

Form 10-K Anika Therapeutics, Inc. For: Dec 31
 Tweet
Tweet Share
Share
UNITED STATES
SECURITIES AND EXCHANGE COMMISSION
Washington, D.C. 20549
FORM
| (Mark One) | |
| | ANNUAL REPORT PURSUANT TO SECTION 13 OR 15(d) OF THE SECURITIES EXCHANGE ACT OF 1934 |
|
For the fiscal year ended
| |
| | TRANSITION REPORT PURSUANT TO SECTION 13 OR 15 (d) OF THE SECURITIES EXCHANGE ACT OF 1934 |
|
For the transition period from to | |
Commission File Number
Anika Therapeutics, Inc.
(Exact Name of Registrant as Specified in Its Charter)
| (State or Other Jurisdiction of Incorporation or Organization) | (IRS Employer Identification No.) |
(Address of Principal Executive Offices) (Zip Code)
(
(Registrant’s Telephone Number, Including Area Code)
Securities registered pursuant to Section 12(b) of the Act:
| Title of Each Class | Trading Symbol | Name of Each Exchange on Which Registered |
| | | |
Indicate by check mark if the registrant is a well-known seasoned issuer, as defined in Rule 405 of the Securities Act. Yes ☐
Indicate by check mark if the registrant is not required to file reports pursuant to Section 13 or Section 15(d) of the Act. Yes ☐
Indicate by check mark whether the registrant (1) has filed all reports required to be filed by Section 13 or 15 (d) of the Securities Exchange Act of 1934 during the preceding 12 months (or for such shorter period that the registrant was required to file such reports), and (2) has been subject to such filing requirements for the past 90 days.
Indicate by check mark whether the registrant has submitted electronically every Interactive Data File required to be submitted to Rule 405 of Regulation S-T (§232.405 of this chapter) during the preceding 12 months (or for such shorter period that the registrant was required to submit such files).
Indicate by check mark whether the registrant is a large accelerated filer, an accelerated filer, a non-accelerated filer, a smaller reporting company, or an emerging growth company. See the definitions of “large accelerated filer,” “accelerated filer,” “smaller reporting company,” and “emerging growth company” in Rule 12b-2 of the Exchange Act.
| Large accelerated filer ☐ | | Non-accelerated filer ☐ | Smaller reporting company | Emerging growth company |
If an emerging growth company, indicate by check mark if the registrant has elected not to use the extended transition period for complying with any new or revised financial accounting standards provided pursuant to Section 13(a) of the Exchange Act. ☐
Indicate by check mark whether the registrant has filed a report on and attestation to its management’s assessment of the effectiveness of internal control over financial reporting under Section 404(b) of the Sarbanes-Oxley Act (15 U.S.C. 7262(b)) by the registered public accounting firm that prepared or issued its audit report.
Indicate by check mark whether the registrant is a shell company (as defined in Rule 12b-2 of the Exchange Act). Yes
The aggregate market value of voting common stock held by non-affiliates of the registrant as of June 30, 2021, the last day of the registrant’s most recently completed second fiscal quarter, was $
At March 2, 2022, there were
Documents Incorporated By Reference
Portions of the registrant’s proxy statement for its 2022 annual meeting of stockholders are incorporated by reference in Part III of this Annual Report on Form 10-K.
TABLE OF CONTENTS
References in this Annual Report on Form 10-K to “we,” “us,” “our,” “our company,” and other similar references refer to Anika Therapeutics, Inc. and its subsidiaries unless the context otherwise indicates.
Anika, Arthrosurface, Anika Therapeutics, Cingal, Hyaff, Monovisc, Orthovisc, Parcus Medical, Tactoset, Hyvisc and WristMotion are our registered trademarks that appear in this Annual Report on Form 10-K. For convenience, these trademarks appear in this Annual Report on Form 10-K without ® and ™ symbols, but that practice does not mean that we will not assert, to the fullest extent under applicable law, our rights to the trademarks. This Annual Report on Form 10-K also contains trademarks and trade names that are the property of other companies and licensed to us.
FORM 10-K
ANIKA THERAPEUTICS, INC.
For Fiscal Year Ended December 31, 2021
CAUTIONARY NOTE REGARDING FORWARD-LOOKING STATEMENTS
This Annual Report on Form 10-K contains "forward-looking statements" within the meaning of Section 27A of the Securities Act of 1933 and Section 21E of the Securities Exchange Act of 1934 concerning our business, consolidated financial condition, and results of operations. The Securities and Exchange Commission, or SEC, encourages companies to disclose forward-looking statements so that investors can better understand a company’s future prospects and make informed investment decisions. Forward-looking statements are subject to risks and uncertainties, many of which are outside our control, which could cause actual results to differ materially from these statements. Therefore, you should not rely on any of these forward-looking statements. Forward-looking statements can be identified by such words as "will," "likely," "may," "believe," "expect," "anticipate," "intend," "seek," "designed," "develop," "would," "future," "can," "could," and other expressions that are predictions of or indicate future events and trends and that do not relate to historical matters. All statements other than statements of historical facts included in this Annual Report regarding our strategies, prospects, financial condition, operations, costs, plans, and objectives are forward-looking statements. Examples of forward-looking statements include, among others, statements regarding expected future operating results, expectations regarding the timing and receipt of regulatory results, anticipated levels of capital expenditures, and expectations of the effect on our financial condition of claims, litigation, and governmental and regulatory proceedings.
Please refer to "Item 1A. Risk Factors" for important factors that we believe could cause actual results to differ materially from those in our forward-looking statements. Any forward-looking statement made by us in this Annual Report on Form 10-K is based only on information currently available to us and speaks only as of the date on which it is made. We undertake no obligation to publicly update any forward-looking statement, whether written or oral, that may be made from time to time, whether as a result of new information, future developments, or otherwise.
PART I
Overview
Founded in 1992, Anika Therapeutics, Inc. is a global joint preservation company that creates and delivers meaningful advancements in early intervention orthopedic care. Based on our collaborations with clinicians to understand what they need most to treat their patients, we develop minimally invasive products that restore active living for people around the world. We are committed to leading in high opportunity spaces within orthopedics, including osteoarthritis (or OA) pain management, regenerative solutions, soft tissue repair and bone preserving joint technologies.
We have thirty years of global expertise developing, manufacturing and commercializing products based on our hyaluronic acid, or HA, technology platform. HA is a naturally occurring polymer found throughout the body that is vital for proper joint health and tissue function. Our proprietary technologies for modifying the HA molecule allow product properties to be tailored specifically to multiple uses, including enabling longer residence time to support OA pain management and creating a solid form of HA called Hyaff, which is the platform for some of our regenerative solutions portfolio.
In early 2020, we expanded our overall technology platform, product portfolio, and significantly expanded our commercial infrastructure, especially in the United States, through our strategic acquisitions of Parcus Medical, LLC, or Parcus Medical, a sports medicine and instrumentation solutions provider focused on soft tissue repair, and Arthrosurface, Inc., or Arthrosurface, a company specializing in bone preserving partial and total joint replacement solutions. These acquisitions have ignited the transformation of our company by augmenting our HA-based OA pain management and regenerative products with a broad suite of products and capabilities focused on early intervention joint preservation primarily in upper and lower extremities such as shoulder, foot/ankle, knee and hand/wrist.
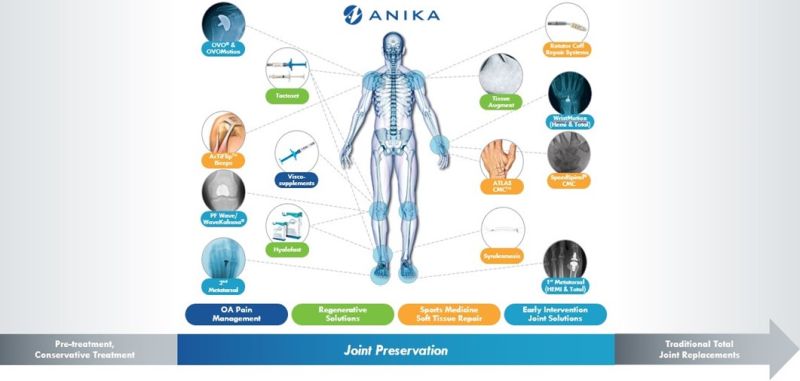
Note: Illustration of available treatments does not reflect Anika’s full product portfolio
Strategy
Beginning in 2020, we launched our transformational strategy to expand and diversify our revenue in the global joint preservation markets. This multi-year journey began with the acquisitions of Arthrosurface and Parcus Medical, through which we entered into the sports medicine soft tissue repair and bone preserving joint technology markets, added to our existing leadership position in the HA based OA pain management market, focusing on building a strong leadership team, and enhanced our commercial organization and infrastructure with investments in people, systems and processes. In the upcoming years, we will continue to invest in our research and development pipeline and strengthen our commercial capabilities to position our product portfolio for the needs of clinicians that practice in ambulatory surgical centers (or ASCs) and hospitals, as well as expand into new geographic areas to drive accelerated growth and profitability. As our pipeline evolves, we intend to leverage our HA expertise in selectively developing and offering solutions for joint preservation and regenerative solutions targeted at procedures that are performed in the ASCs and to focus on completing the clinical trials for key products we sell outside the United States, (i.e. Cingal and Hyalofast), to gain approval for entry into the large U.S. market.
Through the acquisition of Parcus Medical and Arthrosurface, we expanded our addressable global market from the over $1 billion global OA pain management market to the over $8 billion global joint preservation market (which includes faster growing sports medicine and extremities segments), advanced our commercial capabilities, instituted systems and processes to support our transformation, and expanded our product pipeline and research and development expertise in these target markets.
As we look towards the future, our business is positioned to capture value within our target markets in joint preservation. We believe our future success will be driven by our:
| ● |
Decades of experience in HA-based regenerative solutions and early intervention orthopedics combined under new seasoned leadership with a strong financial foundation for future investment in meaningful solutions for our customers and their patients; |
| ● |
Robust network of stakeholders in our target markets to identify evolving unmet patient treatment needs; |
| ● |
Prioritized investment in differentiated pipeline of regenerative solutions, bone preserving implants and soft tissue repair solutions; |
| ● |
Leveraging our global commercial expertise to drive growth across our product portfolio, with an intentional site of care focus in ASCs in the United States; |
| ● |
Opportunity to pursue strategic inorganic growth opportunities, including potential partnerships and smaller acquisitions, technology licensing, and leveraging our strong financial foundation and operational capabilities; and |
| ● |
Energized and experienced team focused on strong values, talent, and culture. |
Products
OA Pain Management
Our OA Pain Management product family consists of:
| ● |
Monovisc and Orthovisc, our single- and multi-injection, HA-based viscosupplement product offerings indicated to provide pain relief from OA conditions solely for use in the knee. Our OA Pain Management products are generally administered to patients in an office setting. In the United States, Monovisc and Orthovisc are marketed exclusively by DePuy Synthes Mitek Sports Medicine, part of the Johnson & Johnson Medical Companies, or Mitek. The Monovisc and Orthovisc products have been the market leaders, based on combined overall revenue in the viscosupplement market, since 2018. Internationally, we market our OA Pain Management products directly through a worldwide network of commercial distributors. |
| ● |
Cingal, our novel, third-generation, single-injection OA Pain Management product consisting of our proprietary cross-linked HA material combined with a fast-acting steroid, is designed to provide both short- and long-term pain relief. Cingal is CE Mark approved and for several years has been sold outside the United States directly in over 30 countries through our network of distributors. In the United States, Cingal is a pipeline product currently under clinical trial studies and is not available for commercial sale; for additional information please see the section captioned “Item 1. Business—Research and Development.” |
| ● |
Hyvisc, our high molecular weight injectable HA veterinary product for the treatment of joint dysfunction in horses due to non-infectious synovitis associated with equine OA. |
Joint Preservation and Restoration
Our Joint Preservation and Restoration product family consists of:
| ● |
Bone Preserving Joint Technologies. Our portfolio of more than 150 bone preserving joint technologies, including partial joint replacement, joint resurfacing, and minimally invasive and bone sparing implants, is designed to treat upper and lower extremity orthopedic conditions as well as knee and hip conditions caused by arthritic disease, trauma and injury. These products span multiple joints including the shoulder, foot/ankle, wrist, knee and hip and are generally intended to restore a patient’s natural anatomy and movement. These products are often used to treat patients with OA progression beyond where our OA Pain Management products can allow the patients to retain an active lifestyle when early surgical intervention becomes preferable. |
| ● |
Soft Tissue Repair. Our line of soft tissue repair solutions is used by surgeons to repair and reconstruct damaged ligaments and tendons resulting from sports injuries, trauma and disease. These more traditional sports medicine solutions include screws, sutures, suture anchors, grafts and other surgical systems that facilitate surgical procedures on the shoulder, knee, hip, upper and lower extremities, and other soft tissues. |
| ● |
Regenerative Solutions. Our portfolio of orthopedic regenerative solutions leveraging our proprietary technologies based on HA and Hyaff, which is a solid form of HA. These products include Tactoset Injectable Bone Substitute, an HA-enhanced injectable bone repair therapy designed to treat insufficiency fractures and for augmenting hardware fixation, such as suture anchors and Hyalofast, a biodegradable support for human bone marrow mesenchymal stem cells used for cartilage regeneration and as an adjunct for microfracture surgery. Tactoset is commercialized principally in the United States, whereas Hyalofast is CE Mark approved and currently available outside the United States in over 30 countries within Europe, South America, Asia, and certain other international markets. In the United States, Hyalofast is a pipeline product under clinical trial studies and is not available for commercial sale. For additional information, please see the section captioned “Item 1. Business—Research and Development.” |
We currently commercialize Bone Preserving Joint Technologies, Soft Tissue Repair products, and Tactoset (from our Regenerative Solutions portfolio) in the United States by selling to hospitals and ASCs, through an independent network of sales representatives and distributors, and utilize our distributor network for sales in certain international markets.
Non-Orthopedic
Our Non-Orthopedic product family consists of legacy HA-based products that are marketed principally for non-orthopedic applications. These products include Hyalobarrier, an anti-adhesion barrier indicated for use after abdomino-pelvic surgeries, Hyalomatrix, used for the treatment of complex wounds such as burns and ulcers, as well as products used in connection with the treatment of ears, nose and throat disorders, and ophthalmic products, including injectable, high molecular weight HA products such as Anikavisc and Nuvisc, used as viscoelastic agents in ophthalmic surgical procedures such as cataract extraction and intraocular lens implantation. These Non-Orthopedic products are sold through commercial sales and marketing partners around the world.
Sales Channels
A majority of our products are used by clinicians and surgeons in one of three environments: office-based procedures usually focused on injections, hospital operating rooms and ASCs, which are clinics outside of a normal hospital setting that are often at least partially physician-owned. These medical care delivery environments typically require different commercial approaches and have distinct call points, which requires diversity in our sales approach. For instance, our OA Pain Management product family and certain products in our Non-Orthopedic category are almost entirely utilized in an office-based setting while our Joint Preservation and Restoration and certain of our Non-Orthopedic products are almost exclusively consumed in hospital operating rooms or ASCs.
As a result of these distinctions, we employ multiple sales models in the United States to ensure that we are meeting the needs of our customers and other healthcare system stakeholders. For many years, we have maintained a mutually beneficial commercial partnership with Mitek, which sells Orthovisc and Monovisc in the United States. For this arrangement with Mitek, we sell the Orthovisc and Monovisc products that we manufacture to Mitek, and also receive from Mitek a royalty on their end user sales of these products in the United States. We have U.S. commercial partnerships for other products in our OA Pain Management and Non-Orthopedic product families. Under these commercial partnerships, we sell our products directly to our partners, who perform the vast majority of the downstream sales and marketing activities to customers and end-users. In addition to a transfer price, we may also structure our arrangements to receive a royalty on end user sales.
With our expanded commercial infrastructure as a result of the Parcus Medical and Arthrosurface acquisitions, we sell our Joint Preservation and Restoration family directly to clinicians, including hospitals and ASCs, through our Anika sales team and large network of independent third-party distributors. During 2020, we completed the initial integration of our U.S. commercial organization including effectively cross training our sales team to sell the consolidated Joint Preservation and Restoration product portfolio. Within this framework, we employ selling models that seek to maximize the benefit for our company and customers, including in certain instances, contracts with group purchasing organizations and certain fixed-price delivery models.
Outside of the United States, we market and sell our products using a worldwide network of commercial partners to provide a solid foundation for future revenue growth and territorial expansion. Our relationships with these partners are generally structured such that we sell our products to these partners directly while they, with global support from our team, perform the in-country sales and marketing activities to drive growth and adoption of our products locally. We expect to generally maintain this model for the foreseeable future, while also selectively evaluating other options and being opportunistic about adopting other sales models, including direct sales, in certain jurisdictions.
We believe that our overall sales approach provides our business with a strong base to drive revenue growth as we continue to grow and scale our commercial infrastructure. We will continue to focus on expanding our own commercial capabilities, including with respect to market access, innovative sales and delivery models, and improved logistics management.
Manufacturing
We manufacture all of our HA-based products, including all of our OA Pain Management products and certain additional products, at our facility in Bedford, Massachusetts, where we have developed significant manufacturing expertise around procedures such as homogenized mixing and filling of highly-viscous liquids and manipulation of solid HA into scaffolds or other presentations. We manufacture most of our soft tissue repair products at our facility in Sarasota, Florida and we manufacture our bone preserving joint products and certain elements of our soft tissue repair portfolio utilizing third-party contract manufacturing organizations.
The raw materials necessary to manufacture our products are generally available from multiple sources. However, we rely on a small number of suppliers for certain key raw materials and a small number of suppliers for certain other materials, components, parts and disposables required for the manufacturing and delivery of these products. The COVID-19 pandemic has impacted our supply chain as the companies that produce our products, product components or otherwise support our manufacturing processes, the distribution centers where we manage our inventory, or the operations of our logistics and other service providers, including third parties that sterilize and store our products, are disrupted, temporarily close or experience worker shortages for a sustained period of time. Any prolonged interruption of operations or significant reduction in the capacity or performance capability at any of our manufacturing facilities, or at any of our key suppliers, could have a material adverse effect on our operations. For additional information on the impact of the COVID-19 pandemic on our manufacturing operations, please refer to the section captioned “Item 1A. Risk Factors—Risks related to the COVID-19 Pandemic. “Our operations are located in areas impacted by the COVID-19 pandemic, and those operations have been, and may continue to be, adversely affected by the COVID-19 pandemic”, and “Our global supply chain may be materially adversely impacted due to the COVID-19 pandemic.”
Research and Development
Our research and development efforts consist of the development of new medical applications for our technology platforms, including new implant designs, the development of intellectual property with respect to our technology platforms and new products, the management of clinical trials for certain product candidates, the preparation and processing of applications for regulatory clearances and approvals, and process development and scale-up manufacturing activities for our existing and new product development initiatives. For 2021, 2020, and 2019, research and development expenses were $27.3 million, $23.4 million and $16.7 million, respectively. The increase in 2021 was primarily due to clinical studies in the United States for Cingal and Hyalofast, certain European post-market clinical studies and regulatory efforts, and activities associated with new product development in our research and development pipeline, including a full year of activities following the acquisitions of Arthrosurface and Parcus Medical in early 2020. We anticipate that we will continue to commit significant resources to research and development activities, primarily for new product development, pre-clinical activities and clinical trials.
Our new product development efforts focus on products in four large and growing orthopedic markets to drive long-term growth: OA pain management, regenerative solutions, sports medicine soft tissue repair and bone preserving joint technologies. In order to better inform and target our research and development investment, we routinely interact with key external stakeholders, including clinicians, to encompass customer and patient insights in our development process that help ensure we bring needed solutions to the market. In the near term, our general new product development will be focused on enhancements to existing products such as Tactoset Injectable Bone Substitute, new soft tissue fixation and regenerative solutions and extremities products like our WristMotion® Total Wrist Arthroplasty product that achieved 510(k) clearance during 2020 from the U.S. Food and Drug Administration (or FDA) and launched commercially in 2021, and clinical development to enable us to commercialize our Cingal and Hyalofast products in the U.S. market (these products are currently sold only outside the United States). As we move forward, we plan to continue to invest in novel and meaningful new products for our target markets based on our core capabilities, including further expanding our regenerative HA technology platform.
Our development focus for OA pain management will continue to be on bringing Cingal, our third-generation, single-injection viscosupplement product, to the U.S. market. While we have conducted previous clinical trials for Cingal, including a trial that supported CE Mark approval for Cingal, the FDA has indicated an additional Phase III trial is necessary to support U.S. regulatory approval. In 2020, we initiated a pilot study to confirm our trial design to increase our probability of success in a Phase III trial and generate data that ultimately will be needed to support FDA approval and clearances. We completed enrollment for the Cingal pilot study in November 2021. We expect to finalize the review of the data related to the pilot trial in the middle of 2022. The results of the data will inform the design of a possible pivotal trial which would be expected to begin thereafter. Given the evolving environment, we will continue to update clinical trial timelines as we have more visibility with respect to the length and regional impacts of the COVID-19 pandemic. For additional information on the impact of the COVID-19 pandemic on our Cingal pilot study, please refer to the section captioned “Item 1A. Risk Factors—Risks related to the COVID-19 Pandemic. The COVID-19 pandemic could adversely impact our development activities, preclinical studies and clinical trials, which could significantly impair our long-term business plans and operating results.”
Development for our Joint Preservation and Restoration product family is focused in several areas. We continue to progress the ongoing clinical trial to support approval in the United States for Hyalofast, our single stage, off the shelf, cartilage repair therapy, currently sold only outside the United States. We are actively pursuing multiple solutions to accelerate patient enrollment, including initiating sites in Mexico, Indonesia, and the Philippines which has been delayed due to COVID-19. We are also focused on the development of additional solutions and line extensions for our soft tissue repair and bone preserving joint technologies business, largely within the faster-growing extremities segments such as the shoulder. These include continued progress on a therapy targeted at rotator cuff repair utilizing our proprietary solid HA technology, as well as other programs that leverage our HA expertise to augment or improve our current offerings.
Intellectual Property
We seek patent and trademark protection for our key technologies, products and product improvements, both in the U.S. and in select foreign countries. When determined appropriate, we enforce and plan to enforce and defend our patent and trademark rights. While we rely on our patent and trademark portfolio to provide us with competitive advantages as it relates to our existing and future product lines, it is not our sole source of protection. We also rely upon trade secrets and continuing technological innovations to develop and maintain our competitive position.
Governmental Regulation
The clinical development, manufacturing, and marketing of our products are subject to governmental regulation in the United States, the European Union, and other territories worldwide. Various statutes, regulations and interpretations thereof, directives, and guidelines, including the Food, Drug, and Cosmetic Act in the United States, govern the development, design, non-clinical and clinical research, testing, manufacture, safety, efficacy, labeling, packaging, storage, record keeping, premarket clearance or approval, adverse event reporting, advertising, and promotion of our products. Product development and approval/clearance within these various regulatory frameworks can take a number of years and generally involves the expenditure of substantial resources. Pharmaceutical and medical device manufacturers are also inspected regularly by the FDA and other applicable regulatory bodies.
Medical products regulated by the FDA are generally classified as drugs, biologics, or medical devices, and the current classification standards for our current or future products may be altered over time. Drugs and biologic products undergo rigorous preclinical testing prior to beginning clinical trials. Clinical trials for new drugs or biologic products include Phase I trials in healthy volunteers to understand safety, dosage tolerance, and pharmacokinetics, Phase II trials in a limited patient population to identify initial efficacy and side effects, and Phase III pivotal trials to statistically evaluate the safety and efficacy of the product. Medical devices intended for human use are classified into three categories (Class I, II or III) on the basis of the controls deemed reasonably necessary by the FDA to assure their safety and effectiveness. Class I devices typically do not require prior approval by a regulatory authority. Class II devices are cleared for marketing under the pre-market notification 510(k) regulatory pathway, which may include clinical testing. Class III devices require pre-market approval based on valid scientific evidence of safety and effectiveness, including evidence elicited through appropriate clinical testing. The failure to adequately demonstrate the quality, safety, and efficacy of a product under development can delay or prevent regulatory approval of the product. In order to gain marketing approval, we must submit to the relevant regulatory authority for review information on the quality aspects of the product as well as the non-clinical and clinical data. The FDA undertakes this review in the United States. Regardless of classification, medical device manufacturers are subject to multiple regulations and standards specifying that a quality system must provide oversight to the design and manufacture of devices intended for human use.
In the European Union, medical devices must be CE Marked in order to be marketed. CE marking a device involves working with a Notified Body, and in some cases a Competent Authority, to demonstrate that the device meets all applicable requirements of the Medical Devices Directive and that the Quality Management System is compliant. Europe’s Medical Device Directive, or MDD, has been replaced by the European Medical Device Regulation, or MDR, enacted in 2017, and became effective in May 2021. MDR requirements will phase in on a product-by-product basis as certifications under MDD lapse and will require all products to undergo review and approval under these new regulations no later than May 2024, which will generally require increased levels of clinical support as compared to MDD requirements. Drug approval in the European Union follows one of several possible processes: (i) a centralized procedure involving members of the European Medicines Agency’s Committee for Medicinal Products for Human Use; (ii) a “mutual recognition procedure” in which an individual country's regulatory agency approves the product followed by “mutual recognition” of this approval by regulatory agencies of other countries; or (iii) a decentralized procedure in which the approval is sought through the regulatory agencies of multiple countries at the same time.
Approval timelines can range from several months to several years, or applications can be denied entirely. Product or product component classifications as drugs, biologics, or medical devices may change over time due to new regulations or augmented interpretation of data or current regulations. The approval process can be affected by a number of factors. For example, additional studies or clinical trials may be requested during the review, which may delay marketing approval and involve unbudgeted costs. As a condition of approval, the regulatory agency may require post-marketing surveillance to monitor for adverse effects, and may require other additional studies, as it deems appropriate. After approval for an initial indication, further clinical studies are generally necessary to gain approval for any additional indications. The terms of any approval, including labeling content, may be more restrictive than expected and could affect the marketability of a product.
The FDA has broad regulatory compliance and enforcement powers. If the FDA determines that we failed to comply with applicable regulatory requirements, it can take a variety of compliance or enforcement actions, including, without limitation, issuing an FDA Form 483 notice of inspectional observations or a warning letter, imposing civil money penalties, suspending or delaying issuance of approvals, requiring product recall, imposing a total or partial shutdown of production, withdrawal of approvals or clearances already granted, pursuing product seizures, consent decrees or other injunctive relief, or criminal prosecution through the Department of Justice. The FDA can also require us to repair, replace, or refund the cost of products that we manufactured or distributed. Outside the United States, regulatory agencies may exert a range of similar powers.
We are subject to various U.S. federal and state laws pertaining to healthcare fraud and abuse, including anti-kickback, false claims, and transparency reporting laws. Similar laws and regulations pertaining to sales, marketing and advertising practices exist in the other geographic areas where we operate.
We are also subject to various laws and regulations concerning data privacy in the United States, Europe, and elsewhere, including the General Data Protection Regulation, or GDPR, in the European Union. These regulations impose several requirements on the processing, administration, security, and confidentiality of personal data and empower enforcement agencies to impose large penalties for noncompliance.
Environmental Laws
We believe that we are in compliance with all foreign, federal, state, and local environmental regulations with respect to our manufacturing facilities. The cost of ongoing compliance with such regulations does not have a material effect on our operations.
Competition
We compete with many companies including large pharmaceutical firms and large and specialized medical device companies across our product lines. For our OA Pain Management products, our principal competitors include Sanofi Genzyme, Zimmer Biomet, Inc., Bioventus Inc., and Ferring Pharmaceuticals, as well as other companies that are commercializing or developing competitive products. Our key competitors for our Joint Preservation and Restoration products include Arthrex, Inc., the DePuy Synthes Companies of Johnson & Johnson, Smith & Nephew PLC., Stryker Corporation, and Zimmer Biomet, Inc., as well as certain smaller organizations that focus on subsets of the larger industry, such as Catalyst OrthoScience, Treace Medical, Paragon 28 and Shoulder Innovations. Many of the larger companies have substantially greater financial resources, larger research and development staffs, more extensive marketing and manufacturing organizations, and more experience in the regulatory processes than we have. We also compete with academic institutions, government agencies, and other research organizations that may be involved in the research and development and commercialization of products. Many of our competitors also compete against us in securing relationships with collaborators for their research and development and commercialization programs.
We compete with other market participants primarily on the efficacy of our products, our products’ reputation for safety, and the breadth of our overall product portfolio. Other factors that impact competition in our industry are the timing and scope of regulatory approvals, the availability of manufacturing supplies, raw materials and finished product supply, marketing and sales capability, reimbursement coverage, product pricing, and patent protection. Some of the principal factors that may affect our ability to compete in our target markets include:
| ● |
The quality and breadth of our continued development of our product portfolio; |
| ● |
Our ability to complete successful clinical studies and obtain FDA marketing and foreign regulatory approvals prior to our competitors; |
| ● |
Our ability to successfully source raw materials and components from suppliers at price points that are in-line with our financial objectives, as well as deliver them on schedule to meet the needs of our operational and commercial organizations; |
| ● |
Our ability to continue to build our commercial infrastructure, integrate our sales channels and execute our sales strategies; |
| ● |
The execution by our key partners of their commercial strategies for our products and our ability to manage our relationships with those key partners; |
| ● |
Our ability to recruit and retain skilled employees; and |
| ● |
The availability of capital resources to fund strategic activities related to the significant expansion of our business or product portfolio, including through acquisitions of third parties or certain assets. |
We are aware of a number of companies that are developing and/or marketing competitive products. In some cases, competitors have already obtained product approvals, submitted applications for approval, or commenced human clinical studies, either in the United States or in certain foreign countries. All of our products face substantial competition. There is a risk that we will be unable to compete effectively against our current or future competitors. Additionally, legislation and regulation aimed at curbing rising healthcare costs has resulted in a consolidation trend in the healthcare industry to create larger companies, including hospitals, with greater market power. In turn, this has led to greater and more intense competition in the provision of products and services to market participants. Important market makers, like group purchasing organizations and integrated delivery networks, have increased their negotiating leverage, and if these market makers demand significant price concessions or if we are excluded as a supplier by these market makers, our product revenue could be adversely impacted.
Seasonality
Our business is generally not seasonal in nature due to the nature of our product mix and sales channels and strategies.
Human Capital Management
We believe that creating a diverse, talented, and inclusive workplace is a central aspect to our culture, employee recruitment, retention and engagement, innovation, operational excellence and overall performance. In turn, this culture and drive for performance is an important factor in our ability to attract and retain key talent. Our culture is centered around our fundamental values of:
| ● |
People: We engage and invest in each other in a community that values diversity and inclusion. |
| ● |
Innovation: We are agile and entrepreneurial in developing and delivering meaningful solutions to our healthcare stakeholders within our target markets. |
| ● |
Quality: We strive for the highest quality and compliance in everything we do. |
| ● |
Teamwork: We operate with mutual respect and trust, and are collaborative as we grow together. |
| ● |
Integrity: We live up to our promises and do the right thing, every day. |
| ● |
Accountability: We are empowered and accountable to deliver results and value to all of our stakeholders. |
Talent Acquisition and Management
Our industry requires complex processes for product development and commercialization, each of which requires deep expertise and experience across a broad array of disciplines. Medical device companies therefore compete for a limited number of qualified applicants to fill specialized positions. This requires competitive compensation and benefits packages and an attractive culture in order to attract and retain skilled employees to support the growth and success of the company.
As of December 31, 2021, we employed 297 fulltime employees in the United States and EMEIA. We expect to continue to add employees in 2022 and beyond as we grow our business.
We believe that our employees’ understanding of how their work contributes to our overall strategy and performance is key to our success. In order to communicate with respect to these important topics in a manner that is engaging to our team, we utilize a variety of channels. These include all-employee town hall meetings with senior management, regular email updates from our chief executive officer and other key members of the executive team, as well as presentations to our employees by invited clinicians, who use our products, participate and share their experiences from a customer’s perspective. In addition, to assess employee perceptions in areas such as inclusion, professional development/training, reward/recognition, equity, engagement and overall organizational satisfaction, we conduct company-wide employee engagement surveys using an external survey platform. Our management team evaluates the results and identifies potential opportunities for improvement. As a result of employee feedback, we have established an employee communications taskforce chartered with improving communications and employee engagement across the business and introduced new e-learning programs to expand employee development.
Diversity, Equity and Inclusion
We are committed to a diverse, equitable and inclusive workplace where all employees, regardless of their gender, race, ethnicity, national origin, age, sexual orientation or identity, education or disability are valued, respected and supported. In 2021, in alignment with our commitment to comply with key elements of the MassBio CEO Pledge for a More Equitable and Inclusive Life Science Industry, we delivered on some of the key deliverables of our multiyear approach. This included the development and communication of a corporate Diversity, Equity and Inclusion Policy Statement as well as the creation of a Diversity Dashboard. The Diversity Dashboard tracks the current diversity within the organization and is shared with the Board of Directors to provide engagement and oversight at the highest levels of the organization. We will continue to enhance the diversity of our workforce through focused talent acquisition goals and development plans.
Employee Development
The ongoing development of our employees continues to be a catalyst for our growth and success as a company. A large number of our employees have obtained advanced degrees in their professions. We support our employees’ further development with individualized development plans, mentoring, coaching, group training, conference attendance. We also provide financial support, including tuition reimbursement for qualified programs, as well as access to a broad-based learning management platform for self-directed learning and improvement.
Competitive Pay and Benefits
To attract and retain qualified employees and key talent, we offer our employees total rewards packages consisting of base salary, a cash bonus, and a comprehensive benefit package. We also provide equity compensation for certain employees based on various criteria, including their level within our company. All employees globally are eligible to participate in the annual incentive cash bonus plan or a sales incentive plan which are aligned to both corporate and individual performance. Bonus opportunity and equity compensation increase as a percentage of total compensation based on level of responsibility. Our employee stock purchase plan, introduced in 2021, gives eligible employees the opportunity to purchase shares in Anika at a discounted rate. Bravo, our global online employee recognition program, provides the opportunity for both peer to peer and manager to employee recognition, and has been well received by our employees.
Health and Safety
We remain focused on promoting the total wellness of our employees including resources, programs and services to support their physical, mental and financial wellness. As a result of the COVID-19 pandemic, we have augmented certain of our normal business practices to ensure that we promote health and safety for our employees. A cross functional COVID-19 Pandemic Task Force has been in place since the start of the pandemic. We have established safety policies and protocols, and we regularly update our employees with respect to any changes. In 2020, we transitioned much of our workforce to work remotely, in order minimize the risk of infection of those who must be onsite to perform their jobs, including our manufacturing team. We also have adjusted attendance policies to encourage those who may be ill to stay home. To further protect our on-site employees, we have provided personal protective equipment and cleaning supplies. Additionally, we engaged a third-party firm to conduct a proactive facility assessment and upgraded our air filtration systems to be more effective against COVID-19 transmission, thus enhancing the safety of our workforce while on the job. We have also provided general information updates and support for our employees to ensure that they have resources and information to protect their health and that of those around them, including their families and co-workers.
Product Liability
The testing, marketing, and sale of human health care products entail an inherent risk of allegations of product liability, and we cannot assure that substantial product liability claims will not be asserted against us. Although we have not received any material product liability claims to date, we cannot assure that if material claims arise in the future, our insurance will be adequate to cover all situations. Moreover, we cannot assure that such insurance, or additional insurance, if required, will be available in the future or, if available, will be available on commercially reasonable terms. Any product liability claim, if successful, could have a material adverse effect on our business, financial condition, and results of operations.
Available Information
We are required to file annual, quarterly and current reports, proxy statements and other information with the SEC. The SEC maintains a website at www.sec.gov that contains reports, proxy and information statements, and other information regarding issuers that file electronically with the SEC.
Our Annual Reports on Form 10-K, Quarterly Reports on Form 10-Q, Current Reports on Form 8-K, proxy statements, and other information, including amendments and exhibits to such reports, filed or furnished pursuant to the Securities Exchange Act of 1934 are available free of charge in the “SEC Filings” section of our website located at http://www.anika.com, as soon as reasonably practicable after the reports are electronically filed with or furnished to the SEC. The information on our website is not part of this Annual Report on Form 10-K.
Our operating results and financial condition have varied in the past and could vary significantly in the future depending on a number of factors. You should consider carefully the risks and uncertainties described below, in addition to the other information contained in this Annual Report on Form 10-K, before deciding whether to purchase our common stock. If any of the following risks actually occurs, our business, financial condition, results of operations, and future prospects could be materially and adversely affected. In that event, the trading price of our common stock could decline, and stockholders could lose part or all of their investment.
Risks Related to Our Business and Industry
Our financial performance depends on sales growth and increasing demand for our legacy and acquired product portfolios, and we may not be able to successfully manage the recent, and future, expansion of our operations.
Through our acquisitions of Parcus Medical and Arthrosurface in early 2020, we significantly broadened our technology and development platforms and commercialization infrastructure and expanded our addressable market from the global OA pain management market to the substantially larger global joint preservation market. Our future success depends on growth in sales of both our legacy and acquired products. There can be no assurance that such growth can be achieved or, if achieved, sustained. There can be no assurance that, even if substantial growth in product sales and the demand for our products is achieved, we will be able to:
| ● |
Gain acceptance of our broadened portfolio of existing products, as well as future products, by the medical community, hospitals, physicians, other health care providers, third-party payers, and end-users, which acceptance may depend upon the extent to which the medical community and end-users perceive our products as safer, more effective or more cost-competitive than other similar products. |
| ● |
Maintain, manage, and develop the necessary manufacturing capabilities and inventory management practices; |
| ● |
Develop, implement, and integrate the mix of appropriate sales channels needed to generate increased sales across our expanded product platform and to develop marketing partners and viable commercial strategies for the distribution of our expanded mix of products; |
| ● |
Attract, retain, and integrate required key personnel; and |
| ● |
Implement the financial, accounting, and management systems needed to manage our expanded business and growing demand for our products. |
There can be no assurance that our current and future, products will achieve significant market acceptance on a timely basis, or at all. Failure of some or all of our products to achieve significant market acceptance, or our failure to successfully manage future growth, could have a material adverse effect on our business, financial condition, and results of operations.
Substantial competition could materially affect our financial performance.
We compete with many companies, including large pharmaceutical companies and large and specialized medical devices companies, across all of our product lines. For our OA Pain Management products, our principal competitors include Sanofi Genzyme, Zimmer Biomet, Inc., Bioventus Inc., and Ferring Pharmaceuticals, as well as other companies that are commercializing or developing competitive products. Our key competitors for our Joint Preservation and Restoration products include Arthrex, Inc., the DePuy Synthes Companies of Johnson & Johnson, Smith & Nephew PLC., Stryker Corporation, and Zimmer Biomet, Inc., as well as certain smaller organizations that focus on subsets of the larger industry, such as Catalyst OrthoScience, Treace Medical, Paragon 28 and Shoulder Innovations. Many of these companies have substantially greater financial resources, larger research and development staffs, more extensive marketing and manufacturing organizations, and more experience in the regulatory process than us. We also compete with academic institutions, government agencies, and other research organizations that are involved in the research and development and commercialization of products similar to our own. Many of our competitors also compete against us in securing relationships with collaborators for their research and development and commercialization programs.
Because a number of companies are developing or have developed products for similar applications as our products and have received the U.S. Food and Drug Administration, or FDA, approval, the successful commercialization of a particular product will depend in part upon our ability to complete clinical studies and/or obtain FDA marketing and foreign regulatory approvals prior to our competitors, or, if regulatory approval is not obtained prior to our competitors, to identify markets for our products that may be sufficient to permit meaningful sales of our products. Additionally, legislation and regulation aimed at curbing rising healthcare costs has resulted in a consolidation trend in the healthcare industry to create larger companies, including hospitals, with greater market power. In turn, this has led to greater and more intense competition in the provision of products and services to market participants. Important market makers, like group purchasing organizations and integrated delivery networks, have increased their negotiating leverage, and if these market makers demand significant price concessions or if we are excluded as a supplier by these market makers, our product revenue could be adversely impacted. There can be no assurance that we will be able to compete against current or future competitors or that competition will not have a material adverse effect on our business, financial condition, and results of operations.
Our business may be adversely affected if consolidation in the healthcare industry leads to demand for price concessions or if we are excluded from being a supplier by a group purchasing organization or similar entity.
Because healthcare costs have risen significantly over the past decade, numerous initiatives and reforms have been launched by legislators, regulators, and third-party payers to curb these costs. As a result, there has been a consolidation trend in the healthcare industry to create larger companies, including hospitals, with greater market power. As the healthcare industry consolidates, competition to provide products and services to industry participants has become and may continue to become more intense. This may result in greater pricing pressures and the exclusion of certain suppliers from important markets as group purchasing organizations, independent delivery networks, and large single accounts continue to use their market power to consolidate purchasing decisions. If a group purchasing organization excludes us from being one of their suppliers, our net sales could be adversely impacted. We expect that market demand, government regulation, third-party reimbursement policies, and societal pressures will continue to change the worldwide healthcare industry, which may exert further downward pressure on the prices of our products.
A significant portion of our revenues are derived from a small number of customers, the loss of which could materially adversely affect our business, financial condition and results of operations.
We have historically derived the majority of our revenues from a small number of customers who resell our products to end-users. Most of these customers are significantly larger companies than us. In 2021, DePuy Synthes Mitek Sports Medicine, part of the Johnson & Johnson Medical Companies, or Mitek, accounted for 45% of our revenue. While we have started to diversify our sales channels, including through the implementation of a direct commercial model in the United States for our Joint Preservation and Restoration products, we expect to continue to be dependent on a small number of large customers for a substantial portion of our business. The failure of key customers to purchase our products in the amounts they historically have or in amounts that we expect would seriously harm our business.
In addition, if present and future customers terminate their purchasing arrangements with us, significantly reduce or delay their orders, or seek to renegotiate their agreements on terms less favorable to us, our business, financial condition, and results of operations will be adversely affected. If we accept terms less favorable than the terms of the current agreements, such renegotiations may have a material adverse effect on our business, financial condition, and/or results of operations. Furthermore, in any future negotiations we may be subject to the perceived or actual leverage that these customers may have given their relative size and importance to us. Any termination, change, reduction, or delay in orders could seriously harm our business, financial condition, and results of operations. The loss of any one of our major customers, the delay of significant orders from such customers or our inability to timely supply product to these customers (including due to production and shipping delays attributable to supply or staffing shortages during the ongoing COVID-19 pandemic), even if only temporary, could reduce or delay our recognition of revenues, harm our reputation in the industry, and reduce our ability to accurately predict cash flow, and, as a consequence, could seriously harm our business, financial condition, and results of operations.
We experience quarterly sales volume variation, which makes our future results difficult to predict and makes period-to-period comparisons potentially not meaningful.
We experience quarterly fluctuations in our product sales as a result of multiple factors, many of which are outside of our control including our arrangement with Mitek which performs the vast majority of the downstream sales and marketing activities to customers and end-users. Therefore, we are subject to fluctuations in Mitek’s sales patterns and corresponding ordering patterns. These quarterly fluctuations create uncertainty as to the volume of sales that we may achieve in a given period. As a result, comparing our operating results on a period-to-period basis might not be meaningful. You should not rely on our past results as an indication of our future performance. Our operating results could be disproportionately affected by a reduction in revenue because a proportionately smaller amount of our expenses varies with our revenue. As a result, our quarterly operating results are difficult to predict, even in the near term.
We rely on a small number of suppliers for certain key raw materials and a small number of suppliers for a number of other materials required for the manufacturing and delivery of our products, and disruption could materially adversely affect our business, financial condition, and results of operations.
Although we believe that alternative sources for many of these and other components and raw materials that we use in our manufacturing processes are available, we cannot be certain that the supply of key raw materials will continue to be available at current levels or will be sufficient to meet our future needs. The COVID-19 pandemic has impacted, and may continue to impact, our supply chain as the companies that produce our products, product components or otherwise support our manufacturing processes, the distribution centers where we manage our inventory, or the operations of our logistics and other service providers, including third parties that sterilize and store our products, are, or may be, disrupted, temporarily closed or experience worker shortages for a sustained period of time. For example, for the manufacture of bone preserving joint technologies, we engage a single third-party organization as a contract manufacturer. Any supply interruption could harm our ability to manufacture our products until a new source of supply is identified and qualified. We may not be able to find sufficient alternative suppliers in a reasonable time-period, or on commercially reasonable terms, if at all, and our ability to produce and supply our products could be impaired.
Our manufacturing processes involve inherent risks, and disruption could materially adversely affect our business, financial condition, and results of operations.
The operation of biomedical manufacturing plants involves many risks, including the risks of breakdown, failure, substandard performance of equipment, the inability of production runs to pass internal quality standards, the need to comply with the requirements of directives of government agencies, including the FDA, and the occurrence of natural and other disasters. Such occurrences could have a material adverse effect on our business, financial condition, and results of operations during the period of such operational difficulties and beyond.
We could become subject to product liability claims, which, if successful, could materially adversely affect our business, financial condition, and results of operations.
The testing, marketing, and sale of human health care products entail an inherent risk of allegations of product liability, and there can be no assurance that substantial product liability claims will not be asserted against us. Although we have not received any material product liability claims to date and we believe that we have adequate insurance coverage to cover such product liability claims should they arise, there can be no assurance that material claims will not arise in the future or that our insurance will be adequate to cover all situations. Moreover, there can be no assurance that such insurance, or additional insurance, if required, will be available in the future or, if available, will be available on commercially reasonable terms. Any product liability claim, if successful, could have a material adverse effect on our business, financial condition, and results of operations.
We are increasingly dependent on sophisticated information technology and if we fail to effectively maintain or protect our information systems or data, including from data breaches, our business could be adversely affected.
We are increasingly dependent on sophisticated information technology for our products and infrastructure. As a result of technology initiatives, recently enacted regulations, changes in our system platforms and integration of new business acquisitions, we have been consolidating and integrating the number of systems we operate and have upgraded and expanded our information systems capabilities. We also have outsourced elements of our operations to third parties, and, as a result, we manage a number of third-party suppliers who may or could have access to our confidential intellectual property or business information.
Our information systems, and those of third-party suppliers with whom we contract, require an ongoing commitment of significant resources to maintain, protect and enhance existing systems and develop new systems to keep pace with continuing changes in information technology, evolving systems and regulatory standards and the increasing need to protect patient and customer information. In addition, given their size and complexity, these systems could be vulnerable to service interruptions or to security breaches from inadvertent or intentional actions by our employees, third-party suppliers and/or business partners, or from cyber-attacks by malicious third parties attempting to gain unauthorized access to our products, systems or Confidential Information. Any such compromise to our information security could result in an interruption in our operations, the unauthorized publication of our confidential business or proprietary information, the unauthorized release of customer, vendor, or employee data, the violation of privacy, including under the General Data Protection Regulation, or GDPR, in the European Union, or other laws and exposure to litigation, any of which could harm our business and operating results.
We may face circumstances in the future that will result in impairment charges, including, but not limited to, goodwill impairment and in-process research and development charges.
As of December 31, 2021, we had long-lived assets in the amount of $137.8 million. If the fair value of any of our long-lived assets, including those that we acquired in the acquisitions of Arthrosurface and Parcus Medical, decrease as a result of an economic slowdown, a downturn in the markets where we sell products and services, a downturn in our financial performance or future outlook, or other reasons, we may be required to record an impairment charge on such assets. We are required to test intangible assets with indefinite life periods for potential impairment annually and on an interim basis if there are indicators of a potential impairment. We also are required to evaluate amortizable intangible assets and fixed assets for impairment if there are indicators of a possible impairment. Impairment charges could have a negative impact on our results of operations and financial position, as well as on the market price of our common stock.
Our business is dependent upon hiring and retaining qualified management and technical personnel.
We are highly dependent on the members of our management and technical staff, the loss of one or more of whom could have a material adverse effect on us. We have experienced a number of management changes in recent years, and there can be no assurances that any future management changes will not adversely affect our business. We believe that our future success will depend in large part upon our ability to attract and retain technical and highly skilled executive, managerial, professional, and technical personnel. We face significant competition for such personnel from competitive companies, research and academic institutions, government entities, and other organizations. There can be no assurance that we will be successful in hiring or retaining the personnel we require. The failure to hire and retain such personnel could have a material adverse effect on our business, financial condition, and results of operations.
We may require additional capital in the future. We cannot give any assurance that such capital will be available at all or on terms acceptable to us, and if it is available, additional capital raised by us could dilute your ownership interest or the value of your shares.
We may need to raise capital in the future depending on numerous factors, including:
| ● |
Market acceptance of our existing and future products; |
| ● |
The success and sales of our products under various distributor agreements and other appropriate commercial strategies, including the ability of our partners to achieve third party reimbursement for our products; |
| ● |
The successful commercialization of products in development through appropriate commercial models and marketing channels; |
| ● |
Progress in our product development efforts; |
| ● |
The magnitude and scope of such product development efforts; |
| ● |
Any potential acquisitions of products, technologies, or businesses; |
| ● |
Progress with preclinical studies, clinical trials, and product approvals and clearances by the FDA and other agencies; |
| ● |
Requirement to conduct additional preclinical studies and clinical trials for future products; |
| ● |
The cost and timing of our efforts to manage our manufacturing capabilities and related costs; |
| ● |
The cost of filing, prosecuting, defending, and enforcing patent claims and other intellectual property rights and the cost of defending any other legal proceeding; |
| ● |
Competing technological and market developments; |
| ● |
The development of strategic alliances for the marketing of certain of our products; |
| ● |
The terms of such strategic alliances, including provisions (and our ability to satisfy such provisions) that provide upfront and/or milestone payments to us; |
| ● |
The cost of maintaining adequate inventory levels to meet current and future product demand; and |
| ● |
Further expanding our business in international markets. |
To the extent funds generated from our operations, together with our existing capital resources, are insufficient to meet future requirements, we will be required to obtain additional funds through equity or debt financings, through strategic alliances with corporate partners and others, or through other sources. The terms of any future equity financings may be dilutive to our investors and the terms of any debt financings may contain restrictive covenants, which limit our ability to pursue certain courses of action. Our ability to obtain financing is dependent on the status of our future business prospects as well as conditions prevailing in the relevant capital markets at the time, we seek financing. No assurance can be given that any additional financing will be made available to us or will be available on acceptable terms should such a need arise.
If we succeed in raising additional funds through the issuance of equity or convertible securities, then the issuance could result in substantial dilution to existing stockholders. Furthermore, the holders of these new securities or debt may have rights, preferences and privileges senior to those of the holders of common stock. In addition, any preferred equity issuance or debt financing that we may obtain in the future could have restrictive covenants relating to our capital raising activities and other financial and operational matters, which may make it more difficult for us to obtain additional capital and to pursue business opportunities, including potential acquisitions.
Risks Related to Our Commercialization Activities
Our license agreements with Mitek provide substantial control of Monovisc and Orthovisc in the United States to Mitek, and Mitek’s actions could have a material impact on our business, financial condition and results of operations.
Our license and distribution agreements with Mitek related to Monovisc and Orthovisc provide Mitek with, among other things, the exclusive right to market and sell Monovisc and Orthovisc in the United States, unilateral decision-making authority over the sale, price, and promotion of Monovisc and Orthovisc in the United States, substantial control over the future development of Monovisc and Orthovisc related to the treatment of pain associated with osteoarthritis, a license to manufacture and have manufactured such products in the event that we are unable to supply Mitek with Monovisc or Orthovisc in accordance with the terms of the relevant agreement, and certain rights of first refusal with respect to future products we develop for the treatment of pain associated with osteoarthritis. In exchange, Mitek pays us a transfer price calculated with reference to historical end-user prices in the market and a fixed royalty rate per product on their net product sales. As Mitek accounts for a large percentage of our yearly revenue and has unilateral decision-making authority over in-market activities, including end-user pricing and discounts, reimbursement strategy, and overall promotion strategy, actions taken by Mitek could impact our ability to predict and generate revenue and have a material impact on our business, financial condition, and results of operations.
We may not succeed in our integration and buildout of our direct sales channel in the United States, and our failure to do so could negatively impact our business and financial results.
Beginning in 2019, and with our expanded commercial infrastructure, as a result of the Parcus Medical and Arthrosurface acquisitions, we have sold our Joint Preservation and Restoration family of products directly to customers, including hospitals and ASCs, through our direct Anika sales team and large network of independent third-party distributors. This approach was a departure from our historical distribution model in the United States, and we cannot be certain that we will be successful in implementing and executing on this commercial approach or that, even if we are able to implement it, the approach will be successful at scale. We may not be able to attract or retain the sophisticated personnel required for our approach, to identify or negotiate favorable or acceptable terms with distribution agents, to achieve in-market pricing at the levels we have targeted, to develop and tailor our product portfolio to be specifically desired by clinicians who practice in ASCs, or to timely execute on our strategies for market penetration generally. Our failure to successfully implement and execute on this commercial approach could have a material adverse effect on our business, financial condition, and results of operations.
We are dependent upon marketing and distribution partners and the failure to maintain strategic alliances on acceptable terms will have a material adverse effect on our business, financial condition, and results of operations.
Our success is dependent, in part, upon the efforts of our marketing, distribution, and logistics partners, including our sales agent partners in the United States, and the terms and conditions of our relationships with such partners. We cannot assure you that our commercial partners, including Mitek, will not seek to renegotiate their current agreements on terms less favorable to us or terminate such agreements. A failure to maintain relationships with our commercial partners on terms satisfactory to us, or at all, could result in a material adverse effect on our operating results.
We continue to seek to establish long-term partnerships in regions and countries not covered by existing agreements, and we may need to obtain the assistance of additional marketing partners to bring new and existing products to market and to replace certain marketing partners. There can be no assurance that we will be able to identify or engage appropriate distribution or collaboration partners or effectively transition to any such new partnerships. The failure to establish strategic partnerships for the marketing and distribution of our products on acceptable terms and within our planned timeframes could have a material adverse effect on our business, financial condition, and results of operations.
Sales of our products are largely dependent upon third party reimbursement and our performance may be harmed by health care cost containment initiatives or decisions of individual third-party payers.
In the United States and other foreign markets, health care providers, such as hospitals and physicians, that purchase health care products, such as our products, generally rely on third-party payers, including Medicare, Medicaid, and other health insurance and managed care plans, to reimburse all or part of the cost of the health care product. Reimbursement by third party payers, both in the United States and internationally, may depend on a number of factors, including the individual payer’s determination that the use of our products is clinically useful and cost-effective, medically necessary, and not experimental or investigational. Since reimbursement approval is required from each payer individually, seeking such approvals can be a time consuming and costly process, which could require us or our marketing partners to provide supporting scientific, clinical, and cost-effectiveness data for the use of our products to each payer separately. Significant uncertainty exists as to the reimbursement status of newly approved health care products, and any failure or delay in obtaining reimbursement approvals can negatively impact sales of our new products. In addition, we cannot be certain that payers who currently provide reimbursement for our products will continue to provide such reimbursement in the future, and such payer decisions could negatively impact the sales of our current or future products.
In addition, third party payers are increasingly attempting to contain the costs of health care products and services by limiting both coverage and the level of reimbursement for new therapeutic products and by refusing, in some cases, to provide coverage for uses of approved products for disease indications for which the FDA, or the applicable foreign regulatory agency, has granted marketing approval. Also, the U.S. Congress, certain state legislatures, and certain foreign governments and regulatory agencies have considered reforms, including, among other items, any material changes to the Affordable Care Act or the potential repeal of reference drug pricing in the United States, which may affect current reimbursement practices and create additional uncertainty about the pricing of our products, including the potential implementation of controls on health care spending through limitations on the growth of Medicare and Medicaid spending. There can be no assurance that third party reimbursement coverage will be available or adequate for any products or services developed by us. Outside the United States, the success of our products is also dependent in part upon the availability of reimbursement and health care payment systems. Domestic and international reimbursement laws and regulations may change from time to time. Lack of adequate coverage and reimbursement provided by governments and other third-party payers for our products and services, including continuing coverage for Monovisc and Orthovisc in the United States, and any change of classification by the Centers for Medicare and Medicaid Services for reimbursement of Orthovisc and Monovisc, could have a material adverse effect on our business, financial condition, and results of operations.
Risks Related to Our Product Development and Regulatory Compliance
We are facing a longer than expected pathway to commercialize our Cingal product in the United States, and we may face other unforeseen difficulties in achieving regulatory approval for Cingal, which could affect our business and financial results.
In the second quarter of 2018, we received and analyzed the results of our second Phase III clinical trial for Cingal and found that the data did not meet the primary study endpoint of demonstrating a statistically significant difference in pain reduction between Cingal and the approved steroid component of Cingal at the six-month time point. After discussions, the FDA indicated that an additional Phase III clinical trial would be necessary to support U.S. marketing approval for Cingal. In 2019, we began the design of a pilot study to enable us to evaluate our full-scale Phase III clinical trial design, including patient and site selection criteria, and increase the probability of success for the Phase III trial. In September 2020 the first patient was enrolled in the pilot study. We completed enrollment in the pilot study in November 2021 and we are currently evaluating the clinical results of the study and expect to complete the review of our analysis in the middle of 2022. We cannot guarantee that the results from the pilot study will be successful. If the pilot study is successful, we expect to commence an additional Phase III trial in 2022, but we cannot guarantee the success of any additional Phase III trial. Because the results of the pilot study or any additional Phase III trial, or other unforeseen future developments, could have a substantial negative impact on the timeline for and the cost associated with a potential Cingal regulatory approval, our overall business condition, financial results, and competitive position could be affected.
Failure to obtain, or any delay in obtaining, FDA or other U.S. and foreign governmental approvals for our products may have a material adverse effect on our business, financial condition and results of operations.
Several of our current products under development, and certain future products we may develop, will require clinical trials to determine their safety and efficacy for marketing approval by regulatory bodies, including the FDA. Product development and approval within the FDA and international regulatory frameworks takes a number of years and involves the expenditure of substantial resources. There can be no assurance that the FDA or other regulatory authorities will accept submissions related to our new products or the expansion of the indications of our current products, and, even if submissions are accepted, there can be no guarantee that the FDA or other regulatory authorities will grant approval for our new products, on a timely basis, if at all. In addition to regulations enforced by the FDA, we are subject to other existing and future federal, state, local, and foreign regulations applicable to product approval, which may vary significantly across jurisdictions. Additional approval of existing products may be required when changes to such products may affect the safety and effectiveness, including for new indications for use, labeling changes, process or manufacturing changes, the use of a different facility to manufacture, process or package the device, and changes in performance or design specifications. Failure to obtain regulatory approvals of our products, including any changes to existing products, could have an adverse material impact on our business, financial condition, and results of operations.
Even if ultimately granted, FDA and international regulatory approvals may be subject to significant, unanticipated delays throughout the regulatory approval process. Internally, we make assumptions regarding product approval timelines, both in the United States and internationally, in our business planning, and any delay in approval could materially affect our competitive position in the relevant product market and our projections related to future business results.
We cannot be certain that product approvals, both in the United States and internationally, will not include significant limitations on the product indications, and other claims sought for use, under which the products may be marketed. The relevant approval or clearance may also include other significant conditions of approval such as post-market testing, tracking, or surveillance requirements. Any of these factors could significantly impact our competitive position in relation to such products and could have a negative impact on the sales of such products.
Once obtained, we cannot guarantee that FDA or international product approvals will not be withdrawn or that relevant agencies will not require other corrective action, and any withdrawal or corrective action could materially affect our business and financial results.
Once obtained, marketing approval can be withdrawn by the FDA or comparable foreign regulatory agencies for a number of reasons, including the failure to comply with ongoing regulatory requirements or the occurrence of unforeseen problems following initial approval. Regulatory authorities could also limit or prevent the manufacture or distribution of our products. Any regulatory limitations on the use of our products or any withdrawal or suspension of approval or rescission of approval by the FDA or a comparable foreign regulatory agency could have a material adverse effect on our business, financial condition, and results of operations.
Our operations and products are subject to extensive regulation, compliance with which is costly and time consuming, and our failure to comply may result in substantial penalties, including recalls of our products.
The FDA and foreign regulatory bodies impose extensive regulations applicable to our operations and products, including regulations governing product and sterilization standards, packing requirements, labeling requirements, quality system and manufacturing requirements, import restrictions, tariff regulations, duties, and tax requirements. We cannot assure you that we will be able to achieve and maintain compliance required for FDA, CE marking, or other foreign regulatory approvals for any or all of our operations and products or that we will be able to produce our products in a timely and profitable manner while complying with applicable requirements.
Failure to comply with applicable regulatory requirements could result in substantial penalties, including warning letters, fines, injunctions, civil penalties, seizure of products, total or partial suspension of production, refusal to grant pre-market clearance or pre-market approval for devices or drugs, withdrawal of approvals, and criminal prosecution. Additionally, regulatory authorities have the power to require the recall of our products. It also might be necessary for us, in applicable circumstances, to initiate a voluntary recall per regulatory requirements of one or several of our products. The imposition of any of the foregoing penalties, whether voluntarily or involuntary, could have a material negative impact on our business, financial condition, and results of operations.
Any changes in FDA or international regulations related to product approval or approval renewal, including those currently under consideration by FDA or those that apply retroactively, could adversely affect our competitive position and materially affect our business and financial results.
FDA and foreign regulations depend heavily on administrative interpretation, and we cannot assure you that future interpretations made by the FDA or other regulatory bodies, with possible retroactive effect, will not adversely affect us. Additionally, any changes, whether in interpretation or substance, in existing regulations or policies, or any future adoption of new regulations or policies by relevant regulatory bodies, could prevent or delay approval of our products. In the event our future, or current, products, including HA generally, are classified, or re-classified, as human drugs, combination products, or biologics by the FDA or an applicable international regulatory body, the applicable review process-related to such products is typically substantially longer and substantially more expensive than the review process to which they are currently subject as medical devices. In 2018, FDA publicly indicated its intent to consider HA products for certain indications for regulation as a drug and has indicated that industry should submit new products or indication expansions to its Office of Combination Products to designate the appropriate FDA office for review. There exists uncertainty with respect to the final interpretation, implementation, and consequences of this development, and this or any other potential regulatory changes in approach or interpretation similar in substance to those mentioned in this paragraph and affecting our products could materially impact our competitive position, business, and financial results.
Additionally, the implementation of the new European Medical Device Regulation, or EU MDR, which was fully put into effect in 2021, is expected to change several aspects of the existing regulatory framework in Europe. Specifically, the EU MDR will require changes in the clinical evidence required for medical devices, post-market clinical follow-up evidence, annual reporting of safety information for Class III products, and bi-annual reporting for Class II products, Unique Device Identification, or UDI, for all products, submission of core data elements to a European UDI database prior to placement of a device on the market, reclassification of medical devices, and multiple other labeling changes. Approvals for certain of our currently marketed products could be curtailed or withdrawn as a result of the implementation of EU MDR, and acquiring approvals for new products could be more challenging and costly. We are currently reviewing our products that we are currently selling in European markets as to the impact of EU MDR. There may be products that we may not continue to market in Europe as expected demand may not be worth the cost of this regulatory compliance. Compliance with this and any other requirements could be time consuming and costly, and our failure to comply may subject us to significant liabilities, which could have a material adverse effect on our business, financial condition, and results of operations.
We may rely on third parties to support certain aspects of our clinical trials. If these third parties do not successfully carry out their contractual duties or meet expected deadlines, we may not be able to obtain regulatory approval or commercialize our products, and our business could be substantially harmed.
We have hired experienced clinical development and regulatory staff, and we have also retained the services of knowledgeable external service providers, including consultants and clinical research organizations, to develop and supervise our clinical trials and regulatory processes. Despite our internal investment in staffing, we will remain dependent upon these third-party contract research organizations and consultants to carry out portions of our clinical and preclinical research studies and regulatory filing assistance for the foreseeable future. As a result, we have had and will have less control over the conduct of the clinical trials, the timing and completion of the trials, the required reporting of adverse events, and the management of data developed through the trials than would be the case if we were relying entirely on our own staff. Outside parties may have staffing difficulties, may undergo changes in priorities or may become financially distressed, adversely affecting their willingness or ability to conduct our trials. Failure by these third parties to comply with regulatory requirements or to meet timing expectations may require us to repeat clinical or preclinical trials, which would delay the regulatory approval process, or require substantial unexpected expenditures.
We are subject to various healthcare laws and regulations, and any failure to comply with applicable laws could subject us to significant liability and harm our business.
The sales, marketing and pricing of products and relationships that medical products companies have with healthcare providers are under increased scrutiny around the world. Our industry is subject to various laws and regulations pertaining to healthcare fraud and abuse, including the False Claims Act, the Anti-Kickback Statute, the Stark law, the Physician Payments Sunshine Act, the Food, Drug, and Cosmetic Act, and similar laws and regulations in the U.S. and around the world. In addition, we are subject to various laws concerning anti-corruption and anti-bribery matters (including the Foreign Corrupt Practices Act), sales to countries or persons subject to economic sanctions and other matters affecting our international operations. Violations of these laws are punishable by criminal and/or civil sanctions, including, in some instances, fines, imprisonment and, within the United States, exclusion from participation in government healthcare programs, including Medicare, Medicaid and Veterans Administration health programs. These laws are administered by, among others, the DOJ, the OIG-HHS, the SEC, the OFAC, the Bureau of Industry and Security of the U.S. Department of Commerce, and state attorneys general. Any failure to comply with these laws could subject us to significant liabilities, which could have a material adverse effect on our business, financial condition, and results of operations.
We are subject to environmental regulations and any failure to comply with applicable laws could subject us to significant liabilities and harm our business.
We are subject to a variety of local, state, federal, and foreign government regulations relating to the storage, discharge, handling, emission, generation, manufacture, and disposal of toxic or other hazardous substances used in the manufacture of our products. Any failure by us to control the use, disposal, removal, or storage of hazardous chemicals or toxic substances could subject us to significant liabilities, which could have a material adverse effect on our business, financial condition, and results of operations.
Risks Related to Our Growth Initiatives
We may have difficulty managing our growth.
As a result of our activities, we have experienced substantial growth in the number of our employees, the scope of our product portfolio and pipeline, the size of our operating and financial systems, and the geographic area of our operations. This growth has resulted in increased responsibilities for our management. To manage our growth effectively, we must continue to expand our management team, attract, motivate and retain employees, and improve our operating and financial systems. There can be no assurance that our current management systems will be adequate or that we will be able to manage our recent or future growth successfully. Any failure to do so could have a material adverse effect on our business, operating results and financial condition.
We may not generate the expected benefits of our acquisitions, and the ongoing integration of those acquisitions could disrupt our ongoing business, distract our management and increase our expenses.
Through our acquisitions of Parcus Medical and Arthrosurface, we expanded our product portfolio and pipeline, diversified our business, expanded our commercial infrastructure, entered new markets, and increased the scope of our operations and the number of our employees. The continued successful integration of these other companies into our operations is critical to our future financial performance. This will require that we continue to integrate more closely the companies’ product offerings and research and development capabilities, retain key employees, assimilate diverse corporate cultures, further integrate management and financial information systems, consolidate the acquired operations and manage geographically dispersed operations, among other things, each of which could pose significant challenges. The difficulty of combining the acquired companies with our company may be increased by the need to integrate personnel, and changes effected in the combination may cause key employees to leave. To succeed in the market for joint preservation and restoration, we must also invest additional resources, primarily in the areas of sales and marketing, to extend name recognition and increase market share.
The integration of the two acquired companies into our operations has taken longer than originally anticipated and has required more effort and expense than was originally planned. This has resulted, and may continue to result, in the loss of valuable employees, additional and unforeseen expenses, the disruption of our ongoing business, processes and systems, or inconsistencies in standards, controls, procedures, practices, policies and compensation arrangements, any of which could adversely affect our ability to achieve the anticipated benefits of the acquisitions. There may be increased risk due to the ongoing integration of financial reporting and internal control systems. Any diversion of the attention of management created by the integration process, any disruptions or other difficulties encountered in the integration process, and unforeseen liabilities or unanticipated problems with the acquired businesses could have a material adverse effect on our business, operating results and financial condition. While we are working diligently to complete integration activities, employee disruptions, production and communication challenges and management diversion created by the COVID-19 pandemic present particular challenges to our continued integration of Arthrosurface and Parcus Medical and have made it more challenging than anticipated to effectively and timely complete our integration goals. We recorded an impairment to goodwill in 2020 and a reduction in the fair value of contingent consideration in connection with the acquisitions that was driven in part by an increase in the significant effect that COVID-19 has had and is expected to continue to have an impact on near-term cash flows of our new subsidiaries.
There can be no assurance that these acquisitions will provide the benefits we expect or that we will be able to integrate and develop the operations of Parcus Medical and Arthrosurface successfully. Any failure to do so could have a material adverse effect on our business, operating results and financial condition.
We expect to continue to actively explore inorganic growth as a part of our future growth strategy, which exposes us to a variety of risks that could adversely affect our business operations.
Our business and future growth strategy includes as an important component the acquisition of businesses, technologies, services, assets or products that we believe are a strategic fit with or otherwise provide value to our business. We may fund these acquisitions by utilizing our cash, incurring debt, issuing additional shares of our common stock, or by other means. Completed transactions may expose us to a number of risks and expenses, including unanticipated liabilities, amortization expenses related to intangible assets with definite lives, or risks associated with entering new markets with which we have limited experience or where commercial alliances with experienced partners or existing sales channels are not available. Whether or not completed, transactions may result in diversion of management resources otherwise available for ongoing development of our business and significant expenditures.
Customer and employee uncertainty about the effects of any acquisitions could harm us.
Customers of any companies we acquire may, in response to the consummation of the acquisitions, delay or defer purchasing decisions, which could adversely affect the success of our acquired businesses. Similarly, employees of acquired companies may experience uncertainty about their future roles, which may adversely affect our ability to attract and retain key management, sales, marketing, and technical personnel following an acquisition.
As our international sales and operations grow, we could become increasingly subject to additional economic, political, and other risks that could harm our business.
Since we manufacture our products for sale worldwide, our business is subject to risks associated with doing business internationally. During 2021, 2020, and 2019, 23%, 21%, and 21%, respectively, of our product sales were to international customers. We continue to be subject to a variety of risks, which could cause fluctuations in the results of our international and domestic operations. These risks include:
| ● |
The impact of recessions and other economic conditions in economies, including impact of COVID-19 pandemic, outside the United States; |
| ● |
Instability of foreign economic, political, and labor conditions; |
| ● |
Unfavorable labor regulations applicable to our European operations, such as severance and the unenforceability of non-competition agreements in the European Union; |
| ● |
The impact of strikes, work stoppages, work slowdowns, grievances, complaints, claims of unfair labor practices, or other collective bargaining disputes; |
| ● |
Difficulties in complying with restrictions imposed by regulatory or market requirements, tariffs, or other trade barriers or by U.S. export laws; |
| ● |
Imposition of government controls limiting the volume of international sales; |
| ● |
Longer accounts receivable payment cycles; |
| ● |
Potentially adverse tax consequences, including, if required or applicable, difficulties transferring funds generated in non-U.S. jurisdictions to the United States in a tax efficient manner; |
| ● |
Difficulties in protecting intellectual property, especially in international jurisdictions; |
| ● |
Difficulties in managing international operations; and |
| ● |
Burdens of complying with a wide variety of foreign laws, including MDR and GDPR among others. |
Our success depends, in part, on our ability to anticipate and address these and any new risks. We cannot guarantee that these or other factors will not adversely affect our business or operating results.
Risks Related to Our Intellectual Property
We may be unable to adequately protect our intellectual property rights, which could have a material impact on our business and future financial results.
Our efforts to enforce our intellectual property rights may not be successful. We rely on a combination of copyright, trademark, patent, and trade secret laws, confidentiality procedures, and contractual provisions to protect our proprietary rights. Our success will depend, in part, on our ability to obtain and enforce patents and trademarks, to protect trade secrets, to obtain licenses to technology owned by third parties when necessary, and to conduct our business without infringing on the valid proprietary rights of others. The patent positions of pharmaceutical, medical product, and biotechnology firms, including ours, can be uncertain and involve complex legal and factual questions. There can be no assurance that any patent applications will result in the issuance of patents or, if any patents are issued, that they will provide significant proprietary protection or commercial advantage or will not be circumvented by others. Filing and prosecution of patent applications, litigation to establish the validity and scope of patents, assertion of patent infringement claims against others, and the defense of patent infringement claims by others can be expensive and time consuming. There can be no assurance that, in the event that any claims with respect to any of our patents, if issued, are challenged by one or more third parties, any court or patent authority ruling on such challenge will determine that such patent claims are valid and enforceable. An adverse outcome in such litigation or patent review process could cause us to lose exclusivity covered by the disputed rights. If a third party is found to have rights covering products or processes used by us, we could be forced to cease using the technologies or marketing the products covered by such rights, we could be subject to significant liabilities to such third party, and we could be required to license technologies from such third party in order to continue production of the products. Furthermore, even if our patents are determined to be valid, enforceable, and broad in scope, there can be no assurance that competitors will not be able to design around such patents and compete with us using the resulting alternative technology. We have a policy of seeking patent protection for patentable aspects of our proprietary technology. We intend to seek patent protection with respect to products and processes developed in the course of our activities when we believe such protection is in our best interest and when the cost of seeking such protection is appropriate. However, no assurance can be given that any patent application will be filed, that any filed applications will result in issued patents, or that any issued patents will provide us with a competitive advantage or will not be successfully challenged by third parties. The protections afforded by patents will depend upon their scope and validity, and others may be able to design around our patents.
We also rely upon trade secrets and proprietary know-how for certain non-patented aspects of our technology. To protect such information, we require all employees, consultants, and licensees to enter into confidentiality agreements limiting the disclosure and use of such information. There can be no assurance that these agreements provide meaningful protection or that they will not be breached, that we would have adequate remedies for any such breach, or that our trade secrets, proprietary know-how, and our technological advances will not otherwise become known to others. In addition, there can be no assurance that, despite precautions taken by us, others have not and will not obtain access to our proprietary technology. Further, there can be no assurance that third parties will not independently develop substantially equivalent or better technology.
There can be no assurance that we will not infringe upon the intellectual property rights of others, which could have a significant impact on our business and financial results.
Other entities have filed patent applications for, or have been issued patents concerning, various products or processes in the segments in which we do business. There can be no assurance that the products or processes developed by us will not infringe on the patent rights of others in the future. The cost of defending infringement suits is typically large, and there is no guarantee that any future defense would be successful. In addition, infringement could lead to substantial damages payouts or our inability to produce or market certain of our current or future products. As a result, any such infringement may have a material adverse effect on our business, financial condition, and results of operations.
Risks Related to the COVID-19 Pandemic
Our operations are located in areas impacted by the COVID-19 pandemic, and those operations have been, and may continue to be, adversely affected by the COVID-19 pandemic.
The coronavirus has impacted the social and economic framework globally. Our administrative, research and development, and manufacturing operations are principally performed at our U.S. facilities in Massachusetts and Florida. Though our Italian operations represent a relatively small percentage of our consolidated business, we conduct commercial activity, product development, sales, logistics, inventory management and supply chain activities, and other services in our office in Padova, Italy. Our business operations in the United States and Italy are subject to potential business interruptions arising from protective measures that have been taken by Italian, U.S., Massachusetts and Florida regulators and other government agencies. Business disruptions elsewhere in the world could also negatively affect the sources and availability of components and materials that are essential to the operation of our business in both the United States and Italy. Our commercial day-to-day operations have been significantly impacted by the worldwide cancellation or delay of elective procedures in hospitals and ASCs, and timelines associated with certain clinical studies and research and development programs have been delayed.
Stay-at-home orders, business closures, travel restrictions, supply chain disruptions, employee illness or quarantines, our or our suppliers’ ability to hire employees and other extended periods of interruption to our business have resulted in disruptions to our operations, caused us to cease or delay operations, and prevented our customers from receiving shipments or processing payments. All of these impacts could continue as COVID-19 continues to impact our business. To mitigate the spread of COVID-19, we have transitioned a significant portion of our employee population to a remote work environment, but employees who are unable to work remotely continue to work at our facilities. There can be no assurances that the safety measures we have implemented will be sufficient to protect our employees in our workplace or that they may not otherwise be exposed to COVID-19 outside of our workplace. If a number of our essential employees become sick or otherwise unable to continue working during the current or any future epidemic, our operations may be harmed. Also, the remote work environment may exacerbate various cybersecurity risks to our business, including an increased demand for information technology resources, an increased risk of phishing and other cybersecurity attacks, and an increased risk of unauthorized dissemination of sensitive personal information or proprietary or confidential information. Extended periods of interruption to our corporate, development or manufacturing facilities due to the COVID-19 pandemic have caused or could cause us to lose revenue and market share, which has depressed and could continue to depress our financial performance and may be difficult to recapture. Travel restrictions within, to or from the United States United, Kingdom and Italy have negatively impacted the ability of our employees to do their jobs effectively and efficiently, including impacting our employees’ abilities to meet with clinicians and present and train them on our products. If travel continues to be restricted or inadvisable, these negative impacts could continue. In addition, employee disruptions and remote working environments related to the COVID-19 pandemic have impacted, and are continuing to impact, the efficiency and pace with which we work and develop our product candidates and our manufacturing capabilities.
In addition, the COVID-19 pandemic and related economic uncertainties has increased challenges associated with hiring highly skilled and experienced employees and may continue to create challenges and/or adversely impact employee retention due to the additional financial, family, and health burdens that many employees may be experiencing. Our industry’s highly competitive market for skilled workers and leaders may negatively affect our ability to retain qualified employees. Losing members of our senior management and other highly skilled personnel could prevent us from achieving our business objectives or divert management’s attention to seeking qualified replacements and ensuring seamless transitions.
The COVID-19 pandemic has resulted in a significant reduction in the number of elective surgeries being performed, and has slowed the pace of new product approvals by current and potential customers, which has decreased the usage of, and revenue from, certain of our products.
A significant portion of the demand for our products results from the usage of our products in elective surgeries. Elective surgeries have been curtailed a number of times during COVID-19 since 2020, including variant surges in 2021 in many parts of the globe due to restrictions on surgeries put in place by governments or healthcare providers, staffing shortages, and positive COVID-19 diagnoses or quarantines. While many restrictions have eased with COVID-19 vaccines now becoming available, the elective surgery market faced additional pandemic-related challenges in the second half of 2021 due to regional surges in COVID-19 Delta variant cases and staffing shortages. In December 2021, the COVID-19 Omicron variant prompted additional government restrictions on elective procedures, led to additional COVID-19 diagnoses, and created additional surgical staffing challenges.
Although the rate of elective procedures has started to increase in some locations, the systemic limits on elective surgery capacity negatively impacted our revenue and operating results. In addition, primarily as a result of the impacts of COVID-19 including stay-at-home orders and other attempts to limit in-person meetings, hospitals and ASCs have at times delayed having meetings of their committees to review and approve the introduction of new products into their facilities. As we are focused on growing our business by introducing new products to existing and new hospital and ASC customers, the inability to have our products timely reviewed and approved by these customers has also negatively impacted our revenue and operating results. It is uncertain whether elective surgeries will continue to be negatively impacted or halted again in the future by a resurgence of COVID-19 or when our customers or potential customers will start reviewing and approving new products again on a more regular cadence. There remains uncertainty in light of ongoing infection rates in many areas of the United States and in various international jurisdictions. Procedure volumes have not yet returned to pre-COVID-19 levels and there is no guarantee that the recent positive trends will continue. As a result, elective procedures may yet again decline, and the ability to get our products timely reviewed and approved by customers may continue to be challenged, especially in geographies with substantial COVID-19 infection rates or policies that cause staffing shortages. Globally, the pace of recovery will be phased and regionally determined based on local orders and the overall impact of COVID-19. A continuation of the decreased level of elective procedures due to COVID-19, or the continued slower pace of new product approvals, will result in a loss of sales and profits and other material adverse effects on our business and operating results.
The COVID-19 pandemic could adversely impact our development activities, preclinical studies and clinical trials, which could significantly impair our long-term business plans and operating results.
Our preclinical activities and clinical trials for our product candidates are planned in geographies that are currently affected by COVID-19. The timely initiation and completion of our preclinical and development activities and clinical trials depend upon the availability of facility access, preclinical and clinical trial sites, researchers and investigators, regulatory agency personnel, and materials, all of which may be adversely affected by the COVID-19 pandemic. The timing of our clinical trials depends on our ability to recruit patients to participate as well as the completion of required follow-up periods. The COVID-19 global pandemic has had and may continue to have a sustained impact on our ability to recruit, enroll and follow-up with patients either due to continued or renewed restrictions on travel or shelter-in-place orders or policies, or due to changes in patient willingness to participate in trials or travel to study sites during the pandemic. Additionally, COVID-19 related study site policies, including performing elective procedures, may create delays or setbacks in our ability to continue to enroll or to treat patients. The timeline for recruiting patients, conducting trials and obtaining regulatory approval of our product candidates may be delayed, which could result in increased costs, delays in advancing our product candidates, delays in testing the effectiveness of our product candidates or termination of the clinical trials altogether. Factors resulting from the COVID-19 pandemic that could delay or otherwise adversely affect the completion of our preclinical activities and the planned activities related to our clinical trials, as well as our business generally, include:
| ● |
the potential diversion of healthcare resources away from the conduct of preclinical activities and clinical trials to focus on pandemic concerns, including the availability of necessary materials and the attention of physicians serving as our clinical trial investigators, hospitals serving as our clinical trial sites and hospital staff supporting the conduct of our prospective clinical trials; |
| ● |
limitations on travel that could interrupt key preclinical and clinical activities, such as clinical trial site initiations and monitoring, domestic and international travel by employees, contractors or patients to clinical trial sites, including any government-imposed travel restrictions or quarantines that will impact the ability or willingness of patients, employees or contractors to travel to our research, manufacturing and clinical trial sites or secure visas or entry permissions, any of which could delay or adversely impact the conduct or progress of our prospective clinical trials; |
| ● |
interruption or delays in the operations of the FDA and comparable foreign regulatory agencies, which may impact review, inspection, clearance and approval timelines; |
| ● |
interruption in global shipping affecting the transport of clinical trial materials, such as patient samples, product candidates and supplies, to be used in our prospective clinical trials; |
| ● |
limitations on our business operations by government authorities that could impact our ability to conduct our preclinical or clinical activities; and |
| ● |
business disruptions caused by potential workplace, laboratory and office closures and an increased reliance on employees working from home, disruptions to or delays in ongoing laboratory experiments and operations, staffing shortages, travel limitations, cyber security and data accessibility, or communication or mass transit disruptions, any of which could adversely impact our business operations or delay necessary interactions with local regulators, ethics committees, manufacturing sites, research or clinical trial sites, and other important agencies and contractors. |
Our global supply chain may be materially adversely impacted due to the COVID-19 pandemic.
We rely upon the facilities of our global suppliers to support our business. The COVID-19 pandemic has resulted in significant governmental measures in many countries being implemented to control the spread of COVID-19, including restrictions on manufacturing and the movement of employees. As a result of COVID-19 and the measures designed to contain its spread, certain of our suppliers have not had the materials, capacity, or capability to supply our needed materials and other supplies that we require to manufacture our products according to our schedule and specifications. It is uncertain whether and to what extent these supply chain challenges will continue as the COVID-19 pandemic continues to evolve. Further, logistics issues, including our ability and our supply chain’s ability to quickly ramp up production, and transportation demands may cause delays. If our suppliers’ operations are curtailed, we may need to seek alternate sources of supply, which may be more expensive or require approval from regulatory agencies which could cause further delays. Alternate sources may not be available or may result in delays in shipments to us from our supply chain and subsequently to our customers, each of which would affect our results of operations. If the duration of the production and supply chain disruptions continue for an extended period of time, the impact on our supply chain could have a material adverse effect on our results of operations and cash flows.
Risks Related to Ownership of Our Common Stock
Our stock price may be highly volatile, and we cannot assure you that market making in our common stock will continue.
The market price of shares of our common stock may be highly volatile. Factors such as announcements of new commercial products or technological innovations by us or our competitors, disclosure of results of clinical testing or regulatory proceedings, government regulation and approvals, developments in patent or other proprietary rights, public concern as to the safety of products developed by us, and general market conditions may have a significant effect on the market price of our common stock. We withdrew and have not since provided financial guidance to investors as a result our own uncertainty with respect to projections during the COVID-19 pandemic. This action, as well as general investor uncertainty related to the COVID-19 pandemic, could create volatility and unpredictability in our stock price. The trading price of our common stock could also be subject to wide fluctuations in response to quarter-to-quarter variations in our operating results, material announcements by us or our competitors, governmental regulatory action, conditions in the health care industry generally or in the medical products industry specifically, or other events or factors, many of which are beyond our control. In addition, the stock market has experienced extreme price and volume fluctuations, which have particularly affected the market prices of many medical products companies and which often have been unrelated to the operating performance of such companies. Our operating results in future quarters may be below the expectations of equity research analysts and investors. In such an event, the price of our common stock would likely decline, perhaps substantially.
Our charter documents contain anti-takeover provisions that may prevent or delay an acquisition of our company.
Our charter documents continue to contain anti-takeover provisions that could prevent or delay an acquisition of our company. The provisions include, among others, a classified board of directors, advance notice to the board of stockholder proposals, limitations on the ability of stockholders to remove directors and to call stockholder meetings, and a provision that allows vacancies on the Board of Directors to be filled by vote of a majority of the remaining directors. We are also subject to Section 203 of the Delaware General Corporate Law which, subject to certain exceptions, prohibits a Delaware corporation from engaging in any of a broad range of business combinations with any “interested stockholder” for a period of three years following the date that such stockholder becomes an interested stockholder. Those provisions could have the effect of discouraging a third party from pursuing a non-negotiated takeover of our company at a price considered attractive by many stockholders and could have the effect of preventing or delaying a potential acquirer from acquiring control of our company.
If securities or industry analysts do not publish or cease publishing research or reports about us, our business, or our market, or if they adversely change their recommendations regarding our stock, our stock price and trading volume could decline.
The trading market for our common stock is influenced by the research and reports that securities or industry analysts may publish about us, our business, our market, or our competitors. No person is under any obligation to publish research or reports on us, and any person publishing research or reports on us may discontinue doing so at any time without notice. If adequate research coverage is not maintained on our company or if any of the analysts who cover us downgrade our stock or publish inaccurate or unfavorable research about our business or provide relatively more favorable recommendations about our competitors, our stock price would likely decline. If any analysts who cover us were to cease coverage of our company or fail to regularly publish reports on us, we could lose visibility in the financial markets, which in turn could cause our stock price or trading volume to decline.
We maintain leases on six facilities, including our corporate headquarters location in Bedford, Massachusetts, where we lease approximately 134,000 square feet of administrative, research and development, and manufacturing space. The lease on this facility contains multiple extension options that allow us to extend the term through October 2038. Our other lease locations are in Franklin, Massachusetts, Sarasota, Florida, Warsaw, Indiana and Padova, Italy. These additional facilities provide us with an aggregate of over 80,000 square feet of additional space and have terms expiring between 2022 and 2032, subject to certain renewal provisions contained within the lease agreements.
See Note 9, Leases, to the consolidated financial statements included elsewhere in this Annual Report on Form 10-K for additional information regarding our specific leaseholds.
We are involved from time-to-time in various legal proceedings arising in the normal course of business. Although the outcomes of these legal proceedings are inherently difficult to predict, we do not expect the resolution of these proceedings to have a material adverse effect on our financial position, results of operations, or cash flows.
On October 21, 2021, we received notice that the former unitholders of Parcus Medical had filed a request for arbitration regarding the earnout provisions agreed to in the Parcus Medical Merger Agreement. We have engaged in the arbitration process and do not anticipate a resolution during 2022. We are unable to estimate the potential liability with respect to this matter at this time. There are numerous factors that make it difficult to estimate reasonably possible loss or range of loss at this stage of the matter, including the significant number of legal and factual issues still to be resolved in the arbitration process. We intend to vigorously defend against the claims, and we believe that we have strong defenses to the claims asserted.
PART II
ITEM 5. MARKET FOR REGISTRANT’S COMMON EQUITY, RELATED STOCKHOLDER MATTERS AND ISSUER PURCHASES OF EQUITY SECURITIES
Common Stock Information
Our common stock has traded on the NASDAQ Global Select Market since November 25, 1997, under the symbol “ANIK.” At December 31, 2021, the closing price per share of our common stock was $35.83 as reported on the NASDAQ Global Select Market, and there were 111 holders of record. We believe that the number of beneficial owners of our common stock at that date was substantially greater, due to shares being held by intermediaries.
We have never declared or paid any cash dividends on our common stock. We currently intend to retain earnings, if any, for use in our business and do not anticipate paying cash dividends on our common stock in the foreseeable future. Payment of future dividends, if any, on our common stock will be at the discretion of our Board of Directors after taking into account various factors, including our financial condition, operating results, anticipated cash needs, and plans for expansion.
Performance Graph
Set forth below is a graph comparing the total returns of our company, the NASDAQ Composite Index, and the NASDAQ Biotechnology Index. The graph assumes $100 is invested on December 31, 2016 in our common stock and each of the indices. Past performance is not indicative of future results.
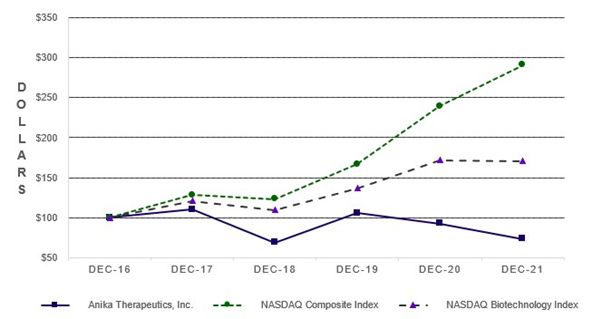
| Dec-16 |
Dec-17 |
Dec-18 |
Dec-19 |
Dec-20 |
Dec-21 |
|||||||||||||||||||
| Anika Therapeutics, Inc. |
$ | 100.00 | $ | 110.11 | $ | 68.65 | $ | 105.90 | $ | 92.44 | $ | 73.18 | ||||||||||||
| NASDAQ Composite Index |
$ | 100.00 | $ | 128.24 | $ | 123.26 | $ | 166.68 | $ | 239.42 | $ | 290.63 | ||||||||||||
| NASDAQ Biotechnology Index |
$ | 100.00 | $ | 121.06 | $ | 109.77 | $ | 136.56 | $ | 171.64 | $ | 170.55 | ||||||||||||
Issuer Purchases of Equity Securities
On May 2, 2019, we announced that our Board of Directors approved a $50.0 million share repurchase program with $30.0 million to be utilized for an accelerated share repurchase program, which was completed in January 2020, and $20.0 million reserved for open market repurchases which represents the maximum value of shares that may yet be purchased. No open market repurchases were made during the year ended December 31, 2021. Please see Note 16, Accelerated Share Repurchases to the consolidated financial statements included elsewhere in this Annual Report on Form 10-K.
Securities Authorized for Issuance Under Equity Compensation Plans
For information regarding securities authorized for issuance under our employee stock-based compensation plans, see Part III. Item 12. Security Ownership of Certain Beneficial Owners and Management and Related Stockholder Matters.
ITEM 6. SELECTED FINANCIAL DATA
Consistent with the amendments to Regulation S-K, information previously required by this item is no longer required. For our historic financial data not included in this Annual Report on Form 10-K, please refer to the “SEC Filings” section of our website located at http://www.anika.com.
ITEM 7. MANAGEMENT’S DISCUSSION AND ANALYSIS OF FINANCIAL CONDITION AND RESULTS OF OPERATIONS
The following section contains statements that are not statements of historical fact and are forward-looking statements within the meaning of the federal securities laws. These statements involve known and unknown risks, uncertainties, and other factors that may cause our actual results, performance, or achievement to differ materially from anticipated results, performance, or achievement, expressed or implied in such forward-looking statements. These statements reflect our current views with respect to future events, are based on assumptions, and are subject to risks and uncertainties. We discuss many of these risks and uncertainties at the beginning of this Annual Report on Form 10-K and under the sections captioned “Business” and “Risk Factors.” The following discussion should also be read in conjunction with the consolidated financial statements and the Notes thereto appearing elsewhere in this Annual Report on Form 10-K.
Management Overview
We are a global joint preservation company that creates and delivers meaningful advancements in early intervention orthopedic care. Based on our collaborations with clinicians to understand what they need most to treat their patients, we develop minimally invasive products that restore active living for people around the world. We are committed to leading in high opportunity spaces within orthopedics, including osteoarthritis, or OA, pain management, regenerative solutions, sports medicine soft tissue repair and bone preserving joint technologies.
We have thirty years of global expertise developing, manufacturing and commercializing products based on our hyaluronic acid, or HA, technology platform. HA is a naturally occurring polymer found throughout the body that is vital for proper joint health and tissue function. Our proprietary technologies for modifying the HA molecule allow product properties to be tailored specifically to multiple uses, including enabling longer residence time to support OA pain management and creating a solid form of HA called Hyaff, which is a platform utilized in our regenerative solutions portfolio.
In early 2020, we expanded our overall technology platform, product portfolio, and significantly enhanced our commercial infrastructure, especially in the United States, through our strategic acquisitions of Parcus Medical, a sports medicine and instrumentation solutions provider focused on soft tissue repair, and Arthrosurface, a company specializing in bone preserving partial and total joint replacement solutions. Through these acquisitions, we have transformed our company. We expanded our addressable market from the over $1 billion global OA pain management market to the over $8 billion global joint preservation market (which includes the faster growing sports medicine soft tissue repair and extremities segments), advanced our commercial capabilities, instituted systems and process to support our transformation, and expanded our product pipeline and research and development expertise in our target markets.
As we look towards the future, our business is positioned to capture value within our target market of joint preservation. We believe our success will be driven by our:
| ● |
Decades of experience in HA-based regenerative solutions and early intervention orthopedics combined under new seasoned leadership with a strong financial foundation for future investment in meaningful solutions for our customers and their patients; |
| ● |
Robust network of stakeholders in our target markets to identify evolving unmet patient treatment needs; |
| ● |
Prioritized investment in differentiated pipeline of regenerative solutions, bone preserving implants and sports medicine soft tissue repair products; |
| ● |
Leveraging our global commercial expertise to drive growth across the portfolio, with an intentional site of care focus on ASCs in the United States; |
| ● |
Opportunity to pursue strategic inorganic growth opportunities, including potential partnerships and smaller acquisitions, technology licensing, and leveraging our strong financial foundation and operational capabilities; and |
| ● |
Energized and experienced team focused on strong values, talent, and culture. |
For additional information regarding our business, please refer to “Item 1. Business” of this Annual Report on Form 10-K.
Key Developments during the Year Ended December 31, 2021
| ● |
We completed enrollment of the U.S. pilot clinical trial of Cingal, our combination viscosupplement / steroid product for OA pain management. |
| ● |
We completed market launch of Tactoset Injectable Bone Substitute for augmentation of suture anchor fixation. This new indication allows surgeons to use Tactoset for hardware fixation due to insufficient bone quality, increasing pull-out strength of suture anchors. |
| ● |
We launched a focused effort to advance our ESG strategy by completing an in-depth “Materiality Assessment” validating key environmental, social and governance issues of greatest importance to stakeholders. |
| ● |
We completed market launch of WristMotion Total Wrist Arthroplasty (TWA) system focused on alleviating pain and restoring full range of motion for patients with arthritic wrist joints; WristMotion TWA, along with WristMotion Hemiarthroplasty System, provide surgeons with multiple innovative and bone preserving treatment options for different stages and severities of wrist arthritis. |
| ● |
We received 510(k) clearance for a reverse shoulder implant system. This clearance sets the stage for the development and expansion of our shoulder implant portfolio targeted for the ASC. |
| ● |
We rolled out Anika’s ERP system, SAP, to legacy Parcus and Arthrosurface operations, providing additional operational capabilities in support of our growth strategy. |
COVID-19 Pandemic
As discussed more fully in the section captioned “Results of Operations – Year ended December 31, 2021 compared to year ended December 31, 2020” below, the COVID-19 pandemic impacted our full year financial condition and operations. In March 2020, the World Health Organization declared the spread of the COVID-19 virus a pandemic. This pandemic has caused an economic downturn on a global scale, as well as significant volatility in the financial markets. There has been significant volatility in our results on a quarterly basis due to the worldwide cancellation or delay of elective procedures, staffing shortages and supply chain disruptions, as well as the impact on timelines associated with certain clinical studies. While elective procedure volume had a limited recovery after the initial pandemic impacts seen in the early parts of second quarter of 2020 due to the easing of COVID-19 related restrictions in certain jurisdictions, areas of the United States and other countries have recently seen, and continue to see, fluctuating infection rates increasing as the result of emerging variants of COVID-19. Continuing fluctuations in infection rates in the United States and other countries make future results difficult to predict despite recent advances in the vaccination rates of certain parts of the population. Please see the section captioned “Part I. Item 1A. Risk Factors” of this Annual Report on Form 10-K for additional information with respect to the risks faced by our business in light of the COVID-19 pandemic. As a result of the COVID-19 pandemic, we have taken many precautions to provide a safe work environment for our employees and customers, including the establishment and implementation of a work from home policy, where possible. Despite increasing vaccination rates and other efforts to return to a more normalized business environment, the pandemic continues to have an impact on our business in certain jurisdictions and a resurgence of COVID-19 as a result of emerging variants or other factors, as has occurred in certain jurisdictions, could result in additional government lockdowns or other restrictions, quarantine requirements, staffing shortages or supply chain disruptions that could impact our business and operations. We may also have to take further actions that we determine are in the best interests of our employees or as required by federal, state, or local authorities. We have had some disruption in our ability to supply products to our customers due to supply chain disruptions and staffing shortages which has caused back orders or delays in certain shipments to our customers. Our commercial day-to-day operations have been impacted due to the worldwide cancellations and/or delays of elective procedures and restrictions on travel for both our employees and our clinician customers, and timelines associated with certain clinical studies and research and development programs have been delayed. While the impact has been limited to these items to date, we caution that there continues to be a possibility for potential future implementation of certain additional restrictions or other challenges associated with infections, staffing shortages or supply chain disruptions due to COVID-19 and it current or new variants in certain jurisdictions. The impact of these challenges are currently unknown, but could be significant.
Products
OA Pain Management
Our OA Pain Management product family consists of Monovisc, Orthovisc, Cingal, and Hyvisc, our injectable, HA-based viscosupplement offerings that are indicated to provide pain relief from osteoarthritis conditions.
Joint Preservation and Restoration
Our Joint Preservation and Restoration product family consists of: (a) our portfolio of over 150 bone preserving joint technology products, including partial joint replacement, joint resurfacing, and minimally invasive and bone sparing implants, designed to treat upper and lower extremity orthopedic conditions caused by trauma, injury and arthritic disease; (b) our line of sports medicine soft tissue repair solutions used to repair and reconstruct damaged ligaments and tendons due to sports injuries, trauma and disease; and (c) our orthopedic regenerative solutions products, including Hyalofast and Tactoset.
Non-Orthopedic
Our Non-Orthopedic product family consists of legacy HA-based products that are marketed principally for non-orthopedic applications, including our adhesion barrier product, advanced wound care products, our ear, nose and throat products, and our ophthalmic products.
For additional information with respect to our products, including information related to how they are sold and new product development initiatives, please see the sections captioned “Products,” “Sales Channels,” and “Research and Development” contained within “Part I. Item I. Business” of this Annual Report on Form 10-K.
Results of Operations
Year ended December 31, 2021 compared to year ended December 31, 2020
Statement of Operations Detail
| Year Ended December 31, |
||||||||||||||||
| 2021 |
2020 |
$ Change |
% Change |
|||||||||||||
| (in thousands, except percentages) |
||||||||||||||||
| Revenue |
$ | 147,794 | $ | 130,457 | $ | 17,337 | 13 | % | ||||||||
| Cost of revenue |
64,851 | 61,431 | 3,420 | 6 | % | |||||||||||
| Gross profit |
82,943 | 69,026 | 13,917 | 20 | % | |||||||||||
| Gross margin |
56 | % | 53 | % | ||||||||||||
| Operating expenses: |
||||||||||||||||
| Research & development |
27,327 | 23,431 | 3,896 | 17 | % | |||||||||||
| Selling, general & administrative |
74,096 | 60,063 | 14,033 | 23 | % | |||||||||||
| Goodwill impairment |
- | 42,520 | (42,520 | ) | (100% | ) | ||||||||||
| Change in fair value of contingent consideration |
(21,095 | ) | (28,666 | ) |
7,571 | (26% | ) | |||||||||
| Total operating expenses |
80,328 | 97,348 | (17,020 | ) | (17% | ) | ||||||||||
| Income (loss) from operations |
2,615 | (28,322 | ) |
30,937 | 109 | % | ||||||||||
| Interest and other expense, net |
(188 | ) | (302 | ) |
114 | (38% | ) | |||||||||
| Income (loss) before income taxes |
2,427 | (28,624 | ) |
31,051 | 108 | % | ||||||||||
| Benefit from income taxes |
(1,707 | ) | (4,642 | ) |
2,935 | (63% | ) | |||||||||
| Net income (loss) |
$ | 4,134 | $ | (23,982 | ) |
$ | 28,116 | 117 | % | |||||||
Revenue
Revenue for the year ended December 31, 2021 was $147.8 million, an increase of $17.3 million, or 13%, compared to prior year. The increase in revenue was primarily driven by partial recovery from the initial impact of the COVID-19 pandemic on sales volumes and related strategic partner ordering patterns as well as from growing commercial adoption of new products. The increase for 2021 was also in part due to inclusion of full first quarter results of Parcus Medical and Arthrosurface, which we acquired on January 24, 2020 and February 3, 2020, respectively.
The following table presents product revenue by product family for fiscal years 2021 and 2020 (dollars in thousands):
| Years Ended December 31, |
||||||||||||||||
| 2021 |
2020 |
$ Change |
% Change |
|||||||||||||
| OA Pain Management |
$ | 89,503 | $ | 83,029 | $ | 6,474 | 8 | % | ||||||||
| Joint Preservation and Restoration |
48,588 | 39,368 | 9,220 | 23 | % | |||||||||||
| Non-orthopedic |
9,703 | 8,060 | 1,643 | 20 | % | |||||||||||
| $ | 147,794 | $ | 130,457 | $ | 17,337 | 13 | % | |||||||||
Revenue from our OA Pain Management product family increased 8% for the year ended December 31, 2021, as compared to prior year, due primarily to partial recovery from the initial impact of the COVID-19 pandemic on sales volumes and related strategic partner ordering patterns.
Revenue from our Joint Preservation and Restoration product family increased 23% for the year ended December 31, 2021, as compared to prior year, due primarily to organic growth as the initial impact of the COVID-19 pandemic on elective procedures begins to lift in various worldwide jurisdictions, especially in the United States during 2021. We also saw rapidly growing commercial adoption of new regenerative, soft tissue and bone sparing joint products introduced in 2019, 2020 and 2021. The increase was also due in part to the inclusion of full year results from Parcus Medical and Arthrosurface which were acquired in the first quarter of 2020.
Revenue from our non-orthopedic product family increased 20% for the year ended December 31, 2021, as compared to prior year, primarily due to timing of distributor sales as well as due to higher revenues from legacy products during the first quarter.
Gross Profit and Margin
Gross profit for the year ended December 31, 2021 was $82.9 million, or gross margin of 56%, as compared with $69.0 million, or gross margin of 53%, for the year ended December 31, 2020. The increase in gross profit for the year ended December 31, 2021, primarily resulted from revenue growth and lower amortization of inventory step up costs related to the Arthrosurface and Parcus Medical acquisitions. This increase was partially offset by higher product rationalization charges, as well as lower production levels and increased reserves caused in part by staffing and supply chain challenges resulting from the COVID-19 pandemic. Gross margin includes the impact of inventory step-up associated with the Arthrosurface and Parcus Medical acquisitions, as well as acquisition-related amortization expenses. These expenses together increased cost of revenue by $12.7 million, or 9 points of gross margin, for the year ended December 31, 2021 as compared to increased cost of revenue of $16.9 million, or 13 points of gross margin for the same periods in 2020.
Research and Development
Research and development expenses for the year ended December 31, 2021 were $27.3 million, an increase of $3.9 million, or 17%, as compared to the prior year, primarily due to product development activities associated with the development of new product candidates in our research and development pipeline, execution of the Cingal pilot study and Hyalofast clinical trial.
For additional information on our research and development activities, please see the section captioned “Part I. Item 1. Business—Research and Development” in this Annual Report on Form 10-K.
Selling, General and Administrative
Selling, general and administrative, or SG&A, expenses for the year ended December 31, 2021 were $74.1 million, an increase of $14.0 million, or 23%, as compared to the prior year. The increase in SG&A expenses for the year ended December 31, 2021 was primarily related to full period expenses from Parcus Medical and Arthrosurface, expansion of our commercial capability in the United States and expanded marketing activities and other operational capabilities to support the growing business needs, higher stock based compensation expense, and a non-cash loss on disposal of fixed assets, partially offset by the absence of transaction costs incurred in 2020 related to acquisitions of Parcus Medical and Arthrosurface. Certain activities were curtailed in the year ended December 31, 2020 due to cost optimization in light of the early stages of the COVID-19 pandemic.
Goodwill Impairment Charge
We assess goodwill for impairment annually, or, under certain circumstances, more frequently, such as when events or changes in circumstances indicate there may be impairment. U.S. government policy responses to the COVID-19 pandemic and the resulting changes in healthcare guidelines caused a temporary suspension of domestic elective surgical procedures. As a result of these events during 2020, we experienced decreases in immediate term revenue and related cash flows which directly impacted the Parcus Medical and Arthrosurface reporting unit. The results of the interim and annual impairment tests indicated that the estimated fair value of this reporting unit was less than its carrying value. Consequently, a non-cash goodwill impairment charge of $42.5 million was recorded in 2020. There were no goodwill impairment charges during 2021.
Contingent Consideration Fair Value Change
In the year ended December 31, 2021, we recorded a $21.1 million net benefit related to the change in fair value of our contingent consideration liabilities incurred associated with the acquisition of Parcus Medical and Arthrosurface in 2020. The liability for contingent consideration is remeasured at each reporting period until the contingency is resolved. The decrease in fair value of the contingent consideration was due primarily to the decrease in the likelihood that certain contingent milestones would be achieved or because certain contingent milestones were not achieved. Also, in July 2021, we made a regulatory milestone payment in connection with the Arthrosurface acquisition in the amount of $10.0 million upon obtaining a regulatory clearance for a reverse shoulder implant system.
Income Taxes
The benefit from income taxes was $1.7 million for the year ended December 31, 2021, resulting in an effective tax rate of (70.4%). The benefit from income taxes was $4.6 million for the year ended December 31, 2020, resulting in an effective tax rate of 16.2%. The net change in the effective tax rate for the year ended December 31, 2021, as compared to the prior year, was primarily due to lower income before tax in 2021, favorable state tax apportionment, a $0.9 million tax benefit on the decrease in the fair value of contingent consideration and the release of a valuation allowance initially recorded in 2020 in the amount of $0.9 million due to increased likelihood regarding the realizability of certain net deferred tax assets in Italy.
Net Income (Loss)
For the year ended December 31, 2021, net income was $4.1 million, or $0.28 per diluted share, compared to net loss of $24.0 million, or $1.69 per diluted share, for the prior year. The increase in net income and diluted earnings per share was primarily due to increased revenue, reduction in the fair value of contingent consideration and the absence of goodwill impairment charges, partially offset by higher operating expenses primarily driven by increased spending to expand our commercial capability in the United States and development of new products and clinical trial activity.
Non-GAAP Financial Measures
We present certain information with respect to adjusted gross profit and adjusted gross margin, adjusted Earnings Before Interest, Tax, Depreciation and Amortization, or EBITDA, adjusted net income, adjusted diluted earnings per share or adjusted EPS, which are financial measures not based on any standardized methodology prescribed by accounting principles generally accepted in the United States, or GAAP, and is not necessarily comparable to similarly titled measures presented by other companies.
We have presented adjusted gross profit and adjusted gross margin, adjusted EBITDA, adjusted net income, adjusted EPS, because they are key measures used by our management and board of directors to understand and evaluate our operating performance and to develop operational goals for managing our business. We believe these financial measures help identify underlying trends in our business that could otherwise be masked by the effect of the expenses that we exclude. In particular, we believe that the exclusion of these items in calculating these measures can provide a useful tool for period-to-period comparisons of our core operating performance. Accordingly, we believe that these measures provide useful information to investors and others in understanding and evaluating our operating results, enhancing the overall understanding of our past performance and future prospects and allowing for greater transparency with respect to key financial metrics used by our management in their financial and operational decision-making.
Adjusted Gross Profit and Adjusted Gross Margin
We define adjusted gross profit as our gross profit excluding amortization of certain acquired intangible assets, the impact of inventory fair-value step up associated with our recent acquisitions and certain product rationalization charges. The amortized assets contribute to revenue generation, and the amortization of such assets will likely continue in future periods until such assets are fully amortized. These assets include the fair value of certain identified assets acquired in acquisitions, including developed technology and acquired tradenames. We define adjusted gross margin as adjusted gross profit divided by total revenue.
The following is a reconciliation of adjusted gross profit to gross profit for the years ended December 30, 2021 and 2020, respectively:
| Years Ended December 31, |
||||||||
| 2021 |
2020 |
|||||||
| Gross profit |
$ | 82,943 | $ | 69,026 | ||||
| Product rationalization charges |
2,445 | 1,920 | ||||||
| Acquisition related intangible asset amortization |
6,248 | 5,844 | ||||||
| Acquisition related inventory step up |
6,465 | 11,082 | ||||||
| Adjusted gross profit |
$ | 98,101 | $ | 87,872 | ||||
| Adjusted gross margin | 66 | % | 67% | |||||
Adjusted gross profit for the year ended December 31, 2021 increased $10.2 million to $98.1 million representing 66% of revenue. Adjusted gross profit for the year ended December 31, 2020 was $87.9 million, or 67% of revenue. This increase in adjusted gross profit for the year ended December 31, 2021 as compared to 2020, primarily resulted from higher revenue due to organic growth of revenues as COVID-19 pandemic related restrictions started lifting in various worldwide jurisdictions, especially in the United States, as well as the inclusion of full period results from Parcus Medical and Arthrosurface in 2021 as we acquired these businesses in early 2020. The decrease in adjusted gross margin for the year ended December 31, 2021 as compared to 2020, is due primarily to unfavorable production volumes and increased reserves caused partially by supply chain and staffing challenges, due largely to the impact of the COVID-19 pandemic.
Adjusted EBITDA
We present information below with respect to adjusted EBITDA, which we define as our net income (loss) excluding interest and other income, net, income tax benefit (expense), depreciation and amortization, stock-based compensation, product rationalization, and acquisition-related expenses. We have also excluded the impacts of goodwill impairment charges and changes in the fair value of contingent consideration associated with our acquisition transactions in early 2020.
Adjusted EBITDA is not prepared in accordance with US GAAP, and should not be considered in isolation of, or as an alternative to, measures prepared in accordance with US GAAP. There are a number of limitations related to the use of adjusted EBITDA rather than net income (loss), which is the nearest US GAAP equivalent. Some of these limitations are:
| • |
adjusted EBITDA excludes depreciation and amortization, and, although these are non-cash expenses, the assets being depreciated or amortized may have to be replaced in the future, the cash requirements for which are not reflected in adjusted EBITDA; |
| • |
we exclude stock-based compensation expense from adjusted EBITDA although (a) it has been, and will continue to be for the foreseeable future, a significant recurring expense for our business and an important part of our employee compensation strategy and (b) if we did not pay out a portion of our compensation in the form of stock-based compensation, the cash salary and bonus expense included in operating expenses likely would be higher, which would affect our cash position; |
| • |
we exclude acquisition related expenses, including transaction costs and other related expenses, amortization and depreciation of acquired assets in recent acquisitions, and the impact of inventory fair-value step up on cost of revenue; |
| • |
we exclude certain impairment charges, including impairment related to In-Process Research and Development, or IPR&D, assets, certain product rationalization charges as a result of managing our financial position in light of our recent acquisitions, the impact of COVID-19 and changing regulatory requirements; |
| • |
we exclude goodwill impairment charges and changes in the fair value of contingent consideration; |
| • |
the expenses and other items that we exclude in our calculation of adjusted EBITDA may differ from the expenses and other items, if any, that other companies may exclude from adjusted EBITDA when they report their operating results; |
| • |
adjusted EBITDA does not reflect changes in, or cash requirements for, working capital needs; |
| • |
adjusted EBITDA does not reflect provision for (benefit from) income taxes or the cash requirements to pay taxes; and |
| • |
adjusted EBITDA does not reflect historical cash expenditures or future requirements for capital expenditures or contractual commitments. |
The following is a reconciliation of adjusted EBITDA to net income (loss) for the years ended December 31, 2021 and 2020, respectively:
| Years Ended December 31, |
||||||||
| 2021 |
2020 |
|||||||
| Net income (loss) |
$ | 4,134 | $ | (23,982 | ) |
|||
| Interest and other expense, net |
188 | 302 | ||||||
| Benefit from income taxes |
(1,707 | ) | (4,642 | ) |
||||
| Depreciation and amortization |
7,169 | 6,844 | ||||||
| Stock-based compensation |
11,085 | 5,386 | ||||||
| Product rationalization charges |
2,445 | 2,892 | ||||||
| IPR&D impairment |
600 | 1,414 | ||||||
| Acquisition related expenses |
- | 4,168 | ||||||
| Acquisition related intangible asset amortization |
7,148 | 6,620 | ||||||
| Acquisition related inventory step up |
6,465 | 11,082 | ||||||
| Goodwill impairment |
- | 42,520 | ||||||
| Change in fair value of contingent consideration |
(21,095 | ) | (28,666 | ) |
||||
| Adjusted EBITDA |
$ | 16,432 | $ | 23,938 | ||||
Adjusted EBITDA for year ended December 31, 2021, decreased $7.5 million as compared to 2020. The decrease in adjusted EBITDA was primarily due to an increase in operating expenses largely attributable to expansion of our commercial capability in the United States and an increase in clinical trial activity, both of which had been largely curtailed during 2020 in response to the COVID-19 pandemic, as well as a non-cash impairment charge related to fixed assets, partially offset by an increase in revenue.
Adjusted Net Income (Loss) and Adjusted EPS
We present information below with respect to adjusted net income (loss) and adjusted EPS. We define adjusted net income (loss) as our net income (loss) excluding acquisition-related expenses, amortization and depreciation of acquired assets, the impact of inventory fair-value step up on cost of revenue and the impacts of goodwill impairment charges and changes in the fair value of contingent consideration, as well as certain impairment charges, including impairment related to IPR&D assets and non-cash product rationalization charges, each on a tax effected basis. Acquisition related expenses are those that we would not have incurred except as a direct result of acquisition transactions. Acquisition related expenses consist of investment banking, legal, accounting, and other professional and related expenses. The amortized assets contribute to revenue generation, and the amortization of such assets will recur in future periods until such assets are fully amortized. These assets include the estimated fair value of certain identified assets acquired in acquisitions, including in-process research and development, developed technology, customer relationships and acquired tradenames. We define adjusted EPS as US GAAP diluted earnings per share excluding the above adjustments to net income (loss) used in calculating adjusted net income (loss), each on a per share and tax effected basis.
The following is a reconciliation of adjusted net income (loss) to net income (loss) for the years ended December 31, 2021 and 2020, respectively:
| Years Ended December 31, |
||||||||
| 2021 |
2020 |
|||||||
| Net income (loss) |
$ | 4,134 | $ | (23,982 | ) |
|||
| Product rationalization charges, tax effected |
1,830 | 2,376 | ||||||
| IPR&D impairment, tax effected |
448 | 1,414 | ||||||
| Acquisition related expenses, tax effected |
- | 3,146 | ||||||
| Acquisition related intangible asset amortization, tax effected |
5,386 | 4,997 | ||||||
| Acquisition related inventory step up |
4,810 | 8,365 | ||||||
| Goodwill impairment, tax effected |
- | 37,702 | ||||||
| Change in fair value of contingent consideration, tax effected |
(16,979 | ) | (23,872 | ) |
||||
| Adjusted net income (loss) |
$ | (371 | ) | $ | 10,146 | |||
The following is a reconciliation of adjusted EPS to diluted earnings (loss) per share for the years ended December 31, 2021 and 2020, respectively (in thousands, expect per share data):
| Years Ended December 31, |
||||||||
| 2021 |
2020 |
|||||||
| Diluted earnings (loss) per share |
$ | 0.28 | $ | (1.69 | ) |
|||
| Product rationalization charges, tax effected |
0.13 | 0.17 | ||||||
| IPR&D impairment, tax effected |
0.03 | 0.10 | ||||||
| Acquisition related expenses per share, tax effected |
- | 0.22 | ||||||
| Acquisition related intangible asset amortization, tax effected |
0.37 | 0.35 | ||||||
| Acquisition related inventory step up |
0.33 | 0.59 | ||||||
| Goodwill impairment, tax effected |
- | 2.65 | ||||||
| Change in fair value contingent consideration, tax effected |
(1.16 | ) | (1.68 | ) |
||||
| Adjusted diluted earnings (loss) per share |
$ | (0.02 | ) | $ | 0.71 | |||
Adjusted net income (loss) in 2021, decreased $10.5 million as compared to 2020. The decrease in adjusted net income for the period was primarily due to an increase in selling and marketing expenses primarily attributable to increased cost to support our commercial capability in the United States, an increase in research and development expenses, an increase in share-based compensation expense due largely to forfeitures of unvested shares during the comparable period, a non-cash impairment charge related to fixed assets, production volumes and supply chain and staffing challenges, as well as a decrease in tax benefits.
Year ended December 31, 2020 compared to year ended December 31, 2019
Statement of Operations Detail
| Year Ended December 31, |
||||||||||||||||
| 2020 |
2019 |
$ Change |
% Change |
|||||||||||||
| (in thousands, except percentages) |
||||||||||||||||
| Revenue |
130,457 | 114,610 | 15,847 | 14 | % |
|||||||||||
| Cost of revenue |
61,431 | 28,747 | 32,684 | 114 | % |
|||||||||||
| Gross Profit |
69,026 | 85,863 | (16,837 | ) |
(20 | %) |
||||||||||
| Gross margin |
53 | % |
75 | % |
||||||||||||
| Operating expenses: |
||||||||||||||||
| Research & development |
23,431 | 16,665 | 6,766 | 41 | % |
|||||||||||
| Selling, general & administrative |
60,063 | 34,950 | 25,113 | 72 | % |
|||||||||||
| Goodwill impairment |
42,520 | - | 42,520 | - | ||||||||||||
| Change in fair value of contingent consideration |
(28,666 | ) |
- | (28,666 | ) |
- | ||||||||||
| Total operating expenses |
97,348 | 51,615 | 45,733 | 89 | % |
|||||||||||
| Income (loss) from operations |
(28,322 | ) |
34,248 | (62,570 | ) |
(183 | %) |
|||||||||
| Interest and other income (expense), net |
(302 | ) |
1,873 | (2,175 | ) |
(116 | %) |
|||||||||
| Income (loss) before income taxes |
(28,624 | ) |
36,121 | (64,745 | ) |
(179 | %) |
|||||||||
| Provision for (benefit from) income taxes |
(4,642 | ) |
8,928 | (13,570 | ) |
(152 | %) |
|||||||||
| Net income (loss) |
$ | (23,982 | ) |
$ | 27,193 | $ | (51,175 | ) |
(188 | %) |
||||||
Revenue
Revenue for the year ended December 31, 2020 was $130.5 million, an increase of $15.9 million, or 14%, compared to prior year. This increase was primarily driven by growth in our Joint Preservation and Restoration product family, as a result of our acquisitions of Parcus Medical and Arthrosurface in early 2020, offset by a decrease in revenue from our OA Pain Management products due to the impact of the COVID-19 pandemic on elective procedure volumes worldwide.
The following table presents product revenue by product family for fiscal years 2020 and 2019 (dollars in thousands):
| Years Ended December 31, |
||||||||||||||||
| 2020 |
2019 |
$ Change |
% Change |
|||||||||||||
| OA Pain Management |
$ | 83,029 | $ | 103,466 | $ | (20,437 | ) |
(20 | %) |
|||||||
| Joint Preservation and Restoration |
39,368 | 2,070 | 37,298 | 1801 | % |
|||||||||||
| Non-Orthopedic |
8,060 | 8,976 | (916 | ) |
(10 | %) |
||||||||||
| $ | 130,457 | $ | 114,512 | $ | 15,945 | 14 | % |
|||||||||
Revenue from our OA Pain Management product family decreased, primarily due to the worldwide impact of the COVID-19 pandemic on elective procedure volumes. Revenue from our Joint Preservation and Restoration products increased primarily from the addition of revenue from the Arthrosurface and Parcus Medical product portfolios following their early 2020 acquisition by us, offset in part by the impact of the COVID-19 pandemic on elective surgery procedure volumes worldwide. Revenue from our Non-Orthopedic product family decreased due to the impact of the COVID-19 pandemic on procedure volumes worldwide. Revenue for the year ended December 31, 2019 includes licensing related revenue in the amount of $0.1 million which was zero in 2020.
Gross Profit and Margin
Gross profit for the year ended December 31, 2020 was $69.0 million, or gross margin of 53%, as compared with $85.9 million, or gross margin of 75%, for the year ended December 31, 2019. The decrease in gross margin was primarily due to the inventory step-up associated with the Arthrosurface and Parcus Medical acquisitions, as well as acquisition-related amortization expenses, which together increased cost of revenue by $16.9 million, or 13 points of gross margin, for the year ended December 31, 2020. Gross margin also decreased due to lower volumes as a result of the COVID-19 pandemic. In addition, during the year ended December 31, 2020, gross profit decreased due to a non-cash inventory impairment charge of $1.9 million following our determination not to pursue CE Mark renewals for certain of our legacy HA-based products primarily in the Non-Orthopedic product family.
Research and Development
Research and development expenses for the year ended December 31, 2020 were $23.4 million, an increase of $6.8 million, or 41%, as compared to the prior year, primarily due to activities associated with new product development in our research and development pipeline, including those related to Parcus Medical and Arthrosurface following their acquisition in the first quarter of 2020, as well as preparation and initial execution activities for the Cingal Pilot study and certain European post-market clinical studies to support CE Mark approvals for our products, Hyalofast clinical study activities, and IPR&D impairment charges related to Hyalonect and Hyalobone projects.
For additional information on our research and development activities, please see the section captioned “Part I. Item 1. Business—Research and Development” in this Annual Report on Form 10-K.
Selling, General and Administrative
Selling, general and administrative, or SG&A, expenses for the year ended December 31, 2020 were $60.1 million, an increase of $25.1 million, or 72%, as compared to the prior year. The increase was primarily related to expenses associated with operating Parcus Medical and Arthrosurface following their acquisition in the first quarter of 2020, including incremental expenses to integrate our commercial infrastructure, as well as incentive compensation, partially offset by a decrease in stock compensation expense due to the forfeiture of unvested equity awards.
Goodwill Impairment Charge
We assess goodwill for impairment annually, or, under certain circumstances, more frequently, such as when events or changes in circumstances indicate there may be impairment. U.S. government policy responses to the COVID-19 pandemic and the resulting changes in healthcare guidelines caused a temporary suspension of domestic elective surgical procedures. As a result of these events during the first quarter of 2020, we performed a quantitative assessment of goodwill impairment related to the Parcus Medical and Arthrosurface reporting unit as of March 31, 2020. The results of these interim impairment tests indicated that the estimated fair value of this reporting unit was less than its carrying value. Consequently, a non-cash goodwill impairment charge of $18.1 million was recorded in the quarter ended March 31, 2020. The decline in fair value was primarily due to decreases in immediate term revenue and related cash flows as a result of the temporary suspension of domestic elective procedures which directly impact the Parcus Medical and Arthrosurface reporting unit. We also performed our annual impairment testing related to the Parcus Medical and Arthrosurface reporting unit in the fourth quarter of 2020. The results of the annual impairment test indicated that the estimated fair value of the reporting unit was less than its carrying value. This was primarily due to a decline in projected net cash flows as a result of the continued impact of COVID-19 on revenue and related cash flows, the expectation that the economic recovery will take longer than expected to materialize, and additional projected investment to support future growth. Consequently, a non-cash goodwill impairment charge was recorded in the amount of $24.4 million during the fourth quarter of 2020. The total non-cash goodwill impairment charge with respect to the reporting unit amounted to $42.5 million for the year ended December 31, 2020.
Contingent Consideration Fair Value Change
In the year ended December 31, 2020, we recorded a $28.7 million net benefit related to the change in fair value of our contingent consideration liabilities incurred as a result of the acquisition of Parcus Medical and Arthrosurface in the first quarter of 2020. The liability for contingent consideration is remeasured at each reporting period until the contingency is resolved. The decrease in fair value of the contingent consideration was largely due to a decrease in revenue projections related primarily to the COVID-19 pandemic. On October 15, 2020, we received FDA clearance for the WristMotion Total Arthroplasty System, triggering a $5 million regulatory-based milestone payment per the Arthrosurface merger agreement.
Income Taxes
The benefit from income taxes was $4.6 million for the twelve-month period ended December 31, 2020, based on an effective tax rate of 16.2%. The provision for income taxes was $8.9 million for the twelve-month period ended December 31, 2019, based on an effective tax rate of 24.7%. The net decrease in the effective tax rate benefit for the year ended December 31, 2020, as compared to the prior year, was primarily due to the $4.8 million tax expense on the impairment of non-tax deductible goodwill, partially offset by the $1.9 million tax benefit on the decrease in the fair value of the contingent consideration.
Net Income (Loss)
For the year ended December 31, 2020, net loss was $23.9 million, or $1.69 net loss per diluted share, compared to net income of $27.2 million, or $1.89 net income per diluted share, for the prior year. The decrease in net income and diluted earnings per share was primarily a result of the increased expenses associated with acquisitions of Parcus Medical and Arthrosurface previously discussed, in addition to the unfavorable impact on sales and gross profit from the COVID-19 pandemic.
Concentration of Risk
We have historically derived the majority of our revenue from a small number of customers, most of whom resell our products to end-users and are significantly larger companies than us. For the year ended December 31, 2021, Mitek accounted for 45% of revenue, as compared to 49% in prior year. While we believe that our expanded commercial infrastructure will substantially diversify our revenue base, we expect to continue to be dependent on a small number of large customers, especially Mitek, for a sizeable portion of our revenues in the near-term future. The failure of these customers to purchase our products in the amounts they historically have or in amounts that we expect could materially impact our business.
In addition, if present and future customers terminate their purchasing arrangements with us, significantly reduce or delay their orders, or seek to renegotiate their agreements on terms less favorable to us, our business, financial condition, and results of operations will be adversely affected. If we accept terms less favorable than the terms of the current agreements, such renegotiations may have a material adverse effect on our business, financial condition, and/or results of operations. Furthermore, in any future negotiations we may be subject to the perceived or actual leverage that these customers may have given their relative size and importance to us. Any termination, change, reduction, or delay in orders could seriously harm our business, financial condition, and results of operations. Accordingly, unless and until we diversify and expand our customer base, our future success will significantly depend upon the timing and size of future purchases by our largest customers and the financial and operational success of these customers. The loss of any one of our major customers or the delay of significant orders from such customers, even if only temporary, could reduce or delay our recognition of revenues, harm our reputation in the industry, and reduce our ability to accurately predict cash flow, and, as a consequence, it could seriously harm our business, financial condition, and results of operations.
See Note 13, Revenue by Product Family, by Significant Customer and by Geographic Location; Geographic Information, to the consolidated financial statements included elsewhere in this Annual Report on Form 10-K for information regarding significant customers.
Liquidity and Capital Resources
We require cash to fund our operating activities and to make capital expenditures and other investments in the business. We expect that our requirements for cash to fund these uses will increase as our operations expand. We continue to generate cash from operating activities and believe that our operating cash flows, cash currently on our balance sheet and availability under our credit facility will be sufficient to allow us to continue to invest in our existing business, to manage our capital structure on a short and long-term basis, and to meet our anticipated operating cash needs. Cash, cash equivalents, and investments aggregated $94.4 million and $98.3 million, and working capital totaled $138.7 million and $140.5 million, at December 31, 2021 and 2020, respectively. We are closely monitoring our liquidity and capital resources for any potential impact that the COVID-19 pandemic may have on our operations.
We entered into a Third Amendment to Credit Agreement, on November 12, 2021, with Bank of America N.A. as administrative agent, amended and restated our existing revolving line of credit agreement dated October 24, 2017 and provides up to $75.0 million in the form of a senior revolving line of credit. Subject to certain conditions, we may request up to an additional $75.0 million for a maximum aggregate commitment of $150.0 million. As a precautionary measure at the beginning of the COVID-19 pandemic, we executed a drawdown of $50.0 million in April 2020, all of which we repaid during the year ended December 31, 2020. As of December 31, 2021, and 2020, there were no outstanding borrowings and we are in compliance with the terms of the credit facility.
Summary of Cash Flows (in thousands):
| Years Ended December 31, |
||||||||||||
| 2021 |
2020 |
2019 |
||||||||||
| Cash provided by (used in) |
||||||||||||
| Operating activities |
$ | 8,397 | $ | 13,065 | $ | 37,005 | ||||||
| Investing activities |
(3,118 | ) | (71,264 | ) |
39,691 | |||||||
| Financing activities |
(6,779 | ) | (3,774 | ) |
(8,142 | ) |
||||||
| Effect of exchange rate changes on cash |
69 | 327 | (133 | ) |
||||||||
| Net (decrease) increase in cash and cash equivalents |
$ | (1,431 | ) | $ | (61,646 | ) |
$ | 68,421 | ||||
The following changes contributed to the net change in cash and cash equivalents from 2020 to 2021.
Operating Activities
Cash provided by operating activities was $8.4 million, $13.1 million, $37.0 million for 2021, 2020 and 2019. The change in 2021 was primarily attributable to payment of contingent consideration, as well as normal variations in the timing of collections, timing of certain state tax payments and a decrease in cash outflows related to acquisition related expenses. In July 2021, we paid contingent consideration in the amount of $10.0 million, $2.8 million of which was classified within operating activities and the remaining $7.2 million was classified within financing activities.
For the foreseeable future, we expect to continue to invest substantial resources in research and development for new products and clinical trials as well as continued investment in our commercial infrastructure to support our growth strategy. These costs will be funded with a combination of cash on hand and cash expected to be generated from future operations.
Investing Activities
Investing activities used $3.1 million and $71.3 million in 2021 and 2020, and provided $39.7 million in 2019. The significant use of cash from investing activities in 2020 was primarily due to the $94.6 million of consideration paid, net of cash acquired, for the acquisitions of Parcus Medical and Arthrosurface. Capital expenditures totaled $5.1 million, $1.6 million, and $2.8 million for 2021, 2020 and 2019, respectively.
Financing Activities
Cash used in financing activities was $6.8 million, $3.8 million and $8.1 million for 2021, 2020 and 2019. The change was primarily due to the portion of the contingent consideration payment related to financing activities, as described above, in 2021.
For a discussion of our liquidity and capital resources as of December 31, 2020, and our cash flow activities for the fiscal year ended December 31, 2020, see “Part II, Item 7. Management’s Discussion and Analysis of Financial Condition and Results of Operations” of our annual report on Form 10-K for the fiscal year ended December 31, 2020, filed with the SEC on March 5, 2021, which is incorporated by reference in this Report.
Contractual Obligations and Other Commercial Commitments
The table below summarizes our non-cancelable operating leases, purchase commitments, and contractual obligations related to future periods which are not reflected in our consolidated balance sheet at December 31, 2021. Purchase commitments relate primarily to non-cancellable inventory commitments and capital expenditures entered in the normal course of business:
| Payments due by period (in thousands) |
||||||||||||||||||||
| Less than |
More than |
|||||||||||||||||||
| Total |
1 year |
1 - 3 years |
3 - 5 years |
5 years |
||||||||||||||||
| Operating and Finance Leases |
$ | 28,242 | $ | 2,500 | $ | 4,375 | $ | 3,496 | $ | 17,871 | ||||||||||
| Purchase Commitments (1) |
8,185 | 6,113 | 1,946 | 126 | ||||||||||||||||
| Year Ended December 31, 2021 |
$ | 36,427 | $ | 8,613 | $ | 6,321 | $ | 3,622 | $ | 17,871 | ||||||||||
| (1) |
Includes purchase commitments for materials and other day to day business requirements. |
Accounting for Off-Balance Sheet Arrangements
We do not use special purpose entities or other off-balance sheet financing techniques, except for operating leases as disclosed in the contractual obligations table above, that we believe have or are reasonably likely to have a current or future material effect on our financial condition, changes in financial condition, revenues or expenses, results of operations, liquidity, or capital resources.
Critical Accounting Policies and Estimates
Our discussion and analysis of our financial condition and results of operations are based upon our consolidated financial statements included elsewhere in this Annual Report on Form 10-K, which consolidated financial statements have been prepared in accordance with accounting principles generally accepted in the United States. The preparation of these consolidated financial statements requires us to make estimates and judgments that affect the reported amounts of assets, liabilities, revenues and expenses, and the related disclosure of contingent assets and liabilities. We monitor our estimates on an ongoing basis for changes in facts and circumstances, and material changes in these estimates could occur in the future. Changes in estimates are recorded in the period in which they become known. We base our estimates on historical experience and other assumptions that we believe to be reasonable under the circumstances. Actual results may differ from our estimates if past experience or other assumptions do not turn out to be substantially accurate.
We have identified the policies below as critical to our business operations and the understanding of our results of operations. The impact and any associated risks related to these policies on our business operations are discussed throughout this section captioned “Management’s Discussion and Analysis of Financial Condition and Results of Operations” where such policies affect our reported and expected financial results. For a detailed discussion on the application of these and other accounting policies, see Note 2 to the consolidated financial statements included elsewhere in this Annual Report on Form 10-K.
Business Combinations and Contingent Consideration
Amounts paid for acquisitions are allocated to the intangible and tangible assets acquired and liabilities assumed, if any, based on their fair values at the dates of acquisition. This purchase price allocation process requires management to make significant estimates and assumptions with respect to intangible assets and deferred revenue obligations. Critical estimates include, but are not limited to, future expected cash flows, including projected revenues and expenses, and the applicable discount rates. The fair value of identifiable intangible assets is based on detailed valuations that use information and assumptions determined by management. Any excess of purchase price over the fair value of the net tangible and intangible assets acquired is allocated to goodwill. While we use our best estimates and assumptions to accurately value assets acquired and liabilities assumed at the acquisition date as well as any contingent consideration, where applicable, our estimates are inherently uncertain and subject to refinement. As a result, during the measurement period, which may be up to one year from the acquisition date, we record adjustments to the assets acquired and liabilities assumed with the corresponding offset to goodwill. Upon conclusion of the measurement period or final determination of the values of assets acquired or liabilities assumed, whichever comes first, any subsequent adjustments are recorded to our consolidated statements of comprehensive income. The fair value of contingent consideration includes estimates and judgments made by management regarding the probability that future contingent payments will be made.
We use the income approach to determine the fair value of certain identifiable intangible assets including developed technology and IPR&D. This approach determines fair value by estimating after-tax cash flows attributable to these assets over their respective useful lives and then discounting these after-tax cash flows back to a present value. The estimated economic lives were determined using a variety of indicators including historical usage, evolutionary changes and other observable market data. We base our assumptions on estimates of future cash flows, expected growth rates and expected trends in technology. We base the discount rate used to arrive at the present value used in this method as of the date of acquisition on the time value of money and certain industry-specific risk factors. We use the relief-from-royalty method of the income approach to determine the fair value of trade names. This approach determines fair value by estimating the after-tax royalty savings attributable to owning the intangible asset and then discounting these after-tax royalty savings back to a present value. We base our assumptions on the estimated revenue attributable to the trade name and the estimated royalty rate attributable to the trade name. We use the avoided costs/lost profits method to determine the fair of customer relationships. This approach determines fair value by estimating the projected revenues related to the asset and estimated costs to recreate the intangible asset. We believe the estimated purchased customer relationships, developed technologies, trade name, and in process research and development amounts so determined represent the fair value at the date of acquisition and do not exceed the amount a third party would pay for the assets. If the subsequent actual results and updated projections of the underlying business activity change compared with the assumptions and projections used to develop these values, we could experience impairment charges which could be material. In addition, estimated economic lives of certain acquired assets are used to calculate depreciation and amortization expense. If our estimates of the economic lives change, depreciation or amortization expenses could be accelerated or slowed.
We used the comparative sales method to determine the fair value of work-in-process (“WIP”) and finished goods inventory acquired and ultimately the inventory step- up required. The fair value of WIP inventory was estimated as the selling price less the sum of (a) costs to complete, (b) costs of disposal, and (c) a reasonable profit allowance for the selling effort of the acquiring entity based on profit for similar products. The fair value of finished goods inventory was estimated as the selling price less the sum of (a) costs of disposal and (b) a reasonable profit allowance for the selling effort of the acquiring entity based on profit for similar products.
For contingent consideration, we update these estimates and the related fair value of contingent consideration at each reporting period based on the estimated probability of achieving the earn-out targets and applying a discount rate that measures the risk associated with the expected contingent payments. Under the Parcus Medical and Arthrosurface merger agreements, there are contingent consideration milestones totaling up to $100 million payable from 2020 to 2022. Parcus Medical has net sales milestones annually from 2020 to 2022, while Arthrosurface had both regulatory and net sales milestones in 2020 and 2021. As of December 31, 2021, the remaining regulatory milestone and the net sales milestone related to Arthrosurface were not achieved. The fair value of the Parcus Medical contingent consideration is estimated using a Monte Carlo simulation. Changes in the fair value can result from changes pertaining to the achievement of the defined milestones and changes in assumed discount rates. Changes in the fair value of contingent consideration are recorded in our consolidated statements of operations. As of December 31, 2021, the contingent consideration for Parcus Medical associated with net sales in 2021 amounted to $4.3 million, which is included in current liabilities. We do not expect the remaining earn-out milestone under the Parcus Medical merger agreement to be achieved.
Revenue Recognition – General
Pursuant to ASC 606, we recognize revenue when a customer obtains control of promised goods or services. The amount of revenue that is recorded reflects the consideration that we expect to receive in exchange for those goods or services. We apply the following five-step model in order to determine this amount: (i) identification of the promised goods or services in the contract; (ii) determination of whether the promised goods or services are performance obligations, including whether they are capable of being distinct or distinct in the context of the contract; (iii) measurement of the transaction price, including the constraint on variable consideration; (iv) allocation of the transaction price to the performance obligations; and (v) recognition of revenue when (or as) we satisfy each performance obligation.
We generate sales principally through three types of customers: (i) commercial partnerships (ii) hospitals and ASCs, and (iii) distributors, referred to as distribution model.
For commercial partnership sales, we sell our products directly to these partners, who perform the vast majority of the downstream sales and marketing activities to customers and end-users. These arrangements may include the grant of certain licenses, performance of development services, and the supply of product. Our largest such customer, Mitek, represented 45% of total revenues for the year-ended December 31, 2021. We recognize revenue from product sales when the customer obtains control of our product, which typically occurs upon shipment to the customer. Commercial partnership agreements may also include sales-based royalties and milestones. As we considered the license to be the predominant item to which the royalties relate for these agreements, sales-based royalties and milestones are only recognized when the later of the underlying sale occurs or the performance obligation to which some or all of the sales-based royalty has been satisfied (or partially satisfied). This is generally in the same period that our licensees complete their product sales in their territory, for which we are contractually entitled to a percentage-based royalty. We record royalty revenues based on estimated net sales of licensed products as reported to us by our commercial partners. Differences between actual and estimated royalty revenues have not been material and are typically adjusted in the following quarter when the actual amounts are known. Revenue from sales-based royalties is included in revenues in our consolidated statement of operations.
For sales to hospitals and ASCs, which generally pairs in-house sales representatives with local or regional distributors, the inventory is generally consigned so that products are available when needed for surgical procedures. No revenue is recognized upon the placement of inventory into consignment, as we retain the ability to control the inventory. Revenue is recognized typically as of the date of surgical implantation of the product.
For distributor sales, we sell our products to our distributors, generally outside the United States, who subsequently resell the products to sub-distributors and health care providers, among others. We recognize revenue from product sales when the distributor obtains control of our product, which typically occurs upon shipment to the distributor, in return for agreed-upon, fixed-price consideration. Performance obligations are generally settled quickly after purchase order acceptance; therefore, the value of unsatisfied performance obligations at the end of any reporting period is generally insignificant. We sell to a diversified base of distributors and, therefore, believes there is no material concentration of credit risk.
Certain of our supply agreements contain terms that represent a promise to deliver product at the customer’s discretion that are considered distributor options. We assess if these options provide a material right to the licensee, and if so, they are accounted for as separate performance obligations. Our supply agreements do not provide options that are considered material rights.
Our payment terms are consistent with prevailing practice in the respective markets in which we do business. Most of our customers make payments based on contract terms, which are not affected by contingent events that could impact the transaction price. Payment terms fall within the one-year guidance for the practical expedient, which allows us to forgo adjustment of the contractual payment amount of consideration for the effects of a significant financing component. Our contracts with customers do not customarily provide a right of return, unless certain product quality standards are not met.
Some of our distributor agreements have volume-based discounts with tiered pricing which are generally prospective in nature. These prospective discounts together with any free-of-charge sample units offered are evaluated as potential material rights. If the prospective discounts or free-of-charge sample units are considered material rights, these would be separate performance obligations and a portion of the sales transaction price is allocated to the material right. Revenue allocated to the material right is recognized when the additional goods are transferred to the customer or when the option expires. During 2021, the consideration allocated to material rights was not significant.
We receive payments from our customers based on billing schedules established in each contract. Up-front payments and fees are recorded as deferred revenue upon receipt or when due, and may require deferral of revenue recognition to a future period until we perform our obligations under these arrangements. Amounts are recorded as accounts receivable when our right to consideration is unconditional. Deferred revenue was $1.0 million and $0.2 million as of December 31, 2021 and 2020, respectively.
Generally, customer contracts contain Free on Board (“FOB”) or Ex-Works shipping point terms where the customer pays the shipping company directly for all shipping and handling costs. In those contracts in which we pay for the shipping and handling, the associated costs are generally recorded along with the product sale at the time of shipment in cost of revenue when control over the products has transferred to the customer. Value-add and other taxes we collected concurrently with revenue-producing activities are excluded from revenue. Our general product warranty does not extend beyond an assurance that the product or services delivered will be consistent with stated contractual specifications, which does not create a separate performance obligation. We recognize the incremental costs of obtaining contracts as an expense when incurred as the amortization period of the assets that we otherwise would have recognized is one year or less in accordance with the practical expedient in paragraph ASC 340-40-25-4. These costs are included in selling, general and administrative expenses.
Inventories
Inventories are primarily stated at the lower of standard cost and net realizable value, with approximate cost determined using the first-in, first-out method. Work-in-process and finished goods inventories include materials, labor, and manufacturing overhead. Manufacturing variances attributable to abnormally low production are expensed in the period incurred. Inventory costs associated with product candidates that have not yet received regulatory approval are capitalized if we believe there is probable future commercial use and future economic benefit.
Our policy is to write-down inventory when conditions exist that suggest inventory may be in excess of anticipated demand or is obsolete based upon assumptions about future demand for our products and market conditions. We regularly evaluate the ability to realize the value of inventory based on a combination of factors including, but not limited to, historical usage rates, forecasted sales or usage, product end of life dates, and estimated current or future market values. Inventory needs and alternative usage avenues are explored within these processes to mitigate inventory exposure. We recorded an inventory reserve of $2.9 million in 2021 based on future sales forecasts as a result of our product rationalization efforts with respect to certain of our Joint Preservation and Restoration product family.
When recorded, inventory write-downs are intended to reduce the carrying value of inventory to its net realizable value. If actual demand for our products deteriorates, or if market conditions are less favorable than those projected, additional inventory write-downs may be required. Other long-term assets include inventory expected to remain on hand beyond one year.
Goodwill and In-Process Research and Development
Goodwill is the amount by which the purchase price of acquired net assets in a business combination exceeded the fair values of net identifiable assets on the date of acquisition. Goodwill is not amortized but is subject to impairment test annually or more frequently if events or changes in circumstances suggest that the carrying value of goodwill may not be recoverable, utilizing either the qualitative or quantitative method.
We test goodwill for impairment at the reporting unit level on an annual basis as of November 30 or more frequently if we believe indicators of impairment exist. We have two reporting units: the legacy Anika reporting unit and a newly created reporting unit established in 2020 upon the acquisitions of Parcus Medical and Arthrosurface. The remaining goodwill as of December 31, 2021 pertains to the legacy Anika reporting unit, as the goodwill with respect to the newly created reporting unit was fully impaired in 2020.
We have the option to first assess qualitative factors to determine whether it is more likely than not that the fair value of a reporting unit is less than its carrying value. When using the qualitative method in 2021, we considered several factors, including the following:
| ● |
the amount by which the fair value of the reporting unit exceeded its carrying value as of the date of the most recent quantitative impairment analysis, which indicated there would need to be substantial negative developments in the markets in which the reporting unit operates in order for there to be potential impairment; |
| ● |
the carrying value of the reporting unit as of the assessment date compared to their previously calculated fair value as of the date of the most recent quantitative impairment analysis; |
| ● |
the current forecasts as compared to the forecasts included in the most recent quantitative impairment analysis; |
| ● |
public information from competitors and other industry information to determine if there were any significant adverse trends in our competitors' businesses; |
| ● |
changes in the value of major U.S. stock indices that could suggest declines in overall market stability that could impact the valuation of our reporting unit; |
| ● |
whether there had been any significant increases to the weighted-average cost of capital rates for the reporting unit, which could materially lower our prior valuation conclusions under a discounted cash flow approach. |
Significant assumptions utilized in the impairment analysis included valuation multiple with respect to revenue and weighted-average cost of capital. Based on sensitivity analysis performed on key assumptions at November 30, 2021, a 10% decrease valuation multiples or a 10% increase in the weighted average cost of capital assumption would not have resulted in a fair value below the reporting unit’s carrying value. Accordingly, we determined it was not more likely than not that the fair value of the legacy Anika reporting unit is less than its carrying amount and thus goodwill was not impaired as of November 30, 2021.
IPR&D represents the fair value assigned to research and development assets that we acquire that have not been completed at the date of acquisition or are pending regulatory approval in certain jurisdictions. We conduct annual impairment tests of IPR&D, by comparing the fair value of each IPR&D project to its carrying value. If the carrying value exceeds its fair value, we record an impairment loss to the extent that the carrying value of the IPR&D project exceeds its fair value. We estimate the fair value for IPR&D using the income approach which incorporates significant estimates and assumptions related to the forecasted results including revenues, expenses, expected economic life of the asset, contributory asset charges and discount rates to estimate future cash flows. During 2021 and 2020, we decided not to further invest in certain of our projects and recorded an impairment charge in the amount of $0.6 million and $1.4 million in 2021 and 2020, respectively, in research and development expenses in the consolidated statements of operations. Based on a sensitivity analysis performed on key assumptions at November 30, 2021 with respect to the remaining IPR&D, a 10% decrease in the long-term growth factor assumption, or 10% increase in the weighted average cost of capital assumption would not have resulted in a fair value below the IPR&D carrying value.
Recent Accounting Pronouncements
A discussion of recent accounting pronouncements is included in Note 2 to the consolidated financial statements in this Annual Report on Form 10-K.
ITEM 7A. QUANTITATIVE AND QUALITATIVE DISCLOSURES ABOUT MARKET RISK
Interest Rate Risk
We manage our investment portfolio in accordance with our investment policy. The primary objectives of our investment policy are to preserve principal, maintain a high degree of liquidity to meet operating and other needs, and obtain competitive returns subject to prevailing market conditions without significantly increasing risk. To achieve this objective, we maintain our portfolio of cash equivalents and investments in a variety of high-quality securities, including money market funds and U.S. treasury bills. The investments are classified as available-for-sale and consequently are recorded at fair value with unrealized gains or losses reported as a separate component of accumulated other comprehensive income (loss). Our portfolio of cash equivalents and investments is subject to interest rate fluctuations, changes in credit quality of the issuer, and other factors.
Foreign Currency Exchange Risk
Foreign currency risk arises from our investments in subsidiaries owned and operated in non-U.S. countries. Such risk is also a result of transactions with customers in countries outside the United States. Approximately $6.4 million of our revenue was denominated in foreign currencies (primarily the Euro) for the year ended December 31, 2021. Gains and losses arising from transactions denominated in foreign currencies are primarily related to intercompany accounts that have been determined to be temporary in nature and cash, accounts payable, and accounts receivable denominated in non-functional currencies. We also utilize clinical vendors that are located in various countries outside of the United States and invoice us in their local currency and we have one major supplier contract denominated in a foreign currency. We do not engage in foreign currency hedging arrangements for these transactions, and, consequently, foreign currency fluctuations may adversely affect our earnings. Unfavorable fluctuations in exchange rates would have a negative impact on our financial statements. The impact of currency exchange rate fluctuations related to our international subsidiaries on our financial statements were insignificant in 2021. We recognize foreign currency gains or losses arising from our operations in the period incurred.
ITEM 8. FINANCIAL STATEMENTS AND SUPPLEMENTARY DATA
ANIKA THERAPEUTICS, INC. AND SUBSIDIARIES
INDEX TO CONSOLIDATED FINANCIAL STATEMENTS
REPORT OF INDEPENDENT REGISTERED PUBLIC ACCOUNTING FIRM
To the Board of Directors and Stockholders of Anika Therapeutics, Inc.
Opinion on the Financial Statements
We have audited the accompanying consolidated balance sheets of Anika Therapeutics, Inc. and subsidiaries (the "Company") as of December 31, 2021 and 2020, the related consolidated statements of operations and comprehensive income (loss), cash flows, and stockholders’ equity for each of the three years in the period ended December 31, 2021, and the related notes (collectively referred to as the “financial statements”). In our opinion, the financial statements present fairly, in all material respects, the financial position of the Company as of December 31, 2021 and 2020, and the results of its operations and its cash flows for each of the three years in the period ended December 31, 2021, in conformity with accounting principles generally accepted in the United States of America (GAAP).
We have also audited, in accordance with the standards of the Public Company Accounting Oversight Board (United States) (PCAOB), the Company's internal control over financial reporting as of December 31, 2021, based on criteria established in Internal Control — Integrated Framework (2013) issued by the Committee of Sponsoring Organizations of the Treadway Commission and our report dated March 10, 2022, expressed an unqualified opinion on the Company's internal control over financial reporting.
Basis for Opinion
These financial statements are the responsibility of the Company's management. Our responsibility is to express an opinion on the Company's financial statements based on our audits. We are a public accounting firm registered with the PCAOB and are required to be independent with respect to the Company in accordance with the U.S. federal securities laws and the applicable rules and regulations of the Securities and Exchange Commission and the PCAOB.
We conducted our audits in accordance with the standards of the PCAOB. Those standards require that we plan and perform the audit to obtain reasonable assurance about whether the financial statements are free of material misstatement, whether due to error or fraud. Our audits included performing procedures to assess the risks of material misstatement of the financial statements, whether due to error or fraud, and performing procedures that respond to those risks. Such procedures included examining, on a test basis, evidence regarding the amounts and disclosures in the financial statements. Our audits also included evaluating the accounting principles used and significant estimates made by management, as well as evaluating the overall presentation of the financial statements. We believe that our audits provide a reasonable basis for our opinion.
Critical Audit Matter
The critical audit matter communicated below is a matter arising from the current-period audit of the financial statements that was communicated or required to be communicated to the audit committee and that (1) relates to accounts or disclosures that are material to the financial statements and (2) involved our especially challenging, subjective, or complex judgments. The communication of critical audit matters does not alter in any way our opinion on the financial statements, taken as a whole, and we are not, by communicating the critical audit matter below, providing a separate opinion on the critical audit matter or on the accounts or disclosures to which it relates.
Inventories — Refer to Notes 2 and 5 to the financial statements
Critical Audit Matter Description
The Company evaluates inventory each reporting period for excess quantities and obsolescence, establishing reserves when necessary based upon historical experience, assessment of economic conditions, and expected demand. Once recorded, these reserves are considered permanent adjustments to the carrying value of inventory. As of December 31, 2021, the Company has total inventories of $55.0 million, net of excess quantities and obsolescence reserves.
We identified the reserve for excess quantities and obsolete inventory as a critical audit matter because of the significant estimates and assumptions management makes to quantify and to record the reserve, including the determination of expected demand. This required a high degree of auditor judgment and an increased extent of effort when performing audit procedures to evaluate the methodology and the reasonableness of assumptions including expected demand.
How the Critical Audit Matter Was Addressed in the Audit
Our audit procedures related to the reserve for excess quantities and obsolete inventory including management’s estimate of expected demand, included the following, among others:
| • |
We tested the effectiveness of controls over inventory, including those over the estimation of reserves for excess quantities and obsolescence. |
| • |
We evaluated the reasonableness of the Company's excess and obsolete inventory policy, considering historical experience and the underlying assumptions. |
| • |
We obtained the Company’s excess and obsolescence reserve calculation and tested the mathematical accuracy. |
| • |
We tested the calculation of the excess and obsolescence reserve pursuant to the Company's policy, on a sample basis, including the completeness and accuracy of the data used in the calculation. |
| • |
We performed procedures to evaluate management’s ability to accurately forecast by comparing the historical expiring inventory estimates to subsequent inventory destructions and expirations. |
|
|
• |
We made inquiries of senior financial and operating management to determine whether any strategic, regulatory, or operational changes in the business were consistent with the projections of future demand that were utilized as the basis for the excess and obsolescence reserve recorded. |
| • |
We considered the existence of contradictory evidence based on consideration of internal communications to management and the board of directors, Company press releases, and analysts' reports, as well as any changes within the business. |
/s/
March 10, 2022
We have served as the Company’s auditor since 2017.
Anika Therapeutics, Inc. and Subsidiaries
Consolidated Balance Sheets
(in thousands, except per share data)
| December 31, | ||||||||
| ASSETS | 2021 | 2020 | ||||||
| Current assets: | ||||||||
| Cash and cash equivalents | $ | $ | ||||||
| Investments | ||||||||
| Accounts receivable, net of reserves of $ and $ at December 31, 2021 and 2020, respectively | ||||||||
| Inventories, net | ||||||||
| Prepaid expenses and other current assets | ||||||||
| Total current assets | ||||||||
| Property and equipment, net | ||||||||
| Right-of-use assets | ||||||||
| Other long-term assets | ||||||||
| Intangible assets, net | ||||||||
| Goodwill | ||||||||
| Total assets | $ | $ | ||||||
| LIABILITIES AND STOCKHOLDERS’ EQUITY | ||||||||
| Current liabilities: | ||||||||
| Accounts payable | $ | $ | ||||||
| Accrued expenses and other current liabilities | ||||||||
| Contingent consideration – current portion | ||||||||
| Total current liabilities | ||||||||
| Other long-term liabilities | ||||||||
| Contingent consideration – long term portion | ||||||||
| Deferred tax liability | ||||||||
| Lease liabilities | ||||||||
| Commitments and contingencies (Note 12) | ||||||||
| Stockholders’ equity: | ||||||||
| Preferred stock, $ par value; shares authorized, shares issued and outstanding at December 31, 2021 and 2020, respectively | ||||||||
| Common stock, $ par value; shares authorized, and shares issued and outstanding at December 31, 2021 and 2020, respectively | ||||||||
| Additional paid-in-capital | ||||||||
| Accumulated other comprehensive loss | ( | ) | ( | ) | ||||
| Retained earnings | ||||||||
| Total stockholders’ equity | ||||||||
| Total liabilities and stockholders’ equity | $ | $ | ||||||
The accompanying notes are an integral part of these consolidated financial statements.
Anika Therapeutics, Inc. and Subsidiaries
Consolidated Statements of Operations and Comprehensive Income (Loss)
(in thousands, except per share data)
| For the Years Ended December 31, |
||||||||||||
| 2021 |
2020 |
2019 |
||||||||||
| Revenue |
$ | $ | $ | |||||||||
| Cost of revenue |
||||||||||||
| Gross profit |
||||||||||||
| Operating expenses: |
||||||||||||
| Research & development |
||||||||||||
| Selling, general & administrative |
||||||||||||
| Goodwill impairment charge |
||||||||||||
| Change in fair value of contingent consideration |
( |
) | ( |
) |
||||||||
| Total operating expenses |
||||||||||||
| Income (loss) from operations |
( |
) |
||||||||||
| Interest and other (expense) income, net |
( |
) | ( |
) |
||||||||
| Income before income taxes |
( |
) |
||||||||||
| (Benefit from) provision for income taxes |
( |
) | ( |
) |
||||||||
| Net income (loss) |
$ | $ | ( |
) |
$ | |||||||
| Net income (loss) per share: |
||||||||||||
| Basic |
$ | $ | ( |
) |
$ | |||||||
| Diluted |
$ | $ | ( |
) |
$ | |||||||
| Weighted average common shares outstanding: |
||||||||||||
| Basic |
||||||||||||
| Diluted |
||||||||||||
| Net income (loss) |
$ | $ | ( |
) |
$ | |||||||
| Foreign currency translation adjustment |
( |
) | ( |
) |
||||||||
| Comprehensive income (loss) |
$ | $ | ( |
) |
$ | |||||||
The accompanying notes are an integral part of these consolidated financial statements.
Anika Therapeutics, Inc. and Subsidiaries
Consolidated Statements of Stockholders' Equity
(in thousands)
| Accumulated |
||||||||||||||||||||||||
| Common Stock |
Other |
Total |
||||||||||||||||||||||
| Number of |
$.01 Par |
Additional Paid |
Retained |
Comprehensive |
Stockholders' |
|||||||||||||||||||
| Shares |
Value |
in Capital |
Earnings |
Loss |
Equity |
|||||||||||||||||||
| Balance, December 31, 2018 |
$ | $ | $ | $ | ( |
) |
$ | |||||||||||||||||
| Issuance of common stock for equity awards |
||||||||||||||||||||||||
| Vesting of restricted stock units |
– | – | – | |||||||||||||||||||||
| Forfeiture of restricted stock awards |
( |
) |
||||||||||||||||||||||
| Stock-based compensation expense |
– | |||||||||||||||||||||||
| Retirement of common stock for minimum tax withholdings |
( |
) |
( |
) |
( |
) |
||||||||||||||||||
| Repurchase of common stock |
( |
) |
( |
) |
( |
) |
( |
) |
||||||||||||||||
| Net income |
– | |||||||||||||||||||||||
| Other comprehensive loss |
– | ( |
) |
( |
) |
|||||||||||||||||||
| Balance, December 31, 2019 |
$ | $ | $ | $ | ( |
) |
$ | |||||||||||||||||
| Issuance of common stock for equity awards |
||||||||||||||||||||||||
| Vesting of restricted stock units |
||||||||||||||||||||||||
| Forfeiture of restricted stock awards |
( |
) |
||||||||||||||||||||||
| Stock-based compensation expense |
- | |||||||||||||||||||||||
| Retirement of common stock for minimum tax withholdings |
( |
) |
( |
) |
( |
) |
||||||||||||||||||
| Repurchase of common stock |
( |
) |
( |
) |
||||||||||||||||||||
| Net loss |
- | ( |
) |
( |
) |
|||||||||||||||||||
| Other comprehensive income |
- | |||||||||||||||||||||||
| Balance, December 31, 2020 |
$ | $ | $ | $ | ( |
) |
$ | |||||||||||||||||
| Issuance of common stock for equity awards |
||||||||||||||||||||||||
| Vesting of restricted stock units |
( |
) | ||||||||||||||||||||||
| Stock-based compensation expense |
- | |||||||||||||||||||||||
| Retirement of common stock for minimum tax withholdings |
( |
) | ( |
) | ( |
) | ||||||||||||||||||
| Net income |
- | |||||||||||||||||||||||
| Other comprehensive income |
- | ( |
) | ( |
) | |||||||||||||||||||
| Balance, December 31, 2021 |
$ | $ | $ | $ | ( |
) | $ | |||||||||||||||||
The accompanying notes are an integral part of these consolidated financial statements.
Anika Therapeutics, Inc. and Subsidiaries
Consolidated Statements of Cash Flows
(in thousands)
| For the years ended December 31, |
||||||||||||
| 2021 |
2020 |
2019 |
||||||||||
| Cash flows from operating activities: |
||||||||||||
| Net income (loss) |
$ | $ | ( |
) |
$ | |||||||
| Adjustments to reconcile net income (loss) to net cash provided by operating activities: |
||||||||||||
| Depreciation |
||||||||||||
| Amortization of acquisition related intangible assets |
||||||||||||
| Amortization of acquisition related inventory step-up |
||||||||||||
| Non-cash operating lease cost |
||||||||||||
| Goodwill impairment charge |
||||||||||||
| Change in fair value of contingent consideration |
( |
) | ( |
) |
||||||||
| Loss on disposal of fixed assets |
||||||||||||
| Loss on impairment of intangible asset |
||||||||||||
| Stock-based compensation expense |
||||||||||||
| Deferred income taxes |
( |
) | ( |
) |
||||||||
| Provision (recovery) for doubtful accounts |
( |
) |
||||||||||
| Provision for inventory |
||||||||||||
| Other |
( |
) | ( |
) | ( |
) |
||||||
| Changes in operating assets and liabilities: |
||||||||||||
| Accounts receivable |
( |
) | ( |
) |
||||||||
| Inventories |
( |
) | ( |
) |
( |
) |
||||||
| Prepaid expenses, other current and long-term assets |
( |
) |
( |
) |
||||||||
| Accounts payable |
( |
) | ||||||||||
| Operating lease liabilities |
( |
) | ( |
) |
( |
) |
||||||
| Accrued expenses, other current and long-term liabilities |
( |
) |
||||||||||
| Income taxes |
( |
) | ( |
) |
( |
) |
||||||
| Payments of contingent consideration |
( |
) | ( |
) |
||||||||
| Net cash provided by operating activities |
||||||||||||
| Cash flows from investing activities: |
||||||||||||
| Acquisition of Parcus Medical and Arthrosurface, net of cash acquired |
( |
) | ( |
) |
||||||||
| Proceeds from maturities of investments |
||||||||||||
| Purchases of investments |
( |
) |
( |
) |
||||||||
| Purchases of property and equipment |
( |
) | ( |
) |
( |
) |
||||||
| Net cash (used in) provided by investing activities |
( |
) | ( |
) |
||||||||
| Cash flows from financing activities: |
||||||||||||
| Payments made on finance leases |
( |
) | ( |
) |
||||||||
| Proceeds from long term debt |
||||||||||||
| Repayments of long term debt |
( |
) |
||||||||||
| Repurchases of common stock |
( |
) |
||||||||||
| Cash paid for tax withheld on vested restricted stock awards |
( |
) | ( |
) |
( |
) |
||||||
| Proceeds from exercises of equity awards |
||||||||||||
| Payments of contingent consideration |
( |
) | ( |
) |
||||||||
| Net cash used by financing activities |
( |
) | ( |
) |
( |
) |
||||||
| Exchange rate impact on cash |
( |
) |
||||||||||
| (Decrease) increase in cash and cash equivalents |
( |
) | ( |
) |
||||||||
| Cash and cash equivalents at beginning of period |
||||||||||||
| Cash and cash equivalents at end of period |
$ | $ | $ | |||||||||
| Supplemental disclosure of cash flow information: |
||||||||||||
| Cash paid for income taxes, net of refunds | $ | $ | $ | |||||||||
| Right-of-use assets obtained in exchange for operating lease liabilities |
$ | $ | $ | |||||||||
| Non-cash investing activities: |
||||||||||||
| Purchases of property and equipment included in accounts payable and accrued expenses |
$ | $ | $ | |||||||||
| Consideration for acquisitions included in accounts payable and accrued expenses |
$ | $ | $ | |||||||||
| Contingent consideration fair value on acquisition date |
$ | $ | $ | |||||||||
The accompanying notes are an integral part of these consolidated financial statements.
Anika Therapeutics, Inc. and Subsidiaries
Notes to Consolidated Financial Statements
(amounts in thousands, except share and per share amounts or as otherwise noted)
1. Nature of Business
Anika Therapeutics, Inc. (“the Company”) is a global joint preservation company that creates and delivers meaningful advancements in early intervention orthopedic care, including in the areas of osteoarthritis (“OA”) pain management, regenerative solutions, soft tissue repair and bone preserving joint technologies.
In early 2020, the Company expanded its overall technology platform through its strategic acquisitions of Parcus Medical, LLC (“Parcus Medical”), a sports medicine implant and instrumentation solutions provider focused on sports medicine and soft tissue repair, and Arthrosurface Inc. (“Arthrosurface”), a company specializing in less invasive, bone preserving partial and total joint replacement solutions. These acquisitions broadened the Company's product portfolio, developed over its 30 years of expertise in hyaluronic acid technology, into joint preservation and restoration, added higher-growth revenue streams, increased its commercial capabilities, diversified its revenue base, and expanded its product pipeline and research and development expertise.
The Company is subject to risks common to companies in the life sciences industry including, but not limited to, development by the Company or its competitors of new technological innovations, dependence on key personnel, protection of proprietary technology, commercialization of existing and new products, and compliance with U.S. Food and Drug Administration (“FDA”) and foreign regulations and approval requirements, as well as the ability to grow the Company’s business through appropriate commercial strategies.
There continue to be uncertainties regarding the pandemic of the novel coronavirus (“COVID-19”), and the Company is closely monitoring the impact of COVID-19 on all aspects of its business, including how it will impact its customers, employees, suppliers, vendors, and business partners. The Company is unable to predict the specific impact that COVID-19 may have on its financial position and operations moving forward due to the numerous uncertainties. Any estimates made herein may change as new events occur and additional information is obtained, and actual results could differ materially from any estimates made herein under different assumptions or conditions. The Company will continue to assess the evolving impact of COVID-19.
2. Summary of Significant Accounting Policies
Use of Estimates
The preparation of financial statements in conformity with generally accepted accounting principles in the United States of America (“US GAAP”) requires management to make estimates and assumptions that affect the reported amounts of assets and liabilities and disclosure of contingent assets and liabilities at the date of the financial statements and the reported amounts of revenues and expenses during the reporting period. Actual results could differ from those estimates.
Principles of Consolidation
The accompanying consolidated financial statements include the accounts of Anika Therapeutics, Inc. and its wholly owned subsidiaries, Anika Securities, Inc., Anika Therapeutics S.r.l. (“Anika S.r.l.”), Anika Therapeutics Limited, Parcus Medical and Arthrosurface. All intercompany balances and transactions have been eliminated in consolidation.
Reclassification of Prior Period Amounts
Certain prior period financial information has been reclassified to conform to current period presentation. The Company reclassified certain prior period amounts in the significant components of the Company’s deferred tax assets and liabilities as of December 31, 2020, in Note 17, Income Taxes, to conform to current year classification.
Foreign Currency Translation
The functional currency of Anika S.r.l. is the Euro, and the functional currency of Anika Therapeutics Limited is the British Pound Sterling. Assets and liabilities of the foreign subsidiaries are translated using the exchange rate existing on each respective balance sheet date. Revenues and expenses are translated using the average exchange rates for the period. The translation adjustments resulting from this process are included in stockholders’ equity as a component of accumulated other comprehensive income (loss) which resulted in a gain (loss) from foreign currency translation of ($
Gains and losses resulting from foreign currency transactions are recognized in the consolidated statements of operations. Recorded balances that are denominated in a currency other than the functional currency are remeasured to the functional currency using the exchange rate at the balance sheet date and gains or losses are recorded in the statements of operations. The Company recognized a gain (loss) from foreign currency transactions of ($
Allowance for Doubtful Accounts
The Company maintains an allowance for doubtful accounts for estimated losses resulting from the inability of its customers to make required payments, which is included in selling, general and administrative expenses in the accompanying consolidated statements of operations. In determining the adequacy of the allowance for doubtful accounts, management specifically analyzes individual accounts receivable, historical bad debts, customer concentrations, customer creditworthiness, current and reasonable and supportable forecasts of future economic conditions, accounts receivable aging trends, and changes in the Company’s customer payment terms. A summary of activity in the allowance for doubtful accounts is as follows:
| December 31, | ||||||||||||
| 2021 | 2020 | 2019 | ||||||||||
| Balance, beginning of the year | $ | $ | $ | |||||||||
| Amounts provided | ||||||||||||
| Amounts recovered | ( | ) | ( | ) | ( | ) | ||||||
| Amounts written off | ( | ) | ( | ) | ( | ) | ||||||
| Translation adjustments | ( | ) | ( | ) | ||||||||
| Balance, end of the year | $ | $ | $ | |||||||||
Revenue Recognition
Pursuant to ASC 606, Revenue from Contracts with Customers (“ASC 606”), the Company recognizes revenue when a customer obtains control of promised goods or services. The amount of revenue that is recorded reflects the consideration that the Company expects to receive in exchange for those goods or services. The Company applies the following five-step model in order to determine this amount: (i) identification of the promised goods or services in the contract; (ii) determination of whether the promised goods or services are performance obligations, including whether they are capable of being distinct or distinct in the context of the contract; (iii) measurement of the transaction price, including the constraint on variable consideration; (iv) allocation of the transaction price to the performance obligations; and (v) recognition of revenue when (or as) the Company satisfies each performance obligation.
Revenue
The Company generate sales principally through three types of customers: (i) commercial partnerships (ii) hospitals and ASCs, and (iii) distributors, referred to as the distribution model.
For commercial partnership sales, the Company sells its products directly to these partners, who perform the vast majority of the downstream sales and marketing activities to customers and end-users. These arrangements may include the grant of certain licenses, performance of development services, and the supply of product. The Company’s largest such customer, DePuy Synthes Mitek Sports Medicine, a division of DePuy Orthopaedics, Inc., part of the Johnson & Johnson Medical Companies (“Mitek”), represented
For sales to hospitals and ASCs, which generally pairs in house sales representatives with local or regional distributors, the inventory is generally consigned so that products are available when needed for surgical procedures. No revenue is recognized upon the placement of inventory into consignment, as the Company retains the ability to control the inventory. Revenue is typically recognized as of the date of surgical implantation of the product.
For distributor sales, the Company sells its products principally to distributors, generally outside the United States, who subsequently resell the products to sub-distributors and health care providers, among others. The Company recognizes revenue from product sales when the distributor obtains control of the Company’s product, which typically occurs upon shipment to the distributor, in return for agreed-upon, fixed-price consideration. Performance obligations are generally settled quickly after purchase order acceptance; therefore, the value of unsatisfied performance obligations at the end of any reporting period is generally insignificant. The Company sells to a diversified base of distributors and, therefore, believes there is no material concentration of credit risk.
The Company’s payment terms are consistent with prevailing practice in the respective markets in which the Company does business. Most of the Company’s customers make payments based on contract terms, which are not affected by contingent events that could impact the transaction price. Payment terms fall within the one-year guidance for the practical expedient, which allows the Company to forgo adjustment of the contractual payment amount of consideration for the effects of a significant financing component. The Company’s contracts with customers do not customarily provide a right of return, unless certain product quality standards are not met.
Some of the Company’s distributor agreements have volume-based discounts with tiered pricing which are generally prospective in nature. These prospective discounts together with any free-of-charge sample units offered are evaluated as potential material rights. If the prospective discounts or free-of-charge sample units are considered material rights, these would be separate performance obligations and a portion of the sales transaction price is allocated to the material right. Revenue allocated to the material right is recognized when the additional goods are transferred to the customer or when the option expires. During 2021, the consideration allocated to material rights was not significant.
The Company receives payments from its customers based on billing schedules established in each contract. Up-front payments and fees are recorded as deferred revenue upon receipt or when due, and may require deferral of revenue recognition to a future period until the Company performs its obligations under these arrangements. Amounts are recorded as accounts receivable when its right to consideration is unconditional. Deferred revenue was $
Generally, customer contracts contain Free on Board (“FOB”) or Ex-Works shipping point terms where the customer pays the shipping company directly for all shipping and handling costs. In those contracts in which the Company pays for the shipping and handling, the associated costs are generally recorded along with the product sale at the time of shipment in cost of revenue when control over the products has transferred to the customer. Value-add and other taxes collected by the Company concurrently with revenue-producing activities are excluded from revenue. The Company’s general product warranty does not extend beyond an assurance that the product or services delivered will be consistent with stated contractual specifications, which does not create a separate performance obligation. The Company recognizes the incremental costs of obtaining contracts as an expense when incurred as the amortization period of the assets that the Company otherwise would have recognized is one year or less in accordance with the practical expedient in paragraph ASC 340-40-25-4. These costs are included in selling, general and administrative expenses.
Licensing, Milestone and Contract Revenue
The agreements with Mitek include variable consideration such as contingent development and regulatory milestones. Since 2016, there have been no remaining regulatory milestones related to the Mitek agreements. In general, variable consideration is included in the transaction price only to the extent a significant reversal in the amount of cumulative revenue recognized is not probable to occur.
Cash and Cash Equivalents
The Company considers only those investments which are highly liquid, readily convertible to cash, and that mature within 90 days from date of purchase to be cash equivalents. The Company’s cash equivalents consist of money market funds.
Investments
All of the Company’s investments are classified as available-for-sale which consist of U.S. treasury bills and are carried at fair value with unrealized gains and losses recorded as a component of accumulated other comprehensive income (loss), net of related income taxes. For securities sold prior to maturity, the cost of securities sold is based on the specific identification method. Realized gains and losses on the sale of investments are recorded in interest and other income, net. Interest is recorded when earned. Investments with original maturities greater than approximately three months and remaining maturities less than one year are classified as short-term investments. Investments with remaining maturities greater than one year are classified as long-term investments. The Company had
All of the Company’s investments are subject to a periodic impairment review. For available-for-sale debt securities in an unrealized loss position, the Company first assesses whether (i) the Company intends to sell, or (ii) it is more likely than not that the Company will be required to sell the security before recovery of its amortized cost basis. If either case is affirmative, any previously recognized allowances are charged-off and the security's amortized cost is written down to fair value through earnings. If neither case is affirmative, the security is evaluated to determine whether the decline in fair value has resulted from credit losses or other factors.
Any impairment that has not been recorded through an allowance for credit losses is recognized in other comprehensive income. Adjustments to the allowance are reported in the consolidated statement of operations as a component of credit loss expense. Available-for-sale securities are charged-off against the allowance or, in the absence of any allowance, written down through earnings when deemed uncollectible by management or when either of the aforementioned criteria regarding intent or requirement to sell is met.
During the years ended December 31, 2021, 2020 and 2019, the Company did not record any impairment charges on its available-for-sale securities because it is not more likely than not that the Company will be required to sell these securities before the recovery of their cost basis.
Concentration of Credit Risk
The Company has no significant off-balance sheet risks related to foreign exchange contracts, option contracts, or other foreign hedging arrangements. The Company’s cash equivalents and investments are held with two major international financial institutions.
The Company, by policy, routinely assesses the financial strength of its customers. As a result, the Company believes that its accounts receivable credit risk exposure is limited.
As of December 31, 2021 and 2020, Mitek represented
Inventories
Inventories are primarily stated at the lower of standard cost and net realizable value, with approximate cost determined using the first-in, first-out method. Work-in-process and finished goods inventories include materials, labor, and certain manufacturing overhead. Manufacturing variances attributable to abnormally low production are expensed in the period incurred. Inventory costs associated with product candidates that have not yet received regulatory approval are capitalized if the Company believes there is probable future commercial use and future economic benefit.
The Company’s policy is to write-down inventory when conditions exist that suggest inventory may be in excess of anticipated demand or is obsolete based upon assumptions about future demand for the Company’s products and market conditions. The Company regularly evaluates the ability to realize the value of inventory based on a combination of factors including, but not limited to, historical usage rates, forecasted sales or usage, product end of life dates, and estimated current or future market values. Purchasing requirements and alternative usage avenues are explored within these processes to mitigate inventory exposure.
When recorded, inventory write-downs are intended to reduce the carrying value of inventory to its net realizable value. If actual demand for the Company’s products deteriorates, or if market conditions are less favorable than those projected, additional inventory write-downs may be required. Other long-term assets include inventory expected to remain on hand beyond one year.
Leases
At the inception of an arrangement, the Company determines whether the arrangement is or contains a lease based on the circumstances present and evaluates whether the lease is an operating lease or a finance lease at the commencement date. Operating and finance leases with a term greater than one year are recognized on the consolidated balance sheet as right-of-use assets, lease liabilities, and, if applicable, long-term lease liabilities. The Company includes renewal options to extend the lease in the lease term where it is reasonably certain that it will exercise these options. Operating and finance lease liabilities and the corresponding right-of-use assets are recorded based on the present values of lease payments over the lease terms. The Company elected an accounting policy to combine the non-lease components (which include common area maintenance, taxes and insurance) with the related lease component. The interest rate implicit in lease contracts is typically not readily determinable. As such, the Company utilizes the appropriate incremental borrowing rates, which are the rates that would be incurred to borrow on a collateralized basis, over similar terms, amounts equal to the lease payments in a similar economic environment. Variable payments that do not depend on a rate or index are not included in the lease liability and are recognized as incurred. Lease contracts do not include residual value guarantees nor do they include restrictions or other covenants. Certain adjustments to the right-of-use assets may be required for items such as initial direct costs paid, incentives received or lease prepayments. If significant events, changes in circumstances, or other events indicate that the lease term or other inputs have changed, the Company would reassess lease classification, remeasure the finance and operating lease liabilities by using revised inputs as of the reassessment date, and adjust the right-of-use asset. Operating lease expense is recognized on a straight-line basis over the lease term. Finance lease expense is recognized based on the effective-interest method over the lease term.
Property and Equipment
Property and equipment are recorded at cost and depreciated using the straight-line method over their estimated useful lives, which are typically:
| Asset | Estimated useful life | |||||||
| Computer equipment and software | - | |||||||
| Furniture and fixtures | - | |||||||
| Equipment | - | |||||||
| Leasehold improvements | Shorter of useful life or term of lease | |||||||
Maintenance and repairs are charged to expense when incurred; additions and improvements are capitalized. Fully depreciated assets are retained in the accounts until they are no longer used and no further charge for depreciation is made in respect of these assets. When an item is sold, retired or removed from service, the cost and related accumulated depreciation is relieved, and the resulting gain or loss, if any, is recognized in income.
Construction-in-process assets are stated at cost, which includes the cost of construction and other direct costs attributable to the construction. Construction-in-process assets are not depreciated until such time as the relevant assets are completed and put into use.
Goodwill and IPR&D Assets
Goodwill is the amount by which the purchase price of acquired net assets in a business combination exceeded the fair values of net identifiable assets on the date of acquisition. Acquired In-Process Research and Development (“IPR&D”) represents the fair value assigned to research and development assets that the Company acquires that have not been completed at the date of acquisition or are pending regulatory approval in certain jurisdictions. The value assigned to the acquired IPR&D is determined by estimating the costs to develop the acquired technology into commercially viable products, estimating the resulting revenue from the projects, and discounting the net cash flows to present value.
Goodwill and IPR&D are not amortized but are evaluated for impairment annually or more frequently if events or changes in circumstances indicate that the asset might be impaired. The goodwill impairment assessment is performed by reporting unit. A reporting unit is the operating segment, or a business one level below that operating segment (the component level) if discrete financial information is prepared and regularly reviewed by segment management. However, components are aggregated as a single reporting unit if they have similar economic characteristics. The Company has
Under US GAAP, the Company has the option to perform a qualitative assessment to determine if it is necessary to perform the impairment test. If the Company concludes, based on a qualitative assessment, it is not more likely than not that the Goodwill or the IPR&D asset is impaired, the Company is not required to perform the quantitative test. The Company has an unconditional option to bypass the qualitative assessment in any period and proceed directly to the quantitative impairment test.
To conduct quantitative impairment tests of goodwill, the fair value of the reporting unit is compared to its carrying value. If the reporting unit’s carrying value exceeds its fair value, the Company records an impairment loss to the extent that the carrying value of goodwill exceeds its implied fair value, not to exceed the recorded amount of goodwill. The Company recorded a non-cash goodwill impairment charge with respect to the newly formed reporting unit amounted to $
The Company performed a qualitative annual assessment for impairment of the remaining goodwill with respect to legacy Anika reporting unit as of November 30, 2021, including consideration of (i) general macroeconomic factors, (ii) industry and market conditions, and (iii) the extent of the excess of the fair value over the carrying value indicated in prior impairment testing. Accordingly, the Company determined it was not more likely than not that the fair value of the legacy Anika reporting unit is less than its carrying amount and thus goodwill was impaired as of November 30, 2021.
To conduct impairment tests of IPR&D, the fair value of the IPR&D project is compared to its carrying value. If the carrying value exceeds its fair value, the Company records an impairment loss to the extent that the carrying value of the IPR&D project exceeds its fair value. The Company estimates the fair value for IPR&D using the income approach, which is based on the Multi-Period Excess Earnings Method (“MPEEM”). MPEEM measures economic benefit indirectly by calculating the income attributable to an asset after appropriate returns are paid to complementary assets used in conjunction with the subject asset to produce the earnings associated with the subject asset, commonly referred to as contributory asset charges. This approach incorporates significant estimates and assumptions related to the forecasted results including revenues, expenses, expected economic life of the asset, contributory asset charges and discount rates to estimate future cash flows.
Long-Lived Assets
Long-lived assets primarily include property and equipment and intangible assets with finite lives. The Company’s intangible assets are comprised of purchased developed technologies, patents, trade names, customer relationships and distributor relationships. These intangible assets are carried at cost, net of accumulated amortization. Amortization is recorded on a straight-line basis over the intangible assets' useful lives, which range from approximately to years. The Company reviews long-lived assets for impairment when events or changes in business circumstances indicate that the carrying amount of the assets may not be fully recoverable or that the useful lives of those assets are no longer appropriate. Each impairment test is based on a comparison of the undiscounted cash flows to the recorded value of the asset. If impairment is indicated, the asset is written down to its estimated fair value based on a discounted cash flow analysis.
In determining the useful lives of intangible assets, the Company considers the expected use of the assets and the effects of obsolescence, demand, competition, anticipated technological advances, changes in surgical techniques, market influences and other economic factors. For technology-based intangible assets, the Company considers the expected life cycles of products, absent unforeseen technological advances, which incorporate the corresponding technology.
Fair Value Measurements
Fair value is defined as the price that would be received from selling an asset, or paid to transfer a liability, in an orderly transaction between market participants at the measurement date. When determining the fair value measurements for assets and liabilities required to be recorded at fair value, the Company considers the principal or most advantageous market in which it would transact and considers assumptions that market participants would use when pricing the asset or liability, such as inherent risk, transfer restrictions, and risk of non-performance. The accounting standard establishes a fair value hierarchy that requires an entity to maximize the use of observable inputs and minimize the use of unobservable inputs when measuring fair value.
A financial instrument’s categorization within the fair value hierarchy is based upon the lowest level of input that is significant to the fair value measurement. Three levels of inputs that may be used to measure fair value are:
| • | Level 1 – Valuation is based upon quoted prices for identical instruments traded in active markets. Level 1 instruments include securities traded on active exchange markets, such as the New York Stock Exchange. |
| • | Level 2 – Valuation is based upon quoted prices for similar instruments in active markets, quoted prices for identical or similar instruments in markets that are not active and model-based valuation techniques for which all significant assumptions are directly observable in the market. |
| • | Level 3 – Valuation is generated from model-based techniques that use significant assumptions not observable in the market. These unobservable assumptions reflect the Company’s own estimates of assumptions market participants would use in pricing the instrument. |
The Company’s financial assets have been classified as Level 1. The Company’s financial assets (which include cash equivalents and investments) have been initially valued at the transaction price and subsequently valued, at the end of each reporting period, utilizing third party pricing services. The Company’s financial liabilities have been classified as Level 3. The Company’s financial liabilities (which include contingent considerations as discussed in Note 4 – Fair Value Measurements) have been initially valued at the transaction price and subsequently valued, at the end of each reporting period, utilizing a third-party valuation specialist.
Research and Development
Research and development costs consist primarily of salaries and related expenses for personnel, clinical trial expenses and fees paid to outside consultants and outside service providers. Research and development costs are expensed as incurred.
Stock-Based Compensation
The Company has stock-based compensation plans under which it grants various types of equity-based awards, the cost of which is based on the grant-date fair value of the underlying award and recognized over the period during which an employee is required to provide service in exchange for the award, which is generally the vesting period.
For performance-equity awards with market-based conditions, compensation cost is measured at the date of the award and is recorded over the vesting period, regardless of the likelihood of achievement of the market-based performance criteria. For performance-based equity awards with financial and business milestone achievement targets, compensation cost is based on the probable outcome of the performance conditions. Changes to the probability assessment and the estimated shares expected to vest will result in adjustments to the related stock-based compensation expense that will be recorded in the period of the change. If the performance targets are not achieved, no compensation cost is recognized, and any previously recognized compensation cost is reversed.
See Note 14, Equity Incentive Plan, for a description of the types of stock-based awards granted, the compensation expense related to such awards, and detail of equity-based awards outstanding.
Income Taxes
The Company’s income tax expense includes U.S. and international income taxes. Certain items of income and expense are not reported in tax returns and financial statements in the same year. The tax effects of these timing differences are reported as deferred tax assets and liabilities. Deferred tax assets are recognized for the estimated future tax effects of deductible temporary differences, tax operating losses, and tax credit carryforwards (including investment tax credits). Changes in deferred tax assets and liabilities are recorded in the provision for income taxes. The Company assesses the likelihood that its deferred tax assets will be recovered from future taxable income and, to the extent it believes that it is more likely than not that all or a portion of deferred tax assets will not be realized, the Company establishes a valuation allowance to reduce the deferred tax assets to the appropriate valuation. To the extent the Company establishes a valuation allowance or increases or decreases this allowance in a given period, it includes the related tax expense or tax benefit within the tax provision in the consolidated statement of operations in that period.
Comprehensive Income (Loss)
Comprehensive income (loss) consists of net income (loss) and other comprehensive income (loss), which includes foreign currency translation adjustments. For the purposes of comprehensive income (loss) disclosures, the Company does not record tax provisions or benefits for the net changes in the foreign currency translation adjustment, as it intends to indefinitely reinvest undistributed earnings of its foreign subsidiary. Accumulated other comprehensive income (loss) is reported as a component of stockholders' equity.
Segment Information
Operating segments are components of an enterprise about which separate financial information is available that is evaluated regularly by the chief operating decision maker, or decision-making group, in deciding how to allocate resources and in assessing performance. The Company’s chief operating decision maker is its President and Chief Executive Officer as of December 31, 2021. Based on the criteria established by ASC 280, Segment Reporting, the Company has
Contingencies
In the normal course of business, the Company is involved from time-to-time in various legal proceedings and other matters such as contractual disputes, which are complex in nature and have outcomes that are difficult to predict. The Company records accruals for loss contingencies to the extent that it concludes that it is probable that a liability has been incurred and the amount of the related loss can be reasonably estimated. The Company considers all relevant factors when making assessments regarding these contingencies. Although the outcomes of any potential legal proceedings are inherently difficult to predict, the Company does not expect the resolution of any potential legal proceedings to have a material adverse effect on its financial position, results of operations, or cash flow.
Recent Accounting Pronouncements
In December 2019, the Financial Accounting Standards Board (“FASB”) issued Accounting Standards Update (“ASU”) 2019-12, Income Taxes (Topic 740) – Simplifying the Accounting for Income Taxes, to simplify the accounting for income taxes by removing certain exceptions to the general principles in Topic 740. The amendments also improve consistent application of and simplify US GAAP for other areas of Topic 740 by clarifying and amending existing guidance. ASU 2019-12 is effective for fiscal years beginning after December 15, 2020 and interim periods within those fiscal years. The Company adopted ASU 2019-12 as of January 1, 2021. The adoption of this standard did not have a significant impact on the Company’s consolidated financial statements and related disclosures.
3. Business Combinations
Parcus Medical, LLC
On January 24, 2020, the Company completed the acquisition of Parcus Medical pursuant to the terms of the Agreement and Plan of Merger, dated as of January 4, 2020 (the “Parcus Medical Merger Agreement”), by and among the Company, Parcus Medical, the Unitholder Representative, and Sunshine Merger Sub LLC, a Wisconsin limited liability company and a wholly owned subsidiary of the Company. At the closing date, Parcus Medical became a wholly owned subsidiary of the Company. Parcus Medical is a sports medicine implant and instrumentation solutions provider focused on surgical repair and reconstruction of soft tissue.
The acquisition of Parcus Medical has been accounted for as a business combination under ASC 805, Business Combinations (“ASC 805”). Under ASC 805, assets acquired and liabilities assumed in a business combination are recorded at their fair value as of the acquisition date. The Company’s consolidated financial statements include results of operations for Parcus Medical from the January 24, 2020 acquisition date.
Consideration Transferred
Pursuant to the Parcus Medical Merger Agreement, the Company acquired all outstanding equity of Parcus Medical for estimated total purchase consideration of $
| Cash consideration | $ | |||
| Deferred consideration | ||||
| Estimated fair value of contingent consideration | ||||
| Estimated total purchase consideration | $ |
Pursuant to the Parcus Medical Merger Agreement, contingent consideration represents additional payments that the Company may be required to make in the future could total up to $
Acquisition-related costs are not included as a component of consideration transferred but are expensed in the periods in which the costs are incurred. The Company incurred approximately $
Fair Value of Net Assets Acquired
The estimate of fair value as of the acquisition date required the use of significant assumptions and estimates. Critical estimates included, but were not limited to, future expected cash flows, including projected revenues and expenses, and the applicable discount rates. These estimates were based on assumptions that the Company believes to be reasonable, however, actual results may differ from these estimates.
The allocation of purchase price to the identifiable assets acquired and liabilities assumed was based on estimates of fair value as of January 24, 2020, and is as follows:
| Recognized identifiable assets acquired and liabilities assumed: | ||||
| Cash and cash equivalents | $ | |||
| Accounts receivable | ||||
| Inventories | ||||
| Prepaid expenses and other current assets | ||||
| Property and equipment, net | ||||
| Right-of-use assets | ||||
| Intangible assets | ||||
| Accounts payable, accrued expenses and other current liabilities | ( | ) | ||
| Other long-term liabilities | ( | ) | ||
| Lease liabilities | ( | ) | ||
| Net assets acquired | ||||
| Goodwill | ||||
| Estimated total purchase consideration | $ |
The acquired intangible assets based on estimates of fair value as of January 24, 2020 are as follows:
| Developed technology | $ | |||
| Trade name | ||||
| Customer relationships | ||||
| Total acquired intangible assets | $ |
The fair value of the developed technology intangible assets has been estimated using the multi-period excess earnings method, which is based on the principle that the value of an intangible asset is equal to the present value of the incremental after-tax cash flows attributable to the asset, after charges for other assets employed by the business. The fair value of the customer relationships has been estimated using the avoided costs/lost profits method, which is based on the principle that the value of an intangible asset is based on consideration of the total costs that would be avoided by having this asset in place. The fair value of the trade name has been estimated using the relief from royalty method of the income approach, which is based on the principle that the value of an intangible asset is equal to the present value of the after-tax royalty savings attributable to owning the intangible asset. Key estimates and assumptions used in these models are projected revenues and expenses related to the asset, estimated contributory asset charges, estimated costs to recreate the asset, and a risk-adjusted discount rate used to calculate the present value of the future expected cash inflows or cash outflows avoided from the asset.
The fair value of developed technology will be amortized over a useful life of
The excess of the purchase price over the fair value of the net assets acquired was recorded as goodwill and assigned to the newly established reporting unit for Parcus Medical and Arthrosurface. The goodwill is attributable to the workforce of the business and the value of future technologies expected to arise after the acquisition. Goodwill will not be amortized and is expected to be deductible for income tax purposes as the acquisition of the limited liability company is an asset purchase for tax purposes. See Note 8, Goodwill, for further discussion.
Arthrosurface, Inc.
On February 3, 2020, the Company completed the acquisition of Arthrosurface pursuant to the terms of the Agreement and Plan of Merger, dated as of January 4, 2020 (the “Arthrosurface Merger Agreement”), by and among the Company, Arthrosurface, the Stockholder Representative, and Button Merger Sub, a Delaware corporation and a wholly-owned subsidiary of the Company. At the closing date, Arthrosurface became a wholly-owned subsidiary of the Company. Arthrosurface is a joint preservation technology company specializing in less invasive, bone-preserving partial and total joint replacement solutions.
The acquisition of Arthrosurface has been accounted for as a business combination under ASC 805. Under ASC 805, assets acquired and liabilities assumed in a business combination are recorded at their fair values as of the acquisition date. Anika’s consolidated financial statements include results of operations for Arthrosurface from the February 3, 2020 acquisition date.
Consideration Transferred
Pursuant to the Arthrosurface Merger Agreement, the Company acquired all outstanding equity of Arthrosurface for estimated total purchase consideration of $
| Cash consideration | $ | |
| Estimated fair value of contingent consideration | ||
| Estimated total purchase consideration | $ |
Pursuant to the Arthrosurface Merger Agreement, the Company could be required to make future payments of up to $
Acquisition-related costs are not included as a component of consideration transferred but are expensed in the periods in which the costs are incurred. The Company incurred approximately $
Fair Value of Net Assets Acquired
The estimate of fair value required the use of significant assumptions and estimates. Critical estimates included, but were not limited to, future expected cash flows, including projected revenues and expenses, and the applicable discount rates. These estimates were based on assumptions that the Company believes to be reasonable. However, actual results may differ from these estimates.
The allocation of purchase price to the identifiable assets acquired and liabilities assumed was based on estimates of fair value as of February 3, 2020, as follows:
| Recognized identifiable assets acquired and liabilities assumed: | ||||
| Cash and cash equivalents | $ | |||
| Accounts receivable | ||||
| Inventories | ||||
| Prepaid expenses and other current assets | ||||
| Property, plant and equipment | ||||
| Other long-term assets | ||||
| Intangible assets | ||||
| Accounts payable, accrued expenses and other liabilities | ( | ) | ||
| Deferred tax liabilities | ( | ) | ||
| Net assets acquired | ||||
| Goodwill | ||||
| Estimated total purchase consideration | $ |
| Intangible assets acquired consist of: | ||||
| Developed technology | $ | |||
| Trade name | ||||
| Customer relationships | ||||
| IPR&D | ||||
| Total acquired intangible assets | $ |
The fair value of the developed technology intangible assets has been estimated using the multi-period excess earnings method, which is based on the principle that the value of an intangible asset is equal to the present value of the incremental after-tax cash flow attributable to the asset, after charges for other assets employed by the business. The fair value of the customer relationships has been estimated using the avoided costs/lost profits method, which is based on the principle that the value of an intangible asset is based on consideration of the total costs that would be avoided by having this asset in place. The fair value of the trade name has been estimated using the relief from royalty method of the income approach, which is based on the principle that the value of an intangible asset is equal to the present value of the after-tax royalty savings attributable to owning the intangible asset. Key estimates and assumptions used in these models are projected revenues and expenses related to the asset, estimated contributory asset charges, estimated costs to recreate the asset, and a risk-adjusted discount rate used to calculate the present value of the future expected cash inflows or cash outflows avoided from the asset.
The fair value of developed technology that will be amortized over an estimated useful life of
The excess of the purchase price over the fair value of the net assets acquired was recorded as goodwill and assigned to the newly established reporting unit for Parcus Medical and Arthrosurface. The goodwill is attributable to the workforce of the business and the value of future technologies expected to arise after the acquisition. Goodwill will not be amortized and is not expected to be deductible for income tax purposes as the acquisition of the corporation is a stock purchase for tax purposes. See Note 8, Goodwill, for further discussion.
Pro forma Information
The Parcus Medical and Arthrosurface acquisitions were both completed in the first quarter of 2020. Both acquired companies have similar businesses with all of their products in the Joint Preservation and Restoration product family, serving orthopedic surgeons, ambulatory surgical centers and hospitals. The Company has combined legacy Anika, Parcus Medical and Arthrosurface pro forma supplemental information as follows.
The unaudited pro forma information for the year ended December 31, 2021 and 2020 was calculated after applying the Company’s accounting policies and the impact of acquisition date fair value adjustments. The pro forma financial information presents the combined results of operations of Anika, Parcus Medical and Arthrosurface as if the acquisitions had occurred on January 1, 2019 after giving effect to certain pro forma adjustments. The pro forma adjustments reflected herein include only those adjustments that are factually supportable and directly attributable to the acquisitions.
These pro forma adjustments include: (i) a net increase in amortization expense to record amortization expense for the aforementioned acquired identifiable intangible assets, (ii) an adjustment to cost of revenue based on the preliminary inventory step-up and the anticipated inventory turnover, (iii) a net decrease in interest expense as a result of eliminating interest expense and interest income related to borrowings that were settled in accordance with the respective Parcus Medical Merger Agreement and Arthrosurface Merger Agreement, (iv) an adjustment to record the acquisition-related transaction costs in the period required, and (v) the tax effect of the pro forma adjustments using the anticipated effective tax rate. The effective tax rate of the combined company could be materially different from the effective rate presented in this unaudited pro forma combined financial information. As a result of the transaction, the combined company may be subject to annual limitations on its ability to utilize pre-acquisition net operating loss carryforwards to offset future taxable income. The amount of the annual limitation is determined based on the value of Anika immediately prior to the acquisition. As further information becomes available, any such adjustment described above could be material to the amounts presented in the unaudited pro forma combined financial statements. The pro forma information does not purport to be indicative of the results of operations that actually would have resulted had the combination occurred at the beginning of each period presented, or of future results of the consolidated entities.
The following table presents unaudited supplemental pro forma information:
| Years Ended December 31, | ||||||||
| 2020 | 2019 | |||||||
| Total revenue | $ | $ | ||||||
| Net loss | $ | ( | ) | $ | ||||
4. Fair Value Measurements
The Company held investments in the form of U.S. treasury bills of $
The Company’s investments are all classified within Levels 1 of the fair value hierarchy and are valued based quoted prices in active markets. For cash, current receivables, accounts payable, and interest accrual, the carrying amounts approximate fair value, because of the short maturity of these instruments, and therefore fair value information is not included in the table below. Contingent consideration related to the previously described business combinations are classified within Level 3 of the fair value hierarchy as the determination of fair value uses considerable judgement and represents the Company’s best estimate of an amount that could be realized in a market exchange for the asset or liability.
The classification of the Company’s cash equivalents and investments within the fair value hierarchy is as follows:
| Active Markets | Significant Other | Significant | ||||||||||||||||||
| for Identical Assets | Observable Inputs | Unobservable Inputs | ||||||||||||||||||
| December 31, 2021 | (Level 1) | (Level 2) | (Level 3) | Amortized Cost | ||||||||||||||||
| Cash equivalents: | ||||||||||||||||||||
| Money Market Funds | $ | $ | $ | $ | $ | |||||||||||||||
| Other current liabilities: | ||||||||||||||||||||
| Contingent Consideration - Short Term | $ | $ | $ | $ | $ | |||||||||||||||
| Active Markets | Significant Other | Significant | ||||||||||||||||||
| for Identical Assets | Observable Inputs | Unobservable Inputs | ||||||||||||||||||
| December 31, 2020 | (Level 1) | (Level 2) | (Level 3) | Amortized Cost | ||||||||||||||||
| Cash equivalents: | ||||||||||||||||||||
| Money Market Funds | $ | $ | $ | $ | $ | |||||||||||||||
| Investments: | ||||||||||||||||||||
| U.S. Treasury Bills | $ | $ | $ | $ | $ | |||||||||||||||
| Other current and long-term liabilities: | ||||||||||||||||||||
| Contingent Consideration - Short Term | $ | $ | $ | $ | $ | |||||||||||||||
| Contingent Consideration - Long Term | ||||||||||||||||||||
| Total other current and long-term liabilities | $ | $ | $ | $ | $ | |||||||||||||||
There were no transfers between fair value levels in 2021 or 2020.
Contingent Consideration
The following table provides a rollforward of the contingent consideration related to business acquisitions discussed in Note 3, Business Combinations.
| Years Ended December 31 | ||||||||
| 2021 | 2020 | |||||||
| Balance, beginning January 1 | $ | $ | ||||||
| Additions | ||||||||
| Payments | ( | ) | ( | ) | ||||
| Change in fair value | ( | ) | ( | ) | ||||
| Balance, ending December 31 | $ | $ | ||||||
Under the Parcus Medical Merger Agreement and Arthrosurface Merger Agreement, there are earn-out milestones totaling up to $
In order to determine the fair value of contingent consideration at each reporting date, the projected contingent payment amounts were discounted back to the current period using a discounted cash flow model or a Monte Carlo simulation approach. The unobservable inputs used in the fair value measurement of the Company’s contingent consideration are the probabilities of successful achievement, the net sales estimates, the weighted average cost of capital used for the Monte Carlo simulation, discount rate and the periods in which the milestones are expected to be achieved. The discount rates used for the net sales earn-out milestone ranged from
As of December 31, 2020, the probability of successful achievement of the regulatory earn-out milestones was determined to be in a range of
As of December 31, 2021, a net sales growth milestone with respect to the Parcus Merger Agreement was achieved, and a liability in the amount of $
The overall fair value of the contingent consideration decreased by $
5. Inventories
Inventories consist of the following:
| December 31, | ||||||||
| 2021 | 2020 | |||||||
| Raw materials | $ | $ | ||||||
| Work-in-process | ||||||||
| Finished goods | ||||||||
| Total | $ | $ | ||||||
| Inventories | $ | $ | ||||||
| Other long-term assets | ||||||||
| Total | $ | |||||||
Inventories are stated net of inventory reserves of approximately $
6. Property and Equipment
Property and equipment is stated at cost and consists of the following:
| December 31, | ||||||||
| 2021 | 2020 | |||||||
| Equipment and software | $ | $ | ||||||
| Furniture and fixtures | ||||||||
| Leasehold improvements | ||||||||
| Construction in progress | ||||||||
| Subtotal | ||||||||
| Less accumulated depreciation | ( | ) | ( | ) | ||||
| Total | $ | $ | ||||||
Depreciation expense was $
7. Acquired Intangible Assets, Net
Intangible assets consist of the following:
| Year Ended December 31, 2021 | ||||||||||||||||||||||||
| Gross Value | Less: Adjustment | Less: | Less: Amortization | Net Book | Weighted Average Life | |||||||||||||||||||
| Developed technology | $ | $ | ( | ) | $ | $ | ( | ) | $ | |||||||||||||||
| IPR&D | ( | ) | ( | ) | Indefinite | |||||||||||||||||||
| Customer relationships | ( | ) | ||||||||||||||||||||||
| Distributor relationships | ( | ) | ( | ) | ||||||||||||||||||||
| Patents | ( | ) | ( | ) | ||||||||||||||||||||
| Tradenames | ( | ) | ||||||||||||||||||||||
| Total | $ | $ | ( | ) | $ | ( | ) | $ | ( | ) | $ | |||||||||||||
| Year Ended December 31, 2020 | ||||||||||||||||||||||||
| Gross Value | Less: Currency Adjustment | Less: Impairment | Less: Amortization | Net Book | Weighted Average Life | |||||||||||||||||||
| Developed technology | $ | $ | ( | ) | $ | ( | ) | $ | ( | ) | $ | |||||||||||||
| IPR&D | ( | ) | ( | ) | Indefinite | |||||||||||||||||||
| Customer relationships | ( | ) | ||||||||||||||||||||||
| Distributor relationships | ( | ) | ( | ) | ||||||||||||||||||||
| Patents | ( | ) | ( | ) | ||||||||||||||||||||
| Tradenames | ( | ) | ||||||||||||||||||||||
| Total | $ | $ | ( | ) | $ | ( | ) | $ | ( | ) | $ | |||||||||||||
Total amortization expense with respect to the definite-lived acquired intangible assets was $
During the fourth quarter of 2021, the Company decided not to further invest in a joint technology IPR&D project, as it is no longer aligned with the Company’s core strategic focus. As a result, the Company recorded an impairment charge in the amount of $
During the fourth quarter of 2020, the Company decided not to further invest in its Hyalobone and Hyalonect IPR&D projects as they were no longer aligned with the Company’s core strategic focus. As a result, the Company recorded an impairment charge in the period totaling $
The Company performed its annual assessment of the remaining IPR&D intangible asset as of November 30, 2021. The Company estimated the fair value of the IPR&D intangible assets using the income approach which is based on the Multi-Period Excess Earnings Method (“MPEEM”). MPEEM measures economic benefit indirectly by calculating the income attributable to an asset after appropriate returns are paid to complementary assets used in conjunction with the subject asset to produce the earnings associated with the subject asset, commonly referred to as contributory asset charges. This approach incorporates significant estimates and assumptions related to the forecasted results including revenues, expenses, expected economic life of the asset, contributory asset charges and discount rates to estimate future cash flows. While assumptions utilized are subject to a high degree of judgment and complexity, the Company made its best estimate of future cash flows under a high degree of economic uncertainty that existed as of November 30, 2021. In developing its assumptions, the Company also considered observed trends of its industry participants.
During 2020, the Company determined that it would not pursue CE Mark renewals for certain of its legacy products, which resulted in an impairment of certain developed technology related assets in the amount of $
8. Goodwill
The following table provides a rollforward of goodwill for the years ended December 31, 2021 and 2020:
| Years Ended December 31 | ||||||||
| 2021 | 2020 | |||||||
| Balance, beginning January 1 | $ | $ | ||||||
| Effect of foreign currency adjustments | ( | ) | ||||||
| Acquisitions | ||||||||
| Impairment | ( | ) | ||||||
| Balance, ending December 31 | $ | $ | ||||||
In the first quarter of 2020, the Company acquired Parcus Medical and Arthrosurface, as further discussed in Note 3, Business Combinations. As a result of the acquisitions, the Company determined that it had
2021 Goodwill Impairment Assessment
As part of its annual impairment testing as of November 30, 2021, for the goodwill related to the legacy Anika reporting unit, the Company performed a qualitative assessment including consideration of (i) general macroeconomic factors, (ii) industry and market conditions, and (iii) the extent of the excess of the fair value over the carrying value indicated in prior impairment testing. The Company determined it was not more likely than not that the fair value of the legacy Anika reporting unit is less than its carrying amount and thus goodwill was impaired as of November 30, 2021.
2020 Goodwill Impairment Assessment
Government policy responses to the COVID-19 pandemic and the resulting changes in healthcare guidelines caused a temporary suspension of global elective surgical procedures. As a result, the widespread economic volatility triggered impairment testing in the first quarter of 2020, and accordingly, the Company performed interim impairment testing on the goodwill balances of its reporting units. The Company also performed its annual impairment testing in the fourth quarter of 2020.
The Company estimated the fair value of the reporting units using a discounted cash flow method, which is based on the present value of projected cash flows and a terminal value, which represents the expected normalized cash flows of the reporting units beyond the cash flows from the discrete projection period. The Company determined that a discounted cash flow model provided the best approximation of fair value of the reporting units for the purpose of performing the impairment test. This approach incorporates significant estimates and assumptions related to the forecasted results including revenues, expenses, the achievement of certain cost synergies, terminal growth rates and discount rates to estimate future cash flows. While assumptions utilized are subject to a high degree of judgment and complexity, the Company made its best estimate of future cash flows under a high degree of economic uncertainty that existed as of November 30, 2020. In developing its assumptions, the Company also considered observed trends of its industry participants.
For the legacy Anika reporting unit, the Company performed a qualitative assessment including consideration of (i) general macroeconomic factors, (ii) industry and market conditions, and (iii) the extent of the excess of the fair value over the carrying value indicated in prior impairment testing. The Company determined it was not more likely than not that the fair value of the legacy Anika reporting unit is less than its carrying amount and thus goodwill was impaired as of March 31, 2020. As part of its annual impairment testing, the Company decided to perform a quantitative assessment related to the legacy Anika reporting unit as of November 30, 2020, due to the expectation that the economic recovery will take longer than expected to materialize. The results of the impairment test indicated that the estimated fair value of the legacy Anika reporting unit was greater than its carrying value, therefore the Company did record any impairment charges related to the legacy Anika reporting unit for the year ended December 31, 2020.
For its newly created reporting unit, which includes Parcus Medical and Arthrosurface, the Company performed an interim quantitative assessment of goodwill impairment as of March 31, 2020. The Company estimated the fair value of the reporting unit using a discounted cash flow method. The results of the interim impairment test indicated that the estimated fair value of the reporting unit was less than its carrying value. This was primarily due to decreases in near term revenue and related cash flows as a result of the temporary suspension of domestic elective procedures primarily due to the COVID-19 pandemic which directly impact the reporting unit. Consequently, a non-cash goodwill impairment charge was recorded in the amount of $
9. Leases
The Company leases its buildings and manufacturing facilities under operating leases. As of December 31, 2021, the Company had real estate leases in Bedford, Massachusetts, Franklin, Massachusetts, Sarasota, Florida, Warsaw, Indiana and Padova, Italy. The current term of the Bedford lease extends to 2022 with several lease renewal options into 2038, and the current term of the Padova lease extends to 2032, with a right to terminate at the Company’s option in 2026 without penalty.
As a result of the acquisition of Parcus Medical and Arthrosurface, the Company acquired operating and finance leases for corporate offices, manufacturing and warehouse facilities and machineries. The operating leases consist of one real estate lease in Franklin, Massachusetts (Franklin lease) and two real estate leases in Sarasota, Florida (Sarasota lease). The current term of the Franklin lease extends to 2023, and the current term of the Sarasota lease extends to 2024 which may be extended by mutual agreement of the parties. The finance leases include equipment utilized in the Company’s manufacturing facility in Sarasota, Florida.
The significant assumptions in recognizing the right-of-use asset and lease liability are as follows:
Incremental borrowing rate. The Company derives its incremental borrowing rate from information available at the lease commencement date in determining the present value of lease payments. The incremental borrowing rate represents a collateralized rate of interest the Company would have to pay to borrow over a similar term an amount equal to the lease payments in a similar economic environment. The Company’s lease agreements do not provide implicit rates. As the Company did not have any external borrowings at the transition date with comparable terms to its lease agreements, the Company estimated its incremental borrowing rate based on its credit quality, line of credit agreement and by comparing interest rates available in the market for similar borrowings, and adjusting this amount based on the impact of collateral over the term of the lease. The weighted average discount rate at December 31, 2021 is
Lease term. The lease term begins at the lease commencement date and is determined on that date based on the non-cancelable term of the lease together with periods covered by an option to extend the lease if the Company is reasonably certain to exercise that option, or periods covered by an option to terminate the lease if the Company is reasonably certain not to exercise that option.
The components of lease expense and other information are as follows:
| Years Ended December 31 | ||||||||||||
| 2021 | 2020 | 2019 | ||||||||||
| Finance lease amortization of right-of-use assets | $ | $ | $ | |||||||||
| Interest on finance lease liabilities | ||||||||||||
| Finance lease expense | ||||||||||||
| Operating lease expense | ||||||||||||
| Short-term lease expense | ||||||||||||
| Variable lease expense | ||||||||||||
| Total lease expense | $ | $ | $ | |||||||||
| Years Ended December 31 | ||||||||
| 2021 | 2020 | |||||||
| Weighted Average Remaining Lease Term (in years) | ||||||||
| Operating leases | ||||||||
| Financing leases | ||||||||
| Weighted Average Discount Rate | ||||||||
| Operating leases | % | % | ||||||
| Financing leases | % | % | ||||||
| Other information | ||||||||
| Operating cash flows from operating leases | $ | $ | ||||||
| Operating cash flows from financing leases | $ | $ | ||||||
Future commitments due under these lease agreements as of December 31, 2021 are as follows:
| Years ended December 31, | Operating | Financing | Total | |||||||||
| 2022 | $ | $ | $ | |||||||||
| 2023 | ||||||||||||
| 2024 | ||||||||||||
| 2025 | ||||||||||||
| 2026 | ||||||||||||
| Thereafter | ||||||||||||
| Present value adjustment | ( | ) | ( | ) | ( | ) | ||||||
| Present value of lease payments | ||||||||||||
| Less current portion included in accrued expenses and other current liabilities | ( | ) | ( | ) | ( | ) | ||||||
| Total lease liabilities | $ | $ | $ | |||||||||
10. Accrued Expenses
Accrued expenses consist of the following:
| December 31, | ||||||||
| 2021 | 2020 | |||||||
| Compensation and related expenses | $ | $ | ||||||
| Professional fees | ||||||||
| Operating lease liability - current | ||||||||
| Clinical trial costs | ||||||||
| Finance lease liability - current | ||||||||
| Other | ||||||||
| Total | $ | $ | ||||||
11. Revolving Credit Agreement
On November 12, 2021, the Company, entered into a “Third Amendment to Credit Agreement” amending the existing revolving line of credit agreement dated October 24, 2017 with Bank of America, N.A., as administrative agent, swingline lender and issuer of letters of credit, for a $
The Credit Agreement contains customary representations, warranties, affirmative and negative covenants, including financial covenants, events of default, and indemnification provisions in favor of the Lenders. These include restrictive covenants that require the Company not to exceed certain maximum leverage and interest coverage ratios, limit its incurrence of liens and indebtedness, and its entry into certain merger and acquisition transactions or dispositions and place additional restrictions on other matters, all subject to certain exceptions. The Revolving Lenders has been granted a first priority lien and security interest in substantially all of the Company’s assets, except for certain intangible assets.
In April 2020, the Company borrowed $
12. Commitments and Contingencies
In certain of its contracts, the Company warrants to its customers that the products it manufactures conform to the product specifications as in effect at the time of delivery of the specific product. The Company may also warrant that the products it manufactures do not infringe, violate or breach any U.S. or international patent or intellectual property rights, trade secret, or other proprietary information of any third party. On occasion, the Company contractually indemnifies its customers against any and all losses arising out of, or in any way connected with, any claim or claims of breach of its warranties or any actual or alleged defect in any product caused by the negligent acts or omissions of the Company. The Company maintains a products liability insurance policy that limits its exposure to these risks. Based on the Company’s historical activity, in combination with its liability insurance coverage, the Company believes the estimated fair value of these indemnification agreements is immaterial. The Company had
The Company is also involved from time-to-time in various legal proceedings arising in the normal course of business. Although the outcomes of these legal proceedings are inherently difficult to predict, the Company does not expect the resolution of these occasional legal proceedings to have a material adverse effect on its financial position, results of operations, or cash flows.
On October 21, 2021, the Company received notice that the former unitholders of Parcus Medical had filed a request for arbitration regarding the earnout provisions agreed to in the Parcus Medical Merger Agreement. The Company has engaged in the arbitration process and does not anticipate a resolution during 2022. The Company is unable to estimate the potential liability with respect to this matter at this time. There are numerous factors that make it difficult to estimate reasonably possible loss or range of loss at this stage of the matter, including the significant number of legal and factual issues still to be resolved in the arbitration process. The Company intends to vigorously defend against the claims and believes it has strong defenses to the claims asserted.
13. Revenue and Geographic Information
The following table summarizes the Company’s disaggregated revenues:
| Years Ended December 31, | ||||||||||||
| 2021 | 2020 | 2019 | ||||||||||
| Product revenue | $ | $ | $ | |||||||||
| Licensing, milestone and contract revenue | ||||||||||||
| Total revenue | $ | $ | $ | |||||||||
The Company categorizes its product portfolio into three product families: OA Pain Management, Joint Preservation and Restoration, and Non-Orthopedic. Anika’s consolidated financial statements include results of operations for Parcus Medical from the January 24, 2020 acquisition date and Arthrosurface from the February 3, 2020 acquisition date.
Product revenue by product family is as follows:
| Years Ended December 31, | ||||||||||||||||||||||||
| 2021 | 2020 | 2019 | ||||||||||||||||||||||
| Revenue | Percentage | Revenue | Percentage | Revenue | Percentage | |||||||||||||||||||
| OA Pain Management | $ | % | $ | % | $ | % | ||||||||||||||||||
| Joint Preservation and Restoration | % | % | % | |||||||||||||||||||||
| Non-Orthopedic | % | % | % | |||||||||||||||||||||
| Total | $ | % | $ | % | $ | % | ||||||||||||||||||
Product revenue from the Company’s sole significant customer, Mitek, as a percentage of the Company’s total product revenue was
Total revenue by geographic location based on the location of the customer in total and as a percentage of total revenue are as follows:
| Years Ended December 31, | ||||||||||||||||||||||||
| 2021 | 2020 | 2019 | ||||||||||||||||||||||
| Total | Percentage | Total | Percentage | Total | Percentage | |||||||||||||||||||
| Revenue | Revenue | Revenue | Revenue | Revenue | Revenue | |||||||||||||||||||
| Geographic Location: | ||||||||||||||||||||||||
| United States | $ | % | $ | % | $ | % | ||||||||||||||||||
| Europe | % | % | % | |||||||||||||||||||||
| Other | % | % | % | |||||||||||||||||||||
| Total | $ | % | $ | % | $ | % | ||||||||||||||||||
Net long-lived assets, consisting primarily of net property and equipment, are subject to geographic risks because they are generally difficult to move and to effectively utilize in another geographic area in a reasonable time period and because they are relatively illiquid. Net tangible long-lived assets by principal geographic areas are as follows:
| Years Ended December 31, | ||||||||
| 2021 | 2020 | |||||||
| United States | $ | $ | ||||||
| Italy | ||||||||
| Total | $ | $ | ||||||
14. Equity Incentive Plan
Equity Incentive Plan
The Anika Therapeutics, Inc. 2017 Omnibus Incentive Plan (the “2017 Plan”) was approved by the Company’s stockholders on June 13, 2017 and subsequently amended on June 18, 2019, June 16, 2020 and June 16, 2021. The 2017 Plan provides for the grant of incentive stock options, nonqualified stock options, stock appreciation rights (“SARs”), restricted stock awards (“RSAs”), performance restricted stock units (“PSUs”), restricted stock units (“RSUs”), total shareholder return options (“TSRs”) and performance options that may be settled in cash, stock, or other property. In accordance with the 2017 Plan approved by the Company’s stockholders, including the amendments thereto, each share award other than stock options or SAR’s will reduce the number of total shares available for grant by
The Anika Therapeutics, Inc. 2021 Inducement Plan (the “Inducement Plan”) was adopted by the Company’s board of directors on November 4, 2021. The Inducement Plan reserves
The Company may satisfy the awards upon exercise, or upon fulfillment of the vesting requirements for other equity-based awards, with either newly issued shares or shares reacquired by the Company. Stock-based awards are granted with an exercise price equal to or greater than the market price of the Company’s stock on the date of grant. Awards contain service conditions or service and performance conditions, and they generally become exercisable ratably over to years with a maximum contractual term of years.
The Company presents the expenses related to stock-based compensation awards in the same expense line items as cash compensation paid to each of its employees as follows (in thousands):
| Years Ended December 31, | ||||||||||||
| 2021 | 2020 | 2019 | ||||||||||
| Cost of revenue | $ | $ | $ | |||||||||
| Research and development | ||||||||||||
| Selling, general and administrative | ||||||||||||
| Total stock-based compensation expense | $ | $ | $ | |||||||||
For the years ended December 31, 2021, 2020 and 2019, tax benefits of $
The Company’s former President and Chief Executive Officer, Joseph Darling, passed away unexpectedly in January 2020. According to the terms of Mr. Darling’s equity award grants and the 2017 Plan, the unvested portion of his stock-based compensation was forfeited upon his death, resulting in a one-time benefit of $
Stock Options
Stock options are granted to purchase common shares at prices that are equal to the fair market value of the shares on the date the options are granted or, in the case of premium options, are granted with an exercise price at
The following summarizes the activity under the Company’s stock option plans:
| Number | Weighted | Weighted Average Remaining Contractual Term (in years) | Aggregate Value (in thousands) | |||||||||||||
| Outstanding as of December 31, 2020 | $ | |||||||||||||||
| Granted | $ | |||||||||||||||
| Exercised | ( | ) | $ | $ | ||||||||||||
| Forfeited and canceled | ( | ) | $ | |||||||||||||
| Outstanding as of December 31, 2021 | $ | $ | ||||||||||||||
| Vested, December 31, 2021 | $ | $ | ||||||||||||||
| Vested or expected to vest, December 31, 2021 | $ | $ | ||||||||||||||
The aggregate intrinsic value of options exercised for the years ended December 31, 2020 and 2019 was $
The Company granted
The Company uses the Black-Scholes pricing model to determine the fair value of options granted. The calculation of the fair value of stock options is affected by the stock price on the grant date, the expected volatility of the Company’s common stock over the expected term of the award, the expected life of the award, the risk-free interest rate and the dividend yield. The Company estimates the fair value of TSRs using Monte-Carlo simulation model where the expected volatility assumption is evaluated over
The assumptions used in the Black-Scholes pricing model for options granted during the years ended December 31, 2021 2020 and 2019, along with the weighted-average grant-date fair values, were as follows:
| 2021 | 2020 | 2019 | |||||||||||||||||||
| Risk-free interest rate | % | - | % | - | % | - | |||||||||||||||
| Expected stock price volatility | % | - | % | - | % | - | |||||||||||||||
| Expected life of options (in years) | 4.0 | 4.0 | |||||||||||||||||||
| Expected dividend yield | |||||||||||||||||||||
| Fair value per option | |||||||||||||||||||||
As of December 31, 2021, there was $
Restricted Stock Units
RSUs generally vest in equal annual installments over a or year periods. The grant-date fair value of RSUs is recognized as expense on a straight-line basis over the requisite service period, which is generally the vesting period. The Company determines the fair value of restricted stock units based on the closing price of its common stock on the date of grant.
RSU activity for the year ended December 31, 2021 is as follows:
| Number of | Weighted | |||||||
| Outstanding as of December 31, 2020 | $ | $ | ||||||
| Granted | $ | |||||||
| Vested | ( | ) | $ | |||||
| Forfeited and cancelled | ( | ) | $ | |||||
| Outstanding as of December 31, 2021 | $ | $ | ||||||
The weighted-average grant-date fair value per share of RSUs granted was $
As of December 31, 2021, there was $
Performance Stock Units
PSUs generally vest over a -year period from the grant date and include both a service and performance component. The PSUs granted to employees in 2019 contained performance conditions with business and financial targets. The business target, amounting to
PSU activity for the year ended December 31, 2021 is as follows:
| Number of | Weighted | |||||||
| Outstanding as of December 31, 2020 | $ | |||||||
| Forfeited and cancelled | ( | ) | $ | |||||
| Outstanding as of December 31, 2021 | $ | |||||||
The weighted-average grant-date fair value per share of PSUs granted was $
Employee Stock Purchase Plan
On March 17, 2021, the Company adopted the 2021 Employee Stock Purchase Plan (ESPP). The ESPP is authorized to issue up to
| 2021 | ||||
| Risk-free interest rate | % | |||
| Expected stock price volatility | % | |||
| Expected life of options (in years) | ||||
| Expected dividend yield | % | |||
15. Employee Benefit Plan
The Company’s U.S. employees are eligible to participate in the Company’s 401(k) savings plan. Employees may elect to contribute a percentage of their compensation to the plan, and the Company will make
16. Accelerated Share Repurchases
On May 2, 2019, the Company announced that its Board of Directors had authorized the repurchase of up to $
On January 14, 2020, the Company settled the approximately $
17. Income Taxes
Income Tax Expense
The components of the Company’s income (loss) before income taxes and its provision for (benefit from) income taxes consist of the following:
| Years ended December 31, | ||||||||||||
| 2021 | 2020 | 2019 | ||||||||||
| Income (loss) before income taxes | ||||||||||||
| Domestic | $ | ( | ) | $ | ( | ) | $ | |||||
| Foreign | ( | ) | ( | ) | ||||||||
| $ | $ | ( | ) | $ | ||||||||
| Years ended December 31, | ||||||||||||
| 2021 | 2020 | 2019 | ||||||||||
| Provision for (benefit from) income taxes: | ||||||||||||
| Current: | ||||||||||||
| Federal | $ | $ | $ | |||||||||
| State | ( | ) | ( | ) | ||||||||
| Foreign | ||||||||||||
| Total current | ( | ) | ||||||||||
| Deferred: | ||||||||||||
| Federal | ( | ) | ( | ) | ||||||||
| State | ( | ) | ( | ) | ||||||||
| Foreign | ( | ) | ( | ) | ( | ) | ||||||
| Total deferred | ( | ) | ( | ) | ||||||||
| Total (benefit from) provision for income taxes | $ | ( | ) | $ | ( | ) | $ | |||||
Deferred Tax Assets and Liabilities
Significant components of the Company’s deferred tax assets and liabilities consist of the following:
| December 31, | ||||||||
| 2021 | 2020 | |||||||
| Deferred tax assets: | ||||||||
| Lease liability | $ | $ | ||||||
| Inventory reserves | ||||||||
| Net operating loss carry forwards | ||||||||
| Stock-based compensation expense | ||||||||
| Tax credits | ||||||||
| Compensation accrual | ||||||||
| Foreign currency exchange | ||||||||
| Accrued expenses and other | ||||||||
| Gross deferred tax assets | ||||||||
| Less: valuation allowance | ( | ) | ||||||
| Deferred tax assets | $ | $ | ||||||
| December 31, | ||||||||
| 2021 | 2020 | |||||||
| Deferred tax liabilities: | ||||||||
| Acquisition-related intangible asset | $ | ( | ) | $ | ( | ) | ||
| Depreciation | ( | ) | ( | ) | ||||
| Right of use asset | ( | ) | ( | ) | ||||
| Accrued expenses and other | ( | ) | ||||||
| Deferred tax liabilities | $ | ( | ) | $ | ( | ) | ||
| Net deferred tax liabilities | $ | ( | ) | $ | ( | ) | ||
As of December 31, 2021, the Company had a federal net operating loss (“NOL”) carryforward of $
In 2021, the Company transferred certain intellectual property held by its Italian subsidiary to the U.S. in exchange of cash consideration, resulting in a gain in Italy, to more closely align the economic ownership of this intellectual property with the Company’s current and future business operations.
The Company evaluated the likelihood that it would realize the deferred income taxes to offset future taxable income and concluded that it is more likely than not that the majority of its deferred tax assets will be realized through consideration of both the positive and negative evidence. As a result, during the year ended December 31, 2021, the Company released the valuation allowance recorded related to the net deferred tax assets in Italy in the amount of $0.9 million.
Effective Tax Rate
The reconciliation between the U.S. federal statutory rate and the Company’s effective rate is summarized as follows:
| Years ended December 31, | ||||||||||||
| 2021 | 2020 | 2019 | ||||||||||
| Statutory federal income tax rate | % | % | % | |||||||||
| State tax expense, net of federal benefit | ( | %) | % | % | ||||||||
| Stock compensation | % | ( | %) | % | ||||||||
| Section 162(m) limitation | % | % | ||||||||||
| Goodwill impairment | % | ( | %) | % | ||||||||
| Change in fair value of contingent consideration | ( | %) | % | % | ||||||||
| Change in state apportionment | ( | %) | % | % | ||||||||
| Federal, state and foreign tax credits | ( | %) | % | ( | %) | |||||||
| Valuation allowance | ( | %) | ( | %) | % | |||||||
| Other permanent items | % | % | ( | %) | ||||||||
| Effective income tax rate | ( | ) | % | % | ||||||||
Accounting for Uncertainty in Income Taxes
The Company had
In the normal course of business, Anika and its subsidiaries may be periodically examined by various taxing authorities. The Company files income tax returns in the United States on a federal basis, in certain U.S. states, and in certain foreign jurisdictions. The associated tax filings remain subject to examination by applicable tax authorities for a certain length of time following the tax year to which those filings relate. With few exceptions, the Company is no longer subject to income tax examinations for years prior to 2018.
Upon the settlement of certain stock-based awards (i.e., exercise, vesting, forfeiture, or cancellation), the actual tax deduction is compared with cumulative financial reporting compensation cost, and any excess tax deduction related to these awards is considered a windfall tax benefit. The Company records windfall tax benefits to income tax expense. The Company follows the with-and-without approach for the direct effects of windfall/shortfall items and to determine the timing of the recognition of any related benefits. The Company recorded a windfall tax benefit in income tax expense of $
18. Earnings per Share (“EPS”)
Basic EPS is calculated by dividing net income (loss) by the weighted average number of shares outstanding during the period. Unvested restricted shares, although legally issued and outstanding, are not considered outstanding for purposes of calculating basic EPS. Diluted EPS is calculated by dividing net income by the weighted average number of shares outstanding plus the dilutive effect, if any, of outstanding share-based awards using the treasury stock method.
The following table provides share information used in the calculation of the Company's basic and diluted EPS (in thousands):
| Years Ended December 31, | ||||||||||||
| 2021 | 2020 | 2019 | ||||||||||
| Shares used in the calculation of basic EPS | ||||||||||||
| Effect of dilutive securities: | ||||||||||||
| Share based awards | ||||||||||||
| Diluted shares used in the calculation of EPS | ||||||||||||
Stock options of
At December 31, 2021 and 2020 there were no outstanding unvested RSAs. At December 31, 2019 a total of
ITEM 9A. CONTROLS AND PROCEDURES
| (a) |
Evaluation of disclosure controls and procedures. |
As required by Rule 13a-15 under the Securities Exchange Act of 1934, or the Exchange Act, we carried out an evaluation under the supervision and with the participation of our management, including our chief executive officer and chief financial officer, of the effectiveness of the design and operation of our disclosure controls and procedures as of the end of the period covered by this report. Based upon that evaluation, the chief executive officer and chief financial officer have concluded that our disclosure controls and procedures are effective as of December 31, 2021 to ensure that information required to be disclosed by us in reports we file or submit under the Exchange Act is recorded, processed, summarized, and reported within the time periods specified in SEC rules and forms. Disclosure controls and procedures include, without limitation, controls and procedures designed to ensure that information required to be disclosed by our company in the reports we file or submit under the Exchange Act is accumulated and communicated to our management, including our chief executive officer and chief financial officer, or persons performing similar functions, as appropriate to allow timely decisions regarding required disclosure. On an on-going basis, we review and document our disclosure controls and procedures, and our internal control over financial reporting, and we may from time to time make changes aimed at enhancing their effectiveness and ensuring that our systems evolve with our business.
| (b) |
Changes in internal controls over financial reporting. |
During the fourth quarter, we completed the implementation of our enterprise resource planning software at our Parcus Medical and Arthrosurface subsidiaries. In this regard, we reviewed and modified our internal controls, as necessary. There were no other changes in our internal control over financial reporting during the three months ended December 31, 2021 that have materially affected, or are reasonably likely to materially affect, our internal control over financial reporting.
Management’s Report on Internal Control over Financial Reporting
Our management is responsible for establishing and maintaining adequate internal control over financial reporting as defined in Rules 13a-15(f) and 15d-15(f) under the Exchange Act. Our internal control over financial reporting is a process designed to provide reasonable assurance regarding the reliability of financial reporting and the preparation of financial statements for external purposes in accordance with generally accepted accounting principles in the United States.
Because of its inherent limitations, internal control over financial reporting can provide only reasonable assurance, and it may not prevent or detect misstatements. Also, projections of any evaluation of effectiveness to future periods are subject to the risk that controls may become inadequate because of changes in conditions or that the degree of compliance with the policies or procedures may deteriorate.
Our management assessed the effectiveness of our internal control over financial reporting as of December 31, 2021. In making this assessment, management used the criteria set forth by the Committee of Sponsoring Organizations of the Treadway Commission in its 2013 Internal Control—Integrated Framework.
Based on its assessment and those criteria, our management believes that our company maintained effective internal control over financial reporting as of December 31, 2021.
The effectiveness of our internal control over financial reporting as of December 31, 2021 has been audited by Deloitte & Touche LLP, an independent registered public accounting firm, as stated in their report which is included below in this Item 9A.
REPORT OF INDEPENDENT REGISTERED PUBLIC ACCOUNTING FIRM
To the Board of Directors and Stockholders of Anika Therapeutics, Inc.
Opinion on Internal Control over Financial Reporting
We have audited the internal control over financial reporting of Anika Therapeutics, Inc. and subsidiaries (the “Company”) as of December 31, 2021, based on criteria established in Internal Control — Integrated Framework (2013) issued by the Committee of Sponsoring Organizations of the Treadway Commission (COSO). In our opinion, the Company maintained, in all material respects, effective internal control over financial reporting as of December 31, 2021, based on criteria established in Internal Control — Integrated Framework (2013) issued by COSO.
We have also audited, in accordance with the standards of the Public Company Accounting Oversight Board (United States) (PCAOB), the consolidated financial statements as of and for the year ended December 31, 2021, of the Company and our report dated March 10, 2022, expressed an unqualified opinion on those financial statements.
Basis for Opinion
The Company’s management is responsible for maintaining effective internal control over financial reporting and for its assessment of the effectiveness of internal control over financial reporting, included in the accompanying Management's Report on Internal Control over Financial Reporting. Our responsibility is to express an opinion on the Company’s internal control over financial reporting based on our audit. We are a public accounting firm registered with the PCAOB and are required to be independent with respect to the Company in accordance with the U.S. federal securities laws and the applicable rules and regulations of the Securities and Exchange Commission and the PCAOB.
We conducted our audit in accordance with the standards of the PCAOB. Those standards require that we plan and perform the audit to obtain reasonable assurance about whether effective internal control over financial reporting was maintained in all material respects. Our audit included obtaining an understanding of internal control over financial reporting, assessing the risk that a material weakness exists, testing and evaluating the design and operating effectiveness of internal control based on the assessed risk, and performing such other procedures as we considered necessary in the circumstances. We believe that our audit provides a reasonable basis for our opinion.
Definition and Limitations of Internal Control over Financial Reporting
A company’s internal control over financial reporting is a process designed to provide reasonable assurance regarding the reliability of financial reporting and the preparation of financial statements for external purposes in accordance with generally accepted accounting principles. A company’s internal control over financial reporting includes those policies and procedures that (1) pertain to the maintenance of records that, in reasonable detail, accurately and fairly reflect the transactions and dispositions of the assets of the company; (2) provide reasonable assurance that transactions are recorded as necessary to permit preparation of financial statements in accordance with generally accepted accounting principles, and that receipts and expenditures of the company are being made only in accordance with authorizations of management and directors of the company; and (3) provide reasonable assurance regarding prevention or timely detection of unauthorized acquisition, use, or disposition of the company’s assets that could have a material effect on the financial statements.
Because of its inherent limitations, internal control over financial reporting may not prevent or detect misstatements. Also, projections of any evaluation of effectiveness to future periods are subject to the risk that controls may become inadequate because of changes in conditions, or that the degree of compliance with the policies or procedures may deteriorate.
/s/ Deloitte & Touche LLP
Boston, Massachusetts
March 10, 2022
On October 28, 2021, the Board of Directors elected Sheryl L. Conley as a member of the Board effective as of October 28, 2021.
ITEM 9C. DISCLOSURE REGARDING FOREIGN JURISDICTIONS THAT PREVENT INSPECTIONS
Not applicable.
PART III
ITEM 10. DIRECTORS, EXECUTIVE OFFICERS AND CORPORATE GOVERNANCE
The information required under this item is incorporated herein by reference to our definitive proxy statement pursuant to Regulation 14A, which proxy statement will be filed with the SEC not later than 120 days after the close of our fiscal year ended December 31, 2021.
ITEM 11. EXECUTIVE COMPENSATION
The information required under this item is incorporated herein by reference to our definitive proxy statement pursuant to Regulation 14A, which proxy statement will be filed with the SEC not later than 120 days after the close of our fiscal year ended December 31, 2021.
ITEM 12. SECURITY OWNERSHIP OF CERTAIN BENEFICIAL OWNERS AND MANAGEMENT AND RELATED STOCKHOLDER MATTERS
The information required under this item and Item 5 of this Annual Report on Form 10-K under the heading “Equity Compensation Plan Information” is incorporated herein by reference to our definitive proxy statement pursuant to Regulation 14A, which proxy statement will be filed with the SEC not later than 120 days after the close of our fiscal year ended December 31, 2021.
ITEM 13. CERTAIN RELATIONSHIPS AND RELATED TRANSACTIONS, AND DIRECTOR INDEPENDENCE
The information required under this item is incorporated herein by reference to our definitive proxy statement pursuant to Regulation 14A, which proxy statement will be filed with the SEC not later than 120 days after the close of our fiscal year ended December 31, 2021.
ITEM 14. PRINCIPAL ACCOUNTING FEES AND SERVICES
The information required under this item is incorporated herein by reference to our definitive proxy statement pursuant to Regulation 14A, which proxy statement will be filed with the SEC not later than 120 days after the close of our fiscal year ended December 31, 2021.
PART IV
ITEM 15. EXHIBITS AND FINANCIAL STATEMENT SCHEDULES
| (a) |
Documents filed as part of Form 10-K. |
|
| (1) Financial Statements |
||
| Consolidated Statements of Operations and Comprehensive Income |
||
| (2) Schedules |
||
| Schedules have been omitted as all required information has been disclosed in the financial statements and related footnotes. |
| (3) Exhibits |
| Exhibit |
Description |
|
| Bylaws of Anika Therapeutics, Inc., effective as of June 6, 2018 |
||
| Anika Therapeutics, Inc. Senior Executive Incentive Compensation Plan |
||
| Anika Therapeutics, Inc. Non-Employee Director Compensation Policy (restated as of February 9, 2022) |
||
| Second Amended and Restated 2003 Stock Option and Incentive Plan (adopted April 5, 2011) |
||
| Anika Therapeutics, Inc. 2017 Omnibus Incentive Plan (as amended effective June 16, 2021) |
||
| Anika Therapeutics, Inc. 2021 Employee Stock Purchase Plan (adopted March 17, 2021) |
||
| Anika Therapeutics, Inc. 2021 Inducement Plan (adopted November 4, 2021) |
||
| ***101 |
The following materials from the Annual Report on Form 10-K of Anika Therapeutics, Inc. for the fiscal year ended December 31, 2021, formatted in Inline XBRL: (i) Consolidated Balance Sheets as of December 31, 2021 and December 31, 2020; (ii) Consolidated Statements of Operations and Comprehensive Income for the Years Ended December 31, 2021, December 31, 2020, and December 31, 2019; (iii) Consolidated Statements of Stockholders’ Equity for the Years Ended December 31, 2021, December 31, 2020, and December 31, 2019; (iv) Consolidated Statements of Cash Flows for the Years Ended December 31, 2021, December 31, 2020, and December 31, 2019; and (v) Notes to Consolidated Financial Statements |
|
| 104 |
Cover Page Interactive Data File (formatted as Inline XBRL and contained in Exhibit 101) |
| + |
Portions of this exhibit have been redacted in compliance with Regulation S-K Item 601(b)(2). The omitted information is not material and would likely cause competitive harm to the Company if publicly disclosed. |
| † |
Management contract or compensatory plan or arrangement. |
| * |
Certain portions of this document have been omitted pursuant to a confidential treatment request filed with the Securities and Exchange Commission. The omitted portions have been filed separately with the Commission. |
| ** |
The certification attached as Exhibit 32.1 that accompanies this Form 10-K is not deemed filed with the SEC and is not to be incorporated by reference into any filing of Anika Therapeutics, Inc. under the Securities Act of 1933 or the Securities Exchange Act of 1934, whether made before or after the date of this Form 10-K, irrespective of any general incorporation language contained in such filing. |
| *** |
Pursuant to Rule 406T of Regulation S-T, XBRL (Extensible Business Reporting Language) information is deemed not filed or a part of a registration statement or prospectus for purposes of sections 11 or 12 of the Securities Act of 1933, is deemed not filed for purposes of section 18 of the Securities Exchange Act of 1934 and otherwise is not subject to liability under these sections. |
Pursuant to the requirements of Section 13 or 15(d) of the Securities Exchange Act of 1934, as amended, the registrant has duly caused this report to be signed on its behalf by the undersigned, thereunto duly authorized.
| ANIKA THERAPEUTICS, INC. |
|||
| Date: March 10, 2022 |
By: |
/s/ CHERYL BLANCHARD |
|
| Cheryl R. Blanchard, Ph.D. |
|||
| Chief Executive Officer |
|||
SIGNATURES
Pursuant to the requirements of the Securities Exchange Act of 1934, this report has been signed below by the following persons on behalf of the registrant and in the capacities and on the dates indicated.
| Signature |
Title |
Date |
||
| /s/ CHERYL BLANCHARD |
President and Chief Executive Officer |
|||
| Cheryl R. Blanchard, Ph.D. |
(Principle Executive Officer) |
March 10, 2022 |
||
| /s/ MICHAEL LEVITZ |
Executive Vice President, Chief Financial Officer and Treasurer |
|||
| Michael Levitz |
(Principal Financial Officer) |
March 10, 2022 |
||
| /s/ IAN MCLEOD |
Vice President, Chief Accounting Officer |
|||
| Ian McLeod |
(Principal Accounting Officer) |
March 10, 2022 |
||
| /s/ JEFFERY S. THOMPSON |
Director, Chairman of the Board |
|||
| Jeffery S. Thompson |
March 10, 2022 |
|||
| /s/ SHERYL L. CONLEY |
Director |
|||
| Sheryl L. Conley |
March 10, 2022 |
|||
| /s/ JOHN HENNEMAN |
Director |
|||
| John Henneman |
March 10, 2022 |
|||
| /s/ RAYMOND J. LAND |
Director |
|||
| Raymond J. Land |
March 10, 2022 |
|||
| /s/ GLENN R. LARSEN, PH.D. |
Director |
|||
| Glenn R. Larsen, Ph.D. |
March 10, 2022 |
|||
| /s/ STEPHEN RICHARD |
Director |
|||
| Stephen Richard |
March 10, 2022 |
|||
| /s/ SUSAN N. VOGT |
Director |
|||
| Susan N. Vogt |
March 10, 2022 |
|||
Serious News for Serious Traders! Try StreetInsider.com Premium Free!
You May Also Be Interested In
- Anika to Issue First Quarter 2024 Financial Results on Wednesday, May 8, 2024
- Dole plc Schedules First Quarter 2024 Earnings Release
- ADP Canada Happiness@Work Index: Spring Sprouts a Surge in Workers' Happiness
Create E-mail Alert Related Categories
SEC FilingsSign up for StreetInsider Free!
Receive full access to all new and archived articles, unlimited portfolio tracking, e-mail alerts, custom newswires and RSS feeds - and more!
