

Form 10-K Andersons, Inc. For: Dec 31
 Tweet
Tweet Share
ShareUNITED STATES
SECURITIES AND EXCHANGE COMMISSION
Washington, D.C. 20549
FORM 10-K
| ANNUAL REPORT PURSUANT TO SECTION 13 OR 15(d) OF THE SECURITIES EXCHANGE ACT OF 1934 | |||||
For the fiscal year ended December 31 , 2021
| TRANSITION REPORT PURSUANT TO SECTION 13 OR 15(d) OF THE SECURITIES EXCHANGE ACT OF 1934 | |||||
For the transition period from to .
Commission file number: 000-20557

(Exact name of the registrant as specified in its charter)
| (State of incorporation or organization) | (I.R.S. Employer Identification No.) | ||||||||||
| (Address of principal executive offices) | (Zip Code) | ||||||||||
(419 ) 893-5050
(Telephone Number)
| Securities registered pursuant to Section 12(b) of the Act: | ||||||||||||||
| Title of each class: | Trading Symbol | Name of each exchange on which registered: | ||||||||||||
Securities registered pursuant to Section 12(g) of the Act: None
Indicate by check mark if the registrant is a well-known seasoned issuer, as defined in Rule 405 of the Securities Act. Yes ý No ¨
Indicate by check mark if the registrant is not required to file reports pursuant to Section 13 or 15(d) of the Act. Yes ¨ No ý
Indicate by check mark whether the registrant (1) has filed all reports required to be filed by Section 13 or 15(d) of the Securities Exchange Act of 1934 during the preceding 12 months (or for such shorter period that the registrant was required to file such reports), and (2) has been subject to such filing requirements for the past 90 days. Yes ý No ¨
Indicate by check mark whether the Registrant has submitted electronically every Interactive Data File required to be submitted pursuant to Rule 405 of Regulation S-T (§232.405 of this chapter) during the preceding 12 months (or for such shorter period that the Registrant was required to submit such files). Yes ý No ¨
Indicate by check mark whether the registrant is a large accelerated filer, an accelerated filer, a non-accelerated filer, a smaller reporting company, or an emerging growth company. See definitions of “large accelerated filer,” “accelerated filer,” “smaller reporting company,” and "emerging growth company" in Rule 12b-2 of the Exchange Act.
| ý | Accelerated filer | ☐ | |||||||||
| Non-accelerated filer | ☐ | Smaller reporting company | |||||||||
| Emerging growth company | |||||||||||
| If an emerging growth company, indicate by check mark if the registrant has elected not to use the extended transition period for complying with any new or revised financial accounting standards provided pursuant to Section 13(a) of the Exchange Act. | ☐ | ||||||||||
Indicate by check mark whether the registrant has filed a report on and attestation to its management's assessment of the effectiveness of its internal control over financial reporting under Section 404(b) of the Sarbanes-Oxley Act (15 U.S.C. 7262(b)) by the registered public accounting firm that prepared or issued its audit report ☒
Indicate by check mark whether the registrant is a shell company (as defined in Rule 12b-2 of the Exchange Act). Yes ☐ No ý
The aggregate market value of the registrant's voting stock which may be voted by persons other than affiliates of the registrant was $939.5 million as of June 30, 2021, computed by reference to the last sales price for such stock on that date as reported on the Nasdaq Global Select Market. The registrant had 33,702,465 common shares outstanding, no par value, at February 11, 2022.
DOCUMENTS INCORPORATED BY REFERENCE
THE ANDERSONS, INC.
Table of Contents
| Page No. | |||||
| PART I. | |||||
| PART II. | |||||
| PART III. | |||||
| PART IV. | |||||
Part I.
Item 1. Business
Company Overview
The Andersons, Inc. (the "Company") is a diversified company rooted in agriculture. Founded in Maumee, Ohio in 1947, the Company is a significant player in the North American agricultural supply chain and conducts its business in the trade, renewables, and plant nutrient sectors.
Segment Descriptions
The Company's operations are classified into three reportable business segments: Trade, Renewables, and Plant Nutrient. Each of these segments is organized based upon the nature of products and services offered and aligns with the management structure. See Note 12 to the Consolidated Financial Statements in Item 8 for information regarding business segments.
Trade
The Trade Group is a diversified business focusing on logistics and merchandising across a wide range of commodities. The group specializes in the movement of physical commodities such as: whole grains, grain products, feed ingredients, domestic fuel products, and other agricultural commodities. The business also operates grain elevators across the U.S. and Canada where income is earned on commodities bought and sold through the elevator, commodities that are purchased and conditioned for resale, and commodities that are held in inventory until a future period, earning space income. Space income consists of appreciation or depreciation in the basis value of commodities held and represents the difference between the cash price of a commodity in one of the Company's facilities and an exchange traded futures price (“basis”); appreciation or depreciation between the future exchange contract months (“spread”); and commodities stored for others upon which storage fees are earned. The Trade Group business also offers a number of unique grain marketing, risk management and origination services to its customers and affiliated ethanol facilities for which it collects fees.
Sales are negotiated by the Company's merchandising staff as commodity prices are not predetermined. The Trade Group has a diversified portfolio of physical commodities that are sold, however, the principal commodities sold by the Company are corn, wheat and soybeans which are consistent with the prior year. Most of the Company's exported commodity sales are made through intermediaries while some commodities are shipped directly to foreign countries, mainly Canada. The Company ships grain from its facilities by rail, truck, or boat. Rail shipments are made primarily to grain processors and feeders with some rail shipments made to exporters on the Gulf of Mexico or east coast. Boat shipments are from the Port of Toledo, the Port of Houston or the Port of Oswego. In addition, commodities are transported via direct ship transactions in which suppliers sell grain to the Company, but delivered directly to domestic and international end users.
The Company's trade operations rely principally on forward purchase contracts with producers, dealers and commercial elevators to ensure an adequate supply of commodities to the Company's facilities throughout the year. The Company makes commodity purchases at prices referenced to regulated commodity exchanges.
The Company competes in the sale of commodities with other public and private grain brokers, elevator operators and farmer owned cooperative elevators. Some of the Company's competitors are also its customers. Competition is based primarily on price, service and reliability. Because the Company often buys in smaller lots, its competition for the purchase of commodities is generally local or regional in scope, although there are some large national and international companies that maintain regional grain purchase and storage facilities. Significant portions of grain bushels purchased and sold are made using forward contracts.
The Group's asset based grain handling business is seasonal in nature in that the largest portion of the principal grains are harvested and delivered from the farm and commercial elevators typically in July for wheat and September through November for corn and soybeans, although a significant portion of the principal grains are bought, sold and handled throughout the year.
The Andersons, Inc. | 2021 Form 10-K | 1
Fixed price purchase and sale commitments as well as commodities held in inventory expose the Company to risks related to adverse changes in market prices. Grain prices are typically comprised of two components, futures prices on regulated commodity exchanges and local basis adjustments. The Company manages the futures price risk by entering into exchange-traded futures and option contracts with regulated commodity exchanges. The contracts are economic hedges of price risk but are not designated or accounted for as hedging instruments. These regulated commodity exchanges maintain futures markets for the grains merchandised by the Company. Futures prices are determined by worldwide supply and demand.
The Company's grain risk management practices are designed to reduce the risk of changing commodity prices. In that regard, such practices also limit potential gains from further changes in market prices. The Company has policies that provide key controls over its risk management practices. These policies include a description of the objectives of the programs and review of daily position limits along with other internal controls. The Company monitors current market conditions and may expand or reduce the purchasing program in response to changes in those conditions. In addition, the Company monitors its counterparties on a regular basis for credit worthiness, defaults and non-delivery.
Purchases of commodities can be made the day the product is delivered to a terminal or via a forward contract made prior to actual delivery. Sales of commodities generally are made by contract for delivery in a future period. When the Company purchases commodities at a fixed price or at a price where a component of the purchase price is fixed via reference to a futures price on a regulated commodity exchange, it also enters into an offsetting sale of a futures contract on the regulated commodity exchange. Similarly, when the Company sells commodities at a fixed price, the sale is offset with the purchase of a futures contract on the regulated commodity exchange. At the close of business each day, inventory and open purchase and sale contracts as well as open futures and option positions are marked-to-market. Gains and losses in the value of the Company's ownership positions due to changing market prices are netted with, and substantially offset in the Statement of Operations by, losses and gains in the value of the Company's futures positions.
When a futures contract is entered into, an initial margin deposit must be sent to the regulated commodity exchange. The amount of the margin deposit is set by the regulated commodity exchange and varies by commodity. If the market price of a futures contract moves in a direction that is adverse to the Company's position, an additional margin deposit, called a maintenance margin, is required by regulated commodity exchanges. Subsequent price changes could require additional maintenance margin deposits or result in the return of maintenance margin deposits by the regulated commodity exchange. Significant increases in market prices, such as those that occur when grain supplies are affected by unfavorable weather conditions and/or when increases in demand occur, can have an effect on the Company's liquidity and, as a result, require it to maintain appropriate short-term lines of credit. The Company may utilize regulated commodity exchange option contracts to limit its exposure to potential required margin deposits in the event of a rapidly rising market.
The Company has a lease and marketing agreement with Cargill, Incorporated ("Cargill") for Cargill's Maumee and Toledo, Ohio grain handling and storage facilities. As part of the agreement, Cargill holds certain marketing rights to grain in the Cargill-owned facilities as well as the adjacent Company-owned facilities in Maumee and Toledo. The marketing agreement contains a profit-sharing provision whereby cumulative earnings generated from the grain facilities are contractually shared. As of December 31, 2021, the lease of the Cargill-owned facilities covers approximately 5%, or 8.8 million bushels, of the Company's total storage capacity.
Renewables
The Renewables Group (formerly the Ethanol Group) produces, purchases and sells ethanol and co-products, offers facility operations, risk management, and ethanol and co-products marketing services to the ethanol plants it invests in and operates. The group was rebranded in 2021 to reflect the strategic shift and focus on serving the broader renewables market, including renewable diesel and our ethanol plants. The group co-owns five ethanol plants located in Indiana, Iowa, Kansas, Michigan and Ohio. The group demonstrates an expertise in ethanol plant management, logistics and commercialization of ethanol and feed products with a focus on leading the industry in margins per bushel. The business also leverages partnerships, which are discussed in further detail below, to expand market knowledge and shared technology across its five plants. The group also operates a merchandising and trade portfolio of ethanol, ethanol co-products and other biofuels such as renewable diesel.
The Andersons, Inc. | 2021 Form 10-K | 2
Through the first nine months of 2019 the Renewables Group held ownership interests in three limited liability companies (“the ethanol LLCs” or “LLCs”), each of which owned an ethanol plant that was operated by the Company's Renewables Group. On October 1, 2019, the Renewables Group entered into an agreement to merge the LLCs and the Company's wholly-owned subsidiary, The Andersons Denison Ethanol LLC into a new legal entity, The Andersons Marathon Holdings LLC ("TAMH"). As a result of the merger, the Company and Marathon Petroleum Corporation ("Marathon") own 50.1% and 49.9% of TAMH equity, respectively. The transaction resulted in the consolidation of TAMH’s results in the Company's financial statements effective October 1, 2019. Prior to October 1, 2019, the results of the Ethanol LLCs were accounted for under the equity method of accounting. The four ethanol plants within TAMH are located in Iowa, Indiana, Michigan, and Ohio. These plants have a combined production capacity of 480 million gallons of ethanol, with a nameplate capacity of 405 million gallons.
The Company also owns 51% of ELEMENT, LLC ("ELEMENT") and ICM, Inc. ("ICM") owns the remaining 49% interest. In 2019, ELEMENT completed the construction of a 70 million-gallon-per-year bio-refinery in Kansas which began limited production in the third quarter of 2019. ICM managed the initial construction of the facility, while the Company operates the facility under a management contract, provides corn origination, ethanol marketing, and risk management services. The Company fully consolidates ELEMENT's results in the Company's financial statements.
Plant Nutrient
The Plant Nutrient Group is a leading manufacturer, distributor and retailer of agricultural and related plant nutrients, corncob-based products, and pelleted lime and gypsum products in the U.S. Corn Belt and Puerto Rico. The group provides warehousing, packaging and manufacturing services to basic nutrient producers and other distributors. The group also manufactures and distributes a variety of industrial products throughout the U.S. and Puerto Rico including nitrogen reagents for air pollution control systems used in coal-fired power plants, and water treatment and dust abatement products.
In its plant nutrient business, the Company competes with regional and local cooperatives, wholesalers and retailers, predominantly publicly owned manufacturers and privately-owned retailers, wholesalers and importers. Some of these competitors are also suppliers. Competition in the nutrient business is based largely on depth of product offering, price, location and service. Sales and warehouse shipments of agricultural nutrients are heaviest in the spring and fall.
As of January 1, 2020, the group reorganized into the three divisions listed below:
Ag Supply Chain - The Ag Supply Chain division provides wholesale nutrients and farm services focused primarily in the Eastern Grain Belt. The wholesale nutrients part of the business stores and distributes dry and liquid agricultural nutrients, and soil amendments. The major nutrient products sold principally contain nitrogen, phosphate, potassium and sulfur which are typically bought and sold as commodities. The farm centers offer a variety of essential crop nutrients, crop protection chemicals and seed products in addition to application and agronomic services to commercial and family farmers. Soil and tissue sampling along with global satellite assisted services provide for pinpointing crop or soil deficiencies and prescriptive agronomic advice is provided to farmers.
Engineered Granules - The Engineered Granules division manufactures and distributes proprietary professional lawn care products that are primarily sold into the golf course and professional turf care markets, serving both U.S. and international customers. These products are sold both directly and through distributors to golf courses and lawn service applicators. The Company also performs contract manufacturing services to sell fertilizer and weed and pest control products to various markets as well as the manufacturing of pelleted lime, gypsum and value add soil amendments. Additionally, corncob-based products are manufactured for a variety of uses including laboratory animal bedding and private-label cat litter, as well as absorbents, blast cleaners, carriers and polishers. The products are distributed throughout the United States, Canada, Europe and Asia. The principal sources for corncobs are seed corn producers.
Specialty Liquids - The Specialty Liquids division manufactures specialty ag liquids, seed starters and zinc as well as a manufacturer of industrial liquids. The business has a diverse portfolio of specialty products which support more sustainable farming practices and command higher margins.
Other
The Company's “Other” activities include corporate income, a small corporate venture fund and the cost for functions that provide support and services to the operating segments. The results include expenses and benefits not allocated to the operating segments.
The Andersons, Inc. | 2021 Form 10-K | 3
Human Capital Resources and Management
As of December 31, 2021, the Company had a total of 2,371 employees across its Trade, Renewables and Plant Nutrient segments and Corporate Services function. This total was comprised of 913 salary, 1,383 hourly and 75 seasonal employees who conducted work at 147 locations across the United States, Canada, United Kingdom, Switzerland, Mexico and Singapore. Ninety five of the Company’s locations included less than 10 employees.
•Recruiting: Talent acquisition efforts target both internal and external candidates. The Company advertises opportunities on large online job boards, state job boards and various targeted diversity job boards, as well as geographically specific media channels. The Company strives to find candidates within its geographic footprint to generate a diverse talent pool. It also engages in campus recruiting efforts for entry level professional talent, internships and professional development programs.
•Focus on Safety: Maintaining a high standard of employee safety is paramount to the Company’s core values. Systems and technology have been implemented to support the Company’s safety initiative, maintain a safe working environment and foster a culture of personal accountability. As a part of our employee onboarding process, employees are required to complete core safety courses. A yearly training calendar is followed to ensure timely completion of annual safety training. The Company advanced its safety program in recent years by identifying and focusing on high-risk work that has the potential of causing serious injury or fatality.
•Employee Engagement: The Company maintains an open-door policy that encourages candid conversations between employees and any level of leadership about job-related concerns without fear of reprisal. It regularly solicits employee feedback through informal pulse surveys and formal engagement surveys. It also communicates with employees on a weekly, monthly and quarterly basis through electronic newsletters, town halls, its intranet site and small group meetings with the Chief Executive Officer.
•Talent Development: The Company offers several resources to help employees expand their business knowledge and leadership skills. It hosts a Foundations of Leadership training course to newly appointed supervisors. It also offers a learning management system which houses numerous online courses, videos, audiobooks and podcasts that are available to all employees on demand. Additionally, several in-person trainings are led by internal staff.
•Health and Wellness: The Company partners with a wellness vendor to offer a comprehensive healthy lifestyles program to employees and their spouses. The program uses rewards and incentives to encourage participants to take the necessary steps to manage their health and wellness. The program was recently expanded to offer a prediabetes program, personal e-coaching with a licensed health professional and financial wellness webinars.
•Compensation and Benefits: The Company offers market competitive employee compensation and benefits programs. Benefits include a health care benefits, dental and vision benefits, disability and life insurance coverages and other a la carte voluntary benefit offerings. Company leave policies include domestic and sexual violence leave, family and medical leave, parental leave and military leave.
•Community Involvement: The Company believes strongly in sharing its time, talent and financial resources to help improve and sustain the quality of life in its communities. It has contributed a portion of its operating income to community organizations every year since its founding in 1947. The Company also encourages employees to share their time and gifts through volunteerism, participation in its annual workplace giving campaign and gift match program.
Government Regulation
Grain sold by the Company must conform to official grade standards imposed under a federal system of grain grading and inspection administered by the United States Department of Agriculture (“USDA”).
The production levels, markets and prices of the grains that the Company merchandises are affected by United States government programs, which include acreage control and price support programs of the USDA. In regard to our investments in ethanol production facilities, the U.S. government has mandated a ten percent blend for motor fuel gasoline sold.
The U.S. Food and Drug Administration (“FDA”) has developed bioterrorism prevention regulations for food facilities, which require that the Company registers its grain operations with the FDA, provide prior notice of any imports of food or other agricultural commodities coming into the United States and maintain records to be made available upon request that identifies the immediate previous sources and immediate subsequent recipients of its grain commodities.
The Andersons, Inc. | 2021 Form 10-K | 4
The Company, like other companies engaged in similar businesses, is subject to a multitude of federal, state and local environmental protection laws and regulations including, but not limited to, laws and regulations relating to air quality, water quality, pesticides and hazardous materials. The provisions of these various regulations could require modifications of certain of the Company's existing facilities and could restrict the expansion of future facilities or significantly increase the cost of their operations. Compliance with environmental laws and regulations did not materially affect the Company's earnings or competitive position in 2021. In each of the countries in which we operate, we are subject to a variety of laws and regulations governing various aspects of our business, including general business regulations as well as those governing the manufacturing, handling, storage, transport, marketing and sale of our products. These include laws and regulations relating to facility licensing and permitting, food and feed safety, the handling and production of regulated substances, nutritional and labeling requirements, global trade compliance and other matters.
Available Information
The Company’s Annual Reports on Form 10-K, Quarterly Reports on Form 10-Q, Current Reports on Form 8-K, and amendments to those reports filed or furnished pursuant to Sections 13(a) and 15(d) of the Securities Exchange Act of 1934, as amended (the “Exchange Act”), are filed with the Securities and Exchange Commission (the “SEC”). The Company is subject to the informational requirements of the Exchange Act and files or furnishes reports, proxy statements and other information with the SEC. Such reports and other information filed by the Company with the SEC are available free of charge at https://theandersonsinc.gcs-web.com/financial-information/sec-filings when such reports are available on the SEC’s website. The SEC maintains an internet site that contains reports, proxy and information statements, and other information regarding issuers that file electronically with the SEC at www.sec.gov. The Company periodically provides other information for investors on its corporate website, www.andersonsinc.com, and its investor relations website, https://theandersonsinc.gcs-web.com. This includes press releases and other information about financial performance, information on corporate governance and details related to the Company’s annual meeting of shareholders. The information contained on the websites referenced in this Form 10-K is not incorporated by reference into this filing. Further, the Company’s website references above are intended to be inactive textual references only.
Item 1A. Risk Factors
The Company's operations are subject to risks and uncertainties that could cause actual results to differ materially from those discussed in this Form 10-K and could have a material adverse impact on our financial results. The risks described below are not the only risks facing us. Additional risks and uncertainties not currently known to us or those we currently view to be immaterial may also materially and adversely affect our business, financial condition or results of operations. These risks can be impacted by factors beyond our control. The following risk factors should be read carefully in connection with evaluating our business and the forward-looking statements contained elsewhere in this Form 10-K.
Risks Related to our Business and Industry
The Company’s business, results of operations, financial condition and stock price have been adversely affected and could in the future be materially adversely affected by the COVID-19 pandemic.
The novel strain of coronavirus ("COVID-19") has spread rapidly throughout the world, prompting governments and businesses to take unprecedented measures in response. Such measures have included restrictions on travel and business operations, temporary closures of businesses, quarantine requirements and shelter-in-place orders. The COVID-19 pandemic has significantly curtailed global economic activity and caused significant volatility and disruption in global financial markets.
The COVID-19 pandemic and the measures taken by many countries in response have adversely affected and could in the future materially adversely impact the Company’s business, results of operations, financial condition and stock price. Following the initial outbreak of the virus, the Company experienced disruptions in ethanol demand as a result of the stay at home orders enforced throughout the year limiting travel. The Company has been designated a key infrastructure company by the U.S. Cybersecurity and Infrastructure Security Agency which has resulted in the Company's facilities to remain open under the appropriate government guidelines to protect public health and the health and safety of employees and customers. The Company has at times required substantially all of its administrative employees to work remotely.
The Company is continuing to monitor the situation and has taken actions in accordance with the recommendations and requirements of relevant authorities. The full extent of the impact of the COVID-19 pandemic on the Company’s operational and financial performance remains uncertain and will depend on many factors outside the Company’s control, including, without limitation, the timing, extent, trajectory and duration of the pandemic and the impacts of resurgences or new variants of
The Andersons, Inc. | 2021 Form 10-K | 5
the virus, the development, availability and use of effective treatments and vaccines, the imposition of and compliance with protective public safety measures, and the impact of the pandemic on the global economy. Additional future impacts on the Company may include, but are not limited to, material adverse effects on: demand for the Company’s products and services; the Company’s supply chain and sales and distribution channels; the Company’s ability to execute its strategic plans; and the Company’s profitability and cost structure.
To the extent the COVID-19 pandemic adversely affects the Company’s business, results of operations, financial condition and stock price, it may also have the effect of heightening many of the other risks described in this Part I, Item 1A of this Form 10-K.
Certain of our business segments are affected by the supply and demand of commodities and are sensitive to factors outside of our control. Adverse price movements could negatively affect our profitability and results of operations.
Our Trade, Renewables and Plant Nutrient businesses buy, sell and hold inventories of agricultural input and output commodities, some of which are readily traded on commodity futures exchanges. Unfavorable weather conditions, both local and worldwide, as well as other factors beyond our control, can affect the supply and demand of these commodities and expose us to liquidity pressures to finance hedges in the commodity business in rapidly rising markets. In our Plant Nutrient business, changes in the supply and demand of these commodities can also affect the value of inventories that we hold, as well as the price of raw materials as we are unable to effectively hedge these commodities. Increased costs of inventory and prices of raw material would decrease our profit margins and adversely affect our results of operations.
Corn - The principal raw material used to produce ethanol and co-products is corn. As a result, an increase in the price of corn in the absence of a corresponding increase in petroleum-based fuel prices will typically decrease ethanol margins thus adversely affecting financial results in the Renewables Group. At certain levels, corn prices may make ethanol uneconomical to produce for fuel markets. The price of corn is influenced by weather conditions and other factors affecting crop yields, shifts in acreage allocated to corn versus other major crops and general economic and regulatory factors. These factors include government policies and subsidies with respect to agriculture and international trade, and global and local demand and supply. The significance and relative effect of these factors on the price of corn is difficult to predict. Any event that tends to negatively affect the supply of corn, such as adverse weather or crop disease, could increase corn prices and adversely impact income. In addition, we may also have difficulty, from time to time, in physically sourcing corn on economical terms due to supply shortages. High costs or shortages could require us to suspend ethanol operations until corn is available on economical terms, which would have an adverse effect on operating results.
Commodities - While we attempt to manage the risk associated with agricultural commodity price changes for our commodity inventory positions with derivative instruments, including purchase and sale contracts, we are unable to offset 100% of the price risk of each transaction due to timing, availability of futures and options contracts and third-party credit risk. Furthermore, there is a risk that the derivatives we employ will not be effective in offsetting all of the risks that we are trying to manage. This can happen when the derivative and the underlying value of grain inventories and purchase and sale contracts are not perfectly matched. Our commodity derivatives, for example, do not perfectly correlate with the basis component of our commodity inventory and contracts. Basis is defined as the difference between the local cash price of a commodity and the corresponding exchange-traded futures price. Differences can reflect time periods, locations or product forms. Although the basis component is smaller and generally less volatile than the futures component of our grain market price, basis moves on a large commodity position can significantly impact the profitability of the Trade business.
Our futures, options and over-the-counter contracts are subject to margin calls. If there are large movements in the commodities market, we could be required to post significant levels of margin deposits, which would impact our liquidity. There is no assurance that the efforts we have taken to mitigate the impact of the volatility of the prices of commodities upon which we rely will be successful and any sudden change in the price of these commodities could have an adverse effect on our business and results of operations.
Natural gas - We rely on third parties for our supply of natural gas, which is consumed in the drying of wet grain, manufacturing of certain lawn products, pelleted lime and gypsum, and manufacturing of ethanol. The prices for and availability of natural gas are subject to market conditions. These market conditions often are affected by factors beyond our control such as higher prices resulting from colder than average weather and overall economic conditions. Significant disruptions in the supply of natural gas could impair the operations of the ethanol facilities. Furthermore, increases in natural gas prices or changes in our natural gas costs relative to natural gas costs paid by competitors may adversely affect future results of operations and financial position.
The Andersons, Inc. | 2021 Form 10-K | 6
Gasoline and oil - We market ethanol as a fuel additive to reduce vehicle emissions from gasoline, as an octane enhancer to improve the octane rating of gasoline with which it is blended and as a substitute for petroleum-based gasoline. As a result, ethanol prices will be influenced by the supply and demand for gasoline and oil and our future results of operations and financial position may be adversely affected if gasoline and oil demand or price changes.
Potash, phosphate and nitrogen - Raw materials used by the Plant Nutrient business include potash, phosphate and nitrogen, for which prices can be volatile and are driven by global and local supply and demand factors. Significant increases in the price of these commodities may result in lower customer demand and higher than optimal inventory levels. In contrast, reductions in the price of these commodities may create lower of cost or net realizable value adjustments to inventories.
Some of our business segments operate in highly regulated industries. Changes in government regulations or trade association policies could adversely affect our results of operations.
Many of our business segments are subject to government regulation and regulation by certain private sector associations, compliance with which can impose significant costs on our business. Other regulations are applicable generally to all our businesses and corporate functions, including, without limitation, those promulgated under the Internal Revenue Code, the Affordable Care Act, the Employee Retirement Income Security Act and other employment and health care related laws, federal and state securities laws, and the US Patriot Act. Failure to comply with such regulations can result in additional costs, fines or criminal action.
A significant part of our operations is regulated by environmental laws and regulations, including those governing the labeling, use, storage, discharge and disposal of hazardous materials. Because we use and handle hazardous substances in our businesses, changes in environmental requirements or an unanticipated significant adverse environmental event could have an adverse effect on our business. We cannot assure that we have been, or will at all times be, in compliance with all environmental requirements, or that we will not incur costs or liabilities in connection with these requirements. Private parties, including current and former employees, could bring personal injury or other claims against us due to the presence of, or exposure to, hazardous substances used, stored or disposed of by us, or contained in our products. We are also exposed to residual risk because some of the facilities and land which we have acquired may have environmental liabilities arising from their prior use. In addition, changes to environmental regulations may require us to modify our existing plant and processing facilities which could significantly increase the cost of those operations.
Trade and Renewables - In our Trade and Renewables businesses, agricultural production and trade flows can be affected by government programs and legislation. Production levels, markets and prices of the commodities we merchandise can be affected by U.S. government programs, which include acreage controls and price support programs administered by the USDA and required levels of ethanol in gasoline through the Renewable Fuel Standards as administered by the Environmental Protection Agency ("EPA"). Other examples of government policies that can have an impact on our business include tariffs, taxes, duties, subsidies, import and export restrictions, outright embargoes and price controls on agricultural commodities. Because a portion of our commodity sales are to exporters, the imposition of export restrictions and other foreign countries' regulations could limit our sales opportunities and create additional credit risk associated with export brokers if shipments are rejected at their destination.
International trade disputes can adversely affect agricultural commodity trade flows by limiting or disrupting trade between countries or regions. Trade disputes can lead to the implementing of tariffs on commodities in which we merchandise or otherwise use in our operations. This can lead to significant volatility in commodity prices, disruptions in historical trade flows and shifts in planting patterns in the Company's geographic footprint, which would present challenges and uncertainties for our business. The imposition of new tariffs or uncertainty around future tariff levels can cause significant fluctuations in the futures and basis levels of agricultural commodities, impacting our earnings. We cannot predict the effects that future trade policy or the terms of any negotiated trade agreements and their impact on our business.
Plant Nutrient - Our Plant Nutrient business manufactures certain agricultural nutrients and uses potentially hazardous materials. All products containing pesticides, fungicides and herbicides must be registered with the EPA and state regulatory bodies before they can be sold. The inability to obtain or the cancellation of such registrations could have an adverse impact on our business. In the past, regulations governing the use and registration of these materials have required us to adjust the raw material content of our products and make formulation changes. Future regulatory changes may have similar consequences. Regulatory agencies, such as the EPA, may at any time reassess the safety of our products based on new scientific knowledge or other factors. If it were determined that any of our products were no longer considered to be safe, it could result in the amendment or withdrawal of existing approvals, which, in turn, could result in a loss of revenue, cause our inventory to become obsolete or give rise to potential lawsuits against us. Consequently, changes in existing and future government or trade association polices may restrict our ability to do business and cause our financial results to suffer.
The Andersons, Inc. | 2021 Form 10-K | 7
We are required to carry significant amounts of inventory across all of our businesses. If a substantial portion of our inventory becomes damaged or obsolete, its value would decrease, and our profit margins would suffer.
We are exposed to the risk of a decrease in the value of our inventories due to a variety of circumstances in all of our businesses. For example, within our Trade and Renewables businesses, there is the risk that the quality of our inventory could deteriorate due to damage, moisture, insects, disease or foreign material. If the quality of our inventory were to deteriorate below an acceptable level, the value of our inventory could decrease significantly. In our Plant Nutrient business, planted acreage, and consequently the volume of fertilizer and crop protection products applied, is partially dependent upon government programs and the producer's perception of demand. Technological advances in agriculture, such as genetically engineered seeds that resist disease and insects, or that meet certain nutritional requirements, could also affect the demand for our crop nutrients and crop protection products. Either of these factors could render some of our inventory obsolete or reduce its value.
Our indebtedness could negatively affect our financial condition, decrease our liquidity and impair our ability to operate the business.
If cash on hand is insufficient to pay our obligations or margin calls as they come due at a time when we are unable to draw on our credit facility, it could have an adverse effect on our ability to conduct our business. Our ability to make payments on and to refinance our indebtedness will depend on our ability to generate cash in the future. Our ability to generate cash is dependent on various factors. These factors include general economic, financial, competitive, legislative, regulatory and other factors that are beyond our control. Certain of our long-term borrowings include provisions that require minimum levels of working capital and equity and impose limitations on additional debt. Our ability to satisfy these provisions can be affected by events beyond our control, such as the demand for and the fluctuating price of commodities. Noncompliance with these provisions could result in default and acceleration of long-term debt payments.
Further, the Financial Conduct Authority, the authority that regulates the London Interbank Offered Rate ("LIBOR"), announced it intends to stop compelling banks to submit rates for the calculation of LIBOR beginning in 2022 and ceasing all such rates by mid-2023. The Alternative Reference Rates Committee ("ARRC") has proposed that the Secured Overnight Financing Rate ("SOFR") is the rate that represents best practice as the alternative to USD-LIBOR for use in debt instruments, derivatives and other financial contracts that are currently indexed to USD-LIBOR. ARRC has proposed a paced market transition plan to SOFR from USD-LIBOR, and organizations are currently working on industry wide and company specific transition plans as they relate to derivatives, debt and cash markets exposed to USD-LIBOR. Although an alternative to LIBOR has been contemplated in the Company’s bank credit agreement, it is unclear as to the new method of calculating LIBOR that may evolve, and this new method could adversely affect the Company’s interest rates on its indebtedness.
We face increasing competition and pricing pressure from other companies in our industries. If we are unable to compete effectively with these companies, our sales and profit margins would decrease, and our earnings and cash flows would be adversely affected.
The markets for our products in each of our business segments are highly competitive. While we have substantial operations in certain of the regions where we operate, some of our competitors are significantly larger, compete in wider markets, have greater purchasing power, and have considerably larger financial resources. We also may enter into new markets where our brand is not recognized and in which we do not have an established customer base. Competitive pressures in all of our businesses could affect the price of, and customer demand for, our products, thereby negatively impacting our profit margins and resulting in a loss of market share.
Our Trade and Renewables businesses use derivative contracts to reduce volatility in the commodity markets. Non-performance by the counter-parties to those contracts could adversely affect our future results of operations and financial position.
A significant amount of purchases and sales within the Trade and Renewables segment are made through forward contracting, much of which includes a natural back-to-back hedging relationship.. In addition, the Company uses exchange traded and, to a lesser degree, over-the-counter contracts to further reduce volatility in changing commodity prices. A significant adverse change in commodity prices could cause a counter-party of one or more of our derivative contracts to not perform on its obligation.
The Andersons, Inc. | 2021 Form 10-K | 8
Adverse weather conditions, including as a result of climate change, may adversely affect the availability, quality and price of agricultural commodities and agricultural commodity products, as well as our operations and operating results.
Adverse weather conditions have historically caused volatility in the agricultural commodity industry and consequently in our operating results by causing crop failures or significantly reduced harvests, which may affect the supply and pricing of the agricultural commodities that we sell and use in our business, reduce demand for our fertilizer products and negatively affect the creditworthiness of agricultural producers who do business with us. A significant portion of the Company's assets are exposed to conditions in the Eastern Grain Belt. In this region, adverse weather during the fertilizer application, planting, and harvest seasons can have negative impacts on our Trade, Renewables and Plant Nutrient businesses. Higher basis levels or adverse crop conditions in the Eastern Grain Belt can increase the input costs or lower the market value of our products relative to other market participants that do not have the same geographic concentration.
Additionally, the potential physical impacts of climate change are uncertain and may vary by region. These potential effects could include changes in rainfall patterns, water shortages, changing sea levels, changing storm patterns and intensities, and changing temperature levels that could adversely impact our costs and business operations, the location, costs and competitiveness of agricultural commodity production and related storage and processing facilities and the supply and demand for agricultural commodities. These effects could be material to our results of operations, liquidity or capital resources.
General Risk Factors
We rely on a limited number of suppliers for certain of our raw materials and other products and the loss of one or several of these suppliers could increase our costs and have a material adverse effect on any one of our business segments.
We rely on a limited number of suppliers for certain of our raw materials and other products. If we were unable to obtain these raw materials and products from our current vendors, or if there were significant increases in our supplier's prices, it could significantly increase our costs and reduce our profit margins.
We are subject to global and regional economic downturns and related risks.
The level of demand for our products is affected by global and regional demographic and macroeconomic conditions, including population growth rates and changes in standards of living. A significant downturn in global economic growth, or recessionary conditions in major geographic regions, may lead to reduced demand for agricultural commodities and food products, which could adversely affect our business and results of operations. The pace of economic improvement is uncertain especially given the current global pandemic caused by COVID-19 and there can be no assurance that economic and/or political conditions will not continue to affect market and consumer confidence or deteriorate further in the near term.
The Company may not be able to effectively integrate businesses it acquires.
We continuously look for opportunities to enhance our existing businesses through strategic acquisitions. The process of integrating an acquired business into our existing business and operations may result in unforeseen operating difficulties and expenditures as well as require a significant amount of management resources. There is also the risk that our due diligence efforts may not uncover significant business flaws or hidden liabilities. In addition, we may not realize the anticipated benefits of an acquisition and they may not generate the anticipated financial results. Additional risks may include the inability to effectively integrate the operations, products, technologies and personnel of the acquired companies. The inability to maintain uniform standards, controls, procedures and policies would also negatively impact operations.
If our goodwill or amortizable intangible assets become impaired, then we could be required to record a significant charge to earnings.
GAAP requires us to test for goodwill impairment at least annually. In addition, we review our tangible and intangible assets for impairment when events or changes in circumstances indicate the carrying value may not be recoverable. Factors that may be considered a change in circumstances indicating that the carrying value of our goodwill or amortizable intangible assets may not be recoverable include prolonged declines in stock price, market capitalization or cash flows, and slower growth rates in our industry. Depending on the results of our review, we could be required to record a significant charge to earnings in our Consolidated Financial Statements during the period in which any impairment of our goodwill or amortizable intangible assets were determined, negatively impacting our results of operations.
The Andersons, Inc. | 2021 Form 10-K | 9
Our business involves considerable safety risks. Significant unexpected costs and liabilities would have an adverse effect on our profitability and overall financial position.
Due to the nature of some of the businesses in which we operate, we are exposed to significant operational hazards such as grain dust explosions, fires, malfunction of equipment, abnormal pressures, blowouts, pipeline and tank ruptures, chemical spills or run-off, transportation accidents and natural disasters. Some of these operational hazards may cause personal injury or loss of life, severe damage to or destruction of property and equipment or environmental damage and may result in suspension of operations and the imposition of civil or criminal penalties. If grain dust were to explode at one of our elevators, if an ethanol plant were to explode or catch fire, or if one of our pieces of equipment were to fail or malfunction due to an accident or improper maintenance, it could put our employees and others at serious risk.
The Company's information technology systems may impose limitations or failures, or may face external threats, which may affect the Company's ability to conduct its business.
The Company's information technology systems, some of which are dependent on services provided by third parties, provide critical data connectivity, information and services for internal and external users. These interactions include, but are not limited to, ordering and managing materials from suppliers, converting raw materials to finished products, inventory management, shipping products to customers, processing transactions, summarizing and reporting results of operations, complying with regulatory, legal or tax requirements, human resources and other processes necessary to manage the business. The Company has put in place business continuity plans for its critical systems. However, if the Company's information technology systems are damaged, or cease to function properly due to any number of causes, such as catastrophic events or power outages, and the Company's business continuity plans do not allow it to effectively recover on a timely basis, the Company may suffer interruptions in the ability to manage its operations, which may adversely impact the Company's operating results. Our security measures may also be breached due to employee error, malfeasance, or otherwise. In addition, although the systems continue to be refreshed periodically, portions of the infrastructure are outdated and may not be adequate to support new business processes, accounting for new transactions, or implementation of new accounting standards if requirements are complex or materially different than what is currently in place.
Additionally, outside parties may attempt to destroy critical information, or fraudulently induce employees, third-party service providers, or users to disclose sensitive information to gain access to our data or our users' data. As a response, the Company requires user names and passwords to access its information technology systems. The Company also uses encryption and authentication technologies designed to secure the transmission and storage of data and prevent access to Company and user data or accounts. The Company also conducts tests and assessments using independent third parties on a regular basis. As with all companies, these security measures are subject to third-party security breaches, employee error, malfeasance, faulty password management, or other irregularities. We cannot assure our ability to prevent, repel or mitigate the effects of such an attack by outside parties. The Company also relies on third parties to maintain and process certain information which could be subject to breach or unauthorized access to Company or employee information. Any such breach or unauthorized access could result in an inability to perform critical functions, significant legal and financial exposure, damage to our reputation, and a loss of confidence in the security of our services that could potentially have an adverse effect on our business.
Unauthorized disclosure of sensitive or confidential customer information could harm the Company's business and standing with our customers.
The protection of our customer, employee and Company data is critical to us. The Company relies on commercially available systems, software, tools and monitoring to provide security for processing, transmission and storage of confidential customer information, such as payment card and personal information. The Company also conducts annual tests and assessments using independent third parties. Despite the security measures the Company has in place, its facilities and systems, and those of its third-party service providers, may be vulnerable to security breaches, acts of vandalism, computer viruses, misplaced or lost data, programming or human errors, or other similar events. Any security breach involving the misappropriation, loss or other unauthorized disclosure of confidential information, whether by the Company or its vendors, could damage our reputation, expose us to risk of litigation and liability, disrupt our operations and harm our business.
The Andersons, Inc. | 2021 Form 10-K | 10
A change in tax laws or regulations of any federal, state or international jurisdiction in which we operate could increase our tax burden and otherwise adversely affect our financial position, results of operations, cash flows and liquidity.
We continue to assess the impact of various U.S. federal, state, local and international legislative proposals that could result in a material increase to our U.S. federal, state, local and/or international taxes. We cannot predict what impact, if any, changes in federal policy, including tax policies, will have on our industry or whether any specific legislation will be enacted or the terms of any such legislation. However, if such proposals were to be enacted, or if modifications were to be made to certain existing regulations, the consequences could have a material adverse impact on us, including increasing our tax burden, increasing our cost of tax compliance or otherwise adversely affecting our financial position, results of operations, cash flows and liquidity. Changes in applicable U.S. or foreign tax laws and regulations, or their interpretation and application, including the possibility of retroactive effect, could affect our tax expense and profitability. Such impact may also be affected positively or negatively by subsequent potential judicial interpretation or related regulation or legislation which cannot be predicted with certainty.
We are subject to various legal and regulatory proceedings, including litigation in the ordinary course of business, and uninsured judgments or a rise in insurance premiums may adversely impact our business, financial condition and results of operations.
In the ordinary course of business, we are subject to various legal and regulatory proceedings, which may include but are not limited to those involving antitrust, tax, environmental, intellectual property, data privacy and other matters, including general commercial litigation. Any claims raised in legal and regulatory proceedings, whether with or without merit, could be time consuming and expensive to defend and could divert management’s attention and resources. Additionally, the outcome of legal and regulatory proceedings may differ from our expectations because the outcomes of these proceedings are often difficult to predict reliably. Various factors and developments can lead to changes in our estimates of liabilities and related insurance receivables, where applicable, or may require us to make additional estimates, including new or modified estimates that may be appropriate due to a judicial ruling or judgment, a settlement, regulatory developments or changes in applicable law. A future adverse ruling, settlement or unfavorable development could result in charges that could have a material adverse effect on our results of operations in any particular period.
In accordance with customary practice, we maintain insurance against some, but not all, of these potential claims. In the future, we may not be able to maintain insurance at commercially acceptable premium levels. In addition, the levels of insurance we maintain may not be adequate to fully cover any and all losses or liabilities. If any significant judgment or claim is not fully insured or indemnified against, it could have a material adverse impact on our business, financial condition and results of operations.
Item 1B. Unresolved Staff Comments
The Company has no unresolved staff comments.
The Andersons, Inc. | 2021 Form 10-K | 11
Item 2. Properties
The Company's principal agriculture and other properties are described below. The Company believes that its properties are adequate for its business, well maintained and utilized, suitable for their intended uses and adequately insured.
| Trade | Renewables | Plant Nutrient | ||||||||||||||||||||||||
| (in thousands) | Grain Storage | Nameplate Capacity | Dry Fertilizer Storage | Liquid Fertilizer Storage | ||||||||||||||||||||||
| Location | (bushels) | (gallons) | (tons) | (tons) | ||||||||||||||||||||||
| Canada | 22,238 | — | — | — | ||||||||||||||||||||||
| Idaho | 16,655 | — | — | — | ||||||||||||||||||||||
| Indiana | 21,690 | 110,000 | 132 | 134 | ||||||||||||||||||||||
| Iowa | — | 55,000 | — | 66 | ||||||||||||||||||||||
| Kansas | — | 70,000 | — | — | ||||||||||||||||||||||
| Louisiana | 24,948 | — | — | — | ||||||||||||||||||||||
| Michigan | 27,814 | 130,000 | 67 | 46 | ||||||||||||||||||||||
| Nebraska | 18,414 | — | — | 45 | ||||||||||||||||||||||
| Ohio | 42,151 | 110,000 | 168 | 73 | ||||||||||||||||||||||
| Wisconsin | — | — | 27 | 78 | ||||||||||||||||||||||
| Other | 11,556 | — | 56 | 69 | ||||||||||||||||||||||
| 185,466 | 475,000 | 450 | 511 | |||||||||||||||||||||||
The Trade facilities are mostly concrete and steel tanks, with some flat storage buildings. The Company also owns grain inspection buildings and dryers, maintenance buildings and truck scales and dumps. Approximately 82% of the total storage capacity noted above, which includes temporary pile storage, is owned, while the remaining capacity is leased from third parties.
The Plant Nutrient properties consist mainly of fertilizer warehouse and formulation and packaging facilities for dry and liquid fertilizers. The Company owns substantially all of the facilities noted above.
Item 3. Legal Proceedings
The Company is currently subject to various claims and suits arising in the ordinary course of business, which include environmental issues, employment claims, contractual disputes, and defensive counterclaims. The Company accrues liabilities in which litigation losses are deemed probable and estimable. The Company believes it is unlikely that the results of its current legal proceedings, even if unfavorable, will result in material liabilities beyond what it currently has accrued. There can be no assurance, however, that any claims or suits arising in the future, whether taken individually or in the aggregate, will not have a material adverse effect on our financial condition or results of operations.
The Andersons, Inc. | 2021 Form 10-K | 12
Item 4. Mine Safety
We are committed to protecting the occupational health and well-being of each of our employees. Safety is one of our core values, and we strive to ensure that safe production is the first priority for all employees. Our internal objective is to achieve zero injuries and incidents across the Company by focusing on proactively identifying needed prevention activities, establishing standards and evaluating performance to mitigate any potential loss to people, equipment, production and the environment. We have implemented intensive employee training that is geared toward maintaining a high level of awareness and knowledge of safety and health issues in the work environment through the development and coordination of requisite information, skills and attitudes. We believe that through these policies, we have developed an effective safety management system.
Under the Dodd-Frank Act, each operator of a coal or other mine is required to include certain mine safety results within its periodic reports filed with the SEC. As required by the reporting requirements included in §1503(a) of the Dodd-Frank Act and Item 104 of Regulation S-K, the required mine safety results regarding certain mining safety and health matters for each of our mine locations that are covered under the scope of the Dodd-Frank Act are included in Exhibit 95.1 of Item 15. Exhibits and Financial Statement Schedules.
The Andersons, Inc. | 2021 Form 10-K | 13
Part II.
Item 5. Market for Registrant's Common Equity, Related Stockholder Matters and Issuer Purchases of Equity Securities
The Common Shares of The Andersons, Inc. trade on the Nasdaq Global Select Market under the symbol “ANDE”.
Shareholders
At February 11, 2022, there were 952 shareholders of record and approximately 19,068 shareholders for whom security firms acted as nominees.
Dividends
The Company has declared and paid consecutive quarterly dividends since its first year of trading in 1996. Dividends paid from January 2020 to January 2022 are as follows:
| Payment Date | Amount | |||||||
| 1/23/2020 | $0.175 | |||||||
| 4/22/2020 | $0.175 | |||||||
| 7/22/2020 | $0.175 | |||||||
| 10/22/2020 | $0.175 | |||||||
| 1/20/2021 | $0.175 | |||||||
| 4/21/2021 | $0.175 | |||||||
| 7/22/2021 | $0.175 | |||||||
| 10/22/2021 | $0.175 | |||||||
| 1/21/2022 | $0.180 | |||||||
While the Company's objective is to pay a quarterly cash dividend, dividends are subject to Board of Director approval.
Purchases of Equity Securities by the Issuer and Affiliated Purchasers
| Period | Total Number of Shares Purchased | Average Price Paid Per Share | Total Number of Shares Purchased as Part of Publicly Announced Plans or Programs | Approximate Dollar Value of Shares that May Yet Be Purchased Under the Plans or Programs (1) | ||||||||||||||||||||||
October 2021 | — | $ | — | — | $ | — | ||||||||||||||||||||
November 2021 | 698 | 35.04 | — | — | ||||||||||||||||||||||
December 2021 | — | — | — | — | ||||||||||||||||||||||
| Total | 698 | $ | 35.04 | — | $ | 100,000,000 | ||||||||||||||||||||
(1) As of August 20, 2021, the Company was authorized to purchase up to $100 million of the Company's common stock (the "Repurchase Plan") on or before August 20, 2024. As of December 31, 2021, none of the $100 million available to repurchase shares had been utilized. The Repurchase Plan does not obligate the Company to acquire any specific number of shares. Under the Repurchase Plan, shares may be repurchased in privately negotiated and/or open market transactions, including under plans complying with Rule 10b5-1 under the Exchange Act.
The Andersons, Inc. | 2021 Form 10-K | 14
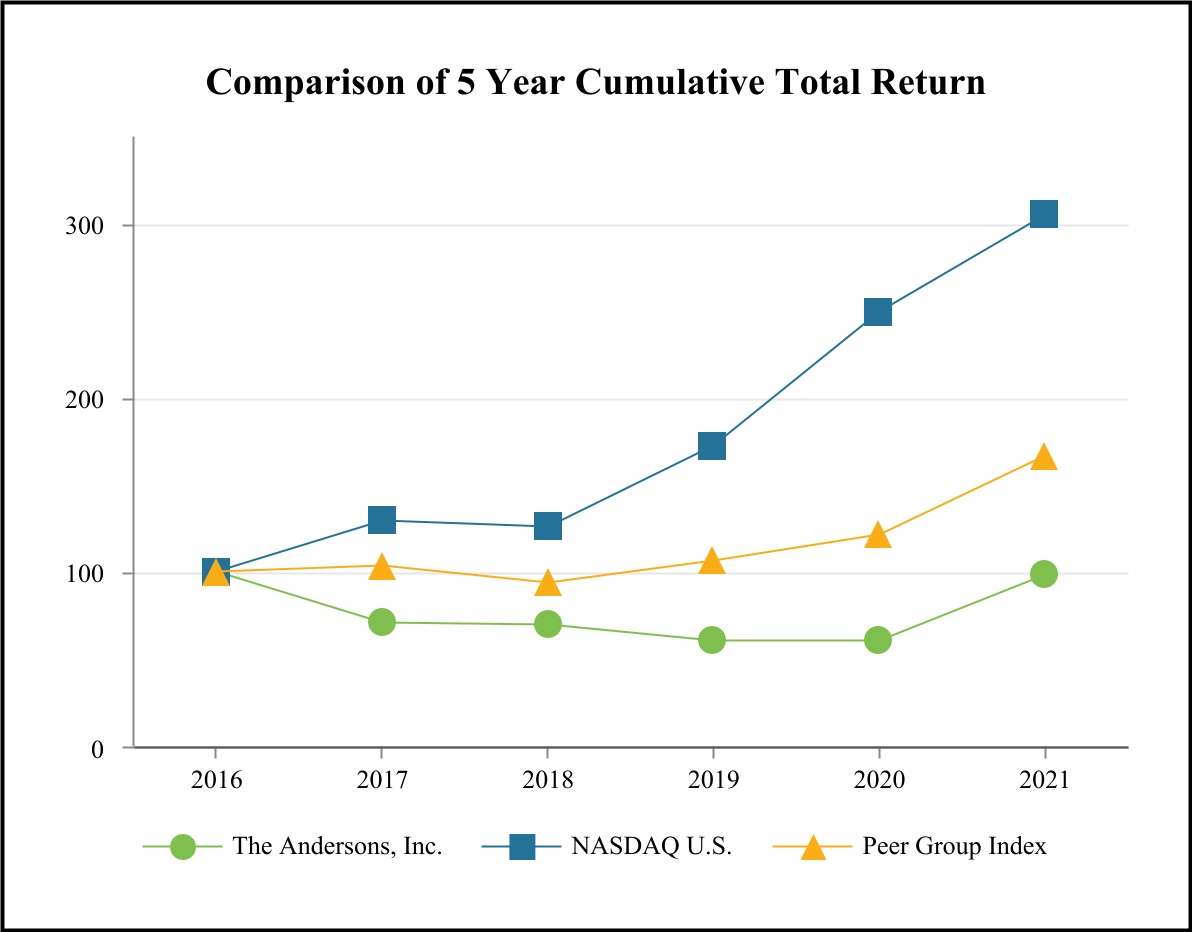
Performance Graph
The graph below compares the total shareholder return on the Company's Common Shares to the cumulative total return for the Nasdaq U.S. Index and a Peer Group Index. The indices reflect the year-end market value of an investment in the stock of each company in the index, including additional shares assumed to have been acquired with cash dividends, if any. The Peer Group Index, weighted for market capitalization, includes the following companies:
| Archer-Daniels-Midland Co. | Nutrien Ltd. | ||||
| GATX Corp. | The Greenbrier Companies, Inc. | ||||
| Green Plains, Inc. | The Scott's Miracle-Gro Company | ||||
| Ingredion Incorporated | |||||
The graph assumes a $100 investment in The Andersons, Inc. Common Shares on December 31, 2016 and also assumes investments of $100 in each of the Nasdaq U.S. and Peer Group indices, respectively, on December 31 of the first year of the graph. The value of these investments as of the following calendar year-ends is shown in the table below the graph.
| Base Period | Cumulative Returns | |||||||||||||||||||||||||||||||||||||
December 31, 2016 | 2017 | 2018 | 2019 | 2020 | 2021 | |||||||||||||||||||||||||||||||||
| The Andersons, Inc. | $ | 100.00 | $ | 71.03 | $ | 69.52 | $ | 60.34 | $ | 60.79 | $ | 98.20 | ||||||||||||||||||||||||||
| NASDAQ U.S. | 100.00 | 129.64 | 125.96 | 172.18 | 249.51 | 304.85 | ||||||||||||||||||||||||||||||||
| Peer Group Index | 100.00 | 103.71 | 93.75 | 106.39 | 121.41 | 166.65 | ||||||||||||||||||||||||||||||||
The Andersons, Inc. | 2021 Form 10-K | 15
Item 7. Management's Discussion and Analysis of Financial Condition and Results of Operations
Forward Looking Statements
The following “Management's Discussion and Analysis of Financial Condition and Results of Operations” contains forward-looking statements which relate to future events or future financial performance and involve known and unknown risks, uncertainties and other factors that may cause actual results, levels of activity, performance or achievements to be materially different from those expressed or implied by these forward-looking statements. Without limitation, these risks include economic, weather and regulatory conditions, competition, the COVID-19 pandemic and those listed under Item 1.A, "Risk Factors." The reader is urged to carefully consider these risks and factors. In some cases, the reader can identify forward-looking statements by terminology such as “may”, “anticipates”, “believes”, “estimates”, “predicts”, or the negative of these terms or other comparable terminology. These statements are only predictions. Actual events or results may differ materially. These forward-looking statements relate only to events as of the date on which the statements are made and the Company undertakes no obligation, other than any imposed by law, to publicly update or revise any forward-looking statements, whether as a result of new information, future events or otherwise. Although we believe that the expectations reflected in the forward-looking statements are reasonable, we cannot guarantee future results, levels of activity, performance or achievements.
Executive Overview
Our operations are organized, managed and classified into three reportable business segments: Trade, Renewables, and Plant Nutrient. Each of these segments is generally based on the nature of products and services offered and aligns with the management structure.
The agricultural commodity-based business is one in which changes in selling prices generally move in relationship to changes in purchase prices. Therefore, increases or decreases in prices of the commodities that the business deals in will have a relatively equal impact on sales and cost of sales and a much less significant impact on gross profit. As a result, changes in sales between periods may not necessarily be indicative of the overall performance of the business and more focus should be placed on changes in gross profit.
Recent Developments
The global emergence of COVID-19 continues to have a significant impact on the global economy. Government-mandated stay-at-home orders and other public health mandates and recommendations, as well as behavioral changes in response to the pandemic, have created labor shortages as labor force participation has remained below pre-pandemic levels. Additionally, supply constraints, low inventory levels and inflationary pressures from the pandemic have affected the industries in which the Company operates. The Company is continuing to actively manage its response to the COVID-19 pandemic, however, the future impacts of the ongoing pandemic on the Company’s business remain uncertain at this time.
The Company is a critical infrastructure industry as defined by The United States Department of Homeland Security, Cybersecurity and Infrastructure Agency. As COVID-19 continues to spread and certain regions experience accelerated spread or resurgences, the Company is currently conducting business as usual to the greatest extent possible in the current circumstances. The Company is taking a variety of measures to ensure the availability of its services throughout our network, promote the safety and security of our employees, and support the communities in which we operate. Certain modifications the Company has made in response to the COVID-19 pandemic include: implementing working at home protocols for all non-essential support staff; restricting employee business travel; strengthening clean workplace practices; reinforcing socially responsible sick leave recommendations; limiting visitor and third-party access to Company facilities; launching internal COVID-19 resources for employees; creating a pandemic response team comprised of employees and members of senior management; encouraging telephonic and video conference-based meetings along with other hygiene and social distancing practices recommended by health authorities including Health Canada, the U.S. Centers for Disease Control and Prevention, and the World Health Organization; and maintaining employment benefit coverage of employees through the pandemic. The Company is responding to this crisis through measures designed to protect our workforce and prevent disruptions to the Company's operations within the North American agricultural supply chain.
The Andersons, Inc. | 2021 Form 10-K | 16
The Company will continue to actively monitor the situation and may take further actions that could materially alter our business operations as may be required or recommended by federal, provincial, state or local authorities, or that management determines are in the best interests of our employees, customers, shareholders, partners, suppliers and other stakeholders.
Additional information concerning the impact COVID-19 may have to our future business and results of operations is provided in Part I, Item 1A. Risk Factors.
Trade
The Trade Group's performance reflects a substantial increase over the prior year as the Group was able to capitalize on commodity price volatility and market dislocations brought on by a demand-driven agricultural rally. During the course of the year, this demand driven rally created an inversion in the futures market for the majority of the agricultural commodities handled by the Group's asset business, resulting in strong elevation margins. Our recent growth from the Swiss trading and Southwest US feed merchandising businesses also contributed to the improved year-over-year results. Additionally, the food and specialty ingredients business netted higher results as the industry continues to recover from the COVID-19 impacts.
Total grain storage capacity, including temporary pile storage, was approximately 185.5 million bushels as of December 31, 2021 and 202.1 million bushels as of December 31, 2020. Commodity inventories on hand at December 31, 2021 were 187.0 million bushels, of which 3.0 million bushels were stored for others. This compares to 142.8 million bushels on hand at December 31, 2020, of which 3.0 million bushels were stored for others.
Looking forward, the Group is well-positioned to capture value and growth across the diverse portfolio of commodities in which it operates with expected ongoing strong fundamentals.
Renewables
The Renewables Group results attributable to the Company were significantly improved compared to the prior year with the largest increase from strong co-product margins as a result of increased high-protein and corn oil values. Further, the Group benefited as spot ethanol crush margins recovered due to gasoline demand returning to pre-pandemic levels coupled with overall low industry stocks. As we move into 2022, the Renewables Group anticipates strong trading opportunities due to robust co-product margins including high corn oil values from strong renewable diesel demand. While high corn prices may place pressure on crush margins, they also improve co-products sales as we are able to sell products such as DDGs and corn oil at higher values.
Volumes shipped for the years ended December 31, 2021 and December 31, 2020 were as follows:
| Twelve months ended December 31, | |||||||||||
| (in thousands) | 2021 | 2020 | |||||||||
| Ethanol (gallons shipped) | 726,512 | 592,738 | |||||||||
| E-85 (gallons shipped) | 41,572 | 27,321 | |||||||||
| Corn Oil (pounds shipped) | 286,082 | 117,563 | |||||||||
| DDG (tons shipped) | 2,040 | 1,850 | |||||||||
Plant Nutrient
The Plant Nutrient Group's results increased year-over-year due to well-positioned inventory and high fertilizer prices. Fertilizer prices have increased year-over-year due to tight global supplies and increased demand from improved grain prices and strong farmer income. The benefit from higher prices were partially offset by higher input costs and a tight labor market, specifically in the manufactured products business. Further, the Group continues to benefit from cost reduction initiatives and effective working capital management.
Total storage capacity at our ag supply chain and engineered granules locations was approximately 450 thousand tons for dry nutrients and approximately 511 thousand tons for liquid nutrients at December 31, 2021, which is similar to the prior year.
Looking forward, the Group expects continued opportunities in 2022 with high commodity prices, higher farmer income and well-positioned inventory.
The Andersons, Inc. | 2021 Form 10-K | 17
Tons of product sold for the years ended December 31, 2021 and December 31, 2020 were as follows:
| Twelve months ended December 31, | |||||||||||
| (in thousands) | 2021 | 2020 | |||||||||
| Ag Supply Chain | 1,621 | 1,585 | |||||||||
| Specialty Liquids | 410 | 351 | |||||||||
| Engineered Granules | 453 | 416 | |||||||||
| Total tons | 2,484 | 2,352 | |||||||||
In the table above, Ag Supply Chain represents facilities principally engaged in the wholesale distribution and retail sale and application of primary agricultural nutrients such as bulk nitrogen, phosphorus, and potassium. Specialty Liquid locations produce and sell a variety of low-salt liquid starter fertilizers, micronutrients for agricultural use, and specialty products for use in various industrial processes. Engineered Granules facilities primarily manufacture granulated dry products for use in specialty turf and agricultural applications.
Other
The Company's “Other” activities include corporate income and expense and cost for functions that provide support and services to the operating segments. The results include expenses and benefits not allocated to the operating segments and other elimination and consolidation adjustments.
Results for Fiscal 2020 compared to Fiscal 2019
For comparisons of the Company's consolidated and segment results of operations and consolidated cash flows for the fiscal years ended December 31, 2020 to December 31, 2019, refer to Part II, Item 7. Management’s Discussion and Analysis of Financial Condition and Results of Operations of the Annual Report on Form 10-K for the fiscal year ended December 31, 2020, filed with the SEC on February 25, 2021.
The Andersons, Inc. | 2021 Form 10-K | 18
Operating Results
The following discussion focuses on the operating results as shown in the Consolidated Statements of Operations with a separate discussion by segment. Additional segment information is included in Note 12 to the Company's Consolidated Financial Statements in Item 8.
Year ended December 31, 2021 | |||||||||||||||||||||||||||||
| (in thousands) | Trade | Renewables | Plant Nutrient | Other | Total | ||||||||||||||||||||||||
| Sales and merchandising revenues | $ | 9,304,357 | $ | 2,440,798 | $ | 866,895 | $ | — | $ | 12,612,050 | |||||||||||||||||||
| Cost of sales and merchandising revenues | 8,968,675 | 2,324,172 | 726,506 | — | 12,019,353 | ||||||||||||||||||||||||
| Gross profit | 335,682 | 116,626 | 140,389 | — | 592,697 | ||||||||||||||||||||||||
| Operating, administrative and general expenses | 251,605 | 31,019 | 95,547 | 45,581 | 423,752 | ||||||||||||||||||||||||
| Asset impairment | 8,321 | — | — | — | 8,321 | ||||||||||||||||||||||||
| Interest expense | 23,688 | 7,602 | 4,355 | 1,647 | 37,292 | ||||||||||||||||||||||||
| Equity in earnings of affiliates, net | 4,842 | — | — | — | 4,842 | ||||||||||||||||||||||||
| Other income (expense), net | 31,036 | 3,200 | 2,128 | (3,768) | 32,596 | ||||||||||||||||||||||||
| Income (loss) before income taxes from continuing operations | 87,946 | 81,205 | 42,615 | (50,996) | 160,770 | ||||||||||||||||||||||||
| Income (loss) before income taxes attributable to the noncontrolling interests | — | 31,880 | — | — | 31,880 | ||||||||||||||||||||||||
| Non-GAAP Income (loss) before income taxes attributable to the Company from continuing operations | $ | 87,946 | $ | 49,325 | $ | 42,615 | $ | (50,996) | $ | 128,890 | |||||||||||||||||||
Year ended December 31, 2020 | |||||||||||||||||||||||||||||
| (in thousands) | Trade | Renewables | Plant Nutrient | Other | Total | ||||||||||||||||||||||||
| Sales and merchandising revenues | $ | 6,141,402 | $ | 1,260,259 | $ | 662,959 | $ | — | $ | 8,064,620 | |||||||||||||||||||
| Cost of sales and merchandising revenues | 5,863,186 | 1,278,526 | 556,711 | — | 7,698,423 | ||||||||||||||||||||||||
| Gross profit (loss) | 278,216 | (18,267) | 106,248 | — | 366,197 | ||||||||||||||||||||||||
| Operating, administrative and general expenses | 244,147 | 24,405 | 85,702 | 23,441 | 377,695 | ||||||||||||||||||||||||
| Asset impairment | — | — | — | — | — | ||||||||||||||||||||||||
| Interest expense (income) | 21,974 | 7,461 | 5,805 | (1,456) | 33,784 | ||||||||||||||||||||||||
| Equity in earnings of affiliates, net | 638 | — | — | — | 638 | ||||||||||||||||||||||||
| Other income, net | 11,954 | 2,795 | 1,274 | 1,540 | 17,563 | ||||||||||||||||||||||||
| Income (loss) before income taxes from continuing operations | 24,687 | (47,338) | 16,015 | (20,445) | (27,081) | ||||||||||||||||||||||||
| Income (loss) before income taxes attributable to the noncontrolling interests | — | (21,925) | — | — | (21,925) | ||||||||||||||||||||||||
| Non-GAAP Income (loss) before income taxes attributable to the Company from continuing operations | $ | 24,687 | $ | (25,413) | $ | 16,015 | $ | (20,445) | $ | (5,156) | |||||||||||||||||||
The Company uses Non-GAAP Income (loss) before income taxes, attributable to the Company from continuing operations, a non-GAAP financial measure as defined by the Securities and Exchange Commission, to evaluate the Company’s financial performance. This performance measure is not defined by accounting principles generally accepted in the United States and should be considered in addition to, and not in lieu of, GAAP financial measures.
Management believes that Non-GAAP Income (loss) before income taxes, attributable to the Company from continuing operations is a useful measure of the Company’s performance because it provides investors additional information about the Company's operations allowing better evaluation of underlying business performance and better period-to-period comparability. This measure is not intended to replace or be an alternative to Income (loss) before income taxes from continuing operations, the most directly comparable amount reported under GAAP.
The Andersons, Inc. | 2021 Form 10-K | 19
Comparison of 2021 with 2020
Trade
Operating results for the Trade Group improved significantly as Income before taxes increased $63.3 million compared to prior year reported results. Sales and merchandising revenues increased $3,163.0 million and Cost of sales and merchandising revenues increased by $3,105.5 million resulting in an increase in gross profit of $57.5 million. Most of the increase to Sales and merchandising revenues and Cost of sales and merchandising revenues is the result of increased commodity prices as the Group benefited from the demand-driven agricultural rally. The net increase in gross profit was driven by improved merchandising results as geographic dislocations created volatility that allowed traders to identify arbitrage opportunities. Additionally, our traditional asset locations were significantly better than the prior year due to strong elevation margins in our draw areas.
Operating, administrative and general expenses increased $7.5 million compared to prior year results. Labor and benefits expenses were higher primarily due to higher incentive compensation costs from improved operating results. Despite the expense increase, the Company continues to benefit from cost saving initiatives, much of which is headcount reduction, both from acquisition integration and in response to the COVID-19 pandemic.
The Trade Group recorded asset impairment charges of $8.3 million in 2021. The current year asset impairment charges include a $7.7 million impairment of the Company's Frac Sand business following a fundamental shift in the operating environment and a $0.6 million charge related to a small food grade asset location in Texas that was shuttered. No such impairments occurred in the prior year.
Interest expense increased $1.7 million due to higher group borrowings on the Company's short-term line of credit compared to the prior year despite lower interest rates and decreased long-term borrowings.
Equity in earnings of affiliates were $4.8 million in the current year. This resulted in an increase of $4.2 million as compared to the prior year, most of which relates to our Canadian equity method investment.
Other income increased by $19.1 million from prior year largely driven by a gain on the sale of a grain asset location in the current year.
Renewables
The Renewables group had a strong year operationally as Income before income taxes attributable to the Company increased $74.7 million from the prior year. Sales and merchandising revenues increased $1,180.5 million and Cost of sales and merchandising revenues increased $1,045.6 million compared to the prior year. As a result, gross profit increased by $134.9 million. Most of the increase to Sales and merchandising revenues and Cost of sales and merchandising revenues is the result of increased commodity prices. The net increase to gross profit in the current period results reflect significantly improved crush margins, higher co-product sales from traditional and high-protein feed products and corn oil and strong merchandising revenues. The prior year results were significantly impacted by COVID-19, resulting in a lack of demand and included an $11.7 million inventory write down.
Operating, administrative and general expenses increased $6.6 million from the prior year due to higher labor and incentive compensation costs from increased production and improved operating results, respectively.
Plant Nutrient
The Plant Nutrient Group finished off a record year with income before taxes increasing $26.6 million compared to the prior year. Sales and merchandising revenues increased $203.9 million and cost of sales and merchandising revenues increased $169.8 million resulting in increased gross profit of $34.1 million from the prior year. Gross profit improved year over year due to increases in volumes and margins across the breadth of product lines and reflects higher demand, strong grower income and well-positioned inventory.
Operating, administrative and general expenses increased $9.8 million primarily due to increased incentive compensation costs from improved results, and other variable expenses supporting additional volume in the current year.
Interest expense decreased $1.5 million from lower interest rates in the current year.
The Andersons, Inc. | 2021 Form 10-K | 20
Other
Operating, administrative and general expenses increased $22.1 million from the same period last year. The increase in operating losses was primarily driven by increased variable incentive-based compensation in Operating, administrative and general expenses due to improved company-wide performance year over year, as well as approximately $5.0 million of stranded costs from the sale of our Rail Leasing business. The prior year results also include severance related expenses of $6.1 million associated with the departure of certain executive officers and key employees.
Income Taxes
In 2021, the Company recorded Income tax expense from continuing operations of $29.2 million. The Company's effective rate for 2021 was 18.2% on income before taxes from continuing operations of $160.8 million. The difference between the 18.2% effective tax rate and the U.S. federal statutory tax rate of 21% is primarily attributable to the tax benefit generated from Federal Research and Development Credits ("R&D Credits"), foreign tax credits and the effect of non-controlling interest offset by state and local income taxes, nondeductible compensation, and changes in unrecognized tax benefits.
In 2020, the Company recorded income tax benefit from continuing operations of $10.9 million. The Company’s effective rate for 2020 was 40.3% on losses before tax from continuing operations of $27.1 million. The difference between the 40.3% effective tax rate and the U.S. federal statutory tax rate of 21% is primarily attributable to the tax benefit generated from Coronavirus Aid, Relief, and Economic Security (“CARES”) Act and R&D Credits offset by the effect of non-controlling interest, derivative instruments and hedging activities, nondeductible compensation, and changes in unrecognized tax benefits.
Liquidity and Capital Resources
Working Capital
At December 31, 2021, the Company had working capital from continuing operations of $900.9 million, an increase of $423.5 million from the prior year. This increase was attributable to changes in the following components of current assets from continuing operations and current liabilities from continuing operations:
| (in thousands) | December 31, 2021 | December 31, 2020 | Variance | ||||||||||||||
| Current Assets from Continuing Operations: | |||||||||||||||||
| Cash and cash equivalents | $ | 216,444 | $ | 29,123 | $ | 187,321 | |||||||||||
| Accounts receivable, net | 835,180 | 641,326 | 193,854 | ||||||||||||||
| Inventories | 1,814,538 | 1,293,066 | 521,472 | ||||||||||||||
| Commodity derivative assets – current | 410,813 | 320,706 | 90,107 | ||||||||||||||
| Other current assets | 74,468 | 99,529 | (25,061) | ||||||||||||||
| Total current assets from continuing operations | 3,351,443 | 2,383,750 | 967,693 | ||||||||||||||
| Current Liabilities from Continuing Operations: | |||||||||||||||||
| Short-term debt | 501,792 | 403,703 | 98,089 | ||||||||||||||
| Trade and other payables | 1,199,324 | 954,809 | 244,515 | ||||||||||||||
| Customer prepayments and deferred revenue | 358,119 | 178,226 | 179,893 | ||||||||||||||
| Commodity derivative liabilities – current | 128,911 | 146,990 | (18,079) | ||||||||||||||
| Accrued expenses and other current liabilities | 230,148 | 153,311 | 76,837 | ||||||||||||||
| Current maturities of long-term debt | 32,256 | 69,366 | (37,110) | ||||||||||||||
| Total current liabilities from continuing operations | 2,450,550 | 1,906,405 | 544,145 | ||||||||||||||
| Working Capital from Continuing Operations | $ | 900,893 | $ | 477,345 | $ | 423,548 | |||||||||||
The Andersons, Inc. | 2021 Form 10-K | 21
Current assets from continuing operations increased $967.7 million in comparison to prior year. This increase was noted in all working capital asset accounts. The increases in accounts receivable, current commodity derivative assets and inventory balances can largely be attributable to the significant increases in the prices of agricultural commodities, including fertilizer, that the Company transacts in the ordinary course of business. The significant increase in cash and cash equivalents is largely due to the timing of accounts payable including expected deferred farmer payments. See also the discussion below on additional sources and uses of cash for an understanding of the increase in cash from prior year.
Current liabilities from continuing operations increased $544.1 million compared to the prior year primarily due to increases in short-term debt, customer prepayments and trade and other payables. The increase in short-term debt is the result of higher working capital needs and driven by significant increases in the prices of agricultural commodities. The increase in trade and other payables is also the result of increasing agricultural commodity prices. The increase in accrued expenses is largely driven by increased income tax payables as well as increased accrued variable based incentive compensation as a result of the significant improvement in operating results in the current year. The decrease in current maturities of long-term debt is due to the Company executing on its strategy to pay down long-term debt with proceeds received from the Rail Leasing sale.
Sources and Uses of Cash in 2021 compared to 2020
Operating Activities and Liquidity
Our operating activities used cash of $51.1 million in 2021 compared to cash used in operations of $74.4 million in 2020. The decrease in cash used was primarily due to increased operating results and offset by working capital accounts driven by higher commodity prices, as discussed above. However, when removing the impact from changes in working capital, cash provided by operating activities was much stronger than the prior period due to favorable operating results.
Net income taxes of $51.7 million and $2.4 million were paid in the years ended December 31, 2021 and 2020, respectively. The increase in the current year is driven by the taxable gain associated with the sale of our Rail Leasing business which was partially offset by refunds primarily related to the CARES Act.
Investing Activities
Investing activities provided $487.2 million in the current year compared to $86.8 million used in the prior year. The significant increase from the prior year was a result of proceeds received from the sale of the Rail Leasing business as well as a grain asset location within the Trade segment. Additional contributing factors to the increase were higher proceeds from sales of assets and railcars in the normal course of business, fewer purchased railcars and the continued strategic use of capital spending to enhance overall liquidity and cash management.
Capital expenditures of $71.8 million for 2021 on property, plant and equipment includes: Trade - $17.8 million; Renewables - $28.5 million; Plant Nutrient - $21.6 million; and $3.8 million in Other.
We expect to invest approximately $100 to $125 million in property, plant and equipment in 2022; approximately 60% of which will be to maintain current facilities.
Financing Arrangements
Net cash used in financing activities was $248.8 million in 2021, compared to $136.3 million provided in 2020. This change from the prior year was largely due to the Company's continued strategic effort to pay down long-term debt which was accelerated with proceeds from the Rail Leasing sale.
As of December 31, 2021, the Company was party to borrowing arrangements with a syndicate of banks that provide a total short and long-term borrowing capacity of $1,345.8 million. This amount includes $20.0 million for ELEMENT and $130.0 million for TAMH, all of which are non-recourse to the Company and classified as long-term. There was $1,019.9 million available for borrowing at December 31, 2021. Typically, our highest borrowing occurs in the late winter and early spring due to seasonal inventory requirements in our fertilizer and grain businesses, however, rising commodity prices during the fourth quarter required more borrowing than the prior year. At December 31, 2021, we had standby letters of credit outstanding of $3.9 million.
The Andersons, Inc. | 2021 Form 10-K | 22
The Company paid $23.7 million in dividends in 2021 compared to $23.0 million in 2020. The Company paid $0.175 per common share for the dividends paid in January, April, July and October 2021, and $0.175 per common share for the dividends paid in January, April, July and October 2020. On December 16, 2021, the Company declared a cash dividend of $0.180 per common share, payable on January 21, 2022 to shareholders of record on January 3, 2022.
Certain of our long-term borrowings include covenants that, among other things, impose minimum levels of equity and limitations on additional debt. We are in compliance with all such covenants as of December 31, 2021. In addition, certain of our long-term borrowings are collateralized by first mortgages on various facilities. Our non-recourse long-term debt is collateralized by ethanol plant assets.
Because we are a significant consumer of short-term debt in peak seasons and the majority of this is variable rate debt, increases in interest rates could have a significant impact on our profitability. In addition, periods of high commodity prices and/or unfavorable market conditions could require us to make additional margin deposits on our exchange traded futures contracts. Conversely, in periods of declining prices, we receive a return of cash.
We believe our sources of liquidity will be adequate to fund our operations, capital expenditures and payments of dividends in the foreseeable future.
Contractual Obligations
Long-term Debt
As of December 31, 2021, the Company had outstanding recourse and non-recourse long-term debt with both floating and fixed-rates of varying maturities for an aggregate principal amount outstanding of $560.2 million and $72.6 million, respectively. $24.7 million and $7.6 million of the outstanding principal of the recourse and non-recourse long-term debt is payable within 12 months. See Note 4 to the Consolidated Financial Statements for additional information.
Future interest payments associated with the recourse long-term debt total $92.5 million, with $14.4 million payable within 12 months. Future interest payments associated with the non-recourse long-term debt total $9.1 million, with $2.4 million payable within 12 months.
Operating Leases
The Company has lease arrangements for certain equipment and facilities, including grain facilities, fertilizer facilities and equipment. As of December 31, 2021, the Company had fixed operating lease payment obligations of $53.8 million, with $20.6 million payable within 12 months. See Note 13 to the Consolidated Financial Statements for additional information.
Commodity Purchase Obligations
The Company enters into forward purchase contracts of commodities with producers through the normal course of business. These forward purchase contracts are largely offset by forward sales contracts of commodities and the net of these forward contracts are offset by exchange-traded futures and options contracts or over-the-counter contracts. As of December 31, 2021, the Company had forward purchase contracts of $4,488.5 million, with $4,383.7 million payable within 12 months. See Note 5 to the Consolidated Financial Statements for additional information.
Retiree Healthcare & Pension Programs
The Company has both a postretirement health care benefit plan and a noncontributory defined benefit pension plan. The postretirement health care benefit plan covers substantially all of its full-time employees hired prior to January 1, 2003 and pension benefits were frozen at July 1, 2010. Obligations under the retiree healthcare programs are not fixed commitments and will vary depending on multiple factors, including the level of participant utilization and inflation. Our estimates of postretirement payments have considered recent payment trends and actuarial assumptions. As of December 31, 2021, the Company had outstanding benefit obligations of $24.8 million, with $1.6 million payable within 12 months.
The Andersons, Inc. | 2021 Form 10-K | 23
Off-Balance Sheet Transactions
Industrial Revenue Bonds
On December 3, 2019, the Company closed an industrial revenue bond transaction with the City of Colwich, Kansas (the "City") in order to receive a 20-year real property tax abatement on our renovated and newly-constructed ELEMENT ethanol facility. Pursuant to this transaction, the City issued a principal amount of $166.1 million of its industrial revenue bonds to the Company and then used the proceeds to purchase the land and facility from the Company. The City then leased the facilities back to the Company under a finance lease, the terms of which provide for the payment of basic rent in an amount sufficient to pay principal and interest on the bonds. Subsequent to the issuance of the bonds, the Company redeemed $165.1 million of the bonds, leaving $1.0 million issued and outstanding. Our obligation to pay rent under the lease is in the same amount and due on the same date as the City’s obligation to pay debt service on the bonds which we hold. The lease permits the Company to present the bonds at any time for cancellation, upon which our obligation to pay basic rent would be canceled. The bonds' maturity date is 2029, at which time the facilities will revert to us without costs. If we were to present the bonds for cancellation prior to maturity, a nominal fee would be incurred. We recorded the land and buildings as assets in property, plant, and equipment, net, on our Consolidated Balance Sheets. Because we own all outstanding bonds, have a legal right to set-off, and intend to set-off the corresponding lease and interest payment, we have netted the finance lease obligation with the bond asset. No amount for our obligation under the finance lease is reflected on our Consolidated Balance Sheets, nor do we reflect an amount for the corresponding industrial revenue bond asset (see Note 14 to the Consolidated Financial Statements).
Critical Accounting Estimates
The process of preparing financial statements requires management to make estimates and assumptions that affect the reported amounts of assets, liabilities, revenues and expenses, and the disclosure of contingent assets and liabilities. Management evaluates these estimates and assumptions on an ongoing basis. Estimates and assumptions are based on historical experience and management's knowledge and understanding of current facts and circumstances. Actual results, under conditions and circumstances different from those assumed, may change from these estimates.
Certain of our accounting estimates are considered critical, as they are important to the depiction of the Company's financial statements and/or require significant or complex judgment by management. There are other items within our financial statements that require estimation, however, they are not deemed critical as defined above. Note 1 to the Consolidated Financial Statements in Item 8 describes our significant accounting policies which should be read in conjunction with our critical accounting estimates.
Management believes that the accounting for readily marketable inventories and commodity derivative contracts, including adjustments for counterparty risk, uncertain tax positions, impairment of long-lived assets, goodwill and equity method investments and business combinations involve significant estimates and assumptions in the preparation of the Consolidated Financial Statements.
Readily Marketable Inventories and Derivative Contracts
Readily Marketable Inventories ("RMI") are stated at their net realizable value, which approximates fair value based on their commodity characteristics, widely available markets, and pricing mechanisms. The Company marks to market all forward purchase and sale contracts for commodities and ethanol, over-the-counter commodity and ethanol contracts, and exchange-traded futures and options contracts. The overall market for commodity inventories is very liquid and active; market value is determined by reference to prices for identical commodities on regulated commodity exchange (adjusted primarily for transportation costs); and the Company's RMI may be sold without significant additional processing. The Company uses forward purchase and sale contracts and both exchange traded and over-the-counter contracts (such as derivatives generally used by the International Swap Dealers Association). Management estimates fair value based on exchange-quoted prices, adjusted for differences in local markets, as well as counter-party non-performance risk in the case of forward and over-the-counter contracts. The amount of risk, and therefore the impact to the fair value of the contracts, varies by type of contract and type of counterparty. With the exception of specific customers thought to be at higher risk, the Company looks at the contracts in total, segregated by contract type, in its quarterly assessment of non-performance risk. For those customers that are thought to be at higher risk, the Company makes assumptions as to performance based on past history and facts about the current situation. Changes in fair value are recorded as a component of Cost of sales and merchandising revenues in the Statement of Operations.
The Andersons, Inc. | 2021 Form 10-K | 24
Impairment of Long-Lived Assets, Goodwill, and Equity Method Investments
The Company's business segments are each highly capital intensive and require significant investment. Long-lived assets are tested for impairment whenever events or changes in circumstances indicate that the carrying amount of the assets may not be recoverable. This is done by evaluating the recoverability based on undiscounted projected cash flows, excluding interest. If an asset group is considered impaired, the impairment loss to be recognized is measured as the amount by which the asset group's carrying amount exceeds its fair value.
Goodwill is tested for impairment at the reporting unit level, which is the operating segment or one level below the operating segment. The quantitative review for impairment takes into account our estimates of future cash flows, as well as a market based approach. Our estimates of future cash flows are based upon a number of assumptions including operating costs, life of the assets, potential disposition proceeds, budgets and long-range plans. The Market based approach compares internal results public companies that reflect economic conditions and risks that are similar to the Company to calculate an estimated enterprise value. These factors are discussed in more detail in Note 17, Goodwill and Intangible Assets, to the Consolidated Financial Statements.
Our annual goodwill impairment test is performed as of October 1 each year which is discussed in further detail in Note 17 to the Consolidated Financial Statements.
In addition, the Company holds investments in several companies that are accounted for using the equity method of accounting. The Company reviews its investments to determine whether there has been a decline in the estimated fair value of the investment that is below the Company's carrying value which is other than temporary. Other than consideration of past and current performance, these reviews take into account forecasted earnings which are based on management's estimates of future performance as well as the market or other income approach to estimate fair value.
Management considers several factors to be significant when estimating fair value including expected financial outlook of the business, changes in the Company's stock price, the impact of changing market conditions on financial performance and expected future cash flows, the geopolitical environment and other factors. Deterioration in any of these factors may result in a lower fair value assessment, which could lead to impairment charges in the future. Specifically, actual results may vary from the Company's forecasts and such variations may be material and unfavorable, thereby triggering the need for future impairment tests where the conclusions could result in non-cash impairment charges.
Business Combinations
Accounting for business combinations requires us to make significant estimates and assumptions, especially at the acquisition date with respect to tangible and intangible assets acquired and liabilities assumed and pre-acquisition contingencies. We use our best estimates and assumptions to accurately assign fair value to the tangible and intangible assets acquired and liabilities assumed at the acquisition date as well as the useful lives of those acquired intangible assets.
Examples of critical estimates in valuing certain of the intangible assets and goodwill we have acquired include but are not limited to the future expected cash flows of the acquired company's operations, the assumptions regarding the attrition rates associated with customer relationships and the period of time non-compete agreements will continue, and discount rates. Unanticipated events and circumstances may occur that may affect the accuracy or validity of such assumptions, estimates or actual results.
Uncertain Tax Positions
Conclusions on recognizing and measuring uncertain tax positions involve significant estimates and management judgment and include complex considerations of the Internal Revenue Code, related regulations, tax case laws, and prior year audit settlements. To account for uncertainty in income taxes, the Company evaluates the likelihood of a tax position based on the technical merits of the position, performs a subsequent measurement related to the maximum benefit and degree of likelihood, and determines the benefits to be recognized in the financial statements, if any.
The Andersons, Inc. | 2021 Form 10-K | 25
Item 7A. Quantitative and Qualitative Disclosures about Market Risk
The market risk inherent in the Company's market risk-sensitive instruments and positions is the potential loss arising from adverse changes in commodity prices foreign currency exchange rates and interest rates as discussed below.
Commodity Prices
The Company's daily net commodity position consists of inventories, related purchase and sale contracts, exchange-traded futures, and over-the-counter contracts. The fair value of the position is a summation of the fair values calculated for each commodity by valuing each net position at quoted futures market prices. The Company has established controls to manage and limit risk exposure, which consists of a daily review of position limits and effects of potential market price moves on those positions.
A sensitivity analysis has been prepared to estimate the Company's exposure to market risk of its net commodity futures position. Market risk is estimated as the potential loss in fair value resulting from a hypothetical 10% adverse change in quoted market prices. The result of this analysis, which may differ from actual results, is as follows:
| December 31, | |||||||||||
| (in thousands) | 2021 | 2020 | |||||||||
| Net long (short) commodity position | $ | 10,987 | $ | (14,093) | |||||||
| Market risk | 1,099 | 1,409 | |||||||||
Foreign Currency
The Company has subsidiaries located outside the United States where the local currency is the functional currency. To reduce the risks associated with foreign currency exchange rate fluctuations, the Company enters into currency exchange contracts to minimize its foreign currency position related to transactions denominated primarily in the euro, British pound, Mexican peso and Canadian dollar. These currencies represent the major functional or local currencies in which recurring business transactions occur. The Company does not use currency exchange contracts as hedges against amounts indefinitely invested in foreign subsidiaries and affiliates. The currency exchange contracts used are forward contracts, swaps with banks, exchange-traded futures contracts, and over-the-counter options. The changes in market value of such contracts have a high correlation to the price changes in the currency of the related transactions. The potential loss in fair value for such net currency position resulting from a hypothetical 10% adverse change in foreign currency exchange rates is not material.
Interest Rates
The fair value of the Company's long-term debt is estimated using quoted market prices or discounted future cash flows based on the Company's current incremental borrowing rates and credit ratings for similar types of borrowing arrangements. Market risk, which is estimated as the potential increase in fair value resulting from a hypothetical one-half percent decrease in interest rates, is summarized below:
| December 31, | |||||||||||
| (in thousands) | 2021 | 2020 | |||||||||
| Fair value of long-term debt, including current maturities | $ | 650,765 | $ | 989,140 | |||||||
| Fair value in excess of carrying value | 13,795 | 26,289 | |||||||||
| Market risk | 6,648 | 9,123 | |||||||||
Actual results may differ. The estimated fair value and market risk will vary from year to year depending on the total amount of long-term debt and the mix of variable and fixed rate debt.
Additionally, the Company may enter into interest rate swaps from time to time to manage our mix of fixed and variable interest rate debt effectively which may decrease market risk noted above. See Note 5 to the Consolidated Financial Statements for further discussion on the impact of these hedging instruments.
The Andersons, Inc. | 2021 Form 10-K | 26
Item 8. Financial Statements and Supplementary Data
The Andersons, Inc.
Index to Financial Statements
| Page No. | |||||
Report of the Independent Registered Public Accounting Firm (PCAOB ID No. | |||||
The Andersons, Inc. | 2021 Form 10-K | 27
Report of Independent Registered Public Accounting Firm
To the shareholders and the Board of Directors of The Andersons, Inc.
Opinion on the Financial Statements
We have audited the accompanying consolidated balance sheets of The Andersons, Inc. and subsidiaries (the “Company”) as of December 31, 2021 and 2020, the related consolidated statements of operations, comprehensive income, equity, and cash flows, for each of the three years in the period ended December 31, 2021, and the related notes and the schedule listed in the Index at Item 15 (collectively referred to as the “financial statements”). In our opinion, the financial statements present fairly, in all material respects, the financial position of the Company as of December 31, 2021 and 2020, and the results of its operations and its cash flows for each of the three years in the period ended December 31, 2021, in conformity with accounting principles generally accepted in the United States of America.
We have also audited, in accordance with the standards of the Public Company Accounting Oversight Board (United States) (PCAOB), the Company’s internal control over financial reporting as of December 31, 2021, based on criteria established in Internal Control—Integrated Framework (2013) issued by the Committee of Sponsoring Organizations of the Treadway Commission and our report dated February 24, 2022, expressed an unqualified opinion on the Company’s internal control over financial reporting.
Basis for Opinion
These financial statements are the responsibility of the Company’s management. Our responsibility is to express an opinion on the Company’s financial statements based on our audits. We are a public accounting firm registered with the PCAOB and are required to be independent with respect to the Company in accordance with the US federal securities laws and the applicable rules and regulations of the Securities and Exchange Commission and the PCAOB.
We conducted our audits in accordance with the standards of the PCAOB. Those standards require that we plan and perform the audit to obtain reasonable assurance about whether the financial statements are free of material misstatement, whether due to error or fraud. Our audits included performing procedures to assess the risks of material misstatement of the financial statements, whether due to error or fraud, and performing procedures that respond to those risks. Such procedures included examining, on a test basis, evidence regarding the amounts and disclosures in the financial statements. Our audits also included evaluating the accounting principles used and significant estimates made by management, as well as evaluating the overall presentation of the financial statements. We believe that our audits provide a reasonable basis for our opinion.
Critical Audit Matter
The critical audit matter communicated below is a matter arising from the current-period audit of the financial statements that was communicated or required to be communicated to the audit committee and that (1) relates to accounts or disclosures that are material to the financial statements and (2) involved our especially challenging, subjective, or complex judgments. The communication of critical audit matters does not alter in any way our opinion on the financial statements, taken as a whole, and we are not, by communicating the critical audit matter below, providing a separate opinion on the critical audit matter or on the accounts or disclosures to which it relates.
Goodwill—GSM and FSI Reporting Units—Refer to Notes 1 and 17 to the Consolidated Financial Statements
Critical Audit Matter Description
Goodwill is tested for impairment annually as of October 1, or more frequently if impairment indicators arise. The Company uses a one-step quantitative approach that compares the business enterprise value (BEV) of each reporting unit with its carrying value. The BEV was computed based on both an income approach (discounted cash flows) and a market approach. The income approach uses a reporting unit’s estimated future cash flows, discounted at the weighted-average cost of capital of a hypothetical third-party buyer. The market approach estimates fair value by applying cash flow multiples to the reporting unit’s operating performance. The multiples are derived from comparable publicly traded companies with similar operating and investment characteristics to the reporting unit.
The Andersons, Inc. | 2021 Form 10-K | 28
The consolidated goodwill balance was $129.3 million as of December 31, 2021, of which $78.5 million and $41.3 million was allocated to the Grain Storage and Merchandising (GSM) and Food and Specialty Ingredients (FSI) reporting units, respectively. The BEV of the GSM and FSI reporting units exceeded its carrying values by 26% and 24%, respectively, as of October 1, 2021, and, therefore, no impairment was recognized. The BEV for the GSM and FSI reporting units are sensitive to changes in the weighted-average cost of capital. Given the significant judgments made by management to estimate the BEV of the GSM and FSI reporting units, performing audit procedures to evaluate the reasonableness of management’s estimates and assumptions related to selection of the weighted-average cost of capital as of October 1, 2021, required a high degree of auditor judgment and an increased extent of effort, including the need to involve our fair value specialists.
How the Critical Audit Matter Was Addressed in the Audit
Our audit procedures related to the selection of the weighted-average cost of capital used by management to estimate the fair values of the GSM and FSI reporting units included the following, among others:
•We tested the effectiveness of internal control over management’s selection of the valuation assumptions used to determine each BEV, including the weighted-average cost of capital.
•With the assistance of our fair value specialists, we evaluated the reasonableness of the (1) valuation methodology and (2) weighted-average cost of capital by:
◦Testing the source information underlying the determination of the weighted-average cost of capital and the mathematical accuracy of the calculation
◦Evaluating the underlying factors that led to management's determination of the company specific risk premium
◦Developing a range of independent estimates and comparing those to the weighted-average cost of capital selected by management
/s/ Deloitte & Touche LLP
February 24, 2022
We have served as the Company’s auditor since 2015.
The Andersons, Inc. | 2021 Form 10-K | 29
The Andersons, Inc.
Consolidated Statements of Operations
(In thousands, except per share data)
| Year ended December 31, | |||||||||||||||||
| 2021 | 2020 | 2019 | |||||||||||||||
| Sales and merchandising revenues | $ | $ | $ | ||||||||||||||
| Cost of sales and merchandising revenues | |||||||||||||||||
| Gross profit | |||||||||||||||||
| Operating, administrative and general expenses | |||||||||||||||||
| Asset impairment | |||||||||||||||||
| Interest expense, net | |||||||||||||||||
| Other income: | |||||||||||||||||
| Equity in earnings (losses) of affiliates, net | ( | ||||||||||||||||
| Gain from remeasurement of equity method investments, net | |||||||||||||||||
| Other income, net | |||||||||||||||||
| Income (loss) before income taxes from continuing operations | ( | ||||||||||||||||
| Income tax provision (benefit) from continuing operations | ( | ||||||||||||||||
| Net income (loss) from continuing operations | ( | ||||||||||||||||
| Income from discontinued operations, net of income taxes | |||||||||||||||||
| Net income (loss) | ( | ||||||||||||||||
| Net income (loss) attributable to the noncontrolling interest | ( | ( | |||||||||||||||
| Net income attributable to The Andersons, Inc. | $ | $ | $ | ||||||||||||||
| Average number of shares outstanding – basic | |||||||||||||||||
| Average number of shares outstanding – diluted | |||||||||||||||||
| Earnings per share attributable to The Andersons, Inc. common shareholders: | |||||||||||||||||
| Basic earnings: | |||||||||||||||||
| Continuing operations | $ | $ | $ | ||||||||||||||
| Discontinued operations | |||||||||||||||||
| $ | $ | $ | |||||||||||||||
| Diluted earnings: | |||||||||||||||||
| Continuing operations | $ | $ | $ | ||||||||||||||
| Discontinued operations | |||||||||||||||||
| $ | $ | $ | |||||||||||||||
The Notes to Consolidated Financial Statements are an integral part of these statements.
The Andersons, Inc. | 2021 Form 10-K | 30
The Andersons, Inc.
Consolidated Statements of Comprehensive Income
(In thousands)
| Year ended December 31, | |||||||||||||||||
| 2021 | 2020 | 2019 | |||||||||||||||
| Net income (loss) | $ | $ | ( | $ | |||||||||||||
| Other comprehensive income (loss), net of tax: | |||||||||||||||||
| Change in unrecognized actuarial gain and prior service cost | ( | ( | |||||||||||||||
| Foreign currency translation adjustments | ( | ||||||||||||||||
| Cash flow hedge activity | ( | ( | |||||||||||||||
| Other comprehensive income (loss) | ( | ( | |||||||||||||||
| Comprehensive income (loss) | ( | ||||||||||||||||
| Comprehensive income (loss) attributable to the noncontrolling interests | ( | ( | |||||||||||||||
| Comprehensive income attributable to The Andersons, Inc. | $ | $ | $ | ||||||||||||||
The Notes to Consolidated Financial Statements are an integral part of these statements.
The Andersons, Inc. | 2021 Form 10-K | 31
The Andersons, Inc.
Consolidated Balance Sheets
(In thousands)
| December 31, 2021 | December 31, 2020 | ||||||||||
| Assets | |||||||||||
| Current assets: | |||||||||||
| Cash and cash equivalents | $ | $ | |||||||||
Accounts receivable, less allowance for doubtful accounts of $ | |||||||||||
| Other current assets | |||||||||||
| Total current assets | |||||||||||
| Other assets: | |||||||||||
| Goodwill | |||||||||||
| Other intangible assets, net | |||||||||||
| Right of use assets, net | |||||||||||
| Other assets | |||||||||||
| Total other assets | |||||||||||
| Total assets | $ | $ | |||||||||
| Liabilities and equity | |||||||||||
| Current liabilities: | |||||||||||
| $ | $ | ||||||||||
| Trade and other payables | |||||||||||
| Customer prepayments and deferred revenue | |||||||||||
| Accrued expenses and other current liabilities | |||||||||||
| Total current liabilities | |||||||||||
| Long-term lease liabilities | |||||||||||
| Other long-term liabilities | |||||||||||
| Total liabilities | |||||||||||
| Shareholders’ equity: | |||||||||||
Common shares, without par value ( | |||||||||||
Preferred shares, without par value ( | |||||||||||
| Additional paid-in-capital | |||||||||||
Treasury shares, at cost ( | ( | ( | |||||||||
| Accumulated other comprehensive income (loss) | ( | ||||||||||
| Retained earnings | |||||||||||
| Total shareholders’ equity of The Andersons, Inc. | |||||||||||
| Noncontrolling interests | |||||||||||
| Total equity | |||||||||||
| Total liabilities and equity | $ | $ | |||||||||
The Notes to Consolidated Financial Statements are an integral part of these statements.
The Andersons, Inc. | 2021 Form 10-K | 32
The Andersons, Inc.
Consolidated Statements of Cash Flows
(In thousands)
| Year ended December 31, | |||||||||||||||||
| 2021 | 2020 | 2019 | |||||||||||||||
| Operating Activities | |||||||||||||||||
| Net income (loss) from continuing operations | $ | $ | ( | $ | |||||||||||||
| Income from discontinued operations, net of income taxes | |||||||||||||||||
| Net income (loss) | ( | ||||||||||||||||
| Adjustments to reconcile net income (loss) to cash provided by (used in) operating activities: | |||||||||||||||||
| Depreciation and amortization | |||||||||||||||||
| Bad debt expense, net | |||||||||||||||||
| Equity in (earnings) losses of affiliates, net of dividends | ( | ( | |||||||||||||||
| Gain on sales of assets, net | ( | ( | ( | ||||||||||||||
| Stock-based compensation expense | |||||||||||||||||
| Deferred federal income tax | ( | ||||||||||||||||
| Inventory write down | |||||||||||||||||
| Gain on sale of business from continuing operations | ( | ( | |||||||||||||||
| Loss on sale of business from discontinued operations | |||||||||||||||||
| Asset impairment | |||||||||||||||||
| Gain from remeasurement of equity method investments, net | ( | ||||||||||||||||
| Other | |||||||||||||||||
| Changes in operating assets and liabilities: | |||||||||||||||||
| Accounts receivable | ( | ( | |||||||||||||||
| Inventories | ( | ( | ( | ||||||||||||||
| Commodity derivatives | ( | ( | |||||||||||||||
| Other current and non-current assets | ( | ( | |||||||||||||||
| Payables and other current and non-current liabilities | |||||||||||||||||
| Net cash (used in) provided by operating activities | ( | ( | |||||||||||||||
| Investing Activities | |||||||||||||||||
| Acquisition of businesses, net of cash acquired | ( | ( | |||||||||||||||
| Purchases of property, plant and equipment and capitalized software | ( | ( | ( | ||||||||||||||
| Proceeds from sale of assets | |||||||||||||||||
| Purchase of investments | ( | ( | ( | ||||||||||||||
| Proceeds from sale of business from continuing operations | |||||||||||||||||
| Proceeds from sale of business from discontinued operations | |||||||||||||||||
| Purchases of Rail assets | ( | ( | ( | ||||||||||||||
| Proceeds from sale of Rail assets | |||||||||||||||||
| Other | |||||||||||||||||
| Net cash provided by (used in) investing activities | ( | ( | |||||||||||||||
| Financing Activities | |||||||||||||||||
| Net receipts (payments) under short-term lines of credit | ( | ( | |||||||||||||||
| Proceeds from issuance of short-term debt | |||||||||||||||||
| Payments of short-term debt | ( | ||||||||||||||||
| Proceeds from issuance of long-term debt | |||||||||||||||||
| Payments of long-term debt | ( | ( | ( | ||||||||||||||
| Contributions from noncontrolling interest owner | |||||||||||||||||
| Distributions to noncontrolling interest owner | ( | ( | |||||||||||||||
| Payments of debt issuance costs | ( | ( | ( | ||||||||||||||
| Dividends paid | ( | ( | ( | ||||||||||||||
| Proceeds from exercises of stock options | |||||||||||||||||
| Other | ( | ( | |||||||||||||||
| Net cash (used in) provided by financing activities | ( | ||||||||||||||||
| Effect of exchange rates on cash, cash equivalents and restricted cash | ( | ( | |||||||||||||||
| Increase (decrease) in cash, cash equivalents and restricted cash | ( | ||||||||||||||||
| Cash, cash equivalents and restricted cash at beginning of year | |||||||||||||||||
| Cash, cash equivalents and restricted cash at end of year | $ | $ | $ | ||||||||||||||
The Notes to Consolidated Financial Statements are an integral part of these statements.
The Andersons, Inc. | 2021 Form 10-K | 33
The Andersons, Inc.
Consolidated Statements of Equity
(In thousands, except per share data)
| The Andersons, Inc. Shareholders’ Equity | |||||||||||||||||||||||||||||||||||||||||
| Common Shares | Additional Paid-in Capital | Treasury Shares | Accumulated Other Comprehensive Income (Loss) | Retained Earnings | Noncontrolling Interests | Total | |||||||||||||||||||||||||||||||||||
| Balance at January 1, 2019 | $ | $ | $ | ( | $ | ( | $ | $ | $ | ||||||||||||||||||||||||||||||||
| Net income (loss) | ( | ||||||||||||||||||||||||||||||||||||||||
| Other comprehensive loss | ( | ( | |||||||||||||||||||||||||||||||||||||||
| Amounts reclassified from Accumulated other comprehensive income (loss) | |||||||||||||||||||||||||||||||||||||||||
| Cash received from noncontrolling interest, net | |||||||||||||||||||||||||||||||||||||||||
| Noncontrolling interests recognized in connection with business combination | |||||||||||||||||||||||||||||||||||||||||
Cumulative adjustment for adoption of leasing standard, net of income tax of $( | ( | ( | |||||||||||||||||||||||||||||||||||||||
Stock awards, stock option exercises and other shares issued to employees and directors, net of income tax of $ | ( | ||||||||||||||||||||||||||||||||||||||||
Dividends declared ($ | ( | ( | |||||||||||||||||||||||||||||||||||||||
| Shares issued for acquisition | |||||||||||||||||||||||||||||||||||||||||
| Restricted share award dividend equivalents | ( | ||||||||||||||||||||||||||||||||||||||||
| Balance at December 31, 2019 | $ | $ | $ | ( | $ | ( | $ | $ | $ | ||||||||||||||||||||||||||||||||
| Net income (loss) | ( | ( | |||||||||||||||||||||||||||||||||||||||
| Other comprehensive loss | ( | ( | |||||||||||||||||||||||||||||||||||||||
| Amounts reclassified from Accumulated other comprehensive income (loss) | |||||||||||||||||||||||||||||||||||||||||
| Contributions from noncontrolling interests | |||||||||||||||||||||||||||||||||||||||||
| Distributions to noncontrolling interests | ( | ( | |||||||||||||||||||||||||||||||||||||||
| Noncontrolling interests recognized in connection with business combination | ( | ( | |||||||||||||||||||||||||||||||||||||||
Stock awards, stock option exercises and other shares issued to employees and directors, net of income tax of $ | ( | ||||||||||||||||||||||||||||||||||||||||
Dividends declared ($ | ( | ( | |||||||||||||||||||||||||||||||||||||||
| Restricted share award dividend equivalents | ( | ||||||||||||||||||||||||||||||||||||||||
Balance at December 31, 2020 | $ | $ | $ | ( | $ | ( | $ | $ | $ | ||||||||||||||||||||||||||||||||
| Net Income (loss) | |||||||||||||||||||||||||||||||||||||||||
| Other comprehensive income | |||||||||||||||||||||||||||||||||||||||||
| Amounts reclassified from Accumulated other comprehensive income (loss) | |||||||||||||||||||||||||||||||||||||||||
| Contributions from noncontrolling interests | |||||||||||||||||||||||||||||||||||||||||
| Distributions to noncontrolling interests | ( | ( | |||||||||||||||||||||||||||||||||||||||
Stock awards, stock option exercises and other shares issued to employees and directors, net of income tax of $ | ( | ||||||||||||||||||||||||||||||||||||||||
Dividends declared ($ | ( | ( | |||||||||||||||||||||||||||||||||||||||
| Restricted share award dividend equivalents | ( | ||||||||||||||||||||||||||||||||||||||||
Balance at December 31, 2021 | $ | $ | $ | ( | $ | $ | $ | $ | |||||||||||||||||||||||||||||||||
The Notes to Consolidated Financial Statements are an integral part of these statements.
The Andersons, Inc. | 2021 Form 10-K | 34
The Andersons, Inc.
Notes to Consolidated Financial Statements
1. Summary of Significant Accounting Policies
Basis of Consolidation
These Consolidated Financial Statements include the accounts of The Andersons, Inc. and its wholly owned and controlled subsidiaries (the “Company”). All material intercompany accounts and transactions are eliminated in consolidation. Investments in unconsolidated entities in which the Company has significant influence, but not control, are accounted for using the equity method of accounting.
During the third quarter of 2021, substantially all of the assets and liabilities of the Rail business were classified as held-for-sale in the accompanying Condensed Consolidated Balance Sheets. As discussed further in Note 16, the Company executed a definitive agreement to sell the Rail Leasing business. In conjunction with the sale of the Rail Leasing business, the Company announced its intent to divest the remainder of the Rail business. The majority of the remaining Rail business remaining on the balance sheet as of December 31, 2021 is related to the Rail Repair business.
These transactions effectively constitute the entirety of what has historically been included in the Rail reportable segment. Therefore, the associated operating results, net of income tax, have been classified as discontinued operations in the accompanying consolidated statements of operations for all periods presented. Throughout this Annual Report on Form 10-K, with the exception of the statements of cash flows and unless otherwise indicated, amounts and activity are presented on a continuing operations basis.
Certain reclassifications have been made to the prior year financial statements to conform to current year classifications. The reclassification relates to the Consolidated Balance Sheet presentation of assets and liabilities as held for sale and Consolidated Statement of Operations presentation of results classified as discontinued operations in relation to the Rail business transactions noted above.
At inception of joint venture transactions, we identify entities for which control is achieved through means other than voting rights (“variable interest entities” or “VIEs”) and determine which business enterprise is the primary beneficiary of its operations. A VIE is broadly defined as an entity where either (i) the equity investors as a group, if any, do not have a controlling financial interest, or (ii) the equity investment at risk is insufficient to finance that entity’s activities without additional subordinated financial support. The Company consolidates investments in VIEs when the Company is determined to be the primary beneficiary. This evaluation is based on an enterprise’s ability to direct and influence the activities of a VIE that most significantly impact that entity’s economic performance.
The Company evaluates its interests in VIEs on an ongoing basis and consolidates any VIE in which it has a controlling financial interest and is deemed to be the primary beneficiary. A controlling financial interest has both of the following characteristics: (i) the power to direct the activities of the VIE that most significantly impact its economic performance; and (ii) the obligation to absorb losses of the VIE that could potentially be significant to it or the right to receive benefits from the VIE that could be significant to the VIE.
On October 1, 2019, the Company entered into an agreement with Marathon Petroleum Corporation to merge The Andersons Albion Ethanol LLC (“TAAE”), The Andersons Clymers Ethanol LLC (“TACE”), The Andersons Marathon Ethanol LLC (“TAME”) and the Company's wholly-owned subsidiary, The Andersons Denison Ethanol LLC (“TADE”), into a new legal entity, The Andersons Marathon Holdings LLC ("TAMH"). The Company evaluated its interest in TAMH and determined that TAMH is a VIE and that the Company is the primary beneficiary of TAMH. This is due to the fact that the Company has both the power to direct the activities that most significantly impact TAMH and the obligation to absorb losses or the right to receive benefits from TAMH. Therefore, the Company consolidated TAMH in its financial statements.
On March 2, 2018, the Company invested in ELEMENT. The Company owns 51 % of ELEMENT and ICM, Inc. owns the remaining 49 % interest. As part of the Company’s investment into ELEMENT, the Company and ICM, Inc. entered into a number of agreements. Most notably, the Company will manage the facility under a management contract, provide corn origination, ethanol marketing and risk management services. The Company evaluated its interest in ELEMENT and determined that ELEMENT is a VIE and that the Company is the primary beneficiary of ELEMENT. This is due to the fact that the Company has both the power to direct the activities that most significantly impact ELEMENT and the obligation to absorb losses or the right to receive benefits from ELEMENT. Therefore, the Company consolidates ELEMENT.
The Andersons, Inc. | 2021 Form 10-K | 35
Cash, Cash Equivalents and Restricted Cash
Cash and cash equivalents include cash and short-term investments with an initial maturity of three months or less. The carrying values of these assets approximate their fair values. The Company had restricted cash of $8.7 million as of December 31, 2019. The restricted cash balance was a result of a royalty claim assumed in the TAMH merger and included in the Consolidated Financial Statements of the Company. In 2020, this restricted cash was subsequently released, and the Company does not have restricted cash as of December 31, 2020 or 2021.
Commodity Derivatives and Inventories
The Company's operating results can be affected by changes to commodity prices. The Trade and Renewables businesses have established “unhedged” position limits (the amount of a commodity, either owned or contracted for, that does not have an offsetting derivative contract to mitigate the price risk associated with those contracts and inventory). To reduce the exposure to market price risk on commodities owned and forward commodity and ethanol purchase and sale contracts, the Company enters into exchange traded commodity futures and options contracts and over-the-counter forward and option contracts with various counterparties. The forward purchase and sale contracts are for physical delivery of the commodity in a future period. Contracts to purchase commodities from producers generally relate to the current or future crop years for delivery periods quoted by regulated commodity exchanges. Contracts for the sale of commodities to processors or other commercial consumers generally do not extend beyond one year .
The Company accounts for its commodity derivatives at fair value. The estimated fair value of the commodity derivative contracts that require the receipt or posting of cash collateral is recorded on a net basis (offset against cash collateral posted or received, also known as margin deposits) within commodity derivative assets or liabilities. Management determines fair value based on exchange-quoted prices and in the case of its forward purchase and sale contracts, fair value is adjusted for differences in local markets and non-performance risk. While the Company considers certain of its commodity contracts to be effective economic hedges, the Company does not designate or account for its commodity contracts as hedges.
Realized and unrealized gains and losses in the value of commodity contracts (whether due to changes in commodity prices, changes in performance or credit risk, or due to sale, maturity or extinguishment of the commodity contract) and commodity inventories are included in Cost of sales and merchandising revenues in the Consolidated Statements of Operations. Additional information about the fair value of the Company's commodity derivatives is presented in Notes 5 and 10 to the Consolidated Financial Statements.
Readily Marketable Inventories, which are grain and other agricultural commodities, may be acquired under provisionally priced contracts, are stated at their net realizable value, which approximates estimated selling prices in the ordinary course of business, less reasonably predictable costs of completion, disposal and transportation.
All other inventories are stated at the lower of cost or net realizable value. Cost is determined by the average cost method. Additional information about inventories is presented in Note 2 to the Consolidated Financial Statements.
The Andersons, Inc. | 2021 Form 10-K | 36
Derivatives - Master Netting Arrangements
Generally accepted accounting principles permit a party to a master netting arrangement to offset fair value amounts recognized for derivative instruments against the right to reclaim cash collateral or obligation to return cash collateral under the same master netting arrangement. The Company has master netting arrangements for its exchange traded futures and options contracts and certain over-the-counter contracts. When the Company enters into a futures, options or an over-the-counter contract, an initial margin deposit may be required by the counterparty. The amount of the margin deposit varies by commodity. If the market price of a futures, option or an over-the-counter contract moves in a direction that is adverse to the Company's position, an additional margin deposit, called a maintenance margin, is required. The Company nets, by counterparty, its futures and over-the-counter positions against the cash collateral provided or received. The margin deposit assets and liabilities are included in short-term commodity derivative assets or liabilities, as appropriate, in the Consolidated Balance Sheets. Additional information about the Company's master netting arrangements is presented in Note 5 to the Consolidated Financial Statements.
Derivatives - Interest Rate and Foreign Currency Contracts
The Company periodically enters into interest rate contracts to manage interest rate risk on borrowing or financing activities. The Company has long-term interest rate swaps recorded in other assets or other long-term liabilities that expire from 2022 to 2030 and have been designated as cash flow hedges; accordingly, changes in the fair value of the instruments are recognized in Other comprehensive income (loss). While the Company considers all of its derivative positions to be effective economic hedges of specified risks, these interest rate contracts for which hedge accounting is not applied are recorded on the Consolidated Balance Sheets in either other current assets or liabilities (if short-term in nature) or in other assets or other long-term liabilities (if non-current in nature), and changes in fair value are recognized in current earnings as interest expense. Upon termination of a derivative instrument or a change in the hedged item, any remaining fair value recorded on the balance sheet is recorded as interest expense consistent with the cash flows associated with the underlying hedged item. Information regarding the nature and terms of the Company's interest rate derivatives is presented in Note 5 to the Consolidated Financial Statements.
Additional information regarding the Company's property, plant and equipment is presented in Note 3 to the Consolidated Financial Statements.
Deferred Debt Issue Costs
Costs associated with the issuance of term debt are deferred and recorded net with debt. Costs associated with revolving credit agreements are recorded as a deferred asset. These costs are amortized, as a component of interest expense, over the earlier of the stated term of the debt or the period from the issue date through the first early payoff date without penalty, or the expected payoff date if the loan does not contain a prepayment penalty. Deferred costs associated with the borrowing arrangement with a syndication of banks are amortized over the term of the agreement.
The Andersons, Inc. | 2021 Form 10-K | 37
Goodwill and Intangible Assets
Goodwill is subject to an annual impairment test or more often when events or circumstances indicate that the carrying amount of goodwill may be impaired. A goodwill impairment loss is recognized to the extent the carrying amount of goodwill exceeds the business enterprise value. Additional information about the Company's goodwill and other intangible assets is presented in Note 17 to the Consolidated Financial Statements.
Acquired intangible assets are recorded at cost, less accumulated amortization, if not indefinite lived. In addition, we capitalize the salaries and payroll-related costs of employees and consultants who devote time to the development of internal-use software projects. If a project constitutes an enhancement to previously-developed software, we assess whether the enhancement is significant and creates additional functionality to the software, thus qualifying the work incurred for capitalization. Once a project is complete, we estimate the useful life of the internal-use software. Changes in our estimates related to internal-use software would increase or decrease operating expenses or amortization recorded during the period.
Impairment of Long-lived Assets and Equity Method Investments
Long-lived assets, including intangible assets, are reviewed for impairment whenever events or changes in circumstances indicate that the carrying value of an asset may not be recoverable. Recoverability of assets to be held and used is measured by comparing the carrying amount of the assets to the undiscounted future net cash flows the Company expects to generate with the assets. If such assets are considered to be impaired, the Company recognizes an impairment loss for the amount by which the carrying amount of the assets exceeds the fair value of the assets.
The Company reviews its equity method investments to determine whether there has been a decline in the estimated fair value of the investment that is below the Company's carrying value which is other-than-temporary. Other than consideration of past and current performance, these reviews take into account forecasted earnings which are based on management's estimates of future performance.
Provisionally Priced Commodity Contracts
Accounts payable includes certain amounts related to commodity purchases for which, even though the Company has taken ownership and possession of the commodity the final purchase price has not been fully established. If the futures and basis components are unpriced, it is referred to as a delayed price payable. If the futures component has not been established, but the basis has been set, it is referred to as a basis payable. The unpriced portion of these payables will be exposed to changes in the fair value of the underlying commodity based on quoted prices on commodity exchanges (or basis levels). Those payables that are fully priced are not considered derivative instruments.
Stock-Based Compensation
Stock-based compensation expense for all stock-based compensation awards is based on the estimated grant-date fair value. The Company recognizes these compensation costs on a straight-line basis over the requisite service period of the award, adjusted for revisions to performance expectations. Additional information about the Company's stock compensation plans is presented in Note 15 to the Consolidated Financial Statements.
The Andersons, Inc. | 2021 Form 10-K | 38
Per Share Data
We present both basic and diluted earnings per share amounts from continuing operations and discontinued operations attributable to the Company's shareholders. Basic earnings per common share are determined by dividing net earnings attributable to controlling interests by the weighted-average number of common shares outstanding. In computing diluted earnings per share, average number of common shares outstanding is increased by unvested stock awards and common stock options outstanding with exercise prices lower than the average market price of common shares using the treasury share method.
Revenue Recognition
The Company’s revenue consists of sales from commodity contracts that are accounted for under ASC 815, Derivatives and Hedging (ASC 815), and sales of other products and services that are accounted for under ASC 606, Revenue from Contracts with Customers (ASC 606).
Revenue from commodity contracts (ASC 815)
Revenue from commodity contracts primarily relates to forward sales of commodities in the Company’s Trade and Renewables segments, such as corn, soybeans, wheat, oats, ethanol, and corn oil, which are accounted for as derivatives at fair value under ASC 815. These forward sales meet the definition of a derivative under ASC 815 as they have an underlying (e.g. the price of corn), a notional amount (e.g. metric tons), no initial net investment and can be net settled since the commodity is readily convertible to cash. The Company does not apply the normal purchase and normal sale exception available under ASC 815 to these contracts.
Revenue from commodity contracts is recognized in Sales and merchandising revenues for the contractually stated amount when the contracts are settled. Settlement of the commodity contracts generally occurs upon shipment or delivery of the product, when title and risks and rewards of ownership transfers to the customer. Prior to settlement, these forward sales contracts are recognized at fair value with the unrealized gains or losses recorded within Cost of sales and merchandising revenues. Additional information about the fair value of the Company's commodity derivatives is presented in Notes 5 and 10 to the Consolidated Financial Statements.
There are certain transactions that allow for pricing to occur after title of the goods has passed to the customer. In these cases, the Company continues to report the goods in inventory until it recognizes the sales revenue once the price has been determined. Direct ship commodity sales (where the Company never takes physical possession of the commodity) are recognized based on the terms of the contract.
Certain of the Company's operations provide for customer billings, deposits or prepayments for product that is stored at the Company's facilities. The sales and gross profit related to these transactions are not recognized until the product is shipped in accordance with the previously stated revenue recognition policy and these amounts are classified in the Consolidated Balance Sheets as a current liability titled “Customer prepayments and deferred revenue”.
Revenue from contracts with customers (ASC 606)
Information regarding our revenue from contracts with customers accounted for under ASC 606 is presented in Note 7 to the Consolidated Financial Statements. The Company recognizes revenue from these contracts at a point in time when it satisfies a performance obligation by transferring control of a product to a customer, generally when legal title and risks and rewards of ownership transfer to the customer.
Income Taxes
Income tax expense for each period includes current tax expense plus deferred expense, which is related to the change in deferred income tax assets and liabilities. Deferred income taxes are provided for temporary differences between the financial reporting basis and the tax basis of assets and liabilities and are measured using enacted tax rates and laws governing periods in which the differences are expected to reverse. The Company evaluates the realizability of deferred tax assets and provides a valuation allowance for amounts that management does not believe are more likely than not to be recoverable, as applicable.
The Andersons, Inc. | 2021 Form 10-K | 39
The annual effective tax rate is determined by Income tax provision (benefit) from continuing operations as a percentage of Income (loss) before income taxes from continuing operations within the Consolidated Statements of Operations. Differences in the effective tax rate and the statutory tax rate may be due to permanent items, tax credits, foreign tax rates and state tax rates in jurisdictions in which the Company operates, or changes in valuation allowances.
The Company records reserves for uncertain tax positions when, despite the belief that tax return positions are fully supportable, it is anticipated that certain tax return positions are likely to be challenged and that the Company may not prevail. These reserves are adjusted for changing facts and circumstances, such as the progress of a tax audit or the lapse of statutes of limitations.
Additional information about the Company’s income taxes is presented in Note 8 to the Consolidated Financial Statements.
Recently Adopted Accounting Pronouncements
Simplifying the Accounting for Income Taxes
In December 2019, the FASB issued ASU 2019-12, Income Taxes (Topic 740): Simplifying the Accounting for Income Taxes, which simplifies the accounting for income taxes by removing certain exceptions to the general principles in Topic 740. The amendments also improve consistent application of and simplify GAAP for other areas of Topic 740 by clarifying and amending existing guidance. The provisions of this update are effective for fiscal years, and interim periods within those fiscal years, beginning after December 15, 2020. The new standard did not have a material impact to the Company's financial statements or disclosures.
Reference Rate Reform (Topic 848)
In January 2021, the FASB issued ASU 2021-01, Reference Rate Reform (Topic 848): Scope, which temporarily simplifies the accounting for contract modifications, including hedging relationships, due to the transition from LIBOR and other interbank offered rates to alternative reference interest rates. For example, entities can elect not to remeasure the contracts at the modification date or reassess a previous accounting determination if certain conditions are met. Additionally, entities can elect to continue applying hedge accounting for hedging relationships affected by reference rate reform if certain conditions are met. The new standard was effective upon issuance and generally can be applied to applicable contract modifications through December 31, 2022. The Company has utilized the relief provided by Topic 848 to ensure financial reporting results reflect the intended continuation of such contracts and arrangements during the period of the market-wide transition to alternative reference rates. The expedients allow an eligible modified contract to be accounted for and presented as a continuation of the existing contract.
The Company has identified its LIBOR-based contracts that will be impacted by the cessation of LIBOR and is actively working with counterparties to incorporate fallback language in negotiated contracts, in addition to incorporating non-LIBOR reference rate and fallback language, when applicable, in new contracts to prepare for these changes. The evaluation and modification of contracts is ongoing. The Company continues to evaluate the impacts of this standard on its consolidated financial statements.
The Andersons, Inc. | 2021 Form 10-K | 40
2. Inventories
Major classes of inventories are presented below. Readily Marketable Inventories are agricultural commodity inventories such as corn, soybeans, wheat, and ethanol co-products, among others, carried at net realizable value which approximates fair value based on their commodity characteristics, widely available markets, and pricing mechanisms. The net realizable value of RMI is calculated as the fair value (spot price of the commodity in an exchange), less cost of disposal and transportation based on the local market. All other inventories are held at lower of cost or net realizable value.
| December 31, | |||||||||||
| (in thousands) | 2021 | 2020 | |||||||||
| Grain and other agricultural products (a) | $ | $ | |||||||||
| Propane and frac sand (a) | |||||||||||
| Ethanol and co-products (a) | |||||||||||
| Plant nutrients and cob products | |||||||||||
| Total | $ | $ | |||||||||
(a) Includes RMI of $1,410.9 million and $983.2 million at December 31, 2021 and December 31, 2020, respectively.
Inventories do not include 3.0
The Company recorded lower of cost or net realizable value adjustments of $3.4 million and $11.7 million for the years ended December 31, 2021 and 2020, respectively. The current year charge primarily relates to certain fertilizer values decreasing after the spring application season. The charge in the prior year was a result of lower ethanol market prices and decreased demand as a result of the COVID-19 pandemic.
3. Property, Plant and Equipment
The components of property, plant and equipment are as follows:
| December 31, | |||||||||||
| (in thousands) | 2021 | 2020 | |||||||||
| Land | $ | $ | |||||||||
| Land improvements and leasehold improvements | |||||||||||
| Buildings and storage facilities | |||||||||||
| Machinery and equipment | |||||||||||
| Construction in progress | |||||||||||
| Less: accumulated depreciation | ( | ( | |||||||||
| Property, plant and equipment, net | $ | $ | |||||||||
Depreciation expense on property, plant and equipment amounted to $126.9 million, $122.4 million and $79.1 million for the years ended 2021, 2020 and 2019, respectively. The increase in depreciation expense from 2019 to 2020 was due to the TAMH merger in October of 2019 and ELEMENT starting its operations in August of 2019.
In December 2021, the Company recorded charges of $7.7 million for impairments of property, plant and equipment in the Trade segment related to its frac sand assets in Oklahoma. The Company also recorded a $0.6 million impairment of property, plant and equipment in the Trade segment related to the shutdown of a facility in Texas.
In 2019, the Company recorded charges of $32.3 million for impairment of property, plant and equipment in the Trade segment related to its frac sand assets. The Company also recorded a $3.7 million impairment of property, plant, and equipment in the Trade segment related to its Tennessee grain assets in 2019.
The Andersons, Inc. | 2021 Form 10-K | 41
4. Debt
The Company’s short-term and long-term debt at December 31, 2021 and 2020 consisted of the following:
| December 31, | |||||||||||
| (in thousands) | 2021 | 2020 | |||||||||
| Short-term debt – non-recourse | $ | $ | |||||||||
| Short-term debt – recourse | |||||||||||
| Total short-term debt | |||||||||||
| Current maturities of long-term debt – non-recourse | |||||||||||
| Current maturities of long-term debt – recourse | |||||||||||
| Total current maturities of long-term debt | |||||||||||
| Long-term debt, less: current maturities – non-recourse | |||||||||||
| Long-term debt, less: current maturities – recourse | |||||||||||
| Total long-term debt, less: current maturities | $ | $ | |||||||||
On February 4, 2021, the Company completed the second amendment to its credit agreement dated January 11, 2019. The amendment, which replaced an underwritten bridge loan received on January 21, 2021, provided for a short-term $250.0 million note in which the entire stated principal was due on December 31, 2021. The entire principal balance was repaid as of September 30, 2021.
On May 6, 2021, the Company completed the third amendment to its credit agreement dated January 11, 2019. The amendment provides for a short-term note of approximately $358.0 million in which the entire stated principal is due on March 31, 2022. The term note will bear interest at variable rates, which are based on LIBOR plus an applicable spread. As of December 31, 2021 $200.0 million of principal remains outstanding.
As part of the Company's ongoing covenant monitoring process, at September 30, 2021, the Company determined that it was virtually certain that ELEMENT will be out of compliance with its debt service coverage ratio covenant of no less than 1.4 to be initially measured on December 31, 2021. It was determined that if ELEMENT was not in compliance with the debt service coverage ratio at December 31, 2021, it would result in an event of default, which if not cured or waived, could result in the lender accelerating the maturity of the ELEMENT’s indebtedness or preventing access to additional funds under the line of credit agreement, or requiring prepayment of outstanding indebtedness under the loan agreement or the line of credit agreement. Because it was determined that it was virtually certain that ELEMENT would violate this covenant in the future and had not yet received a waiver at that time, the $70.0 million of non-recourse debt associated with ELEMENT was classified as a current maturity of long-term debt as of September 30, 2021. On February 14, 2022, ELEMENT executed an amended agreement of the debt whereby the lender retrospectively waived the covenant violations and modified the existing covenants. The debt service coverage ratio covenant was waived as of December 31, 2021 and modified to a target of 1.0 for 2022. As the waiver and amended debt agreement was completed prior to the annual report filing, the debt was classified as noncurrent as of December 31, 2021.
The Company was in compliance with all financial covenants at and during the years ended December 31, 2021 and 2020.
Total interest paid was $38.2 million, $33.9 million and $43.4 million for the years ended December 31, 2021, 2020 and 2019, respectively.
As of December 31, 2021 and 2020, the estimated fair value of long-term debt, including the current portion, was $650.7 million and $989.1 million, respectively. The Company estimates the fair value of its long-term debt based upon the Company’s credit standing and current interest rates offered by the Company on similar bonds and rates currently available to the Company for long-term borrowings with similar terms and remaining maturities.
At December 31, 2021, the Company had short-term lines of credit capacity totaling $1,195.8 million, of which $890.1 million was unused. The weighted-average interest rates on short-term borrowings outstanding at December 31, 2021 and 2020, were 1.49 % and 1.66 %, respectively.
The Andersons, Inc. | 2021 Form 10-K | 42
Long-Term Debt
Recourse Long-Term Debt
| December 31, | |||||||||||
| (in thousands, except percentages) | 2021 | 2020 | |||||||||
Note payable, variable rate ( | $ | $ | |||||||||
Note payable, variable rate ( | |||||||||||
Note payable, | |||||||||||
Note payable, | |||||||||||
Note payable, | |||||||||||
Industrial revenue bond, variable rate ( | |||||||||||
Note payable, | |||||||||||
Note payable, | |||||||||||
| Finance lease obligations, due serially to 2030 (a) | |||||||||||
| Note payable, variable rate, paid 2021 | |||||||||||
Note payable, | |||||||||||
Note payable, | |||||||||||
Note payable, | |||||||||||
Debenture bonds, | |||||||||||
| Note payable, variable rate, paid 2021 | |||||||||||
| Less: current maturities | |||||||||||
| Less: unamortized prepaid debt issuance costs | |||||||||||
| $ | $ | ||||||||||
The aggregate annual maturities of recourse, long-term debt are as follows: 2022 -- $24.7 million; 2023 -- $48.8 million; 2024 -- $25.1 million; 2025 -- $25.3 million; 2026 -- $305.5 million; and $134.8 million thereafter.
Non-Recourse Long-Term Debt
The Company's non-recourse long-term debt consists of the following:
| December 31, | |||||||||||
| (in thousands) | 2021 | 2020 | |||||||||
Note payable, variable rate ( | $ | $ | |||||||||
| Finance lease obligations, due serially to 2023 | |||||||||||
| Long-term credit facility, variable rate, due 2024 | |||||||||||
| Less: current maturities | |||||||||||
| Less: unamortized prepaid debt issuance costs | |||||||||||
| $ | $ | ||||||||||
The aggregate annual maturities of non-recourse, long-term debt are as follows: 2022 -- $7.6 million; 2023 -- $8.0 million; 2024 -- $7.9 million; 2025 -- $7.2 million; 2026 -- $7.1 million; and $34.9 million thereafter.
The Andersons, Inc. | 2021 Form 10-K | 43
5. Derivatives
Commodity Contracts
The Company’s operating results are affected by changes to commodity prices. The Trade and Renewables businesses have established “unhedged” futures position limits (the amount of a commodity, either owned or contracted for, that does not have an offsetting derivative contract to lock in the price). To reduce the exposure to market price risk on commodities owned and forward purchase and sale contracts, the Company enters into exchange traded commodity futures and options contracts and over-the-counter forward and option contracts with various counterparties. These contracts are primarily traded via regulated commodity exchanges. The Company’s forward purchase and sales contracts are for physical delivery of the commodity in a future period. Contracts to purchase commodities from producers generally relate to the current or future crop years for delivery periods quoted by regulated commodity exchanges. Most contracts for the sale of commodities to processors or other commercial consumers generally do not extend beyond one year .
Most of these contracts meet the definition of derivatives. While the Company considers its commodity contracts to be effective economic hedges, the Company does not designate or account for its commodity contracts as hedges as defined under current accounting standards. The Company primarily accounts for its commodity derivatives at estimated fair value. The estimated fair value of the commodity derivative contracts that require the receipt or posting of cash collateral is recorded on a net basis (offset against cash collateral posted or received, also known as margin deposits) within commodity derivative assets or liabilities. Management determines fair value based on exchange-quoted prices and in the case of its forward purchase and sale contracts, estimated fair value is adjusted for differences in local markets and non-performance risk. For contracts for which physical delivery occurs, balance sheet classification is based on estimated delivery date. For futures, options and over-the-counter contracts in which physical delivery is not expected to occur but, rather, the contract is expected to be net settled, the Company classifies these contracts as current or noncurrent assets or liabilities, as appropriate, based on the Company’s expectations as to when such contracts will be settled.
Realized and unrealized gains and losses in the value of commodity contracts (whether due to changes in commodity prices, changes in performance or credit risk, or due to sale, maturity or extinguishment of the commodity contract) and commodity inventories are included in Cost of sales and merchandising revenues.
Generally accepted accounting principles permit a party to a master netting arrangement to offset fair value amounts recognized for derivative instruments against the right to reclaim cash collateral or obligation to return cash collateral under the same master netting arrangement. The Company has master netting arrangements for its exchange traded futures and options contracts and certain over-the-counter contracts. When the Company enters into a future, option or an over-the-counter contract, an initial margin deposit may be required by the counterparty. The amount of the margin deposit varies by commodity. If the market price of a future, option or an over-the-counter contract moves in a direction that is adverse to the Company’s position, an additional margin deposit, called a maintenance margin, is required. The margin deposit assets and liabilities are included in current commodity derivative assets (or liabilities), as appropriate, in the Consolidated Balance Sheets.
The following table presents at December 31, 2021 and 2020, a summary of the estimated fair value of the Company’s commodity derivative instruments that require cash collateral and the associated cash posted or received as collateral. The net asset or liability positions of these derivatives (net of their cash collateral) are determined on a counterparty-by-counterparty basis and are included within current or noncurrent commodity derivative assets (or liabilities) in the Consolidated Balance Sheets:
| (in thousands) | December 31, 2021 | December 31, 2020 | |||||||||
| Cash collateral paid | $ | $ | |||||||||
| Fair value of derivatives | ( | ( | |||||||||
| Net derivative asset position | $ | $ | |||||||||
The Andersons, Inc. | 2021 Form 10-K | 44
The following table presents, on a gross basis, current and non-current commodity derivative assets and liabilities:
| December 31, 2021 | |||||||||||||||||||||||||||||
| (in thousands) | Commodity Derivative Assets - Current | Commodity Derivative Assets - Noncurrent | Commodity Derivative Liabilities - Current | Commodity Derivative Liabilities - Noncurrent | Total | ||||||||||||||||||||||||
| Commodity derivative assets | $ | $ | $ | $ | $ | ||||||||||||||||||||||||
| Commodity derivative liabilities | ( | ( | ( | ( | ( | ||||||||||||||||||||||||
| Cash collateral paid | |||||||||||||||||||||||||||||
| Balance sheet line item totals | $ | $ | $ | ( | $ | ( | $ | ||||||||||||||||||||||
| December 31, 2020 | |||||||||||||||||||||||||||||
| (in thousands) | Commodity Derivative Assets - Current | Commodity Derivative Assets - Noncurrent | Commodity Derivative Liabilities - Current | Commodity Derivative Liabilities - Noncurrent | Total | ||||||||||||||||||||||||
| Commodity derivative assets | $ | $ | $ | $ | $ | ||||||||||||||||||||||||
| Commodity derivative liabilities | ( | ( | ( | ( | ( | ||||||||||||||||||||||||
| Cash collateral paid | |||||||||||||||||||||||||||||
| Balance sheet line item totals | $ | $ | $ | ( | $ | ( | $ | ||||||||||||||||||||||
The net gains and losses on commodity derivatives not designated as hedging instruments included in the Company’s Consolidated Statements of Operations and the line items in which they are located for the years ended December 31, 2021, 2020 and 2019 are as follows:
| Year Ended December 31, | |||||||||||||||||
| (in thousands) | 2021 | 2020 | 2019 | ||||||||||||||
| Gains (losses) on commodity derivatives included in Cost of sales and merchandising revenues | $ | $ | ( | $ | |||||||||||||
The Andersons, Inc. | 2021 Form 10-K | 45
The Company had the following volume of commodity derivative contracts outstanding (on a gross basis) as of December 31, 2021 and 2020:
| December 31, 2021 | |||||||||||||||||
| (in thousands) | Number of Bushels | Number of Gallons | Number of Tons | ||||||||||||||
| Non-exchange traded: | |||||||||||||||||
| Corn | |||||||||||||||||
| Soybeans | |||||||||||||||||
| Wheat | |||||||||||||||||
| Oats | |||||||||||||||||
| Ethanol | |||||||||||||||||
| Soybean meal | |||||||||||||||||
| Dried distillers grain | |||||||||||||||||
| Other | |||||||||||||||||
| Subtotal | |||||||||||||||||
| Exchange traded: | |||||||||||||||||
| Corn | |||||||||||||||||
| Soybeans | |||||||||||||||||
| Wheat | |||||||||||||||||
| Oats | |||||||||||||||||
| Ethanol | |||||||||||||||||
| Propane | |||||||||||||||||
| Other | |||||||||||||||||
| Subtotal | |||||||||||||||||
| Total | |||||||||||||||||
| December 31, 2020 | |||||||||||||||||
| (in thousands) | Number of Bushels | Number of Gallons | Number of Tons | ||||||||||||||
| Non-exchange traded: | |||||||||||||||||
| Corn | |||||||||||||||||
| Soybeans | |||||||||||||||||
| Wheat | |||||||||||||||||
| Oats | |||||||||||||||||
| Ethanol | |||||||||||||||||
| Soybean meal | |||||||||||||||||
| Dried distillers grain | |||||||||||||||||
| Other | |||||||||||||||||
| Subtotal | |||||||||||||||||
| Exchange traded: | |||||||||||||||||
| Corn | |||||||||||||||||
| Soybeans | |||||||||||||||||
| Wheat | |||||||||||||||||
| Oats | |||||||||||||||||
| Ethanol | |||||||||||||||||
| Propane | |||||||||||||||||
| Other | |||||||||||||||||
| Subtotal | |||||||||||||||||
| Total | |||||||||||||||||
The Andersons, Inc. | 2021 Form 10-K | 46
Interest Rate and Other Derivatives
The Company’s objectives in using interest rate derivatives are to add stability to interest expense and to manage its exposure to interest rate movements. To accomplish these objectives, the Company primarily uses interest rate swaps as part of its interest rate risk management strategy. Interest rate swaps designated as cash flow hedges involve the receipt of variable amounts from a counterparty in exchange for the Company making fixed-rate payments over the life of the agreements without exchange of the underlying notional amount.
The gains or losses on the derivatives designated as hedging instruments are recorded in Other comprehensive income (loss) and subsequently reclassified into Interest expense in the same periods during which the hedged transaction affects earnings. Amounts reported in Accumulated other comprehensive income (loss) related to derivatives will be reclassified to Interest expense as interest payments are made on the Company’s variable-rate debt. The Company also has foreign currency derivatives which are considered effective economic hedges of specified economic risks.
At December 31, 2021 and 2020, the Company had recorded the following amounts for the fair value of the Company's interest rate and other derivatives:
| December 31, | |||||||||||
| (in thousands) | 2021 | 2020 | |||||||||
| Derivatives not designated as hedging instruments | |||||||||||
| Interest rate contracts included in Accrued expenses and other current liabilities | $ | ( | $ | ( | |||||||
| Interest rate contracts included in Other long-term liabilities | ( | ||||||||||
| Foreign currency contracts included in Other current (liabilities) assets | ( | ||||||||||
| Derivatives designated as hedging instruments | |||||||||||
| Interest rate contracts included in Other assets | |||||||||||
| Interest rate contracts included in Accrued expenses and other current liabilities | ( | ( | |||||||||
| Interest rate contracts included in Other long-term liabilities | $ | ( | $ | ( | |||||||
The recording of derivatives gains and losses and the financial statement line item in which they are located are as follows:
| Year Ended December 31, | |||||||||||||||||
| (in thousands) | 2021 | 2020 | 2019 | ||||||||||||||
| Derivatives not designated as hedging instruments | |||||||||||||||||
| Interest rate derivative gains (losses) included in Interest expense, net | $ | ( | $ | ( | $ | ( | |||||||||||
| Derivatives designated as hedging instruments | |||||||||||||||||
| Interest rate derivative gains (losses) included in Other comprehensive income (loss) | ( | ( | |||||||||||||||
| Interest rate derivative gains (losses) included in Interest expense, net | $ | ( | $ | ( | $ | ( | |||||||||||
The Andersons, Inc. | 2021 Form 10-K | 47
The following table presents the open interest rate contracts at December 31, 2021:
| Interest Rate Hedging Instrument | Year Entered | Year of Maturity | Initial Notional Amount (in millions) | Hedged Item | Interest Rate | |||||||||||||||||||||||||||
| Long-term | ||||||||||||||||||||||||||||||||
| Swap | 2014 | 2023 | $ | Interest rate component of debt - not accounted for as a hedge | ||||||||||||||||||||||||||||
| Swap | 2017 | 2022 | $ | Interest rate component of debt - accounted for as a hedge | ||||||||||||||||||||||||||||
| Swap | 2018 | 2023 | $ | Interest rate component of debt - accounted for as a hedge | ||||||||||||||||||||||||||||
| Swap | 2018 | 2025 | $ | Interest rate component of debt - accounted for as a hedge | ||||||||||||||||||||||||||||
| Swap | 2019 | 2025 | $ | Interest rate component of debt - accounted for as a hedge | ||||||||||||||||||||||||||||
| Swap | 2019 | 2025 | $ | Interest rate component of debt - accounted for as a hedge | ||||||||||||||||||||||||||||
| Swap | 2019 | 2025 | $ | Interest rate component of debt - accounted for as a hedge | ||||||||||||||||||||||||||||
| Swap | 2020 | 2030 | $ | Interest rate component of debt - accounted for as a hedge | ||||||||||||||||||||||||||||
| Swap | 2020 | 2030 | $ | Interest rate component of debt - accounted for as a hedge | ||||||||||||||||||||||||||||
6. Employee Benefit Plans
The Company provides certain full-time employees with pension benefits under defined benefit and defined contribution plans. The measurement date for all plans is December 31st. The Company's expense for its defined contribution plans amounted to $14.6 million, $8.1 million and $8.8 million for the years ended December 31, 2021, 2020 and 2019, respectively. The expense for the Company's defined contribution plans increased in the current year as the discretionary contribution increased consistent with the improved operating results. The Company also provides health insurance benefits to certain employees and retirees.
The Company has an unfunded noncontributory defined benefit pension plan. The plan provides defined benefits based on years of service and average monthly compensation using a career average formula. Pension benefits were frozen at July 1, 2010.
The Company also has postretirement health care benefit plans covering substantially all of its full-time employees hired prior to January 1, 2003. These plans are generally contributory and include a cap on the Company's share of the related costs.
Obligation and Funded Status
Following are the details of the obligation and funded status of the pension and postretirement benefit plans:
| (in thousands) | Pension Benefits | Postretirement Benefits | |||||||||||||||||||||
| Change in benefit obligation | 2021 | 2020 | 2021 | 2020 | |||||||||||||||||||
| Benefit obligation at beginning of year | $ | $ | $ | $ | |||||||||||||||||||
| Service cost | |||||||||||||||||||||||
| Interest cost | |||||||||||||||||||||||
| Actuarial (gains) losses | ( | ( | |||||||||||||||||||||
| Participant contributions | |||||||||||||||||||||||
| Benefits paid | ( | ( | ( | ( | |||||||||||||||||||
| Benefit obligation at end of year | $ | $ | $ | $ | |||||||||||||||||||
The Andersons, Inc. | 2021 Form 10-K | 48
| (in thousands) | Pension Benefits | Postretirement Benefits | |||||||||||||||||||||
| Change in plan assets | 2021 | 2020 | 2021 | 2020 | |||||||||||||||||||
| Fair value of plan assets at beginning of year | $ | $ | $ | $ | |||||||||||||||||||
| Company contributions | |||||||||||||||||||||||
| Participant contributions | |||||||||||||||||||||||
| Benefits paid | ( | ( | ( | ( | |||||||||||||||||||
| Fair value of plan assets at end of year | $ | $ | $ | $ | |||||||||||||||||||
| Under funded status of plans at end of year | $ | ( | $ | ( | $ | ( | $ | ( | |||||||||||||||
Amounts recognized in the Consolidated Balance Sheets at December 31, 2021 and 2020 consist of:
| Pension Benefits | Postretirement Benefits | ||||||||||||||||||||||
| (in thousands) | 2021 | 2020 | 2021 | 2020 | |||||||||||||||||||
| Accrued expenses and other current liabilities | $ | $ | $ | $ | |||||||||||||||||||
| Other long-term liabilities | |||||||||||||||||||||||
| Net amount recognized | $ | $ | $ | $ | |||||||||||||||||||
Following are the details of the pre-tax amounts recognized in Accumulated other comprehensive income at December 31, 2021:
| Pension Benefits | Postretirement Benefits | ||||||||||||||||||||||
| (in thousands) | Unamortized Actuarial Net Losses | Unamortized Prior Service Costs | Unamortized Actuarial Net Losses | Unamortized Prior Service Costs | |||||||||||||||||||
| Balance at beginning of year | $ | $ | $ | ( | $ | ||||||||||||||||||
| Amounts arising during the period | ( | ( | |||||||||||||||||||||
| Amounts recognized as a component of net periodic benefit cost | ( | ( | |||||||||||||||||||||
| Balance at end of year | $ | $ | $ | ( | $ | ||||||||||||||||||
Amounts applicable to the Company's defined benefit plans with accumulated benefit obligations in excess of plan assets are as follows:
| December 31, | |||||||||||
| (in thousands) | 2021 | 2020 | |||||||||
| Projected benefit obligation | $ | $ | |||||||||
| Accumulated benefit obligation | $ | $ | |||||||||
The combined benefits expected to be paid for all Company defined benefit plans over the next ten years are as follows:
| (in thousands) | Expected Pension Benefit Payout | Expected Postretirement Benefit Payout | |||||||||
| 2022 | $ | $ | |||||||||
| 2023 | |||||||||||
| 2024 | |||||||||||
| 2025 | |||||||||||
| 2026 | |||||||||||
| 2027-2031 | |||||||||||
The Andersons, Inc. | 2021 Form 10-K | 49
Following are components of the net periodic benefit cost for each year:
| Pension Benefits | Postretirement Benefits | ||||||||||||||||||||||||||||||||||
| December 31, | December 31, | ||||||||||||||||||||||||||||||||||
| (in thousands) | 2021 | 2020 | 2019 | 2021 | 2020 | 2019 | |||||||||||||||||||||||||||||
| Service cost | $ | $ | $ | $ | $ | $ | |||||||||||||||||||||||||||||
| Interest cost | |||||||||||||||||||||||||||||||||||
| Expected return on plan assets | ( | ( | ( | ||||||||||||||||||||||||||||||||
| Recognized net actuarial loss | |||||||||||||||||||||||||||||||||||
| Net periodic benefit cost | $ | $ | $ | $ | $ | $ | |||||||||||||||||||||||||||||
Following are weighted-average assumptions of pension and postretirement benefits for each year:
| Postretirement Benefits | |||||||||||||||||
| 2021 | 2020 | 2019 | |||||||||||||||
| Used to Determine Benefit Obligations at Measurement Date | |||||||||||||||||
| Discount rate (a) | % | % | % | ||||||||||||||
| Used to Determine Net Periodic Benefit Cost for Years ended December 31 | |||||||||||||||||
| Discount rate (b) | % | % | % | ||||||||||||||
| Expected long-term return on plan assets | |||||||||||||||||
| Rate of compensation increases | |||||||||||||||||
(a)The calculated rate for the unfunded employee retirement plan was 1.10 %, 0.50 % and 2.00 % in 2021, 2020, and 2019, respectively. Since it was terminated in 2015, the defined benefit pension plan did not have a discount rate during the three-year period presented above.
(b)The calculated rate for the unfunded employee retirement plan was 0.50 %, 2.00 % and 3.20 % in 2021, 2020, and 2019, respectively. Since it was terminated in 2015, the defined benefit pension plan did not have a discount rate during the three-year period presented above.
| Assumed Health Care Cost Trend Rates at Beginning of Year | |||||||||||
| 2021 | 2020 | ||||||||||
| Health care cost trend rate assumed for next year | % | % | |||||||||
| Rate to which the cost trend rate is assumed to decline (the ultimate trend rate) (a) | N/A | N/A | |||||||||
| Year that the rate reaches the ultimate trend rate (a) | N/A | N/A | |||||||||
(a)In 2017, the Company's remaining uncapped participants were converted to a Medicare Exchange Health Reimbursement Arrangement, which put a 2 % cap on the Company's share of the related costs.
7. Revenue
Many of the Company’s revenues are generated from contracts that are outside the scope of ASC 606 and thus are accounted for under other accounting standards. Specifically, many of the Company's Trade and Renewables sales contracts are derivatives under ASC 815, Derivatives and Hedging. The breakdown of revenues between ASC 606 and ASC 815 is as follows:
| Year ended December 31, | ||||||||||||||||||||
| (in thousands) | 2021 | 2020 | 2019 | |||||||||||||||||
| Revenues under ASC 606 | $ | $ | $ | |||||||||||||||||
| Revenues under ASC 815 | ||||||||||||||||||||
| Total revenues | $ | $ | $ | |||||||||||||||||
The Andersons, Inc. | 2021 Form 10-K | 50
Disaggregation of revenue
The following tables disaggregate revenues under ASC 606 by major product/service line:
Year ended December 31, 2021 | |||||||||||||||||||||||
| (in thousands) | Trade | Renewables | Plant Nutrient | Total | |||||||||||||||||||
| Specialty nutrients | $ | $ | $ | $ | |||||||||||||||||||
| Primary nutrients | |||||||||||||||||||||||
| Products and co-products | |||||||||||||||||||||||
| Propane and frac sand | |||||||||||||||||||||||
| Other | |||||||||||||||||||||||
| Total | $ | $ | $ | $ | |||||||||||||||||||
Year ended December 31, 2020 | |||||||||||||||||||||||
| (in thousands) | Trade | Renewables | Plant Nutrient | Total | |||||||||||||||||||
| Specialty nutrients | $ | $ | $ | $ | |||||||||||||||||||
| Primary nutrients | |||||||||||||||||||||||
| Products and co-products | |||||||||||||||||||||||
| Propane and frac sand | |||||||||||||||||||||||
| Other | |||||||||||||||||||||||
| Total | $ | $ | $ | $ | |||||||||||||||||||
Year ended December 31, 2019 | |||||||||||||||||||||||
| (in thousands) | Trade | Renewables | Plant Nutrient | Total | |||||||||||||||||||
| Specialty nutrients | $ | $ | $ | $ | |||||||||||||||||||
| Primary nutrients | |||||||||||||||||||||||
| Products and co-products | |||||||||||||||||||||||
| Propane and frac sand | |||||||||||||||||||||||
| Other | |||||||||||||||||||||||
| Total | $ | $ | $ | $ | |||||||||||||||||||
Substantially all of the Company's revenues accounted for under ASC 606 for the years ended December 31, 2021, 2020 and 2019, respectively, are recorded as a point in time instead of over time.
Specialty and primary nutrients
The Company sells several different types of specialty nutrient products, including: low-salt liquid starter fertilizers, micro-nutrients and other specialty lawn products. These products can be sold through the wholesale distribution channels as well as directly to end users at the farm center locations. Similarly, the Company sells several different types of primary nutrient products, including: nitrogen, phosphorus and potassium. These products may be purchased and re-sold as is or sold as finished goods resulting from a blending and manufacturing process. The contracts associated with specialty and primary nutrients generally have a single performance obligation, as the Company has elected the accounting policy to consider shipping and handling costs as fulfillment costs. Revenue is recognized when control of the product has passed to the customer. Payment terms generally range from 0 - 30 days.
The Andersons, Inc. | 2021 Form 10-K | 51
Products and co-products
In addition to the ethanol sales contracts that are considered derivative instruments, the Renewables Group sells several other co-products that remain subject to ASC 606, including E-85, DDGs, syrups and renewable identification numbers (“RINs”). RINs are credits for compliance with the Environmental Protection Agency's Renewable Fuel Standard program and are created by renewable fuel producers. Contracts for these co-products generally have a single performance obligation, as the Company has elected the accounting policy to consider shipping and handling costs as fulfillment costs. Revenue is recognized when control of the product has passed to the customer which follows shipping terms on the contract. Payment terms generally range from 5 - 15 days.
Propane and frac sand
Propane and sand products are primarily sold to United States customers in the energy industry. Revenue is recognized at a point in time when obligations under the terms of a contract with the customer are satisfied. This occurs with the transfer of control of our products to customers when products are shipped for direct sales to customers or when the product is picked up by a customer either at the plant location or transload location. Contracts contain one performance obligation which is the delivery to the customer at a point in time. Revenue is measured as the amount of consideration received in exchange for transferring products. The Company recognizes the cost for shipping as an expense in cost of sales and merchandising revenues when control over the product has transferred to the customer. Payment terms generally range from 0 - 30 days.
Contract balances
The opening and closing balances of the Company’s contract liabilities are as follows:
| (in thousands) | 2021 | 2020 | |||||||||
| Balance at January 1 | $ | $ | |||||||||
| Balance at December 31 | |||||||||||
The difference between the opening and closing balances of the Company’s contract liabilities primarily results from the timing difference between the Company’s performance and the customer’s payment. Contract liabilities relate to the Plant Nutrient business for payments received in advance of fulfilling our performance obligations under our customer contracts. Contract liabilities are built up at year-end and through the first quarter as a result of payments in advance of fulfilling our performance obligations under our customer contracts in preparation for the spring application season. The contract liabilities are then relieved as obligations are met through the year and begin to build in preparation for a new season as we approach year-end. The variance in contract liabilities at December 31, 2021 compared to the prior years was due to the sharp increase of fertilizer prices.
The Andersons, Inc. | 2021 Form 10-K | 52
8. Income Taxes
Income tax provision (benefit) from continuing operations consists of the following:
| Year ended December 31, | |||||||||||||||||
| (in thousands) | 2021 | 2020 | 2019 | ||||||||||||||
| Current: | |||||||||||||||||
| Federal | $ | $ | ( | $ | |||||||||||||
| State and local | ( | ||||||||||||||||
| Foreign | |||||||||||||||||
| ( | |||||||||||||||||
| Deferred: | |||||||||||||||||
| Federal | ( | ||||||||||||||||
| State and local | |||||||||||||||||
| Foreign | ( | ( | |||||||||||||||
| Total: | |||||||||||||||||
| Federal | ( | ||||||||||||||||
| State and local | |||||||||||||||||
| Foreign | |||||||||||||||||
| $ | $ | ( | $ | ||||||||||||||
Income (loss) before income taxes from continuing operations consists of the following:
| Year ended December 31, | |||||||||||||||||
| (in thousands) | 2021 | 2020 | 2019 | ||||||||||||||
| U.S. | $ | $ | ( | $ | |||||||||||||
| Foreign | |||||||||||||||||
| $ | $ | ( | $ | ||||||||||||||
The Andersons, Inc. | 2021 Form 10-K | 53
A reconciliation from the statutory U.S. federal tax rate to the effective tax rate follows:
| Year ended December 31, | |||||||||||||||||
| 2021 | 2020 | 2019 | |||||||||||||||
| Statutory U.S. federal tax rate | % | % | % | ||||||||||||||
| Increase (decrease) in rate resulting from: | |||||||||||||||||
| State and local income taxes, net of related federal taxes | |||||||||||||||||
| Federal tax rate differential | ( | ||||||||||||||||
U.S. tax rate change and other tax law impacts (a) | |||||||||||||||||
| Effect of noncontrolling interest | ( | ( | |||||||||||||||
| Derivative instruments and hedging activities | ( | ( | |||||||||||||||
| U.S. income taxes on foreign earnings | ( | ||||||||||||||||
| Nondeductible compensation | ( | ||||||||||||||||
| Unrecognized tax benefits | ( | ||||||||||||||||
| Valuation allowance | ( | ( | |||||||||||||||
| Foreign tax credits | ( | ( | ( | ||||||||||||||
| Research and development and other tax credits | ( | ( | |||||||||||||||
| Equity method investments | ( | ( | |||||||||||||||
| Acquisition related permanent item | |||||||||||||||||
| Other, net | ( | ( | ( | ||||||||||||||
| Effective tax rate | % | % | % | ||||||||||||||
(a) Reflects the impact of the CARES Act which provided a financial statement benefit of $14.8 million in 2020.
Net income taxes of $51.7 million, $2.4 million and $2.0 million were paid in the years ended December 31, 2021, 2020 and 2019, respectively.
TAMH and ELEMENT are treated as partnerships for U.S. tax purposes. Partnerships are not taxable entities so the tax consequences of the partnership’s transactions flow through to the partners (i.e., investors) at their proportionate share. As a result, the Consolidated Financial Statements do not reflect such income taxes on income (loss) before taxes attributable to the noncontrolling interest in the partnerships.
The Company has elected to treat Global Intangible Low Tax Income (“GILTI”) as a period cost and, therefore, has not recognized deferred taxes for basis differences that may reverse as GILTI tax in future years.
For the years ended December 31, 2021 and 2020, the Company has not recognized deferred tax liabilities for temporary differences related to investments in foreign subsidiaries that were deemed permanently reinvested. Determination of the amount of unrecognized deferred income tax liabilities on these earnings is not practicable because such liability, if any, depends on certain circumstances existing and if/when remittance occurs. A deferred tax liability will be recognized if and when the Company no longer plans to permanently reinvest these undistributed earnings.
The Andersons, Inc. | 2021 Form 10-K | 54
Significant components of the Company's deferred tax liabilities and assets are as follows:
| December 31, | |||||||||||
| (in thousands) | 2021 | 2020 | |||||||||
| Deferred tax liabilities: | |||||||||||
| Property, plant and equipment and Rail assets leased to others | $ | ( | $ | ( | |||||||
| Identifiable intangibles | ( | ( | |||||||||
| Investments | ( | ( | |||||||||
| Other | ( | ( | |||||||||
| ( | ( | ||||||||||
| Deferred tax assets: | |||||||||||
| Employee benefits | |||||||||||
| Accounts and notes receivable | |||||||||||
| Inventory | |||||||||||
| Federal income tax credits | |||||||||||
| Net operating loss carryforwards | |||||||||||
| Derivative instruments | |||||||||||
| Lease liability | |||||||||||
| Other | |||||||||||
| Total deferred tax assets | |||||||||||
| less: Valuation allowance | |||||||||||
Net deferred tax liabilities(a) | $ | ( | $ | ( | |||||||
(a) The Company had deferred tax assets of $1.5 million included in Other assets in the Consolidated Balance Sheets as of December 31, 2021.
On December 31, 2021, the Company had $30.7 million and $4.7 million of state and non-U.S. net operating loss carryforwards that begin to expire in 2022 and 2035, respectively. The Company also has $2.3 million of U.S. foreign tax credits ("FTCs") carryforwards that begin to expire after 2028. The valuation allowance of $2.8 million is related to tax assets of $2.3 million and $0.5 million for U.S. federal FTCs and net operating loss carryforwards, respectively.
The decrease in net deferred tax liabilities of $100.5 million during the year ended December 31, 2021 was primarily related to a decrease in deferred tax liabilities related to the sale of the Company’s Rail Leasing business during the third quarter of 2021 which are reflected in the Consolidated statements of operations as discontinued operations, net of income taxes.
Deferred income tax assets and liabilities are recognized for the future tax consequences attributable to differences between financial statement carrying amounts of existing assets and liabilities and their respective tax bases and operating loss and tax credit carryforwards. Deferred tax assets and liabilities are measured using enacted tax rates expected to apply to taxable income in the years in which those temporary differences are expected to be recovered or settled. A valuation allowance will be recorded to reduce deferred tax assets if, based on all available evidence, it is considered more likely than not that some portion or all of the recorded deferred tax assets will not be realized in future periods. In assessing the realizability of our deferred tax assets, we consider positive and negative evidence, including historical operating results, future reversals of existing taxable temporary differences, projected future earnings, and tax planning strategies.
The Company, or one of its subsidiaries, files income tax returns in the U.S., multiple foreign, state and local jurisdictions. The Company is no longer subject to examination by taxing authorities in the U.S., foreign, state and local jurisdictions federal taxation for years before 2014. The Company and the Company’s subsidiary partnership returns are under federal tax examination by the Internal Revenue Service (“IRS”) for the tax year 2018 and tax years 2015 through 2018, respectively. The Company’s subsidiary is under federal tax examination by the Mexican tax authorities for tax year 2015. Due to the potential for resolution of U.S. federal, foreign, state and local examinations, and the expiration of various statutes of limitations, it is reasonably possible that the gross unrecognized tax benefits may change within the next 12 months by a range of zero to $2.0 million.
The Andersons, Inc. | 2021 Form 10-K | 55
A reconciliation of the beginning and ending amounts of unrecognized tax benefits is as follows:
| (in thousands) | 2021 | 2020 | 2019 | ||||||||||||||
| Balance at beginning of period | $ | $ | $ | ||||||||||||||
| Tax positions related to the current year | |||||||||||||||||
| Gross additions | |||||||||||||||||
| Tax positions related to prior years | |||||||||||||||||
| Gross additions | |||||||||||||||||
| Gross reductions | ( | ( | ( | ||||||||||||||
| Lapse in statute of limitations | ( | ( | |||||||||||||||
| Balance at end of period | $ | $ | $ | ||||||||||||||
As of December 31, 2021, 2020 and 2019, if our unrecognized tax benefits were recognized in future periods, they would favorably impact our effective tax rate. As of December 31, 2021, unrecognized tax benefits of $51.7 million include $43.0 million associated with the federal and state R&D Credits.
The Company’s practice is to recognize interest and penalties on uncertain tax positions in the provision for income taxes in the Consolidated Statement of Operations. At December 31, 2021, 2020, and 2019, the Company recorded reserves of $2.7 million, $1.8 million and $2.1 million, respectively, of interest and penalties on uncertain tax positions in the Consolidated Balance Sheets.
The Andersons, Inc. | 2021 Form 10-K | 56
9. Accumulated Other Comprehensive Income (Loss)
The following table summarizes the changes in Accumulated other comprehensive income (loss) attributable to the Company ("AOCI") for the twelve months ended December 31, 2021 and 2020:
| Year ended December 31, | ||||||||||||||
| (in thousands) | 2021 | 2020 | ||||||||||||
| Currency Translation Adjustment | ||||||||||||||
| Beginning balance | $ | $ | ||||||||||||
| Other comprehensive income (loss) before reclassifications | ( | |||||||||||||
| Tax effect | ( | |||||||||||||
| Other comprehensive income (loss), net of tax | ( | |||||||||||||
| Ending Balance | $ | $ | ||||||||||||
| Cash Flow Hedges | ||||||||||||||
| Beginning balance | $ | ( | $ | ( | ||||||||||
| Other comprehensive income (loss) before reclassifications | ( | |||||||||||||
| Amounts reclassified from AOCI (a) | ||||||||||||||
| Tax effect | ( | |||||||||||||
| Other comprehensive income (loss), net of tax | ( | |||||||||||||
| Ending Balance | $ | ( | $ | ( | ||||||||||
| Pension and Other Postretirement Plans | ||||||||||||||
| Beginning balance | $ | $ | ||||||||||||
| Other comprehensive income (loss) before reclassifications | ( | |||||||||||||
| Amounts reclassified from AOCI (b) | ( | ( | ||||||||||||
| Tax effect | ( | |||||||||||||
| Other comprehensive income (loss), net of tax | ( | |||||||||||||
| Ending Balance | $ | $ | ||||||||||||
| Investments in Convertible Preferred Securities | ||||||||||||||
| Beginning balance | $ | $ | ||||||||||||
| Other comprehensive income (loss), net of tax | ||||||||||||||
| Ending Balance | $ | $ | ||||||||||||
| Total AOCI Ending Balance | $ | $ | ( | |||||||||||
(a) Amounts reclassified from gain (loss) on cash flow hedges are reclassified from AOCI to income when the hedged item affects earnings and is recognized in Interest expense, net. See Note 5 for additional information.
(b) This accumulated other comprehensive loss component is included in the computation of net periodic benefit cost recorded in Operating, administrative and general expenses.
10. Fair Value Measurements
The following table presents the Company's assets and liabilities measured at fair value on a recurring basis at December 31, 2021 and 2020:
| (in thousands) | December 31, 2021 | ||||||||||||||||||||||
| Assets (liabilities) | Level 1 | Level 2 | Level 3 | Total | |||||||||||||||||||
| Commodity derivatives, net (a) | $ | $ | $ | $ | |||||||||||||||||||
| Provisionally priced contracts (b) | ( | ( | |||||||||||||||||||||
| Convertible preferred securities (c) | |||||||||||||||||||||||
| Other assets and liabilities (d) | ( | ( | |||||||||||||||||||||
| Total | $ | $ | $ | $ | |||||||||||||||||||
The Andersons, Inc. | 2021 Form 10-K | 57
| (in thousands) | December 31, 2020 | ||||||||||||||||||||||
| Assets (liabilities) | Level 1 | Level 2 | Level 3 | Total | |||||||||||||||||||
| Commodity derivatives, net (a) | $ | $ | $ | $ | |||||||||||||||||||
| Provisionally priced contracts (b) | ( | ( | |||||||||||||||||||||
| Convertible preferred securities (c) | |||||||||||||||||||||||
| Other assets and liabilities (d) | ( | ( | |||||||||||||||||||||
| Total | $ | $ | $ | $ | |||||||||||||||||||
(a)Includes associated cash posted/received as collateral.
(b)Included in "Provisionally priced contracts" are those instruments based only on underlying futures values (Level 1) and delayed price contracts (Level 2).
(c)Recorded in “Other assets” on the Company’s Consolidated Balance Sheets related to certain available for sale securities.
(d)Included in other assets and liabilities are assets held by the Company to fund deferred compensation plans and foreign exchange derivative contracts (Level 1), as well as interest rate derivatives (Level 2) .
Level 1 commodity derivatives reflect the fair value of the exchange-traded futures and options contracts that the Company holds, net of the cash collateral that the Company has in its margin account.
The majority of the Company’s assets and liabilities measured at fair value are based on the market approach valuation technique. With the market approach, fair value is derived using prices and other relevant information generated by market transactions involving identical or comparable assets or liabilities.
The Company’s net commodity derivatives primarily consist of futures or options contracts via regulated exchanges and contracts with producers or customers under which the future settlement date and bushels (or gallons in the case of ethanol contracts) of commodities to be delivered (primarily wheat, corn, soybeans and ethanol) are fixed and under which the price may or may not be fixed. Depending on the specifics of the individual contracts, the fair value is derived from the futures or options prices quoted on various exchanges for similar commodities and delivery dates as well as observable quotes for local basis adjustments (the difference, which is attributable to local market conditions, between the quoted futures price and the local cash price). Because “basis” for a particular commodity and location typically has multiple quoted prices from other agribusinesses in the same geographical vicinity and is used as a common pricing mechanism in the agribusiness industry, the Company has concluded that “basis” is typically a Level 2 fair value input for purposes of the fair value disclosure requirements related to our commodity derivatives, depending on the specific commodity. Although nonperformance risk, both of the Company and the counterparty, is present in each of these commodity contracts and is a component of the estimated fair values, based on the Company’s historical experience with its producers and customers and the Company’s knowledge of their businesses, the Company does not view nonperformance risk to be a significant input to fair value for these commodity contracts.
These fair value disclosures exclude RMI which consists of agricultural commodity inventories measured at net realizable value. The net realizable value used to measure the Company’s agricultural commodity inventories is the fair value (spot price of the commodity in an exchange), less cost of disposal and transportation based on the local market. This valuation would generally be considered Level 2. The amount of RMI is disclosed in Note 2. Changes in the net realizable value of commodity inventories are recognized as a component of Cost of sales and merchandising revenues.
Provisionally priced contract liabilities are those for which the Company has taken ownership and possession of grain, but the final purchase price has not been established. In the case of payables where the unpriced portion of the contract is limited to the futures price of the underlying commodity or the Company has delivered a provisionally priced grain and a subsequent payable or receivable is set up for any future changes in the grain price, quoted exchange prices are used and the liability is deemed to be Level 1 in the fair value hierarchy. For all other unpriced contracts which include variable futures and basis components, the amounts recorded for delayed price contracts are determined on the basis of local grain market prices at the balance sheet date and, as such, are deemed to be Level 2 in the fair value hierarchy.
The convertible preferred securities are interests in several early-stage enterprises that may be in various forms, such as convertible debt or preferred equity securities.
The Andersons, Inc. | 2021 Form 10-K | 58
A reconciliation of beginning and ending balances for the Company’s fair value measurements using Level 3 inputs is as follows:
| Convertible Preferred Securities | |||||||||||
| (in thousands) | 2021 | 2020 | |||||||||
| Assets at January 1, | $ | $ | |||||||||
| Additional investments | |||||||||||
| Losses included in Other income, net | ( | ||||||||||
| Assets at December 31, | $ | $ | |||||||||
The following tables summarize quantitative information about the Company's Level 3 fair value measurements as of December 31, 2021 and 2020:
| Quantitative Information about Recurring Level 3 Fair Value Measurements | |||||||||||||||||||||||
| (in thousands) | Fair Value as of 12/31/2021 | Valuation Method | Unobservable Input | Weighted Average | |||||||||||||||||||
| Convertible preferred securities (a) | $ | Implied based on market prices | N/A | N/A | |||||||||||||||||||
| (in thousands) | Fair Value as of 12/31/2020 | Valuation Method | Unobservable Input | Weighted Average | |||||||||||||||||||
| Convertible preferred securities (a) | $ | Implied based on market prices | N/A | N/A | |||||||||||||||||||
(a) The Company considers observable price changes and other additional market data available to estimate fair value, including additional capital raising, internal valuation models, progress towards key business milestones, and other relevant market data points.
| Quantitative Information about Non-Recurring Level 3 Fair Value Measurements | |||||||||||||||||||||||
| (in thousands) | Fair Value as of 12/31/2021 | Valuation Method | Unobservable Input | Weighted Average | |||||||||||||||||||
| Frac sand assets (a) | $ | Third party appraisal | Various | N/A | |||||||||||||||||||
| Real property (b) | Market approach | Various | N/A | ||||||||||||||||||||
(a) The Company recognized impairment charges on long lived related to its frac sand business. The fair value of the assets were determined using prior transactions and third-party appraisals. These measures are considered Level 3 inputs on a nonrecurring basis.
(b) The Company recognized impairment charges on certain Trade assets and measured the fair value using Level 3 inputs on a nonrecurring basis. The fair value of the assets were determined using prior transactions in the local market and a recent sale of comparable Trade group assets held by the Company.
There were no non-recurring fair value measurements as of December, 31 2020.
The fair value of the Company’s cash equivalents, accounts receivable and accounts payable approximate their carrying value as they are close to maturity.
11. Related Party Transactions
Equity Method Investments
The Company, directly or indirectly, holds investments in companies that are accounted for under the equity method. The Company’s equity in these entities is generally presented at cost plus its accumulated proportional share of income or loss, less any distributions it has received, or other-than-temporary impairments recognized. The amount of equity method investments has decreased substantially as two acquisitions in 2019 resulted in the consolidation of the former equity method investments. In January 2019, the Company purchased the remaining equity of Lansing Trade Group and Thompsons Limited and in October 2019, the Company merged its existing equity method ethanol investments to create the consolidated entity of TAMH.
The Andersons, Inc. | 2021 Form 10-K | 59
The following table presents aggregate summarized financial information of the Company's equity method investments as they qualified as significant equity method investees in the aggregate for the year ended December 31, 2019. No individual equity investments qualified as significant for the years presented.
| Year Ended December 31, | |||||||||||||||||
| (in thousands) | 2021 | 2020 | 2019 | ||||||||||||||
| Sales | $ | $ | $ | ||||||||||||||
| Gross profit | |||||||||||||||||
| Income from continuing operations | |||||||||||||||||
| Net income | |||||||||||||||||
| Current assets | |||||||||||||||||
| Non-current assets | |||||||||||||||||
| Current liabilities | |||||||||||||||||
| Non-current liabilities | |||||||||||||||||
The following table presents the Company’s investment balance in each of its equity method investees by entity:
| December 31, | |||||||||||
| (in thousands) | 2021 | 2020 | |||||||||
| Providence Grain Group Inc. (a) | $ | $ | |||||||||
| Quadra Commodities S.A. | |||||||||||
| Other | |||||||||||
| Total | $ | $ | |||||||||
(a) At December 31, 2021, the aggregate unamortized basis difference of the Company's investment in Providence Grain Group Inc. of $5.0 million is primarily attributable to the difference between the amount for which the Company recorded other-than-temporary impairment charges and the historical carrying value of the net assets of the entity. This difference is being amortized over the remaining useful life of the related assets and included in the reported amount of income from unconsolidated entities.
The following table summarizes income (losses) from the Company’s equity method investments by entity:
% Ownership at December 31, 2021 | Year Ended December 31, | ||||||||||||||||||||||
| (in thousands) | 2021 | 2020 | 2019 | ||||||||||||||||||||
| Providence Grain Group Inc. (a) | $ | $ | ( | $ | ( | ||||||||||||||||||
| Quadra Commodities S.A. (a) | |||||||||||||||||||||||
| The Andersons Albion Ethanol LLC (b) | N/A | ( | |||||||||||||||||||||
| The Andersons Clymers Ethanol LLC (b) | N/A | ( | |||||||||||||||||||||
| The Andersons Marathon Ethanol LLC (b) | N/A | ||||||||||||||||||||||
| Other | ( | ( | ( | ||||||||||||||||||||
| Total | $ | $ | $ | ( | |||||||||||||||||||
(a) The Company acquired the equity method investments in Providence Grain Group Inc. and Quadra Commodities S.A. through the consolidation of Lansing Trade Group in 2019.
(b) The Company previously owned approximately 55 %, 39 %, 33 % in The Andersons Albion LLC, The Andersons Clymers Ethanol LLC and The Andersons Marathon Ethanol LLC, respectively. Effective October 1, 2019, the Company contributed its interests in these three entities into TAMH. The transaction resulted in the consolidation of these entities into the Company's Consolidated Financial Statements.
Total distributions received from unconsolidated affiliates were de minimis for the year ended December 31, 2021.
The Andersons, Inc. | 2021 Form 10-K | 60
Related Party Transactions
In the ordinary course of business and on an arms-length basis, the Company will enter into related party transactions with certain of the investments described above, along with other related parties.
The following table sets forth the related party transactions entered into for the time periods presented:
| Year Ended December 31, | |||||||||||||||||
| (in thousands) | 2021 | 2020 | 2019 | ||||||||||||||
| Sales revenues | $ | $ | $ | ||||||||||||||
| Service fee revenues (a) | |||||||||||||||||
| Purchases of product (b) | |||||||||||||||||
| Lease income (c) | |||||||||||||||||
| Labor and benefits reimbursement (d) | |||||||||||||||||
(a)Prior period service fee revenues include management fees, corn origination fees, ethanol and distillers dried grains ("DDG") marketing fees, and other commissions. All activity subsequent to the TAMH merger on October 1, 2019 has been eliminated in consolidation.
(b)Prior period purchases of product include ethanol and co-products purchased from the unconsolidated ethanol LLCs. All activity subsequent to the TAMH merger on October 1, 2019 has been eliminated in consolidation.
(c)Prior period lease income includes certain railcars leased to related parties and the lease of the Company’s Albion, Michigan and Clymers, Indiana grain facilities. All activity subsequent to the TAMH merger on October 1, 2019 has been eliminated in consolidation.
(d)Prior period labor and benefits reimbursement includes all operations labor to the unconsolidated ethanol equity investments. All activity subsequent to the TAMH merger on October 1, 2019 has been eliminated in consolidation.
| December 31, | |||||||||||
| (in thousands) | 2021 | 2020 | |||||||||
| Accounts receivable (e) | $ | $ | |||||||||
| Accounts payable (f) | |||||||||||
(e)Accounts receivable represents amounts due from related parties for sales of ethanol and other various items.
(f)Accounts payable represents amounts due to related parties for purchases of equipment, denaturant and other various items.
12. Segment Information
The Company’s operations include three reportable business segments that are distinguished primarily on the basis of products and services offered as well as the structure of management. The Trade business includes commodity merchandising and the operation of terminal grain elevator facilities. The Renewables business produces, purchases and sells ethanol and co-products. The group also operates a merchandising and trade portfolio of ethanol, ethanol co-products and other biofuels such as renewable diesel. The Plant Nutrient business manufactures and distributes agricultural inputs, primary nutrients and specialty fertilizers, to dealers and farmers, along with turf care and corncob-based products. Included in Other are the corporate level costs not attributed to an operating segment.
In the third quarter of 2021, the Company sold its Rail Leasing assets and announced its intentions of selling the remainder of the assets reported under the prior Rail segment. Prior year results have been recast to reflect this change. See Note 16 for further details of the divestiture of the Rail segment.
The segment information below includes the allocation of expenses shared by one or more operating segments. Although management believes such allocations are reasonable, the operating information does not necessarily reflect how such data might appear if the segments were operated as separate businesses. The Company does not have any customers who represent 10 percent, or more, of total revenues.
| Year Ended December 31, | |||||||||||||||||
| (in thousands) | 2021 | 2020 | 2019 | ||||||||||||||
| Revenues from external customers | |||||||||||||||||
| Trade | $ | $ | $ | ||||||||||||||
| Renewables | |||||||||||||||||
| Plant Nutrient | |||||||||||||||||
| Total | $ | $ | $ | ||||||||||||||
The Andersons, Inc. | 2021 Form 10-K | 61
| Year Ended December 31, | |||||||||||||||||
| (in thousands) | 2021 | 2020 | 2019 | ||||||||||||||
| Interest expense (income) | |||||||||||||||||
| Trade | $ | $ | $ | ||||||||||||||
| Renewables | |||||||||||||||||
| Plant Nutrient | |||||||||||||||||
| Other | ( | ( | |||||||||||||||
| Total | $ | $ | $ | ||||||||||||||
| Year Ended December 31, | |||||||||||||||||
| (in thousands) | 2021 | 2020 | 2019 | ||||||||||||||
| Equity in earnings (losses) of affiliates | |||||||||||||||||
| Trade | $ | $ | $ | ( | |||||||||||||
| Renewables | ( | ||||||||||||||||
| Total | $ | $ | $ | ( | |||||||||||||
| Year Ended December 31, | |||||||||||||||||
| (in thousands) | 2021 | 2020 | 2019 | ||||||||||||||
| Other income, net | |||||||||||||||||
| Trade | $ | $ | $ | ||||||||||||||
| Renewables | |||||||||||||||||
| Plant Nutrient | |||||||||||||||||
| Other | ( | ||||||||||||||||
| Total | $ | $ | $ | ||||||||||||||
| Year Ended December 31, | |||||||||||||||||
| (in thousands) | 2021 | 2020 | 2019 | ||||||||||||||
| Income (loss) before income taxes from continuing operations | |||||||||||||||||
| Trade | $ | $ | $ | ( | |||||||||||||
Renewables1 | ( | ||||||||||||||||
| Plant Nutrient | |||||||||||||||||
| Other | ( | ( | ( | ||||||||||||||
| Income (loss) before income taxes from continuing operations | $ | $ | ( | $ | |||||||||||||
1 Includes income (loss) attributable to noncontrolling interests of $31.9 million, $(21.9 ) million and $(3.2 ) million for the years ended December 31, 2021, 2020 and 2019, respectively.
| Year Ended December 31, | |||||||||||
| (in thousands) | 2021 | 2020 | |||||||||
| Identifiable assets | |||||||||||
| Trade | $ | $ | |||||||||
| Renewables | |||||||||||
| Plant Nutrient | |||||||||||
| Other | |||||||||||
| Total assets of continuing operations | |||||||||||
| Assets of discontinued operations | |||||||||||
| Total | $ | $ | |||||||||
The Andersons, Inc. | 2021 Form 10-K | 62
| Year Ended December 31, | |||||||||||||||||
| (in thousands) | 2021 | 2020 | 2019 | ||||||||||||||
| Capital expenditures | |||||||||||||||||
| Trade | $ | $ | $ | ||||||||||||||
| Renewables | |||||||||||||||||
| Plant Nutrient | |||||||||||||||||
| Other | |||||||||||||||||
| Total | $ | $ | $ | ||||||||||||||
| Year Ended December 31, | |||||||||||||||||
| (in thousands) | 2021 | 2020 | 2019 | ||||||||||||||
| Depreciation and amortization | |||||||||||||||||
| Trade | $ | $ | $ | ||||||||||||||
| Renewables | |||||||||||||||||
| Plant Nutrient | |||||||||||||||||
| Other | |||||||||||||||||
| Total from continuing operations | |||||||||||||||||
| Discontinued operations | |||||||||||||||||
| Total | $ | $ | $ | ||||||||||||||
| Year Ended December 31, | |||||||||||||||||
| (in thousands) | 2021 | 2020 | 2019 | ||||||||||||||
| Revenues from external customers by geographic region | |||||||||||||||||
| United States | $ | $ | $ | ||||||||||||||
| Canada | |||||||||||||||||
| Mexico | |||||||||||||||||
| Switzerland | |||||||||||||||||
| Other | |||||||||||||||||
| Total | $ | $ | $ | ||||||||||||||
13. Leases
The Andersons, Inc. | 2021 Form 10-K | 63
The following table summarizes the amounts recognized in the Company's Consolidated Balance Sheets related to leases:
| December 31, | ||||||||||||||||||||
| (in thousands) | Consolidated Balance Sheet Classification | 2021 | 2020 | |||||||||||||||||
| Assets | ||||||||||||||||||||
| Operating lease assets | Right of use assets, net | $ | $ | |||||||||||||||||
| Finance lease assets | ||||||||||||||||||||
| Total leased assets | ||||||||||||||||||||
| Liabilities | ||||||||||||||||||||
| Current operating leases | ||||||||||||||||||||
| Non-current operating leases | Long-term lease liabilities | |||||||||||||||||||
| Total operating lease liabilities | ||||||||||||||||||||
| Current finance leases | ||||||||||||||||||||
| Non-current finance leases | ||||||||||||||||||||
| Total finance lease liabilities | ||||||||||||||||||||
| Total lease liabilities | $ | $ | ||||||||||||||||||
The components of lease cost recognized within the Company's Consolidated Statement of Operations were as follows:
| Year Ended December 31, | ||||||||||||||||||||||||||
| (in thousands) | Consolidated Statement of Operations Classification | 2021 | 2020 | 2019 | ||||||||||||||||||||||
| Lease cost: | ||||||||||||||||||||||||||
| Operating lease cost | Cost of sales and merchandising revenues | $ | $ | $ | ||||||||||||||||||||||
| Operating lease cost | Operating, administrative and general expenses | |||||||||||||||||||||||||
| Finance lease cost | ||||||||||||||||||||||||||
| Amortization of right-of-use assets | Cost of sales and merchandising revenues | |||||||||||||||||||||||||
| Amortization of right-of-use assets | Operating, administrative and general expenses | |||||||||||||||||||||||||
| Interest expense on lease liabilities | Interest expense, net | |||||||||||||||||||||||||
| Short-term lease cost | Cost of sales and merchandising revenues | |||||||||||||||||||||||||
| Variable lease cost | Cost of sales and merchandising revenues | |||||||||||||||||||||||||
| Variable lease cost | Operating, administrative and general expenses | |||||||||||||||||||||||||
| Total lease cost | $ | $ | $ | |||||||||||||||||||||||
The Company often has the option to renew lease terms for buildings and other assets. The exercise of a lease renewal option is generally at the sole discretion of the Company. In addition, certain lease agreements may be terminated prior to their original expiration date at the discretion of the Company. Each renewal and termination option is evaluated at the lease commencement date to determine if the Company is reasonably certain to exercise the option on the basis of economic factors. The following table summarizes the weighted-average remaining lease terms:
| As of December 31, | |||||||||||
| Weighted-Average Remaining Lease Term | 2021 | 2020 | |||||||||
| Operating leases | |||||||||||
| Finance leases | |||||||||||
The Andersons, Inc. | 2021 Form 10-K | 64
The discount rate implicit within our leases is generally not determinable and therefore the Company determines the discount rate based on its incremental borrowing rate. The incremental borrowing rate for each lease is determined based on its term and the currency in which lease payments are made, adjusted for the impacts of collateral. The following table summarizes the weighted-average discount rate used to measure the Company's lease liabilities:
| As of December 31, | |||||||||||
| Weighted-Average Discount Rate | 2021 | 2020 | |||||||||
| Operating leases | % | % | |||||||||
| Finance leases | % | % | |||||||||
Supplemental Cash Flow Information Related to Leases
| Year Ended December 31, | |||||||||||||||||
| (in thousands) | 2021 | 2020 | 2019 | ||||||||||||||
| Cash paid for amounts included in the measurement of lease liabilities: | |||||||||||||||||
| Operating cash flows from operating leases | $ | $ | $ | ||||||||||||||
| Operating cash flows from finance leases | |||||||||||||||||
| Financing cash flows from finance leases | |||||||||||||||||
| Right-of-use assets obtained in exchange for lease obligations: | |||||||||||||||||
| Operating leases | |||||||||||||||||
| Finance leases | |||||||||||||||||
Maturity Analysis of Leases Liabilities
| December 31, 2021 | |||||||||||||||||
| (in thousands) | Operating Leases | Finance Leases | Total | ||||||||||||||
| 2022 | $ | $ | $ | ||||||||||||||
| 2023 | |||||||||||||||||
| 2024 | |||||||||||||||||
| 2025 | |||||||||||||||||
| 2026 | |||||||||||||||||
| Thereafter | |||||||||||||||||
| Total lease payments | |||||||||||||||||
| Less: interest | |||||||||||||||||
| Total | $ | $ | $ | ||||||||||||||
| December 31, 2020 | |||||||||||||||||
| (in thousands) | Operating Leases | Finance Leases | Total | ||||||||||||||
| 2021 | $ | $ | $ | ||||||||||||||
| 2022 | |||||||||||||||||
| 2023 | |||||||||||||||||
| 2024 | |||||||||||||||||
| 2025 | |||||||||||||||||
| Thereafter | |||||||||||||||||
| Total lease payments | |||||||||||||||||
| Less: interest | |||||||||||||||||
| Total | $ | $ | $ | ||||||||||||||
The Andersons, Inc. | 2021 Form 10-K | 65
14. Commitments and Contingencies
Litigation activities
The Company is party to litigation, or threats thereof, both as defendant and plaintiff with some regularity, although individual cases that are material in size occur infrequently. As a defendant, the Company establishes reserves for claimed amounts that are considered probable and capable of estimation. If those cases are resolved for lesser amounts, the excess reserves are taken into income and, conversely, if those cases are resolved for larger than the amount the Company has accrued, the Company records additional expense. The Company believes it is unlikely that the results of its current legal proceedings for which it is the defendant, even if unfavorable, will be material. As a plaintiff, amounts that are collected can also result in sudden, non-recurring income.
Litigation results depend upon a variety of factors, including the availability of evidence, the credibility of witnesses, the performance of counsel, the state of the law, and the impressions of judges and jurors, any of which can be critical in importance, yet difficult, if not impossible, to predict. Consequently, cases currently pending, or future matters, may result in unexpected, and non-recurring losses, or income, from time to time. Finally, litigation results are often subject to judicial reconsideration, appeal and further negotiation by the parties, and as a result, the final impact of a particular judicial decision may be unknown for some time or may result in continued reserves to account for the potential of such post-verdict actions.
Specifically, the Company is party to a non-regulatory litigation claim, which is in response to penalties and fines paid to regulatory entities by a previously unconsolidated subsidiary in 2018 for the settlement of matters which focused on certain trading activity. While the Company believes it has meritorious defenses against the suit, the ultimate resolution of the matter could result in a loss in excess of the amount accrued. Given the status of the claim, the Company does not believe the excess, net of the acquisition-related indemnity, will be material.
The estimated losses for all other outstanding claims that are considered reasonably possible are not material.
Commitments
As of December 31, 2021, the Company carries $1.0 million in industrial revenue bonds with the City of Colwich, Kansas (the "City") that mature in 2029, and leases back facilities owned by the City that the Company recorded as property, plant, and equipment, net, on its Consolidated Balance Sheets under a finance lease. The lease payment on the facilities is sufficient to pay principal and interest on the bonds. Because the Company owns all of the outstanding bonds, has a legal right to set-off, and intends to set-off the corresponding lease and interest payment, the Company netted the finance lease obligation with the bond asset and, in turn, reflected no amount for the obligation or the corresponding asset on its Consolidated Balance Sheets at December 31, 2021.
15. Stock Compensation Plans
The Company's 2019 Long-Term Incentive Compensation Plan, dated February 22, 2019 and subsequently approved by Shareholders on May 10, 2019, is authorized to issue up to 2.3 million shares of common stock as options, share appreciation rights, restricted shares and units, performance shares and units and other stock or cash-based awards. Approximately 0.2 million shares remain available for issuance at December 31, 2021.
Stock-based compensation expense for all stock-based compensation awards are based on the grant-date fair value. The Company recognizes these compensation costs on a straight-line basis over the requisite service period of the award and recognized forfeitures as they occur. Total compensation expense recognized in the Consolidated Statements of Operations for all stock compensation programs was $11.0 million, $9.8 million, and $15.8 million for the years ended December 31, 2021, 2020 and 2019, respectively. Of the expense recognized, approximately $1.3 million, $4.3 million and $9.4 million were related to awards granted as part of the Lansing Acquisition 2018 Inducement and Retention Award Plan for the years ended December 31, 2021, 2020 and 2019, respectively.
Non-Qualified Stock Options ("Options")
In 2015, the Company granted 325 thousand non-qualified stock options upon hiring of a senior executive. The fair value of the options was estimated at the date of grant under the Black-Scholes option pricing model. The options have a term of seven years with a weighted-average exercise price of $35.40 and have since fully vested.
The Andersons, Inc. | 2021 Form 10-K | 66
A reconciliation of the number of Options outstanding under the 2014 Long Term Incentive Compensation Plan as of December 31, 2021, and changes during the period then ended, is as follows:
| Shares (in thousands) | Weighted-Average Exercise Price | ||||||||||
Outstanding at January 1, 2021 | $ | ||||||||||
| Exercised | ( | ||||||||||
Outstanding at December 31, 2021 | $ | ||||||||||
For the year ended December 31, 2021, there were no options granted, cancelled or forfeited; and all options outstanding as of December 31, 2021 were vested and exercisable. The total intrinsic value of the options exercised for the year ended December 31, 2021 was $0.6 million and the aggregate intrinsic value of options outstanding as of December 31, 2021 was $0.5 million. The Company expects all remaining options outstanding as of December 31, 2021 to be exercised in 2022 as all remaining options outstanding expire in November of 2022.
As of December 31, 2021, there was no unrecognized compensation cost related to Options.
Restricted Stock Awards ("RSAs")
These awards carry voting and dividend equivalent rights upon vesting; however, sale of the shares is restricted prior to vesting. RSAs graded vest over a period of 3 years. Total restricted stock expense is equal to the market value of the Company's common shares on the date of the award and is recognized over the service period on a straight-line basis.
A summary of the status of the Company's non-vested RSAs as of December 31, 2021, and changes during the period then ended, is presented below:
| Shares (in thousands) | Weighted-Average Grant-Date Fair Value | ||||||||||
Non-vested at January 1, 2021 | $ | ||||||||||
| Granted | |||||||||||
| Vested | ( | ||||||||||
| Forfeited | ( | ||||||||||
Non-vested at December 31, 2021 | $ | ||||||||||
| Year ended December 31, | |||||||||||||||||
| 2021 | 2020 | 2019 | |||||||||||||||
Total fair value of shares vested (in thousands) | $ | $ | $ | ||||||||||||||
| Weighted-average fair value of RSAs granted | $ | $ | $ | ||||||||||||||
As of December 31, 2021, there was $2.2 million of total unrecognized compensation cost related to non-vested RSAs that is expected to be recognized over a weighted-average period of 1.2 years.
Earnings Per Share-Based Performance Share Units (“EPS PSUs”)
Each EPS PSU gives the participant the right to receive common shares dependent on the achievement of specified performance results over a 3 -year performance period. At the end of the performance period, the number of shares of stock issued will be determined by adjusting the award upward or downward from a target award. Fair value of EPS PSUs issued is based on the market value of the Company's common shares on the date of the award. The related compensation expense is recognized over the performance period when achievement of the award is probable and is adjusted for changes in the number of shares expected to be issued if changes in performance are expected. Currently, the Company is accounting for the awards granted in 2021, 2020 and 2019 at 100 %, 61 % and 28 % of the maximum amount available for issuance, respectively.
The Andersons, Inc. | 2021 Form 10-K | 67
A summary of the status of the Company's EPS PSUs as of December 31, 2021, and changes during the period then ended, is presented below:
| Shares (in thousands) | Weighted-Average Grant-Date Fair Value | ||||||||||
Non-vested at January 1, 2021 | $ | ||||||||||
| Granted | |||||||||||
| Vested | |||||||||||
| Forfeited | ( | ||||||||||
Non-vested at December 31, 2021 | $ | ||||||||||
| Year ended December 31, | |||||||||||||||||
| 2021 | 2020 | 2019 | |||||||||||||||
| Weighted-average fair value of EPS PSUs granted | $ | $ | $ | ||||||||||||||
As of December 31, 2021, there was $3.4 million unrecognized compensation cost related to non-vested EPS PSUs that is expected to be recognized over a weighted-average period of 1.3 years.
Total Shareholder Return-Based Performance Share Units (“TSR PSUs”)
Each TSR PSU gives the participant the right to receive common shares dependent on total shareholder return over a 3-year period. At the end of the period, the number of shares of stock issued will be determined by adjusting the award upward or downward from a target award. Fair value of TSR PSUs was estimated at the date of grant using a Monte Carlo Simulation with the following assumptions: Expected volatility was estimated based on the historical volatility of the Company's common shares over the 2.83 years period prior to the grant date. The average expected life was based on the contractual term of the plan. The risk-free rate is based on the U.S. Treasury Strips available with maturity period consistent with the expected life.
| 2021 | |||||
| Risk free interest rate | |||||
| Dividend yield | |||||
| Volatility factor of the expected market price of the common shares | |||||
| Expected term (in years) | |||||
| Correlation coefficient | |||||
A summary of the status of the Company's TSR PSUs as of December 31, 2021, and changes during the period then ended, is presented below:
| Shares (in thousands) | Weighted-Average Grant-Date Fair Value | ||||||||||
Non-vested at January 1, 2021 | $ | ||||||||||
| Granted | |||||||||||
| Vested | |||||||||||
| Forfeited | ( | ||||||||||
Non-vested at December 31, 2021 | $ | ||||||||||
| Year ended December 31, | |||||||||||||||||
| 2021 | 2020 | 2019 | |||||||||||||||
| Weighted-average fair value of TSR PSUs granted | $ | $ | $ | ||||||||||||||
As of December 31, 2021, there was approximately $2.2 million unrecognized compensation cost related to non-vested TSR PSUs that is expected to be recognized over a weighted-average period of 1.3 years.
The Andersons, Inc. | 2021 Form 10-K | 68
Employee Share Purchase Plan (the “ESP Plan”)
The Company's 2019 ESP Plan is authorized to issue up to 230 thousand common shares. The ESP Plan allows employees to purchase common shares through payroll withholdings. The Company has approximately 120 thousand common shares remaining available for issuance to and purchase by employees under this plan. The ESP Plan also contains an option component. The purchase price per share under the ESP Plan is the lower of the market price at the beginning or end of the year. The Company records a liability for withholdings not yet applied towards the purchase of common stock. This liability is included in Accrued expenses and other current liabilities on the Consolidated Balance Sheets.
The fair value of the option component of the ESP Plan is estimated at the date of grant under the Black-Scholes option pricing model with the following assumptions at the grant date. Expected volatility was estimated based on the historical volatility of the Company's common shares over the past year. The average expected life was based on the contractual term of the plan. The risk-free rate is based on the U.S. Treasury yield curve rate with a one year term. Forfeitures are estimated at the date of grant based on historical experience.
| Year ended December 31, | |||||||||||||||||
| 2021 | 2020 | 2019 | |||||||||||||||
| Risk free interest rate | % | % | % | ||||||||||||||
| Dividend yield | % | % | % | ||||||||||||||
| Volatility factor of the expected market price of the common shares | % | % | % | ||||||||||||||
Expected life for the options (in years) | |||||||||||||||||
16. Discontinued Operations
On August 16, 2021, the Company entered into a definitive agreement under which the Company sold the assets of the Company’s Rail Leasing business for a cash purchase price of approximately $543.1 million which resulted in a loss of $1.5 million. In conjunction with the sale of the Rail Leasing business, the Company announced its intent to divest the remaining pieces of the Rail Leasing business and the Rail Repair business.
| Year ended December 31, | |||||||||||||||||
| (in thousands) | 2021 | 2020 | 2019 | ||||||||||||||
| Sales and merchandising revenues | $ | $ | $ | ||||||||||||||
| Cost of sales and merchandising revenues | |||||||||||||||||
| Gross profit | |||||||||||||||||
| Operating, administrative and general expenses | |||||||||||||||||
| Asset impairment | |||||||||||||||||
| Interest expense, net | |||||||||||||||||
| Other income, net: | |||||||||||||||||
| Income from discontinued operations before income taxes | |||||||||||||||||
| Income tax provision | |||||||||||||||||
| Income from discontinued operations, net of income taxes | $ | $ | $ | ||||||||||||||
The Andersons, Inc. | 2021 Form 10-K | 69
The following table summarizes the assets and liabilities which are classified as held-for-sale in the Consolidated Balance Sheets as of December 31, 2021 and 2020.
| (in thousands) | December 31, 2021 | December 31, 2020 | |||||||||
| Assets | |||||||||||
| Current assets: | |||||||||||
| Accounts receivable, net | $ | $ | |||||||||
| Inventories | |||||||||||
| Other current assets | |||||||||||
| Current assets held-for-sale | |||||||||||
| Other assets: | |||||||||||
| Rail assets leased to others, net | |||||||||||
| Property, plant and equipment, net | |||||||||||
| Goodwill | |||||||||||
| Other intangible assets, net | |||||||||||
| Right of use assets, net | |||||||||||
| Other assets, net | |||||||||||
| Non-current assets held-for-sale | |||||||||||
| Total assets held-for-sale | $ | $ | |||||||||
| Liabilities | |||||||||||
| Current liabilities: | |||||||||||
| Trade and other payables | $ | $ | |||||||||
| Customer prepayments and deferred revenue | |||||||||||
| Current maturities of long-term debt | |||||||||||
| Current operating lease liability | |||||||||||
| Accrued expenses and other current liabilities | |||||||||||
| Current liabilities held-for-sale | |||||||||||
| Long-term lease liabilities | |||||||||||
| Long-term debt, less current maturities | |||||||||||
| Other long-term liabilities | |||||||||||
| Non-current liabilities held-for-sale | |||||||||||
| Total liabilities held-for-sale | $ | $ | |||||||||
The following table summarizes cash flow data relating to discontinued operations for the years ended December 31, 2021, 2020 and 2019, respectively:
| Year Ended December 31, | |||||||||||||||||
| (in thousands) | 2021 | 2020 | 2019 | ||||||||||||||
| Depreciation and amortization | $ | $ | $ | ||||||||||||||
| Capital expenditures | ( | ( | ( | ||||||||||||||
| Proceeds from sale of assets | |||||||||||||||||
| Loss on sale of discontinued operations | |||||||||||||||||
| Non-cash operating activities - gain on sale of railcars | ( | ( | ( | ||||||||||||||
| Non-cash operating activities - fixed asset impairment | |||||||||||||||||
| Non-cash investing activities - capital expenditures, consisting of unpaid capital expenditure liabilities at period end | |||||||||||||||||
The Andersons, Inc. | 2021 Form 10-K | 70
17. Goodwill and Other Intangible Assets
The changes in the carrying amount of goodwill by reportable segment for the years ended December 31, 2021, 2020 and 2019 are as follows:
| (in thousands) | Trade | Renewables | Plant Nutrient | Total | ||||||||||||||||||||||
Balance at January 1, 2019 | $ | $ | $ | $ | ||||||||||||||||||||||
| Acquisitions | ||||||||||||||||||||||||||
Balance at December 31, 2019 | ||||||||||||||||||||||||||
| Reorganization | ( | |||||||||||||||||||||||||
| Acquisitions | ||||||||||||||||||||||||||
Balance at December 31, 2020 | ||||||||||||||||||||||||||
| Disposals (a) | ( | ( | ||||||||||||||||||||||||
Balance at December 31, 2021 | $ | $ | $ | $ | ||||||||||||||||||||||
Goodwill for the Trade segment is $119.9 million as of December 31, 2021 which is net of prior years' accumulated impairment losses of $46.4 million. Goodwill for the Plant Nutrient segment is $0.7 million, net of accumulated impairment losses of $68.9 million as of December 31, 2021.
The Company had goodwill of approximately $129.3 million at December 31, 2021, which includes approximately $78.5 million related to the Company's Grain Storage and Merchandising ("GSM") reporting unit, approximately $41.3 million related to the Company's Food and Specialty Ingredients ("FSI") reporting unit, approximately $8.8 million related to the Company's Renewables reporting unit and approximately $0.7 million is related to the Lawn reporting unit.
Goodwill is tested for impairment annually as of October 1, or more frequently if impairment indicators arise. The Company uses a one-step quantitative approach that compares the business enterprise value ("BEV") of each reporting unit with its carrying value. The BEV was computed based on both an income approach (discounted cash flows) and a market approach. The income approach uses a reporting unit's estimated future cash flows, discounted at the weighted-average cost of capital ("WACC") of a hypothetical third-party buyer. The WACC is the rate used to discount each reporting unit’s estimated future cash flows. The WACC is calculated based on the proportionate weighting of the cost of debt and equity. The cost of equity is based on a risk-free interest rate and an equity risk factor, which is derived from public companies similar to the reporting units and which captures the perceived risks and uncertainties associated with the reporting unit's cash flows. The cost of debt is the rate that a prudent investor would require to lend money to the reporting units on an after tax basis and is estimated based on a market-derived analysis of corporate bond yields. The cost of debt and equity is weighted based on the debt to market capitalization ratio of publicly traded companies with similarities to the reporting units being tested. The WACC applied in each reporting unit's last quantitative test ranged from 8.50 % to 11.25 %, which includes a company specific risk premium range from 2.0 % to 4.0 %. Differences in the WACC used between reporting units is primarily due to distinct risks and uncertainties regarding the cash flows of the different reporting units.
The market approach estimates fair value by applying cash flow multiples to the reporting unit's operating performance. The multiples are derived from comparable publicly traded companies with similar operating and investment characteristics to the reporting unit. Any excess of the carrying value of the goodwill over the BEV will be recorded as an impairment loss. The calculation of the BEV is based on significant unobservable inputs, such as price trends, customer demand, material costs and discount rates, and are classified as Level 3 in the fair value hierarchy.
There can be no assurance that anticipated financial results will be achieved and the goodwill balances remain susceptible to future impairment charges. The goodwill related to the GSM and FSI reporting units are determined to have the greatest risk of future impairment charges given the difference (approximately 26 % and 24 %, respectively) between the BEV and carrying value of these reporting units as of the Company's annual impairment test date. The BEVs of the Company's other reporting units more substantially exceed their carrying values. If the Company's projected future cash flows were lower, or if the assumed weighted-average cost of capital were higher, the testing performed at year-end may have indicated an impairment of the goodwill related to one or more of the Company's reporting units. Any impairment charges that the Company may take in the future could be material to its Consolidated statements of operations and financial condition.
The Andersons, Inc. | 2021 Form 10-K | 71
No goodwill impairment charges were incurred in the years ended December 31, 2021, 2020 or 2019 as a result of our annual impairment testing.
The Company's other intangible assets are as follows:
| December 31, | |||||||||||||||||||||||||||||||||||||||||||||||
| 2021 | 2020 | ||||||||||||||||||||||||||||||||||||||||||||||
| (in thousands) | Useful Life (in years) | Original Cost | Accumulated Amortization | Net Book Value | Original Cost | Accumulated Amortization | Net Book Value | ||||||||||||||||||||||||||||||||||||||||
| Intangible asset class | |||||||||||||||||||||||||||||||||||||||||||||||
| Customer lists | to | $ | $ | $ | $ | $ | $ | ||||||||||||||||||||||||||||||||||||||||
| Non-compete agreements | to | ||||||||||||||||||||||||||||||||||||||||||||||
| Supply agreement | to | ||||||||||||||||||||||||||||||||||||||||||||||
| Technology | to | ||||||||||||||||||||||||||||||||||||||||||||||
| Trademarks and patents | to | ||||||||||||||||||||||||||||||||||||||||||||||
| Software | to | ||||||||||||||||||||||||||||||||||||||||||||||
| Other | to | ||||||||||||||||||||||||||||||||||||||||||||||
| $ | $ | $ | $ | $ | $ | ||||||||||||||||||||||||||||||||||||||||||
Amortization expense for intangible assets was $30.3 million, $30.7 million and $33.0 million for the years ended December 31, 2021, 2020 and 2019, respectively. Expected future annual amortization expense for the assets above is as follows: 2022 -- $23.4 million; 2023 -- $22.8 million; 2024 -- $19.7 million; 2025 -- $13.5 million; and 2026 -- $11.5 million.
In 2019, the Company recorded impairment charges of $2.5 million for intangibles in the Trade segment related to a frac sand non-compete agreement. The Company also recorded a $2.2 million impairment charge for brand related intangibles within the Plant Nutrient segment.
18. Sale of Assets
During 2021, The Company sold its grain assets in Champaign, Illinois including working capital for $23.3 million which resulted in a $14.6 million gain recorded in Other income, net. The Company has collected $18.1 million of cash proceeds as of December 31, 2021, with the remaining $5.2 million to be collected upon the completion of property severances. The Company also sold its Rail Leasing business which is described in further detail in Note 16.
During 2020, the Company sold part of its grain assets in Geneva, New York plus working capital during the third quarter for $11.6 million resulting in a pre-tax gain of $1.4 million recorded in Other income, net.
The Andersons, Inc. | 2021 Form 10-K | 72
19. Earnings Per Share
| (in thousands except per common share data) | Year Ended December 31, | ||||||||||||||||
| 2021 | 2020 | 2019 | |||||||||||||||
| Numerator: | |||||||||||||||||
| Net income (loss) from continuing operations | $ | $ | ( | $ | |||||||||||||
Net income (loss) attributable to noncontrolling interests(a) | ( | ( | |||||||||||||||
| Net income attributable to The Andersons Inc. common shareholders from continuing operations | $ | $ | $ | ||||||||||||||
| Income from discontinued operations, net of income taxes | $ | $ | $ | ||||||||||||||
| Denominator: | |||||||||||||||||
| Weighted-average shares outstanding – basic | |||||||||||||||||
| Effect of dilutive awards | |||||||||||||||||
| Weighted-average shares outstanding – diluted | |||||||||||||||||
| Earnings per share attributable to The Andersons, Inc. common shareholders: | |||||||||||||||||
| Basic earnings: | |||||||||||||||||
| Continuing operations | $ | $ | $ | ||||||||||||||
| Discontinued operations | |||||||||||||||||
| $ | $ | $ | |||||||||||||||
| Diluted earnings: | |||||||||||||||||
| Continuing operations | $ | $ | $ | ||||||||||||||
| Discontinued operations | |||||||||||||||||
| $ | $ | $ | |||||||||||||||
(a) All net income (loss) attributable to noncontrolling interests is within the continuing operations of the Company.
There were 25 thousand, 294 thousand and 88 thousand antidilutive share-based awards outstanding for the years ended December 31, 2021, 2020 and 2019, respectively.
The Andersons, Inc. | 2021 Form 10-K | 73
20. Quarterly Consolidated Financial Information (Unaudited)
As a result of the agreement to sell the Company's Rail Leasing business and announcing the intent to sell the Rail Repair business, the results of the former Rail segment are reported separately as discontinued operations in our Consolidated statements of operations for all periods presented. Prior to presentation of Rail as a discontinued operation, Rail was a stand-alone segment. All periods presented have been retrospectively adjusted to reflect this change.
The following is a summary of the unaudited quarterly results of operations for 2021 and 2020:
| Three Months Ended | |||||||||||||||||||||||
| (in thousands, except for per common share data) | March 31, 2021 | June 30, 2021 | September 30, 2021 | December 31, 2021 | |||||||||||||||||||
Sales and merchandising revenues | $ | $ | $ | $ | |||||||||||||||||||
| Income (loss) before income taxes from continuing operations | |||||||||||||||||||||||
| Net income (loss) from continuing operations | |||||||||||||||||||||||
| Net income (loss) | |||||||||||||||||||||||
| Net income attributable to The Andersons, Inc. | |||||||||||||||||||||||
| Income (loss) from continuing operations per share: | |||||||||||||||||||||||
| Basic | |||||||||||||||||||||||
| Diluted | |||||||||||||||||||||||
| Three Months Ended | |||||||||||||||||||||||
| (in thousands, except for per common share data) | March 31, 2020 | June 30, 2020 | September 30, 2020 | December 31, 2020 | |||||||||||||||||||
Sales and merchandising revenues | $ | $ | $ | $ | |||||||||||||||||||
| Income (loss) before income taxes from continuing operations | ( | ( | |||||||||||||||||||||
| Net income (loss) from continuing operations | ( | ||||||||||||||||||||||
| Net income (loss) | ( | ||||||||||||||||||||||
| Net income attributable to The Andersons, Inc. | ( | ( | |||||||||||||||||||||
| Income (loss) from continuing operations per share: | |||||||||||||||||||||||
| Basic | ( | ( | |||||||||||||||||||||
| Diluted | ( | ( | |||||||||||||||||||||
Net income (loss) per share is computed independently for each of the quarters presented. As such, the summation of the quarterly amounts may not equal the total net income per share reported for the year.
The Andersons, Inc. | 2021 Form 10-K | 74
Item 9. Changes in and Disagreements with Accountants on Accounting and Financial Disclosure
None.
Item 9A. Controls and Procedures
Evaluation of Disclosure Controls and Procedures
Under the supervision and with the participation of our management, including the Chief Executive Officer and Chief Financial Officer, we have evaluated the effectiveness of our disclosure controls and procedures as required by Exchange Act Rule 13a-15(b) as of the end of the period covered by this report. Based on that evaluation, the Chief Executive Officer and Chief Financial Officer have concluded that these disclosure controls and procedures are effective.
Management's Report on Internal Control over Financial Reporting
Management is responsible for establishing and maintaining adequate internal control over financial reporting, as such term is defined in Exchange Act Rules 13a-15(f) and 15d-15(f). Internal control over financial reporting is designed to provide reasonable assurance regarding the reliability of financial reporting and the preparation of financial statements for external purposes in accordance with generally accepted accounting principles and includes those policies and procedures that (i) pertain to the maintenance of records that, in reasonable detail, accurately and fairly reflect the transactions and dispositions of the assets of the Company; (ii) provide reasonable assurance that transactions are recorded as necessary to permit preparation of financial statements in accordance with generally accepted accounting principles, and that receipts and expenditures of the Company are being made only in accordance with authorizations of management and directors of the Company; and (iii) provide reasonable assurance regarding prevention or timely detection of unauthorized acquisition, use, or disposition of the Company's assets that could have a material effect on the Consolidated Financial Statements. Because of its inherent limitations, internal control over financial reporting may not prevent or detect misstatements. Also, projections of any evaluation of effectiveness to future periods are subject to the risk that controls may become inadequate because of changes in conditions, or that the degree of compliance with the policies or procedures may deteriorate.
Under the supervision and with the participation of management, including the certifying officers, the Company conducted an evaluation of the effectiveness of its internal control over financial reporting based on the criteria established in the Internal Control - Integrated Framework (2013) issued by the Committee of Sponsoring Organizations of the Treadway Commission. Based upon the evaluation under this framework, management concluded that our internal control over financial reporting was effective as of December 31, 2021.
The effectiveness of the Company's internal control over financial reporting as of December 31, 2021 has been audited by Deloitte & Touche LLP, an independent registered public accounting firm, as stated in their report, which is included below.
Changes in Internal Control over Financial Reporting
There have been no changes in the Company's internal controls over financial reporting during the Company's most recent fiscal quarter that have materially affected, or are reasonably likely to materially affect, the Company's internal controls over financial reporting.
The Andersons, Inc. | 2021 Form 10-K | 75
REPORT OF INDEPENDENT REGISTERED PUBLIC ACCOUNTING FIRM
To the shareholders and the Board of Directors of The Andersons, Inc.
Opinion on Internal Control over Financial Reporting
We have audited the internal control over financial reporting of The Andersons, Inc. and subsidiaries (the “Company”) as of December 31, 2021, based on criteria established in Internal Control — Integrated Framework (2013) issued by the Committee of Sponsoring Organizations of the Treadway Commission (COSO). In our opinion, the Company maintained, in all material respects, effective internal control over financial reporting as of December 31, 2021, based on criteria established in Internal Control — Integrated Framework (2013) issued by COSO.
We have also audited, in accordance with the standards of the Public Company Accounting Oversight Board (United States) (PCAOB), the consolidated financial statements as of and for the year ended December 31, 2021, of the Company and our report dated February 24, 2022, expressed an unqualified opinion on those financial statements.
Basis for Opinion
The Company’s management is responsible for maintaining effective internal control over financial reporting and for its assessment of the effectiveness of internal control over financial reporting, included in the accompanying Management’s Report on Internal Control over Financial Reporting. Our responsibility is to express an opinion on the Company’s internal control over financial reporting based on our audit. We are a public accounting firm registered with the PCAOB and are required to be independent with respect to the Company in accordance with the U.S. federal securities laws and the applicable rules and regulations of the Securities and Exchange Commission and the PCAOB.
We conducted our audit in accordance with the standards of the PCAOB. Those standards require that we plan and perform the audit to obtain reasonable assurance about whether effective internal control over financial reporting was maintained in all material respects. Our audit included obtaining an understanding of internal control over financial reporting, assessing the risk that a material weakness exists, testing and evaluating the design and operating effectiveness of internal control based on the assessed risk, and performing such other procedures as we considered necessary in the circumstances. We believe that our audit provides a reasonable basis for our opinion.
Definition and Limitations of Internal Control over Financial Reporting
A company’s internal control over financial reporting is a process designed to provide reasonable assurance regarding the reliability of financial reporting and the preparation of financial statements for external purposes in accordance with generally accepted accounting principles. A company’s internal control over financial reporting includes those policies and procedures that (1) pertain to the maintenance of records that, in reasonable detail, accurately and fairly reflect the transactions and dispositions of the assets of the company; (2) provide reasonable assurance that transactions are recorded as necessary to permit preparation of financial statements in accordance with generally accepted accounting principles, and that receipts and expenditures of the company are being made only in accordance with authorizations of management and directors of the company; and (3) provide reasonable assurance regarding prevention or timely detection of unauthorized acquisition, use, or disposition of the company’s assets that could have a material effect on the financial statements.
Because of its inherent limitations, internal control over financial reporting may not prevent or detect misstatements. Also, projections of any evaluation of effectiveness to future periods are subject to the risk that controls may become inadequate because of changes in conditions, or that the degree of compliance with the policies or procedures may deteriorate.
/s/ Deloitte & Touche LLP
Cleveland, Ohio
February 24, 2022
The Andersons, Inc. | 2021 Form 10-K | 76
Item 9B. Other Information
None.
Item 9C. Disclosure Regarding Foreign Jurisdictions that Prevent Inspections
Not applicable.
The Andersons, Inc. | 2021 Form 10-K | 77
Part III.
Item 10. Directors, Executive Officers and Corporate Governance
The information required by this Item is set forth under the headings "Election of Directors," “Corporate Governance,” and “Executive Officers” in the Company’s 2022 Proxy Statement to be filed with the SEC within 120 days after December 31, 2021 in connection with the solicitation of proxies for the Company’s 2022 annual meeting of shareholders, and is incorporated herein by reference.
Item 11. Executive Compensation
The information set forth under the caption “Executive Compensation” and "Compensation and Leadership Development Committee Interlocks and Insider Participation" in the Proxy Statement is incorporated herein by reference.
Item 12. Security Ownership of Certain Beneficial Owners and Management and Related Stockholder Matters
The information set forth under the caption “Share Ownership” and “Equity Plans” in the Proxy Statement is incorporated herein by reference.
Item 13. Certain Relationships and Related Transactions, and Director Independence
The information set forth under the captions "Corporate Governance" and “Review, Approval or Ratification of Transactions with Related Persons” in the Proxy Statement is incorporated herein by reference.
Item 14. Principal Accountant Fees and Services
The information set forth under “Appointment of Independent Registered Public Accounting Firm” in the Proxy Statement is incorporated herein by reference.
The Andersons, Inc. | 2021 Form 10-K | 78
Part IV.
Item 15. Exhibits and Financial Statement Schedules
(a) Documents filed as a part of this report
| 1. | Financial Statements | ||||||||||
The Consolidated Financial Statements of the Company are set forth under Item 8 of this report on Form 10-K. | |||||||||||
| 2. | Financial Statement Schedules | ||||||||||
Financial Statement Schedule II - Valuation and Qualifying Accounts included in this Form 10-K. All other schedules are not required under the related instructions or are not applicable. | |||||||||||
(b) Exhibit Listing
| Exhibit Number | Exhibit Description | Form | Exhibit | Filing Date/ Period End Date | |||||||||||||||||||||||||
| 3.1 | 10-K | 3.1 | December 31, 2019 | ||||||||||||||||||||||||||
| 3.2 | S-4/A | Annex B | May 19, 1995 | ||||||||||||||||||||||||||
| 4.1 | S-4/A | 4.1 | May 19, 1995 | ||||||||||||||||||||||||||
| 4.2** | |||||||||||||||||||||||||||||
| 10.01 | 10-K | 10.11 | December 31, 2018 | ||||||||||||||||||||||||||
| 10.02 | 10-K | 10.58 | December 31, 2013 | ||||||||||||||||||||||||||
| 10.03 | 8-K | 10.2 | June 28, 2018 | ||||||||||||||||||||||||||
| 10.04 | 8-K | 10.1 | June 28, 2018 | ||||||||||||||||||||||||||
| 10.05* | DEF 14A | Appendix B | March 19, 2019 | ||||||||||||||||||||||||||
| 10.06 | DEF 14A | Appendix C | March 12, 2014 | ||||||||||||||||||||||||||
| 10.07* | DEF 14A | Appendix C | March 19, 2019 | ||||||||||||||||||||||||||
| 10.08* | 10-Q | 10 | September 30, 2015 | ||||||||||||||||||||||||||
| 10.09* | S-8 | 4 | December 21, 2018 | ||||||||||||||||||||||||||
| 10.10* | S-8 | 10.1 | December 21, 2018 | ||||||||||||||||||||||||||
| 10.11* | 10-Q | 10.3 | March 31, 2019 | ||||||||||||||||||||||||||
| 10.12* | 10-Q | 10.4 | March 31, 2019 | ||||||||||||||||||||||||||
| 10.13* | 10-Q | 10.1 | June 30, 2019 | ||||||||||||||||||||||||||
The Andersons, Inc. | 2021 Form 10-K | 79
| Exhibit Number | Exhibit Description | Form | Exhibit | Filing Date/ Period End Date | |||||||||||||||||||||||||
| 10.14* | 10-Q | 10.2 | June 30, 2019 | ||||||||||||||||||||||||||
| 10.15 | 8-K | 10.1 | January 14, 2019 | ||||||||||||||||||||||||||
| 10.16 | 10-Q | 10.1 | September 30, 2020 | ||||||||||||||||||||||||||
| 10.17 | 8-K | 10.1 | February 5, 2021 | ||||||||||||||||||||||||||
| 10.18 | 8-K | 10.1 | May 6, 2021 | ||||||||||||||||||||||||||
| 10.19** | |||||||||||||||||||||||||||||
| 10.20 | 8-K | 10.2 | October 3, 2019 | ||||||||||||||||||||||||||
| 10.21 | 8-K | 10.1 | December 17, 2019 | ||||||||||||||||||||||||||
| 10.22 | 10-Q | 10.2 | June 30, 2020 | ||||||||||||||||||||||||||
| 10.23 | 10-Q | 10.1 | June 30, 2021 | ||||||||||||||||||||||||||
| 10.24 | 8-K | 10.1 | November 18, 2019 | ||||||||||||||||||||||||||
| 10.25 | 10-Q | 10.1 | June 30, 2020 | ||||||||||||||||||||||||||
| 10.26 | 8-K | 10.1 | December 28, 2021 | ||||||||||||||||||||||||||
| 21.1** | |||||||||||||||||||||||||||||
| 23.1** | |||||||||||||||||||||||||||||
| 31.1** | |||||||||||||||||||||||||||||
| 31.2** | |||||||||||||||||||||||||||||
| 32.1*** | |||||||||||||||||||||||||||||
| 95.1** | |||||||||||||||||||||||||||||
The Andersons, Inc. | 2021 Form 10-K | 80
| Exhibit Number | Exhibit Description | Form | Exhibit | Filing Date/ Period End Date | |||||||||||||||||||||||||
| 101** | Inline XBRL Document Set for the consolidated financial statements and accompanying notes in Part II, Item 8, “Financial Statements and Supplementary Data” of this Annual Report on Form 10-K. | ||||||||||||||||||||||||||||
| 104** | Inline XBRL for the cover page of this Annual Report on Form 10-K, included in the Exhibit 101 Inline XBRL Document Set. | ||||||||||||||||||||||||||||
| * Indicates management contract or compensatory plan or arrangement. | |||||||||||||||||||||||||||||
| ** Filed herewith. | |||||||||||||||||||||||||||||
| *** Furnished herewith. | |||||||||||||||||||||||||||||
The Andersons, Inc. | 2021 Form 10-K | 81
Item 16. Form 10-K Summary
Not applicable
The Andersons, Inc. | 2021 Form 10-K | 82
THE ANDERSONS, INC.
SCHEDULE II - CONSOLIDATED VALUATION AND QUALIFYING ACCOUNTS
| Additions | ||||||||||||||||||||||||||||||||
Description (in thousands) | Balance at Beginning of Period | Charged to Costs and Expenses | Charged to Other Accounts | Deductions (1) | Balance at End of Period | |||||||||||||||||||||||||||
| Allowance for doubtful accounts receivable | ||||||||||||||||||||||||||||||||
| 2021 | $ | $ | ( | $ | $ | ( | $ | |||||||||||||||||||||||||
| 2020 | ( | |||||||||||||||||||||||||||||||
| 2019 | ( | |||||||||||||||||||||||||||||||
(1) Uncollectible accounts written off, net of recoveries and adjustments to estimates for the allowance for doubtful accounts receivable accounts.
The Andersons, Inc. | 2021 Form 10-K | 83
SIGNATURES
Pursuant to the requirements of Section 13 or 15(d) of the Securities Exchange Act of 1934, the Registrant has duly caused this report to be signed on its behalf by the undersigned, thereunto duly authorized.
| THE ANDERSONS, INC. | |||||
Date: February 24, 2022 | /s/ Patrick E. Bowe | ||||
| Patrick E. Bowe | |||||
| Chief Executive Officer | |||||
Pursuant to the requirements of the Securities Exchange Act of 1934, this report has been signed below by the following persons on behalf of the Registrant and in the capacities and on the dates indicated.
| Signature | Title | Date | Signature | Title | Date | |||||||||||||||
| /s/ Patrick E. Bowe | Chief Executive Officer | 2/24/2022 | /s/ Stephen F. Dowdle | Director | 2/24/2022 | |||||||||||||||
| Patrick E. Bowe | (Principal Executive Officer) | Stephen F. Dowdle | ||||||||||||||||||
| /s/ Brian A. Valentine | Executive Vice President and Chief Financial Officer | 2/24/2022 | /s/ Pamela S. Hershberger | Director | 2/24/2022 | |||||||||||||||
| Brian A. Valentine | (Principal Financial Officer) | Pamela S. Hershberger | ||||||||||||||||||
| /s/ Michael T. Hoelter | Vice President, Corporate Controller & Investor Relations | 2/24/2022 | /s/ Catherine M. Kilbane | Director | 2/24/2022 | |||||||||||||||
| Michael T. Hoelter | (Principal Accounting Officer) | Catherine M. Kilbane | ||||||||||||||||||
| /s/ Michael J. Anderson, Sr. | Chairman | 2/24/2022 | /s/ Robert J. King, Jr. | Director | 2/24/2022 | |||||||||||||||
| Michael J. Anderson, Sr. | Robert J. King, Jr. | |||||||||||||||||||
| /s/ Gerard M. Anderson | Director | 2/24/2022 | /s/ Ross W. Manire | Director | 2/24/2022 | |||||||||||||||
| Gerard M. Anderson | Ross W. Manire | |||||||||||||||||||
| /s/ Gary A. Douglas | Director | 2/24/2022 | /s/ John T. Stout, Jr. | Director | 2/24/2022 | |||||||||||||||
| Gary A. Douglas | John T. Stout, Jr. | |||||||||||||||||||
The Andersons, Inc. | 2021 Form 10-K | 84
Serious News for Serious Traders! Try StreetInsider.com Premium Free!
You May Also Be Interested In
- The Andersons, Inc. to Release First Quarter Results on May 7
- UIICore unveiling / ECCMID announcement Analyst Targets
- NETA Auto: The First Car from the Indonesian Factory Powers up Global Strategy
Create E-mail Alert Related Categories
SEC FilingsSign up for StreetInsider Free!
Receive full access to all new and archived articles, unlimited portfolio tracking, e-mail alerts, custom newswires and RSS feeds - and more!
