

Form 10-K ARROW ELECTRONICS INC For: Dec 31
 Tweet
Tweet Share
ShareUNITED STATES SECURITIES AND EXCHANGE COMMISSION
Washington, D.C. 20549
FORM 10-K
ANNUAL REPORT PURSUANT TO SECTION 13 OR 15(d) OF THE SECURITIES EXCHANGE ACT OF 1934 | |||||
For the fiscal year ended December 31 , 2021
OR
TRANSITION REPORT PURSUANT TO SECTION 13 OR 15(d) OF THE SECURITIES EXCHANGE ACT OF 1934 | |||||
For the transition period from to
Commission file number 1-4482
(Exact name of registrant as specified in its charter)
| (State or other jurisdiction of | (I.R.S. Employer | ||||||||||||||||
| incorporation or organization) | Identification Number) | ||||||||||||||||
| (Zip Code) | |||||||||||||||||
| (Address of principal executive offices) | |||||||||||||||||
(Registrant's telephone number, including area code)
Securities registered pursuant to Section 12(b) of the Act:
| Title of each class | Trading Symbol(s) | Name of each exchange on which registered | ||||||||||||
Securities registered pursuant to Section 12(g) of the Act: None
Indicate by check mark if the registrant is a well-known seasoned issuer, as defined in Rule 405 of the Securities Act. Yes x No o
Indicate by check mark if the registrant is not required to file reports pursuant to Section 13 or Section 15(d) of the Act. Yes o No x
Indicate by check mark whether the registrant (1) has filed all reports required to be filed by Section 13 or 15(d) of the Securities Exchange Act of 1934 during the preceding 12 months (or for such shorter period that the registrant was required to file such reports), and (2) has been subject to such filing requirements for the past 90 days. Yes x No o
Indicate by check mark whether the registrant has submitted electronically every Interactive Data File required to be submitted pursuant to Rule 405 of Regulation S-T (§232.405 of this chapter) during the preceding 12 months (or for such shorter period that the registrant was required to submit such files). Yes x No o
Indicate by check mark whether the registrant is a large accelerated filer, an accelerated filer, a non-accelerated filer, a smaller reporting company, or an emerging growth company. See the definitions of “large accelerated filer,” “accelerated filer,” “smaller reporting company,” and “emerging growth company” in Rule 12b-2 of the Exchange
Act.
| ☒ | Accelerated filer | ☐ | |||||||||
| Non-accelerated filer | ☐ | Smaller reporting company | |||||||||
| Emerging growth company | |||||||||||
If an emerging growth company, indicate by check mark if the registrant has elected not to use the extended transition period for complying with any new or revised financial accounting standards provided pursuant to Section 13(a) of the Exchange Act. o
Indicate by check mark whether the registrant has filed a report on and attestation to its management's assessment of the effectiveness of its internal control over financial reporting under Section 404(b) of the Sarbanes-Oxley Act (15 U.S.C. 7262 (b)) by the registered public accounting firm that prepared or issued its audit report. ☒
Indicate by check mark whether the registrant is a shell company (as defined in Rule 12b-2 of the Exchange Act). Yes ☐ No ☒
The aggregate market value of voting stock held by non-affiliates of the registrant as of the last business day of the registrant's most recently completed second fiscal quarter was $8,209,051,733 .
There were 67,693,074 shares of Common Stock outstanding as of February 3, 2022.
DOCUMENTS INCORPORATED BY REFERENCE
TABLE OF CONTENTS
Item 6. | [Reserved] | ||||||||||
2
PART I
Item 1. Business.
Arrow Electronics, Inc. (the “company” or “Arrow”) is a global provider of products, services, and solutions to industrial and commercial users of electronic components and enterprise computing solutions. The company has one of the world's broadest portfolios of product offerings available from leading electronic components and enterprise computing solutions suppliers, coupled with a range of services, solutions, and software that help industrial and commercial customers introduce innovative products, reduce their time to market, and enhance their overall competitiveness. Arrow was incorporated in New York in 1946 and serves over 220,000 customers worldwide.
Arrow's diverse worldwide customer base consists of original equipment manufacturers (“OEMs”), value-added resellers (“VARs”), managed service providers (“MSPs”), contract manufacturers (“CMs”), and other commercial customers. These customers include manufacturers of industrial equipment (such as machine tools, factory automation, and robotic equipment) and consumer products serving industries ranging from aerospace and defense, alternative energy, automotive and transportation, medical, professional services, and telecommunications, among others.
The company has two business segments, the global components business and the global enterprise computing solutions (“ECS”) business. The company distributes electronic components to OEMs and CMs through its global components business segment and provides enterprise computing solutions to VARs and MSPs through its global ECS business segment. For 2021, approximately 76% of the company's sales were from the global components business segment, and approximately 24% of the company's sales were from the global ECS business segment. The financial information about the company's business segments and geographic operations is found in Note 16 to the consolidated financial statements.
The company maintains over 245 sales facilities and 43 distribution and value-added centers, serving over 90 countries. Both business segments have operations in each of the three largest electronics markets; the Americas; Europe, Middle East, and Africa (“EMEA”); and Asia-Pacific regions. Arrow's business strategy is to be the world's foremost technology solutions provider. The company guides innovation forward by helping its customers in the areas of industrial automation, edge computing, cloud computing, smart and connected devices, homes, cities, and transportation to deliver new technologies, new materials, new ideas, and new electronics that improve businesses' performance and consumers' lives. Arrow aggregates disparate sources of electronics components, infrastructure software, and IT hardware to increasingly provide complete solutions for customers on behalf of its suppliers. Arrow’s goal is to leave no segment of the market underserved in terms of the products offered and services provided. The company aims to accelerate its customers’ time to market, enable secure and consistent supply chains, and drive growth on behalf of its suppliers.
The company's financial objectives are to grow sales faster than the market, increase the markets served, grow profits faster than sales, generate earnings per share growth in excess of competitors’ earnings per share growth and market expectations, grow earnings per share at a rate that provides the capital necessary to support the company’s business strategy, allocate and deploy capital effectively so that return on invested capital exceeds the company’s cost of capital, and increase return on invested capital. To achieve its objectives, the company seeks to capture significant opportunities to grow across products, markets, and geographies. To supplement its organic growth strategy, the company continually evaluates strategic acquisitions to broaden its product and value-added service offerings, increase its market penetration, and expand its geographic reach.
Global Components
Global components markets and distributes electronic components enabled by a comprehensive range of value-added capabilities and services. The company provides customers with the ability to deliver the latest technologies to the market through design engineering, global marketing and integration, global logistics, and supply chain management. The company offers the convenience of accessing, from a single source, multiple technologies and products from its suppliers with rapid or scheduled deliveries. Most of the company's customers require delivery of their orders on schedules or volumes that are generally not available on direct purchases from manufacturers.
The global components business design, engineering, global marketing and integration services provide a variety of mechanisms, commonly known as ‘demand creation,’ to promote the future sale of suppliers’ products. Most notably, the company will register engineered designs and schematics showing the use of suppliers’ components in the company’s customers’ future products. Providing these services generally lead to longer and more profitable relationships that benefit the company as well as our suppliers and customers.
3
Beyond the traditional source of sales and profits tied to the buying and selling of electronic components, the company has a global supply chain services business that has grown organically within the global components business. It derives services revenue from providing supply chain services such as procurement, logistics, warehousing, and insights from data analytics.
Within the global components business segment for 2021, net sales of approximately 78% consist of semiconductor products and related services; approximately 13% consist of passive, electro-mechanical, and interconnect products, such as capacitors, resistors, potentiometers, power supplies, relays, switches, and connectors; approximately 7% consist of computing and memory; and approximately 2% consist of other products and services.
Global ECS
The company's global ECS business segment is a leading value-added provider of comprehensive computing solutions and services. Global ECS' portfolio of computing solutions includes datacenter, cloud, security, and analytics solutions. Global ECS brings broad market access, extensive supplier relationships, scale, and resources to help its VARs and MSPs meet the needs of their end-users. Global ECS works with VARs and MSPs to tailor complex IT solutions for their end-users. Customers have access to various services including engineering and integration support, warehousing and logistics, marketing resources, and authorized hardware and software training. Global ECS' suppliers benefit from demand creation, speed to market, and efficient supply chain management.
Global ECS further supports customers by enabling their cloud solutions businesses through ArrowSphere, a cloud marketplace and management platform. ArrowSphere helps VARs and MSPs to manage, differentiate and scale their cloud businesses. It simplifies the operational complexity of delivering hybrid multi-cloud solutions while providing the business intelligence that IT solution providers need to drive growth. By making cloud-based solutions available through ArrowSphere, suppliers benefit from greater subscription adoption, consumption, and utilization.
Within the global ECS business segment for 2021, net sales of approximately 42% consist of software, 35% consist of storage, 11% consist of industry standard servers, 5% consist of proprietary servers, and 7% consist of other products and services.
Customers and Suppliers
The company and its affiliates serve over 220,000 industrial and commercial customers. Industrial customers range from major OEMs and CMs to small engineering firms, while commercial customers primarily include VARs, MSPs, and OEMs. No single customer accounted for more than 2% of the company's 2021 consolidated sales. The company's sales teams focus on an extensive portfolio of products and services to support customers' material management and production needs, including connecting customers to the company's field application engineers that provide technical support and serve as a gateway to the company's supplier partners. The company's sales representatives generally focus on a specific customer segment, particular product lines or a specific geography, and provide end-to-end product offerings and solutions with an emphasis on helping customers introduce innovative products, reduce their time to market, and enhance their overall competitiveness. Substantially all of the company's sales are made on an order-by-order basis, rather than through long-term sales contracts. As such, the nature of the company's business does not provide visibility of material forward-looking information from its customers and suppliers beyond a few months.
One supplier accounted for approximately 17% of the company's consolidated sales in 2021. No other single supplier accounted for more than 7% of the company's consolidated sales in 2021. The company believes that many of the products it sells are available from other sources at competitive prices. However, certain parts of the company's business, such as the company's global ECS business segment, rely on a limited number of suppliers with the strategy of providing focused support, extensive product knowledge, and customized service to suppliers, MSPs, and VARs. Most of the company's purchases are pursuant to distributor agreements, which are typically non-exclusive and cancelable by either party at any time or on short notice.
Distribution Agreements
Certain agreements with suppliers protect the company against the potential write-down of inventories due to technological change or suppliers' price reductions. These contractual provisions typically provide certain protections to the company for product obsolescence and price erosion in the form of return privileges, scrap allowances, and price protection. Under the terms of the related distributor agreements and assuming the company complies with certain conditions, such suppliers are required to credit the company for reductions in suppliers' list prices. As of December 31, 2021, this type of arrangement covered approximately 50% of the company's consolidated inventories. In addition, under the terms of many such agreements, the company has the right to return to the supplier, for credit, a defined portion of those inventory items purchased within a designated period of time.
4
A supplier, which elects to terminate a distribution agreement, may be required to purchase from the company the total amount of its products carried in inventory. As of December 31, 2021, this type of repurchase arrangement covered approximately 45% of the company's consolidated inventories.
While these inventory practices do not wholly protect the company from inventory losses, the company believes that they currently provide substantial protection from such losses.
Competition
The company operates in a highly competitive environment, both in the United States and internationally. The company competes with other large multinational and national electronic components and enterprise computing solutions distributors, as well as numerous other smaller, specialized competitors who generally focus on narrower markets, products, or particular sectors. The company also competes for customers with its suppliers. The size of the company's competitors vary across market sectors, as do the resources the company has allocated to the sectors in which it does business. Therefore, some of the company's competitors may have a more extensive customer and/or supplier base than the company in one or more of its market sectors. There is significant competition within each market sector and geography served that creates pricing pressure and the need to continually improve services. Other competitive factors include rapid technological changes, product availability, credit availability, speed of delivery, ability to tailor solutions to customer needs, quality and depth of product lines and training, as well as service and support provided by the distributor to the customer.
The company also faces competition from companies entering or expanding into the logistics and product fulfillment, electronic catalog distribution, and e-commerce supply chain services markets. As the company seeks to expand its business into new areas in order to stay competitive in the market, the company may encounter increased competition from its current and/or new competitors.
The company believes that it is well equipped to compete effectively with its competitors in all of these areas due to its comprehensive product and service offerings, highly-skilled work force, and global distribution network.
Government Regulation
The company is subject to and endeavors to comply with various government regulations in the United States as well as various jurisdictions where it operates. These regulations cover several diverse areas including trade compliance, anti-bribery, anti-corruption, money laundering, securities, environmental, and data and privacy protection. Regulatory or government authorities where the company operates may have enforcement powers that can subject the company to legal penalties or other measures and can impose changes or conditions in the way it conducts business. For example, local authorities may disagree with how the company classifies its products for trade and taxation purposes, and the company may be required to change its classifications, which could increase the company’s operating costs or subject it to increased taxes or fines and penalties. Increased government scrutiny of the company's actions or enforcement could materially and adversely affect its business or damage its reputation. In addition, the company may conduct, or it may be required to conduct, internal investigations or face audits or investigations by one or more domestic or foreign government or regulatory agencies, which could be costly and time-consuming, and could divert management and key personnel from the company’s business operations. See Risk Factors in Part I, Item 1A.
Human Capital
The company’s business strategy is to be the world’s foremost technology solutions provider, and the company’s talent strategy powers that business strategy through its people. The company’s talent ecosystem, with all of its multi-cultural diversity, spans 53 countries. The company and its employees around the world rally behind a common greater good: to make the benefits of technology accessible to all.
The company believes its deep capabilities and broad services are made possible by a broad group of professionals who understand their problems from numerous perspectives and curate forward-looking, comprehensive solutions. The company's employees’ diverse backgrounds have melded into rich perspectives that sharpen the company, frame how its global network of engineers, suppliers, and manufacturers work together, and enhance value for customers.
Our business results depend in part on our ability to successfully manage our human capital resources, including attracting, identifying, and retaining key talent. Factors that may affect our ability to attract and retain qualified employees include employee morale, our reputation, competition from other employers, and availability of qualified individuals.
5
The company and its affiliates employed approximately 20,700 employees worldwide as of December 31, 2021. The following table shows the company's approximate headcount by region:
| Americas | EMEA | Asia-Pacific | ||||||||||||||||||
| Headcount | 6,100 | 6,800 | 7,800 | |||||||||||||||||
Gender and Racial/Ethnic Diversity
The company has a long-standing goal for gender representation share growth at all levels of the organization globally, and for race/ethnicity representation share growth at all levels of the organization in the United States. Efforts towards employee diversity share growth are reflected in the company’s talent strategy through (a) internal talent development programs that advance career opportunity for women and underrepresented employees, (b) hiring, (c) retention, and (d) training programs designed to emphasize and expand diversity and inclusion priorities that align to our business strategy.
Below are statistics related to gender and racial/ethnic diversity by employee population:
| Gender Diversity (Globally) (% female) | Underrepresented Race/Ethnicity (United States) (% underrepresented race/ethnicity) | |||||||||||||||||||||||||||||||||||||
| 2021 | 2020 | Change | 2021 | 2020 | Change | |||||||||||||||||||||||||||||||||
| Executives (a) | 19% | 20% | (1)% | 15% | 8% | 7% | ||||||||||||||||||||||||||||||||
| Vice Presidents | 24% | 25% | (1)% | 15% | 14% | 1% | ||||||||||||||||||||||||||||||||
| Directors | 28% | 26% | 2% | 16% | 17% | (1)% | ||||||||||||||||||||||||||||||||
| Managers | 30% | 30% | —% | 27% | 27% | —% | ||||||||||||||||||||||||||||||||
| Supervisors | 46% | 46% | —% | 43% | 43% | —% | ||||||||||||||||||||||||||||||||
| Individual Contributors | 45% | 45% | —% | 37% | 35% | 2% | ||||||||||||||||||||||||||||||||
| Total Employee Population | 42% | 42% | —% | 35% | 33% | 2% | ||||||||||||||||||||||||||||||||
(a) Executives includes executive and non-executive officers who are members of the executive committee.
Talent Acquisition, Development, and Retention
The company believes in work that elevates career opportunity for all and views its employees as career investors. Employees invest in Arrow by bringing their unique talents, experiences, and perspectives to the organization through their daily work. The company is committed to helping employees receive a return on their investment, in the form of compounding knowledge, skills, abilities, and earnings opportunity as their careers grow within the company. The company supports employees through targeted curriculum and tools focused on building skills and capabilities within each workforce segment. Arrow also offers a suite of enterprise leadership training and development programs. These programs create value by growing employee capability, which in turn facilitates business growth. For example, nearly three quarters of manager-level and above positions were filled internally during 2021 and 2020.
Attracting and retaining early career talent enables Arrow to grow employee capability from the ground up. Through the company’s university intern and graduate programs, apprenticeship programs, and management trainee programs, Arrow builds a diverse talent pipeline.
The company believes in rewards that improve performance outcomes for all and endorses a pay-for-performance philosophy via performance differentiation and rewarding employees through compensation and benefits. Arrow's compensation and benefits programs are aligned with the local external market to attract, grow, and retain talent. Arrow’s commitment to rewarding employees fairly based on skills, experience, contribution/performance, internal equity, and the external market enables us to maximize employees’ return on their career investment. The company reviews our compensation and benefits programs and practices regularly to ensure they remain competitive and equitable.
Arrow’s Response to COVID
Arrow has worked to protect its global workforce during the COVID-19 pandemic by aligning to guidance of the world's leading health authorities and state and national governments, as well as local government directives, at all locations around the globe to safely continue working in person as prudent, while also providing exemptions and tools for extended remote work, and enhanced benefits as appropriate. To protect the safety of our employees, customers, and suppliers, the company
6
implemented a COVID-19 vaccine mandate for our U.S. employees, with the exception of our light industrial population in our distribution facilities and employees with approved accommodations. All employees in the distribution facilities and those with approved accommodations are required to wear masks when on site at Arrow facilities. All U.S. new hires, including light industrial, are required to be fully vaccinated.
Expanded Human Capital Disclosure
Additional human capital information will be included in the company's inaugural Environmental, Social, and Governance Report ("ESG Report"), which will be available in the near future on the Arrow.com website. Information contained in our ESG Report and website is not deemed part of, or incorporated by reference into, this Annual Report on Form 10-K.
Available Information
The company files its Annual Report on Form 10-K, Quarterly Reports on Form 10-Q, Current Reports on Form 8-K, Proxy Statements, and other documents with the U.S. Securities and Exchange Commission (“SEC”) under the Securities Exchange Act of 1934. The SEC maintains a website that contains reports, proxy and information statements, and other information regarding issuers that file electronically with the SEC. The company's SEC filings are available to the public on the SEC's website at www.sec.gov and through the New York Stock Exchange (“NYSE”), 11 Wall Street, New York, New York 10005, on which the company's common stock is listed.
A copy of any of the company's filings with the SEC, or any of the agreements or other documents that constitute exhibits to those filings, can be obtained by request directed to the company at the following address and telephone number:
Arrow Electronics, Inc.
9201 East Dry Creek Road
Centennial, Colorado 80112
(303) 824-4000
Attention: Corporate Secretary
The company also makes these filings available, free of charge, through its Investor Relations website (investor.arrow.com/investors) as soon as reasonably practicable after the company files such materials with the SEC. The company does not intend this internet address to be an active link or to otherwise incorporate the contents of the website into this Annual Report on Form 10-K.
Executive Officers
The following table sets forth the names, ages, and the positions held by each of the executive officers of the company as of February 11, 2022:
| Name | Age | Position | ||||||
| Michael J. Long | 63 | Chairman, President, and Chief Executive Officer | ||||||
| W. Victor Gao | 42 | Senior Vice President, Chief Marketing Officer | ||||||
| Carine L. Jean-Claude | 54 | Senior Vice President, Chief Legal Officer and Secretary | ||||||
| Sean J. Kerins | 59 | Chief Operating Officer | ||||||
| Charles F. Kostalnick II | 56 | Senior Vice President, Chief Supply Chain Officer | ||||||
| Vincent P. Melvin | 58 | Senior Vice President, Chief Information Officer | ||||||
| Kristin D. Russell | 51 | President, Arrow Global Enterprise Computing Solutions | ||||||
| Christopher D. Stansbury | 56 | Senior Vice President, Chief Financial Officer | ||||||
| David A. West | 61 | President, Arrow Global Components | ||||||
| Gretchen K. Zech | 52 | Senior Vice President, Chief Governance, Sustainability, and Human Resources Officer | ||||||
Set forth below is a brief account of the business experience during the past five years of each executive officer of the company.
Michael J. Long has been Chairman of the Board of Directors, President, and Chief Executive Officer of the company for more than five years.
7
W. Victor Gao was appointed Senior Vice President, Chief Marketing Officer effective September 2019. Prior thereto he served as Vice President, Chief Marketing Officer from April 2018 to September 2019. Prior thereto, he served as Vice President, Digital from January 2015 to April 2018.
Carine L. Jean-Claude was appointed Senior Vice President, Chief Legal Officer and Secretary in June 2021. Prior thereto, she served as Vice President, Interim Chief Legal Officer and Secretary since December 2020. Prior thereto, she served as Vice President, Legal Affairs since 2017. Prior thereto, she served in other legal and compliance roles at Arrow Electronics, Inc.
Sean J. Kerins was appointed Chief Operating Officer effective December 2020. Prior thereto, he served as President of Arrow Global Enterprise Computing Solutions for more than five years.
Charles F. Kostalnick II was appointed Senior Vice President, Chief Supply Chain Officer in July 2017. Prior thereto he served as President, Arrow Sustainable Technology Solutions from August 2016 to July 2017.
Vincent P. Melvin has been Senior Vice President and Chief Information Officer of the company for more than five years.
Kristin D. Russell was appointed President, Arrow Global Enterprise Computing Solutions in December 2020. Prior thereto she served as President, Arrow Intelligent Systems from May 2016 to December 2020.
Christopher D. Stansbury has served as Senior Vice President and Chief Financial Officer of the company for more than five years.
David A. West was appointed President of Arrow Global Components effective December 2020. Prior thereto, he served as Senior Vice President of Worldwide Supplier Marketing and Engineering for more than five years.
Gretchen K. Zech was appointed Senior Vice President, Chief Governance, Sustainability, and Human Resources Officer in February 2022. Prior thereto, she served as Senior Vice President and Chief Human Resources Officer of the company for more than five years.
8
Item 1A. Risk Factors.
Described below and throughout this report are certain risks that the company’s management believes are applicable to the company’s business and the industries in which it operates. Please see Part II, Item 7A, “Quantitative and Qualitative Disclosures about Market Risk” for a discussion of the company's market risk. If any of the described events occur, the company’s business, results of operations, financial condition, liquidity, or access to the capital markets could be materially adversely affected. When stated below that a risk may have a material adverse effect on the company’s business, it means that such risk may have one or more of these effects. There may be additional risks that are not presently material or known. There are also risks within the economy, the industry, and the capital markets that could materially adversely affect the company, including those associated with an economic recession, inflation, a global economic slowdown, political instability, government regulation (including tax regulation), climate change, employee attraction and retention, and customers’ inability or refusal to pay for the products and services provided by the company. There are also risks associated with the occurrence of extraordinary or unforeseen events, such as terrorist attacks, military or political conflicts, epidemics or pandemics, natural disasters (such as tsunamis, hurricanes, tornadoes, and floods), or other catastrophic events. These factors affect businesses generally, including the company, its customers and suppliers, and as a result, are not discussed in detail below, but are applicable to the company.
Operational Risks
If the company is unable to maintain its relationships with its suppliers or if the suppliers materially change the terms of their existing agreements with the company, or if supply chain shortages and other disruptions occur, the company’s business could be materially adversely affected.
A substantial portion of the company’s inventory is purchased from suppliers with which the company has entered into non-exclusive distribution agreements. These agreements are typically cancellable at any time or on short notice (generally 30 to 90 days). However, the recent global semi-conductor shortages have resulted in some suppliers increasing the amount of non-cancelable orders, which limits our ability to adjust down our inventory levels in the event of market downturns, and could have a negative impact on the financial results of the company. The company seeks to limit these risks by passing non-cancellable terms on to customers, where possible.
Some of the company’s businesses rely on a limited number of suppliers to provide a high percentage of their revenues. For example, sales of products from one of the company’s suppliers accounted for approximately 17% of the company’s consolidated sales in 2021. To the extent that the company’s significant suppliers reduce the number of products they sell through distribution, experience disruptions in their supply chains, cease to continue doing business with the company, or are unable to continue to meet or significantly alter their obligations, the company’s business could be materially adversely affected. In addition, to the extent that the company’s suppliers modify the terms of their contracts to the detriment of the company, limit supplies due to capacity constraints, or other factors, there could be a material adverse effect on the company’s business. Further, the supplier landscape has continued to experience a consolidation, which could negatively impact the company if the surviving, consolidated suppliers decide to exclude the company from their supply chain efforts, and which could expose the company to increased risks, including increased pricing and dependence on a smaller number of suppliers. Increasing consolidation in the industries where the company’s suppliers operate may occur as companies combine to achieve further economies of scale and other synergies, which could result in reduced supplies, as companies seek to eliminate duplicative product lines, and increased prices, which could have a material adverse effect on the company’s business.
The global COVID-19 pandemic has created and continues to create significant shortages, disruptions, constraints, extended lead times, and unpredictability across the global supply chain. Shortages in electronics components markets and supply chain logistical issues have impacted the company's business. The extent to which supply constraints will continue to impact the company's results will depend on future developments, including the severity and duration of the COVID-19 pandemic and the impact of actions to contain or treat its impact, among others. These future developments are highly uncertain and cannot be predicted with confidence.
The company’s revenues originate primarily from the sales of semiconductor, PEMCO (passive, electro-mechanical and connector), and IT hardware and software products, the sales of which are traditionally cyclical and may be impacted by shortages and other disruptions in the global supply chain.
The semiconductor industry historically has experienced fluctuations in product supply and demand, often associated with changes in technology and manufacturing capacity and subject to significant economic market upturns and downturns. The COVID-19 pandemic has created and continues to create significant shortages, disruptions, constraints, extended lead times and unpredictability in the global supply chain and especially in the semiconductor market. Sales of semiconductor products and
9
related services represented approximately 57%, 54%, and 49%, of the company’s consolidated sales in 2021, 2020, and 2019, respectively. The sale of the company’s PEMCO products closely tracks the semiconductor market. Accordingly, the company’s revenues and profitability, particularly in its global components business segment, tend to closely follow the strength or weakness of the semiconductor market. Further, economic weakness could cause a decline in spending in information technology, which could have a negative impact on the company’s ECS business. A cyclical downturn in the technology industry could have a material adverse effect on the company’s business and negatively impact its ability to maintain historical profitability levels.
The competitive pressures the company faces, such as pricing and margin reductions, could have a material adverse effect on the company’s business.
The company operates in a highly competitive international environment. The company competes with other large multinational and national electronic components and enterprise computing solutions distributors, as well as numerous other smaller, specialized competitors who generally focus on narrower market sectors, products, or industries. The company also competes for customers with its suppliers. The size of the company’s competitors varies across market sectors, as do the resources the company has allocated to the sectors in which it does business. Therefore, some of the company’s competitors may have a more extensive customer and/or supplier base than the company in one or more of its market sectors. There is significant competition within each market sector and geography that creates pricing and margin pressure and the need for constant attention to improve service and product offerings and increase market share. Other competitive factors include rapid technological changes, product availability, credit availability, speed of delivery, ability to tailor solutions to changing customer needs, and quality and depth of product lines and training, as well as service and support provided by the distributor to the customer. The company also faces competition from companies in the logistics and product fulfillment, catalog distribution, and e-commerce supply chain services markets. As the company continues to expand its business into new areas in order to stay competitive in the market, the company may encounter increased competition from its current and/or new competitors, making it difficult to retain its market share. Further, the enterprise computing distributors industry has recently experienced increased consolidation, resulting in companies with greater scale, market presence, and purchasing power than before. As a result, competition among enterprise computing distributors has increased. In addition, there is no guarantee that the company’s response to and growth in emerging technologies will be successful. Also, customers may seek commitments from the company related to sustainability and environmental impacts, and meeting these commitments may increase the company's cost of operations. The company’s failure to maintain and enhance its competitive position could have a material adverse effect on its business.
Declines in value of the company’s inventory could materially adversely affect its business.
The market for the company’s products and services is subject to rapid technological changes, evolving industry standards, changes in end-market demand, evolving customer expectations, oversupply of product, and regulatory requirements, which can contribute to the decline in value or obsolescence of inventory. Although many of the company’s suppliers provide the company with certain protections from the loss in value of inventory (such as price protection and certain rights of return), the company cannot be sure that such protections will fully compensate it for the loss in value, or that the suppliers will choose to, or be able to, honor such agreements. For example, many of the company’s suppliers will not allow products to be returned after they have been held in inventory beyond a certain amount of time, and, in most instances, the return rights are limited to a certain percentage of the amount of products the company purchased in a particular time frame. Therefore, the company is not fully protected from declines in the value of the company’s inventory, and such decline could have a material adverse effect on the company’s business.
The company’s lack of long-term sales contracts may have a material adverse effect on its business.
Most of the company’s sales are made on an order-by-order basis, rather than through long-term sales contracts. The company generally works with its customers to develop non-binding forecasts for future orders. Based on such non-binding forecasts, the company makes commitments regarding the level of business that it will seek and accept, the inventory that it purchases, and the levels of utilization of personnel and other resources. A variety of conditions over which the company has little or no control, both specific to each customer and generally affecting each customer’s industry may cause customers to cancel, reduce, or delay orders that were either previously made or anticipated, file for bankruptcy protection, or default on their payments. Significant or numerous cancellations, reductions, delays in orders by customers, loss of customers, changing in pricing driven by changing environmental laws and regulations, or the effects of climate change on pricing and sourcing, and/or customer defaults on payments could materially adversely affect the company’s business.
10
The company’s non-U.S. sales represent a significant portion of its revenues, and consequently, the company is exposed to risks associated with operating internationally.
In 2021, 2020, and 2019, approximately 66%, 65%, and 60%, respectively, of the company’s sales came from its operations outside the United States. As a result of the company’s international sales and locations, its operations are subject to a variety of risks that are specific to international operations, including the following:
•import and export regulations that could erode profit margins or restrict exports;
•the burden and cost of compliance with international laws, treaties, and technical standards and changes in those regulations;
•potential restrictions on transfers of funds;
•trade protection measures, import and export tariffs and other restrictions, duties and value-added taxes;
•transportation delays and interruptions;
•the burden and cost of compliance with complex multi-national tax laws and regulations;
•uncertainties arising from local business practices and cultural considerations;
•foreign laws that potentially discriminate against companies which are headquartered outside that jurisdiction;
•stringent antitrust regulations in local jurisdictions;
•volatility associated with sovereign debt of certain international economies;
•the uncertainty surrounding the effects of Brexit;
•environmental protection laws and regulations, including those related to climate change;
•potential social unrest, military conflicts, government shutdowns and disruptions, and political risks; and
•currency fluctuations, which the company attempts to minimize through traditional hedging instruments.
Also, the company’s gross margins in the components business in the Asia-Pacific region tend to be lower than those in other markets in which the company sells products and services. If sales in this market increase as a percentage of overall sales, consolidated gross margins will be lower. While the company has and will continue to adopt measures to reduce the risks of doing business abroad, it cannot ensure that such measures will be adequate and, therefore, such risks could have a material adverse effect on its business.
Changes in the company’s global mix of earnings, and changes in tax law and policy, could materially adversely impact results.
The company’s effective tax rate may be adversely impacted by, among other things, changes in the mix of earnings among countries having different statutory tax rates, changes in the valuation of deferred tax assets, and certain U.S. and international tax policy and enforcement efforts, including the Organization for Economic Co-operation and Development’s (“OECD”) Base Erosion and Profit Shifting Project, the European Commission’s state aid investigations, and other initiatives adversely affecting taxation of international businesses. For example, in October 2021, a substantial majority of the OECD’s participating countries and jurisdictions agreed to introduce a 15% global minimum corporate tax rate that would apply to companies with revenue over a set threshold and that could be assessed potentially as early as 2023. Furthermore, many of the countries where the company is subject to taxes are independently evaluating their corporate tax policy, which could result in tax legislation and enforcement that adversely impacts the company’s tax provision and value of deferred assets and liabilities. For instance, proposed legislation in the U.S. includes a new 15% corporate profits minimum tax on corporations that report over $1 billion of profits to shareholders, a new 1% excise tax on corporate stock repurchases, limitations on interest deductions of international financial reporting groups, and increases to the tax rate applied to profits earned outside the U.S. Additionally, tax returns are subject to periodic audits by U.S. and foreign tax authorities, and these audits may result in allocations of income and/or deductions that may result in tax assessments different from amounts that have been estimated. The company regularly assesses the likelihood of adverse outcomes resulting from these audits to determine the adequacy of the company’s provision for taxes. Such tax changes could increase the effective tax rates in many of the countries where the company has operations and ultimately could have an adverse effect on overall tax liability, along with increasing the complexity, burden and cost of tax compliance, all of which could impact the company’s operating results, cash flows, and financial condition.
11
When the company makes acquisitions, it may take on additional liabilities or may not be able to successfully integrate such acquisitions.
As part of the company’s history and growth strategy, it has acquired other businesses. Acquisitions involve numerous risks, including the following:
•effectively combining the acquired operations, technologies, or products;
•unanticipated costs or assumed liabilities, including those associated with regulatory actions or investigations;
•not realizing the anticipated financial benefit from the acquired companies;
•diversion of management’s attention;
•negative effects on existing customer and supplier relationships; and
•potential loss of key employees of the acquired companies.
Further, the company has made, and may continue to make acquisitions of, or investments in new services, businesses or technologies to expand its current service offerings and product lines. Some of these may involve risks that may differ from those traditionally associated with the company’s core distribution business, including undertaking product or service warranty responsibilities that in its traditional core business would generally reside primarily with its suppliers. In addition, our effective tax rate for future periods could be impacted by mergers and acquisitions. If the company is not successful in mitigating or insuring against such risks, it could have a material adverse effect on the company’s business.
The company relies heavily on its internal information systems, which, if not properly functioning, could materially adversely affect the company’s business.
The company’s current global operations reside on multiple technology platforms. The size and complexity of the company’s computer systems make them potentially vulnerable to breakdown, malicious intrusion, and random attack. Failure to properly or adequately address any unaccounted for or unforeseen issues could impact the company’s ability to perform necessary business operations, which could materially adversely affect the company’s business.
Regulatory and Legal Risks
Products sold by the company may be found to be defective and, as a result, warranty and/or product liability claims may be asserted against the company, which may have a material adverse effect on the company.
The company sells its components at prices that are significantly lower than the cost of the equipment or other goods in which they are incorporated. As a result, the company may face claims for damages (such as consequential damages) that are disproportionate to the revenues and profits it receives from the components involved in the claims. While the company typically has provisions in its supplier agreements that hold the supplier accountable for defective products, and the company and its suppliers generally exclude consequential damages in their standard terms and conditions, the company’s ability to avoid such liabilities may be limited as a result of differing factors, such as the inability to exclude such damages due to the laws of some of the countries where the company does business. The company’s business could be materially adversely affected as a result of a significant quality or performance issue in the products sold by the company, if it is required to pay for the associated damages. Although the company currently has product liability insurance, such insurance is limited in coverage and amount and may not be sufficient to cover all possible claims. Further, when relying on contractual liability exclusions, the company could lose customers if their claims are not addressed to their satisfaction.
Tariffs may result in increased prices and could adversely affect the company’s business and results of operations.
In recent years, the U.S. government has imposed tariffs on certain products imported into the United States and the Chinese government has imposed tariffs on certain products imported into China, which have increased the prices of many of the products that the company purchases from its suppliers. The tariffs, along with any additional tariffs or trade restrictions that may be implemented by the U.S., China, or other countries, could result in further increased prices. While the company intends to pass price increases on to its customers, the effect of tariffs on prices may impact sales and results of operations. Retaliatory tariffs imposed by other countries on U.S. goods have not yet had a significant impact, but the company cannot predict further developments. The tariffs and the additional operational costs incurred in minimizing the number of products subject to the tariffs could adversely affect the operating profits for certain of the company’s businesses and customer demand for certain products which could have an adverse effect on its business and results of operations.
12
In addition, in the event that the company pays tariffs for products it imports from China which are then re-exported to other locations outside of the United States, the company may be eligible for refunds of certain tariffs. In order to qualify for these tariff drawbacks, the company must provide data and documentation to the U.S. government that it must obtain from third-party sources, such as its suppliers. There is no guarantee the company will be able to obtain this additional data and documentation from those other sources, which could result in the U.S. government rejecting the drawback requests. Further, there are additional administrative costs expended by the company in furtherance of these efforts. Finally, due to the backlog of drawback applications, the U.S. government has been slow in issuing the associated drawback refunds. The company’s inability to obtain the drawback refunds or significant delays in receiving them could result in a material adverse effect on the company’s business.
The company is subject to U.S. and certain foreign export and import controls, sanctions, embargoes, anti-corruption laws, anti-bribery laws, and anti-money laundering laws and regulations. In the event of non-compliance, the company can face serious consequences, which can harm its business.
The company is subject to export control and import laws and regulations, including the U.S. Export Administration Regulations (“EAR”), U.S. Customs regulations, and various economic and trade sanctions regulations administered by the U.S. Treasury Department’s Office of Foreign Assets Controls (“OFAC”). Products the company sells which are either manufactured in the United States or based on U.S. technology (“U.S. Products”) are subject to the EAR when exported and re-exported to and from all international jurisdictions, in addition to the local jurisdiction’s export regulations applicable to individual shipments. Licenses or proper license exemptions may be required by local jurisdictions’ export regulations, including EAR, for the shipment of certain U.S. Products to certain countries, including China, India, Russia, and other countries in which the company operates. Non-compliance with the EAR, OFAC regulations, or other applicable export regulations can result in a wide range of penalties including the denial of export privileges, fines, criminal penalties, and the seizure of inventories. In the event that any export regulatory body determines that any shipments made by the company violate the applicable export regulations, the company could be fined significant sums and/or its export capabilities could be restricted, which could have a material adverse effect on the company’s business. For example, in 2019, the company determined that from 2015 to 2019 a limited number of non-executive employees, without first obtaining required authorization from the company or the United States government, had facilitated product shipments with an aggregate total invoiced value of approximately $4.8 million, to resellers for reexports to persons covered by the Iran Threat Reduction and Syria Human Rights Act of 2012 or other United States sanctions and export control laws. The company has voluntarily reported these activities to OFAC and the United States Department of Commerce’s Bureau of Industry and Security (“BIS”), conducted an internal investigation and terminated or disciplined the employees involved. BIS has closed its investigation and issued the company a warning letter without referring the matter for further proceedings. No penalties have been imposed by BIS. The company has cooperated fully and intends to continue to cooperate fully with OFAC with respect to its review, which may result in the imposition of penalties, the magnitude of which the company is currently not able to estimate. In addition, the company’s distribution process includes the use of third parties that operate outside of the company’s direct control. Although the company conducts risk based due diligence on third parties in its distribution supply chain, noncompliance with applicable import, export, and other laws and regulations by these third parties may negatively impact the company.
Further, the company is also subject to the U.S. Foreign Corrupt Practices Act of 1977, as amended, the U.S. domestic bribery statute contained in 18 U.S.C. §201, and other national and sub-national anti-bribery and anti-money laundering laws in the countries in which it conducts business. Anti-corruption laws have been enforced aggressively in recent years, are interpreted broadly and prohibit companies and their employees, agents, contractors, and other affiliated parties from authorizing, promising, offering, or providing, directly or indirectly, improper payments or transfers of money or anything else of value to recipients in the public or private sector. The company engages third parties to provide services. The company can be held liable for the corrupt or other illegal activities of its employees, agents, contractors, and counterparties, even if it does not explicitly authorize or have actual knowledge of such activities. While the company has policies and procedures to foster compliance, any violations of the laws and regulations described above may result in substantial civil and criminal fines and penalties, imprisonment, the loss of export or import privileges, debarment, tax reassessments, breach of contract and fraud litigation, reputational harm, and other consequences.
The company is subject to environmental laws and regulations and sustainability initiatives, and may be impacted by climate change, in ways that could materially adversely affect its business.
A number of jurisdictions in which the company’s products are sold have enacted laws addressing environmental and other impacts from product disposal, use of hazardous materials in products, use of chemicals in manufacturing, recycling of products at the end of their useful life, and other related matters. These laws prohibit the use of certain substances in the manufacture of products sold by the company and impose a variety of requirements for modification of manufacturing processes, registration, chemical testing, labeling, and other matters. Failure to comply with these laws or any other applicable environmental
13
regulations could result in fines or suspension of sales. Additionally, these directives and regulations may result in the company having non-compliant inventory that may be less readily salable or have to be written off.
Some environmental laws impose liability, sometimes without fault, for investigating or cleaning up contamination on or emanating from the company’s currently or formerly owned, leased, or operated property, as well as for damages to property or natural resources and for personal injury arising out of such contamination. Under these laws and regulations, the company may be responsible for investigating, removing, or otherwise remediating hazardous substances released at properties or facilities it owns or operates, regardless of when such substances were released. As the distribution business, in general, does not involve the manufacture of products, it is typically not subject to significant liability in this area. However, there may be occasions, including through acquisitions, where environmental liability arises. Two sites for which the company assumed responsibility as part of the Wyle Electronics (“Wyle”) acquisition are known to have environmental issues, one at Norco, California and the other at Huntsville, Alabama. The company was also named as a defendant in a private lawsuit filed in connection with alleged contamination at a small industrial building formerly leased by Wyle Laboratories in El Segundo, California. That lawsuit was ultimately settled, but the possibility remains that government entities or others may attempt to involve the company in further characterization or remediation of groundwater issues in the area. The presence of environmental contamination could also interfere with ongoing operations or adversely affect the company’s ability to sell or lease its properties. The discovery of contamination for which the company is responsible, the enactment of new laws and regulations, or changes in how existing regulations are enforced, could require the company to incur costs for compliance or subject it to unexpected liabilities.
Additionally, long-term climate change impacts, including the frequency and magnitude of severe weather events, and natural disasters, may significantly impact the company’s operations and business, either directly or indirectly, by adversely affecting the price and availability of energy, and the supply of other services or materials throughout the company’s supply chain, any of which could have a material adverse effect on the company’s business.
Proposed and existing efforts to address concerns over climate change by reducing greenhouse gas emissions could directly or indirectly affect the company’s costs of energy and other operating costs. Investors are placing a greater emphasis on environmental factors, and the company may be unable to meet investor expectations in this regard. In addition, a number of the company’s customers have adopted, or may adopt, procurement policies that may impose sustainability standards on suppliers. The perceptions held by the company’s shareholders, potential investors, suppliers, customers, other stakeholders, or the communities in which the company does business may depend, in part, on whether the company meets on a timely basis or at all the sustainability standards imposed on the company or that the company chooses or aspires to achieve. The subjective nature and wide variety of methods and processes used by various stakeholders, including investors, to assess sustainability criteria could result in a negative perception or misrepresentation of the company’s sustainability policies and practices. Also, by electing to establish and publicly share the company’s sustainability standards, the company’s business may face increased scrutiny related to sustainability activities, and the company’s reputation could be harmed. In addition, sustainability laws, regulations, requirements, and initiatives may increase compliance costs.
The company may be subject to intellectual property rights claims, which are costly to defend, could require payment of damages or licensing fees and could limit the company’s ability to use certain technologies in the future.
Certain of the company’s products and services include intellectual property owned primarily by the company’s third party suppliers and, to a lesser extent, the company itself. Substantial litigation and threats of litigation regarding intellectual property rights exist in the semiconductor/integrated circuit, software and some service industries. From time to time, third parties (including certain companies in the business of acquiring patents not for the purpose of developing technology but with the intention of aggressively seeking licensing revenue from purported infringers) may assert patent, copyright and/or other intellectual property rights to technologies that are important to the company’s business. Depending on the nature of the claim, the company may be able to seek indemnification from its suppliers for itself and its customers against such claims, but there is no assurance that it will be successful in obtaining such indemnification or that the company is fully protected against such claims. In addition, the company is exposed to potential liability for technology that it develops itself or when it combines multiple technologies of its suppliers for which it may have limited or no indemnification protections. In any dispute involving products or services that incorporate intellectual property from multiple sources or is developed, licensed by the company, or obtained through acquisition, the company’s customers could also become the targets of litigation. The company may be obligated to indemnify and defend its customers if the products or services the company sells are alleged to infringe any third party’s intellectual property rights. Any infringement or indemnification claim brought against the company, regardless of the duration, outcome, or size of damage award, could:
•result in substantial cost to the company;
•divert management’s attention and resources;
14
•be time consuming to defend;
•result in substantial damage awards; or
•cause product shipment delays.
Additionally, if an infringement claim against the company or its customers is successful, the company may be required to pay damages or seek royalty or license arrangements, which may not be available on commercially reasonable terms. The payment of any such damages or royalties may significantly increase the company’s operating expenses and materially harm the company’s operating results and financial condition. Further, royalty or license arrangements may not be available at all, which would then require the company to stop selling certain products or using certain technologies, which could negatively affect the company’s ability to compete effectively.
Restrictions on immigration or changes in immigration laws could limit the company’s access to qualified and skilled professionals, increase the cost of doing business, or otherwise disrupt operations.
Restrictions on immigration or changes in immigration laws could limit the company’s access to qualified and skilled professionals, increase the cost of doing business, or otherwise disrupt operations. The success of portions of the company’s business is dependent on its ability to recruit engineers and other professionals. Immigration laws in the United States and other countries in which the company operates are subject to legislative changes, as well as variations in the standards of application and enforcement due to political forces and economic conditions. It is difficult to predict the political and economic events that could affect immigration laws, or the restrictive impact they could have on obtaining or renewing work visas. If immigration laws change or if more restrictive government regulations are enacted, the company’s access to qualified and skilled professionals may be limited, the costs of doing business may increase, operations may be disrupted, and the company’s business may be materially negatively impacted.
The company may not be able to adequately anticipate, prevent, or mitigate damage resulting from criminal and other illegal or fraudulent activities committed against it or as a result of misconduct or other improper activities by its employees or contractors.
Global businesses are facing increasing risks of criminal, illegal, and other fraudulent acts. The evolving nature of such threats, considering new and sophisticated methods used by criminals, including phishing, misrepresentation, social engineering and forgery, is making it increasingly difficult for the company to anticipate and adequately mitigate these risks. In addition, designing and implementing measures to defend against, prevent, and detect these types of activities are increasingly costly and invasive to the operations of the business. Misconduct or failure of its employees or contractors to adhere to company policy may further heighten such risks. As a result, the company could experience a material loss to the extent that controls and other measures implemented to address these threats fail to prevent or detect such acts.
In addition, misconduct by its employees or contractors may include intentional failures to comply with the applicable laws and regulations in the United States and abroad, report financial information or data accurately or disclose unauthorized activities to the company. Such misconduct could result in legal or regulatory sanctions and cause serious harm to the company, including to it's reputation.
It is not always possible to identify and deter employee misconduct, and any other precautions the company takes to detect and prevent this activity may not be effective in controlling unknown or unmanaged risks or losses, or in protecting the company from governmental investigations or other actions or lawsuits stemming from a failure to comply with these laws or regulations. If any such actions are instituted against the company, and it is not successful in defending itself or asserting its rights, those actions could result in the imposition of significant civil, criminal and administrative penalties, which could have a significant impact on the company’s business. Whether or not the company is successful in defending against such actions or investigations, it could incur substantial costs, including legal fees, and divert the attention of management in defending itself against any of these claims or investigations.
Cyber security and privacy incidents and also ransomware may hurt the company’s business, damage its reputation, increase its costs, and cause losses.
The company’s information technology systems could be subject to cyber security and privacy incidents, including invasion, cyber-attacks, ransom demands, or data privacy breaches by employees and others with authorized access, and unauthorized persons. Such attacks could result in disruption to the company’s operations and/or loss or compromise of, or damage to, the company’s or any of its customers’ or suppliers’ data, confidential information, or reputation. The company’s information
15
technology systems security measures may also be compromised due to employee error, malfeasance, or otherwise. Additionally, outside parties may attempt to fraudulently induce employees, customers, or suppliers to disclose sensitive information in order to compromise the company’s data, assets and information technology systems. Any such incident could result in significant legal and financial exposure, damage to the company’s reputation, loss of competitive advantage, and a loss of confidence in the security of the company’s information technology systems that could potentially have an adverse impact on the company’s business. Because the techniques used to obtain unauthorized access, disable or degrade, or sabotage the company’s information technology systems and data and information stored on those systems change frequently and often are not recognized until launched, the company may be unable to anticipate these techniques or to implement adequate preventive or protective measures. Further, third parties, such as hosted solution providers, that provide services for the company’s operations, could be a source of risk in the event of a failure of their own systems and infrastructure or could experience their own privacy or security event which could create risks similar to those described above.
The company makes investments seeking to address these risks and vulnerabilities, including ongoing monitoring, updating networks and systems, and personnel awareness training of potential cyber security and privacy threats to help ensure employees remain diligent in identifying potential risks. In addition, the company has deployed monitoring capabilities to support early detection, internal and external escalation, and effective responses to potential anomalies. As part of the company’s regular review of potential risks, the company analyzes emerging cyber security and privacy threats as well as the company’s plan and strategies to address them and presents them to senior management. Although the company has developed systems and processes that are designed to protect information and information systems and to prevent data loss and other security and privacy incidents, including systems and processes designed to reduce the impact of a security or privacy incident, such measures cannot provide absolute security. Such incidents, whether successful or unsuccessful, could result in the company incurring costs related to, for example, rebuilding internal systems, managing its brand and reputation, defending against litigation, responding to regulatory inquiries or actions, paying damages, or taking other remedial steps.
Also, global privacy legislation, enforcement, and policy activity are rapidly expanding and creating a complex compliance environment. The company’s actual or perceived failure to comply with federal, state, or international privacy related or data protection laws and regulations could result in proceedings against the company by governmental entities or others, as well as impact to its brand and reputation, as a result of which the company may suffer losses that could have a material adverse effect on its business.
Financial Risks
The company may not have adequate or cost-effective liquidity or capital resources.
The company requires cash or committed liquidity facilities for general corporate purposes, such as funding its ongoing working capital, acquisitions, and capital expenditure needs, as well as to refinance indebtedness. At December 31, 2021, the company had cash and cash equivalents of $222.2 million. In addition, the company currently has access to committed credit lines of $2.0 billion and a committed North America asset securitization program of $1.3 billion, of which the company had no outstanding borrowings at December 31, 2021. The company’s ability to satisfy its cash needs depends on its ability to generate cash from operations and to access the financial markets, both of which are subject to general economic, financial, competitive, legislative, regulatory, and other factors that are beyond its control.
The company may, in the future, need to access the financial markets to satisfy its cash needs. The company’s ability to obtain external financing is affected by various factors, including general financial market conditions and the company’s debt ratings. Further, any increase in the company’s level of debt or deterioration of its operating results may cause a reduction in its current debt ratings. Any downgrade in the company’s current debt rating or tightening of credit availability could impair the company’s ability to obtain additional financing or renew existing credit facilities on acceptable terms, if at all, negatively impact the price of the company’s common stock, increase its interest payments under existing debt agreements and have other negative implications on its business, many of which are beyond the company’s control. Under the terms of any additional external financing, the company may incur higher financing expenses and become subject to additional restrictions and covenants. For example, the company’s existing debt agreements contain restrictive covenants, including covenants requiring compliance with specified financial ratios, and a failure to comply with these or any other covenants may result in an event of default. An increase in the company’s financing costs or loss of access to cost-effective capital resources could have a material adverse effect on the company’s business.
16
The agreements governing some of the company’s financing arrangements contain various covenants and restrictions that limit some of management’s discretion in operating the business and could prevent the company from engaging in some activities that may be beneficial to its business.
The agreements governing some of the company’s financings contain various covenants and restrictions that, in certain circumstances, could limit its ability to:
•grant liens on assets;
•make investments or certain acquisitions;
•merge, consolidate, or transfer all or substantially all of its assets;
•incur additional debt; or
•engage in certain transactions with affiliates.
As a result of these covenants and restrictions, the company may be limited in how it conducts its business and may be unable to raise additional debt, compete effectively, or make investments.
Further, if an event of default under any of the company’s existing debt agreements occurred or became imminent, while the company could explore alternative sources of capital, whether debt or equity, such alternative sources may be more expensive than the costs it incurred under the company's existing credit facility. Further, the company may be unable to borrow additional amounts under the existing credit facility, and as a result may be unable to make acquisitions or fund share repurchases, and the lenders thereunder may be able to accelerate the company’s obligations under the debt agreement. This circumstance would have a material adverse effect on the company’s financial position and results of operations.
The company’s goodwill and identifiable intangible assets could become impaired, which could reduce the value of its assets and reduce its net income in the year in which the write-off occurs.
Goodwill represents the excess of the cost of an acquisition over the fair value of the assets acquired. The company also ascribes value to certain identifiable intangible assets, which consist primarily of customer relationships and trade names, among others, as a result of acquisitions. The company may incur impairment charges on goodwill or identifiable intangible assets if it determines that the fair values of the goodwill or identifiable intangible assets are less than their current carrying values. The company evaluates, on a regular basis, whether events or circumstances have occurred that indicate all, or a portion, of the carrying amount of goodwill or identifiable intangible assets may no longer be recoverable, in which case an impairment charge to earnings would become necessary.
Refer to Notes 1 and 3 of the Notes to the Consolidated Financial Statements and “Critical Accounting Policies” in Management’s Discussion and Analysis of Financial Condition and Results of Operations for further discussion of the impairment testing of goodwill and identifiable intangible assets.
A decline in general economic conditions, a substantial increase in market interest rates, and increase in income tax rates, or the company’s inability to meet long-term working capital or operating income projections could impact future valuations of the company’s reporting units, and the company could be required to record an impairment charge in the future, which could impact the company’s consolidated balance sheets, as well as the company’s consolidated statements of operations. If the company were required to recognize an impairment charge in the future, the charge would not impact the company’s consolidated cash flows, current liquidity, capital resources, and covenants under its existing revolving credit facility, North America asset securitization program, and other outstanding borrowings.
General Risks
The company’s success depends upon its ability to attract, retain, motivate and develop key executive and employee talent and the strategies they develop and implement.
Any failure to attract, retain, motivate and develop key executive and employee talent may materially and adversely affect the company’s business, prospects, financial condition, and results of operations. The company’s success depends, to a significant extent, on the capability, expertise, and continued services of its key executives. The company relies on the expertise and experience of certain key executives in developing business strategies, business operations, and maintaining relationships with customers and suppliers. If the company were to lose any of its key executives, it may not be able to find a suitable replacement with comparable knowledge and experience in a timely manner, or if at all, at similar level of remuneration and other benefits.
17
If the company fails to maintain an effective system of internal controls or discovers material weaknesses in its internal controls over financial reporting, it may not be able to report its financial results accurately or timely or detect fraud, which could have a material adverse effect on its business.
An effective internal control environment is necessary for the company to produce reliable financial reports, safeguard assets, and is an important part of its effort to prevent financial fraud. The company is required to annually evaluate the effectiveness of the design and operation of its internal controls over financial reporting. Based on these evaluations, the company may conclude that enhancements, modifications, or changes to internal controls are necessary or desirable. While management evaluates the effectiveness of the company’s internal controls on a regular basis, these controls may not always be effective. There are inherent limitations on the effectiveness of internal controls, including collusion, management override, and failure in human judgment. In addition, control procedures are designed to reduce rather than eliminate financial statement risk. If the company fails to maintain an effective system of internal controls, or if management or the company’s independent registered public accounting firm discovers material weaknesses in the company’s internal controls, it may be unable to produce reliable financial reports or prevent fraud, which could have a material adverse effect on the company’s business. In addition, the company may be subject to sanctions or investigation by regulatory authorities, such as the SEC or the NYSE. Any such actions could result in an adverse reaction in the financial markets due to a loss of confidence in the reliability of the company’s consolidated financial statements, which could cause the market price of its common stock to decline or limit the company’s access to capital.
General business conditions are vulnerable to the effects of epidemics and pandemics, such as the COVID-19 pandemic, which could materially disrupt the company’s business and have a negative impact on the company’s financial results and financial condition.
The company is vulnerable to the general economic effects of epidemics, pandemics and other public health crises, such as the COVID-19 pandemic. The global COVID-19 pandemic continues to create significant macroeconomic uncertainty, volatility and disruption, including supply constraints, extended lead times, and unpredictability across many markets. Supply chain constraints are being caused by shortages in electronics components markets and supply chain logistical issues resulting in extended lead times and unpredictability. Also, there has been a substantial curtailment of travel and business activities due to COVID-19, which has caused and may continue to cause significant disruptions to the U.S. and global economy. The extent to which COVID-19 and ensuing challenges such as supply chain constraints will continue to impact the company’s results will depend primarily on future developments, which are highly uncertain and cannot be predicted with confidence, including the severity and duration of the crisis, the speed and effectiveness of vaccine and treatment developments and deployment, the impact of vaccine and other mandates, potential mutations of COVID-19, and the impact of actions taken and that will be taken to contain COVID-19 or treat its impact, among others. For example, COVID-19 or other epidemics or pandemics may result in the company having to limit operations, rely on personnel working from home, or implement additional restrictions as a result of widespread government restrictions, any of which may negatively impact productivity or disrupt, delay or otherwise adversely impact the company's business. Remote working could increase the company’s cyber security risk. In addition, a U.S. or global recession or a banking crisis triggered by the COVID-19 pandemic could have a material adverse effect on the company’s business, financial results and financial condition, including by reducing the demand for its products and services, reducing the access to its supplies, increasing customer defaults, reducing its access to capital, and reducing the value of its common stock.
Item 1B. Unresolved Staff Comments.
None.
Item 2. Properties.
The company has executive offices located in Centennial, Colorado under a long-term lease expiring in 2033. The company leases eight major warehouses and logistics centers with approximately 2.7 million square feet of space located in Reno, Nevada, Phoenix, Arizona, Hong Kong, Shenzhen, China, and two warehouses in Venlo, Netherlands. The company has 35 smaller distribution centers with approximately 904 thousand square feet of space located throughout the Americas, EMEA, and Asia-Pacific regions. The company believes its facilities are well maintained and suitable for company operations, and does not anticipate significant difficulty in renewing its leases as they expire or securing replacement facilities.
18
Item 3. Legal Proceedings.
See Note 15, Contingencies, to the consolidated financial statements included in Item 8 of Part II of this 10-K for information regarding certain legal proceedings in which the company is involved.
Item 4. Mine Safety Disclosures.
Not applicable.
19
PART II
Item 5. Market for Registrant's Common Equity, Related Stockholder Matters and Issuer Purchases of Equity Securities.
Market Information
The company's common stock is listed on the NYSE (trading symbol: “ARW”).
Record Holders
On February 3, 2022, there were approximately 1,306 shareholders of record of the company's common stock.
Equity Compensation Plan Information
The following table summarizes information, as of December 31, 2021, relating to the Omnibus Incentive Plan, which was approved by the company's shareholders and under which cash-based awards, non-qualified stock options, incentive stock options, stock appreciation rights, restricted stock, restricted stock units, performance shares, performance share units, covered employee annual incentive awards, and other stock-based awards may be granted.
| Plan Category | Number of Securities to be Issued Upon Exercise of Outstanding Options, Warrants and Rights | Weighted-Average Exercise Price of Outstanding Options, Warrants and Rights | Number of Securities Remaining Available for Future Issuance | |||||||||||||||||
| Equity compensation plans approved by security holders | 2,034,571 | $ | 80.50 | 6,209,975 | ||||||||||||||||
| Total | 2,034,571 | $ | 80.50 | 6,209,975 | ||||||||||||||||
20
Performance Graph
The following graph compares the performance of the company's common stock for the periods indicated with the performance of the Standard & Poor's MidCap 400 Index (“S&P 400 Stock Index”) and the average performance of a group consisting of the company's peer companies (“Peer Group”) on a line-of-business basis. During 2021, the companies included in the Peer Group are Avnet, Inc., CDW Corp., Celestica Inc., Flex Ltd., HP Enterprise Co., HP Inc., Jabil Inc., TD Synnex, and WESCO International, Inc. During 2021, in order to diversify the company's Peer Group and better measure our relative financial performance, CDW Corp., HP Enterprises Co., HP Inc., and TD Synnex were added to the Peer Group. In the year of change, the company is also showing the Peer Group used in the 2020 Form 10-K before the changes in 2021 (“2020 Peer Group”) for comparative purposes. The graph assumes $100 invested on December 31, 2016 in the company, the S&P 400 MidCap Stock Index, the Peer Group, and the 2020 Peer Group. Total return indicies reflect reinvestment of dividends and are weighted on the basis of market capitalization at the time of each reported data point.
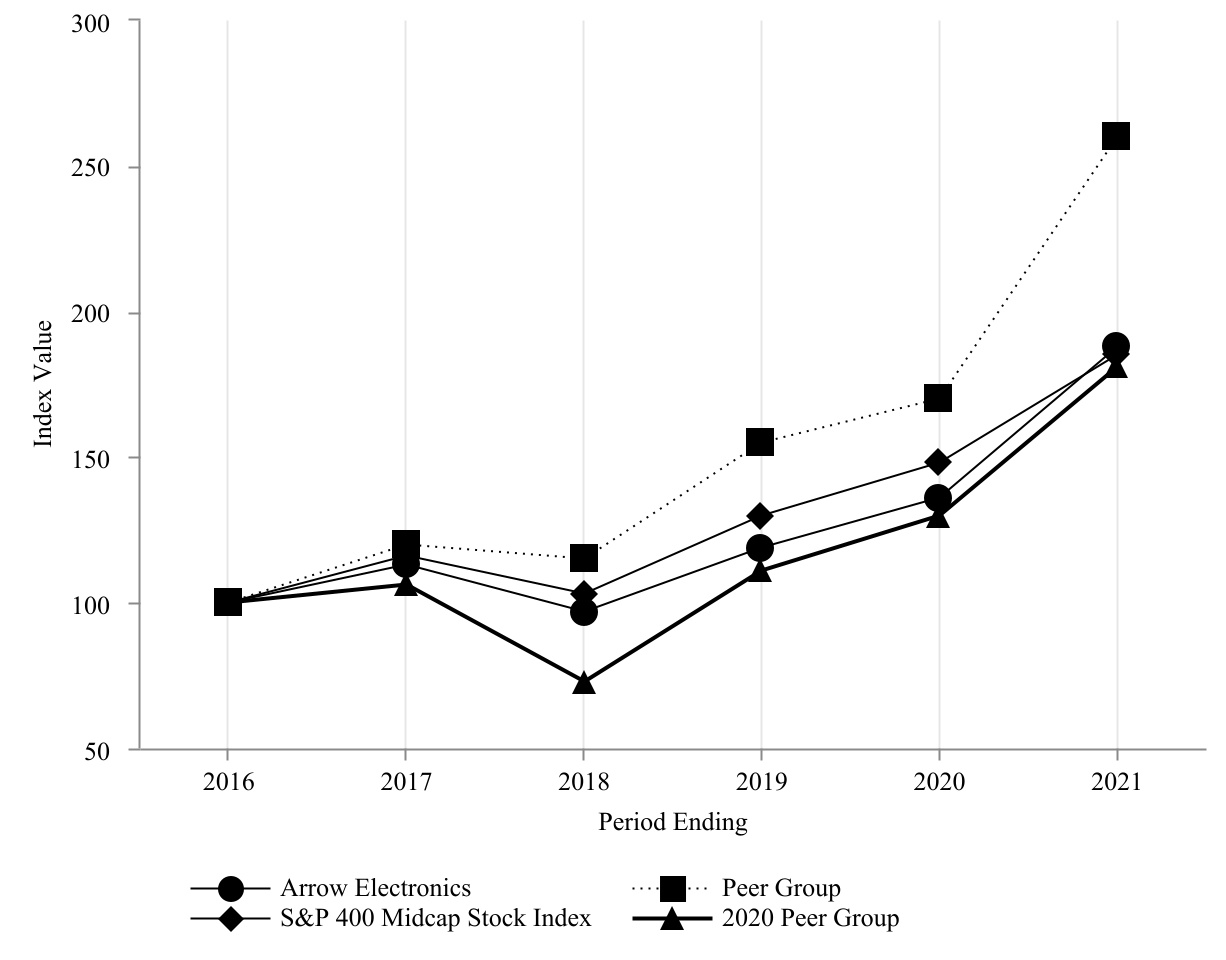
| 2016 | 2017 | 2018 | 2019 | 2020 | ||||||||||||||||
| Arrow Electronics | 100 | 113 | 97 | 119 | 136 | 188 | ||||||||||||||
| Peer Group | 100 | 120 | 115 | 155 | 170 | 260 | ||||||||||||||
| S&P 400 Midcap Stock Index | 100 | 116 | 103 | 130 | 148 | 185 | ||||||||||||||
| 2020 Peer Group | 100 | 106 | 73 | 111 | 130 | 181 | ||||||||||||||
21
Issuer Purchases of Equity Securities
The following table shows the share-repurchase activity for the quarter ended December 31, 2021 (in thousands except share and per share data):
| Month | Total Number of Shares Purchased | Average Price Paid per Share | Total Number of Shares Purchased as Part of Publicly Announced Program | Approximate Dollar Value of Shares that May Yet be Purchased Under the Program (a) | ||||||||||||||||||||||
| October 3 through October 30, 2021 | 424,409 | $ | 117.81 | 424,409 | $ | 363,468 | ||||||||||||||||||||
| October 31 through November 27, 2021 | 666,822 | 125.93 | 666,822 | 279,494 | ||||||||||||||||||||||
| November 28 through December 31, 2021 | 923,308 | 125.66 | 923,308 | 763,468 | ||||||||||||||||||||||
| Total | 2,014,539 | 2,014,539 | ||||||||||||||||||||||||
(a)During 2021, the company was authorized to purchase up to $1,200,000 of its common stock under the share-repurchase program announced in July and December in amounts of $600,000. Of the newly authorized shares available for repurchase, $436,532 has been utilized, while the $763,468 in the table represents the remaining amount available for repurchase under the program as of December 31, 2021.
Item 6. [Reserved].
22
Item 7. Management's Discussion and Analysis of Financial Condition and Results of Operations.
This section of the Form 10-K generally discusses 2021 and 2020 items and year-to-year comparisons between 2021 and 2020. Discussions of 2019 items and year-to-year comparisons between 2020 and 2019 that are not included in this Form 10-K can be found in “Management's Discussion and Analysis of Financial Condition and Results of Operations” in Part II, Item 7 of the Company's Annual Report on Form 10-K for the fiscal year ended December 31, 2020.
Information Relating to Forward-Looking Statements
This report includes "forward-looking statements," as the term is defined under the federal securities laws. Forward-looking statements are those statements which are not statements of historical fact. These forward-looking statements can be identified by forward-looking words such as “expects,” “anticipates,” “intends,” “plans,” “may,” “will,” “believes,” “seeks,” “estimates,” and similar expressions. These forward-looking statements are subject to numerous assumptions, risks, and uncertainties, which could cause actual results or facts to differ materially from such statements for a variety of reasons, including, but not limited to: potential adverse effects of the ongoing global COVID-19 pandemic, including actions taken to contain or mitigate the impact of COVID-19, industry conditions, changes in product supply, pricing and customer demand, competition, other vagaries in the global components and the global enterprise computing solutions (“ECS”) markets, changes in relationships with key suppliers, increased profit margin pressure, changes in legal and regulatory matters, non-compliance with certain regulations, such as export, antitrust, and anti-corruption laws, foreign tax and other loss contingencies, and the company's ability to generate cash flow. For a further discussion of these and other factors that could cause the company's future results to differ materially from any forward-looking statements, see the section entitled “Risk Factors” in this Annual Report on Form 10-K, as well as in other filings the company makes with the Securities and Exchange Commission. Shareholders and other readers are cautioned not to place undue reliance on these forward-looking statements, which speak only as of the date on which they are made. The company undertakes no obligation to update publicly or revise any of the forward-looking statements.
Certain Non-GAAP Financial Information
In addition to disclosing financial results that are determined in accordance with accounting principles generally accepted in the United States (“GAAP”), the company also discloses certain non-GAAP financial information, including:
•Non-GAAP sales and non-GAAP gross profit exclude the impact of changes in foreign currencies (referred to as “changes in foreign currencies”) by re-translating prior period results at current period foreign exchange rates and the impact of the wind down of the company’s personal computer and mobility asset disposition business (referred to as “wind down”).
•Non-GAAP operating expenses excludes restructuring, integration, and other charges, AFS notes receivable recoveries related to the Arrow Financing Solutions (“AFS”) business (referred to as “AFS notes receivable recoveries”), impairments of long-lived assets, the impact of changes in foreign currencies, and the impact of wind down.
•Non-GAAP operating income excludes identifiable intangible asset amortization, restructuring, integration, and other charges, AFS notes receivable recoveries, impairments of long-lived assets, and the impact of wind down.
•Non-GAAP effective tax rate and non-GAAP net income attributable to shareholders exclude identifiable intangible asset amortization, restructuring, integration, and other charges, AFS notes receivable recoveries, net gains on investments, certain tax adjustments, impairments of long-lived assets, pension settlement gain, and the impact of wind down.
Management believes that providing this additional information is useful to the reader to better assess and understand the company’s operating performance, especially when comparing results with previous periods, primarily because management typically monitors the business adjusted for these items in addition to GAAP results. However, analysis of results on a non-GAAP basis should be used as a complement to, and in conjunction with, data presented in accordance with GAAP.
Overview
The company is a global provider of products, services, and solutions to industrial and commercial users of electronic components and enterprise computing solutions. The company has one of the world's broadest portfolios of product offerings available from leading electronic components and enterprise computing solutions suppliers, coupled with a range of services, solutions and tools that help industrial and commercial customers introduce innovative products, reduce their time to market, and enhance their overall competitiveness. The company has two business segments, the global components business segment and the global enterprise computing solutions (“ECS”) business segment. The company distributes electronic components to original equipment manufacturers (“OEMs”) and contract manufacturers (“CMs”) through its global components business segment and provides enterprise computing solutions to value-added resellers (“VARs”) and managed service providers
23
(“MSPs”) through its global ECS business segment. For 2021, approximately 76% and 24% of the company's sales were from the global components business and the global ECS business, respectively.
The company's strategic initiatives include the following:
•Offering a variety of value added demand creation services in the global components business, including design, engineering, global marketing and integration services to promote the future sale of suppliers’ products, which generally lead to longer and more profitable relationships with our suppliers and customers.
•The company has a global supply chain services business that has grown organically within the global components business. It derives services revenue from providing supply chain services such as procurement, logistics, warehousing, and insights from data analytics.
•Enabling customer cloud solutions through the global ECS business' cloud marketplace and management platform, ArrowSphere, which helps VARs and MSPs to manage, differentiate, and scale their cloud businesses while providing the business intelligence that IT solution providers need to drive growth.
The company's financial objectives are to grow sales faster than the market, increase the markets served, grow profits faster than sales, generate earnings per share growth in excess of competitors’ earnings per share growth and market expectations, grow earnings per share at a rate that provides the capital necessary to support the company’s business strategy, allocate and deploy capital effectively so that return on invested capital exceeds the company’s cost of capital, and increase return on invested capital. To achieve its objectives, the company seeks to capture significant opportunities to grow across products, markets, and geographies. To supplement its organic growth strategy, the company continually evaluates strategic acquisitions to broaden its product and value-added service offerings, increase its market penetration, and expand its geographic reach.
Executive Summary
Consolidated sales for 2021 increased by 20.2% compared with the year-earlier period. The increase for 2021 was driven by a 28.6% increase in the global components business segment sales offset by a 0.6% decrease in global ECS business segment sales. Adjusted for the change in foreign currencies, non-GAAP consolidated sales increased 18.6% in 2021 compared with the year-earlier period.
The company reported net income attributable to shareholders of $1.1 billion in 2021 compared with a net income of $584.4 million in the year-earlier period. The following items impacted the comparability of the company's results for the years ended December 31, 2021 and 2020 (all amounts are before tax except for amounts related to the effects of tax changes):
•restructuring, integration, and other charges of $10.9 million in 2021 and $13.3 million in 2020;
•identifiable intangible asset amortization of $36.9 million in 2021 and $38.4 million in 2020;
•impairments of long-lived assets of $4.5 million in 2021 and $7.2 million in 2020;
•gains from wind down of business of $14.7 million in 2020;
•AFS notes receivable recoveries of $1.8 million in 2020;
•net gain on investments of $13.0 million in 2021 and $5.3 million in 2020;
•tax benefit of $1.3 million in 2020 related to legislation changes and other non-recurring tax adjustments; and
•pension settlement gain of $1.8 million in 2020.
Excluding the aforementioned items, non-GAAP net income attributable to shareholders increased to $1.1 billion in 2021 compared with $609.7 million in the year-earlier period. Net income in 2020 also included charges of approximately $32.7 million, net of tax, primarily related to foreign tax and other loss contingencies within the global ECS business.
Impact of the COVID-19 Pandemic
The global COVID-19 pandemic continues to create significant macroeconomic uncertainty, volatility and disruption, including supply constraints, extended lead times, and unpredictability across many markets. Supply chain constraints are being caused by shortages in electronics components markets and supply chain logistical issues resulting in extended lead times and unpredictability, which has impacted the business. Despite these challenges, to date the company has efficiently managed the global supply chain requirements of customers and suppliers, and as a result, during 2021 the company's global components business benefited from rising demand and higher prices for certain products leading to improved profit margins globally.
Management is actively monitoring the impact of the global situation on its financial condition, liquidity, operations, suppliers, industry, and workforce. The extent to which COVID-19 and related supply constraints will continue to impact the company’s results will depend primarily on future developments, including the severity and duration of the crisis, and the impact of actions
24
taken and that will be taken to contain COVID-19 or treat its impact, among others. These future developments are highly uncertain and cannot be predicted with confidence, however, the company currently expects component supply to remain well below demand through the better part of 2022. The global economic impact from COVID-19 may adversely affect the company's results of operations in the future and may affect the credit condition of some customers, which could increase delays in customer payments and credit losses.
Accordingly, current results and financial condition discussed herein may not be indicative of future operating results and trends. See discussion regarding the impacts of the COVID-19 pandemic included in Item 1A, Risk Factors, within this Form 10-K.
Impact on the first quarter of 2022
As a result of the timing of seasonal builds of electronic devices, and factoring our current estimation of supply chain constraints, we expect global components sales in the first quarter of 2022 to be slightly above fourth quarter 2021 sales.
Sales
Substantially all of the company’s sales are made on an order-by-order basis, rather than through long-term sales contracts. As such, the nature of the company’s business does not provide for the visibility of material forward-looking information from its customers and suppliers beyond a few months.
Following is an analysis of net sales by reportable segment for the years ended December 31 (in millions):
| 2021 | 2020 | Change | ||||||||||||||||||
| Consolidated sales, as reported* | $ | 34,477 | $ | 28,673 | 20.2 | % | ||||||||||||||
Impact of changes in foreign currencies | — | 403 | ||||||||||||||||||
| Non-GAAP consolidated sales | $ | 34,477 | $ | 29,076 | 18.6 | % | ||||||||||||||
Global components sales, as reported | $ | 26,358 | $ | 20,503 | 28.6 | % | ||||||||||||||
Impact of changes in foreign currencies | — | 261 | ||||||||||||||||||
| Non-GAAP global components sales | $ | 26,358 | $ | 20,764 | 26.9 | % | ||||||||||||||
Global ECS sales, as reported | $ | 8,120 | $ | 8,171 | (0.6) | % | ||||||||||||||
Impact of changes in foreign currencies | — | 142 | ||||||||||||||||||
| Non-GAAP global ECS sales | $ | 8,120 | $ | 8,313 | (2.3) | % | ||||||||||||||
* The sum of the components for sales, as reported, and non-GAAP sales may not agree to totals, as presented, due to rounding.
Consolidated sales for 2021 increased by $5.8 billion, or 20.2%, compared with the year-earlier period. The increase in 2021 was driven by an increase in global components business segment sales of $5.9 billion, or 28.6%, partially offset by a decrease in global ECS business segment sales of $51.2 million, or 0.6%, compared with the year-earlier period. Non-GAAP consolidated sales increased 18.6% in 2021, compared with the year-earlier period.
Compared with the year-earlier period, global components business segment sales for 2021 increased $5.9 billion, or 28.6%, as reported. The global components business capitalized on strong demand in all regions from higher sales volumes and favorable pricing in all regions. Sales in the Americas, EMEA, and Asia/Pacific regions increased 26.6%, 25.3%, and 31.6%, respectively. Increases during 2021 related to many product lines, however the company noted particularly strong demand in the industrial, communications, and data networking verticals. Changes in foreign exchange rates contributed favorably to results in the EMEA and Asia/Pacific regions during 2021. Non-GAAP global components sales increased 26.9% in 2021, compared with the year-earlier period.
Compared with the year-earlier period, global ECS business segment sales for 2020 decreased $51.2 million, or 0.6%, as reported. Decreases were primarily due to lower sales of IT solutions, including data center and hybrid cloud, in the Americas region, offset primarily by strengthening demand in the EMEA region for infrastructure software across the portfolio. Non-GAAP global components sales decreased 2.3% in 2021, compared with the year-earlier period.
25
Gross Profit
Following is an analysis of gross profit for the years ended December 31 (in millions):
| 2021 | 2020 | Change | |||||||||||||||||||||
| Consolidated gross profit, as reported | $ | 4,202 | $ | 3,191 | 31.7 | % | |||||||||||||||||
Impact of changes in foreign currencies | — | 52 | |||||||||||||||||||||
| Impact of wind down | — | (11) | |||||||||||||||||||||
| Non-GAAP consolidated gross profit | $ | 4,202 | $ | 3,232 | 30.0 | % | |||||||||||||||||
| Consolidated gross profit as a percentage of sales, as reported | 12.2 | % | 11.1 | % | 110 | bps | |||||||||||||||||
| Non-GAAP consolidated gross profit as a percentage of non-GAAP sales | 12.2 | % | 11.1 | % | 110 | bps | |||||||||||||||||
The company recorded gross profit of $4.2 billion for 2021 compared with $3.2 billion in the year-earlier period. Non-GAAP gross profit increased 30.0% in 2021 compared with the year-earlier period. Non-GAAP gross profit margins in 2021 increased by approximately 110 bps compared with the year-earlier period.
The increases in gross profit margins during 2021 related primarily to significant improvements in pricing and margins in the Americas and APAC regions, due in part to the current market conditions, product mix, and the global supply chain issues discussed above, as well as the company's ability to secure inventory to meet the strong demand. Growing demand in our global supply chain services offerings continued to have a positive impact on gross margins during 2021 compared with the year-earlier period.
The company is currently experiencing benefits to gross margins in the global components business due to the factors discussed above, which may not be representative of future trends or conditions. As such, the current gross margins may not be sustainable.
Selling, General, and Administrative Expenses and Depreciation and Amortization
Following is an analysis of operating expenses for the years ended December 31 (in millions):
| 2021 | 2020 | Change | |||||||||||||||||||||
| Selling, general, and administrative expenses, as reported | $ | 2,435 | $ | 2,087 | 16.7 | % | |||||||||||||||||
| Depreciation and amortization, as reported | 195 | 189 | 3.2 | % | |||||||||||||||||||
Operating expenses+ | $ | 2,630 | $ | 2,276 | 15.6 | % | |||||||||||||||||
| Impact of changes in foreign currencies | — | 37 | |||||||||||||||||||||
| Impact of wind down | — | 4 | |||||||||||||||||||||
| AFS notes receivable recoveries | — | 2 | |||||||||||||||||||||
| Non-GAAP operating expenses* | $ | 2,630 | $ | 2,318 | 13.5% | ||||||||||||||||||
| Operating expenses as a percentage of sales | 7.6 | % | 7.9 | % | (30) | bps | |||||||||||||||||
| Non-GAAP operating expenses as a percentage of non-GAAP sales | 7.6 | % | 8.0 | % | (40) | bps | |||||||||||||||||
+Operating expenses discussed here are presented before restructuring, integration, and other charges, and impairments of long-lived assets.
* The sum of the components for selling, general, and administrative expenses and depreciation and amortization, as reported, and non-GAAP operating expenses may not agree to totals, as presented, due to rounding.
Selling, general, and administrative expenses increased by $348.0 million, or 16.7%, in 2021, on a sales increase of 20.2%, compared with the year-earlier period. Selling, general, and administrative expenses, as a percentage of sales, was 7.1% and 7.3% for 2021 and 2020, respectively. Depreciation and amortization expense as a percentage of operating expenses was 7.4% for 2021 compared with 8.3% in the year-earlier period. Included in depreciation and amortization expense is identifiable intangible asset amortization of $36.9 million for 2021 compared to $38.4 million for the year-earlier period.
During 2021 and 2020, the company received $12.5 million and $2.4 million, respectively, in settlement funds in connection with certain class action claims (Refer to Note 15), which were recorded as a reduction of selling, general, and administrative expenses.
26
Operating expenses as a percentage of sales during 2021 was 7.6% compared to 7.9% in the year-earlier period. The decline related primarily to operational efficiencies the company achieved to align costs to the business mix and the settlement funds discussed above. This was partially offset by investments to grow the company's sales, higher variable costs related to higher margin product and services sold during the year, and increased costs related to the global supply chain environment. Higher variable costs primarily related to increased incentive compensation tied to sales and other personnel costs, as well as costs related to warehousing and shipping product.
Non-GAAP operating expenses increased 13.5% compared with the year-earlier period. Non-GAAP operating expenses, as a percentage of non-GAAP sales, decreased 40 bps for 2021 compared with the year-earlier periods.
Restructuring, Integration, and Other Charges
Restructuring initiatives and integration costs are due to the company's continued efforts to lower costs, drive operational efficiency, integrate any acquired businesses, and the consolidation of certain operations, as necessary. The company recorded restructuring, integration, and other charges of $10.9 million and $13.3 million for 2021 and 2020, respectively.
As of December 31, 2021, the company does not anticipate there will be any material adjustments relating to the aforementioned restructuring and integration plans. Refer to Note 9, “Restructuring, Integration, and Other Charges” of the Notes to the Consolidated Financial Statements for further discussion of the company's restructuring and integration activities.
Operating Income
Following is an analysis of operating income for the years ended December 31 (in millions):
| 2021 | 2020 | Change | |||||||||||||||||||||
| Consolidated operating income, as reported | $ | 1,557 | $ | 895 | 74.0 | % | |||||||||||||||||
| Identifiable intangible asset amortization | 37 | 38 | |||||||||||||||||||||
| Restructuring, integration, and other charges | 11 | 13 | |||||||||||||||||||||
| AFS notes receivable recoveries | — | (2) | |||||||||||||||||||||
| Impairments | 4 | 7 | |||||||||||||||||||||
| Impact of wind down | — | (15) | |||||||||||||||||||||
| Non-GAAP consolidated operating income* | $ | 1,609 | $ | 937 | 71.7 | % | |||||||||||||||||
| Consolidated operating income as a percentage of sales, as reported | 4.5 | % | 3.1 | % | 140 | bps | |||||||||||||||||
| Non-GAAP consolidated operating income, as a percentage of sales | 4.7 | % | 3.3 | % | 140 | bps | |||||||||||||||||
* The sum of the components for non-GAAP consolidated operating income may not agree to totals, as presented, due to rounding.
The company recorded operating income of $1.6 billion, or 4.5% of sales, in 2021 compared with operating income of $894.5 million, or 3.1% of sales, in the year-earlier period. Non-GAAP operating income was $1.6 billion, or 4.7% of sales, in 2021 compared with non-GAAP operating income of $936.9 million, or 3.3% of sales, in the year-earlier period. Non-GAAP operating income increased 71.7% compared with the year-earlier period, on a sales increase of 20.2%.
Operating income, as a percentage of sales, increased 140 bps for 2021 primarily due to increases in sales volumes and prices from the global components business. The increase in operating margins are also impacted by the reserves and other adjustments related to foreign tax and other loss contingencies recorded within the global ECS business during the first quarter of 2020 (Refer to Note 15). These reserves are principally associated with transactional taxes on activity from several prior years, not significant to any one year. During 2021, changes in foreign currencies had a positive impact on operating income of $14.6 million when compared to the year-earlier period.
Interest and Other Financing Expense, Net
The company recorded net interest and other financing expense of $131.7 million for 2021, compared with $137.2 million in the year-earlier period. The decrease for 2021 primarily related to lower borrowings and interest rates on short term credit facilities, offset partially by decreased interest income. The decrease in interest income was primarily attributable to lower average cash balances and lower interest rates within the company's cash pooling arrangements.
27
Income Tax
The company records a provision for income taxes for the anticipated tax consequences of the reported financial results of operations using the asset and liability method. The following table presents the company's effective income tax rate deviation from the non-GAAP effective tax rate for the years ended December 31:
| 2021 | 2020 | ||||||||||
| Effective income tax rate | 22.7 | % | 22.8 | % | |||||||
| Identifiable intangible asset amortization | 0.1 | % | 0.1 | % | |||||||
| Restructuring, integration, and other charges | — | % | (0.3) | % | |||||||
| Impairments | — | % | 0.1 | % | |||||||
| Impact of tax legislation changes | — | % | 0.1 | % | |||||||
| Non-GAAP effective income tax rate* | 22.7 | % | 22.9 | % | |||||||
* The sum of the components for non-GAAP effective income tax rate may not agree to totals, as presented, due to rounding.
The change in the effective tax rate to 22.7% for 2021 from 22.8% for 2020 was primarily driven by changes in the mix of tax jurisdictions where taxable income is generated.
Net Income Attributable to Shareholders
Following is an analysis of net income attributable to shareholders for the years ended December 31 (in millions):
| 2021 | 2020 | |||||||||||||
| Net income attributable to shareholders, as reported | $ | 1,108 | $ | 584 | ||||||||||
| Identifiable intangible asset amortization* | 36 | 38 | ||||||||||||
| Restructuring, integration, and other charges | 11 | 13 | ||||||||||||
| Gain on investments, net | (13) | (5) | ||||||||||||
| AFS notes receivable recoveries | — | (2) | ||||||||||||
| Impairments | 4 | 7 | ||||||||||||
| Impact of wind down | — | (15) | ||||||||||||
| Pension settlement gain | — | (2) | ||||||||||||
| Tax effect of adjustments above | (10) | (8) | ||||||||||||
| Impact of tax legislation changes | — | (1) | ||||||||||||
| Non-GAAP net income attributable to shareholders** | $ | 1,137 | $ | 610 | ||||||||||
* Identifiable intangible asset amortization also excludes amortization related to the noncontrolling interest.
** The sum of the components for non-GAAP net income attributable to shareholders may not agree to totals, as presented, due to rounding.
The company recorded net income attributable to shareholders of $1.1 billion for 2021, compared with $584.4 million in the year-earlier period. Non-GAAP net income attributable to shareholders was $1.1 billion for 2021, compared with $609.7 million in the year-earlier period.
Liquidity and Capital Resources
Management believes that the company’s current cash availability, its current borrowing capacity under its revolving credit facility and asset securitization programs, and its expected ability to generate future operating cash flows are sufficient to meet its projected cash flow needs for the next 12 months and the foreseeable future. The company's current committed and undrawn liquidity stands at over $3.3 billion in addition to $222.2 million of cash on hand at December 31, 2021. The company also may issue debt or equity securities in the future and management believes the company will have adequate access to the capital markets, if needed. The company continually evaluates its liquidity requirements and would seek to amend its existing borrowing capacity or access the financial markets as deemed necessary.
The company’s principal sources of liquidity are existing cash and cash equivalents, cash generated from operations and cash provided by its revolving credit facilities and debt. The company's principal uses of liquidity include cash used in operations, investments to grow working capital, scheduled interest and principal payments on our borrowings, and the return of cash to shareholders through share repurchases.
28
The following table presents selected financial information related to liquidity at December 31 (in millions):
| 2021 | 2020 | Change | ||||||||||||||||||
| Working capital | $ | 5,709 | $ | 4,555 | $ | 1,154 | ||||||||||||||
| Cash and cash equivalents | 222 | 374 | (152) | |||||||||||||||||
| Short-term debt | 383 | 159 | 224 | |||||||||||||||||
| Long-term debt | 2,244 | 2,098 | 146 | |||||||||||||||||
Working Capital
The company maintains a significant investment in working capital which the company defines as accounts receivable, net, plus inventories less accounts payable. Working capital, as a percentage of sales was 15.8% and 13.5% in 2021 and 2020, respectively. The change in working capital during 2021, compared to the year-earlier period, was primarily attributable to increases in inventory and increases in trade and accounts receivable as a result of significantly increased sales compared to 2020.
Cash and Cash Equivalents
Cash equivalents consist of highly liquid investments, which are readily convertible into cash, with original maturities of three months or less. At December 31, 2021 and 2020, the company had cash and cash equivalents of $222.2 million and $373.6 million, respectively, of which $211.6 million and $140.1 million, respectively, were held outside the United States. Liquidity is affected by many factors, some of which are based on normal ongoing operations of the company's business and some of which arise from fluctuations related to global economics and markets.
To achieve greater cash management agility and to further advance business objectives, during the fourth quarter of 2019, the company reversed its assertion to indefinitely reinvest a certain portion of its foreign earnings, of which approximately $2.2 billion are still available for distribution in future periods as of December 31, 2021, after distributions of $53.6 million and $349.0 million during 2021 and 2020, respectively. The company has not reversed its assertion to indefinitely reinvest the residual $2.5 billion of undistributed earnings of its foreign subsidiaries and recognizes that it may be subject to additional foreign taxes and U.S. state income taxes, if it reverses its indefinite reinvestment assertion on these foreign earnings.
Revolving Credit Facilities and Debt
The following table summarizes the company’s credit facilities by category at December 31 (in millions):
| Borrowing capacity | Outstanding borrowings | Average daily balance outstanding | ||||||||||||||||||||||||||||||
| 2021 | 2020 | 2021 | 2020 | |||||||||||||||||||||||||||||
| North American asset securitization program (a) | $ | 1,250 | $ | — | $ | — | $ | 516 | $ | 430 | ||||||||||||||||||||||
| Revolving credit facility (b) | 2,000 | — | — | 10 | 21 | |||||||||||||||||||||||||||
| Commercial paper program (c) | 1,200 | — | — | 316 | 48 | |||||||||||||||||||||||||||
| Uncommitted lines of credit | 200 | — | — | — | 7 | |||||||||||||||||||||||||||
| EMEA asset securitization program (d) | 453 | 453 | 398 | 459 | 310 | |||||||||||||||||||||||||||
(a) In March 2021, the company amended its asset securitization program and, among other things, increased its borrowing capacity from $1.20 billion to $1.25 billion and extended its term to mature in March 2024.
(b) In September 2021, the company amended its revolving credit facility and, among other things, extended its term to mature in September 2026.
(c) Amounts outstanding under the commercial paper program are backstopped by available commitments under the company’s revolving credit facility.
(d) The facility limit is €400 million and has been converted to U.S. dollars for the table above. Under the EMEA asset securitization program the company will continuously sell its interest in designated pools of trade accounts receivables of certain of its subsidiaries in the EMEA region. Receivables sold under the program are excluded from “Accounts receivable, net” and no corresponding liability is recorded on the company’s consolidated balance sheets. Refer to Note 5 “Accounts Receivables” of the Notes to the Consolidated Financial Statements for further discussion.
29
The following table summarizes recent events impacting the company's capital resources (in millions):
| Activity | Date | Notional amount | ||||||||||||||||||
| 3.50% notes, due April 2022* | Repaid | February 2022 | $ | 350 | ||||||||||||||||
| 2.95% notes, due February 2032 | Issued | December 2021 | 500 | |||||||||||||||||
| 5.125% notes, due March 2021 | Repaid | March 2021 | 131 | |||||||||||||||||
| 6.00% notes, due April 2020 | Repaid | April 2020 | 209 | |||||||||||||||||
*During February 2022, prior to the issuance of this Form 10-K, the company repaid $349.8 million principal amount of its 3.50% notes, due April 2022.
Refer to Note 6, “Debt” of the Notes to the Consolidated Financial Statements for further discussion of the company's short-term and long-term debt and available financing.
Cash Flows
The following table summarizes the company’s cash flows by category for the periods presented (in millions):
| 2021 | 2020 | Change | ||||||||||||||||||
| Net cash provided by operating activities | $ | 419 | $ | 1,360 | $ | (941) | ||||||||||||||
| Net cash used for investing activities | (60) | (139) | 79 | |||||||||||||||||
| Net cash used for financing activities | (463) | (1,227) | 764 | |||||||||||||||||
Cash Flows from Operating Activities
The net amount of cash provided by the company's operating activities during 2021 and 2020 was $419.0 million and $1.4 billion, respectively. The change in cash provided by operating activities during 2021, compared to the year-earlier period, related primarily to the timing of payments, increasing growth in customer demand in certain regions and a corresponding increase in working capital, including inventory, which is consistent with the company's historical counter-cyclical cash flow in which the company generates less cash flow in periods of increased demand.
Cash Flows from Investing Activities
The net amount of cash used for investing activities during 2021 and 2020 was $60.1 million and $138.8 million, respectively. The change in cash used for investing activities during 2021, compared to the year-earlier period, related primarily to proceeds from the sale of property plant and equipment, and the timing of capital expenditures related to the build out of distribution centers.
Cash Flows from Financing Activities
The net amount of cash used for financing activities during 2021 and 2020 was $463.3 million and $1.2 billion, respectively. The primary uses of cash were $911.5 million of repurchases of common stock, and $130.9 million of repayments of the principal amount of the company's 5.125% notes due March 2021. The primary sources of cash from financing activities during 2021 were $495.1 million of net proceeds related to the issuances of 2.95% notes during the fourth quarter of 2021, $47.0 million of proceeds from the exercise of stock options, and $24.9 million of payments upon the settlement of forward-starting interest rate swaps.
Capital Expenditures
Capital expenditures were $83.1 million and $123.6 million in 2021 and 2020, respectively. The company expects capital expenditures to be approximately $100 million for fiscal year 2022.
Share Repurchase Program
The company repurchased 7.7 million shares for $900 million and 6.4 million shares for $475 million in 2021 and 2020, respectively. As of December 31, 2021, approximately $763 million remained available for repurchase under the program. In July and December 2021, the company's Board of Directors approved a total of $1.2 billion additional share-repurchase programs. In July 2020, the company’s Board of Directors approved $600 million of additional share-repurchase programs. The stock-repurchase authorization does not have an expiration date and the pace of the repurchase activity will depend on factors
30
such as the company’s working capital needs, cash requirements for acquisitions and dividend payments, debt repayment obligations or repurchases of debt, stock price, and economic and market conditions. The stock-repurchase program may be accelerated, suspended, delayed or discontinued at any time subject to the approval by the company's Board of Directors.
Contractual Obligations
The company has contractual obligations for short-term and long-term debt, interest on short-term and long-term debt, purchase obligations, and operating leases.
•At December 31, 2021, the company had $2.6 billion of notes outstanding, $349.8 million of which mature in the next twelve months. The remaining debt has maturity dates in 2023 through 2032. During February 2022, prior to the issuance of this Form 10-K, the company repaid the $349.8 million principal amount of its 3.50% notes due April 2022. Refer to Note 6.
•Amounts related to total interest on long-term debt at December 31, 2021 totaled $442.4 million, with $95.7 million expected to be paid within the next 12 months. Refer to Note 6.
•Purchase obligations of $13.9 billion represent an estimate of non-cancelable inventory purchase orders and other contractual obligations related to information technology and facilities as of December 31, 2021 with $12.1 billion expected to be paid within the next 12 months and $1.6 billion in 2023. Many of these orders are backed by customer purchase orders with Arrow, that are also non-cancelable. Non-cancelable purchase orders increased over $8 billion compared with the year-earlier period primarily due to increased inventory purchase orders outstanding as a result of supply chain constraints and current market conditions and were entered into in the ordinary course of business. Both prices and lead times for orders have increased significantly and many vendors are limiting cancellations. Some of the inventory purchases above relate to sales where the company assumes an agency relationship in the transaction. Refer to discussion of the company's revenue recognition policy in Note 1.
•Amounts related to future lease payments for operating lease obligations at December 31, 2021 totaled $330.4 million, with $76.8 million expected to be paid within the next 12 months. Refer to Note 14.
Additional Capital Requirements and Sources
Recent and expected other capital requirements and sources, in addition to the above matters, also include the items described below:
•Employee Benefit Plans: The company maintains an unfunded executive pension plan under which the company will pay supplemental pension benefits to certain employees upon retirement. The company has funded $116.7 million of the Arrow SERP obligation for the former corporate officers in a rabbi trust comprised primarily of life insurance policies and mutual fund assets. Projected benefit obligation at December 31, 2021 and 2020, was $105.5 million and $109.6 million, respectively. Refer to Note 13.
•Environmental liabilities: The company is involved in certain ongoing environmental cleanup activities and legal proceedings, which are inherently uncertain with respect to outcomes, estimates and assumptions that it makes as of each reporting period, are inherently unpredictable. Refer to Note 15.
•Hedging activities: The company has entered into certain forward-starting interest rate swaps derivatives which are designated hedges of future debt issuances as well as certain foreign exchange forward contracts designated as net investment hedges. As of December 31, 2021 and 2020, all such contracts were in an asset position in the amount of $62.4 million and $33.7 million, respectively. Refer to Note 7.
•Sales of trade receivables: In the normal course of business, certain of the company’s subsidiaries have agreements to sell, without recourse, selected trade receivables to financial institutions. The company does not retain financial or legal interests in these receivables, and, accordingly, they are accounted for as sales of the related receivables and the receivables are removed from the company’s consolidated balance sheets.
Critical Accounting Estimates
The company's consolidated financial statements are prepared in accordance with accounting principles generally accepted in the United States. The preparation of these consolidated financial statements requires the company to make significant estimates and judgments that affect the reported amounts of assets, liabilities, revenues, and expenses and related disclosure of contingent assets and liabilities. The company evaluates its estimates on an ongoing basis. The company bases its estimates on historical experience and on various other assumptions that are believed reasonable under the circumstances; the results of which form the basis for making judgments about the carrying values of assets and liabilities that are not readily apparent from other sources. Actual results may differ from these estimates under different assumptions or conditions.
31
The company believes the following critical accounting policies involve the more significant judgments and estimates used in the preparation of its consolidated financial statements:
Revenue Recognition
The company recognizes revenue as control of products is transferred to customers, which generally happens at the point of shipment. Sales are recorded net of discounts, rebates, and returns, which historically have not been material. The company allows its customers to return product for exchange or credit in limited circumstances. A liability is recorded at the time of sale for estimated product returns based upon historical experience. The company also provides volume rebates and other discounts to certain customers which are considered a variable consideration. A provision for customer rebates and other discounts is recorded as a reduction of revenue at the time of sale based on an evaluation of the contract terms and historical experience. Tariffs are included in sales as the company has enforceable rights to additional consideration to cover the cost of tariffs. Other taxes imposed by governmental authorities on the company's revenue producing activities with customers, such as sales taxes and value added taxes, are excluded from net sales.
Products sold by the company are generally delivered via shipment from the company's facilities, drop shipment directly from the vendor, or by electronic delivery of keys for software products. A portion of the company’s business involves shipments directly from its suppliers to its customers, in these transactions, the company is generally responsible for negotiating price both with the supplier and customer, payment to the supplier, establishing payment terms with the customer, product returns, and has risk of loss if the customer does not make payment. As the principal with the customer, the company recognizes revenue upon receiving notification from the supplier that the product was shipped.
The company has contracts with certain customers where the company’s performance obligation is to arrange for the products or services to be provided by another party. In these arrangements, as the company assumes an agency relationship in the transaction, revenue is recognized in the amount of the net fee associated with serving as an agent. These arrangements relate to the sale of supplier service contracts to customers where the company has no future obligation to perform under these contracts or the rendering of supply chain services including the delivery of inventory for which the company does not assume the risks and rewards of ownership.
No single customer accounted for more than 2% of the company’s 2021 consolidated sales. One supplier accounted for approximately 17% of the company's consolidated sales in 2021. No other single supplier accounted for more than 7% of the company's consolidated sales in 2021. The company believes that many of the products it sells are available from other sources at competitive prices. However, certain parts of the company's business, such as the company's global ECS business segment, rely on a limited number of suppliers with the strategy of providing focused support, extensive product knowledge, and customized service to suppliers, MSPs, and VARs. Most of the company's purchases are pursuant to distributor agreements, which are typically non-exclusive and cancelable by either party at any time or on short notice.
Trade Accounts and Notes Receivable
Trade accounts and notes receivable are reported at amortized cost, net of the allowance for credit losses in the consolidated balance sheets. The allowance for credit losses is a valuation account that is deducted from the receivables’ amortized cost basis to present the net amount expected to be collected. Receivables are written off against the allowance when management believes the receivable balance is confirmed to be uncollectible. Refer to Notes 1 and 5.
Management estimates the allowance for credit losses using relevant available information about expected credit losses and an age-based reserve model. Inputs to the model include information about historical credit losses, customer credit ratings, past events, current conditions, and reasonable and supportable forecasts. Adjustments to historical loss information are made for differences in current receivable-specific risk characteristics such as changes in the economic and industry environment, or other relevant factors.
Expected credit losses are estimated on a collective (pool) basis, when similar risk characteristics exist, based on customer credit ratings, which include both externally acquired as well as internally determined credit ratings. Receivables that do not share risk characteristics are evaluated on an individual basis.
Inventories
Inventories are stated at the lower of cost or net realizable value. Write-downs of inventories to market value are based upon contractual provisions governing price protection, stock rotation rights, and obsolescence, as well as assumptions about future demand and market conditions. If assumptions about future demand change and/or actual market conditions are less favorable
32
than those projected by the company, additional write-downs of inventories may be required. Due to the large number of transactions and the complexity of managing the process around price protections and stock rotations, estimates are made regarding adjustments to the book cost of inventories. Actual amounts could be different from those estimated.
Income Taxes
Income taxes are accounted for under the liability method, which requires the recognition of deferred tax assets and liabilities for the expected future tax consequences of events that have been included in the consolidated financial statements. Under this method, deferred tax assets and liabilities are determined on the basis of differences between the tax bases of assets and liabilities and their financial reporting amounts using enacted tax rates in effect for the year in which the differences are expected to reverse. The effect of a change in tax rates on deferred tax assets and liabilities is recognized in income in the period that includes the enactment date.
The carrying value of the company’s deferred tax assets is dependent upon the company's ability to generate sufficient future taxable income in certain tax jurisdictions. Should the company determine that it is more likely than not that some portion or all of its deferred tax assets will not be realized, a valuation allowance to reduce the deferred tax assets is established in the period such determination is made. The assessment of the need for a valuation allowance requires considerable judgment on the part of management with respect to the benefits that could be realized from future taxable income, as well as other positive and negative factors.
It is also the company’s policy to provide for uncertain tax positions and the related interest and penalties based upon management’s assessment of whether a tax benefit is more likely than not to be sustained upon examination by tax authorities. To the extent the company prevails in matters for which a liability for an unrecognized tax benefit is established, or is required to pay amounts in excess of the liability, or when other facts and circumstances change, the company's effective tax rate in a given financial statement period may be materially affected.
Contingencies and Litigation
The company is subject to proceedings, lawsuits, and other claims related to environmental, regulatory, labor, product, tax, and other matters and assesses the likelihood of an adverse judgment or outcome for these matters, as well as the range of potential losses. A determination of the reserves required, if any, is made after careful analysis. The reserves may change in the future due to new developments impacting the probability of a loss, the estimate of such loss, and the probability of recovery of such loss from third parties.
Goodwill
Goodwill represents the excess of the cost of an acquisition over the fair value of the net assets acquired. The company tests goodwill for impairment annually as of the first day of the fourth quarter and/or when an event occurs or circumstances change such that it is more likely than not that an impairment may exist. Examples of such events and circumstances that the company would consider include the following:
•macroeconomic conditions such as deterioration in general economic conditions, limitations on accessing capital, fluctuations in foreign exchange rates, or other developments in equity and credit markets;
•industry and market considerations such as a deterioration in the environment in which the company operates, an increased competitive environment, a decline in market-dependent multiples or metrics (considered in both absolute terms and relative to peers), a change in the market for the company’s products or services, or a regulatory or political development;
•cost factors such as increases in inventory, labor, or other costs that have a negative effect on earnings and cash flows;
•overall financial performance such as negative or declining cash flows or a decline in actual or planned revenue or earnings compared with actual and projected results of relevant prior periods;
•other relevant entity-specific events such as changes in management, key personnel, strategy, or customers, contemplation of bankruptcy, or litigation;
•events affecting a reporting unit such as a change in the composition or carrying amount of its net assets, a more likely than not expectation of selling or disposing all, or a portion, of a reporting unit, the testing for recoverability of a significant asset group within a reporting unit, or recognition of a goodwill impairment loss in the financial statements of a subsidiary that is a component of a reporting unit; and
•a sustained decrease in share price (considered in both absolute terms and relative to peers).
33
Goodwill is tested at a level of reporting referred to as “the reporting unit.” The company’s reporting units are defined as each of the three regional businesses within the global components business segment, which are the Americas, EMEA, and Asia/Pacific, each of the two regional businesses within the global ECS business segment, which are North America and EMEA, and eInfochips, which is part of the global components business segment. Within the global components business segment, the Asia/Pacific reporting unit's goodwill was previously fully impaired.
An entity has the option to first assess qualitative factors to determine whether the existence of events or circumstances leads to a determination that it is more likely than not (that is, a likelihood of more than 50%) that the fair value of a reporting unit is less than its carrying amount. If, after assessing the totality of events or circumstances, an entity determines it is not more likely than not that the fair value of a reporting unit is less than its carrying amount, then the quantitative goodwill impairment test is unnecessary. The company has elected not to perform the qualitative assessment and performed the quantitative goodwill impairment test. The quantitative goodwill impairment test, used to identify both the existence of impairment and the amount of impairment loss, compares the fair value of a reporting unit with its carrying amount, including goodwill. If the carrying amount of the reporting unit is less than its fair value, no impairment exists. If the carrying amount of a reporting unit exceeds its fair value, an impairment loss shall be recognized in an amount equal to that excess, limited to the total amount of goodwill allocated to that reporting unit.
The company estimates the fair value of a reporting unit using the income approach. For the purposes of the income approach, fair value is determined based on the present value of estimated future cash flows, discounted at an appropriate risk-adjusted rate. The assumptions included in the income approach include forecasted revenues, gross profit margins, operating income margins, working capital cash flow, perpetual growth rates, income tax rates, and long-term discount rates, among others, all of which require significant judgments by management. Actual results may differ from those assumed in the company’s forecasts. The company also reconciles its discounted cash flow analysis to its current market capitalization allowing for a reasonable control premium. As of the first day of the fourth quarters of 2021, and 2020, the company’s annual impairment testing did not indicate impairment at any of the company’s reporting units.
A decline in general economic conditions or global equity valuations could impact the judgments and assumptions about the fair value of the company’s businesses, and the company could be required to record an impairment charge in the future, which could impact the company’s consolidated balance sheets, as well as the company’s consolidated statements of operations. If the company was required to recognize an impairment charge in the future, the charge would not impact the company’s consolidated cash flows, current liquidity, capital resources, and covenants under its existing revolving credit facility, North American asset securitization program, other outstanding borrowings, and EMEA asset securitization program.
As of December 31, 2021, the company has $2.1 billion of goodwill, of which approximately $602.6 million and $83.3 million was allocated to the Americas and EMEA reporting units within the global components business segment, respectively, $784.4 million and $413.0 million was allocated to the North America and EMEA reporting units within the global ECS business segment, respectively, and $197.1 million was allocated to the eInfochips reporting unit. As of the date of the company's 2021 annual impairment test, the fair value of all reporting units exceeded their carrying values by more than 30%. (See Note 3).
Item 7A. Quantitative and Qualitative Disclosures About Market Risk.
The company is exposed to market risk from changes in foreign currency exchange rates and interest rates.
Foreign Currency Exchange Rate Risk
The company, as a large global organization, faces exposure to adverse movements in foreign currency exchange rates. These exposures may change over time as business practices evolve and could materially impact the company’s financial results in the future. The company’s primary exposure relates to transactions in which the currency collected from customers is different from the currency utilized to purchase the product sold in Europe, the Asia-Pacific region, Canada, and Latin America. The company’s policy is to hedge substantially all such currency exposures for which natural hedges do not exist. Natural hedges exist when purchases and sales within a specific country are both denominated in the same currency and, therefore, no exposure exists to hedge with foreign exchange forward, option, or swap contracts (collectively, the “foreign exchange contracts”). In many regions in Asia, for example, sales and purchases are primarily denominated in U.S. dollars, resulting in a “natural hedge.” Natural hedges exist in most countries in which the company operates, although the percentage of natural offsets, as compared with offsets that need to be hedged by foreign exchange contracts, will vary from country to country. The company does not enter into foreign exchange contracts for trading purposes. The risk of loss on a foreign exchange contract is the risk of nonperformance by the counterparties, which the company minimizes by limiting its counterparties to major financial institutions. The fair value of the foreign exchange contracts are estimated using foreign currency spot rates and forward rates quotes by third party financial institutions. The notional amount of the foreign exchange contracts inclusive of foreign exchange
34
contracts designated as a net investment hedge at December 31, 2021 and 2020, was $1.1 billion and $914.9 million, respectively.
The translation of the financial statements of the non-United States operations is impacted by fluctuations in foreign currency exchange rates. The change in consolidated sales and operating income was impacted by the translation of the company's international financial statements into U.S. dollars. This resulted in increased sales and operating income of $403.0 million and $14.6 million, respectively, for 2021, compared with the year-earlier period, based on 2020 sales and operating income at the average rate for 2021. Sales and operating income would decrease by approximately $681.4 million and $30.5 million, respectively, if average foreign exchange rates had declined by 10% against the U.S. dollar in 2021. These amounts were determined by considering the impact of a hypothetical foreign exchange rate on the sales and operating income of the company's international operations.
Interest Rate Risk
The company's interest expense, in part, is sensitive to the general level of interest rates in North America, Europe, and the Asia-Pacific region. The company historically has managed its exposure to interest rate risk through the proportion of fixed-rate and floating-rate debt in its total debt portfolio. Additionally, the company utilizes interest rate swaps in order to manage its targeted mix of fixed- and floating-rate debt.
At December 31, 2021, substantially all of the company's debt was subject to fixed rates. During 2021, the average outstanding balance on the company’s floating rate debt was $1.3 billion, and a one percentage point change in average interest rates would have caused net interest and other financing expense during 2021 to increase by $13.0 million. This was determined by considering the impact of a hypothetical interest rate on the company’s average floating rate outstanding variable debt. This analysis does not consider the effect of the level of overall economic activity that could exist. In the event of a change in the level of economic activity, which may adversely impact interest rates, the company could likely take actions to further mitigate any potential negative exposure to the change. However, due to the uncertainty of the specific actions that might be taken and their possible effects, the sensitivity analysis assumes no changes in the company’s financial structure.
In July 2017, the Financial Conduct Authority (the authority that regulates LIBOR) announced it intends to stop compelling banks to submit rates for the calculation of LIBOR after 2021. The Alternative Reference Rates Committee (“ARRC”) has proposed that the Secured Overnight Financing Rate (“SOFR”) is the rate that represents best practice as the alternative to USD-LIBOR for use in derivatives and other financial contracts that are currently indexed to USD-LIBOR. ARRC has proposed a paced market transition plan to SOFR from USD-LIBOR and organizations are currently working on industry wide and company specific transition plans as it relates to derivatives and cash markets exposed to USD-LIBOR. In January 2021, the ICE Benchmark Administration extended the cessation date for most LIBOR tenors to June 30, 2023. The company has a North American asset securitization program, revolving credit facility, certain lines of credit, and interest rate swaps that are indexed to USD-LIBOR. At the time LIBOR is discontinued, the interest rates in these contracts will be based on a fallback reference rate specified in the applicable documentation governing such debt or swaps or as otherwise agreed upon. Such an event would not affect the company's ability to borrow or maintain already outstanding borrowings or swaps, but the alternative reference rate could be higher and more volatile than LIBOR. The company continues to monitor developments by the ARRC and the potential impact of LIBOR changes on our business.
35
Item 8. Financial Statements and Supplementary Data.
Report of Independent Registered Public Accounting Firm
To the Shareholders and the Board of Directors of Arrow Electronics, Inc.
Opinion on the Financial Statements
We have audited the accompanying consolidated balance sheets of Arrow Electronics, Inc. (the Company) as of December 31, 2021 and 2020, the related consolidated statements of operations, comprehensive income (loss), equity and cash flows for each of the three years in the period ended December 31, 2021, and the related notes and financial statement schedule listed in the Index at Item 15(a) (collectively referred to as the “consolidated financial statements”). In our opinion, the consolidated financial statements present fairly, in all material respects, the financial position of the Company at December 31, 2021 and 2020, and the results of its operations and its cash flows for each of the three years in the period ended December 31, 2021, in conformity with U.S. generally accepted accounting principles.
We also have audited, in accordance with the standards of the Public Company Accounting Oversight Board (United States) (PCAOB), the Company’s internal control over financial reporting as of December 31, 2021, based on criteria established in Internal Control-Integrated Framework issued by the Committee of Sponsoring Organizations of the Treadway Commission (2013 framework) and our report dated February 11, 2022 expressed an unqualified opinion thereon.
Basis for Opinion
These financial statements are the responsibility of the Company’s management. Our responsibility is to express an opinion on the Company’s financial statements based on our audits. We are a public accounting firm registered with the PCAOB and are required to be independent with respect to the Company in accordance with the U.S. federal securities laws and the applicable rules and regulations of the Securities and Exchange Commission and the PCAOB.
We conducted our audits in accordance with the standards of the PCAOB. Those standards require that we plan and perform the audit to obtain reasonable assurance about whether the financial statements are free of material misstatement, whether due to error or fraud. Our audits included performing procedures to assess the risks of material misstatement of the financial statements, whether due to error or fraud, and performing procedures that respond to those risks. Such procedures included examining, on a test basis, evidence regarding the amounts and disclosures in the financial statements. Our audits also included evaluating the accounting principles used and significant estimates made by management, as well as evaluating the overall presentation of the financial statements. We believe that our audits provide a reasonable basis for our opinion.
Critical Audit Matters
The critical audit matters communicated below are matters arising from the current period audit of the consolidated financial statements that were communicated or required to be communicated to the audit committee and that: (1) relate to accounts or disclosures that are material to the consolidated financial statements and (2) involved especially challenging, subjective, or complex judgments. The communication of critical audit matters does not alter in any way our opinion on the consolidated financial statements, taken as a whole, and we are not, by communicating the critical audit matters below, providing separate opinions on the critical audit matters or on the accounts or disclosures to which they relate.
| Evaluation of net realizable value adjustments to inventories for excess or obsolescence | |||||
| Description of the Matter | At December 31, 2021, the Company’s inventories were $4.2 billion. As discussed in Note 1 to the consolidated financial statements, inventories are stated at the lower of cost or net realizable value. Write-downs of inventories to net realizable value for excess or obsolete inventories are based upon forecasted sales, contractual supplier protection and stock rotation privileges, and the age of inventories. | ||||
Auditing management’s lower of cost or net realizable value determination for excess or obsolete inventories was especially challenging and highly judgmental because of the estimation uncertainty in determining demand for aging inventory and future market conditions, after considering supplier protection provisions. Inventories not supported by forecasted sales orders or stock rotation privileges are written down to lower of cost or net realizable value based on the age of the inventories and inventory turnover. | |||||
36
| How We Addressed the Matter in Our Audit | We obtained an understanding, evaluated the design and tested the operating effectiveness of controls over the Company’s determination of the lower of cost or net realizable value for excess and obsolete inventories. For example, we tested controls over management’s review of excess and obsolete inventories which includes their review of the assumptions supporting current product demand, supplier protections, evaluation of aging of inventories and consideration of inventory turnover. Our audit procedures to test the net realizable value adjustments to inventories for excess or obsolescence included, among others, testing the completeness and accuracy of the underlying data used in management’s assessment. We evaluated the reasonableness of management’s assumptions by performing a retrospective review of the prior year assumptions to actual activity, including write-off history. We evaluated the appropriateness and consistency of management’s methods and assumptions used in developing their estimates around forecasted sales and expected stock rotation privileges. We tested the aging of inventories. We held discussions with senior financial and operating management to determine whether any strategic or operational changes in the business would impact expected demand or related carrying value of inventory. We assessed the reasonableness of management’s excess and obsolescence assumptions by comparing those assumptions to historical data and trends, as well as reviewing such assumptions for management bias. We considered macroeconomic trends within the industry, including trends that could impact the movement of the products provided by the Company. We performed procedures to compare recent sales transactions or market data to cost of inventories to assess that the carrying value of inventories was the lower of cost or net realizable value. | ||||
| Evaluation of Americas Components and eInfochips Goodwill for Impairment | |||||
| Description of the Matter | At December 31, 2021, the Company’s consolidated goodwill was $2.1 billion. As discussed in Note 3 to the consolidated financial statements, goodwill is tested for impairment annually as of the first day of the fourth quarter, or more frequently if indicators of potential impairment exist. As of the first day of the fourth quarter, the Company performed its annual impairment test which did not result in any impairment of goodwill. Auditing management’s annual impairment tests related to the Americas Components and eInfochips reporting units was especially challenging due to the complexity of forecasting the long-term cash flows of these businesses and the significant estimation uncertainty of the assumptions included within such forecasts. The significant estimation uncertainty was primarily due to the sensitivity of the reporting units’ fair value to changes in the underlying assumptions used in the income approach which include, among others, forecasted revenue, gross profit margins, operating income margins, forecasted working capital levels, and long-term growth and discount rates. These significant assumptions are inherently uncertain and require a high degree of estimation and judgment based on an evaluation of historical performance, current industry and global economic and geo-political conditions, and the timing and success of the Company’s ability to implement strategic initiatives. | ||||
37
| How We Addressed the Matter in Our Audit | We obtained an understanding, evaluated the design and tested the operating effectiveness of controls over the Company’s goodwill impairment review process, including controls over management’s review of the significant assumptions described above and controls over management’s review of its annual financial forecasts. To test the estimated fair value of the Americas Components and eInfochips reporting units, we performed audit procedures that included, among others, involving a specialist to assist in assessing the Company’s fair value methodologies and its development and calculation of the long-term growth and discount rates. We assessed the reasonableness of the Company’s assumptions around forecasted revenue, gross profit margins, operating income margins, forecasted working capital levels, long-term growth and discount rates, and tax rates by comparing those assumptions to recent historical performance, current economic and industry trends, and annual financial forecasts presented to the Board of Directors and communicated to external analysts. We also assessed the reasonableness of estimates included in the Company’s annual financial forecast by evaluating how such assumptions compared to economic, industry, and peer expectations. We evaluated management’s historical accuracy of forecasting revenues, gross profit margin, operating income margins, and capital expenditures by comparing past forecasts to subsequent actual activity. We performed various sensitivity analyses around these significant assumptions to understand the impact on the fair value calculation and focused our testing accordingly. We evaluated the Company’s determination of its reporting units and tested the allocation of net assets to each of its reporting units. We also tested the company’s reconciliation of the fair value of its reporting units to the Company’s market value as of the impairment test dates. | ||||
/s/ Ernst & Young LLP
We have served as the Company's auditor since 1975.
February 11, 2022
38
ARROW ELECTRONICS, INC.
CONSOLIDATED STATEMENTS OF OPERATIONS
(In thousands except per share data)
| Years Ended December 31, | ||||||||||||||||||||
| 2021 | 2020 | 2019 | ||||||||||||||||||
| Sales | $ | $ | $ | |||||||||||||||||
| Cost of sales | ||||||||||||||||||||
| Gross profit | ||||||||||||||||||||
| Operating expenses: | ||||||||||||||||||||
Selling, general, and administrative expenses | ||||||||||||||||||||
Depreciation and amortization | ||||||||||||||||||||
| Loss on disposition of businesses, net (Note 2) | ||||||||||||||||||||
| Impairments (Notes 2 and 3) | ||||||||||||||||||||
Restructuring, integration, and other charges | ||||||||||||||||||||
| Operating income | ||||||||||||||||||||
| Equity in earnings (losses) of affiliated companies | ( | ( | ||||||||||||||||||
| Gain on investments, net | ||||||||||||||||||||
| Employee benefit plan expense, net | ( | ( | ( | |||||||||||||||||
| Interest and other financing expense, net | ( | ( | ( | |||||||||||||||||
| Income (loss) before income taxes | ( | |||||||||||||||||||
| Provision for income taxes | ||||||||||||||||||||
| Consolidated net income (loss) | ( | |||||||||||||||||||
| Noncontrolling interests | ||||||||||||||||||||
| Net income (loss) attributable to shareholders | $ | $ | $ | ( | ||||||||||||||||
| Net income (loss) per share: | ||||||||||||||||||||
Basic | $ | $ | $ | ( | ||||||||||||||||
Diluted | $ | $ | $ | ( | ||||||||||||||||
| Weighted-average shares outstanding: | ||||||||||||||||||||
Basic | ||||||||||||||||||||
Diluted | ||||||||||||||||||||
See accompanying notes.
39
ARROW ELECTRONICS, INC.
CONSOLIDATED STATEMENTS OF COMPREHENSIVE INCOME (LOSS)
(In thousands)
| Years Ended December 31, | |||||||||||||||||
| 2021 | 2020 | 2019 | |||||||||||||||
| Consolidated net income (loss) | $ | $ | $ | ( | |||||||||||||
| Other comprehensive income (loss): | |||||||||||||||||
| Foreign currency translation adjustment and other, net of taxes | ( | ||||||||||||||||
| Unrealized gain (loss) on foreign exchange contracts designated as net investment hedges, net of taxes | ( | ||||||||||||||||
| Unrealized gain (loss) on interest rate swaps designated as cash flow hedges, net of taxes | ( | ( | |||||||||||||||
| Employee benefit plan items, net of taxes | ( | ||||||||||||||||
| Other comprehensive income (loss) | ( | ||||||||||||||||
| Comprehensive income (loss) | ( | ||||||||||||||||
| Less: Comprehensive income (loss) attributable to noncontrolling interests | ( | ||||||||||||||||
| Comprehensive income (loss) attributable to shareholders | $ | $ | $ | ( | |||||||||||||
See accompanying notes.
40
ARROW ELECTRONICS, INC.
CONSOLIDATED BALANCE SHEETS
(In thousands except par value)
| December 31, | ||||||||||||||
| 2021 | 2020 | |||||||||||||
| ASSETS | ||||||||||||||
| Current assets: | ||||||||||||||
| Cash and cash equivalents | $ | $ | ||||||||||||
| Accounts receivable, net | ||||||||||||||
| Inventories | ||||||||||||||
| Other current assets | ||||||||||||||
| Total current assets | ||||||||||||||
| Property, plant, and equipment, at cost: | ||||||||||||||
| Land | ||||||||||||||
| Buildings and improvements | ||||||||||||||
| Machinery and equipment | ||||||||||||||
| Less: Accumulated depreciation and amortization | ( | ( | ||||||||||||
| Property, plant, and equipment, net | ||||||||||||||
| Investments in affiliated companies | ||||||||||||||
| Intangible assets, net | ||||||||||||||
| Goodwill | ||||||||||||||
| Other assets | ||||||||||||||
| Total assets | $ | $ | ||||||||||||
| LIABILITIES AND EQUITY | ||||||||||||||
| Current liabilities: | ||||||||||||||
| Accounts payable | $ | $ | ||||||||||||
| Accrued expenses | ||||||||||||||
| Short-term borrowings, including current portion of long-term debt | ||||||||||||||
| Total current liabilities | ||||||||||||||
| Long-term debt | ||||||||||||||
| Other liabilities | ||||||||||||||
| Commitments and contingencies (Notes 14 and 15) | ||||||||||||||
| Equity: | ||||||||||||||
| Shareholders’ equity: | ||||||||||||||
Common stock, par value $ | ||||||||||||||
Authorized - | ||||||||||||||
Issued - | ||||||||||||||
Capital in excess of par value | ||||||||||||||
Treasury stock ( | ( | ( | ||||||||||||
Retained earnings | ||||||||||||||
| Accumulated other comprehensive loss | ( | ( | ||||||||||||
| Total shareholders’ equity | ||||||||||||||
| Noncontrolling interests | ||||||||||||||
| Total equity | ||||||||||||||
| Total liabilities and equity | $ | $ | ||||||||||||
See accompanying notes.
41
ARROW ELECTRONICS, INC.
CONSOLIDATED STATEMENTS OF CASH FLOWS
(In thousands)
| Years Ended December 31, | ||||||||||||||||||||
| 2021 | 2020 | 2019 | ||||||||||||||||||
| Cash flows from operating activities: | ||||||||||||||||||||
| Consolidated net income (loss) | $ | $ | $ | ( | ||||||||||||||||
| Adjustments to reconcile consolidated net income (loss) to net cash provided by operations: | ||||||||||||||||||||
Depreciation and amortization | ||||||||||||||||||||
Amortization of stock-based compensation | ||||||||||||||||||||
| Equity in (earnings) losses of affiliated companies | ( | |||||||||||||||||||
Deferred income taxes | ( | |||||||||||||||||||
| Impairments | ||||||||||||||||||||
| Gain on investments, net | ( | ( | ( | |||||||||||||||||
| Loss on disposition of businesses, net | ||||||||||||||||||||
| Pension settlement loss | ||||||||||||||||||||
Other | ||||||||||||||||||||
Change in assets and liabilities, net of effects of acquired and disposed businesses: | ||||||||||||||||||||
| Accounts receivable, net | ( | ( | ||||||||||||||||||
Inventories | ( | |||||||||||||||||||
Accounts payable | ( | |||||||||||||||||||
Accrued expenses | ( | |||||||||||||||||||
Other assets and liabilities | ( | ( | ( | |||||||||||||||||
| Net cash provided by operating activities | ||||||||||||||||||||
| Cash flows from investing activities: | ||||||||||||||||||||
| Cash paid on disposition of businesses | ( | |||||||||||||||||||
| Acquisition of property, plant, and equipment | ( | ( | ( | |||||||||||||||||
| Proceeds from sale of property, plant, and equipment | ||||||||||||||||||||
| Cash paid for customer relationship intangible asset | ( | ( | ||||||||||||||||||
| Other | ( | ( | ||||||||||||||||||
| Net cash used for investing activities | ( | ( | ( | |||||||||||||||||
| Cash flows from financing activities: | ||||||||||||||||||||
| Change in short-term and other borrowings | ( | ( | ||||||||||||||||||
| Repayments of long-term bank borrowings, net | ( | ( | ( | |||||||||||||||||
| Redemption of notes | ( | ( | ||||||||||||||||||
| Net proceeds from note offering | ||||||||||||||||||||
| Proceeds from exercise of stock options | ||||||||||||||||||||
| Repurchases of common stock | ( | ( | ( | |||||||||||||||||
| Settlement of forward-starting interest rate swap | ( | |||||||||||||||||||
| Other | ( | ( | ( | |||||||||||||||||
| Net cash used for financing activities | ( | ( | ( | |||||||||||||||||
| Effect of exchange rate changes on cash | ( | |||||||||||||||||||
| Net increase (decrease) in cash and cash equivalents | ( | ( | ||||||||||||||||||
| Cash and cash equivalents at beginning of year | ||||||||||||||||||||
| Cash and cash equivalents at end of year | $ | $ | $ | |||||||||||||||||
See accompanying notes.
42
ARROW ELECTRONICS, INC.
CONSOLIDATED STATEMENTS OF EQUITY
(In thousands)
| Common Stock at Par Value | Capital in Excess of Par Value | Treasury Stock | Retained Earnings | Accumulated Other Comprehensive Income (Loss) | Noncontrolling Interests | Total | |||||||||||||||||||||||||||||||||||
| Balance at December 31, 2018 | $ | $ | $ | ( | $ | $ | ( | $ | $ | ||||||||||||||||||||||||||||||||
| Consolidated net income (loss) | ( | ( | |||||||||||||||||||||||||||||||||||||||
| Other comprehensive income (loss) | ( | ||||||||||||||||||||||||||||||||||||||||
| Amortization of stock-based compensation | |||||||||||||||||||||||||||||||||||||||||
| Shares issued for stock-based compensation awards | ( | ||||||||||||||||||||||||||||||||||||||||
| Repurchases of common stock | ( | ( | |||||||||||||||||||||||||||||||||||||||
| Distributions | ( | ( | |||||||||||||||||||||||||||||||||||||||
| Balance at December 31, 2019 | ( | ( | |||||||||||||||||||||||||||||||||||||||
| Effect of new accounting principles | — | — | — | ( | — | — | ( | ||||||||||||||||||||||||||||||||||
| Consolidated net income | |||||||||||||||||||||||||||||||||||||||||
| Other comprehensive income | |||||||||||||||||||||||||||||||||||||||||
| Amortization of stock-based compensation | |||||||||||||||||||||||||||||||||||||||||
| Shares issued for stock-based compensation awards | ( | ||||||||||||||||||||||||||||||||||||||||
| Repurchases of common stock | ( | ( | |||||||||||||||||||||||||||||||||||||||
| Distributions | ( | ( | |||||||||||||||||||||||||||||||||||||||
| Balance at December 31, 2020 | ( | ( | |||||||||||||||||||||||||||||||||||||||
| Consolidated net income | |||||||||||||||||||||||||||||||||||||||||
| Other comprehensive loss | ( | ( | ( | ||||||||||||||||||||||||||||||||||||||
| Amortization of stock-based compensation | |||||||||||||||||||||||||||||||||||||||||
| Shares issued for stock-based compensation awards | ( | ||||||||||||||||||||||||||||||||||||||||
| Repurchases of common stock | ( | ( | |||||||||||||||||||||||||||||||||||||||
| Distributions | ( | ( | |||||||||||||||||||||||||||||||||||||||
| Balance at December 31, 2021 | $ | $ | $ | ( | $ | $ | ( | $ | $ | ||||||||||||||||||||||||||||||||
See accompanying notes.
43
ARROW ELECTRONICS, INC.
NOTES TO THE CONSOLIDATED FINANCIAL STATEMENTS
(Dollars in thousands except per share data)
1. Summary of Significant Accounting Policies
Principles of Consolidation
The consolidated financial statements of Arrow Electronics, Inc. (the “company” or “Arrow”) include the accounts of the company, its majority-owned subsidiaries, and Arrow EMEA Funding Corp B.V. (see Note 5). All significant intercompany transactions are eliminated.
Use of Estimates
The preparation of financial statements in conformity with accounting principles generally accepted in the United States (“GAAP”) requires the company to make significant estimates and assumptions that affect the amounts reported in the consolidated financial statements and accompanying notes. Actual results could differ from those estimates.
Cash and Cash Equivalents
Cash equivalents consist of highly liquid investments, which are readily convertible into cash, with original maturities of three months or less.
Trade Accounts and Notes Receivable
Trade accounts and notes receivable are reported at amortized cost, net of the allowance for credit losses in the consolidated balance sheets. The allowance for credit losses is a valuation account that is deducted from the receivables' amortized cost basis to present the net amount expected to be collected. Receivables are written off against the allowance when management believes the receivable balance is confirmed to be uncollectible.
Management estimates the allowance for credit losses using relevant available information about expected credit losses and an age-based reserve model. Inputs to the model include information about historical credit losses, customer credit ratings, past events, current conditions, and reasonable and supportable forecasts. Adjustments to historical loss information are made for differences in current receivable-specific risk characteristics such as changes in the economic and industry environment, or other relevant factors.
Expected credit losses are estimated on a collective (pool) basis, when similar risk characteristics exist, based on customer credit ratings, which include both externally acquired as well as internally determined credit ratings. Receivables that do not share risk characteristics are evaluated on an individual basis.
Inventories
Inventories are stated at the lower of cost or net realizable value. Cost is determined on a moving average cost basis, which approximates the first-in, first-out method. Substantially all inventories represent finished goods held for sale.
Property, Plant, and Equipment
Property, plant, and equipment are stated at cost. Depreciation is computed on the straight-line method over the estimated useful lives of the assets. The estimated useful lives for depreciation of buildings is generally 20 to 30 years, and the estimated useful lives of machinery and equipment is generally three to ten years. Leasehold improvements are amortized over the shorter of the term of the related lease or the life of the improvement. Long-lived assets are reviewed for impairment whenever events or changes in circumstances indicate that the carrying amounts may not be recoverable. If the carrying value of the asset cannot be recovered from estimated future cash flows, undiscounted and without interest, the fair value of the asset is calculated using the present value of estimated net future cash flows. If the fair value is less than the carrying amount of the asset, a loss is recognized for the difference, subject to the limitation of individual asset fair values within the group.
44
Software Development Costs
The company capitalizes certain internal and external costs incurred to acquire or create internal-use software. Capitalized software costs are amortized on a straight-line basis over the estimated useful life of the software, which is generally three to twelve years. At December 31, 2021 and 2020, the company had unamortized software development costs of $382,435 and $453,407 , respectively, which are included in “Machinery and equipment” in the company’s consolidated balance sheets.
Identifiable Intangible Assets
Amortization of definite-lived intangible assets is computed on the straight-line method over the estimated useful lives of the assets. Identifiable intangible assets are reviewed for impairment whenever events or changes in circumstances indicate that the carrying amounts may not be recoverable.
Investments
Investments are accounted for using the equity method if the investment provides the company the ability to exercise significant influence, but not control, over an investee. Significant influence is generally deemed to exist if the company has an ownership interest in the voting stock of the investee between 20% and 50%, although other factors, such as representation on the investee's Board of Directors, are considered in determining whether the equity method is appropriate. The company records its investments in equity method investees meeting these characteristics as “Investments in affiliated companies” in the company's consolidated balance sheets.
Equity investments which the company does not possess the ability to exercise significant influence, are measured at fair value, using quoted market prices, and are included in “Other assets” in the company’s consolidated balance sheets. Changes in fair value are recorded in “Gain on investments, net” in the company’s consolidated statements of operations. During the year ended December 31, 2021, the company recorded a net gain on investments of $12,951 .
Goodwill
Goodwill represents the excess of the cost of an acquisition over the fair value of the net assets acquired. The company tests goodwill for impairment annually as of the first day of the fourth quarter and/or when an event occurs or circumstances change such that it is more likely than not that an impairment may exist. Examples of such events and circumstances that the company would consider include the following:
•macroeconomic conditions such as deterioration in general economic conditions, limitations on accessing capital, fluctuations in foreign exchange rates, or other developments in equity and credit markets;
•industry and market considerations such as a deterioration in the environment in which the company operates, an increased competitive environment, a decline in market-dependent multiples or metrics (considered in both absolute terms and relative to peers), a change in the market for the company's products or services, or a regulatory or political development;
•cost factors such as increases in inventory, labor, or other costs that have a negative effect on earnings and cash flows;
•overall financial performance such as negative or declining cash flows or a decline in actual or planned revenue or earnings compared with actual and projected results of relevant prior periods;
•other relevant entity-specific events such as changes in management, key personnel, strategy, or customers, contemplation of bankruptcy, or litigation;
•events affecting a reporting unit such as a change in the composition or carrying amount of its net assets, a more likely than not expectation of selling or disposing all, or a portion, of a reporting unit, the testing for recoverability of a significant asset group within a reporting unit, or recognition of a goodwill impairment loss in the financial statements of a subsidiary that is a component of a reporting unit; and
•a sustained decrease in share price (considered in both absolute terms and relative to peers).
Goodwill is tested at a level of reporting referred to as “the reporting unit.” The company's reporting units are defined as each of the three regional businesses within the global components business segment, which are the Americas; Europe, the Middle East, and Africa (“EMEA”); and Asia/Pacific, each of the two regional businesses within the global ECS business segment, which are North America and EMEA, and eInfochips, which is part of the global components business segment. Within the global components business segment, the Asia/Pacific reporting unit's goodwill was previously fully impaired.
45
An entity has the option to first assess qualitative factors to determine whether the existence of events or circumstances leads to a determination that it is more likely than not (that is, a likelihood of more than 50%) that the fair value of a reporting unit is less than its carrying amount. If, after assessing the totality of events or circumstances, an entity determines it is not more likely than not that the fair value of a reporting unit is less than its carrying amount, then the quantitative goodwill impairment test is unnecessary. The company has elected not to perform the qualitative assessment and performed the quantitative goodwill impairment test. The quantitative goodwill impairment test, used to identify both the existence of impairment and the amount of impairment loss, compares the fair value of a reporting unit with its carrying amount, including goodwill. If the carrying amount of the reporting unit is less than its fair value, no impairment exists. If the carrying amount of a reporting unit exceeds its fair value, an impairment loss shall be recognized in an amount equal to that excess, limited to the total amount of goodwill allocated to that reporting unit.
The company estimates the fair value of a reporting unit using the income approach. For the purposes of the income approach, fair value is determined based on the present value of estimated future cash flows, discounted at an appropriate risk-adjusted rate. The assumptions included in the income approach include forecasted revenues, gross profit margins, operating income margins, working capital cash flow, perpetual growth rates, income tax rates, and long-term discount rates, among others, all of which require significant judgments by management. Actual results may differ from those assumed in the company's forecasts. The company also reconciles its discounted cash flow analysis to its current market capitalization allowing for a reasonable control premium.
As of the first day of the fourth quarters of 2021, 2020, and 2019, the company's annual impairment testing did not indicate impairment at any of the company's reporting units.
A decline in general economic conditions or global equity valuations could impact the judgments and assumptions about the fair value of the company's businesses, and the company could be required to record an impairment charge in the future, which could impact the company's consolidated balance sheets, as well as the company's consolidated statements of operations. If the company was required to recognize an impairment charge in the future, the charge would not impact the company's consolidated cash flows, current liquidity, capital resources, and covenants under its existing revolving credit facility, North American asset securitization program, other outstanding borrowings, and EMEA asset securitization program.
As of December 31, 2021, the company has $2,080,371 of goodwill, of which approximately $602,575 and $83,261 was allocated to the Americas and EMEA reporting units within the global components business segment, respectively, $784,441 and $412,982 was allocated to the North America and EMEA reporting units within the global ECS business segment, respectively, and $197,112 was allocated to the eInfochips reporting unit. As of the date of the company's 2021 annual impairment test, the fair value of all reporting units exceeded their carrying values by more than 30 %. (see Note 3).
Leases
The company determines if a contract contains a lease at inception based on whether it conveys the right to control the use of an identified asset. Substantially all of the company's leases are classified as operating leases. The company records operating lease right-of-use assets within “Other assets” and lease liabilities are recorded within “Other liabilities” and “Accrued expenses” in the consolidated balance sheets. Lease expenses are recorded within “Selling, general, and administrative expenses” in the consolidated statements of operations. Operating lease payments are presented within “Operating cash flows” in the consolidated statements of cash flows.
Operating lease right-of-use assets and lease liabilities are recognized based on the net present value of future minimum lease payments over the lease term starting on the commencement date. The company generally is not able to determine the rate implicit in its leases and, as such, applies an incremental borrowing rate based on the company's cost of borrowing for the relevant terms of each lease. Lease expense for minimum lease payments is recognized on a straight-line basis over the lease term. Lease terms may include an option to extend or terminate a lease if it is reasonably certain that the company will exercise such options. The company does not separate lease components from non-lease components, and also has elected not to record a right-of-use asset or lease liability for leases which, at inception, have a term of twelve months or less. Variable lease payments are recognized in the period in which the obligation for those payments is incurred.
Foreign Currency Translation and Remeasurement
The assets and liabilities of international operations are translated at the exchange rates in effect at the balance sheet date. Revenue and expense accounts are translated at the monthly average exchange rates. Adjustments arising from the translation of the foreign currency financial statements of the company's international operations are reported as a component of
46
Income Taxes
Income taxes are accounted for under the liability method, which requires the recognition of deferred tax assets and liabilities for the expected future tax consequences of events that have been included in the consolidated financial statements. Under this method, deferred tax assets and liabilities are determined on the basis of differences between the tax bases of assets and liabilities and their financial reporting amounts using enacted tax rates in effect for the year in which the differences are expected to reverse. The effect of a change in tax rates on deferred tax assets and liabilities is recognized in income in the period that includes the enactment date.
The carrying value of the company's deferred tax assets is dependent upon the company's ability to generate sufficient future taxable income in certain tax jurisdictions. Should the company determine that it is more likely than not that some portion or all of its deferred tax assets will not be realized, a valuation allowance to reduce the deferred tax assets is established in the period such determination is made. The assessment of the need for a valuation allowance requires considerable judgment on the part of management with respect to the benefits that could be realized from future taxable income, as well as other positive and negative factors.
It is also the company's policy to provide for uncertain tax positions and the related interest and penalties based upon management's assessment of whether a tax benefit is more likely than not to be sustained upon examination by tax authorities. To the extent the company prevails in matters for which a liability for an unrecognized tax benefit is established, or is required to pay amounts in excess of the liability, or when other facts and circumstances change, the company's effective tax rate in a given financial statement period may be materially affected.
Net Income (Loss) Per Share
Basic net income (loss) per share is computed by dividing net income (loss) attributable to shareholders by the weighted-average number of common shares outstanding for the period. Diluted net income (loss) per share reflects the potential dilution that would occur if securities or other contracts to issue common stock were exercised or converted into common stock.
47
Revenue Recognition
The company recognizes revenue as control of products is transferred to customers, which generally happens at the point of shipment. Sales are recorded net of discounts, rebates, and returns, which historically have not been material. The company allows its customers to return product for exchange or credit in limited circumstances. A liability is recorded at the time of sale for estimated product returns based upon historical experience. The company also provides volume rebates and other discounts to certain customers which are considered a variable consideration. A provision for customer rebates and other discounts is recorded as a reduction of revenue at the time of sale based on an evaluation of the contract terms and historical experience. Tariffs are included in sales as the company has enforceable rights to additional consideration to cover the cost of tariffs. Other taxes imposed by governmental authorities on the company's revenue producing activities with customers, such as sales taxes and value added taxes, are excluded from net sales.
Products sold by the company are generally delivered via shipment from the company's facilities, drop shipment directly from the vendor, or by electronic delivery of keys for software products. A portion of the company's business involves shipments directly from its suppliers to its customers, in these transactions, the company is generally responsible for negotiating price both with the supplier and customer, payment to the supplier, establishing payment terms with the customer, product returns, and has risk of loss if the customer does not make payment. As the principal with the customer, the company recognizes revenue upon receiving notification from the supplier that the product was shipped.
The company has contracts with certain customers where the company's performance obligation is to arrange for the products or services to be provided by another party. In these arrangements, as the company assumes an agency relationship in the transaction, revenue is recognized in the amount of the net fee associated with serving as an agent. These arrangements relate to the sale of supplier service contracts to customers where the company has no future obligation to perform under these contracts or the rendering of logistics services for the delivery of inventory for which the company does not assume the risks and rewards of ownership.
No single customer accounted for more than 2 % of the company's 2021 consolidated sales. One supplier accounted for approximately 17 % of the company's consolidated sales in 2021. No other single supplier accounted for more than 7 % of the company's consolidated sales in 2021. The company believes that many of the products it sells are available from other sources at competitive prices. However, certain parts of the company's business, such as the company's global ECS business segment, rely on a limited number of suppliers with the strategy of providing focused support, extensive product knowledge, and customized service to suppliers, MSPs, and VARs. Most of the company's purchases are pursuant to distributor agreements, which are typically non-exclusive and cancelable by either party at any time or on short notice.
Vendor Programs
The company participates in supplier programs that provide for price protection, product rebates, marketing/promotional allowances, and other incentives. The consideration received under these programs is recorded in the consolidated statements of operations as an adjustment to cost of goods sold or selling, general, and administrative expenses, according to the nature of the activity and terms of the vendor program. Incentives are accrued as they are earned based on sales of qualifying products or as services are provided in accordance with the terms of the related program.
Reclassification
Certain prior period amounts were reclassified to conform to the current period presentation. These reclassifications did not have a material impact on previously reported amounts.
48
2. Impairment of Long-Lived Assets and Loss on Disposition of Businesses
During the second quarter of 2019, the company committed to a plan to close its personal computer and mobility asset disposition business within the global components business segment. In light of the plan, the company performed an impairment analysis of the long-lived assets of the personal computer and mobility asset disposition business in accordance with Accounting Standards Codification (“ASC”) topic 360 and recorded a pre-tax impairment charge of $74,908 to write-down certain assets of the personal computer and mobility asset disposition business to estimated fair value in the second quarter of 2019.
During 2019, the company completed the disposition of three foreign subsidiaries related to the personal computer and mobility asset disposition business. As a result of the disposition, the company recognized a loss on disposition of business, net, of $19,384 , primarily related to the reclassification of cumulative translation adjustment to earnings upon the sale.
3. Goodwill and Intangible Assets
Goodwill represents the excess of the cost of an acquisition over the fair value of the net assets acquired. The company tests goodwill and other indefinite-lived intangible assets for impairment annually as of the first day of the fourth quarter, or more frequently if indicators of potential impairment exist.
Goodwill of companies acquired, allocated to the company's business segments, is as follows:
| Global Components | Global ECS | Total | ||||||||||||||||||
| Balance as of December 31, 2019 (a) | $ | $ | $ | |||||||||||||||||
| Foreign currency translation adjustment | ||||||||||||||||||||
| Balance as of December 31, 2020 (a) | $ | $ | $ | |||||||||||||||||
| Foreign currency translation adjustment | ( | ( | ( | |||||||||||||||||
| Balance as of December 31, 2021 (a) | $ | $ | $ | |||||||||||||||||
(a) The total carrying value of goodwill as of December 31, 2021, 2020, and 2019 in the table above is reflected net of $1,588,955 1,287,100 301,855
As of the first day of the fourth quarters of 2021, 2020, and 2019, the company's annual impairment testing did not result in any additional impairment of goodwill of companies acquired.
During the second quarter of 2019, as a result of the company's downward revision of forecasted future earnings and the decision to wind down the company's personal computer and mobility asset disposition business, the company determined that it was more likely than not that an impairment may exist within the Americas components and Asia/Pacific components reporting units. The company evaluated its other four reporting units and concluded an interim impairment analysis was not required based on the results of those reporting units and historical levels of headroom in each of those reporting units. The interim goodwill impairment analysis resulted in a partial goodwill impairment charge of $509,000 ($457,806 net of tax) with approximately $600,000 of goodwill remaining within the Americas components reporting unit and a full impairment charge of $61,175 ($61,175 net of tax) within the Asia/Pacific components reporting unit.
| Gross Carrying Amount | Accumulated Amortization | Net | |||||||||||||||
| Customer relationships | $ | $ | ( | $ | |||||||||||||
| Amortizable trade name | ( | ||||||||||||||||
| $ | $ | ( | $ | ||||||||||||||
49
Intangible assets, net, are comprised of the following as of December 31, 2020:
| Gross Carrying Amount | Accumulated Amortization | Net | ||||||||||||||||||
| Customer relationships | $ | $ | ( | $ | ||||||||||||||||
| Amortizable trade name | ( | |||||||||||||||||||
| $ | $ | ( | $ | |||||||||||||||||
During the second quarter of 2019, the company initiated actions to further integrate two global components businesses. These businesses held indefinite-lived trade names with a carrying value of $101,000 . As a result of the company's decision to integrate these brands, it determined the useful lives of the trade names were no longer indefinite. Subsequent to the second quarter of 2019, the company began amortizing these trade names over their estimated remaining useful lives. The trade names were tested for impairment during the second quarter of 2019 as a result of the change in estimated useful lives. The company estimated the fair value of the trade names to be $55,000 using the relief from royalty method and recorded a non-cash impairment charge of $46,000 ($34,653 net of tax). The drivers of the impairment were primarily due to the shortened useful lives of the asset and a decline of the forecasted revenues attributable to the trade names as integration to the Arrow brand occurs over the estimated remaining useful lives.
Amortization expense related to identifiable intangible assets was $36,930 , $38,417 , and $48,097 for the years ended December 31, 2021, 2020, and 2019, respectively. Amortization expense for each of the years 2022 through 2026 is estimated to be approximately $35,177 , $31,443 , $29,767 , $20,398 , and $19,583 , respectively.
4. Investments in Affiliated Companies
The company owns a 50 % interest in each of the two joint ventures with Marubun Corporation (collectively “Marubun/Arrow”) and a 50 % interest in one other joint venture. These investments are accounted for using the equity method.
The following table presents the company's investment in affiliated companies:
| 2021 | 2020 | |||||||||||||
| Marubun/Arrow | $ | $ | ||||||||||||
| Other | ||||||||||||||
| $ | $ | |||||||||||||
The equity in earnings (losses) of affiliated companies consists of the following:
| 2021 | 2020 | 2019 | ||||||||||||||||||
| Marubun/Arrow | $ | $ | ( | $ | ||||||||||||||||
| Other | ( | |||||||||||||||||||
| $ | $ | ( | $ | ( | ||||||||||||||||
Under the terms of various joint venture agreements, the company is required to pay its pro-rata share of the third party debt of the joint ventures in the event that the joint ventures are unable to meet their obligations. There were no outstanding borrowings under the third party debt agreements of the joint ventures as of December 31, 2021 and 2020.
5. Accounts Receivable
Accounts receivable, net, consists of the following at December 31:
| 2021 | 2020 | |||||||||||||
| Accounts receivable | $ | $ | ||||||||||||
| Allowances for doubtful accounts | ( | ( | ||||||||||||
| Accounts receivable, net | $ | $ | ||||||||||||
50
Allowances for doubtful accounts consists of the following at December 31:
| 2021 | 2020 | |||||||||||||
| Balance at beginning of period | $ | $ | ||||||||||||
| Effect of adoption of ASU No. 2016-13 | ||||||||||||||
| Charged to income | ||||||||||||||
| Translation Adjustments | ( | |||||||||||||
| Write-offs | ( | ( | ||||||||||||
| Balance at end of period | $ | $ | ||||||||||||
During 2020, the company entered into an EMEA asset securitization program under which it will continuously sell its interest in designated pools of trade accounts receivables of certain of its subsidiaries in the EMEA region, at a discount, to a special purpose entity, which in turn sells certain of the receivables to unaffiliated financial institutions and conduits administered by such unaffiliated financial institutions (“unaffiliated financial institutions”) on a monthly basis. The company may sell up to €400,000 under the EMEA asset securitization program, which matures in January 2023, subject to extension in accordance with its terms. The program is conducted through Arrow EMEA Funding Corp B.V., an entity structured to be bankruptcy remote. The company is deemed the primary beneficiary of Arrow EMEA Funding Corp B.V. as the company has both the power to direct the activities that most significantly impact the entity’s economic performance and the obligation to absorb losses or the right to receive the benefits that could potentially be significant to the entity from the transfer of the trade accounts receivables into the special purpose entity. Accordingly, Arrow EMEA Funding Corp B.V. is included in the company’s consolidated financial statements.
Sales of accounts receivables to unaffiliated financial institutions under the EMEA asset securitization program at December 31:
| 2021 | 2020 | |||||||||||||
| EMEA asset securitization, sales of accounts receivables | $ | $ | ||||||||||||
Receivables sold to unaffiliated financial institutions under the program are excluded from “Accounts receivable, net” on the company’s consolidated balance sheets and cash receipts are reflected as cash provided by operating activities on the consolidated statements of cash flows. The purchase price is paid in cash when the receivables are sold. Certain unsold receivables held on Arrow EMEA Funding Corp B.V. are pledged as collateral to unaffiliated financial institutions. These unsold receivables are included in “Accounts receivable, net” in the company’s consolidated balance sheets.
The company continues servicing the receivables which were sold and in exchange receives a servicing fee under the program. The company does not record a servicing asset or liability on the company’s consolidated balance sheets as the company estimates that the fee it receives to service these receivables approximates the fair market compensation to provide the servicing activities.
Other amounts related to the EMEA asset securitization program as of December 31:
| 2021 | 2020 | |||||||||||||
| Receivables sold to unaffiliated financial institutions that were uncollected | $ | $ | ||||||||||||
| Collateralized accounts receivable held by Arrow EMEA funding Corp B.V. | ||||||||||||||
Any accounts receivables held by Arrow EMEA Funding Corp B.V. would likely not be available to other creditors of the company in the event of bankruptcy or insolvency proceedings if there are outstanding balances under the EMEA asset securitization program. The assets of the special purpose entity cannot be used by the company for general corporate purposes. Additionally, the financial obligations of Arrow EMEA Funding Corp B.V. to the unaffiliated financial institution under the program are limited to the assets it owns and there is no recourse to Arrow Electronics, Inc. for receivables that are uncollectible as a result of the insolvency or inability to pay of the account debtors.
51
6. Debt
| 2021 | 2020 | |||||||||||||
| $ | $ | |||||||||||||
| Other short-term borrowings | ||||||||||||||
| $ | $ | |||||||||||||
Other short-term borrowings are primarily utilized to support working capital requirements. The weighted-average interest rate on these borrowings was 1.41 % and 1.73 % at December 31, 2021 and 2020, respectively.
The company has $200,000 in uncommitted lines of credit. There were no outstanding borrowings under the uncommitted lines of credit at December 31, 2021 and 2020. These borrowings were provided on a short-term basis and the maturity is agreed upon between the company and the lender. The lines had a weighted-average effective interest rate of 1.50 % and 1.53 % at December 31, 2021 and 2020, respectively.
The company has a commercial paper program and the maximum aggregate balance of commercial paper outstanding may not exceed the borrowing capacity of $1,200,000 . Amounts outstanding under the commercial paper program are backstopped by available commitments under the company’s revolving credit facility. The company had no outstanding borrowings under this program as of December 31, 2021 and 2020. The program had a weighted-average effective interest rate of .29 % and .30 % at December 31, 2021 and 2020, respectively.
| 2021 | 2020 | |||||||||||||
| $ | $ | |||||||||||||
| Other obligations with various interest rates and due dates | ||||||||||||||
| $ | $ | |||||||||||||
The 7.50 % senior debentures are not redeemable prior to their maturity. All other notes may be called at the option of the company subject to “make whole” clauses.
The estimated fair market value of long-term debt at December 31, using quoted market prices, is as follows:
| 2021 | 2020 | |||||||||||||
| $ | $ | |||||||||||||
52
The company has a North American asset securitization program collateralized by accounts receivable of certain of its subsidiaries. In March 2021, the company amended its asset securitization program and, among other things, increased its borrowing capacity from $1,200,000 to $1,250,000 and extended its term to mature in March 2024. The program is conducted through Arrow Electronics Funding Corporation (“AFC”), a wholly-owned, bankruptcy remote subsidiary. The North American asset securitization program does not qualify for sale treatment. Accordingly, the accounts receivable and related debt obligation remain on the company's consolidated balance sheets. Interest on borrowings is calculated using a base rate or a commercial paper rate plus a spread (.45 % at December 31, 2021), or an effective interest rate of .53 % at December 31, 2021. The facility fee is .40 % of the total borrowing capacity.
The company had no outstanding borrowings under the North American asset securitization program at December 31, 2021 and 2020. Total collateralized accounts receivable of approximately $2,735,145 and $2,207,700 were held by AFC and were included in “Accounts receivable, net” in the company's consolidated balance sheets at December 31, 2021 and 2020, respectively. Any accounts receivable held by AFC would likely not be available to other creditors of the company in the event of bankruptcy or insolvency proceedings before repayment of any outstanding borrowings under the North American asset securitization program.
Both the revolving credit facility and North American asset securitization program include terms and conditions that limit the incurrence of additional borrowings and require that certain financial ratios be maintained at designated levels. As of December 31, 2021, the company was in compliance with all such financial covenants.
During February 2022, prior to the issuance of this Form 10-K, the company repaid $349,779 principal amount of its 3.50 % notes due April 2022.
During the fourth quarter of 2021, the company completed the sale of $500,000 principal amount of 2.95 % notes due in February 2032. The net proceeds of the offering of $495,134 will be used to repay the 3.50 % notes due April 2022 and for general corporate purposes.
During March 2021, the company repaid $130,860 principal amount of its 5.125 % notes due March 2021.
During April 2020, the company repaid $209,366 principal amount of its 6.00 % notes due April 2020.
In the normal course of business, certain of the company’s subsidiaries have agreements to sell, without recourse, selected trade receivables to financial institutions. The company does not retain financial or legal interests in these receivables, and, accordingly they are accounted for as sales of the related receivables, and the receivables are removed from the company’s consolidated balance sheets.
Annual payments of borrowings during each of the years 2022 through 2026 are $382,619 , $299,558 , $497,317 , $347,699 , and
$0 , respectively, and $1,099,869 for all years thereafter.
Interest and other financing expense, net, includes interest and dividend income of $14,722 , $22,568 , and $54,815 in 2021, 2020, and 2019, respectively. Interest paid, net of interest and dividend income, amounted to $113,090 , $138,303 , and $209,512 in 2021, 2020, and 2019, respectively.
53
7. Financial Instruments Measured at Fair Value
Fair value is defined as the exchange price that would be received for an asset or paid to transfer a liability (an exit price) in the principal or most advantageous market for the asset or liability in an orderly transaction between market participants on the measurement date. The company utilizes a fair value hierarchy, which maximizes the use of observable inputs and minimizes the use of unobservable inputs when measuring fair value. The fair value hierarchy has three levels of inputs that may be used to measure fair value:
Level 1 Unadjusted quoted prices in active markets that are accessible at the measurement date for identical, unrestricted assets or liabilities.
Level 2 Quoted prices in markets that are not active; or other inputs that are observable, either directly or indirectly, for substantially the full term of the asset or liability.
Level 3 Prices or valuation techniques that require inputs that are both significant to the fair value measurement and unobservable.
The following table presents assets (liabilities) measured at fair value on a recurring basis at December 31, 2021:
| Balance Sheet Location | Level 1 | Level 2 | Level 3 | Total | ||||||||||||||||||||||||||||
| Cash equivalents (a) | Cash and cash equivalents/ other assets | $ | $ | $ | $ | |||||||||||||||||||||||||||
| Equity investments (b) | Other assets | |||||||||||||||||||||||||||||||
| Interest rate swaps designated as cash flow hedges | Other assets | |||||||||||||||||||||||||||||||
| Foreign exchange contracts designated as net investment hedges | Other assets | |||||||||||||||||||||||||||||||
| $ | $ | $ | $ | |||||||||||||||||||||||||||||
The following table presents assets (liabilities) measured at fair value on a recurring basis at December 31, 2020:
| Balance Sheet Location | Level 1 | Level 2 | Level 3 | Total | ||||||||||||||||||||||||||||
| Cash equivalents (a) | Cash and cash equivalents/ other assets | $ | $ | $ | $ | |||||||||||||||||||||||||||
| Equity investments (b) | Other assets | |||||||||||||||||||||||||||||||
| Interest rate swaps designated as cash flow hedges | Other assets | |||||||||||||||||||||||||||||||
| Foreign exchange contracts designated as net investment hedges | Other assets | |||||||||||||||||||||||||||||||
| $ | $ | $ | $ | |||||||||||||||||||||||||||||
(a) Cash equivalents include highly liquid investments with an original maturity of less than three months.
Assets and liabilities that are measured at fair value on a nonrecurring basis relate primarily to goodwill, identifiable intangible assets, and long-lived assets (see Notes 2 and 3). The company tests these assets for impairment if indicators of potential impairment exist or at least annually if indefinite lived.
Derivative Instruments
The company uses various financial instruments, including derivative instruments, for purposes other than trading. Certain derivative instruments are designated at inception as hedges and measured for effectiveness both at inception and on an ongoing basis. Derivative instruments not designated as hedges are marked-to-market each reporting period with any unrealized gains or losses recognized in earnings.
Interest Rate Swaps
The company manages the risk of variability in interest rates of future expected debt issuances by entering into various forward starting interest rate swaps, designated as cash flow hedges. Changes in fair value of interest rate swaps are recorded in the shareholders’ equity section in the company’s consolidated balance sheets in “Accumulated other comprehensive loss” and will be reclassified into income over the life of the anticipated debt issuance or in the period the hedged forecasted cash flows are deemed no longer probable to occur. Gains and losses on interest rate swaps are recorded within the line item “Interest and other financing expense, net” in the consolidated statements of operations. The fair value of interest rate swaps are estimated using a discounted cash flow analysis on the expected cash flows of each derivative using observable inputs including interest rate curves and credit spreads.
At December 31, 2021, the company had the following outstanding interest rate swaps designated as cash flow hedges:
| Trade Date | Maturity Date | Notional Amount | Weighted Average Interest Rate | Date Range of Forecasted Transaction | ||||||||||||||||||||||
| April 2020 | December 2024 | $ | Jan 2023 - Dec 2025 | |||||||||||||||||||||||
At December 31, 2020, the company had the following outstanding interest rate swaps designated as cash flow hedges:
| Trade Date | Maturity Date | Notional Amount | Weighted Average Interest Rate | Date Range of Forecasted Transaction | ||||||||||||||||||||||
| April 2020 | December 2024 | $ | Jan 2023 - Dec 2025 | |||||||||||||||||||||||
| May 2020 | June 2022 | $ | Jan 2021 - Jun 2023 | |||||||||||||||||||||||
In May 2019, the company entered into a series of ten-year forward-starting interest rate swaps (the “May 2019 swaps”). The May 2019 swaps were designated as cash flow hedges managing the risk of variability in interest rates of future expected debt issuance by June 2020. In February 2020, the company determined that certain of the forecasted cash flows were no longer probable and de-designated the hedging relationship. In February 2020, the company re-designated the May 2019 swaps in a new cash flow hedge managing the risk of variability in interest rates of future expected debt issuance by June 2023. In May 2020, the company terminated the May 2019 swaps for a cash payment of $48,378 , which is reported in the “cash flows from financing activities” section of the consolidated statements of cash flows. Subsequent to terminating the May 2019 swaps, the company entered into a new series of ten-year forward-starting interest rate swaps ("May 2020 swaps") and designated them as a cash flow hedge in order to continue managing the risk of variability in interest rates of future expected debt issuance by June 2023.
During the years ended December 31, 2021 and 2020, losses of $1,493 and $2,616 , before taxes, were reclassified from “Accumulated other comprehensive loss” to “Interest and other financing expense, net” related to forecasted cash flows that were deemed no longer probable to occur. At December 31, 2021 and 2020, losses of $33,071 and $34,751 , net of taxes, remained in “Accumulated other comprehensive loss” related to the May 2019 swaps.
During the fourth quarter of 2021, the company completed the sale of $500,000 principal amount of 2.95 % notes due in 2032 ("2032 notes") and received $24,896 , before taxes, in connection with the termination of the May 2020 swaps upon issuance of the ten-year notes due in 2032. Losses on the May 2019 swaps remaining in “Accumulated other comprehensive loss” upon issuance of the 2032 notes were $44,269 , before taxes. The fair value of the May 2019 swaps and May 2020 swaps recorded in “Accumulated other comprehensive loss” is being reclassified into income over the ten-year term of the notes due in 2032.
Foreign Exchange Contracts
The company's foreign currency exposure relates primarily to international transactions where the currency collected from customers can be different from the currency used to purchase the product. The company's transactions in its foreign operations are denominated primarily in the following currencies: Euro, Indian Rupee, Chinese Renminbi, and British Pound. The company enters into foreign exchange forward, option, or swap contracts (collectively, the “foreign exchange contracts”) to facilitate the hedging of foreign currency exposures resulting from inventory purchases and sales and mitigate the impact of changes in foreign currency exchange rates related to these transactions. Foreign exchange contracts generally have terms of no more than six months. Gains or losses on these contracts are deferred and recognized when the underlying future purchase or sale is recognized or when the corresponding asset or liability is revalued. The company does not enter into foreign exchange contracts for trading purposes. The risk of loss on a foreign exchange contract is the risk of nonperformance by the
55
counterparties, which the company minimizes by limiting its counterparties to major financial institutions. The fair value of the foreign exchange contracts are estimated using foreign currency spot rates and forward rates quotes by third party financial institutions. The notional amount of the foreign exchange contracts inclusive of foreign exchange contracts designated as a net investment hedge at 2021 and 2020 was $1,125,997 and $914,930 , respectively.
Gains and losses related to non-designated foreign currency exchange contracts are recorded in “Cost of sales” in the company’s consolidated statements of operations. Gains and losses related to foreign currency exchange contracts designated as cash flow hedges are recorded in “Cost of sales,” “Selling, general, and administrative expenses,” and “Interest and other financing expense, net” based upon the nature of the underlying hedged transaction, in the company’s consolidated statements of operations.
At December 31, 2021, and 2020, the following foreign exchange contracts were designated as net investment hedges:
| Maturity Date | Notional Amount | |||||||
| March 2023 | € | |||||||
| September 2024 | ||||||||
| April 2025 | ||||||||
| January 2028 | ||||||||
| Total | € | |||||||
The contracts above have been designated as a net investment hedge which is in place to hedge a portion of the company's net investment in subsidiaries with euro-denominated net assets. The change in the fair value of derivatives designated as net investment hedges are recorded in “foreign currency translation adjustment” (“CTA”) within “Accumulated other comprehensive loss” in the company's consolidated balance sheets. Amounts excluded from the assessment of hedge effectiveness are included in “Interest and other financing expense, net” in the company's consolidated statements of operations.
The effects of derivative instruments on the company’s consolidated statements of operations and other comprehensive income are as follows for the years ended December 31:
| Income Statement Line | 2021 | 2020 | 2019 | |||||||||||||||||||||||
| Gain (Loss) Recognized in Income (Loss) | ||||||||||||||||||||||||||
| Foreign exchange contracts, net investment hedge (a) | Interest Expense | $ | $ | $ | ||||||||||||||||||||||
Interest rate swaps, cash flow hedge | Interest Expense | ( | ( | ( | ||||||||||||||||||||||
| Total | $ | $ | $ | |||||||||||||||||||||||
| Gain (Loss) Recognized in Other Comprehensive Income (Loss) before reclassifications, net of tax | ||||||||||||||||||||||||||
| Foreign exchange contracts, net investment hedge (b) | $ | $ | ( | $ | ||||||||||||||||||||||
Interest rate swaps, cash flow hedge | ( | ( | ||||||||||||||||||||||||
| Total | $ | $ | ( | $ | ||||||||||||||||||||||
(a)Represents derivative amounts excluded from the assessment of effectiveness for the net investment hedges reclassified from CTA to Interest and other financing expenses, net.
(b)Includes derivative gains (losses) excluded from the assessment of effectiveness for the net investment hedges and recognized in other comprehensive income (net of tax) of $(617 ), $17,991 , and $10,734 for 2021, 2020, and 2019, respectively.
Other
The carrying amount of cash and cash equivalents, accounts receivable, net, and accounts payable approximate their fair value due to the short maturities of these financial instruments.
56
8. Income Taxes
The provision for income taxes for the years ended December 31 consists of the following:
| 2021 | 2020 | 2019 | |||||||||||||||
| Current: | |||||||||||||||||
Federal | $ | $ | $ | ||||||||||||||
State | ( | ||||||||||||||||
International | |||||||||||||||||
| $ | $ | $ | |||||||||||||||
| Deferred: | |||||||||||||||||
Federal | $ | ( | $ | $ | ( | ||||||||||||
State | ( | ( | |||||||||||||||
International | |||||||||||||||||
| ( | |||||||||||||||||
| $ | $ | $ | |||||||||||||||
The principal causes of the difference between the U.S. federal statutory tax rate of 21 % and effective income tax rates for the years ended December 31 are as follows:
| 2021 | 2020 | 2019 | |||||||||||||||
| United States | $ | $ | $ | ( | |||||||||||||
| International | |||||||||||||||||
| Income (loss) before income taxes | $ | $ | $ | ( | |||||||||||||
| Provision (benefit) at statutory tax rate | $ | $ | $ | ( | |||||||||||||
| State taxes (benefit), net of federal benefit | ( | ||||||||||||||||
| International effective tax rate differential | ( | ||||||||||||||||
| U.S. tax on foreign earnings | |||||||||||||||||
| Tax expense (benefit) on wind down of business (a) | ( | ||||||||||||||||
| Change in valuation allowance | ( | ||||||||||||||||
| Other non-deductible expenses | |||||||||||||||||
| Changes in tax accruals | |||||||||||||||||
| Tax credits | ( | ( | ( | ||||||||||||||
| Non-deductible portion of impairment of goodwill | |||||||||||||||||
| Other | ( | ||||||||||||||||
| Provision for income taxes | $ | $ | $ | ||||||||||||||
(a)The wind down of the company’s personal computer and mobility asset disposition business resulted in net tax expense (benefit) of $1,937 and $(11,311 ) during 2020 and 2019, respectively.
The company is subject to taxation of global intangible low-taxed income (“GILTI”) on foreign subsidiaries and a tax provision to deduct a portion of foreign-derived intangible income (“FDII”) of U.S. corporations. GILTI tax expense, net of FDII benefit, resulted in a net tax expense (benefit) of $(12,287 ), $233 , and $31,042 during 2021, 2020, and 2019, respectively. The 2019 GILTI tax was adversely affected by losses from the wind down of the personal computer and mobility asset disposition business. The company elected to account for GILTI tax expense (net of FDII benefit) as a current period cost.
As of December 31, 2021, a long-term tax payable of $30,857 was recorded in “other liabilities” in the consolidated balance sheets related to the Tax Act's one-time transition tax on the foreign subsidiaries' accumulated, unremitted earnings.
At December 31, 2021, the company had a liability for unrecognized tax position of $71,422 . The timing of the resolution of these uncertain tax positions is dependent on the tax authorities' income tax examination processes. Material changes are not
57
expected, however, it is possible that the amount of unrecognized tax benefits with respect to uncertain tax positions could increase or decrease during 2022. Currently, the company is unable to make a reasonable estimate of when tax cash settlement would occur and how it would impact the effective tax rate.
| 2021 | 2020 | 2019 | |||||||||||||||
| Balance at beginning of year | $ | $ | $ | ||||||||||||||
| Additions based on tax positions taken during a prior period | |||||||||||||||||
| Reductions based on tax positions taken during a prior period | ( | ( | ( | ||||||||||||||
| Additions based on tax positions taken during the current period | |||||||||||||||||
| Reductions based on tax positions taken during the current period | ( | ( | ( | ||||||||||||||
| Reductions related to settlement of tax matters | ( | ( | |||||||||||||||
| Reductions related to a lapse of applicable statute of limitations | ( | ( | ( | ||||||||||||||
| Balance at end of year | $ | $ | $ | ||||||||||||||
Interest costs related to unrecognized tax benefits are classified as a component of “Interest and other financing expense, net” in the company's consolidated statements of operations. In 2021, 2020, and 2019, the company recognized $1,302 , $1,862 , and $1,469 , respectively, of interest expense related to unrecognized tax benefits. At December 31, 2021 and 2020, the company had accrued a liability of $9,091 and $8,100 , respectively, for the payment of interest related to unrecognized tax benefits.
In many cases the company's uncertain tax positions are related to tax years that remain subject to examination by tax authorities. The following describes the open tax years, by major tax jurisdiction, as of December 31, 2021:
| United States - Federal | ||||||||
| United States - States | ||||||||
| Germany (a) | ||||||||
| China and Hong Kong | ||||||||
| Italy (a) | ||||||||
| Netherlands | ||||||||
| Sweden | ||||||||
| Taiwan | ||||||||
| United Kingdom | ||||||||
(a) Includes federal as well as local jurisdictions.
58
Deferred income taxes are provided for the effects of temporary differences between the tax basis of an asset or liability and its reported amount in the consolidated balance sheets. These temporary differences result in taxable or deductible amounts in future years.
| 2021 | 2020 | ||||||||||
| Deferred tax assets: | |||||||||||
| Net operating loss carryforwards | $ | $ | |||||||||
| Capital loss carryforwards | |||||||||||
| Inventory adjustments | |||||||||||
| Allowance for doubtful accounts | |||||||||||
| Accrued expenses | |||||||||||
| Interest carryforward | |||||||||||
| Stock-based compensation awards | |||||||||||
| Lease liability | |||||||||||
| Other | |||||||||||
| Valuation allowance | ( | ( | |||||||||
| Total deferred tax assets | $ | $ | |||||||||
| Deferred tax liabilities: | |||||||||||
| Goodwill | $ | ( | $ | ( | |||||||
| Depreciation | ( | ( | |||||||||
| Intangible assets | ( | ( | |||||||||
| Lease right-of-use assets | ( | ( | |||||||||
| Total deferred tax liabilities | $ | ( | $ | ( | |||||||
| Total net deferred tax assets (liabilities) | $ | ( | $ | ( | |||||||
At December 31, 2021, the company had international tax loss carryforwards of approximately $205,642 , of which $16,733 have expiration dates ranging from 2022 to 2041, and the remaining $188,909 have no expiration date. Deferred tax assets related to these international tax loss carryforwards were $40,623 with a corresponding valuation allowance of $7,366 . At December 31, 2021, the company had a valuation allowance of $3,804 related to other deferred tax assets.
At December 31, 2021, the company also had deferred tax assets of $186 related to U.S. Federal net operating loss carryforwards from acquired subsidiaries. These U.S. Federal net operating losses expire in various years beginning after 2028. Additionally, as of December 31, 2021, the company had deferred tax assets of approximately $9,205 with a corresponding valuation allowance of $7,825 , related to U.S. state net operating loss carryforwards. Valuation allowances are needed when deferred tax assets may not be realized due to the uncertainty of the timing and the ability of the company to generate sufficient future taxable income in certain tax jurisdictions.
To achieve greater cash management agility and to further advance business objectives, during the fourth quarter of 2019, the company reversed its assertion to indefinitely reinvest a certain portion of its foreign earnings, of which approximately $2,180,000 are still available for distribution in future periods as of December 31, 2021, after distributions of $53,600 , $349,000 and $761,000 during 2021, 2020 and 2019, respectively. The company continues to indefinitely reinvest the residual $2,487,000 of undistributed earnings of its foreign subsidiaries and recognizes that it may be subject to additional foreign taxes and U.S. state income taxes, if it reverses its indefinite reinvestment assertion on these foreign earnings.
Income taxes paid, net of income taxes refunded, amounted to $221,088 , $160,143 , and $188,601 in 2021, 2020, and 2019, respectively.
59
9. Restructuring, Integration, and Other Charges
Restructuring initiatives and integration costs are due to the company's continued efforts to lower costs, drive operational efficiency, integrate any acquired businesses, and the consolidation of certain operations, as necessary. The following table presents the components of the restructuring, integration, and other charges for the years ended December 31:
| 2021 | 2020 | 2019 | ||||||||||||||||||
| Restructuring and integration charges - current period actions | $ | $ | $ | |||||||||||||||||
| Restructuring and integration (credits) charges - actions taken in prior periods | ( | |||||||||||||||||||
| Other charges | ( | |||||||||||||||||||
| $ | $ | $ | ||||||||||||||||||
Restructuring and Integration Accrual Summary
The restructuring and integration accrual was $11,201 and $9,735 at December 31, 2021 and 2020, respectively. During the year ended December 31, 2021, the company made $16,167 of payments related to restructuring and integration accruals, and recorded $16,673 in restructuring and integration charges. The remaining changes to the accrual related to changes in foreign exchange rates during the year. Substantially all amounts accrued at December 31, 2021, and all restructuring and integration charges for the year ending December 31, 2021 relate to the termination of personnel and are expected to be spent in cash within one year .
Other Charges
10. Shareholders' Equity
Accumulated Other Comprehensive Loss
The following table presents the changes in Accumulated other comprehensive loss, excluding noncontrolling interests:
| Foreign Currency Translation Adjustment and Other, Net | Unrealized Gain (Loss) on Foreign Exchange Contracts Designated as Net Investment Hedges, Net | Unrealized Gain (Loss) on Interest Rate Swaps Designated as Cash Flow Hedges, Net | Employee Benefit Plan Items, Net | Total | ||||||||||||||||||||||||||||
| Balance as of December 31, 2019 | $ | ( | $ | $ | ( | $ | ( | $ | ( | |||||||||||||||||||||||
| Other comprehensive income (loss) before reclassifications (a) | ( | ( | ( | |||||||||||||||||||||||||||||
| Amounts reclassified into income (loss) | ( | ( | ( | |||||||||||||||||||||||||||||
| Net change in accumulated other comprehensive income (loss) for the year ended December 31, 2020 | ( | ( | ( | |||||||||||||||||||||||||||||
| Balance as of December 31, 2020 | ( | ( | ( | ( | ( | |||||||||||||||||||||||||||
| Other comprehensive income (loss) before reclassifications (a) | ( | ( | ||||||||||||||||||||||||||||||
| Amounts reclassified into income (loss) | ( | ( | ( | |||||||||||||||||||||||||||||
| Net change in accumulated other comprehensive income (loss) for the year ended December 31, 2021 | ( | ( | ||||||||||||||||||||||||||||||
| Balance as of December 31, 2021 | $ | ( | $ | $ | ( | $ | ( | $ | ( | |||||||||||||||||||||||
(a) Foreign currency translation adjustment includes intra-entity foreign currency transactions that are of a long-term investment nature of $(9,981 ) and $31,470 for 2021 and 2020, respectively.
60
Common Stock Outstanding Activity
| Common Stock Issued | Treasury Stock | Common Stock Outstanding | ||||||||||||||||||
| Common stock outstanding at December 31, 2018 | ||||||||||||||||||||
| Shares issued for stock-based compensation awards | ( | |||||||||||||||||||
Repurchases of common stock | ( | |||||||||||||||||||
| Common stock outstanding at December 31, 2019 | ||||||||||||||||||||
| Shares issued for stock-based compensation awards | ( | |||||||||||||||||||
Repurchases of common stock | ( | |||||||||||||||||||
| Common stock outstanding at December 31, 2020 | ||||||||||||||||||||
Shares issued for stock-based compensation awards | ( | |||||||||||||||||||
Repurchases of common stock | ( | |||||||||||||||||||
| Common stock outstanding at December 31, 2021 | ||||||||||||||||||||
The company has 2,000,000 authorized shares of serial preferred stock with a par value of one dollar. There were no shares of serial preferred stock outstanding at December 31, 2021 and 2020.
Share-Repurchase Programs
The following table shows the company's Board of Directors (the “Board”) approved share-repurchase programs as of December 31, 2021:
| Month of Board Approval | Dollar Value Approved for Repurchase | Dollar Value of Shares Repurchased | Approximate Dollar Value of Shares that May Yet be Purchased Under the Program | |||||||||||||||||
| December 2018 | $ | $ | $ | |||||||||||||||||
| July 2020 | ||||||||||||||||||||
| July 2021 | ||||||||||||||||||||
| December 2021 | ||||||||||||||||||||
Total | $ | $ | $ | |||||||||||||||||
11. Net Income (Loss) Per Share
The following table presents the computation of net income (loss) per share on a basic and diluted basis for the years ended December 31 (shares in thousands):
| 2021 | 2020 | 2019 | ||||||||||||||||||
| Net income (loss) attributable to shareholders | $ | $ | $ | ( | ||||||||||||||||
| Weighted-average shares outstanding - basic | ||||||||||||||||||||
| Net effect of various dilutive stock-based compensation awards | ||||||||||||||||||||
| Weighted-average shares outstanding - diluted | ||||||||||||||||||||
| Net income (loss) per share: | ||||||||||||||||||||
Basic | $ | $ | $ | ( | ||||||||||||||||
Diluted (a) | $ | $ | $ | ( | ||||||||||||||||
(a)Stock-based compensation awards for the issuance of 1,143 shares and 1,614 shares for the years ended December 31, 2020 and 2019, respectively, were excluded from the computation of net income (loss) per share on a diluted basis as their effect was anti-dilutive. As the company reported a net loss attributable to shareholders for 2019, basic and diluted net loss per share attributable to shareholders are the same.
61
12. Employee Stock Plans
Omnibus Plan
The company maintains the Arrow Electronics, Inc. 2004 Omnibus Incentive Plan (the “Omnibus Plan”), which provides an array of equity alternatives available to the company when designing compensation incentives. The Omnibus Plan permits the grant of cash-based awards, non-qualified stock options, incentive stock options (“ISOs”), stock appreciation rights, restricted stock, restricted stock units, performance shares, performance units, covered employee annual incentive awards, and other stock-based awards. The Compensation Committee of the company's Board of Directors (the “Compensation Committee”) determines the vesting requirements, termination provision, and the terms of the award for any awards under the Omnibus Plan when such awards are issued. The company did not grant non-qualified stock options or ISOs in 2021 and does not intend to grant them in the future.
Under the terms of the Omnibus Plan, a maximum of 24,000,000 shares of common stock may be awarded. There were 6,209,974 and 6,777,309 shares available for grant under the Omnibus Plan as of December 31, 2021 and 2020, respectively. Generally, shares are counted against the authorization only to the extent that they are issued. Restricted stock, restricted stock units, performance shares, and performance units count against the authorization at a rate of 1.69 to 1.
The company recorded, as a component of “Selling, general, and administrative expenses,” amortization of stock-based compensation of $36,117 , $35,288 , and $41,070 in 2021, 2020, and 2019, respectively. The actual tax benefit realized from share-based payment awards during 2021, 2020, and 2019 was $8,635 , $5,308 , and $7,308 , respectively.
Stock Options
Under the Omnibus Plan, the company may grant both ISOs and non-qualified stock options. ISOs may only be granted to employees of the company, its subsidiaries, and its affiliates. The exercise price for options cannot be less than the fair market value of Arrow's common stock on the date of grant. Options generally vest in equal installments over a four-year period. Options currently outstanding have contractual terms of ten years.
The following information relates to the stock option activity for the year ended December 31, 2021:
| Shares | Weighted- Average Exercise Price | Weighted- Average Remaining Contractual Life | Aggregate Intrinsic Value | |||||||||||||||||||||||||||||
| Outstanding at December 31, 2020 | $ | |||||||||||||||||||||||||||||||
| Exercised | ( | |||||||||||||||||||||||||||||||
| Forfeited | ( | |||||||||||||||||||||||||||||||
| Outstanding at December 31, 2021 | months | $ | ||||||||||||||||||||||||||||||
| Exercisable at December 31, 2021 | $ | months | $ | |||||||||||||||||||||||||||||
The total intrinsic value of options exercised during 2021, 2020, and 2019 was $26,614 , $8,211 , and $9,346 , respectively.
Cash received from option exercises during 2021, 2020, and 2019 was $46,982 , $21,037 , and $16,911 , respectively, and is included within the financing activities section in the company's consolidated statements of cash flows.
62
The fair value of stock options was estimated using the Black-Scholes valuation model with the following weighted-average assumptions for the years ended December 31:
| 2020 | 2019 | ||||||||||
| Volatility (percent) (a) | |||||||||||
| Expected term (in years) (b) | |||||||||||
| Risk-free interest rate (percent) (c) | |||||||||||
(a) Volatility is measured using historical daily price changes of the company's common stock over the expected term of the option.
(b) The expected term represents the weighted-average period the option is expected to be outstanding and is based primarily on the historical exercise behavior of employees.
(c) The risk-free interest rate is based on the U.S. Treasury zero-coupon yield with a maturity that approximates the expected term of the option.
There is no expected dividend yield.
No stock options were granted in 2021. The weighted-average fair value per option granted was $20.59 and $22.68 during 2020 and 2019, respectively.
Performance Awards
The Compensation Committee, subject to the terms and conditions of the Omnibus Plan, may grant performance share and/or performance unit awards (collectively “performance awards”). The fair value of a performance award is the fair market value of the company's common stock on the date of grant. Such awards will be earned only if performance goals over performance periods established by or under the direction of the Compensation Committee are met. The performance goals and periods may vary from participant-to-participant, group-to-group, and time-to-time. The performance awards will be delivered in common stock at the end of the service period based on the company's actual performance compared to the target metric and may be from 0% to 185% of the initial award. Compensation expense is recognized using the graded vesting method over the three-year service period and is adjusted each period based on the current estimate of performance compared to the target metric.
Restricted Stock
Subject to the terms and conditions of the Omnibus Plan, the Compensation Committee may grant shares of restricted stock and/or restricted stock units. Restricted stock units are similar to restricted stock except that no shares are actually awarded to the participant on the date of grant. Shares of restricted stock and/or restricted stock units awarded under the Omnibus Plan may not be sold, transferred, pledged, assigned, or otherwise alienated or hypothecated until the end of the applicable period of restriction established by the Compensation Committee and specified in the award agreement (and in the case of restricted stock units until the date of delivery or other payment). Compensation expense is recognized on a straight-line basis as shares become free of forfeiture restrictions (i.e. vest) generally over a four-year period.
Non-Employee Director Awards
The company's Board shall set the amounts and types of equity awards that shall be granted to all non-employee directors on a periodic, nondiscriminatory basis pursuant to the Omnibus Plan, as well as any additional amounts, if any, to be awarded, also on a periodic, nondiscriminatory basis, based on each of the following: the number of committees of the Board on which a non-employee director serves, service of a non-employee director as the chair of a Committee of the Board, service of a non-employee director as Chairman of the Board or Lead Director, or the first selection or appointment of an individual to the Board as a non-employee director. Non-employee directors currently receive annual awards of fully-vested restricted stock units valued at $175 . All restricted stock units are settled in common stock following the director's separation from the Board.
Unless a non-employee director gives notice setting forth a different percentage, 50% of each director's annual retainer fee is deferred and converted into units based on the fair market value of the company's stock as of the date it was payable. A non-employee director can choose between one-year cliff vesting or keep the deferral until separation from the Board. After separation from the Board, the deferral will be converted into a share of company stock and distributed to the non-employee director as soon as practicable following such date.
63
Summary of Non-Vested Shares
The following information summarizes the changes in non-vested performance shares, performance units, restricted stock, and restricted stock units for 2021:
| Shares | Weighted- Average Grant Date Fair Value | |||||||||||||
| Non-vested shares at December 31, 2020 | $ | |||||||||||||
| Granted | ||||||||||||||
| Vested | ( | |||||||||||||
| Forfeited | ( | |||||||||||||
| Non-vested shares at December 31, 2021 | $ | |||||||||||||
The total fair value of shares vested during 2021, 2020, and 2019 was $37,323 , $31,851 , and $46,676 , respectively.
As of December 31, 2021, there was $26,460 of total unrecognized compensation cost related to non-vested shares and stock options which is expected to be recognized over a weighted-average period of 2.1 years.
64
13. Employee Benefit Plans
The company maintains an unfunded Arrow supplemental executive retirement plan (“SERP”) under which the company will pay supplemental pension benefits to certain employees upon retirement. As of December 31, 2021, there were 11 current and 23 former corporate officers participating in this plan. The Board determines those employees who are eligible to participate in the Arrow SERP.
The Arrow SERP, as amended, provides for the pension benefits to be based on a percentage of average final compensation, based on years of participation in the Arrow SERP. The Arrow SERP permits early retirement, with payments at a reduced rate, based on age and years of service subject to a minimum retirement age of 55. Participants whose accrued rights under the Arrow SERP, prior to the 2002 amendment, which were adversely affected by the amendment, will continue to be entitled to such greater rights.
| Arrow SERP | |||||||||||
| 2021 | 2020 | ||||||||||
| Accumulated benefit obligation | $ | $ | |||||||||
| Changes in projected benefit obligation: | |||||||||||
| Projected benefit obligation at beginning of year | |||||||||||
| Service cost | |||||||||||
| Interest cost | |||||||||||
| Actuarial loss (gain) | ( | ||||||||||
| Benefits paid | ( | ( | |||||||||
| Projected benefit obligation at end of year | |||||||||||
| Funded status | $ | ( | $ | ( | |||||||
Amounts recognized in the company's consolidated balance sheets: | |||||||||||
| Current liabilities | $ | ( | $ | ( | |||||||
| Noncurrent liabilities | ( | ( | |||||||||
| Net liability at end of year | $ | ( | $ | ( | |||||||
| Components of net periodic pension cost: | |||||||||||
| Service cost | $ | $ | |||||||||
| Interest cost | |||||||||||
| Amortization of net loss | |||||||||||
| Net periodic pension cost | $ | $ | |||||||||
| Weighted-average assumptions used to determine benefit obligation: | |||||||||||
| Discount rate | % | % | |||||||||
| Rate of compensation increase | % | % | |||||||||
| Expected return on plan assets | N/A | N/A | |||||||||
| Weighted-average assumptions used to determine net periodic pension cost: | |||||||||||
| Discount rate | % | % | |||||||||
| Rate of compensation increase | % | % | |||||||||
| Expected return on plan assets | N/A | N/A | |||||||||
The amounts reported for net periodic pension cost and the respective benefit obligation amounts are dependent upon the actuarial assumptions used. The company reviews historical trends, future expectations, current market conditions, and external data to determine the assumptions. The discount rate represents the market rate for a high-quality corporate bond. The rate of compensation increase is determined by the company, based upon its long-term plans for such increases. The actuarial
65
assumptions used to determine the net periodic pension cost are based upon the prior year's assumptions used to determine the benefit obligation.
Benefit payments are expected to be paid as follows:
| Arrow SERP | |||||
| 2022 | $ | ||||
| 2023 | |||||
| 2024 | |||||
| 2025 | |||||
| 2026 | |||||
| 2027-2031 | |||||
The company has funded $116,713 of the Arrow SERP obligation for the former corporate officers in a rabbi trust comprised primarily of life insurance policies and mutual fund assets. Contributions to the rabbi trust are irrevocable by the company. In the event of bankruptcy by the company, the assets held by the rabbi trust are subject to claims made by the company's creditors.
As part of the company's acquisition of Wyle in 2000, Wyle provided retirement benefits for certain employees under a defined benefit plan. Benefits under this plan were frozen as of December 31, 2000 and on December 31, 2018 the plan was terminated. Prior to terminating the plan, the company adopted an amendment to the plan that provided eligible plan participants with the option to receive an early distribution of their pension benefits. In 2019 the company entered into a settlement for the remaining portion of its Wyle defined benefit plan under which participants received benefits through lump sum payments and an insurance annuity contract. During 2019, the settlement of $59,311 was completed and the company recorded settlement expense of $20,111 , which is recorded in the “Employee benefit plan expense, net” line item in the company's consolidated statements of operations. The company decided to terminate the plan to reduce administrative burdens.
Comprehensive Income Items
In 2021, 2020, and 2019, actuarial (gains) losses of $(4,223 ), $4,341 , and $2,922 , respectively, were recognized in comprehensive income, net of related taxes, related to the company's defined benefit plans. In 2021, 2020, and 2019, a reclassification adjustment of comprehensive income was recognized, net of related taxes, as a result of being recognized in net periodic pension cost for an actuarial loss of $1,856 , $1,220 , and $15,797 , respectively.
Accumulated other comprehensive income (loss) at December 31, 2021 and 2020 includes unrecognized actuarial losses, net of related taxes, of $11,271 and $17,375 , respectively, that have not yet been recognized in net periodic pension cost.
The actuarial loss included in accumulated other comprehensive income (loss), net of related taxes, which is expected to be recognized in net periodic pension cost during the year ended December 31, 2022 is $588 .
Defined Contribution Plan
The company has defined contribution plans for eligible employees, which qualify under Section 401(k) of the Internal Revenue Code. The company's contribution to the plans, which are based on a specified percentage of employee contributions, amounted to $19,054 , $17,989 , and $19,655 in 2021, 2020, and 2019, respectively. Certain international subsidiaries maintain separate defined contribution plans for their employees and made contributions thereunder, which amounted to $23,033 , $21,819 , and $21,025 in 2021, 2020, and 2019, respectively.
14. Lease Commitments
66
The following amounts were recorded in the consolidated balance sheets at December 31:
| 2021 | 2020 | |||||||||||||
| Operating Leases | ||||||||||||||
| Right-of-use asset | $ | $ | ||||||||||||
| Lease liability - current | ||||||||||||||
| Lease liability - non-current | ||||||||||||||
| Total operating lease liabilities | $ | $ | ||||||||||||
| 2022 | $ | |||||||
| 2023 | ||||||||
| 2024 | ||||||||
| 2025 | ||||||||
| 2026 | ||||||||
| Thereafter | ||||||||
| Total lease payments | ||||||||
| Less: imputed interest | ( | |||||||
| Total | $ | |||||||
Other information pertaining to leases consists of the following for the year ended December 31:
| 2021 | 2020 | |||||||||||||
| Supplemental Cash Flow Information | ||||||||||||||
| Cash paid for amounts included in the measurement of operating lease liabilities | $ | $ | ||||||||||||
| Right-of-use assets obtained in exchange for operating lease obligations | ||||||||||||||
| Operating Lease Term and Discount Rate | ||||||||||||||
| Weighted-average remaining lease term in years | ||||||||||||||
| Weighted-average discount rate | % | % | ||||||||||||
15. Contingencies
Environmental Matters
In connection with the purchase of Wyle in August 2000, the company acquired certain of the then outstanding obligations of Wyle, including Wyle's indemnification obligations to the purchasers of its Wyle Laboratories division for environmental clean-up costs associated with any then existing contamination or violation of environmental regulations. Under the terms of the company's purchase of Wyle from the sellers, the sellers agreed to indemnify the company for certain costs associated with the Wyle environmental obligations, among other things. In 2012, the company entered into a settlement agreement with the sellers pursuant to which the sellers paid $110,000 and the company released the sellers from their indemnification obligation. As part of the settlement agreement the company accepted responsibility for any potential subsequent costs incurred related to the Wyle matters. The company is aware of two Wyle Laboratories facilities (in Huntsville, Alabama and Norco, California) at which contaminated groundwater was identified and will require environmental remediation. In addition, the company was named as a defendant in several lawsuits related to the Norco facility and a third site in El Segundo, California which have now been settled to the satisfaction of the parties.
The company expects these environmental liabilities to be resolved over an extended period of time. Costs are recorded for environmental matters when it is probable that a liability has been incurred and the amount of the liability can be reasonably estimated. Accruals for environmental liabilities are adjusted periodically as facts and circumstances change, assessment and remediation efforts progress, or as additional technical or legal information becomes available. Environmental liabilities are difficult to assess and estimate due to various unknown factors such as the timing and extent of remediation, improvements in
67
remediation technologies, and the extent to which environmental laws and regulations may change in the future. Accordingly, the company cannot presently estimate the ultimate potential costs related to these sites until such time as a substantial portion of the investigation at the sites is completed and remedial action plans are developed and, in some instances, implemented. To the extent that future environmental costs exceed amounts currently accrued by the company, net income would be adversely impacted and such impact could be material.
Accruals for environmental liabilities are included in “Accrued expenses” and “Other liabilities” in the company's consolidated balance sheets. The company has determined that there is no amount within the environmental liability range that is a better estimate than any other amount, and therefore has recorded the accruals at the minimum amount of the ranges.
As successor-in-interest to Wyle, the company is the beneficiary of various Wyle insurance policies that covered liabilities arising out of operations at Norco and Huntsville. To date, the company has recovered approximately $47,000 from certain insurance carriers relating to environmental clean-up matters at the Norco and Huntsville sites. The company filed suit against two insurers regarding liabilities arising out of operations at Huntsville and reached a confidential settlement with one of the insurers in 2020. The resolution of this matter against the remaining insurer will likely take several years. The company has not recorded a receivable for any potential future insurance recoveries related to the Norco and Huntsville environmental matters, as the realization of the claims for recovery are not deemed probable at this time.
Environmental Matters - Huntsville
In February 2015, the company and the Alabama Department of Environmental Management (“ADEM”) finalized and executed a consent decree in connection with the Huntsville, Alabama site. Characterization of the extent of contaminated soil and groundwater is complete and has been approved by ADEM. Health-risk evaluations and a Corrective Action Development Plan were approved by ADEM in 2018, opening the way for pilot testing of on-site remediation in late 2019. Pilot testing is currently underway. Approximately $7,600 was spent to date and the company currently anticipates no additional investigative and related expenditures. The cost of subsequent remediation at the site is estimated to be between $2,700 and $10,000 .
Despite the amount of work undertaken and planned to date, the company is unable to estimate any potential costs in addition to those discussed above because the complete scope of the work is not yet known, and, accordingly, the associated costs have yet to be determined.
Environmental Matters - Norco
In October 2003, the company entered into a consent decree with Wyle Laboratories and the California Department of Toxic Substance Control (the “DTSC”) in connection with the Norco site. Subsequent to the decree, a Remedial Investigation Work Plan was approved by DTSC in April 2005, the required investigations were performed, and a final Remedial Investigation Report was submitted early in 2008. In 2008, a hydraulic containment system (“HCS”) was installed as an interim remedial measure to capture and treat groundwater before it moves into the adjacent off-site area. In September 2013, the DTSC approved the final Remedial Action Plan (“RAP”) for actions in five on-site areas and one off-site area. As of 2018, the remediation measures described in the RAP had been implemented and were being monitored. A Five Year Review (“FYR”) of the HCS submitted to DTSC in December 2016 found that while significant progress was made in on-site and off-site groundwater remediation, contaminants were not sufficiently reduced in a key off-site area identified in the RAP. This exception triggered the need for additional off-site remediation that began in 2018 and was completed in mid-2019. Routine progress monitoring of groundwater and soil gas continue on-site and off-site.
Approximately $78,000 was spent to date on remediation, project management, regulatory oversight, and investigative and feasibility study activities. The company currently estimates that these activities will give rise to an additional $3,400 to $17,000 . Project management and regulatory oversight include costs incurred by project consultants for project management and costs billed by DTSC to provide regulatory oversight.
Despite the amount of work undertaken and planned to date, the company is unable to estimate any potential costs in addition to those discussed above because the complete scope of the work under the RAP is not yet known, and, accordingly, the associated costs have yet to be determined.
Other
During 2021 and 2020, the company received $12,477 and $2,369 , respectively, in settlement funds in connection with claims filed against certain manufacturers of aluminum, tantalum, and film capacitors who allegedly colluded to fix the price of capacitors from 2001 through 2014. These amounts were recorded as a reduction to “Selling, general, and administrative
68
expenses” in the company’s consolidated statements of operations. The company has related on-going disputes with other manufacturers and may receive additional funds in the future. The company is unable to estimate additional amounts that may be received in the future and as such has not recorded a receivable at this time.
During 2020, the company recorded reserves and other adjustments of approximately $32,700 primarily related to foreign tax and other loss contingencies. These reserves are principally associated with transactional taxes on activity from several prior years, not significant to any one year.
In 2019, the company determined that from 2015 to 2019 a limited number of non-executive employees, without first obtaining required authorization from the company or the United States government, had facilitated product shipments with an aggregate total invoiced value of approximately $4,770 , to resellers for reexports to persons covered by the Iran Threat Reduction and Syria Human Rights Act of 2012 or other United States sanctions and export control laws. The company has voluntarily reported these activities to the United States Treasury Department's Office of Foreign Assets Control (“OFAC”) and the United States Department of Commerce's Bureau of Industry and Security (“BIS”), and conducted an internal investigation and terminated or disciplined the employees involved. BIS has closed its investigation and issued the company a warning letter without referring the matter for further proceedings. No penalties have been imposed by BIS. The company has cooperated fully and intends to continue to cooperate fully with OFAC with respect to its review, which may result in the imposition of penalties, which the company is currently not able to estimate.
16. Segment and Geographic Information
The company is a global provider of products, services, and solutions to industrial and commercial users of electronic components and enterprise computing solutions. The company distributes electronic components to original equipment manufacturers and contract manufacturers through its global components business segment and provides enterprise computing solutions to value-added resellers and managed service providers through its global ECS business segment. As a result of the company's philosophy of maximizing operating efficiencies through the centralization of certain functions, selected fixed assets and related depreciation, as well as borrowings, are not directly attributable to the individual operating segments and are included in the corporate business segment.
Sales, by segment by geographic area, are as follows:
| 2021 | 2020 | 2019 | ||||||||||||||||||
| Components: | ||||||||||||||||||||
| Americas | $ | $ | $ | |||||||||||||||||
| EMEA | ||||||||||||||||||||
| Asia/Pacific | ||||||||||||||||||||
| Global components | $ | $ | $ | |||||||||||||||||
| ECS: | ||||||||||||||||||||
| Americas | $ | $ | $ | |||||||||||||||||
| EMEA | ||||||||||||||||||||
| Global ECS | $ | $ | $ | |||||||||||||||||
| Consolidated | $ | $ | $ | |||||||||||||||||
69
The company operates in more than 90 countries worldwide. Sales to unaffiliated customers are based on the company location that maintains the customer relationship and transacts the external sale. The following tables set forth sales information where individual countries represent a material portion of the total:
| 2021 | 2020 | 2019 | |||||||||||||||
| Sales: | |||||||||||||||||
| China and Hong Kong | $ | $ | $ | ||||||||||||||
| Germany | |||||||||||||||||
| Other | |||||||||||||||||
| Total foreign | $ | $ | $ | ||||||||||||||
| United States | |||||||||||||||||
| Total | $ | $ | $ | ||||||||||||||
Operating income (loss), by segment, are as follows:
| 2021 | 2020 | 2019 | |||||||||||||||
| Operating income (loss): | |||||||||||||||||
| Global components (a) | $ | $ | $ | ( | |||||||||||||
| Global ECS (b) | |||||||||||||||||
| Corporate (c) | ( | ( | ( | ||||||||||||||
| Consolidated | $ | $ | $ | ||||||||||||||
(a) Global components operating income includes $12,477 and $2,369 related to proceeds from legal settlements for 2021 and 2020, respectively, (refer to Note 15) and $4,482 in impairment charges related to various long-lived assets for 2021. Global components operating income for 2019 includes restructuring, integration, and other charges of $10,778 , a loss on disposition of businesses, net, of $19,384 , impairments of $698,246 , a non-recurring charge of $22,332 related to a subset of inventory held by its digital business, and a non-recurring charge of $18,037 related to the receivables and inventory of its financing solutions business.
(b) Global ECS operating income for 2020 includes reserves and other adjustments of approximately $29,858 primarily related to foreign tax and other loss contingencies. These reserves are principally associated with transactional taxes on activity from several prior years, not significant to any one year. Global ECS operating income for 2020 also includes $4,918 in impairment charges related to various long-lived assets.
(c) Corporate operating income for the years 2021, 2020, and 2019 includes restructuring, integration, and other charges (credits) of $10,911 , $13,288 , and $79,007 , respectively. Also included in 2019 was a net loss on the disposition of businesses of $1,868 . Corporate operating income for 2020 includes $2,305 of impairment charges related to various long-lived assets.
Total assets, by segment, at December 31 are as follows:
| 2021 | 2020 | |||||||||||||
| Total assets: | ||||||||||||||
| Global components | $ | $ | ||||||||||||
| Global ECS | ||||||||||||||
| Corporate | ||||||||||||||
| Consolidated | $ | $ | ||||||||||||
The following tables set forth long-lived asset information where individual countries represent a material portion of the total:
| 2021 | 2020 | ||||||||||
| Long-lived assets: | |||||||||||
| Netherlands | $ | $ | |||||||||
| Other | |||||||||||
| Total foreign | $ | $ | |||||||||
| United States | |||||||||||
| Total | $ | $ | |||||||||
70
Item 9. Changes in and Disagreements with Accountants on Accounting and Financial Disclosure.
None.
Item 9A. Controls and Procedures.
Evaluation of Disclosure Controls and Procedures
The company's management, under the supervision and with the participation of the company's Chief Executive Officer and Chief Financial Officer, carried out an evaluation of the effectiveness of the design and operation of the company's disclosure controls and procedures as of December 31, 2021 (the “Evaluation”). Based upon the Evaluation, the company's Chief Executive Officer and Chief Financial Officer concluded that the company's disclosure controls and procedures (as defined in Rule 13a-15(e) of the Securities Exchange Act of 1934) are effective.
Management's Report on Internal Control Over Financial Reporting
The company's management is responsible for establishing and maintaining adequate “internal control over financial reporting” (as defined in Exchange Act Rules 13a-15(f) and 15d-15(f)). Management evaluates the effectiveness of the company's internal control over financial reporting using the criteria set forth by the Committee of Sponsoring Organizations of the Treadway Commission (2013 framework). Management, under the supervision and with the participation of the company's Chief Executive Officer and Chief Financial Officer, assessed the effectiveness of the company's internal control over financial reporting as of December 31, 2021, and concluded that it is effective.
The company's independent registered public accounting firm, Ernst & Young LLP, has audited the effectiveness of the company's internal control over financial reporting as of December 31, 2021, as stated in their report, which is included herein.
71
Report of Independent Registered Public Accounting Firm
To the Shareholders and the Board of Directors of Arrow Electronics, Inc.
Opinion on Internal Control Over Financial Reporting
We have audited Arrow Electronics, Inc.’s internal control over financial reporting as of December 31, 2021, based on criteria established in Internal Control—Integrated Framework issued by the Committee of Sponsoring Organizations of the Treadway Commission (2013 framework) (the COSO criteria). In our opinion, Arrow Electronics, Inc. (the Company) maintained, in all material respects, effective internal control over financial reporting as of December 31, 2021, based on the COSO criteria.
We also have audited, in accordance with the standards of the Public Company Accounting Oversight Board (United States) (PCAOB), the consolidated balance sheets of the Company as of December 31, 2021 and 2020, the related consolidated statements of operations, comprehensive income (loss), equity and cash flows for each of the three years in the period ended December 31, 2021, and the related notes and schedule and our report dated February 11, 2022 expressed an unqualified opinion thereon.
Basis for Opinion
The Company’s management is responsible for maintaining effective internal control over financial reporting and for its assessment of the effectiveness of internal control over financial reporting included in the accompanying Management’s Report on Internal Control Over Financial Reporting. Our responsibility is to express an opinion on the Company’s internal control over financial reporting based on our audit. We are a public accounting firm registered with the PCAOB and are required to be independent with respect to the Company in accordance with the U.S. federal securities laws and the applicable rules and regulations of the Securities and Exchange Commission and the PCAOB.
We conducted our audit in accordance with the standards of the PCAOB. Those standards require that we plan and perform the audit to obtain reasonable assurance about whether effective internal control over financial reporting was maintained in all material respects.
Our audit included obtaining an understanding of internal control over financial reporting, assessing the risk that a material weakness exists, testing and evaluating the design and operating effectiveness of internal control based on the assessed risk, and performing such other procedures as we considered necessary in the circumstances. We believe that our audit provides a reasonable basis for our opinion.
Definition and Limitations of Internal Control Over Financial Reporting
A Company’s internal control over financial reporting is a process designed to provide reasonable assurance regarding the reliability of financial reporting and the preparation of financial statements for external purposes in accordance with generally accepted accounting principles. A Company’s internal control over financial reporting includes those policies and procedures that (1) pertain to the maintenance of records that, in reasonable detail, accurately and fairly reflect the transactions and dispositions of the assets of the Company; (2) provide reasonable assurance that transactions are recorded as necessary to permit preparation of financial statements in accordance with generally accepted accounting principles, and that receipts and expenditures of the Company are being made only in accordance with authorizations of management and directors of the Company; and (3) provide reasonable assurance regarding prevention or timely detection of unauthorized acquisition, use, or disposition of the Company’s assets that could have a material effect on the financial statements.
Because of its inherent limitations, internal control over financial reporting may not prevent or detect misstatements. Also, projections of any evaluation of effectiveness to future periods are subject to the risk that controls may become inadequate because of changes in conditions, or that the degree of compliance with the policies or procedures may deteriorate.
/s/ Ernst & Young LLP
February 11, 2022
72
Item 9B. Other Information.
None.
Item 9C. Disclosure Regarding Foreign Jurisdictions that Prevent Inspections.
None.
PART III
Item 10. Directors, Executive Officers and Corporate Governance.
See “Executive Officers” in Part I of this Annual Report on Form 10-K. In addition, the information set forth under the heading “Election of Directors” in the company's Proxy Statement, filed in connection with the 2022 Annual Meeting of Shareholders ("Proxy Statement"), is incorporated herein by reference. The company will provide disclosure of delinquent Section 16(a) reports, if any, in our Proxy Statement, and such disclosure, if any, is incorporated herein by reference.
Information about the company's audit committee is set forth under the heading “The Board and its Committees” in the company's Proxy Statement, is incorporated herein by reference.
Information about the company's code of ethics governing the Chief Executive Officer, Chief Financial Officer, and Corporate Controller, known as the “Finance Code of Ethics,” as well as a code of ethics governing all employees, known as the “Worldwide Code of Business Conduct and Ethics,” is available free of charge on the company's website at investor.arrow.com in the Leadership and Governance section and is available in print to any shareholder upon request.
Information about the company's “Corporate Governance Guidelines” and written committee charters for the company's Audit Committee, Compensation Committee, and Corporate Governance Committee is available free of charge on the company's website at investor.arrow.com in the Leadership and Governance section and is available in print to any shareholder upon request.
Item 11. Executive Compensation.
The information required by Item 11 is included in the company's Proxy Statement, and is incorporated herein by reference.
Item 12. Security Ownership of Certain Beneficial Owners and Management and Related Stockholder Matters.
The information required by Item 12 is included in the company's Proxy Statement, and is incorporated herein by reference.
For the information required by item 201(d) of Regulation S-K, refer to Item 5 in this report.
Item 13. Certain Relationships and Related Transactions, and Director Independence.
The information required by Item 13 is included in the company's Proxy Statement, and is incorporated herein by reference.
Item 14. Principal Accounting Fees and Services.
The information required by Item 14 is included in the company's Proxy Statement, and is incorporated herein by reference.
73
PART IV
Item 15. Exhibits and Financial Statement Schedules.
| (a) | The following documents are filed as part of this report: | Page | |||||||||
| 1 | Financial Statements. | ||||||||||
Report of Independent Registered Public Accounting Firm (PCAOB ID: | |||||||||||
| Consolidated Statements of Operations for the years ended December 31, 2021, 2020, and 2019 | |||||||||||
| Consolidated Statements of Comprehensive Income for the years ended December 31, 2021, 2020, and 2019 | |||||||||||
| Consolidated Balance Sheets as of December 31, 2021 and 2020 | |||||||||||
| Consolidated Statements of Cash Flows for the years ended December 31, 2021, 2020, and 2019 | |||||||||||
| Consolidated Statements of Equity for the years ended December 31, 2021, 2020, and 2019 | |||||||||||
Notes to the Consolidated Financial Statements | |||||||||||
| 2 | Financial Statement Schedule. | ||||||||||
| Schedule II - Valuation and Qualifying Accounts | |||||||||||
| All other schedules are omitted since the required information is not present, or is not present in amounts sufficient to require submission of the schedule, or because the information required is included in the consolidated financial statements, including the notes thereto. | |||||||||||
| 3 | Exhibits. | ||||||||||
| See Index of Exhibits included on pages 76 - 80 | |||||||||||
74
ARROW ELECTRONICS, INC.
SCHEDULE II - VALUATION AND QUALIFYING ACCOUNTS
(In thousands)
| Balance at beginning of year | Charged to income | Other (a) | Write-down | Balance at end of year | ||||||||||||||||||||||||||||||||||||||||
| Allowance for doubtful accounts: | ||||||||||||||||||||||||||||||||||||||||||||
| Year ended December 31, 2021 | $ | $ | $ | ( | $ | $ | ||||||||||||||||||||||||||||||||||||||
| Year ended December 31, 2020 | $ | $ | $ | $ | $ | |||||||||||||||||||||||||||||||||||||||
| Year ended December 31, 2019 | $ | $ | $ | ( | $ | $ | ||||||||||||||||||||||||||||||||||||||
75
INDEX OF EXHIBITS
| Exhibit Number | Exhibit | |||||||
76
77
78
79
| 101.SCH* | Inline XBRL Taxonomy Extension Schema Document. | |||||||
| 101.CAL* | Inline XBRL Taxonomy Extension Calculation Linkbase Document. | |||||||
| 101.LAB* | Inline XBRL Taxonomy Extension Label Linkbase Document. | |||||||
| 101.PRE* | Inline XBRL Taxonomy Extension Presentation Linkbase Documents. | |||||||
| 101.DEF* | Inline XBRL Taxonomy Definition Linkbase Document. | |||||||
| 104* | Cover Page Interactive Data File (formatted as Inline XBRL and contained in Exhibit 101). | |||||||
* : Filed herewith.
** : Furnished herewith.
† : Certain portions of this exhibit have been redacted in accordance with Item 601(b)(10) of Regulation S-K.
+ : Indicates a management contract or compensatory plan or arrangement.
Item 16. Form 10-K Summary.
None.
80
SIGNATURES
Pursuant to the requirements of Section 13 or 15(d) of the Securities Exchange Act of 1934, the registrant has duly caused this report to be signed on its behalf by the undersigned, thereunto duly authorized.
| ARROW ELECTRONICS, INC. | ||||||||||||||
| Date: | February 11, 2022 | By: | /s/ Carine Jean-Claude | |||||||||||
| Carine Jean-Claude | ||||||||||||||
| Senior Vice President, Chief Legal Officer and Secretary | ||||||||||||||
POWER OF ATTORNEY
Each person whose signature appears below constitutes and appoints Mike J. Long and Chris D. Stansbury, and each of them, as his or her true and lawful attorney-in-fact and agent, with full power of substitution and resubstitution, for him or her and in his or her name, place and stead, in any and all capacities, to sign any and all amendments to this Annual Report on Form 10-K, and to file the same, with all exhibits thereto, and other documents in connection therewith, with the Securities and Exchange Commission, granting unto said attorneys-in-fact and agents, and each of them, full power and authority to do and perform each and every act and thing requisite and necessary to be done in connection therewith, as fully to all intents and purposes as he or she might or could do in person, hereby ratifying and confirming all that said attorneys-in-fact and agents, or any of them, or their or his substitutes, may lawfully do or cause to be done by virtue thereof.
Pursuant to the requirements of the Securities Exchange Act of 1934, this report has been signed below by the following persons on behalf of the registrant and in the capacities and on the dates indicated:
| Signature | Title | Date | ||||||||||||
| By: | /s/ Michael J. Long | Chairman, President, and Chief Executive Officer (principal executive officer) | February 11, 2022 | |||||||||||
| Michael J. Long | ||||||||||||||
| By: | /s/ Chris D. Stansbury | Senior Vice President and Chief Financial Officer (principal financial officer) | February 11, 2022 | |||||||||||
| Chris D. Stansbury | ||||||||||||||
| By: | /s/ Richard A. Seidlitz | Corporate Controller (principal accounting officer) | February 11, 2022 | |||||||||||
| Richard A. Seidlitz | ||||||||||||||
| By: | /s/ Barry W. Perry | Lead Independent Director | February 11, 2022 | |||||||||||
| Barry W. Perry | ||||||||||||||
| By: | /s/ William F. Austen | Director | February 11, 2022 | |||||||||||
| William F. Austen | ||||||||||||||
| By: | /s/ Fabian Garcia | Director | February 11, 2022 | |||||||||||
| Fabian Garcia | ||||||||||||||
| By: | /s/ Steven H. Gunby | Director | February 11, 2022 | |||||||||||
| Steven H. Gunby | ||||||||||||||
| By: | /s/ Gail E. Hamilton | Director | February 11, 2022 | |||||||||||
| Gail E. Hamilton | ||||||||||||||
| By: | /s/ Richard S. Hill | Director | February 11, 2022 | |||||||||||
| Richard S. Hill | ||||||||||||||
| By: | /s/ Andrew C. Kerin | Director | February 11, 2022 | |||||||||||
| Andrew C. Kerin | ||||||||||||||
81
| By: | /s/ Laurel J. Krzeminski | Director | February 11, 2022 | |||||||||||
| Laurel J. Krzeminski | ||||||||||||||
| By: | /s/ Carol Lowe | Director | February 11, 2022 | |||||||||||
| Carol Lowe | ||||||||||||||
| By: | /s/ Stephen C. Patrick | Director | February 11, 2022 | |||||||||||
| Stephen C. Patrick | ||||||||||||||
| By: | /s/ Gerry P. Smith | Director | February 11, 2022 | |||||||||||
| Gerry P. Smith | ||||||||||||||
82
Serious News for Serious Traders! Try StreetInsider.com Premium Free!
You May Also Be Interested In
- Arrow Electronics (ARW) Announces Upcoming Resignation of Board Chair Fabian Garcia
- Flat Steel Market Projected to Surpass USD 861.07 Billion by 2031 Due to Surging Demand Across Industries
- LALAL.AI Launches Voice Changer, an AI Tool That Modifies Any Voice to Sound Like a Star
Create E-mail Alert Related Categories
SEC FilingsSign up for StreetInsider Free!
Receive full access to all new and archived articles, unlimited portfolio tracking, e-mail alerts, custom newswires and RSS feeds - and more!
