

Form N-CSRS FPA CAPITAL FUND INC For: Sep 30
 Tweet
Tweet Share
Share
UNITED STATES
SECURITIES AND EXCHANGE COMMISSION
Washington, D.C. 20549
FORM N-CSR
CERTIFIED SHAREHOLDER REPORT OF REGISTERED
MANAGEMENT INVESTMENT COMPANIES
|
Investment Company Act file number |
811-01596 | ||||||||
|
| |||||||||
|
FPA CAPITAL FUND, INC. | |||||||||
|
(Exact name of registrant as specified in charter) | |||||||||
|
| |||||||||
|
11601 WILSHIRE BLVD., STE. 1200 LOS ANGELES, CALIFORNIA |
|
90025 | |||||||
|
(Address of principal executive offices) |
|
(Zip code) | |||||||
|
| |||||||||
|
(Name and Address of Agent for Service) |
Copy to: | ||||||||
|
|
| ||||||||
|
J. RICHARD ATWOOD, PRESIDENT FPA CAPITAL FUND, INC. 11601 WILSHIRE BLVD., STE. 1200 LOS ANGELES, CALIFORNIA 90025 |
MARK D. PERLOW, ESQ. DECHERT LLP ONE BUSH STREET, STE. 1600 SAN FRANCISCO, CA 94104 | ||||||||
|
| |||||||||
|
Registrant’s telephone number, including area code: |
(310) 473-0225 |
| |||||||
|
| |||||||||
|
Date of fiscal year end: |
March 31 |
| |||||||
|
| |||||||||
|
Date of reporting period: |
September 30, 2018 |
| |||||||
Item 1: Report to Shareholders.
FPA Capital Fund, Inc.
Semi-Annual Report
September 30, 2018

Distributor:
UMB DISTRIBUTION SERVICES, LLC
235 West Galena Street
Milwaukee, Wisconsin 53212
FPA CAPITAL FUND, INC.
LETTER TO SHAREHOLDERS
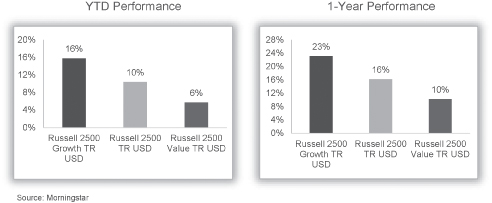
The FPA Capital Fund, Inc. ("Fund") returned 0.61% (net) in the third quarter of 2018, 1.28% (net) calendar year-to-date and 3.15% (net) for the one year period.
As we wrote in our last quarterly letter, even though the Russell 2500 index's calendar year-to-date performance is strong at 10.41%, most of that performance is coming from Russell 2500 Growth stocks. The Russell 2500 Value index is up only 5.75% for the calendar year-to-date period.
Our Commitment to Fellow Shareholders
September 30, 2018 marked the first anniversary of the portfolio management change initiatives we instituted. The changes we committed to were:
1. Avoid position inertia
2. Be more nimble
3. Differentiate between long-term and opportunistic investments
We are happy to announce that all the changes we set out to enact are now behind us. We have completed the restructure of the portfolio; we are being more nimble, with increased attention to adjusting position sizing when there are changes in our analysis and/or the risk/reward profile; and we have increased the quality1 of the portfolio positions. The only exception is our continued elevated exposure to energy names.
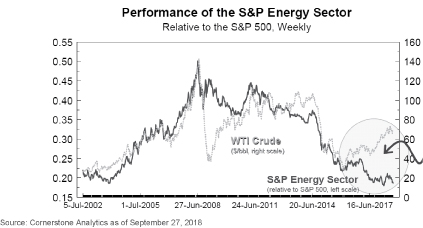
Despite crude prices increasing by 36% since the beginning of 2017 through the 3Q 2018, equity securities in the energy sector have failed to match that performance. As one would expect, the market price of oil has historically been the key driver of energy-related equity security performance, yet energy sector returns relative to the S&P 500 remain near a 15-year low despite the appreciation in oil prices. In fact, the energy sector's relative performance is weaker than it was in 2016, when the price of West Texas Intermediate (WTI) crude was below $30/barrel! We believe this disconnect offers a margin of safety that seems to be dismissed by the market.2
1 Please refer to the 1Q 2018 and 2Q 2018 Commentaries for more detail on the quality rankings we have implemented. In general, a company's quality score reflects our historic investment framework (e.g., market leadership, history of profitability, solid balance sheets, and strong management teams) as well as including industry-related aspects such as competitive strengths and weaknesses.
2 Cornerstone Analytics, Sept. 10, 2018.
1
FPA CAPITAL FUND, INC.
LETTER TO SHAREHOLDERS
(Continued)
Western Digital Corporation (NASDAQ: WDC):3
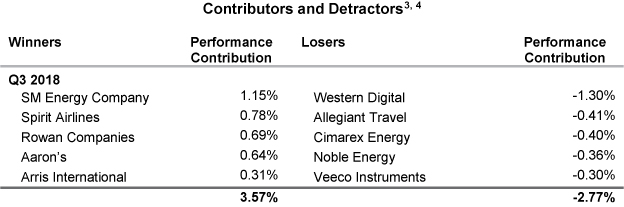
Western Digital's stock price was down 23.73% in the third quarter of 2018 and was the largest detractor of performance for the Fund this quarter. Whenever we see such a big move, we like to take a step back and
3 Reflects the top contributors and top detractors to the Fund's performance based on contribution to return for the quarter. Contribution is presented gross of investment management fees, transactions costs, and Fund operating expenses, which if included, would reduce the returns presented. The information provided does not reflect all positions purchased, sold or recommended by FPA during the quarter. A copy of the methodology used and a list of every holding's contribution to the overall Fund's performance during the quarter is available by contacting FPA at [email protected]. It should not be assumed that recommendations made in the future will be profitable or will equal the performance of the securities listed. Past performance is no guarantee, nor is it indicative, of future results. Please see Important Disclosures at the end of this commentary.
4 References to individual securities are for informational purposes only and should not be construed as recommendations by the Fund, the portfolio manager, FPA, or the Distributor. It should not be assumed that future investments will be profitable or will equal the performance of the security examples discussed. The portfolio holdings as of the most recent quarter-end may be obtained at www.fpa.com.
2
FPA CAPITAL FUND, INC.
LETTER TO SHAREHOLDERS
(Continued)
reevaluate our investment thesis. As part of that process, we seek a deep understanding of the bear case, such that we can articulate the bear case even better than the bears can — a process known as 'straw manning'.5 If we truly understand the bear case and can pose cogent arguments against its core points, we think this presents a good long-term investment opportunity. So, let us walk through the bear case as we see it:
1. Past NAND memory cycles6 are a useful guide for today's environment.
2. Gross margins cratered during past down cycles and we believe they are likely to crater again.
3. Collapsing gross margins suggest falling earnings and that the stock will follow earnings lower.
4. If the stock is so cheap, why isn't the company buying back shares?
The bear case, as presented, certainly sounds compelling, and many investors have obviously subscribed to it given the stock's recent performance. But let us examine each of the arguments.
Past NAND cycles are a useful guide for today's environment
We see several reasons to believe the current NAND cycle is different from the past. First, NAND end-markets are substantially more diversified than in the past. In 2009, nearly 80% of NAND bits went to removable products (e.g. camera flash drives).7 Today, three new end-markets, Enterprise solid state drives ("SSDs"), Client SSDs, and Mobile comprise over 80% of bit demand and each represents over 20% of the total.8 Today's those diversified end-markets should help limit cyclicality of the business. Second, today's products are less commodity-like than in the past. As a reminder, Western Digital is not just selling raw NAND flash, it is selling SSDs, and these products generally require more intellectual property and carry better margins. As Western Digital sits higher up in the value chain, we expect the business to perform better than a pure commodity business. Third, we believe long-term secular demand drivers are robust. Data storage is at the center of multiple megatrends (e.g., internet of things, surveillance, big data, analytics, artificial intelligence, cloud computing, etc.), and we think strong underlying demand should help rebalance any temporary supply/demand imbalance that arises. Fourth, the technology has become harder to scale, and that has placed a ceiling on potential supply growth. From 2004 to 2008, 'bits shipped' grew at nearly a 200% CAGR.9 That CAGR has fallen to closer to 35-45% from 2013-2017.10 This cap on bit supply growth, when paired with strong demand, fundamentally limits how far out of balance the market can get, and we believe that is a key difference compared to past cycles. And fifth, manufacturers are already acting rationally by curbing supply in the face of slowing demand. That was not always the case. On Western Digital's last earnings conference call, Chief Operating Officer Mike Cordano spoke to this point directly, telling analysts: "We are in discussions with Toshiba Memory Corporation, our joint venture partner, to moderate the near-term pace of capital investments."11 Bottom line, for all of these reasons, we think the current NAND cycle is likely to be less harsh than the past cycles that bearish analysts may be using to formulate their views.
5 https://en.wikipedia.org/wiki/Straw_man
6 NAND is a type of non-volatile memory. The memory business, like many businesses, has a business cycle of good times and bad times.
7 Micron Investor Day, May 21, 2018. HDD and "SSD Primer: Demand for Capacity to Drive Long-Term Growth," Deutche Bank, April 12, 2016. Analyst estimates.
8 Micron Investor Day Presentation — 05/21/18
9 Compound annual growth rate.
10 Seagate Presentation — Mission Impossible: Surviving Today's Flood of Critical Data — August 2017
11 4Q 2018 Earnings conference call.
3
FPA CAPITAL FUND, INC.
LETTER TO SHAREHOLDERS
(Continued)
Gross margins cratered during past down cycles and they are likely to crater again
While it is true that gross margins have declined meaningfully from peak-to-trough in past cycles, for the most recent cycle, the fall in gross margins was capped at about 15 percentage points (as shown in the chart below). The one glaring exception to this trend came during the financial crisis. Our view is that given all of the positive structural changes in the industry discussed above, the industry is very unlikely to see a fall in gross margins anywhere near what we saw in 2009. Instead, we expect gross margins to fall a few percentage points in each of the next several quarters while the market rebalances. One final point: As you might expect for an industry whose quality is improving, we see a general up-trend in gross margin with each subsequent cycle (higher highs and higher lows).

Collapsing gross margins means falling earnings & the stock price will follow earnings lower
If we look at past cycles, it is really no surprise that earnings per share ("EPS") tends to follow gross margins lower. However, as shown in the charts below, the stock price doesn't always head lower when EPS is temporarily pressured by the down-cycle. In fact, during the gross margin compression cycle from 2010 to 2012, the stock mostly traded sideways. Furthermore, the stock bottomed almost two full quarters before gross margin, and even kicked off a sustained rally while gross margins continued to fall. Said another way, even though we agree that gross margins and EPS are heading lower near-term, that does not mean the stock will continue to trend down as well.
4
FPA CAPITAL FUND, INC.
LETTER TO SHAREHOLDERS
(Continued)

In addition, if the stock is so cheap, why is the company not buying back shares?
The company did virtually no buybacks over the previous two years, but there were good reasons for that. First, the company was in the midst of its dispute with Toshiba (its joint venture partner).12 This dispute is behind them now. Second, the company's debt level increased to almost $17 billion after its acquisition of SanDisk Corporation in May 2016. Since then, the company has not only decreased its gross debt level to $11 billion, but also cut its annual interest expense by over 40% via debt pay down and successful refinancing.13 The improved operational performance, coupled with the reduced interest payments, has bolstered Western Digital's free cash flow to over $3.3 billion over the last 12 months14.
Following these improvements in the balance sheet and free cash flow generation, the company repurchased over $430 million worth of shares (nearly 2% of shares outstanding) in the second calendar quarter of 2018. It also announced a $5 billion repurchase authorization15 — which, if executed at today's share price, would shrink the share count by nearly a third. Furthermore, we estimate that Western Digital has already repurchased nearly 5 million shares through the first half of 3Q2018, based on disclosures in its most recent 10-K. This would put the company on pace to repurchase ~3% of shares outstanding in the current quarter alone. We believe these repurchases will be accretive to long-term shareholders and we applaud the move as a sound capital allocation decision.
When we evaluate the bear case, we take issue with essentially all of its core arguments. Additionally, the bear case entirely ignores what we believe to be a compelling current valuation for Western Digital. On a trailing 12-month basis through FY18'4Q, the stock trades at a 3.8x adj P/E and a 4.2x EBITDA multiple, and on a forward-basis it trades at a 5.0x adj P/E and a 3.7x EBITDA multiple (as of October 17, 2018). These are multiples typically reserved for dying businesses with no terminal value. In our view, they are not applicable to a thriving,
12 https://www.bloomberg.com/news/articles/2017-12-12/toshiba-western-digital-settle-fight-over-chip-unit-sale
13 WDC's 4Q18 Earnings release — 07/26/18
14 WDC's 4Q18 Earnings release — 07/26/18
15 WDC's 4Q18 Earnings release — 07/26/18
5
FPA CAPITAL FUND, INC.
LETTER TO SHAREHOLDERS
(Continued)
growing business like Western Digital. Furthermore, even if estimates continue to fall, we believe these low multiples provide a margin of safety for our investment.
Now let us take a look back at our history with this stock. We have owned Western Digital stock and traded around our position very successfully for over a decade (as shown in the chart below). Historically, the market has provided us with many opportunities to take advantage of short-term pessimism and euphoria, and we have tended to capitalize on those periods. We believe the stock's decline over the last few quarters represents the latest wave of pessimism. During this period, we have added to our position substantially, and we feel strongly that the downturn has presented us with yet another compelling opportunity with a company we know very well.

Spirit Airlines, Inc. (NYSE: SAVE)3
One of the largest contributors during the third quarter was Spirit Airlines (NYSE: SAVE). SAVE is an ultra-low-cost airline offering flights throughout the United States, as well as to and from the Caribbean, Mexico, Central America, and South America. We invested in SAVE because of its industry-leading cost advantage, which allows the airline to sustainably offer lower fares than peers at margins that support attractive, full-cycle returns on capital. Further, while the ultra-low-cost model clearly offers value to consumers, we believe it still represents only a small portion of domestic capacity, providing a long-term 'runway' for future growth.
6
FPA CAPITAL FUND, INC.
LETTER TO SHAREHOLDERS
(Continued)
Our thesis at initial purchase (3Q 2017) was that the share price was reflecting unsustainably low fares driven by high near-term industry capacity growth rates. We believe there also were exaggerated fears that SAVE's leading unit-cost advantage was in jeopardy due to the renegotiation of a compensation contract with the pilot's union. Since our initial investment, SAVE executed a multi-year pilot compensation contract that did not adversely affect their unit cost advantage.
Additionally, the industry — including SAVE — has started to dial back on domestic capacity growth as a way to improve revenue yields in light of higher fuel costs (which are still well below our valuation assumptions). In addition to providing improved yield management, the decline in competitive capacity growth has had a positive effect on investor sentiment towards the airline space.
We generally view airlines as opportunistic investments as opposed to core long-term holdings. As such, we have been aggressive in taking chips off the table as the share price has approached our estimate of intrinsic value. The chart below illustrates how we have managed position sizing since our initial investment.

7
FPA CAPITAL FUND, INC.
LETTER TO SHAREHOLDERS
(Continued)
Scariest chart I saw this quarter:16

The national debt of the United States recently surpassed $21 trillion for the first time as compared to 2Q 2018 annualized GDP of $20 trillion.17 Accordingly, government interest expenditures jumped to almost $550 billion a year. With expected trillion-dollar-plus annual budget deficits for many years to come, the national debt will continue to break one record after another.
The budget office projects that government interest expenditures will match military spending by 2023. However, that assumes that interest rates remain near today's levels and that GDP continues to grow unabated at 2% to 3% per year. A rate increase of just a few hundred basis points from today's historically low levels could more than double annual interest costs.
So far, the nation's escalating leverage has had a relatively benign impact on the economy and markets — but that cannot last indefinitely. We suspect the continued normalization of interest rates, a recession, or some other factor could tip the balance, so we continue to take a cautious view on the equity market. We believe our bottom-up valuation work offers added protection.
In Conclusion
The market continues to be very expensive. The Russell 2500 is trading at a 30.0x earnings multiple despite many economic and geopolitical risks. We remain disciplined, and the Fund is only 70.7% long. The Fund's portfolio's earnings multiple is 16.8% lower than that of the index and its price-to-book is 0.7% lower despite a 2.6% higher return on equity. We remain disciplined contrarian investors. We believe many of the Fund's portfolio companies' stock prices are like a coiled spring waiting to be sprung. Hence, we remain excited about the Fund's portfolio prospectively despite our cautious tone about the overall stock market.
16 https://fred.stlouisfed.org/series/A091RC1Q027SBEA
17 https://apps.bea.gov/iTable/iTable.cfm?reqid=19&step=2#reqid=19&step=2&isuri=1&1921=survey
8
FPA CAPITAL FUND, INC.
LETTER TO SHAREHOLDERS
(Continued)
We thank you for your support and appreciate the trust you have placed in us.
Sincerely,

Arik Ahitov
Portfolio Manager
September 30, 2018
Important Disclosures
You should consider the Fund's investment objectives, risks, and charges and expenses carefully before you invest. The Prospectus details the Fund's objective and policies and other matters of interest to the prospective investor. Please read this Prospectus carefully before investing. The Prospectus may be obtained by visiting the website at www.fpa.com, by calling toll-free, 1-800-982-4372, or by contacting the Fund in writing.
Past performance is no guarantee of future results and current performance may be higher or lower than the performance shown. This data represents past performance and investors should understand that investment returns and principal values fluctuate, so that when you redeem your investment it may be worth more or less than its original cost. The Fund's expense ratio as of its most recent prospectus is 0.80%. Current month-end performance data may be obtained at www.fpa.com or by calling toll-free, 1-800-982-4372.
Mr. Ahitov was named sole portfolio manager effective October 1, 2017. Dennis Bryan and Arik Ahitov had been co-portfolio managers since November 2007 and February 2014, respectively, and managed the Fund in a manner that is substantially similar to the prior portfolio manager, Robert Rodriguez. Mr. Rodriguez ceased serving as the Fund's portfolio manager effective December 2010.
The views expressed herein and any forward-looking statements are as of the date of the publication and are those of the portfolio management team. Future events or results may vary significantly from those expressed and are subject to change at any time in response to changing circumstances and industry developments. This information and data has been prepared from sources believed reliable, but the accuracy and completeness of the information cannot be guaranteed and is not a complete summary or statement of all available data.
Portfolio composition will change due to ongoing management of the Fund. References to individual securities are for informational purposes only and should not be construed as recommendations by the Fund, the portfolio manager, or the Distributor. It should not be assumed that future investments will be profitable or will equal the performance of the security examples discussed. The portfolio holdings as of the most recent quarter-end may be obtained at www.fpa.com.
Investments in mutual funds carry risks and investors may lose principal value. Stock markets are volatile and can decline significantly in response to adverse issuer, political, regulatory, market, or economic developments. The Fund may purchase foreign securities, including American Depository Receipts (ADRs) and other depository receipts, which are subject to interest rate, currency exchange rate, economic and political risks; this may be enhanced when investing in emerging markets. Small and mid-cap stocks involve greater risks and they can fluctuate in price more than larger company stocks.
9
FPA CAPITAL FUND, INC.
LETTER TO SHAREHOLDERS
(Continued)
Value stocks, including those selected by the Fund's portfolio manager, are subject to the risk that their intrinsic value may never be realized by the market and that their prices may go down. Securities selected by the portfolio manager using a value strategy may never reach their intrinsic value because the market fails to recognize what the portfolio manager considers to be the true business value or because the portfolio manager has misjudged those values. In addition, value style investing may fall out of favor and underperform growth or other styles of investing during given periods.
Definitions
The Russell 2500 Index consists of the 2,500 smallest companies in the Russell 3000 total capitalization universe offers investors access to the small to mid-cap segment of the U.S. equity universe, commonly referred to as "smid" cap. The Russell 2500 Value Index measures the performance of those Russell 2500 companies with lower price-to-book-ratios and lower forecasted growth values.
The S&P 500 Index includes a representative sample of 500 companies in leading industries of the U.S. economy. The Index focuses on the large-cap segment of the market, with over 80% coverage of U.S. equities, but is also considered a proxy for the total market.
Indices are unmanaged, do not reflect any commissions or fees which would be incurred by an investor purchasing the underlying securities. Investors cannot invest directly in an index.
An exploration & production (E&P) company is in a specific sector within the oil and gas industry — companies involved in the high-risk/high-reward area of exploration and production focused on finding, augmenting, producing and merchandising different types of oil and gas.
Margin of safety — Buying with a "margin of safety" is when a security is purchased at a discount to the portfolio manager's estimate of its intrinsic value. Buying a security with a margin of safety is designed to protect against permanent capital loss in the case of an unexpected event or analytical mistake. A purchase made with a margin of safety does not guarantee the security will not decline in price.
Price/Earnings ratio (P/E) is the price of a stock divided by its earnings per share.
West Texas Intermediate (WTI) — crude oil is the underlying commodity of the New York Mercantile Exchange's oil futures contracts.
10
FPA CAPITAL FUND, INC.
PORTFOLIO SUMMARY
September 30, 2018
(Unaudited)
|
Common Stocks |
70.7 |
% |
|||||||||
|
Exploration & Production |
14.0 |
% |
|||||||||
|
Communications Equipment |
9.3 |
% |
|||||||||
|
Oil & Gas Services & Equipment |
8.8 |
% |
|||||||||
|
Airlines |
6.4 |
% |
|||||||||
|
Computer Hardware & Storage |
5.3 |
% |
|||||||||
|
Technology Distributors |
5.1 |
% |
|||||||||
|
Other Common Stocks |
5.0 |
% |
|||||||||
|
Auto Parts |
4.5 |
% |
|||||||||
|
Containers & Packaging |
3.5 |
% |
|||||||||
|
Agricultural Machinery |
3.1 |
% |
|||||||||
|
Banks |
2.4 |
% |
|||||||||
|
Consumer Goods — Rental |
2.0 |
% |
|||||||||
|
Infrastructure Software |
1.3 |
% |
|||||||||
|
Bonds & Debentures |
25.2 |
% |
|||||||||
|
Short-term Investments |
4.7 |
% |
|||||||||
|
Other Assets And Liabilities, Net |
(0.6 |
)% |
|||||||||
|
Net Assets |
100.0 |
% |
|||||||||
11
FPA CAPITAL FUND, INC.
PORTFOLIO OF INVESTMENTS
September 30, 2018
(Unaudited)
|
COMMON STOCKS |
Shares |
Fair Value |
|||||||||
|
EXPLORATION & PRODUCTION — 14.0% |
|||||||||||
|
Cimarex Energy Co. |
201,678 |
$ |
18,743,953 |
||||||||
|
Noble Energy, Inc. |
459,781 |
14,340,570 |
|||||||||
|
SM Energy Co. |
442,962 |
13,966,592 |
|||||||||
|
$ |
47,051,115 |
||||||||||
|
COMMUNICATIONS EQUIPMENT — 9.3% |
|||||||||||
|
ARRIS International plc (a) |
611,247 |
$ |
15,886,310 |
||||||||
|
InterDigital, Inc. |
193,385 |
15,470,800 |
|||||||||
|
$ |
31,357,110 |
||||||||||
|
OIL & GAS SERVICES & EQUIPMENT — 8.8% |
|||||||||||
|
Frank's International NV (Netherlands) (a) |
1,035,870 |
$ |
8,991,352 |
||||||||
|
Patterson-UTI Energy, Inc. |
708,752 |
12,126,747 |
|||||||||
|
Rowan Cos. plc (Class A) (a) |
441,262 |
8,308,963 |
|||||||||
|
$ |
29,427,062 |
||||||||||
|
AIRLINES — 6.4% |
|||||||||||
|
Allegiant Travel Co. |
134,354 |
$ |
17,036,087 |
||||||||
|
Spirit Airlines, Inc. (a) |
93,204 |
4,377,792 |
|||||||||
|
$ |
21,413,879 |
||||||||||
|
COMPUTER HARDWARE & STORAGE — 5.3% |
|||||||||||
|
Western Digital Corporation |
303,319 |
$ |
17,756,294 |
||||||||
|
TECHNOLOGY DISTRIBUTORS — 5.1% |
|||||||||||
|
Arrow Electronics, Inc. (a) |
43,202 |
$ |
3,184,851 |
||||||||
|
Avnet, Inc. |
310,404 |
13,896,787 |
|||||||||
|
$ |
17,081,638 |
||||||||||
|
AUTO PARTS — 4.5% |
|||||||||||
|
Dana, Inc. |
413,784 |
$ |
7,725,347 |
||||||||
|
Gentex Corp. |
346,798 |
7,442,285 |
|||||||||
|
$ |
15,167,632 |
||||||||||
|
CONTAINERS & PACKAGING — 3.5% |
|||||||||||
|
Graphic Packaging Holding Co. |
833,257 |
$ |
11,673,931 |
||||||||
|
AGRICULTURAL MACHINERY — 3.1% |
|||||||||||
|
AGCO Corporation |
171,728 |
$ |
10,439,345 |
||||||||
|
BANKS — 2.4% |
|||||||||||
|
Capitol Federal Financial, Inc. |
639,711 |
$ |
8,149,918 |
||||||||
12
FPA CAPITAL FUND, INC.
PORTFOLIO OF INVESTMENTS (Continued)
September 30, 2018
(Unaudited)
|
COMMON STOCKS — Continued |
Shares or Principal Amount |
Fair Value |
|||||||||
|
CONSUMER GOODS — RENTAL — 2.0% |
|||||||||||
|
Aaron's, Inc. |
126,970 |
$ |
6,914,786 |
||||||||
|
INFRASTRUCTURE SOFTWARE — 1.3% |
|||||||||||
|
Cision Ltd. (a) |
252,214 |
$ |
4,237,195 |
||||||||
| OTHER COMMON STOCKS — 5.0% (a)(b) |
$ |
16,699,741 |
|||||||||
| TOTAL COMMON STOCKS — 70.7% (Cost $200,825,669) |
$ |
237,369,646 |
|||||||||
|
BONDS & DEBENTURES |
|||||||||||
|
U.S. TREASURIES — 25.2% |
|||||||||||
|
U.S. Treasury Notes — 0.75% 7/15/2019 |
$ |
10,000,000 |
$ |
9,859,922 |
|||||||
|
U.S. Treasury Notes — 1.25% 10/31/2018 |
10,000,000 |
9,991,328 |
|||||||||
|
U.S. Treasury Notes — 1.25% 11/30/2018 |
7,500,000 |
7,487,696 |
|||||||||
|
U.S. Treasury Notes — 1.25% 4/30/2019 |
10,000,000 |
9,931,289 |
|||||||||
|
U.S. Treasury Notes — 1.50% 12/31/2018 |
7,500,000 |
7,485,293 |
|||||||||
|
U.S. Treasury Notes — 1.50% 1/31/2019 |
7,500,000 |
7,478,906 |
|||||||||
|
U.S. Treasury Notes — 1.50% 2/28/2019 |
7,500,000 |
7,473,662 |
|||||||||
|
U.S. Treasury Notes — 1.50% 5/31/2019 |
7,500,000 |
7,450,517 |
|||||||||
|
U.S. Treasury Notes — 1.625% 3/31/2019 |
10,000,000 |
9,960,938 |
|||||||||
|
U.S. Treasury Notes — 1.625% 6/30/2019 |
7,500,000 |
7,449,346 |
|||||||||
| TOTAL U.S. TREASURIES (Cost $84,621,076) |
$ |
84,568,897 |
|||||||||
| TOTAL BONDS & DEBENTURES — 25.2% (Cost $84,621,076) |
$ |
84,568,897 |
|||||||||
| TOTAL INVESTMENT SECURITIES — 95.9% (Cost $285,446,745) |
$ |
321,938,543 |
|||||||||
13
FPA CAPITAL FUND, INC.
PORTFOLIO OF INVESTMENTS (Continued)
September 30, 2018
(Unaudited)
|
SHORT-TERM INVESTMENTS — 4.7% |
Principal Amount |
Fair Value |
|||||||||
|
State Street Bank Repurchase Agreement — 0.42% 10/1/2018 (Dated 09/28/2018, repurchase price of $15,874,556, collateralized by $17,155,000 principal amount U.S. Treasury Notes — 2.25% 2027, fair value $16,192,793) |
$ |
15,874,000 |
$ |
15,874,000 |
|||||||
| TOTAL SHORT-TERM INVESTMENTS (Cost $15,874,000) |
$ |
15,874,000 |
|||||||||
| TOTAL INVESTMENTS — 100.6% (Cost $301,320,745) |
$ |
337,812,543 |
|||||||||
|
Other Assets and Liabilities, net — (0.6)% |
(2,088,997 |
) |
|||||||||
|
NET ASSETS — 100.0% |
$ |
335,723,546 |
|||||||||
(a) Non-income producing security.
(b) As permitted by U.S. Securities and Exchange Commission regulations, "Other" Common Stocks include holdings in their first year of acquisition that have not previously been publicly disclosed.
See accompanying Notes to Financial Statements.
14
FPA CAPITAL FUND, INC.
STATEMENT OF ASSETS AND LIABILITIES
September 30, 2018
(Unaudited)
|
ASSETS |
|||||||
|
Investment securities — at fair value (identified cost $285,446,745) |
$ |
321,938,543 |
|||||
|
Short-term investments — at amortized cost (maturities 60 days or less) |
15,874,000 |
||||||
|
Cash |
251,560 |
||||||
|
Receivable for: |
|||||||
|
Investment securities sold |
10,228,975 |
||||||
|
Dividends and interest |
624,375 |
||||||
|
Capital Stock sold |
3,405 |
||||||
|
Prepaid expenses and other assets |
59 |
||||||
|
Total assets |
348,920,917 |
||||||
|
LIABILITIES |
|||||||
|
Payable for: |
|||||||
|
Investment securities purchased |
12,530,484 |
||||||
|
Capital Stock repurchased |
267,160 |
||||||
|
Advisory fees |
183,939 |
||||||
|
Accrued expenses and other liabilities |
215,788 |
||||||
|
Total liabilities |
13,197,371 |
||||||
|
NET ASSETS |
$ |
335,723,546 |
|||||
|
SUMMARY OF SHAREHOLDERS' EQUITY |
|||||||
|
Capital Stock — par value $0.01 per share; authorized 100,000,000 shares; outstanding 9,673,931 shares |
$ |
96,739 |
|||||
|
Additional Paid-in Capital |
289,247,360 |
||||||
|
Distributable Earnings |
46,379,447 |
||||||
|
NET ASSETS |
$ |
335,723,546 |
|||||
|
NET ASSET VALUE |
|||||||
|
Offering and redemption price per share |
$ |
34.70 |
|||||
See accompanying Notes to Financial Statements.
15
FPA CAPITAL FUND, INC.
STATEMENT OF OPERATIONS
For the Six Months Ended September 30, 2018
(Unaudited)
|
INVESTMENT INCOME |
|||||||
|
Dividends |
$ |
1,630,734 |
|||||
|
Interest |
804,969 |
||||||
|
Total investment income |
2,435,703 |
||||||
|
EXPENSES |
|||||||
|
Advisory fees |
1,161,647 |
||||||
|
Director fees and expenses |
100,028 |
||||||
|
Transfer agent fees and expenses |
93,932 |
||||||
|
Legal fees |
68,589 |
||||||
|
Reports to shareholders |
46,140 |
||||||
|
Filing fees |
26,889 |
||||||
|
Audit and tax services fees |
25,125 |
||||||
|
Custodian fees |
13,210 |
||||||
|
Administrative services fees |
9,969 |
||||||
|
Professional fees |
9,069 |
||||||
|
Other |
6,839 |
||||||
|
Total expenses |
1,561,437 |
||||||
|
Net investment income |
874,266 |
||||||
|
NET REALIZED AND UNREALIZED GAIN (LOSS) |
|||||||
|
Net realized gain (loss) on: |
|||||||
|
Investments |
18,073,584 |
||||||
|
Net change in unrealized appreciation (depreciation) of: |
|||||||
|
Investments |
(4,771,355 |
) |
|||||
|
Net realized and unrealized gain |
13,302,229 |
||||||
|
NET INCREASE IN NET ASSETS RESULTING FROM OPERATIONS |
$ |
14,176,495 |
|||||
See accompanying Notes to Financial Statements.
16
FPA CAPITAL FUND, INC.
STATEMENTS OF CHANGES IN NET ASSETS
|
Six Months Ended September 30, 2018 (Unaudited) |
Year Ended March 31, 2018 |
||||||||||
|
INCREASE (DECREASE) IN NET ASSETS |
|||||||||||
|
Operations: |
|||||||||||
|
Net investment income |
$ |
874,266 |
$ |
776,062 |
|||||||
|
Net realized gain |
18,073,584 |
94,543,646 |
|||||||||
|
Net change in unrealized depreciation |
(4,771,355 |
) |
(119,297,810 |
) |
|||||||
|
Net increase (decrease) in net assets resulting from operations |
14,176,495 |
(23,978,102 |
) |
||||||||
|
Distributions to shareholders |
(704,475 |
) |
(24,352,698 |
) |
|||||||
|
Capital Stock transactions: |
|||||||||||
|
Proceeds from Capital Stock sold |
967,413 |
15,636,936 |
|||||||||
|
Proceeds from shares issued to shareholders upon reinvestment of dividends and distributions |
588,718 |
21,393,932 |
|||||||||
|
Cost of Capital Stock repurchased |
(32,570,834 |
) |
(424,875,180 |
)* |
|||||||
|
Net decrease from Capital Stock transactions |
(31,014,703 |
) |
(387,844,312 |
) |
|||||||
|
Total change in net assets |
(17,542,683 |
) |
(436,175,112 |
) |
|||||||
|
NET ASSETS |
|||||||||||
|
Beginning of period |
353,266,229 |
789,441,341 |
|||||||||
|
End of period |
$ |
335,723,546 |
$ |
353,266,229 |
|||||||
|
CHANGE IN CAPITAL STOCK OUTSTANDING |
|||||||||||
|
Shares of Capital Stock sold |
27,969 |
445,345 |
|||||||||
|
Shares issued to shareholders upon reinvestment of dividends and distributions |
17,136 |
618,132 |
|||||||||
|
Shares of Capital Stock repurchased |
(943,223 |
) |
(12,184,122 |
) |
|||||||
|
Change in Capital Stock outstanding |
(898,118 |
) |
(11,120,645 |
) |
|||||||
* Net of redemption fees of $36,394 for the year ended March 31, 2018, see Note 6.
See accompanying Notes to Financial Statements.
17
FPA CAPITAL FUND, INC.
FINANCIAL HIGHLIGHTS
Selected Data for Each Share of Capital Stock Outstanding Throughout Each Period
|
Six Months ended September 30, 2018 |
Year ended March 31, |
||||||||||||||||||||||||||
|
(Unaudited) |
2018 |
2017 |
2016 |
2015 |
2014 |
||||||||||||||||||||||
|
Per share operating performance: |
|||||||||||||||||||||||||||
|
Net asset value at beginning of period |
$ |
33.42 |
$ |
36.39 |
$ |
32.41 |
$ |
37.66 |
$ |
47.46 |
$ |
45.60 |
|||||||||||||||
|
Income from investment operations: |
|||||||||||||||||||||||||||
|
Net investment income (loss)* |
0.09 |
0.05 |
0.05 |
0.12 |
0.03 |
(0.03 |
) |
||||||||||||||||||||
|
Net realized and unrealized gain (loss) on investment securities |
1.26 |
(1.47 |
) |
5.80 |
(4.92 |
) |
(5.02 |
) |
7.90 |
||||||||||||||||||
|
Total from investment operations |
1.35 |
(1.42 |
) |
5.85 |
(4.80 |
) |
(4.99 |
) |
7.87 |
||||||||||||||||||
|
Less distributions: |
|||||||||||||||||||||||||||
|
Dividends from net investment income |
(0.07 |
) |
— |
(0.10 |
) |
(0.12 |
) |
— |
— |
||||||||||||||||||
|
Distributions from net realized capital gains |
— |
(1.55 |
) |
(1.77 |
) |
(0.33 |
) |
(4.81 |
) |
(6.01 |
) |
||||||||||||||||
|
Total distributions |
(0.07 |
) |
(1.55 |
) |
(1.87 |
) |
(0.45 |
) |
(4.81 |
) |
(6.01 |
) |
|||||||||||||||
|
Redemption fees |
— |
— |
— |
** |
— |
** |
— |
** |
— |
** |
|||||||||||||||||
|
Net asset value at end of period |
$ |
34.70 |
$ |
33.42 |
$ |
36.39 |
$ |
32.41 |
$ |
37.66 |
$ |
47.46 |
|||||||||||||||
|
Total investment return*** |
4.04 |
% |
(4.05 |
)% |
18.09 |
% |
(12.74 |
)% |
(11.49 |
)% |
18.99 |
% |
|||||||||||||||
|
Ratios/supplemental data: |
|||||||||||||||||||||||||||
|
Net assets, end of period (in $000's) |
$ |
335,724 |
$ |
353,266 |
$ |
789,441 |
$ |
759,467 |
$ |
1,076,477 |
$ |
1,372,336 |
|||||||||||||||
|
Ratio of expenses of average net assets: |
0.89 |
%† |
0.83 |
% |
0.80 |
% |
0.77 |
% |
0.83 |
% |
0.83 |
% |
|||||||||||||||
|
Ratio of net investment income (loss) to average net assets |
0.50 |
%† |
0.15 |
% |
0.14 |
% |
0.34 |
% |
0.08 |
% |
(0.07 |
)% |
|||||||||||||||
|
Portfolio turnover rate |
70 |
%† |
66 |
% |
23 |
% |
45 |
% |
38 |
% |
17 |
% |
|||||||||||||||
* Per share amount is based on average shares outstanding.
** Rounds to less than $0.01 per share.
*** Return is based on net asset value per share, adjusted for reinvestment of distributions, and does not reflect deduction of the sales charge.
† Annualized.
See accompanying Notes to Financial Statements.
18
FPA CAPITAL FUND, INC.
NOTES TO FINANCIAL STATEMENTS
September 30, 2018
(Unaudited)
NOTE 1 — Significant Accounting Policies
FPA Capital Fund, Inc. (the "Fund") is registered under the Investment Company Act of 1940, as a diversified, open-end investment company. The Fund's primary investment objective is long-term capital growth. Current income is a factor, but a secondary consideration. The Fund qualifies as an investment company pursuant to Financial Accounting Standard Board (FASB) Accounting Standards Codification (ASC) No. 946, Financial Services — Investment Companies. The following is a summary of significant accounting policies consistently followed by the Fund in the preparation of its financial statements.
A. Security Valuation
The Fund's investments are reported at fair value as defined by accounting principles generally accepted in the United States of America, ("U.S. GAAP"). The Fund generally determines its net asset value as of approximately 4:00 p.m. New York time each day the New York Stock Exchange is open. Further discussion of valuation methods, inputs and classifications can be found under Disclosure of Fair Value Measurements.
B. Securities Transactions and Related Investment Income
Securities transactions are accounted for on the date the securities are purchased or sold. Dividend income and distributions to shareholders are recorded on the ex-dividend date. Interest income and expenses are recorded on an accrual basis.
C. Use of Estimates
The preparation of the financial statements in accordance with U.S. GAAP requires management to make estimates and assumptions that affect the amounts reported. Actual results could differ from those estimates.
D. Recent Accounting Pronouncements
In August 2018, the Financial Accounting Standards Board (FASB) issued Accounting Standards Update (ASU) No. 2018-13, Fair Value Measurement (Topic 820) — Disclosure Framework — Changes to the Disclosure Requirements for Fair Value Measurement. The amendments eliminate certain disclosure requirements for fair value measurements for all entities, requires public entities to disclose certain new information and modifies some disclosure requirements. The new guidance is effective for all entities for fiscal years beginning after December 15, 2019 and for interim periods within those fiscal years. An entity is permitted to early adopt either the entire standard or only the provisions that eliminate or modify requirements. The Adviser is currently evaluating the impact of this new guidance on the Funds' financial statements.
NOTE 2 — Risk Considerations
Investing in the Fund may involve certain risks including, but not limited to, those described below.
Market Risk: Because the values of the Fund's investments will fluctuate with market conditions, so will the value of your investment in the Fund. You could lose money on your investment in the Fund or the Fund could underperform other investments.
Common Stocks and Other Securities: The prices of common stocks and other securities held by the Fund may decline in response to certain events taking place around the world, including; those directly involving companies whose securities are owned by the Fund; conditions affecting the general economy; overall market changes; local, regional or global political, social or economic instability; and currency, interest rate and
19
FPA CAPITAL FUND, INC.
NOTES TO FINANCIAL STATEMENTS (Continued)
(Unaudited)
commodity price fluctuations. In addition, the Adviser's emphasis on a value-oriented investment approach generally results in the Fund's portfolio being invested primarily in medium or smaller sized companies. Smaller companies may be subject to a greater degree of change in earnings and business prospects than larger, more established companies, and smaller companies are often more reliant on key products or personnel than larger companies. Also, securities of smaller companies are traded in lower volumes than those issued by larger companies and may be more volatile than those of larger companies. In light of these characteristics of smaller companies and their securities, the Fund may be subjected to greater risk than that assumed when investing in the equity securities of larger companies.
Covered Call Options: In an effort to increase potential income, the Fund may write (i.e. sell) covered call options listed on a national securities exchange. When the Fund writes a listed call option, the purchaser has the right to buy a security from the Fund at a fixed exercise price any time before the option contract expires, regardless of changes in the market price of the underlying security. The Fund writes options only on securities it owns (covered options) and must retain ownership of the underlying security while the option is outstanding. Until the option expires, the Fund cannot profit from a rise in the market price of the underlying security over the exercise price, except insofar as the premium which the Fund receives, net of commissions, represents a profit. The premium paid to the Fund is the consideration for undertaking this obligation.
If a covered call option written by the Fund expires unexercised, the Fund realizes a capital gain on the expiration date equal to the premium received at the time the option was written. Prior to the earlier of exercise or expiration, an option may be closed out by an offsetting purchase of an option of the same series (type, underlying security, exercise price and expiration). There can be no assurance, however, that a closing purchase transaction can be effected when the Fund desires. The Fund will realize a capital gain from a closing purchase transaction if the cost of the closing option is less than the premium received from writing the option, or a capital loss if the cost of the closing option is more than the premium received from writing the option.
Repurchase Agreements: Repurchase agreements permit the Fund to maintain liquidity and earn income over periods of time as short as overnight. Repurchase agreements held by the Fund are fully collateralized by U.S. Government securities, or securities issued by U.S. Government agencies, or securities that are within the three highest credit categories assigned by established rating agencies (Aaa, Aa, or A by Moody's or AAA, AA or A by Standard & Poor's) or, if not rated by Moody's or Standard & Poor's, are of equivalent investment quality as determined by the Adviser. Such collateral is in the possession of the Fund's custodian. The collateral is evaluated daily to ensure its market value equals or exceeds the current market value of the repurchase agreements including accrued interest. In the event of default on the obligation to repurchase, the Fund has the right to liquidate the collateral and apply the proceeds in satisfaction of the obligation.
The Fund may enter into repurchase agreements, under the terms of a Master Repurchase Agreement ("MRA"). The MRA permits the Fund, under certain circumstances including an event of default (such as bankruptcy or insolvency), to offset payables and/or receivables under the MRA with collateral held and/or posted to the counterparty and create one single net payment due to or from the Fund. However, bankruptcy or insolvency laws of a particular jurisdiction may impose restrictions on or prohibitions against such a right of offset in the event of a MRA counterparty's bankruptcy or insolvency. Pursuant to the terms of the MRA, the Fund receives securities as collateral with a market value in excess of the repurchase price to be received by the Fund upon the maturity of the repurchase transaction. Upon a bankruptcy or insolvency of the MRA counterparty, the Fund recognizes a liability with respect to such excess collateral to reflect the Fund's obligation under bankruptcy law
20
FPA CAPITAL FUND, INC.
NOTES TO FINANCIAL STATEMENTS (Continued)
(Unaudited)
to return the excess to the counterparty. Repurchase agreements outstanding at the end of the period are listed in the Fund's Portfolio of Investments.
NOTE 3 — Purchases and Sales of Investment Securities
Cost of purchases of investment securities (excluding short-term investments) aggregated $87,407,113 for the period ended September 30, 2018. The proceeds and cost of securities sold resulting in net realized gains of $18,073,584 aggregated $129,126,881 and $111,053,297, respectively, for the period ended September 30, 2018. Realized gains or losses are based on the specific identification method.
NOTE 4 — Federal Income Tax
No provision for federal income tax is required because the Fund has elected to be taxed as a "regulated investment company" under the Internal Revenue Code (the "Code") and intends to maintain this qualification and to distribute each year to its shareholders, in accordance with the minimum distribution requirements of the Code, its taxable net investment income and taxable net realized gains on investments.
The cost of investment securities held at September 30, 2018, was $286,339,325 for federal income tax purposes. Gross unrealized appreciation and depreciation for all investments (excluding short-term investments) at September 30, 2018, for federal income tax purposes was $43,470,321 and $7,871,103, respectively resulting in net unrealized appreciation of $35,599,218. The Fund recognizes interest and penalties, if any, related to unrecognized tax benefits as income tax expense in the Statement of Operations. During the year, the Fund did not incur any interest or penalties. The Fund is not subject to examination by U.S. federal tax authorities for years ended on or before March 31, 2013 or by state tax authorities for years ended on or before March 31, 2012.
NOTE 5 — Advisory Fees and Other Affiliated Transactions
Pursuant to an Investment Advisory Agreement, advisory fees were paid by the Fund to First Pacific Advisors, LP (the "Adviser"). Under the terms of this Agreement, the Fund pays the Adviser a monthly fee calculated at the annual rate of 0.75% of the first $50 million of the Fund's average daily net assets and 0.65% of the average daily net assets in excess of $50 million. The Agreement obligates the Adviser to reduce its fee to the extent necessary to reimburse the Fund for any annual expenses (exclusive of interest, taxes, the cost of any supplemental statistical and research information, and extraordinary expenses such as litigation) in excess of 11/2% of the first $30 million and 1% of the remaining average net assets of the Fund for the year.
For the period ended September 30, 2018, the Fund paid aggregate fees and expenses of $100,028 to all Directors who are not affiliated persons of the Adviser. Certain officers of the Fund are also officers of the Adviser.
NOTE 6 — Redemption Fees
Effective June 26, 2017, the Board of Directors of the Fund approved the removal of the 2% redemption fee. Prior to that date, a redemption fee of 2% applied to redemptions within 90 days of purchase. For the period ended September 30, 2018, there were no redemption fees collected.
NOTE 7 — Disclosure of Fair Value Measurements
The Fund uses the following methods and inputs to establish the fair value of its assets and liabilities. Use of particular methods and inputs may vary over time based on availability and relevance as market and economic conditions evolve.
21
FPA CAPITAL FUND, INC.
NOTES TO FINANCIAL STATEMENTS (Continued)
(Unaudited)
Equity securities are generally valued each day at the official closing price of, or the last reported sale price on, the exchange or market on which such securities principally are traded, as of the close of business on that day. If there have been no sales that day, equity securities are generally valued at the last available bid price. Securities that are unlisted and fixed-income and convertible securities listed on a national securities exchange for which the over-the-counter ("OTC") market more accurately reflects the securities' value in the judgment of the Fund's officers, are valued at the most recent bid price. Short-term corporate notes with maturities of 60 days or less at the time of purchase are valued at amortized cost.
Securities for which representative market quotations are not readily available or are considered unreliable by the Adviser are valued as determined in good faith under procedures adopted by the authority of the Fund's Board of Directors. Various inputs may be reviewed in order to make a good faith determination of a security's value. These inputs include, but are not limited to, the type and cost of the security; contractual or legal restrictions on resale of the security; relevant financial or business developments of the issuer; actively traded similar or related securities; conversion or exchange rights on the security; related corporate actions; significant events occurring after the close of trading in the security; and changes in overall market conditions. Fair valuations and valuations of investments that are not actively trading involve judgment and may differ materially from valuations of investments that would have been used had greater market activity occurred.
The Fund classifies its assets based on three valuation methodologies. Level 1 values are based on quoted market prices in active markets for identical assets. Level 2 values are based on significant observable market inputs, such as quoted prices for similar assets and quoted prices in inactive markets or other market observable inputs as noted above including spreads, cash flows, financial performance, prepayments, defaults, collateral, credit enhancements, and interest rate volatility. Level 3 values are based on significant unobservable inputs that reflect the Fund's determination of assumptions that market participants might reasonably use in valuing the assets. The valuation levels are not necessarily an indication of the risk associated with investing in those securities. The following table presents the valuation levels of the Fund's investments as of September 30, 2018:
|
Investments |
Level 1 |
Level 2 |
Level 3 |
Total |
|||||||||||||||
|
Common Stocks |
|||||||||||||||||||
|
Exploration & Production |
$ |
47,051,115 |
— |
— |
$ |
47,051,115 |
|||||||||||||
|
Communications Equipment |
31,357,110 |
— |
— |
31,357,110 |
|||||||||||||||
|
Oil & Gas Services & Equipment |
29,427,062 |
— |
— |
29,427,062 |
|||||||||||||||
|
Airlines |
21,413,879 |
— |
— |
21,413,879 |
|||||||||||||||
|
Computer Hardware & Storage |
17,756,294 |
— |
— |
17,756,294 |
|||||||||||||||
|
Technology Distributors |
17,081,638 |
— |
— |
17,081,638 |
|||||||||||||||
|
Auto Parts |
15,167,632 |
— |
— |
15,167,632 |
|||||||||||||||
|
Containers & Packaging |
11,673,931 |
— |
— |
11,673,931 |
|||||||||||||||
|
Agricultural Machinery |
10,439,345 |
— |
— |
10,439,345 |
|||||||||||||||
|
Banks |
8,149,918 |
— |
— |
8,149,918 |
|||||||||||||||
|
Consumer Goods — Rental |
6,914,786 |
— |
— |
6,914,786 |
|||||||||||||||
|
Infrastructure Software |
4,237,195 |
— |
— |
4,237,195 |
|||||||||||||||
22
FPA CAPITAL FUND, INC.
NOTES TO FINANCIAL STATEMENTS (Continued)
(Unaudited)
|
Investments |
Level 1 |
Level 2 |
Level 3 |
Total |
|||||||||||||||
|
Other Common Stocks |
$ |
16,699,741 |
— |
— |
$ |
16,699,741 |
|||||||||||||
|
U.S. Treasuries |
— |
$ |
84,568,897 |
— |
84,568,897 |
||||||||||||||
|
Short-Term Investment |
— |
15,874,000 |
— |
15,874,000 |
|||||||||||||||
|
$ |
237,369,646 |
$ |
100,442,897 |
— |
$ |
337,812,543 |
|||||||||||||
Transfers of investments between different levels of the fair value hierarchy are recorded at market value as of the end of the reporting period. There were no transfers between Levels 1, 2, or 3 during the period ended September 30, 2018.
NOTE 8 — Collateral Requirements
FASB Accounting Standards Update No. 2011-11, Disclosures about Offsetting Assets and Liabilities, requires disclosures to make financial statements that are prepared under U.S. GAAP more comparable to those prepared under International Financial Reporting Standards. Under this guidance the Fund discloses both gross and net information about instruments and transactions eligible for offset such as instruments and transactions subject to an agreement similar to a master netting arrangement. In addition, the Fund discloses collateral received and posted in connection with master netting agreements or similar arrangements.
The following table presents the Fund's repurchase agreements by counterparty net of amounts available for offset under an ISDA Master agreement or similar agreements and net of the related collateral received or pledged by the Fund as of September 30, 2018, are as follows:
|
Counterparty |
Gross Assets in the Statement of Assets and Liabilities |
Collateral Received |
Assets (Liabilities) Available for Offset |
Net Amount of Assets* |
|||||||||||||||
|
State Street Bank and Trust Company |
$ |
15,874,000 |
$ |
15,874,000 |
** |
— |
— |
||||||||||||
* Represents the net amount receivable from the counterparty in the event of default.
** Collateral with a value of $16,192,793 has been received in connection with a master repurchase agreement. Excess of collateral received from the individual master repurchase agreement is not shown for financial reporting purposes.
23
FPA CAPITAL FUND, INC.
SHAREHOLDER EXPENSE EXAMPLE
September 30, 2018 (Unaudited)
Fund Expenses
Mutual fund shareholders generally incur two types of costs: (1) transaction costs, and (2) ongoing costs, including advisory and administrative fees; shareholder service fees; and other Fund expenses. The Example is intended to help you understand your ongoing costs (in dollars) of investing in the Fund and to compare these costs with the ongoing costs of investing in other mutual funds. The Example is based on an investment of $1,000 invested at the beginning of the year and held for the entire year.
Actual Expenses
The information in the table under the heading "Actual Performance" provides information about actual account values and actual expenses. You may use the information in this column, together with the amount you invested, to estimate the expenses that you paid over the period. Simply divide your account value by $1,000 (for example, an $8,600 account value divided by $1,000 = 8.6), then multiply the result by the number in the first column in the row entitled "Expenses Paid During Period" to estimate the expenses you paid on your account during this period.
Hypothetical Example for Comparison Purposes
The information in the table under the heading "Hypothetical Performance (5% return before expenses)" provides information about hypothetical account values and hypothetical expenses based on the Fund's actual expense ratio and an assumed rate of return of 5% per year before expenses, which is not the Fund's actual return. The hypothetical account values and expenses may not be used to estimate the actual ending account balance or expenses you paid for the period. You may use this information to compare the ongoing costs of investing in the Fund
and other funds. To do so, compare this 5% hypothetical example with the 5% hypothetical examples that appear in the shareholder reports of other funds.
Please note that the expenses shown in the table are meant to highlight your ongoing costs only and do not reflect any transactional costs. Therefore, the information under the heading "Hypothetical Performance (5% return before expenses)" is useful in comparing ongoing costs only, and will not help you determine the relative total costs of owning different funds. In addition, if these transactional costs were included, your costs would have been higher. Even though the Fund does not charge transaction fees, if you purchase shares through a broker, the broker may charge you a fee. You should evaluate other mutual funds' transaction fees and any applicable broker fees to assess the total cost of ownership for comparison purposes.
|
Actual Performance |
Hypothetical Performance (5% return before expenses) |
||||||||||
|
Beginning Account Value March 31, 2018 |
$ |
1,000.00 |
$ |
1,000.00 |
|||||||
|
Ending Account Value September 30, 2018 |
$ |
1,040.40 |
$ |
1,020.61 |
|||||||
|
Expenses Paid During Period* |
$ |
4.55 |
$ |
4.51 |
|||||||
* Expenses are equal to the Fund's annualized expense ratio of 0.89%, multiplied by the average account value over the period and prorated for the six-months ended September 30, 2018 (183/365 days).
24
FPA CAPITAL FUND, INC.
APPROVAL OF INVESTMENT ADVISORY AGREEMENT
(Unaudited)
Approval of the Advisory Agreement. At a meeting of the Board of Directors held on August 13, 2018, the Directors approved the continuation of the advisory agreement between the Fund and the Adviser (the "Advisory Agreement") for an additional one-year period through September 30, 2019, on the recommendation of the Independent Directors, who met in executive session on August 13, 2018 prior to the Board meeting to review and discuss the proposed continuation of the Advisory Agreement. The Board had also met on July 9, 2018, with the Independent Directors meeting separately prior to the Meeting in executive session with the management of the Adviser and then separately with independent counsel to evaluate the renewal of the Advisory Agreement. Prior to their July 9 meeting, the Independent Directors, through their independent counsel, had requested and received extensive materials prepared in connection with the review of the Advisory Agreements. The materials provided a broad range of information regarding the Fund, including a description of, among other matters, the terms of the Advisory Agreement; the services provided by the Adviser; the experience of the relevant investment personnel; the Fund's performance in absolute terms and as compared to the performance of peers and appropriate benchmark(s); the fees and expenses of the Fund in absolute terms and as compared to peers; and the profitability of the Adviser from serving as adviser to the Fund. Following their review at the July 9 meeting, the Independent Directors requested (through their independent counsel) and received supplemental information and responses to a number of questions relating to the materials provided by the Adviser.
In addition, the Board met regularly throughout the year and received information on a variety of topics that were relevant to its annual consideration of the renewal of the Advisory Agreement including, among other matters, Fund investment performance, compliance, risk management, liquidity, valuation, trade execution and other matters relating to Fund operations. The Independent Directors also had met with management of the Adviser (including key investment personnel) at their quarterly meetings as well as with management at other times between the quarterly meetings throughout the year. The materials specifically provided in connection with the annual review of the Advisory Agreement supplement the information received throughout the year.
At their regular Board meetings and executive sessions, the Independent Directors were also assisted by independent legal counsel. In addition to the materials provided by the Adviser, the Independent Directors received a legal memorandum from independent counsel that outlined, among other matters: the duties of the Independent Directors and relevant requirements under the 1940 Act; the general principles under state law relevant to considering the approval of advisory contracts; an adviser's fiduciary duty with respect to advisory agreements and compensation; the standards used by courts in determining whether investment advisers and investment company boards of trustees have fulfilled their duties; and factors to be considered by the Independent Directors when voting on advisory agreements. During executive session, independent legal counsel reviewed with the Independent Directors these duties, standards and factors summarized in the legal memorandum described above. The following paragraphs summarize the material information and factors considered by the Board and the Independent Directors, as well as the Directors' conclusions relative to such factors.
Nature, Extent and Quality of Services. The Board and the Independent Directors considered information provided by the Adviser in response to their requests, as well as information provided throughout the year regarding: the Adviser and its staffing in connection with the Fund, including the Fund's portfolio manager and the two analysts supporting him; the scope of services provided by the Adviser, including portfolio supervision and supervision of other service providers performed by the Adviser. The Board and the Independent Directors noted the experience, length of service and reputation of the Fund's portfolio manager, Arik A. Ahitov, who has served as portfolio manager of the Fund since February 2014 and previously served as an associate portfolio manager of the Fund from July 2013 to February 2014. They also noted that FPA had a transition in the management of the Fund: Arik Ahitov became the Fund's sole portfolio manager effective October 1, 2017, at
25
FPA CAPITAL FUND, INC.
APPROVAL OF INVESTMENT ADVISORY AGREEMENT (Continued)
(Unaudited)
which time Dennis Bryan stepped down from his former role as a portfolio manager and became a strategic adviser to Mr. Ahitov and the investment team. The Board and the Independent Directors concluded that the nature, extent and quality of services provided by the Adviser have benefited and should continue to benefit the Fund and its shareholders.
Investment Performance. The Board and the Independent Directors reviewed the overall investment performance of the Fund. The Directors also received information from an independent consultant, Broadridge, regarding the Fund's performance relative to a peer group of midcap core funds selected by Broadridge (the "Peer Group"). The Board and the Independent Directors noted that the Fund underperformed its Peer Group for the one-, three-, five- and 10-year periods ending March 31, 2018 and the Fund's benchmark, Russell 2000 Index, for the one-, three-, five- and 10-year period ended March 31, 2018. They also noted that Broadridge had given the Fund a "Neutral" Analyst Rating. The Board and the Independent Directors considered the Fund's investment results in light of the Fund's objectives and the recent transition, and they concluded that the Adviser's continued management of the Fund should benefit the Fund and its shareholders.
Advisory Fees and Fund Expenses; Comparison with Peer Group and Institutional Fees. The Board and the Independent Directors considered information provided by the Adviser regarding the Fund's advisory fees and total expense levels. The Board and the Independent Directors reviewed comparative information regarding fees and expenses for the Peer Group. The Directors noted that the Fund's fees and expenses were at the lower end of the range for the Peer Group. The Board and the Independent Directors also noted that the overall expense ratio of the Fund was relatively low compared to the Peer Group. The Board and the Independent Directors considered the fees charged by the Adviser for advising institutional accounts and sub-advising another mutual fund managed in a similar style, as well as the Adviser's discussion of the differences between the services provided by the Adviser to the Fund and those provided by the Adviser to the sub-advised fund and institutional accounts. The Board and the Independent Directors concluded that the continued payment of advisory fees and expenses by the Fund to the Adviser was fair and reasonable and should continue to benefit the Fund and its shareholders.
Adviser Profitability and Costs. The Board and the Independent Directors considered information provided by the Adviser regarding the Adviser's costs in providing services to the Fund, the profitability of the Adviser and the benefits to the Adviser from its relationship to the Fund. They reviewed and considered the Adviser's representations regarding its assumptions and methods of allocating certain costs, such as personnel costs, which constitute the Adviser's largest operating cost, overhead and trading costs with respect to the provision of investment advisory services. The Independent Directors discussed with the Adviser the general process through which individuals' compensation is determined and then reviewed by the management committee of the Adviser, as well as the Adviser's methods for determining that its compensation levels are set at appropriate levels to attract and retain the personnel necessary to provide high quality professional investment advice. In evaluating the Adviser's profitability, they excluded certain distribution and marketing-related expenses. The Board and the Independent Directors recognized that the Adviser is entitled under the law to earn a reasonable level of profits for the services that it provides to the Fund. The Board and the Independent Directors concluded that the Adviser's level of profitability from its relationship with the Fund did not indicate that the Adviser's compensation was unreasonable or excessive.
Economies of Scale and Sharing of Economies of Scale. The Board and the Independent Directors considered whether there have been economies of scale with respect to the management of the Fund, whether the Fund has appropriately benefited from any economies of scale, and whether the fee rate is reasonable in relation to the Fund's asset levels and any economies of scale that may exist. The Board and the Independent Directors considered the Adviser's representation that its internal costs of providing investment management services to
26
FPA CAPITAL FUND, INC.
APPROVAL OF INVESTMENT ADVISORY AGREEMENT (Continued)
(Unaudited)
the Fund have significantly increased in recent years as a result of a number of factors, including the Adviser's substantial investment in additional professional resources and staffing. The Board and the Independent Directors considered both quantitative and qualitative information regarding the Adviser's representation that it has also made significant investments in: (1) the portfolio managers, analysts, traders and other investment personnel who assist with the management of the Fund; (2) new compliance, operations, and administrative personnel; (3) information technology, portfolio accounting and trading systems; and (4) office space, each of which enhances the quality of services provided to the Fund. The Board and the Independent Directors also considered that the Adviser had agreed to forgo the reimbursement for providing certain financial services that it had previously received from the Fund. The Board and the Independent Directors also considered the Adviser's willingness to close funds, including the Fund, to new investors when it believed that the Fund had limited capacity to grow or that it otherwise would benefit fund shareholders. The Board and the Independent Directors also noted that, even though the Fund is currently closed to new investors and it continues to experience outflows of investment capital, the Adviser has continued to make investments in personnel servicing the Fund.
The Independent Directors noted that the fee rate contained a breakpoint as the Fund's assets increased. They considered that many mutual funds have breakpoints in the advisory fee structure as a means by which to share in the benefits of potential economies of scale as a fund's assets grow. They also considered that not all funds have breakpoints in their fee structures and that breakpoints are not the exclusive means of sharing potential economies of scale. The Board and the Independent Directors considered the Adviser's statement that it believes that additional breakpoints would not be appropriate for the Fund at this time given the ongoing investments the Adviser is making in its business for the benefit of the Fund, uncertainties regarding the direction of the economy, rising inflation, increasing costs for personnel and systems, and the limited prospect for growth in the Fund's assets given the limited availability of shares of the Fund to new shareholders, all of which could negatively impact the profitability of the Adviser. The Board and the Independent Directors concluded that the Fund is benefitting from the ongoing investments made by the Adviser in its team of personnel serving the Fund and in the Adviser's service infrastructure, and that in light of these investments, additional breakpoints in the Fund's advisory fee structure were not warranted at current asset levels.
Ancillary Benefits. The Board and the Independent Directors considered other actual and potential benefits to the Adviser from managing the Fund, including the acquisition and use of research services with commissions generated by the Fund, in concluding that the contractual advisory and other fees are fair and reasonable for the Fund. They noted that the Adviser does not have any affiliates that benefit from the Adviser's relationship to the Fund.
Conclusions. The Board and the Independent Directors determined that the Fund continues to benefit from the services of the Adviser's portfolio management and research team. In addition, the Board and the Independent Directors agreed that the Fund continues to receive high quality services from the Adviser. The Board and the Independent Directors concluded that the current advisory fee rate is reasonable and fair to the Fund and its shareholders in light of the nature and quality of the services provided by the Adviser and the Adviser's profitability and costs. The Board and the Independent Directors also noted their intention to continue monitoring the factors relevant to the Adviser's compensation, such as the performance of the Fund, changes in the Fund's asset levels, changes in portfolio management personnel and the cost and quality of the services provided by the Adviser to the Fund. On the basis of the foregoing, and without assigning particular weight to any single factor, none of which was dispositive, the Board and the Independent Directors concluded that it would be in the best interests of the Fund to continue to be advised and managed by the Adviser and determined to approve the continuation of the current Advisory Agreement for another one-year period through September 30, 2019.
27
FPA CAPITAL FUND, INC.
DIRECTOR AND OFFICER INFORMATION
(Unaudited)
Sandra Brown, Mark L. Lipson, Alfred E. Osborne, Jr., A. Robert Pisano, Patrick B. Purcell and Allan M. Rudnick are all Directors of the Fund who are not "interested persons" of the Fund, as that term is defined in the 1940 Act (collectively, the "Independent Directors"). Directors serve until their resignation, removal or retirement. The Statement of Additional Information includes additional information about the Directors and is available, without charge, upon request by calling (800) 982-4372.
|
Name, Address(1) and Year of Birth |
Position(s) Held with the Fund |
Year First Elected as Director of the Fund |
Principal Occupation(s) During the Past Five Years |
Number of FPA Funds Overseen by Director |
Other Directorships Held by Director During the Past Five Years |
||||||||||||||||||
|
Independent Directors |
|||||||||||||||||||||||
|
Sandra Brown, 1955 |
Director |
2016 |
Consultant. Formerly, CEO and President of Transamerica Financial Advisers, Inc. (1999-2009); President, Transamerica Securities Sales Corp. (1998-2009); Vice President, Bank of America Mutual Fund Administration (1990-1998); Director/Trustee of FPA New Income, Inc., of FPA Funds Trust, of FPA Paramount Fund, Inc., of FPA U.S. Value Fund, Inc. and of Source Capital, Inc. (since October 2016). |
7 |
None |
||||||||||||||||||
|
Mark L. Lipson, 1949 |
Director |
2015 |
RIA & Consultant, ML2 Wealth Advisors, LLC. Formerly Managing Director, Bessemer Trust (2007-2014) and US Trust (2003-2006); Founder, Chairman and CEO of the Northstar Mutual Funds (1993-2001). Director/Trustee of FPA New Income, Inc., of FPA Funds Trust, of FPA Paramount Fund, Inc., of FPA U.S. Value Fund, Inc. and of Source Capital, Inc. (since October 2015). |
7 |
None |
||||||||||||||||||
|
Alfred E. Osborne, Jr., 1944 |
Director |
1999 |
Interim Dean, Professor and Faculty Director, Price Center for Entrepreneurship and Innovation of the John E. Anderson School of Management at UCLA. Dr. Osborne has been at UCLA since 1972. Director/Trustee of FPA Paramount Fund, Inc. and FPA U.S. Value Fund, Inc., (since 2013), of FPA New Income, Inc. (since 1999), of FPA Funds Trust (since 2002) and of Source Capital, Inc. (since 2013). |
7 |
Kaiser Aluminum, Wedbush, Inc. |
||||||||||||||||||
28
FPA CAPITAL FUND, INC.
DIRECTOR AND OFFICER INFORMATION (Continued)
(Unaudited)
|
Name, Address(1) and Year of Birth |
Position(s) Held with the Fund |
Year First Elected as Director of the Fund |
Principal Occupation(s) During the Past Five Years |
Number of FPA Funds Overseen by Director |
Other Directorships Held by Director During the Past Five Years |
||||||||||||||||||
|
A. Robert Pisano, 1943 |
Director |
2013 |
Consultant. Formerly, President and Chief Operating Officer of The Motion Picture Association of America, Inc. (October 2005-2011). Formerly, National Executive Director and Chief Executive Officer of The Screen Actors Guild (2001-April 2005). Director/Trustee of FPA Paramount Fund, Inc., of FPA U.S. Value Fund, Inc., of FPA Funds Trust, of FPA New Income, Inc. and of Source Capital, Inc. (since 2013). |
7 |
Entertainment Partners and Resources Global Professionals |
||||||||||||||||||
|
Patrick B. Purcell, 1943 |
Director |
2006 |
Retired. Formerly, Executive Vice President, Chief Financial and Administrative Officer of Paramount Pictures (1983 to 1998). Director/Trustee of FPA New Income, Inc., and of FPA Funds Trust (since May 2006), of FPA Paramount Fund, Inc. and of FPA U.S. Value Fund, Inc. (since July 2012), and of Source Capital, Inc. (since 2010). |
7 |
None |
||||||||||||||||||
|
Allan M. Rudnick, 1940 |
Director & Chairman |
2010 |
Private investor. Formerly, Co-founder and Chief Investment Officer of Kayne Anderson Rudnick Investment Management ("KAR") (1989-December 2007). Formerly, President (from 2001) and Chief Executive Officer and Chairman of the Board (from 2005) of KAR. Director/Trustee of FPA New Income, Inc., of FPA Funds Trust, (since January 2010), of FPA Paramount Fund, Inc. and of FPA U.S. Value Fund, Inc. (since July 2012), and of Source Capital, Inc. (since 2012). |
7 |
None |
||||||||||||||||||
|
Interested Director(2) |
|||||||||||||||||||||||
|
J. Richard Atwood, 1960 |
Director |
2016 |
Director and President of FPA GP, Inc., the General Partner of the Adviser (since October 2018). Director/Trustee of each FPA Fund (since May 2016). President of each FPA Fund (since February 2015). Formerly, Managing Partner of FPA (2006-2018). Formerly, until February 2015, Treasurer of each FPA Fund for more than the past five years. |
7 |
None |
||||||||||||||||||
(1) The address for each Director is 11601 Wilshire Boulevard, Suite 1200, Los Angeles, California 90025.
(2) "Interested person" within the meaning of the 1940 Act by virtue of their affiliation with the Fund's Adviser.
29
FPA CAPITAL FUND, INC.
DIRECTOR AND OFFICER INFORMATION (Continued)
(Unaudited)
Officers of the Fund. Officers of the Fund are elected annually by the Board.
|
Name, Address(1) and Year of Birth |
Position with Fund |
Year First Elected as Officer of the Fund |
Principal Occupation(s) During the Past Five Years |
||||||||||||
|
Arik A. Ahitov, 1975 |
Vice President and Portfolio Manager |
2013 |
Partner of the Adviser (since January 2015). Managing Director of the Adviser (January 2013 to December 2014), Vice President of the Adviser (October 2010 to December 2012). Formerly, Vice President of Shamrock Capital Advisors, LLC from September 2004 to September 2010. |
||||||||||||
|
J. Richard Atwood, 1960 |
President |
1997 |
Director and President of FPA GP, Inc., the General Partner of the Adviser (since October 2018). Director/Trustee of each FPA Fund (since May 2016). President of each FPA Fund (since February 2015). Formerly, Managing Partner of FPA (2006-2018). Formerly, until February 2015, Treasurer of each FPA Fund for more than the past five years. |
||||||||||||
|
David C. Lebisky, 1972 |
Chief Compliance Officer |
2017 |
President of Lebisky Compliance Consulting LLC (since October 2015). Consultant, Duff & Phelps Compliance Consulting (since 2016). Senior Consultant, Freeh Group International Solutions, LLC (a global risk management firm) (since 2015). Formerly, Director of Regulatory Administration, Scotia Institutional Investments US, LP (2010 to 2014). |
||||||||||||
|
E. Lake Setzler III, 1967 |
Treasurer |
2006 |
Senior Vice President (since January 2013) and Controller for more than the past five years of FPA; and Treasurer of each FPA Fund (since February 2015). Formerly, until February 2015, Assistant Treasurer of each FPA Fund for more than the past five years. |
||||||||||||
|
Francine S. Hayes, 1967 |
Secretary |
2015 |
Vice President and Senior Counsel, State Street Bank and Trust Company (various positions since 2005). |
||||||||||||
(1) The address for each Officer (except Ms. Hayes) is 11601 Wilshire Boulevard, Suite 1200, Los Angeles, California 90025. Ms. Hayes' address is State Street Bank and Trust Company, One Lincoln Street, Boston, Massachusetts 02111.
30
FPA CAPITAL FUND, INC.
(Unaudited)
INVESTMENT ADVISER
First Pacific Advisors, LP
11601 Wilshire Boulevard, Suite 1200
Los Angeles, CA 90025
TRANSFER & SHAREHOLDER SERVICE AGENT
UMB Fund Services, Inc.
P.O. Box 2175
Milwaukee, WI 53201-2175
or
235 West Galena Street
Milwaukee, WI 53212-3948
(800) 638-3060
CUSTODIAN AND ADMINISTRATOR
State Street Bank and Trust Company
One Lincoln Street
Boston, Massachusetts 02111
TICKER: FPPTX
CUSIP: 302539101
DISTRIBUTOR
UMB Distribution Services, LLC
235 West Galena Street
Milwaukee, Wisconsin 53212-3948
LEGAL COUNSEL
Dechert LLP
One Bush Street, Suite 1600
San Francisco, California 94104
INDEPENDENT REGISTERED PUBLIC ACCOUNTING FIRM
Ernst & Young LLP
725 South Figueroa Street,
Los Angeles, California 90017
This report has been prepared for the information of shareholders of FPA CAPITAL FUND, INC., and is not authorized for distribution to prospective investors unless preceded or accompanied by an effective prospectus. The financial information included in this report has been taken from the records of the Fund without examination by independent auditors.
A description of the policies and procedures that the Adviser uses to vote proxies related to the Fund's portfolio securities is set forth in the Fund's Statement of Additional Information which is available without charge, upon request, on the Fund's website at www.fpa.com or by calling (800) 982-4372 and on the Securities and Exchange Commission's (SEC) website at www.sec.gov. The Fund's complete proxy voting record for the 12 months ended June 30, 2018 is available without charge, upon request by calling (800) 982-4372 and on the SEC's website at www.sec.gov.
The Fund's schedule of portfolio holdings, filed the first and third quarter of the Fund's fiscal year on Form N-Q with the SEC, is available on the SEC's website at www.sec.gov. To obtain Form N-Q from the Fund, shareholders can call (800) 982-4372.
Additional information about the Fund is available online at www.fpa.com. This information includes, among other things, holdings, top sectors, and performance, and is updated on or about the 15th business day after the end of each quarter.
Item 2. Code of Ethics.
Not applicable to this semi-annual report.
Item 3. Audit Committee Financial Expert.
Not applicable to this semi-annual report.
Item 4. Principal Accountant Fees and Services.
Not applicable to this semi-annual report.
Item 5. Audit Committee of Listed Registrants.
Not applicable to this semi-annual report.
Item 6. Investments.
(a) Schedule of Investments is included as a part of the report to shareholders filed under Item 1 of this Form N-CSR.
(b) Not applicable.
Item 7. Disclosure of Proxy Voting Policies and Procedures for Closed-End Management Investment Companies.
Not applicable.
Item 8. Portfolio Managers of Closed-End Management Investment Companies.
Not applicable.
Item 9. Purchases of Equity Securities by Closed-End Management Investment Company and Affiliated Purchasers.
Not applicable.
Item 10. Submission of Matters to a Vote of Security Holders.
There have been no material changes to the procedures by which the shareholders may recommend nominees to the registrant’s board of directors.
Item 11. Controls and Procedures.
(a) The principal executive officer and principal financial officer of the registrant have concluded that the registrant’s disclosure controls and procedures (as defined in Rule 30a-3(c) under the Investment Company Act of 1940) are effective based on their evaluation of the disclosure controls and procedures as of a date within 90 days of the filing date of this report.
(b) There have been no significant changes in the registrant’s internal controls over financial reporting (as defined in Rule 30a-3(d) under the Investment Company Act of 1940) that occurred during the registrant’s second fiscal quarter of the period covered by this report that have materially affected, or is reasonably likely to materially affect, the registrant’s internal controls over financial reporting.
Item 12. Disclosure of Securities Lending Activities for Closed-End Management Investment Companies
Not applicable.
Item 13. Exhibits.
(a)(1) Not applicable.
(a)(2) The certifications required by Rule 30a-2(a) under the Investment Company Act of 1940 are attached hereto.
(a)(3) Not applicable.
(a)(4) The information required regarding the change in the independent public accountant is attached hereto.
(b) The certifications required by Rule 30a-2(b) under the Investment Company Act of 1940 and Section 906 of the Sarbanes-Oxley Act of 2002 are attached hereto.
SIGNATURES
Pursuant to the requirements of the Securities Exchange Act of 1934 and the Investment Company Act of 1940, the registrant has duly caused this report to be signed on its behalf by the undersigned, thereunto duly authorized.
|
FPA CAPITAL FUND, INC. |
| |
|
|
| |
|
|
| |
|
By: |
/s/ J. Richard Atwood |
|
|
|
J. Richard Atwood |
|
|
|
President (principal executive officer) |
|
Date: December 4, 2018
Pursuant to the requirements of the Securities Exchange Act of 1934 and the Investment Company Act of 1940, this report has been signed below by the following persons on behalf of the registrant and in the capacities and on the dates indicated.
|
By: |
/s/ J. Richard Atwood |
|
|
|
J. Richard Atwood |
|
|
|
President (principal executive officer) |
|
|
|
|
|
|
Date: December 4, 2018 |
| |
|
|
|
|
|
|
|
|
|
By: |
/s/ E. Lake Setzler III |
|
|
|
E. Lake Setzler III |
|
|
|
Treasurer (principal financial officer) |
|
|
|
|
|
|
Date: December 4, 2018 |
| |
I, J. Richard Atwood, President of FPA Capital Fund, Inc., certify that:
1. I have reviewed this report on Form N-CSR of FPA Capital Fund, Inc.;
2. Based on my knowledge, this report does not contain any untrue statement of a material fact or omit to state a material fact necessary to make the statements made, in light of the circumstances under which such statements were made, not misleading with respect to the period covered by this report;
3. Based on my knowledge, the financial statements, and other financial information included in this report, fairly present in all material respects the financial condition, results of operations, changes in net assets, and cash flows (if the financial statements are required to include a statement of cash flows) of the registrant as of, and for, the periods presented in this report;
4. The registrant’s other certifying officer and I are responsible for establishing and maintaining disclosure controls and procedures (as defined in Rule 30a-3(c) under the Investment Company Act of 1940) and internal control over financial reporting (as defined in Rule 30a-3(d) under the Investment Company Act of 1940) for the registrant and have:
(a) Designed such disclosure controls and procedures, or caused such disclosure controls and procedures to be designed under our supervision, to ensure that material information relating to the registrant, including its consolidated subsidiaries, is made known to us by others within those entities, particularly during the period in which this report is being prepared;
(b) Designed such internal control over financial reporting, or caused such internal control over financial reporting to be designed under our supervision, to provide reasonable assurance regarding the reliability of financial reporting and the preparation of financial statements for external purposes in accordance with generally accepted accounting principles;
(c) Evaluated the effectiveness of the registrant’s disclosure controls and procedures and presented in this report our conclusions about the effectiveness of the disclosure controls and procedures, as of a date within 90 days prior to the filing date of this report based on such evaluation; and
(d) Disclosed in this report any change in the registrant’s internal control over financial reporting that occurred during the second fiscal quarter of the period covered by this report that has materially affected, or is reasonably likely to materially affect, the registrant’s internal control over financial reporting; and
5. The registrant’s other certifying officer and I have disclosed to the registrant’s auditors and the audit committee of the registrant’s board of directors (or persons performing the equivalent functions):
(a) All significant deficiencies and material weaknesses in the design or operation of internal control over financial reporting which are reasonably likely to adversely affect the registrant’s ability to record, process, summarize, and report financial information; and
(b) Any fraud, whether or not material, that involves management or other employees who have a significant role in the registrant’s internal control over financial reporting.
Date: December 4, 2018
|
By: |
/s/ J. Richard Atwood |
|
|
|
J. Richard Atwood |
|
|
|
President (principal executive officer) |
|
I, E. Lake Setzler III, Treasurer FPA Capital Fund, Inc., certify that:
1. I have reviewed this report on Form N-CSR of FPA Capital Fund, Inc.;
2. Based on my knowledge, this report does not contain any untrue statement of a material fact or omit to state a material fact necessary to make the statements made, in light of the circumstances under which such statements were made, not misleading with respect to the period covered by this report;
3. Based on my knowledge, the financial statements, and other financial information included in this report, fairly present in all material respects the financial condition, results of operations, changes in net assets, and cash flows (if the financial statements are required to include a statement of cash flows) of the registrant as of, and for, the periods presented in this report;
4. The registrant’s other certifying officer and I are responsible for establishing and maintaining disclosure controls and procedures (as defined in Rule 30a-3(c) under the Investment Company Act of 1940) and internal control over financial reporting (as defined in Rule 30a-3(d) under the Investment Company Act of 1940) for the registrant and have:
(a) Designed such disclosure controls and procedures, or caused such disclosure controls and procedures to be designed under our supervision, to ensure that material information relating to the registrant, including its consolidated subsidiaries, is made known to us by others within those entities, particularly during the period in which this report is being prepared;
(b) Designed such internal control over financial reporting, or caused such internal control over financial reporting to be designed under our supervision, to provide reasonable assurance regarding the reliability of financial reporting and the preparation of financial statements for external purposes in accordance with generally accepted accounting principles;
(c) Evaluated the effectiveness of the registrant’s disclosure controls and procedures and presented in this report our conclusions about the effectiveness of the disclosure controls and procedures, as of a date within 90 days prior to the filing date of this report based on such evaluation; and
(d) Disclosed in this report any change in the registrant’s internal control over financial reporting that occurred during the second fiscal quarter of the period covered by this report that has materially affected, or is reasonably likely to materially affect, the registrant’s internal control over financial reporting; and
5. The registrant’s other certifying officer and I have disclosed to the registrant’s auditors and the audit committee of the registrant’s board of directors (or persons performing the equivalent functions):
(a) All significant deficiencies and material weaknesses in the design or operation of internal control over financial reporting which are reasonably likely to adversely affect the registrant’s ability to record, process, summarize, and report financial information; and
(b) Any fraud, whether or not material, that involves management or other employees who have a significant role in the registrant’s internal control over financial reporting.
Date: December 4, 2018
|
By: |
/s/ E. Lake Setzler III |
|
|
|
E. Lake Setzler III |
|
|
|
Treasurer (principal financial officer) |
|
On February 12, 2018, the Board of Trustees of FPA Capital Fund, Inc. (the “Board”) dismissed Deloitte & Touche LLP (“Deloitte”) as the independent registered public accounting firm for FPA Capital Fund, Inc. (the “Fund”).
Deloitte’s reports on the Fund’s financial statements for the fiscal years ended March 31, 2017 and March 31, 2018 contained no adverse opinion or disclaimer of opinion nor were they qualified or modified as to uncertainty, audit scope, or accounting principles. During the Fund’s fiscal years ended March 31, 2017 and March 31, 2018, (i) there were no disagreements with Deloitte on any matter of accounting principles or practices, financial statement disclosure, or audit scope or procedure, which disagreements, if not resolved to the satisfaction of Deloitte, would have caused them to make reference to the subject matter of the disagreements in connection with their reports on the Fund’s financial statements for such years, and (ii) there were no reportable events of the kind described in Item 304(a)(1)(v) of Regulation S-K.
The Board has requested that Deloitte furnish it with a letter addressed to the SEC stating whether or not it agrees with the above statements. A copy of such letter, dated December 4, 2018, is filed as an exhibit to this N-CSR.
The Board has selected Ernst & Young LLP (“EY”) to serve as the Fund’s independent registered public accounting firm for the fiscal year ending March 31, 2019. The decision to select EY was recommended by the Board’s Audit Committee and was approved by the Board. During the Fund’s fiscal years ended March 31, 2017 and March 31, 2018, the Fund has not consulted with EY regarding either the (i) application of accounting principles to a specified transaction, either completed or proposed; or the type of audit opinion that might be rendered on the financial statements, and neither a written report was provided nor oral advice was provided that EY concluded was an important factor considered by the Fund in reaching a decision as to the accounting, auditing, or financial reporting issue; or (ii) any matter that was either the subject of a disagreement, as that term is defined in S-K 304(a)(1)(iv) and the related instructions to S-K 304, or a reportable event, as that term is defined in S-K 304(a)(1)(v).
|
|
|
|
Deloitte & Touche LLP 555 West 5th Street Suite 2700 Los Angeles, CA 90013-1010 USA
Tel: +1 213 688 0800 Fax: +1 213 688 0100 www.deloitte.com |
December 4, 2018
Securities and Exchange Commission
100 F Street, N.E.
Washington, D.C. 20549-7561
Dear Sirs/Madams:
We have read the exhibit to item 304(a)(3) on Form N-CSR dated December 4, 2018, and have the following comments:
1. We agree with the statements made in the first, second and third paragraphs.
2. We have no basis on which to agree or disagree with the statements made in the fourth paragraph.
Yours Truly,
/s/ Deloitte & Touche LLP
I, J. Richard Atwood, President of FPA Capital Fund, Inc., (the “Fund”), certify that:
1. The Form N-CSR of the Fund for the period ended September 30, 2018 (the “Report”) fully complies with the requirements of Section 13(a) or 15(d) of the Securities Exchange Act of 1934; and
2. The information contained in the Report fairly presents, in all material respects, the financial condition and results of operations of the Fund.
|
By: |
/s/ J. Richard Atwood |
|
|
|
J. Richard Atwood |
|
|
|
President (principal executive officer) |
|
Date: December 4, 2018
I, E. Lake Setzler III, Treasurer of FPA Capital Fund, Inc., (the “Fund”), certify that:
1. The Form N-CSR of the Fund for the period ended September 30, 2018 (the “Report”) fully complies with the requirements of Section 13(a) or 15(d) of the Securities Exchange Act of 1934; and
2. The information contained in the Report fairly presents, in all material respects, the financial condition and results of operations of the Fund.
|
By: |
/s/ E. Lake Setzler III |
|
|
|
E. Lake Setzler III |
|
|
|
Treasurer (principal financial officer) |
|
Date: December 4, 2018
A signed original of this written statement required by Section 906 has been provided by the Fund and will be retained by the Fund and furnished to the Securities and Exchange Commission or its staff upon request.
Serious News for Serious Traders! Try StreetInsider.com Premium Free!
You May Also Be Interested In
- Carter Bankshares, Inc. Announces First Quarter 2024 Financial Results
- Carnegie Investment Counsel Highlights the Importance of UPMIFA Compliance for Nonprofits
- Bitcoin Depot Announces Strategic Investment from Sopris Capital
Create E-mail Alert Related Categories
SEC FilingsSign up for StreetInsider Free!
Receive full access to all new and archived articles, unlimited portfolio tracking, e-mail alerts, custom newswires and RSS feeds - and more!
