

Form 6-K Amira Nature Foods Ltd. For: Mar 02
 Tweet
Tweet Share
Share
UNITED STATES
SECURITIES AND EXCHANGE COMMISSION
WASHINGTON, D.C. 20549
FORM 6-K
REPORT OF FOREIGN PRIVATE ISSUER
PURSUANT TO RULE 13a-16 OR 15d-16 UNDER
THE SECURITIES EXCHANGE ACT OF 1934
For the month of March 2015
Commission File Number: 001-35681
AMIRA NATURE FOODS LTD
(Exact name of the Registrant as specified in its charter)
29E, A.U. Tower
Jumeirah Lake Towers
Dubai, United Arab Emirates
(Address of principal executive office)
Indicate by check mark whether the registrant files or will file annual reports under cover of Form 20-F or Form 40-F.
Form 20-F x Form 40-Fo
Indicate by check mark if the registrant is submitting the Form 6-K in paper as permitted by Regulation S-T Rule 101(b)(1):o
Indicate by check mark if the registrant is submitting the Form 6-K in paper as permitted by Regulation S-T Rule 101(b)(7):o
CONVENTIONS USED IN THIS REPORT
In this report (this “Report”), unless otherwise stated or unless the context otherwise requires, references to (i) ‘‘we’’, ‘‘us’’, ‘‘our’’, the “Company’’, the“Amira Group”, ‘‘our Company’’ or “ANFI” are to Amira Nature Foods Ltd, a British Virgin Islands business company, including its subsidiaries; (ii)references to “Amira Mauritius” are solely to Amira Nature Foods Ltd, a Mauritius company and ANFI’s wholly owned subsidiary and (iii) “APFPL” or “Amira India” are to Amira Pure Foods Private Limited, and its subsidiaries, including Amira I Grand Foods Inc., Amira Food Pte. Ltd., Amira Foods (Malaysia) SDN. Bhd., Amira C Foods International DMCC, Basmati Rice GmbH, Basmati Rice North America LLC, Amira G Foods Limited and Amira Ten Nigeria Limited.
In this Report, references to “India” are to the Republic of India, references to “BVI” are to the British Virgin Islands, and references to “Mauritius” are to the Republic of Mauritius. References to “$”, “USD” , “dollars” or “U.S. dollars” are to the legal currency of the United States and references to “Rs.”, “Rupees”, “INR” or “Indian Rupees” are to the legal currency of India.
The condensed interim consolidated financial statements for the three and nine months ended December 31, 2014 and 2013 and notes thereto included elsewhere in this Report have been prepared in compliance with International Accounting Standard (IAS) 34, “Interim financial reporting” as issued by International Accounting Standards Board (IASB). These condensed interim consolidated financial statements should be read in conjunction with the Amira Group’s annual consolidated financial statements and related notes included in the Company’s annual report on Form 20-F for the fiscal year ended March 31, 2014 (the “Annual Report”). References to a particular “fiscal year” are to our fiscal year ended March 31 of that year. Our fiscal quarters end on June 30, September 30, and December 31. References to a year other than a “fiscal” are to the calendar year ended December 31.
In this Report, references to our “international sales” are to those sales which are made to international markets outside of India. In this Report, references to increase/ decrease in percent for the financial statement items have been computed based on absolute figures reported. We also refer in various places within this report to earnings before interest, tax, depreciation and amortization (EBITDA), adjusted EBITDA, adjusted profit after tax, adjusted earnings per share, adjusted net working capital and net debt, which are non-IFRS measures and are more fully explained in the section titled “Non-IFRS Financial Measures”. The presentation of this non-IFRS information is not meant to be considered in isolation or as a substitute for our consolidated financial results prepared in accordance with IFRS as issued by the IASB.
FORWARD-LOOKING STATEMENTS
This Report contains statements of a forward-looking nature. These statements are made under the “safe harbor” provisions of the U.S. Private Securities Litigation Reform Act of 1995. You can identify these forward-looking statements by words or phrases such as “may,” “will,” “except,” “anticipate,” “aim,” “estimate,” “intend,” “plan,” “believe,” “is/are likely to,” “future” or other similar expressions. We have based these forward-looking statements largely on our current expectations and projections about future events and financial trends that we believe may affect our financial condition, results of operations, business strategy and financial needs. These forward-looking statements include, but are not limited to:
| · | our goals and strategies; |
| · | our expansion plans; |
| · | our future business development, results of operations and financial condition; |
| · | our ability to protect our intellectual property rights; |
| · | projected revenue, profits, earnings and other estimated financial information; |
| · | our ability to maintain strong relationships with our customers and suppliers; |
| · | the continued application of the proceeds from our initial public offering (“IPO”); |
| · | governmental policies regarding our industry; and |
| · | the impact of legal proceedings. |
We would like to caution you not to place undue reliance on forward-looking statements and you should read these statements in conjunction with the risk factors disclosed in “Risk Factors” appearing in the Annual Report. Those risks are not exhaustive. We operate in a rapidly evolving environment. New risk factors emerge from time to time, and it is impossible for our management to predict all risk factors, nor can we assess the impact of all factors on our business or the extent to which any factor, or combination of factors, may cause actual results to differ from those contained in any forward-looking statement. We do not undertake any obligation to update or revise the forward-looking statements except as required under applicable law.
Results of Operations and Financial Position
Following this page are our condensed interim consolidated financial position as at December 31, 2014 and our financial results for the three and nine months ended December 31, 2014 and 2013, respectively.
| 2 |
INDEX TO CONDENSED INTERIM CONSOLIDATED FINANCIAL STATEMENTS
| 3 |
Amira Nature Foods Ltd
Condensed Consolidated Statements of Financial Position
| (Amounts in USD) | ||||||||
| As at December 31, 2014 (Unaudited) | As at March 31, 2014 (Audited) | |||||||
| ASSETS | ||||||||
| Non-current | ||||||||
| Property, plant and equipment | $ | 22,037,426 | $ | 23,284,918 | ||||
| Goodwill | 1,549,872 | 1,727,338 | ||||||
| Other intangible assets | 1,898,476 | 2,262,731 | ||||||
| Other long-term financial assets | 592,950 | 485,731 | ||||||
| Total non-current assets | $ | 26,078,724 | $ | 27,760,718 | ||||
| Current | ||||||||
| Inventories (Note 7) | $ | 253,752,955 | $ | 254,952,549 | ||||
| Trade receivables | 99,132,069 | 80,882,986 | ||||||
| Derivative financial assets | 260,034 | 2,352,886 | ||||||
| Other financial assets | 11,541,259 | 9,768,514 | ||||||
| Prepayments (Note 8) | 10,206,040 | 8,361,244 | ||||||
| Other current assets | 1,664,630 | 765,655 | ||||||
| Cash and cash equivalents | 26,960,875 | 37,606,098 | ||||||
| Total current assets | $ | 403,517,862 | $ | 394,689,932 | ||||
| Total assets | $ | 429,596,586 | $ | 422,450,650 | ||||
| EQUITY AND LIABILITIES | ||||||||
| Equity | ||||||||
| Share capital | $ | 9,119 | $ | 9,115 | ||||
| Share premium | 82,896,597 | 82,804,750 | ||||||
| Other reserves | (8,575,285 | ) | (3,312,575 | ) | ||||
| Retained earnings | 100,878,863 | 74,334,687 | ||||||
| Equity attributable to shareholders of the Company | $ | 175,209,294 | $ | 153,835,977 | ||||
| Equity attributable to non-controlling interest | 23,479,458 | 18,005,030 | ||||||
| Total equity | $ | 198,688,752 | $ | 171,841,007 | ||||
| Liabilities | ||||||||
| Non-current liabilities | ||||||||
| Defined benefit obligations | $ | 344,971 | $ | 246,548 | ||||
| Debt | 1,676,780 | 2,739,414 | ||||||
| Deferred tax liabilities | 6,291,114 | 6,666,270 | ||||||
| Total non-current liabilities | $ | 8,312,865 | $ | 9,652,232 | ||||
| Current liabilities | ||||||||
| Trade payables | $ | 16,451,264 | $ | 41,197,158 | ||||
| Debt (Note 9) | 185,432,472 | 182,103,347 | ||||||
| Current tax liabilities (net) | 13,066,707 | 9,644,944 | ||||||
| Derivative financial liabilities | 489,466 | - | ||||||
| Other financial liabilities | 5,814,444 | 6,031,593 | ||||||
| Other current liabilities | 1,340,616 | 1,980,369 | ||||||
| Total current liabilities | $ | 222,594,969 | $ | 240,957,411 | ||||
| Total liabilities | $ | 230,907,834 | $ | 250,609,643 | ||||
| Total equity and liabilities | $ | 429,596,586 | $ | 422,450,650 | ||||
(The accompanying notes are an integral part of these condensed interim consolidated financial statements)
| 4 |
Amira Nature Foods Ltd
Condensed Consolidated Statements of Profit or Loss
(Amounts in USD)
| Nine months ended | Three months ended | |||||||||||||||
| December 31, 2014 (Unaudited) | December 31, 2013 (Unaudited) | December 31, 2014 (Unaudited) | December 31, 2013 (Unaudited) | |||||||||||||
| Revenue | $ | 472,607,849 | $ | 360,774,711 | $ | 192,407,304 | $ | 142,478,370 | ||||||||
| Other income | 92,692 | 108,120 | 18,033 | 13,057 | ||||||||||||
| Cost of material | (427,274,003 | ) | (291,031,271 | ) | (159,601,896 | ) | (109,089,976 | ) | ||||||||
| Change in inventory of finished goods | 56,061,879 | 14,195,269 | 6,949,431 | 1,710,878 | ||||||||||||
| Employee benefit expenses | (9,763,317 | ) | (9,103,034 | ) | (4,344,311 | ) | (4,850,720 | ) | ||||||||
| Depreciation and amortization | (1,778,915 | ) | (1,472,270 | ) | (576,736 | ) | (521,070 | ) | ||||||||
| Freight, forwarding and handling expenses | (14,011,609 | ) | (15,907,424 | ) | (4,595,471 | ) | (6,045,737 | ) | ||||||||
| Other expenses | (17,638,443 | ) | (12,101,245 | ) | (6,071,914 | ) | (5,644,163 | ) | ||||||||
| $ | 58,296,133 | $ | 45,462,856 | $ | 24,184,440 | $ | 18,050,639 | |||||||||
| Finance costs | (23,066,231 | ) | (18,864,147 | ) | (7,928,780 | ) | (8,284,701 | ) | ||||||||
| Finance income | 1,632,163 | 2,248,529 | 548,802 | 685,383 | ||||||||||||
| Other gains and (losses) | 4,543,029 | (711,563 | ) | 1,251,358 | (902,391 | ) | ||||||||||
| Profit before tax for the period | $ | 41,405,094 | $ | 28,135,675 | $ | 18,055,820 | $ | 9,548,930 | ||||||||
| Income tax expense | (7,629,792 | ) | (6,780,309 | ) | (3,927,670 | ) | (1,819,944 | ) | ||||||||
| Profit after tax for the period | $ | 33,775,302 | $ | 21,355,366 | $ | 14,128,150 | $ | 7,728,986 | ||||||||
| Profit after tax attributable to: | ||||||||||||||||
| Shareholders of the Company | $ | 26,544,176 | $ | 16,585,182 | $ | 10,967,083 | $ | 5,680,798 | ||||||||
| Non-controlling interest | $ | 7,231,126 | $ | 4,770,184 | $ | 3,161,067 | $ | 2,048,188 | ||||||||
| Earnings per share | ||||||||||||||||
| Basic earnings per share (Note 6) | $ | 0.93 | $ | 0.58 | $ | 0.38 | $ | 0.20 | ||||||||
| Diluted earnings per share (Note 6) | $ | 0.92 | $ | 0.58 | $ | 0.38 | $ | 0.20 | ||||||||
(The accompanying notes are an integral part of these condensed interim consolidated financial statements)
| 5 |
Amira Nature Foods Ltd
Condensed Consolidated Statements of Comprehensive Income
(Amounts in USD)
| Nine months ended | Three months ended | |||||||||||||||
| December 31, 2014 (Unaudited) | December 31, 2013 (Unaudited) | December 31, 2014 (Unaudited) | December 31, 2013 (Unaudited) | |||||||||||||
| Profit after tax for the period | $ | 33,775,302 | $ | 21,355,366 | $ | 14,128,150 | $ | 7,728,986 | ||||||||
| Other comprehensive income | ||||||||||||||||
| Items that may be reclassified subsequently to profit or loss: | ||||||||||||||||
| Available for sale financial assets: | ||||||||||||||||
| Current period gain/(loss) | 48,434 | (14,536 | ) | 18,304 | 9,258 | |||||||||||
| Reclassification to profit or loss | - | - | - | - | ||||||||||||
| Income tax | (11,622 | ) | 4,941 | (6,222 | ) | (3,147 | ) | |||||||||
| $ | 36,812 | $ | (9,595 | ) | $ | 12,082 | $ | 6,111 | ||||||||
| Cash flow hedging reserve: | ||||||||||||||||
| Current period gain/(loss) | 1,948,914 | (8,090,011 | ) | 281,214 | 2,976,006 | |||||||||||
| Reclassification to profit or loss | (2,872,337 | ) | 3,281,293 | (284,792 | ) | 1,072,748 | ||||||||||
| Income tax | 313,871 | 1,634,483 | 1,216 | (1,376,172 | ) | |||||||||||
| $ | (609,552 | ) | $ | (3,174,235 | ) | $ | (2,362 | ) | $ | 2,672,582 | ||||||
| Currency translation reserve | (8,370,804 | ) | (15,407,013 | ) | (5,036,825 | ) | 2,167,917 | |||||||||
| Other comprehensive income/(loss) for the period, net of tax | $ | (8,943,544 | ) | $ | (18,590,843 | ) | $ | (5,027,105 | ) | $ | 4,846,610 | |||||
| Total comprehensive income for the period | $ | 24,831,758 | $ | 2,764,523 | $ | 9,101,045 | $ | 12,575,596 | ||||||||
| Total comprehensive income for the period attributable to: | ||||||||||||||||
| Shareholders of the Company | $ | 19,357,330 | $ | 1,636,105 | $ | 6,927,407 | $ | 9,575,433 | ||||||||
| Non-controlling interest | $ | 5,474,428 | $ | 1,128,418 | $ | 2,173,638 | $ | 3,000,163 | ||||||||
(The accompanying notes are an integral part of these condensed interim consolidated financial statements)
| 6 |
Amira Nature Foods Ltd
Condensed Consolidated Statements of Changes in Equity
(Amounts in USD)
| Other reserves | ||||||||||||||||||||||||||||||||||||||||||||
| Share capital | Share premium |
Share-based
compensation reserve |
Reserve
for available for sale financial assets |
Currency
translation Reserve |
Cash
flow hedging Reserve |
Restructuring
Reserve |
Retained
earnings |
Equity
attributable to shareholders of the Company |
Equity
attributable to non - controlling interest |
Total equity | ||||||||||||||||||||||||||||||||||
| Balance as at April 1, 2013 (Audited) | $ | 9,111 | $ | 82,683,926 | $ | 183,514 | $ | (21,561 | ) | $ | (5,582,983 | ) | $ | 258,647 | $ | 9,398,927 | $ | 44,375,024 | $ | 131,304,605 | $ | 12,328,130 | $ | 143,632,735 | ||||||||||||||||||||
| Share based compensation | 4 | 120,824 | 2,679,848 | - | - | - | - | - | $ | 2,800,676 | - | $ | 2,800,676 | |||||||||||||||||||||||||||||||
| Profit after tax for the period | - | - | - | - | - | - | - | 16,585,182 | $ | 16,585,182 | 4,770,184 | $ | 21,355,366 | |||||||||||||||||||||||||||||||
| Other comprehensive income /(loss) for the period | - | - | - | (7,717 | ) | (12,388,151 | ) | (2,553,209 | ) | - | - | $ | (14,949,077 | ) | (3,641,766 | ) | $ | (18,590,843 | ) | |||||||||||||||||||||||||
| Total comprehensive income/(loss) for the period | $ | - | $ | - | $ | - | $ | (7,717 | ) | $ | (12,388,151 | ) | $ | (2,553,209 | ) | $ | - | $ | 16,585,182 | $ | 1,636,105 | $ | 1,128,418 | $ | 2,764,523 | |||||||||||||||||||
| Balance as at December 31, 2013 (Unaudited) | $ | 9,115 | $ | 82,804,750 | $ | 2,863,362 | $ | (29,278 | ) | (17,971,134 | ) | $ | (2,294,562 | ) | $ | 9,398,927 | $ | 60,960,206 | $ | 135,741,386 | $ | 13,456,548 | $ | 149,197,934 | ||||||||||||||||||||
| Balance as at April 1, 2014 (Audited) | $ | 9,115 | $ | 82,804,750 | $ | 2,863,362 | $ | (30,127 | ) | $ | (16,018,401 | ) | $ | 473,664 | $ | 9,398,927 | $ | 74,334,687 | $ | 153,835,977 | $ | 18,005,030 | $ | 171,841,007 | ||||||||||||||||||||
| Share based compensation | 8 | 130,033 | 1,924,136 | - | - | - | - | - | $ | 2,054,177 | - | $ | 2,054,177 | |||||||||||||||||||||||||||||||
| Repurchase of shares from ex-director and cancelled | (4 | ) | (38,186 | ) | - | - | - | - | - | - | $ | (38,190 | ) | - | $ | (38,190 | ) | |||||||||||||||||||||||||||
| Profit after tax for the period | - | - | - | - | - | - | - | 26,544,176 | $ | 26,544,176 | 7,231,126 | $ | 33,775,302 | |||||||||||||||||||||||||||||||
| Other comprehensive income /(loss) for the period | - | - | - | 29,581 | (6,726,604 | ) | (489,823 | ) | - | - | $ | (7,186,846 | ) | (1,756,698 | ) | $ | (8,943,544 | ) | ||||||||||||||||||||||||||
| Total comprehensive income/(loss) for the period | $ | - | $ | - | $ | - | $ | 29,581 | $ | (6,726,604 | ) | $ | (489,823 | ) | $ | - | $ | 26,544,176 | $ | 19,357,330 | $ | 5,474,428 | $ | 24,831,758 | ||||||||||||||||||||
| Balance as at December 31, 2014 (Unaudited) | $ | 9,119 | $ | 82,896,597 | $ | 4,787,498 | $ | (546 | ) | $ | (22,745,005 | ) | $ | (16,159 | ) | $ | 9,398,927 | $ | 100,878,863 | $ | 175,209,294 | $ | 23,479,458 | $ | 198,688,752 | |||||||||||||||||||
(The accompanying notes are an integral part of these condensed interim consolidated financial statements)
| 7 |
Amira Nature Foods Ltd
Condensed Consolidated Statements of Cash Flows
(Amounts in USD)
| Nine months ended | ||||||||
| December 31, 2014 (Unaudited) | December 31, 2013 (Unaudited) | |||||||
| (A) CASH FLOW FROM OPERATING ACTIVITIES | ||||||||
| Profit before tax for the period | $ | 41,405,094 | $ | 28,135,675 | ||||
| Adjustments for non-cash items | 4,195,710 | 2,453,905 | ||||||
| Adjustments for non-operating incomes and expenses | 21,433,198 | 16,611,490 | ||||||
| Changes in operating assets and liabilities | (66,896,650 | ) | (37,142,521 | ) | ||||
| $ | 137,352 | $ | 10,058,549 | |||||
| Income taxes paid | (3,063,424 | ) | (2,714,900 | ) | ||||
| Net cash (used in)/ generated from operating activities | $ | (2,926,072 | ) | $ | 7,343,649 | |||
| (B) CASH FLOW FROM INVESTING ACTIVITIES | ||||||||
| Purchase of property, plant and equipment | $ | (1,709,197 | ) | $ | (1,364,502 | ) | ||
| Purchase of intangible assets | (2,498 | ) | (298,763 | ) | ||||
| Proceeds from sale of property, plant and equipment | 1,614 | 5,332 | ||||||
| Proceeds from term deposits | 12,497,806 | 12,883,590 | ||||||
| Investments in term deposits | (13,671,865 | ) | (14,005,325 | ) | ||||
| Purchase of short term investments | (41,300 | ) | (4,145 | ) | ||||
| Proceeds from the sale of short term investments | - | (218,250 | ) | |||||
| Interest income | 625,812 | 1,102,293 | ||||||
| Net cash used in investing activities | $ | (2,299,628 | ) | $ | (1,899,770 | ) | ||
| (C) CASH FLOWS FROM FINANCING ACTIVITIES | ||||||||
| Repurchase of shares from ex-director and cancelled | $ | (38,190 | ) | $ | - | |||
| Net proceeds from short term debt | 14,217,389 | 17,821,423 | ||||||
| Proceeds from long term debt | 18,150 | 41,445 | ||||||
| Repayment of long term debt | (963,487 | ) | (1,394,134 | ) | ||||
| Interest paid | (16,383,217 | ) | (14,502,897 | ) | ||||
| Net cash (used in)/ generated from financing activities | $ | (3,149,355 | ) | $ | 1,965,837 | |||
| (D) Effect of change in exchange rate on cash and cash equivalents | (2,270,168 | ) | (6,907,131 | ) | ||||
| Net increase/ (decrease) in cash and cash equivalents (A+B+C+D) | $ | (10,645,223 | ) | $ | 502,585 | |||
| Cash and cash equivalents at the beginning of the period | 37,606,098 | 33,270,338 | ||||||
| Cash and cash equivalents at the end of the period | $ | 26,960,875 | $ | 33,772,923 | ||||
(The accompanying notes are an integral part of these condensed interim consolidated financial statements)
| 8 |
Amira Nature Foods Ltd
Notes to condensed interim consolidated financial statements
| 1. | Background and nature of operations |
Amira Nature Foods Ltd (‘‘ANFI” or ‘‘the Company’’) and its subsidiaries (hereinafter together referred to as ‘‘Amira’’ or the “Amira Group’’) are engaged primarily in the business of processing and selling packaged Indian specialty rice, primarily basmati rice and other food products. The Amira Group sells these products to buyers including distributors and retail chains in India and Internationally (including Asia Pacific, Europe, Middle East, North Africa and North America). The Amira Group has currently one rice processing plant which is located in Gurgaon, India.
ANFI was incorporated on February 20, 2012 and is domiciled in the British Virgin Islands. The principal office of the Company is located at 29E, A.U. Tower Jumeirah Lake Towers Dubai, United Arab Emirates.
| 2. | Basis of preparation |
These condensed interim consolidated financial statements are prepared in compliance with International Accounting Standard (IAS) 34, “Interim financial reporting” as issued by International Accounting Standards Board (IASB). These condensed interim consolidated financial statements should be read in conjunction with the Amira Group’s annual consolidated financial statements and related notes included in the Company’s annual report on Form 20-F for the fiscal year ended March 31, 2014.
The accounting policies applied are consistent with the policies that were applied for the preparation of the consolidated financial statements for the fiscal year ended March 31, 2014.
| 3. | Fair value hierarchy |
The following table presents fair value hierarchy of assets and liabilities measured at fair value on a recurring basis:
| Fair value measurements at reporting date using | ||||||||||||
| December 31, 2014 (Unaudited) | Total | Level 1 | Level 2 | |||||||||
| Assets | ||||||||||||
| Derivative assets | ||||||||||||
| Forward contracts | $ | 260,034 | $ | - | $ | 260,034 | ||||||
| Available for sale financial assets | ||||||||||||
| Mutual funds in units | 427,872 | 427,872 | - | |||||||||
| Listed securities | 82,730 | 82,730 | - | |||||||||
| Liabilities | ||||||||||||
| Derivative liabilities | ||||||||||||
| Forward contracts | $ | 489,466 | $ | - | $ | 489,466 | ||||||
| Fair value measurements at reporting date using | ||||||||||||
| March 31, 2014 (Audited) | Total | Level 1 | Level 2 | |||||||||
| Assets | ||||||||||||
| Derivative assets | ||||||||||||
| Forward contracts | $ | 2,352,886 | $ | - | $ | 2,352,886 | ||||||
| Available for sale financial assets | ||||||||||||
| Mutual funds in units | 393,763 | 393,763 | - | |||||||||
| Listed securities | $ | 58,672 | $ | 58,672 | $ | - | ||||||
| 4. | Related party transactions |
Mr. Karan A. Chanana is the principal shareholder of ANFI and as of December 31, 2014, he held majority effective interest (including 7,005,434 ordinary shares issuable pursuant to the Exchange Agreement and 721,535 share options granted and vested pursuant to the 2012 Omnibus Securities and Incentive Plan) in ANFI.
The Amira Group's related parties include transactions with key management personnel ("KMP") and enterprises over which KMP are able to exercise control/significant influence. All the directors (both executive and others) of ANFI and Ms. Anita Daing (a director of Amira Pure Foods Private Limited “APFPL”) are considered as KMP for related party transactions disclosures.
| 9 |
| 4.1 | Transactions with KMP |
| Nine months ended | Three months ended | |||||||||||||||
| Transactions during the period | December 31, 2014 (Unaudited) | December 31, 2013 (Unaudited) | December 31, 2014 (Unaudited) | December 31, 2013 (Unaudited) | ||||||||||||
| Short term employee benefits | $ | 1,246,063 | $ | 891,641 | $ | 443,796 | $ | 266,361 | ||||||||
| Share-based compensation: | ||||||||||||||||
| - expense recognized on share options granted | - | 2,679,848 | - | 2,553,276 | ||||||||||||
| - expense recognized on share awards granted | 1,924,136 | 120,829 | 1,736,913 | 92,579 | ||||||||||||
| Defined benefit plan – Gratuity | 1,282 | 1,306 | 421 | 421 | ||||||||||||
| Rent expense | 3,112 | 3,169 | 1,021 | 1,021 | ||||||||||||
| Loan repaid | - | 4,432 | - | - | ||||||||||||
| Interest expense | 95,299 | 88,936 | 31,481 | 28,704 | ||||||||||||
| Outstanding Balances | December 31, 2014 (Unaudited) | March 31, 2014 (Audited) | ||||||
| Salary and bonus payable | $ | 668,134 | $ | 510,600 | ||||
| Loan payable | 1,163,190 | 1,170,492 | ||||||
| Rent payable | 17,945 | 4,208 | ||||||
All of the above payables are short term and carry no collateral. Loan payable as at December 31, 2014 and March 31, 2014 carry an interest rate of 11% per annum, compounded on daily basis.
| 4.2 | Guarantee given by KMP |
Mr. Karan A. Chanana (Chairman and Chief Executive Officer of ANFI) and Ms. Anita Daing (a director of APFPL) have issued personal guarantees in favor of consortium of banks that granted APFPL its outstanding term loans and secured revolving credit facilities. Under these personal guarantees Mr. Karan A. Chanana and Ms. Anita Daing have guaranteed the repayment of term loans and secured revolving credit facilities up to a limit of $223,753,570 and $197,301,128 as at December 31, 2014 and March 31, 2014, respectively. ANFI has indemnified its directors and officers, including Mr. Karan A. Chanana and Ms. Anita Daing as permitted by ANFI’s amended and restated memorandum and articles of association and pursuant to indemnification agreements entered into with such directors and officers. Such indemnification will include indemnification for the personal guarantees provided by Mr. Karan A. Chanana and Ms. Anita Daing as described above.
| 4.3 | Transactions with enterprises over which KMP are able to exercise control/significant influence |
| Nine months ended | Three months ended | |||||||||||||||
| Transactions during the period | December 31, 2014 (Unaudited) | December 31, 2013 (Unaudited) | December 31, 2014 (Unaudited) | December 31, 2013 (Unaudited) | ||||||||||||
| Advance paid in quarter ended September 30, 2014 for purchase of Office premises, which has been adjusted in quarter ended December 31, 2014 | $ | 272,220 | $ | - | $ | - | $ | - | ||||||||
| Purchase of Office premises in quarter ended December 31, 2014 against advance given as mentioned above | 272,220 | - | 272,220 | - | ||||||||||||
| Outstanding balances | December 31, 2014 (Unaudited) | March 31, 2014 (Audited) | ||||||
| Trade payable | $ | 48 | $ | 51 | ||||
| Advances receivable | 142,176 | 152,576 | ||||||
| 10 |
| 5. | Equity |
Shares issued and authorized are summarized as follows:
| Shares issued and fully paid: | No. of Shares |
| Balance as at April 1, 2012 | 19,660,000 |
| Shares issued during the year ended March 31, 2013 | 9,000,000 |
| Shares issued under share-based compensation plan during the year ended March 31, 2013 and 2014 | 14,997 |
| Total Shares issued and fully paid as at March 31, 2014 | 28,674,997 |
| Shares issued under the share-based compensation plan during the nine months ended December 31, 2014 | 8,986 |
| Repurchase of shares issued under the share-based compensation plan and cancelled, from one of the ex-directors | (3,819) |
| Total shares issued and fully paid as at December 31, 2014 (A) | 28,680,164 |
| Shares issuable pursuant to exchange agreement* (B) | 7,005,434 |
| Total (C) = (A) + (B) | 35,685,598 |
|
Shares authorized for share-based compensation (Net of 20,164 shares already issued to directors till December 31, 2014) |
3,942,662 |
|
On October 17, 2014, the Compensation Committee of the Company has approved the grant of 100,000 ordinary equity shares to Mr. Karan A Chanana based on the 2012 Omibus Securities and Incentive Plan. The grant is subject to specified performance targets being achieved for the year ended March 31, 2015. For this share grant, the Company has recorded an expense of $1,612,000 and $1,612,000 during the nine months and three months period ended December 31, 2014.
| |
| *Represents ordinary shares issuable to NCI shareholders in APFPL pursuant to an exchange agreement. |
| 6. | Earnings per Share |
Earnings per share has been calculated using outstanding shares of ANFI which are reflected in the table below.
| Nine months ended | Three months ended | |||||||||||||||
| December 31, 2014 (Unaudited) | December 31, 2013 (Unaudited) | December 31, 2014 (Unaudited) | December 31, 2013 (Unaudited) | |||||||||||||
| Profit attributable to Shareholders of the Company (A) | $ | 26,544,176 | $ | 16,585,182 | $ | 10,967,083 | $ | 5,680,798 | ||||||||
| Weighted average number of shares: | ||||||||||||||||
| - For calculation of basic earnings per share (B) | 28,677,018 | 28,672,134 | 28,679,439 | 28,674,389 | ||||||||||||
| - Dilutive impact of stock options as converted in equivalent number of shares (C) | 239,016 | 138,785 | 225,944 | 231,445 | ||||||||||||
| For diluted earnings per share (D) = (B) + (C) | 28,916,034 | 28,810,919 | # | 28,905,383 | * | 28,905,834 | # | |||||||||
| Basic earnings per share (A) ÷ (B) | $ | 0.93 | $ | 0.58 | $ | 0.38 | $ | 0.20 | ||||||||
| Diluted earnings per share (A) ÷ (D) | $ | 0.92 | $ | 0.58 | $ | 0.38 | $ | 0.20 | ||||||||
The Company has granted an option to NCI shareholders in APFPL to exchange shares in ANFI at a pre- determined share swap ratio. The swap ratio is reflective of fair values of the shares and therefore, the option is not considered as dilutive.
* The dilutive impact of total share options of 721,535 granted to Mr. Karan A. Chanana through the three months ended December 2014, is negligible and hence there is no impact on the presented basic and diluted earnings per share in the table above.
# The effect of 721,535 share options granted to Mr. Karan A. Chanana through the three and nine months ended December 2013 was negligible and hence there is no impact on the presented basic and diluted earnings per share in the table above.
| 11 |
| 7. | Inventories |
Inventories comprise the following:
| December 31, 2014 (Unaudited) | March 31, 2014 (Audited) | |||||||
| Raw materials | $ | 5,547,564 | $ | 62,914,367 | ||||
| Finished goods | 246,623,656 | 190,561,778 | ||||||
| Stores, spares and others | 1,581,735 | 1,476,404 | ||||||
| Total | $ | 253,752,955 | $ | 254,952,549 | ||||
The cost of inventories expensed during the three and nine months ended December 31, 2014 was $152,652,465 (December 31, 2013: $107,379,098) and $371,212,124 (December 31, 2013: $276,836,002), respectively.
No inventory write downs or reversals are recognized for the three and nine months ended December 31, 2014 and 2013.
| 8. | Prepayments |
Prepayments include $9,893,567 as of December 31, 2014 (March 31, 2014: $7,745,972) in respect of advances made to suppliers, for purchase of inventory.
| 9. | Current liabilities – Debt |
| December 31, 2014 (Unaudited) | March 31, 2014 (Audited) | |||||||
| Working capital debt | $ | 182,921,878 | $ | 179,085,080 | ||||
| Loan from Mr. Karan A. Chanana | 1,163,190 | 1,170,492 | ||||||
| $ | 184,085,068 | $ | 180,255,572 | |||||
| Add: Current portion of long term debt | 1,347,404 | 1,847,775 | ||||||
| Total | $ | 185,432,472 | $ | 182,103,347 | ||||
Working capital debt represents credit limits from banks with renewal period not exceeding one year. The Amira Group's property, plant and equipment, trade receivables and inventories with a carrying value of $21,605,820 (March 31, 2014: $23,104,444), $11,530,018 (March 31, 2014: $19,668,385), and $235,267,592 (March 31, 2014: $249,894,991), respectively have been pledged as collateral to secure repayment of these debts. This working capital debt carries floating rates of interest.
Loan from Mr. Karan A. Chanana comprises debt taken from a director of the Company that is payable on demand and carries a fixed rate of interest of 11% per annum, compounded daily.
The annualized weighted average interest rates (including corresponding bank processing charges and fees) for each of the reporting periods for working capital debt and debt from related party are as follows:
| December 31, 2014 (Unaudited) | March 31, 2014 (Audited) | |||||||
| Working capital debt | 12.51 | % | 11.84 | % | ||||
| Debt from a related party | 11.60 | % | 11.60 | % | ||||
| 10. | Capital Commitments |
Capital commitments net of advance amounted to $9.2 million and $6.9 million as of December 31, 2014 and March 31, 2014 respectively.
| 11. | Events after the reporting period |
There have been no material events other than disclosed in the financial statement after reporting date which would require disclosure or adjustments to the condensed interim consolidated financial statements as of and for the three and nine months ended December 31, 2014.
| 12. | Authorization of financial statements |
These condensed interim consolidated financial statements for the three and nine months ended December 31, 2014 and 2013 were approved and authorized for issue by the Board of Directors on March 1, 2015.
| 12 |
MANAGEMENT’S DISCUSSION AND ANALYSIS OF FINANCIAL CONDITION AND RESULTS OF OPERATIONS
You should read the following discussion in conjunction with our consolidated financial statements and the related notes included elsewhere in this Report. We urge you to carefully review and consider the various disclosures made by us in this Report and in our other SEC filings, including our Annual Report on Form 20-F for the year ended March 31, 2014. Some of the statements in the following discussion are forward-looking statements. See “Forward-Looking Statements.”
Overview
We are a leading global provider of branded packaged Indian specialty rice and other related rice based products, with sales in over 60 countries. We generate the majority of our revenue through the sale of Basmati rice, a premium long-grain variety of rice grown only in certain regions of the Indian sub-continent, under our flagship Amira brand, as well as under other third party brands. We have developed a complete line of Amira branded products to complement our packaged rice offerings, including snacks, ready-to-heat meals and a growing line of organic product offerings. We also sell other products such as wheat, barley, legumes and other produce. Our fourth generation leadership has built on a rich, century-old legacy and transformed Amira from a local family-run business to a publicly-listed globally focused packaged food company with a leadership position in the high growth Basmati rice sector.
We sell our products globally in both developed and emerging markets through a broad distribution network. Our Amira branded products are currently sold in more than 40 countries by global retailers such as Asda, Reliance Retail Limited, Big Bazaar, Carrefour, Costco, Easyday, Jetro Restaurant Depot, Lulu’s, Metro Cash & Carry, Morrisons, Panda, Smart & Final, Spar, Spencer’s and Tesco. In emerging markets, our products are sold by global retailers and regional supermarkets (“the modern trade”), as well as a network of small, privately-owned independent stores, which are also known as general trade or traditional retail. We had established nine company-managed distribution centers in India till December 31, 2014. We target having company-managed distribution centers in six additional major cities in India by the end of the fiscal 2015, which we expect will result in greater market penetration and higher margins. We maintain a strong distribution platform into the restaurant channel and have a longstanding network of third party branded partners who sell our products in 40 countries throughout the rest of the world.
We have successfully expanded the Amira brand into more than 40 countries and are investing resources to further establish our brand as a premium, high quality packaged Basmati brand. We have tailored our strategy to local market requirements and continuously focus on strengthening our brand and developing new value-added products. Since 2010, Amira has been recognized each year by the World Economic Forum as a Global Growth Company, an invitation-only community consisting of approximately 300 of the world’s fastest-growing corporations, including companies such as illycaffé SpA and Intralinks. In 2011 and 2013, Planman Marcom recognized the Amira brand as one of only six food Power Brands in our Indian market, based on a survey of Indian consumers, along with such other brands as United Breweries, Britannia, Dabur, Godrej and Tata. In 2013, Amira was voted as one of “Asia’s Most Promising Brand” by the WCRC group. Additionally, Inc. India, a leading Indian business magazine, has recognized Amira as one of India’s fastest growing mid-sized companies in every year since 2010. The Amira brand remains the foundation of our expansion strategy and it continues to gain traction with customers as a trusted standard of premium quality. In 2013, Bharti Retail named Amira its Indian Best Partner in the “Staples” category. The Amira brand has also been recognized as “The Admired Brand of India” for the year 2014-15 by VWP World Brands.
We are vertically integrated and participate across the rice supply chain beginning with the procurement of paddy (or unprocessed rice) to its storage, aging, processing into rice, packaging, distribution and marketing. We have multigenerational relationships with more than 200,000 local Indian paddy farmers and a large network of procurement agents which allow us to consistently source high-quality paddy. Over the past several years, we have implemented an organic sourcing initiative and currently have relationships with more than 7,500 farmers practicing organic farming in India. We operate a state-of-the-art, fully-automated and integrated processing and milling facility that is strategically located in the vicinity of the key Basmati rice paddy producing regions of northern India. The facility spans a covered area of approximately 310,000 square feet, with a processing capacity of approximately 24 metric tons of paddy per hour. We had previously secured 48.2 acres of land in Karnal Haryana, India and have begun construction of our new processing facility which we expect to increase our production capacity to more than 60 metric tons per hour. Additionally, we have relationships with several independent rice millers throughout India which supplement our production capacity to fully meet our growing product needs. We believe our flexible, vertically integrated model provides us with significant advantages in ensuring stability of supply and maintaining quality control throughout the processing cycle.
The global rice market represented approximately $275 billion in value, according to statistics from the Horizon Research based on benchmark rice export prices for the international rice trade. The Indian rice industry was valued at approximately $50 billion in wholesale prices in fiscal 2013, within which the Indian Basmati rice segment is large and growing and was valued at approximately $4.2 billion, according to the CRISIL Research Report on the Indian Rice Industry. The Basmati rice segment has benefited from increased consumption trends both within India and internationally. According to CRISIL research, volume sales in India increased at a 15% CAGR between 2008 and 2013 while international volume sales increased at a 24% CAGR during the same time period. International sales of Indian Basmati rice have also benefited from favorable pricing trends and value sales have grown at a 30% CAGR between 2008 and 2013. We believe that global demand for Basmati and other specialty rice will continue to outpace the growth of the overall rice industry.
| 13 |
As of December 31, 2014 and 2013, we had 474 and 455 full time employees, respectively. As of December 31, 2014, we had 75 employees working in our finance, accounting & legal department, 255 working in sales, marketing & distribution, 45 working in HR, IT & administration, and 99 working in operations and processing facility. We support our sales force using a marketing strategy including extensive media advertising in both Indian and international markets. We use television, radio and print advertisements to reach our end users in order to promote the Amira brand name.
Corporate Structure
For information regarding Corporate Structure, see Item 4. INFORMATION ON THE COMPANY – “Corporate Structure” contained in the Company’s annual report on Form 20-F for the year ended March 31, 2014. There is no significant change in the corporate structure after March 31, 2014.
Results of Operations
Our results of operations for the three and nine months ended December 31, 2014 and 2013, respectively, were as follows:
| Nine months ended | Three months ended | |||||||||||||||
| December 31, 2014 (Unaudited) | December 31, 2013 (Unaudited) | December 31, 2014 (Unaudited) | December 31, 2013 (Unaudited) | |||||||||||||
| Revenue | $ | 472,607,849 | $ | 360,774,711 | $ | 192,407,304 | $ | 142,478,370 | ||||||||
| Other income | 92,692 | 108,120 | 18,033 | 13,057 | ||||||||||||
| Cost of material | (427,274,003 | ) | (291,031,271 | ) | (159,601,896 | ) | (109,089,976 | ) | ||||||||
| Change in inventory of finished goods | 56,061,879 | 14,195,269 | 6,949,431 | 1,710,878 | ||||||||||||
| Employee benefit expenses | (9,763,317 | ) | (9,103,034 | ) | (4,344,311 | ) | (4,850,720 | ) | ||||||||
| Depreciation and amortization | (1,778,915 | ) | (1,472,270 | ) | (576,736 | ) | (521,070 | ) | ||||||||
| Freight, forwarding and handling expenses | (14,011,609 | ) | (15,907,424 | ) | (4,595,471 | ) | (6,045,737 | ) | ||||||||
| Other expenses | (17,638,443 | ) | (12,101,245 | ) | (6,071,914 | ) | (5,644,163 | ) | ||||||||
| $ | 58,296,133 | $ | 45,462,856 | $ | 24,184,440 | $ | 18,050,639 | |||||||||
| Finance costs | (23,066,231 | ) | (18,864,147 | ) | (7,928,780 | ) | (8,284,701 | ) | ||||||||
| Finance income | 1,632,163 | 2,248,529 | 548,802 | 685,383 | ||||||||||||
| Other gains and (losses) | 4,543,029 | (711,563 | ) | 1,251,358 | (902,391 | ) | ||||||||||
| Profit before tax for the period | $ | 41,405,094 | $ | 28,135,675 | $ | 18,055,820 | $ | 9,548,930 | ||||||||
| Income tax expense | (7,629,792 | ) | (6,780,309 | ) | (3,927,670 | ) | (1,819,944 | ) | ||||||||
| Profit after tax for the period | $ | 33,775,302 | $ | 21,355,366 | $ | 14,128,150 | $ | 7,728,986 | ||||||||
| Profit after tax attributable to: | ||||||||||||||||
| Shareholders of the Company | $ | 26,544,176 | $ | 16,585,182 | $ | 10,967,083 | $ | 5,680,798 | ||||||||
| Non-controlling interest | $ | 7,231,126 | $ | 4,770,184 | $ | 3,161,067 | $ | 2,048,188 | ||||||||
| Earnings per share(1) | ||||||||||||||||
| Basic earnings per share | $ | 0.93 | $ | 0.58 | $ | 0.38 | $ | 0.20 | ||||||||
| Diluted earnings per share | $ | 0.92 | $ | 0.58 | $ | 0.38 | $ | 0.20 | ||||||||
| (1) | Basic earnings per share is calculated by dividing our profit after tax as reduced by the amount of a non-controlling interest reflecting the remaining 19.6% of Amira India that is not owned by us, by the number of our weighted average outstanding ordinary shares, during the applicable period. Diluted earnings per share is calculated by dividing our profit after tax as reduced by the amount of a non-controlling interest reflecting the remaining 19.6% of Amira India that is not owned by us, by the number of our weighted average outstanding ordinary shares adjusted by the dilutive impact of equivalent stock options granted. For three months ended December 31, 2014, the dilutive impact of total share options of 721,535 granted to Mr. Karan A. Chanana through December 31, 2014, is negligible and hence there is no impact on the presented basic and diluted earnings per share in the table above. For three and nine months ended December 31, 2013, the dilutive impact of total share options of 721,535 granted to Mr. Karan A. Chanana through December 31, 2013, was negligible and hence there is no impact on the presented basic and diluted earnings per share in the table above. |
| 14 |
Comparison of the nine months ended December 31, 2014 and 2013
For the nine months ended December 31, 2014, we had revenues of $472.6 million, adjusted EBITDA of $66.5 million, and adjusted profit after tax of $35.7 million. Our revenue increased by $111.8 million or 31.0% for the nine months ended December 31, 2014 to $472.6 million from $360.8 million for the prior year’s nine month period. Our adjusted EBITDA increased by $17.5 million or 35.7% to $66.5 million for the nine months ended December 31, 2014 from $49.0 million for the prior year’s nine month period. Our adjusted profit after tax increased by $11.5 million or 47.8% to $35.7 million for the nine months ended December 31, 2014 from $24.2 million for the prior year’s nine month period. For the reconciliation of above mentioned non-IFRS measures with IFRS measures, please refer section “Non-IFRS Financial Measures”.
Revenue
Revenue increased by $111.8 million, or 31.0%, to 472.6 million in the nine months ended December 31, 2014 from $360.8 million in the nine months ended December 31, 2013. The revenue increase was primarily due to increased sales volume, price and product mix of rice in India and internationally.
During the nine months ended December 31, 2014, sales of our Amira branded and third party branded products increased by $134.3 million or 42.0% to $454.0 million from $319.7 million in the prior year’s nine month period. Our total sales consists of Amira branded, third party branded and institutional sales. Our Amira branded and third party branded sales contributed to 96.1% of our total sales for the period, up from 88.6% in the prior year’s nine month period. During the nine months ended December 31, 2014 our institutional sales were $18.6 million or 3.9% of our total sales for the period. During the nine months ended December 31, 2013, our institutional sales were $41.1 million or 11.4% of our total sales for the period.
During the nine months ended December 31, 2014, our revenue from international sales increased by $65.8 million or 31.4% to $274.9 million from $209.1 million in the prior year’s nine month period, while our revenue from sales in India increased by $46.0 million or 30.4% to $197.7 million from $151.6 million in the prior year’s nine month period. Revenue growth in India was negatively impacted by the depreciation of the Indian rupee against the U.S. dollar during the nine months ended December 31, 2014 as compared to December 31, 2013. Our sales in India grew by approximately 32.5% during the nine months ended December 31, 2014 as compared to December 31, 2013, when measured in Indian rupees. During the nine months ended December 31, 2014, our revenue from international sales contributed 58.2% of total sales, while revenue from sales in India contributed 41.8% of total sales. During the nine month period ended December 31, 2013, our revenue from international sales contributed 58.0% of total sales, while revenue from sales in India contributed 42.0% of total sales.
Other income
Other income was $92,692 in the nine months ended December 31, 2014 compared to $108,120 in the nine months ended December 31, 2013.
Cost of material, including change in inventory of finished goods
Cost of material including change in inventory of finished goods increased by $94.4 million, or 34.1%, to $371.2 million in the nine months ended December 31, 2014 from $276.8 million in the nine months ended December 31, 2013, primarily reflecting the growth in our revenue. Since we age rice, the higher cost of raw material in the procurement season of FY14 has been impacting our Cost of material including change in inventory of finished goods this year. Accordingly, as a percentage of revenue, cost of material including change in inventory of finished goods increased to 78.5% in the nine months ended December 31, 2014 as compared to 76.7% in the nine months ended December 31, 2013. Our cost of material including change in inventory of finished goods as a percentage of revenue, was negatively impacted due to exchange fluctuation on revenue which has been partially offset by a foreign exchange gain/ (loss) based on our hedging policy. Accordingly, our cost of material including change in finished goods as a percentage of revenue plus foreign exchange gain/ (loss) (due to hedging of foreign exchange risk) increased marginally to 78.1% as compared to 77.4% in the corresponding period in the prior year.
Employee benefit expenses
Employee benefit expenses increased by $0.7 million, or 7.3%, to $9.8 million in the nine months ended December 31, 2014 from $9.1 million in the nine months ended December 31, 2013. The non-cash charge for share awards during nine months ended December 31, 2014 is $1.9 million as compared to non-cash charge for share awards and options of $2.8 million for same period last year, showing a decrease of $0.9 million which is more than offset by increase in the number of employees across function to support business growth resulting into net increase of $0.7 million in employee benefit expenses. Accordingly, as a percentage of revenue, employee benefit expenses were 2.1% and 2.5% in the nine months ended December 31, 2014 and 2013, respectively.
| 15 |
Depreciation and amortization
Depreciation and amortization expense increased to $1.8 million in the nine months ended December 31, 2014 as compared to $1.5 million in the nine months ended December 31, 2013. As a percentage of revenue, depreciation and amortization costs remained same as of 0.4% as in the nine months ended December 31, 2014 and 2013.
Freight, forwarding and handling expenses
Freight, forwarding and handling expenses decreased by $1.9 million, or 11.9 % to $14.0 million in the nine months ended December 31, 2014 from $15.9 million in the nine months ended December 31, 2013, primarily due to more shipments involving free on board (FOB) terms during the nine months ended December 31, 2014, as compared to last year same period when we had higher incident of sales involving payment of shipping, insurance and freight costs. As a percentage of revenue, freight, forwarding and handling expenses were 3.0% and 4.4% in the nine months ended December 31, 2014 and 2013, respectively.
Other expenses
Other expenses increased by $5.5 million, or 45.8% to $17.6 million in the nine months ended December 31, 2014 from $12.1 million in the nine months ended December 31, 2013. As a percentage of revenue, other expenses were 3.7% in the nine months ended December 31, 2014 as compared to 3.4% in the nine months ended December 31, 2013. The increase was primarily due to an increase in legal & professional, advertising & business promotion expenses and travel & conveyance which are in line with our business growth.
Finance costs
Finance costs were $23.1 million in the nine months ended December 31, 2014, as compared to $18.9 million in the nine months ended December 31, 2013. Finance costs increased by $4.2 million as a result of an increase in our debt, which was $187.1 million at the end of December 31, 2014 compared to $160.3 million at the end of December 31, 2013. The increase in debt during the period is consistent with the working capital requirements of our publicly stated growth forecasts.
Finance income
Finance income has marginally decreased to $1.6 million in the nine months ended December 31, 2014 compared to $2.2 million in the nine months ended December 31, 2013.
Other gains and (losses)
Other gains and (losses) increased by $5.2 million, to a gain of $4.5 million in the nine months ended December 31, 2014 from a loss of $0.7 million in the nine months ended December 31, 2013. This is primarily due to foreign exchange gain for hedging revenue.
Profit before tax
Profit before tax increased by $13.3 million, or 47.2% to $41.4 million in the nine months ended December 31, 2014 from $28.1 million in the nine months ended December 31, 2013. This increase was primarily due to an increase in revenue from both our Indian and international markets. Our key strategy of focusing on emerging growth markets supported this growth in profits. Profit before tax as a percentage of revenue was 8.8% and 7.8%% in the nine months ended December 31, 2014 and nine months ended December 31, 2013, respectively.
Income tax expense
Corporate tax expense was $7.6 million and our effective tax rate was 18.4% in the nine months ended December 31, 2014. This compares favorably to our nine months ended December 31, 2013 corporate tax expense of $6.8 million and effective tax rate of 24.1%. The reduction in effective tax rate was primarily due to relatively higher contribution of revenue and corresponding profit from lower tax jurisdictions in nine months ended December 2014.
Profit after tax
Profit after tax increased by $12.4 million, or 58.2%, to $33.8 million in the nine months ended December 31, 2014 from $21.4 million in the nine months ended December 31, 2013, primarily due to increase in our revenue. Profit after tax as a percentage of revenue was 7.1% and 5.9% in the nine months ended December 31, 2014 and nine months ended December 31, 2013, respectively.
Comparison of the three months ended December 31, 2014 and 2013
For the quarter ended December 31, 2014, we had revenue of $192.4 million, adjusted EBITDA of $27.7 million, and adjusted profit after tax of $15.9 million. Our revenue increased by $49.9 million or 35.0% to $192.4 million in the quarter ended December 31, 2014 from $142.5 million in the prior year’s period. Our adjusted EBITDA increased by $7.4 million or 36.6% to $27.7 million in the quarter ended December 31, 2014 from $20.3 million in the prior year’s period. Our adjusted profit after tax increased by $5.5 million or 52.9% to $15.9 million from $10.4 million in the prior year’s three month period. For the reconciliation of above mentioned non-IFRS measures with IFRS measures, please refer section “Non-IFRS Financial Measures”.
| 16 |
Revenue
Revenue increased by $49.9 million, or 35.0%, to $192.4 million in the three months ended December 31, 2014 from $142.5 million in the three months ended December 31, 2013. The revenue increase was primarily due to increased sales volume and product mix of rice in India and internationally.
During the three months ended December 31, 2014, sales of our Amira branded and third party branded products increased by $39.9 million or 29.2% to $176.4 million from $136.5 million in the prior year’s three month period. Our Amira branded and third party branded sales contributed to 91.7% of our total sales for the period, down from 95.8% in the prior year’s three month period. During the three months ended December 31, 2014 our institutional sales were $16.0 million or 8.3% of our total sales for the period. During the three months ended December 31, 2013, our institutional sales were $5.9 million or 4.2% of our total sales for the period.
During the three months ended December 31, 2014, our revenue from international sales increased by $29.6 million or 38.9% to $105.8 million from $76.2 million in the prior year’s three month period, while our revenue from sales in India increased by $20.3 million or 30.7% to $86.6 million from $66.3 million in the prior year’s three month period. During the three months ended December 31, 2014, our revenue from international sales contributed 55.0% of total sales, while revenue from sales in India contributed 45.0% of total sales. During the three month period ended December 31, 2013, our revenue from international sales contributed 53.5% of total sales, while revenue from sales in India contributed 46.5% of total sales.
Other income
Other income was $18,033 in the three months ended December 31, 2014 compared to $13,057 in the three months ended December 31, 2013.
Cost of material, including change in inventory of finished goods
Cost of material including change in inventory of finished goods increased by $45.3 million, or 42.2%, to $152.7 million in the three months ended December 31, 2014 from $107.4 million in the three months ended December 31, 2013, primarily reflecting the growth in our revenue. Since we age rice, the higher cost of raw material in the procurement season of FY14 has been impacting our Cost of material including change in inventory of finished goods this year. Accordingly, as a percentage of revenue, cost of material including change in inventory of finished goods increased to 79.3% in the three months ended December 31, 2014 as compared to 75.4% in the three months ended December 31, 2013. Our cost of material including change in inventory of finished goods as a percentage of revenue, was negatively impacted due to exchange fluctuation on revenue which has been partially offset by a foreign exchange gain/ (loss) based on our hedging policy. Accordingly, our cost of material including change in finished goods as a percentage of Revenue plus foreign exchange gain/ (loss) (due to hedging of foreign exchange risk) increased to 79.2% as compared to 75.9% in the corresponding period in the prior year.
Employee benefit expenses
Employee benefit expenses decreased by $0.6 million, or 10.4%, to $4.3 million in the three months ended December 31, 2014 from $4.9 million in the three months ended December 31, 2013. The non-cash charge for share awards during the three months ended December 31, 2014 was $1.7 million as compared to non-cash charge for share awards and options of $2.6 million for same period last year, showing a decrease of $0.9 million. Accordingly, as a percentage of revenue, employee benefit expenses were 2.3% and 3.4% in each of the three months ended December 31, 2014 and 2013, respectively.
Depreciation and amortization
Depreciation and amortization expense increased to $0.6 million in the three months ended December 31, 2014 as compared to $0.5 million in the three months ended December 31, 2013. As a percentage of revenue, depreciation and amortization costs were 0.3% and 0.4% in the three months ended December 31, 2014 and 2013, respectively.
Freight, forwarding and handling expenses
Freight, forwarding and handling expenses decreased by $1.4 million to $4.6 million in the three months ended December 31, 2014 from $6.0 million in the three months ended December 31, 2013, primarily due to more shipments involving free on board (FOB) terms during the nine months ended December 31, 2014, as compared to last year same period when we had higher incident of sales involving payment of shipping, insurance and freight costs. during the three months ended December 31, 2014. As a percentage of revenue, freight, forwarding and handling expenses were 2.4% and 4.2% in the three months ended December 31, 2014 and 2013, respectively.
| 17 |
Other expenses
Other expenses increased by $0.5 million, or 7.6% to 6.1 million in the three months ended December 31, 2014 from $5.6 million in the three months ended December 31, 2013. As a percentage of revenue, other expenses were 3.2% in the three months ended December 31, 2014 as compared to 4.0% in the three months ended December 31, 2013. The increase was primarily due to an increase in legal & professional, advertising & business promotion expenses and travel & conveyance which are in line with our business growth.
Finance costs
Finance costs were $7.9 million in the three months ended December 31, 2014, as compared to $8.3 million in the three months ended December 31, 2013. Finance costs decreased by $0.4 million during the three months ended December 31, 2014 as a result of having new working capital limits in Dubai at a lower rate of interest as compared to India.
Finance income
Finance income has marginally decreased to $0.5 million in the three months ended December 31, 2014 compared to $0.7 million in the three months ended December 31, 2013.
Other gains and (losses)
Other gains and (losses) increased by $2.2 million, to a gain of $1.3 million in the three months ended December 31, 2014 from a loss of $0.9 million in the three months ended December 31, 2013.
Profit before tax
Profit before tax increased by $8.6 million, or 89.1% to $18.1 million in the three months ended December 31, 2014 from $9.5 million in the three months ended December 31, 2013. This increase was primarily due to an increase in revenue from both our Indian and international markets. Our key strategy of focusing on emerging growth markets supported this growth in profits. Profit before tax as a percentage of revenue was 9.4% and 6.7% in the three months ended December 31, 2014 and three months ended December 31, 2013, respectively.
Income tax expense
Corporate tax expense was $3.9 million and our effective tax rate was 21.8% in the three months ended December 31, 2014 compared to corporate tax expense of $1.8 million and effective tax rate of 19.1% in the corresponding period in the prior year. The increase in effective tax rate was primarily due to relatively higher contribution of profit from higher tax jurisdictions in three months ended December 2014.
Profit after tax
Profit after tax increased by $6.4 million, or 82.8%, to $14.1 million in the three months ended December 31, 2014 from $7.7 million in the three months ended December 31, 2013, primarily due to increase in our revenue. Profit after tax as a percentage of revenue was 7.3% and 5.4% in the three months ended December 31, 2014 and three months ended December 31, 2013, respectively.
Liquidity and Capital Resources
As of December 31, 2014, we had debt and liabilities in the following amounts:
| · | secured revolving credit facilities, aggregating $145.4 million; |
| · | other facilities, aggregating $37.4 million; |
| · | related party debt, aggregating $1.2 million; |
| 18 |
| · | term loan facilities (including current portion of long term debt amounting to $1.3 million), aggregating $2.9 million; |
| · | vehicle loans (including current portion of vehicle loan amounting to $0.1 million), aggregating $0.2 million; and |
| · | trade payables, aggregating $16.5 million. |
Debt incurred under our secured revolving credit facilities bears interest at variable rates of interest, determined by reference to the relevant benchmark rate. Most of our debt is denominated in Rupees.
As of December 31, 2014, the Amira Group had the following undrawn financing facilities which remained available for drawdown under existing financing arrangements:
| December 31, 2014 (Unaudited) | ||||
| Working capital - fund based | $ | 3,009,835 | ||
| Letter of credit and bank guarantee - non fund based | 18,605,165 | |||
| Total | $ | 21,615,000 | ||
The annualized weighted average interest rates (including corresponding bank processing charges and fees for bank-related facilities) for each of the reporting periods were as follows:
| Interest | Nine months ended December 31, 2014 (Unaudited) | Year ended March 31, 2014 (Audited) | ||||||||
| Working capital debt: | ||||||||||
| Secured revolving credit facilities | Floating Rates of Interest | 13.1 | % | 11.7 | % | |||||
| Other facilities | Floating Rates of Interest | 11.0 | % | 12.2 | % | |||||
| Others: | ||||||||||
| Related party debt | Fixed Rate of Interest | 11.6 | % | 11.6 | % | |||||
| Term loans | Floating Rate of Interest | 12.5 | % | 12.5 | % | |||||
| Vehicle loan | Fixed Rate of Interest | 10.6 | % | 9.2 | % | |||||
| Trade payables* | Fixed Rate of Interest | 21.0 | % | 21.0 | % | |||||
* The Amira Group has paid interest to certain suppliers for the payments made beyond the normal credit period as required under “Association of aartiyas (agents)”.
Our outstanding secured revolving credit facilities and term loans have been secured by, among other things, certain current and fixed assets of Amira India, including property, plant and equipment, and supported by personal guarantees issued by Mr. Karan A. Chanana (our Chairman and Chief Executive Officer) and Ms. Anita Daing (a director of Amira India). Mr. Chanana and Ms. Daing have issued personal guarantees in favor of Canara Bank, the lead bank of a consortium of 12 banks that granted Amira India its outstanding secured revolving credit facilities. Under these personal guarantees, Mr. Chanana and Ms. Daing have guaranteed the repayment of the secured revolving credit facilities, up to a sum of $220.9 million, along with any applicable interest and other charges due to the consortium. In the event that Amira India defaults in its payment obligations, Canara Bank has the right to demand such payment from Mr. Chanana and/or Ms. Daing, who are obligated under the terms of the personal guarantees to make such payment.
Additionally, personal guarantees containing similar terms have been issued by Mr. Chanana and Ms. Daing in favor of Bank of Baroda and ICICI Bank for amounts not exceeding $0.4 million and $2.5 million, respectively, guaranteeing repayment of the term loan facilities availed by Amira India from these banks.
ANFI has indemnified its directors and officers, including Mr. Karan A. Chanana, in accordance with its amended and restated memorandum and articles of association and indemnification agreements entered into with such directors and officers. Such indemnification includes indemnification for Mr. Chanana’s and Ms. Daing’s personal guarantees described above.
Under the terms of some of Amira India’s current secured revolving credit facilities (representing less than 10% of our total debt outstanding as of December 31, 2014), we need the consent of lenders under our current secured revolving credit facilities to declare dividends for any year (i) except out of profits relating to that year after meeting all the financial commitments to the bank(s) and making all other due and necessary provisions and (ii) provided that no default had occurred in any repayment obligations during the year. Additionally, such financing arrangements contain limitations on Amira India’s ability to:
| · | incur additional indebtedness, |
| 19 |
| · | effect a change in Amira India’s capital structure, |
| · | formulate any merger or other similar reorganization such as a scheme of amalgamation, |
| · | implement a scheme of expansion, diversification, modernization, |
| · | make investments by way of shares/debentures or lend or advance funds to or place deposits with any other company, except in the normal course of business, |
| · | create any charge, lien or encumbrance over its assets or any part thereof in favor of any financial institution, bank, company or persons, and |
| · | make certain changes in management or ownership. |
In the nine months ended December 31, 2014 and 2013, we spent $1.7 million and $1.4 million, respectively, on capital expenditures.
Historically, our cash requirements have mainly been for working capital as well as capital expenditures. As of December 31, 2014, our primary sources of liquidity, aside from our secured revolving credit facilities, were $ 27.0 million of cash and cash equivalents and $0.5 million of short term investments, deposits which are available on demand.
We believe that our current cash and cash equivalents, cash flow from operations, debt incurred under our secured revolving credit facilities and other short and long-term loans will be sufficient to meet our anticipated regular working capital requirements and our needs for capital expenditures for at least the next 12 months. We may, however, require additional cash resources to fund the development of our new processing facility or to respond to changing business conditions or other future developments, including any new investments or acquisitions we may decide to pursue.
Since we are currently a holding company, we do not generate cash from operations in order to fund our expenses. Restrictions on the ability of our subsidiaries to pay us cash dividends may make it impracticable for us to use such dividends as a means of funding the expenses of ANFI. However, in the event that ANFI requires additional cash resources, we may conduct certain international operations or transactions through ANFI using transfer pricing principles that involve Amira India or its trading affiliates, or seek third-party sources of financing in the form of debt or equity.
The following table sets forth the summary of our cash flows for the periods indicated:
| Nine months ended | ||||||||
| December 31, 2014 (Unaudited) | December 31, 2013 (Unaudited) | |||||||
| Net cash (used in)/ generated from operating activities | $ | (2.9 | ) | $ | 7.3 | |||
| Net cash used in investing activities | (2.3 | ) | (1.9 | ) | ||||
| Net cash (used in)/ generated from in financing activities | (3.1 | ) | 2.0 | |||||
| Effect of change in exchange rate on cash and cash equivalents | (2.3 | ) | (6.9 | ) | ||||
| Net increase/ (decrease) in cash and cash equivalents | $ | (10.6 | ) | $ | 0.5 | |||
| Cash and cash equivalents at the beginning of the period | 37.6 | 33.3 | ||||||
| Cash and cash equivalents at the end of the period | $ | 27.0 | $ | 33.8 | ||||
Net cash generated from/ (used in) operating activities
In nine months ended December 31, 2014, net cash used in operating activities was $2.9 million in comparison to cash generated of $7.3 million in the nine months ended December 31, 2013, primarily due to significant decrease in payables and increase in receivables largely being offset by increase in profit after tax before non-operating expenses and non-cash items.
Generally, factors that affect our earnings include, among others, sales price and volume, costs and productivity, which similarly also affect our cash flows from or (used in) operations. While management of working capital, including timing of collections and payments, affects operating results only indirectly, its impact on working capital and cash flows provided by operating activities can be significant.
Net cash generated from/ (used in) investing activities
In nine months ended December 31, 2014, net cash used in investing activities was $2.3 million in comparison to cash used of $1.9 million in the nine months ended December 31, 2013.
| 20 |
Net cash used in financing activities
In the nine months ended December 31, 2014, we incurred $14.2 million of additional short term debt and repaid $0.9 million of long term debt along with interest of $16.4 million on total debt which resulted in net outflow of $3.1 million.
Inflation
Our results of operations and financial condition have historically not been significantly affected by inflation because we were able to pass most, if not all, increases in raw materials prices on to our customers through price increases on our products.
Off-Balance Sheet Arrangements
As of December 31, 2014, we had no off-balance sheet arrangements, other than items disclosed under Note 4.2 “Guarantees given by KMP” to the unaudited condensed interim consolidated financial statements and undrawn financial facilities as disclosed under “Liquidity Risk Analysis” section.
Critical Accounting Policies and Estimates
For information regarding Critical Accounting Policies and Estimates, see Item 5. OPERATING AND FINANCIAL REVIEW AND PROSPECTS – “Critical Accounting Policies and Estimates” contained in the Company’s annual report on Form 20-F for the year ended March 31, 2014. There have been no material changes since March 31, 2014 to the critical accounting policies and estimates.
New standards/amendments relevant for the Amira Group adopted from April 1, 2014 and new standards/amendments issued but not yet effective relevant for the Amira Group
There is no material impact due to adoption of new standards/amendments relevant for the Amira Group from April 1, 2014. The accounting pronouncements which were not effective as of December 31, 2014 and have not been applied in preparing these condensed interim consolidated financial statements.
Non-IFRS Financial Measures
In evaluating our business, we consider and use the non-IFRS measures EBITDA, adjusted EBITDA, adjusted profit after tax, adjusted earnings per share, adjusted net working capital and net debt as supplemental measures to review and assess our operating performance. The presentation of these non-IFRS financial measures is not intended to be considered in isolation or as a substitute for the financial information prepared and presented in accordance with IFRS. We define: (1) EBITDA as profit after tax plus finance costs (net of finance income), income tax expense and depreciation and amortization; (2) adjusted EBITDA, as EBITDA plus non-cash expense for share-based compensation for the three and nine months ended December 31, 2014 and 2013, respectively (3) adjusted profit after tax, as profit after tax plus non-cash expense for share-based compensation for three and nine months ended December 31, 2014 and 2013, respectively; (4) adjusted earnings per share as the quotient of: (a) adjusted profit after tax and (b) the sum of our weighted average number of shares (including dilutive impact of share options granted) for the applicable period and the ordinary shares subject to the exchange agreement between us and the non-controlling shareholders of Amira India; (5) adjusted net working capital as total current assets minus: (a) total current liabilities (b) cash and cash equivalents and plus current debt; and (6) net debt as total current and non-current debt minus cash and cash equivalents.
We use both EBITDA and adjusted EBITDA as measures of operating performance to assist in comparing performance from period to period on a consistent basis, as a measure for planning and forecasting overall expectations, for evaluating actual results against such expectations and as a performance evaluation metric, including as part of assessing and administering our executive and employee incentive compensation programs. We believe that the use of both EBITDA and adjusted EBITDA as non-IFRS measures facilitates investors’ assessment of our operating performance from period to period and from company to company by backing out potential differences caused by variations in items such as capital structure (affecting relative finance or interest expenses), non-recurring IPO-related expenses, the book amortization of intangibles (affecting relative amortization expenses), the age and book value of property and equipment (affecting relative depreciation expenses) and other non-cash expenses. We also present these non-IFRS measures because we believe they are frequently used by securities analysts, investors and other interested parties as measures of the financial performance of companies in our industry.
These non-IFRS financial measures are not defined under IFRS and are not presented in accordance with IFRS. These non-IFRS financial measures have limitations as analytical tool, and when assessing our operating performance, investors should not consider it in isolation, or as a substitute for profit/ (loss) or other consolidated statements of operations data prepared in accordance with IFRS. Some of these limitations include, but are not limited to:
| · | it does not reflect our cash expenditures or future requirements for capital expenditures or contractual commitments; |
| · | it does not reflect changes in, or cash requirements for, our working capital needs; |
| · | it does not reflect the finance or interest expenses, or the cash requirements necessary to service interest or principal payments, on our debt; |
| 21 |
| · | it does not reflect income taxes or the cash requirements for any tax payments; |
| · | although depreciation and amortization are non-cash charges, the assets being depreciated and amortized often will have to be replaced in the future, and adjusted net profit, EBITDA and Adjusted EBITDA do not reflect any cash requirements for such replacements; |
| · | other companies may calculate EBITDA, Adjusted EBITDA and other non-IFRS measures differently than we do, limiting the usefulness of this non-IFRS measure as a comparative measure. |
We compensate for these limitations by relying primarily on our IFRS results and using non-IFRS measures only as a supplemental information.
We present adjusted EBITDA, adjusted profit after tax, adjusted earnings per share, adjusted net working capital and net debt because we believe these measures provide additional metrics to evaluate our operations and, when considered with both our IFRS results and the reconciliation to profit after tax, basic and diluted earnings per share, working capital and total current and non-current debt, respectively, provide a more complete understanding of our business than could be obtained absent this disclosure. We also believe that these non-IFRS financial measures are useful to investors in assessing the operating performance of our business after reflecting the adjustments described above.
In the following tables we have provided reconciliation of the non-IFRS measures to the most directly comparable IFRS measure:
- Reconciliation of profit after tax to EBITDA and adjusted EBITDA:
| Nine months ended | Three months ended | |||||||||||||||
| December 31, 2014 | December 31, 2013 | December 31, 2014 | December 31, 2013 | |||||||||||||
| Profit after tax (PAT) | $ | 33,775,302 | $ | 21,355,366 | $ | 14,128,150 | $ | 7,728,986 | ||||||||
| Add: Income tax expense | 7,629,792 | 6,780,309 | 3,927,670 | 1,819,944 | ||||||||||||
| Add: Finance costs (net of finance income) | 21,434,068 | 16,615,618 | 7,379,978 | 7,599,318 | ||||||||||||
| Add: Depreciation and amortization | 1,778,915 | 1,472,270 | 576,736 | 521,070 | ||||||||||||
| EBITDA | $ | 64,618,077 | $ | 46,223,563 | $ | 26,012,534 | $ | 17,669,318 | ||||||||
| Add: Non-cash expenses for share-based compensation | 1,924,136 | 2,800,677 | 1,736,913 | 2,645,855 | ||||||||||||
| Adjusted EBITDA | $ | 66,542,213 | $ | 49,024,240 | $ | 27,749,447 | $ | 20,315,173 | ||||||||
- Reconciliation of profit after tax to adjusted profit after tax:
| Nine months ended | Three months ended | |||||||||||||||
| December 31, 2014 | December 31, 2013 | December 31, 2014 | December 31, 2013 | |||||||||||||
| Profit after tax (PAT) | $ | 33,775,302 | $ | 21,355,366 | $ | 14,128,150 | $ | 7,728,986 | ||||||||
| Add: Non-cash expenses for share-based compensation | 1,924,136 | 2,800,677 | 1,736,913 | 2,645,855 | ||||||||||||
| Adjusted profit after tax | $ | 35,699,438 | $ | 24,156,043 | $ | 15,865,063 | $ | 10,374,841 | ||||||||
| 22 |
- Reconciliation of earnings per share and adjusted earnings per share:
| Nine months ended | Three months ended | |||||||||||||||||
| December 31, 2014 | December 31, 2013 | December 31, 2014 | December 31, 2013 | |||||||||||||||
| Profit after tax (PAT) | $ | 33,775,302 | $ | 21,355,366 | $ | 14,128,150 | $ | 7,728,986 | ||||||||||
| Profit attributable to Shareholders of the Company | (A) | $ | 26,544,176 | $ | 16,585,182 | $ | 10,967,083 | $ | 5,680,798 | |||||||||
| Weighted average number of shares (for basic earnings per share) | (B) | 28,677,018 | 28,672,134 | 28,679,439 | 28,674,389 | |||||||||||||
| Dilutive impact of stock options as converted in equivalent number of shares | (C) | 239,016 | 138,785 | 225,944 | 231,445 | |||||||||||||
| Weighted average number of shares (for diluted earnings per share) | (D) = (B) + C) | 28,916,034 | 28,810,919 | 28,905,383 | 28,905,834 | |||||||||||||
| Shares issuable under exchange agreement | (E) | 7,005,434 | 7,005,434 | 7,005,434 | 7,005,434 | |||||||||||||
| Basic earnings per share as per IFRS | (A) ÷ (B) | $ | 0.93 | $ | 0.58 | $ | 0.38 | $ | 0.20 | |||||||||
| Diluted earnings per share as per IFRS | (A) ÷ (D) | $ | 0.92 | $ | 0.58 | $ | 0.38 | $ | 0.20 | |||||||||
| Profit after tax (PAT) | (F) | $ | 33,775,302 | $ | 21,355,366 | $ | 14,128,150 | $ | 7,728,986 | |||||||||
| Add: Non-cash expenses for share-based compensation | (G) | $ | 1,924,136 | $ | 2,800,677 | $ | 1,736,913 | $ | 2,645,855 | |||||||||
| Adjusted profit after tax | (H) = (F) +(G) | $ | 35,699,438 | $ | 24,156,043 | $ | 15,865,063 | $ | 10,374,841 | |||||||||
| Weighted average number of shares (including dilutive impact of share options granted) and the ordinary shares subject to the exchange agreement between us and the non-controlling shareholders of Amira India | (I) = (D) + (E) | 35,921,468 | 35,816,353 | 35,910,817 | 35,911,268 | |||||||||||||
| Adjusted earnings per share | (H) ÷ (I) | $ | 0.99 | $ | 0.68 | $ | 0.44 | $ | 0.29 | |||||||||
- Reconciliation of working capital (total current assets minus total current liabilities) and adjusted net working capital:
| As at December 31, 2014 | As at March 31, 2014 | |||||||
| (Amount in $) | ||||||||
| Current assets: | ||||||||
| Inventories | 253,752,955 | 254,952,549 | ||||||
| Trade receivables | 99,132,069 | 80,882,986 | ||||||
| Derivative financial assets | 260,034 | 2,352,886 | ||||||
| Other financial assets | 11,541,259 | 9,768,514 | ||||||
| Prepayments | 10,206,040 | 8,361,244 | ||||||
| Other current assets | 1,664,630 | 765,655 | ||||||
| Cash and cash equivalents | 26,960,875 | 37,606,098 | ||||||
| Total current assets | 403,517,862 | 394,689,932 | ||||||
| Current liabilities: | ||||||||
| Trade payables | 16,451,264 | 41,197,158 | ||||||
| Debt | 185,432,472 | 182,103,347 | ||||||
| Current tax liabilities (net) | 13,066,707 | 9,644,944 | ||||||
| Derivative financial liabilities | 489,466 | - | ||||||
| Other financial liabilities | 5,814,444 | 6,031,593 | ||||||
| Other current liabilities | 1,340,616 | 1,980,369 | ||||||
| Total current liabilities | 222,594,969 | 240,957,411 | ||||||
| Working Capital (Total current assets minus Total current liabilities) | 180,922,893 | 153,732,521 | ||||||
| Less: Cash and cash equivalents | 26,960,875 | 37,606,098 | ||||||
| Add: Current debt | 185,432,472 | 182,103,347 | ||||||
| Adjusted net working capital | 339,394,490 | 298,229,770 | ||||||
| 23 |
- Reconciliation of total current and non-current debt to net debt:
| As at December 31, 2014 | As at March 31, 2014 | |||||||
| (Amount in $) | ||||||||
| Current debt | 185,432,472 | 182,103,347 | ||||||
| Non-current debt | 1,676,780 | 2,739,414 | ||||||
| Total current and non-current debt | 187,109,252 | 184,842,761 | ||||||
| Less: Cash and cash equivalents | 26,960,875 | 37,606,098 | ||||||
| Net debt | 160,148,377 | 147,236,663 | ||||||
Quantitative and Qualitative Disclosure about Market Risks
We are exposed to various financial risks. These risks are categorized into market risk, credit risk and liquidity risk. Our risk management is coordinated by our Board of Directors and focuses on securing long term and short term cash flows. We do not engage in trading of financial assets for speculative purposes.
Market risk analysis
Market risk is the risk that changes in market prices will have an effect on our income or value of the financial assets and liabilities. We are exposed to various types of market risks which result from its operating and investing activities. The most significant financial risks to which we are exposed are described below.
Currency risk (foreign exchange risk)
We operate internationally and a significant portion of the business is transacted in the U.S. dollar and consequently we are exposed to foreign exchange risk through its sales. The exchange rate risk primarily arises from foreign exchange receivables. A significant portion of revenue is in U.S. dollars while a significant portion of our costs is in Indian Rupee (INR).
The exchange rate between the INR and the U.S. dollar has fluctuated significantly in recent years and may continue to fluctuate in the future. Appreciation of the INR against the U.S. dollar can adversely affect our results of operations. We also have exposure to foreign currency exchange risk from other currencies, namely the Euro, however, management considers the impact of any fluctuation in these currencies to be insignificant. Further, Amira C Foods International DMCC, having a functional currency of United Arab Emirates Dirham (AED), has significant foreign currency transactions denominated in U.S. dollars. There is no risk of change in the same, as the exchange rate between the U.S. dollar and the AED is fixed at $1 = AED 3.6735.
We evaluate exchange rate exposure arising from these transactions and enter into foreign currency derivative instruments to mitigate such exposure. We follow established risk management policies, including the use of derivatives like foreign exchange forward contracts to hedge forecasted cash flows denominated in foreign currency. The analysis assumes that all other variables remain constant.
The table below presents non-derivative financial instruments, which are exposed to currency risk as of December 31, 2014:
| December 31, 2014 (Unaudited) | U.S. Dollars | Other Currencies | ||||||
| (Amount in $) | ||||||||
| Trade receivables | 1,222,722 | - | ||||||
| Trade payables | - | (185,537 | ) | |||||
| Intercompany receivables | 36,713,328 | 8,900,865 | ||||||
| Intercompany payables | (1,127,856 | ) | - | |||||
| Cash and cash equivalents | 13,813 | 8,351 | ||||||
| Debt receivable – intercompany | - | 1,816,890 | ||||||
| Debt | - | - | ||||||
| Total | 36,822,007 | 10,540,569 | ||||||
| March 31, 2014 (Audited) | U.S. Dollars | Other Currencies | ||||||
| (Amount in $) | ||||||||
| Trade receivables | 5,453,322 | 12,770 | ||||||
| Intercompany receivables | 28,406,181 | 1,905,666 | ||||||
| Trade payables | (420,227 | ) | (534,666 | ) | ||||
| Intercompany payables | (188,402 | ) | - | |||||
| Cash and cash equivalents | 474,881 | 19,755 | ||||||
| Total | 33,725,755 | 1,403,525 | ||||||
As of December 31, 2014 and March 31, 2014 every 1% increase or decrease of the respective foreign currencies compared to our functional currency of the Company would impact our profit before tax by approximately $473,626 and $351,293 respectively.
| 24 |
There are no long term exposures in foreign currency denominated financial asset and liabilities as of the reporting date.
We use forward foreign exchange contracts to mitigate exchange rate exposure arising from forecasted sales in U.S. dollars in APFPL whose functional currency is the INR. U.S. Dollar forward exchange contracts covering forecasted revenue have been designated as hedging instruments in cash flow hedges in accordance with IAS 39. Outstanding U.S. dollar forward contracts relate to revenue forecasted for fiscal 2015. Forecasted transactions for which hedge accounting has been applied are expected to occur and affect profit or loss in fiscal 2015.
Based on expected volatility, the management does not expect the foreign currency hedges to become ineffective due to changes in the exchange rates and therefore, there is no impact expected on profit on changes in the values of such derivatives consequent to changes in foreign currency exchange rates. This analysis assumes that all other variables remain constant.
Interest rate sensitivity
Our results of operations are subject to fluctuations in interest rates because we maintain substantial levels of short term indebtedness in the form of secured revolving credit facilities, which are subject to floating interest rates, to fulfill our capital requirements. As of December 31, 2014 and March 31, 2014, we had $187.1 million and $184.8 million of total indebtedness, respectively, of which more than 99.0% had floating rates of interest. The sensitivity analyses below have been determined based on the exposure to interest rates for non-derivative financial instruments at the balance sheet date. For floating rate liabilities, the analysis is prepared assuming the amount of liability outstanding at the balance sheet date was outstanding for the whole year. The analysis assumes that all other variables remain constant.
In computing the sensitivity analysis, management has assumed a change of 100 basis points movement in the interest rate per annum. This movement in the interest rate would have led to an increase or decrease in the profit before tax by $1.4 million, in the nine months ended December 31, 2014.
Price risk sensitivity
We are exposed to price risk in respect of APFPL’s investments in listed equity securities and investment in mutual funds in India. These investments are held short term and are designated as available for sale financial assets and therefore do not impact the profit or loss in the consolidated statements of profit or loss unless impaired. Further, the amount of investment is not material. Accordingly, sensitivity towards the change in price is not presented.
Credit risk analysis
Credit risk refers to the risk of default by the counterparty to a financial instrument to meet its contractual obligation resulting in a financial loss to us. Our credit risk primarily arises from trade receivables. Accordingly, credit risk from trade receivables has been separately evaluated from all other financial assets in the following paragraphs.
Trade receivables
Trade receivables are unsecured and are derived from revenue earned from customers. Credit risk in trade receivables is managed through monitoring of creditworthiness of the customers and by granting credit approvals in the normal course of the business. An analysis of age of trade receivables at each reporting date is summarized as follows:
| December 31, 2014 (Unaudited) | ||||||||
| Gross | Impairment | |||||||
| (Amount in $) | ||||||||
| Not past due | 95,723,438 | - | ||||||
| Past due less than three months | 1,568,057 | - | ||||||
| Past due more than three months but not more than six months | 551,676 | - | ||||||
| Past due more than six months but not more than one year | 1,065,227 | - | ||||||
| More than one year | 327,720 | (104,049 | ) | |||||
| Total | 99,236,118 | (104,049 | ) | |||||
| 25 |
| March 31, 2014 (Audited) | ||||||||
| Gross | Impairment | |||||||
| (Amount in $) | ||||||||
| Not past due | 79,603,752 | - | ||||||
| Past due less than three months | 166,676 | - | ||||||
| Past due more than three months but not more than six months | 373,157 | - | ||||||
| Past due more than six months but not more than one year | 431,866 | - | ||||||
| More than one year | 410,506 | (102,971 | ) | |||||
| Total | 80,985,957 | (102,971 | ) | |||||
Trade receivables are impaired in full when recoverability is considered doubtful based on the recovery analysis performed by the Amira Group for individual trade receivables. The Amira Group considers that all the above financial assets that are not impaired and past due for each reporting dates under review are of good credit quality.
Receivables from our top five customers are as follows:
| December 31, 2014 (Unaudited) | March 31, 2014 (Audited) | |||||||
| Receivables from top five customers as of reporting date | $ | 7,881,024 | $ | 2,549,827 | ||||
| Percentage to total receivables | 7.9 | % | 3.2 | % | ||||
Receivables from our top two customers are as follows:
| December 31, 2014 (Unaudited) | March 31, 2014 (Audited) | |||||||
| Receivables from top two customers as of reporting date | $ | 6,206,089 | $ | 1,429,857 | ||||
| Percentage to total receivables | 6.3 | % | 1.8 | % | ||||
Management considers the credit quality of these trade receivables to be good. No collateral is held for trade receivables.
Other financial assets
The maximum exposure to credit risk in other financial assets is summarized as follows:
Credit risk relating to cash and cash equivalents and derivative financial instruments is considered negligible because our counterparties are banks. We consider the credit quality of term deposits with such banks that are majority-owned by the Government of India and subject to the regulatory oversight of the Reserve Bank of India to be good, and we review these banking relationships on an ongoing basis.
Security deposits are primarily comprised of deposits made with customers who are public sector organizations. Such deposits were given as part of our contracts with such organizations.
We do not hold any security in respect of the above financial assets. There are no impairment provisions as at each reporting date against these financial assets. We consider all the above financial assets as at the reporting dates to be of good credit quality.
Liquidity risk analysis
Our liquidity needs are monitored on the basis of monthly and yearly projections. We manage our liquidity needs by continuously monitoring cash flows from customers and by maintaining adequate cash and cash equivalents. Net cash requirements are compared to available cash in order to determine any shortfalls.
Short term liquidity requirements consists mainly of trade payables, expense payable, employee dues, debt and security deposits received arising during the normal course of business as of each reporting date. We maintain a sufficient balance in cash and cash equivalents to meet our short term liquidity requirements. We assess long term liquidity requirements on a periodical basis and managed them through internal accruals and through our ability to negotiate long term debt facilities. Our non-current liabilities include vehicle loans, term loans and liabilities for employee benefits.
| 26 |
As of December 31, 2014, the Amira Group had following undrawn financing facilities which remained available for drawdown under our existing financing arrangements:
| December 31, 2014 (Unaudited) | ||||
| Working capital – fund based | $ | 3,009,835 | ||
| Letter of credit and bank guarantee – non fund based | 18,605,165 | |||
| Total | $ | 21,615,000 | ||
As at reporting date, our liabilities having contractual maturities are summarized as follows:
| Current | Non-current | |||||||||||||||
| December 31, 2014 (Unaudited) | Within 6 months | 6-12 months | 1-5 years | More than 5 years | ||||||||||||
| (Amount in $) | ||||||||||||||||
| Long term debt* | 1,041,956 | 603,713 | 1,906,032 | - | ||||||||||||
| Short term debt | 184,085,068 | - | - | - | ||||||||||||
| Trade payables | 16,451,264 | - | - | - | ||||||||||||
| Other financial liabilities | 5,814,444 | - | - | - | ||||||||||||
| Lease obligation | 445,530 | - | - | - | ||||||||||||
| Total | 207,838,262 | 603,713 | 1,906,032 | - | ||||||||||||
| Current | Non-current | |||||||||||||||
| March 31, 2014 (Audited) | Within 6 months | 6-12 months | 1-5 years | More than 5 years | ||||||||||||
| (Amount in $) | ||||||||||||||||
| Long term debt* | 1,200,422 | 1,132,362 | 3,200,308 | - | ||||||||||||
| Short term debt | 180,255,572 | - | - | - | ||||||||||||
| Trade payables | 41,197,158 | - | - | - | ||||||||||||
| Other financial liabilities | 6,031,593 | - | - | - | ||||||||||||
| Lease obligation | 429,886 | - | - | - | ||||||||||||
| Total | 229,114,631 | 1,132,362 | 3,200,308 | - | ||||||||||||
*Includes future interest costs on account of long term debt as at reporting period to be payable over the period of term loan.
The above contractual maturities reflect the gross cash outflows, not discounted at the current values. As a result, these values will differ as compared to the carrying values of the liabilities at the balance sheet date.
LEGAL PROCEEDINGS
We are subject to litigation in the normal course of our business. Except as set forth below, we are not currently, and have not been in the recent past subject to any legal, arbitration or government proceedings (including proceedings pending or known to be contemplated) that we believe could have a significant effect on our financial position or profitability.
On April 4, 2012, a vessel carrying rice owned by Amira C Foods International DMCC (“Amira C Foods”) with a market value of approximately $10 million arrived at the Subic Special Economic Zone (“SSEZ”) in the Port of Subic Bay, a free trade zone located in the Republic of the Philippines for purposes of temporary warehousing and trans-shipment. Metro Eastern Trading Corp (“Metro Eastern”) a registered “locator,” duly authorized and regulated by the Subic Bay Metropolitan Authority was engaged to unload, warehouse, and transship the vessel’s cargo. On May 15, 2012, the Collector of Customs (“COC”) in the Port of Subic Bay issued a warrant of seizure and detention to Metro Eastern alleging violation of certain sections of the Tariff and Customs Code of the Philippines. To protect its interests, on June 8, 2012, Amira C Foods intervened in the proceedings and argued that the COC lacked jurisdiction over the goods because they were never imported into the Philippines, but rather only transshipped into the SSEZ. The COC upheld seizure of the rice shipment and forfeiture of the goods to the Philippines on grounds that the shipment was imported into the Philippines without a valid import permit. This decision was upheld by the Commissioner of the Bureau of Customs (“BOC”), and Amira C Foods filed an appeal with the Court of Tax Appeals (the “CTA”).
On June 27, 2012, the rice subject of the warrant was sold to a related party for $11.4 million under an arrangement that effectively transferred all risks and rewards to the goods without any recourse or further obligation, other than Amira C Foods’ obligation to make best efforts to assist the purchaser in any regulatory, port and customs clearance required to transship the goods, the cost of which will be borne by the purchaser.
| 27 |
On October 17, 2012, the COC conducted a public auction for the seized rice and an entity named Veramar Rice Mill and Trading Company was declared as the highest bidder with a bid of Php 487 million ($11.7 million at the rate of Php 41.18 to one U.S. dollar). Based on representations by BOC’s legal counsel during the hearing of October 22, 2012 before the COC, the full bid amount was delivered to the COC and such amount was deposited in escrow to be released to the final prevailing party. Should the CTA find the forfeiture to be invalid, it will issue a ruling that the escrowed amount be released to Amira C Foods. The CTA case is currently at the pre-trial stage, and should the CTA rule against Amira C Foods, we intend to appeal the ruling.
Concurrently with the proceedings at the BOC, the Senate of the Philippines conducted fact-finding hearings in support of potential legislation with regard to these events. Mr. Protik Guha, our chief operating officer at that time, testified before one such hearing on August 22, 2012. On September 4, 2012, at a hearing that Mr. Guha did not attend, the Senate of the Philippines cited Mr. Guha in contempt for allegedly testifying falsely before the Senate and ordered his detention. This citation is an administrative and not a criminal matter. The Senate investigation against Mr. Guha has concluded. The Senate report dated February 6, 2013 does not recommend any charge against Mr. Guha or Amira C Foods. However, the CTA case continues and is currently in progress and we believe that it is unlikely that the Amira Group will suffer any financial loss as a consequence of this proceeding.
RISK FACTORS
We are subject to certain risks and uncertainties. There have been no material changes since March 31, 2014 to the significant risk factors and uncertainties known to the Company that, if they were to occur, could materially adversely affect the Company’s business, financial condition, operating results and/or cash flow. For a discussion of the Company’s risk factors, refer to Item. 3D “Risk Factors”, contained in the Company’s annual report on Form 20-F for the year ended March 31, 2014. Additional risks and uncertainties that are not presently known or are currently deemed immaterial may also impair our business and financial results.
OTHER EVENTS
Earnings Press Release
On March 2, 2015, we issued a press release announcing our quarterly results for the period ended December 31, 2014. The press release is attached as Exhibit 99.1 and is incorporated by reference herein. On the same day, we held an earnings call to discuss our quarterly results. A copy of the transcript for the earnings call is attached as Exhibit 99.3 and is incorporated by reference herein. The information contained in Exhibits 99.1 and 99.2 shall not be deemed “filed” for purposes of Section 18 of the Exchange Act, or incorporated by reference in any filing under the Securities Act of 1933, as amended, or the Exchange Act, except as shall be expressly set forth by specific reference in such a filing.
We make reference to non-IFRS financial information in both the press release and the earnings call. A reconciliation of these non-IFRS financial measures to the comparable IFRS financial measures is contained in the press release attached hereto.
| Exhibits | ||
| 99.1 | Press Release, dated March 2, 2015 | |
| 99.2 | Earnings Call Presentation, dated March 2, 2015 | |
| 99.3 | Earnings Call Transcript, dated March 2, 2015 |
| 28 |
SIGNATURE
Pursuant to the requirements of the Securities Exchange Act of 1934, the registrant has duly caused this Report to be signed on its behalf by the undersigned, thereunto duly authorized.
| Amira Nature Foods Ltd | ||
| By: | /s/ Bruce C. Wacha | |
| Name: | Bruce C. Wacha | |
| Title: | Chief Financial Officer | |
Dated: March 2, 2015
| 29 |
Exhibit 99.1

Amira Nature Foods Ltd Announces Third Quarter 2015 Financial Results
Reports Record Revenue, EBITDA and Earnings
Third Quarter Revenue and Profits Increased by 35.0% or More
NEW YORK, NY– March 2, 2015 – Amira Nature Foods Ltd (the “Company;” or “Amira” NYSE: ANFI), a leading global provider of branded, packaged Indian specialty rice, today reported financial results for its fiscal 2015 third quarter which ended on December 31, 2014.
Third Quarter 2015 Financial Highlights versus Third Quarter 2014:
| · | Revenue grew 35.0% to $192.4 million compared to $142.5 million |
| · | Adjusted EBITDA increased 36.6% to $27.7 million compared to $20.3 million |
| · | Adjusted EBITDA margin of 14.4% |
| · | Profits after tax increased 82.8% to $14.1 million compared to $7.7 million |
| · | Adjusted profits after tax increased 52.9% to $15.9 million compared to $10.4 million |
| · | Adjusted earnings per share (“EPS”) was $0.44 compared to $0.29 |
Karan A Chanana, Amira’s Chairman and Chief Executive Officer, stated, “Our strong fiscal third quarter performance reflects increased demand for our products across categories and geographies. We continued to make investments in our Amira brand in the quarter, while also building our infrastructure as we further develop our global distribution footprint. In India, we plan to add more Company-managed distribution centers, and in the US we expect our new strategic distribution partnerships with Crossmark and UNFI will help us to better capture the many international opportunities for growth with the Amira brand. As we celebrate our centennial in 2015, Amira is better positioned than ever before with the right people, products and strategic initiatives in place to drive incremental sales and profitability.”
Bruce Wacha, Amira’s Chief Financial Officer added, “During our fiscal third quarter, we generated record quarterly revenue, adjusted EBITDA and adjusted EPS which represents our tenth consecutive quarter of double digit revenue and profit growth as a public company. Our growth in the third quarter was driven primarily by volume gains as we build out our distribution around the globe and capitalize on the continued demand for healthy, better for you products such as our premium, specialty rice. Our Basmati and other specialty rice sales were up significantly in the third quarter, while revenues also benefited from an increase in our more opportunistic institutional business. Going forward, we continue to see many opportunities in India and around the world to further grow our business and create value for our shareholders.”
Third Quarter Fiscal 2015 Results
Revenue for the third quarter of fiscal 2015 increased 35.0% to $192.4 million, compared to $142.5 million for same period in fiscal 2014. The revenue increase was primarily due to increased sales volume and product mix in India and internationally. Sales in India increased 30.7% to $86.6 million, while sales outside of India, or international sales, increased 38.9% to $105.8 million. Amira branded and third party branded sales increased 29.2% to $176.4 million and institutional sales increased $10.1 million to $16.0 million.
| 1 |
Cost of material including the change in finished goods increased by $45.3 million or 42.2% to $152.7 million, and as a percentage of revenue, increased 390 basis points to 79.3% from 75.4% in the year ago period. Cost of material including change in finished goods as a percentage of revenue plus foreign exchange gain/ (loss) (due to hedging of foreign exchange risk) increased by 330 basis points to 79.2% of sales from 75.9% in the prior period. This was largely driven by higher cost of raw material from the procurement season of the fiscal 2014.
Increase in cost of material, including the change of finished goods were offset in part by other line items throughout the P&L. Freight, forwarding and handling expenses decreased by 180 basis points to 2.4% of sales from 4.2% in the prior period, due to more shipments involving free on board. Employee benefit costs decreased 110 basis points to 2.3% of sales compared to 3.4% of sales in the prior year period. Other expenses decreased 80 basis points to 3.2% of sales from 4.0% of sales in the year ago period. Other gains / losses showed a gain of $1.3 million versus a loss of $0.9 million in the prior year period.
Adjusted EBITDA increased $7.4 million or 36.6% to $27.7 million and Adjusted EBITDA margin increased to 14.4%. Profits after tax increased 82.8% to $14.1 million compared to $7.7 million in the prior year period. Adjusted profit after tax increased by 52.9% to $15.9 million for the three months ended December 31, 2014 compared to $10.4 million in the year ago period. Adjusted EPS increased 52.9% to $0.44 per share from $0.29 per share in the prior year period. The Company’s effective tax rate was 21.8% for the period compared to 19.1% for the prior year period. A reconciliation of adjusted EBITDA, adjusted profit after tax and adjusted EPS is provided in the “Non-IFRS Financial Measures” section of this release.
First Nine Months of Fiscal 2015 Results
For the first nine months of fiscal 2015, revenue increased $111.8 million or 31.0% to $472.6 million, compared to $360.8 million for the same period of fiscal 2014. Adjusted EBITDA increased $17.5 million or 35.7% to $66.5 million, compared to $49.0 million for the same period in fiscal 2014. Adjusted profit after tax increased 47.8% to $35.7 million, compared to $24.2 million in the same period in fiscal 2014. Adjusted EPS was $0.99 compared to $0.68 for the first nine months of fiscal 2014.
Balance Sheet and Cash Flow Highlights
As of December 31, 2014, the Company’s cash and cash equivalents were $27.0 million and adjusted net working capital was $339.4 million. Net debt (after deducting cash and cash equivalents) was $160.1 million. As of December 31, 2014, inventories were $253.8 million compared to $255.0 as of March 31, 2014, trade receivables were $99.1 million, an increase of $18.2 million from $80.9 million, trade payables were $16.5 million, a decrease of $24.7 million from $41.2 million. Total debt was $187.1 million, an increase of $2.3 million from $184.8 million. Reconciliations of adjusted net working capital and net debt to the IFRS measures of working capital and total current and non-current debt, respectively, are provided in the “Non-IFRS Financial Measures” section of this release.
Fiscal 2015 Outlook
The Company reiterated its previously-issued guidance and expects full-year fiscal 2015 revenue and adjusted EBITDA growth in excess of 25%. This is in line with long-term guidance previously provided to the investment community. The Company’s guidance is based on foreign exchange rates as of December 31, 2014.
Conference Call
The Company will hold an investor call today at 8:30 a.m. Eastern time. The dial-in number for this conference call is 1-877-407-3982 for North American listeners and 1-201-493-6780 for international listeners. Live audio of the conference call and a supplemental presentation will be simultaneously webcast on the investor relations section of the Company's website at www.amira.net.
| 2 |
An audio replay will be available following the completion of the conference call by dialing 1-877-870-5176 for North American listeners or 1-858-384-5517 for international listeners (conference ID 13602559). The webcast of the teleconference will be archived and available on the Company’s website.
About Amira Nature Foods Ltd
Founded in 1915, Amira has evolved into a leading global provider of branded packaged Indian specialty rice, with sales in over 60 countries today. The Company primarily sells Basmati rice, which is a premium long-grain rice grown only in certain regions of the Indian sub-continent, under its flagship Amira brand as well as under other third party brands. Amira sells its products through a broad distribution network in both the developed and emerging markets. The Company’s global headquarters are in Dubai, United Arab Emirates, and it also has offices in India, Malaysia, Singapore, Germany, the United Kingdom, and the United States. Amira Nature Foods Ltd is listed on the New York Stock Exchange (NYSE) under the ticker symbol “ANFI.” For more information please visit www.amira.net.
Contact
Amira Nature Foods Ltd
Bruce Wacha
Chief Financial Officer
201-960-0745
Cautionary Note on Forward-Looking Statements
This release contains forward-looking statements within the meaning of the U.S. federal securities laws. These forward-looking statements generally can be identified by phrases such as that we or our members of management “believe,” “expect,” “anticipate,” “foresee,” “forecast,” “estimate” or other words or phrases of similar import. Specifically, these statements include, among other things, statements that describe our expectations for the growth of our business, expansion into new geographic markets, maintaining and expanding our relationship with key retail partners, the financial impact of new sales contracts on our revenue, our plans to make significant capital expenditures, and other statements of management’s beliefs, intentions or goals. It is uncertain whether any of the events anticipated by the forward-looking statements will transpire or occur, or if any of them do, what impact they will have on our results of operations, financial condition, or the price of our ordinary shares. These forward-looking statements involve certain risks and uncertainties that could cause actual results to differ materially from those indicated in such forward-looking statements, including but not limited to our ability to penetrate and increase the acceptance of our products in new geographic markets; our ability to perform our agreements with customers and further develop our relationships with key retail partners; our ability to recognize revenue from our contracts; continued competitive pressures in the marketplace; our reliance on a few customers for a substantial part of our revenue; our ability to implement our plans, forecasts and other expectations with respect to our business and realize additional opportunities for growth; and the other risks and important factors contained and identified in our filings with the Securities and Exchange Commission. All forward-looking statements attributable to us or to persons acting on our behalf are expressly qualified in their entirety by these risk factors. Since we operate in an emerging and evolving environment and new risk factors and uncertainties emerge from time to time, you should not rely upon forward-looking statements as predictions of future events. Except as required under the securities laws of the United States, we undertake no obligation to update any forward-looking or other statements herein to reflect events or circumstances after the date hereof, whether as a result of new information, future events or otherwise.
| 3 |
Amira Nature Foods Ltd
Condensed Consolidated Statements of Financial Position
| (Amounts in USD) | ||||||||
| As at December 31, 2014 (Unaudited) |
As at March 31, 2014 (Audited) |
|||||||
| ASSETS | ||||||||
| Non-current | ||||||||
| Property, plant and equipment | $ | 22,037,426 | $ | 23,284,918 | ||||
| Goodwill | 1,549,872 | 1,727,338 | ||||||
| Other intangible assets | 1,898,476 | 2,262,731 | ||||||
| Other long-term financial assets | 592,950 | 485,731 | ||||||
| Total non-current assets | $ | 26,078,724 | $ | 27,760,718 | ||||
| Current | ||||||||
| Inventories | $ | 253,752,955 | $ | 254,952,549 | ||||
| Trade receivables | 99,132,069 | 80,882,986 | ||||||
| Derivative financial assets | 260,034 | 2,352,886 | ||||||
| Other financial assets | 11,541,259 | 9,768,514 | ||||||
| Prepayments | 10,206,040 | 8,361,244 | ||||||
| Other current assets | 1,664,630 | 765,655 | ||||||
| Cash and cash equivalents | 26,960,875 | 37,606,098 | ||||||
| Total current assets | $ | 403,517,862 | $ | 394,689,932 | ||||
| Total assets | $ | 429,596,586 | $ | 422,450,650 | ||||
| EQUITY AND LIABILITIES | ||||||||
| Equity | ||||||||
| Share capital | $ | 9,119 | $ | 9,115 | ||||
| Share premium | 82,896,597 | 82,804,750 | ||||||
| Other reserves | (8,575,285 | ) | (3,312,575 | ) | ||||
| Retained earnings | 100,878,863 | 74,334,687 | ||||||
| Equity attributable to shareholders of the Company | $ | 175,209,294 | $ | 153,835,977 | ||||
| Equity attributable to non-controlling interest | 23,479,458 | 18,005,030 | ||||||
| Total equity | $ | 198,688,752 | $ | 171,841,007 | ||||
| Liabilities | ||||||||
| Non-current liabilities | ||||||||
| Defined benefit obligations | $ | 344,971 | $ | 246,548 | ||||
| Debt | 1,676,780 | 2,739,414 | ||||||
| Deferred tax liabilities | 6,291,114 | 6,666,270 | ||||||
| Total non-current liabilities | $ | 8,312,865 | $ | 9,652,232 | ||||
| Current liabilities | ||||||||
| Trade payables | $ | 16,451,264 | $ | 41,197,158 | ||||
| Debt | 185,432,472 | 182,103,347 | ||||||
| Current tax liabilities (net) | 13,066,707 | 9,644,944 | ||||||
| Derivative financial liabilities | 489,466 | - | ||||||
| Other financial liabilities | 5,814,444 | 6,031,593 | ||||||
| Other current liabilities | 1,340,616 | 1,980,369 | ||||||
| Total current liabilities | $ | 222,594,969 | $ | 240,957,411 | ||||
| Total liabilities | $ | 230,907,834 | $ | 250,609,643 | ||||
| Total equity and liabilities | $ | 429,596,586 | $ | 422,450,650 | ||||
| 4 |
Amira Nature Foods Ltd
Condensed Consolidated Statements of Profit or Loss
(Amounts in USD)
| Nine months ended | Three months ended | |||||||||||||||
| December 31, 2014 (Unaudited) | December 31, 2013 (Unaudited) | December 31, 2014 (Unaudited) | December 31, 2013 (Unaudited) | |||||||||||||
| Revenue | $ | 472,607,849 | $ | 360,774,711 | $ | 192,407,304 | $ | 142,478,370 | ||||||||
| Other income | 92,692 | 108,120 | 18,033 | 13,057 | ||||||||||||
| Cost of material | (427,274,003 | ) | (291,031,271 | ) | (159,601,896 | ) | (109,089,976 | ) | ||||||||
| Change in inventory of finished goods | 56,061,879 | 14,195,269 | 6,949,431 | 1,710,878 | ||||||||||||
| Employee benefit expenses | (9,763,317 | ) | (9,103,034 | ) | (4,344,311 | ) | (4,850,720 | ) | ||||||||
| Depreciation and amortization | (1,778,915 | ) | (1,472,270 | ) | (576,736 | ) | (521,070 | ) | ||||||||
| Freight, forwarding and handling expenses | (14,011,609 | ) | (15,907,424 | ) | (4,595,471 | ) | (6,045,737 | ) | ||||||||
| Other expenses | (17,638,443 | ) | (12,101,245 | ) | (6,071,914 | ) | (5,644,163 | ) | ||||||||
| $ | 58,296,133 | $ | 45,462,856 | $ | 24,184,440 | $ | 18,050,639 | |||||||||
| Finance costs | (23,066,231 | ) | (18,864,147 | ) | (7,928,780 | ) | (8,284,701 | ) | ||||||||
| Finance income | 1,632,163 | 2,248,529 | 548,802 | 685,383 | ||||||||||||
| Other gains and (losses) | 4,543,029 | (711,563 | ) | 1,251,358 | (902,391 | ) | ||||||||||
| Profit before tax for the period | $ | 41,405,094 | $ | 28,135,675 | $ | 18,055,820 | $ | 9,548,930 | ||||||||
| Income tax expense | (7,629,792 | ) | (6,780,309 | ) | (3,927,670 | ) | (1,819,944 | ) | ||||||||
| Profit after tax for the period | $ | 33,775,302 | $ | 21,355,366 | $ | 14,128,150 | $ | 7,728,986 | ||||||||
| Profit after tax attributable to: | ||||||||||||||||
| Shareholders of the Company | $ | 26,544,176 | $ | 16,585,182 | $ | 10,967,083 | $ | 5,680,798 | ||||||||
| Non-controlling interest | $ | 7,231,126 | $ | 4,770,184 | $ | 3,161,067 | $ | 2,048,188 | ||||||||
| Earnings per share | ||||||||||||||||
| Basic earnings per share | $ | 0.93 | $ | 0.58 | $ | 0.38 | $ | 0.20 | ||||||||
| Diluted earnings per share | $ | 0.92 | $ | 0.58 | $ | 0.38 | $ | 0.20 | ||||||||
| 5 |
Amira Nature Foods Ltd
Condensed Consolidated Statements of Comprehensive Income
(Amounts in USD)
| Nine months ended | Three months ended | |||||||||||||||
| December 31, 2014 (Unaudited) | December 31, 2013 (Unaudited) | December 31, 2014 (Unaudited) | December 31, 2013 (Unaudited) | |||||||||||||
| Profit after tax for the period | $ | 33,775,302 | $ | 21,355,366 | $ | 14,128,150 | $ | 7,728,986 | ||||||||
| Other comprehensive income | ||||||||||||||||
| Items that may be reclassified subsequently to profit or loss: | ||||||||||||||||
| Available for sale financial assets: | ||||||||||||||||
| Current period gain/(loss) | 48,434 | (14,536 | ) | 18,304 | 9,258 | |||||||||||
| Reclassification to profit or loss | - | - | - | - | ||||||||||||
| Income tax | (11,622 | ) | 4,941 | (6,222 | ) | (3,147 | ) | |||||||||
| $ | 36,812 | $ | (9,595 | ) | $ | 12,082 | $ | 6,111 | ||||||||
| Cash flow hedging reserve: | ||||||||||||||||
| Current period gain/(loss) | 1,948,914 | (8,090,011 | ) | 281,214 | 2,976,006 | |||||||||||
| Reclassification to profit or loss | (2,872,337 | ) | 3,281,293 | (284,792 | ) | 1,072,748 | ||||||||||
| Income tax | 313,871 | 1,634,483 | 1,216 | (1,376,172 | ) | |||||||||||
| $ | (609,552 | ) | $ | (3,174,235 | ) | $ | (2,362 | ) | $ | 2,672,582 | ||||||
| Currency translation reserve | (8,370,804 | ) | (15,407,013 | ) | (5,036,825 | ) | 2,167,917 | |||||||||
| Other comprehensive income/(loss) for the period, net of tax | $ | (8,943,544 | ) | $ | (18,590,843 | ) | $ | (5,027,105 | ) | $ | 4,846,610 | |||||
| Total comprehensive income for the period | $ | 24,831,758 | $ | 2,764,523 | $ | 9,101,045 | $ | 12,575,596 | ||||||||
| Total comprehensive income for the period attributable to: | ||||||||||||||||
| Shareholders of the Company | $ | 19,357,330 | $ | 1,636,105 | $ | 6,927,407 | $ | 9,575,433 | ||||||||
| Non-controlling interest | $ | 5,474,428 | $ | 1,128,418 | $ | 2,173,638 | $ | 3,000,163 | ||||||||
| 6 |
Amira Nature Foods Ltd
Condensed Consolidated Statements of Changes in Equity
(Amounts in USD)
| Other reserves | |||||||||||||||||||||||||||||||||||||||||||||
| Share capital | Share premium | Share-based compensation reserve | Reserve
for available for sale financial assets |
Currency
translation Reserve |
Cash
flow hedging Reserve |
Restructuring
Reserve |
Retained
earnings |
Equity
attributable to shareholders of the Company |
Equity
attributable to non - controlling interest |
Total equity | |||||||||||||||||||||||||||||||||||
| Balance as at April 1, 2013 (Audited) | $ | 9,111 | $ | 82,683,926 | $ | 183,514 | $ | (21,561 | ) | $ | (5,582,983 | ) | $ | 258,647 | $ | 9,398,927 | $ | 44,375,024 | $ | 131,304,605 | $ | 12,328,130 | $ | 143,632,735 | |||||||||||||||||||||
| Share based compensation | 4 | 120,824 | 2,679,848 | - | - | - | - | - | $ | 2,800,676 | - | $ | 2,800,676 | ||||||||||||||||||||||||||||||||
| Profit after tax for the period | - | - | - | - | - | - | - | 16,585,182 | $ | 16,585,182 | 4,770,184 | $ | 21,355,366 | ||||||||||||||||||||||||||||||||
| Other comprehensive income /(loss) for the period | - | - | - | (7,717 | ) | (12,388,151 | ) | (2,553,209 | ) | - | - | $ | (14,949,077 | ) | (3,641,766 | ) | $ | (18,590,843 | ) | ||||||||||||||||||||||||||
| Total comprehensive income/(loss) for the period | $ | - | $ | - | $ | - | $ | (7,717 | ) | $ | (12,388,151 | ) | $ | (2,553,209 | ) | $ | - | $ | 16,585,182 | $ | 1,636,105 | $ | 1,128,418 | $ | 2,764,523 | ||||||||||||||||||||
| Balance as at December 31, 2013 (Unaudited) | $ | 9,115 | $ | 82,804,750 | $ | 2,863,362 | $ | (29,278 | ) | (17,971,134 | ) | $ | (2,294,562 | ) | $ | 9,398,927 | $ | 60,960,206 | $ | 135,741,386 | $ | 13,456,548 | $ | 149,197,934 | |||||||||||||||||||||
| Balance as at April 1, 2014 (Audited) | $ | 9,115 | $ | 82,804,750 | $ | 2,863,362 | $ | (30,127 | ) | $ | (16,018,401 | ) | $ | 473,664 | $ | 9,398,927 | $ | 74,334,687 | $ | 153,835,977 | $ | 18,005,030 | $ | 171,841,007 | |||||||||||||||||||||
| Share based compensation | 8 | 130,033 | 1,924,136 | - | - | - | - | - | $ | 2,054,177 | - | $ | 2,054,177 | ||||||||||||||||||||||||||||||||
| Repurchase of shares from ex-director and cancelled | (4 | ) | (38,186 | ) | - | - | - | - | - | - | $ | (38,190 | ) | - | $ | (38,190 | ) | ||||||||||||||||||||||||||||
| Profit after tax for the period | - | - | - | - | - | - | - | 26,544,176 | $ | 26,544,176 | 7,231,126 | $ | 33,775,302 | ||||||||||||||||||||||||||||||||
| Other comprehensive income /(loss) for the period | - | - | - | 29,581 | (6,726,604 | ) | (489,823 | ) | - | - | $ | (7,186,846 | ) | (1,756,698 | ) | $ | (8,943,544 | ) | |||||||||||||||||||||||||||
| Total comprehensive income/(loss) for the period | $ | - | $ | - | $ | - | $ | 29,581 | $ | (6,726,604 | ) | $ | (489,823 | ) | $ | - | $ | 26,544,176 | $ | 19,357,330 | $ | 5,474,428 | $ | 24,831,758 | |||||||||||||||||||||
| Balance as at December 31, 2014 (Unaudited) | $ | 9,119 | $ | 82,896,597 | $ | 4,787,498 | $ | (546 | ) | $ | (22,745,005 | ) | $ | (16,159 | ) | $ | 9,398,927 | $ | 100,878,863 | $ | 175,209,294 | $ | 23,479,458 | $ | 198,688,752 | ||||||||||||||||||||
| 7 |
Amira Nature Foods Ltd
Condensed Consolidated Statements of Cash Flows
(Amounts in USD)
| Nine months ended | ||||||||
| December 31, 2014 (Unaudited) | December 31, 2013 (Unaudited) | |||||||
| (A) CASH FLOW FROM OPERATING ACTIVITIES | ||||||||
| Profit before tax for the period | $ | 41,405,094 | $ | 28,135,675 | ||||
| Adjustments for non-cash items | 4,195,710 | 2,453,905 | ||||||
| Adjustments for non-operating incomes and expenses | 21,433,198 | 16,611,490 | ||||||
| Changes in operating assets and liabilities | (66,896,650 | ) | (37,142,521 | ) | ||||
| $ | 137,352 | $ | 10,058,549 | |||||
| Income taxes paid | (3,063,424 | ) | (2,714,900 | ) | ||||
| Net cash (used in)/ generated from operating activities | $ | (2,926,072 | ) | $ | 7,343,649 | |||
| (B) CASH FLOW FROM INVESTING ACTIVITIES | ||||||||
| Purchase of property, plant and equipment | $ | (1,709,197 | ) | $ | (1,364,502 | ) | ||
| Purchase of intangible assets | (2,498 | ) | (298,763 | ) | ||||
| Proceeds from sale of property, plant and equipment | 1,614 | 5,332 | ||||||
| Proceeds from term deposits | 12,497,806 | 12,883,590 | ||||||
| Investments in term deposits | (13,671,865 | ) | (14,005,325 | ) | ||||
| Purchase of short term investments | (41,300 | ) | (4,145 | ) | ||||
| Proceeds from the sale of short term investments | - | (218,250 | ) | |||||
| Interest income | 625,812 | 1,102,293 | ||||||
| Net cash used in investing activities | $ | (2,299,628 | ) | $ | (1,899,770 | ) | ||
| (C) CASH FLOWS FROM FINANCING ACTIVITIES | ||||||||
| Repurchase of shares from ex-director and cancelled | $ | (38,190 | ) | $ | - | |||
| Net proceeds from short term debt | 14,217,389 | 17,821,423 | ||||||
| Proceeds from long term debt | 18,150 | 41,445 | ||||||
| Repayment of long term debt | (963,487 | ) | (1,394,134 | ) | ||||
| Interest paid | (16,383,217 | ) | (14,502,897 | ) | ||||
| Net cash (used in)/ generated from financing activities | $ | (3,149,355 | ) | $ | 1,965,837 | |||
| (D) Effect of change in exchange rate on cash and cash equivalents | (2,270,168 | ) | (6,907,131 | ) | ||||
| Net increase/ (decrease) in cash and cash equivalents (A+B+C+D) | $ | (10,645,223 | ) | $ | 502,585 | |||
| Cash and cash equivalents at the beginning of the period | 37,606,098 | 33,270,338 | ||||||
| Cash and cash equivalents at the end of the period | $ | 26,960,875 | $ | 33,772,923 | ||||
| 8 |
Non-IFRS Financial Measures
In evaluating our business, we consider and use the non-IFRS measures EBITDA, adjusted EBITDA, adjusted profit after tax, adjusted earnings per share, adjusted net working capital and net debt as supplemental measures to review and assess our operating performance. The presentation of these non-IFRS financial measures is not intended to be considered in isolation or as a substitute for the financial information prepared and presented in accordance with IFRS. We define: (1) EBITDA as profit after tax plus finance costs (net of finance income), income tax expense and depreciation and amortization; (2) adjusted EBITDA, as EBITDA plus non-cash expense for share-based compensation for the three and nine months ended December 31, 2014 and 2013, respectively (3) adjusted profit after tax, as profit after tax plus non-cash expense for share-based compensation for three and nine months ended December 31, 2014 and 2013, respectively; (4) adjusted earnings per share as the quotient of: (a) adjusted profit after tax and (b) the sum of our weighted average number of shares (including dilutive impact of share options granted) for the applicable period and the ordinary shares subject to the exchange agreement between us and the non-controlling shareholders of Amira India; (5) adjusted net working capital as total current assets minus: (a) total current liabilities (b) cash and cash equivalents and plus current debt; and (6) net debt as total current and non-current debt minus cash and cash equivalents.
We use both EBITDA and adjusted EBITDA as measures of operating performance to assist in comparing performance from period to period on a consistent basis, as a measure for planning and forecasting overall expectations, for evaluating actual results against such expectations and as a performance evaluation metric, including as part of assessing and administering our executive and employee incentive compensation programs. We believe that the use of both EBITDA and adjusted EBITDA as non-IFRS measures facilitates investors’ assessment of our operating performance from period to period and from company to company by backing out potential differences caused by variations in items such as capital structure (affecting relative finance or interest expenses), non-recurring IPO-related expenses, the book amortization of intangibles (affecting relative amortization expenses), the age and book value of property and equipment (affecting relative depreciation expenses) and other non-cash expenses. We also present these non-IFRS measures because we believe they are frequently used by securities analysts, investors and other interested parties as measures of the financial performance of companies in our industry.
These non-IFRS financial measures are not defined under IFRS and are not presented in accordance with IFRS. These non-IFRS financial measures have limitations as analytical tool, and when assessing our operating performance, investors should not consider it in isolation, or as a substitute for profit/ (loss) or other consolidated statements of operations data prepared in accordance with IFRS. Some of these limitations include, but are not limited to:
| · | it does not reflect our cash expenditures or future requirements for capital expenditures or contractual commitments; |
| · | it does not reflect changes in, or cash requirements for, our working capital needs; |
| · | it does not reflect the finance or interest expenses, or the cash requirements necessary to service interest or principal payments, on our debt; |
| · | it does not reflect income taxes or the cash requirements for any tax payments; |
| · | although depreciation and amortization are non-cash charges, the assets being depreciated and amortized often will have to be replaced in the future, and adjusted net profit, EBITDA and Adjusted EBITDA do not reflect any cash requirements for such replacements; |
| · | other companies may calculate EBITDA, Adjusted EBITDA and other non-IFRS measures differently than we do, limiting the usefulness of this non-IFRS measure as a comparative measure. |
We compensate for these limitations by relying primarily on our IFRS results and using non-IFRS measures only as a supplemental information.
We present adjusted EBITDA, adjusted profit after tax, adjusted earnings per share, adjusted net working capital and net debt because we believe these measures provide additional metrics to evaluate our operations and, when considered with both our IFRS results and the reconciliation to profit after tax, basic and diluted earnings per share, working capital and total current and non-current debt, respectively, provide a more complete understanding of our business than could be obtained absent this disclosure. We also believe that these non-IFRS financial measures are useful to investors in assessing the operating performance of our business after reflecting the adjustments described above.
In the following tables we have provided reconciliation of the non-IFRS measures to the most directly comparable IFRS measure:
- Reconciliation of profit after tax to EBITDA and adjusted EBITDA:
| Nine months ended | Three months ended | |||||||||||||||
| December 31, 2014 | December 31, 2013 | December 31, 2014 | December 31, 2013 | |||||||||||||
| Profit after tax (PAT) | $ | 33,775,302 | $ | 21,355,366 | $ | 14,128,150 | $ | 7,728,986 | ||||||||
| Add: Income tax expense | 7,629,792 | 6,780,309 | 3,927,670 | 1,819,944 | ||||||||||||
| Add: Finance costs (net of finance income) | 21,434,068 | 16,615,618 | 7,379,978 | 7,599,318 | ||||||||||||
| Add: Depreciation and amortization | 1,778,915 | 1,472,270 | 576,736 | 521,070 | ||||||||||||
| EBITDA | $ | 64,618,077 | $ | 46,223,563 | $ | 26,012,534 | $ | 17,669,318 | ||||||||
| Add: Non-cash expenses for share-based compensation | 1,924,136 | 2,800,677 | 1,736,913 | 2,645,855 | ||||||||||||
| Adjusted EBITDA | $ | 66,542,213 | $ | 49,024,240 | $ | 27,749,447 | $ | 20,315,173 | ||||||||
| 9 |
- Reconciliation of profit after tax to adjusted profit after tax:
| Nine months ended | Three months ended | |||||||||||||||
| December 31, 2014 | December 31, 2013 | December 31, 2014 | December 31, 2013 | |||||||||||||
| Profit after tax (PAT) | $ | 33,775,302 | $ | 21,355,366 | $ | 14,128,150 | $ | 7,728,986 | ||||||||
| Add: Non-cash expenses for share-based compensation | 1,924,136 | 2,800,677 | 1,736,913 | 2,645,855 | ||||||||||||
| Adjusted profit after tax | $ | 35,699,438 | $ | 24,156,043 | $ | 15,865,063 | $ | 10,374,841 | ||||||||
- Reconciliation of earnings per share and adjusted earnings per share:
| Nine months ended | Three months ended | |||||||||||||||||
| December 31, 2014 | December 31, 2013 | December 31, 2014 | December 31, 2013 | |||||||||||||||
| Profit after tax (PAT) | $ | 33,775,302 | $ | 21,355,366 | $ | 14,128,150 | $ | 7,728,986 | ||||||||||
| Profit attributable to Shareholders of the Company | (A) | $ | 26,544,176 | $ | 16,585,182 | $ | 10,967,083 | $ | 5,680,798 | |||||||||
| Weighted average number of shares (for basic earnings per share) | (B) | 28,677,018 | 28,672,134 | 28,679,439 | 28,674,389 | |||||||||||||
| Dilutive impact of stock options as converted in equivalent number of shares | (C) | 239,016 | 138,785 | 225,944 | 231,445 | |||||||||||||
| Weighted average number of shares (for diluted earnings per share) | (D) = (B) + C) | 28,916,034 | 28,810,919 | 28,905,383 | 28,905,834 | |||||||||||||
| Shares issuable under exchange agreement | (E) | 7,005,434 | 7,005,434 | 7,005,434 | 7,005,434 | |||||||||||||
| Basic earnings per share as per IFRS | (A) ÷ (B) | $ | 0.93 | $ | 0.58 | $ | 0.38 | $ | 0.20 | |||||||||
| Diluted earnings per share as per IFRS | (A) ÷ (D) | $ | 0.92 | $ | 0.58 | $ | 0.38 | $ | 0.20 | |||||||||
| Profit after tax (PAT) | (F) | $ | 33,775,302 | $ | 21,355,366 | $ | 14,128,150 | $ | 7,728,986 | |||||||||
| Add: Non-cash expenses for share-based compensation | (G) | $ | 1,924,136 | $ | 2,800,677 | $ | 1,736,913 | $ | 2,645,855 | |||||||||
| Adjusted profit after tax | (H) = (F) +(G) | $ | 35,699,438 | $ | 24,156,043 | $ | 15,865,063 | $ | 10,374,841 | |||||||||
| Weighted average number of shares (including dilutive impact of share options granted) and the ordinary shares subject to the exchange agreement between us and the non-controlling shareholders of Amira India | (I) = (D) + (E) | 35,921,468 | 35,816,353 | 35,910,817 | 35,911,268 | |||||||||||||
| Adjusted earnings per share | (H) ÷ (I) | $ | 0.99 | $ | 0.68 | $ | 0.44 | $ | 0.29 | |||||||||
| 10 |
- Reconciliation of working capital (total current assets minus total current liabilities) and adjusted net working capital:
| As at December 31, 2014 | As at March 31, 2014 | |||||||
| (Amount in $) | ||||||||
| Current assets: | ||||||||
| Inventories | 253,752,955 | 254,952,549 | ||||||
| Trade receivables | 99,132,069 | 80,882,986 | ||||||
| Derivative financial assets | 260,034 | 2,352,886 | ||||||
| Other financial assets | 11,541,259 | 9,768,514 | ||||||
| Prepayments | 10,206,040 | 8,361,244 | ||||||
| Other current assets | 1,664,630 | 765,655 | ||||||
| Cash and cash equivalents | 26,960,875 | 37,606,098 | ||||||
| Total current assets | 403,517,862 | 394,689,932 | ||||||
| Current liabilities: | ||||||||
| Trade payables | 16,451,264 | 41,197,158 | ||||||
| Debt | 185,432,472 | 182,103,347 | ||||||
| Current tax liabilities (net) | 13,066,707 | 9,644,944 | ||||||
| Derivative financial liabilities | 489,466 | - | ||||||
| Other financial liabilities | 5,814,444 | 6,031,593 | ||||||
| Other current liabilities | 1,340,616 | 1,980,369 | ||||||
| Total current liabilities | 222,594,969 | 240,957,411 | ||||||
| Working Capital (Total current assets minus Total current liabilities) | 180,922,893 | 153,732,521 | ||||||
| Less: Cash and cash equivalents | 26,960,875 | 37,606,098 | ||||||
| Add: Current debt | 185,432,472 | 182,103,347 | ||||||
| Adjusted net working capital | 339,394,490 | 298,229,770 | ||||||
- Reconciliation of total current and non-current debt to net debt:
| As at December 31, 2014 | As at March 31, 2014 | |||||||
| (Amount in $) | ||||||||
| Current debt | 185,432,472 | 182,103,347 | ||||||
| Non-current debt | 1,676,780 | 2,739,414 | ||||||
| Total current and non-current debt | 187,109,252 | 184,842,761 | ||||||
| Less: Cash and cash equivalents | 26,960,875 | 37,606,098 | ||||||
| Net debt | 160,148,377 | 147,236,663 | ||||||
| 11 |
Exhibit 99.2

MAKE SOMETHING BEAUTIFUL Investor Presentation Fiscal Q3 2015 Results March 2, 2015

Basmati Roadshow_1_October - 2012.ppt Forward Looking Statement This presentation contains forward - looking statements that are subject to risks and uncertainties. All statements other than statements of historical fact included in this presentation are forward - looking statements. Forward - looking statements give our current expectations and projections relating to our financial condition, results of operations, plans, objectives, future performance and business. Specifically, these statements include, among other things, statements that describe our expectatio ns for the growth of our business, expansion into new geographic markets, maintaining and expanding our relationship with key re tai l partners, the financial impact of new sales contracts on our revenue, our plan to make significant capital expenditure, and o
the r statements of management’s beliefs, intentions or goals. You can identify forward - looking statements by the fact that they do no t relate strictly to historical or current facts. These statements may include words such as “foresee”, “forecast”, "anticipate ," "estimate," "expect," "project," "plan,“ "intend,“ "believe" and other words and terms of similar meaning in connection with any discussion of the timing or nature of future operating or financial performance or other events. These forward - looking statement s are based on assumptions that we have made in light of our industry experience and on our perceptions of historical trends, current conditions, expected future developments and other factors we believe are appropriate under the circumstances. As you consider this presentation, you should understand that these statements are not guarantees of performance or results. They involve risks, uncertainties (some of which are beyond our control) and assumptions, some of which are described under “Risk Factors” in our Annual Reports on Form 20 - F and our Registration Statement on Form F - 1 filed with the Securities and Exchange Commission. Although we believe that these forward - looking statements are based on reasonable assumptions, you should be aware that many factors could affect our actual financial results and cause them to differ materially from those anticipated in the forward - looking statements. Since we operate in an emerging and evolving environment and new risk factors and uncertainties emerge from time to time, you should not rely upon forward looking statements as predictions of future events. Except as required under the securities laws of the United States, we undertake no obligation to update any forward - looking or other statements herein to reflect events or circumstances after the date hereof, whether as a result of new information, future ev ent s or otherwise. Because of these factors, we caution that you should not place undue reliance on any of our forward - looking statements. Further, any forward - looking statement speaks only as of the date on which it is made. New risks and uncertainties arise from time to tim e, and it is impossible for us to predict those events or how they may affect us. Except as required by law, we have no duty to, an d do not intend to, update or revise the forward - looking statements in this presentation after the date of this presentation.

Basmati Roadshow_1_October - 2012.ppt Market and Industry Data This presentation contains estimates and projections regarding market and industry data that were obtained from internal company surveys as well as third - party sources such as market research, consultant surveys, publicly available information and industry publications and surveys. We believe the information provided or made available by these third - party sources is general ly reliable. However, market data is subject to change and cannot always be verified with complete certainty due to limits on th e availability and reliability of raw data, the voluntary nature of the data gathering process and other limitations and uncert ain ties inherent in any statistical survey, interpretation or presentation of mark
et data and management’s estimates and projections. In addition, projections are often wrong. As a result, you should be aware that market data set forth herein, and estimates, projections and beliefs ( i ) based on such data and (ii) relating to certain financial and performance metrics presented herein, may not be reliable. We have not independently verified any of the data from third - party sources or ascertained the underlying economic assumptions relied upon therein; accordingly we cannot guarantee the accuracy or completeness of any such data. Similarly, internal surveys, which we believe to be reliable, are based upon management’s knowledge of the industry as of the da te of such surveys and have not been verified by any independent sources. As a result, we cannot guarantee the accuracy or completeness of any such information and you should not place undue reliance on such information when making an investment decision.

Basmati Roadshow_1_October - 2012.ppt 1 KARAN A CHANANA CHAIRMAN AND CHIEF EXECUTIVE OFFICER BRUCE WACHA CHIEF FINANCIAL OFFICER RAJESH ARORA SR. EXECUTIVE DIRECTOR FINANCE ASHISH PODDAR EXECUTIVE DIRECTOR FINANCE Presenters

Basmati Roadshow_1_October - 2012.ppt Fiscal Q3 2015 Financial Results

Basmati Roadshow_1_October - 2012.ppt 3 3 Months Ended Q3 2015 Financial Highlights Revenue Key drivers Adjusted EBITDA Adjusted EPS % margin 14.3% 14.4% • Revenue increased $49.9 million or 35.0% to $192.4 million driven primarily by increased sales volume and product mix of rice in India and internationally ‒ Sales in India increased by $ 20.3 million or 30.7%, to $86.6 million, non - India or international sales increased $29.6 million or 38.9%, to $105.8 million ‒ Amira branded and third party branded sales increased $39.9 million, or 29.2%, to $176.4 million, Institutional sales were $16.0 million compared to $5.9 million a year ago • Cost of material including the change in finished goods as a percentage of revenue increased by 390 basis points to 79.3 % of
sales from 75.4% in the year ago period. Cost of material including change in finished goods as a percentage of revenue plus foreign exchange gain/ (loss) (due to hedging of foreign exchange risk) increased by 330 basis points to 79.2% of sales from 75.9 %. Increase largely driven by higher cost of raw material from the procurement season of FY 2014 • Freight, forwarding and handling expenses decreased by 180 basis points to 2.4 % of sales from 4.2% in the prior period, due to more shipments involving free on board (FOB). Employee benefit costs decreased 110 basis points to 2.3 % of sales compared to 3.4%. Other expenses decreased 80 basis points to 3.2% of sales from 4.0 %. Other gains / losses showed a gain of $1.3 million versus a loss of $0.9 million in the prior year period. Adjusted EBITDA increased $7.4 million or 36.6% to $ 27.7 million, with adjusted EBITDA margins increased 10 bps to 14.4 % • The Company’s effective tax rate was 21.8% for the period compared to 19.1% in the year ago period, Adjusted profit after tax increased $ 5.5 million or 52.9% to $15.9 million from $10.4 million and Adjusted EPS increased 52.9% to $0.44 per share from $0.29 per share in th e prior year period Note: Interim results are not audited. Includes full benefit of Basmati Rice GmbH which was acquired in January 2014; Adjusted EBITDA and Adjusted EPS exclude the impact of non cash compensation; weighted average diluted shares were 35.9 million and 35.9 million for the three months ended December 31, 2013 and December 31, 2014, respectively. Please see “ Non - IFRS Measures” in this release for a reconciliation of Adjusted EBITDA and Adjusted profit after tax to the IFRS measure of profit after tax . $142.5 $192.4 $0.0 $50.0 $100.0 $150.0 $200.0 $250.0 2014 2015 ($ in millions) 35.0% $20.3 $27.7 $0.0 $10.0 $20.0 $30.0 $40.0 2014 2015 ($ in millions) 36.6% $0.29 $0.44 $0.00 $0.10 $0.20 $0.30 $0.40 $0.50 2014 2015 ($ per share) 52.9%

Basmati Roadshow_1_October - 2012.ppt 4 9 Months Ended Q3 2015 Financial Highlights Revenue Key drivers Adjusted EBITDA Adjusted EPS % margin 13.6% 14.1% • Revenue increased $111.8 million, or 31.0% to $472.6 million driven by increased sales volume, price and product mix of rice in India and internationally ‒ Sales in India increased $46.0 million or 30.4% to $197.7 million (or 32.5% in rupees), non - India or international sales increased $65.8 million or 31.4 % to $274.9 million ‒ Amira branded and third party branded sales increased $134.3 million or 42.0% to $454.0 million, Institutional sales were $18.6 million compared to $41.1 million a year ago • Cost of material including the change in finished goods as a percentage of revenue increased by 180 basis poin
ts to 78.5% of sales from 76.7% in the year ago period. Cost of material including change in finished goods as a percentage of revenue plus foreign exchange gain/ (loss) (due to hedging of foreign exchange risk) increased by 70 basis points to 78.1% of sales from 77.4%. Increase largely driven by higher cost of raw material from the procurement season of FY 2014 • Freight, forwarding and handling expenses decreased by 140 basis points to 3.0 % of sales from 4.4% in the prior period, due to more shipments involving free on board (FOB). Employee benefit costs decreased 40 bps to 2.1% of sales compared to 2.5% in the prior year period, other expenses increased 30 bps to 3.7% from 3.4% of sales in the prior year period and other gains / losses showed a gain of $4.5 million vs. a loss of $0.7 million in the prior year period • Adjusted EBITDA increased by $17.5 million or 35.7% to $66.5 million, with adjusted EBITDA margins increased 50 bps to 14.1% • The Company’s effective tax rate was 18.4% for the period compared to 24.1% in the year ago period, Adjusted profit after tax increased $11.5 million or 47.8% to $35.7 million from $24.2 million and Adjusted EPS increased by 47.4% to $0.99 per share from $0.68 per share in the prior year period Note: Interim results are not audited. Includes full benefit of Basmati Rice GmbH which was acquired in January 2014; Adjusted EBITDA and Adjusted EPS exclude the impact of non cash compensation; weighted average diluted shares were 35.8 million and 35.9 million for the nine months ended December 31, 2013 and December 31, 2014, respectively. Please see “ Non - IFRS Measures” in this release for a reconciliation of Adjusted EBITDA and Adjusted profit after tax to the IFRS measure of profit after tax. $360.8 $472.6 $0.0 $200.0 $400.0 $600.0 2014 2015 ($ in millions) 31.0% $49.0 $66.5 $0.0 $20.0 $40.0 $60.0 $80.0 2014 2015 ($ in millions) 35.7% $0.68 $0.99 $0.00 $0.40 $0.80 $1.20 2014 2015 ($ per share) 47.4%

Basmati Roadshow_1_October - 2012.ppt 5 3 Months Ended Q3 2015 Revenue Mix Amira and Third Party Branded vs. Institutional Revenue Mix India vs. International Revenue Mix Amira and Third Party Branded Sales Note: Sales to Institutional customers were $16.0 million in Q3 2015 compared to $5.9 million in Q3 2014 India Sales International Sales Note: Calculations have been derived from historical financial statements and has not been audited. Amira and Third Party Branded , 91.7% Institutional , 8.3% $136.5 $176.4 $0.0 $50.0 $100.0 $150.0 $200.0 Q3 '14 Q3 '15 ($ in millions) 29.2% International , 55.0% India , 45.0% $66.3 $86.6 $0.0 $40.0 $80.0 $120.0 Q3 '14 Q3 '15 ($ in millions) 30.7% $76.2 $105. 8 $0.0 $40.0 $80.0 $120.0 Q3 '14 Q3 '15 ($ in millions) 38.9%

Basmati Roadshow_1_October - 2012.ppt 6 Amira Nature Foods Performance Since IPO – 10 Quarters of Double Digit Growth LTM Revenue ($ millions) LTM Adj. EBITDA ($ millions) Note: Includes non IFRS measures and calculations that have been derived from historical financial statements and has not been audited. (1) Adjusted EBITDA bar graph and revenue trend line are based on LTM numbers, while indicated growth rates reflect y - o - y quarte rly growth 19.4% 22.0% 28.7% 53.8 % 56.2% 54.2% 10.2% 16.0% 37.6% 43.2% 36.1% 38.8% 25.1% 48.7% 33.0% 44.0% 25.9% 30.9% Amira LTM Dec . 2012 to LTM Dec. 2014 CAGRs Revenue CAGR 28.3% Adj. EBITDA CAGR 36.6% Adj. EPS CAGR 61.5% Revenue growth (1) Adj. EBITDA growth (1 ) (1) 30.9% 39.4% $41 $45 $50 $52 $57 $61 $67 $75 $80
$86 $93 $342 $360 $401 $414 $444 $472 $501 $547 $576 $609 $659 0 20 40 60 80 100 120 0 100 200 300 400 500 600 700 Jun.12 Sep.12 Dec.12 Mar.13 Jun.13 Sep.13 Dec.13 Mar.14 Jun.14 Sep.14 Dec.14 LTM Adj. EBITDA LTM Revenue 35.0% 36.6%

Basmati Roadshow_1_October - 2012.ppt ANFI Continues to Maintain a Conservative Capital Structure ANFI Leverage (Total Debt / LTM Adj. EBITDA) ANFI Interest Coverage (LTM Adj. EBITDA / Finance Costs Net of Finance Income) 7 Source: Derived from public Company financial statements and Capital IQ as of February 6, 2015 Note: ANFI values based on publicly filed financial statements; Interim results and ratios have not been audited. Large Cap companies include Campbell’s, ConAgra, General Mills, Kellogg, Kraft, Mondelez , PepsiCo, Mead Johnson. Mid Cap companies include JM Smucker , McCormick, Treehouse, Snyder’s - Lance, B&G Foods, Flowers Foods, Post Holding Cop., SodaStream , J&J Snack Foods, and Pinnacle Foods Peer Leverage Levels (Total Debt / LTM Adj. EBITDA)
ANFI continues to maintain a conservative balance sheet with $187.1 million of total debt at December 31, 2014 compared to December 31, 2014 LTM adjusted EBITDA of $93 million ‒ Total Debt to adjusted EBITDA ratio of just 2.0x at December 31, 2014, compared to 2.4x and 3.1x at December 31, 2013 and March 31, 2013, respectively ‒ Net Debt to LTM adjusted EBITDA ratio of just 1.7x at December 31, 2014 ‒ LTM Adjusted EBITDA to Finance Cost (net of Finance Income) ratio of 3.3x at December 31, 2014 ANFI had $27 million of cash on its balance sheet and $21.6 million available under its current borrowing facility suggesting more than sufficient capital to fund its continuing operations Strong relationships with consortium of Indian banks 3.2x 2.8x 2.0x 0.0x 1.0x 2.0x 3.0x 4.0x Mid Cap Food Competitors (Avg) Large Cap Food Competitors (Avg) Amira LTM Adj. EBITDA / Finance Cost (net of Finance Income) 3.1x 2.5x 2.4x 2.4x 2.4x 2.3x 2.2x 2.0x 0.0x 1.0x 2.0x 3.0x 4.0x 5.0x Q4'13 Q1'14 Q2'14 Q3'14 Q4'14 Q1'15 Q2'15 Q3'15 Total Debt / LTM Adj. EBITDA 2.5x 2.8x 3.1x 3.0x 3.3x 3.2x 3.0x 3.3x 0.0x 1.0x 2.0x 3.0x 4.0x 5.0x Q4'13 Q1'14 Q2'14 Q3'14 Q4'14 Q1'15 Q2'15 Q3'15 LTM Adj. EBITDA / Finance Cost (net of Finance Income)
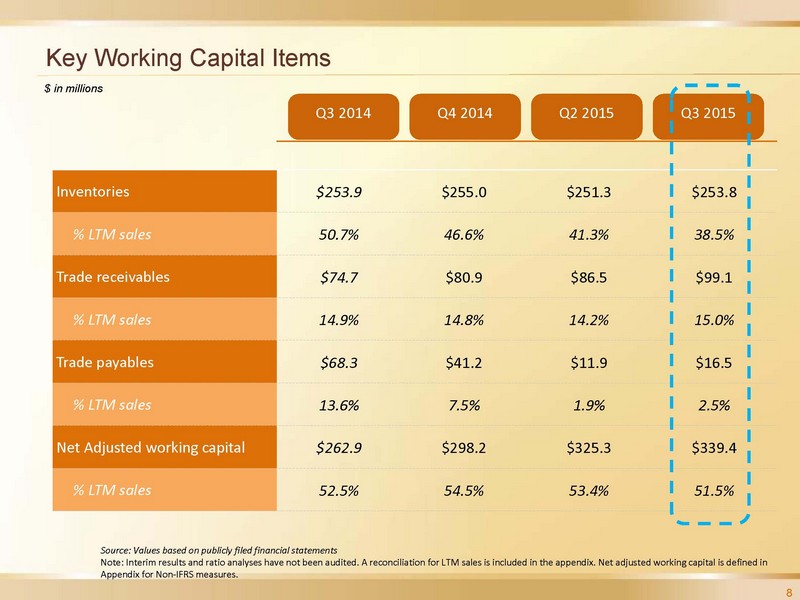
Basmati Roadshow_1_October - 2012.ppt 8 Key Working Capital Items Inventories $253.9 $255.0 $251.3 $253.8 % LTM sales 50.7% 46.6% 41.3% 38.5% Trade receivables $74.7 $80.9 $86.5 $99.1 % LTM sales 14.9% 14.8% 14.2% 15.0% Trade payables $68.3 $41.2 $11.9 $16.5 % LTM sales 13.6% 7.5% 1.9% 2.5% Net Adjusted working capital $262.9 $298.2 $325.3 $ 339.4 % LTM sales 52.5% 54.5% 53.4% 51.5% Source: Values based on publicly filed financial statements Note: Interim results and ratio analyses have not been audited. A reconciliation for LTM sales is included in the appendix. Net adjusted working capital is defined in Appendix for Non - IFRS measures. $ in millions Q4 2014 Q2 2015 Q3 2015 Q3 2014

Basmati Roadshow_1_October - 2012.ppt 9 Key Capital Structure Items Cash and cash equivalents $ 33.8 $37.6 $25.7 $ 27.0 Total debt $160.3 $184.8 $184.2 $ 187.1 LTM adjusted EBITDA $ 67.4 $75.5 $ 85.6 $93.0 Total debt / LTM adjusted EBITDA 2.4x 2.4x 2.2x 2.0x Net debt / LTM adjusted EBITDA 1.9x 2.0x 1.9x 1.7x $ in millions Source: Values based on publicly filed financial statements Note : Interim results and ratio analyses have not been audited. A reconciliation for LTM adjusted EBITDA is included in the appendix. Q4 2014 Q2 2015 Q3 2015 Q3 2014

Basmati Roadshow_1_October - 2012.ppt Outlook Long term FY 2015 Revenue 25% + growth $1.0 billion Adjusted EBITDA 25% + growth $150 million 10

Basmati Roadshow_1_October - 2012.ppt The Truth About Amira: Amira Facts (2012 – 2015)

Basmati Roadshow_1_October - 2012.ppt 11 The Truth About Amira: Amira Facts (2012 - 2015) ANFI listed on the NYSE in October 2012 at $10 per share ‒ The transaction was 100% primary with the net proceeds from the offering being reinvested into the business ‒ The Underwriters for the transaction were UBS Securities LLC, Deutsche Bank Securities Inc., Jefferies & Company, Inc., and KeyBank Capital Markets Inc. ‒ Company Counsel was Loeb & Loeb LLP, Underwriters Counsel was Skadden Arps , Slate, Meagher & Flom LLP ANFI’s financial statements have been fully audited ‒ FY 2010, FY 2011, FY 2012 (pre IPO) and FY 2013 audited by Grant Thornton India LLP ‒ FY 2013 and FY 2014 audited by Deloitte Haskins & Sell LLP Prior to its IPO, ANFI was a family owned entity dating ba
ck to 1915 ‒ Karan A Chanana remains the largest individual shareholder in ANFI ‒ The Chanana family retains various interests unrelated to ANFI ‒ ANFI discloses all related party transactions since time of IPO ANFI has grown since the time of its IPO and currently sells its products in more than 60 countries around the world ‒ Nearly doubled revenues from $342 million for LTM June 2012 to $659 million for the LTM period ended December 2014 ‒ More than doubled adjusted EBITDA from $ 41 million for LTM June 2012 to $93 million for the LTM period ended December 2014 ‒ Increased employees from 252 at time of IPO to 474 at December 2014 ‒ ANFI has not had a major factory upgrade since 2010 and has outgrown its currently facility ‒ ANFI has discussed its plans for the construction of a new factory since the time of its IPO ANFI has an experienced management team and an Independent Board of Directors and Audit Committee (please see appendix) Note: Information based on previous ANFI public filings
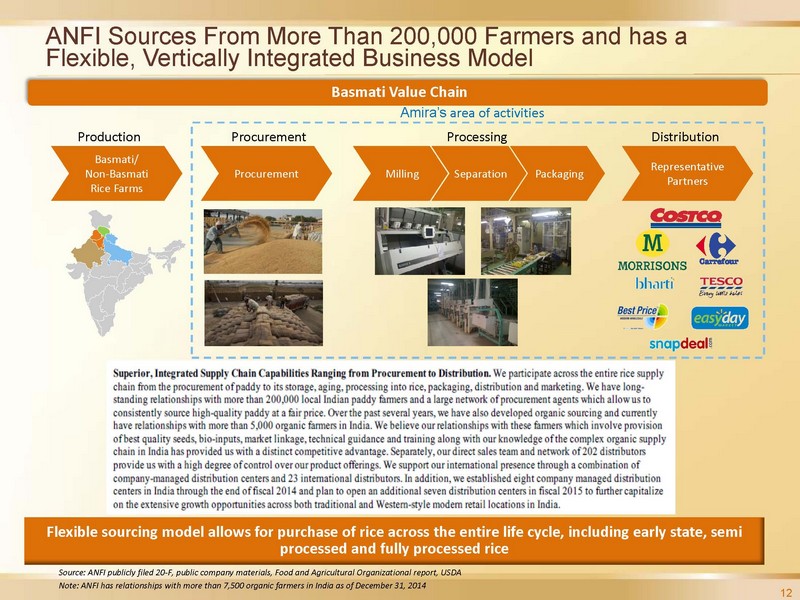
Basmati Roadshow_1_October - 2012.ppt Separation 12 ANFI Sources From More Than 200,000 Farmers and has a Flexible, Vertically Integrated Business Model Basmati/ Non - Basmati Rice Farms Processing Procurement Milling Packaging Representative Partners Distribution Procurement Basmati Value Chain Uttar Pradesh Production Amira’s area of activities Source: ANFI publicly filed 20 - F, public company materials, Food and Agricultural Organizational report, USDA Note: ANFI has relationships with more than 7,500 organic farmers in India as of December 31, 2014 Flexible sourcing model allows for purchase of rice across the entire life cycle, including early state, semi processed and fully processed rice

Basmati Roadshow_1_October - 2012.ppt Currently operates a fully automated and integrated processing and milling facility (originally constructed in 1995 with major upgrades in 2010) Includes grading and packaging units, along with modern in - house laboratory for quality assurance and warehousing Processing capacity of 24 metric tons per hour Existing site in Guragon (less than 20 acres), India sits in a residential area 24 60 Today Post Expansion Plan Installed Capacity (MT/HR) Proposed Acquisition of Amira Enterprises Existing Facility ANFI Remains a Sales Led Organization, but Is Investing in Processing Capacity to Support Growth 13 Processing Capacity Currently process 30 - 35% product as early stage product, additional 30 - 35% reprocessed and remainder via
3rd party After completion of new facility, expect to process >50 % as early stage rice, additional 30 - 35% reprocessed and remainder via 3rd party Source: ANFI publicly filed 20 - F and other publicly available data Planned spending of $64 million disclosed at time of IPO Proposed acquisition Amira Enterprises for $30 million (based on third party appraisal value of land) Buhler rice processing facility on order for $8.3 million Next generation machinery expected to add 48 metric tons per hour of rice milling capacity Upon completion of installation, 12 metric tons per hour facility (2010 vintage) plan to move to new location and sell or discard older - era equipment; construction of office for factory workers, R&D lab and warehousing (vs. 12+ leased warehouses today) Planned CapEx Spend
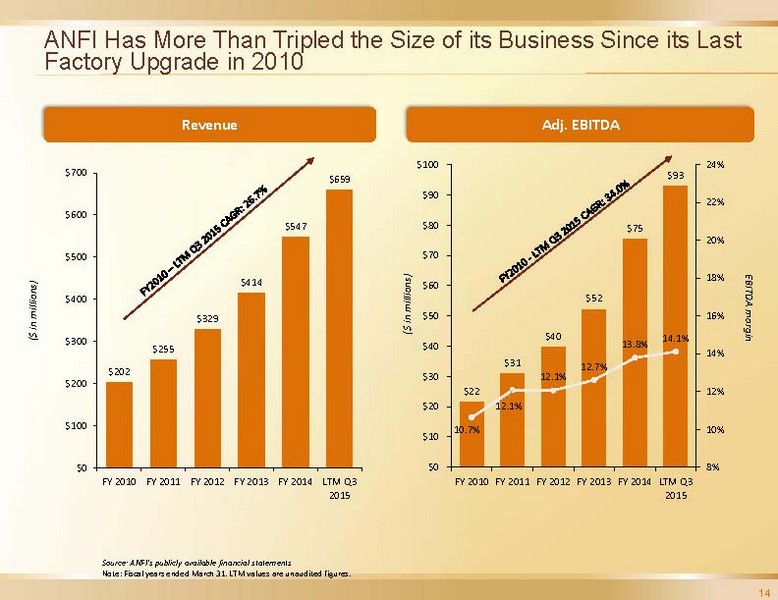
$202 $255 $329 $414 $547 $659 $0 $100 $200 $300 $400 $500 $600 $700 FY 2010 FY 2011 FY 2012 FY 2013 FY 2014 LTM Q3 2015 ($ in millions) $22 $31 $40 $52 $75 $93 10.7% 12.1% 12.1% 12.7% 13.8% 14.1% 8% 10% 12% 14% 16% 18% 20% 22% 24% $0 $10 $20 $30 $40 $50 $60 $70 $80 $90 $100 FY 2010 FY 2011 FY 2012 FY 2013 FY 2014 LTM Q3 2015 EBITDA margin ($ in millions) ANFI Has More Than Tripled the Size of its Business Since its Last Factory Upgrade in 2010 Revenue Adj. EBITDA Source: ANFI’s publicly available financial statements Note : Fiscal years ended March 31. LTM values are unaudited figures. 14

Basmati Roadshow_1_October - 2012.ppt x ANFI provides revenue mix information based upon the following: ‒ Revenue by geography (including India, EMEA, Asia Pacific ex. India and North America ‒ Revenue by Amira branded, third party branded and institutional ‒ Total Basmati revenue and Total non Basmati revenue x ANFI has more than doubled India sales since FY 2012 x ANFI has increased its International sales by almost 50% since FY 2012 ‒ “International sales” are to those sales which are made to international markets outside of India ‒ Sales recorded outside of India includes product sourced from Amira India, as well as from 3rd parties in India and internationally x ANFI has nearly doubled its global Amira branded sales since 2012 20 - F: ANFI’s Revenue Mix Disclosure A
Deeper Look at ANFI’s Sources of Revenue 15 Source: ANFI publicly filed 20 - F and other publicly available data
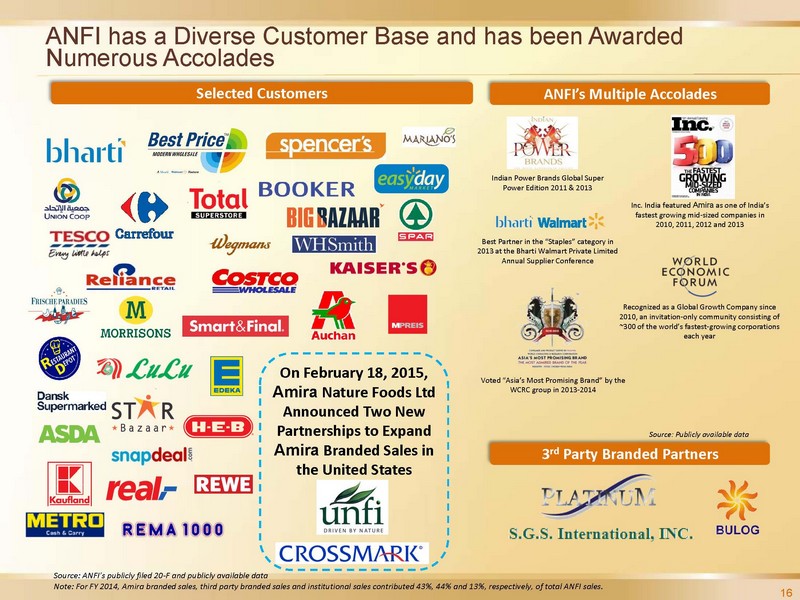
Basmati Roadshow_1_October - 2012.ppt ANFI has a Diverse Customer Base and has been Awarded Numerous Accolades 3 rd Party Branded Partners Selected Customers On February 18, 2015, Amira Nature Foods Ltd Announced Two New Partnerships to Expand Amira Branded Sales in the United States 16 Source: ANFI’s publicly filed 20 - F and publicly available data Note: For FY 2014, Amira branded sales, third party branded sales and institutional sales contributed 43%, 44% and 13%, respe cti vely, of total ANFI sales. ANFI’s Multiple Accolades Indian Power Brands Global Super Power Edition 2011 & 2013 Inc. India featured Amira as one of India’s fastest growing mid - sized companies in 2010, 2011, 2012 and 2013 Recognized as a Global Growth Company since 2010, an invitation - only commu
nity consisting of ~300 of the world’s fastest - growing corporations each year Best Partner in the “Staples” category in 2013 at the Bharti Walmart Private Limited Annual Supplier Conference Voted “Asia’s Most Promising Brand” by the WCRC group in 2013 - 2014 Source: Publicly available data

Basmati Roadshow_1_October - 2012.ppt ANFI’s Products Sit On the Shelves Around the World WH Smith, New Delhi Morrisons , London Dansk, Copenhagen Food Palace, Qatar Mariano’s, Chicago, USA Costco, USA 17 Established base in high growth emerging markets with opportunity to increase penetration in developed markets
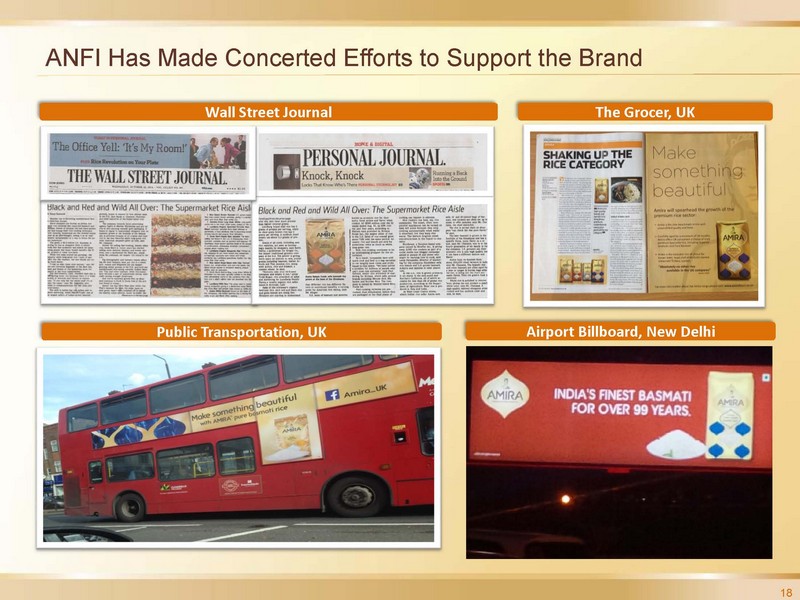
Basmati Roadshow_1_October - 2012.ppt ANFI Has Made Concerted Efforts to Support the Brand Wall Street Journal The Grocer, UK Public Transportation, UK Airport Billboard, New Delhi 18

Basmati Roadshow_1_October - 2012.ppt ANFI Has Invested In Physical Infrastructure with Sales Offices, Processing Equipment and Storage Around the World ANFI’s Offices Around the World Processing Facility, Gurgaon, India 19 Delhi Office (Current) Delhi Office (Spring 2015 expected occupancy) New York Office Dubai Office Dusseldorf, Germany Office Distribution Center, India UK Office ANFI’s offices, factory and warehouses have been visited and diligenced by its investment bankers, lawyers, sellside research analysts and numerous investors Note: for illustrative purposes only. ANFI has additional offices, production facilities that have not been depicted above.
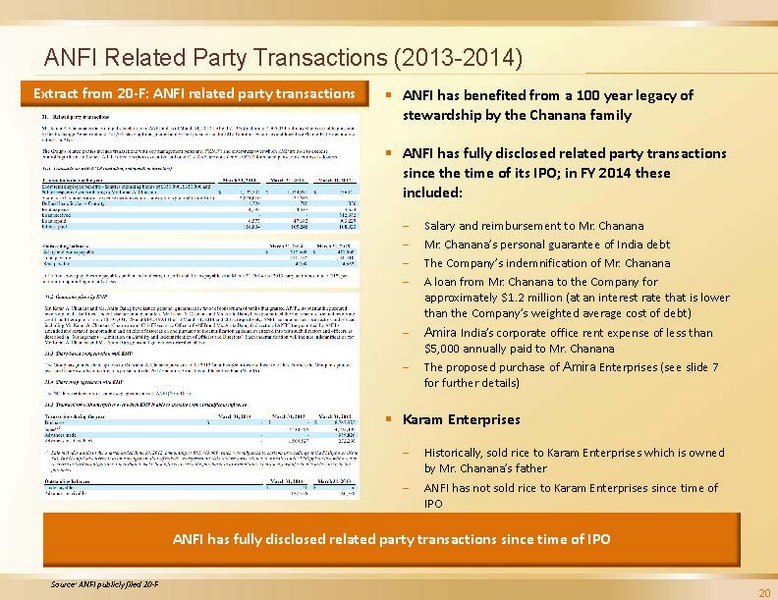
ANFI Related Party Transactions (2013 - 2014) ▪ ANFI has benefited from a 100 year legacy of stewardship by the Chanana family ▪ ANFI has fully disclosed related party transactions since the time of its IPO; in FY 2014 these included: ‒ Salary and reimbursement to Mr. Chanana ‒ Mr. Chanana’s personal guarantee of India debt ‒ The Company’s indemnification of Mr. Chanana ‒ A loan from Mr. Chanana to the Company for approximately $1.2 million (at an interest rate that is lower than the Company’s weighted average cost of debt) ‒ Amira India’s corporate office rent expense of less than $5,000 annually paid to Mr. Chanana ‒ The proposed purchase of Amira Enterprises (see slide 7 for further details) ▪ Karam Enterprises ‒ Historically, sold rice to Karam
Enterprises which is owned by Mr. Chanana’s father ‒ ANFI has not sold rice to Karam Enterprises since time of IPO Extract from 20 - F: ANFI related party transactions ANFI has fully disclosed related party transactions since time of IPO 20 Source: ANFI publicly filed 20 - F
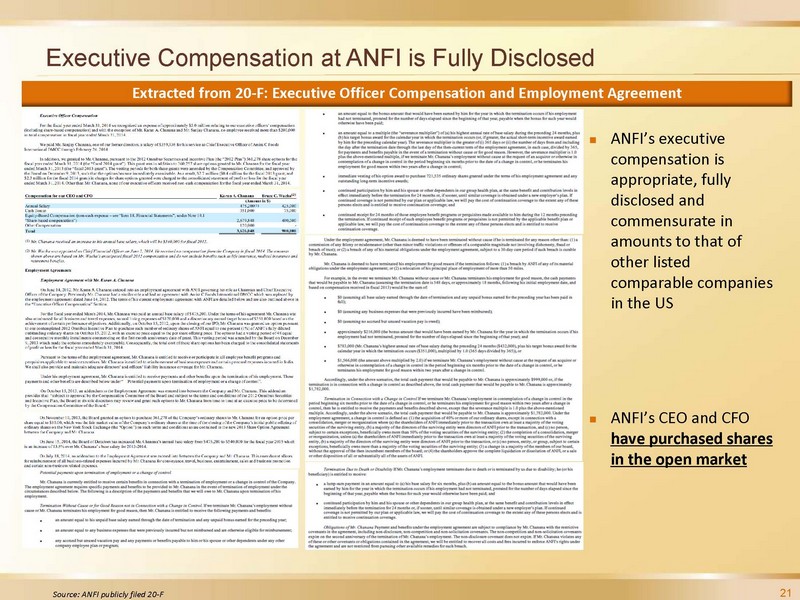
Basmati Roadshow_1_October - 2012.ppt Executive Compensation at ANFI is Fully Disclosed Extracted from 20 - F: Executive Officer Compensation and Employment Agreement 21 Source: ANFI publicly filed 20 - F ANFI’s executive compensation is appropriate, fully disclosed and commensurate in amounts to that of other listed comparable companies in the US ANFI’s CEO and CFO have purchased shares in the open market

Basmati Roadshow_1_October - 2012.ppt Appendix
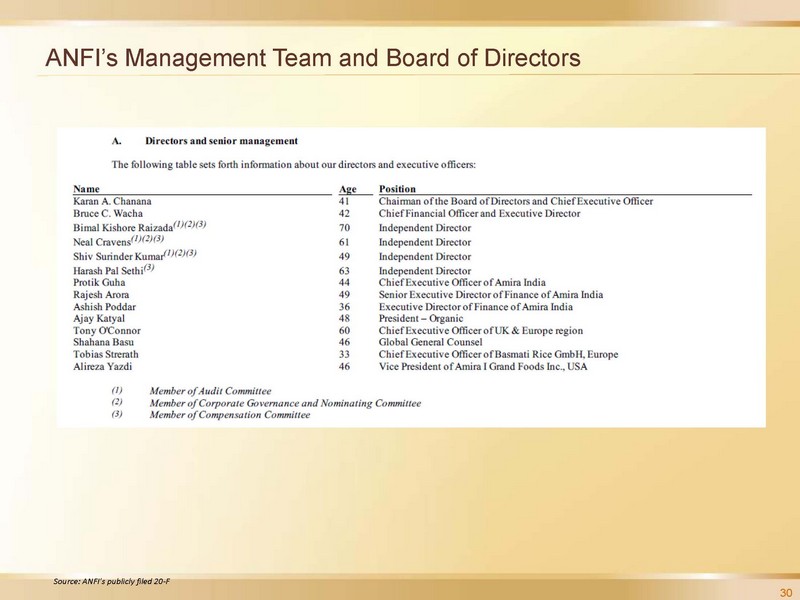
Basmati Roadshow_1_October - 2012.ppt 30 ANFI’s Management Team and Board of Directors Source: ANFI’s publicly filed 20 - F

Basmati Roadshow_1_October - 2012.ppt 31 ANFI’s Independent Directors Source: ANFI’s publicly filed 20 - F
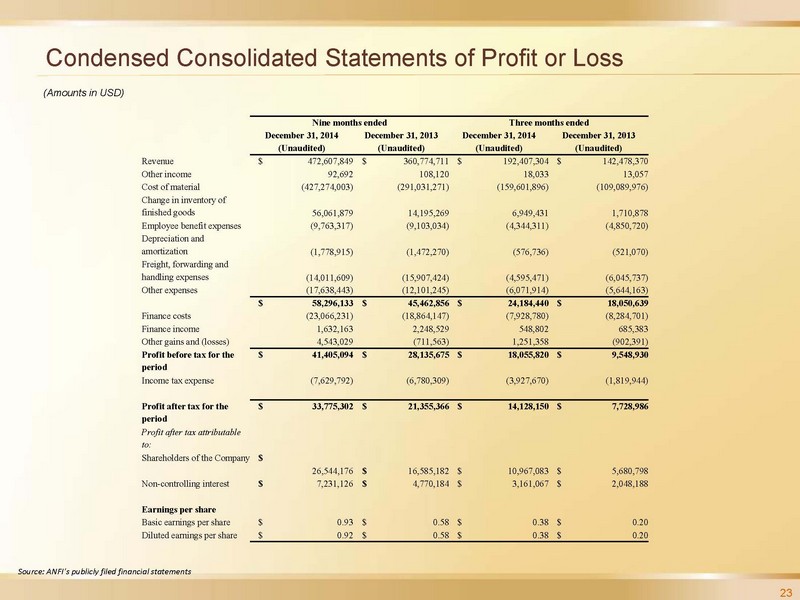
Basmati Roadshow_1_October - 2012.ppt 23 Condensed Consolidated Statements of Profit or Loss (Amounts in USD) Source: ANFI’s publicly filed financial statements Nine months ended Three months ended December 31, 2014 (Unaudited) December 31, 2013 (Unaudited) December 31, 2014 (Unaudited) December 31, 2013 (Unaudited) Revenue $ 472,607,849 $ 360,774,711 $ 192,407,304 $ 142,478,370 Other income 92,692 108,120 18,033 13,057 Cost of material (427,274,003) (291,031,271) (159,601,896) (109,089,976) Change in inventory of finished goods 56,061,879 14,195,269 6,949,431 1,710,878 Employee benefit expenses (9,763,317) (9,103,034) (4,344,311) (4,850,720) Depreciation and amortization (1,778,915) (1,472,270) (576,736) (521,070) Freight, forwarding and handling expenses (14,011,609) (15,90
7,424) (4,595,471) (6,045,737) Other expenses (17,638,443) (12,101,245) (6,071,914) (5,644,163) $ 58,296,133 $ 45,462,856 $ 24,184,440 $ 18,050,639 Finance costs (23,066,231) (18,864,147) (7,928,780) (8,284,701) Finance income 1,632,163 2,248,529 548,802 685,383 Other gains and (losses) 4,543,029 (711,563) 1,251,358 (902,391) Profit before tax for the period $ 41,405,094 $ 28,135,675 $ 18,055,820 $ 9,548,930 Income tax expense (7,629,792) (6,780,309) (3,927,670) (1,819,944) Profit after tax for the period $ 33,775,302 $ 21,355,366 $ 14,128,150 $ 7,728,986 Profit after tax attributable to: Shareholders of the Company $ 26,544,176 $ 16,585,182 $ 10,967,083 $ 5,680,798 Non - controlling interest $ 7,231,126 $ 4,770,184 $ 3,161,067 $ 2,048,188 Earnings per share Basic earnings per share $ 0.93 $ 0.58 $ 0.38 $ 0.20 Diluted earnings per share $ 0.92 $ 0.58 $ 0.38 $ 0.20

Basmati Roadshow_1_October - 2012.ppt 24 Condensed Consolidated Statements of Financial Position (Amounts in USD) Source: ANFI’s publicly filed financial statements As at December 31, 2014 (Unaudited) As at March 31, 2014 (Audited) ASSETS Non - current Property, plant and equipment $ 22,037,426 $ 23,284,918 Goodwill 1,549,872 1,727,338 Other intangible assets 1,898,476 2,262,731 Other long - term financial assets 592,950 485,731 Total non - current assets $ 26,078,724 $ 27,760,718 Current Inventories $ 253,752,955 $ 254,952,549 Trade receivables 99,132,069 80,882,986 Derivative financial assets 260,034 2,352,886 Other financial assets 11,541,259 9,768,514 Prepayments 10,206,040 8,361,244 Other current assets 1,664,630 765,655 Cash and cash equivalents 26,960,875 37,606,098 Total c
urrent assets $ 403,517,862 $ 394,689,932 Total assets $ 429,596,586 $ 422,450,650 EQUITY AND LIABILITIES Equity Share capital $ 9,119 $ 9,115 Share premium 82,896,597 82,804,750 Other reserves (8,575,285) (3,312,575) Retained earnings 100,878,863 74,334,687 Equity attributable to shareholders of the Company $ 175,209,294 $ 153,835,977 Equity attributable to non - controlling interest 23,479,458 18,005,030 Total equity $ 198,688,752 $ 171,841,007 Liabilities Non - current liabilities Defined benefit obligations $ 344,971 $ 246,548 Debt 1,676,780 2,739,414 Deferred tax liabilities 6,291,114 6,666,270 Total non - current liabilities $ 8,312,865 $ 9,652,232 Current liabilities Trade payables $ 16,451,264 $ 41,197,158 Debt 185,432,472 182,103,347 Current tax liabilities (net) 13,066,707 9,644,944 Derivative financial liabilities 489,466 - Other financial liabilities 5,814,444 6,031,593 Other current liabilities 1,340,616 1,980,369 Total current liabilities $ 222,594,969 $ 240,957,411 Total liabilities $ 230,907,834 $ 250,609,643 Total equity and liabilities $ 429,596,586 $ 422,450,650

Basmati Roadshow_1_October - 2012.ppt 25 Condensed Consolidated Statements of Cash Flows (Amounts in USD) Source: ANFI’s publicly filed financial statements Nine months ended December 31, 2014 (Unaudited) December 31, 2013 (Unaudited) (A) CASH FLOW FROM OPERATING ACTIVITIES Profit before tax for the period $ 41,405,094 $ 28,135,675 Adjustments for non - cash items 4,195,710 2,453,905 Adjustments for non - operating incomes and expenses 21,433,198 16,611,490 Changes in operating assets and liabilities (66,896,650) (37,142,521) $ 137,352 $ 10,058,549 Income taxes paid (3,063,424) (2,714,900) Net cash (used in)/ generated from operating activities $ (2,926,072) $ 7,343,649 (B) CASH FLOW FROM INVESTING ACTIVITIES Purchase of property, plant and equipment $ (1,709,197) $ (1,36
4,502) Purchase of intangible assets (2,498) (298,763) Proceeds from sale of property, plant and equipment 1,614 5,332 Proceeds from term deposits 12,497,806 12,883,590 Investments in term deposits (13,671,865) (14,005,325) Purchase of short term investments (41,300) (4,145) Proceeds from the sale of short term investments - (218,250) Interest income 625,812 1,102,293 Net cash used in investing activities $ (2,299,628) $ (1,899,770) (C) CASH FLOWS FROM FINANCING ACTIVITIES Repurchase of shares from ex - director and cancelled $ (38,190) $ - Net proceeds from short term debt 14,217,389 17,821,423 Proceeds from long term debt 18,150 41,445 Repayment of long term debt (963,487) (1,394,134) Interest paid (16,383,217) (14,502,897) Net cash (used in)/ generated from financing activities $ (3,149,355) $ 1,965,837 (D) Effect of change in exchange rate on cash and cash equivalents (2,270,168) (6,907,131) Net increase/ (decrease) in cash and cash equivalents (A+B+C+D) $ (10,645,223) $ 502,585 Cash and cash equivalents at the beginning of the period 37,606,098 33,270,338 Cash and cash equivalents at the end of the period $ 26,960,875 $ 33,772,923

Basmati Roadshow_1_October - 2012.ppt Non IFRS Measures In evaluating our business, we consider and use the non - IFRS measures EBITDA, adjusted EBITDA, adjusted profit after tax, adjust ed earnings per share, adjusted net working capital and net debt as supplemental measures to review and assess our operating performance. The presentation of these non - IFRS financial measures is not intended to be considered in isolation or as a substit ute for the financial information prepared and presented in accordance with IFRS. We define: (1) EBITDA as profit after tax plus fina nce costs (net of finance income), income tax expense and depreciation and amortization; (2) adjusted EBITDA, as EBITDA plus non - cash expe nse for share - based - compensation for three months ended June 30,
2014 and 2013, respectively (3) adjusted profit after tax, as profi t after tax plus non - cash expense for share - based compensation for three months ended June 30, 2014 and 2013, respectively; (4) adjusted earnings per share as the quotient of: (a) adjusted profit after tax and (b) the sum of our weighted average number of shares (i ncluding dilutive impact of share options granted) for the applicable period and the ordinary shares subject to the exchange agreement be tween us and the non - controlling shareholders of Amira India; (5) adjusted net working capital as total current assets minus: (a) tota l current liabilities (b) cash and cash equivalents and plus current debt; and (6) net debt as total current and non - current debt minus ca sh and cash equivalents. We use both EBITDA and adjusted EBITDA as measures of operating performance to assist in comparing performance from period to period on a consistent basis, as a measure for planning and forecasting overall expectations, for evaluating actual results a gai nst such expectations and as a performance evaluation metric, including as part of assessing and administering our executive and emplo yee incentive compensation programs. We believe that the use of both EBITDA and adjusted EBITDA as non - IFRS measures facilitates investors’ assessment of our operating performance from period to period and from company to company by backing out potential differences caused by variations in items such as capital structure (affecting relative finance or interest expenses), non - recur ring IPO - related expenses the book amortization of intangibles (affecting relative amortization expenses), the age and book value of p rop erty and equipment (affecting relative depreciation expenses) and other non - cash expenses. We also present these non - IFRS measures because we believe they are frequently used by securities analysts, investors and other interested parties as measures of the fi nancial performance of companies in our industry. We present adjusted EBITDA, adjusted profit after tax, adjusted earnings per share, adjusted net working capital and net debt be cause we believe these measures provide additional metrics to evaluate our operations and, when considered with both our IFRS resul ts and the reconciliation to profit after tax, basic and diluted earnings per share, working capital and total current and non - current debt, respectively, provide a more complete understanding of our business than could be obtained absent this disclosure. We also be lie ve that these non - IFRS financial measures are useful to investors in assessing the operating performance of our business after refl ecting the adjustments described above. 26

Basmati Roadshow_1_October - 2012.ppt 27 Non IFRS Reconciliations for Adj. EBITDA and Adj. Profit After Tax (Amounts in USD) Nine months ended Three months ended December 31, 2014 December 31, 2013 December 31, 2014 December 31, 2013 Profit after tax (PAT) $ 33,775,302 $ 21,355,366 $ 14,128,150 $ 7,728,986 Add: Income tax expense 7,629,792 6,780,309 3,927,670 1,819,944 Add: Finance costs (net of finance income) 21,434,068 16,615,618 7,379,978 7,599,318 Add: Depreciation and amortization 1,778,915 1,472,270 576,736 521,070 EBITDA $ 64,618,077 $ 46,223,563 $ 26,012,534 $ 17,669,318 Add: Non - cash expenses for share - based compensation 1,924,136 2,800,677 1,736,913 2,645,855 Adjusted EBITDA $ 66,542,213 $ 49,024,240 $ 27,749,447 $ 20,315,173 Nine months ended Three months ende
d December 31, 2014 December 31, 2013 December 31, 2014 December 31, 2013 Profit after tax (PAT) $ 33,775,302 $ 21,355,366 $ 14,128,150 $ 7,728,986 Add: Non - cash expenses for share - based compensation 1,924,136 2,800,677 1,736,913 2,645,855 Adjusted profit after tax $ 35,699,438 $ 24,156,043 $ 15,865,063 $ 10,374,841

Basmati Roadshow_1_October - 2012.ppt 28 Non IFRS Reconciliation for Adjusted Earnings Per Share (Amounts in USD) Source: ANFI’s publicly filed financial statements Nine months ended Three months ended December 31, 2014 December 31, 2013 December 31, 2014 December 31, 2013 Profit after tax (PAT) $ 33,775,302 $ 21,355,366 $ 14,128,150 $ 7,728,986 Profit attributable to Shareholders of the Company (A) $ 26,544,176 $ 16,585,182 $ 10,967,083 $ 5,680,798 Weighted average number of shares (for basic earnings per share) (B) 28,677,018 28,672,134 28,679,439 28,674,389 Dilutive impact of stock options as converted in equivalent number of shares (C) 239,016 138,785 225,944 231,445 Weighted average number of shares (for diluted earnings per share) (D) = (B) + C) 28,916,034 28,810,919
28,905,383 28,905,834 Shares issuable under exchange agreement (E) 7,005,434 7,005,434 7,005,434 7,005,434 Basic earnings per share as per IFRS (A) ÷ (B) $ 0.93 $ 0.58 $ 0.38 $ 0.20 Diluted earnings per share as per IFRS (A) ÷ (D) $ 0.92 $ 0.58 $ 0.38 $ 0.20 Profit after tax (PAT) (F) $ 33,775,302 $ 21,355,366 $ 14,128,150 $ 7,728,986 Add: Non - cash expenses for share - based compensation (G) $ 1,924,136 $ 2,800,677 $ 1,736,913 $ 2,645,855 Adjusted profit after tax (H) = (F) +(G) $ 35,699,438 $ 24,156,043 $ 15,865,063 $ 10,374,841 Weighted average number of shares (including dilutive impact of share options granted) and the ordinary shares subject to the exchange agreement between us and the non - controlling shareholders of Amira India (I) = (D) + (E) 35,921,468 35,816,353 35,910,817 35,911,268 Adjusted earnings per share (H) ÷ (I) $ 0.99 $ 0.68 $ 0.44 $ 0.29

Basmati Roadshow_1_October - 2012.ppt 29 Non IFRS Reconciliation for Adj. Net Working Capital and Net Debt (Amounts in USD) Source: ANFI’s publicly filed financial statements As at December 31, 2014 As at March 31, 2014 Current assets: Inventories 253,752,955 254,952,549 Trade receivables 99,132,069 80,882,986 Derivative financial assets 260,034 2,352,886 Other financial assets 11,541,259 9,768,514 Prepayments 10,206,040 8,361,244 Other current assets 1,664,630 765,655 Cash and cash equivalents 26,960,875 37,606,098 Total current assets 403,517,862 394,689,932 Current liabilities: Trade payables 16,451,264 41,197,158 Debt 185,432,472 182,103,347 Current tax liabilities (net) 13,066,707 9,644,944 Derivative financial liabilities 489,466 - Other financial liabilities 5,814,444 6,031,5
93 Other current liabilities 1,340,616 1,980,369 Total current liabilities 222,594,969 240,957,411 Working Capital (Total current assets minus Total current liabilities) 180,922,893 153,732,521 Less: Cash and cash equivalents 26,960,875 37,606,098 Add: Current debt 185,432,472 182,103,347 Adjusted net working capital 339,394,490 298,229,770 As at December 31, 2014 As at March 31, 2014 Current debt 185,432,472 182,103,347 Non - current debt 1,676,780 2,739,414 Total current and non - current debt 187,109,252 184,842,761 Less: Cash and cash equivalents 26,960,875 37,606,098 Net debt 160,148,377 147,236,663

Basmati Roadshow_1_October - 2012.ppt 30 Q3 2015 LTM Revenue, Adj. EBITDA and Adj. PAT Reconciliation FY 2013 FY 2014 (A) 9 Months Ended Dec 31, 2013 (B) 9 Months Ended Dec 31, 2014 (C) LTM Dec 31, 2014 (A) – (B) + (C) Revenue $413.7 $547.3 $360.8 $472.6 $ 659.2 Adjusted EBITDA $52.4 $75.5 $49.0 $66.5 $93.0 Adjusted PAT $21.2 $41.0 $24.2 $35.7 $52.5 ($ in USD millions) Source: ANFI’s publicly filed 20 - F and public company financial statements Note: LTM and quarterly values are unaudited.

Basmati Roadshow_1_October - 2012.ppt
Exhibit 99.3


CORPORATE PARTICIPANTS
Karan A Chanana, Chairman and Chief Executive Officer
Bruce Wacha, Chief Financial Officer
CONFERENCE CALL PARTICIPANTS
Rupesh Parikh, Oppenheimer, Analyst
Eric Katzman, Deutsche Bank, Analyst
Akshay Jagdale, KeyBanc, Analyst
PRESENTATION
Operator
Greetings and welcome to the Amira Nature Foods Third Quarter 2015 Earnings Conference Call. At this time, all participants are in a listen-only mode. A question-and-answer session will follow the formal presentation. As a reminder, this conference is being recorded. It is now my pleasure to introduce your host, Ms. Katie Turner. Thank you. Ms. Turner, you may begin.
Katie Turner
Good morning and welcome to Amira Nature Foods third quarter fiscal 2015 earnings conference call. Speaking on the call today are, Karan A Chanana, Amira's Chairman and Chief Executive Officer; and Bruce Wacha, Amira's Chief Financial Officer. We are also joined by Ashish Poddar, Executive Director of Finance; and Rajesh Arora, Senior Executive Director of Finance. By now everyone should have access to the earnings release, which went out today at approximately 8 A.M. Eastern Time. The earnings press release and the earnings presentation are available on the Investor Relations portion of the company's website at www.amira.net. This call is being webcast and a replay will also be available on Amira's website. Before I begin, we would like to remind everyone that prepared remarks contains forward-looking statements and management may make additional forward-looking statements in response to your questions. Such statements involve a number of known and unknown risks and uncertainties, many of which are outside of the company's control that could cause its future results, performance or achievements to differ significantly from our results, performance, or achievements expressed or implied by such forward-looking statements. Important factors that could cause or contribute to such differences include risks detailed in the company's public filings with the Securities and Exchange Commission and those mentioned in the earnings release. Except as required by law, the company undertakes no obligation to update any forward-looking statements herein, and as a result of new information, future events, or otherwise. Also in the company's earnings release and in today's prepared remarks, the company includes adjusted EBITDA, adjusted profit after tax and adjusted earnings per share. These are non-IFRS financial measures. A reconciliation of non-IFRS measures to the most directly comparable IFRS financial measures is included in the company's press release. And with that, I'd like to turn the call over to Karan A Chanana, Amira's Chairman and Chief Executive Officer.
ViaVid has made considerable efforts to provide an accurate transcription, there may be material errors, omissions, or inaccuracies in the reporting of the substance of the conference call. This transcript is being made available for information purposes only.
1-888-562-0262 1-604-929-1352 www.viavid.com
| 1 |
Karan A Chanana, Chairman and Chief Executive Officer
Thank you, Katie, and thank you to everybody and our sell-side analysts for joining us on this morning’s call. This is our third quarter of 2015.
For those who are new to our story, I’d like to begin by pointing out 2015 is a very special year for us. We are now celebrating our centennial year. We are a hundred years old but young public company, and we can expect to do great things with Amira for the next hundred years. Now, we are blessed to be in a great category with attractive growth dynamics. As many of you know, we are focused on the specialty rice, primarily Basmati rice, which is a high growth segment of the broader $275 billion global rice market. Basmati continues to grow at healthy double digit rate, whether it’s in our home market of India, in other emerging markets in the Middle East, et cetera, and in the developed markets such as the US.
In our current fiscal quarter, we increased revenues by approximately 35%. Yes, that’s right, 35%. We reported record results for quarter revenue, adjusted EBITDA, profits after tax and EPS. Our sales in India grew by more than 30% for the quarter, while our international sales grew almost 40%. Now, we are not relying on category dynamics alone. Instead, we have continued to make investments in the Amira brand, while also adding infrastructure and further develop our distribution footprint, both in India and across the world.
First, in our home market in India. We continue to add more Company managed DCs. We had nine at the close of the quarter in December, and we have added three since, to make it a 12—total of 12 DCs as of now. We are well on our way of hitting the target of 15 Company managed DCs in India compared to just one at the time of IPO. These additional DCs are of great strategic importance to us and it better enables us to maximize our breadth and depth of reach in India and take better advantage of the unique growth opportunities in the Indian market.
Let me remind you, India has nine million mom-and-pop stores. The Indian budget just came out on Saturday, where the growth rate of the GDP was classified close to 7%. The roadmap for the (inaudible) has been clearly laid out through the budget. India is expecting the next financial year to grow at 8, 8.5% and then thereafter at even 10, so we at Amira are right there to take advantage of this demographic dividend through our (inaudible) and distribution and through our (inaudible), you know, so it’s not all brick and mortar alone. We increased distribution and at a partnership (inaudible) with Snapdeal.com, which we did a press release for, this is, you know, also known as the Amazon of India. The partnership with Snapdeal makes Amira the first premium packaged Basmati rice brand to make available on the internet through organized retail. We have also done similar partnerships with smaller ecommerce Indian (inaudible) thereafter.
Separately, we are also looking to the international markets throughout the emerging and the developed world. We have an inherent advantage with our reach into emerging markets based on existing strong relationships with our third party branded partners, many of which have been with us for decades. I’ll also remind you, our third party branded business and pass through business dates back to 1978. We have also been focused on the developed markets in the recent years. Many of you are aware of the progress made in the UK, where we are now in four of the five largest retailers in the UK, so we are in Morrison’s, Asda, Tesco and Waitrose with the Amira brand. I must highlight at Tesco and Waitrose, we’ve barely been there for about seven months. We went into Tesco late July, early August and in (inaudible) and Waitrose last week of September, so still early days for (inaudible).
Now it’s time for us to begin making progress in the US. As many of you know, we have a great relationship with Costco. That has been a terrific partner for us. On our last call, we highlighted the new relationship with the Chicago-based premium retailer, Mariano’s. We are optimistic that we’ll add to this presence in the coming year and point to our recent announcements regarding two very important strategic relationships. First, we have appointed CROSSMARK as our national broker to represent the Amira brand in the United States. We selected CROSSMARK for their extensive retail customer relationships, deep understanding of the grocery and mass merchandise channels across the US. We believe the CROSSMARK partnership will help us execute on our vision of connecting the wide range of Amira products with the American consumer.
ViaVid has made considerable efforts to provide an accurate transcription, there may be material errors, omissions, or inaccuracies in the reporting of the substance of the conference call. This transcript is being made available for information purposes only.
1-888-562-0262 1-604-929-1352 www.viavid.com
| 2 |
Separately, we also entered into an agreement with UNFI to distribute the Amira brand across the United States. UNFI is a leading independent national distributor of natural, organic and specialty foods in the US. UNFI, as many of you know, services more than 40,000 locations, making this partnership a huge growth opportunity as we look to launch three new Amira Organic products this spring. We have some early reviews through our strategic partnership. Publix, the leading retailer in Florida, has just accepted the Amira products to go into their (inaudible) stores and you should see the products on their shelves by June. We are very excited about our recent performance, but we are not going to stop there.
You can expect a lot of great things from us and to discuss the quarter in greater detail, I’ll now hand it over to our global CFO, Bruce.
Bruce Wacha, Chief Financial Officer
Thank you, Karan. It’s my pleasure to walk through the December period results, which are our fiscal third quarter and first nine months of the year, and the results are very strong. As Karan mentioned earlier, we are currently celebrating our one hundred year centennial in 2015, and we are also now reporting our tenth consecutive earnings call as a public company and we have now reported 10 consecutive quarters of double digit revenue and profit growth since the IPO. During our fiscal third quarter, we generated record quarterly revenue, adjusted EBITDA and adjusted EPS, and all were up 35% or more for the quarter. Our growth was driven primarily by volume gains as we built out our positions around the globe and capitalized on the continued demand for healthy, better for you products such as our premium specialty rice offerings.
Now as we discuss the third quarter in detail, I’d like to reference page 3 of the investor presentation, which folks should have been able to obtain, along with our formal press release. Revenues increased by nearly $50 million or 35% to $192.4 million, a record quarterly revenue number. Sales in India increased by $20.3 million or 30.7% to $86.6 million for the quarter, while non-India or international sales increased $30 million or nearly 40% to $105.8 million. Amira branded and third party branded sales increased by nearly $40 million or approximately 30% to $176.4 million, while our opportunistic institutional business had sales of $16 million compared to just under $6 million a year ago. Our revenues have typically been driven by some combination of gains in both price/mix and volume. This quarter, we have seen volume growth as the primary driver for growth, while we also benefited in part from mix in our core packaged rice business, both in India and internationally.
Cost of material, including the change in finished goods, increased by $45 million or 42% to $152.7 million for the quarter. The primary driver for the increase in cost of materials was higher sales and also a higher cost of raw material from the procurement season from fiscal 2014.
Increases in cost of materials margins were offset by other line items throughout the remainder of our P&L, showing the power of our business model. Freight, forwarding and handling expenses decreased by 180 basis points to 2.4% of sales from 4.2% in the prior period. Employee benefit costs decreased by 110 basis points to 2.3% of sales compared to 3.4% in the prior year period. Other expenses decreased 80 basis points to 3.2% from 4% in the sales a year ago, and other gains and losses showed a gain of $1.3 million versus a loss of $0.9 million in the prior year.
Our adjusted EBITDA increased by $7.4 million or 36.6% to $27.7 million, benefiting from increased revenues and a slightly higher margin profile, with adjusted EBITDA margins increasing by about 10 basis points to 14.4%, which is Amira’s highest adjusted EBITDA margin on record as a public company. Our effective tax rate was 21.8% for the period compared to 19.1%, in line with the 20% range that we’ve been guiding towards. Our adjusted profit after tax increased by $5.5 million or 52.9% to $15.9 million from $10.4 million in the prior period. Adjusted EPS increased by more 50% to $0.44 per share from $0.29 per share in the prior year.
ViaVid has made considerable efforts to provide an accurate transcription, there may be material errors, omissions, or inaccuracies in the reporting of the substance of the conference call. This transcript is being made available for information purposes only.
1-888-562-0262 1-604-929-1352 www.viavid.com
| 3 |
On page 4, we had a similar story for the nine-month period, with revenues up more than 30%, adjusted EBITDA up more than 35% and adjusted EPS up more than 45%.
Moving to page 5, I’d like to quickly point out that our Amira branded and third party branded business accounted for more than 90% of revenues and at the institutional business, less than 10%. Meanwhile, our India versus International business was in line with the 40 to 45% / 55 to 60% split that we typically see.
As a reminder, on page 6, you can see our 10 quarters of reporting as a public company with double digit revenue, EBITDA and EPS growth. Additionally, as you can see at the top right of the page, we are now at $659 million of sales and $93 million of adjusted EBITDA for the trailing 12-month period ended December 31st, 2014.
On page 7, I’d like to pause on our capital structure for a moment. As you can see on the top left of the page, Amira has continued to de-lever by growing EBITDA over time, with debt to EBITDA now at just 2.0 times, and actually, 1.7 on a net debt to EBITDA basis. On the bottom right, our leverage ratios, as you can see, are well below that of our mid cap and large cap peers trading in the US, illustrating Amira’s conservative balance sheet. Additionally, as you can see on the bottom left, our interest coverage or adjusted EBITDA to net finance costs, are an attractive 3.3 times, suggesting great discretionary free cash flows before we channel that cash back into the business in the form of inventory purchases to fund future growth.
On page 8, key working capital items, you can see how we have benefited, in part, from some input cost relief during the current crop cycle, and a lower priced crop in front of us, we are positioned for future growth but with inventory levels that are flattish in dollar terms to the prior year but nicely lower than that 45% of trailing sales that we’ve seen more recently. Also note on page 8, our trade payables have remained modest at $16.5 million.
On page 9, we discussed leverage levels previously, but as you can see flowing from right to left on the page—or, sorry, from left to right on the page, we have taken debt to EBITDA down from 2.4 a couple quarters ago to 2 times today and net debt from 1.9 times to 1.7 times today.
Now, finishing on page 10, outlook. As people may recall, we raised our full year fiscal 2015 guidance to plus 25% growth for both revenue and adjusted EBITDA back in late December, and we still expect to hit those targets today.
With that, I’d like to open up the discussion with questions from the audience. Thank you.
Operator
Thank you. Ladies and gentlemen, at this time, we will be conducting the question and answer session. If you would like to ask a question, please press star, one on your telephone keypad. The confirmation tone will indicate your line is in the question queue. You may press star, two if you’d like to remove your question from the queue. For participants using speaker equipment, it may be necessary to pick up your handset before pressing the star keys.
Our first question is coming from the line of Rupesh Parikh with Oppenheimer. Please proceed with your question.
ViaVid has made considerable efforts to provide an accurate transcription, there may be material errors, omissions, or inaccuracies in the reporting of the substance of the conference call. This transcript is being made available for information purposes only.
1-888-562-0262 1-604-929-1352 www.viavid.com
| 4 |
Rupesh Parikh, Oppenheimer, Analyst
Thanks for taking my question and congrats on the really nice quarter.
Bruce Wacha, Chief Financial Officer
Thank you.
Rupesh Parikh, Oppenheimer, Analyst
So first, I just wanted to start on, you know, I guess at a higher level, just Karan, in terms of what you’re seeing right now from the Indian consumer and the competitive market in India, and also maybe your thoughts on what’s happening right now in the Middle East.
Karan A Chanana, Chairman and Chief Executive Officer
Yes, good question and hi, Rupesh. Thank you for being on the call, and the India market is very strong. The crop came in and it’s almost over, and you know, the crop is higher by 15%. The prices are lower, so that made for a lower input cost for the mid-financial year. That has led to higher volume growth, both in India and from our customers and what we’re hearing from our distributors for the next financial year. You know, and to put that better in perspective, if you look at the last four to five years, including this one, for the Basmati rice business, you will see prices are up sharply across the board on a five-year average, which they should be, and every time (inaudible) there is a slight reduction in price, the complete channels to the consumer picks up a lot, of course, so we’re looking. With what we have seen—we’ve declared a $90 million contract end of December and what we are seeing is a lot of volume growth coming into India and the emerging markets. If you look at across the board, that’s what the interesting aspect (inaudible).
Rupesh Parikh, Oppenheimer, Analyst
Okay, thank you. Then in terms of DC, it seems like you’re on pace to roll out the Indian DCs this year. What’s your thoughts longer term in terms of how many DCs you think you may need in that market? Also, are you starting to see better sales from just improved service levels with the new DCs?
Karan A Chanana, Chairman and Chief Executive Officer
Good question. Service levels, as you know, the quarter we are in right now and the quarter which has just passed by what we’ve also introduced internally is an (inaudible) between now and future (ph) departments, a service level agreement that is. So each DC is actually a growth agent for us. It helps us get better distribution within that region, and that’s why we continue to invest in third (ph) management strength (inaudible) each of these DCs, and I think that’s crucial for us. So to your question, yes, we are seeing clear benefits. As soon as a DC comes online, both the cost three to four months, it’s getting regular revenue close to and the plan was to actual (inaudible) it, so—and we believe we will continue. I can’t give you forecasts right now. We normally do that at the end of our fiscal year, and we will tell you that (inaudible) how many more DCs we’re looking to (inaudible).
But India, you know, I spoke a little about the budget. The euphoria is completely there. The oil price is down globally so it—has been the foreign exchange and the government taking in the majority of the risk, what (inaudible) defined in the budget forward and the infrastructure play, I think India is poised for a new amount of growth. We’ll be definitely out there seeking dividends from that (inaudible), and we are poised to do that. The Middle East, you know, the common psychology would be, okay, lower oil prices, what are you seeing in the emerging markets, et cetera? You know, I’d like to really remind everybody that Basmati rice and specialty rice is center of the table food for the emerging markets and (inaudible) is just so low that you’re seeing continued consumption growth. You know, in our estimates, there’s 15% growth of Basmati rice in India and it is more than 20% growth of Basmati rice on an international level, so—and we are just doing a better job because we have management teams across the world and we are actively adding more and more intellectual capital, people to our team and they’re going with it.
ViaVid has made considerable efforts to provide an accurate transcription, there may be material errors, omissions, or inaccuracies in the reporting of the substance of the conference call. This transcript is being made available for information purposes only.
1-888-562-0262 1-604-929-1352 www.viavid.com
| 5 |
Rupesh Parikh, Oppenheimer, Analyst
Great, and just shifting gears on your US distribution, congrats on the Publix win. So at this point, you know, with the UNFI partnership and CROSSMARK, do you feel now that you have sales and marketing infrastructure in the US to start growing that business?
Karan A Chanana, Chairman and Chief Executive Officer
Absolutely. What we’ve also done is we’ve got an outsource sales force in CROSSMARK and we’ve got another company and then we have UNFI, our New York office, where—which is headed by Bruce, our global CFO who’s on the call. We have a marketing, Vice President of Marketing who’s there and we’ll also be getting more sales people added to our US team. I’ve always spoke about US as a priority but—and I’ve—however, I’ve said that, you know, we have so much low-hanging fruit across the world, but I think now you’re seeing the Amira brand come out there to what I have been talking about, so we look forward to a lot more gains and bringing the brand very close to everybody. So I think still early days but a lot of headroom to grow.
Rupesh Parikh, Oppenheimer, Analyst
Okay, thank you. My last question, maybe just for Bruce, and maybe if you can give us maybe a little more color on what’s happening on the cost side with the lower employee benefit expenses and the shifting, and also where you’re—was the cost of materials in line with what you were expecting for the quarter?
Bruce Wacha, Chief Financial Officer
Yes, so first on the cost of materials side, I think you have to remember that the crop season 2014 had increases, so while we took up price a year ago, we’re cycling through that dynamic right now from a margin standpoint, which is to be expected. Now, on the employee costs and really the lower half of our P&L, we’re starting to see the real benefits of the economies of scale for the business as we grow and, essentially, that’s what you see on the employee costs.
Rupesh Parikh, Oppenheimer, Analyst
Okay. Thank you.
Operator
Thank you. Our next question is coming from the line of Eric Katzman with Deutsche Bank. Please proceed with your question.
Eric Katzman, Deutsche Bank, Analyst
Hi, good morning, everybody.
Bruce Wacha, Chief Financial Officer
Morning.
Karan A Chanana, Chairman and Chief Executive Officer
Good morning.
ViaVid has made considerable efforts to provide an accurate transcription, there may be material errors, omissions, or inaccuracies in the reporting of the substance of the conference call. This transcript is being made available for information purposes only.
1-888-562-0262 1-604-929-1352 www.viavid.com
| 6 |
Eric Katzman, Deutsche Bank, Analyst
I guess, you know, can you talk a little bit—you’ve given a lot of detail around the P&L, but Bruce, and I guess, Karan, you know, can you talk a little bit about the—given the high yield offerings pullback, kind of what are the plans now in terms of, I guess, you know, growth capital spending and have you received the production equipment from Buhler and how do you finance forward? Will it be that—will you just now depend upon the consortium of Indian banks like you’ve been doing? Maybe just some color as to kind of how all this now shapes up.
Bruce Wacha, Chief Financial Officer
Sure. Great question, Eric. As you know, we launched the bond deal last month and due to some of the efforts of short sellers that disrupted our stock prices, that deal has not yet happened. When I look at our balance sheet, I continue to remind people we’re 2 times debt to EBITDA, 1.7 on a net debt basis, so we are not by any means over-levered. We have opportunities to work with our Indian banks. We’re evaluating those opportunities to see what’s the path that makes the most sense for us. In the meantime, we do have ample liquidity, both with cash and current borrowing ability.
With regards to the factory, I would say this probably delays us a little bit just in terms of the shift and trying to figure out the appropriate thing to do, but I would anticipate that’s probably being more the back half of calendar 2015. Now, as people know by following our Company, we do have a good vertically integrated sourcing and processing model, so we currently source early stage rice for about a third of our product, more mid-stage rice that we’re running through and packaging in our factory for the middle third and then the back half is either relying on third party millers for rice that we’ve purchased or purchasing opportunistically more finished product, and so we’ll continue to use that model going forward.
Eric Katzman, Deutsche Bank, Analyst
Okay. Then, Karan, I didn’t know if you wanted to add on to that in terms of how you kind of see it, or is that—that’s sufficient?
Karan A Chanana, Chairman and Chief Executive Officer
No, I’ll add to that. So I think (inaudible) showed you the model of the—as he said, of the new facility and so (inaudible) up and running by the second half of the calendar year. I think you said (inaudible) the back half of the year, and on the financing, yes, we will look at other options as well but the—consulting with Indian banks has always been very supportive. We’ve worked with them for now three decades, and the only differential being the US bond offering would have been at a better pricing versus what we get in India. So we won’t—you’re right, we will go back to them and look at other opportunities that Bruce is doing actively, and I think we have ample liquidity. We would work in that manner.
Eric Katzman, Deutsche Bank, Analyst
Okay. Then the—I don’t know if you can comment, but the receipt of the new equipment, kind of when is that now supposed to occur, or did it—maybe it already occurred and it’s just, you know, now waiting for a facility as opposed to in transit or something, I don’t know?
Karan A Chanana, Chairman and Chief Executive Officer
I think we will time it according to our construction layout and we’ll update you on the next call on that.
ViaVid has made considerable efforts to provide an accurate transcription, there may be material errors, omissions, or inaccuracies in the reporting of the substance of the conference call. This transcript is being made available for information purposes only.
1-888-562-0262 1-604-929-1352 www.viavid.com
| 7 |
Eric Katzman, Deutsche Bank, Analyst
Okay. Then—so I guess last question for me and I’ll pass it on. So this—as you had kind of said in the last call, the crop—this year’s crop is a big one. It’s likely to result in—because it’s so much volume, it’s likely to result in some lower prices and I guess you see that as being beneficial to volume because, one, you know, you’ve got the GDP of India growing rapidly and your distribution gains, but you also—do you see some of that pricing flowing through into the market in terms of lower prices for the consumer, or how do you see that kind of playing out over—and I realize this is for the next year’s crop, or the next year’s sales as opposed to this.
Karan A Chanana, Chairman and Chief Executive Officer
Good question, Eric. So you’re spot on. The crop is larger in size. The input cost for us is lower, and as you—as—you know, for the benefit of everybody else, we haven’t, you know, (inaudible) age the product before we bring it to the consumer and by the time it gets to them, should be a year old. So yes, we have a low input cost. We will keep some of that for ourselves in an aim to make a better margin and the rest will be passed on. So to answer your question on the consumer, yes, I think the consumer should look towards getting a better price, maybe in the back half of this calendar year, which is our next fiscal year, and that’s how it’s going to pan out. On your observation about volume, definitely, I mentioned that in my opening remarks, where we find that our distributors and third party customers are all looking towards a better volume intake because we’ve seen this clearly pan out with the history as our benefit of we feel that the next crop would be, probably be flattish or comparison to the (inaudible) year before and in actual cycle of prices going higher than what we have today. So yes, that’s the scenario currently, so next financial year, we look at the consumer getting slightly better prices.
Eric Katzman, Deutsche Bank, Analyst
I guess—last question. Sorry, the last one was the second to last one. The—for US investors or US, you know potential investors, when do you think they’ll be able to see the Amira product, the organic product or the product at Publix? Like, when—if somebody was to do a store tour, you know, when do you think they see the impact of that on the shelf in the US? Is that, you know, towards the end of this calendar half or maybe you’d just give some guidance on that?
Karan A Chanana, Chairman and Chief Executive Officer
We are continuously working at pitching to all of the supermarkets and I think by the second half of this year, one should see it.
Eric Katzman, Deutsche Bank, Analyst
Okay, so that includes, like, Publix and making…
Karan A Chanana, Chairman and Chief Executive Officer
The Publix, we—sorry to interrupt you. Publix we’ve got confirmation, second half—or, sorry, June we go into Publix, clearly, and as the (inaudible) of other supermarkets coming on, we have the team pitching to them and as we make distribution gains, we will be more than happy to keep announcing them.
Eric Katzman, Deutsche Bank, Analyst
Okay. Thank you.
ViaVid has made considerable efforts to provide an accurate transcription, there may be material errors, omissions, or inaccuracies in the reporting of the substance of the conference call. This transcript is being made available for information purposes only.
1-888-562-0262 1-604-929-1352 www.viavid.com
| 8 |
Karan A Chanana, Chairman and Chief Executive Officer
As a matter of fact, one more thing on that. We are participating in Expo West, which is this weekend. We—all our organic product in (inaudible) form as they are going to be seen on the shelves in the coming (inaudible) are going to be there, so if anybody wants to come and see it, we’ll be glad to show it to them.
Eric Katzman, Deutsche Bank, Analyst
Thank you.
Bruce Wacha, Chief Financial Officer
Thanks, Eric.
Operator
Thank you. As a reminder, ladies and gentlemen, if you would like to ask a question, please press star, one on your telephone keypad at this time. Our next question is coming from the line of Akshay Jagdale with KeyBanc. Please proceed with your question.
Akshay Jagdale, KeyBanc, Analyst
Good morning.
Bruce Wacha, Chief Financial Officer
Hi, Akshay.
Karan A Chanana, Chairman and Chief Executive Officer
Morning.
Akshay Jagdale KeyBanc, Analyst
Congratulations on a good quarter. First question, Bruce, I didn’t get a chance; if you had provided this, I apologize. But can you (inaudible) free cash flow? I mean, obviously you’re a growth company, you use more—you know, all of your cash to invest in working capital, but I think this quarter is unique in that, in a while, you know, first time in a while we’ve seen the crop come in higher and prices lower, so it seems like, you know, your debt came down sequentially and you actually generated cash, so can you just talk to that a little bit, give us a few more details on the cash flow side?
Bruce Wacha, Chief Financial Officer
Yes, I think that you are highlighting a key point, is that we are reinvesting our cash back into the business. We continue to think of ourselves as having a very strong free cash flow model. We are electing to make purchases of rice and then age it, process it, package it and sell it, you know, 10, 12, 15 months out for a nice premium, and so the key point is that we can be free cash flow generative. We are making the conscious decision to reinvest those cash flows back into the business. This year is a nice year for us in terms of seeing input relief, or input cost relief, and so that’s a nice benefit for us as well which we should use, as Karan said, to help drive up volume, and that obviously helps very much with that cash flow cycle in terms of buying crop at a lower price today and then aging in the future.
ViaVid has made considerable efforts to provide an accurate transcription, there may be material errors, omissions, or inaccuracies in the reporting of the substance of the conference call. This transcript is being made available for information purposes only.
1-888-562-0262 1-604-929-1352 www.viavid.com
| 9 |
Akshay Jagdale KeyBanc, Analyst
Okay, and just going back to the crop, Karan, this is for you. I think you were in the Middle East at that show not too long ago. Can you talk a little bit about demand? There’s some concern about, you know, countries like—you know, some countries that are oil dependent having issues with discretionary consumption. I mean, can you just give us some color on if that’s flowing through in any way in terms of soft demand on Basmati rice side? You know, that’s—you were at the Gulf Foods Show, I’m sure, and I’m sure you meet with all your customers there, so can you just give us some color as to where you might see some weakness, what the sort of inventory pipeline looks like for these distributors, et cetera? That’d be helpful.
Karan A Chanana, Chairman and Chief Executive Officer
Yes. Sure, great question. Yes, you’re right. I was at Gulf Foods and we met a large number of our customers, and here is the thing. What you are referring to is Iran. They have—every year what they do is they restrict the import of Basmati rice to make (inaudible) to sell their local produce and this year is nothing different, probably lasted longer. I must remind you that we have maybe less than 1% of our sales into Iran (inaudible), so we are not dependent on that. However, a large part of industries are—you know, who are going for primarily third party are dependent on that, and that’s why you see the prices being soft. You know, that’s one reason and the larger crop being the other, but not in that priority of (inaudible). So other than that, we’ve seen very strong demand. All countries in the Middle East and other emerging markets have actually taken up or continue to take up more volume than previous year. The previous year was a very high year in terms of pricing uptake, so we’re seeing good volume growth across the world. Even it is early but I still estimate even Europe has taken a higher volume and taken advantage of the larger crop. So that’s what we saw and for us at Amira, it’s no different in terms of our selling geography, so we see strong growth in volume for us at the Gulf Foods Show.
Akshay Jagdale KeyBanc, Analyst
Okay. Then on the US, can you just give us some sense of—you know, you had obviously some plans for your US business and these new announcements obviously very positive, but were those included in your plans for the year? Did they come in ahead of them? Can you give us some sense of what impact these new distribution relationships might mean for the US business?
Karan A Chanana, Chairman and Chief Executive Officer
I think, you know, we’ve been working on this a while and we’ve said that, you know, the US is important to us. We are listed in the US, we want to bring it to the consumers and have our investors also get a feel for our product, so we are in Costco. You know, the—our three brands, our small prices (ph) in fresh market, HEB (ph) and (inaudible), you know, we recently did it’s in partnerships or strategic (inaudible) with CROSSMARK and UNFI, we’ve seen some early gains from that Publix taking in the Amira brand. You should see the products on the shelves by June, and we continue to pitch to other supermarkets as their (inaudible) come in and hope to get the Amira brand to shelves closer to everybody. So that remains our focus for the US. We’ve hired a Vice President of Marketing who sits out of our New York office. We’re looking to increase the sales force, so—and we will keep you updated as we make any gains, and I think this is all—to answer your question, yes, I think execution is the part of a great plan, so we plan out. You know, we’ve spoken about it but it is a priority so the CROSSMARK, UNFI and results of that are—our products (inaudible) to get the products in the—get the Amira brand in the US.
Akshay Jagdale KeyBanc, Analyst
Okay, and one for Bruce. I don’t know if you mentioned this, on the debt side, so what is the—what’s the current situation with your Indian banks? I mean, I know there is some ceiling that you were about to reach and can you just give us an update on your liquidity and what’s available to you right now?
ViaVid has made considerable efforts to provide an accurate transcription, there may be material errors, omissions, or inaccuracies in the reporting of the substance of the conference call. This transcript is being made available for information purposes only.
1-888-562-0262 1-604-929-1352 www.viavid.com
| 10 |
Bruce Wacha, Chief Financial Officer
Sure. So I think—and we have this in the presentation, but we’re sitting on about $27 million of cash. We have over $20 million of available borrowing capacity under the current agreements, and we’re in discussions with the banks as well today with regards to, you know, any changes in (inaudible).
Akshay Jagdale KeyBanc, Analyst
Okay, great. I’ll pass it on. Thank you.
Operator
Thank you. Ladies and gentlemen, we have reached the end of our question and answer session. I would like to turn the floor back over to Management for any additional or concluding comments.
Karan A Chanana, Chairman and Chief Executive Officer
Thank you all for your interest in Amira Nature Foods and for your support, and I know in my closing remarks, I’d like to say, you know, our stock is incredibly cheap and we continue to do what we do best, is run our business. We remain a single product category which is attractive, high growth and part of a larger $275 billion market, and I look forward to talking to you on our next call. Thank you. Bye-bye.
Operator
Thank you. Ladies and gentlemen, this does conclude today’s teleconference. We thank you for your participation and you may disconnect your lines at this time.
ViaVid has made considerable efforts to provide an accurate transcription, there may be material errors, omissions, or inaccuracies in the reporting of the substance of the conference call. This transcript is being made available for information purposes only.
1-888-562-0262 1-604-929-1352 www.viavid.com
| 11 |
Serious News for Serious Traders! Try StreetInsider.com Premium Free!
You May Also Be Interested In
- Scrum Alliance® Appoints Veteran Transformation Leader Chetna Limbani as Its First Chief Delivery Officer
- XEALTH NAMED TO NEWSWEEK’S WORLD’S BEST DIGITAL HEALTH COMPANIES 2024 LIST
- DIZPOT Announces Strategic Expansion into Emerging Minnesota Cannabis Market
Create E-mail Alert Related Categories
SEC FilingsSign up for StreetInsider Free!
Receive full access to all new and archived articles, unlimited portfolio tracking, e-mail alerts, custom newswires and RSS feeds - and more!
