

General Dynamics Reports Fourth-Quarter and Full-Year 2020 Financial Results
- Strong fourth quarter performance in COVID environment - $3.9 billion net cash provided by operating activities for the year, 122% of net earnings - Record-high backlog of $89.5 billion
 Tweet
Tweet Share
ShareRESTON, Va., Jan. 27, 2021 /PRNewswire/ -- General Dynamics (NYSE: GD) today reported quarterly net earnings of $1 billion, or $3.49 per diluted share, on $10.5 billion in revenue. For the full year, net earnings were $3.2 billion, or $11.00 per diluted share, on revenue of $37.9 billion.
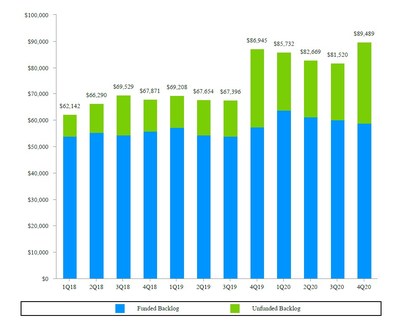
On a sequential basis, both net earnings and earnings per share (EPS) were up 20% from the previous quarter. Operating margin was 12.3% in the quarter, up 90 basis points sequentially and up 20 basis points from the year-ago quarter. Backlog grew 9.8% in the quarter to a record-high $89.5 billion.
"Our continued focus on operating performance and on protecting the health and safety of our employees contributed to strong sequential improvements in earnings, margin and cash flow," said Phebe N. Novakovic, chairman and chief executive officer. "Our defense segments continued to capture significant awards, leading to a record-high backlog, while our aerospace segment not only remained very profitable, but actually improved its margins throughout the year, even as the broader business aviation industry contracted severely due to the pandemic."
MarginCompany-wide operating margin was 12.3%, up 90 basis points from the prior quarter. Aerospace margin was 16.5%, up 220 basis points from the prior quarter.
CashNet cash provided by operating activities in the quarter totaled $2.6 billion, or 256% of net earnings. For the year, net cash provided by operating activities totaled $3.9 billion, or 122% of net earnings. Free cash flow from operations, defined as net cash provided by operating activities less capital expenditures, was $2.2 billion for the quarter, a 221% conversion of net earnings, and $2.9 billion for the year, a 91% conversion of net earnings. During the quarter, the company reduced its net debt by $1.7 billion, invested $345 million in capital expenditures, paid $315 million in dividends, and repurchased $100.7 million in shares at an average price of $143.80, ending 2020 with $2.8 billion in cash and equivalents on hand.
BacklogOrders remained strong across the company with a consolidated book-to-bill of 1.8-to-1 for the quarter and 1.1-to-1 for the year. In addition to backlog of $89.5 billion, management's estimate of additional value in unfunded indefinite delivery/indefinite quantity (IDIQ) contracts and unexercised options was $45.2 billion at year-end. Total estimated contract value, representing the sum of all backlog components was $134.7 billion, up 6.7% for the year.
Significant awards in the fourth quarter included a $9.5 billion option exercise from the U.S. Navy for construction and test of the first two Columbia-class submarines; $4.4 billion maximum potential value contract from the U.S. Department of Defense to provide cloud solutions for Office 365 deployment and migration; a $3.3 billion maximum potential value contract from the U.S. State Department to provide business process support services; a $695 million contract from the U.S. Army to provide information technology and professional services; $620 million for several key contracts for classified customers; a $405 million initial task order on a $4.3 billion maximum potential value contract to upgrade Abrams tanks for the Army; a $230 million initial task order on an Army contract with a maximum potential contract value of $1.2 billion to produce Stryker Initial Maneuver Short-Range Air Defense (IM-SHORAD) vehicles; $375 million from the Navy to provide lead yard services for the Virginia-class submarine program; and $265 million from the Navy for maintenance and repair services for three ship classes.
About General DynamicsHeadquartered in Reston, Virginia, General Dynamics is a global aerospace and defense company that offers a broad portfolio of products and services in business aviation; ship construction and repair; land combat vehicles, weapons systems and munitions; and technology products and services. General Dynamics employs more than 100,000 people worldwide and generated $37.9 billion in revenue in 2020. More information is available at www.gd.com.
Certain statements made in this press release, including any statements as to future results of operations and financial projections, may constitute "forward-looking statements" within the meaning of the Private Securities Litigation Reform Act of 1995, as amended. Forward-looking statements are based on management's expectations, estimates, projections and assumptions. These statements are not guarantees of future performance and involve risks and uncertainties that are difficult to predict. Therefore, actual future results and trends may differ materially from what is forecast in forward-looking statements due to a variety of factors. Additional information regarding these factors is contained in the company's filings with the Securities and Exchange Commission, including, without limitation, its Annual Report on Form 10-K, its Quarterly Reports on Form 10-Q and its Current Reports on Form 8-K. All forward-looking statements speak only as of the date they were made. The company does not undertake any obligation to update or publicly release any revisions to forward-looking statements to reflect events, circumstances or changes in expectations after the date of this press release.
WEBCAST INFORMATION: General Dynamics will webcast its fourth-quarter and full-year 2020 financial results conference call at 9 a.m. EST on Wednesday, January 27, 2021. The webcast will be a listen-only audio event available at www.gd.com. An on-demand replay of the webcast will be available one hour after the end of the call and end on February 3, 2021. To hear a recording of the conference call by telephone, please call 877-344-7529 (international: 412-317-0088); passcode 10151195. Charts furnished to investors and securities analysts in connection with General Dynamics' announcement of its financial results are available at www.gd.com. General Dynamics intends to supplement those charts on its website after its earnings call today to include information about 2021 guidance presented during the call.
EXHIBIT A | |||||||||||||||||||||||
CONSOLIDATED STATEMENT OF EARNINGS - (UNAUDITED) | |||||||||||||||||||||||
DOLLARS IN MILLIONS, EXCEPT PER SHARE AMOUNTS | |||||||||||||||||||||||
Three Months Ended December 31 | Variance | ||||||||||||||||||||||
2020 | 2019* | $ | % | ||||||||||||||||||||
Revenue | $ | 10,481 | $ | 10,773 | $ | (292) | (2.7) | % | |||||||||||||||
Operating costs and expenses | (9,188) | (9,465) | 277 | ||||||||||||||||||||
Operating earnings | 1,293 | 1,308 | (15) | (1.1) | % | ||||||||||||||||||
Other, net | 12 | 16 | (4) | ||||||||||||||||||||
Interest, net | (120) | (110) | (10) | ||||||||||||||||||||
Earnings before income tax | 1,185 | 1,214 | (29) | (2.4) | % | ||||||||||||||||||
Provision for income tax, net | (183) | (194) | 11 | ||||||||||||||||||||
Net earnings | $ | 1,002 | $ | 1,020 | $ | (18) | (1.8) | % | |||||||||||||||
Earnings per share—basic | $ | 3.50 | $ | 3.53 | $ | (0.03) | (0.8) | % | |||||||||||||||
Basic weighted average shares outstanding | 286.3 | 288.8 | |||||||||||||||||||||
Earnings per share—diluted | $ | 3.49 | $ | 3.51 | $ | (0.02) | (0.6) | % | |||||||||||||||
Diluted weighted average shares outstanding | 287.1 | 290.9 | |||||||||||||||||||||
* | Prior-period information has been restated for the retrospective application of a change in accounting principle related to the amortization of actuarial gains and losses for our qualified U.S. government pension plans, which we adopted in the fourth quarter of 2020. |
EXHIBIT B | |||||||||||||||||||||||
CONSOLIDATED STATEMENT OF EARNINGS - (UNAUDITED) | |||||||||||||||||||||||
DOLLARS IN MILLIONS, EXCEPT PER SHARE AMOUNTS | |||||||||||||||||||||||
Year Ended December 31 | Variance | ||||||||||||||||||||||
2020 | 2019* | $ | % | ||||||||||||||||||||
Revenue | $ | 37,925 | $ | 39,350 | $ | (1,425) | (3.6) | % | |||||||||||||||
Operating costs and expenses | (33,792) | (34,780) | 988 | ||||||||||||||||||||
Operating earnings | 4,133 | 4,570 | (437) | (9.6) | % | ||||||||||||||||||
Other, net | 82 | 92 | (10) | ||||||||||||||||||||
Interest, net | (477) | (460) | (17) | ||||||||||||||||||||
Earnings before income tax | 3,738 | 4,202 | (464) | (11.0) | % | ||||||||||||||||||
Provision for income tax, net | (571) | (718) | 147 | ||||||||||||||||||||
Net earnings | $ | 3,167 | $ | 3,484 | $ | (317) | (9.1) | % | |||||||||||||||
Earnings per share—basic | $ | 11.04 | $ | 12.09 | $ | (1.05) | (8.7) | % | |||||||||||||||
Basic weighted average shares outstanding | 286.9 | 288.3 | |||||||||||||||||||||
Earnings per share—diluted | $ | 11.00 | $ | 11.98 | $ | (0.98) | (8.2) | % | |||||||||||||||
Diluted weighted average shares outstanding | 287.9 | 290.8 | |||||||||||||||||||||
* | Prior-period information has been restated for the retrospective application of a change in accounting principle related to the amortization of actuarial gains and losses for our qualified U.S. government pension plans, which we adopted in the fourth quarter of 2020. |
EXHIBIT C | |||||||||||||||||||||||
REVENUE AND OPERATING EARNINGS BY SEGMENT - (UNAUDITED) | |||||||||||||||||||||||
DOLLARS IN MILLIONS | |||||||||||||||||||||||
Three Months Ended December 31 | Variance | ||||||||||||||||||||||
2020 | 2019 (a) | $ | % | ||||||||||||||||||||
Revenue: | |||||||||||||||||||||||
Aerospace | $ | 2,435 | $ | 2,930 | $ | (495) | (16.9) | % | |||||||||||||||
Marine Systems | 2,857 | 2,565 | 292 | 11.4 | % | ||||||||||||||||||
Combat Systems | 1,960 | 1,972 | (12) | (0.6) | % | ||||||||||||||||||
Technologies (b) | 3,229 | 3,306 | (77) | (2.3) | % | ||||||||||||||||||
Total | $ | 10,481 | $ | 10,773 | $ | (292) | (2.7) | % | |||||||||||||||
Operating earnings: | |||||||||||||||||||||||
Aerospace | $ | 401 | $ | 480 | $ | (79) | (16.5) | % | |||||||||||||||
Marine Systems | 247 | 199 | 48 | 24.1 | % | ||||||||||||||||||
Combat Systems | 309 | 284 | 25 | 8.8 | % | ||||||||||||||||||
Technologies (b) | 352 | 360 | (8) | (2.2) | % | ||||||||||||||||||
Corporate | (16) | (15) | (1) | (6.7) | % | ||||||||||||||||||
Total | $ | 1,293 | $ | 1,308 | $ | (15) | (1.1) | % | |||||||||||||||
Operating margin: | |||||||||||||||||||||||
Aerospace | 16.5 | % | 16.4 | % | |||||||||||||||||||
Marine Systems | 8.6 | % | 7.8 | % | |||||||||||||||||||
Combat Systems | 15.8 | % | 14.4 | % | |||||||||||||||||||
Technologies (b) | 10.9 | % | 10.9 | % | |||||||||||||||||||
Total | 12.3 | % | 12.1 | % | |||||||||||||||||||
(a) | Prior-period information has been restated for the retrospective application of a change in accounting principle related to the amortization of actuarial gains and losses for our qualified U.S. government pension plans, which we adopted in the fourth quarter of 2020. |
(b) | Effective December 31, 2020, we have reorganized our Mission Systems and Information Technology business units into a single reporting unit — Technologies — to better reflect the way we are running the business, the overlap and commonality of customers, and customer demand for end-to-end solutions melding technology, hardware and software. |
EXHIBIT D | |||||||||||||||||||||||
REVENUE AND OPERATING EARNINGS BY SEGMENT - (UNAUDITED) | |||||||||||||||||||||||
DOLLARS IN MILLIONS | |||||||||||||||||||||||
Year Ended December 31 | Variance | ||||||||||||||||||||||
2020 | 2019 (a) | $ | % | ||||||||||||||||||||
Revenue: | |||||||||||||||||||||||
Aerospace | $ | 8,075 | $ | 9,801 | $ | (1,726) | (17.6) | % | |||||||||||||||
Marine Systems | 9,979 | 9,183 | 796 | 8.7 | % | ||||||||||||||||||
Combat Systems | 7,223 | 7,007 | 216 | 3.1 | % | ||||||||||||||||||
Technologies (b) | 12,648 | 13,359 | (711) | (5.3) | % | ||||||||||||||||||
Total | $ | 37,925 | $ | 39,350 | $ | (1,425) | (3.6) | % | |||||||||||||||
Operating earnings: | |||||||||||||||||||||||
Aerospace | $ | 1,083 | $ | 1,532 | $ | (449) | (29.3) | % | |||||||||||||||
Marine Systems | 854 | 785 | 69 | 8.8 | % | ||||||||||||||||||
Combat Systems | 1,041 | 996 | 45 | 4.5 | % | ||||||||||||||||||
Technologies (b) | 1,211 | 1,311 | (100) | (7.6) | % | ||||||||||||||||||
Corporate | (56) | (54) | (2) | (3.7) | % | ||||||||||||||||||
Total | $ | 4,133 | $ | 4,570 | $ | (437) | (9.6) | % | |||||||||||||||
Operating margin: | |||||||||||||||||||||||
Aerospace | 13.4 | % | 15.6 | % | |||||||||||||||||||
Marine Systems | 8.6 | % | 8.5 | % | |||||||||||||||||||
Combat Systems | 14.4 | % | 14.2 | % | |||||||||||||||||||
Technologies (b) | 9.6 | % | 9.8 | % | |||||||||||||||||||
Total | 10.9 | % | 11.6 | % | |||||||||||||||||||
(a) | Prior-period information has been restated for the retrospective application of a change in accounting principle related to the amortization of actuarial gains and losses for our qualified U.S. government pension plans, which we adopted in the fourth quarter of 2020. |
(b) | Effective December 31, 2020, we have reorganized our Mission Systems and Information Technology business units into a single reporting unit — Technologies — to better reflect the way we are running the business, the overlap and commonality of customers, and customer demand for end-to-end solutions melding technology, hardware and software. |
EXHIBIT E | |||||||||||||||||||||||
REVENUE AND OPERATING EARNINGS BY SEGMENT - (UNAUDITED) | |||||||||||||||||||||||
DOLLARS IN MILLIONS | |||||||||||||||||||||||
Three Months Ended | Variance | ||||||||||||||||||||||
December 31, 2020 | September 27, 2020 (a) | $ | % | ||||||||||||||||||||
Revenue: | |||||||||||||||||||||||
Aerospace | $ | 2,435 | $ | 1,975 | $ | 460 | 23.3 | % | |||||||||||||||
Marine Systems | 2,857 | 2,405 | 452 | 18.8 | % | ||||||||||||||||||
Combat Systems | 1,960 | 1,801 | 159 | 8.8 | % | ||||||||||||||||||
Technologies (b) | 3,229 | 3,250 | (21) | (0.6) | % | ||||||||||||||||||
Total | $ | 10,481 | $ | 9,431 | $ | 1,050 | 11.1 | % | |||||||||||||||
Operating earnings: | |||||||||||||||||||||||
Aerospace | $ | 401 | $ | 283 | $ | 118 | 41.7 | % | |||||||||||||||
Marine Systems | 247 | 223 | 24 | 10.8 | % | ||||||||||||||||||
Combat Systems | 309 | 270 | 39 | 14.4 | % | ||||||||||||||||||
Technologies (b) | 352 | 314 | 38 | 12.1 | % | ||||||||||||||||||
Corporate | (16) | (18) | 2 | 11.1 | % | ||||||||||||||||||
Total | $ | 1,293 | $ | 1,072 | $ | 221 | 20.6 | % | |||||||||||||||
Operating margin: | |||||||||||||||||||||||
Aerospace | 16.5 | % | 14.3 | % | |||||||||||||||||||
Marine Systems | 8.6 | % | 9.3 | % | |||||||||||||||||||
Combat Systems | 15.8 | % | 15.0 | % | |||||||||||||||||||
Technologies (b) | 10.9 | % | 9.7 | % | |||||||||||||||||||
Total | 12.3 | % | 11.4 | % | |||||||||||||||||||
(a) | Prior-period information has been restated for the retrospective application of a change in accounting principle related to the amortization of actuarial gains and losses for our qualified U.S. government pension plans, which we adopted in the fourth quarter of 2020. |
(b) | Effective December 31, 2020, we have reorganized our Mission Systems and Information Technology business units into a single reporting unit — Technologies — to better reflect the way we are running the business, the overlap and commonality of customers, and customer demand for end-to-end solutions melding technology, hardware and software. |
EXHIBIT F | |||||||||||
CONSOLIDATED BALANCE SHEET | |||||||||||
DOLLARS IN MILLIONS | |||||||||||
(Unaudited) | |||||||||||
December 31, 2020 | December 31, 2019* | ||||||||||
ASSETS | |||||||||||
Current assets: | |||||||||||
Cash and equivalents | $ | 2,824 | $ | 902 | |||||||
Accounts receivable | 3,161 | 3,544 | |||||||||
Unbilled receivables | 8,024 | 7,857 | |||||||||
Inventories | 5,745 | 6,306 | |||||||||
Other current assets | 1,789 | 1,679 | |||||||||
Total current assets | 21,543 | 20,288 | |||||||||
Noncurrent assets: | |||||||||||
Property, plant and equipment, net | 5,100 | 4,475 | |||||||||
Intangible assets, net | 2,117 | 2,315 | |||||||||
Goodwill | 20,053 | 19,677 | |||||||||
Other assets | 2,495 | 2,594 | |||||||||
Total noncurrent assets | 29,765 | 29,061 | |||||||||
Total assets | $ | 51,308 | $ | 49,349 | |||||||
LIABILITIES AND SHAREHOLDERS' EQUITY | |||||||||||
Current liabilities: | |||||||||||
Short-term debt and current portion of long-term debt | $ | 3,003 | $ | 2,920 | |||||||
Accounts payable | 2,952 | 3,162 | |||||||||
Customer advances and deposits | 6,276 | 7,148 | |||||||||
Other current liabilities | 3,733 | 3,571 | |||||||||
Total current liabilities | 15,964 | 16,801 | |||||||||
Noncurrent liabilities: | |||||||||||
Long-term debt | 9,995 | 9,010 | |||||||||
Other liabilities | 9,688 | 9,560 | |||||||||
Total noncurrent liabilities | 19,683 | 18,570 | |||||||||
Shareholders' equity: | |||||||||||
Common stock | 482 | 482 | |||||||||
Surplus | 3,124 | 3,039 | |||||||||
Retained earnings | 33,498 | 31,633 | |||||||||
Treasury stock | (17,893) | (17,358) | |||||||||
Accumulated other comprehensive loss | (3,550) | (3,818) | |||||||||
Total shareholders' equity | 15,661 | 13,978 | |||||||||
Total liabilities and shareholders' equity | $ | 51,308 | $ | 49,349 | |||||||
* | Prior-period information has been restated for the retrospective application of a change in accounting principle related to the amortization of actuarial gains and losses for our qualified U.S. government pension plans, which we adopted in the fourth quarter of 2020. |
EXHIBIT G | |||||||||||
CONSOLIDATED STATEMENT OF CASH FLOWS - (UNAUDITED) | |||||||||||
DOLLARS IN MILLIONS | |||||||||||
Year Ended December 31 | |||||||||||
2020 | 2019 | ||||||||||
Cash flows from operating activities—continuing operations: | |||||||||||
Net earnings | $ | 3,167 | $ | 3,484 | |||||||
Adjustments to reconcile net earnings to net cash from operating activities: | |||||||||||
Depreciation of property, plant and equipment | 523 | 466 | |||||||||
Amortization of intangible and finance lease right-of-use assets | 355 | 363 | |||||||||
Equity-based compensation expense | 128 | 133 | |||||||||
Deferred income tax (benefit) provision | (127) | 92 | |||||||||
(Increase) decrease in assets, net of effects of business acquisitions: | |||||||||||
Accounts receivable | 371 | 176 | |||||||||
Unbilled receivables | (116) | (1,303) | |||||||||
Inventories | 502 | (376) | |||||||||
Increase (decrease) in liabilities, net of effects of business acquisitions: | |||||||||||
Accounts payable | (215) | 6 | |||||||||
Customer advances and deposits | (707) | (105) | |||||||||
Other, net | (23) | 45 | |||||||||
Net cash provided by operating activities | 3,858 | 2,981 | |||||||||
Cash flows from investing activities: | |||||||||||
Capital expenditures | (967) | (987) | |||||||||
Other, net | (7) | (7) | |||||||||
Net cash used by investing activities | (974) | (994) | |||||||||
Cash flows from financing activities: | |||||||||||
Proceeds from fixed-rate notes | 3,960 | — | |||||||||
Repayment of fixed-rate notes | (2,000) | — | |||||||||
Dividends paid | (1,240) | (1,152) | |||||||||
Purchases of common stock | (587) | (231) | |||||||||
Repayment of floating-rate notes | (500) | — | |||||||||
(Repayment of) proceeds from credit facility, net | (441) | 291 | |||||||||
Proceeds from commercial paper, gross (maturities greater than 3 months) | 420 | — | |||||||||
Repayment of commercial paper, gross (maturities greater than 3 months) | (420) | — | |||||||||
Repayment of commercial paper, net | — | (850) | |||||||||
Other, net | (95) | (55) | |||||||||
Net cash used by financing activities | (903) | (1,997) | |||||||||
Net cash used by discontinued operations | (59) | (51) | |||||||||
Net increase (decrease) in cash and equivalents | 1,922 | (61) | |||||||||
Cash and equivalents at beginning of year | 902 | 963 | |||||||||
Cash and equivalents at end of year | $ | 2,824 | $ | 902 | |||||||
EXHIBIT H | |||||||||||||||||||||||
ADDITIONAL FINANCIAL INFORMATION - (UNAUDITED) | |||||||||||||||||||||||
DOLLARS IN MILLIONS, EXCEPT PER SHARE AMOUNTS | |||||||||||||||||||||||
Other Financial Information: | |||||||||||||||||||||||
December 31, 2020 | December 31, 2019* | ||||||||||||||||||||||
Debt-to-equity (a) | 83.0 | % | 85.3 | % | |||||||||||||||||||
Debt-to-capital (b) | 45.4 | % | 46.0 | % | |||||||||||||||||||
Book value per share (c) | $ | 54.67 | $ | 48.26 | |||||||||||||||||||
Shares outstanding | 286,477,836 | 289,610,336 | |||||||||||||||||||||
Fourth Quarter | Twelve Months | ||||||||||||||||||||||
2020 | 2019 | 2020 | 2019* | ||||||||||||||||||||
Income tax payments, net | $ | 419 | $ | 85 | $ | 764 | $ | 572 | |||||||||||||||
Company-sponsored research and development (d) | $ | 83 | $ | 114 | $ | 374 | $ | 466 | |||||||||||||||
Return on sales (e) | 9.6 | % | 9.5 | % | 8.4 | % | 8.9 | % | |||||||||||||||
Return on equity (f) | 22.0 | % | 26.4 | % | |||||||||||||||||||
Non-GAAP Financial Measures: | |||||||||||||||||||||||
Fourth Quarter | Twelve Months | ||||||||||||||||||||||
2020 | 2019 | 2020 | 2019 | ||||||||||||||||||||
Earnings before interest, taxes, depreciation and amortization: | |||||||||||||||||||||||
Net earnings | $ | 1,002 | $ | 1,020 | $ | 3,167 | $ | 3,484 | |||||||||||||||
Interest, net | 120 | 110 | 477 | 460 | |||||||||||||||||||
Provision for income tax, net | 183 | 194 | 571 | 718 | |||||||||||||||||||
Depreciation of property, plant and equipment | 147 | 114 | 523 | 466 | |||||||||||||||||||
Amortization of intangible and finance lease right-of-use assets | 88 | 90 | 355 | 363 | |||||||||||||||||||
Earnings before interest, taxes, depreciation and amortization (g) | $ | 1,540 | $ | 1,528 | $ | 5,093 | $ | 5,491 | |||||||||||||||
Free cash flow from operations: | |||||||||||||||||||||||
Net cash provided by operating activities | $ | 2,562 | $ | 2,394 | $ | 3,858 | $ | 2,981 | |||||||||||||||
Capital expenditures | (345) | (381) | (967) | (987) | |||||||||||||||||||
Free cash flow from operations (h) | $ | 2,217 | $ | 2,013 | $ | 2,891 | $ | 1,994 | |||||||||||||||
Return on invested capital: | |||||||||||||||||||||||
Net earnings | $ | 3,167 | $ | 3,484 | |||||||||||||||||||
After-tax interest expense | 386 | 373 | |||||||||||||||||||||
After-tax amortization expense | 280 | 287 | |||||||||||||||||||||
Net operating profit after taxes | 3,833 | 4,144 | |||||||||||||||||||||
Average invested capital | 32,431 | 29,620 | |||||||||||||||||||||
Return on invested capital (i) | 11.8 | % | 14.0 | % | |||||||||||||||||||
Notes describing the calculation of the other financial information and a reconciliation of non-GAAP financial measures are on the following page. | |
* | Prior-period information has been restated for the retrospective application of a change in accounting principle related to the amortization of actuarial gains and losses for our qualified U.S. government pension plans, which we adopted in the fourth quarter of 2020. |
EXHIBIT H (Cont.) | |
ADDITIONAL FINANCIAL INFORMATION - (UNAUDITED) | |
DOLLARS IN MILLIONS, EXCEPT PER SHARE AMOUNTS | |
(a) | Debt-to-equity ratio is calculated as total debt divided by total equity as of year end. |
(b) | Debt-to-capital ratio is calculated as total debt divided by the sum of total debt plus total equity as of year end. |
(c) | Book value per share is calculated as total equity divided by total outstanding shares as of year end. |
(d) | Includes independent research and development and Aerospace product-development costs. |
(e) | Return on sales is calculated as net earnings divided by revenue. |
(f) | Return on equity is calculated by dividing net earnings by our average equity during the year. |
(g) | We believe earnings before interest, taxes, depreciation and amortization (EBITDA) is a useful measure for investors because it provides another measure of our profitability and our ability to service our debt. We calculate EBITDA by adding back interest, taxes, depreciation and amortization to net earnings. The most directly comparable GAAP measure to EBITDA is net earnings. |
(h) | We believe free cash flow from operations is a useful measure for investors because it portrays our ability to generate cash from our businesses for purposes such as repaying maturing debt, funding business acquisitions, repurchasing our common stock and paying dividends. We use free cash flow from operations to assess the quality of our earnings and as a key performance measure in evaluating management. The most directly comparable GAAP measure to free cash flow from operations is net cash provided by operating activities. |
(i) | We believe return on invested capital (ROIC) is a useful measure for investors because it reflects our ability to generate returns from the capital we have deployed in our operations. We use ROIC to evaluate investment decisions and as a performance measure in evaluating management. We define ROIC as net operating profit after taxes divided by average invested capital. Net operating profit after taxes is defined as net earnings plus after-tax interest and amortization expense, calculated using the statutory federal income tax rate. Average invested capital is defined as the sum of the average debt and shareholders' equity excluding accumulated other comprehensive loss. ROIC excludes goodwill impairments and non-economic accounting changes as they are not reflective of company performance. The most directly comparable GAAP measure to net operating profit after taxes is net earnings. |
EXHIBIT I | ||||||||||||||||||||||||||||||||
BACKLOG - (UNAUDITED) | ||||||||||||||||||||||||||||||||
DOLLARS IN MILLIONS | ||||||||||||||||||||||||||||||||
Funded | Unfunded | TotalBacklog | Estimated Potential Contract Value (a) | Total EstimatedContract Value | ||||||||||||||||||||||||||||
Fourth Quarter 2020: | ||||||||||||||||||||||||||||||||
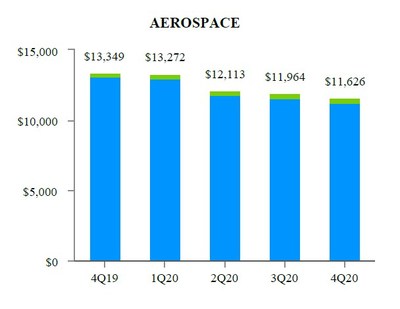
Aerospace | $ | 11,308 | $ | 318 | $ | 11,626 | $ | 2,800 | $ | 14,426 | ||||||||||||||||||||||
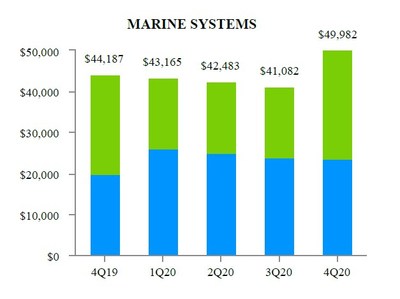
Marine Systems | 23,646 | 26,336 | 49,982 | 4,876 | 54,858 | |||||||||||||||||||||||||||
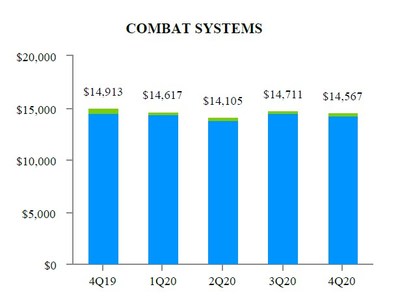
Combat Systems | 14,341 | 226 | 14,567 | 9,774 | 24,341 | |||||||||||||||||||||||||||
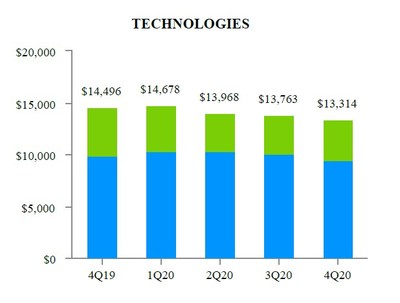
Technologies | 9,488 | 3,826 | 13,314 | 27,727 | 41,041 | |||||||||||||||||||||||||||
Total | $ | 58,783 | $ | 30,706 | $ | 89,489 | $ | 45,177 | $ | 134,666 | ||||||||||||||||||||||
Third Quarter 2020: | ||||||||||||||||||||||||||||||||
Aerospace | $ | 11,640 | $ | 324 | $ | 11,964 | $ | 2,888 | $ | 14,852 | ||||||||||||||||||||||
Marine Systems | 23,958 | 17,124 | 41,082 | 14,666 | 55,748 | |||||||||||||||||||||||||||
Combat Systems | 14,511 | 200 | 14,711 | 6,593 | 21,304 | |||||||||||||||||||||||||||
Technologies (b) | 10,112 | 3,651 | 13,763 | 26,242 | 40,005 | |||||||||||||||||||||||||||
Total | $ | 60,221 | $ | 21,299 | $ | 81,520 | $ | 50,389 | $ | 131,909 | ||||||||||||||||||||||
Fourth Quarter 2019: | ||||||||||||||||||||||||||||||||
Aerospace | $ | 13,168 | $ | 181 | $ | 13,349 | $ | 2,989 | $ | 16,338 | ||||||||||||||||||||||
Marine Systems | 20,012 | 24,175 | 44,187 | 5,453 | 49,640 | |||||||||||||||||||||||||||
Combat Systems | 14,474 | 439 | 14,913 | 4,322 | 19,235 | |||||||||||||||||||||||||||
Technologies (b) | 9,876 | 4,620 | 14,496 | 26,485 | 40,981 | |||||||||||||||||||||||||||
Total | $ | 57,530 | $ | 29,415 | $ | 86,945 | $ | 39,249 | $ | 126,194 | ||||||||||||||||||||||
(a) | The estimated potential contract value includes work awarded on unfunded indefinite delivery, indefinite quantity (IDIQ) contracts and unexercised options associated with existing firm contracts, including options and other agreements with existing customers to purchase new aircraft and aircraft services. We recognize options in backlog when the customer exercises the option and establishes a firm order. For IDIQ contracts, we evaluate the amount of funding we expect to receive and include this amount in our estimated potential contract value. The actual amount of funding received in the future may be higher or lower than our estimate of potential contract value. |
(b) | Effective December 31, 2020, we have reorganized our Mission Systems and Information Technology business units into a single reporting unit — Technologies — to better reflect the way we are running the business, the overlap and commonality of customers, and customer demand for end-to-end solutions melding technology, hardware and software. |
EXHIBIT I-1 |
BACKLOG - (UNAUDITED) |
DOLLARS IN MILLIONS |
https://mma.prnewswire.com/media/1427217/Exhibit_I_1.jpg
EXHIBIT I-2 |
BACKLOG BY SEGMENT - (UNAUDITED) |
DOLLARS IN MILLIONS |
https://mma.prnewswire.com/media/1427218/EXHIBIT_I_2_Aerospace.jpg
https://mma.prnewswire.com/media/1427219/EXHIBIT_I_2_Marine_Systems.jpg
https://mma.prnewswire.com/media/1427220/EXHIBIT_I_2_Combat_Systems.jpg
https://mma.prnewswire.com/media/1427221/EXHIBIT_I_2_Technologies.jpg

https://mma.prnewswire.com/media/1427222/EXHIBIT_I_2_Segment_Key.jpg
EXHIBIT J |
FOURTH QUARTER 2020 SIGNIFICANT ORDERS - (UNAUDITED) |
DOLLARS IN MILLIONS |
We received the following significant contract awards during the fourth quarter of 2020:
Marine Systems:
- $9.5 billion from the U.S. Navy for construction of the first two Columbia-class submarines, as well as associated design and engineering support.
- $375 from the Navy to provide lead yard services for the Virginia-class submarine program.
- $265 from the Navy to provide maintenance and repair services for the San Antonio-class amphibious transport dock, Whidbey Island-class dock landing ship and Ticonderoga-class guided-missile cruiser programs.
- $215 from the Navy to provide engineering, technical, design and planning yard support services for operational strategic and attack submarines.
- $95 from the Navy to provide ongoing planning yard services for the Arleigh Burke-class (DDG-51) guided-missile destroyer program.
- $60 from the Navy to produce a large vertical array fixture for Navy submarine acoustic detection efforts.
Combat Systems:
- $405 from the U.S. Army to upgrade Abrams tanks to the M1A2 System Enhancement Package Version 3 (SEPv3) configuration. The contract has a maximum potential value of $4.3 billion.
- $230 from the Army to produce Stryker Initial Maneuver Short-Range Air Defense (IM-SHORAD) vehicles. The contract has a maximum potential value of $1.2 billion.
- A contract from the Army to provide maintenance, training and support services for the Stryker fleet. The contract has a maximum potential value of $430.
- $215 from the Canadian government for various munitions and ordnance.
- $175 from the Army for various munitions and ordnance.
- $80 for the production of Pandur 6x6 wheeled combat vehicles for the Austrian Federal Ministry of Defence.
- $55 to produce ASCOD tracked combat vehicles for an international customer.
Technologies:
- The Defense Enterprise Office Solutions (DEOS) contract from the General Services Administration in partnership with the Department of Defense (DoD) and Defense Information Systems Agency (DISA) to stand up cloud environments and support the migration of over 3.2 million existing DoD Office 365 users to the cloud. The contract has a maximum potential value of $4.4 billion.
- An IDIQ award from the U.S. Department of State to provide overseas consular services to support visa processing and other functions for U.S. embassies and consultants under the Global Support Strategy (GSS) program. The program has a maximum potential contract value of $3.3 billion among three awardees.
- A contract to provide enterprise information technology, communications and mission command support services to U.S. Army Europe. The contract has a maximum potential value of $695.
- $620 for several key contracts for classified customers.
- $110 to develop and deliver a digital engineering environment for the U.S. Air Force.
- $105 from the National Geospatial-Intelligence Agency (NGA) for network storage and data center services.
- $90 from the Navy to provide sustainment services for the Navy's next-generation Mobile User Objective System (MUOS) satellite communications system.
EXHIBIT K | ||||||||||||||||||||||||||
AEROSPACE SUPPLEMENTAL DATA - (UNAUDITED) | ||||||||||||||||||||||||||
Fourth Quarter | Twelve Months | |||||||||||||||||||||||||
2020 | 2019 | 2020 | 2019 | |||||||||||||||||||||||
Gulfstream Aircraft Deliveries (units): | ||||||||||||||||||||||||||
Large-cabin aircraft | 34 | 35 | 105 | 114 | ||||||||||||||||||||||
Mid-cabin aircraft | 6 | 9 | 22 | 33 | ||||||||||||||||||||||
Total | 40 | 44 | 127 | 147 | ||||||||||||||||||||||
Aerospace Book-to-Bill: | ||||||||||||||||||||||||||
Orders* | $ | 2,347 | $ | 4,652 | $ | 7,091 | $ | 11,674 | ||||||||||||||||||
Revenue (excluding pre-owned aircraft sales) | 2,435 | 2,774 | 8,075 | 9,509 | ||||||||||||||||||||||
Book-to-Bill Ratio | 0.96x | 1.68x | 0.88x | 1.23x | ||||||||||||||||||||||
* | Does not include customer defaults, liquidated damages, cancellations, foreign exchange fluctuations and other backlog adjustments. |
![]()
![]() View original content to download multimedia:http://www.prnewswire.com/news-releases/general-dynamics-reports-fourth-quarter-and-full-year-2020-financial-results-301215712.html
View original content to download multimedia:http://www.prnewswire.com/news-releases/general-dynamics-reports-fourth-quarter-and-full-year-2020-financial-results-301215712.html
SOURCE General Dynamics
Serious News for Serious Traders! Try StreetInsider.com Premium Free!
You May Also Be Interested In
- Super Micro Computer (SMCI) Falls 6%
- Trade Facilitation Commission Launches Initiative to Boost UK Exports and Foster Economic Growth
- Zhou Guanyu Takes Center Stage at Shanghai F1 Grand Prix: A Thrilling Home Debut
Create E-mail Alert Related Categories
PRNewswire, Press ReleasesRelated Entities
Dividend, EarningsSign up for StreetInsider Free!
Receive full access to all new and archived articles, unlimited portfolio tracking, e-mail alerts, custom newswires and RSS feeds - and more!
