

Digital Brands Group Reports Third Quarter 2021 Financial Results
 Tweet
Tweet Share
ShareAUSTIN, Texas, Nov. 11, 2021 /PRNewswire/ -- Digital Brands Group, Inc. ("DBG") (NASDAQ: DBGI), a curated collection of luxury lifestyle, digital-first brands, today reported financial results for its third quarter ended September 30, 2021.
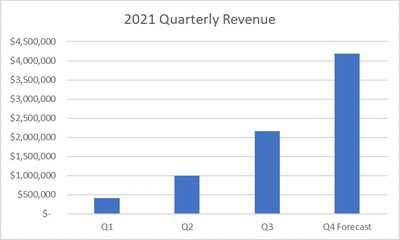
Third quarter 2021 net revenue increased 75% year over year to $2.2 million versus $1.2 million a year ago. Our gross profit margin increased 96% year over year to 55.9% from negative 40.1% a year ago, an increase of $1.7 million in gross profit dollars.
Our net loss per diluted share was $0.76 versus a net loss of $5.89 per diluted share a year ago, an improvement of 677% year over year. Our net loss attributable to common stockholders was $8.9 million versus a net loss of $3.9 million a year ago. The net loss included a non-cash expense associated with a change in the fair value of contingent liabilities of $4.0. million and a non-cash expense associated with a change in the fair value of our convertible notes of $0.6 million.
"Our third quarter 2021 results reflect another quarter of meaningful improvement in our business results from our first and second quarter results as we were able to benefit from the cash inflows from our IPO in the middle of May," said Hil Davis, Chief Executive Officer of Digital Brands Group.
"These improving business trends have continued into the fourth quarter. We now expect our fourth quarter revenues to double once again on a sequential quarterly basis to $4.0M, as the table below illustrates."
Stateside Acquisition Completed
We also finalized our acquisition of Stateside at the end of August, which resulted in only one month of revenue and cash flow contribution to our third quarter results. We expect Stateside to add meaningful revenue and cash flow to our fourth quarter of 2021, and in fiscal year 2022.
Fiscal Year 2022 Revenue and EBITDA Guidance
We are providing fiscal year 2022 net revenue guidance of $37.5M to $42.5M, an increase of 350% from 2021 revenue expectations. Additionally, the Company forecasts positive EBITDA for 2022, as it leverages its shared services platform.
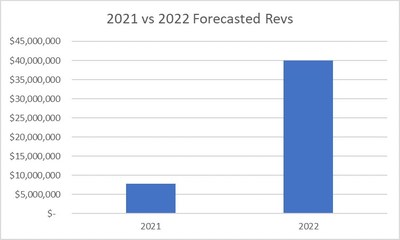
"Our 2022 revenue guidance reflects the power of our brand portfolio, especially as we are able to benefit from the full year revenue contribution from our acquisitions in 2021," said Hil Davis, Chief Executive Officer of Digital Brands Group.
"This forecasted increase of 350% in our year over revenue growth does not reflect any potential additional acquisitions, nor does it reflect any meaningful benefit from our expected increase in marketing spend."
"We expect to achieve cash flow EBITDA in 2022 due to the leverage we are experiencing from our shared services platform. We are excited about the cost savings we are experiencing from this shared services platform, especially as it relates to revenue generating marketing initiatives."
Our forecasted increase in 2022 revenues is driven by the following factors:
- For DSTLD:
- The addition of wholesale revenue with limited key accounts for brand awareness;
- A meaningful increase in digital marketing advertising, which was minimal in 2021;
- A full year of selling on Amazon;
- A full inventory stock for the entire year;
- And new product expansion driven by our recently hired women's designer.
- For Bailey 44:
- A full year of wholesale revenue versus six months in 2021;
- A meaningful increase in digital marketing advertising, which was minimal in 2021;
- And a full inventory stock for the entire year.
- For Harper & Jones:
- A full year of revenue contribution versus approximately seven months in 2021;
- New showroom openings;
- The full year benefit of new clothiers who started in the second half of 2021;
- And a meaningfully larger ready to wear offering versus 2021.
- For Stateside:
- A full year of revenue contribution versus four months in 2021;
- New product categories in women's knits and woven tops and bottoms;
- A meaningful increase in digital marketing advertising, which was minimal in 2021.
Acquisition Update
Finally, as we discussed in our S-1, we expect to continue to grow through acquisitions and expect to continue to acquire companies this year and next year. These acquisitions require GAAP PCAOB audits. These audits take time, which results in a delayed acquisition timeframe weighted toward the back months of 2021.
Third Quarter 2021 Highlights
- Net Sales were $2.2. million versus $1.2 million in the year ago quarter, an increase of 75% year over year. The increase in net sales was driven by the increase in revenue at Bailey 44 and DSTLD plus the addition of Harper & Jones for the full quarter and Stateside on a pro-rata basis.
- Our gross profit margin increased 96% year over year to 55.9% from negative 40.1%. Gross profit increased by $1.7 million due to improved gross margins at all our brands.
- Net loss attributable to common stockholders was $8.9 million, or $0.76 per diluted share, compared to net loss attributable to common stockholders of $3.9 million, or $5.89 per diluted share, in the prior year period.
- Net loss in the third quarter of 2021 included a non-cash expense associated with a change in the fair value of contingent liabilities of $4.0 million and a non-cash expense associated with a change in the fair value of our convertible notes of $0.6 million.
Conference Call and Webcast Details
The Company will host a conference call and webcast at 8:30 a.m. ET on Friday, November 12 to discuss results. The live conference call can be accessed by dialing (866) 605-1828 from the U.S. or internationally. The conference I.D. code is 13725121 or via the web by using the following link: https://tinyurl.com/efyarha2.
Forward-looking Statements
Certain statements included in this release are "forward-looking statements" within the meaning of the federal securities laws. Forward-looking statements are made based on our expectations and beliefs concerning future events impacting DBG and therefore involve several risks and uncertainties. You can identify these statements by the fact that they use words such as "will," "anticipate," "estimate," "expect," "should," and "may" and other words and terms of similar meaning or use of future dates, however, the absence of these words or similar expressions does not mean that a statement is not forward-looking. All statements regarding DBG's plans, objectives, projections and expectations relating to DBG's operations or financial performance, and assumptions related thereto are forward-looking statements. We caution that forward-looking statements are not guarantees and that actual results could differ materially from those expressed or implied in the forward-looking statements. DBG undertakes no obligation to publicly update or revise any forward-looking statements, whether as a result of new information, future events or otherwise, except as required by law. Potential risks and uncertainties that could cause the actual results of operations or financial condition of DBG to differ materially from those expressed or implied by forward-looking statements include, but are not limited to: risks arising from the widespread outbreak of an illness or any other communicable disease, or any other public health crisis, including the coronavirus (COVID-19) global pandemic; the level of consumer demand for apparel and accessories; disruption to DBGs distribution system; the financial strength of DBG's customers; fluctuations in the price, availability and quality of raw materials and contracted products; disruption and volatility in the global capital and credit markets; DBG's response to changing fashion trends, evolving consumer preferences and changing patterns of consumer behavior; intense competition from online retailers; manufacturing and product innovation; increasing pressure on margins; DBG's ability to implement its business strategy; DBG's ability to grow its wholesale and direct-to-consumer businesses; retail industry changes and challenges; DBG's and its vendors' ability to maintain the strength and security of information technology systems; the risk that DBG's facilities and systems and those of our third-party service providers may be vulnerable to and unable to anticipate or detect data security breaches and data or financial loss; DBG's ability to properly collect, use, manage and secure consumer and employee data; stability of DBG's manufacturing facilities and foreign suppliers; continued use by DBG's suppliers of ethical business practices; DBG's ability to accurately forecast demand for products; continuity of members of DBG's management; DBG's ability to protect trademarks and other intellectual property rights; possible goodwill and other asset impairment; DBG's ability to execute and integrate acquisitions; changes in tax laws and liabilities; legal, regulatory, political and economic risks; adverse or unexpected weather conditions; DBG's indebtedness and its ability to obtain financing on favorable terms, if needed, could prevent DBG from fulfilling its financial obligations; and climate change and increased focus on sustainability issues. More information on potential factors that could affect DBG's financial results is included from time to time in DBG's public reports filed with the SEC, including DBG's Annual Report on Form 10-K, and Quarterly Reports on Form 10-Q, and Forms 8-K filed or furnished with the SEC.
DIGITAL BRANDS GROUP, INC | ||||||||||
STATEMENT OF OPERATIONS | ||||||||||
Three Months Ended | ||||||||||
September 30, | ||||||||||
2021 | 2020 | |||||||||
Net revenues | $ 2,163,280 | $ 1,234,805 | ||||||||
Cost of net revenues | 954,137 | 1,729,709 | ||||||||
Gross profit (loss) | 1,209,143 | (494,904) | ||||||||
Operating expenses | 9,121,907 | 2,901,364 | ||||||||
Operating loss | (7,912,764) | (3,396,268) | ||||||||
Other expenses | (1,025,283) | (518,312) | ||||||||
Loss before provision for income taxes | (8,938,047) | (3,914,580) | ||||||||
Provision for income taxes | - | (276) | ||||||||
Net loss | $ (8,938,047) | $ (3,914,856) | ||||||||
Weighted average common shares outstanding - | ||||||||||
basic and diluted | 11,786,592 | 664,167 | ||||||||
Net loss per common share - basic and diluted | $ (0.76) | $ (5.89) | ||||||||
The accompanying notes are an integral part of these financial statements. | ||||||||||
DIGITAL BRANDS GROUP, INC | |||||||||||
STATEMENTS OF CASH FLOW | |||||||||||
Nine Months Ended | |||||||||||
September 30, | |||||||||||
2021 | 2020 | ||||||||||
Cash flows from operating activities: | |||||||||||
Net loss | $ (22,659,480) | $ (8,088,980) | |||||||||
Adjustments to reconcile net loss to net cash used in operating activities: | |||||||||||
Depreciation and amortization | 652,732 | 716,568 | |||||||||
Amortization of loan discount and fees | 682,956 | 144,974 | |||||||||
Stock-based compensation | 4,155,641 | 105,643 | |||||||||
Fees incurred in connection with debt financings | 132,609 | - | |||||||||
Change in fair value of warrant liability | 21,930 | (1,792) | |||||||||
Change in fair value of derivative liability | 627,956 | - | |||||||||
Change in fair value of contingent consideration | 7,039,394 | - | |||||||||
Deferred income tax benefit | (1,100,120) | - | |||||||||
Impairment of intangible assets | - | 784,500 | |||||||||
Loss on disposal of property and equipment | - | 593,449 | |||||||||
Change in credit reserve | 66,748 | (182,758) | |||||||||
Changes in operating assets and liabilities: | |||||||||||
Accounts receivable, net | (32,582) | (74,256) | |||||||||
Due from factor, net | (540,257) | 1,334,263 | |||||||||
Inventory | (483,477) | 2,578,261 | |||||||||
Prepaid expenses | (1,259,835) | (113,566) | |||||||||
Accounts payable | 749,352 | 1,161,279 | |||||||||
Accrued expenses and other liabilities | 451,298 | (721,062) | |||||||||
Deferred revenue | (78,492) | (13,564) | |||||||||
Accrued compensation - related party | (108,550) | (29,302) | |||||||||
Accrued interest | 206,163 | 656,734 | |||||||||
Net cash used in operating activities | (11,476,014) | (1,149,609) | |||||||||
Cash flows from investing activities: | |||||||||||
Cash acquired (consideration) pursuant to business combination | (5,442,966) | 106,913 | |||||||||
Issuance of related party receivable | - | (10,000) | |||||||||
Purchase of property, equipment and software | (13,585) | (266,390) | |||||||||
Deposits | (67,431) | 98,835 | |||||||||
Net cash provided by (used in) investing activities | (5,523,982) | (70,642) | |||||||||
Cash flows from financing activities: | |||||||||||
Proceeds from related party advances | - | 22,856 | |||||||||
Repayments to factor | (39,520) | (1,684,703) | |||||||||
Proceeds from venture debt | - | 862,500 | |||||||||
Issuance of loans payable | 2,626,050 | 1,701,044 | |||||||||
Repayments of promissory notes and loans payable | (2,002,731) | - | |||||||||
Issuance of convertible notes payable | 5,078,650 | - | |||||||||
Proceeds from initial public offering | 10,000,002 | - | |||||||||
Exercise of over-allotment option with public offering, net | 1,364,997 | - | |||||||||
Exercise of warrants | 1,768,046 | - | |||||||||
Proceeds from sale of Series A-3 preferred stock | - | 355,945 | |||||||||
Subscription receivable from Series A-3 preferred stock | - | 22,677 | |||||||||
Proceeds from sale of Series CF preferred stock | - | 286,518 | |||||||||
Offering costs | (2,116,957) | (104,996) | |||||||||
Net cash provided by financing activities | 16,678,537 | 1,461,841 | |||||||||
Net increase in cash and cash equivalents | (321,459) | 241,590 | |||||||||
Cash and cash equivalents at beginning of period | 575,986 | 40,469 | |||||||||
Cash and cash equivalents at end of period | $ 254,527 | $ 282,059 | |||||||||
The accompanying notes are an integral part of these financial statements. | |||||||||||
DIGITAL BRANDS GROUP, INC | ||||||||||
STATEMENT OF BALANCE SHEETS | ||||||||||
September 30, | December 31, | |||||||||
2021 | 2020 | |||||||||
ASSETS | ||||||||||
Current assets: | ||||||||||
Cash and cash equivalents | $ 254,527 | $ 575,986 | ||||||||
Accounts receivable, net | 272,264 | 35,532 | ||||||||
Due from factor, net | 1,094,309 | 210,033 | ||||||||
Inventory | 2,327,542 | 1,163,279 | ||||||||
Prepaid expenses and other current assets | 1,525,818 | 23,826 | ||||||||
Total current assets | 5,474,460 | 2,008,656 | ||||||||
Deferred offering costs | 367,696 | 214,647 | ||||||||
Property, equipment and software, net | 97,862 | 62,313 | ||||||||
Goodwill | 17,771,031 | 6,479,218 | ||||||||
Intangible assets, net | 16,779,126 | 7,494,667 | ||||||||
Deposits | 174,109 | 92,668 | ||||||||
Total assets | $ 40,664,284 | $ 16,352,169 | ||||||||
LIABILITIES AND STOCKHOLDERS' EQUITY (DEFICIT) | ||||||||||
Current liabilities: | ||||||||||
Accounts payable | $ 6,855,352 | $ 5,668,703 | ||||||||
Accrued expenses and other liabilities | 1,853,954 | 1,245,646 | ||||||||
Deferred revenue | 193,023 | 1,667 | ||||||||
Due to related parties | 232,635 | 441,453 | ||||||||
Contingent consideration liability | 10,527,910 | - | ||||||||
Convertible notes, current | 100,000 | 700,000 | ||||||||
Accrued interest payable | 855,729 | 737,039 | ||||||||
Note payable - related party | 299,489 | 137,856 | ||||||||
Venture debt, current | 300,000 | 5,854,326 | ||||||||
Loan payable, current | 1,796,000 | 992,000 | ||||||||
Promissory note payable, current | 655,000 | 4,500,000 | ||||||||
Total current liabilities | 23,669,092 | 20,278,690 | ||||||||
Convertible note payable, net | 2,793,385 | 1,215,815 | ||||||||
Loan payable | 1,677,213 | 709,044 | ||||||||
Promissory note payable | 2,845,000 | - | ||||||||
Venture debt, net of discount | 5,701,755 | - | ||||||||
Derivative liability | 2,486,843 | - | ||||||||
Warrant liability | 28,195 | 6,265 | ||||||||
Total liabilities | 39,201,483 | 22,209,814 | ||||||||
Commitments and contingencies (Note 12) | ||||||||||
Stockholders' equity (deficit): | ||||||||||
Series Seed convertible preferred stock, $0.0001 par, no shares and 20,714,518 shares, authorized, | ||||||||||
issued and outstanding at June 30, 2021 and December 31, 2020, respectively | - | 2,071 | ||||||||
Series A convertible preferred stock, $0.0001 par, no shares and 14,481,413 shares authorized, no shares | ||||||||||
and 5,654,072 shares issued and outstanding at September 30, 2021, and December 31, 2020, respectively | - | 565 | ||||||||
Series A-2 convertible preferred stock, $0.0001 par, no shares and 20,000,000 shares authorized, no shares | ||||||||||
and 5,932,742 shares issued and outstanding at September 30, 2021, and December 31, 2020, respectively | - | 593 | ||||||||
Series A-3 convertible preferred stock, $0.0001 par, no shares and 18,867,925 shares authorized, no shares | ||||||||||
and 9,032,330 shares issued and outstanding at September 30, 2021, and December 31, 2020, respectively | - | 904 | ||||||||
Series CF convertible preferred stock, $0.0001 par, no shares and 2,000,000 shares authorized, no shares | ||||||||||
and 836,331 shares issued and outstanding at September 30, 2021, and December 31, 2020, respectively | - | 83 | ||||||||
Series B convertible preferred stock, $0.0001 par, no shares and 20,714,517 shares authorized, no shares | ||||||||||
and 20,714,517 shares issued and outstanding at September 30, 2021, and December 31, 2020, respectively | - | 2,075 | ||||||||
Undesignated preferred stock, $0.0001 par, 10,000,000 shares and 936,144 shares authorized, 0 shares | ||||||||||
issued and outstanding as of both September 30, 2021 and December 31, 2020 | - | - | ||||||||
Common stock, $0.0001 par, 200,000,000 and 110,000,000 shares authorized, 12,627,488 and 664,167 shares | ||||||||||
issued and outstanding as of both September 30, 2021 and December 31, 2020, respectively | 1,263 | 66 | ||||||||
Additional paid-in capital | 57,467,015 | 27,481,995 | ||||||||
Accumulated deficit | (56,005,477) | (33,345,997) | ||||||||
Total stockholders' equity (deficit) | 1,462,801 | (5,857,645) | ||||||||
Total liabilities and stockholders' equity (deficit) | $ 40,664,284 | $ 16,352,169 | ||||||||
Checks: | - | - | ||||||||
1,263 | ||||||||||
57,467,015 | ||||||||||
(56,005,477) | ||||||||||
1,462,801 | ||||||||||
The accompanying notes are an integral part of these financial statements. | ||||||||||
About Digital Brands GroupWe offer a wide variety of apparel through numerous brands on a both direct-to-consumer and wholesale basis. We have created a business model derived from our founding as a digitally native-first vertical brand. Digital native first brands are brands founded as e-commerce driven businesses, where online sales constitute a meaningful percentage of net sales, although they often subsequently also expand into wholesale or direct retail channels., Unlike typical e-commerce brands, as a digitally native vertical brand we control our own distribution, sourcing products directly from our third-party manufacturers and selling directly to the end consumer. We focus on owning the customer's "closet share" by leveraging their data and purchase history to create personalized targeted content and looks for that specific customer cohort. We have strategically expanded into an omnichannel brand offering these styles and content not only on-line but at selected wholesale and retail storefronts. We believe this approach allows us opportunities to successfully drive Lifetime Value ("LTV") while increasing new customer growth.
Digital Brands Group, Inc. Company ContactHil Davis, CEOEmail: [email protected] Phone: (800) 593-1047
![]() View original content to download multimedia:https://www.prnewswire.com/news-releases/digital-brands-group-reports-third-quarter-2021-financial-results-301422676.html
View original content to download multimedia:https://www.prnewswire.com/news-releases/digital-brands-group-reports-third-quarter-2021-financial-results-301422676.html
SOURCE Digital Brands Group, Inc.
Serious News for Serious Traders! Try StreetInsider.com Premium Free!
You May Also Be Interested In
- Midday movers: Meta, IBM, Caterpillar fall; Chipotle rises
- Cyngn Inc (CYN) Announces Pricing of $5.0 Million Firm Commitment Public Offering of Common Stock
- HOOKIPA Pharma Inc. (HOOK) Announces Pivotal Phase 2/3 Trial Design for HB-200 plus Pembrolizumab
Create E-mail Alert Related Categories
PRNewswire, Press ReleasesRelated Entities
S1, Earnings, Definitive Agreement, IPOSign up for StreetInsider Free!
Receive full access to all new and archived articles, unlimited portfolio tracking, e-mail alerts, custom newswires and RSS feeds - and more!
