

Impactive Capital Issues Letter to Board of Directors of Envestnet, Inc.
 Tweet
Tweet Share
ShareGet Alerts ENV Hot Sheet
Join SI Premium – FREE
Details Serious Concerns with Envestnet’s Prolonged, Significant Stock Price and Operating Underperformance, Lack of Shareholder Alignment and Poor Board Governance
Perplexed by Board’s Refusal to Add a Single Shareholder Representative to the Board, Despite Impactive’s Large Ownership Stake and Considerable Effort to Collaborate Over the Past 18 Months
Troubled by Excessive Spending Without ROI Justification and Declining Profitability as Management and Board Payouts Increase
May Seek Further Board Change at 2023 Annual Meeting
NEW YORK, Nov. 15, 2022 (GLOBE NEWSWIRE) -- Impactive Capital, LP, together with its affiliates, one of the largest shareholders of Envestnet, Inc. (NYSE: ENV) (“Envestnet” or the “Company”), with an ownership interest of approximately 7.2% today issued an open letter to the Company’s Board of Directors (the “Board”).
In its letter, Impactive details Envestnet’s well-below market returns over multiple time periods relative to the S&P 500, S&P 400 and its closest peers, significant margin gap versus its closest peers, and egregious spending with seemingly no accountability for returns. Impactive highlights that despite the Board delivering significantly sub-market returns and collectively owning less than 1% of the Company, the Board has nonetheless increased management’s compensation over the past five years. As such, Impactive seeks to add a shareholder representative to the Board to better align pay for performance, refocus on capital allocation and protect and drive long term shareholder value.
The full text of the letter is set forth below:
November 15, 2022
The Board of Directors - Envestnet, Inc.1000 Chesterbrook Blvd, Suite 250Berwyn, PA 19312Attn: James Fox and William Crager
Dear Members of the Board,
Impactive Capital, LP (together with its affiliates, “Impactive” or “we”) has been a long-term investor in Envestnet, Inc. (“Envestnet” or the “Company”) and is currently one of its largest shareholders with approximately 4.0 million shares of the Company’s common stock, representing approximately 7.2% of the shares outstanding. During our engagement over the past 18 months, we have been clear that we believe Envestnet is a high-quality business that is not achieving adequate margins, returns, and its full potential value. In May of 2022, in the spirit of collaboration, we suggested that an Impactive representative be added to the Board of Directors (the “Board”) to represent shareholder interests. Rather than accepting the help the Company so desperately needs, management and the Board proceeded to hire a series of “defense” advisors, seemingly to entrench their own interests at the expense of shareholders, concoct an unconvincing performative review process of our candidate, and ultimately reject our request. We write today because we are exceedingly troubled by the Company’s long-term underperformance, lack of shareholder alignment, poor Board governance, and disingenuous shareholder engagement. Absent the appointment of an Impactive representative to the Board, we see no choice but to consider nominating a slate of directors at the next annual meeting of shareholders to replace long-standing directors who must be held accountable for the Company’s subpar performance.
We note that over the course of our history, Impactive has worked with over a dozen companies collaboratively to enhance shareholder value and deliver exceptional long-term returns. We are not short term actors; we have owned many of our portfolio companies since our inception and our current portfolio’s weighted average holding period is over two years. We have helped companies improve their capital allocation, operating efficiency, ESG profiles, and ultimately shareholder returns, while working behind the scenes across various industries. The fact that this is the first public letter we have ever been compelled to write should be cause for serious reflection and concern on the part of the entire Board.
Long-Term Returns
Since the current Chair of the Board, James Fox, joined the Board in February 2015, the stock has underperformed the S&P 500 by a staggering 124%.1 Over the past five years, during which 5 of the 7 Board members were present and a sixth director served as the Company’s President, Envestnet returned a mere 2% while the S&P 500 returned 67%.2 We cannot emphasize enough how difficult it is for a software company with mostly fixed costs, greater than 95% revenue retention, and revenues linked to the market, to underperform the market by ~65% over 5 years. The Company’s 1-, 3-, and 5-year relative returns have been similarly disappointing. We fear this level of dismal performance stems from an especially strong elixir of management incompetence and lack of effective Board oversight.
| Total Shareholder Return | ||||||||
| James Fox Tenure2/10/2015 – 11/10/2022 | 5-Year 11/10/2017-11/10/2022 | 3-Year 11/8/2019-11/10/2022 | 1-Year 11/10/2021 – 11/10/2022 | |||||
| Envestnet | -2.6 | % | 1.8 | % | -18.8 | % | -37.3 | % |
| S&P 500 | 121.2 | % | 67.3 | % | 34.3 | % | -13.5 | % |
| S&P 400 | 92.0 | % | 49.0 | % | 31.8 | % | -11.2 | % |
| Peers | ||||||||
| Proxy Peer Group | 240.9 | % | 115.3 | % | 30.6 | % | -12.4 | % |
| AssetMark | -2.7 | % | -12.6 | % | ||||
| SEIC | 53.3 | % | -1.6 | % | -0.3 | % | -5.6 | % |
| SS&C | 80.4 | % | 36.3 | % | -7.3 | % | -33.4 | % |
Source: Bloomberg. “Proxy Peer Group” represents the average total return of peers included in the 2021 Compensation Peer Group, including ACIW, AMK, AX, BCOR, FDS, FICO, GWRE, LPLA, MKTX, MORN, MSCI, NEWR, SEIC, SSNC, & ZEN, but excludes EPAY and CSOD which have been taken private.
History of Poor Operating Performance
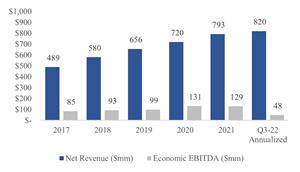
The Company’s conversion of revenue growth to EBITDA has also significantly lagged its closest peers since 2017.3 Envestnet’s Economic EBITDA (defined as Adjusted EBITDA less stock-based compensation and capitalized software development) has declined despite a 70% increase in net revenues, while the revenue growth of its closest peers has dropped through to the bottom line at 34%.4,5
Envestnet Net Revenue & EBITDA Track Record
Source: Company Reports
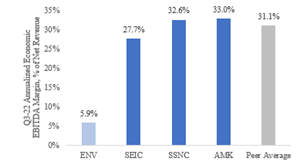
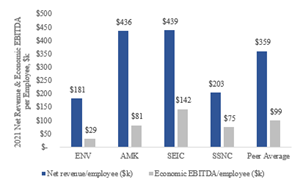
Envestnet’s Economic EBITDA margins lag its closest peers by a staggering 25%. Net revenue and profit per employee similarly trailed the Company’s closest peers by an astonishing 50% and 70%, respectively, in fiscal 2021.6 At a software-driven business like Envestnet, we believe growth in profitability should far exceed growth in revenues, but the right incentives must be in place.
Envestnet Margins vs Closest Peers7
Source: Company Reports
The Company’s spending has also been troubling. In 2021, management committed $40 to $45 million in incremental annual spend on their investment plan. However, since 2020, the expense base has swelled by an astounding $180 million.8 And this is before an incremental $104 million of acquisition expense year-to-date to acquire approximately $12 million in annualized revenues. Management’s apparent lack of expense discipline and reluctance to quantify returns on these expenditures leave us wondering: is anyone being held accountable for returns? In our view, this has further accelerated the erosion of investor confidence. In the 30 press releases the Company has issued this year to announce acquisitions, partnerships, initiatives, and new products, there has not been any mention of the Company’s associated profits, costs, or returns. We suspect even SpongeBob SquarePants and Mr. Krabs, who were engaged by the Company to educate on an “Intelligent Financial Life” in a recent marketing campaign, would know better.9 Shareholders deserve better.
Lack of Shareholder Alignment
Despite delivering significantly sub-market returns and collectively owning less than 1% of the Company, the Board has nonetheless paid itself $19 million over the past 5 years. Even as revenues almost doubled over the past 5 years, Economic EBITDA is down 40%, while management compensation is up. For the Board to look at this set of facts and conclude all is well, is, in our view, a shocking abandonment of its fiduciary duties.
Over the course of our engagement, we have repeatedly impressed upon management and the Board the importance of Free Cash Flow and true economic profit, as opposed to two metrics driving much of management compensation, namely management’s “Adjusted EBITDA” and “Adjusted Revenue”. We fail to see how these metrics align with the profits shareowners retain as they ignore real costs like stock-based compensation, restructuring, severance, litigation, and capitalized software development. It is therefore no surprise to us that these misaligned incentive structures would lead to a 5-year track record of 11% Adjusted EBITDA growth (as defined by management), but a decline in Economic EBITDA.10
Between 33% and 45% of Envestnet’s incentive plans (i.e., the Company’s Annual Incentive Program and Long Term Incentive Plan’s performance stock units (PSUs) are linked to Adjusted Revenue growth, a proportion which was increased in 2021.11 Adjusted Revenue is not representative of Envestnet’s true economic earnings power since approximately 30% of gross revenues is paid out in asset-based pass-through expenses. Further, we contend that linking such a large portion of compensation to gross revenue growth encourages management to prioritize products that may carry both a higher fee rate (i.e., AUM-linked versus AUA-linked) and higher asset-based costs, which would accelerate gross revenue growth but would not necessarily increase net gross profit dollars. Over the past five years, we have seen the harmful result of these incentives – growth in gross revenue has far exceeded growth in both net revenues and Economic EBITDA. Executive payouts have ballooned while profits and shareholder returns have shrunk. Sound corporate governance dictates separation of the Chairman and the Compensation Committee Chairman roles. Perhaps this is the reason why.
Recent Engagement
After months of engagement, we set forth our ideas for analyzing returns on incremental investments, enhancing disclosures, improving profitability, and focusing on capital allocation through the addition of an Impactive representative to the Board. In August of 2022, we were told by Chief Executive Officer William Crager to prepare a candidacy package for review by the Nominating and Governance Committee. We respected this process and tried every conceivable way to give the Board the information it needed to come to an informed decision. We offered to meet with the head of the Nominating and Governance committee, but this was rejected. We offered to travel to Chicago to meet with Chairman Fox, but this was rejected. Our package included several references which we were assured would be reviewed, but none were called by any member of the Board. Even by the low standards of a purely performative process designed to entrench one of the few remaining classified boards, this was lacking.12 Management and the Board seem to have attempted Kabuki theater, and still forgot to put on their costumes before they went on stage.13
To us, the rationale the Board gave for not appointing an Impactive representative to the Board was unpersuasive. The three “reasons” given were: 1) an assessment of the current Board’s skills matrix, 2) the prior rejection of another large shareholder’s request for a Board seat, and 3) that our candidate “was not a good fit”.
We will address each. First, we are not privy to what is in the Board’s secretive matrix analysis, but we can infer from publicly available data what definitely is NOT there: a track record of value creation. With respect to the second reason, we were informed that another large shareholder had requested a Board seat, which the Board similarly rejected. Here, the Board is confusing a bad precedent for a good reason. We respectfully remind the Board that shareholders actually own Envestnet. If multiple shareholders holding a sizable percentage of the outstanding stock are demanding Board representation in a short period of time, it should be a clear indication of broad-based dissatisfaction with the Board’s performance and returns. In our view, this is extremely poor corporate governance. We shudder to think of the wasted company resources that have gone into preventing not just ourselves but any meaningful shareholder from having a voice in a boardroom that is supposed to represent them.
Lastly, we were informed that our candidate just “was not a good fit.” We know that this may be a canned answer given to many actively engaged shareholders. But of course this is not a reason at all, it is a non-reason. A key function of a board is to select a management team who can allocate capital in a way that delivers shareholder returns. It therefore was equally shocking and troubling to sit across a zoom from two entrenched Directors who have underperformed the market by thousands of basis points and own very little stock telling you they don’t need your help, even though you’ve outperformed the market by thousands of basis points at other companies because it’s “not a good fit.”
The Path Forward
The Company’s blatant underperformance, shareholder misalignment, poor governance and lack of meaningful engagement, have made it clear to us that more profound change is needed at the Board level.
We strongly believe that an owner’s mindset is needed in the Boardroom to better align pay with performance, improve capital allocation and protect and drive long-term shareholder value at Envestnet. To the extent any existing shareholders have any questions, we encourage them to reach out. Our track record on boards has spanned years and led to over 30% annualized returns for Impactive. We certainly believe similar outperformance is possible for Envestnet as well.
While we are now assessing the magnitude of the changes required at the Board ahead of the Company’s upcoming nomination window, we remain hopeful that the Board will see reason and avoid the unnecessary time, expense, and distraction associated with that process.
Sincerely,
Lauren Taylor Wolfe Impactive Capital
Christian Asmar Impactive Capital
Appendix I: Envestnet vs Peers Revenue and EBITDA Growth and Margins
| $mm | 2017 | 2018 | 2019 | 2020 | 2021 | Q3-22 Annualized | ||||||
| ENV | ||||||||||||
| Net Revenue | 489 | 580 | 656 | 720 | 793 | 820 | ||||||
| Economic EBITDA | 85 | 93 | 99 | 131 | 129 | 48 | ||||||
| % - margin | 17.4 | % | 16.1 | % | 15.0 | % | 18.2 | % | 16.2 | % | 5.9 | % |
| Net Revenue Growth (a) | 331 | |||||||||||
| EBITDA Growth (b) | (37 | ) | ||||||||||
| Drop-Through (b/a) | -11 | % | ||||||||||
| SEIC | ||||||||||||
| Revenue | 1,527 | 1,624 | 1,650 | 1,684 | 1,918 | 2,046 | ||||||
| Economic EBITDA | 411 | 475 | 507 | 506 | 620 | 567 | ||||||
| % - margin | 27.0 | % | 29.3 | % | 30.7 | % | 30.0 | % | 32.3 | % | 27.7 | % |
| Revenue Growth (a) | 519 | |||||||||||
| EBITDA Growth (b) | 156 | |||||||||||
| Drop-Through (b/a) | 30 | % | ||||||||||
| SSNC | ||||||||||||
| Revenue | 1,675 | 3,421 | 4,633 | 4,668 | 5,051 | 5,260 | ||||||
| Economic EBITDA | 648 | 1,652 | 1,738 | 1,697 | 1,869 | 1,714 | ||||||
| % - margin | 38.7 | % | 48.3 | % | 37.5 | % | 36.4 | % | 37.0 | % | 32.6 | % |
| Revenue Growth (a) | 3,584 | |||||||||||
| EBITDA Growth (b) | 1,066 | |||||||||||
| Drop-Through (b/a) | 30 | % | ||||||||||
| AMK | ||||||||||||
| Net Revenue | 197 | 247 | 292 | 299 | 379 | 448 | ||||||
| Economic EBITDA | 39 | 67 | 53 | 35 | 70 | 148 | ||||||
| % - margin | 19.8 | % | 27.1 | % | 18.2 | % | 11.7 | % | 18.6 | % | 33.0 | % |
| Net Revenue Growth (a) | 251 | |||||||||||
| EBITDA Growth (b) | 108 | |||||||||||
| Drop-Through (b/a) | 43 | % | ||||||||||
| Benchmarking | ||||||||||||
| ENV Drop-Through | -11 | % | ||||||||||
| Peer Average Drop-Through | 34 | % | ||||||||||
| ENV Margin | 5.9 | % | ||||||||||
| Peer Average Margin | 31.1 | % | ||||||||||
Source: Company Reports. Net revenue defined as reported revenue less asset-based costs. Economic EBITDA defined as Adjusted EBITDA less stock-based compensation and capitalized software development for ENV, AMK, & SSNC and Income Statement EBITDA less capitalized software development for SEIC.
Appendix II: Envestnet vs Peers 2021 Net Revenue and Profit per Employee
Source: Company 10-K’s. Net revenue defined as reported revenue less asset-based costs. Economic EBITDA defined as Adjusted EBITDA less stock-based compensation and capitalized software development for ENV, AMK, & SSNC and Income Statement EBITDA less capitalized software development for SEIC.
Appendix III: Envestnet Expense Increase, 2020 through 2022
| $mm | 2020 | 2021 | Q3-22 Annualized |
| Net revenues | 720 | 793 | 820 |
| Compensation & benefits | 399 | 433 | 493 |
| General & administration | 160 | 172 | 210 |
| Capitalized software | 55 | 65 | 90 |
| Total expenses | 614 | 670 | 793 |
| Expense increase 2020-22 | 179 |
Source: Company Reports
Appendix IV: Envestnet Adjusted vs Economic EBITDA
| $mm | 2017 | 2018 | 2019 | 2020 | 2021 | Q3-22 Annualized | % CAGR | |||||||
| Net Revenue | 489 | 580 | 656 | 720 | 793 | 820 | 10.9 | % | ||||||
| Adjusted EBITDA | 129 | 158 | 193 | 243 | 262 | 222 | 11.5 | % | ||||||
| Stock-based Compensation | (31 | ) | (40 | ) | (60 | ) | (57 | ) | (68 | ) | (83 | ) | ||
| Capitalized Software | (13 | ) | (24 | ) | (34 | ) | (55 | ) | (65 | ) | (90 | ) | ||
| Economic EBITDA | 85 | 93 | 99 | 131 | 129 | 48 | -10.8 | % | ||||||
| % of Adj EBITDA | 66 | % | 59 | % | 51 | % | 54 | % | 49 | % | 22 | % | ||
Source: Company Reports
About Impactive
Impactive Capital, LP is a $2.7 Billion active investment management firm based in New York. Impactive invests in high quality, attractively valued businesses and engages collaboratively with management teams and Boards to unlock shareholder value using capital allocation, operational and returns-linked ESG tools. Investing over a longer term, multi-year time horizon allows Impactive to think and invest like owners to drive long term sustainable returns for all shareholders.
Contact:Walter Lee, (212) 218-8815[email protected]
____________________________________________1 Compares S&P 500 and Envestnet returns from February 10, 2015 through November 10, 2022 with dividends reinvested. Source: Bloomberg2 Compares S&P 500 and Envestnet returns from November 10, 2017 through November 10, 2022 with dividends reinvested. Source: Bloomberg3 Closest Peers include: SEIC, SSNC and AMK4 Net revenues defined as reported revenues less asset-based costs5 See Appendix I6 See Appendix II7 See Appendix I8 See Appendix III9 We wish this were a joke. https://investor.envestnet.com/resources/press-releases/detail/420/envestnet-partners-with-nickelodeon-to-bring-the10 See Appendix IV11 Per 2022 Proxy, the Compensation Committee, chaired by Mr. Fox, raised the proportion of the Annual Incentive Program tied to Adjusted revenues from 35% to 45%.12 Only 11% of S&P 500 Boards are classified according to Spencer Stuart13 We have great admiration for the arts, including Kabuki. We make the comparison as we prefer it left to the theater, not the Boardroom.
Charts accompanying this announcement are available athttps://www.globenewswire.com/NewsRoom/AttachmentNg/5b7b81a0-feb3-408c-bcb3-ee3f1afae5a4
https://www.globenewswire.com/NewsRoom/AttachmentNg/9dc00a80-a115-4011-9bcc-70e2f850b4db
https://www.globenewswire.com/NewsRoom/AttachmentNg/dc0dbc97-fc02-4465-aa87-005272b8b0f2
A logo accompanying this announcement is available at
https://www.globenewswire.com/NewsRoom/AttachmentNg/c6c7703d-08fc-41f4-9e75-703413b9b21a


Serious News for Serious Traders! Try StreetInsider.com Premium Free!
You May Also Be Interested In
- Bank of America (BAC) Tops Q1 EPS by $0.07, Beats on Revenue
- Midday movers: Goldman Sachs and Meta Platforms rise; Apple and Tesla fall
- McDonald's (MCD) PT Lowered to $297 at Citi
Create E-mail Alert Related Categories
Globe Newswire, Press ReleasesRelated Entities
Dividend, Earnings, Definitive AgreementSign up for StreetInsider Free!
Receive full access to all new and archived articles, unlimited portfolio tracking, e-mail alerts, custom newswires and RSS feeds - and more!
