

Form N-CSR GOLDMAN SACHS TRUST For: Nov 30
 Tweet
Tweet Share
ShareUNITED STATES
SECURITIES AND EXCHANGE COMMISSION
Washington, D.C. 20549
FORM N-CSR
CERTIFIED SHAREHOLDER REPORT OF REGISTERED
MANAGEMENT INVESTMENT COMPANIES
Investment Company Act file number 811-05349
Goldman Sachs Trust
(Exact name of registrant as specified in charter)
71 South Wacker Drive,
Chicago, Illinois 60606
(Address of principal executive offices) (Zip code)
| Copies to: | ||
| Caroline Kraus, Esq |
Geoffrey R.T. Kenyon, Esq. | |
| Goldman Sachs & Co. LLC |
Dechert LLP | |
| 200 West Street |
One International Place, 40th Floor | |
| New York, New York 10282 |
100 Oliver Street | |
| Boston, MA 02110 | ||
(Name and address of agents for service)
Registrant’s telephone number, including area code: (312) 655-4400
Date of fiscal year end: November 30
Date of reporting period: November 30, 2020
| ITEM 1. | REPORTS TO STOCKHOLDERS. |
| The Annual Report to Shareholders is filed herewith. |
Goldman Sachs Funds

| Annual Report | November 30, 2020 | |||
| MLP Energy Infrastructure Fund | ||||

Goldman Sachs MLP Energy Infrastructure Fund
| 1 | ||||
| 11 | ||||
| 13 | ||||
| 16 | ||||
| 23 | ||||
| 36 | ||||
| 37 | ||||
| NOT FDIC-INSURED | May Lose Value | No Bank Guarantee | ||
PORTFOLIO RESULTS
Goldman Sachs MLP Energy Infrastructure Fund
Investment Objective and Principal Investment Strategy
The Fund seeks total return through current income and capital appreciation.
In April 2020, the Board of Trustees of the Goldman Sachs Trust approved changes to the Fund’s principal investment strategy, effective at the close of business on June 26, 2020. When the Reporting Period began on December 1, 2019, the Fund invested, under normal circumstances, at least 80% of its net assets plus any borrowings for investment purposes (measured at the time of purchase) (“Net Assets”) in energy infrastructure master limited partnership (“MLP”) investments. After June 26, 2020, the Fund invests, under normal circumstances, at least 80% of its Net Assets in U.S. and non-U.S. equity or fixed income securities issued by energy infrastructure companies, including MLPs and “C” corporations. The Fund’s investments in MLPs will consist of at least 25% of the Fund’s total assets as measured at the time of purchase. The Fund intends to concentrate its investments in the energy sector.
Portfolio Management Discussion and Analysis
Below, the Goldman Sachs Energy and Infrastructure Team discusses the Goldman Sachs MLP Energy Infrastructure Fund’s (the “Fund”) performance and positioning for the 12-month period ended November 30, 2020 (the “Reporting Period”). The performance information reported herein reflects the Fund’s current and prior investment strategies.
| Q | How did the Fund perform during the Reporting Period? |
| A | During the Reporting Period, the Fund’s Class A, Class C, Institutional, Investor, Class R6, Class R and Class P Shares generated average annual total returns, without sales charges, of -27.84%, -28.33%, -27.48%, -27.56%, -27.61%, -28.12% and -27.55%, respectively. These returns compare to the -24.45% average annual total return of the Alerian MLP Index. The Alerian MLP Index is a leading measure of energy infrastructure master limited partnerships (“MLPs”).1 |
| Q | How did energy-related assets overall perform during the Reporting Period? |
| A | Energy-related assets broadly sold off during the Reporting Period. Energy infrastructure MLPs generally, as measured by the Alerian MLP Index,1 produced a total return of -24.45%. The broader midstream2 sector, as measured by the Alerian Midstream Energy Index3 (“AMNA Index”) (which includes both energy MLPs and “C” corporations), generated a total return of -17.82%. |
| In December 2019, when the Reporting Period began, the growth outlooks for the U.S. shale industry and the global economy were positive and stable overall. Conditions abruptly changed in early 2020 with the emergence and spread of COVID-19 and the start of a crude oil producer price war, which together created a more challenging and uncertain global environment for the energy markets and energy-related equities. |
| The energy markets experienced unprecedented weakness during the first quarter of 2020, driven by two factors. The first was a demand-side shock, as quarantine efforts and travel restrictions implemented to reduce the spread of COVID-19 led to a sharp drop in demand. The second was a supply-side shock, as the Organization of the Petroleum Exporting Countries (“OPEC”) and Russia failed to reach an agreement on production cuts and entered into a crude oil price war, which ultimately added supply to an already oversupplied market. Crude oil prices fell, with the prices of |
| 1 | Source: Alerian. The Alerian MLP Index is the leading gauge of energy infrastructure Master Limited Partnerships (MLPs). The capped, float-adjusted, capitalization-weighted index, whose constituents earn the majority of their cash flow from midstream activities involving energy commodities, is disseminated real-time on a price-return basis (AMZ) and on a total-return basis (AMZX). It is not possible to invest directly in an unmanaged index. |
| 2 | The midstream component of the energy industry is usually defined as those companies providing products or services that help link the supply side (i.e., energy producers) and the demand side (i.e., energy end-users for any type of energy commodity. Such midstream businesses can include, but are not limited to, those that process, store, market and transport various energy commodities. |
| 3 | Source: Alerian. The Alerian Midstream Energy Index is a broad-based composite of North American energy infrastructure companies. The capped, float-adjusted, capitalization-weighted index, whose constituents earn the majority of their cash flow from midstream activities involving energy commodities, is disseminated real-time on a price-return (AMNA), total-return (AMNAX), net total-return (AMNAN), and adjusted net total-return (AMNTR) basis. |
1
PORTFOLIO RESULTS
| West Texas Intermediate (“WTI”) and Brent crude oil declining approximately 25% and 24%, respectively, on March 9th, the first trading day after the OPEC+ talks collapsed.4 (OPEC+ is composed of OPEC countries and non-OPEC oil producing countries, most notably Russia.) Crude oil prices then continued to trend down fueled by market uncertainty about demand given the global economic impact of COVID-19 as well as by shorter-term concerns around U.S. storage constraints. |
| Energy-related equities sold off during the first quarter of 2020 on investor uncertainty about the ultimate impact on the U.S. shale industry of the simultaneous demand-side and supply-side shocks. We believe the sell-off was exacerbated in the midstream sector by technical selling, as closed-end funds de-levered to reduce volatility and, in some cases, to maintain compliance with leverage covenants. We estimate more than $3 billion in holdings were sold by closed-end funds during the first 15 trading days of March.5 Midstream equities were also pressured during the first calendar quarter by the magnitude of uncertainty within the equities and energy markets broadly, even though midstream cash flows are predominantly volume based and generally less sensitive to commodity price fluctuations due to contractual agreements, which we believe help manage one-to-one exposure between midstream cash flows and volume declines. Furthermore, in response to severe commodity price weakness during the first calendar quarter, a number of midstream energy companies announced plans to strengthen their balance sheets, with some keeping their distributions flat, some cutting distribution payout levels, and many reducing their expected capital expenditures for 2020. In most cases, these defensive actions were rewarded by investors. |
| In April 2020, the energy markets and energy-related equities experienced some relief, as the crude oil price war appeared to reach a resolution. OPEC+ members met, starting on April 9th, and proposed their largest-ever production cut of 9.7 million barrels per day on April 12th.6 Saudi Arabia subsequently deepened its commitment to the production cut, reducing output by an additional 1.0 million barrels per day. Several other countries also announced voluntary production cuts. Despite the April OPEC+ production agreement, significant crude oil oversupply led to logistical issues and storage capacity constraints in the U.S. that same month, resulting in unprecedentedly low WTI crude oil prices and even negative WTI crude oil futures contracts for the first time in history. Midstream equities remained relatively resilient during April, as we believe many investors looked past transient supply-side issues and instead valued equities on longer-dated commodity price expectations. |
| In May 2020, market expectations about the supply-demand gap started to ease, as crude oil demand improved relative to the troughs seen in early April and global supply levels began to react to lower prices in the marketplace. In particular, production cuts from OPEC+ members, as well as market-driven reductions in U.S. production, slowed inventory builds relative to their April levels. Meanwhile, future production activity indicators, such as rig counts and 2020 capital expenditure expectations for exploration and production companies, fell substantially. As a result, the crude oil market started to show signs of tightening in May, enabling prices to rebound off their prior month lows. At the same time, energy-related equities, particularly midstream equities, continued to experience a meaningful recovery from their lows in mid-March. The Alerian MLP Index and the AMNA Index recorded gains of 148% and 107%, respectively, between March 18th and June 8th. They retreated thereafter, dropping 32% and 24%, respectively, from June 9th through the end of October. We believe the drop in midstream equity performance from mid-June through October 2020 was driven largely by weak investor sentiment, not fundamentals. In our view, the weakness in sentiment was due to a number of factors, including uncertainty about the then-upcoming U.S. elections, given the seemingly unfavorable oil and gas policy views of Democratic politicians. Midstream equities were also hurt, in our opinion, by environmental, social and governance-related capital allocation headwinds and terminal value7 concerns for oil and gas assets given growing interest in renewable energy. Meanwhile, the fundamental backdrop for energy-related companies improved considerably. First, oil demand picked up steam. We track traffic data across the world, and within the largest cities in Asia and Europe, traffic congestion grew closer to pre-COVID-19 levels. Although the recovery in U.S. traffic congestion was comparatively slower, we also started to see improvement domestically. Second, on the supply side, we witnessed production discipline from OPEC+ countries and U.S. shale producers, |
| 4 | Source of crude oil price data: Bloomberg. |
| 5 | Source of sales data: Bloomberg and U.S. Capital Advisors. |
| 6 | Source of production cut data: OPEC and Bloomberg. |
| 7 | Terminal value is the value of a business or project beyond the forecast period when future cash flows can be estimated. Terminal value assumes a business will grow at a set growth rate forever after the forecast period. |
2
PORTFOLIO RESULTS
| which narrowed the supply-demand gap and provided upside support for crude oil prices. Third, many midstream energy companies had significantly reduced their capital expenditures, a welcome and appropriate change, in our view. Finally, even with the dramatic decline in oil demand during the second quarter of 2020, midstream cash flows were rather resilient. If one were to look at a list of the most prominent midstream energy companies, their earnings before interest, taxes, depreciation and amortization (“EBITDA”) were only down an average of approximately 11% year-over-year during the second calendar quarter. During that same quarter, the share prices of these companies fell an average of 44%, demonstrating the disconnect between equity price performance and the sector’s fundamentals, in our view. |
| During November 2020, energy markets and energy-related securities experienced strong rebounds. WTI and Brent crude oil prices rose 27% and 25%, respectively. Energy-related securities rallied, with the Alerian MLP Index and AMNA Index up 24% and 19%, respectively. We believe the strong performance was driven by positive COVID-19 vaccine news, which materially improved the outlook for energy demand, and by resilient earnings of midstream energy companies. Nine of the top 10 U.S. midstream energy companies beat consensus EBITDA expectations for the third calendar quarter by an average of 7.5%, while |
| also posting healthy distribution coverage ratios8 and strong free cash flow outlooks. Price performance was also bolstered, in our view, by the announcement of share buyback programs, with $2.3 billion authorized in November alone, and continued cost rationalization,9 with consensus expectations for 2021 midstream capital expenditures declining more than 50% relative to the estimates at 2019 year-end, greatly increasing market expectations for free cash flow and capital return to investors. At the same time, the market appeared to view the U.S. election results as relatively benign, given that a Democratic President could be coupled with a potentially Republican Senate, alleviating investors’ worst-case concerns about punitive legislation against the oil and gas sector. Finally, we believe energy-related equities benefited from a growth to value rotation, as promising COVID-19 vaccine news and potential economic reopening led many investors to focus on undervalued businesses. This view is supported, we believe, by the approximately 550 basis point outperformance of the Russell 1000 Value Index10 versus the Russell 1000 Growth Index11 between October 1, 2020 and the end of the Reporting Period. (A basis point is 1/100th of a percentage point.) |
| Q | What key factors were responsible for the Fund’s relative performance during the Reporting Period? |
| A | Security selection and severe weakness in the energy markets drove the Fund’s performance during the Reporting Period. The Fund posted negative absolute returns and underperformed the Alerian MLP Index, as high quality midstream energy equities, which are favored by our investment process, generally lagged lower quality midstream energy equities. In managing the Fund, we focus on what we consider to be high quality midstream energy companies with strong dividend and distribution coverage ratios, healthy balance sheets and robust free cash flow outlooks. These stocks outperformed during the severe market weakness in March 2020, while lower quality midstream stocks, which we define as smaller cap, high-beta12 companies with non-investment grade balance sheets, experienced steep declines. However, as the midstream energy sector recovered from its March lows, lower quality midstream stocks, which we believe were oversold, meaningfully outperformed higher quality midstream stocks, and the Fund’s minimal exposure to lower quality stocks compared to the Alerian MLP Index detracted from its relative performance. We note that while volatility may lead to periods of underperformance for higher quality names, these companies have historically outperformed over a |
| 8 | The distribution coverage ratio is an energy company’s distributable cash flow divided by the total amount of distributions it has paid out. It is an indication of an energy company’s ability to maintain its current cash distribution level. |
| 9 | Cost rationalization addresses the sources of costs through the supply chain. |
| 10 | The Russell 1000® Value Index measures the performance of the large-cap value segment of the U.S. equity universe. It includes those Russell 1000® Index companies with lower price-to-book ratios and lower expected growth values. The Russell 1000® Index measures the performance of the large-cap segment of the U.S. equity universe and includes approximately 1000 of the largest securities based on a combination of their market cap and current index membership. The Russell 1000® Index represents approximately 92% of the U.S. market. |
| 11 | The Russell 1000® Growth Index is an unmanaged index of common stock prices that measures the performance of those Russell 1000 companies with higher price-to-book ratios and higher forecasted growth values. |
| 12 | In this context, a high-beta company means any midstream company whose stock has a trailing one-year beta to the AMNA Index that is greater than 1.2. Beta is a measure of a stock’s volatility relative to an index or the overall market. A beta greater than 1.0 indicates that the stock’s price is theoretically more volatile than the index or overall market. |
3
PORTFOLIO RESULTS
| longer time frame, and we believe they have offered better risk-adjusted returns. |
| Regarding its exposures, the Fund was negatively impacted by weak stock selection in the petroleum pipeline transportation, natural gas pipeline transportation, and gathering and processing subsectors.13 On the positive side, the Fund benefited from its holdings in the power generation subsector, positioning that proved to be rather defensive amid volatility in the energy markets. The subsector also provided the Fund with exposure to renewable power generation, an industry that has experienced increased investor interest as well as supportive corporate and regulatory announcements, which added further to relative returns. (Power generating companies are not represented in the Alerian MLP Index.) |
| Q | What individual holdings detracted from the Fund’s relative performance during the Reporting Period? |
| A | Compared to the Alerian MLP Index, the Fund was hurt during the Reporting Period by its underweight positions in Tallgrass Energy, LP; Western Midstream Partners, LP; and DC Midstream, LP. |
| Detracting most from relative performance was the Fund’s underweight position in Tallgrass Energy, LP (TGE), a midstream provider that primarily engages in the transportation of crude oil and natural gas in addition to providing storage, water management and processing services. On January 31, 2019, Blackstone Infrastructure Partners (“BIP”) announced a definitive agreement to acquire 100% of the membership interests in TGE’s general partners and an approximately 44% economic interest in TGE itself. After the deal was completed during March 2019, TGE’s equity price significantly underperformed the midstream sector, as represented by the Alerian MLP Index. In August 2019, TGE received a non-binding preliminary proposal letter from BIP offering to acquire all outstanding Class A shares of the company for $19.50 per share in cash. Subsequently in December 2019, TGE announced it had entered into a definitive merger agreement pursuant to which BIP, together with its affiliates, would acquire all of the publicly held outstanding Class A shares of TGE for $22.45 per share in cash. Although TGE’s stock initially rallied, there were significant delays following the announcement, which raised investor uncertainty around the prospects of the deal closing, leading TGE to trade significantly below the agreement’s offering price. In March 2020, BIP confirmed its commitment to the deal, and the Fund established a modest, though still underweight, position in the stock. After March 18th, the date we initiated the position, through the transaction’s closing date of April 17th, TGE rallied approximately 68% to reflect the original offering price, and, as a result, the Fund’s underweight position hurt its relative performance. |
| The Fund was also hampered by its underweight in Western Midstream Partners, LP (WES), a midstream energy company that engages in the business of gathering, compressing, treating, processing and transporting natural gas, natural gas liquids and crude oil. WES performed well during the Reporting Period, largely because the company took several steps to fix its balance sheet and focus on cash flow growth. WES announced a distribution cut of 50% for 2020 and said it would reduce future capital expenditures, with the intention of using the excess cash flow to de-lever its balance sheet and buy back its stock. Additionally, as commodity prices stabilized, the outlook for the company’s largest customer, Occidental Petroleum, improved. |
| An underweight position in DCP Midstream, LP (DCP), one of the largest natural gas gatherers in North America and a top producer and primary marketer of natural gas liquids, detracted from the Fund’s relative returns. Severe weakness in the energy markets led to a steep decline in DCP’s stock price, largely, we believe, because of the company’s high leverage and direct commodity exposure relative to many of its peers. DCP’s management team responded to the sell-off with a 50% distribution cut, a meaningful reduction in 2020 capital expenditures and an announcement of additional cost savings initiatives in an effort to strengthen the company’s balance sheet. Although DCP’s capital discipline was generally viewed positively, we believe the market remained concerned about the company’s ability to decrease leverage given a reduction in producer activity and weak commodity prices. We sold the Fund’s position in DCP during April 2020 and reallocated the proceeds to companies that we believed had comparatively stronger balance sheets and less commodity price sensitivity. By the end of the Reporting Period, crude oil supply/demand had largely balanced and prices had stabilized, with market expectations for U.S. total liquids production rising from trough levels. Amid an improving macro environment for the energy market, DCP reported strong second calendar quarter earnings that significantly beat consensus estimates and reaffirmed its management’s original, pre-COVID-19 guidance for the |
| 13 | Sector and subsector allocations are defined by GSAM and may differ from sector allocations used by the Alerian MLP Index. |
4
PORTFOLIO RESULTS
| 2020 calendar year. In the week after the positive earnings announcement, average analyst consensus for the company’s 2021 price target increased considerably, and its stock traded higher. As a result, during the Reporting Period overall, the Fund’s underweight position in DCP detracted from its relative performance. |
| Q | What individual holdings added to the Fund’s relative performance during the Reporting Period? |
| A | Relative to the Alerian MLP Index, the Fund benefited from its lack of exposure to NGL Energy Partners LP, its overweight in Targa Resources Corp. and its underweight in Phillips 66 Partners LP. |
| Contributing most positively to the Fund’s relative performance was a lack of exposure to NGL Energy Partners LP (NGL), a diversified midstream MLP that provides multiple services, including transportation, storage, blending and marketing of crude oil, natural gas liquids, refined products/renewables and water solutions. NGL was negatively affected when one of the largest customers on its premier asset—Grand Mesa, a crude oil pipeline—entered into bankruptcy and fought to have its contracts with NGL rejected. In addition, in response to COVID-19 related weakness, NGL cut its distribution twice after the start of calendar year 2020. Counterparty concerns and the announcement of the two distribution cuts weighed on NGL’s equity price performance during the Reporting Period. |
| Adding further to relative returns was the Fund’s overweight in Targa Resources Corp. (TRGP), an independent midstream services provider primarily engaged in gathering, storing, processing and transporting crude oil, natural gas and refined petroleum products. The severe weakness in energy markets due to COVID-19-related demand destruction and the simultaneous OPEC+ producer price war led to an outsized decline in TRGP’s share price, largely due to the company’s high leverage ratio.14 However, its management team quickly took steps to strengthen the company’s balance sheet and to increase the company’s focus on free cash flow, which included an 89% dividend cut during 2020 and a reduction in capital expenditures. Then, later in the Reporting Period, TRGP announced it intended to buy back stock. Additionally, given that the company’s main area of operations is in the Permian Basin and it has an integrated asset profile, TRGP benefited from the stabilization of crude oil prices, as such stability greatly improved the company’s leverage and earnings profile, and the outlook for TRGP became increasingly positive, in our view. |
| The Fund’s relative performance was further bolstered during the Reporting Period by an underweight position in Phillips 66 Partners LP (PSXP), which owns, operates, develops and acquires crude oil, refined petroleum product and natural gas liquids pipelines and terminals and other transportation and midstream assets predominantly in the central and Gulf Coast regions of the U.S. PSXP’s performance was hurt by investor concerns around the potential shut-down of the Dakota Access Pipeline of which PSXP is a 25% owner through a joint venture. During the 2019 calendar year, this asset contributed approximately 18% of PSXP’s adjusted EBITDA. Fears that the pipeline might be closed by a federal district court led to heightened volatility in PSXP’s share price. To manage active portfolio risk should there be an unexpectedly positive court ruling, as well as to free up capital for other investments, we eliminated the Fund’s long position in PSXP during November 2020. However, we maintained measured exposure to the stock through the use of a call spread strategy.15 |
| Q | Were there any notable purchases or sales during the Reporting Period? |
| A | During the Reporting Period, the Fund initiated a position in Enbridge, Inc. (ENB), which provides energy transportation, distribution and related services in North America. We viewed the company’s size, scale, investment grade rating and overall defensive position as a compelling investment opportunity. |
| During a period of severe market uncertainty driven by the COVID-19 outbreak, the Fund initiated a position in NextEra Energy, Inc. (NEE). We considered NEE as an attractive investment opportunity because of what we viewed as the company’s low volatility earnings profile, focus on renewable energy sources and regulated rates of return that could help to protect its earnings from the impacts of COVID-19. |
| 14 | A leverage ratio indicates the level of debt incurred by a business against several other accounts in its balance sheet, income statement, or cash flow statement. A high leverage ratio generally indicates that a company has been aggressive in financing its growth with debt. |
| 15 | A call spread strategy involves purchasing call options at a specific strike price, while also selling the same number of calls of the same asset and expiration date but at a higher strike price. A call option is an option that gives the holder the right, but not the obligation, to buy an underlying asset at an agreed-upon price at any time up to an agreed-upon date. |
5
PORTFOLIO RESULTS
| In addition, during the Reporting Period, the Fund established a position in Rice Acquisition Corp. (RICE/U), a special-purpose acquisition company (SPAC), through an initial public offering. A SPAC raises capital through an initial public offering for the purpose of acquiring an existing company and driving shareholder value through strategic management and operational expertise. We decided to allocate capital to RICE/U as we are confident in its management team, members of which previously served as executive officers of Rice Energy Inc. and Rice Midstream Partners LP. In our opinion, they are well equipped to deliver upon their objective of producing attractive and sustainable risk-adjusted returns through the development of the world’s clean energy supply, a theme we believe may become more prominent in the global energy mix over the next several decades. |
| Among notable sales during the Reporting Period was the Fund’s investment in Noble Midstream Partners LP (NBLX). We exited the position in an effort to reduce portfolio risk during severe energy market uncertainty. We allocated the proceeds to companies that had what we viewed as comparatively stronger balance sheets and less commodity price sensitivity. |
| We eliminated the Fund’s investment in Genesis Energy, LP (GEL), a midstream MLP that provides energy infrastructure and logistics services. A significant portion of GEL’s cash flow comes from its soda ash segment, and soda ash demand was negatively impacted by the spread of COVID-19. Additionally, cash flows from soda ash can have greater variability than those from more traditional midstream business segments because of the length and nature of soda ash contracts. Because of uncertainty around the performance of GEL’s soda ash segment, COVID-19-related impacts to its more traditional midstream segments and the company’s relatively high level of leverage, we decided to exit the Fund’s position in the stock. |
| Q | How did the Fund use derivatives and similar instruments during the Reporting Period? |
| A | During the Reporting Period, the Fund used listed equity options to implement a call spread as we sought to maintain exposure to PSXP after eliminating the Fund’s long investment in the stock. The use of listed equity options had a positive impact on the Fund’s performance during the Reporting Period. |
| Q | What is the Fund’s tactical view and strategy for the months ahead? |
| A | At the end of the Reporting Period, we had a positive outlook for the energy markets and energy-related equities in 2021. Taking a macro perspective, we noted that crude oil demand had improved toward the end of the Reporting Period, not only internationally, but also in the U.S., and we believed the COVID-19 vaccine would only accelerate this trend. Additionally, in our view, U.S. producers were demonstrating unprecedented supply-side discipline and OPEC+ members were showing solidarity. Assuming global production remained disciplined and demand increased on the back of rapid testing and a vaccine, Goldman Sachs Global Investment Research was forecasting at the end of the Reporting Period that Brent crude oil prices could hit $63 per barrel in 2021. Furthermore, a decline in U.S.-based upstream16 drilling activity seemed to have reduced the need for more pipeline projects, which led many midstream energy companies to shift their focus from new project spending to debt reduction and possible share buyback programs during the Reporting Period. Coupled with lower distribution payouts, this should result in strong free cash flow into 2021, in our view. We thought the shift in capital allocation was long overdue, and more free cash flow-centric business models may well be a key factor for the long-term sustainability of the midstream energy sector. In our opinion, the sector’s free cash flow potential has also created a significant opportunity for share repurchase programs, which we believe could be a meaningful catalyst for a recovery in equity prices, given the depressed valuations at the end of the Reporting Period. |
| Looking toward 2025, we believe the midstream energy sector has the potential to generate $35-$45 billion of excess cash after distributions and capital expenditures, which amounts to nearly 15% of the market capitalization of midstream energy companies generating positive free cash flow at the end of the Reporting Period. To put this in context, Wells Fargo said it expects the midstream energy sector to generate nearly $7 billion of excess cash in 2021 alone. If just 50% of that excess cash is used for share buyback programs, we believe it could reverse almost all of the investment outflows experienced from January 2020 through the end of |
| 16 | The upstream component of the energy industry is usually defined as those operations stages in the oil and gas industry that involve exploration and production. Upstream operations deal primarily with the exploration stages of the oil and gas industry, with upstream firms taking the first steps to first locate, test and drill for oil and gas. Later, once reserves are proven, upstream firms will extract any oil and gas from the reserve. |
6
PORTFOLIO RESULTS
| the Reporting Period. We have seen several billion dollars of share buyback authorizations from midstream companies during 2020 year to date through November, and we anticipate more buyback programs may be announced in coming calendar quarters. In our opinion, these programs could be accretive to shareholder value and may also be a strong technical tailwind for midstream equity prices. |
| At the end of the Reporting Period, we believed the risk-reward profile of midstream equities had grown increasingly positive. In managing the Fund, we intended to remain focused on companies we deemed to be of high quality, with strong dividend and distribution coverage ratios, healthy balance sheets and robust free cash flow outlooks. At the end of the Reporting Period, we believed the Fund was well positioned to benefit from a potential rebound in midstream equity prices we expect to see in 2021. |
7
FUND BASICS
Goldman Sachs MLP Energy Infrastructure Fund
as of November 30, 2020
| TOP TEN HOLDINGS AS OF 11/30/201 | ||||||||
| Holding | % of Net Assets | Line of Business | ||||||
| Enterprise Products Partners LP | 10.5 | % | Pipeline Transportation | Natural Gas | |||||
| MPLX LP | 9.5 | Gathering + Processing | ||||||
| Magellan Midstream Partners LP | 8.8 | Pipeline Transportation | Petroleum | ||||||
| Energy Transfer LP | 7.1 | Pipeline Transportation | Natural Gas | ||||||
| Plains All American Pipeline LP | 6.6 | Pipeline Transportation | Petroleum | ||||||
| ONEOK, Inc. | 5.7 | Gathering + Processing | ||||||
| The Williams Cos., Inc. | 5.5 | Gathering + Processing | ||||||
| Targa Resources Corp. | 5.4 | Gathering + Processing | ||||||
| Cheniere Energy, Inc. | 4.7 | Other | Liquefaction | ||||||
| Pembina Pipeline Corp. | 2.9 | Pipeline Transportation | Petroleum | ||||||
| 1 | The top 10 holdings may not be representative of the Fund’s future investments. |
| FUND SECTOR ALLOCATIONS2 |
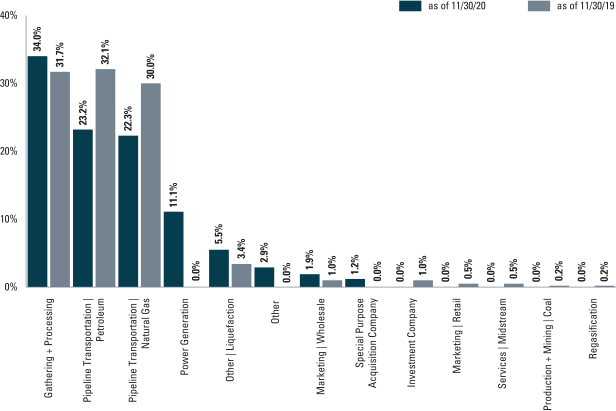
| 2 | The Fund is actively managed and, as such, its composition may differ over time. Consequently, the Fund’s overall sector allocations may differ from the percentages contained in the graph above. The percentage shown for each investment category reflects the value of investments in that category as a percentage of total net assets. The graph depicts the Fund’s investments but may not represent the Fund’s market exposure due to the exclusion of certain derivatives, if any, as listed in the Additional Investment Information section of the Schedule of Investments. |
For more information about your Fund, please refer to www.GSAMFUNDS.com. There, you can learn more about your Fund’s investment strategies, holdings, and performance.
8
FUND BASICS
Index Definitions
The Alerian MLP Index is a composite of the 50 most prominent energy master limited partnerships calculated by Standard & Poor’s using a float-adjusted market capitalization methodology. The Alerian MLP Index is disseminated by the New York Stock Exchange real-time on a price return basis (NYSE: AMZ). The corresponding total return index is calculated and disseminated daily through ticker AMZX. The Alerian MLP Index figures do not reflect any deduction for fees, expenses or taxes. It is not possible to invest directly in an index.
9
GOLDMAN SACHS MLP ENERGY INFRASTRUCTURE FUND
Performance Summary
November 30, 2020
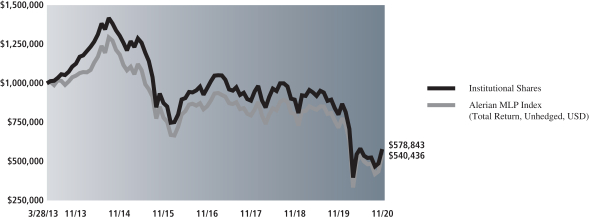
The following graph shows the value, as of November 30, 2020, of a $1,000,000 investment made on March 28, 2013 (commencement of operations) in Institutional Shares at NAV. For comparative purposes, the performance of the Fund’s benchmark, the Alerian MLP Index (Total Return, Unhedged, USD) is shown. Performance reflects applicable fee waivers and/or expense limitations in effect during the periods shown and in their absence, performance would be reduced. Returns do not reflect the deduction of taxes that a shareholder would pay on Fund distributions or the redemption of Fund shares. The returns set forth below represent past performance. Past performance does not guarantee future results. The Fund’s investment return and principal value will fluctuate so that an investor’s shares, when redeemed, may be worth more or less than their original cost. Current performance may be lower or higher than the performance quoted below. Please visit our website at www.GSAMFUNDS.com to obtain the most recent month-end returns.
| MLP Energy Infrastructure Fund’s Lifetime Performance |
Performance of a $1,000,000 investment, with distributions reinvested, from March 28, 2013 through November 30, 2020.
| Average Annual Total Return through November 30, 2020* | One Year | Five Years | Since Inception | |||||||
| Class A (Commenced March 28, 2013) |
||||||||||
| Excluding sales charges |
-27.84% | -8.26% | -7.23% | |||||||
| Including sales charges |
-31.75% | -9.28% | -7.91% | |||||||
|
| ||||||||||
| Class C (Commenced March 28, 2013) |
||||||||||
| Excluding contingent deferred sales charges |
-28.33% | -8.90% | -7.89% | |||||||
| Including contingent deferred sales charges |
-28.55% | -8.90% | -7.89% | |||||||
|
| ||||||||||
| Institutional (Commenced March 28, 2013) |
-27.48% | -7.89% | -6.87% | |||||||
|
| ||||||||||
| Investor (Commenced March 28, 2013) |
-27.56% | -8.00% | -6.99% | |||||||
|
| ||||||||||
| Class R6 (Commenced April 2, 2018) |
-27.61% | N/A | -12.85% | |||||||
|
| ||||||||||
| Class R (Commenced March 28, 2013) |
-28.12% | -8.47% | -7.46% | |||||||
|
| ||||||||||
| Class P (Commenced April 16, 2018) |
-27.55% | N/A | -15.53% | |||||||
|
| ||||||||||
| * | These returns assume reinvestment of all distributions at NAV and reflect a maximum initial sales charge of 5.50% for Class A Shares and the assumed contingent deferred sales charge for Class C Shares (1% if redeemed within 12 months of purchase). Because Institutional, Investor, Class R6, Class R and Class P Shares do not involve a sales charge, such a charge is not applied to their Average Annual Total Return. |
10
GOLDMAN SACHS MLP ENERGY INFRASTRUCTURE FUND
November 30, 2020
| Shares | Description | Value |
||||||
| Common Stocks – 100.9% | ||||||||
| Gathering + Processing – 34.0% | ||||||||
| 1,845,367 | Antero Midstream Corp. | $ | 12,437,774 | |||||
| 842,915 | Crestwood Equity Partners LP | 13,747,944 | ||||||
| 1,558,299 | DCP Midstream LP | 25,166,529 | ||||||
| 4,451,327 | MPLX LP | 93,655,920 | ||||||
| 1,558,588 | ONEOK, Inc. | 55,906,551 | ||||||
| 2,274,291 | Targa Resources Corp. | 53,445,838 | ||||||
| 2,568,553 | The Williams Cos., Inc. | 53,888,242 | ||||||
| 1,994,992 | Western Midstream Partners LP | 25,735,397 | ||||||
|
|
|
|||||||
| 333,984,195 | ||||||||
|
|
|
|||||||
| Marketing | Wholesale – 1.9% | ||||||||
| 673,310 | Sunoco LP | 18,711,285 | ||||||
|
|
|
|||||||
| Other – 2.9% | ||||||||
| 69,326 | American Water Works Co., Inc. | 10,633,222 | ||||||
| 269,324 | Darling Ingredients, Inc.* | 13,002,963 | ||||||
| 26,235 | Vestas Wind Systems A/S | 5,347,046 | ||||||
|
|
|
|||||||
| 28,983,231 | ||||||||
|
|
|
|||||||
| Other | Liquefaction – 5.5% | ||||||||
| 126,682 | Cheniere Energy Partners LP | 4,826,584 | ||||||
| 817,947 | Cheniere Energy, Inc.* | 46,369,415 | ||||||
| 61,844 | New Fortress Energy, Inc. | 2,666,095 | ||||||
|
|
|
|||||||
| 53,862,094 | ||||||||
|
|
|
|||||||
| Pipeline Transportation | Natural Gas – 22.3% | ||||||||
| 11,321,582 | Energy Transfer LP | 69,967,377 | ||||||
| 5,336,605 | Enterprise Products Partners LP | 103,530,137 | ||||||
| 633,409 | Equitrans Midstream Corp. | 5,168,617 | ||||||
| 718,197 | Kinder Morgan, Inc. | 10,327,673 | ||||||
| 448,873 | TC Energy Corp. | 19,718,991 | ||||||
| 329,173 | TC PipeLines LP | 10,171,446 | ||||||
|
|
|
|||||||
| 218,884,241 | ||||||||
|
|
|
|||||||
| Pipeline Transportation | Petroleum – 23.2% | ||||||||
| 797,997 | Enbridge, Inc. | 24,905,486 | ||||||
| 184,536 | Holly Energy Partners LP | 2,498,617 | ||||||
| 2,094,742 | Magellan Midstream Partners LP | 86,198,633 | ||||||
| 1,060,009 | NuStar Energy LP | 14,087,520 | ||||||
| 702,021 | PBF Logistics LP | 6,549,856 | ||||||
| 1,134,652 | Pembina Pipeline Corp. | 28,922,280 | ||||||
| 8,204,406 | Plains All American Pipeline LP | 65,142,984 | ||||||
|
|
|
|||||||
| 228,305,376 | ||||||||
|
|
|
|||||||
| Power Generation – 11.1% | ||||||||
| 453,860 | Atlantica Sustainable Infrastructure PLC | 15,608,245 | ||||||
| 170,571 | Boralex, Inc. Class A | 5,390,186 | ||||||
| 127,430 | CMS Energy Corp. | 7,842,042 | ||||||
| 110,224 | Duke Energy Corp. | 10,213,356 | ||||||
| 60,349 | Eversource Energy | 5,281,141 | ||||||
| 129,674 | National Grid PLC ADR | 7,349,922 | ||||||
| 209,474 | NextEra Energy Partners LP | 13,295,315 | ||||||
| 176,557 | NextEra Energy, Inc. | 12,992,830 | ||||||
| 319,946 | Northland Power, Inc. | 10,965,424 | ||||||
| 27,482 | Orsted A/S(a) | 4,944,744 | ||||||
|
|
|
|||||||
| Common Stocks – (continued) | ||||||||
| Power Generation – (continued) | ||||||||
| 250,371 | The AES Corp. | 5,117,583 | ||||||
| 155,609 | Xcel Energy, Inc. | 10,481,822 | ||||||
|
|
|
|||||||
| 109,482,610 | ||||||||
|
|
|
|||||||
| TOTAL COMMON STOCKS | ||||||||
| (Cost $1,319,528,405) | $ | 992,213,032 | ||||||
|
|
|
|||||||
| Units | Description | Value | ||||||
| Special Purpose Acquisition Company*(b) – 1.2% | ||||||||
| 1,135,900 | Rice Acquisition Corp. | $ | 11,767,924 | |||||
| (Cost $11,359,000) | ||||||||
|
|
|
|||||||
| TOTAL INVESTMENTS – 102.1% |
||||||||
| (Cost $1,330,887,405) | $ | 1,003,980,956 | ||||||
|
|
|
|||||||
| |
LIABILITIES IN EXCESS OF OTHER ASSETS – (2.1)% |
(20,764,120 | ) | |||||
|
|
|
|||||||
| NET ASSETS – 100.0% | $ | 983,216,836 | ||||||
|
|
|
|||||||
| The percentage shown for each investment category reflects the value of investments in that category as a percentage of net assets. | ||
| * |
Non-income producing security. | |
| (a) |
Exempt from registration under Rule 144A of the Securities Act of 1933. | |
| (b) |
Units consist of 1 share of common stock and 1/2 warrant. | |
|
| ||||
| Investment Abbreviations: | ||||
| ADR |
—American Depositary Receipt | |||
| LP |
—Limited Partnership | |||
| PLC |
—Public Limited Company | |||
|
| ||||
| The accompanying notes are an integral part of these financial statements. | 11 |
GOLDMAN SACHS MLP ENERGY INFRASTRUCTURE FUND
Schedule of Investments (continued)
November 30, 2020
| ADDITIONAL INVESTMENT INFORMATION |
PURCHASED AND WRITTEN OPTIONS CONTRACTS — At November 30, 2020, the Fund had the following purchased and written options:
EXCHANGE TRADED OPTIONS ON EQUITIES CONTRACTS
| Description | Exercise Price |
Expiration Date |
Number of Contracts |
Notional Amount |
Market Value |
Premiums Paid (Received) by Fund |
Unrealized Appreciation/ (Depreciation) |
|||||||||||||||||||||
| Purchased option contracts |
|
|||||||||||||||||||||||||||
| Calls |
|
|||||||||||||||||||||||||||
| Phillips 66 Partners LP FLEX |
$ | 27.500 | 03/19/2021 | 3,750 | $ | 375,000 | $ | 857,891 | $ | 626,250 | $ | 231,641 | ||||||||||||||||
| Phillips 66 Partners LP FLEX |
27.500 | 06/18/2021 | 3,750 | 375,000 | 1,095,908 | 881,625 | 214,283 | |||||||||||||||||||||
| Total purchased options |
|
7,500 | $ | 750,000 | $ | 1,953,799 | $ | 1,507,875 | $ | 445,924 | ||||||||||||||||||
| Description | Exercise Price |
Expiration Date |
Number of Contracts |
Notional Amount |
Market Value |
Premiums Paid (Received) by Fund |
Unrealized Appreciation/ (Depreciation) |
|||||||||||||||||||||||
| Written option contracts |
|
|||||||||||||||||||||||||||||
| Calls |
|
|||||||||||||||||||||||||||||
| Phillips 66 Partners LP |
$ | 35.000 | 06/18/2021 | (3,750 | ) | $ | (375,000 | ) | $ | (496,875 | ) | $ | (367,500 | ) | $ | (129,375 | ) | |||||||||||||
| Phillips 66 Partners LP |
35.000 | 03/19/2021 | (3,750 | ) | (375,000 | ) | (234,375 | ) | (146,250 | ) | (88,125 | ) | ||||||||||||||||||
| Total written options | (7,500 | ) | $ | (750,000 | ) | $ | (731,250 | ) | $ | (513,750 | ) | $ | (217,500 | ) | ||||||||||||||||
| Total | $ | 1,222,549 | $ | 994,125 | $ | 228,424 | ||||||||||||||||||||||||
| 12 | The accompanying notes are an integral part of these financial statements. |
GOLDMAN SACHS MLP ENERGY INFRASTRUCTURE FUND
Statement of Assets and Liabilities
November 30, 2020
|
|
||||||
| Assets: | ||||||
| Investments of unaffiliated issuers, at value (cost $1,330,887,405) |
$ | 1,003,980,956 | ||||
| Purchased options, at value (premium paid $1,507,875) |
1,953,799 | |||||
| Cash |
1,395,226 | |||||
| Foreign currencies, at value (cost $137,923) |
137,901 | |||||
| Receivables: |
||||||
| Fund shares sold |
2,585,968 | |||||
| Due from broker |
2,386,913 | |||||
| Dividends |
1,256,005 | |||||
| Investments sold |
1,150,503 | |||||
| Collateral on options contracts |
261,062 | |||||
| Reimbursement from investment adviser |
111,532 | |||||
| Other assets |
22,415 | |||||
| Total assets | 1,015,242,280 | |||||
| Liabilities: | ||||||
| Written option contracts, at value (premium received $513,750) |
731,250 | |||||
| Payables: |
||||||
| Current Tax liability |
17,251,712 | |||||
| Fund shares redeemed |
3,243,291 | |||||
| Investments purchased |
978,170 | |||||
| Management fees |
760,844 | |||||
| Distribution and service fees and transfer agent fees |
61,121 | |||||
| Deferred taxes, net |
8,415,897 | |||||
| Accrued expenses |
583,159 | |||||
| Total liabilities | 32,025,444 | |||||
| Net Assets: | ||||||
| Paid-in capital |
2,521,500,372 | |||||
| Total distributable earnings (loss) |
(1,538,283,536 | ) | ||||
| NET ASSETS | $ | 983,216,836 | ||||
| Net Assets: |
||||||
| Class A |
$ | 34,023,509 | ||||
| Class C |
24,897,466 | |||||
| Institutional |
182,235,854 | |||||
| Investor |
32,395,629 | |||||
| Class R6 |
181,968,440 | |||||
| Class R |
795,723 | |||||
| Class P |
526,900,215 | |||||
| Total Net Assets |
$ | 983,216,836 | ||||
| Shares Outstanding $0.001 par value (unlimited shares authorized): |
||||||
| Class A |
1,983,839 | |||||
| Class C |
1,567,480 | |||||
| Institutional |
10,213,406 | |||||
| Investor |
1,840,329 | |||||
| Class R6 |
10,187,380 | |||||
| Class R |
47,583 | |||||
| Class P |
29,423,040 | |||||
| Net asset value, offering and redemption price per share:(a) |
||||||
| Class A |
$17.15 | |||||
| Class C |
15.88 | |||||
| Institutional |
17.84 | |||||
| Investor |
17.60 | |||||
| Class R6 |
17.86 | |||||
| Class R |
16.72 | |||||
| Class P |
17.91 | |||||
| (a) | Maximum public offering price per share for Class A Shares is $18.15. At redemption, Class C Shares may be subject to a contingent deferred sales charge, assessed on the amount equal to the lesser of the current net asset value or the original purchase price of the shares. |
| The accompanying notes are an integral part of these financial statements. | 13 |
GOLDMAN SACHS MLP ENERGY INFRASTRUCTURE FUND
Statement of Operations
For the Fiscal Year Ended November 30, 2020
|
|
||||||
| Investment income: | ||||||
| Dividends — unaffiliated issuers (net of tax withholding of $861,054) |
$ | 98,039,646 | ||||
| Dividends — affiliated issuers |
39,038 | |||||
| Less: Return of Capital on Dividends |
(90,787,356 | ) | ||||
| Interest |
58,835 | |||||
| Total investment income | 7,350,163 | |||||
| Expenses: | ||||||
| Management fees |
10,607,099 | |||||
| Transfer Agency fees(a) |
525,917 | |||||
| Professional fees |
466,281 | |||||
| Distribution and Service (12b-1)fees(a) |
363,576 | |||||
| Franchise tax expense |
227,551 | |||||
| Registration fees |
163,125 | |||||
| Custody, accounting and administrative services |
147,754 | |||||
| Printing and mailing costs |
147,282 | |||||
| Service Share fees — Class C |
85,962 | |||||
| Trustee fees |
21,513 | |||||
| Other |
21,014 | |||||
| Total operating expenses, before taxes | 12,777,074 | |||||
| Less — expense reductions |
(287,087 | ) | ||||
| Net operating expenses, before taxes | 12,489,987 | |||||
| NET INVESTMENT LOSS, BEFORE TAXES | (5,139,824 | ) | ||||
| Current and deferred tax expense | (139,064 | ) | ||||
| NET INVESTMENT LOSS, NET OF TAXES | (5,278,888 | ) | ||||
| Realized and unrealized gain (loss): | ||||||
| Net realized gain (loss) from: |
||||||
| Investments — unaffiliated issuers |
(520,453,207 | ) | ||||
| Foreign currency transactions |
43,710 | |||||
| Current and deferred tax expense |
(14,080,343 | ) | ||||
| Net change in unrealized gain (loss) on: |
||||||
| Investments — unaffiliated issuers |
75,974,862 | |||||
| Purchased options |
445,924 | |||||
| Written options |
(217,500 | ) | ||||
| Foreign currency translation |
5,438 | |||||
| Deferred tax benefit |
2,061,924 | |||||
| Net realized and unrealized loss, net of taxes | (456,219,192 | ) | ||||
| NET DECREASE IN NET ASSETS RESULTING FROM OPERATIONS | $ | (461,498,080 | ) | |||
| (a) | Class specific Distribution and/or Service (12b-1) and Transfer Agent fees were as follows: |
| Distribution and/or (12b-1) Service Fees | Transfer Agent Fees | |||||||||||||||||||||||||||||||||||
| Class A |
Class C |
Class R |
Class A |
Class C |
Institutional |
Investor |
Class R6 |
Class R |
Class P |
|||||||||||||||||||||||||||
| $101,330 | $ | 257,887 | $ | 4,359 | $ | 68,906 | $ | 58,454 | $ | 100,392 | $ | 86,230 | $ | 46,843 | $ | 1,482 | $ | 163,610 | ||||||||||||||||||
| 14 | The accompanying notes are an integral part of these financial statements. |
GOLDMAN SACHS MLP ENERGY INFRASTRUCTURE FUND
Statements of Changes in Net Assets
| For the Fiscal Year Ended November 30, 2020 |
For the Fiscal Year Ended November 30, 2019 |
|||||||||
| From operations: | ||||||||||
| Net investment loss, net of taxes |
$ | (5,278,888 | ) | $ | (14,172,362 | ) | ||||
| Net realized loss, net of taxes |
(534,489,840 | ) | (32,745,401 | ) | ||||||
| Net change in unrealized gain (loss), net of taxes |
78,270,648 | (188,225,976 | ) | |||||||
| Net decrease in net assets resulting from operations | (461,498,080 | ) | (235,143,739 | ) | ||||||
| Distributions to shareholders: | ||||||||||
| From distributable earnings |
||||||||||
| Class A Shares |
— | (381,978 | ) | |||||||
| Class C Shares |
— | (390,185 | ) | |||||||
| Institutional Shares |
— | (2,761,431 | ) | |||||||
| Investor Shares |
— | (581,787 | ) | |||||||
| Class R6 Shares |
— | (751,716 | ) | |||||||
| Class R Shares |
— | (10,186 | ) | |||||||
| Class P Shares |
— | (4,774,138 | ) | |||||||
| From return of capital |
||||||||||
| Class A Shares |
(3,740,013 | ) | (5,911,900 | ) | ||||||
| Class C Shares |
(3,271,090 | ) | (6,038,926 | ) | ||||||
| Institutional Shares |
(21,684,266 | ) | (42,738,912 | ) | ||||||
| Investor Shares |
(4,311,050 | ) | (9,004,374 | ) | ||||||
| Class R6 Shares |
(14,964,119 | ) | (11,634,374 | ) | ||||||
| Class R Shares |
(83,728 | ) | (157,655 | ) | ||||||
| Class P Shares |
(49,952,163 | ) | (73,889,763 | ) | ||||||
| Total distributions to shareholders | (98,006,429 | ) | (159,027,325 | ) | ||||||
| From share transactions: | ||||||||||
| Proceeds from sales of shares |
969,598,587 | 917,467,591 | ||||||||
| Reinvestment of distributions |
91,996,502 | 150,234,567 | ||||||||
| Cost of shares redeemed |
(1,247,880,583 | ) | (1,206,522,397 | ) | ||||||
| Net decrease in net assets resulting from share transactions | (186,285,494 | ) | (138,820,239 | ) | ||||||
| TOTAL DECREASE | (745,790,003 | ) | (532,991,303 | ) | ||||||
| Net assets: | ||||||||||
| Beginning of year |
1,729,006,839 | 2,261,998,142 | ||||||||
| End of year |
$ | 983,216,836 | $ | 1,729,006,839 | ||||||
| The accompanying notes are an integral part of these financial statements. | 15 |
GOLDMAN SACHS MLP ENERGY INFRASTRUCTURE FUND
Selected Share Data for a Share Outstanding Throughout the Year
| Goldman Sachs MLP Energy Infrastructure Fund | ||||||||||||||||||||||
| Class A Shares | ||||||||||||||||||||||
| Year Ended November 30, | ||||||||||||||||||||||
| 2020 | 2019 | 2018 | 2017 | 2016 | ||||||||||||||||||
| Per Share Data* | ||||||||||||||||||||||
| Net asset value, beginning of year |
$ | 26.10 | $ | 31.90 | $ | 34.00 | $ | 39.40 | $ | 38.10 | ||||||||||||
| Net investment income (loss)(a) |
(0.15 | ) | (0.30 | ) | (0.10 | ) | (0.35 | ) | (0.30 | ) | ||||||||||||
| Net realized and unrealized gain (loss) |
(7.86 | ) | (3.00 | ) | 0.35 | (2.85 | ) | 4.00 | ||||||||||||||
| Total from investment operations |
(8.01 | ) | (3.30 | ) | 0.25 | (3.20 | ) | 3.70 | ||||||||||||||
| Distributions to shareholders from net investment income |
— | (0.15 | ) | (0.80 | ) | (0.25 | ) | — | ||||||||||||||
| Distributions to shareholders from return of capital |
(0.94 | ) | (2.35 | ) | (1.55 | ) | (1.95 | ) | (2.40 | ) | ||||||||||||
| Total distributions |
(0.94 | ) | (2.50 | ) | (2.35 | ) | (2.20 | ) | (2.40 | ) | ||||||||||||
| Net asset value, end of year |
$ | 17.15 | $ | 26.10 | $ | 31.90 | $ | 34.00 | $ | 39.40 | ||||||||||||
| Total return(b) | (27.83 | )% | (11.06 | )% | 0.23 | % | (8.35 | )% | 10.23 | % | ||||||||||||
| Net assets, end of year (in 000s) |
$ | 34,024 | $ | 60,112 | $ | 95,120 | $ | 115,467 | $ | 289,689 | ||||||||||||
| Ratio of total expenses to average net assets after tax (benefit)/expense(c) |
2.64 | % | 1.67 | % | 1.67 | % | 1.52 | % | 1.45 | % | ||||||||||||
| Ratio of net expenses to average net assets after tax (benefit)/expense(c) |
2.61 | % | 1.67 | % | 1.67 | % | 1.52 | % | 1.45 | % | ||||||||||||
| Ratio of net expenses to average net assets before tax (benefit)/expense |
1.49 | % | 1.44 | % | 1.40 | % | 1.42 | % | 1.45 | % | ||||||||||||
| Ratio of net investment loss to average net assets(d) |
(0.81 | )% | (1.02 | )% | (0.34 | )% | (0.85 | )% | (0.87 | )% | ||||||||||||
| Portfolio turnover rate(e) |
139 | % | 51 | % | 68 | % | 42 | % | 104 | % | ||||||||||||
| * | On June 5, 2020, the Fund effected a 5-for-1 reverse share split. All per share data prior to June 5, 2020 has been adjusted to reflect the reverse share split. |
| (a) | Calculated based on the average shares outstanding methodology. |
| (b) | Assumes investment at the NAV at the beginning of the year, reinvestment of all dividends and distributions, a complete redemption of the investment at the NAV at the end of the year and no sales or redemption charges (if any). Total returns would be reduced if a sales or redemption charge was taken into account. Returns do not reflect the impact of taxes to shareholders relating to Fund distributions or the redemption of Fund shares. |
| (c) | Current and deferred tax expense/benefit for the ratio calculation is derived from the net investment income (loss), and realized and unrealized gains (losses). |
| (d) | Current and deferred tax benefit for the ratio calculation is derived from net investment income (loss) only. |
| (e) | The Fund’s portfolio turnover rate is calculated in accordance with regulatory requirements, without regard to transactions involving short term investments and certain derivatives. If such transactions were included, the Fund’s portfolio turnover rate may be higher. |
| 16 | The accompanying notes are an integral part of these financial statements. |
GOLDMAN SACHS MLP ENERGY INFRASTRUCTURE FUND
Financial Highlights (continued)
Selected Share Data for a Share Outstanding Throughout the Year
| Goldman Sachs MLP Energy Infrastructure Fund | ||||||||||||||||||||||
| Class C Shares | ||||||||||||||||||||||
| Year Ended November 30, | ||||||||||||||||||||||
| 2020 | 2019 | 2018 | 2017 | 2016 | ||||||||||||||||||
| Per Share Data* | ||||||||||||||||||||||
| Net asset value, beginning of year |
$ | 24.55 | $ | 30.35 | $ | 32.70 | $ | 38.25 | $ | 37.30 | ||||||||||||
| Net investment loss(a) |
(0.29 | ) | (0.50 | ) | (0.35 | ) | (0.60 | ) | (0.60 | ) | ||||||||||||
| Net realized and unrealized gain (loss) |
(7.44 | ) | (2.80 | ) | 0.35 | (2.75 | ) | 3.95 | ||||||||||||||
| Total from investment operations |
(7.73 | ) | (3.30 | ) | — | (3.35 | ) | 3.35 | ||||||||||||||
| Distributions to shareholders from net investment income |
— | (0.15 | ) | (0.80 | ) | (0.25 | ) | — | ||||||||||||||
| Distributions to shareholders from return of capital |
|
(0.94 |
) |
(2.35 | ) | (1.55 | ) | (1.95 | ) | (2.40 | ) | |||||||||||
| Total distributions |
(0.94 | ) | (2.50 | ) | (2.35 | ) | (2.20 | ) | (2.40 | ) | ||||||||||||
| Net asset value, end of year |
$ | 15.88 | $ | 24.55 | $ | 30.35 | $ | 32.70 | $ | 38.25 | ||||||||||||
| Total return(b) | (28.47 | )% | (11.64 | )% | (0.38 | )% | (9.15 | )% | 9.49 | % | ||||||||||||
| Net assets, end of year (in 000s) |
$ | 24,897 | $ | 58,044 | $ | 92,201 | $ | 124,291 | $ | 170,575 | ||||||||||||
| Ratio of total expenses to average net assets after tax (benefit)/expense(c) |
3.39 | % | 2.42 | % | 2.44 | % | 2.28 | % | 2.20 | % | ||||||||||||
| Ratio of net expenses to average net assets after tax (benefit)/expense(c) |
3.37 | % | 2.42 | % | 2.44 | % | 2.28 | % | 2.20 | % | ||||||||||||
| Ratio of net expenses to average net assets before tax (benefit)/expense |
2.24 | % | 2.19 | % | 2.15 | % | 2.17 | % | 2.21 | % | ||||||||||||
| Ratio of net investment loss to average net assets(d) |
(1.63 | )% | (1.77 | )% | (1.06 | )% | (1.60 | )% | (1.63 | )% | ||||||||||||
| Portfolio turnover rate(e) |
139 | % | 51 | % | 68 | % | 42 | % | 104 | % | ||||||||||||
| * | On June 5, 2020, the Fund effected a 5-for-1 reverse share split. All per share data prior to June 5, 2020 has been adjusted to reflect the reverse share split. |
| (a) | Calculated based on the average shares outstanding methodology. |
| (b) | Assumes investment at the NAV at the beginning of the year, reinvestment of all dividends and distributions, a complete redemption of the investment at the NAV at the end of the year and no sales or redemption charges (if any). Total returns would be reduced if a sales or redemption charge was taken into account. Returns do not reflect the impact of taxes to shareholders relating to Fund distributions or the redemption of Fund shares. |
| (c) | Current and deferred tax expense/benefit for the ratio calculation is derived from the net investment income (loss), and realized and unrealized gains (losses). |
| (d) | Current and deferred tax benefit for the ratio calculation is derived from net investment income (loss) only. |
| (e) | The Fund’s portfolio turnover rate is calculated in accordance with regulatory requirements, without regard to transactions involving short term investments and certain derivatives. If such transactions were included, the Fund’s portfolio turnover rate may be higher. |
| The accompanying notes are an integral part of these financial statements. | 17 |
GOLDMAN SACHS MLP ENERGY INFRASTRUCTURE FUND
Financial Highlights (continued)
Selected Share Data for a Share Outstanding Throughout the Year
| Goldman Sachs MLP Energy Infrastructure Fund | ||||||||||||||||||||||
| Institutional Shares | ||||||||||||||||||||||
| Year Ended November 30, | ||||||||||||||||||||||
| 2020 | 2019 | 2018 | 2017 | 2016 | ||||||||||||||||||
| Per Share Data* | ||||||||||||||||||||||
| Net asset value, beginning of year |
$ | 26.95 | $ | 32.75 | $ | 34.75 | $ | 40.10 | $ | 38.50 | ||||||||||||
| Net investment income (loss)(a) |
(0.11 | ) | (0.20 | ) | 0.10 | (0.15 | ) | (0.25 | ) | |||||||||||||
| Net realized and unrealized gain (loss) |
(8.06 | ) | (3.10 | ) | 0.25 | (3.00 | ) | 4.25 | ||||||||||||||
| Total from investment operations |
(8.17 | ) | (3.30 | ) | 0.35 | (3.15 | ) | 4.00 | ||||||||||||||
| Distributions to shareholders from net investment income |
— | (0.15 | ) | (0.80 | ) | (0.25 | ) | — | ||||||||||||||
| Distributions to shareholders from return of capital |
(0.94 | ) | (2.35 | ) | (1.55 | ) | (1.95 | ) | (2.40 | ) | ||||||||||||
| Total distributions |
(0.94 | ) | (2.50 | ) | (2.35 | ) | (2.20 | ) | (2.40 | ) | ||||||||||||
| Net asset value, end of year |
$ | 17.84 | $ | 26.95 | $ | 32.75 | $ | 34.75 | $ | 40.10 | ||||||||||||
| Total return(b) | (27.54 | )% | (10.77 | )% | 0.67 | % | (8.21 | )% | 10.92 | % | ||||||||||||
| Net assets, end of year (in 000s) |
$ | 182,236 | $ | 502,633 | $ | 651,132 | $ | 1,711,829 | $ | 1,830,614 | ||||||||||||
| Ratio of total expenses to average net assets after tax (benefit)/expense(c) |
2.25 | % | 1.28 | % | 1.43 | % | 1.14 | % | 1.05 | % | ||||||||||||
| Ratio of net expenses to average net assets after tax (benefit)/expense(c) |
2.22 | % | 1.28 | % | 1.43 | % | 1.14 | % | 1.05 | % | ||||||||||||
| Ratio of net expenses to average net assets before tax (benefit)/expense |
1.10 | % | 1.05 | % | 1.01 | % | 1.03 | % | 1.05 | % | ||||||||||||
| Ratio of net investment loss to average net assets(d) |
(0.56 | )% | (0.61 | )% | 0.34 | % | (0.42 | )% | (0.69 | )% | ||||||||||||
| Portfolio turnover rate(e) |
139 | % | 51 | % | 68 | % | 42 | % | 104 | % | ||||||||||||
| * | On June 5, 2020, the Fund effected a 5-for-1 reverse share split. All per share data prior to June 5, 2020 has been adjusted to reflect the reverse share split. |
| (a) | Calculated based on the average shares outstanding methodology. |
| (b) | Assumes investment at the NAV at the beginning of the year, reinvestment of all dividends and distributions, a complete redemption of the investment at the NAV at the end of the year and no sales or redemption charges (if any). Total returns would be reduced if a sales or redemption charge was taken into account. Returns do not reflect the impact of taxes to shareholders relating to Fund distributions or the redemption of Fund shares. |
| (c) | Current and deferred tax expense/benefit for the ratio calculation is derived from the net investment income (loss), and realized and unrealized gains (losses). |
| (d) | Current and deferred tax benefit for the ratio calculation is derived from net investment income (loss) only. |
| (e) | The Fund’s portfolio turnover rate is calculated in accordance with regulatory requirements, without regard to transactions involving short term investments and certain derivatives. If such transactions were included, the Fund’s portfolio turnover rate may be higher. |
| 18 | The accompanying notes are an integral part of these financial statements. |
GOLDMAN SACHS MLP ENERGY INFRASTRUCTURE FUND
Financial Highlights (continued)
Selected Share Data for a Share Outstanding Throughout the Year
| Goldman Sachs MLP Energy Infrastructure Fund | ||||||||||||||||||||||
| Investor Shares | ||||||||||||||||||||||
| Year Ended November 30, | ||||||||||||||||||||||
| 2020 | 2019 | 2018 | 2017 | 2016 | ||||||||||||||||||
| Per Share Data* | ||||||||||||||||||||||
| Net asset value, beginning of year |
$ | 26.65 | $ | 32.50 | $ | 34.50 | $ | 39.85 | $ | 38.35 | ||||||||||||
| Net investment income (loss)(a) |
(0.15 | ) | (0.25 | ) | (0.05 | ) | (0.25 | ) | (0.20 | ) | ||||||||||||
| Net realized and unrealized gain (loss) |
(7.96 | ) | (3.10 | ) | 0.40 | (2.90 | ) | 4.10 | ||||||||||||||
| Total from investment operations |
(8.11 | ) | (3.35 | ) | 0.35 | (3.15 | ) | 3.90 | ||||||||||||||
| Distributions to shareholders from net investment income |
— | (0.15 | ) | (0.80 | ) | (0.25 | ) | — | ||||||||||||||
| Distributions to shareholders from return of capital |
(0.94 | ) | (2.35 | ) | (1.55 | ) | (1.95 | ) | (2.40 | ) | ||||||||||||
| Total distributions |
(0.94 | ) | (2.50 | ) | (2.35 | ) | (2.20 | ) | (2.40 | ) | ||||||||||||
| Net asset value, end of year |
$ | 17.60 | $ | 26.65 | $ | 32.50 | $ | 34.50 | $ | 39.85 | ||||||||||||
| Total return(b) | (27.63 | )% | (11.01 | )% | 0.68 | % | (8.26 | )% | 10.69 | % | ||||||||||||
| Net assets, end of year (in 000s) |
$ | 32,396 | $ | 98,506 | $ | 142,664 | $ | 156,974 | $ | 121,705 | ||||||||||||
| Ratio of total expenses to average net assets after tax (benefit)/expense(c) |
2.38 | % | 1.42 | % | 1.43 | % | 1.29 | % | 1.20 | % | ||||||||||||
| Ratio of net expenses to average net assets after tax (benefit)/expense(c) |
2.36 | % | 1.42 | % | 1.43 | % | 1.29 | % | 1.20 | % | ||||||||||||
| Ratio of net expenses to average net assets before tax (benefit)/expense |
1.23 | % | 1.19 | % | 1.15 | % | 1.17 | % | 1.20 | % | ||||||||||||
| Ratio of net investment loss to average net assets(d) |
(0.73 | )% | (0.77 | )% | (0.07 | )% | (0.63 | )% | (0.60 | )% | ||||||||||||
| Portfolio turnover rate(e) |
139 | % | 51 | % | 68 | % | 42 | % | 104 | % | ||||||||||||
| * | On June 5, 2020, the Fund effected a 5-for-1 reverse share split. All per share data prior to June 5, 2020 has been adjusted to reflect the reverse share split. |
| (a) | Calculated based on the average shares outstanding methodology. |
| (b) | Assumes investment at the NAV at the beginning of the year, reinvestment of all dividends and distributions, a complete redemption of the investment at the NAV at the end of the year and no sales or redemption charges (if any). Total returns would be reduced if a sales or redemption charge was taken into account. Returns do not reflect the impact of taxes to shareholders relating to Fund distributions or the redemption of Fund shares. |
| (c) | Current and deferred tax expense/benefit for the ratio calculation is derived from the net investment income (loss), and realized and unrealized gains (losses). |
| (d) | Current and deferred tax benefit for the ratio calculation is derived from net investment income (loss) only. |
| (e) | The Fund’s portfolio turnover rate is calculated in accordance with regulatory requirements, without regard to transactions involving short term investments and certain derivatives. If such transactions were included, the Fund’s portfolio turnover rate may be higher. |
| The accompanying notes are an integral part of these financial statements. | 19 |
GOLDMAN SACHS MLP ENERGY INFRASTRUCTURE FUND
Financial Highlights (continued)
Selected Share Data for a Share Outstanding Throughout Each Period
| Goldman Sachs MLP Energy Infrastructure Fund | ||||||||||||||
| Class R6 Shares | ||||||||||||||
| Year Ended November 30, | Period Ended November 30, 2018(a) |
|||||||||||||
| 2020 | 2019 | |||||||||||||
| Per Share Data* | ||||||||||||||
| Net asset value, beginning of period |
$ | 27.00 | $ | 32.75 | $ | 32.15 | ||||||||
| Net investment income (loss)(b) |
(0.05 | ) | (0.20 | ) | (0.10 | ) | ||||||||
| Net realized and unrealized gain (loss) |
(8.15 | ) | (3.05 | ) | 2.50 | |||||||||
| Total from investment operations |
(8.20 | ) | (3.25 | ) | 2.40 | |||||||||
| Distributions to shareholders from net investment income |
— | (0.15 | ) | (0.65 | ) | |||||||||
| Distributions to shareholders from return of capital |
(0.94 | ) | (2.35 | ) | (1.15 | ) | ||||||||
| Total distributions |
(0.94 | ) | (2.50 | ) | (1.80 | ) | ||||||||
| Net asset value, end of period |
$ | 17.86 | $ | 27.00 | $ | 32.75 | ||||||||
| Total return(c) | (27.60 | )% | (10.60 | )% | 7.15 | % | ||||||||
| Net assets, end of period (in 000s) |
$ | 181,968 | $ | 165,252 | $ | 205,470 | ||||||||
| Ratio of total expenses to average net assets after tax (benefit)/expense(d) |
2.26 | % | 1.26 | % | 1.11 | %(e) | ||||||||
| Ratio of net expenses to average net assets after tax (benefit)/expense(d) |
2.23 | % | 1.26 | % | 1.11 | %(e) | ||||||||
| Ratio of net expenses to average net assets before tax (benefit)/expense |
1.11 | % | 1.04 | % | 1.00 | %(e) | ||||||||
| Ratio of net investment loss to average net assets(f) |
(0.29 | )% | (0.66 | )% | (0.46 | )%(e) | ||||||||
| Portfolio turnover rate(g) |
139 | % | 51 | % | 68 | % | ||||||||
| * | On June 5, 2020, the Fund effected a 5-for-1 reverse share split. All per share data prior to June 5, 2020 has been adjusted to reflect the reverse share split. |
| (a) | Commenced operations on April 2, 2018. |
| (b) | Calculated based on the average shares outstanding methodology. |
| (c) | Assumes investment at the NAV at the beginning of the period, reinvestment of all dividends and distributions, a complete redemption of the investment at the NAV at the end of the period and no sales or redemption charges (if any). Total returns would be reduced if a sales or redemption charge was taken into account. Returns do not reflect the impact of taxes to shareholders relating to Fund distributions or the redemption of Fund shares. Total returns for periods less than one full year are not annualized. |
| (d) | Current and deferred tax expense/benefit for the ratio calculation is derived from the net investment income (loss), and realized and unrealized gains (losses). |
| (e) | Annualized with the exception of tax expenses. |
| (f) | Current and deferred tax benefit for the ratio calculation is derived from net investment income (loss) only. |
| (g) | The Fund’s portfolio turnover rate is calculated in accordance with regulatory requirements, without regard to transactions involving short term investments and certain derivatives. If such transactions were included, the Fund’s portfolio turnover rate may be higher. |
| 20 | The accompanying notes are an integral part of these financial statements. |
GOLDMAN SACHS MLP ENERGY INFRASTRUCTURE FUND
Financial Highlights (continued)
Selected Share Data for a Share Outstanding Throughout the Year
| Goldman Sachs MLP Energy Infrastructure Fund | ||||||||||||||||||||||
| Class R Shares | ||||||||||||||||||||||
| Year Ended November 30, | ||||||||||||||||||||||
| 2020 | 2019 | 2018 | 2017 | 2016 | ||||||||||||||||||
| Per Share Data* | ||||||||||||||||||||||
| Net asset value, beginning of year |
$ | 25.60 | $ | 31.40 | $ | 33.55 | $ | 39.05 | $ | 37.80 | ||||||||||||
| Net investment income (loss)(a) |
(0.17 | ) | (0.40 | ) | (0.20 | ) | (0.40 | ) | (0.45 | ) | ||||||||||||
| Net realized and unrealized gain (loss) |
(7.77 | ) | (2.90 | ) | 0.40 | (2.90 | ) | 4.10 | ||||||||||||||
| Total from investment operations |
(7.94 | ) | (3.30 | ) | 0.20 | (3.30 | ) | 3.65 | ||||||||||||||
| Distributions to shareholders from net investment income |
— | (0.15 | ) | (0.80 | ) | (0.25 | ) | — | ||||||||||||||
| Distributions to shareholders from return of capital |
(0.94 | ) | (2.35 | ) | (1.55 | ) | (1.95 | ) | (2.40 | ) | ||||||||||||
| Total distributions |
(0.94 | ) | (2.50 | ) | (2.35 | ) | (2.20 | ) | (2.40 | ) | ||||||||||||
| Net asset value, end of year |
$ | 16.72 | $ | 25.60 | $ | 31.40 | $ | 33.55 | $ | 39.05 | ||||||||||||
| Total return(b) | (28.11 | )% | (11.24 | )% | 0.24 | % | (8.83 | )% | 10.18 | % | ||||||||||||
| Net assets, end of year (in 000s) |
$ | 796 | $ | 1,012 | $ | 2,254 | $ | 2,009 | $ | 2,026 | ||||||||||||
| Ratio of total expenses to average net assets after tax (benefit)/expense(c) |
2.90 | % | 1.92 | % | 1.93 | % | 1.77 | % | 1.70 | % | ||||||||||||
| Ratio of net expenses to average net assets after tax (benefit)/expense(c) |
2.87 | % | 1.92 | % | 1.93 | % | 1.77 | % | 1.70 | % | ||||||||||||
| Ratio of net expenses to average net assets before tax (benefit)/expense |
1.74 | % | 1.69 | % | 1.65 | % | 1.68 | % | 1.70 | % | ||||||||||||
| Ratio of net investment loss to average net assets(d) |
(0.94 | )% | (1.31 | )% | (0.59 | )% | (1.06 | )% | (1.23 | )% | ||||||||||||
| Portfolio turnover rate(e) |
139 | % | 51 | % | 68 | % | 42 | % | 104 | % | ||||||||||||
| * | On June 5, 2020, the Fund effected a 5-for-1 reverse share split. All per share data prior to June 5, 2020 has been adjusted to reflect the reverse share split. |
| (a) | Calculated based on the average shares outstanding methodology. |
| (b) | Assumes investment at the NAV at the beginning of the year, reinvestment of all dividends and distributions, a complete redemption of the investment at the NAV at the end of the year and no sales or redemption charges (if any). Total returns would be reduced if a sales or redemption charge was taken into account. Returns do not reflect the impact of taxes to shareholders relating to Fund distributions or the redemption of Fund shares. |
| (c) | Current and deferred tax expense/benefit for the ratio calculation is derived from the net investment income (loss), and realized and unrealized gains (losses). |
| (d) | Current and deferred tax benefit for the ratio calculation is derived from net investment income (loss) only. |
| (e) | The Fund’s portfolio turnover rate is calculated in accordance with regulatory requirements, without regard to transactions involving short term investments and certain derivatives. If such transactions were included, the Fund’s portfolio turnover rate may be higher. |
| The accompanying notes are an integral part of these financial statements. | 21 |
GOLDMAN SACHS MLP ENERGY INFRASTRUCTURE FUND
Financial Highlights (continued)
Selected Share Data for a Share Outstanding Throughout Each Period
| Goldman Sachs MLP Energy Infrastructure Fund | ||||||||||||||
| Class P Shares | ||||||||||||||
| Year Ended November 30, | Period Ended November 30, 2018(a) |
|||||||||||||
| 2020 | 2019 | |||||||||||||
| Per Share Data* | ||||||||||||||
| Net asset value, beginning of period |
$ | 27.05 | $ | 32.85 | $ | 34.80 | ||||||||
| Net investment income (loss)(b) |
(0.08 | ) | (0.20 | ) | (0.15 | ) | ||||||||
| Net realized and unrealized gain (loss) |
(8.12 | ) | (3.10 | ) | — | (c) | ||||||||
| Total from investment operations |
(8.20 | ) | (3.30 | ) | (0.15 | ) | ||||||||
| Distributions to shareholders from net investment income |
— | (0.15 | ) | (0.65 | ) | |||||||||
| Distributions to shareholders from return of capital |
(0.94 | ) | (2.35 | ) | (1.15 | ) | ||||||||
| Total distributions |
(0.94 | ) | (2.50 | ) | (1.80 | ) | ||||||||
| Net asset value, end of period |
$ | 17.91 | $ | 27.05 | $ | 32.85 | ||||||||
| Total return(d) | (27.55 | )% | (10.73 | )% | (0.72 | )% | ||||||||
| Net assets, end of period (in 000s) |
$ | 526,900 | $ | 843,448 | $ | 1,073,157 | ||||||||
| Ratio of total expenses to average net assets after tax (benefit)/expense(e) |
2.26 | % | 1.27 | % | 1.05 | %(f) | ||||||||
| Ratio of net expenses to average net assets after tax (benefit)/expense(e) |
2.23 | % | 1.27 | % | 1.05 | %(f) | ||||||||
| Ratio of net expenses to average net assets before tax (benefit)/expense |
1.10 | % | 1.04 | % | 1.00 | %(f) | ||||||||
| Ratio of net investment loss to average net assets(g) |
(0.38 | )% | (0.61 | )% | (0.68 | )%(f) | ||||||||
| Portfolio turnover rate(h) |
139 | % | 51 | % | 68 | % | ||||||||
| * | On June 5, 2020, the Fund effected a 5-for-1 reverse share split. All per share data prior to June 5, 2020 has been adjusted to reflect the reverse share split. |
| (a) | Commenced operations on April 16, 2018. |
| (b) | Calculated based on the average shares outstanding methodology. |
| (c) | Less than $0.005 per share. |
| (d) | Assumes investment at the NAV at the beginning of the period, reinvestment of all dividends and distributions, a complete redemption of the investment at the NAV at the end of the period and no sales or redemption charges (if any). Total returns would be reduced if a sales or redemption charge was taken into account. Returns do not reflect the impact of taxes to shareholders relating to Fund distributions or the redemption of Fund shares. Total returns for periods less than one full year are not annualized. |
| (e) | Current and deferred tax expense/benefit for the ratio calculation is derived from the net investment income (loss), and realized and unrealized gains (losses). |
| (f) | Annualized with the exception of tax expenses. |
| (g) | Current and deferred tax benefit for the ratio calculation is derived from net investment income (loss) only. |
| (h) | The Fund’s portfolio turnover rate is calculated in accordance with regulatory requirements, without regard to transactions involving short term investments and certain derivatives. If such transactions were included, the Fund’s portfolio turnover rate may be higher. |
| 22 | The accompanying notes are an integral part of these financial statements. |
GOLDMAN SACHS MLP ENERGY INFRASTRUCTURE FUND
November 30, 2020
| 1. ORGANIZATION |
Goldman Sachs Trust (the “Trust”) is a Delaware statutory trust registered under the Investment Company Act of 1940, as amended (the “Act”), as an open-end management investment company. The Trust includes the Goldman Sachs MLP Energy Infrastructure Fund (the “Fund”). The Fund is a non-diversified portfolio under the Act offering seven classes of shares — Class A, Class C, Institutional, Investor, Class R6, Class R and Class P Shares.
Class A Shares are sold with a front-end sales charge of up to 5.50%. Class C Shares are sold with a contingent deferred sales charge (“CDSC”) of 1.00%, which is imposed on redemptions made within 12 months of purchase. Institutional, Investor, Class R6, Class R and Class P shares are not subject to a sales charge.
Goldman Sachs Asset Management, L.P. (“GSAM”), an affiliate of Goldman Sachs & Co. LLC (“Goldman Sachs”), serves as investment adviser to the Fund pursuant to a management agreement (the “Agreement”) with the Trust.
On June 5, 2020, the Fund effected a 5 for 1 reverse share split. The share split did not have an impact on the overall value of a shareholder’s investment in the Fund.
| 2. SIGNIFICANT ACCOUNTING POLICIES |
The financial statements have been prepared in accordance with accounting principles generally accepted in the United States of America (“GAAP”) and require management to make estimates and assumptions that may affect the reported amounts and disclosures. Actual results may differ from those estimates and assumptions. The Fund is an investment company under GAAP and follows the accounting and reporting guidance applicable to investment companies.
A. Investment Valuation — The Fund’s valuation policy is to value investments at fair value.
B. Investment Income and Investments — Investment income includes interest income, dividend income, net of any foreign withholding taxes and less any amounts reclaimable. Interest income is accrued daily and adjusted for amortization of premiums and accretion of discounts. Dividend income is recognized on ex-dividend date or, for certain foreign securities, as soon as such information is obtained subsequent to the ex-dividend date. Non-cash dividends, if any, are recorded at the fair market value of the securities received. Investment transactions are reflected on trade date. Realized gains and losses are calculated using identified cost. Investment transactions are recorded on the following business day for daily net asset value (“NAV”) calculations. Distributions from master limited partnerships (“MLPs”) are generally recorded based on the characterization reported on the Fund’s schedule K-1 received from the MLPs. The Fund records its pro-rata share of the income/loss and capital gains/losses, allocated from the underlying partnerships and adjusts the cost basis of the underlying partnerships accordingly.
C. Class Allocations and Expenses — Investment income, realized and unrealized gain (loss), if any, and non-class specific expenses of the Fund are allocated daily based upon the proportion of net assets of each class. Non-class specific expenses directly incurred by the Fund are charged to the Fund, while such expenses incurred by the Trust are allocated across the applicable Funds on a straight-line and/or pro-rata basis depending upon the nature of the expenses. Class specific expenses, where applicable, are borne by the respective share classes and include Distribution and Service, Transfer Agency and Service fees.
D. Distributions to Shareholders — Over the long term, the Fund makes distributions to its shareholders each fiscal quarter at a rate that is approximately equal to the distributions the Fund receives from the MLPs and other securities in which it invests. To permit the Fund to maintain more stable quarterly distributions, the distribution for any particular quarterly period may be more or less than the amount of total distributable earnings actually earned by the Fund. The Fund estimates that only a portion of the distributions paid to shareholders will be treated as income. The remaining portion of the Fund’s distribution, which may be significant, is expected to be a return of capital. These estimates are based on the Fund’s operating results during the period, and their final federal income tax characterization may differ.
The characterization of distributions to shareholders for financial reporting purposes is determined in accordance with federal income tax rules, which may differ from GAAP. Certain components of the Fund’s net assets on the Statement of Assets and Liabilities reflect permanent GAAP/Tax differences based on the appropriate tax character.
23
GOLDMAN SACHS MLP ENERGY INFRASTRUCTURE FUND
Notes to Financial Statements (continued)
November 30, 2020
| 2. SIGNIFICANT ACCOUNTING POLICIES (continued) |
E. Income Taxes — The Fund does not intend to qualify as a regulated investment company pursuant to Subchapter M of the Internal Revenue Code of 1986, as amended, but will rather be taxed as a corporation. As a result, the Fund is obligated to pay federal, state and local income tax on its taxable income. The Fund invests primarily in MLPs, which generally are treated as partnerships for federal income tax purposes. As a limited partner in the MLPs, the Fund must report its allocable share of the MLPs’ taxable income or loss in computing its own taxable income or loss. The Fund’s tax expense or benefit is included in the Statement of Operations based on the component of income or gains/losses to which such expense or benefit relates. Deferred income taxes reflect the net tax effects of temporary differences between the carrying amounts of assets and liabilities for financial reporting purposes and the amounts used for income tax purposes. Such temporary differences are principally: (i) taxes on unrealized gains/losses, which are attributable to the temporary difference between fair market value and tax basis, (ii) the net tax effects of temporary differences between the carrying amounts of assets and liabilities for financial reporting and income tax purposes, and (iii) the net tax benefit of accumulated net operating losses and capital loss carryforwards. The Fund will accrue a deferred income tax liability balance, at the currently effective statutory United States (“U.S.”) federal income tax rate plus an estimated state and local income tax rate, for its future tax liability associated with the capital appreciation of its investments and the distributions received by the Fund on interests of MLPs considered to be return of capital and for any net operating gains. The Fund may also record a deferred tax asset balance, which reflects an estimate of the Fund’s future tax benefit associated with net operating losses, capital loss carryforwards, and/or unrealized losses.
To the extent the Fund has a deferred tax asset, consideration is given to whether or not a valuation allowance, which would offset the value of some or all of the deferred tax asset balance, is required. A valuation allowance is required if based on the evaluation criterion provided by Accounting Standards Codification (“ASC”) 740, Income Taxes (ASC 740) it is more likely than not that some portion, or all, of the deferred tax asset will not be realized. The factors considered in assessing the Fund’s valuation allowance include: the nature, frequency and severity of current and cumulative losses, the duration of the statutory carryforward periods and the associated risks that operating and capital loss carryforwards may expire unutilized. From time to time, as new information becomes available, the Fund will modify its estimates or assumptions regarding the deferred tax liability or asset. Unexpected significant decreases in cash distributions from the Fund’s MLP investments or significant declines in the fair value of its investments may change the Fund’s assessment regarding the recoverability of their deferred tax assets and may result in a valuation allowance. If a valuation allowance is required to reduce any deferred tax asset in the future, it could have a material impact on the Fund’s NAV and results of operations in the period it is recorded. The Fund will rely to some extent on information provided by MLPs, which may not be provided to the Fund on a timely basis, to estimate operating income/loss and gains/losses and current taxes and deferred tax liabilities and/or asset balances for purposes of daily reporting of NAVs and financial statement reporting. In addition, sales of MLP investments will result in allocations to the Fund of taxable ordinary income or loss and capital gain or loss, each in amounts that will not be reported to the Fund until the following year, in magnitudes often not readily estimable before such reporting is made.
It is the Fund’s policy to classify interest and penalties associated with underpayment of federal and state income taxes, if any, as income tax expense on its Statement of Operations. The Fund anticipates filing income tax returns in the U.S. federal jurisdiction and various states, and such returns are subject to examination by the tax jurisdictions. The Fund has reviewed all major jurisdictions and concluded that there is no significant impact on its net assets and no tax liability resulting from unrecognized tax benefits or expenses relating to uncertain tax positions expected to be taken on its tax returns.
Return of Capital Estimates — Distributions received from the Fund’s investments in MLPs generally are comprised of income and return of capital. The Fund records investment income and return of capital based on estimates made at the time such distributions are received. Such estimates are based on historical information available from each MLP and other industry sources. These estimates may subsequently be revised based on information received from MLPs after their tax reporting periods are concluded.
F. Foreign Currency Translation — The accounting records and reporting currency of the Fund are maintained in U.S. dollars. Assets and liabilities denominated in foreign currencies are translated into U.S. dollars using the current exchange rates at the close of each business day. The effect of changes in foreign currency exchange rates on investments is included within net realized and unrealized gain (loss) on investments. Changes in the value of other assets and liabilities as a result of fluctuations in foreign
24
GOLDMAN SACHS MLP ENERGY INFRASTRUCTURE FUND
| 2. SIGNIFICANT ACCOUNTING POLICIES (continued) |
exchange rates are included in the Statement of Operations within net change in unrealized gain (loss) on foreign currency translations. Transactions denominated in foreign currencies are translated into U.S. dollars on the date the transaction occurred, the effects of which are included within net realized gain (loss) on foreign currency transactions.
| 3. INVESTMENTS AND FAIR VALUE MEASUREMENTS |
The fair value of a financial instrument is the amount that would be received to sell an asset or paid to transfer a liability in an orderly transaction between market participants at the measurement date (i.e., the exit price); the Fund’s policy is to use the market approach. GAAP establishes a fair value hierarchy that prioritizes the inputs to valuation techniques used to measure fair value. The hierarchy gives the highest priority to unadjusted quoted prices in active markets for identical assets or liabilities (Level 1 measurements) and the lowest priority to unobservable inputs (Level 3 measurements). The level in the fair value hierarchy within which the fair value measurement in its entirety falls shall be determined based on the lowest level input that is significant to the fair value measurement in its entirety. The levels used for classifying investments are not necessarily an indication of the risk associated with investing in these investments. The three levels of the fair value hierarchy are described below:
Level 1 — Unadjusted quoted prices in active markets that are accessible at the measurement date for identical, unrestricted assets or liabilities;
Level 2 — Quoted prices in markets that are not active or financial instruments for which significant inputs are observable (including, but not limited to, quoted prices for similar investments, interest rates, foreign exchange rates, volatility and credit spreads), either directly or indirectly;
Level 3 — Prices or valuations that require significant unobservable inputs (including GSAM’s assumptions in determining fair value measurement).
The Board of Trustees (“Trustees”) has approved Valuation Procedures that govern the valuation of the portfolio investments held by the Fund, including investments for which market quotations are not readily available. The Trustees have delegated to GSAM day-to-day responsibility for implementing and maintaining internal controls and procedures related to the valuation of the Fund’s portfolio investments. To assess the continuing appropriateness of pricing sources and methodologies, GSAM regularly performs price verification procedures and issues challenges as necessary to third party pricing vendors or brokers, and any differences are reviewed in accordance with the Valuation Procedures.
A. Level 1 and Level 2 Fair Value Investments — The valuation techniques and significant inputs used in determining the fair values for investments classified as Level 1 and Level 2 are as follows:
Equity Securities — Equity securities traded on a United States (“U.S.”) securities exchange or the NASDAQ system, or those located on certain foreign exchanges, including but not limited to the Americas, are valued daily at their last sale price or official closing price on the principal exchange or system on which they are traded. If there is no sale or official closing price or such price is believed by GSAM to not represent fair value, equity securities will be valued at the valid closing bid price for long positions and at the valid closing ask price for short positions (i.e. where there is sufficient volume, during normal exchange trading hours). If no valid big/ask price is available, the equity security will be valued pursuant to the Valuation Procedures approved by the Trustees and consistent with applicable regulatory guidance. To the extent these investments are actively traded, they are classified as Level 1 of the fair value hierarchy, otherwise they are generally classified as Level 2. Certain equity securities containing unique attributes may be classified as Level 2.
Unlisted equity securities for which market quotations are available are valued at the last sale price on the valuation date, or if no sale occurs, at the last bid price, and are generally classified as Level 2. Securities traded on certain foreign securities exchanges are valued daily at fair value determined by an independent fair value service (if available) under Valuation Procedures approved by the Trustees and consistent with applicable regulatory guidance. The independent fair value service takes into account multiple factors including, but not limited to, movements in the securities markets, certain depositary receipts, futures contracts and foreign currency exchange rates that have occurred subsequent to the close of the foreign securities exchange. These investments are generally classified as Level 2 of the fair value hierarchy.
25
GOLDMAN SACHS MLP ENERGY INFRASTRUCTURE FUND
Notes to Financial Statements (continued)
November 30, 2020
| 3. INVESTMENTS AND FAIR VALUE MEASUREMENTS (continued) |
Money Market Funds — Investments in the Goldman Sachs Financial Square Government Fund (“Underlying Fund”) are valued at the NAV on the day of valuation. These investments are generally classified as Level 1 of the fair value hierarchy. For information regarding an Underlying Fund’s accounting policies and investment holdings, please see the Underlying Fund’s shareholder report.
Derivative Contracts — A derivative is an instrument whose value is derived from underlying assets, indices, reference rates or a combination of these factors. The Fund enters into derivative transactions to hedge against changes in interest rates, securities prices, and/or currency exchange rates, to increase total return, or to gain access to certain markets or attain exposure to other underliers. For financial reporting purposes, cash collateral that has been pledged to cover obligations of the Fund and cash collateral received, if any, is reported separately on the Statement of Assets and Liabilities as receivables/payables for collateral on certain derivatives contracts. Non-cash collateral pledged by the Fund, if any, is noted in the Schedule of Investments.
Exchange-traded derivatives, including futures and options contracts, are valued at the last sale or settlement price and typically fall within Level 1 of the fair value hierarchy. Over-the-counter (“OTC”) and centrally cleared derivatives are valued using market transactions and other market evidence, including market-based inputs to models, calibration to market-clearing transactions, broker or dealer quotations, or other alternative pricing sources. Where models are used, the selection of a particular model to value OTC and centrally cleared derivatives depends upon the contractual terms of, and specific risks inherent in, the instrument, as well as the availability of pricing information in the market. Valuation models require a variety of inputs, including contractual terms, market prices, yield curves, credit curves, measures of volatility, voluntary and involuntary prepayment rates, loss severity rates and correlations of such inputs. For OTC and centrally cleared derivatives that trade in liquid markets, model inputs can generally be verified and model selection does not involve significant management judgment. OTC and centrally cleared derivatives are classified within Level 2 of the fair value hierarchy when significant inputs are corroborated by market evidence.
i. Options Contracts — When the Fund writes call or put options contracts, an amount equal to the premium received is recorded as a liability and is subsequently marked-to-market to reflect the current value of the option written. Swaptions are options on swap contracts.
Upon the purchase of a call option or a put option by the Fund, the premium paid is recorded as an investment and subsequently marked-to-market to reflect the current value of the option. Certain options may be purchased with premiums to be determined on a future date. The premiums for these options are based upon implied volatility parameters at specified terms.
B. Level 3 Fair Value Investments — To the extent that significant inputs to valuation models and other alternative pricing sources are unobservable, or if quotations are not readily available, or if GSAM believes that such quotations do not accurately reflect fair value, the fair value of the Fund’s investments may be determined under Valuation Procedures approved by the Trustees. GSAM, consistent with its procedures and applicable regulatory guidance, may make an adjustment to the most recent valuation prices of either domestic or foreign securities in light of significant events to reflect what it believes to be the fair value of the securities at the time of determining the Fund’s NAV. To the extent investments are valued using single source broker quotations obtained directly from the broker or passed through from third party pricing vendors, such investments are classified as Level 3 investments.
C. Fair Value Hierarchy — The following is a summary of the Fund’s investments and derivatives classified in the fair value hierarchy as of November 30, 2020:
| Type | Level 1 | Level 2 | Level 3 | |||||||||
| Assets |
| |||||||||||
| Common Stock(a) |
| |||||||||||
| Europe |
$ | 22,958,167 | $ | 10,291,790 | $ | — | ||||||
| North America |
958,963,075 | — | — | |||||||||
| Special Purpose Acquisition Company |
11,767,924 | — | — | |||||||||
| Total | $ | 993,689,166 | $ | 10,291,790 | $ | — | ||||||
26
GOLDMAN SACHS MLP ENERGY INFRASTRUCTURE FUND
| 3. INVESTMENTS AND FAIR VALUE MEASUREMENTS (continued) |
| Derivative Type | Level 1 | Level 2 | Level 3 | |||||||||
| Assets |
| |||||||||||
| Purchased option contracts |
$ | — | $ | 1,953,799 | $ | — | ||||||
| Liabilities |
| |||||||||||
| Written option contracts |
$ | (731,250 | ) | $ | — | $ | — | |||||
| (a) | Amounts are disclosed by continent to highlight the impact of time zone differences between local market close and the calculation of net asset value. Security valuations are based on the principal exchange or system on which they are traded, which may differ from country of domicile. The Fund utilizes fair value model prices provided by an independent fair value service for international equities, resulting in a Level 2 classification. |
For further information regarding security characteristics, see the Schedule of Investments.
| 4. INVESTMENTS IN DERIVATIVES |
The following table sets forth, by certain risk types, the gross value of derivative contracts (not considered to be hedging instruments for accounting disclosure purposes) as of November 30, 2020. These instruments were used as part of the Fund’s investment strategies and to obtain and/or manage exposure related to the risks below. The values in the table below exclude the effects of cash collateral received or posted pursuant to these derivative contracts, and therefore are not representative of the Fund’s net exposure.
| Risk | Statement of Assets and Liabilities |
Assets | Statement of Assets and Liabilities |
Liabilities | ||||||||
| Equity |
Purchased options, at value | $ | 1,953,799 | Written options, at value | $ | (731,250) | ||||||
The following table sets forth, by certain risk types, the Fund’s gains (losses) related to these derivatives and their indicative volumes for the fiscal year ended November 30, 2020. These gains (losses) should be considered in the context that these derivative contracts may have been executed to create investment opportunities and/or economically hedge certain investments, and accordingly, certain gains (losses) on such derivative contracts may offset certain (losses) gains attributable to investments. These gains (losses) are included in “Net realized gain (loss)” or “Net change in unrealized gain (loss)” on the Statement of Operations:
| Risk | Statement of Operations | Net Change in Unrealized Gain (Loss) |
Average Number of Contracts(a) |
|||||||
| Equity | Net unrealized gain (loss) on purchased options and written options | $ | 228,424 | 1 | ||||||
| (a) | Average number of contracts is based on the average of month end balances for the fiscal year ended November 30, 2020. |
27
GOLDMAN SACHS MLP ENERGY INFRASTRUCTURE FUND
Notes to Financial Statements (continued)
November 30, 2020
| 5. TAXATION |
Total income taxes are computed by applying the federal statutory rate plus a blended state income tax rate. During the fiscal year ended November 30, 2020, the Fund reevaluated its blended state income tax rate, decreasing the rate from 1.80% to 1.78% due to anticipated change in state apportionment of income and gains. The reconciliation between the federal statutory income tax rate of 21% and the effective tax rate on net investment income/loss and realized and unrealized gain/loss is as follows:
| Application of statutory income tax rate |
$ | (94,361,525 | ) | 21.00 | % | |||
| State income taxes, net of federal benefit |
(7,998,263 | ) | 1.78 | % | ||||
| Change in estimated deferred tax rate |
294,375 | -0.07 | % | |||||
| Effect of permanent differences |
(17,982,282 | ) | 4.00 | % | ||||
| Capital Loss Carryforward Expiration |
89,005,395 | -19.81 | % | |||||
| Change in valuation allowance |
43,199,783 | -9.61 | % | |||||
| Total current and deferred income tax expense, net |
$ | 12,157,483 | -2.71 | % | ||||
Deferred tax assets and liabilities are measured using effective tax rates expected to apply to taxable income in the years such temporary differences are realized or otherwise settled. At November 30, 2020, components of the Fund’s deferred tax assets and liabilities were as follows:
| Deferred tax assets: | ||||
| Net unrealized losses on investment securities (tax basis) |
$ | 23,001,269 | ||
| State net operating loss carryforward |
542,905 | |||
| Capital loss carryforward (tax basis) |
245,789,660 | |||
| Other tax assets |
963,808 | |||
| Valuation Allowance |
(269,031,643 | ) | ||
| Total Deferred Tax Assets |
$ | 1,265,999 | ||
| Deferred tax liabilities: | ||||
| Book vs tax partnership income to be recognized |
$ | (9,681,896 | ) | |
| Total Deferred Tax Liabilities |
$ | (9,681,896 | ) | |
| Net Deferred Tax Asset/(Liability) |
$ | (8,415,897 | ) | |
At November 30, 2020, the Fund had capital loss carryforwards, subject to expiration and limitation based on the fiscal year generated, as follows:
| For Fiscal Year Ended: | Amount | Expiration | ||||||
| November 30, 2016 |
$ | 288,032,916 | November 30, 2021 | |||||
| November 30, 2019 |
$ | 130,792,210 | November 30, 2024 | |||||
| November 30, 2020 |
$ | 660,146,164 | November 30, 2025 | |||||
The Fund had a capital loss carryforward expire unutilized in the current year in the amount of $390,717,276.
The Fund reviews the recoverability of its deferred tax assets based upon the weight of the available evidence. When assessing, the Fund’s management considers available carrybacks, reversing temporary taxable differences, and tax planning, if any. As a result of its analysis of the recoverability of its deferred tax assets, the Fund recorded $269,031,643 of valuation allowances as of November 30, 2020.
28
GOLDMAN SACHS MLP ENERGY INFRASTRUCTURE FUND
| 5. TAXATION (continued) |
For the fiscal year ended November 30, 2020, components of the Fund’s current and deferred tax benefit are as follows:
| Current | Deferred | Total | ||||||||||
| Federal |
$ | 15,903,686 | $ | (44,776,355 | ) | $ | (28,872,669 | ) | ||||
| State |
$ | 1,956,700 | $ | (4,126,331 | ) | $ | (2,169,631 | ) | ||||
| Valuation Allowance |
$ | — | $ | 43,199,783 | $ | 43,199,783 | ||||||
| Total | $ | 17,860,386 | $ | (5,702,903 | ) | $ | 12,157,483 | |||||
For the fiscal year ended November 30, 2020, the Fund does not have any interest or penalties associated with the underpayment of any income taxes. At November 30, 2020, gross unrealized appreciation and depreciation of investments, based on cost, for federal income tax purposes was as follows:
| Tax Cost |
$ | 1,062,493,303 | ||
| Gross unrealized gain |
105,495,748 | |||
| Gross unrealized loss |
(164,008,095 | ) | ||
| Net unrealized security gain (loss) |
$ | (58,512,347 | ) |
Any difference between cost amounts for financial statement and federal income tax purposes is due primarily to wash sales and differences related to the tax treatment of partnership investments.
For the fiscal year ended November 30, 2020, the Fund distributions are estimated to be comprised of 0% from taxable income and 100% return of capital. Shareholders will be informed of the final tax characterization of the distributions in February 2021. The Fund’s tax years ended November 30, 2017 through November 30, 2019 remain open for examination by U.S. and state tax authorities. Management of the Fund is not aware of any tax positions for which it is reasonably possible that the total amounts of unrecognized tax benefits or expenses will significantly change in the next 12 months.
| 6. AGREEMENTS AND AFFILIATED TRANSACTIONS |
A. Management Agreement — Under the Agreement, GSAM manages the Fund, subject to the general supervision of the Trustees.
As compensation for the services rendered pursuant to the Agreement, the assumption of the expenses related thereto and administration of the Fund’s business affairs, including providing facilities, GSAM is entitled to a management fee, accrued daily and paid monthly, equal to an annual percentage rate of the Fund’s average daily managed net assets.
For the fiscal year ended November 30, 2020, contractual and effective net management fees with GSAM were at the following rates:
| Contractual Management Rate | ||||||||||||||||||||||
| First $1 billion |
Next $1 billion |
Next $3 billion |
Next $3 billion |
Over $8 billion |
Effective Net Management Rate^ |
|||||||||||||||||
| 1.00% | 0.90% | 0.86% | 0.84% | 0.82% | 0.98% | |||||||||||||||||
| ^ | Effective Net Management Rate includes the impact of management fee waivers of affiliated Underlying Funds, if any. The Effective Net Management Rate may not correlate to the Contractual Management Rate as a result of management fee waivers that may be in effect from time to time. |
The Fund invests in Institutional Shares of the Goldman Sachs Financial Square Government Fund, which is an affiliated Underlying Fund. GSAM has agreed to waive a portion of its management fee payable by the Fund in an amount equal to the management fee it earns as an investment adviser to the affiliated Underlying Fund in which the Fund invests. For the fiscal year ended November 30, 2020, GSAM waived $10,209 of the Fund’s management fee.
29
GOLDMAN SACHS MLP ENERGY INFRASTRUCTURE FUND
Notes to Financial Statements (continued)
November 30, 2020
| 6. AGREEMENTS AND AFFILIATED TRANSACTIONS (continued) |
B. Distribution and/or Service (12b-1) Plans — The Trust, on behalf of Class A and Class R Shares of the Fund, has adopted Distribution and Service Plans subject to Rule 12b-1 under the Act. Under the Distribution and Service Plans, Goldman Sachs, which serves as distributor (the “Distributor”), is entitled to a fee accrued daily and paid monthly, for distribution services and personal and account maintenance services, which may then be paid by Goldman Sachs to authorized dealers. These fees are equal to an annual percentage rate of the average daily net assets attributable to Class A or Class R Shares of the Fund, as applicable, as set forth below.
The Trust, on behalf of Class C Shares of the Fund, has adopted a Distribution Plan subject to Rule 12b-1 under the Act. Under the Distribution Plan, Goldman Sachs as Distributor is entitled to a fee accrued daily and paid monthly for distribution services, which may then be paid by Goldman Sachs to authorized dealers. These fees are equal to an annual percentage rate of the average daily net assets attributable to Class C Shares of the Fund.
| Distribution and/or Service Plan Rates | ||||||||||||
| Class A* | Class C | Class R* | ||||||||||
| Distribution and/or Service Plan |
0.25 | % | 0.75 | % | 0.50 | % | ||||||
| * | With respect to Class A and Class R Shares, the Distributor at its discretion may use compensation for distribution services paid under the Distribution Plan to compensate service organizations for personal and account maintenance services and expenses as long as such total compensation does not exceed the maximum cap on “service fees” imposed by the Financial Industry Regulatory Authority. |
C. Distribution Agreement — Goldman Sachs, as Distributor of the shares of the Fund pursuant to a Distribution Agreement, may retain a portion of the Class A Shares’ front end sales charge and Class C Shares’ CDSC. During the fiscal year ended November 30, 2020, Goldman Sachs advised that it retained $16,499 and $0 of the sales charges applicable to Class A and Class C Shares, respectively.
D. Service Plan — The Trust, on behalf of the Fund, has adopted a Service Plan to allow Class C Shares to compensate service organizations (including Goldman Sachs) for providing varying levels of personal and account maintenance services to its customers who are beneficial owners of such shares. The Service Plan provides for compensation to the service organizations equal to an annual percentage rate of 0.25% of the average daily net assets attributable to Class C Shares of the Fund.
E. Transfer Agency Agreement — Goldman Sachs also serves as the transfer agent of the Fund for a fee pursuant to the Transfer Agency Agreement. The fees charged for such transfer agency services are accrued daily and paid monthly at annual rates as follows: 0.17% of the average daily net assets of Class A, Class C, Investor and Class R Shares; 0.03% of the average daily net assets of Class R6 and Class P Shares; and 0.04% of the average daily net assets of Institutional Shares.
F. Other Expense Agreements and Affiliated Transactions — GSAM has agreed to reduce or limit certain “Other Expenses” of the Fund (excluding acquired fund fees and expenses, transfer agency fees and expenses, service fees and shareholder administration fees (as applicable), taxes, interest, brokerage fees, shareholder meeting, litigation, indemnification and extraordinary expenses) to the extent such expenses exceed, on an annual basis, a percentage rate of the average daily net assets of the Fund. Such Other Expense reimbursements, if any, are accrued daily and paid monthly. In addition, the Fund is not obligated to reimburse GSAM for prior fiscal year expense reimbursements, if any. The Other Expense limitations as an annual percentage rate of average daily net assets for the Fund is 0.064%. These Other Expense limitations will remain in place through at least March 27, 2021, and prior to such date GSAM may not terminate the arrangements without the approval of the Trustees. In addition, the Fund has entered into certain offset arrangements with the transfer agent, which may result in a reduction of the Fund’s expenses and are received irrespective of the application of the “Other Expense” limitations described above. Such Other Expense reimbursements,
30
GOLDMAN SACHS MLP ENERGY INFRASTRUCTURE FUND
| 6. AGREEMENTS AND AFFILIATED TRANSACTIONS (continued) |
if any, are accrued daily and paid monthly and are disclosed in the Statement of Operations for the fiscal year ended November 30, 2020. For the fiscal year ended November 30, 2020, these expense reductions, including any fee waivers and Other Expense reimbursements, were as follows:
| Management Fee Waiver |
Transfer Agency |
Other Expense Reimbursements |
Total Expense Reductions |
|||||||||||
| $ | 10,209 | $ | 472 | $ | 276,406 | $ | 287,087 | |||||||
G. Other Transactions with Affiliates — For the fiscal year ended November 30, 2020, Goldman Sachs earned $136,719 in brokerage commissions from portfolio transactions on behalf of the Fund.
The table below shows the transactions in and earnings from investments in all affiliated funds as of and for the fiscal year ended November 30, 2020:
| Underlying Fund | Beginning Value as of November 30, 2019 |
Purchases at Cost |
Proceeds from Sales |
Ending Value as of November 30, 2020 |
Shares as of November 30, 2020 |
Dividend Income |
||||||||||||||||||
| Goldman Sachs Financial Square Government Fund — Institutional Shares |
$ | 17,556,028 | $ | 350,425,737 | $ | (367,981,765 | ) | $ | — | — | $ | 39,038 | ||||||||||||
H. Line of Credit Facility — As of November 30, 2020, the Fund participated in a $700,000,000 committed, unsecured revolving line of credit facility (the “facility”) together with other funds of the Trust and registered investment companies having management agreements with GSAM or its affiliates. This facility is to be used for temporary or emergency purposes, or to allow for an orderly liquidation of securities to meet redemption requests. The interest rate on borrowings is based on the federal funds rate. The facility also requires a fee to be paid by the Fund based on the amount of the commitment that has not been utilized. For fiscal year ended November 30, 2020, the Fund did not have any borrowings under the facility. Prior to April 28, 2020, the facility was $580,000,000.
| 7. PORTFOLIO SECURITIES TRANSACTIONS |
The cost of purchases and proceeds from sales and maturities of long-term securities for the fiscal year ended November 30, 2020, were $1,527,545,795 and $1,709,554,922, respectively.
| 8. OTHER RISKS |
The Fund’s risks include, but are not limited to, the following:
Derivatives Risk — The Fund’s use of derivatives may result in loss. Derivative instruments, which may pose risks in addition to and greater than those associated with investing directly in securities, currencies or other instruments, may be illiquid or less liquid, volatile, difficult to price and leveraged so that small changes in the value of the underlying instruments may produce disproportionate losses to the Fund. Derivatives are also subject to counterparty risk, which is the risk that the other party in the transaction will not fulfill its contractual obligation. The use of derivatives is a highly specialized activity that involves investment techniques and risks different from those associated with investments in more traditional securities and instruments. Losses from derivatives can also result from a lack of correlation between changes in the value of derivative instruments and the portfolio assets (if any) being hedged.
Geographic and Sector Risk — The Fund focuses its investments in the energy sector, and will therefore be susceptible to adverse economic, environmental, business, regulatory or other occurrences affecting that sector. The energy sector has historically
31
GOLDMAN SACHS MLP ENERGY INFRASTRUCTURE FUND
Notes to Financial Statements (continued)
November 30, 2020
| 8. OTHER RISKS (continued) |
experienced substantial price volatility. MLPs and other companies operating in the energy sector are subject to specific risks, including, among others, fluctuations in commodity prices; reduced consumer demand for commodities such as oil, natural gas or petroleum products; reduced availability of natural gas or other commodities for transporting, processing, storing or delivering; slowdowns in new construction; extreme weather or other natural disasters; and threats of attack by terrorists on energy assets. Additionally, changes in the regulatory environment for energy companies may adversely impact their profitability. Over time, depletion of natural gas reserves and other energy reserves may also affect the profitability of energy companies.
Investments in Other Investment Companies — As a shareholder of another investment company, the Fund will indirectly bear its proportionate share of any net management fees and other expenses paid by such other investment companies, in addition to the fees and expenses regularly borne by the Fund.
Large Shareholder Transactions Risk — The Fund may experience adverse effects when certain large shareholders, such as other funds, institutional investors (including those trading by use of non-discretionary mathematical formulas), financial intermediaries (who may make investment decisions on behalf of underlying clients and/or include the Fund in their investment model), individuals, accounts and Goldman Sachs affiliates, purchase or redeem large amounts of shares of the Fund. Such large shareholder redemptions, which may occur rapidly or unexpectedly, may cause the Fund to sell portfolio securities at times when it would not otherwise do so, which may negatively impact the Fund’s NAV and liquidity. These transactions may also accelerate the realization of taxable income to shareholders if such sales of investments resulted in gains, and may also increase transaction costs. In addition, a large redemption could result in the Fund’s current expenses being allocated over a smaller asset base, leading to an increase in the Fund’s expense ratio. Similarly, large Fund share purchases may adversely affect the Fund’s performance to the extent that the Fund is delayed in investing new cash or otherwise maintains larger cash position than it ordinarily would.
Liquidity Risk — The Fund may make investments that are illiquid or that may become less liquid in response to market developments or adverse investor perceptions. Illiquid investments may be more difficult to value. Liquidity risk may also refer to the risk that the Fund will not be able to pay redemption proceeds within the allowable time period or without significant dilution to remaining investors’ interests because of unusual market conditions, an unusually high volume of redemption requests, or other reasons. To meet redemption requests, the Fund may be forced to sell investments at an unfavorable time and/or under unfavorable conditions. If the Fund is forced to sell securities at an unfavorable time and/or under unfavorable conditions, such sales may adversely affect the Fund’s NAV and dilute remaining investors’ interests. Redemptions by large shareholders may have a negative impact on the Fund’s liquidity.
Market and Credit Risks — In the normal course of business, the Fund trades financial instruments and enters into financial transactions where risk of potential loss exists due to changes in the market (market risk). The value of the securities in which the Fund invests may go up or down in response to the prospectus of individual companies, particular sectors or governments and/or general economic conditions throughout the world due to increasingly interconnected global economies and financial markets. Events such as war, acts of terrorism, social unrest, natural disasters, the spread of infectious illness or other public health threats could also significantly impact the Fund and its investments. Additionally, the Fund may also be exposed to credit risk in the event that an issuer or guarantor fails to perform or that an institution or entity with which the Fund has unsettled or open transactions defaults.
Master Limited Partnership Risk — Investments in securities of MLPs involve risks that differ from investments in common stock, including risks related to limited control and limited rights to vote on matters affecting the MLP, risks related to potential conflicts of interest between the MLP and the MLP’s general partner, cash flow risks, dilution risks, limited liquidity and risks related to the general partner’s right to require unit-holders to sell their common units at an undesirable time or price.
Non-Diversification Risk — The Fund is non-diversified, meaning that it is permitted to invest a larger percentage of its assets in fewer issuers than diversified mutual funds. Thus, the Fund may be more susceptible to adverse developments affecting any single issuer held in its portfolio, and may be more susceptible to greater losses because of these developments.
Special Purpose Acquisition Companies Risk — The Fund may invest in stock, warrants, and other securities of special purpose acquisition companies (“SPACs”) or similar special purpose entities that pool funds to seek potential acquisition
32
GOLDMAN SACHS MLP ENERGY INFRASTRUCTURE FUND
| 8. OTHER RISKS (continued) |
opportunities. Because SPACs and similar entities are in essence blank check companies without operating history or ongoing business other than seeking acquisitions, the value of their securities is particularly dependent on the ability of the entity’s management to identify and complete a profitable acquisition. An investment in a SPAC is subject to a variety of risks, including that (i) a portion of the monies raised by the SPAC for the purpose of effecting an acquisition or merger may be expended prior to the transaction for payment of taxes and other purposes; (ii) prior to any acquisition or merger, a SPAC’s assets are typically invested in government securities, money market funds and similar investments whose returns or yields may be significantly lower than those of the Fund’s other investments; (iii) the Fund generally will not receive significant income from its investments in SPACs (both prior to and after any acquisition or merger) and, therefore, the Fund’s investments in SPACs will not significantly contribute to the Fund’s distributions to shareholders; (iv) an attractive acquisition or merger target may not be identified at all, in which case the SPAC will be required to return any remaining monies to shareholders; (v) if an acquisition or merger target is identified, the Fund may elect not to participate in the proposed transaction or the Fund may be required to divest its interests in the SPAC due to regulatory or other considerations, in which case the warrants or other rights with respect to the SPAC held by the Fund may expire worthless or may be repurchased or retired by the SPAC at an unfavorable price; (vi) any proposed merger or acquisition may be unable to obtain the requisite approval, if any, of SPAC shareholders; (vii) under any circumstances in which the Fund receives a refund of all or a portion of its original investment (which typically represents a pro rata share of the proceeds of the SPAC’s assets, less any applicable taxes), the returns on that investment may be negligible, and the Fund may be subject to opportunity costs to the extent that alternative investments would have produced higher returns; (viii) to the extent an acquisition or merger is announced or completed, shareholders who redeem their shares prior to that time may not reap any resulting benefits; (ix) the Fund may be delayed in receiving any redemption or liquidation proceeds from a SPAC to which it is entitled; (x) an acquisition or merger once effected may prove unsuccessful and an investment in the SPAC may lose value; (xi) an investment in a SPAC may be diluted by additional later offerings of interests in the SPAC or by other investors exercising existing rights to purchase shares of the SPAC; (xii) only a thinly traded market for shares of or interests in a SPAC may develop, or there may be no market at all, leaving the Fund unable to sell its interest in a SPAC or to sell its interest only at a price below what the Fund believes is the SPAC interest’s intrinsic value; and (xiii) the values of investments in SPACs may be highly volatile and may depreciate significantly over time.
Strategy Risk — The Fund’s strategy of investing primarily in MLPs, resulting in its being taxed as a corporation, or a “C” corporation, rather than as a regulated investment company for U.S. federal income tax purposes, is a relatively new investment strategy for funds. This strategy involves complicated accounting, tax and valuation issues. Volatility in the NAV may be experienced because of the use of estimates at various times during a given year that may result in unexpected and potentially significant consequences for the Fund and its shareholders.
Tax Risks — Tax risks associated with investments in the Fund include but are not limited to the following:
Fund Structure Risk. Unlike traditional mutual funds that are structured as regulated investment companies for U.S. federal income tax purposes, the Fund will be taxable as a regular corporation, or “C” corporation, for U.S. federal income tax purposes. This means the Fund generally will be subject to U.S. federal income tax on its taxable income at the rates applicable to corporations (currently a maximum rate of 35%), and will also be subject to state and local income taxes.
MLP Tax Risk. MLPs are generally treated as partnerships for U.S. federal income tax purposes. Partnerships do not pay U.S. federal income tax at the partnership level. Rather, each partner is allocated a share of the partnership’s income, gains, losses, deductions and expenses. A change in current tax law or a change in the underlying business mix of a given MLP could result in an MLP being treated as a corporation for U.S. federal income tax purposes, which would result in the MLP being required to pay U.S. federal income tax (as well as state and local income taxes) on its taxable income. This would have the effect of reducing the amount of cash available for distribution by the MLP and could result in a reduction in the value of the Fund’s investment in the MLP and lower income to the Fund.
To the extent a distribution received by the Fund from an MLP is treated as a return of capital, the Fund’s adjusted tax basis in the interests of the MLP will be reduced, which may increase the Fund’s tax liability upon the sale of the interests in the MLP or upon subsequent distributions in respect of such interests.
33
GOLDMAN SACHS MLP ENERGY INFRASTRUCTURE FUND
Notes to Financial Statements (continued)
November 30, 2020
| 8. OTHER RISKS (continued) |
Tax Estimation/NAV Risk. In calculating the Fund’s daily NAV, the Fund will, among other things, include its current taxes and deferred tax liability and/or asset balances and related valuation balances, if any. The Fund may accrue a deferred income tax liability balance, at the currently effective statutory U.S. federal income tax rate (currently 21%) plus an estimated state and local income tax rate, for its future tax liability associated with the capital appreciation of its investments and the distributions received by the Fund on interests of MLPs considered to be return of capital and for any net operating gains. Any deferred tax liability balance will reduce the Fund’s NAV which could have an effect on the market price of the shares. The Fund may also record a deferred tax asset balance, which reflects an estimate of the Fund’s future tax benefit associated with net operating losses, capital loss carryforwards, and/or unrealized losses. Any deferred tax asset balance will increase the Fund’s NAV to the extent it exceeds any valuation allowance which could have an effect on the market price of the shares. The Fund will rely to some extent on information provided by MLPs, which may not be provided to the Fund on a timely basis, to estimate current taxes and deferred tax liability and/or asset balances for purposes of financial statement reporting and determining its NAV. The daily estimate of the Fund’s current taxes and deferred tax liability and/or asset balances used to calculate the Fund’s NAV could vary significantly from the Fund’s actual tax liability or benefit, and, as a result, the determination of the Fund’s actual tax liability or benefit may have a material impact on the Fund’s NAV. From time to time, the Fund may modify its estimates or assumptions regarding its current taxes and deferred tax liability and/or asset balances as new information becomes available, which modifications in estimates or assumptions may have a material impact on the Fund’s NAV.
| 9. INDEMNIFICATIONS |
Under the Trust’s organizational documents, its Trustees, officers, employees and agents are indemnified, to the extent permitted by the Act and state law, against certain liabilities that may arise out of performance of their duties to the Fund. Additionally, in the course of business, the Fund enters into contracts that contain a variety of indemnification clauses. The Fund’s maximum exposure under these arrangements is unknown, as this would involve future claims that may be made against the Funds that have not yet occurred. However, GSAM believes the risk of loss under these arrangements to be remote.
| 10. SUBSEQUENT EVENTS |
Subsequent events after the Statement of Assets and Liabilities date have been evaluated, and GSAM has concluded that there is no impact requiring adjustment or disclosure in the financial statements.
| 11. OTHER MATTERS |
On October 22, 2020, Goldman Sachs announced a settlement of matters involving 1Malaysia Development Bhd. (1MDB), a Malaysian sovereign wealth fund, with the United States Department of Justice as well as criminal and civil authorities in the UK, Singapore and Hong Kong. Further information regarding the 1MDB settlement can be found at https://www.goldmansachs.com/media-relations/press-releases/current/goldman-sachs-2020-10-22.html. The 1MDB settlement will not materially adversely affect GSAM’s ability to serve as investment manager.
34
GOLDMAN SACHS MLP ENERGY INFRASTRUCTURE FUND
| 12. SUMMARY OF SHARE TRANSACTIONS |
Share activity is as follows:
| MLP Energy Infrastructure Fund | ||||||||||||||||
|
|
||||||||||||||||
| For the Fiscal Year Ended November 30, 2020 |
For the Fiscal Year Ended November 30, 2019 |
|||||||||||||||
|
|
||||||||||||||||
| Shares | Dollars | Shares | Dollars | |||||||||||||
|
|
||||||||||||||||
| Class A Shares | ||||||||||||||||
| Shares sold |
2,466,485 | $ | 11,817,019 | 2,569,578 | $ | 16,195,173 | ||||||||||
| Reinvestment of distributions |
641,677 | 3,702,367 | 1,031,577 | 6,171,703 | ||||||||||||
| Shares reduced due to reverse split(a) |
(8,621,708 | ) | — | — | — | |||||||||||
| Shares redeemed |
(4,014,207 | ) | (21,505,544 | ) | (6,989,024 | ) | (43,318,436 | ) | ||||||||
| (9,527,753 | ) | (5,986,158 | ) | (3,387,869 | ) | (20,951,560 | ) | |||||||||
| Class C Shares | ||||||||||||||||
| Shares sold |
613,243 | 2,833,737 | 977,782 | 5,653,584 | ||||||||||||
| Reinvestment of distributions |
618,918 | 3,251,375 | 1,132,713 | 6,396,585 | ||||||||||||
| Shares reduced due to reverse split(a) |
(7,457,743 | ) | — | — | — | |||||||||||
| Shares redeemed |
(4,039,149 | ) | (19,976,017 | ) | (5,462,008 | ) | (31,631,218 | ) | ||||||||
| (10,264,731 | ) | (13,890,905 | ) | (3,351,513 | ) | (19,581,049 | ) | |||||||||
| Institutional Shares | ||||||||||||||||
| Shares sold |
37,171,754 | 179,771,517 | 45,682,735 | 292,520,825 | ||||||||||||
| Reinvestment of distributions |
2,784,973 | 15,731,700 | 6,000,078 | 36,862,569 | ||||||||||||
| Shares reduced due to reverse split(a) |
(40,771,338 | ) | — | — | — | |||||||||||
| Shares redeemed |
(82,143,437 | ) | (345,372,810 | ) | (57,864,269 | ) | (361,372,991 | ) | ||||||||
| (82,958,048 | ) | (149,869,593 | ) | (6,181,456 | ) | (31,989,597 | ) | |||||||||
| Investor Shares | ||||||||||||||||
| Shares sold |
4,839,436 | 25,460,118 | 8,448,853 | 52,657,289 | ||||||||||||
| Reinvestment of distributions |
776,226 | 4,311,050 | 1,572,291 | 9,585,878 | ||||||||||||
| Shares reduced due to reverse split(a) |
(9,133,496 | ) | — | — | — | |||||||||||
| Shares redeemed |
(13,108,521 | ) | (68,412,538 | ) | (13,519,706 | ) | (85,555,997 | ) | ||||||||
| (16,626,355 | ) | (38,641,370 | ) | (3,498,562 | ) | (23,312,830 | ) | |||||||||
| Class R6 Shares | ||||||||||||||||
| Shares sold |
26,275,592 | 100,343,017 | 12,452,892 | 75,808,866 | ||||||||||||
| Reinvestment of distributions |
2,415,659 | 14,964,119 | 2,033,495 | 12,386,090 | ||||||||||||
| Shares reduced due to reverse split(a) |
(42,783,974 | ) | — | — | — | |||||||||||
| Shares redeemed |
(6,348,000 | ) | (68,769,966 | ) | (15,206,078 | ) | (101,828,358 | ) | ||||||||
| (20,440,723 | ) | 46,537,170 | (719,691 | ) | (13,633,402 | ) | ||||||||||
| Class R Shares | ||||||||||||||||
| Shares sold |
118,698 | 539,750 | 83,201 | 511,762 | ||||||||||||
| Reinvestment of distributions |
14,229 | 83,728 | 28,205 | 167,841 | ||||||||||||
| Shares reduced due to reverse split(a) |
(212,268 | ) | — | — | — | |||||||||||
| Shares redeemed |
(70,842 | ) | (505,060 | ) | (272,734 | ) | (1,663,168 | ) | ||||||||
| (150,183 | ) | 118,418 | (161,328 | ) | (983,565 | ) | ||||||||||
| Class P Shares | ||||||||||||||||
| Shares sold |
131,039,384 | 648,833,429 | 75,175,811 | 474,120,092 | ||||||||||||
| Reinvestment of distributions |
8,152,871 | 49,952,163 | 12,778,086 | 78,663,901 | ||||||||||||
| Shares reduced due to reverse split(a) |
(102,974,135 | ) | — | — | — | |||||||||||
| Shares redeemed |
(162,669,956 | ) | (723,338,648 | ) | (95,395,447 | ) | (581,152,229 | ) | ||||||||
| (126,451,836 | ) | (24,553,056 | ) | (7,441,550 | ) | (28,368,236 | ) | |||||||||
| NET DECREASE |
(266,419,629 | ) | $ | (186,285,494 | ) | (24,741,969 | ) | $ | (138,820,239 | ) | ||||||
| (a) | On June 5, 2020, the Goldman Sachs MLP Energy Infrastructure Fund effected a 5-for-1 reverse share split. |
35
Report of Independent Registered Public Accounting Firm
To the Board of Trustees of Goldman Sachs Trust and Shareholders of Goldman Sachs MLP Energy Infrastructure Fund
Opinion on the Financial Statements
We have audited the accompanying statement of assets and liabilities, including the schedule of investments, of Goldman Sachs MLP Energy Infrastructure Fund (one of the funds constituting Goldman Sachs Trust, referred to hereafter as the “Fund”) as of November 30, 2020, the related statement of operations for the year ended November 30, 2020, the statements of changes in net assets for each of the two years in the period ended November 30, 2020, including the related notes, and the financial highlights for each of the periods indicated therein (collectively referred to as the “financial statements”). In our opinion, the financial statements present fairly, in all material respects, the financial position of the Fund as of November 30, 2020, the results of its operations for the year then ended, the changes in its net assets for each of the two years in the period ended November 30, 2020 and the financial highlights for each of the periods indicated therein in conformity with accounting principles generally accepted in the United States of America.
Basis for Opinion
These financial statements are the responsibility of the Fund’s management. Our responsibility is to express an opinion on the Fund’s financial statements based on our audits. We are a public accounting firm registered with the Public Company Accounting Oversight Board (United States) (PCAOB) and are required to be independent with respect to the Fund in accordance with the U.S. federal securities laws and the applicable rules and regulations of the Securities and Exchange Commission and the PCAOB.
We conducted our audits of these financial statements in accordance with the standards of the PCAOB. Those standards require that we plan and perform the audit to obtain reasonable assurance about whether the financial statements are free of material misstatement, whether due to error or fraud.
Our audits included performing procedures to assess the risks of material misstatement of the financial statements, whether due to error or fraud, and performing procedures that respond to those risks. Such procedures included examining, on a test basis, evidence regarding the amounts and disclosures in the financial statements. Our audits also included evaluating the accounting principles used and significant estimates made by management, as well as evaluating the overall presentation of the financial statements. Our procedures included confirmation of securities owned as of November 30, 2020 by correspondence with the custodian, transfer agent and brokers; when replies were not received from brokers, we performed other auditing procedures. We believe that our audits provide a reasonable basis for our opinion.
Boston, Massachusetts
January 26, 2021
We have served as the auditor of one or more investment companies in the Goldman Sachs fund complex since 2000.
36
GOLDMAN SACHS MLP ENERGY INFRASTRUCTURE FUND
|
Fund Expenses — Six Month Period Ended November 30, 2020 (Unaudited) |
||
As a shareholder of Class A, Class C, Institutional, Investor, Class R6, Class R and Class P Shares of the Fund, you incur two types of costs: (1) transaction costs, including sales charges on purchase payments (with respect to Class A Shares), contingent deferred sales charges on redemptions (with respect to Class C Shares), and (2) ongoing costs, including management fees; distribution and service (12b-1) fees (with respect to Class A, Class C and Class R Shares); and other Fund expenses. This example is intended to help you understand your ongoing costs (in dollars) of investing in Class A, Class C, Institutional, Investor, Class R6, Class R and Class P Shares of the Fund and to compare these costs with the ongoing costs of investing in other mutual funds.
The example is based on an investment of $1,000 invested at the beginning of the period and held for the entire period from June 1, 2020 through November 30, 2020, which represents a period of 183 days in a 366 day year.
Actual Expenses — The first line under each share class in the table below provides information about actual account values and actual expenses. You may use the information in this line, together with the amount you invested, to estimate the expenses that you paid over the period. Simply divide your account value by $1,000 (for example, an $8,600 account value divided by $1,000=8.6), then multiply the result by the number in the first line under the heading entitled “Expenses Paid” to estimate the expenses you paid on your account during this period.
Hypothetical Example for Comparison Purposes — The second line under each share class in the table below provides information about hypothetical account values and hypothetical expenses based on the Fund’s actual net expense ratios and an assumed rate of return of 5% per year before expenses, which is not the Fund’s actual return. The hypothetical account values and expenses may not be used to estimate the actual ending account balance or expenses you paid for the period. You may use this information to compare the ongoing costs of investing in the Fund and other funds. To do so, compare this 5% hypothetical example with the 5% hypothetical examples that appear in the shareholder reports of the other funds.
Please note that the expenses shown in the table are meant to highlight your ongoing costs only and do not reflect any transactional costs, such as sales charges, redemption fees, or exchange fees. Therefore, the second line of the table is useful in comparing ongoing costs only, and will not help you determine the relative total costs of owning different funds. In addition, if these transactional costs were included, your costs would have been higher.
| MLP Energy Infrastructure Fund | ||||||||||||
| Share Class | Beginning Account Value 6/1/20 |
Ending Account Value 11/30/20 |
Expenses Paid for the 6 months ended 11/30/20* |
|||||||||
| Class A | ||||||||||||
|
Actual |
$ | 1,000.00 | $ | 993.70 | $ | 7.58 | ||||||
|
Hypothetical 5% return |
1,000.00 | 1,017.40 | + | 7.67 | ||||||||
| Class C | ||||||||||||
|
Actual |
1,000.00 | 991.20 | 11.30 | |||||||||
|
Hypothetical 5% return |
1,000.00 | 1,013.65 | + | 11.43 | ||||||||
| Institutional | ||||||||||||
|
Actual |
1,000.00 | 994.40 | 5.73 | |||||||||
|
Hypothetical 5% return |
1,000.00 | 1,019.25 | + | 5.81 | ||||||||
| Investor | ||||||||||||
|
Actual |
1,000.00 | 994.80 | 6.38 | |||||||||
|
Hypothetical 5% return |
1,000.00 | 1,018.60 | + | 6.46 | ||||||||
| Class R6 | ||||||||||||
|
Actual |
1,000.00 | 994.50 | 5.63 | |||||||||
|
Hypothetical 5% return |
1,000.00 | 1,019.35 | + | 5.70 | ||||||||
| Class R | ||||||||||||
|
Actual |
1,000.00 | 991.80 | 8.81 | |||||||||
|
Hypothetical 5% return |
1,000.00 | 1,016.15 | + | 8.92 | ||||||||
| Class P | ||||||||||||
|
Actual |
1,000.00 | 994.50 | 5.63 | |||||||||
|
Hypothetical 5% return |
1,000.00 | 1,019.35 | + | 5.70 | ||||||||
| * | Expenses for each share class are calculated using the Fund’s annualized net expense ratio for each class, which represents the ongoing expenses as a percentage of net assets for the six months ended November 30, 2020. Deferred tax benefit (expense) is not included in the ratio calculation. Expenses are calculated by multiplying the annualized net expense ratio by the average account value for the period; then multiplying the result by the number of days in the most recent fiscal half year; and then dividing that result by the number of days in the fiscal year. The annualized net expense ratios for the period were as follows: |
| Fund | Class A | Class C | Institutional | Investor | Class R6 | Class R | Class P | |||||||||||||||||||||
| MLP Energy Infrastructure |
1.52 | % | 2.27 | % | 1.15 | % | 1.28 | % | 1.13 | % | 1.77 | % | 1.13 | % | ||||||||||||||
| + | Hypothetical expenses are based on the Fund’s actual annualized net expense ratio (excluding proxy fee which is not annualized) and an assumed rate of return of 5% per year before expenses. |
37
GOLDMAN SACHS MLP ENERGY INFRASTRUCTURE FUND
Statement Regarding Basis for Approval of Management Agreement (Unaudited)
Background
The Goldman Sachs MLP Energy Infrastructure Fund (the “Fund”) is an investment portfolio of Goldman Sachs Trust (the “Trust”). The Board of Trustees oversees the management of the Trust and reviews the investment performance and expenses of the Fund at regularly scheduled meetings held throughout the year. In addition, the Board of Trustees determines annually whether to approve the continuance of the Trust’s investment management agreement (the “Management Agreement”) with Goldman Sachs Asset Management, L.P. (the “Investment Adviser”) on behalf of the Fund.
The Management Agreement was most recently approved for continuation until June 30, 2021 by the Board of Trustees, including those Trustees who are not parties to the Management Agreement or “interested persons” (as defined in the Investment Company Act of 1940, as amended) of any party thereto (the “Independent Trustees”), at a meeting held on June 16-17, 2020 (the “Annual Meeting”).
The review process undertaken by the Trustees spans the course of the year and culminates with the Annual Meeting. To assist the Trustees in their deliberations, the Trustees have established a Contract Review Committee (the “Committee”), comprised of the Independent Trustees. The Committee held two meetings over the course of the year since the Management Agreement was last approved. At those Committee meetings, regularly scheduled Board or other committee meetings, and/or the Annual Meeting, matters relevant to the renewal of the Management Agreement were considered by the Board, or the Independent Trustees, as applicable. With respect to the Fund, such matters included:
| (a) | the nature and quality of the advisory, administrative, and other services provided to the Fund by the Investment Adviser and its affiliates, including information about: |
| (i) | the structure, staff, and capabilities of the Investment Adviser and its portfolio management teams; |
| (ii) | the groups within the Investment Adviser and its affiliates that support the portfolio management teams or provide other types of necessary services, including fund services groups (e.g., accounting and financial reporting, tax, shareholder services, and operations); controls and risk management groups (e.g., legal, compliance, valuation oversight, credit risk management, internal audit, compliance testing, market risk analysis, finance, and central funding); sales and distribution support groups, and others (e.g., information technology and training); |
| (iii) | trends in employee headcount; |
| (iv) | the Investment Adviser’s financial resources and ability to hire and retain talented personnel and strengthen its operations; and |
| (v) | the parent company’s support of the Investment Adviser and its mutual fund business, as expressed by the firm’s senior management; |
| (b) | information on the investment performance of the Fund, including comparisons to the performance of similar mutual funds, as provided by a third-party mutual fund data provider engaged as part of the contract review process (the “Outside Data Provider”), and a benchmark performance index; and information on general investment outlooks in the markets in which the Fund invests; |
| (c) | information provided by the Investment Adviser indicating the Investment Adviser’s views on whether the Fund’s peer group and/or benchmark index had high, medium, or low relevance given the Fund’s particular investment strategy; |
| (d) | the terms of the Management Agreement and other agreements with affiliated service providers entered into by the Trust on behalf of the Fund; |
| (e) | fee and expense information for the Fund, including: |
| (i) | the relative management fee and expense levels of the Fund as compared to those of comparable funds managed by other advisers, as provided by the Outside Data Provider; |
| (ii) | the Fund’s expense trends over time; and |
| (iii) | to the extent the Investment Adviser manages other types of accounts (such as bank collective trusts, private wealth management accounts, institutional separate accounts, sub-advised mutual funds, and non-U.S. funds) having investment objectives and policies similar to those of the Fund, comparative information on the advisory fees charged and services provided to those accounts by the Investment Adviser; |
| (f) | with respect to the extensive investment performance and expense comparison data provided by the Outside Data Provider, its processes in producing that data for the Fund; |
| (g) | the undertakings of the Investment Adviser and its affiliates to implement fee waivers and/or expense limitations; |
| (h) | information relating to the profitability of the Management Agreement and the transfer agency and distribution and service arrangements of the Fund to the Investment Adviser and its affiliates; |
| (i) | whether the Fund’s existing management fee schedule adequately addressed any economies of scale; |
38
GOLDMAN SACHS MLP ENERGY INFRASTRUCTURE FUND
Statement Regarding Basis for Approval of Management Agreement (Unaudited) (continued)
| (j) | a summary of the “fall-out” benefits derived by the Investment Adviser and its affiliates from their relationships with the Fund, including the fees received by the Investment Adviser’s affiliates from the Fund for transfer agency, portfolio trading, distribution and other services; |
| (k) | a summary of potential benefits derived by the Fund as a result of its relationship with the Investment Adviser; |
| (l) | information regarding commissions paid by the Fund and broker oversight, an update on the Investment Adviser’s soft dollars practices, other information regarding portfolio trading, and how the Investment Adviser carries out its duty to seek best execution; |
| (m) | portfolio manager ownership of Fund shares; the manner in which portfolio manager compensation is determined; and the number and types of accounts managed by the portfolio managers; |
| (n) | the nature and quality of the services provided to the Fund by its unaffiliated service providers, and the Investment Adviser’s general oversight and evaluation (including reports on due diligence) of those service providers as part of the administrative services provided under the Management Agreement; and |
| (o) | the Investment Adviser’s processes and policies addressing various types of potential conflicts of interest; its approach to risk management; the annual review of the effectiveness of the Fund’s compliance program; and periodic compliance reports. |
The Trustees also received an overview of the Fund’s distribution arrangements. They received information regarding the Fund’s assets, share purchase and redemption activity, and payment of distribution and service fees. Information was also provided to the Trustees relating to revenue sharing payments made by and services provided by the Investment Adviser and its affiliates to intermediaries that promote the sale, distribution, and/or servicing of Fund shares. The Independent Trustees also discussed the broad range of other investment choices that are available to Fund investors, including the availability of comparable funds managed by other advisers.
The presentations made at the Board and Committee meetings and at the Annual Meeting encompassed the Fund and other mutual funds for which the Board of Trustees has responsibility. In evaluating the Management Agreement at the Annual Meeting, the Trustees relied upon their knowledge, resulting from their meetings and other interactions throughout the year, of the Investment Adviser and its affiliates, their services, and the Fund. In conjunction with these meetings, the Trustees received written materials and oral presentations on the topics covered, and the Investment Adviser addressed the questions and concerns of the Trustees, including concerns regarding the investment performance of certain of the funds they oversee. The Independent Trustees were advised by their independent legal counsel regarding their responsibilities and other regulatory requirements related to the approval and continuation of mutual fund investment management agreements under applicable law. In addition, the Investment Adviser and its affiliates provided the Independent Trustees with a written response to a formal request for information sent on behalf of the Independent Trustees by their independent legal counsel. During the course of their deliberations, the Independent Trustees met in executive sessions with their independent legal counsel, without representatives of the Investment Adviser or its affiliates present.
Nature, Extent, and Quality of the Services Provided Under the Management Agreement
As part of their review, the Trustees considered the nature, extent, and quality of the services provided to the Fund by the Investment Adviser. In this regard, the Trustees considered both the investment advisory services and non-advisory services that are provided by the Investment Adviser and its affiliates. The Trustees noted the transition in the leadership and changes in personnel of various of the Investment Adviser’s portfolio management teams that had occurred in recent periods, and the ongoing recruitment efforts aimed at bringing high quality investment talent to the Investment Adviser. They also noted the Investment Adviser’s commitment to maintaining high quality systems and expending substantial resources to respond to ongoing changes to the market, regulatory and control environment in which the Fund and its service providers operate, including changes associated with the COVID-19 pandemic, as well as the efforts of the Investment Adviser and its affiliates to combat cyber security risks. The Trustees also considered information regarding the Investment Adviser’s business continuity planning and remote operations in the current environment. The Trustees concluded that the Investment Adviser continued to commit substantial financial and operational resources to the Fund and expressed confidence that the Investment Adviser would continue to do so in the future. The Trustees also recognized that the Investment Adviser had made significant commitments to address regulatory compliance requirements applicable to the Fund and the Investment Adviser and its affiliates.
Investment Performance
The Trustees also considered the investment performance of the Fund. In this regard, they compared the investment performance of the Fund to its peers using rankings and ratings compiled by the Outside Data Provider as of December 31, 2019, and updated performance information prepared by the Investment Adviser using the peer group identified by the Outside Data
39
GOLDMAN SACHS MLP ENERGY INFRASTRUCTURE FUND
Statement Regarding Basis for Approval of Management Agreement (Unaudited) (continued)
Provider as of March 31, 2020. The information on the Fund’s investment performance was provided for the one-, three-, and five-year periods ending on the applicable dates. The Trustees also reviewed the Fund’s investment performance relative to its performance benchmark. As part of this review, they considered the investment performance trends of the Fund over time, and reviewed the investment performance of the Fund in light of its investment objective and policies and market conditions.
In addition, the Trustees considered materials prepared and presentations made by the Investment Adviser’s senior management and portfolio management personnel in which Fund performance was assessed. The Trustees also considered the Investment Adviser’s periodic reports with respect to the Fund’s risk profile, and how the Investment Adviser’s approach to risk monitoring and management influences portfolio management.
The Trustees observed that the Fund’s Institutional Shares had placed in the third quartile of the Fund’s peer group and had outperformed the Fund’s benchmark index for the one-, three-, and five-year periods ended March 31, 2020. They also considered that in June 2020 the Fund would be repositioned, which involved changes to the Fund’s investment strategy.
Costs of Services Provided and Competitive Information
The Trustees considered the contractual terms of the Management Agreement and the fee rates payable by the Fund thereunder. In this regard, the Trustees considered information on the services rendered by the Investment Adviser to the Fund, which included both advisory and administrative services that were directed to the needs and operations of the Fund as a registered mutual fund.
In particular, the Trustees reviewed analyses prepared by the Outside Data Provider regarding the expense rankings of the Fund. The analyses provided a comparison of the Fund’s management fee and breakpoints to those of a relevant peer group and category universe; an expense analysis which compared the Fund’s overall net and gross expenses to a peer group and a category universe; and data comparing the Fund’s net expenses to the peer and category medians. The analyses also compared the Fund’s other expenses and fee waivers/reimbursements to those of the peer group and category medians. The Trustees concluded that the comparisons provided by the Outside Data Provider were useful in evaluating the reasonableness of the management fees and total expenses paid by the Fund.
In addition, the Trustees considered the Investment Adviser’s undertakings to implement fee waivers and/or expense limitations. They also considered, to the extent that the Investment Adviser manages other types of accounts having investment objectives and policies similar to those of the Fund, comparative fee information for services provided by the Investment Adviser to those accounts, and information that indicated that services provided to the Fund differed in various significant respects from the services provided to other types of accounts which, in many cases, operated under less stringent legal and regulatory structures, required fewer services from the Investment Adviser to a smaller number of client contact points, and were less time-intensive.
In addition, the Trustees noted that shareholders are able to redeem their Fund shares at any time if shareholders believe that the Fund fees and expenses are too high or if they are dissatisfied with the performance of the Fund.
Profitability
The Trustees reviewed the Fund’s contribution to the Investment Adviser’s revenues and pre-tax profit margins. In this regard the Trustees noted that they had received, among other things, profitability analyses and summaries, revenue and expense schedules by Fund and by function (i.e., investment management, transfer agency and distribution and service), and information on the Investment Adviser’s expense allocation methodology. They observed that the profitability and expense figures are substantially similar to those used by the Investment Adviser for many internal purposes, including compensation decisions among various business groups, and are thus subject to a vigorous internal debate about how certain revenue and expenses should be allocated. The Trustees also noted that the internal audit group within the Goldman Sachs organization periodically audits the expense allocation methodology and that the internal audit group was satisfied with the reasonableness, consistency, and accuracy of the Investment Adviser’s expense allocation methodology. Profitability data for the Fund was provided for 2019 and 2018, and the Trustees considered this information in relation to the Investment Adviser’s overall profitability.
Economies of Scale
The Trustees considered the information that had been provided regarding whether there have been economies of scale with respect to the management of the Fund. The Trustees also considered the breakpoints in the fee rate payable under the Management Agreement for the Fund at the following annual percentage rates of the average daily net assets of the Fund:
| First $1 billion |
1.00 | % | ||
| Next $1 billion |
0.90 | |||
| Next $3 billion |
0.86 | |||
| Next $3 billion |
0.84 | |||
| Over $8 billion |
0.82 | |||
40
GOLDMAN SACHS MLP ENERGY INFRASTRUCTURE FUND
Statement Regarding Basis for Approval of Management Agreement (Unaudited) (continued)
The Trustees noted that the breakpoints were designed to share potential economies of scale, if any, with the Fund and its shareholders as assets under management reach those asset levels. The Trustees considered the amount of assets in the Fund; the Fund’s recent share purchase and redemption activity; the information provided by the Investment Adviser relating to the costs of the services provided by the Investment Adviser and its affiliates and their realized profits; information comparing fee rates charged by the Investment Adviser with fee rates charged to other funds in the peer group; and the Investment Adviser’s undertaking to limit certain expenses of the Fund that exceed a specified level. Upon reviewing these matters at the Annual Meeting, the Trustees concluded that the fee breakpoints represented a means of assuring that benefits of scalability, if any, would be passed along to shareholders at the specified asset levels. They also noted that the Investment Adviser had passed along savings to shareholders of the Fund, which had asset levels above at least the first breakpoint during the prior fiscal year.
Other Benefits to the Investment Adviser and Its Affiliates
The Trustees also considered the other benefits derived by the Investment Adviser and its affiliates from their relationships with the Fund as stated above, including: (a) transfer agency fees received by Goldman Sachs & Co. LLC (“Goldman Sachs”); (b) brokerage and futures commissions earned by Goldman Sachs for executing securities and futures transactions on behalf of the Fund; (c) research received by the Investment Adviser from broker-dealers in exchange for executing certain transactions on behalf of the Fund; (d) trading efficiencies resulting from aggregation of orders of the Fund with those for other funds or accounts managed by the Investment Adviser; (e) the Investment Adviser’s ability to leverage the infrastructure designed to service the Fund on behalf of its other clients; (f) the Investment Adviser’s ability to cross-market other products and services to Fund shareholders; (g) Goldman Sachs’ retention of certain fees as Fund Distributor; (h) the Investment Adviser’s ability to negotiate better pricing with custodians on behalf of its other clients, as a result of the relationship with the Fund; (i) the investment of cash in money market funds managed by the Investment Adviser that will result in increased assets under management for those money market funds; and (j) the possibility that the working relationship between the Investment Adviser and the Fund’s third-party service providers may cause those service providers to be more likely to do business with other areas of Goldman Sachs. In the course of considering the foregoing, the Independent Trustees requested and received further information quantifying certain of these fall-out benefits.
Other Benefits to the Fund and Its Shareholders
The Trustees also noted that the Fund receives certain other potential benefits as a result of its relationship with the Investment Adviser, including: (a) trading efficiencies resulting from aggregation of orders of the Fund with those of other funds or accounts managed by the Investment Adviser; (b) enhanced servicing from vendors due to the volume of business generated by the Investment Adviser and its affiliates; (c) enhanced servicing from broker-dealers due to the volume of business generated by the Investment Adviser and its affiliates; (d) the Investment Adviser’s ability to negotiate favorable terms with derivatives counterparties on behalf of the Fund as a result of the size and reputation of the Goldman Sachs organization; (e) the advantages received from the Investment Adviser’s knowledge and experience gained from managing other accounts and products; (f) the Investment Adviser’s ability to hire and retain qualified personnel to provide services to the Fund because of the reputation of the Goldman Sachs organization; (g) the Fund’s access, through the Investment Adviser, to certain firm-wide resources (e.g., proprietary risk management systems and databases), subject to certain restrictions; and (h) the Fund’s access to certain affiliated distribution channels. In addition, the Trustees noted the competitive nature of the mutual fund marketplace, and considered that many of the Fund’s shareholders invested in the Fund in part because of the Fund’s relationship with the Investment Adviser and that those shareholders have a general expectation that the relationship will continue.
Conclusion
In connection with their consideration of the Management Agreement, the Trustees gave weight to each of the factors described above, but did not identify any particular factor as controlling their decision. After deliberation and consideration of all of the information provided, including the factors described above, the Trustees concluded, in the exercise of their business judgment, that the management fees paid by the Fund were reasonable in light of the services provided to it by the Investment Adviser, the Investment Adviser’s costs and the Fund’s current and reasonably foreseeable asset levels. The Trustees unanimously concluded that the Investment Adviser’s continued management likely would benefit the Fund and its shareholders and that the Management Agreement should be approved and continued with respect to the Fund until June 30, 2021.
41
GOLDMAN SACHS MLP ENERGY INFRASTRUCTURE FUND
Voting Results of Special Meeting of Shareholders (Unaudited)
A Special Meeting (the “Meeting”) of the Goldman Sachs Trust (“GST”) was held on January 23, 2020 to consider and act upon the proposals below. The Portfolio will amortize its respective share of the proxy, shareholder meeting and other related costs and GSAM has agreed to reimburse the Portfolio to the extent such expenses exceed a specified percentage of the Portfolio’s net assets.
At the Meeting, Dwight L. Bush, Kathryn A. Cassidy, Joaquin Delgado and Gregory G. Weaver were elected to the Trust’s Board of Trustees. In electing trustees, the Trust’s shareholders voted as follows:
| Proposal 1. Election of Trustees |
For |
Against |
Withheld | Broker Non-Votes | ||||||||||||
| Dwight L. Bush |
94,278,961,728.065 | 0 | 349,026,343.365 | 0 | ||||||||||||
| Kathryn A. Cassidy |
94,310,850,789.164 | 0 | 317,137,282.266 | 0 | ||||||||||||
| Joaquin Delgado |
94,282,646,444.727 | 0 | 345,341,626.703 | 0 | ||||||||||||
| Gregory G. Weaver |
94,306,589,873.348 | 0 | 321,398,198.082 | 0 | ||||||||||||
42
GOLDMAN SACHS MLP ENERGY INFRASTRUCTURE FUND
Trustees and Officers (Unaudited)
Independent Trustees
| Name, Address and Age1 |
Position(s) Held with the Trust |
Term of Office and Length of Time Served2 |
Principal Occupation(s) During Past 5 Years |
Number of Portfolios in Fund Complex Overseen by Trustee3 |
Other Directorships Held by Trustee4 | |||||
| Jessica Palmer Age: 71 |
Chair of the Board of Trustees | Since 2018 (Trustee since 2007) |
Ms. Palmer is retired. She was formerly Consultant, Citigroup Human Resources Department (2007-2008); Managing Director, Citigroup Corporate and Investment Banking (previously, Salomon Smith Barney/ Salomon Brothers) (1984-2006). Ms. Palmer was a Member of the Board of Trustees of Indian Mountain School (private elementary and secondary school) (2004-2009).
Chair of the Board of Trustees — Goldman Sachs Trust and Goldman Sachs Variable Insurance Trust. |
105 | None | |||||
| Dwight L. Bush Age: 63 |
Trustee | Since 2020 | Ambassador Bush is President and CEO of D.L. Bush & Associates (a financial advisory and private investment firm) (2002-2014 and 2017-present); and was formerly U.S. Ambassador to the Kingdom of Morocco (2014-2017) and a Member of the Board of Directors of Santander Bank, N.A. (2018-2019). Previously, Ambassador Bush served as an Advisory Board Member of Goldman Sachs Trust and Goldman Sachs Variable Insurance Trust (October 2019-January 2020).
Trustee — Goldman Sachs Trust and Goldman Sachs Variable Insurance Trust. |
105 | None | |||||
| Kathryn A. Cassidy Age: 66 |
Trustee | Since 2015 | Ms. Cassidy is retired. Formerly, she was Advisor to the Chairman (May 2014-December 2014); and Senior Vice President and Treasurer (2008-2014), General Electric Company & General Electric Capital Corporation (technology and financial services companies).
Trustee — Goldman Sachs Trust and Goldman Sachs Variable Insurance Trust. |
105 |
None | |||||
| Diana M. Daniels Age: 71 |
Trustee | Since 2007 | Ms. Daniels is retired. Formerly, she was Vice President, General Counsel and Secretary, The Washington Post Company (1991-2006). Ms. Daniels is a Trustee Emeritus and serves as a Presidential Councillor of Cornell University (2013-Present); former Member of the Legal Advisory Board, New York Stock Exchange (2003-2006) and of the Corporate Advisory Board, Standish Mellon Management Advisors (2006- 2007).
Trustee — Goldman Sachs Trust and Goldman Sachs Variable Insurance Trust. |
105 | None | |||||
| Joaquin Delgado Age: 60 |
Trustee | Since 2020 | Dr. Delgado is retired. He is Director, Hexion Inc. (a specialty chemical manufacturer) (2019-present); and Director, Stepan Company (a specialty chemical manufacturer) (2011-present); and was formerly Executive Vice President, Consumer Business Group of 3M Company (July 2016-July 2019); and Executive Vice President, Health Care Business Group of 3M Company (October 2012-July 2016). Previously, Dr. Delgado served as an Advisory Board Member of Goldman Sachs Trust and Goldman Sachs Variable Insurance Trust (October 2019-January 2020).
Trustee — Goldman Sachs Trust and Goldman Sachs Variable Insurance Trust |
105 | Stepan Company (a specialty chemical manufacturer) | |||||
| Roy W. Templin Age: 60 |
Trustee | Since 2013 | Mr. Templin is retired. He is Director, Armstrong World Industries, Inc. (a designer and manufacturer of ceiling, wall and suspension system solutions) (2016-Present); and was formerly Chairman of the Board of Directors, Con-Way Incorporated (a transportation, logistics and supply chain management service company) (2014-2015); Executive Vice President and Chief Financial Officer, Whirlpool Corporation (an appliance manufacturer and marketer) (2004- 2012).
Trustee — Goldman Sachs Trust and Goldman Sachs Variable Insurance Trust. |
105 | Armstrong World Industries, Inc. (a ceiling, wall and suspension systems solutions manufacturer) | |||||
| Gregory G. Weaver Age: 69 |
Trustee | Since 2015 | Mr. Weaver is retired. He is Director, Verizon Communications Inc. (2015-Present); and was formerly Chairman and Chief Executive Officer, Deloitte & Touche LLP (a professional services firm) (2001-2005 and 2012-2014); and Member of the Board of Directors, Deloitte & Touche LLP (2006-2012).
Trustee — Goldman Sachs Trust and Goldman Sachs Variable Insurance Trust. |
105 | Verizon Communications Inc. | |||||
43
GOLDMAN SACHS MLP ENERGY INFRASTRUCTURE FUND
Trustees and Officers (Unaudited) (continued)
Interested Trustee*
| Name, Address and Age1 |
Position(s) Held with the Trust |
Term of Office and Length of Time Served2 |
Principal Occupation(s) During Past 5 Years |
Number of Portfolios in Fund Complex Overseen by Trustee3 |
Other Directorships Held by Trustee4 | |||||
| James A. McNamara Age: 58 |
President and Trustee | Since 2007 | Advisory Director, Goldman Sachs (January 2018-Present); Managing Director, Goldman Sachs (January 2000-December 2017); Director of Institutional Fund Sales, GSAM (April 1998-December 2000); and Senior Vice President and Manager, Dreyfus Institutional Service Corporation (January 1993- April 1998).
President and Trustee — Goldman Sachs Trust; Goldman Sachs Variable Insurance Trust; Goldman Sachs Trust II; Goldman Sachs MLP and Energy Renaissance Fund; Goldman Sachs ETF Trust; Goldman Sachs Credit Income Fund; and Goldman Sachs Real Estate Diversified Income Fund.
|
164 | None | |||||
| * | Mr. McNamara is considered to be an “Interested Trustee” because he holds positions with Goldman Sachs and owns securities issued by The Goldman Sachs Group, Inc. Mr. McNamara holds comparable positions with certain other companies of which Goldman Sachs, GSAM or an affiliate thereof is the investment adviser, administrator and/or distributor. |
| 1 | Each Trustee may be contacted by writing to the Trustee, c/o Goldman Sachs, 200 West Street, New York, New York, 10282, Attn: Caroline Kraus. Information is provided as of November 30, 2020. |
| 2 | Subject to such policies as may be adopted by the Board from time-to-time, each Trustee holds office for an indefinite term, until the earliest of: (a) the election of his or her successor; (b) the date the Trustee resigns or is removed by the Board or shareholders, in accordance with the Trust’s Declaration of Trust; or (c) the termination of the Trust. The Board has adopted policies which provide that each Independent Trustee shall retire as of December 31st of the calendar year in which he or she reaches (a) his or her 75th birthday or (b) the 15th anniversary of the date he or she became a Trustee, whichever is earlier, unless a waiver of such requirements shall have been adopted by a majority of the other Trustees. These policies may be changed by the Trustees without shareholder vote. |
| 3 | The Goldman Sachs Fund Complex includes certain other companies listed above for each respective Trustee. As of November 30, 2020, Goldman Sachs Trust consisted of 92 portfolios (90 of which offered shares to the public); Goldman Sachs Variable Insurance Trust consisted of 13 portfolios; Goldman Sachs Trust II consisted of 19 portfolios (17 of which offered shares to the public); Goldman Sachs ETF Trust consisted of 37 portfolios (20 of which offered shares to the public); and Goldman Sachs MLP and Energy Renaissance Fund, Goldman Sachs Credit Income Fund and Goldman Sachs Real Estate Diversified Income Fund each consisted of one portfolio. Goldman Sachs Credit Income Fund did not offer shares to the public. |
| 4 | This column includes only directorships of companies required to report to the Securities and Exchange Commission under the Securities Exchange Act of 1934 (i.e., “public companies”) or other investment companies registered under the Act. |
Additional information about the Trustees is available in the Fund’s Statement of Additional Information, which can be obtained from Goldman Sachs free of charge by calling this toll-free number (in the United States of America): 1-800-526-7384.
44
GOLDMAN SACHS MLP ENERGY INFRASTRUCTURE FUND
Trustees and Officers (Unaudited) (continued)
Officers of the Trust*
| Name, Address and Age1 |
Position(s) Held with the Trust |
Term of Office and |
Principal Occupation(s) During Past 5 Years | |||
| James A. McNamara 200 West Street New York, NY 10282 Age: 58 |
Trustee and President | Since 2007 | Advisory Director, Goldman Sachs (January 2018-Present); Managing Director, Goldman Sachs (January 2000-December 2017); Director of Institutional Fund Sales, GSAM (April 1998-December 2000); and Senior Vice President and Manager, Dreyfus Institutional Service Corporation (January 1993-April 1998).
President and Trustee — Goldman Sachs Trust; Goldman Sachs Variable Insurance Trust; Goldman Sachs Trust II; Goldman Sachs MLP and Energy Renaissance Fund; Goldman Sachs ETF Trust; Goldman Sachs Credit Income Fund; and Goldman Sachs Real Estate Diversified Income Fund. | |||
| Caroline L. Kraus 200 West Street New York, NY 10282 Age: 43 |
Secretary | Since 2012 | Managing Director, Goldman Sachs (January 2016-Present); Vice President, Goldman Sachs (August 2006-December 2015); Senior Counsel, Goldman Sachs (January 2020-Present); Associate General Counsel, Goldman Sachs (2012-December 2019); Assistant General Counsel, Goldman Sachs (August 2006-December 2011); and Associate, Weil, Gotshal & Manges, LLP (2002-2006).
Secretary — Goldman Sachs Trust (previously Assistant Secretary (2012)); Goldman Sachs Variable Insurance Trust (previously Assistant Secretary (2012)); Goldman Sachs Trust II; Goldman Sachs BDC, Inc.; Goldman Sachs Private Middle Market Credit LLC; Goldman Sachs Private Middle Market Credit II LLC; Goldman Sachs Middle Market Lending Corp.; Goldman Sachs MLP and Energy Renaissance Fund; Goldman Sachs ETF Trust; Goldman Sachs Credit Income Fund; and Goldman Sachs Real Estate Diversified Income Fund. | |||
| Joseph F. DiMaria 30 Hudson Street Jersey City, NJ 07302 Age: 52 |
Treasurer, Principal Financial Officer and Principal Accounting Officer | Since 2017 (Treasurer and Principal Financial Officer since 2019) | Managing Director, Goldman Sachs (November 2015-Present) and Vice President — Mutual Fund Administration, Columbia Management Investment Advisers, LLC (May 2010-October 2015).
Treasurer, Principal Financial Officer and Principal Accounting Officer — Goldman Sachs Trust (previously Assistant Treasurer (2016)); Goldman Sachs Variable Insurance Trust (previously Assistant Treasurer (2016)); Goldman Sachs Trust II (previously Assistant Treasurer (2017)); Goldman Sachs MLP and Energy Renaissance Fund (previously Assistant Treasurer (2017)); Goldman Sachs ETF Trust (previously Assistant Treasurer (2017)); Goldman Sachs Credit Income Fund; and Goldman Sachs Real Estate Diversified Income Fund. | |||
| * | Represents a partial list of officers of the Trust. Additional information about all the officers is available in the Fund’s Statement of Additional Information, which can be obtained from Goldman Sachs free of charge by calling this toll-free number (in the United States): 1-800-526-7384. |
| 1 | Information is provided as of November 30, 2020. |
| 2 | Officers hold office at the pleasure of the Board of Trustees or until their successors are duly elected and qualified. Each officer holds comparable positions with certain other companies of which Goldman Sachs, GSAM or an affiliate thereof is the investment adviser, administrator and/or distributor. |
45
FUNDS PROFILE
Goldman Sachs Funds
Goldman Sachs is a premier financial services firm, known since 1869 for creating thoughtful and customized investment solutions in complex global markets.
Today, the Consumer and Investment Management Division of Goldman Sachs serves a diverse set of clients worldwide, including private institutions, public entities and individuals. With approximately $1.86 trillion in assets under supervision as of September 30, 2020, Goldman Sachs Asset Management (“GSAM”) has portfolio management teams located around the world and our investment professionals bring firsthand knowledge of local markets to every investment decision. Assets under supervision includes assets under management and other client assets for which Goldman Sachs does not have full discretion. GSAM leverages the resources of Goldman Sachs & Co. LLC subject to legal, internal and regulatory restrictions.
Money Market
Financial Square FundsSM
| ∎ | Financial Square Treasury Solutions Fund1 |
| ∎ | Financial Square Government Fund1 |
| ∎ | Financial Square Money Market Fund2 |
| ∎ | Financial Square Prime Obligations Fund2 |
| ∎ | Financial Square Treasury Instruments Fund1 |
| ∎ | Financial Square Treasury Obligations Fund1 |
| ∎ | Financial Square Federal Instruments Fund1 |
Investor FundsSM
| ∎ | Investor Money Market Fund3 |
| ∎ | Investor Tax-Exempt Money Market Fund3 |
Fixed Income
Short Duration and Government
| ∎ | Enhanced Income Fund |
| ∎ | High Quality Floating Rate Fund |
| ∎ | Short-Term Conservative Income Fund |
| ∎ | Short Duration Government Fund |
| ∎ | Short Duration Income Fund |
| ∎ | Government Income Fund |
| ∎ | Inflation Protected Securities Fund |
Multi-Sector
| ∎ | Bond Fund |
| ∎ | Core Fixed Income Fund |
| ∎ | Global Core Fixed Income Fund4 |
| ∎ | Income Fund |
| ∎ | Strategic Income Fund |
Municipal and Tax-Free
| ∎ | High Yield Municipal Fund |
| ∎ | Dynamic Municipal Income Fund |
| ∎ | Municipal Income Completion Fund |
| ∎ | Short Duration Tax-Free Fund |
Single Sector
| ∎ | Investment Grade Credit Fund |
| ∎ | U.S. Mortgages Fund |
| ∎ | High Yield Fund |
| ∎ | High Yield Floating Rate Fund |
| ∎ | Emerging Markets Debt Fund |
| ∎ | Local Emerging Markets Debt Fund |
Fixed Income Alternatives
| ∎ | Long Short Credit Strategies Fund |
Fundamental Equity
| ∎ | Equity Income Fund |
| ∎ | Small Cap Growth Fund |
| ∎ | Small Cap Value Fund |
| ∎ | Small/Mid Cap Value Fund |
| ∎ | Mid Cap Value Fund |
| ∎ | Large Cap Value Fund |
| ∎ | Focused Value Fund |
| ∎ | Capital Growth Fund |
| ∎ | Strategic Growth Fund |
| ∎ | Small/Mid Cap Growth Fund |
| ∎ | Flexible Cap Fund |
| ∎ | Concentrated Growth Fund |
| ∎ | Technology Opportunities Fund |
| ∎ | Growth Opportunities Fund |
| ∎ | Rising Dividend Growth Fund |
| ∎ | U.S. Equity ESG Fund5 |
| ∎ | Income Builder Fund |
| ∎ | Defensive Equity Fund |
Tax-Advantaged Equity
| ∎ | U.S. Tax-Managed Equity Fund |
| ∎ | International Tax-Managed Equity Fund |
| ∎ | U.S. Equity Dividend and Premium Fund |
| ∎ | International Equity Dividend and Premium Fund |
Equity Insights
| ∎ | Small Cap Equity Insights Fund |
| ∎ | U.S. Equity Insights Fund |
| ∎ | Small Cap Growth Insights Fund |
| ∎ | Large Cap Growth Insights Fund |
| ∎ | Large Cap Value Insights Fund |
| ∎ | Small Cap Value Insights Fund |
| ∎ | International Small Cap Insights Fund |
| ∎ | International Equity Insights Fund |
| ∎ | Emerging Markets Equity Insights Fund |
Fundamental Equity International
| ∎ | International Equity Income Fund |
| ∎ | International Equity ESG Fund |
| ∎ | China Equity Fund6 |
| ∎ | Emerging Markets Equity Fund |
| ∎ | Imprint Emerging Markets Opportunities Fund |
| ∎ | ESG Emerging Markets Equity Fund |
Alternative
| ∎ | Clean Energy Income Fund |
| ∎ | Real Estate Securities Fund |
| ∎ | International Real Estate Securities Fund |
| ∎ | Commodity Strategy Fund |
| ∎ | Global Real Estate Securities Fund |
| ∎ | Alternative Premia Fund |
| ∎ | Absolute Return Tracker Fund |
| ∎ | Managed Futures Strategy Fund |
| ∎ | MLP Energy Infrastructure Fund |
| ∎ | Energy Infrastructure Fund7 |
| ∎ | Multi-Manager Alternatives Fund |
| ∎ | Global Infrastructure Fund |
Total Portfolio Solutions
| ∎ | Global Managed Beta Fund |
| ∎ | Multi-Manager Non-Core Fixed Income Fund |
| ∎ | Multi-Manager Global Equity Fund |
| ∎ | Multi-Manager International Equity Fund |
| ∎ | Tactical Tilt Overlay Fund |
| ∎ | Balanced Strategy Portfolio |
| ∎ | Multi-Manager U.S. Small Cap Equity Fund |
| ∎ | Multi-Manager Real Assets Strategy Fund |
| ∎ | Growth and Income Strategy Portfolio |
| ∎ | Growth Strategy Portfolio |
| ∎ | Dynamic Global Equity Fund |
| ∎ | Satellite Strategies Portfolio |
| ∎ | Enhanced Dividend Global Equity Portfolio |
| ∎ | Tax-Advantaged Global Equity Portfolio |
| ∎ | Strategic Factor Allocation Fund |
| ∎ | Target Date Retirement Portfolio8 |
| ∎ | Target Date 2025 Portfolio |
| ∎ | Target Date 2030 Portfolio |
| ∎ | Target Date 2035 Portfolio |
| ∎ | Target Date 2040 Portfolio |
| ∎ | Target Date 2045 Portfolio |
| ∎ | Target Date 2050 Portfolio |
| ∎ | Target Date 2055 Portfolio |
| ∎ | Target Date 2060 Portfolio |
| ∎ | GQG Partners International Opportunities Fund |
| 1 | You could lose money by investing in the Fund. Although the Fund seeks to preserve the value of your investment at $1.00 per share, it cannot guarantee it will do so. An investment in the Fund is not a deposit of a bank and is not insured or guaranteed by the Federal Deposit Insurance Corporation or any other government agency. The Fund’s sponsor has no legal obligation to provide financial support to the Fund, and you should not expect that the sponsor will provide financial support to the Fund at any time. |
| 2 | You could lose money by investing in the Fund. Because the share price of the Fund will fluctuate, when you sell your shares they may be worth more or less than what you originally paid for them. The Fund may impose a fee upon sale of your shares or may temporarily suspend your ability to sell shares if the Fund’s liquidity falls below required minimums because of market conditions or other factors. An investment in the Fund is not a deposit of a bank and is not insured or guaranteed by the Federal Deposit Insurance Corporation or any other government agency. The Fund’s sponsor has no legal obligation to provide financial support to the Fund, and you should not expect that the sponsor will provide financial support to the Fund at any time. |
| 3 | You could lose money by investing in the Fund. Although the Fund seeks to preserve the value of your investment at $1.00 per share, it cannot guarantee it will do so. The Fund may impose a fee upon sale of your shares or may temporarily suspend your ability to sell shares if the Fund’s liquidity falls below required minimums because of market conditions or other factors. An investment in the Fund is not a deposit of a bank and is not insured or guaranteed by the Federal Deposit Insurance Corporation or any other government agency. The Fund’s sponsor has no legal obligation to provide financial support to the Fund, and you should not expect that the sponsor will provide financial support to the Fund at any time. |
| 4 | Effective after the close of business on April 30, 2020, the Goldman Sachs Global Income Fund was renamed the Goldman Sachs Global Core Fixed Income Fund. |
| 5 | Effective after the close of business on August 30, 2020, the Goldman Sachs Blue Chip Fund was renamed the Goldman Sachs U.S. Equity ESG Fund. |
| 6 | Effective after the close of business on November 20, 2019, the Goldman Sachs Asia Equity Fund was renamed the Goldman Sachs China Equity Fund. |
| 7 | Effective after the close of business on June 26, 2020, the Goldman Sachs MLP & Energy Fund was renamed the Goldman Sachs Energy Infrastructure Fund. |
| 8 | Effective December 27, 2019, the Goldman Sachs Target Date 2020 Portfolio was renamed the Goldman Sachs Target Date Retirement Portfolio. Financial Square FundsSM and Investor FundsSM are registered service marks of Goldman Sachs & Co. LLC. |
| * | This list covers open-end funds only. Please visit our website at www.GSAMFUNDS.com to learn about our closed-end funds and exchange-traded funds. |
| TRUSTEES Jessica Palmer, Chair Dwight L. Bush Kathryn A. Cassidy Diana M. Daniels Joaquin Delgado James A. McNamara Roy W. Templin Gregory G. Weaver |
OFFICERS James A. McNamara, President Joseph F. DiMaria, Principal Financial Officer, Caroline L. Kraus, Secretary | |
| GOLDMAN SACHS & CO. LLC Distributor and Transfer Agent |
GOLDMAN SACHS ASSET MANAGEMENT, L.P. Investment Adviser | |
Visit our website at www.GSAMFUNDS.com to obtain the most recent month-end returns.
Goldman Sachs Asset Management, L.P., 200 West Street, New York, New York 10282
Goldman Sachs does not provide legal, tax or accounting advice, unless explicitly agreed between you and Goldman Sachs (generally through certain services offered only to clients of Private Wealth Management). Any statement contained in this presentation concerning U.S. tax matters is not intended or written to be used and cannot be used for the purpose of avoiding penalties imposed on the relevant taxpayer. Notwithstanding anything in this document to the contrary, and except as required to enable compliance with applicable securities law, you may disclose to any person the US federal and state income tax treatment and tax structure of the transaction and all materials of any kind (including tax opinions and other tax analyses) that are provided to you relating to such tax treatment and tax structure, without Goldman Sachs imposing any limitation of any kind. Investors should be aware that a determination of the tax consequences to them should take into account their specific circumstances and that the tax law is subject to change in the future or retroactively and investors are strongly urged to consult with their own tax advisor regarding any potential strategy, investment or transaction.
The reports concerning the Fund included in this shareholder report may contain certain forward-looking statements about the factors that may affect the performance of the Fund in the future. These statements are based on Fund management’s predictions and expectations concerning certain future events and their expected impact on the Fund, such as performance of the economy as a whole and of specific industry sectors, changes in the levels of interest rates, the impact of developing world events, and other factors that may influence the future performance of the Fund. Management believes these forward-looking statements to be reasonable, although they are inherently uncertain and difficult to predict. Actual events may cause adjustments in portfolio management strategies from those currently expected to be employed.
A description of the policies and procedures that the Fund uses to determine how to vote proxies relating to portfolio securities and information regarding how the Fund voted proxies relating to portfolio securities for the most recent 12-month period ended June 30, are available (I) without charge, upon request by calling 1-800-526-7384 (for Retail Shareholders) or 1-800-621-2550 (for Institutional Shareholders); and (II) on the Securities and Exchange Commission (“SEC’’) web site at http://www.sec.gov.
The Fund will file its portfolio holdings for each month in a fiscal quarter within 60 days after the end of the relevant fiscal quarter on Form N-PORT. Portfolio holdings information for the third month of each fiscal quarter will be made available on the SEC’s web site at http://www.sec.gov. Portfolio holdings information may be obtained upon request and without charge by calling 1-800-526-7384 (for Retail Shareholders) or 1-800-621-2550 (for Institutional Shareholders).
Fund holdings and allocations shown are as of November 30, 2020 and may not be representative of future investments. Fund holdings should not be relied on in making investment decisions and should not be construed as research or investment advice regarding particular securities. Current and future holdings are subject to risk.
Economic and market forecasts presented herein reflect our judgment as of the date of this presentation and are subject to change without notice. These forecasts do not take into account the specific investment objectives, restrictions, tax and financial situation or other needs of any specific client. Actual data will vary and may not be reflected here. These forecasts are subject to high levels of uncertainty that may affect actual performance. Accordingly, these forecasts should be viewed as merely representative of a broad range of possible outcomes. These forecasts are estimated, based on assumptions, and are subject to significant revision and may change materially as economic and market conditions change. Goldman Sachs has no obligation to provide updates or changes to these forecasts. Case studies and examples are for illustrative purposes only.
“Alerian MLP Index”, “Alerian MLP Total Return Index”, “AMZ” and “AMZX” are trademarks of Alerian and their use is granted under a license from Alerian.
The portfolio risk management process includes an effort to monitor and manage risk, but does not imply low risk.
This material is not authorized for distribution to prospective investors unless preceded or accompanied by a current Prospectus or summary prospectus, if applicable. Investors should consider the Fund’s objective, risks, and charges and expenses, and read the summary prospectus, if available, and/or the Prospectus carefully before investing or sending money. The summary prospectus, if available, and the Prospectus contain this and other information about the Fund and may be obtained from your authorized dealer or from Goldman Sachs & Co. LLC by calling (retail – 1-800-526-7384) (institutional – 1-800-621-2550).
© 2021 Goldman Sachs. All rights reserved. 226455-OTU-1335064 MLPEIAR-21
Goldman Sachs Funds

| Annual Report | November 30, 2020 | |||
| Energy Funds | ||||
| Clean Energy Income Fund | ||||
| Energy Infrastructure Fund* | ||||
*Effective after the close of business on June 26, 2020, the Goldman Sachs MLP & Energy Fund was renamed the Goldman Sachs Energy Infrastructure Fund.

Goldman Sachs Energy Funds
| ∎ | CLEAN ENERGY INCOME FUND |
| ∎ | ENERGY INFRASTRUCTURE FUND |
| 1 | ||||
| 16 | ||||
| 18 | ||||
| 21 | ||||
| 21 | ||||
| 28 | ||||
| 35 | ||||
| 48 | ||||
| 49 | ||||
| NOT FDIC-INSURED | May Lose Value | No Bank Guarantee | ||
PORTFOLIO RESULTS
Goldman Sachs Clean Energy Income Fund
Investment Objective
The Fund seeks total return through current income and capital appreciation.
Portfolio Management Discussion and Analysis
Below, the Goldman Sachs Energy and Infrastructure Team discusses the Goldman Sachs Clean Energy Income Fund’s (the ”Fund”) performance and positioning for the period from its inception on June 26, 2020 through November 30, 2020 (the “Reporting Period”).
| Q | How did the Fund perform during the Reporting Period? |
| A | During the Reporting Period, the Fund’s Class A, Class C, Institutional, Investor, Class R6, Class R and Class P Shares generated cumulative total returns, without sales charges, of 36.27%, 35.80%, 36.40%, 36.33%, 36.40%, 36.10% and 36.41% and respectively. These returns compare to the 34.20% cumulative total return of the Fund’s blended benchmark, which is comprised 50% of the Eagle North American Renewables Infrastructure Index,1 35% of the Indxx Yieldco and Renewable Energy Income Index2 and 15% of the Eagle Global Renewables Infrastructure Index.3 |
| Q | How did clean energy infrastructure assets overall perform during the Reporting Period? |
| A | Clean energy infrastructure assets generated positive returns overall during the Reporting Period, outperforming the broader equity market, energy-related stocks and global infrastructure securities. The sector benefited from resilient fundamentals amid the COVID-19 pandemic and growing investor interest in the clean energy transition, which is underpinned by supportive government policies and an increased focus on reducing global carbon emissions. |
| The clean energy transition appeared to gain meaningful traction with investors during the Reporting Period, with clean energy investment products (i.e., mutual funds and exchange-traded funds/exchange-traded notes) experiencing approximately $17.3 billion of investment inflows from January through November 2020 — more than triple the amount received during the 2019 calendar year.4 The increase acted as a technical tailwind for share prices. Clean energy infrastructure assets traded around historical enterprise value (“EV”)/EBITDA5 during the Reporting Period, with the potential for multiple expansion, in our view, as the clean energy growth story grows more prominent. |
| Although the broader energy markets experienced severe weakness as a result of COVID-19-related demand destruction and a supply-side shock driven by the OPEC+ producer price war, clean energy infrastructure companies demonstrated resilient fundamentals during the downturn. (OPEC+ is composed of OPEC countries and non-OPEC oil producing countries, most notably Russia. OPEC is the Organization of the Petroleum Exporting Countries.) From January through September 2020, U.S. electricity generation fell 3.4% year over year, while fossil fuel generation dropped 5.6% year over year. In comparison, renewable power |
| 1 | The Eagle North American Renewables Infrastructure Index is designed to track the performance of renewables infrastructure or renewables-related infrastructure assets, primarily wind, solar, hydro, biomass and electric transmission lines. Constituents are companies whose stocks trade in either the U.S. or Canada, though assets owned by these companies can have a global reach. The index is a capped, float-adjusted, capitalization-weighted index developed by Eagle Global Advisors and disseminated real-time on a price-return basis (RENEWNA) and on a total-return basis (RENEWNAT). |
| 2 | The Indxx YieldCo and Renewable Energy Income Index is designed to track the performance of income-paying renewable energy companies and companies categorized as YieldCos (i.e., producers of biofuels) listed in developed and emerging markets. |
| 3 | The Eagle Global Renewables Infrastructure Index is designed to track the performance of renewables infrastructure or renewables-related infrastructure assets, primarily wind, solar, hydro, biomass and electric transmission lines. Constituents are companies whose stocks trade globally in OECD countries. (The Organization for Economic Co-operation and Development is an intergovernmental economic organization with 37 member countries, founded in 1961 to stimulate economic progress and world trade.) The index is a capped, float-adjusted, capitalization-weighted index developed by Eagle Global Advisors and disseminated real-time on a price-return basis (RENEW) and on a total-return basis (RENEWTR). |
| 4 | Source: U.S. Capital Advisors. |
| 5 | Enterprise value is the market value of debt, common equity and preferred equity minus the value of cash. EBITDA is earnings before interest, taxes, depreciation and amortization. Enterprise value/EBITDA is a financial ratio that measures a company’s value. |
1
PORTFOLIO RESULTS
| generation increased 12.0% year over year during the same period.6 |
| During the Reporting Period, many Fortune 500 companies committed to ambitious decarbonization targets, which supported the pace of corporate power purchase agreements7 (“PPA”) volumes and earnings expectations for clean energy infrastructure companies. The global PPA market was relatively resilient amid the spread of COVID-19, with corporations signing contracts to purchase 17.9 gigawatts (“GWs”) of clean energy for the 2020 calendar year through November 2020. This surpassed by 0.5 GWs the total volume during the same time period in 2019 and positioned PPA volumes to achieve an annual record by the end of December 2020.8 |
| Government policies that sought emissions reductions further accelerated the growth in clean energy investment and demand, which we believe created a favorable landscape for the expansion in clean energy offtake agreements.9 Furthermore, the clean energy transition was a key campaign theme of the Democratic Presidential nominee, who announced that if elected, he would spend $2 trillion on clean energy initiatives during his first term in office. |
| Q | What key factors were responsible for the Fund’s relative performance during the Reporting Period? |
| A | Security selection and developed markets exposure drove the Fund’s relative performance during the Reporting Period. The Fund primarily targets companies that are scaling the clean energy transition, primarily renewable independent power producers (“IPPs”) and power infrastructure companies. Within this market segment, the Fund generally focused on companies with what it considered to be effective management teams that operate within a strong corporate governance framework, with high renewable asset quality, strong balance sheets and liquidity that may weather various economic cycles and business cycles, and that demonstrate clear earnings growth and dividend visibility. |
| In addition, the Fund benefited from its concentration on companies domiciled in North America or Europe, with revenues that largely come from those regions but that also have some limited emerging markets exposure. |
| Q | What individual holdings added to the Fund’s relative performance during the Reporting Period? |
| A | Compared to the blended benchmark, the Fund’s exposure to Enel SpA and its lack of exposure to AGL Energy Ltd. and ENGIE Brasil Energia SA added to performance. |
| The Fund benefited most from its overweight in Enel SpA (ENEL) and its underweight in ENEL’s emerging markets subsidiaries. ENEL is a multinational power company and a participant in the global power, gas and renewables markets. In addition to producing energy and distributing electricity for end-users globally, ENEL manages wind, solar, geothermal and hydropower plants in Europe, the Americas, Africa, Asia and Oceania. (Oceania includes Australasia, Melanesia, Micronesia and Polynesia). During the Reporting Period, ENEL posted third quarter 2020 results that were in line with market expectations and revised upward its guidance through 2025. Meanwhile, the company’s Latin American subsidiaries cut guidance on the back of currency weakness, poor demand and lower hydroelectric power production. We added to the Fund’s overweight in ENEL during the Reporting Period. |
| The Fund’s lack of exposure to AGL Energy Ltd. (AGL) added to its performance versus the blended benchmark. AGL is one of Australia’s largest vertically-integrated utility businesses, and it is Australia’s largest private owner, operator and developer of renewable generation assets. The spread of COVID-19 posed significant challenges for AGL, including electricity demand destruction due to lockdowns, falling wholesale and retail prices, and rising bad debt linked to customer difficulties. In addition, the company provided net profit after-tax guidance for its 2021 fiscal year that was 18% below Goldman Sachs Global Investment Research estimates, driven by operating challenges and market headwinds. The weak guidance and near-term market uncertainty around wholesale electricity prices weighed on AGL’s share price, in our view. |
| The Fund also did not own shares of ENGIE Brasil Energia SA (EGIE3) during the Reporting Period, which contributed positively to its relative returns. EGIE3, a Brazil-based IPP, is majority owned by ENGIE, one of Europe’s top power, gas and infrastructure companies. During the Reporting |
| 6 | Source of electricity and renewal power generation data: U.S. Energy Information Administration. |
| 7 | A power purchase agreement is the contract between a power producer and a power buyer. A corporate renewable energy PPA is used when that buyer is a corporation, and not a utility. |
| 8 | Source of gigawatt data: Bloomberg New Energy Finance. |
| 9 | An offtake agreement is an arrangement between a power producer and a power buyer (often called the offtaker) to buy the energy and related products that a project will produce and deliver over time. The offtake agreement is the agreement to “sell” power. |
2
PORTFOLIO RESULTS
| Period, EGIE3’s stock price was hurt by the effects of COVID-19, as the company’s energy production fell 24% year over year through the first nine months of 2020 compared to the same period in 2019. Additionally, many of the company’s assets have local concessions, which could have a negative impact as EGIE3 looks to replace lost earnings, especially with an already elevated payout ratio.10 |
| Q | What individual holdings detracted from the Fund’s relative performance during the Reporting Period? |
| A | During the Reporting Period, the Fund was hurt by its overweight position versus the blended benchmark in Brookfield Renewables Partners LP and its underweight position in Brookfield Renewable Corp.; its lack of exposure to Meridian Energy Limited; and its overweight in Emera Inc. |
| Relative to the blended benchmark, the combination of Fund’s overweight position in Brookfield Renewable Partners LP (BEP-U) and its underweight in Brookfield Renewable Corp. (BEPC) detracted from performance. The negative results were largely the result of two factors. The first was BEPC’s scarcity value (i.e., the increase in its share price because of low supply), as BEPC was spun off by BEP-U near the end of July 2020. The second was that BEPC is a “C” Corporation, which we believe created a larger investor pool of capital for the security. After the spin-off and through the conclusion of the Reporting Period, shares of BEP-U rose 70.7% compared to shares of BEPC, which were up 80.7%. Therefore, in relative terms, the Fund was hurt by its underweight versus the blended benchmark in BEPC and its overweight position in BEP-U. Both stocks performed well because of the companies’ ability to execute on multiple transactions, including the acquisition of TerraForm Power, Inc., an owner and operator of solar and wind assets located primarily in North America and Western Europe, that supports the companies’ long-term 12%-15% return targets. For context, BEP-U/BEPC comprises one of the largest renewable IPPs in the world with 19.3 GWs of gross installed capacity that is primarily hydroelectric (66% of the total portfolio), a renewable resource that generally yields a premium valuation given its perpetual asset life. BEP-U’s facilities are across North America, South America, Europe and Asia, and it owns wind, solar, distributed generation and storage assets. |
| The Fund was also hampered during the Reporting Period by its lack of exposure to Meridian Energy Limited (MEL), which generated a gain for the blended benchmark during the Reporting Period overall. MEL is New Zealand’s largest state-owned electricity producer and retailer, which generates energy through a 100% renewable portfolio comprised primarily of wind, water and solar assets. Its equity price fell sharply alongside COVID-19 lockdown measures and broad weakness in energy demand/forward electricity price expectations during March and April 2020. Subsequently, the stock traded higher alongside resilient earnings announcements in the second and third calendar quarters; favorable news about COVID-19 vaccines, which would be positive for energy demand; and material improvement in New Zealand’s electricity price expectations in 2021 after the government’s public commitment to keep open the Rio Tinto aluminum smelter — which consumes a significant percentage of New Zealand’s power generation and was expected to close in 2021 because of its high energy costs and the challenging aluminum market conditions. At the end of the Reporting Period, we maintained the Fund’s underweight position in MEL based on its valuation and our belief that capital could be better allocated to stocks with more favorable risk/reward profiles. |
| Also detracting from the Fund’s relative performance was its overweight position in Emera Inc. (EMA), a Canada-based owner and operator of electric generation, transmission and distribution assets and services, with a strategic focus on transformation to renewable energy generation. The company’s stock lagged other clean energy stocks, largely because of its defensive characteristics. In addition to its Canadian assets, EMA owns regulated electric and gas utilities in the U.S. and Caribbean. EMA is engaged in the rapid de-carbonization of its fleet, is growing at a faster rate than most utilities (targeting an 8% earnings-per-share compound annual growth rate through 2022) and is investing in renewable assets in Florida. However, it is not growing as quickly as some other renewable developers and pure-play renewable IPPs. |
| Q | Were there any notable purchases or sales during the Reporting Period? |
| A | As the Fund launched on June 26, 2020, it was not a matter of making changes during the Reporting Period but of building the portfolio. That said, the Fund initiated a position in TPI Composites Inc. (TPIC), a designer and manufacturer of composite wind blades, during the Reporting Period. In our view, the company’s expertise in composites enables it to |
| 10 | The payout ratio is a financial metric showing the proportion of earnings a company pays shareholders in the form of dividends, expressed as a percentage of the company’s total earnings. |
3
PORTFOLIO RESULTS
| partner with wind turbine developers to help in the creation of wind farms. Also, we believe TPIC has a strong backlog of long-term supply agreements and stands to benefit from continued growth in wind development due to its strong customer relationships. The company reported strong EBITDA margins in its third calendar quarter earnings announcement, which helped its stock to perform well into the end of the Reporting Period. |
| Conversely, the Fund exited its position in Avangrid, Inc. (AGR), a diversified energy and utility holding company that provides clean energy. AGR is 81% owned by Ibedrola, Spain’s largest energy company, and is a global clean energy player with assets in the U.K., U.S., Brazil and Mexico. The company’s newly appointed chief executive officer presented at the company’s Analyst Day, re-setting earnings expectations and the growth outlook. We eliminated the Fund’s position in the stock shortly afterwards. |
| Q | How did the Fund use derivatives and similar instruments during the Reporting Period? |
| A | During the Reporting Period, the Fund did not use derivatives or similar instruments. |
| Q | What is the Fund’s tactical view and strategy for the months ahead? |
| A | Global energy consumption has steadily grown, and we expect it to grow further. Through 2050, total energy consumption is forecast to rise by 43%,11 as the world’s population increases and more people move into the middle class. |
| Clean energy consumption has also grown, by approximately 82% between 2010 and the end of the Reporting Period, and we expect it to make up 17% of total demand in the 2020 calendar year. By 2050, clean energy consumption is projected to grow 137%, at which time renewable energy sources would account for 28% of total energy market share compared to 27% for crude oil and other liquids.11 That same year, clean energy is expected to become the world’s primary energy source, and it is estimated that $10.3 trillion of investments in the sector will be made in the form of technology improvements and infrastructure build-out to meet demand.12 |
| From a cost perspective, clean energy has quickly become competitive, with new build renewables projects becoming the cheapest source of energy. Since 2009, clean energy costs have decreased substantially, largely because of economies of scale, growing capacity, government programs and technological advancements. Solar and wind costs, for example, fell approximately 89% and 70%, respectively, between 2009 and 2019.13 In fact, not only are most newly built renewable energy facilities the cheapest source option, in our view, but some new build wind and solar projects are also competitive relative to the marginal costs of existing hydrocarbon power sources. We believe continued cost declines will be critical to clean energy capturing further market share. |
| At the end of the Reporting Period, we believed clean energy was poised to enter a golden age of growth driven by government policies seeking to reduce carbon emissions, primarily by targeting the power sector, which is currently the largest emitter of carbon dioxide. In the U.S., de-carbonization and clean energy is a major focus of the incoming Presidential Administration. As mentioned previously, the President-elect said he intends to spend $2 trillion on clean energy during his first term. We also believe U.S. federal government support for clean energy development may provide substantial tailwinds for the clean energy sector in the coming years. More than 30 U.S. states already have renewable power standards in place. In Europe, a law has been proposed that would make it legally binding for European Union members to reach net zero greenhouse gas emissions by 2050. |
| Supportive government policies, as well as continued cost declines and increased appetite for clean energy investments, has created a substantial, multi-decade opportunity for companies focused on clean energy sources, in our view. We believe attractive investment opportunities may exist among the contracted, clean energy infrastructure companies that the Fund’s investment philosophy favors as well as among companies engaged in the generation, transmission and distribution of renewable energy. In our view, investments in these companies offer not only exposure to the growing clean energy story but also attractive income potential for investors. |
| 11 | Source for data on clean energy consumption: U.S. Energy Information Administration’s International Energy Outlook. |
| 12 | Source: Bloomberg New Energy Finance. |
| 13 | Source of cost-related information: Lazard’s Levelized Costs of Energy version 13.0. |
4
FUND BASICS
Goldman Sachs Clean Energy Income Fund
as of November 30, 2020
| TOP TEN HOLDINGS AS OF 11/30/201 | ||||||||
| Holding | % of Net Assets | Line of Business | ||||||
| Brookfield Renewable Partners LP | 12.1 | % | Renewable IPP | |||||
| Northland Power, Inc. | 7.3 | Renewable IPP | ||||||
| NextEra Energy, Inc. | 5.8 | Renewable-Focused Power Infrastructure | ||||||
| NextEra Energy Partners LP | 5.8 | Renewable IPP | ||||||
| Boralex, Inc. Class A | 5.5 | Renewable IPP | ||||||
| Emera, Inc. | 5.4 | Renewable-Focused Power Infrastructure | ||||||
| Hannon Armstrong Sustainable Infrastructure Capital, Inc. | 4.8 | Renewable IPP | ||||||
| Atlantica Sustainable Infrastructure PLC | 4.7 | Renewable IPP | ||||||
| Innergex Renewable Energy, Inc. | 4.6 | Renewable IPP | ||||||
| Clearway Energy, Inc. Class A | 4.4 | Renewable IPP | ||||||
| 1 | The top 10 holdings may not be representative of the Fund’s future investments. |
| FUND SECTOR ALLOCATIONS2 |
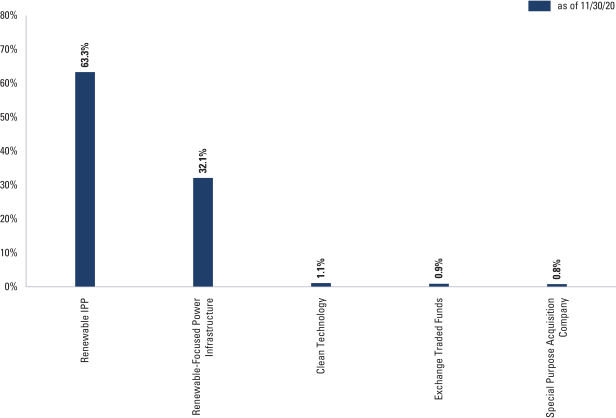
| 2 | The Fund is actively managed and, as such, its composition may differ over time. Consequently, the Fund’s overall sector allocations may differ from the percentages contained in the graph above. The percentage shown for each investment category reflects the value of investments in that category as a percentage of total net assets. The graph depicts the Fund’s investments but may not represent the Fund’s market exposure due to the exclusion of certain derivatives, if any, as listed in the Additional Investment Information section of the Schedule of Investments. |
For more information about your Fund, please refer to www.GSAMFUNDS.com. There, you can learn more about your Fund’s investment strategies, holdings, and performance.
5
PORTFOLIO RESULTS
Goldman Sachs Energy Infrastructure Fund
Investment Objective and Principal Investment Strategy
In April 2020, the Board of Trustees of the Goldman Sachs Trust approved changes to the Goldman Sachs MLP & Energy Fund’s name and principal investment strategy, effective after the close of business on June 26, 2020. No changes were made to the investment objective, which is to seek total return through current income and capital appreciation.
After the close of business on June 26, 2020, the Goldman Sachs MLP & Energy Fund’s name changed to the Goldman Sachs Energy Infrastructure Fund.
Regarding the principal investment strategy, when the Reporting Period began on December 1, 2019, the Goldman Sachs MLP & Energy Fund invested, under normal circumstances, at least 80% of its net assets plus any borrowings for investment purposes (measured at the time of purchase) (“Net Assets”) in U.S. and non-U.S. equity or fixed income securities issued by master limited partnerships (“MLPs”) and energy companies. After June 26, 2020, the Goldman Sachs Energy Infrastructure Fund (the “Fund”) invests, under normal circumstances, at least 80% of its Net Assets in U.S. and non-U.S. equity or fixed income securities issued by energy infrastructure companies, including MLPs and “C” corporations. The Fund’s investments in MLPs will not exceed 25% of the Fund’s total assets as measured at the time of purchase. The Fund intends to concentrate its investments in the energy sector.
Portfolio Management Discussion and Analysis
Below, the Goldman Sachs Energy and Infrastructure Team discusses the Goldman Sachs Energy Infrastructure Fund’s (the “Fund”) performance and positioning for the 12-month period ended November 30, 2020 (the “Reporting Period”). The performance information reported herein reflects the Fund’s current and prior investment strategies.
| Q | How did the Fund perform during the Reporting Period? |
| A | During the Reporting Period, the Fund’s Class A, Class C, Institutional, Investor, Class R6, Class R and Class P Shares generated average annual total returns, without sales charges, of -13.05%, -13.60%, -12.74%, -12.86%, -12.83%, -13.34% and -12.74%, respectively. These returns compare to the -17.82% average annual total return of the Fund’s benchmark, the Alerian Midstream Energy Select Index (Total Return, Unhedged, USD) (“AMEI Index”). The AMEI is a composite of North American energy infrastructure companies.1 |
| Q | How did energy-related assets overall perform during the Reporting Period? |
| A | Energy-related assets broadly sold off during the Reporting Period. Energy infrastructure master limited partnerships (“MLPs”) generally, as measured by the Alerian MLP Index,2 produced a total return of -24.45%. The broader midstream3 sector, as measured by the Alerian Midstream Energy Index4 (“AMNA Index”) (which includes both energy MLPs and “C” corporations), generated a total return of -18.22%. |
6
| 1Source: | Alerian. The Alerian Midstream Energy Select Index is a composite of North American energy infrastructure companies. It is a capped, float-adjusted, capitalization-weighted index, whose constituents are engaged in midstream activities involving energy commodities, is disseminated real-time on a price-return basis (AMEI) and on a total-return basis (AMEIX). It is not possible to invest directly in an unmanaged index. |
| 2 | Source: Alerian. The Alerian MLP Index is the leading gauge of energy infrastructure MLPs. The capped, float-adjusted, capitalization-weighted index, whose constituents earn the majority of their cash flow from midstream activities involving energy commodities, is disseminated real-time on a price-return basis (AMZ) and on a total-return basis (AMZX). It is not possible to invest directly in an unmanaged index. |
| 3 | The midstream component of the energy industry is usually defined as those companies providing products or services that help link the supply side (i.e., energy producers) and the demand side (i.e., energy end-users for any type of energy commodity. Such midstream businesses can include, but are not limited those that process, store, market and transport various energy commodities. |
| 4 | Source: Alerian. The Alerian Midstream Energy Index is a broad-based composite of North American energy infrastructure companies. The capped, float-adjusted, capitalization-weighted index, whose constituents earn the majority of their cash flow from midstream activities involving energy commodities, is disseminated real-time on a price-return (AMNA), total-return (AMNAX), net total-return (AMNAN), and adjusted net total-return (AMNTR) basis. |
PORTFOLIO RESULTS
| In December 2019, when the Reporting Period began, the growth outlooks for the U.S. shale industry and the global economy were positive and stable overall. Conditions abruptly changed in early 2020 with the emergence and spread of COVID-19 and the start of a crude oil producer price war, which together created a more challenging and uncertain global environment for the energy markets and energy-related equities. |
| The energy markets experienced unprecedented weakness during the first quarter of 2020, driven by two factors. The first was a demand-side shock, as quarantine efforts and travel restrictions implemented to reduce the spread of COVID-19 led to a sharp drop in demand. The second was a supply-side shock, as the Organization of the Petroleum Exporting Countries (“OPEC”) and Russia failed to reach an agreement on production cuts and entered into a crude oil price war, which ultimately added supply to an already oversupplied market. Crude oil prices fell, with the prices of West Texas Intermediate (“WTI”) and Brent crude oil declining approximately 25% and 24%, respectively, on March 9th, the first trading day after the OPEC+ talks collapsed.5 (OPEC+ is composed of OPEC countries and non-OPEC oil producing countries, most notably Russia.) Crude oil prices then continued to trend down fueled by market uncertainty about demand given the global economic impact of COVID-19 as well as by shorter-term concerns around U.S. storage constraints. |
| Energy-related equities sold off during the first quarter of 2020 on investor uncertainty about the ultimate impact on the U.S. shale industry of the simultaneous demand-side and supply-side shocks. We believe the sell-off was exacerbated in the midstream sector by technical selling, as closed-end funds de-levered to reduce volatility and, in some cases, to maintain compliance with leverage covenants. We estimate more than $3 billion in holdings were sold by closed-end funds during the first 15 trading days of March.6 Midstream equities were also pressured during the first calendar quarter by the magnitude of uncertainty within the equities and energy markets broadly, even though midstream cash flows are predominantly volume based and generally less sensitive to commodity price fluctuations due to contractual agreements, which we believe help manage one-to-one exposure between midstream cash flows and volume declines. Furthermore, in response to severe commodity price weakness during the first calendar quarter, a number of midstream energy companies announced plans to strengthen their balance sheets, with some keeping their distributions flat, some cutting distribution payout levels, and many reducing their expected capital expenditures for 2020. In most cases, these defensive actions were rewarded by investors. |
| In April 2020, the energy markets and energy-related equities experienced some relief, as the crude oil price war appeared to reach a resolution. OPEC+ members met, starting on April 9th, and proposed their largest-ever production cut of 9.7 million barrels per day on April 12th.7 Saudi Arabia subsequently deepened its commitment to the production cut, reducing output by an additional 1.0 million barrels per day. Several other countries also announced voluntary production cuts. Despite the April OPEC+ production agreement, significant crude oil oversupply led to logistical issues and storage capacity constraints in the U.S. that same month, resulting in unprecedentedly low WTI crude oil prices and even negative WTI crude oil futures contracts for the first time in history. Midstream equities remained relatively resilient during April, as we believe many investors looked past transient supply-side issues and instead valued equities on longer-dated commodity price expectations. |
| In May 2020, market expectations about the supply-demand gap started to ease, as crude oil demand improved relative to the troughs seen in early April and global supply levels began to react to lower prices in the marketplace. In particular, production cuts from OPEC+ members, as well as market-driven reductions in U.S. production, slowed inventory builds relative to their April levels. Meanwhile, future production activity indicators, such as rig counts and 2020 capital expenditure expectations for exploration and production companies, fell substantially. As a result, the crude oil market started to show signs of tightening in May, enabling prices to rebound off their prior month lows. At the same time, energy-related equities, particularly midstream equities, continued to experience a meaningful recovery from their lows in mid-March. The Alerian MLP Index and the AMNA Index recorded gains of 148% and 107%, respectively, between March 18th and June 8th. They retreated thereafter, dropping 32% and 24%, respectively, from June 9th through the end of October. We believe the drop in midstream equity performance from mid-June through October 2020 was driven largely by weak investor sentiment, not fundamentals. In our view, the weakness in sentiment was due to a number of factors, including uncertainty about |
| 5 | Source of crude oil price data: Bloomberg. |
| 6 | Source of sales data: Bloomberg and U.S. Capital Advisors. |
| 7 | Source of production cut data: OPEC and Bloomberg. |
7
PORTFOLIO RESULTS
| the then-upcoming U.S. elections, given the seemingly unfavorable oil and gas policy views of Democrats. Midstream equities were also hurt, in our opinion, by environmental, social and governance-related capital allocation headwinds and terminal value8 concerns for oil and gas assets given growing interest in renewable energy. Meanwhile, the fundamental backdrop for energy-related companies improved considerably. First, oil demand picked up steam. We track traffic data across the world, and within the largest cities in Asia and Europe, traffic congestion grew closer to pre-COVID-19 levels. Although the recovery in U.S. traffic congestion was comparatively slower, we also started to see improvement domestically. Second, on the supply side, we witnessed production discipline from OPEC+ countries and U.S. shale producers, which narrowed the supply-demand gap and provided upside support for crude oil prices. Third, many midstream energy companies had significantly reduced their capital expenditures, a welcome and appropriate change, in our view. Finally, even with the dramatic decline in oil demand during the second quarter of 2020, midstream cash flows were rather resilient. If one were to look at a list of the most prominent midstream energy companies, their earnings before interest, taxes, depreciation and amortization (“EBITDA”) were only down an average of approximately 11% year-over-year during the second calendar quarter. During that same quarter, the share prices of these companies fell an average of 44%, demonstrating the disconnect between equity price performance and the sector’s fundamentals, in our view. |
| During November 2020, energy markets and energy-related securities experienced strong rebounds. WTI and Brent crude oil prices rose 27% and 25%, respectively. Energy-related securities rallied, with the Alerian MLP Index and AMNA Index up 24% and 19%, respectively. We believe the strong performance was driven by positive COVID-19 vaccine news, which materially improved the outlook for energy demand, and resilient earnings by midstream energy companies. Nine of the top 10 U.S. midstream energy companies beat consensus EBITDA expectations for the third calendar quarter by an average of 7.5%, while also posting healthy distribution coverage ratios9 and strong free cash flow outlooks. Price performance was also bolstered, in our view, by the announcement of share buyback programs, with $2.3 billion authorized in November alone, and continued cost rationalization,10 with consensus expectations for 2021 midstream capital expenditures declining more than 50% relative to the estimates at 2019 year-end, greatly increasing market expectations for free cash flow and capital return to investors. At the same time, the market appeared to view the U.S. election results as relatively benign, given that a Democratic President could be coupled with a potentially Republican Senate, alleviating investors’ worst-case concerns about punitive legislation against the oil and gas sector. Finally, we believe energy-related equities benefited from a growth to value rotation, as promising COVID-19 vaccine news and potential economic reopening led many investors to focus on undervalued businesses. This view is supported, we believe, by the approximately 550 basis point outperformance of the Russell 1000 Value Index11 versus the Russell 1000 Growth Index12 between October 1, 2020 and the end of the Reporting Period. (A basis point is 1/100th of a percentage point.) |
| Q | What key factors were responsible for the Fund’s relative performance during the Reporting Period? |
| A | Security selection and severe weakness in the energy markets drove the Fund’s performance during the Reporting Period. The Fund posted negative absolute returns but outperformed the AMEI Index, largely because of its focus on what we consider to be high quality midstream energy companies with strong dividend and distribution coverage ratios, healthy balance sheets and robust free cash flow outlooks. |
| Regarding its exposures, the Fund benefited most from its holdings in the power generation subsector,13 positioning that |
| 8 | Terminal value is the value of a business or project beyond the forecast period when future cash flows can be estimated. Terminal value assumes a business will grow at a set growth rate forever after the forecast period. |
| 9 | The distribution coverage ratio is an energy company’s distributable cash flow divided by the total amount of distributions it has paid out. It is an indication of an energy company’s ability to maintain its current cash distribution level. |
| 10 | Cost rationalization addresses the sources of costs through the supply chain. |
| 11 | The Russell 1000® Value Index measures the performance of the large-cap value segment of the U.S. equity universe. It includes those Russell 1000® Index companies with lower price-to-book ratios and lower expected growth values. The Russell 1000® Index measures the performance of the large-cap segment of the U.S. equity universe and includes approximately 1000 of the largest securities based on a combination of their market cap and current index membership. The Russell 1000® Index represents approximately 92% of the U.S. market. |
| 12 | The Russell 1000® Growth Index is an unmanaged index of common stock prices that measures the performance of those Russell 1000 companies with higher price-to-book ratios and higher forecasted growth values. |
| 13 | Sector and subsector allocations are defined by GSAM and may differ from sector allocations used by the AMEI Index. |
8
PORTFOLIO RESULTS
| proved to be rather defensive amid volatility in the energy markets. The subsector also provided the Fund with exposure to renewable power generation, an industry that has experienced increased investor interest as well as supportive corporate and regulatory announcements, adding further to the Fund’s relative returns during the Reporting Period. (Power generating companies are not represented in the AMEI Index.) In addition, the Fund was helped by its rather modest exposures to the natural gas pipeline transportation and midstream services subsectors. Both of these subsectors suffered from the global demand destruction associated with efforts to contain the spread of COVID-19 and a supply shock stemming from a price war between OPEC and Russia. On the other hand, the Fund’s relative performance was hurt by weak stock selection in the petroleum pipeline transportation and gathering and processing subsectors. |
| Q | What individual holdings added to the Fund’s relative performance during the Reporting Period? |
| A | During the Reporting Period, the Fund’s overweight positions versus the AMEI Index in NextEra Energy, Inc., Targa Resources Corp. and Ameren Corp. contributed positively to its relative performance. |
| Adding most to the Fund’s relative returns was an overweight position in utility company NextEra Energy, Inc. (NEE), which benefited during the Reporting Period from its low volatility earnings profile and its clean energy tilt. NEE has two main businesses, one that owns and operates Florida-based utilities and one that focuses on renewable power development. The Florida-based utilities segment can earn regulated rates of return, which helped protect NEE’s earnings from the negative effects of COVID-19, in our view. Meanwhile, the renewable development business continues to grow its wind, solar and battery resource backlog. We believe the strength, defensiveness and growth of these two businesses made NEE a top Fund contributor during the Reporting Period. |
| The Fund was also helped by its overweight in Targa Resources Corp. (TRGP), an independent midstream services provider that is primarily engaged in gathering, storing, processing and transporting oil, natural gas and refined petroleum products. The severe weakness in energy markets due to COVID-19-related demand destruction and the simultaneous OPEC+ producer price war led to an outsized decline in TRGP’s share price, largely due to the company’s high leverage ratio.14 However, its management team quickly took steps to strengthen the company’s balance sheet and to increase the company’s focus on free cash flow, which included an 89% dividend cut during 2020 and a reduction in capital expenditures. Then, later in the Reporting Period, TRGP announced it intended to buy back stock. |
| Additionally, given that the company’s main area of operations is in the Permian Basin and it has an integrated asset profile, TRGP benefited from the stabilization of crude oil prices, as such stability greatly improved its leverage and earnings profile, and the outlook for TRGP became increasingly positive. We added to the Fund’s position in TRGP following what we saw as its management team’s swift decision-making and increased financial flexibility. In our view, the company was well positioned at the end of the Reporting Period to benefit from a recovery in demand. |
| Another contributor to the Fund’s relative performance was an overweight position in Ameren Corp. (AEE), a public utility holding company that, through its subsidiaries, generates and delivers electricity as well as distributes natural gas to customers in Missouri and Illinois. Given the uncertain macro backdrop, we think AEE was viewed by many investors as a relatively safe haven because of the company’s regulated rates of returns, defensive business model and cost management. In addition, AEE published its Missouri Integrated Resource Plan in September 2020, which highlighted accelerated coal plant retirements and $3.3 billion of incremental renewables investments through 2030, positioning the company to potentially capture renewables-driven growth. In our view, the company’s rather defensive nature as well as its growth opportunities contributed positively to the Fund’s relative performance during the Reporting Period. |
| Q | What individual holdings detracted from the Fund’s relative performance during the Reporting Period? |
| A | Compared to the AMEI Index, underweight positions in TC Energy Corp., Tallgrass Energy, LP and Enbridge, Inc. detracted from the Fund’s relative performance during the Reporting Period. |
| The Fund’s underweight position in TC Energy Corp. (TRP), a Canadian-based energy infrastructure company primarily |
| 14 | A leverage ratio indicates the level of debt incurred by a business against several other accounts in its balance sheet, income statement, or cash flow statement. A high leverage ratio generally indicates that a company has been aggressive in financing its growth with debt. |
9
PORTFOLIO RESULTS
| engaged in natural gas transmission and power services, detracted most from relative returns. In our view, investors viewed TRP as a relatively safe haven during the Reporting Period and, as a result, it generally outperformed the AMEI Index during periods of market weakness for the midstream energy sector. We also think TRP might have been rather resilient during the Reporting Period because of its “C” Corporation structure, which some investors seemed to favor over companies with MLP structures. In addition, TRP’s diversified asset base, the contracted nature of its cash flows and its bias toward natural gas rather than crude oil resulted in minimal COVID-19-related impacts to its cash flows compared to certain of the company’s midstream peers. We added to the Fund’s position in the stock but maintained an underweight due to the ongoing political risk associated with the Keystone XL Pipeline, which could present some headline risk, and TRP’s defensive nature, which could lead it to lag during a recovery in midstream equities. |
| The Fund was also hurt by its underweight position in Tallgrass Energy, LP (TGE), a midstream provider that primarily engages in the transportation of crude oil and natural gas in addition to providing storage, water management and processing services. On January 31, 2019, Blackstone Infrastructure Partners (“BIP”) announced a definitive agreement to acquire 100% of the membership interests in TGE’s general partners and an approximately 44% economic interest in TGE itself. After the deal was completed during March 2019, TGE’s equity price significantly underperformed the midstream sector, as represented by the Alerian MLP Index. In August 2019, TGE received a non-binding preliminary proposal letter from BIP offering to acquire all outstanding Class A shares of the company for $19.50 per share in cash. Subsequently in December 2019, TGE announced it had entered into a definitive merger agreement pursuant to which BIP, together with its affiliates, would acquire all of the publicly held outstanding Class A shares of TGE for $22.45 per share in cash. Although TGE’s stock initially rallied, there were significant delays following the announcement, which raised investor uncertainty around the prospects of the deal closing, leading TGE to trade significantly below the agreement’s offering price. In March 2020, BIP confirmed its commitment to the deal, and the Fund established a modest, though still underweight, position in the stock. After March 18th, the date we initiated the position, through the transaction’s closing date of April 17th, TGE rallied approximately 68% to reflect the original offering price and, as a result, the Fund’s underweight position hurt its relative performance. |
| Detracting further from relative performance was the Fund’s underweight position in Enbridge, Inc. (ENB), an energy transportation and distribution provider operating one of the world’s longest transportation systems that bridges the U.S. and Canada. In our view, investors perceived ENB as a relatively safe haven during the Reporting Period and, as a result, it generally outperformed the AMEI Index during periods of market weakness for the midstream energy sector. We also attribute some of its strength to the company’s “C” Corporation structure, which certain investors appeared to favor over MLP structures. Additionally, we think the advantaged geography of ENB’s asset base, the diversified nature of its business segments and its contractual protections helped to mitigate the impact on ENB’s cash flows of COVID-19-driven demand destruction. During the Reporting Period, we increased the Fund’s investment in the stock but maintained an underweight position due to what we saw as the legal, political and re-contracting risk impacting segments of ENB’s Mainline pipeline system, which would create a headwind for the company. In addition, ENB’s defensive nature may mean it could underperform during a recovery in midstream equity prices. |
| Q | Were there any notable purchases or sales during the Reporting Period? |
| A | During the Reporting Period, the Fund established a position in Suburban Propane Partners, LP (SPH), a retail propane gas marketer, because of what we saw as its relatively low volatility characteristics as well as our positive views on propane demand. In addition, the company had recently cut its distribution, and we felt this proactive step to protect its balance sheet was prudent and created an attractive entry point for the Fund. |
| During a period of severe market uncertainty driven by the COVID-19 outbreak, the Fund initiated a position in NextEra Energy, Inc. (NEE), mentioned earlier. We considered NEE an attractive investment opportunity because of what we viewed as the company’s low volatility earnings profile, focus on renewable energy sources and regulated rates of return that could help to protect its earnings from the impacts of COVID-19. |
| In addition, during the Reporting Period, the Fund established a position in Rice Acquisition Corp. (RICE/U), a special-purpose acquisition company (SPAC), through an initial public offering. A SPAC raises capital through an initial public offering for the purpose of acquiring an existing company and driving shareholder value through strategic management and operational expertise. We decided to allocate capital to RICE/U as we are confident in its |
10
PORTFOLIO RESULTS
| management team, members of which previously served as executive officers of Rice Energy Inc. and Rice Midstream Partners LP. In our opinion, they are well equipped to deliver upon their objective of producing attractive and sustainable risk-adjusted returns through the development of the world’s clean energy supply, a theme we believe may become more prominent in the global energy mix over the next several decades. |
| Among notable sales during the Reporting Period was the Fund’s position in Genesis Energy, LP (GEL), a midstream MLP that provides energy infrastructure and logistics services. A significant portion of GEL’s cash flow comes from its soda ash segment, and soda ash demand was negatively impacted by the spread of COVID-19. Additionally, cash flows from soda ash can have greater variability than those from more traditional midstream business segments because of the length and nature of soda ash contracts. Because of uncertainty around the performance of GEL’s soda ash segment, COVID-19-related impacts to its more traditional midstream segments and the company’s relatively high level of leverage, we decided to exit the Fund’s position in the stock. |
| During the Reporting Period, we also eliminated the Fund’s position in PBF Logistics LP (PBFX), which owns, leases, operates, develops and acquires crude oil and refined petroleum products, terminals, pipelines and storage facilities. PBFX’s stock price suffered as a result of refined product demand destruction stemming from COVID-19 containment efforts. In addition, PBFX was negatively impacted by investor uncertainty around the company’s affiliate and primary counterparty PBF Energy (PBF), which had exposure to gasoline, diesel and jet fuel amid worsening refining conditions. We eliminated the Fund’s position in PBFX to increase exposure to what we believed were higher quality companies with more diverse customer bases and greater trading liquidity. |
| Q | How did the Fund use derivatives and similar instruments during the Reporting Period? |
| A | During the Reporting Period, the Fund did not use derivatives or similar instruments. |
| Q | What is the Fund’s tactical view and strategy for the months ahead? |
| A | At the end of the Reporting Period, we had a positive outlook for the energy markets and energy-related equities in 2021. Taking a macro perspective, we noted that crude oil demand had improved toward the end of the Reporting Period, not only internationally, but also in the U.S., and we believed the COVID-19 vaccine would only accelerate this trend. Additionally, in our view, U.S. producers were demonstrating unprecedented supply-side discipline and OPEC+ members were showing solidarity. Assuming global production remained disciplined and demand increased on the back of rapid testing and a vaccine, Goldman Sachs Global Investment Research was forecasting at the end of the Reporting Period that Brent crude oil prices could hit $63 per barrel in 2021. Furthermore, a decline in U.S.-based upstream15 drilling activity seemed to have reduced the need for more pipeline projects, which led many midstream energy companies to shift their focus from new project spending to debt reduction and possible share buyback programs during the Reporting Period. Coupled with lower distribution payouts, this should result in strong free cash flow into 2021, in our view. We thought the shift in capital allocation was long overdue, and more free cash flow-centric business models may well be a key factor for the long-term sustainability of the midstream energy sector. In our opinion, the sector’s free cash flow potential has also created a significant opportunity for share repurchase programs, which we believe could be a meaningful catalyst for a recovery in equity prices, given the depressed valuations at the end of the Reporting Period. |
| Looking toward 2025, we believe the midstream energy sector has the potential to generate $35-$45 billion of excess cash after distributions and capital expenditures, which amounts to nearly 15% of the market capitalization of midstream energy companies generating positive free cash flow at the end of the Reporting Period. To put this in context, Wells Fargo said it expects the midstream energy sector to generate nearly $7 billion of excess cash in 2021 alone. If just 50% of that excess cash is used for share buyback programs, we believe it could reverse almost all of the investment outflows experienced from January 2020 through the end of the Reporting Period. We have seen |
| 15 | The upstream component of the energy industry is usually defined as those operations stages in the oil and gas industry that involve exploration and production. Upstream operations deal primarily with the exploration stages of the oil and gas industry, with upstream firms taking the first steps to first locate, test and drill for oil and gas. Later, once reserves are proven, upstream firms will extract any oil and gas from the reserve. |
11
PORTFOLIO RESULTS
| several billion dollars of share buyback authorizations from midstream companies during 2020 year to date through November, and we anticipate more buyback programs may be announced in coming calendar quarters. In our opinion, these programs could be accretive to shareholder value and may also be a strong technical tailwind for midstream equity prices. |
| At the end of the Reporting Period, we believed the risk-reward profile of midstream equities had grown increasingly positive. In managing the Fund, we intended to remain focused on companies we deemed to be of high quality, with strong dividend and distribution coverage ratios, healthy balance sheets and robust free cash flow outlooks. At the end of the Reporting Period, we believed the Fund was well positioned to benefit from a potential rebound in midstream equity prices we expect to see in 2021. |
12
FUND BASICS
Goldman Sachs Energy Infrastructure Fund
as of November 30, 2020
| TOP TEN HOLDINGS AS OF 11/30/201 | ||||||||
| Holding | % of Net Assets | Line of Business | ||||||
| Targa Resources Corp. | 8.0 | % | Gathering + Processing | |||||
| Enterprise Products Partners LP | 7.9 | Pipeline Transportation | Natural Gas | ||||||
| Enbridge, Inc. | 7.2 | Pipeline Transportation | Petroleum | ||||||
| TC Energy Corp. | 7.2 | Pipeline Transportation | Natural Gas | ||||||
| Cheniere Energy, Inc. | 7.2 | Other | Liquefaction | ||||||
| ONEOK, Inc. | 6.0 | Gathering + Processing | ||||||
| The Williams Cos., Inc. | 5.9 | Gathering + Processing | ||||||
| MPLX LP | 4.7 | Gathering + Processing | ||||||
| Kinder Morgan, Inc. | 4.7 | Pipeline Transportation | Natural Gas | ||||||
| Pembina Pipeline Corp. | 4.7 | Pipeline Transportation | Petroleum | ||||||
| 1 | The top 10 holdings may not be representative of the Fund’s future investments. |
| FUND SECTOR ALLOCATIONS2 |
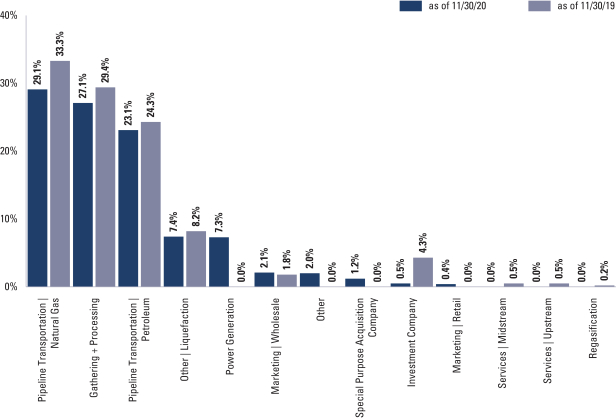
| 2 | The Fund is actively managed and, as such, its composition may differ over time. Consequently, the Fund’s overall sector allocations may differ from the percentages contained in the graph above. The percentage shown for each investment category reflects the value of investments in that category as a percentage of total net assets. The figures in the graph may not sum to 100% due to exclusion of other assets and liabilities. |
For more information about your Fund, please refer to www.GSAMFUNDS.com. There, you can learn more about your Fund’s investment strategies, holdings, and performance.
13
FUND BASICS
Index Definitions
The Alerian Midstream Energy Select Index is a capped, float-adjusted, capitalization-weighted index, whose constituents are engaged in midstream activities involving energy commodities, is disseminated real-time on a price-return basis (AMEI) and on a total-return basis (AMEIX). It is not possible to invest directly in an index.
The Clean Energy Income Composite Index is comprised of the Eagle North American Renewables Infrastructure Index (50%), Index Yieldco and Renewable Energy Income Index (35%), and Eagle Global Renewables Infrastructure Index (15%). It is not possible to invest directly in an unmanaged index
The Indxx Yieldco and Renewable Energy Income Index is designed to track the performance of income-paying renewable energy companies (RECs) and companies categorized as YieldCos listed in Developed and Emerging Markets.
The Eagle Global Renewables Infrastructure Index provides a benchmark that is designed to track the performance of renewables infrastructure or renewables-related infrastructure assets, primarily wind, solar, hydro, biomass, and electric transmission lines. Constituents are companies whose stocks trade globally in OECD countries.
The Eagle North American Renewables Infrastructure Index provides a benchmark that is designed to track the performance of renewables infrastructure or renewables related infrastructure assets, primarily wind, solar, hydro, biomass, and electric transmission lines. Constituents are companies whose stocks trade in either the USA and Canada, though assets owned by these companies can have a global reach. The index is a capped, float-adjusted, capitalization-weighted index developed by Eagle Global Advisors, and disseminated real-time on a price-return basis (RENEWNA) and on a total-return basis (RENEWNAT).
14
GOLDMAN SACHS ENERGY INFRASTRUCTURE FUND
Performance Summary
November 30, 2020
The following graph shows the value, as of November 30, 2020, of a $1,000,000 investment made on September 29, 2017 (commencement of operations) in Institutional Shares at NAV. For comparative purposes, the performance of the Fund’s benchmark, the Alerian Midstream Energy Select Index (Total Return, Unhedged, USD), is shown. Performance reflects applicable fee waivers and/or expense limitations in effect during the periods shown and in their absence, performance would be reduced. Returns do not reflect the deduction of taxes that a shareholder would pay on Fund distributions or the redemption of Fund shares. The returns set forth below represent past performance. Past performance does not guarantee future results. The Fund’s investment return and principal value will fluctuate so that an investor’s shares, when redeemed, may be worth more or less than their original cost. Current performance may be lower or higher than the performance quoted below. Please visit our web site at www.GSAMFUNDS.com to obtain the most recent month-end returns.
| Energy Infrastructure Fund’s Lifetime Performance |
Performance of a $1,000,000 investment, with distributions reinvested, from September 29, 2017 through November 30, 2020.
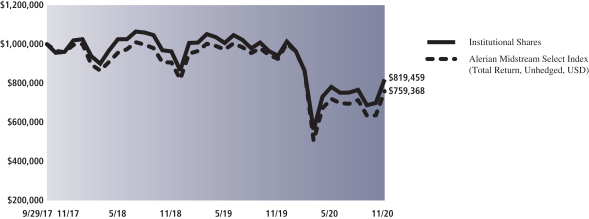
| Average Annual Total Return through November 30, 2020* | One Year | Since Inception | ||||||
| Class A (Commenced September 29, 2017) |
||||||||
| Excluding sales charges |
-13.05% | -6.43% | ||||||
| Including sales charges |
-17.79% | -8.08% | ||||||
|
|
||||||||
| Class C (Commenced September 29, 2017) |
||||||||
| Excluding contingent deferred sales charges |
-13.60% | -7.09% | ||||||
| Including contingent deferred sales charges |
-14.46% | -7.09% | ||||||
|
|
||||||||
| Institutional (Commenced September 29, 2017) |
-12.74% | -6.05% | ||||||
|
|
||||||||
| Investor (Commenced September 29, 2017) |
-12.86% | -6.18% | ||||||
|
|
||||||||
| Class R6 (Commenced September 29, 2017) |
-12.83% | -6.08% | ||||||
|
|
||||||||
| Class R (Commenced September 29, 2017) |
-13.34% | -6.66% | ||||||
|
|
||||||||
| Class P (Commenced April 16, 2018) |
-12.74% | -5.81% | ||||||
|
|
||||||||
| * | These returns assume reinvestment of all distributions at NAV and reflect a maximum initial sales charge of 5.50% for Class A and the assumed contingent deferred sales charge for Class C Shares (1% if redeemed within 12 months of purchase). Because Institutional, Investor, Class R6, Class R and Class P Shares do not involve a sales charge, such a charge is not applied to their Average Annual Total Return. |
15
GOLDMAN SACHS CLEAN ENERGY INCOME FUND
November 30, 2020
| Shares | Description | Value |
||||||
| Common Stocks – 96.5% | ||||||||
| Clean Technology* – 1.1% | ||||||||
| 5,421 | Enphase Energy, Inc. | $ | 740,346 | |||||
| 2,402 | SolarEdge Technologies, Inc. | 667,708 | ||||||
|
|
|
|||||||
| 1,408,054 | ||||||||
|
|
|
|||||||
| Renewable IPP – 63.3% | ||||||||
| 3,920 | Ameresco, Inc. Class A* | 174,636 | ||||||
| 169,736 | Atlantica Sustainable Infrastructure PLC | 5,837,221 | ||||||
| 217,592 | Boralex, Inc. Class A | 6,876,088 | ||||||
| 6,890 | Brookfield Renewable Corp. Class A | 544,186 | ||||||
| 236,321 | Brookfield Renewable Partners LP | 15,019,585 | ||||||
| 200,688 | Clearway Energy, Inc. Class A | 5,446,672 | ||||||
| 81,032 | EDP Renovaveis SA | 1,717,456 | ||||||
| 87,260 | Enviva Partners LP | 3,895,286 | ||||||
| 76,487 | Green Plains Partners LP | 646,315 | ||||||
| 108,997 | Hannon Armstrong Sustainable Infrastructure Capital, Inc. | 5,957,776 | ||||||
| 286,963 | Innergex Renewable Energy, Inc. | 5,678,717 | ||||||
| 113,984 | NextEra Energy Partners LP | 7,234,564 | ||||||
| 265,090 | Northland Power, Inc. | 9,085,359 | ||||||
| 17,072 | Orsted A/S(a) | 3,071,708 | ||||||
| 8,794 | TPI Composites, Inc.* | 353,783 | ||||||
| 295,592 | TransAlta Corp. | 2,048,455 | ||||||
| 376,642 | TransAlta Renewables, Inc. | 5,202,862 | ||||||
|
|
|
|||||||
| 78,790,669 | ||||||||
|
|
|
|||||||
| Renewable-Focused Power Infrastructure – 32.1% | ||||||||
| 236,493 | Algonquin Power & Utilities Corp. | 3,705,731 | ||||||
| 10,680 | American Electric Power Co., Inc. | 906,625 | ||||||
| 649,315 | EDP – Energias de Portugal SA | 3,470,758 | ||||||
| 163,211 | Emera, Inc. | 6,767,469 | ||||||
| 445,174 | Enel SpA | 4,466,351 | ||||||
| 232,730 | Hydro One Ltd.(a) | 5,429,829 | ||||||
| 191,956 | Iberdrola SA | 2,635,117 | ||||||
| 98,638 | NextEra Energy, Inc. | 7,258,771 | ||||||
| 36,485 | Polaris Infrastructure, Inc. | 474,218 | ||||||
| 63,157 | RWE AG | 2,612,322 | ||||||
| 102,162 | SSE PLC | 1,828,597 | ||||||
| 1,680 | Vestas Wind Systems A/S | 342,407 | ||||||
|
|
|
|||||||
| 39,898,195 | ||||||||
|
|
|
|||||||
| TOTAL COMMON STOCKS | ||||||||
| (Cost $108,400,076) | $ | 120,096,918 | ||||||
|
|
|
|||||||
| Units | Description | Value | ||||||
| Special Purpose Acquisition Company*(b) – 0.8% | ||||||||
| 96,798 | Rice Acquisition Corp. | $ | 1,002,827 | |||||
| (Cost $967,980) | ||||||||
|
|
|
|||||||
| Exchange Traded Funds – 0.9% | ||||||||
| 8,480 | Invesco WilderHill Clean Energy ETF | 779,143 | ||||||
| 13,300 | iShares Global Clean Energy ETF | 312,949 | ||||||
|
|
|
|||||||
| TOTAL EXCHANGE TRADED FUNDS | ||||||||
| (Cost $1,100,008) | $ | 1,092,092 | ||||||
|
|
|
|||||||
| TOTAL INVESTMENTS – 98.2% | ||||||||
| (Cost $110,468,064) | $ | 122,191,837 | ||||||
|
|
|
|||||||
| |
OTHER ASSETS IN EXCESS OF LIABILITIES – 1.8% |
2,205,950 | ||||||
|
|
|
|||||||
| NET ASSETS – 100.0% | $ | 124,397,787 | ||||||
|
|
|
|||||||
| The percentage shown for each investment category reflects the value of investments in that category as a percentage of net assets. | ||
| * |
Non-income producing security. | |
| (a) |
Exempt from registration under Rule 144A of the Securities Act of 1933. | |
| (b) |
Units consist of 1 share of common stock and 1/2 warrant. | |
|
| ||
| Investment Abbreviations: | ||
| ETF |
—Exchange Traded Fund | |
| IPP |
—Independent Power Producers | |
| LP |
—Limited Partnership | |
| PLC |
—Public Limited Company | |
|
| ||
| 16 | The accompanying notes are an integral part of these financial statements. |
GOLDMAN SACHS ENERGY INFRASTRUCTURE FUND
Schedule of Investments
November 30, 2020
| Shares | Description | Value |
||||||
| Common Stocks – 98.5% | ||||||||
| Gathering + Processing – 27.1% | ||||||||
| 495,463 | Antero Midstream Corp. | $ | 3,339,421 | |||||
| 56,824 | Crestwood Equity Partners LP | 926,799 | ||||||
| 45,105 | DCP Midstream LP | 728,446 | ||||||
| 541,387 | MPLX LP | 11,390,783 | ||||||
| 405,313 | ONEOK, Inc. | 14,538,577 | ||||||
| 823,545 | Targa Resources Corp. | 19,353,308 | ||||||
| 685,777 | The Williams Cos., Inc. | 14,387,601 | ||||||
| 60,826 | Western Midstream Partners LP | 784,655 | ||||||
|
|
|
|||||||
| 65,449,590 | ||||||||
|
|
|
|||||||
| Marketing | Retail – 0.4% | ||||||||
| 69,330 | Suburban Propane Partners LP | 1,062,135 | ||||||
|
|
|
|||||||
| Marketing | Wholesale – 2.1% | ||||||||
| 321,713 | Gibson Energy, Inc. | 5,167,424 | ||||||
|
|
|
|||||||
| Other – 2.0% | ||||||||
| 12,943 | American Water Works Co., Inc. | 1,985,197 | ||||||
| 56,952 | Darling Ingredients, Inc.* | 2,749,643 | ||||||
|
|
|
|||||||
| 4,734,840 | ||||||||
|
|
|
|||||||
| Other | Liquefaction – 7.4% | ||||||||
| 305,343 | Cheniere Energy, Inc.* | 17,309,895 | ||||||
| 12,285 | New Fortress Energy, Inc. | 529,606 | ||||||
|
|
|
|||||||
| 17,839,501 | ||||||||
|
|
|
|||||||
| Pipeline Transportation | Natural Gas – 29.1% | ||||||||
| 1,481,003 | Energy Transfer LP | 9,152,599 | ||||||
| 988,229 | Enterprise Products Partners LP | 19,171,643 | ||||||
| 427,458 | Equitrans Midstream Corp. | 3,488,057 | ||||||
| 232,266 | Inter Pipeline Ltd. | 2,314,254 | ||||||
| 429,981 | Keyera Corp. | 7,419,631 | ||||||
| 789,303 | Kinder Morgan, Inc. | 11,350,177 | ||||||
| 397,580 | TC Energy Corp. | 17,489,601 | ||||||
|
|
|
|||||||
| 70,385,962 | ||||||||
|
|
|
|||||||
| Pipeline Transportation | Petroleum – 23.1% | ||||||||
| 158,124 | BP Midstream Partners LP | 1,793,126 | ||||||
| 561,110 | Enbridge, Inc. | 17,524,156 | ||||||
| 124,293 | Holly Energy Partners LP | 1,682,927 | ||||||
| 222,537 | Magellan Midstream Partners LP | 9,157,398 | ||||||
| 444,257 | Pembina Pipeline Corp. | 11,329,631 | ||||||
| 93,697 | Phillips 66 Partners LP | 2,518,575 | ||||||
| 1,384,129 | Plains GP Holdings LP Class A | 10,976,143 | ||||||
| 95,502 | Shell Midstream Partners LP | 979,851 | ||||||
|
|
|
|||||||
| 55,961,807 | ||||||||
|
|
|
|||||||
| Power Generation – 7.3% | ||||||||
| 33,292 | Ameren Corp. | 2,589,452 | ||||||
| 26,323 | Dominion Energy, Inc. | 2,066,092 | ||||||
| 12,756 | Emera, Inc. | 528,922 | ||||||
| 23,646 | Eversource Energy | 2,069,261 | ||||||
| 48,685 | NextEra Energy Partners LP | 3,090,037 | ||||||
| 57,114 | NextEra Energy, Inc. | 4,203,019 | ||||||
|
|
|
|||||||
| Common Stocks – (continued) | ||||||||
| Power Generation – (continued) | ||||||||
| 61,793 | Northland Power, Inc. | 2,117,815 | ||||||
| 8,481 | Sempra Energy | 1,081,159 | ||||||
|
|
|
|||||||
| 17,745,757 | ||||||||
|
|
|
|||||||
| TOTAL COMMON STOCKS | ||||||||
| (Cost $183,478,113) | $ | 238,347,016 | ||||||
|
|
|
|||||||
| Units | Description | Value | ||||||
| Special Purpose Acquisition Company*(a) – 1.2% | ||||||||
| 272,186 | Rice Acquisition Corp. | $ | 2,819,847 | |||||
| (Cost $2,721,860) | ||||||||
|
|
|
|||||||
| Shares | Dividend Rate |
Value | ||||||
| Investment Company(b) – 0.5% | ||||||||
| Goldman Sachs Financial Square Government Fund – Institutional Shares |
| |||||||
| 1,125,704 | 0.016 | % | $ | 1,125,704 | ||||
| (Cost $1,125,704) |
| |||||||
|
|
||||||||
| TOTAL INVESTMENTS – 100.2% |
| |||||||
| (Cost $187,325,677) |
|
$ | 242,292,567 | |||||
|
|
||||||||
| LIABILITIES IN EXCESS OF OTHER ASSETS – (0.2)% |
|
(397,980 | ) | |||||
|
|
||||||||
| NET ASSETS – 100.0% |
|
$ | 241,894,587 | |||||
|
|
||||||||
| The percentage shown for each investment category reflects the value of investments in that category as a percentage of net assets. | ||
| * |
Non-income producing security. | |
| (a) |
Units consist of 1 share of common stock and 1/2 warrant. | |
| (b) |
Represents an affiliated issuer. | |
|
| ||||
| Investment Abbreviations: | ||||
| GP |
— | General Partnership | ||
| LP |
— | Limited Partnership | ||
|
| ||||
| The accompanying notes are an integral part of these financial statements. | 17 |
GOLDMAN SACHS ENERGY FUNDS
Statements of Assets and Liabilities
November 30, 2020
| Clean Energy Income Fund |
Energy Infrastructure Fund |
|||||||||
| Assets: | ||||||||||
| Investments of unaffiliated issuers, at value (cost $110,468,064 and $186,199,973, respectively) |
$ | 122,191,837 | $ | 241,166,863 | ||||||
| Investments of affiliated issuers, at value (cost $0 and $1,125,704, respectively) |
— | 1,125,704 | ||||||||
| Cash |
4,136,590 | 1,171,603 | ||||||||
| Foreign currencies, at value (cost $174,037 and $31,018, respectively) |
174,056 | 31,040 | ||||||||
| Receivables: |
||||||||||
| Fund shares sold |
1,840,450 | 1,049,800 | ||||||||
| Dividends |
315,288 | 443,218 | ||||||||
| Investments sold |
306,419 | — | ||||||||
| Reimbursement from investment adviser |
82,797 | 32,745 | ||||||||
| Foreign tax reclaims |
941 | — | ||||||||
| Deferred offering costs |
141,318 | — | ||||||||
| Other assets |
9,143 | 45,138 | ||||||||
| Total assets | 129,198,839 | 245,066,111 | ||||||||
| Liabilities: | ||||||||||
| Payables: |
||||||||||
| Investments purchased |
4,594,281 | — | ||||||||
| Management fees |
67,275 | 185,637 | ||||||||
| Fund shares redeemed |
10,700 | 2,750,000 | ||||||||
| Distribution and Service fees and Transfer Agency fees |
3,077 | 5,762 | ||||||||
| Accrued expenses |
125,719 | 230,125 | ||||||||
| Total liabilities | 4,801,052 | 3,171,524 | ||||||||
| Net Assets: | ||||||||||
| Paid-in capital |
111,810,271 | 226,831,034 | ||||||||
| Total distributable earnings |
12,587,516 | 15,063,553 | ||||||||
| NET ASSETS | $ | 124,397,787 | $ | 241,894,587 | ||||||
| Net Assets: |
||||||||||
| Class A |
$ | 1,881,904 | $ | 68,012 | ||||||
| Class C |
82,968 | 134,584 | ||||||||
| Institutional |
7,070,209 | 2,414,699 | ||||||||
| Investor |
68,184 | 40,821 | ||||||||
| Class R6 |
68,225 | 78,375,169 | ||||||||
| Class R |
68,040 | 40,186 | ||||||||
| Class P |
115,158,257 | 160,821,116 | ||||||||
| Total Net Assets |
$ | 124,397,787 | $ | 241,894,587 | ||||||
| Shares Outstanding $0.001 par value (unlimited number of shares authorized): |
||||||||||
| Class A |
138,423 | 9,469 | ||||||||
| Class C |
6,110 | 18,703 | ||||||||
| Institutional |
519,322 | 335,928 | ||||||||
| Investor |
5,009 | 5,679 | ||||||||
| Class R6 |
5,011 | 10,914,308 | ||||||||
| Class R |
5,000 | 5,587 | ||||||||
| Class P |
8,463,217 | 22,388,023 | ||||||||
| Net asset value, offering and redemption price per share:(a) |
||||||||||
| Class A |
$13.60 | $7.18 | ||||||||
| Class C |
13.58 | 7.20 | ||||||||
| Institutional |
13.61 | 7.19 | ||||||||
| Investor |
13.61 | 7.19 | ||||||||
| Class R6 |
13.61 | (b) | 7.18 | |||||||
| Class R |
13.61 | 7.19 | ||||||||
| Class P |
13.61 | 7.18 | ||||||||
| (a) | Maximum public offering price per share for Class A Shares is $14.39 for the Clean Energy Income Fund and $7.60 for the Energy Infrastructure Fund. At redemption, Class C Shares may be subject to a contingent deferred sales charge, assessed on the amount equal to the lesser of the current net asset value or the original purchase price of the shares. |
| (b) | Net asset value may not recalculate due to rounding of fractional shares. |
| 18 | The accompanying notes are an integral part of these financial statements. |
GOLDMAN SACHS ENERGY FUNDS
Statements of Operations
For the Period Ended November 30, 2020
| Clean Energy Income Fund(a) |
Energy Infrastructure Fund |
|||||||||
| Investment income: | ||||||||||
| Dividends — unaffiliated issuers (net of foreign withholding taxes of $48,139 and $482,739, respectively) |
$ | 474,083 | $ | 3,176,364 | ||||||
| Dividends — affiliated issuers |
165 | 11,912 | ||||||||
| Total investment income | 474,248 | 3,188,276 | ||||||||
| Expenses: | ||||||||||
| Management fees |
163,829 | 1,636,804 | ||||||||
| Professional fees |
99,601 | 211,810 | ||||||||
| Amortization of offering costs |
94,469 | — | ||||||||
| Printing and mailing costs |
52,455 | 46,834 | ||||||||
| Custody, accounting and administrative services |
24,507 | 79,717 | ||||||||
| Organization costs |
12,000 | — | ||||||||
| Trustee fees |
11,456 | 20,289 | ||||||||
| Transfer Agency fees(b) |
6,731 | 49,749 | ||||||||
| Registration fees |
2,132 | 114,389 | ||||||||
| Distribution and Service (12b-1) fees(b) |
724 | 1,564 | ||||||||
| Service Share fees — Class C |
64 | 408 | ||||||||
| Other |
7,899 | 403 | ||||||||
| Total expenses | 475,867 | 2,161,967 | ||||||||
| Less — expense reductions |
(293,856 | ) | (371,188 | ) | ||||||
| Net expenses | 182,011 | 1,790,779 | ||||||||
| NET INVESTMENT INCOME | 292,237 | 1,397,497 | ||||||||
| Realized and unrealized gain (loss): | ||||||||||
| Net realized gain (loss) from: |
||||||||||
| Investments — unaffiliated issuers |
851,008 | (37,468,406 | ) | |||||||
| Foreign currency transactions |
(650 | ) | 79,900 | |||||||
| Net change in unrealized gain (loss) on: |
||||||||||
| Investments — unaffiliated issuers |
11,723,773 | 53,845,632 | ||||||||
| Foreign currency translation |
(4,704 | ) | 3,411 | |||||||
| Net realized and unrealized gain | 12,569,427 | 16,460,537 | ||||||||
| NET INCREASE IN NET ASSETS RESULTING FROM OPERATIONS | $ | 12,861,664 | $ | 17,858,034 | ||||||
| (a) | Commenced operations on June 26, 2020. |
| (b) | Class specific Distribution and/or Service (12b-1) and Transfer Agency fees were as follows: |
| Distribution and/or Service (12b-1) Fees |
Transfer Agency Fees | |||||||||||||||||||||||||||||||||||||||
| Fund |
Class A |
Class C |
Class R |
Class A |
Class C |
Institutional |
Investor |
Class R6 |
Class R |
Class P |
||||||||||||||||||||||||||||||
| Clean Energy Income |
$ | 407 | $ | 191 | $ | 126 | $ | 277 | $ | 43 | $ | 1,012 | $ | 43 | $ | 8 | $ | 43 | $ | 5,305 | ||||||||||||||||||||
| Energy Infrastructure |
135 | 1,225 | 204 | 91 | 277 | 915 | 67 | 11,912 | 71 | 36,416 | ||||||||||||||||||||||||||||||
| The accompanying notes are an integral part of these financial statements. | 19 |
GOLDMAN SACHS ENERGY FUNDS
Statements of Changes in Net Assets
| Clean Energy Income Fund |
Energy Infrastructure Fund | |||||||||||||||||
| For the Period Ended |
For the Fiscal Year Ended November 30, 2020 |
For the Fiscal Year Ended November 30, 2019 |
||||||||||||||||
| From operations: |
|
|||||||||||||||||
| Net investment income |
$ | 292,237 | $ | 1,397,497 | $ | 931,598 | ||||||||||||
| Net realized gain (loss) |
850,358 | (37,388,506 | ) | (466,134 | ) | |||||||||||||
| Net change in unrealized gain |
11,719,069 | 53,849,043 | 1,297,993 | |||||||||||||||
| Net increase in net assets resulting from operations | 12,861,664 | 17,858,034 | 1,763,457 | |||||||||||||||
| Distributions to shareholders: |
|
|||||||||||||||||
| From distributable earnings: |
||||||||||||||||||
| Class A Shares |
(3,603 | ) | (792 | ) | (1,399 | ) | ||||||||||||
| Class C Shares |
— | (1,512 | ) | (2,166 | ) | |||||||||||||
| Institutional Shares |
(15,442 | ) | (32,726 | ) | (71,875 | ) | ||||||||||||
| Investor Shares |
(118 | ) | (543 | ) | (1,258 | ) | ||||||||||||
| Class R6 Shares |
(151 | ) | (854,643 | ) | (1,304 | ) | ||||||||||||
| Class R Shares |
— | (481 | ) | (1,161 | ) | |||||||||||||
| Class P Shares |
(258,820 | ) | (1,985,203 | ) | (1,574,896 | ) | ||||||||||||
| Return of capital: |
||||||||||||||||||
| Class A Shares |
— | (1,960 | ) | (922 | ) | |||||||||||||
| Class C Shares |
— | (3,739 | ) | (1,428 | ) | |||||||||||||
| Institutional Shares |
— | (80,937 | ) | (47,362 | ) | |||||||||||||
| Investor Shares |
— | (1,341 | ) | (829 | ) | |||||||||||||
| Class R6 Shares |
— | (2,113,673 | ) | (860 | ) | |||||||||||||
| Class R Shares |
— | (1,189 | ) | (765 | ) | |||||||||||||
| Class P Shares |
— | (4,909,734 | ) | (1,037,780 | ) | |||||||||||||
| Total distributions to shareholders | (278,134 | ) | (9,988,473 | ) | (2,744,005 | ) | ||||||||||||
| From share transactions: |
|
|||||||||||||||||
| Proceeds from sales of shares |
111,708,330 | 284,094,043 | 76,258,028 | |||||||||||||||
| Reinvestment of distributions |
278,134 | 9,846,938 | 2,744,005 | |||||||||||||||
| Cost of shares redeemed |
(172,207 | ) | (127,843,592 | ) | (15,624,549 | ) | ||||||||||||
| Net increase in net assets resulting from share transactions | 111,814,257 | 166,097,389 | 63,377,484 | |||||||||||||||
| TOTAL INCREASE | 124,397,787 | 173,966,950 | 62,396,936 | |||||||||||||||
| Net assets: |
|
|||||||||||||||||
| Beginning of period |
— | 67,927,637 | 5,530,701 | |||||||||||||||
| End of period |
$ | 124,397,787 | $ | 241,894,587 | $ | 67,927,637 | ||||||||||||
| (a) | Commenced operations on June 26, 2020. |
| 20 | The accompanying notes are an integral part of these financial statements. |
GOLDMAN SACHS CLEAN ENERGY INCOME FUND
Selected Share Data for a Share Outstanding Throughout the Period
| (a) | Commenced operations on June 26, 2020. |
| (b) | Calculated based on the average shares outstanding methodology. |
| (c) | Assumes investment at the NAV at the beginning of the period, reinvestment of all dividends and distributions, a complete redemption of the investment at the NAV at the end of the period and no sales or redemption charges (if any). Total returns would be reduced if a sales or redemption charge was taken into account. Returns do not reflect the impact of taxes to shareholders relating to Fund distributions or the redemption of Fund shares. Total returns for periods less than one full year are not annualized. |
| (d) | Annualized. |
| (e) | The Fund’s portfolio turnover rate is calculated in accordance with regulatory requirements, without regard to transactions involving short term investments. If such transactions were included, the Fund’s portfolio turnover rate may be higher. |
| The accompanying notes are an integral part of these financial statements. | 21 |
GOLDMAN SACHS CLEAN ENERGY INCOME FUND
Financial Highlights (continued)
Selected Share Data for a Share Outstanding Throughout the Period
| Goldman Sachs Clean Energy Income Fund | ||||||
| Class C Shares | ||||||
| Period Ended November 30, 2020(a) |
||||||
| Per Share Data | ||||||
| Net asset value, beginning of period |
$ | 10.00 | ||||
| Net investment income(b) |
0.03 | |||||
| Net realized and unrealized gain |
3.55 | |||||
| Total from investment operations |
3.58 | |||||
| Net asset value, end of period |
$ | 13.58 | ||||
| Total return(c) | 35.80 | % | ||||
| Net assets, end of period (in 000s) |
$ | 83 | ||||
| Ratio of net expenses to average net assets |
2.02 | %(d) | ||||
| Ratio of total expenses to average net assets |
4.85 | %(d) | ||||
| Ratio of net investment income to average net assets |
0.51 | %(d) | ||||
| Portfolio turnover rate(e) |
10 | % | ||||
| (a) | Commenced operations on June 26, 2020. |
| (b) | Calculated based on the average shares outstanding methodology. |
| (c) | Assumes investment at the NAV at the beginning of the period, reinvestment of all dividends and distributions, a complete redemption of the investment at the NAV at the end of the period and no sales or redemption charges (if any). Total returns would be reduced if a sales or redemption charge was taken into account. Returns do not reflect the impact of taxes to shareholders relating to Fund distributions or the redemption of Fund shares. Total returns for periods less than one full year are not annualized. |
| (d) | Annualized. |
| (e) | The Fund’s portfolio turnover rate is calculated in accordance with regulatory requirements, without regard to transactions involving short term investments. If such transactions were included, the Fund’s portfolio turnover rate may be higher. |
| 22 | The accompanying notes are an integral part of these financial statements. |
GOLDMAN SACHS CLEAN ENERGY INCOME FUND
Financial Highlights (continued)
Selected Share Data for a Share Outstanding Throughout the Period
| Goldman Sachs Clean Energy Income Fund | ||||||
| Institutional Shares | ||||||
| Period Ended November 30, 2020(a) |
||||||
| Per Share Data | ||||||
| Net asset value, beginning of period |
$ | 10.00 | ||||
| Net investment income(b) |
0.08 | |||||
| Net realized and unrealized gain |
3.56 | |||||
| Total from investment operations |
3.64 | |||||
| Distributions to shareholders from net investment income |
(0.03 | ) | ||||
| Net asset value, end of period |
$ | 13.61 | ||||
| Total return(c) | 36.40 | % | ||||
| Net assets, end of period (in 000s) |
$ | 7,070 | ||||
| Ratio of net expenses to average net assets |
0.89 | %(d) | ||||
| Ratio of total expenses to average net assets |
3.62 | %(d) | ||||
| Ratio of net investment income to average net assets |
1.52 | %(d) | ||||
| Portfolio turnover rate(e) |
10 | % | ||||
| (a) | Commenced operations on June 26, 2020. |
| (b) | Calculated based on the average shares outstanding methodology. |
| (c) | Assumes investment at the NAV at the beginning of the period, reinvestment of all dividends and distributions, a complete redemption of the investment at the NAV at the end of the period and no sales or redemption charges (if any). Total returns would be reduced if a sales or redemption charge was taken into account. Returns do not reflect the impact of taxes to shareholders relating to Fund distributions or the redemption of Fund shares. Total returns for periods less than one full year are not annualized. |
| (d) | Annualized. |
| (e) | The Fund’s portfolio turnover rate is calculated in accordance with regulatory requirements, without regard to transactions involving short term investments. If such transactions were included, the Fund’s portfolio turnover rate may be higher. |
| The accompanying notes are an integral part of these financial statements. | 23 |
GOLDMAN SACHS CLEAN ENERGY INCOME FUND
Financial Highlights (continued)
Selected Share Data for a Share Outstanding Throughout the Period
| Goldman Sachs Clean Energy Income Fund | ||||||
| Investor Shares | ||||||
| Period Ended November 30, 2020(a) |
||||||
| Per Share Data | ||||||
| Net asset value, beginning of period |
$ | 10.00 | ||||
| Net investment income(b) |
0.07 | |||||
| Net realized and unrealized gain |
3.56 | |||||
| Total from investment operations |
3.63 | |||||
| Distributions to shareholders from net investment income |
(0.02 | ) | ||||
| Net asset value, end of period |
$ | 13.61 | ||||
| Total return(c) | 36.33 | % | ||||
| Net assets, end of period (in 000s) |
$ | 68 | ||||
| Ratio of net expenses to average net assets |
1.02 | %(d) | ||||
| Ratio of total expenses to average net assets |
3.86 | %(d) | ||||
| Ratio of net investment income to average net assets |
1.39 | %(d) | ||||
| Portfolio turnover rate(e) |
10 | % | ||||
| (a) | Commenced operations on June 26, 2020. |
| (b) | Calculated based on the average shares outstanding methodology. |
| (c) | Assumes investment at the NAV at the beginning of the period, reinvestment of all dividends and distributions, a complete redemption of the investment at the NAV at the end of the period and no sales or redemption charges (if any). Total returns would be reduced if a sales or redemption charge was taken into account. Returns do not reflect the impact of taxes to shareholders relating to Fund distributions or the redemption of Fund shares. Total returns for periods less than one full year are not annualized. |
| (d) | Annualized. |
| (e) | The Fund’s portfolio turnover rate is calculated in accordance with regulatory requirements, without regard to transactions involving short term investments. If such transactions were included, the Fund’s portfolio turnover rate may be higher. |
| 24 | The accompanying notes are an integral part of these financial statements. |
GOLDMAN SACHS CLEAN ENERGY INCOME FUND
Financial Highlights (continued)
Selected Share Data for a Share Outstanding Throughout the Period
| Goldman Sachs Clean Energy Income Fund | ||||||
| Class R6 Shares | ||||||
| Period Ended November 30, 2020(a) |
||||||
| Per Share Data | ||||||
| Net asset value, beginning of period |
$ | 10.00 | ||||
| Net investment income(b) |
0.08 | |||||
| Net realized and unrealized gain |
3.56 | |||||
| Total from investment operations |
3.64 | |||||
| Distributions to shareholders from net investment income |
(0.03 | ) | ||||
| Net asset value, end of period |
$ | 13.61 | ||||
| Total return(c) | 36.40 | % | ||||
| Net assets, end of period (in 000s) |
$ | 68 | ||||
| Ratio of net expenses to average net assets |
0.88 | %(d) | ||||
| Ratio of total expenses to average net assets |
3.72 | %(d) | ||||
| Ratio of net investment income to average net assets |
1.53 | %(d) | ||||
| Portfolio turnover rate(e) |
10 | % | ||||
| (a) | Commenced operations on June 26, 2020. |
| (b) | Calculated based on the average shares outstanding methodology. |
| (c) | Assumes investment at the NAV at the beginning of the period, reinvestment of all dividends and distributions, a complete redemption of the investment at the NAV at the end of the period and no sales or redemption charges (if any). Total returns would be reduced if a sales or redemption charge was taken into account. Returns do not reflect the impact of taxes to shareholders relating to Fund distributions or the redemption of Fund shares. Total returns for periods less than one full year are not annualized. |
| (d) | Annualized. |
| (e) | The Fund’s portfolio turnover rate is calculated in accordance with regulatory requirements, without regard to transactions involving short term investments. If such transactions were included, the Fund’s portfolio turnover rate may be higher. |
| The accompanying notes are an integral part of these financial statements. | 25 |
GOLDMAN SACHS CLEAN ENERGY INCOME FUND
Financial Highlights (continued)
Selected Share Data for a Share Outstanding Throughout the Period
| Goldman Sachs Clean Energy Income Fund | ||||||
| Class R Shares | ||||||
| Period Ended November 30, 2020(a) |
||||||
| Per Share Data | ||||||
| Net asset value, beginning of period |
$ | 10.00 | ||||
| Net investment income(b) |
0.05 | |||||
| Net realized and unrealized gain |
3.56 | |||||
| Total from investment operations |
3.61 | |||||
| Net asset value, end of period |
$ | 13.61 | ||||
| Total return(c) | 36.10 | % | ||||
| Net assets, end of period (in 000s) |
$ | 68 | ||||
| Ratio of net expenses to average net assets |
1.52 | %(d) | ||||
| Ratio of total expenses to average net assets |
4.36 | %(d) | ||||
| Ratio of net investment income to average net assets |
0.89 | %(d) | ||||
| Portfolio turnover rate(e) |
10 | % | ||||
| (a) | Commenced operations on June 26, 2020. |
| (b) | Calculated based on the average shares outstanding methodology. |
| (c) | Assumes investment at the NAV at the beginning of the period, reinvestment of all dividends and distributions, a complete redemption of the investment at the NAV at the end of the period and no sales or redemption charges (if any). Total returns would be reduced if a sales or redemption charge was taken into account. Returns do not reflect the impact of taxes to shareholders relating to Fund distributions or the redemption of Fund shares. Total returns for periods less than one full year are not annualized. |
| (d) | Annualized. |
| (e) | The Fund’s portfolio turnover rate is calculated in accordance with regulatory requirements, without regard to transactions involving short term investments. If such transactions were included, the Fund’s portfolio turnover rate may be higher. |
| 26 | The accompanying notes are an integral part of these financial statements. |
GOLDMAN SACHS CLEAN ENERGY INCOME FUND
Financial Highlights (continued)
Selected Share Data for a Share Outstanding Throughout the Period
| Goldman Sachs Clean Energy Income Fund | ||||||
| Class P Shares | ||||||
| Period Ended November 30, 2020(a) |
||||||
| Per Share Data | ||||||
| Net asset value, beginning of period |
$ | 10.00 | ||||
| Net investment income(b) |
0.08 | |||||
| Net realized and unrealized gain |
3.56 | |||||
| Total from investment operations |
3.64 | |||||
| Distributions to shareholders from net investment income |
(0.03 | ) | ||||
| Net asset value, end of period |
$ | 13.61 | ||||
| Total return(c) | 36.41 | % | ||||
| Net assets, end of period (in 000s) |
$ | 115,158 | ||||
| Ratio of net expenses to average net assets |
0.88 | %(d) | ||||
| Ratio of total expenses to average net assets |
1.85 | %(d) | ||||
| Ratio of net investment income to average net assets |
1.41 | %(d) | ||||
| Portfolio turnover rate(e) |
10 | % | ||||
| (a) | Commenced operations on June 26, 2020. |
| (b) | Calculated based on the average shares outstanding methodology. |
| (c) | Assumes investment at the NAV at the beginning of the period, reinvestment of all dividends and distributions, a complete redemption of the investment at the NAV at the end of the period and no sales or redemption charges (if any). Total returns would be reduced if a sales or redemption charge was taken into account. Returns do not reflect the impact of taxes to shareholders relating to Fund distributions or the redemption of Fund shares. Total returns for periods less than one full year are not annualized. |
| (d) | Annualized. |
| (e) | The Fund’s portfolio turnover rate is calculated in accordance with regulatory requirements, without regard to transactions involving short term investments. If such transactions were included, the Fund’s portfolio turnover rate may be higher. |
| The accompanying notes are an integral part of these financial statements. | 27 |
GOLDMAN SACHS ENERGY INFRASTRUCTURE FUND
Financial Highlights (continued)
Selected Share Data for a Share Outstanding Throughout Each Period
| (a) | Commenced operations on September 29, 2017. |
| (b) | Calculated based on the average shares outstanding methodology. |
| (c) | Calculation of the net gain (loss) per share (both realized and unrealized) does not correlate to the aggregate realized and unrealized gain (loss) presented in the Statement of Operations due to the timing of subscriptions and redemptions of Fund shares in relation to fluctuations in the market value of the portfolio. |
| (d) | Assumes investment at the NAV at the beginning of the period, reinvestment of all dividends and distributions, a complete redemption of the investment at the NAV at the end of the period and no sales or redemption charges (if any). Total returns would be reduced if a sales or redemption charge was taken into account. Returns do not reflect the impact of taxes to shareholders relating to Fund distributions or the redemption of Fund shares. Total returns for periods less than one full year are not annualized. |
| (e) | Annualized. |
| (f) | The amount reflects certain expense reallocations between the classes due to the timing of sales and redemptions of Fund class shares. |
| (g) | The Fund’s portfolio turnover rate is calculated in accordance with regulatory requirements, without regard to transactions involving short term investments. If such transactions were included, the Fund’s portfolio turnover rate may be higher. |
| 28 | The accompanying notes are an integral part of these financial statements. |
GOLDMAN SACHS ENERGY INFRASTRUCTURE FUND
Financial Highlights (continued)
Selected Share Data for a Share Outstanding Throughout Each Period
| Goldman Sachs Energy Infrastructure Fund | ||||||||||||||||||||||
| Class C Shares | ||||||||||||||||||||||
| Year Ended November 30, | Period Ended November 30, | |||||||||||||||||||||
| 2020 | 2019 | 2018 | 2017(a) | |||||||||||||||||||
| Per Share Data | ||||||||||||||||||||||
| Net asset value, beginning of period |
$ | 8.64 | $ | 9.26 | $ | 9.54 | $ | 10.00 | ||||||||||||||
| Net investment income (loss)(b) |
(0.02 | ) | 0.08 | 0.04 | — | (c) | ||||||||||||||||
| Net realized and unrealized loss |
(1.16 | )(d) | (0.39 | )(d) | (0.12 | ) | (0.41 | ) | ||||||||||||||
| Total from investment operations |
(1.18 | ) | (0.31 | ) | (0.08 | ) | (0.41 | ) | ||||||||||||||
| Distributions to shareholders from net investment income |
(0.02 | ) | (0.19 | ) | (0.08 | ) | (0.02 | ) | ||||||||||||||
| Distributions to shareholders from net realized gains |
(0.05 | ) | — | — | — | |||||||||||||||||
| Distributions to shareholders from return of capital |
(0.19 | ) | (0.12 | ) | (0.12 | ) | (0.03 | ) | ||||||||||||||
| Total distributions |
(0.26 | ) | (0.31 | ) | (0.20 | ) | (0.05 | ) | ||||||||||||||
| Net asset value, end of period |
$ | 7.20 | $ | 8.64 | $ | 9.26 | $ | 9.54 | ||||||||||||||
| Total return(e) | (13.60 | )% | (3.63 | )% | (0.86 | )% | (4.04 | )% | ||||||||||||||
| Net assets, end of period (in 000s) |
$ | 135 | $ | 154 | $ | 48 | $ | 48 | ||||||||||||||
| Ratio of net expenses to average net assets |
2.23 | % | 2.25 | % | 2.24 | % | 2.24 | %(f) | ||||||||||||||
| Ratio of total expenses to average net assets |
2.48 | % | 3.17 | % | 16.47 | %(g) | 21.32 | %(f) | ||||||||||||||
| Ratio of net investment income (loss) to average net assets |
(0.34 | )% | 0.89 | % | 0.39 | % | (0.11 | )%(f) | ||||||||||||||
| Portfolio turnover rate(h) |
121 | % | 59 | % | 67 | % | 11 | % | ||||||||||||||
| (a) | Commenced operations on September 29, 2017. |
| (b) | Calculated based on the average shares outstanding methodology. |
| (c) | Amount is less than $0.005 per share. |
| (d) | Calculation of the net gain (loss) per share (both realized and unrealized) does not correlate to the aggregate realized and unrealized gain (loss) presented in the Statement of Operations due to the timing of subscriptions and redemptions of Fund shares in relation to fluctuations in the market value of the portfolio. |
| (e) | Assumes investment at the NAV at the beginning of the period, reinvestment of all dividends and distributions, a complete redemption of the investment at the NAV at the end of the period and no sales or redemption charges (if any). Total returns would be reduced if a sales or redemption charge was taken into account. Returns do not reflect the impact of taxes to shareholders relating to Fund distributions or the redemption of Fund shares. Total returns for periods less than one full year are not annualized. |
| (f) | Annualized. |
| (g) | The amount reflects certain expense reallocations between the classes due to the timing of sales and redemptions of Fund class shares. |
| (h) | The Fund’s portfolio turnover rate is calculated in accordance with regulatory requirements, without regard to transactions involving short term investments. If such transactions were included, the Fund’s portfolio turnover rate may be higher. |
| The accompanying notes are an integral part of these financial statements. | 29 |
GOLDMAN SACHS ENERGY INFRASTRUCTURE FUND
Financial Highlights (continued)
Selected Share Data for a Share Outstanding Throughout Each Period
| Goldman Sachs Energy Infrastructure Fund | ||||||||||||||||||||||
| Institutional Shares | ||||||||||||||||||||||
| Year Ended November 30, | Period Ended November 30, | |||||||||||||||||||||
| 2020 | 2019 | 2018 | 2017(a) | |||||||||||||||||||
| Per Share Data | ||||||||||||||||||||||
| Net asset value, beginning of period |
$ | 8.65 | $ | 9.26 | $ | 9.54 | $ | 10.00 | ||||||||||||||
| Net investment income(b) |
0.05 | 0.15 | 0.15 | 0.02 | ||||||||||||||||||
| Net realized and unrealized loss |
(1.16 | )(c) | (0.35 | )(c) | (0.12 | ) | (0.41 | ) | ||||||||||||||
| Total from investment operations |
(1.11 | ) | (0.20 | ) | 0.03 | (0.39 | ) | |||||||||||||||
| Distributions to shareholders from net investment income |
(0.05 | ) | (0.25 | ) | (0.12 | ) | (0.03 | ) | ||||||||||||||
| Distributions to shareholders from net realized gains |
(0.05 | ) | — | — | — | |||||||||||||||||
| Distributions to shareholders from return of capital |
(0.25 | ) | (0.16 | ) | (0.19 | ) | (0.04 | ) | ||||||||||||||
| Total distributions |
(0.35 | ) | (0.41 | ) | (0.31 | ) | (0.07 | ) | ||||||||||||||
| Net asset value, end of period |
$ | 7.19 | $ | 8.65 | $ | 9.26 | $ | 9.54 | ||||||||||||||
| Total return(d) | (12.74 | )% | (2.36 | )% | 0.18 | % | (3.87 | )% | ||||||||||||||
| Net assets, end of period (in 000s) |
$ | 2,415 | $ | 2,606 | $ | 2,650 | $ | 2,644 | ||||||||||||||
| Ratio of net expenses to average net assets |
1.10 | % | 1.11 | % | 1.10 | % | 1.10 | %(e) | ||||||||||||||
| Ratio of total expenses to average net assets |
1.35 | % | 2.09 | % | 15.32 | %(f) | 20.18 | %(e) | ||||||||||||||
| Ratio of net investment income to average net assets |
0.74 | % | 1.62 | % | 1.53 | % | 1.03 | %(e) | ||||||||||||||
| Portfolio turnover rate(g) |
121 | % | 59 | % | 67 | % | 11 | % | ||||||||||||||
| (a) | Commenced operations on September 29, 2017. |
| (b) | Calculated based on the average shares outstanding methodology. |
| (c) | Calculation of the net gain (loss) per share (both realized and unrealized) does not correlate to the aggregate realized and unrealized gain (loss) presented in the Statement of Operations due to the timing of subscriptions and redemptions of Fund shares in relation to fluctuations in the market value of the portfolio. |
| (d) | Assumes investment at the NAV at the beginning of the period, reinvestment of all dividends and distributions, a complete redemption of the investment at the NAV at the end of the period and no sales or redemption charges (if any). Total returns would be reduced if a sales or redemption charge was taken into account. Returns do not reflect the impact of taxes to shareholders relating to Fund distributions or the redemption of Fund shares. Total returns for periods less than one full year are not annualized. |
| (e) | Annualized. |
| (f) | The amount reflects certain expense reallocations between the classes due to the timing of sales and redemptions of Fund class shares. |
| (g) | The Fund’s portfolio turnover rate is calculated in accordance with regulatory requirements, without regard to transactions involving short term investments. If such transactions were included, the Fund’s portfolio turnover rate may be higher. |
| 30 | The accompanying notes are an integral part of these financial statements. |
GOLDMAN SACHS ENERGY INFRASTRUCTURE FUND
Financial Highlights (continued)
Selected Share Data for a Share Outstanding Throughout Each Period
| Goldman Sachs Energy Infrastructure Fund | ||||||||||||||||||||||
| Investor Shares | ||||||||||||||||||||||
| Year Ended November 30, | Period Ended November 30, | |||||||||||||||||||||
| 2020 | 2019 | 2018 | 2017(a) | |||||||||||||||||||
| Per Share Data | ||||||||||||||||||||||
| Net asset value, beginning of period |
$ | 8.65 | $ | 9.26 | $ | 9.54 | $ | 10.00 | ||||||||||||||
| Net investment income(b) |
0.04 | 0.14 | 0.14 | 0.01 | ||||||||||||||||||
| Net realized and unrealized loss |
(1.16 | )(c) | (0.35 | )(c) | (0.13 | ) | (0.40 | ) | ||||||||||||||
| Total from investment operations |
(1.12 | ) | (0.21 | ) | 0.01 | (0.39 | ) | |||||||||||||||
| Distributions to shareholders from net investment income |
(0.05 | ) | (0.24 | ) | (0.11 | ) | (0.03 | ) | ||||||||||||||
| Distributions to shareholders from net realized gains |
(0.05 | ) | — | — | — | |||||||||||||||||
| Distributions to shareholders from return of capital |
(0.24 | ) | (0.16 | ) | (0.18 | ) | (0.04 | ) | ||||||||||||||
| Total distributions |
(0.34 | ) | (0.40 | ) | (0.29 | ) | (0.07 | ) | ||||||||||||||
| Net asset value, end of period |
$ | 7.19 | $ | 8.65 | $ | 9.26 | $ | 9.54 | ||||||||||||||
| Total return(d) | (12.86 | )% | (2.50 | )% | 0.04 | % | (3.90 | )% | ||||||||||||||
| Net assets, end of period (in 000s) |
$ | 41 | $ | 47 | $ | 48 | $ | 48 | ||||||||||||||
| Ratio of net expenses to average net assets |
1.23 | % | 1.25 | % | 1.24 | % | 1.24 | %(e) | ||||||||||||||
| Ratio of total expenses to average net assets |
1.49 | % | 2.23 | % | 15.46 | %(f) | 20.32 | %(e) | ||||||||||||||
| Ratio of net investment income to average net assets |
0.61 | % | 1.49 | % | 1.39 | % | 0.89 | %(e) | ||||||||||||||
| Portfolio turnover rate(g) |
121 | % | 59 | % | 67 | % | 11 | % | ||||||||||||||
| (a) | Commenced operations on September 29, 2017. |
| (b) | Calculated based on the average shares outstanding methodology. |
| (c) | Calculation of the net gain (loss) per share (both realized and unrealized) does not correlate to the aggregate realized and unrealized gain (loss) presented in the Statement of Operations due to the timing of subscriptions and redemptions of Fund shares in relation to fluctuations in the market value of the portfolio. |
| (d) | Assumes investment at the NAV at the beginning of the period, reinvestment of all dividends and distributions, a complete redemption of the investment at the NAV at the end of the period and no sales or redemption charges (if any). Total returns would be reduced if a sales or redemption charge was taken into account. Returns do not reflect the impact of taxes to shareholders relating to Fund distributions or the redemption of Fund shares. Total returns for periods less than one full year are not annualized. |
| (e) | Annualized. |
| (f) | The amount reflects certain expense reallocations between the classes due to the timing of sales and redemptions of Fund class shares. |
| (g) | The Fund’s portfolio turnover rate is calculated in accordance with regulatory requirements, without regard to transactions involving short term investments. If such transactions were included, the Fund’s portfolio turnover rate may be higher. |
| The accompanying notes are an integral part of these financial statements. | 31 |
GOLDMAN SACHS ENERGY INFRASTRUCTURE FUND
Financial Highlights (continued)
Selected Share Data for a Share Outstanding Throughout Each Period
| Goldman Sachs Energy Infrastructure Fund | ||||||||||||||||||||||
| Class R6 Shares | ||||||||||||||||||||||
| Year Ended November 30, | Period Ended November 30, | |||||||||||||||||||||
| 2020 | 2019 | 2018 | 2017(a) | |||||||||||||||||||
| Per Share Data | ||||||||||||||||||||||
| Net asset value, beginning of period |
$ | 8.65 | $ | 9.26 | $ | 9.54 | $ | 10.00 | ||||||||||||||
| Net investment income(b) |
0.06 | 0.16 | 0.15 | 0.02 | ||||||||||||||||||
| Net realized and unrealized loss |
(1.18 | )(c) | (0.36 | )(c) | (0.12 | ) | (0.41 | ) | ||||||||||||||
| Total from investment operations |
(1.12 | ) | (0.20 | ) | 0.03 | (0.39 | ) | |||||||||||||||
| Distributions to shareholders from net investment income |
(0.05 | ) | (0.25 | ) | (0.12 | ) | (0.03 | ) | ||||||||||||||
| Distributions to shareholders from net realized gains |
(0.05 | ) | — | — | — | |||||||||||||||||
| Distributions to shareholders from return of capital |
(0.25 | ) | (0.16 | ) | (0.19 | ) | (0.04 | ) | ||||||||||||||
| Total distributions |
(0.35 | ) | (0.41 | ) | (0.31 | ) | (0.07 | ) | ||||||||||||||
| Net asset value, end of period |
$ | 7.18 | $ | 8.65 | $ | 9.26 | $ | 9.54 | ||||||||||||||
| Total return(d) | (12.83 | )% | (2.35 | )% | 0.19 | % | (3.87 | )% | ||||||||||||||
| Net assets, end of period (in 000s) |
$ | 78,375 | $ | 47 | $ | 48 | $ | 48 | ||||||||||||||
| Ratio of net expenses to average net assets |
1.09 | % | 1.10 | % | 1.09 | % | 1.09 | %(e) | ||||||||||||||
| Ratio of total expenses to average net assets |
1.30 | % | 2.08 | % | 15.31 | %(f) | 20.17 | %(e) | ||||||||||||||
| Ratio of net investment income to average net assets |
0.92 | % | 1.64 | % | 1.54 | % | 1.04 | %(e) | ||||||||||||||
| Portfolio turnover rate(g) |
121 | % | 59 | % | 67 | % | 11 | % | ||||||||||||||
| (a) | Commenced operations on September 29, 2017. |
| (b) | Calculated based on the average shares outstanding methodology. |
| (c) | Calculation of the net gain (loss) per share (both realized and unrealized) does not correlate to the aggregate realized and unrealized gain (loss) presented in the Statement of Operations due to the timing of subscriptions and redemptions of Fund shares in relation to fluctuations in the market value of the portfolio. |
| (d) | Assumes investment at the NAV at the beginning of the period, reinvestment of all dividends and distributions, a complete redemption of the investment at the NAV at the end of the period and no sales or redemption charges (if any). Total returns would be reduced if a sales or redemption charge was taken into account. Returns do not reflect the impact of taxes to shareholders relating to Fund distributions or the redemption of Fund shares. Total returns for periods less than one full year are not annualized. |
| (e) | Annualized. |
| (f) | The amount reflects certain expense reallocations between the classes due to the timing of sales and redemptions of Fund class shares. |
| (g) | The Fund’s portfolio turnover rate is calculated in accordance with regulatory requirements, without regard to transactions involving short term investments. If such transactions were included, the Fund’s portfolio turnover rate may be higher. |
| 32 | The accompanying notes are an integral part of these financial statements. |
GOLDMAN SACHS ENERGY INFRASTRUCTURE FUND
Financial Highlights (continued)
Selected Share Data for a Share Outstanding Throughout Each Period
| Goldman Sachs Energy Infrastructure Fund | ||||||||||||||||||||||
| Class R Shares | ||||||||||||||||||||||
| Year Ended November 30, | Period Ended November 30, | |||||||||||||||||||||
| 2020 | 2019 | 2018 | 2017(a) | |||||||||||||||||||
| Per Share Data | ||||||||||||||||||||||
| Net asset value, beginning of period |
$ | 8.65 | $ | 9.26 | $ | 9.54 | $ | 10.00 | ||||||||||||||
| Net investment income(b) |
0.01 | 0.09 | 0.09 | 0.01 | ||||||||||||||||||
| Net realized and unrealized loss |
(1.17 | )(c) | (0.35 | )(c) | (0.12 | ) | (0.41 | ) | ||||||||||||||
| Total from investment operations |
(1.16 | ) | (0.26 | ) | (0.03 | ) | (0.40 | ) | ||||||||||||||
| Distributions to shareholders from net investment income |
(0.04 | ) | (0.21 | ) | (0.10 | ) | (0.02 | ) | ||||||||||||||
| Distributions to shareholders from net realized gains |
(0.05 | ) | — | — | — | |||||||||||||||||
| Distributions to shareholders from return of capital |
(0.21 | ) | (0.14 | ) | (0.15 | ) | (0.04 | ) | ||||||||||||||
| Total distributions |
(0.30 | ) | (0.35 | ) | (0.25 | ) | (0.06 | ) | ||||||||||||||
| Net asset value, end of period |
$ | 7.19 | $ | 8.65 | $ | 9.26 | $ | 9.54 | ||||||||||||||
| Total return(d) | (13.34 | )% | (2.98 | )% | (0.46 | )% | (3.97 | )% | ||||||||||||||
| Net assets, end of period (in 000s) |
$ | 40 | $ | 49 | $ | 49 | $ | 48 | ||||||||||||||
| Ratio of net expenses to average net assets |
1.73 | % | 1.75 | % | 1.74 | % | 1.74 | %(e) | ||||||||||||||
| Ratio of total expenses to average net assets |
1.99 | % | 2.73 | % | 15.94 | %(f) | 20.82 | %(e) | ||||||||||||||
| Ratio of net investment income to average net assets |
0.10 | % | 0.99 | % | 0.89 | % | 0.39 | %(e) | ||||||||||||||
| Portfolio turnover rate(g) |
121 | % | 59 | % | 67 | % | 11 | % | ||||||||||||||
| (a) | Commenced operations on September 29, 2017. |
| (b) | Calculated based on the average shares outstanding methodology. |
| (c) | Calculation of the net gain (loss) per share (both realized and unrealized) does not correlate to the aggregate realized and unrealized gain (loss) presented in the Statement of Operations due to the timing of subscriptions and redemptions of Fund shares in relation to fluctuations in the market value of the portfolio. |
| (d) | Assumes investment at the NAV at the beginning of the period, reinvestment of all dividends and distributions, a complete redemption of the investment at the NAV at the end of the period and no sales or redemption charges (if any). Total returns would be reduced if a sales or redemption charge was taken into account. Returns do not reflect the impact of taxes to shareholders relating to Fund distributions or the redemption of Fund shares. Total returns for periods less than one full year are not annualized. |
| (e) | Annualized. |
| (f) | The amount reflects certain expense reallocations between the classes due to the timing of sales and redemptions of Fund class shares. |
| (g) | The Fund’s portfolio turnover rate is calculated in accordance with regulatory requirements, without regard to transactions involving short term investments. If such transactions were included, the Fund’s portfolio turnover rate may be higher. |
| The accompanying notes are an integral part of these financial statements. | 33 |
GOLDMAN SACHS ENERGY INFRASTRUCTURE FUND
Financial Highlights (continued)
Selected Share Data for a Share Outstanding Throughout Each Period
| Goldman Sachs Energy Infrastructure Fund | ||||||||||||||||||
| Class P Shares | ||||||||||||||||||
| Year Ended November 30, | Period Ended November 30, | |||||||||||||||||
| 2020 | 2019 | 2018(a) | ||||||||||||||||
| Per Share Data | ||||||||||||||||||
| Net asset value, beginning of period |
$ | 8.64 | $ | 9.26 | $ | 9.52 | ||||||||||||
| Net investment income(b) |
0.06 | 0.17 | 0.14 | |||||||||||||||
| Net realized and unrealized loss |
(1.17 | )(c) | (0.38 | )(c) | (0.09 | ) | ||||||||||||
| Total from investment operations |
(1.11 | ) | (0.21 | ) | 0.05 | |||||||||||||
| Distributions to shareholders from net investment income |
(0.05 | ) | (0.25 | ) | (0.12 | ) | ||||||||||||
| Distributions to shareholders from net realized gains |
(0.05 | ) | — | — | ||||||||||||||
| Distributions to shareholders from return of capital |
(0.25 | ) | (0.16 | ) | (0.19 | ) | ||||||||||||
| Total distributions |
(0.35 | ) | (0.41 | ) | (0.31 | ) | ||||||||||||
| Net asset value, end of period |
$ | 7.18 | $ | 8.64 | $ | 9.26 | ||||||||||||
| Total return(d) | (12.74 | )% | (2.46 | )% | 0.42 | % | ||||||||||||
| Net assets, end of period (in 000s) |
$ | 160,821 | $ | 64,970 | $ | 2,640 | ||||||||||||
| Ratio of net expenses to average net assets |
1.09 | % | 1.10 | % | 1.09 | %(e) | ||||||||||||
| Ratio of total expenses to average net assets |
1.33 | % | 1.92 | % | 4.04 | %(e) (f) | ||||||||||||
| Ratio of net investment income to average net assets |
0.84 | % | 1.78 | % | 2.37 | %(e) | ||||||||||||
| Portfolio turnover rate(g) |
121 | % | 59 | % | 67 | % | ||||||||||||
| (a) | Commenced operations on April 16, 2018. |
| (b) | Calculated based on the average shares outstanding methodology. |
| (c) | Calculation of the net gain (loss) per share (both realized and unrealized) does not correlate to the aggregate realized and unrealized gain (loss) presented in the Statement of Operations due to the timing of subscriptions and redemptions of Fund shares in relation to fluctuations in the market value of the portfolio. |
| (d) | Assumes investment at the NAV at the beginning of the period, reinvestment of all dividends and distributions, a complete redemption of the investment at the NAV at the end of the period and no sales or redemption charges (if any). Total returns would be reduced if a sales or redemption charge was taken into account. Returns do not reflect the impact of taxes to shareholders relating to Fund distributions or the redemption of Fund shares. Total returns for periods less than one full year are not annualized. |
| (e) | Annualized. |
| (f) | The amount reflects certain expense reallocations between the classes due to the timing of sales and redemptions of Fund class shares. |
| (g) | The Fund’s portfolio turnover rate is calculated in accordance with regulatory requirements, without regard to transactions involving short term investments. If such transactions were included, the Fund’s portfolio turnover rate may be higher. |
| 34 | The accompanying notes are an integral part of these financial statements. |
GOLDMAN SACHS ENERGY FUNDS
November 30, 2020
| 1. ORGANIZATION |
Goldman Sachs Trust (the “Trust”) is a Delaware statutory trust registered under the Investment Company Act of 1940, as amended (the “Act”), as an open-end management investment company. The following table lists those series of the Trust that are included in this report (collectively, the “Funds” or individually a “Fund”), along with their corresponding share classes and respective diversification status under the Act:
| Fund | Share Classes Offered | Diversified/ Non-diversified | ||
| Clean Energy Income Fund* |
A, C, Institutional, Investor, R6, R and P |
Non-diversified | ||
| Energy Infrastructure Fund** |
A, C, Institutional, Investor, R6, R and P |
Non-diversified |
| * | Commenced operations on June 26, 2020. |
| ** | Goldman Sachs MLP & Energy Fund was renamed to Goldman Sachs Energy Infrastructure Fund effective as of the close of business on June 26, 2020. |
Class A Shares are sold with a front-end sales charge of up to 5.50%. Class C Shares are sold with a contingent deferred sales charge (“CDSC”) of 1.00%, which is imposed on redemptions made within 12 months of purchase. Institutional, Investor, Class R6, Class R and Class P Shares are not subject to a sales charge.
Goldman Sachs Asset Management, L.P. (“GSAM”), an affiliate of Goldman Sachs & Co. LLC (“Goldman Sachs”), serves as investment adviser to the Fund pursuant to a management agreement (the “Agreement”) with the Trust.
| 2. SIGNIFICANT ACCOUNTING POLICIES |
The financial statements have been prepared in accordance with accounting principles generally accepted in the United States of America (“GAAP”) and require management to make estimates and assumptions that may affect the reported amounts and disclosures. Actual results may differ from those estimates and assumptions. Each Fund is an investment company under GAAP and follows the accounting and reporting guidance applicable to investment companies.
A. Investment Valuation — The Funds’ valuation policy is to value investments at fair value.
B. Investment Income and Investments — Investment income includes interest income, dividend income, and securities lending income, if any. Interest income is accrued daily and adjusted for amortization of premiums and accretion of discounts. Dividend income is recognized on ex-dividend date or, for certain foreign securities, as soon as such information is obtained subsequent to the ex-dividend date. Non-cash dividends, if any, are recorded at the fair market value of the securities received. Investment transactions are reflected on trade date. Realized gains and losses are calculated using identified cost. Investment transactions are recorded on the following business day for daily net asset value (“NAV”) calculations. Distributions from master limited partnerships (“MLPs”) are generally recorded based on the characterization reported on the MLP’s tax return. A Fund records its pro-rata share of the income/loss and capital gains/losses, allocated from the underlying partnerships and adjusts the cost basis of the underlying partnerships accordingly.
C. Class Allocations and Expenses — Investment income, realized and unrealized gain (loss), if any, and non-class specific expenses of each Fund are allocated daily based upon the proportion of net assets of each class. Non-class specific expenses directly incurred by a Fund are charged to that Fund, while such expenses incurred by the Trust are allocated across the applicable Funds on a straight-line and/or pro-rata basis depending upon the nature of the expenses. Class specific expenses, where applicable, are borne by the respective share classes and include Distribution and Service, Transfer Agency and Service fees.
D. Federal Taxes and Distributions to Shareholders — It is each Fund’s policy to comply with the requirements of the Internal Revenue Code of 1986, as amended (the “Code”), applicable to regulated investment companies and to distribute each year substantially all of its investment company taxable income and capital gains to its shareholders. Accordingly, Fund is not required to make any provisions for the payment of federal income tax. Distributions to shareholders are recorded on the ex-dividend date. Net investment income distributions, if any, are declared and paid at least semi-annually. Capital gains distributions, if any, are declared and paid annually.
35
GOLDMAN SACHS ENERGY FUNDS
Notes to Financial Statements (continued)
November 30, 2020
| 2. SIGNIFICANT ACCOUNTING POLICIES (continued) |
Net capital losses, if any, are carried forward to future fiscal years and may be used to the extent allowed by the Code to offset any future capital gains. Losses that are carried forward will retain their character as either short-term or long-term capital losses. Utilization of capital loss carryforwards will reduce the requirement of future capital gains distributions.
The characterization of distributions to shareholders for financial reporting purposes is determined in accordance with federal income tax rules, which may differ from GAAP. The source of each Fund’s distributions may be shown in the accompanying financial statements as either from distributable earnings or capital. Certain components of the Funds’ net assets on the Statement of Assets and Liabilities reflect permanent GAAP/tax differences based on the appropriate tax character.
E. Offering and Organization Costs — Offering costs paid in connection with the initial offering of shares of the Clean Energy Income Fund are being amortized on a straight-line basis over 12 months from the date of commencement of operations. Organization costs paid in connection with the organization of the Clean Energy Income Fund were expensed on the first day of operations.
F. Foreign Currency Translation — The accounting records and reporting currency of each Fund are maintained in U.S. dollars. Assets and liabilities denominated in foreign currencies are translated into U.S. dollars using the current exchange rates at the close of each business day. The effect of changes in foreign currency exchange rates on investments is included within net realized and unrealized gain (loss) on investments. Changes in the value of other assets and liabilities as a result of fluctuations in foreign exchange rates are included in the Statements of Operations within net change in unrealized gain (loss) on foreign currency translation. Transactions denominated in foreign currencies are translated into U.S. dollars on the date the transaction occurred, the effects of which are included within net realized gain (loss) on foreign currency transactions.
| 3. INVESTMENTS AND FAIR VALUE MEASUREMENTS |
U.S. GAAP defines the fair value of a financial instrument as the amount that would be received to sell an asset or paid to transfer a liability in an orderly transaction between market participants at the measurement date (i.e., the exit price); the Funds’ policy is to use the market approach. GAAP establishes a fair value hierarchy that prioritizes the inputs to valuation techniques used to measure fair value. The hierarchy gives the highest priority to unadjusted quoted prices in active markets for identical assets or liabilities (Level 1 measurements) and the lowest priority to unobservable inputs (Level 3 measurements). The level in the fair value hierarchy within which the fair value measurement in its entirety falls shall be determined based on the lowest level input that is significant to the fair value measurement in its entirety. The levels used for classifying investments are not necessarily an indication of the risk associated with investing in these investments. The three levels of the fair value hierarchy are described below:
Level 1 — Unadjusted quoted prices in active markets that are accessible at the measurement date for identical, unrestricted assets or liabilities;
Level 2 — Quoted prices in markets that are not active or financial instruments for which significant inputs are observable (including, but not limited to, quoted prices for similar investments, interest rates, foreign exchange rates, volatility and credit spreads), either directly or indirectly;
Level 3 — Prices or valuations that require significant unobservable inputs (including GSAM’s assumptions in determining fair value measurement).
The Board of Trustees (“Trustees”) has approved Valuation Procedures that govern the valuation of the portfolio investments held by the Funds, including investments for which market quotations are not readily available. The Trustees have delegated to GSAM day-to-day responsibility for implementing and maintaining internal controls and procedures related to the valuation of the Funds’ investments. To assess the continuing appropriateness of pricing sources and methodologies, GSAM regularly performs price verification procedures and issues challenges as necessary to third party pricing vendors or brokers, and any differences are reviewed in accordance with the Valuation Procedures.
36
GOLDMAN SACHS ENERGY FUNDS
| 3. INVESTMENTS AND FAIR VALUE MEASUREMENTS (continued) |
A. Level 1 and Level 2 Fair Value Investments — The valuation techniques and significant inputs used in determining the fair values for investments classified as Level 1 and Level 2 are as follows:
Equity Securities — Equity securities traded on a United States (“U.S.”) securities exchange or the NASDAQ system, or those located on certain foreign exchanges, including but not limited to the Americas, are valued daily at their last sale price or official closing price on the principal exchange or system on which they are traded. If there is no sale or official closing price or such price is believed by GSAM to not represent fair value, equity securities will be valued at the valid closing bid price for long positions and at the valid closing ask price for short positions (i.e. where there is sufficient volume, during normal exchange trading hours). If no valid bid/ask price is available, the equity security will be valued pursuant to the Valuation Procedures approved by the Trustees and consistent with applicable regulatory guidance. To the extent these investments are actively traded, they are classified as Level 1 of the fair value hierarchy, otherwise they are generally classified as Level 2. Certain equity securities containing unique attributes may be classified as Level 2.
Unlisted equity securities for which market quotations are available are valued at the last sale price on the valuation date, or if no sale occurs, at the last bid price for long positions or the last ask price for short positions, and are generally classified as Level 2. Securities traded on certain foreign securities exchanges are valued daily at fair value determined by an independent fair value service (if available) under Fair Valuation Procedures approved by the Trustees and consistent with applicable regulatory guidance. The independent fair value service takes into account multiple factors including, but not limited to, movements in the securities markets, certain depositary receipts, futures contracts and foreign currency exchange rates that have occurred subsequent to the close of the foreign securities exchange. These investments are generally classified as Level 2 of the fair value hierarchy.
Underlying Funds (including Money Market Funds) — Underlying Funds (“Underlying Funds”) include other investment companies and exchange-traded funds (“ETFs”). Investments in the Underlying Funds (except ETFs) are valued at the NAV per share on the day of valuation. ETFs are valued daily at the last sale price or official closing price on the principal exchange or system on which the investment is traded. Because the Funds invest in Underlying Funds that fluctuate in value, the Funds’ shares will correspondingly fluctuate in value. To the extent these investments are actively traded, they are classified as Level 1 of the fair value hierarchy, otherwise they are generally classified as Level 2. For information regarding an Underlying Fund’s accounting policies and investment holdings, please see the Underlying Fund’s shareholder report.
B. Level 3 Fair Value Investments — To the extent that significant inputs to valuation models and other alternative pricing sources are unobservable, or if quotations are not readily available, or if GSAM believes that such quotations do not accurately reflect fair value, the fair value of the Funds’ investments may be determined under Valuation Procedures approved by the Trustees. GSAM, consistent with its procedures and applicable regulatory guidance, may make an adjustment to the most recent valuation prices of either domestic or foreign securities in light of significant events to reflect what it believes to be the fair value of the securities at the time of determining a Fund’s NAV. To the extent investments are valued using single source broker quotations obtained directly from the broker or passed through from third party pricing vendors, such investments are classified as Level 3 investments.
37
GOLDMAN SACHS ENERGY FUNDS
Notes to Financial Statements (continued)
November 30, 2020
| 3. INVESTMENTS AND FAIR VALUE MEASUREMENTS (continued) |
C. Fair Value Hierarchy — The following is a summary of the Funds’ investments classified in the fair value hierarchy as of November 30, 2020:
| CLEAN ENERGY INCOME | ||||||||||||
| Investment Type | Level 1 | Level 2 | Level 3 | |||||||||
| Assets | ||||||||||||
| Common Stock and/or Other Equity Investments(a) |
||||||||||||
| Europe |
$ | 5,837,221 | $ | 20,144,716 | $ | — | ||||||
| North America |
94,114,981 | — | — | |||||||||
| Exchange Traded Funds |
1,092,092 | — | — | |||||||||
| Special Purpose Acquisition Company |
1,002,827 | — | — | |||||||||
| Total | $ | 102,047,121 | $ | 20,144,716 | $ | — | ||||||
| (a) | Amounts are disclosed by continent to highlight the impact of time zone differences between local market close and the calculation of net asset value. Security valuations are based on the principal exchange or system on which they are traded, which may differ from country of domicile. The Fund utilizes fair value model prices provided by an independent fair value service for international equities, resulting in a Level 2 classification. |
| ENERGY INFRASTRUCTURE | ||||||||||||
| Investment Type | Level 1 | Level 2 | Level 3 | |||||||||
| Assets | ||||||||||||
| Common Stock and/or Other Equity Investments(a) |
||||||||||||
| North America |
$ | 238,347,016 | $ | — | $ | — | ||||||
| Special Purpose Acquisition Company |
2,819,847 | — | — | |||||||||
| Investment Company |
1,125,704 | — | — | |||||||||
| Total | $ | 242,292,567 | $ | — | $ | — | ||||||
| (a) | Amounts are disclosed by continent to highlight the impact of time zone differences between local market close and the calculation of net asset value. Security valuations are based on the principal exchange or system on which they are traded, which may differ from country of domicile. |
For further information regarding security characteristics, see the Schedules of Investments.
| 4. AGREEMENTS AND AFFILIATED TRANSACTIONS |
A. Management Agreement — Under the Agreement, GSAM manages the Funds, subject to the general supervision of the Trustees.
As compensation for the services rendered pursuant to the Agreement, the assumption of the expenses related thereto and administration of the Funds’ business affairs, including providing facilities, GSAM is entitled to a management fee, accrued daily and paid monthly, equal to an annual percentage rate of each Fund’s average daily net assets. For the period ended November 30, 2020, contractual and effective net management fees with GSAM were at the following rates:
| Contractual Management Rate | Effective Net Management Rate^ |
|||||||||||||||||||||||||
| Fund | First $1 billion |
Next $1 billion |
Next $3 billion |
Next $3 billion |
Over $8 billion |
|||||||||||||||||||||
| Clean Energy Income |
0.80 | % | 0.72 | % | 0.68 | % | 0.67 | % | 0.66 | % | 0.80 | % | ||||||||||||||
| Energy Infrastructure |
1.00 | 0.90 | 0.86 | 0.84 | 0.82 | 1.00 | ||||||||||||||||||||
| ^ | Effective Net Management Rate includes impact of management fee waivers of underlying funds, if any. |
38
GOLDMAN SACHS ENERGY FUNDS
| 4. AGREEMENTS AND AFFILIATED TRANSACTIONS (continued) |
The Funds invest in Institutional Shares of the Goldman Sachs Financial Square Government Fund, which is an affiliated Underlying Fund. GSAM has agreed to waive a portion of its management fee payable by the Funds in an amount equal to the management fee it earns as an investment adviser to any of the affiliated Underlying Funds in which the Funds invest. For the period ended November 30, 2020, GSAM waived $395 and $2,503 of the Fund’s management fee for the Clean Energy Income and Energy Infrastructure Funds, respectively.
B. Distribution and/or Service (12b-1) Plans — The Trust, on behalf of Class A and Class R Shares of the Funds, has adopted Distribution and Service Plans subject to Rule 12b-1 under the Act. Under the Distribution and Service Plans, Goldman Sachs, which serves as distributor (the “Distributor”), is entitled to a fee accrued daily and paid monthly for distribution services and personal and account maintenance services, which may then be paid by Goldman Sachs to authorized dealers. These fees are equal to an annual percentage rate of the average daily net assets attributable to Class A or Class R Shares of the Funds, as set forth below.
The Trust, on behalf of Class C Shares of the Funds, has adopted a Distribution Plan subject to Rule 12b-1 under the Act. Under the Distribution Plan, Goldman Sachs as Distributor is entitled to a fee accrued daily and paid monthly for distribution services, which may then be paid by Goldman Sachs to authorized dealers. These fees are equal to an annual percentage rate of the average daily net assets attributable to Class C Shares of the Funds, as set forth below.
| Distribution and/or Service Plan Rates | ||||||||||||
| Class A* | Class C | Class R* | ||||||||||
| Distribution Plan and/or Service Plan |
0.25 | % | 0.75 | % | 0.50 | % | ||||||
| * | With respect to Class A and Class R Shares, the Distributor at its discretion may use compensation for distribution services paid under the Distribution and Service Plans to compensate service organizations for personal and account maintenance services and expenses as long as such total compensation does not exceed the maximum cap on “service fees” imposed by the Financial Industry Regulatory Authority. |
C. Distribution Agreement — Goldman Sachs, as Distributor of the shares of the Funds pursuant to a Distribution Agreement, may retain a portion of the Class A Shares’ front end sales charge and Class C Shares’ CDSC. During the period ended November 30, 2020, Goldman Sachs retained $165 of the sales charges for the Clean Energy Fund and did not retain any portion of the sales charges or CDSC for the Energy Infrastructure Fund.
D. Service Plan — The Trust, on behalf of each Fund, has adopted a Service Plan to allow Class C Shares to compensate service organizations (including Goldman Sachs) for providing varying levels of personal and account maintenance services to their customers who are beneficial owners of such shares. The Service Plan provides for compensation to the service organizations equal to an annual percentage rate of 0.25% of the average daily net assets attributable to Class C Shares of the Funds.
E. Transfer Agency Agreement — Goldman Sachs also serves as the transfer agent of the Funds for a fee pursuant to the Transfer Agency Agreement. The fees charged for such transfer agency services are accrued daily and paid monthly at annual rates as follows: 0.17% of the average daily net assets of Class A, Class C, Investor and Class R Shares; 0.03% of the average daily net assets of Class R6 and Class P Shares; and 0.04% of the average daily net assets of Institutional Shares.
F. Other Expense Agreements and Affiliated Transactions — GSAM has agreed to reduce or limit certain “Other Expenses” of the Funds (excluding acquired fund fees and expenses, transfer agency fees and expenses, service fees and shareholder administration fees (as applicable), taxes, interest, brokerage fees, expenses of shareholder meetings, litigation and indemnification, and extraordinary expenses) to the extent such expenses exceed, on an annual basis, a percentage rate of the average daily net assets of each Fund. Such Other Expense reimbursements, if any, are accrued daily and paid monthly. In addition, the Funds are not obligated to reimburse GSAM for prior fiscal year expense reimbursements, if any. The Other Expense limitations as an annual percentage rate of average daily net assets for the Clean Energy Income Fund and Energy Infrastructure Fund are 0.054% and 0.064%, respectively. These Other Expense limitations will remain in place through at least June 26, 2021 for the Clean Energy Income Fund and March 27, 2021 for the Energy Infrastructure Fund, and prior to such dates GSAM may not terminate the arrangements without the approval of the Trustees. In addition, the Funds have entered into certain offset
39
GOLDMAN SACHS ENERGY FUNDS
Notes to Financial Statements (continued)
November 30, 2020
| 4. AGREEMENTS AND AFFILIATED TRANSACTIONS (continued) |
arrangements with the transfer agent, which may result in a reduction of a Fund’s expenses and are received irrespective of the application of the “Other Expense” limitations described above. Such Other Expense reimbursements, if any, are accrued daily and paid monthly and are disclosed in the Statements of Operations for the period ended November 30, 2020.
For the period ended November 30, 2020, these expense reductions, including any fee waivers and Other Expense reimbursements, were as follows:
| Funds | Management Fee Waiver |
Other Expense |
Total Expense Reductions |
|||||||||||
| Clean Energy Income |
$ | 395 | $ | 293,461 | $ | 293,856 | ||||||||
| Energy Infrastructure |
2,503 | 368,685 | 371,188 | |||||||||||
G. Line of Credit Facility — As of November 30, 2020, the Energy Infrastructure Fund participated in a $700,000,000 committed, unsecured revolving line of credit facility (the “facility”) together with other funds of the Trust and certain registered investment companies having management agreements with GSAM or its affiliates. This facility is to be used for temporary emergency purposes, or to allow for an orderly liquidation of securities to meet redemption requests. The interest rate on borrowings is based on the federal funds rate. The facility also requires a fee to be paid by the Fund based on the amount of the commitment that has not been utilized. For the period ended November 30, 2020, the Energy Infrastructure Fund did not have any borrowings under the facility. Prior to April 28, 2020, the facility was $580,000,000.
H. Other Transactions with Affiliates — For the period ended November 30, 2020, Goldman Sachs did not earn any brokerage commissions from portfolio transactions on behalf of the Funds.
As of November 30, 2020, The Goldman Sachs Group, Inc. was the beneficial owner of 5% or more of total outstanding shares of the following Funds:
| Fund | Class A | Class C | Institutional | Investor | Class R6 | Class R | ||||||||||||||||||
| Clean Energy Income |
— | % | 82 | % | 91 | % | 100 | % | 100 | % | 100 | % | ||||||||||||
| Energy Infrastructure |
60 | — | 93 | 100 | — | 100 | ||||||||||||||||||
The table below shows the transactions in and earnings from investments in the Goldman Sachs Financial Square Government Fund for the period ended November 30, 2020:
| Fund | Underlying Fund | Beginning Value as of November 30, 2019 |
Purchases at Cost |
Proceeds from Sales |
Ending Value as of November 30, 2020 |
Shares as of November 30, 2020 |
Dividend Income |
|||||||||||||||||||
| Clean Energy Income |
Goldman Sachs Financial Square Government Fund — Institutional Shares |
$ | — | $ | 52,482,218 | $ | (52,482,218 | ) | $ | — | — | $ | 165 | |||||||||||||
| Energy Infrastructure |
Goldman Sachs Financial Square Government Fund — Institutional Shares |
342,982 | 153,354,503 | (152,571,781 | ) | 1,125,704 | 1,125,704 | 11,912 | ||||||||||||||||||
40
GOLDMAN SACHS ENERGY FUNDS
| 5. PORTFOLIO SECURITIES TRANSACTIONS |
The cost of purchases and proceeds from sales and maturities of long-term securities for the period ended November 30, 2020, were as follows:
| Fund | Purchases | Sales | ||||||||
| Clean Energy Income |
$ | 115,043,892 | $ | 5,147,943 | ||||||
| Energy Infrastructure |
359,162,482 | 194,814,901 | ||||||||
| 6. TAX INFORMATION |
The tax character of distributions paid during the period ended November 30, 2020 was as follows:
| Clean Energy Income | Energy Infrastructure | |||||||
| Distributions paid from: |
||||||||
| Ordinary Income |
$ | 278,134 | $ | 2,875,900 | ||||
| Net long-term capital gains |
— | — | ||||||
| Total taxable distributions |
$ | 278,134 | $ | 2,875,900 | ||||
| Tax return of capital |
$ | — | $ | 7,112,573 | ||||
The tax character of distributions paid during the fiscal year ended November 30, 2019 was as follows:
| Clean Energy Income | Energy Infrastructure | |||||||
| Distributions paid from: |
||||||||
| Ordinary Income |
$ | — | $ | 1,654,059 | ||||
| Total taxable distributions |
$ | — | $ | 1,654,059 | ||||
| Tax return of capital |
$ | — | $ | 1,089,946 | ||||
As of November 30, 2020, the components of accumulated earnings (losses) on a tax basis were as follows:
| Clean Energy Income | Energy Infrastructure | |||||||
| Undistributed ordinary income — net |
$ | 887,661 | $ | — | ||||
| Undistributed long-term capital gains |
— | — | ||||||
| Total undistributed earnings |
$ | 887,661 | $ | — | ||||
| Capital loss carryforwards:(1) |
||||||||
| Perpetual Short-Term |
— | — | ||||||
| Perpetual Long-Term |
— | (1,303,737 | ) | |||||
| Total capital loss carryforwards |
— | (1,303,737 | ) | |||||
| Timing differences (Qualified Late Year Loss Deferral/Post October Deferral) |
(13,132 | ) | (170,874 | ) | ||||
| Unrealized gains (losses) — net |
11,712,987 | 16,538,164 | ||||||
| Total accumulated earnings (losses) — net |
$ | 12,587,516 | $ | 15,063,553 | ||||
41
GOLDMAN SACHS ENERGY FUNDS
Notes to Financial Statements (continued)
November 30, 2020
| 6. TAX INFORMATION (continued) |
As of November 30, 2020, the Funds’ aggregate security unrealized gains and losses based on cost for U.S. federal income tax purposes were as follows:
| Clean Energy Income | Energy Infrastructure | |||||||
| Tax Cost |
$ | 110,474,146 | $ | 225,757,714 | ||||
| Gross unrealized gain |
11,731,517 | 16,543,758 | ||||||
| Gross unrealized loss |
(18,530 | ) | (5,594 | ) | ||||
| Net unrealized security gain (loss) |
$ | 11,712,987 | $ | 16,538,164 | ||||
The difference between GAAP-basis and tax basis unrealized gains (losses) is attributable primarily to wash sales and differences in the tax treatment of partnership investments.
The Clean Energy Income Fund reclassed $3,986 from paid in capital to distributable earnings and Energy Infrastructure Fund reclassed $240,941 from paid in capital to distributable earnings for the year ending November 30, 2020. In order to present certain components of the Fund’s capital accounts on a tax-basis, certain reclassifications have been recorded to the Fund’s accounts. These reclassifications have no impact on the net asset value of the Fund’s and result primarily from certain nondeductible expenses and differences in the tax treatment of partnership investments, and underlying fund investments.
GSAM has reviewed the Funds’ tax positions for all open tax years (the current and prior three years, as applicable) and has concluded that no provision for income tax is required in the Fund’s financial statements. Such open tax years remain subject to examination and adjustment by tax authorities.
| 7. OTHER RISKS |
The Fund’s risks include, but are not limited to, the following:
Dividend-Paying Investments Risk — A Fund’s investments in dividend-paying securities could cause a Fund to underperform other funds. Securities that pay dividends, as a group, can fall out of favor with the market, causing such securities to underperform securities that do not pay dividends. Depending upon market conditions and political and legislative responses to such conditions, dividend-paying securities that meet a Fund’s investment criteria may not be widely available and/or may be highly concentrated in only a few market sectors. In addition, issuers that have paid regular dividends or distributions to shareholders may not continue to do so at the same level or at all in the future. This may limit the ability of a Fund to produce current income.
Energy Sector Risk— The Energy Infrastructure Fund concentrates its investments in the energy sector, and will therefore be susceptible to adverse economic, environmental, business, regulatory or other occurrences affecting that sector. The energy sector has historically experienced substantial price volatility. MLPs and other companies operating in the energy sector are subject to specific risks, including, among others: fluctuations in commodity prices; reduced consumer demand for commodities such as oil, natural gas or petroleum products; reduced availability of natural gas or other commodities for transporting, processing, storing or delivering; slowdowns in new construction; extreme weather or other natural disasters; and threats of attack by terrorists on energy assets. Additionally, changes in the regulatory environment for energy companies may adversely impact their profitability. Over time, depletion of natural gas reserves and other energy reserves may also affect the profitability of energy companies.
Foreign Countries Risk — Investing in foreign markets may involve special risks and considerations not typically associated with investing in the U.S. Foreign securities may be subject to risk of loss because of more or less foreign government regulation, less public information and less economic, political and social stability in the countries in which a Fund invests. The imposition of exchange controls (including repatriation restrictions), confiscations of assets and property, trade restrictions (including tariffs) and other government restrictions by the U.S. or other governments, or from problems in share registration, settlement or custody, may also result in losses. Foreign risk also involves the risk of negative foreign currency rate fluctuations, which may cause the value of securities denominated in such foreign currency (or other instruments through which a Fund has exposure to foreign currencies) to decline in value. Currency exchange rates may fluctuate significantly over short periods of time.
42
GOLDMAN SACHS ENERGY FUNDS
| 7. OTHER RISKS (continued) |
Foreign Custody Risk — If a Fund invests in foreign securities, the Fund may hold such securities and cash with foreign banks, agents, and securities depositories appointed by the Fund’s custodian (each a “Foreign Custodian”). Some foreign custodians may be recently organized or new to the foreign custody business. In some countries, Foreign Custodians may be subject to little or no regulatory oversight over, or independent evaluation of, their operations. Further, the laws of certain countries may place limitations on a Fund’s ability to recover its assets if a Foreign Custodian enters bankruptcy
Geographic and Sector Risk — The Funds focus their investments in the energy sector, and will therefore be susceptible to adverse economic, environmental, business, regulatory or other occurrences affecting that sector. The energy sector has historically experienced substantial price volatility. MLPs and other companies operating in the energy sector are subject to specific risks, including, among others, fluctuations in commodity prices; reduced consumer demand for commodities such as oil, natural gas or petroleum products; reduced availability of natural gas or other commodities for transporting, processing, storing or delivering; slowdowns in new construction; extreme weather or other natural disasters; and threats of attack by terrorists on energy assets. Additionally, changes in the regulatory environment for energy companies may adversely impact their profitability. Over time, depletion of natural gas reserves and other energy reserves may also affect the profitability of energy companies.
Investments in Other Investment Companies Risk — As a shareholder of another investment company, including an ETF, a Fund will indirectly bear its proportionate share of any net management fees and other expenses paid by such other investment companies, in addition to the fees and expenses regularly borne by the Fund. ETFs are subject to risks that do not apply to conventional mutual funds, including but not limited to the following: (i) the market price of the ETF’s shares may trade at a premium or a discount to their NAV; and (ii) an active trading market for an ETF’s shares may not develop or be maintained.
Clean Energy Sector Risk — The Clean Energy Income Fund concentrates its investments in the clean energy group of industries, and will therefore be susceptible to adverse economic, business, social, political, environmental, regulatory or other developments affecting that group of industries. Clean energy companies may be more volatile than companies operating in more established industries. Certain valuation methods used to value clean energy companies have not been in widespread use for a significant period of time and may further increase the volatility of certain clean energy company share prices. Clean energy companies and other companies operating in the clean energy group of industries are subject to specific risks, including, among others: fluctuations in commodity prices and/or interest rates; changes in governmental or environmental regulation; reduced availability of clean energy sources or other commodities for transporting, processing, storing or delivering; slowdowns in new construction; seasonal weather conditions, extreme weather or other natural disasters; and threats of attack by terrorists on certain clean energy assets. Clean energy companies can be significantly affected by the supply of, and demand for, particular energy products, which may result in overproduction or underproduction. Additionally, changes in the regulatory environment for clean energy companies may adversely impact their profitability. Obsolescence of existing technology, short product cycles, falling prices and profits, competition from new market entrants and general economic conditions can significantly affect companies in the clean energy group of industries. Certain investments may be dependent on U.S. and foreign government policies, including tax incentives and subsidies. Adhering to the clean energy company criteria and applying the Investment Adviser’s supplemental clean energy analysis may also affect the Fund’s performance relative to other energy sector-focused funds that do not adhere to such criteria or apply such analysis.
Large Shareholder Transactions Risk — A Fund may experience adverse effects when certain large shareholders, such as other funds, institutional investors (including those trading by use of non-discretionary mathematical formulas), financial intermediaries (who may make investment decisions on behalf of underlying clients and/or include a Fund in their investment model), individuals, accounts and Goldman Sachs affiliates, purchase or redeem large amounts of shares of a Fund. Such large shareholder redemptions, which may occur rapidly or unexpectedly, may cause a Fund to sell portfolio securities at times when it would not otherwise do so, which may negatively impact a Fund’s NAV and liquidity. These transactions may also accelerate the realization of taxable income to shareholders if such sales of investments resulted in gains, and may also increase transaction costs. In addition, a large redemption could result in a Fund’s current expenses being allocated over a smaller asset base, leading to an increase in the Fund’s expense ratio. Similarly, large Fund share purchases may adversely affect a Fund’s performance to the extent that the Fund is delayed in investing new cash or otherwise maintains a larger cash position than it ordinarily would.
43
GOLDMAN SACHS ENERGY FUNDS
Notes to Financial Statements (continued)
November 30, 2020
| 7. OTHER RISKS (continued) |
Liquidity Risk — A Fund may make investments that are illiquid or that may become less liquid in response to market developments or adverse investor perceptions. Illiquid investments may be more difficult to value. Liquidity risk may also refer to the risk that a Fund will not be able to pay redemption proceeds within the allowable time period or without significant dilution to remaining investors’ interests because of unusual market conditions, an unusually high volume of redemption requests, or other reasons. To meet redemption requests, a Fund may be forced to sell investments at an unfavorable time and/or under unfavorable conditions. If a Fund is forced to sell securities at an unfavorable time and/or under unfavorable conditions, such sales may adversely affect the Fund’s NAV and dilute remaining investors’ interests. Redemptions by large shareholders may have a negative impact on a Fund’s liquidity.
Market and Credit Risks — In the normal course of business, a Fund trades financial instruments and enters into financial transactions where risk of potential loss exists due to changes in the market (market risk). The value of the securities in which a Fund invests may go up or down in response to the prospects of individual companies, particular sectors or governments and/or general economic conditions throughout the world due to increasingly interconnected global economies and financial markets. Events such as war, acts of terrorism, social unrest, natural disasters, the spread of infectious illness or other public health threats could also significantly impact a Fund and its investments. Additionally, the Fund may also be exposed to credit risk in the event that an issuer or guarantor fails to perform or that an institution or entity with which the Fund has unsettled or open transactions defaults.
Master Limited Partnership Risk — Investments in securities of MLPs involve risks that differ from investments in common stock, including risks related to limited control and limited rights to vote on matters affecting the MLP, risks related to potential conflicts of interest between the MLP and the MLP’s general partner, cash flow risks, dilution risks, limited liquidity and risks related to the general partner’s right to require unit-holders to sell their common units at an undesirable time or price.
Special Purpose Acquisition Companies Risk — A Fund may invest in stock, warrants, and other securities of special purpose acquisition companies (“SPACs”) or similar special purpose entities that pool funds to seek potential acquisition opportunities. Because SPACs and similar entities are in essence blank check companies without operating history or ongoing business other than seeking acquisitions, the value of their securities is particularly dependent on the ability of the entity’s management to identify and complete a profitable acquisition. An investment in a SPAC is subject to a variety of risks, including that (i) a portion of the monies raised by the SPAC for the purpose of effecting an acquisition or merger may be expended prior to the transaction for payment of taxes and other purposes; (ii) prior to any acquisition or merger, a SPAC’s assets are typically invested in government securities, money market funds and similar investments whose returns or yields may be significantly lower than those of a Fund’s other investments; (iii) a Fund generally will not receive significant income from its investments in SPACs (both prior to and after any acquisition or merger) and, therefore, a Fund’s investments in SPACs will not significantly contribute to a Fund’s distributions to shareholders; (iv) an attractive acquisition or merger target may not be identified at all, in which case the SPAC will be required to return any remaining monies to shareholders; (v) if an acquisition or merger target is identified, a Fund may elect not to participate in the proposed transaction or a Fund may be required to divest its interests in the SPAC due to regulatory or other considerations, in which case the warrants or other rights with respect to the SPAC held by a Fund may expire worthless or may be repurchased or retired by the SPAC at an unfavorable price; (vi) any proposed merger or acquisition may be unable to obtain the requisite approval, if any, of SPAC shareholders; (vii) under any circumstances in which a Fund receives a refund of all or a portion of its original investment (which typically represents a pro rata share of the proceeds of the SPAC’s assets, less any applicable taxes), the returns on that investment may be negligible, and a Fund may be subject to opportunity costs to the extent that alternative investments would have produced higher returns; (viii) to the extent an acquisition or merger is announced or completed, shareholders who redeem their shares prior to that time may not reap any resulting benefits; (ix) a Fund may be delayed in receiving any redemption or liquidation proceeds from a SPAC to which it is entitled; (x) an acquisition or merger once effected may prove unsuccessful and an investment in the SPAC may lose value; (xi) an investment in a SPAC may be diluted by additional later offerings of interests in the SPAC or by other investors exercising existing rights to purchase shares of the SPAC; (xii) only a thinly traded market for shares of or interests in a SPAC may develop, or there may be no market at all, leaving a Fund unable to sell its interest in a SPAC or to sell its interest only at a price below what a Fund believes is the SPAC interest’s intrinsic value; and (xiii) the values of investments in SPACs may be highly volatile and may depreciate significantly over time.
44
GOLDMAN SACHS ENERGY FUNDS
| 7. OTHER RISKS (continued) |
Non-Diversification Risk — The Funds are non-diversified, meaning that they are permitted to invest a larger percentage of their assets in fewer issuers than diversified mutual funds. Thus, a Fund may be more susceptible to adverse developments affecting any single issuer held in its portfolio, and may be more susceptible to greater losses because of these developments.
Tax Risks — Tax risks associated with investments in the Funds include but are not limited to the following:
MLP Tax Risk. MLPs are generally treated as partnerships for U.S. federal income tax purposes. Partnerships do not pay U.S. federal income tax at the partnership level. Rather, each partner is allocated a share of the partnership’s income, gains, losses, deductions and expenses. A change in current tax law or a change in the underlying business mix of a given MLP could result in an MLP being treated as a corporation for U.S. federal income tax purposes, which would result in the MLP being required to pay U.S. federal income tax (as well as state and local income taxes) on its taxable income. This would have the effect of reducing the amount of cash available for distribution by the MLP and could result in a reduction in the value of the Fund’s investment in the MLP and lower income to the Fund.
To the extent a distribution received by a Fund from an MLP is treated as a return of capital, the Fund’s adjusted tax basis in the interests of the MLP will be reduced, which may increase a Fund’s tax liability upon the sale of the interests in the MLP or upon subsequent distributions in respect of such interests.
| 8. INDEMNIFICATIONS |
Under the Trust’s organizational documents, its Trustees, officers, employees and agents are indemnified, to the extent permitted by the Act and state law, against certain liabilities that may arise out of performance of their duties to the Fund. Additionally, in the course of business, the Funds enter into contracts that contain a variety of indemnification clauses. The Funds’ maximum exposure under these arrangements is unknown, as this would involve future claims that may be made against the Funds that have not yet occurred. However, GSAM believes the risk of loss under these arrangements to be remote.
| 9. OTHER MATTERS |
On October 22, 2020, Goldman Sachs announced a settlement of matters involving 1Malaysia Development Bhd. (1MDB), a Malaysian sovereign wealth fund, with the United States Department of Justice as well as criminal and civil authorities in the UK, Singapore and Hong Kong. Further information regarding the 1MDB settlement can be found at https://www.goldmansachs.com/media-relations/press-releases/current/goldman-sachs-2020-10-22.html. The 1MDB settlement will not materially adversely affect GSAM’s ability to serve as investment manager.
| 10. SUBSEQUENT EVENTS |
Subsequent events after the Statement of Assets and Liabilities date have been evaluated, and GSAM has concluded that there is no impact requiring adjustment or disclosure in the financial statements.
45
GOLDMAN SACHS ENERGY FUNDS
Notes to Financial Statements (continued)
November 30, 2020
| 11. SUMMARY OF SHARE TRANSACTIONS |
Share activity is as follows:
| Goldman Sachs Clean Energy Income Fund(a) |
||||||||
|
|
|
|||||||
| For the Period Ended November 30, 2020 |
||||||||
|
|
|
|||||||
| Shares | Dollars | |||||||
|
|
|
|||||||
| Class A Shares | ||||||||
| Shares sold |
144,779 | $ | 1,858,540 | |||||
| Reinvestment of distributions |
263 | 3,603 | ||||||
| Shares redeemed |
(6,619 | ) | (85,807 | ) | ||||
| 138,423 | 1,776,336 | |||||||
| Class C Shares | ||||||||
| Shares sold |
6,111 | 65,010 | ||||||
| Shares redeemed |
(1 | ) | (10 | ) | ||||
| 6,110 | 65,000 | |||||||
| Institutional Shares | ||||||||
| Shares sold |
518,197 | 5,274,880 | ||||||
| Reinvestment of distributions |
1,126 | 15,442 | ||||||
| Shares redeemed |
(1 | ) | (10 | ) | ||||
| 519,322 | 5,290,312 | |||||||
| Investor Shares | ||||||||
| Shares sold |
5,001 | 50,010 | ||||||
| Reinvestment of distributions |
9 | 118 | ||||||
| Shares redeemed |
(1 | ) | (10 | ) | ||||
| 5,009 | 50,118 | |||||||
| Class R6 Shares | ||||||||
| Shares sold |
5,001 | 50,010 | ||||||
| Reinvestment of distributions |
11 | 151 | ||||||
| Shares redeemed |
(1 | ) | (10 | ) | ||||
| 5,011 | 50,151 | |||||||
| Class R Shares | ||||||||
| Shares sold |
5,001 | 50,010 | ||||||
| Shares redeemed |
(1 | ) | (10 | ) | ||||
| 5,000 | 50,000 | |||||||
| Class P Shares | ||||||||
| Shares sold |
8,450,763 | 104,359,870 | ||||||
| Reinvestment of distributions |
18,892 | 258,820 | ||||||
| Shares redeemed |
(6,438 | ) | (86,350 | ) | ||||
| 8,463,217 | 104,532,340 | |||||||
| NET INCREASE |
9,142,092 | $ | 111,814,257 | |||||
| (a) | Commenced operations on June 26, 2020. |
46
GOLDMAN SACHS ENERGY FUNDS
| 11. SUMMARY OF SHARE TRANSACTIONS (continued) |
| Goldman Sachs Energy Infrastructure Fund | ||||||||||||||||
|
|
|
|||||||||||||||
| For the Fiscal Year Ended November 30, 2020 |
For the Fiscal Year Ended November 30, 2019 |
|||||||||||||||
|
|
|
|||||||||||||||
| Shares | Dollars | Shares | Dollars | |||||||||||||
|
|
|
|||||||||||||||
| Class A Shares | ||||||||||||||||
| Shares sold |
4,488 | $ | 32,000 | 927 | $ | 9,158 | ||||||||||
| Reinvestment of distributions |
381 | 2,752 | 253 | 2,321 | ||||||||||||
| Shares redeemed |
(1,745 | ) | (11,832 | ) | (11 | ) | (104 | ) | ||||||||
| 3,124 | 22,920 | 1,169 | 11,375 | |||||||||||||
| Class C Shares | ||||||||||||||||
| Shares sold |
5,520 | 51,500 | 12,328 | 125,000 | ||||||||||||
| Reinvestment of distributions |
722 | 5,251 | 404 | 3,594 | ||||||||||||
| Shares redeemed |
(5,402 | ) | (34,840 | ) | — | — | ||||||||||
| 840 | 21,911 | 12,732 | 128,594 | |||||||||||||
| Institutional Shares | ||||||||||||||||
| Shares sold |
21,155 | 113,266 | 2,390 | 21,407 | ||||||||||||
| Reinvestment of distributions |
15,741 | 113,663 | 12,989 | 119,237 | ||||||||||||
| Shares redeemed |
(2,335 | ) | (13,845 | ) | (1 | ) | (7 | ) | ||||||||
| 34,561 | 213,084 | 15,378 | 140,637 | |||||||||||||
| Investor Shares | ||||||||||||||||
| Reinvestment of distributions |
260 | 1,884 | 228 | 2,087 | ||||||||||||
| 260 | 1,884 | 228 | 2,087 | |||||||||||||
| Class R6 Shares | ||||||||||||||||
| Shares sold |
10,897,877 | 59,229,000 | — | — | ||||||||||||
| Reinvestment of distributions |
399,579 | 2,826,781 | 236 | 2,164 | ||||||||||||
| Shares redeemed |
(388,584 | ) | (2,786,073 | ) | — | — | ||||||||||
| 10,908,872 | 59,269,708 | 236 | 2,164 | |||||||||||||
| Class R Shares | ||||||||||||||||
| Shares sold |
541 | 3,906 | 239 | 2,217 | ||||||||||||
| Reinvestment of distributions |
228 | 1,670 | 210 | 1,926 | ||||||||||||
| Shares redeemed |
(862 | ) | (5,827 | ) | (64 | ) | (584 | ) | ||||||||
| (93 | ) | (251 | ) | 385 | 3,559 | |||||||||||
| Class P Shares | ||||||||||||||||
| Shares sold |
32,643,587 | 224,664,371 | 8,665,705 | 76,100,246 | ||||||||||||
| Reinvestment of distributions |
967,797 | 6,894,937 | 287,400 | 2,612,676 | ||||||||||||
| Shares redeemed |
(18,741,613 | ) | (124,991,175 | ) | (1,719,933 | ) | (15,623,854 | ) | ||||||||
| 14,869,771 | 106,568,133 | 7,233,172 | 63,089,068 | |||||||||||||
| NET INCREASE |
25,817,335 | $ | 166,097,389 | 7,263,300 | $ | 63,377,484 | ||||||||||
47
Report of Independent Registered Public Accounting Firm
To the Board of Trustees of Goldman Sachs Trust and Shareholders of Goldman Sachs Clean Energy Income Fund and Goldman Sachs Energy Infrastructure Fund (formerly known as Goldman Sachs MLP & Energy Fund)
Opinions on the Financial Statements
We have audited the accompanying statements of assets and liabilities, including the schedules of investments, of Goldman Sachs Clean Energy Income Fund and Goldman Sachs Energy Infrastructure Fund (two of the funds constituting Goldman Sachs Trust, hereafter collectively referred to as the “Funds”) as of November 30, 2020, the related statements of operations and of changes in net assets for each of the periods indicated in the table below, including the related notes, and the financial highlights for each of the periods indicated in the table below (collectively referred to as the “financial statements”). In our opinion, the financial statements present fairly, in all material respects, the financial position of each of the Funds as of November 30, 2020, the results of each of their operations, the changes in each of their net assets for each of the periods listed in the table below and each of the financial highlights for each of the periods therein in conformity with accounting principles generally accepted in the United States of America.
| Fund | Statement of operations |
Statements of changes in net assets |
Financial highlights | |||
| Goldman Sachs Clean Energy Income Fund | For the period June 26, 2020 (commencement of operations) through November 30, 2020 | |||||
| Goldman Sachs Energy Infrastructure Fund (formerly known as Goldman Sachs MLP & Energy Fund) | For the year ended November 30, 2020 |
For the two years ended November 30, 2020 | For each of the periods indicated therein | |||
Basis for Opinions
These financial statements are the responsibility of the Funds’ management. Our responsibility is to express an opinion on the Funds’ financial statements based on our audits. We are a public accounting firm registered with the Public Company Accounting Oversight Board (United States) (PCAOB) and are required to be independent with respect to the Funds in accordance with the U.S. federal securities laws and the applicable rules and regulations of the Securities and Exchange Commission and the PCAOB.
We conducted our audits of these financial statements in accordance with the standards of the PCAOB. Those standards require that we plan and perform the audit to obtain reasonable assurance about whether the financial statements are free of material misstatement, whether due to error or fraud.
Our audits included performing procedures to assess the risks of material misstatement of the financial statements, whether due to error or fraud, and performing procedures that respond to those risks. Such procedures included examining, on a test basis, evidence regarding the amounts and disclosures in the financial statements. Our audits also included evaluating the accounting principles used and significant estimates made by management, as well as evaluating the overall presentation of the financial statements. Our procedures included confirmation of securities owned as of November 30, 2020 by correspondence with the custodian, transfer agent and brokers. We believe that our audits provide a reasonable basis for our opinions.
Boston, Massachusetts
January 26, 2021
We have served as the auditor of one or more investment companies in the Goldman Sachs fund complex since 2000.
48
GOLDMAN SACHS ENERGY FUNDS
As a shareholder of Class A, Class C, Institutional, Investor, Class R6, Class R and Class P Shares of a Fund, you incur two types of costs: (1) transaction costs, including sales charges on purchase payments (with respect to Class A Shares) and contingent deferred sales charges on redemptions (with respect to Class C Shares); and (2) ongoing costs, including management fees; distribution and/or service (12b-1) fees (with respect to Class A, Class C and Class R Shares); and other Fund expenses. This example is intended to help you understand your ongoing costs (in dollars) of investing in Class A, Class C, Institutional, Investor, Class R6, Class R and Class P Shares of a Fund and to compare these costs with the ongoing costs of investing in other mutual funds.
The example is based on an investment of $1,000 invested at the beginning of the period and held for the entire period from June 1, 2020 through November 30, 2020, which represents a period of 183 days in a 366 day year. The Clean Energy Income Fund example is based on the period from June 29, 2020 through November 30, 2020, which represents a period of 155 days out of 366 days. The Clean Energy Income Fund example for hypothetical expenses reflects projected activity for the period from June 1, 2020 through November 30, 2020 for the purposes of comparability. This projection assumes that annualized expense ratios were in effect during the period.
Actual Expenses — The first line under each share class in the table below provides information about actual account values and actual expenses. You may use the information in this line, together with the amount you invested, to estimate the expenses that you paid over the period. Simply divide your account value by $1,000 (for example, an $8,600 account value divided by $1,000=8.6), then multiply the result by the number in the first line under the heading entitled “Expenses Paid” to estimate the expenses you paid on your account during this period.
Hypothetical Example for Comparison Purposes — The second line under each share class in the table below provides information about hypothetical account values and hypothetical expenses based on each Fund’s actual net expense ratios and an assumed rate of return of 5% per year before expenses, which is not the Fund’s actual return. The hypothetical account values and expenses may not be used to estimate the actual ending account balance or expenses you paid for the period. You may use this information to compare the ongoing costs of investing in the Fund and other funds. To do so, compare this 5% hypothetical example with the 5% hypothetical examples that appear in the shareholder reports
of the other funds.
Please note that the expenses shown in the table are meant to highlight your ongoing costs only and do not reflect any transactional costs, such as sales charges, redemption fees, or exchange fees. Therefore, the second line of the table is useful in comparing ongoing costs only, and will not help you determine the relative total costs of owning different funds. In addition, if these transactional costs were included, your costs would have been higher.
| Clean Energy Income Fund(a) | Energy Infrastructure Fund | |||||||||||||||||||||||
| Share Class | Beginning Account Value 6/1/20 |
Ending Account Value 11/30/20 |
Expenses Paid for the 6 months ended 11/30/20* |
Beginning Account Value 6/1/20 |
Ending Account Value 11/30/20 |
Expenses Paid for the 6 months ended 11/30/20* |
||||||||||||||||||
| Class A | ||||||||||||||||||||||||
|
Actual |
$ | 1,000.00 | $ | 1,362.70 | $ | 6.35 | $ | 1,000.00 | $ | 1,045.90 | $ | 7.57 | ||||||||||||
|
Hypothetical 5% return |
1,000.00 | 1,017.60 | + | 5.42 | 1,000.00 | 1,017.60 | + | 7.47 | ||||||||||||||||
| Class C | ||||||||||||||||||||||||
|
Actual |
1,000.00 | 1,358.00 | 10.09 | 1,000.00 | 1,043.70 | 11.39 | ||||||||||||||||||
|
Hypothetical 5% return |
1,000.00 | 1,012.62 | + | 8.61 | 1,000.00 | 1,013.85 | + | 11.23 | ||||||||||||||||
| Institutional | ||||||||||||||||||||||||
|
Actual |
1,000.00 | 1,364.00 | 4.46 | 1,000.00 | 1,048.00 | 5.63 | ||||||||||||||||||
|
Hypothetical 5% return |
1,000.00 | 1,017.41 | + | 3.80 | 1,000.00 | 1,019.50 | + | 5.55 | ||||||||||||||||
| Investor | ||||||||||||||||||||||||
|
Actual |
1,000.00 | 1,363.30 | 5.10 | 1,000.00 | 1,048.00 | 6.30 | ||||||||||||||||||
|
Hypothetical 5% return |
1,000.00 | 1,016.86 | + | 4.36 | 1,000.00 | 1,018.85 | + | 6.21 | ||||||||||||||||
| Class R6 | ||||||||||||||||||||||||
|
Actual |
1,000.00 | 1,364.00 | 4.41 | 1,000.00 | 1,048.30 | 5.58 | ||||||||||||||||||
|
Hypothetical 5% return |
1,000.00 | 1,017.45 | + | 3.76 | 1,000.00 | 1,019.55 | + | 5.50 | ||||||||||||||||
| Class R | ||||||||||||||||||||||||
|
Actual |
1,000.00 | 1,361.00 | 7.60 | 1,000.00 | 1,045.10 | 8.90 | ||||||||||||||||||
|
Hypothetical 5% return |
1,000.00 | 1,016.30 | + | 6.48 | 1,000.00 | 1,016.30 | + | 8.77 | ||||||||||||||||
| Class P | ||||||||||||||||||||||||
|
Actual |
1,000.00 | 1,364.10 | 4.41 | 1,000.00 | 1,048.20 | 5.58 | ||||||||||||||||||
|
Hypothetical 5% return |
1,000.00 | 1,019.55 | + | 3.76 | 1,000.00 | 1,019.55 | + | 5.50 | ||||||||||||||||
| * | Expenses for each share class are calculated using each Fund’s annualized net expense ratio for each class, which represents the ongoing expenses as a percentage of net assets for the six months ended November 30, 2020. Expenses are calculated by multiplying the annualized net expense ratio by the average account value for the period; then multiplying the result by the number of days in the most recent fiscal half year; and then dividing that result by the number of days in the fiscal year. The annualized net expense ratios for the period were as follows: |
| Fund | Class A | Class C | Institutional | Investor | Class R6 | Class R | Class P | |||||||||||||||||||||
| Clean Energy Income(a) |
1.27 | % | 2.02 | % | 0.89 | % | 1.02 | % | 0.88 | % | 1.52 | % | 0.88 | % | ||||||||||||||
| Energy Infrastructure |
1.48 | 2.23 | 1.10 | 1.23 | 1.09 | 1.74 | 1.09 | |||||||||||||||||||||
| (a) | Commenced operations on June 26, 2020. |
| + | Hypothetical expenses are based on each Fund’s actual annualized net expense ratios and an assumed rate of return of 5% per year before expenses. |
49
GOLDMAN SACHS ENERGY FUNDS
Statement Regarding Basis for Approval of Management Agreement (Unaudited)
Background
The Goldman Sachs Clean Energy Income Fund (the “Fund”) is a newly-organized investment portfolio of Goldman Sachs Trust (the “Trust”) that commenced investment operations on June 26, 2020. At a meeting held on April 14, 2020 (the “Meeting”) in connection with the Fund’s organization, the Board of Trustees, including all of the Trustees present who are not parties to the Fund’s investment management agreement (the “Management Agreement”) or “interested persons” (as defined in the Investment Company Act of 1940, as amended) of any party thereto (the “Independent Trustees”) approved the Management Agreement with Goldman Sachs Asset Management, L.P. (the “Investment Adviser”).
At the Meeting, the Trustees reviewed the Management Agreement, including information regarding the terms of the Management Agreement; the nature, extent and quality of the Investment Adviser’s anticipated services; the fees and expenses to be paid by the Fund; a comparison of the Fund’s anticipated expenses with those paid by other similar mutual funds; the Investment Adviser’s proposal to waive and/or reimburse the Fund’s expenses (with certain customary exceptions, such as taxes, brokerage fees, and extraordinary expenses); and potential benefits to be derived by the Investment Adviser and its affiliates from their relationships with the Fund. Various information was also provided at a prior meeting at which the Fund was discussed.
In connection with the Meeting, the Trustees received written materials and oral presentations on the topics covered. The Independent Trustees were advised by their independent legal counsel regarding their responsibilities under applicable law. In evaluating the Management Agreement at the Meeting, the Trustees relied upon information included in a presentation made by the Investment Adviser at the Meeting and information received at prior meetings of the Trustees, as well as on their knowledge of the Investment Adviser resulting from their meetings and other interactions over time.
Nature, Extent, and Quality of the Services to Be Provided under the Management Agreement
As part of their review, the Trustees considered the nature, extent, and quality of the services to be provided by the Investment Adviser. In this regard, the Trustees considered both the investment advisory services and non-advisory services that would be provided to the Fund by the Investment Adviser and its affiliates. The Trustees also considered information about the Fund’s structure, investment objective, strategies, and other characteristics. The Trustees considered the experience and capabilities of the investment team and noted that the Fund’s portfolio manager was currently managing other series of the Trust. The Trustees concluded that the Investment Adviser would be able to commit substantial financial and other resources to the Fund. In this regard, the Trustees noted that, although the Fund was new (and therefore had no performance data to evaluate), the Investment Adviser had experience managing other funds and accounts that employ similar investment strategies. The Trustees concluded that the Investment Adviser’s management of the Fund likely would benefit the Fund and its shareholders.
Costs of Services to Be Provided and Profitability
The Trustees considered the contractual terms of the Management Agreement and the fee rates to be payable by the Fund thereunder. In this regard, the Trustees considered information on the services to be rendered by the Investment Adviser to the Fund, which included both advisory and administrative services that were directed to the needs and operations of the Fund as a registered mutual fund.
In particular, the Trustees reviewed information on the proposed management fees and the Fund’s projected total operating expense ratios (both gross and net of expense limitations), and those were compared to similar information for comparable mutual funds advised by other, unaffiliated investment management firms, as well as the peer group and category medians. The comparisons of the Fund’s fee rates and total operating expense ratios were prepared by a third-party provider of mutual fund data. The Trustees believed that this information was useful in evaluating the reasonableness of the management fees and total expenses expected to be paid by the Fund.
The Trustees considered the Investment Adviser’s undertaking to limit certain expenses of the Fund that exceed a specified level. In addition, the Trustees recognized that there was not yet profitability data to evaluate for the Fund, but considered the Investment Adviser’s representations that (i) such data would be provided after the Fund commenced operations, and (ii) the Fund was not expected to be profitable to the Investment Adviser and its affiliates initially.
The Trustees noted the competitive nature of the fund marketplace, and that many of the Fund’s shareholders would be investing in the Fund in part because of the Fund’s relationship with the Investment Adviser. They also noted that shareholders would be able to redeem their Fund shares if they believe that the Fund fees and expenses are too high or if they are dissatisfied with the performance of the Fund.
50
GOLDMAN SACHS ENERGY FUNDS
Statement Regarding Basis for Approval of Management Agreement (Unaudited) (continued)
Economies of Scale
The Trustees considered the proposed breakpoints in the fee rates payable under the Management Agreement at the following annual percentage rates of the average daily net assets of the Fund:
| Average Daily Net Assets | Management Fee Annual Rate | |||
| First $1 billion |
0.80 | % | ||
| Next $1 billion |
0.72 | % | ||
| Next $3 billion |
0.68 | % | ||
| Next $3 billion |
0.67 | % | ||
| Over $8 billion |
0.66 | % | ||
The Trustees noted that the breakpoints were meant to share potential economies of scale, if any, with the Fund and its shareholders as assets under management reach those asset levels. The Trustees considered the Fund’s projected asset levels and information comparing fee rates charged by the Investment Adviser with fee rates charged to other funds in the peer group, as well as the Investment Adviser’s undertaking to limit certain expenses of the Fund that exceed a specified level. Upon reviewing these matters, the Trustees concluded that the fee breakpoints represented a means of assuring that benefits of scalability, if any, would be passed along to shareholders at the specified asset levels.
Other Benefits to the Investment Adviser and Its Affiliates
The Trustees also considered the other benefits expected to be derived by the Investment Adviser and its affiliates from their relationship with the Fund, including: (a) transfer agency fees received by Goldman Sachs & Co. LLC (“Goldman Sachs”); (b) brokerage and futures commissions earned by Goldman Sachs for executing securities and futures transactions on behalf of the Fund; (c) research received by the Investment Adviser from broker-dealers in exchange for executing certain transactions on behalf of the Fund; (d) trading efficiencies resulting from aggregation of orders of the Fund with those for other funds or accounts managed by the Investment Adviser; (e) the Investment Adviser’s ability to leverage the infrastructure designed to service the Fund on behalf of its other clients; (f) the Investment Adviser’s ability to cross-market other products and services to Fund shareholders; (g) Goldman Sachs’ retention of certain fees as Fund Distributor; (h) the Investment Adviser’s ability to negotiate better pricing with custodians on behalf of its other clients, as a result of the relationship with the Fund; (i) the investment of cash and cash collateral in money market funds managed by the Investment Adviser that will result in increased assets under management for those money market funds; (j) the investment in exchange-traded funds (“ETFs”) managed by the Investment Adviser that will result in increased assets under management for those ETFs and may facilitate the development of the Investment Adviser’s ETF advisory business; and (k) the possibility that the working relationship between the Investment Adviser and the Fund’s third-party service providers may cause those service providers to be open to doing business with other areas of Goldman Sachs.
Conclusion
In connection with their consideration of the Management Agreement for the Fund at the Meeting, the Trustees gave weight to various factors, but did not identify any particular factor as controlling their decision. After deliberation and consideration of the information provided, including the factors described above, the Trustees concluded, in the exercise of their business judgment, that the management fee that would be payable by the Fund was reasonable in light of the services to be provided to it by the Investment Adviser, the Investment Adviser’s anticipated costs and the Fund’s reasonably anticipated asset levels. The Trustees unanimously concluded that the Investment Adviser’s management likely would benefit the Fund and its shareholders and that the Management Agreement should be approved with respect to the Fund.
51
GOLDMAN SACHS ENERGY FUNDS
Statement Regarding Basis for Approval of Management Agreement (Unaudited)
Background
The Goldman Sachs Energy Infrastructure Fund (formerly, the Goldman Sachs MLP & Energy Fund) (the “Fund”) is an investment portfolio of Goldman Sachs Trust (the “Trust”). The Board of Trustees oversees the management of the Trust and reviews the investment performance and expenses of the Fund at regularly scheduled meetings held throughout the year. In addition, the Board of Trustees determines annually whether to approve the continuance of the Trust’s investment management agreement (the “Management Agreement”) with Goldman Sachs Asset Management, L.P. (the “Investment Adviser”) on behalf of the Fund.
The Management Agreement was most recently approved for continuation until June 30, 2021 by the Board of Trustees, including those Trustees who are not parties to the Management Agreement or “interested persons” (as defined in the Investment Company Act of 1940, as amended) of any party thereto (the “Independent Trustees”), at a meeting held on June 16-17, 2020 (the “Annual Meeting”).
The review process undertaken by the Trustees spans the course of the year and culminates with the Annual Meeting. To assist the Trustees in their deliberations, the Trustees have established a Contract Review Committee (the “Committee”), comprised of the Independent Trustees. The Committee held two meetings over the course of the year since the Management Agreement was last approved. At those Committee meetings, regularly scheduled Board or other committee meetings, and/or the Annual Meeting, matters relevant to the renewal of the Management Agreement were considered by the Board, or the Independent Trustees, as applicable. With respect to the Fund, such matters included:
| (a) | the nature and quality of the advisory, administrative, and other services provided to the Fund by the Investment Adviser and its affiliates, including information about: |
| (i) | the structure, staff, and capabilities of the Investment Adviser and its portfolio management teams; |
| (ii) | the groups within the Investment Adviser and its affiliates that support the portfolio management teams or provide other types of necessary services, including fund services groups (e.g., accounting and financial reporting, tax, shareholder services, and operations); controls and risk management groups (e.g., legal, compliance, valuation oversight, credit risk management, internal audit, compliance testing, market risk analysis, finance, and central funding); sales and distribution support groups, and others (e.g., information technology and training); |
| (iii) | trends in employee headcount; |
| (iv) | the Investment Adviser’s financial resources and ability to hire and retain talented personnel and strengthen its operations; and |
| (v) | the parent company’s support of the Investment Adviser and its mutual fund business, as expressed by the firm’s senior management; |
| (b) | information on the investment performance of the Fund, including comparisons to the performance of similar mutual funds, as provided by a third-party mutual fund data provider engaged as part of the contract review process (the “Outside Data Provider”), and a benchmark performance index; and information on general investment outlooks in the markets in which the Fund invests; |
| (c) | information provided by the Investment Adviser indicating the Investment Adviser’s views on whether the Fund’s peer group and/or benchmark index had high, medium, or low relevance given the Fund’s particular investment strategy; |
| (d) | the terms of the Management Agreement and other agreements with affiliated service providers entered into by the Trust on behalf of the Fund; |
| (e) | fee and expense information for the Fund, including: |
| (i) | the relative management fee and expense levels of the Fund as compared to those of comparable funds managed by other advisers, as provided by the Outside Data Provider; |
| (ii) | the Fund’s expense trends over time; and |
| (iii) | to the extent the Investment Adviser manages other types of accounts (such as bank collective trusts, private wealth management accounts, institutional separate accounts, sub-advised mutual funds, and non-U.S. funds) having investment objectives and policies similar to those of the Fund, comparative information on the advisory fees charged and services provided to those accounts by the Investment Adviser; |
| (f) | with respect to the extensive investment performance and expense comparison data provided by the Outside Data Provider, its processes in producing that data for the Fund; |
| (g) | the undertakings of the Investment Adviser and its affiliates to implement fee waivers and/or expense limitations; |
| (h) | information relating to the profitability of the Management Agreement and the transfer agency and distribution and service arrangements of the Fund to the Investment Adviser and its affiliates; |
| (i) | whether the Fund’s existing management fee schedule adequately addressed any economies of scale; |
52
GOLDMAN SACHS ENERGY FUNDS
Statement Regarding Basis for Approval of Management Agreement (Unaudited) (continued)
| (j) | a summary of the “fall-out” benefits derived by the Investment Adviser and its affiliates from their relationships with the Fund, including the fees received by the Investment Adviser’s affiliates from the Fund for transfer agency, portfolio trading, distribution and other services; |
| (k) | a summary of potential benefits derived by the Fund as a result of its relationship with the Investment Adviser; |
| (l) | information regarding commissions paid by the Fund and broker oversight, an update on the Investment Adviser’s soft dollars practices, other information regarding portfolio trading, and how the Investment Adviser carries out its duty to seek best execution; |
| (m) | portfolio manager ownership of Fund shares; the manner in which portfolio manager compensation is determined; and the number and types of accounts managed by the portfolio managers; |
| (n) | the nature and quality of the services provided to the Fund by its unaffiliated service providers, and the Investment Adviser’s general oversight and evaluation (including reports on due diligence) of those service providers as part of the administrative services provided under the Management Agreement; and |
| (o) | the Investment Adviser’s processes and policies addressing various types of potential conflicts of interest; its approach to risk management; the annual review of the effectiveness of the Fund’s compliance program; and periodic compliance reports. |
The Trustees also received an overview of the Fund’s distribution arrangements. They received information regarding the Fund’s assets, share purchase and redemption activity, and payment of distribution and service fees. Information was also provided to the Trustees relating to revenue sharing payments made by and services provided by the Investment Adviser and its affiliates to intermediaries that promote the sale, distribution, and/or servicing of Fund shares. The Independent Trustees also discussed the broad range of other investment choices that are available to Fund investors, including the availability of comparable funds managed by other advisers.
The presentations made at the Board and Committee meetings and at the Annual Meeting encompassed the Fund and other mutual funds for which the Board of Trustees has responsibility. In evaluating the Management Agreement at the Annual Meeting, the Trustees relied upon their knowledge, resulting from their meetings and other interactions throughout the year, of the Investment Adviser and its affiliates, their services, and the Fund. In conjunction with these meetings, the Trustees received written materials and oral presentations on the topics covered, and the Investment Adviser addressed the questions and concerns of the Trustees, including concerns regarding the investment performance of certain of the funds they oversee. The Independent Trustees were advised by their independent legal counsel regarding their responsibilities and other regulatory requirements related to the approval and continuation of mutual fund investment management agreements under applicable law. In addition, the Investment Adviser and its affiliates provided the Independent Trustees with a written response to a formal request for information sent on behalf of the Independent Trustees by their independent legal counsel. During the course of their deliberations, the Independent Trustees met in executive sessions with their independent legal counsel, without representatives of the Investment Adviser or its affiliates present.
Nature, Extent, and Quality of the Services Provided Under the Management Agreement
As part of their review, the Trustees considered the nature, extent, and quality of the services provided to the Fund by the Investment Adviser. In this regard, the Trustees considered both the investment advisory services and non-advisory services that are provided by the Investment Adviser and its affiliates. The Trustees noted the transition in the leadership and changes in personnel of various of the Investment Adviser’s portfolio management teams that had occurred in recent periods, and the ongoing recruitment efforts aimed at bringing high quality investment talent to the Investment Adviser. They also noted the Investment Adviser’s commitment to maintaining high quality systems and expending substantial resources to respond to ongoing changes to the market, regulatory and control environment in which the Fund and its service providers operate, including changes associated with the COVID-19 pandemic, as well as the efforts of the Investment Adviser and its affiliates to combat cyber security risks. The Trustees also considered information regarding the Investment Adviser’s business continuity planning and remote operations in the current environment. The Trustees concluded that the Investment Adviser continued to commit substantial financial and operational resources to the Fund and expressed confidence that the Investment Adviser would continue to do so in the future. The Trustees also recognized that the Investment Adviser had made significant commitments to address regulatory compliance requirements applicable to the Fund and the Investment Adviser and its affiliates.
53
GOLDMAN SACHS ENERGY FUNDS
Statement Regarding Basis for Approval of Management Agreement (Unaudited) (continued)
Investment Performance
The Trustees also considered the investment performance of the Fund. In this regard, they compared the investment performance of the Fund to its peers using rankings compiled by the Outside Data Provider as of December 31, 2019, and updated performance information prepared by the Investment Adviser using the peer group identified by the Outside Data Provider as of March 31, 2020. The information on the Fund’s investment performance was provided for the one-year period ending on the applicable dates. The Trustees also reviewed the Fund’s investment performance relative to its performance benchmark. As part of this review, they considered the investment performance trends of the Fund over time, and reviewed the investment performance of the Fund in light of its investment objective and policies and market conditions.
In addition, the Trustees considered materials prepared and presentations made by the Investment Adviser’s senior management and portfolio management personnel in which Fund performance was assessed. The Trustees also considered the Investment Adviser’s periodic reports with respect to the Fund’s risk profile, and how the Investment Adviser’s approach to risk monitoring and management influences portfolio management.
The Trustees noted that the Fund’s Institutional Shares had placed in the top half of the Fund’s peer group and outperformed the Fund’s benchmark index for the one-year period ended March 31, 2020. They also considered that in June 2020 the Fund would be repositioned, which would involve changes to the Fund’s investment strategy.
Costs of Services Provided and Competitive Information
The Trustees considered the contractual terms of the Management Agreement and the fee rates payable by the Fund thereunder. In this regard, the Trustees considered information on the services rendered by the Investment Adviser to the Fund, which included both advisory and administrative services that were directed to the needs and operations of the Fund as a registered mutual fund.
In particular, the Trustees reviewed analyses prepared by the Outside Data Provider regarding the expense rankings of the Fund. The analyses provided a comparison of the Fund’s management fee and breakpoints to those of a relevant peer group and category universe; an expense analysis which compared the Fund’s overall net and gross expenses to a peer group and a category universe; and data comparing the Fund’s net expenses to the peer and category medians. The analyses also compared the Fund’s other expenses and fee waivers/reimbursements to those of the peer group and category medians. The Trustees concluded that the comparisons provided by the Outside Data Provider were useful in evaluating the reasonableness of the management fees and total expenses paid by the Fund.
In addition, the Trustees considered the Investment Adviser’s undertakings to implement fee waivers and/or expense limitations. They also considered, to the extent that the Investment Adviser manages other types of accounts having investment objectives and policies similar to those of the Fund, comparative fee information for services provided by the Investment Adviser to those accounts, and information that indicated that services provided to the Fund differed in various significant respects from the services provided to other types of accounts which, in many cases, operated under less stringent legal and regulatory structures, required fewer services from the Investment Adviser to a smaller number of client contact points, and were less time-intensive.
In addition, the Trustees noted that shareholders are able to redeem their Fund shares at any time if shareholders believe that the Fund fees and expenses are too high or if they are dissatisfied with the performance of the Fund.
Profitability
The Trustees reviewed the Fund’s contribution to the Investment Adviser’s revenues and pre-tax profit margins. In this regard the Trustees noted that they had received, among other things, profitability analyses and summaries, revenue and expense schedules by Fund and by function (i.e., investment management, transfer agency and distribution and service), and information on the Investment Adviser’s expense allocation methodology. They observed that the profitability and expense figures are substantially similar to those used by the Investment Adviser for many internal purposes, including compensation decisions among various business groups, and are thus subject to a vigorous internal debate about how certain revenue and expenses should be allocated. The Trustees also noted that the internal audit group within the Goldman Sachs organization periodically audits the expense allocation methodology and that the internal audit group was satisfied with the reasonableness, consistency, and accuracy of the Investment Adviser’s expense allocation methodology. Profitability data for the Fund was provided for 2019 and 2018, and the Trustees considered this information in relation to the Investment Adviser’s overall profitability.
54
GOLDMAN SACHS ENERGY FUNDS
Statement Regarding Basis for Approval of Management Agreement (Unaudited) (continued)
Economies of Scale
The Trustees considered the information that had been provided regarding whether there have been economies of scale with respect to the management of the Fund. The Trustees also considered the breakpoints in the fee rate payable under the Management Agreement for the Fund at the following annual percentage rates of the average daily net assets of the Fund:
| First $1 billion |
1.00 | % | ||
| Next $1 billion |
0.90 | |||
| Next $3 billion |
0.86 | |||
| Next $3 billion |
0.84 | |||
| Over $8 billion |
0.82 | |||
The Trustees noted that the breakpoints were designed to share potential economies of scale, if any, with the Fund and its shareholders as assets under management reach those asset levels. The Trustees considered the amount of assets in the Fund; the Fund’s recent share purchase and redemption activity; the information provided by the Investment Adviser relating to the costs of the services provided by the Investment Adviser and its affiliates and their realized profits; information comparing fee rates charged by the Investment Adviser with fee rates charged to other funds in the peer group; and the Investment Adviser’s undertaking to limit certain expenses of the Fund that exceed a specified level. Upon reviewing these matters at the Annual Meeting, the Trustees concluded that the fee breakpoints represented a means of assuring that benefits of scalability, if any, would be passed along to shareholders at the specified asset levels.
Other Benefits to the Investment Adviser and Its Affiliates
The Trustees also considered the other benefits derived by the Investment Adviser and its affiliates from their relationships with the Fund as stated above, including: (a) transfer agency fees received by Goldman Sachs & Co. LLC (“Goldman Sachs”); (b) brokerage and futures commissions earned by Goldman Sachs for executing securities and futures transactions on behalf of the Fund; (c) research received by the Investment Adviser from broker-dealers in exchange for executing certain transactions on behalf of the Fund; (d) trading efficiencies resulting from aggregation of orders of the Fund with those for other funds or accounts managed by the Investment Adviser; (e) the Investment Adviser’s ability to leverage the infrastructure designed to service the Fund on behalf of its other clients; (f) the Investment Adviser’s ability to cross-market other products and services to Fund shareholders; (g) Goldman Sachs’ retention of certain fees as Fund Distributor; (h) the Investment Adviser’s ability to negotiate better pricing with custodians on behalf of its other clients, as a result of the relationship with the Fund; (i) the investment of cash and cash collateral in money market funds managed by the Investment Adviser that will result in increased assets under management for those money market funds; and (j) the possibility that the working relationship between the Investment Adviser and the Fund’s third-party service providers may cause those service providers to be more likely to do business with other areas of Goldman Sachs. In the course of considering the foregoing, the Independent Trustees requested and received further information quantifying certain of these fall-out benefits.
Other Benefits to the Fund and Its Shareholders
The Trustees also noted that the Fund receives certain other potential benefits as a result of its relationship with the Investment Adviser, including: (a) trading efficiencies resulting from aggregation of orders of the Fund with those of other funds or accounts managed by the Investment Adviser; (b) enhanced servicing from vendors due to the volume of business generated by the Investment Adviser and its affiliates; (c) enhanced servicing from broker-dealers due to the volume of business generated by the Investment Adviser and its affiliates; (d) the Investment Adviser’s ability to negotiate favorable terms with derivatives counterparties on behalf of the Fund as a result of the size and reputation of the Goldman Sachs organization; (e) the advantages received from the Investment Adviser’s knowledge and experience gained from managing other accounts and products; (f) the Investment Adviser’s ability to hire and retain qualified personnel to provide services to the Fund because of the reputation of the Goldman Sachs organization; (g) the Fund’s access, through the Investment Adviser, to certain firm-wide resources (e.g., proprietary risk management systems and databases), subject to certain restrictions; and (h) the Fund’s access to certain affiliated distribution channels. In addition, the Trustees noted the competitive nature of the mutual fund marketplace, and considered that many of the Fund’s shareholders invested in the Fund in part because of the Fund’s relationship with the Investment Adviser and that those shareholders have a general expectation that the relationship will continue.
55
GOLDMAN SACHS ENERGY FUNDS
Statement Regarding Basis for Approval of Management Agreement (Unaudited) (continued)
Conclusion
In connection with their consideration of the Management Agreement, the Trustees gave weight to each of the factors described above, but did not identify any particular factor as controlling their decision. After deliberation and consideration of all of the information provided, including the factors described above, the Trustees concluded, in the exercise of their business judgment, that the management fees paid by the Fund were reasonable in light of the services provided to it by the Investment Adviser, the Investment Adviser’s costs and the Fund’s current and reasonably foreseeable asset levels. The Trustees unanimously concluded that the Investment Adviser’s continued management likely would benefit the Fund and its shareholders and that the Management Agreement should be approved and continued with respect to the Fund until June 30, 2021.
56
GOLDMAN SACHS ENERGY FUNDS
Voting Results of Special Meeting of Shareholders (Unaudited)
A Special Meeting (the “Meeting”) of the Goldman Sachs Trust (“GST”) was held on January 23, 2020 to consider and act upon the proposals below. The Portfolio will amortize its respective share of the proxy, shareholder meeting and other related costs and GSAM has agreed to reimburse the Portfolio to the extent such expenses exceed a specified percentage of the Portfolio’s net assets.
At the Meeting, Dwight L. Bush, Kathryn A. Cassidy, Joaquin Delgado and Gregory G. Weaver were elected to the Trust’s Board of Trustees. In electing trustees, the Trust’s shareholders voted as follows:
| Proposal 1. Election of Trustees |
For | Against | Withheld | Broker Non-Votes | ||||||||||||
| Dwight L. Bush |
94,278,961,728.065 | 0 | 349,026,343.365 | 0 | ||||||||||||
| Kathryn A. Cassidy |
94,310,850,789.164 | 0 | 317,137,282.266 | 0 | ||||||||||||
| Joaquin Delgado |
94,282,646,444.727 | 0 | 345,341,626.703 | 0 | ||||||||||||
| Gregory G. Weaver |
94,306,589,873.348 | 0 | 321,398,198.082 | 0 | ||||||||||||
57
GOLDMAN SACHS ENERGY FUNDS
Trustees and Officers (Unaudited)
Independent Trustees
| Name, Address and Age1 |
Position(s) Held with the Trust |
Term of Office and Length of Time Served2 |
Principal Occupation(s) During Past 5 Years |
Number of Portfolios in Fund Complex Overseen by Trustee3 |
Other Directorships Held by Trustee4 | |||||
| Jessica Palmer Age: 71 |
Chair of the Board of Trustees | Since 2018 (Trustee since 2007) |
Ms. Palmer is retired. She was formerly Consultant, Citigroup Human Resources Department (2007-2008); Managing Director, Citigroup Corporate and Investment Banking (previously, Salomon Smith Barney/Salomon Brothers) (1984-2006). Ms. Palmer was a Member of the Board of Trustees of Indian Mountain School (private elementary and secondary school) (2004-2009).
Chair of the Board of Trustees — Goldman Sachs Trust and Goldman Sachs Variable Insurance Trust. |
105 | None | |||||
| Dwight L. Bush Age: 63 |
Trustee | Since 2020 | Ambassador Bush is President and CEO of D.L. Bush & Associates (a financial advisory and private investment firm) (2002-2014 and 2017-present); and was formerly U.S. Ambassador to the Kingdom of Morocco (2014-2017) and a Member of the Board of Directors of Santander Bank, N.A. (2018-2019). Previously, Ambassador Bush served as an Advisory Board Member of Goldman Sachs Trust and Goldman Sachs Variable Insurance Trust (October 2019-January 2020).
Trustee — Goldman Sachs Trust and Goldman Sachs Variable Insurance Trust. |
105 | None | |||||
| Kathryn A. Cassidy Age: 66 |
Trustee | Since 2015 | Ms. Cassidy is retired. Formerly, she was Advisor to the Chairman (May 2014-December 2014); and Senior Vice President and Treasurer (2008-2014), General Electric Company & General Electric Capital Corporation (technology and financial services companies).
Trustee — Goldman Sachs Trust and Goldman Sachs Variable Insurance Trust. |
105 | None | |||||
| Diana M. Daniels Age: 71 |
Trustee | Since 2007 | Ms. Daniels is retired. Formerly, she was Vice President, General Counsel and Secretary, The Washington Post Company (1991-2006). Ms. Daniels is a Trustee Emeritus and serves as a Presidential Councillor of Cornell University (2013-Present); former Member of the Legal Advisory Board, New York Stock Exchange (2003-2006) and of the Corporate Advisory Board, Standish Mellon Management Advisors (2006- 2007).
Trustee — Goldman Sachs Trust and Goldman Sachs Variable Insurance Trust. |
105 | None | |||||
| Joaquin Delgado Age: 60 |
Trustee | Since 2020 | Dr. Delgado is retired. He is Director, Hexion Inc. (a specialty chemical manufacturer) (2019-present); and Director, Stepan Company (a specialty chemical manufacturer) (2011-present); and was formerly Executive Vice President, Consumer Business Group of 3M Company (July 2016-July 2019); and Executive Vice President, Health Care Business Group of 3M Company (October 2012-July 2016). Previously, Dr. Delgado served as an Advisory Board Member of Goldman Sachs Trust and Goldman Sachs Variable Insurance Trust (October 2019-January 2020).
Trustee — Goldman Sachs Trust and Goldman Sachs Variable Insurance Trust. |
105 | Stepan Company (a specialty chemical manufacturer) | |||||
58
GOLDMAN SACHS ENERGY FUNDS
Trustees and Officers (Unaudited) (continued)
Independent Trustees (continued)
| Name, Address and Age1 |
Position(s) Held with the Trust |
Term of Office and Length of Time Served2 |
Principal Occupation(s) During Past 5 Years |
Number of Portfolios in Fund Complex Overseen by Trustee3 |
Other Directorships Held by Trustee4 | |||||
| Roy W. Templin Age: 60 |
Trustee | Since 2013 | Mr. Templin is retired. He is Director, Armstrong World Industries, Inc. (a designer and manufacturer of ceiling, wall and suspension system solutions) (2016-Present); and was formerly Chairman of the Board of Directors, Con-Way Incorporated (a transportation, logistics and supply chain management service company) (2014-2015); Executive Vice President and Chief Financial Officer, Whirlpool Corporation (an appliance manufacturer and marketer) (2004- 2012).
Trustee — Goldman Sachs Trust and Goldman Sachs Variable Insurance Trust. |
105 | Armstrong World Industries, Inc. (a ceiling, wall and suspension systems solutions manufacturer) | |||||
| Gregory G. Weaver Age: 69 |
Trustee | Since 2015 | Mr. Weaver is retired. He is Director, Verizon Communications Inc. (2015-Present); and was formerly Chairman and Chief Executive Officer, Deloitte & Touche LLP (a professional services firm) (2001-2005 and 2012-2014); and Member of the Board of Directors, Deloitte & Touche LLP (2006-2012).
Trustee — Goldman Sachs Trust and Goldman Sachs Variable Insurance Trust. |
105 | Verizon Communications Inc. | |||||
Interested Trustee*
| Name, Address and Age1 |
Position(s) Held with the Trust |
Term of Office and Length of Time Served2 |
Principal Occupation(s) During Past 5 Years |
Number of Portfolios in Fund Complex Overseen by Trustee3 |
Other Directorships Held by Trustee4 | |||||
| James A. McNamara Age: 58 |
Trustee and President | Since 2007 | Advisory Director, Goldman Sachs (January 2018-Present); Managing Director, Goldman Sachs (January 2000-December 2017); Director of Institutional Fund Sales, GSAM (April 1998-December 2000); and Senior Vice President and Manager, Dreyfus Institutional Service Corporation (January 1993-April 1998).
President and Trustee — Goldman Sachs Trust; Goldman Sachs Variable Insurance Trust; Goldman Sachs Trust II; Goldman Sachs MLP and Energy Renaissance Fund; Goldman Sachs ETF Trust; Goldman Sachs Credit Income Fund; and Goldman Sachs Real Estate Diversified Income Fund.
|
170 | None | |||||
| * | Mr. McNamara is considered to be an “Interested Trustee” because he holds positions with Goldman Sachs and owns securities issued by The Goldman Sachs Group, Inc. Mr. McNamara holds comparable positions with certain other companies of which Goldman Sachs, GSAM or an affiliate thereof is the investment adviser, administrator and/or distributor. |
| 1 | Each Trustee may be contacted by writing to the Trustee, c/o Goldman Sachs, 200 West Street, New York, New York, 10282, Attn: Caroline Kraus. Information is provided as of November 30, 2020. |
| 2 | Subject to such policies as may be adopted by the Board from time-to-time, each Trustee holds office for an indefinite term, until the earliest of: (a) the election of his or her successor; (b) the date the Trustee resigns or is removed by the Board or shareholders, in accordance with the Trust’s Declaration of Trust; or (c) the termination of the Trust. The Board has adopted policies which provide that each Independent Trustee shall retire as of December 31st of the calendar year in which he or she reaches (a) his or her 75th birthday or (b) the 15th anniversary of the date he or she became a Trustee, whichever is earlier, unless a waiver of such requirements shall have been adopted by a majority of the other Trustees. These policies may be changed by the Trustees without shareholder vote. |
| 3 | The Goldman Sachs Fund Complex includes certain other companies listed above for each respective Trustee. As of November 30, 2020, Goldman Sachs Trust consisted of 92 portfolios (90 of which offered shares to the public); Goldman Sachs Variable Insurance Trust consisted of 13 portfolios; Goldman Sachs Trust II consisted of 19 portfolios (17 of which offered shares to the public); Goldman Sachs ETF Trust consisted of 37 portfolios (20 of which offered shares to the public); and Goldman Sachs MLP and Energy Renaissance Fund, Goldman Sachs Credit Income Fund and Goldman Sachs Real Estate Diversified Income Fund each consisted of one portfolio. Goldman Sachs Credit Income Fund did not offer shares to the public. |
| 4 | This column includes only directorships of companies required to report to the Securities and Exchange Commission under the Securities Exchange Act of 1934 (i.e., “public companies”) or other investment companies registered under the Act. |
Additional information about the Trustees is available in the Funds’ Statement of Additional Information, which can be obtained from Goldman Sachs free of charge by calling this toll-free number (in the United States of America): 1-800-526-7384.
59
GOLDMAN SACHS ENERGY FUNDS
Trustees and Officers (Unaudited) (continued)
Officers of the Trust*
| Name, Address and Age1 |
Position(s) Held with the Trust |
Term of Office and |
Principal Occupation(s) During Past 5 Years | |||
| James A. McNamara 200 West Street New York, NY 10282 Age: 58 |
Trustee and President | Since 2007 | Advisory Director, Goldman Sachs (January 2018-Present); Managing Director, Goldman Sachs (January 2000-December 2017); Director of Institutional Fund Sales, GSAM (April 1998-December 2000); and Senior Vice President and Manager, Dreyfus Institutional Service Corporation (January 1993-April 1998).
President and Trustee — Goldman Sachs Trust; Goldman Sachs Variable Insurance Trust; Goldman Sachs Trust II; Goldman Sachs MLP and Energy Renaissance Fund; Goldman Sachs ETF Trust; Goldman Sachs Credit Income Fund; and Goldman Sachs Real Estate Diversified Income Fund. | |||
| Caroline L. Kraus 200 West Street New York, NY 10282 Age: 43 |
Secretary | Since 2012 | Managing Director, Goldman Sachs (January 2016-Present); Vice President, Goldman Sachs (August 2006-December 2015); Senior Counsel, Goldman Sachs (January 2020-Present); Associate General Counsel, Goldman Sachs (2012-December 2019); Assistant General Counsel, Goldman Sachs (August 2006-December 2011); and Associate, Weil, Gotshal & Manges, LLP (2002-2006).
Secretary — Goldman Sachs Trust (previously Assistant Secretary (2012)); Goldman Sachs Variable Insurance Trust (previously Assistant Secretary (2012)); Goldman Sachs Trust II; Goldman Sachs BDC, Inc.; Goldman Sachs Private Middle Market Credit LLC; Goldman Sachs Private Middle Market Credit II LLC; Goldman Sachs Middle Market Lending Corp.; Goldman Sachs MLP and Energy Renaissance Fund; Goldman Sachs ETF Trust; Goldman Sachs Credit Income Fund; and Goldman Sachs Real Estate Diversified Income Fund. | |||
| Joseph F. DiMaria 30 Hudson Street Jersey City, NJ 07302 Age: 52 |
Treasurer, Principal Financial Officer and Principal Accounting Officer | Since 2017 (Treasurer and Principal Financial Officer since 2019) | Managing Director, Goldman Sachs (November 2015-Present) and Vice President — Mutual Fund Administration, Columbia Management Investment Advisers, LLC (May 2010-October 2015).
Treasurer, Principal Financial Officer and Principal Accounting Officer — Goldman Sachs Trust (previously Assistant Treasurer (2016)); Goldman Sachs Variable Insurance Trust (previously Assistant Treasurer (2016)); Goldman Sachs Trust II (previously Assistant Treasurer (2017)); Goldman Sachs MLP and Energy Renaissance Fund (previously Assistant Treasurer (2017)); Goldman Sachs ETF Trust (previously Assistant Treasurer (2017)); Goldman Sachs Credit Income Fund; and Goldman Sachs Real Estate Diversified Income Fund. | |||
| * | Represents a partial list of officers of the Trust. Additional information about all the officers is available in the Funds’ Statement of Additional Information, which can be obtained from Goldman Sachs free of charge by calling this toll-free number (in the United States): 1-800-526-7384. |
| 1 | Information is provided as of November 30, 2020. |
| 2 | Officers hold office at the pleasure of the Board of Trustees or until their successors are duly elected and qualified. Each officer holds comparable positions with certain other companies of which Goldman Sachs, GSAM or an affiliate thereof is the investment adviser, administrator and/or distributor. |
Goldman Sachs Energy Funds — Tax Information (Unaudited)
For the year ended November 30, 2020, 8.06% and 100% of the dividends paid from net investment company taxable income by the Goldman Sachs Clean Energy Income Fund and Goldman Sachs Energy Infrastructure Fund, respectively, qualify for the dividends received deduction available to corporations.
For the year ended November 30, 2020, 36.52% and 100% of the dividends paid from net investment company taxable income by the Goldman Sachs Clean Energy Income Fund and Goldman Sachs Energy Infrastructure Fund, respectively, qualify for the reduced tax rate under the Jobs and Growth Tax Relief and Reconciliation Act of 2003.
60
FUNDS PROFILE
Goldman Sachs Funds
Goldman Sachs is a premier financial services firm, known since 1869 for creating thoughtful and customized investment solutions in complex global markets.
Today, the Consumer and Investment Management Division of Goldman Sachs serves a diverse set of clients worldwide, including private institutions, public entities and individuals. With approximately $1.86 trillion in assets under supervision as of September 30, 2020, Goldman Sachs Asset Management (“GSAM”) has portfolio management teams located around the world and our investment professionals bring firsthand knowledge of local markets to every investment decision. Assets under supervision includes assets under management and other client assets for which Goldman Sachs does not have full discretion. GSAM leverages the resources of Goldman Sachs & Co. LLC subject to legal, internal and regulatory restrictions.
Money Market
Financial Square FundsSM
| ∎ | Financial Square Treasury Solutions Fund1 |
| ∎ | Financial Square Government Fund1 |
| ∎ | Financial Square Money Market Fund2 |
| ∎ | Financial Square Prime Obligations Fund2 |
| ∎ | Financial Square Treasury Instruments Fund1 |
| ∎ | Financial Square Treasury Obligations Fund1 |
| ∎ | Financial Square Federal Instruments Fund1 |
Investor FundsSM
| ∎ | Investor Money Market Fund3 |
| ∎ | Investor Tax-Exempt Money Market Fund3 |
Fixed Income
Short Duration and Government
| ∎ | Enhanced Income Fund |
| ∎ | High Quality Floating Rate Fund |
| ∎ | Short-Term Conservative Income Fund |
| ∎ | Short Duration Government Fund |
| ∎ | Short Duration Income Fund |
| ∎ | Government Income Fund |
| ∎ | Inflation Protected Securities Fund |
Multi-Sector
| ∎ | Bond Fund |
| ∎ | Core Fixed Income Fund |
| ∎ | Global Core Fixed Income Fund4 |
| ∎ | Income Fund |
| ∎ | Strategic Income Fund |
Municipal and Tax-Free
| ∎ | High Yield Municipal Fund |
| ∎ | Dynamic Municipal Income Fund |
| ∎ | Municipal Income Completion Fund |
| ∎ | Short Duration Tax-Free Fund |
Single Sector
| ∎ | Investment Grade Credit Fund |
| ∎ | U.S. Mortgages Fund |
| ∎ | High Yield Fund |
| ∎ | High Yield Floating Rate Fund |
| ∎ | Emerging Markets Debt Fund |
| ∎ | Local Emerging Markets Debt Fund |
Fixed Income Alternatives
| ∎ | Long Short Credit Strategies Fund |
Fundamental Equity
| ∎ | Equity Income Fund |
| ∎ | Small Cap Growth Fund |
| ∎ | Small Cap Value Fund |
| ∎ | Small/Mid Cap Value Fund |
| ∎ | Mid Cap Value Fund |
| ∎ | Large Cap Value Fund |
| ∎ | Focused Value Fund |
| ∎ | Capital Growth Fund |
| ∎ | Strategic Growth Fund |
| ∎ | Small/Mid Cap Growth Fund |
| ∎ | Flexible Cap Fund |
| ∎ | Concentrated Growth Fund |
| ∎ | Technology Opportunities Fund |
| ∎ | Growth Opportunities Fund |
| ∎ | Rising Dividend Growth Fund |
| ∎ | U.S. Equity ESG Fund5 |
| ∎ | Income Builder Fund |
| ∎ | Defensive Equity Fund |
Tax-Advantaged Equity
| ∎ | U.S. Tax-Managed Equity Fund |
| ∎ | International Tax-Managed Equity Fund |
| ∎ | U.S. Equity Dividend and Premium Fund |
| ∎ | International Equity Dividend and Premium Fund |
Equity Insights
| ∎ | Small Cap Equity Insights Fund |
| ∎ | U.S. Equity Insights Fund |
| ∎ | Small Cap Growth Insights Fund |
| ∎ | Large Cap Growth Insights Fund |
| ∎ | Large Cap Value Insights Fund |
| ∎ | Small Cap Value Insights Fund |
| ∎ | International Small Cap Insights Fund |
| ∎ | International Equity Insights Fund |
| ∎ | Emerging Markets Equity Insights Fund |
Fundamental Equity International
| ∎ | International Equity Income Fund |
| ∎ | International Equity ESG Fund |
| ∎ | China Equity Fund6 |
| ∎ | Emerging Markets Equity Fund |
| ∎ | Imprint Emerging Markets Opportunities Fund |
| ∎ | ESG Emerging Markets Equity Fund |
Alternative
| ∎ | Clean Energy Income Fund |
| ∎ | Real Estate Securities Fund |
| ∎ | International Real Estate Securities Fund |
| ∎ | Commodity Strategy Fund |
| ∎ | Global Real Estate Securities Fund |
| ∎ | Alternative Premia Fund |
| ∎ | Absolute Return Tracker Fund |
| ∎ | Managed Futures Strategy Fund |
| ∎ | MLP Energy Infrastructure Fund |
| ∎ | Energy Infrastructure Fund7 |
| ∎ | Multi-Manager Alternatives Fund |
| ∎ | Global Infrastructure Fund |
Total Portfolio Solutions
| ∎ | Global Managed Beta Fund |
| ∎ | Multi-Manager Non-Core Fixed Income Fund |
| ∎ | Multi-Manager Global Equity Fund |
| ∎ | Multi-Manager International Equity Fund |
| ∎ | Tactical Tilt Overlay Fund |
| ∎ | Balanced Strategy Portfolio |
| ∎ | Multi-Manager U.S. Small Cap Equity Fund |
| ∎ | Multi-Manager Real Assets Strategy Fund |
| ∎ | Growth and Income Strategy Portfolio |
| ∎ | Growth Strategy Portfolio |
| ∎ | Dynamic Global Equity Fund |
| ∎ | Satellite Strategies Portfolio |
| ∎ | Enhanced Dividend Global Equity Portfolio |
| ∎ | Tax-Advantaged Global Equity Portfolio |
| ∎ | Strategic Factor Allocation Fund |
| ∎ | Target Date Retirement Portfolio8 |
| ∎ | Target Date 2025 Portfolio |
| ∎ | Target Date 2030 Portfolio |
| ∎ | Target Date 2035 Portfolio |
| ∎ | Target Date 2040 Portfolio |
| ∎ | Target Date 2045 Portfolio |
| ∎ | Target Date 2050 Portfolio |
| ∎ | Target Date 2055 Portfolio |
| ∎ | Target Date 2060 Portfolio |
| ∎ | GQG Partners International Opportunities Fund |
| 1 | You could lose money by investing in the Fund. Although the Fund seeks to preserve the value of your investment at $1.00 per share, it cannot guarantee it will do so. An investment in the Fund is not a deposit of a bank and is not insured or guaranteed by the Federal Deposit Insurance Corporation or any other government agency. The Fund’s sponsor has no legal obligation to provide financial support to the Fund, and you should not expect that the sponsor will provide financial support to the Fund at any time. |
| 2 | You could lose money by investing in the Fund. Because the share price of the Fund will fluctuate, when you sell your shares they may be worth more or less than what you originally paid for them. The Fund may impose a fee upon sale of your shares or may temporarily suspend your ability to sell shares if the Fund’s liquidity falls below required minimums because of market conditions or other factors. An investment in the Fund is not a deposit of a bank and is not insured or guaranteed by the Federal Deposit Insurance Corporation or any other government agency. The Fund’s sponsor has no legal obligation to provide financial support to the Fund, and you should not expect that the sponsor will provide financial support to the Fund at any time. |
| 3 | You could lose money by investing in the Fund. Although the Fund seeks to preserve the value of your investment at $1.00 per share, it cannot guarantee it will do so. The Fund may impose a fee upon sale of your shares or may temporarily suspend your ability to sell shares if the Fund’s liquidity falls below required minimums because of market conditions or other factors. An investment in the Fund is not a deposit of a bank and is not insured or guaranteed by the Federal Deposit Insurance Corporation or any other government agency. The Fund’s sponsor has no legal obligation to provide financial support to the Fund, and you should not expect that the sponsor will provide financial support to the Fund at any time. |
| 4 | Effective after the close of business on April 30, 2020, the Goldman Sachs Global Income Fund was renamed the Goldman Sachs Global Core Fixed Income Fund. |
| 5 | Effective after the close of business of August 30, 2020, the Goldman Sachs Blue Chip Fund was renamed the Goldman Sachs U.S. Equity ESG Fund. |
| 6 | Effective after the close of business of November 20, 2019, the Goldman Sachs Asia Equity Fund was renamed the Goldman Sachs China Equity Fund. |
| 7 | Effective after the close of business on June 26, 2020, the Goldman Sachs MLP & Energy Fund was renamed the Goldman Sachs Energy Infrastructure Fund. |
| 8 | Effective December 27, 2019, the Goldman Sachs Target Date 2020 Portfolio was renamed the Goldman Sachs Target Date Retirement Portfolio. Financial Square FundsSM and Investor FundsSM are registered service marks of Goldman Sachs & Co. LLC. |
| * | This list covers open-end funds only. Please visit our website at www.GSAMFUNDS.com to learn about our closed-end funds and exchange-traded funds. |
| TRUSTEES Jessica Palmer, Chair Dwight L. Bush Kathryn A. Cassidy Diana M. Daniels Joaquin Delgado James A. McNamara Roy W. Templin Gregory G. Weaver |
OFFICERS James A. McNamara, President Joseph F. DiMaria, Principal Financial Officer, Caroline L. Kraus, Secretary | |
| GOLDMAN SACHS & CO. LLC Distributor and Transfer Agent |
GOLDMAN SACHS ASSET MANAGEMENT, L.P. Investment Adviser | |
Visit our website at www.GSAMFUNDS.com to obtain the most recent month-end returns.
Goldman Sachs Asset Management, L.P., 200 West Street, New York, New York 10282
Goldman Sachs does not provide legal, tax or accounting advice, unless explicitly agreed between you and Goldman Sachs (generally through certain services offered only to clients of Private Wealth Management). Any statement contained in this presentation concerning U.S. tax matters is not intended or written to be used and cannot be used for the purpose of avoiding penalties imposed on the relevant taxpayer. Notwithstanding anything in this document to the contrary, and except as required to enable compliance with applicable securities law, you may disclose to any person the US federal and state income tax treatment and tax structure of the transaction and all materials of any kind (including tax opinions and other tax analyses) that are provided to you relating to such tax treatment and tax structure, without Goldman Sachs imposing any limitation of any kind. Investors should be aware that a determination of the tax consequences to them should take into account their specific circumstances and that the tax law is subject to change in the future or retroactively and investors are strongly urged to consult with their own tax advisor regarding any potential strategy, investment or transaction.
The reports concerning the Funds included in this shareholder report may contain certain forward-looking statements about the factors that may affect the performance of the Funds in the future. These statements are based on Fund management’s predictions and expectations concerning certain future events and their expected impact on the Fund, such as performance of the economy as a whole and of specific industry sectors, changes in the levels of interest rates, the impact of developing world events, and other factors that may influence the future performance of the Funds. Management believes these forward-looking statements to be reasonable, although they are inherently uncertain and difficult to predict. Actual events may cause adjustments in portfolio management strategies from those currently expected to be employed.
A description of the policies and procedures that the Funds use to determine how to vote proxies relating to portfolio securities and information regarding how the Fund voted proxies relating to portfolio securities for the most recent 12-month period ended June 30, are available (I) without charge, upon request by calling 1-800-526-7384 (for Retail Shareholders) or 1-800-621-2550 (for Institutional Shareholders); and (II) on the Securities and Exchange Commission (“SEC’’) web site at http://www.sec.gov.
The Funds will file their portfolio holdings for each month in a fiscal quarter within 60 days after the end of the relevant fiscal quarter on Form N-PORT. Portfolio holdings information for the third month of each fiscal quarter will be made available on the SEC’s web site at http://www.sec.gov. Portfolio holdings information may be obtained upon request and without charge by calling 1-800-526-7384 (for Retail Shareholders) or 1-800-621-2550 (for Institutional Shareholders).
Fund holdings and allocations shown are as of November 30, 2020 and may not be representative of future investments. Fund holdings should not be relied on in making investment decisions and should not be construed as research or investment advice regarding particular securities. Current and future holdings are subject to risk.
Economic and market forecasts presented herein reflect our judgment as of the date of this presentation and are subject to change without notice. These forecasts do not take into account the specific investment objectives, restrictions, tax and financial situation or other needs of any specific client. Actual data will vary and may not be reflected here. These forecasts are subject to high levels of uncertainty that may affect actual performance. Accordingly, these forecasts should be viewed as merely representative of a broad range of possible outcomes. These forecasts are estimated, based on assumptions, and are subject to significant revision and may change materially as economic and market conditions change. Goldman Sachs has no obligation to provide updates or changes to these forecasts. Case studies and examples are for illustrative purposes only.
“Alerian Midstream Energy Select Index”, “Alerian MLP Index”, “Alerian MLP Total Return Index”, “AMEI”, “AMEIX”, “AMZ” and “AMZX” are trademarks of Alerian and their use is granted under a license from Alerian.
The portfolio risk management process includes an effort to monitor and manage risk, but does not imply low risk.
This material is not authorized for distribution to prospective investors unless preceded or accompanied by a current Prospectus or summary prospectus, if applicable. Investors should consider the Fund’s objective, risks, and charges and expenses, and read the summary prospectus, if available, and/or the Prospectus carefully before investing or sending money. The summary prospectus, if available, and the Prospectus contain this and other information about the Fund and may be obtained from your authorized dealer or from Goldman Sachs & Co. LLC by calling (retail – 1-800-526-7384) (institutional – 1-800-621-2550).
© 2021 Goldman Sachs. All rights reserved. 226454-OTU-1335063 MLPANDEAR-21
| ITEM 2. | CODE OF ETHICS. |
| (a) | As of the end of the period covered by this report, the registrant has adopted a code of ethics that applies to the registrant’s principal executive officer, principal financial officer, principal accounting officer or controller, or persons performing similar functions, regardless of whether these individuals are employed by the registrant or a third party (the “Code of Ethics”). |
| (b) | Not applicable. |
| (c) | During the period covered by this report, no amendments were made to the provisions of the Code of Ethics. |
| (d) | During the period covered by this report, the registrant did not grant any waivers, including an implicit waiver, from any provision of the Code of Ethics. |
| (e) | Not applicable. |
| (f) | A copy of the Code of Ethics is available as provided in Item 13(a)(1) of this report. |
| ITEM 3. | AUDIT COMMITTEE FINANCIAL EXPERT. |
| The registrant’s board of trustees has determined that the registrant has at least one “audit committee financial expert” (as defined in Item 3 of Form N-CSR) serving on its audit committee. Gregory G. Weaver is the “audit committee financial expert” and is “independent” (as each term is defined in Item 3 of Form N-CSR). |
| ITEM 4. | PRINCIPAL ACCOUNTANT FEES AND SERVICES. |
Table 1 — Items 4(a) - 4(d). The accountant fees below reflect the aggregate fees billed by all of the Funds of the Goldman Sachs Trust and includes the Goldman Sachs Funds to which this certified shareholder report relates.
| 2020 | 2019 | Description of Services Rendered | ||||||||
| Audit Fees: |
||||||||||
| • PricewaterhouseCoopers LLP (“PwC”) |
$ | 4,031,292 | $ | 3,492,375 | Financial Statement audits. | |||||
| Audit-Related Fees: |
||||||||||
| • PwC |
$ | 344,654 | $ | 210,602 | Other attest services. | |||||
| Tax Fees: |
||||||||||
| • PwC |
$ | 54,425 | $ | 1,069,045 | Tax compliance services provided in connection with the preparation and review of registrant’s tax returns and certain other tax-related services. | |||||
Table 2 — Items 4(b)(c) & (d). Non-Audit Services to the Goldman Sachs Trust’s service affiliates* that were pre-approved by the Audit Committee of the Goldman Sachs Trust pursuant to Rule 2-01(c)(7)(ii) of Regulation S-X.
| 2020 | 2019 | Description of Services Rendered | ||||||||
| Audit-Related Fees: |
||||||||||
| • PwC |
$ |
2,026,617 |
|
$ | 2,339,266 | Internal control review performed in accordance with Statement on Standards for Attestation Engagements No. 16 and semi annual updates related to withholding tax accrual for non-US jurisdictions. These fees are borne by the Funds’ Adviser. | ||||
| * | These include the advisor (excluding sub-advisors) and any entity controlling, controlled by or under common control with the advisor that provides ongoing services to the registrant (hereinafter referred to as “service affiliates”). |
Item 4(e)(1) — Audit Committee Pre-Approval Policies and Procedures
Pre-Approval of Audit and Non-Audit Services Provided to the Funds of the Goldman Sachs Trust. The Audit and Non-Audit Services Pre-Approval Policy (the “Policy”) adopted by the Audit Committee of Goldman Sachs Trust (“GST”) sets forth the procedures and the conditions pursuant to which services performed by an independent auditor for GST may be pre-approved. Services may be pre-approved specifically by the Audit Committee as a whole or, in certain circumstances, by the Audit Committee Chairman or the person designated as the Audit Committee Financial Expert. In addition, subject to specified cost limitations, certain services may be pre-approved under the provisions of the Policy. The Policy provides that the Audit Committee will consider whether the services provided by an independent auditor are consistent with the Securities and Exchange Commission’s rules on auditor independence. The Policy provides for periodic review and pre-approval by the Audit Committee of the services that may be provided by the independent auditor.
De Minimis Waiver. The pre-approval requirements of the Policy may be waived with respect to the provision of non-audit services that are permissible for an independent auditor to perform, provided (1) the aggregate amount of all such services provided constitutes no more than five percent of the total amount of revenues subject to pre-approval that was paid to the independent auditors during the fiscal year in which the services are provided; (2) such services were not recognized by GST at the time of the engagement to be non-audit services; and (3) such services are promptly brought to the attention of the Audit Committee and approved prior to the completion of the audit by the Audit Committee or by one or more members of the Audit Committee to whom authority to grant such approvals has been delegated by the Audit Committee, pursuant to the pre-approval provisions of the Policy.
Pre-Approval of Non-Audit Services Provided to GST’s Investment Advisers. The Policy provides that, in addition to requiring pre-approval of audit and non-audit services provided to GST, the Audit Committee will pre-approve those non-audit services provided to GST’s investment advisers (and entities controlling, controlled by or under common control with the investment advisers that provide ongoing services to GST) where the engagement relates directly to the operations or financial reporting of GST.
Item 4(e)(2) – 0% of the audit-related fees, tax fees and other fees listed in Table 1 were approved by GST’s Audit Committee pursuant to the “de minimis” exception of Rule 2-01(c)(7)(i)(C) of Regulation S-X. In addition, 0% of the non-audit services to the GST’s service affiliates listed in Table 2 were approved by GST’s Audit Committee pursuant to the “de minimis” exception of Rule 2-01(c)(7)(i)(C) of Regulation S-X.
Item 4(f) – Not applicable.
Item 4(g) Aggregate Non-Audit Fees Disclosure
The aggregate non-audit fees billed to GST by PwC for the twelve months ended November 30, 2020 and November 30, 2019 were $399,079 and $1,279,647, respectively. The aggregate non-audit fees billed to GST’s adviser and service affiliates by PwC for non-audit services for the twelve months ended December 31, 2019 and December 31, 2018 were approximately $14.7 million and $12.3 million, respectively. The figures for these entities are not yet available for the twelve months ended December 31, 2020. With regard to the aggregate non-audit fees billed to GST’s adviser and service affiliates, the 2019 and 2018 amounts include fees for non-audit services required to be pre-approved [see Table 2] and fees for non-audit services that did not require pre-approval since they did not directly relate to GST’s operations or financial reporting.
Item 4(h) — GST’s Audit Committee has considered whether the provision of non-audit services to GST’s investment adviser and service affiliates that did not require pre-approval pursuant to paragraph (c)(7)(ii) of Rule 2-01 of Regulation S-X is compatible with maintaining the auditors’ independence.
| ITEM 5. | AUDIT COMMITTEE OF LISTED REGISTRANTS. |
| Not applicable. |
| ITEM 6. | SCHEDULE OF INVESTMENTS. |
| Schedule of Investments is included as part of the Report to Shareholders filed under Item 1. |
| ITEM 7. | DISCLOSURE OF PROXY VOTING POLICIES AND PROCEDURES FOR CLOSED-END MANAGEMENT INVESTMENT COMPANIES. |
| Not applicable. |
| ITEM 8. | PORTFOLIO MANAGERS OF CLOSED-END MANAGEMENT INVESTMENT COMPANIES. |
| Not applicable. |
| ITEM 9. | PURCHASES OF EQUITY SECURITIES BY CLOSED-END MANAGEMENT INVESTMENT COMPANY AND AFFILIATED PURCHASERS. |
| Not applicable. |
| ITEM 10. | SUBMISSION OF MATTERS TO A VOTE OF SECURITY HOLDERS. |
| There have been no material changes to the procedures by which shareholders may recommend nominees to the registrant’s board of trustees. |
| ITEM 11. | CONTROLS AND PROCEDURES. |
| (a) | The registrant’s principal executive and principal financial officers, or persons performing similar functions have concluded that the registrant’s disclosure controls and procedures (as defined in Rule 30a-3(c) under the Investment Company Act of 1940, as amended (the “1940 Act”)) are effective as of a date within 90 days of the filing of this report that includes the disclosure required by this paragraph, based on the evaluation of these controls and procedures required by Rule 30a-3(b) under the 1940 Act and 15d-15(b) under the Securities Exchange Act of 1934, as amended. |
| (b) | There were no changes in the registrant’s internal control over financial reporting (as defined in Rule 30a-3(d) under the 1940 Act) that occurred during the period covered by this report that have materially affected, or are reasonably likely to materially affect, the registrant’s internal control over financial reporting. |
| ITEM 12. | DISCLOSURE OF SECURITIES LENDING ACTIVITIES FOR CLOSED-END MANAGEMENT INVESTMENT COMPANIES |
Not applicable.
| ITEM 13. | EXHIBITS. |
| (a)(1) | Goldman Sachs Trust’s Code of Ethics for Principal Executive and Senior Financial Officers is incorporated by reference to Exhibit 13(a)(1) of the registrant’s Form N-CSR filed on May 5, 2020. | |||
| (a)(2) | Exhibit 99.CERT | Certifications pursuant to Section 302 of the Sarbanes-Oxley Act of 2002 filed herewith. | ||
| (a)(3) | Not applicable to open-end investment companies. | |||
| (a)(4) | There was no change in the registrant’s independent public accountant for the period covered by this report. | |||
| (b) | Exhibit 99.906CERT | Certifications pursuant to Section 906 of the Sarbanes-Oxley Act of 2002 filed herewith. | ||
SIGNATURES
Pursuant to the requirements of the Securities Exchange Act of 1934 and the Investment Company Act of 1940, the registrant has duly caused this report to be signed on its behalf by the undersigned, thereunto duly authorized.
| Goldman Sachs Trust | ||||
| By: | /s/ James A. McNamara | |||
| James A. McNamara | ||||
| President/Chief Executive Officer | ||||
| Goldman Sachs Trust | ||||
| Date: | February 5, 2021 | |||
Pursuant to the requirements of the Securities Exchange Act of 1934 and the Investment Company Act of 1940, this report has been signed below by the following persons on behalf of the registrant and in the capacities and on the dates indicated.
| By: | /s/ James A. McNamara | |||
| James A. McNamara | ||||
| President/Chief Executive Officer | ||||
| Goldman Sachs Trust | ||||
| Date: | February 5, 2021 | |||
| By: | /s/ Joseph F. DiMaria | |||
| Joseph F. DiMaria | ||||
| Principal Financial Officer | ||||
| Goldman Sachs Trust | ||||
| Date: | February 5, 2021 | |||
CERTIFICATIONS
(Section 302)
I, James A. McNamara, certify that:
1. I have reviewed this report on Form N-CSR of the Goldman Sachs Trust;
2. Based on my knowledge, this report does not contain any untrue statement of a material fact or omit to state a material fact necessary to make the statements made, in light of the circumstances under which such statements were made, not misleading with respect to the period covered by this report;
3. Based on my knowledge, the financial statements, and other financial information included in this report, fairly present in all material respects the financial condition, results of operations, changes in net assets, and cash flows (if the financial statements are required to include a statement of cash flows) of the registrant as of, and for, the periods presented in this report;
4. The registrant’s other certifying officer(s) and I are responsible for establishing and maintaining disclosure controls and procedures (as defined in Rule 30a-3(c) under the Investment Company Act of 1940) and internal control over financial reporting (as defined in Rule 30a-3(d) under the Investment Company Act of 1940) for the registrant and have:
(a) Designed such disclosure controls and procedures, or caused such disclosure controls and procedures to be designed under our supervision, to ensure that material information relating to the registrant, including its consolidated subsidiaries, is made known to us by others within those entities, particularly during the period in which this report is being prepared;
(b) Designed such internal control over financial reporting, or caused such internal control over financial reporting to be designed under our supervision, to provide reasonable assurance regarding the reliability of financial reporting and the preparation of financial statements for external purposes in accordance with generally accepted accounting principles;
(c) Evaluated the effectiveness of the registrant’s disclosure controls and procedures and presented in this report our conclusions about the effectiveness of the disclosure controls and procedures, as of a date within 90 days prior to the filing date of this report based on such evaluation; and
(d) Disclosed in this report any change in the registrant’s internal control over financial reporting that occurred during the period covered by this report that has materially affected, or is reasonably likely to materially affect, the registrant’s internal control over financial reporting; and
5. The registrant’s other certifying officer(s) and I have disclosed to the registrant’s auditors and the audit committee of the registrant’s board of directors (or persons performing the equivalent functions):
(a) All significant deficiencies and material weaknesses in the design or operation of internal control over financial reporting which are reasonably likely to adversely affect the registrant’s ability to record, process, summarize, and report financial information; and
(b) Any fraud, whether or not material, that involves management or other employees who have a significant role in the registrant’s internal control over financial reporting.
Dated: February 5, 2021
| /s/ James A. McNamara |
| James A. McNamara President/Chief Executive Officer |
CERTIFICATIONS
(Section 302)
I, Joseph F. DiMaria, certify that:
1. I have reviewed this report on Form N-CSR of the Goldman Sachs Trust;
2. Based on my knowledge, this report does not contain any untrue statement of a material fact or omit to state a material fact necessary to make the statements made, in light of the circumstances under which such statements were made, not misleading with respect to the period covered by this report;
3. Based on my knowledge, the financial statements, and other financial information included in this report, fairly present in all material respects the financial condition, results of operations, changes in net assets, and cash flows (if the financial statements are required to include a statement of cash flows) of the registrant as of, and for, the periods presented in this report;
4. The registrant’s other certifying officer(s) and I are responsible for establishing and maintaining disclosure controls and procedures (as defined in Rule 30a-3(c) under the Investment Company Act of 1940) and internal control over financial reporting (as defined in Rule 30a-3(d) under the Investment Company Act of 1940) for the registrant and have:
(a) Designed such disclosure controls and procedures, or caused such disclosure controls and procedures to be designed under our supervision, to ensure that material information relating to the registrant, including its consolidated subsidiaries, is made known to us by others within those entities, particularly during the period in which this report is being prepared;
(b) Designed such internal control over financial reporting, or caused such internal control over financial reporting to be designed under our supervision, to provide reasonable assurance regarding the reliability of financial reporting and the preparation of financial statements for external purposes in accordance with generally accepted accounting principles;
(c) Evaluated the effectiveness of the registrant’s disclosure controls and procedures and presented in this report our conclusions about the effectiveness of the disclosure controls and procedures, as of a date within 90 days prior to the filing date of this report based on such evaluation; and
(d) Disclosed in this report any change in the registrant’s internal control over financial reporting that occurred during the period covered by this report that has materially affected, or is reasonably likely to materially affect, the registrant’s internal control over financial reporting; and
5. The registrant’s other certifying officer(s) and I have disclosed to the registrant’s auditors and the audit committee of the registrant’s board of directors (or persons performing the equivalent functions):
(a) All significant deficiencies and material weaknesses in the design or operation of internal control over financial reporting which are reasonably likely to adversely affect the registrant’s ability to record, process, summarize, and report financial information; and
(b) Any fraud, whether or not material, that involves management or other employees who have a significant role in the registrant’s internal control over financial reporting.
Dated: February 5, 2021
| /s/ Joseph F. DiMaria |
| Joseph F. DiMaria Principal Financial Officer |
EX-99.906CERT
Certification Under Section 906
of the Sarbanes-Oxley Act of 2002
James A. McNamara, President/Chief Executive Officer, and Joseph F. DiMaria, Principal Financial Officer of the Goldman Sachs Trust (the “Registrant”), each certify to the best of his knowledge that:
| 1. | The Registrant’s periodic report on Form N-CSR for the period ended November 30, 2020 (the “Form N-CSR”) fully complies with the requirements of section 15(d) of the Securities Exchange Act of 1934, as amended; and |
| 2. | The information contained in the Form N-CSR fairly presents, in all material respects, the financial condition and results of operations of the Registrant. |
| President/Chief Executive Officer | Principal Financial Officer | |||
| Goldman Sachs Trust | Goldman Sachs Trust | |||
| /s/ James A. McNamara | /s/ Joseph F. DiMaria | |||
| James A. McNamara | Joseph F. DiMaria | |||
| Date: February 5, 2021 | February 5, 2021 | |||
This certification is being furnished to the Securities and Exchange Commission pursuant to Rule 30a-2(b) under the Investment Company Act of 1940, as amended, and 18 U.S.C. § 1350 and is not being filed as part of the Form N-CSR with the Securities and Exchange Commission.
Serious News for Serious Traders! Try StreetInsider.com Premium Free!
You May Also Be Interested In
- Infosys Technologies (INFY) PT Lowered to $19.90 at Goldman Sachs
- Eversource Energy (ES) to Sell 50% Stake in Sunrise Wind to Orsted
Create E-mail Alert Related Categories
SEC FilingsRelated Entities
Goldman SachsSign up for StreetInsider Free!
Receive full access to all new and archived articles, unlimited portfolio tracking, e-mail alerts, custom newswires and RSS feeds - and more!
