

Form 497K GOLDMAN SACHS TRUST
 Tweet
Tweet Share
ShareSummary
Prospectus
February 28, 2021
Goldman Sachs Small Cap Equity Insights Fund
Class
A: GCSAX Class C: GCSCX Institutional: GCSIX Service: GCSSX Investor: GDSTX Class R: GDSRX Class R6: GCSUX
Before
you invest, you may want to review the Goldman Sachs Small Cap Equity Insights Fund (the “Fund”) Prospectus, which contains more information about the Fund and its risks. You can find the Fund’s Prospectus, reports to shareholders
and other information about the Fund online at www.gsamfunds.com/mutualfunds. You can also get this information at no cost by calling 800-621-2550 or by sending an e-mail request to
[email protected]. The Fund’s Prospectus and Statement of Additional Information (“SAI”), both dated February 28, 2021, are incorporated by reference into this Summary Prospectus.
It is our intention that beginning on January 1, 2021, paper
copies of the Fund’s annual and semi-annual shareholder reports will not be sent by mail, unless you specifically request paper copies of the reports from the Fund or from your financial intermediary. Instead, the reports will be made
available on a website, and you will be notified by mail each time a report is posted and provided with a website link to access the report.
If you already elected to receive shareholder reports
electronically, you will not be affected by this change and you need not take any action. At any time, you may elect to receive reports and certain communications from the Fund electronically by calling the applicable toll-free number below or by
contacting your financial intermediary.
You may elect to
receive all future shareholder reports in paper free of charge. If you hold shares of the Fund directly with the Fund’s transfer agent, you can inform the transfer agent that you wish to receive paper copies of reports by calling toll-free
800-621-2550 for Institutional and Class R6 shareholders or 800-526-7384 for all other shareholders. If you hold shares of the Fund through a financial intermediary, please contact your financial intermediary to make this election. Your election to
receive reports in paper will apply to all Goldman Sachs Funds held in your account if you invest through your financial intermediary or all Goldman Sachs Funds held with the Fund’s transfer agent if you invest directly with the transfer
agent.
Shareholder Fees
(fees paid directly from your
investment)
| Class A | Class C | Institutional | Service | Investor | Class R | Class R6 | |
| Maximum Sales Charge (Load) Imposed on Purchases (as a percentage of offering price) | 5.50% | None | None | None | None | None | None |
| Maximum Deferred Sales Charge (Load) (as a percentage of the lower of original purchase price or sale proceeds)1 | None | 1.00% | None | None | None | None | None |
2 Summary
Prospectus — Goldman Sachs Small Cap Equity Insights Fund
Annual Fund Operating Expenses
(expenses that you pay each year as a percentage of the
value of your investment)
| Class A | Class C | Institutional | Service | Investor | Class R | Class R6 | |
| Management Fees | 0.80% | 0.80% | 0.80% | 0.80% | 0.80% | 0.80% | 0.80% |
| Distribution and/or Service (12b-1) Fees | 0.25% | 0.75% | 0.00% | 0.25% | 0.00% | 0.50% | 0.00% |
| Other Expenses | 0.24% | 0.49% | 0.12% | 0.37% | 0.24% | 0.24% | 0.11% |
| Service Fees | 0.00% | 0.25% | 0.00% | 0.00% | 0.00% | 0.00% | 0.00% |
| Shareholder Administration Fees | 0.00% | 0.00% | 0.00% | 0.25% | 0.00% | 0.00% | 0.00% |
| All Other Expenses | 0.24% | 0.24% | 0.12% | 0.12% | 0.24% | 0.24% | 0.11% |
| Total Annual Fund Operating Expenses | 1.29% | 2.04% | 0.92% | 1.42% | 1.04% | 1.54% | 0.91% |
| Expense Limitation2 | (0.08)% | (0.08)% | (0.08)% | (0.08)% | (0.08)% | (0.08)% | (0.08)% |
| Total Annual Fund Operating Expenses After Expense Limitation | 1.21% | 1.96% | 0.84% | 1.34% | 0.96% | 1.46% | 0.83% |
| 1 | A contingent deferred sales charge (“CDSC”) of 1.00% is imposed on Class C Shares redeemed within 12 months of purchase. |
| 2 | The Investment Adviser has agreed to reduce or limit “Other Expenses” (excluding acquired fund fees and expenses, transfer agency fees and expenses, service fees, shareholder administration fees, taxes, interest, brokerage fees, expenses of shareholder meetings, litigation and indemnification, and extraordinary expenses) to 0.004% of the Fund’s average daily net assets through at least February 28, 2022, and prior to such date, the Investment Adviser may not terminate the arrangement without the approval of the Board of Trustees. |
3 Summary
Prospectus — Goldman Sachs Small Cap Equity Insights Fund
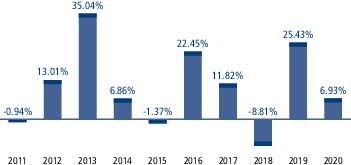
4 Summary
Prospectus — Goldman Sachs Small Cap Equity Insights Fund
| AVERAGE ANNUAL TOTAL RETURN |
| For the period ended December 31, 2020 | 1 Year | 5 Years | 10 Years |
| Class A Shares (Inception 8/15/1997) | |||
| Returns Before Taxes | 0.70% | 9.20% | 9.26% |
| Returns After Taxes on Distributions | 0.66% | 8.78% | 9.02% |
| Returns After Taxes on Distributions and Sale of Fund Shares | 0.45% | 7.15% | 7.55% |
| Russell 2000® Index (reflects no deduction for fees or expenses) | 19.90% | 13.24% | 11.19% |
| Class C Shares (Inception 8/15/1997) | |||
| Returns Before Taxes | 4.78% | 9.61% | 9.07%* |
| Russell 2000® Index (reflects no deduction for fees or expenses) | 19.90% | 13.24% | 11.19% |
| Institutional Shares (Inception 8/15/1997) | |||
| Returns Before Taxes | 6.93% | 10.87% | 10.32% |
| Russell 2000® Index (reflects no deduction for fees or expenses) | 19.90% | 13.24% | 11.19% |
| Service Shares (Inception 8/15/1997) | |||
| Returns Before Taxes | 6.43% | 10.32% | 9.77% |
| Russell 2000® Index (reflects no deduction for fees or expenses) | 19.90% | 13.24% | 11.19% |
| Investor Shares (Inception 11/30/2007) | |||
| Returns Before Taxes | 6.85% | 10.71% | 10.16% |
| Russell 2000® Index (reflects no deduction for fees or expenses) | 19.90% | 13.24% | 11.19% |
| Class R Shares (Inception 11/30/2007) | |||
| Returns | 6.31% | 10.16% | 9.61% |
| Russell 2000® Index (reflects no deduction for fees or expenses) | 19.90% | 13.24% | 11.19% |
| Class R6 Shares (Inception 7/31/2015)** | |||
| Returns Before Taxes | 6.95% | 10.89% | 10.33% |
| Russell 2000® Index (reflects no deduction for fees or expenses) | 19.90% | 13.24% | 11.19% |
| * | Class C Shares automatically convert into Class A Shares eight years after the purchase date. The 10-Year performance for Class C Shares does not reflect the conversion to Class A Shares after the first eight years of performance. |
| ** | Class R6 Shares commenced operations on July 31, 2015. Prior to that date, the performance of Class R6 Shares shown in the table above is that of Institutional Shares. Performance has not been adjusted to reflect the lower expenses of Class R6 Shares. Class R6 Shares would have had higher returns because: (i) Institutional Shares and Class R6 Shares represent interests in the same portfolio of securities; and (ii) Class R6 Shares have lower expenses. |
The after-tax returns are for Class A Shares only.
The after-tax returns for Class C, Institutional, Service, Investor and Class R6 Shares, and returns for Class R Shares (which are offered exclusively to employee benefit plans), will vary. After-tax returns are calculated using the historical
highest individual federal marginal income tax rates and do not reflect the impact of state and local taxes. Actual after-tax returns depend on an investor’s tax situation and may differ from those shown. In addition, the after-tax returns
shown are not relevant to investors who hold Fund Shares through tax-deferred arrangements such as 401(k) plans or individual retirement accounts.
5 Summary
Prospectus — Goldman Sachs Small Cap Equity Insights Fund
6 Summary
Prospectus — Goldman Sachs Small Cap Equity Insights Fund
[This page intentionally left blank]
7 Summary
Prospectus — Goldman Sachs Small Cap Equity Insights Fund
[This page intentionally left blank]
8 Summary
Prospectus — Goldman Sachs Small Cap Equity Insights Fund
DOMINSSUM3-21
Serious News for Serious Traders! Try StreetInsider.com Premium Free!
You May Also Be Interested In
- Infosys Technologies (INFY) PT Lowered to $19.90 at Goldman Sachs
- Eversource Energy (ES) to Sell 50% Stake in Sunrise Wind to Orsted
Create E-mail Alert Related Categories
SEC FilingsRelated Entities
Goldman SachsSign up for StreetInsider Free!
Receive full access to all new and archived articles, unlimited portfolio tracking, e-mail alerts, custom newswires and RSS feeds - and more!
