

Form 10-Q CONOCOPHILLIPS For: Sep 30
 Tweet
Tweet Share
ShareTable of Contents
�
�
UNITED STATES
SECURITIES AND EXCHANGE COMMISSION
Washington, D.C. 20549
�
�
FORM 10-Q
�
�
(Mark One)
�
| x | QUARTERLY REPORT PURSUANT TO SECTION 13 OR 15(d) OF THE SECURITIES EXCHANGE ACT OF 1934 |
For the quarterly period ended September�30, 2014
or
�
| � | TRANSITION REPORT PURSUANT TO SECTION 13 OR 15(d) OF THE SECURITIES EXCHANGE ACT OF 1934 |
For the transition period from ������������ to�������������
Commission file number:�001-32395
�
�
ConocoPhillips
(Exact name of registrant as specified in its charter)
�
�
�
| Delaware | � | 01-0562944 |
| (State or other jurisdiction of incorporation or organization) |
� | (I.R.S. Employer Identification No.) |
�
| 600 North Dairy Ashford, Houston, TX 77079 | ||
| (Address of principal executive offices)������������(Zip Code) | ||
281-293-1000
(Registrant�s telephone number, including area code)
�
�
Indicate by check mark whether the registrant (1)�has filed all reports required to be filed by Section�13 or 15(d) of the Securities Exchange Act of 1934 during the preceding 12 months (or for such shorter period that the registrant was required to file such reports), and (2)�has been subject to such filing requirements for the past 90 days.����Yes��x����No���
Indicate by check mark whether the registrant has submitted electronically and posted on its corporate Web site, if any, every Interactive Data File required to be submitted and posted pursuant to Rule 405 of Regulation S-T during the preceding 12 months (or for such shorter period that the registrant was required to submit and post such files).����Yes��x����No���
Indicate by check mark whether the registrant is a large accelerated filer, an accelerated filer, a non-accelerated filer, or a smaller reporting company. See the definitions of �large accelerated filer,� �accelerated filer� and �smaller reporting company� in Rule 12b-2 of the Exchange Act.
�
| Large�accelerated�filer | � | x | �� | Accelerated�filer | � | � |
| Non-accelerated filer | � | � | �� | Smaller�reporting�company | � | � |
Indicate by check mark whether the registrant is a shell company (as defined in Rule 12b-2 of the Exchange Act).����Yes�������No��x
The registrant had 1,230,912,872 shares of common stock, $.01 par value, outstanding at September�30, 2014.
�
�
�
Table of Contents
TABLE OF CONTENTS
�
| � | �� | Page | � | |
| �� | ||||
| �� | ||||
| �� | � | 1 | �� | |
| �� | � | 2 | �� | |
| �� | � | 3 | �� | |
| �� | � | 4 | �� | |
| �� | � | 5 | �� | |
| Supplementary Information�Condensed Consolidating Financial Information |
�� | � | 25 | �� |
| Item�2. Management�s Discussion and Analysis of Financial Condition and Results of Operations |
�� | � | 30 | �� |
| Item�3. Quantitative and Qualitative Disclosures About Market Risk |
�� | � | 51 | �� |
| �� | � | 51 | �� | |
| �� | ||||
| �� | � | 52 | �� | |
| �� | � | 52 | �� | |
| �� | � | 53 | �� | |
| �� | � | 54 | �� | |
Table of Contents
�
| Consolidated Income Statement | �� | � | ConocoPhillips | �� |
�
| � | �� | Millions of Dollars | � | |||||||||||||
| � | �� | Three Months Ended September�30 |
� | � | Nine Months Ended September�30 |
� | ||||||||||
| � | �� | 2014 | � | � | 2013 | � | � | 2014 | � | � | 2013 | � | ||||
| �� | � |
� |
� | � | � |
� |
� | |||||||||
| Revenues and Other Income |
�� | � | � | � | ||||||||||||
| Sales and other operating revenues |
�� | $ | 12,080 | �� | � | � | 13,643 | �� | � | � | 41,316 | �� | � | � | 41,159 | �� |
| Equity in earnings of affiliates |
�� | � | 764 | �� | � | � | 709 | �� | � | � | 2,008 | �� | � | � | 1,565 | �� |
| Gain on dispositions |
�� | � | 4 | �� | � | � | 1,069 | �� | � | � | 20 | �� | � | � | 1,222 | �� |
| Other income |
�� | � | 69 | �� | � | � | 49 | �� | � | � | 322 | �� | � | � | 317 | �� |
| � |
� | |||||||||||||||
| Total Revenues and Other Income |
�� | � | 12,917 | �� | � | � | 15,470 | �� | � | � | 43,666 | �� | � | � | 44,263 | �� |
| � |
� | |||||||||||||||
| Costs and Expenses |
�� | � | � | � | ||||||||||||
| Purchased commodities |
�� | � | 4,703 | �� | � | � | 5,708 | �� | � | � | 17,325 | �� | � | � | 17,063 | �� |
| Production and operating expenses |
�� | � | 2,041 | �� | � | � | 1,962 | �� | � | � | 5,966 | �� | � | � | 5,321 | �� |
| Selling, general and administrative expenses |
�� | � | 203 | �� | � | � | 249 | �� | � | � | 603 | �� | � | � | 607 | �� |
| Exploration expenses |
�� | � | 459 | �� | � | � | 313 | �� | � | � | 1,272 | �� | � | � | 911 | �� |
| Depreciation, depletion and amortization |
�� | � | 2,096 | �� | � | � | 1,902 | �� | � | � | 6,058 | �� | � | � | 5,541 | �� |
| Impairments |
�� | � | 108 | �� | � | � | 1 | �� | � | � | 126 | �� | � | � | 31 | �� |
| Taxes other than income taxes |
�� | � | 493 | �� | � | � | 664 | �� | � | � | 1,756 | �� | � | � | 2,198 | �� |
| Accretion on discounted liabilities |
�� | � | 120 | �� | � | � | 106 | �� | � | � | 357 | �� | � | � | 317 | �� |
| Interest and debt expense |
�� | � | 149 | �� | � | � | 151 | �� | � | � | 475 | �� | � | � | 420 | �� |
| Foreign currency transaction (gains) losses |
�� | � | (8 | )� | � | � | 9 | �� | � | � | 17 | �� | � | � | (34 | )� |
| � |
� | |||||||||||||||
| Total Costs and Expenses |
�� | � | 10,364 | �� | � | � | 11,065 | �� | � | � | 33,955 | �� | � | � | 32,375 | �� |
| � |
� | |||||||||||||||
| Income from continuing operations before income taxes |
�� | � | 2,553 | �� | � | � | 4,405 | �� | � | � | 9,711 | �� | � | � | 11,888 | �� |
| Provision for income taxes |
�� | � | 904 | �� | � | � | 1,966 | �� | � | � | 3,880 | �� | � | � | 5,359 | �� |
| � |
� | |||||||||||||||
| Income From Continuing Operations |
�� | � | 1,649 | �� | � | � | 2,439 | �� | � | � | 5,831 | �� | � | � | 6,529 | �� |
| Income from discontinued operations* |
�� | � | 1,078 | �� | � | � | 57 | �� | � | � | 1,131 | �� | � | � | 183 | �� |
| � |
� | |||||||||||||||
| Net income |
�� | � | 2,727 | �� | � | � | 2,496 | �� | � | � | 6,962 | �� | � | � | 6,712 | �� |
| Less: net income attributable to noncontrolling interests |
�� | � | (23 | )� | � | � | (16 | )� | � | � | (54 | )� | � | � | (43 | )� |
| � |
� | |||||||||||||||
| Net Income Attributable to ConocoPhillips |
�� | $ | 2,704 | �� | � | � | 2,480 | �� | � | � | 6,908 | �� | � | � | 6,669 | �� |
| � |
� | |||||||||||||||
| Amounts Attributable to ConocoPhillips Common Shareholders: |
�� | � | � | � | ||||||||||||
| Income from continuing operations |
�� | $ | 1,626 | �� | � | � | 2,423 | �� | � | � | 5,777 | �� | � | � | 6,486 | �� |
| Income from discontinued operations |
�� | � | 1,078 | �� | � | � | 57 | �� | � | � | 1,131 | �� | � | � | 183 | �� |
| � |
� | |||||||||||||||
| Net income |
�� | $ | 2,704 | �� | � | � | 2,480 | �� | � | � | 6,908 | �� | � | � | 6,669 | �� |
| � |
� | |||||||||||||||
| Net Income Attributable to ConocoPhillips Per Share of Common Stock (dollars) |
�� | � | � | � | ||||||||||||
| Basic |
�� | � | � | � | ||||||||||||
| Continuing operations |
�� | $ | 1.31 | �� | � | � | 1.96 | �� | � | � | 4.67 | �� | � | � | 5.26 | �� |
| Discontinued operations |
�� | � | 0.87 | �� | � | � | 0.05 | �� | � | � | 0.91 | �� | � | � | 0.15 | �� |
| � |
� | |||||||||||||||
| Net Income Attributable to ConocoPhillips Per Share of Common Stock |
�� | $ | 2.18 | �� | � | � | 2.01 | �� | � | � | 5.58 | �� | � | � | 5.41 | �� |
| � |
� | |||||||||||||||
| Diluted |
�� | � | � | � | ||||||||||||
| Continuing operations |
�� | $ | 1.31 | �� | � | � | 1.95 | �� | � | � | 4.63 | �� | � | � | 5.23 | �� |
| Discontinued operations |
�� | � | 0.86 | �� | � | � | 0.05 | �� | � | � | 0.91 | �� | � | � | 0.15 | �� |
| � |
� | |||||||||||||||
| Net Income Attributable to ConocoPhillips Per Share of Common Stock |
�� | $ | 2.17 | �� | � | � | 2.00 | �� | � | � | 5.54 | �� | � | � | 5.38 | �� |
| � |
� | |||||||||||||||
| Dividends Paid Per Share of Common Stock (dollars) |
�� | $ | 0.73 | �� | � | � | 0.69 | �� | � | � | 2.11 | �� | � | � | 2.01 | �� |
| � |
� | |||||||||||||||
| Average Common Shares Outstanding (in thousands) |
�� | � | � | � | ||||||||||||
| Basic |
�� | � | 1,238,234 | �� | � | � | 1,231,054 | �� | � | � | 1,236,431 | �� | � | � | 1,230,027 | �� |
| Diluted |
�� | � | 1,247,436 | �� | � | � | 1,240,365 | �� | � | � | 1,246,788 | �� | � | � | 1,238,943 | �� |
| � |
� | |||||||||||||||
| *Net of provision (benefit) for income taxes on discontinued operations of: | �� | $ | (6 | )� | � | � | 136 | �� | � | � | 16 | �� | � | � | 215 | �� |
See Notes to Consolidated Financial Statements.
�
1
Table of Contents
| Consolidated Statement of Comprehensive Income | �� | � | ConocoPhillips | �� |
�
| � | �� | Millions of Dollars | � | |||||||||||||
| � | �� | Three�Months�Ended September�30 |
� | � | Nine�Months�Ended September�30 |
� | ||||||||||
| � | �� | 2014 | � | � | 2013 | � | � | 2014 | � | � | 2013 | � | ||||
| �� | � |
� |
� | � | � |
� |
� | |||||||||
| Net Income |
�� | $ | 2,727 | �� | � | � | 2,496 | �� | � | � | 6,962 | �� | � | � | 6,712 | �� |
| Other comprehensive income (loss) |
�� | � | � | � | ||||||||||||
| Defined benefit plans |
�� | � | � | � | ||||||||||||
| Reclassification adjustment for amortization of prior service credit included in net income |
�� | � | (2 | )� | � | � | (1 | )� | � | � | (5 | )� | � | � | (4 | )� |
| Net actuarial gain arising during the period |
�� | � | � | �� | � | � | 301 | �� | � | � | � | �� | � | � | 302 | �� |
| Reclassification adjustment for amortization of net actuarial losses included in net income |
�� | � | 32 | �� | � | � | 106 | �� | � | � | 98 | �� | � | � | 220 | �� |
| Nonsponsored plans* |
�� | � | � | �� | � | � | � | �� | � | � | 5 | �� | � | � | 1 | �� |
| Income taxes on defined benefit plans |
�� | � | (11 | )� | � | � | (155 | )� | � | � | (34 | )� | � | � | (197 | )� |
| � |
� | |||||||||||||||
| Defined benefit plans, net of tax |
�� | � | 19 | �� | � | � | 251 | �� | � | � | 64 | �� | � | � | 322 | �� |
| � |
� | |||||||||||||||
| Foreign currency translation adjustments |
�� | � | (1,947 | )� | � | � | 623 | �� | � | � | (1,501 | )� | � | � | (1,705 | )� |
| Reclassification adjustment for loss included in net income |
�� | � | � | �� | � | � | � | �� | � | � | � | �� | � | � | (4 | )� |
| Income taxes on foreign currency translation adjustments |
�� | � | 15 | �� | � | � | (2 | )� | � | � | 20 | �� | � | � | 12 | �� |
| � |
� | |||||||||||||||
| Foreign currency translation adjustments, net of tax |
�� | � | (1,932 | )� | � | � | 621 | �� | � | � | (1,481 | )� | � | � | (1,697 | )� |
| � |
� | |||||||||||||||
| Other Comprehensive Income (Loss), Net of Tax |
�� | � | (1,913 | )� | � | � | 872 | �� | � | � | (1,417 | )� | � | � | (1,375 | )� |
| � |
� | |||||||||||||||
| Comprehensive Income |
�� | � | 814 | �� | � | � | 3,368 | �� | � | � | 5,545 | �� | � | � | 5,337 | �� |
| Less: comprehensive income attributable to noncontrolling interests |
�� | � | (23 | )� | � | � | (16 | )� | � | � | (54 | )� | � | � | (43 | )� |
| � |
� | |||||||||||||||
| Comprehensive Income Attributable to ConocoPhillips |
�� | $ | 791 | �� | � | � | 3,352 | �� | � | � | 5,491 | �� | � | � | 5,294 | �� |
| � |
� | |||||||||||||||
*Plans for which ConocoPhillips is not the primary obligor�primarily those administered by equity affiliates.
See Notes to Consolidated Financial Statements.
�
2
Table of Contents
| Consolidated Balance Sheet | �� | � | ConocoPhillips | �� |
�
| � | �� | Millions of Dollars | � | |||||
| � | �� | September�30 | � | � | December�31 | � | ||
| � | �� | 2014 | � | � | 2013 | � | ||
| �� | � |
� |
� | |||||
| Assets |
�� | � | ||||||
| Cash and cash equivalents |
�� | $ | 5,408 | �� | � | � | 6,246 | �� |
| Short-term investments* |
�� | � | 374 | �� | � | � | 272 | �� |
| Accounts and notes receivable (net of allowance of $5 million in 2014 |
�� | � | 7,255 | �� | � | � | 8,273 | �� |
| Accounts and notes receivable�related parties |
�� | � | 198 | �� | � | � | 214 | �� |
| Inventories |
�� | � | 1,330 | �� | � | � | 1,194 | �� |
| Prepaid expenses and other current assets |
�� | � | 1,688 | �� | � | � | 2,824 | �� |
| � |
� | |||||||
| Total Current Assets |
�� | � | 16,253 | �� | � | � | 19,023 | �� |
| Investments and long-term receivables |
�� | � | 24,615 | �� | � | � | 23,907 | �� |
| Loans and advances�related parties |
�� | � | 1,202 | �� | � | � | 1,357 | �� |
| Net properties, plants and equipment (net of accumulated depreciation, depletion and amortization of $70,117 million in 2014 and $65,321 million in 2013) |
�� | � | 75,790 | �� | � | � | 72,827 | �� |
| Other assets |
�� | � | 1,126 | �� | � | � | 943 | �� |
| � |
� | |||||||
| Total Assets |
�� | $ | 118,986 | �� | � | � | 118,057 | �� |
| � |
� | |||||||
| Liabilities |
�� | � | ||||||
| Accounts payable |
�� | $ | 8,647 | �� | � | � | 9,250 | �� |
| Accounts payable�related parties |
�� | � | 45 | �� | � | � | 64 | �� |
| Short-term debt |
�� | � | 1,688 | �� | � | � | 589 | �� |
| Accrued income and other taxes |
�� | � | 1,655 | �� | � | � | 2,713 | �� |
| Employee benefit obligations |
�� | � | 713 | �� | � | � | 842 | �� |
| Other accruals |
�� | � | 1,393 | �� | � | � | 1,671 | �� |
| � |
� | |||||||
| Total Current Liabilities |
�� | � | 14,141 | �� | � | � | 15,129 | �� |
| Long-term debt |
�� | � | 19,499 | �� | � | � | 21,073 | �� |
| Asset retirement obligations and accrued environmental costs |
�� | � | 9,803 | �� | � | � | 9,883 | �� |
| Deferred income taxes |
�� | � | 16,084 | �� | � | � | 15,220 | �� |
| Employee benefit obligations |
�� | � | 2,219 | �� | � | � | 2,459 | �� |
| Other liabilities and deferred credits |
�� | � | 1,579 | �� | � | � | 1,801 | �� |
| � |
� | |||||||
| Total Liabilities |
�� | � | 63,325 | �� | � | � | 65,565 | �� |
| � |
� | |||||||
| Equity |
�� | � | ||||||
| Common stock (2,500,000,000 shares authorized at $.01 par value) |
�� | � | ||||||
| Issued (2014�1,773,143,545 shares; 2013�1,768,169,906 shares) |
�� | � | ||||||
| Par value |
�� | � | 18 | �� | � | � | 18 | �� |
| Capital in excess of par |
�� | � | 46,000 | �� | � | � | 45,690 | �� |
| Treasury stock (at cost: 2014�542,230,673 shares; 2013�542,230,673 shares) |
�� | � | (36,780 | )� | � | � | (36,780 | )� |
| Accumulated other comprehensive income |
�� | � | 585 | �� | � | � | 2,002 | �� |
| Retained earnings |
�� | � | 45,451 | �� | � | � | 41,160 | �� |
| � |
� | |||||||
| Total Common Stockholders� Equity |
�� | � | 55,274 | �� | � | � | 52,090 | �� |
| Noncontrolling interests |
�� | � | 387 | �� | � | � | 402 | �� |
| � |
� | |||||||
| Total Equity |
�� | � | 55,661 | �� | � | � | 52,492 | �� |
| � |
� | |||||||
| Total Liabilities and Equity |
�� | $ | 118,986 | �� | � | � | 118,057 | �� |
| � |
� | |||||||
| *Includes marketable securities of: | �� | $ | � | �� | � | � | 135 | �� |
See Notes to Consolidated Financial Statements.
�
�
3
Table of Contents
| Consolidated Statement of Cash Flows | �� | � | ConocoPhillips | �� |
�
| � | �� | Millions�of�Dollars | � | |||||
| � | �� | Nine�Months�Ended September�30 |
� | |||||
| � | �� | 2014 | � | � | 2013 | � | ||
| �� | � |
� |
� | |||||
| Cash Flows From Operating Activities |
�� | � | ||||||
| Net income |
�� | $ | 6,962 | �� | � | � | 6,712 | �� |
| Adjustments to reconcile net income to net cash provided by operating activities |
�� | � | ||||||
| Depreciation, depletion and amortization |
�� | � | 6,058 | �� | � | � | 5,541 | �� |
| Impairments |
�� | � | 126 | �� | � | � | 31 | �� |
| Dry hole costs and leasehold impairments |
�� | � | 668 | �� | � | � | 345 | �� |
| Accretion on discounted liabilities |
�� | � | 357 | �� | � | � | 317 | �� |
| Deferred taxes |
�� | � | 1,024 | �� | � | � | 1,142 | �� |
| Undistributed equity earnings |
�� | � | 334 | �� | � | � | (585 | )� |
| Gain on dispositions |
�� | � | (20 | )� | � | � | (1,222 | )� |
| Income from discontinued operations |
�� | � | (1,131 | )� | � | � | (183 | )� |
| Other |
�� | � | (536 | )� | � | � | (280 | )� |
| Working capital adjustments |
�� | � | ||||||
| Decrease in accounts and notes receivable |
�� | � | 634 | �� | � | � | 822 | �� |
| Increase in inventories |
�� | � | (162 | )� | � | � | (301 | )� |
| Increase in prepaid expenses and other current assets |
�� | � | (189 | )� | � | � | (172 | )� |
| Increase (decrease) in accounts payable |
�� | � | (187 | )� | � | � | 324 | �� |
| Increase (decrease) in taxes and other accruals |
�� | � | 57 | �� | � | � | (550 | )� |
| � |
� | |||||||
| Net cash provided by continuing operating activities |
�� | � | 13,995 | �� | � | � | 11,941 | �� |
| Net cash provided by discontinued operations |
�� | � | 143 | �� | � | � | 235 | �� |
| � |
� | |||||||
| Net Cash Provided by Operating Activities |
�� | � | 14,138 | �� | � | � | 12,176 | �� |
| � |
� | |||||||
| Cash Flows From Investing Activities |
�� | � | ||||||
| Capital expenditures and investments |
�� | � | (12,729 | )� | � | � | (11,281 | )� |
| Proceeds from asset dispositions |
�� | � | 1,434 | �� | � | � | 3,175 | �� |
| Net sales (purchases) of short-term investments |
�� | � | (109 | )� | � | � | 1 | �� |
| Collection of advances/loans�related parties |
�� | � | 143 | �� | � | � | 130 | �� |
| Other |
�� | � | (454 | )� | � | � | (51 | )� |
| � |
� | |||||||
| Net cash used in continuing investing activities |
�� | � | (11,715 | )� | � | � | (8,026 | )� |
| Net cash used in discontinued operations |
�� | � | (59 | )� | � | � | (540 | )� |
| � |
� | |||||||
| Net Cash Used in Investing Activities |
�� | � | (11,774 | )� | � | � | (8,566 | )� |
| � |
� | |||||||
| Cash Flows From Financing Activities |
�� | � | ||||||
| Repayment of debt |
�� | � | (505 | )� | � | � | (946 | )� |
| Change in restricted cash |
�� | � | � | �� | � | � | 748 | �� |
| Issuance of company common stock |
�� | � | 27 | �� | � | � | 12 | �� |
| Dividends paid |
�� | � | (2,618 | )� | � | � | (2,481 | )� |
| Other |
�� | � | (20 | )� | � | � | (593 | )� |
| � |
� | |||||||
| Net cash used in continuing financing activities |
�� | � | (3,116 | )� | � | � | (3,260 | )� |
| Net cash used in discontinued operations |
�� | � | � | �� | � | � | � | �� |
| � |
� | |||||||
| Net Cash Used in Financing Activities |
�� | � | (3,116 | )� | � | � | (3,260 | )� |
| � |
� | |||||||
| Effect of Exchange Rate Changes on Cash and Cash Equivalents |
�� | � | (86 | )� | � | � | (85 | )� |
| � |
� | |||||||
| Net Change in Cash and Cash Equivalents |
�� | � | (838 | )� | � | � | 265 | �� |
| Cash and cash equivalents at beginning of period |
�� | � | 6,246 | �� | � | � | 3,618 | �� |
| � |
� | |||||||
| Cash and Cash Equivalents at End of Period |
�� | $ | 5,408 | �� | � | � | 3,883 | �� |
| � |
� | |||||||
See Notes to Consolidated Financial Statements.
�
4
Table of Contents
| Notes to Consolidated Financial Statements | � | ConocoPhillips |
Note 1�Basis of Presentation
The interim-period financial information presented in the financial statements included in this report is unaudited and, in the opinion of management, includes all known accruals and adjustments necessary for a fair presentation of the consolidated financial position of ConocoPhillips and its results of operations and cash flows for such periods. All such adjustments are of a normal and recurring nature unless otherwise disclosed. Certain notes and other information have been condensed or omitted from the interim financial statements included in this report. Therefore, these financial statements should be read in conjunction with the consolidated financial statements and notes included in our 2013 Annual Report on Form 10-K.
Effective April�1, 2014, the Other International segment was restructured to focus on enhancing our capability to operate in emerging and new country business units. As a result, we moved the Latin America and Poland businesses from the historically presented Lower 48 and Latin America segment and the Europe segment to the Other International segment. Certain financial information has been revised for all prior periods presented to reflect the change in the composition of our operating segments. For additional information, see Note 18�Segment Disclosures and Related Information.
The results of operations for our interest in the North Caspian Sea Production Sharing Agreement (Kashagan) and our Algeria and Nigeria businesses have been classified as discontinued operations for all periods presented. See Note 2�Discontinued Operations, for additional information. Unless indicated otherwise, the information in the Notes to Consolidated Financial Statements relates to our continuing operations.
Note 2�Discontinued Operations
As part of our asset disposition program, we agreed to sell our interest in Kashagan and our Algeria and Nigeria businesses (collectively, the �Disposition Group�). The Disposition Group was previously part of the Other International operating segment. We completed the sales of Kashagan and our Algeria business in the fourth quarter of 2013 and the sale of our Nigeria business in the third quarter of 2014.
On December�20, 2012, we entered into agreements with affiliates of Oando PLC to sell our Nigeria business. The transaction originally included our upstream affiliates and Phillips (Brass) Limited, which owned a 17�percent interest in the Brass LNG Project. On July�30, 2014, we completed the sale of the upstream affiliates for $1,359 million, inclusive of $550 million deposits previously received. The deposits had been included in the �Other accruals� line on our consolidated balance sheet and in the �Other� line of cash flows from investing activities on our consolidated statement of cash flows. The deposits received included $435�million in 2012, $15 million in 2013, and $100 million in 2014. At closing we also received a $33�million short-term promissory note. We recognized a before-tax gain of $1,052 million, which is included in the �Income from discontinued operations� line on the consolidated income statement. At the time of disposition, the net carrying value of the upstream assets was $307 million, which included $233 million of other current assets, $1,211 million of properties, plants and equipment (PP&E), $298 million of other current liabilities, $14 million of asset retirement obligations (ARO), and $825 million of deferred taxes.
In the first quarter of 2014, we and Oando agreed to terminate the sales agreement for Phillips (Brass) Limited. In July 2014 we transferred our interest in the Brass LNG Project to the remaining shareholders in Brass LNG Limited. The financial impact of the transfer was recorded in the second quarter of 2014 and did not have a material effect on our consolidated financial statements.
�
5
Table of Contents
The carrying amounts of the major classes of assets and liabilities associated with the Disposition Group as of December�31, 2013, were as follows:
�
| � | �� | Millions�of�Dollars | � | |
| Assets |
�� | |||
| Accounts and notes receivable |
�� | $ | 376 | �� |
| Inventories |
�� | � | 9 | �� |
| Prepaid expenses and other current assets |
�� | � | 72 | �� |
| � |
� | |||
| Total current assets of discontinued operations |
�� | � | 457 | �� |
| Investments and long-term receivables |
�� | � | 60 | �� |
| Loans and advances�related parties |
�� | � | 7 | �� |
| Net properties, plants and equipment |
�� | � | 1,154 | �� |
| Other assets |
�� | � | 1 | �� |
| � |
� | |||
| Total assets of discontinued operations |
�� | $ | 1,679 | �� |
| � |
� | |||
| Liabilities |
�� | |||
| Accounts payable |
�� | $ | 419 | �� |
| Accrued income and other taxes |
�� | � | 72 | �� |
| � |
� | |||
| Total current liabilities of discontinued operations |
�� | � | 491 | �� |
| Asset retirement obligations and accrued environmental costs |
�� | � | 14 | �� |
| Deferred income taxes |
�� | � | 765 | �� |
| � |
� | |||
| Total liabilities of discontinued operations |
�� | $ | 1,270 | �� |
| � |
� | |||
Sales and other operating revenues and income from discontinued operations related to the Disposition Group were as follows:
�
| � | �� | Millions of Dollars | � | |||||||||||||
| � | �� | Three�Months�Ended September�30 |
� | �� | Nine�Months�Ended September�30 |
� | ||||||||||
| � | �� | 2014 | � | � | 2013 | � | �� | 2014 | � | �� | 2013 | � | ||||
| �� | � |
� |
� | �� | � |
� |
� | |||||||||
| Sales and other operating revenues from discontinued operations |
�� | $ | 161 | �� | � | � | 353 | �� | �� | � | 480 | �� | �� | � | 892 | �� |
| � |
� | |||||||||||||||
| Income from discontinued operations before-tax |
�� | $ | 1,072 | �� | � | � | 193 | �� | �� | � | 1,147 | �� | �� | � | 398 | �� |
| Income tax expense (benefit) |
�� | � | (6 | )� | � | � | 136 | �� | �� | � | 16 | �� | �� | � | 215 | �� |
| � |
� | |||||||||||||||
| Income from discontinued operations |
�� | $ | 1,078 | �� | � | � | 57 | �� | �� | � | 1,131 | �� | �� | � | 183 | �� |
| � |
� | |||||||||||||||
Note 3�Variable Interest Entities (VIEs)
We hold variable interests in VIEs that have not been consolidated because we are not considered the primary beneficiary. Information on our significant VIEs follows:
Freeport LNG Development, L.P. (Freeport LNG)
We have an agreement with Freeport LNG to participate in a liquefied natural gas (LNG) receiving terminal in Quintana, Texas. We have no ownership in Freeport LNG; however, we own a 50 percent interest in Freeport LNG GP, Inc. (Freeport GP), which serves as the general partner managing the venture. We entered into a credit agreement with Freeport LNG, whereby we agreed to provide loan financing for the construction of the terminal. We also entered into a long-term agreement with Freeport LNG to use 0.9 billion cubic feet per day of regasification capacity, which expires in 2033. When the terminal became operational in June 2008, we began making payments under the terminal use agreement. At September�30, 2014, the prepaid balance of the terminal use agreement was $318 million, which is primarily reflected in the �Other assets� line on our consolidated
�
6
Table of Contents
balance sheet. Freeport LNG began making loan repayments in September 2008, and the loan balance outstanding was $460 million at September�30, 2014, and $506�million at December�31, 2013.
In July 2013 we reached an agreement with Freeport LNG to terminate our long-term agreement at the Freeport LNG Terminal, subject to Freeport LNG obtaining regulatory approval and project financing for an LNG liquefaction and export facility in Texas, in which we are not a participant. In July 2014 Freeport LNG received conditional approval from the Federal Energy Regulatory Commission (FERC), and in October 2014, Freeport LNG received FERC�s permission to construct the facility. Upon satisfaction of their project financing conditions, currently expected to occur in the fourth quarter of 2014, we will pay Freeport LNG a termination fee of approximately $520 million. Freeport LNG will repay the outstanding ConocoPhillips loan used by Freeport LNG to partially fund the original construction of the terminal. These transactions, plus miscellaneous items, will result in a one-time net cash outflow of approximately $50 million for us. When the agreement becomes effective, we expect to recognize an after-tax charge to earnings of approximately $520�million. At that time, our terminal regasification capacity will be reduced from 0.9 billion cubic feet per day to 0.4 billion cubic feet per day, until July�1, 2016, at which time it will be reduced to zero.
Freeport LNG is a VIE because Freeport GP holds no equity in Freeport LNG, and the limited partners of Freeport LNG do not have any substantive decision making ability. Since we do not have the unilateral power to direct the key activities which most significantly impact its economic performance, we are not the primary beneficiary of Freeport LNG. These key activities primarily involve or relate to operating and maintaining the terminal. We also performed an analysis of the expected losses and determined we are not the primary beneficiary. This expected loss analysis took into account that the credit support arrangement requires Freeport LNG to maintain sufficient commercial insurance to mitigate any loan losses. The loan to Freeport LNG is accounted for as a financial asset, and our investment in Freeport GP is accounted for as an equity method investment.
Australia Pacific LNG Pty Ltd (APLNG)
APLNG is considered a VIE, as it has entered into certain contractual arrangements that provide it with additional forms of subordinated financial support. We are not the primary beneficiary of APLNG because we share with Origin Energy and China Petrochemical Corporation (Sinopec) the power to direct the key activities of APLNG that most significantly impact its economic performance, which involve activities related to the production and commercialization of coalbed methane, as well as LNG processing and export marketing. As a result, we do not consolidate APLNG, and it is accounted for as an equity method investment.
As of September�30, 2014, we have not provided any financial support to APLNG other than amounts previously contractually required. Unless we elect otherwise, we have no requirement to provide liquidity or purchase the assets of APLNG. See Note 5�Investments, Loans and Long-Term Receivables, and Note 10�Guarantees, for additional information.
Note 4�Inventories
Inventories consisted of the following:
�
| � | �� | Millions of Dollars | � | |||||
| � | �� | September�30 2014 |
� | �� | December�31 2013 |
� | ||
| �� | � |
� |
� | |||||
| Crude oil and natural gas |
�� | $ | 536 | �� | �� | � | 452 | �� |
| Materials, supplies and other |
�� | � | 794 | �� | �� | � | 742 | �� |
| � |
� | |||||||
| �� | $ | 1,330 | �� | �� | � | 1,194 | �� | |
| � |
� | |||||||
Inventories valued on the last-in, first-out (LIFO) basis totaled $430 million and $343 million at September�30, 2014 and December�31, 2013, respectively. The estimated excess of current replacement cost over LIFO cost
�
7
Table of Contents
of inventories was approximately $80 million and $160 million at September�30, 2014 and December�31, 2013, respectively.
Note 5�Investments, Loans and Long-Term Receivables
APLNG
APLNG�s $8.5 billion project finance facility consists of financing agreements executed by APLNG with the Export-Import Bank of the United States for approximately $2.9 billion, the Export-Import Bank of China for approximately $2.7 billion, and a syndicate of Australian and international commercial banks for approximately $2.9 billion. At September�30, 2014, $8.0 billion had been drawn from the facility. In connection with the execution of the project financing, we provided a completion guarantee for our pro-rata share of the project finance facility until the project achieves financial completion. See Note 10�Guarantees, for additional information.
APLNG is considered a VIE, as it has entered into certain contractual arrangements that provide it with additional forms of subordinated financial support. See Note 3�Variable Interest Entities (VIEs), for additional information.
At September�30, 2014, the book value of our equity method investment in APLNG was $12,299 million, which included $829 million of cumulative translation effects due to strengthening of the Australian dollar relative to the U.S. dollar over time, and is included in the �Investments and long-term receivables� line on our consolidated balance sheet.
FCCL
In the first quarter of 2014, we received a $1.3 billion distribution from FCCL Partnership, our 50 percent owned business venture with Cenovus Energy Inc., which is included in the �Undistributed equity earnings� line on our consolidated statement of cash flows.
Loans and Long-Term Receivables
As part of our normal ongoing business operations and consistent with industry practice, we enter into numerous agreements with other parties to pursue business opportunities. Included in such activity are loans made to certain affiliated and non-affiliated companies. Significant loans to affiliated companies at September�30, 2014, included the following:
�
| � | � | � | $460 million in loan financing to Freeport LNG. See Note 3�Variable Interest Entities (VIEs), for additional information. |
�
| � | � | � | $909 million in project financing to Qatar Liquefied Gas Company Limited (3)�(QG3). |
The long-term portion of these loans is included in the �Loans and advances�related parties� line on our consolidated balance sheet, while the short-term portion is in �Accounts and notes receivable�related parties.�
Note 6�Suspended Wells and Wells in Progress
The capitalized cost of suspended wells at September�30, 2014, was $1,285 million, an increase of $291�million from $994 million at year-end 2013. No suspended wells were charged to dry hole expense during the first nine months of 2014 relating to exploratory well costs capitalized for a period greater than one year as of December�31, 2013.
In November 2014 we will plug and abandon the Kamoxi-1 exploration well, located in Block 36 offshore Angola.�The cost of the well, which totaled $183 million pre-tax at September�30, 2014, will be expensed as a dry hole in the fourth quarter of 2014.
�
8
Table of Contents
Note 7�Impairments
During the three- and nine-month periods ended September�30, 2014 and 2013, we recognized before-tax impairment charges within the following segments:
�
| � | �� | Millions of Dollars | � | |||||||||||||
| � | �� | Three�Months�Ended September�30 |
� | �� | Nine�Months�Ended September�30 |
� | ||||||||||
| � | �� | 2014 | � | �� | 2013 | � | �� | 2014 | � | �� | 2013 | � | ||||
| �� | � |
� |
� | �� | � |
� |
� | |||||||||
| Alaska |
�� | $ | 3 | �� | �� | � | � | �� | �� | � | 3 | �� | �� | � | � | �� |
| Lower 48 |
�� | � | 102 | �� | �� | � | � | �� | �� | � | 119 | �� | �� | � | � | �� |
| Europe |
�� | � | 1 | �� | �� | � | � | �� | �� | � | 1 | �� | �� | � | 28 | �� |
| Asia Pacific and Middle East |
�� | � | � | �� | �� | � | 1 | �� | �� | � | � | �� | �� | � | 3 | �� |
| Corporate and Other |
�� | � | 2 | �� | �� | � | � | �� | �� | � | 3 | �� | �� | � | � | �� |
| � |
� | |||||||||||||||
| �� | $ | 108 | �� | �� | � | 1 | �� | �� | � | 126 | �� | �� | � | 31 | �� | |
| � |
� | |||||||||||||||
The three- and nine-month periods of 2014 included an impairment in our Lower 48 segment of $102 million, primarily as a result of reduced volume forecasts. We also recorded a $138 million impairment for the undeveloped leasehold costs associated with the same properties, which was included in the �Exploration expenses� line on our consolidated income statement.
The nine-month period of 2013 included an impairment in our Europe segment of $28 million, primarily due to increases in the ARO for the U.K. Don Field, which has ceased production.
In June 2014 we decided not to pursue future development of the Amauligak discovery at this time. Accordingly, we recorded a $145 million before-tax property impairment for the carrying value of capitalized undeveloped leasehold costs associated with our Amauligak, Arctic Islands and other Beaufort properties, located offshore Canada. This impairment is also included in the �Exploration expenses� line on our consolidated income statement.
Note 8�Debt
In June 2014 we refinanced our revolving credit facility from a total of $7.5 billion to $7.0 billion, with a new expiration date of June 2019. Our revolving credit facility may be used for direct bank borrowings, for the issuance of letters of credit totaling up to $500 million, or as support for our commercial paper programs. The revolving credit facility is broadly syndicated among financial institutions and does not contain any material adverse change provisions or any covenants requiring maintenance of specified financial ratios or credit ratings. The facility agreement contains a cross-default provision relating to the failure to pay principal or interest on other debt obligations of $200 million or more by ConocoPhillips, or any of its consolidated subsidiaries.
Credit facility borrowings may bear interest at a margin above rates offered by certain designated banks in the London interbank market as administered by ICE Benchmark Administration or at a margin above the overnight federal funds rate or prime rates offered by certain designated banks in the United States. The agreement calls for commitment fees on available, but unused, amounts. The agreement also contains early termination rights if our current directors or their approved successors cease to be a majority of the Board of Directors.
�
9
Table of Contents
We have two commercial paper programs supported by our $7.0 billion revolving credit facility: the ConocoPhillips $6.1 billion program, primarily a funding source for short-term working capital needs, and the ConocoPhillips Qatar Funding Ltd. $900 million program, which is used to fund commitments relating to QG3. Commercial paper maturities are generally limited to 90 days.
At September�30, 2014 and December�31, 2013, we had no direct outstanding borrowings under the revolving credit facility, with no letters of credit as of September�30, 2014 or December�31, 2013. In addition, under the ConocoPhillips Qatar Funding Ltd. commercial paper program, there was $860 million of commercial paper outstanding at September�30, 2014, compared with $961 million at December�31, 2013. Since we had $860�million of commercial paper outstanding and had issued no letters of credit, we had access to $6.1�billion in borrowing capacity under our revolving credit facility at September�30, 2014.
At September�30, 2014, we classified $752 million of short-term debt as long-term debt, based on our ability and intent to refinance the obligation on a long-term basis under our revolving credit facility.
During the first nine months of 2014, we repaid at maturity the aggregate principal amount of our $400 million 4.75% Notes due 2014. In October 2014 we notified holders of the outstanding $1.5 billion 4.60% Notes due January 2015 that early redemption will occur in November 2014.
During 2013 a lease of a semi-submersible floating production system (FPS) commenced for the Gumusut development, located in Malaysia, in which we are a co-venturer. As of September�30, 2014, the value of the capital lease asset and associated obligation for our proportionate interest in the FPS was $930 million. Following the startup of the FPS, which occurred in October 2014, the capital lease asset will be depreciated over a period consistent with the estimated proved reserves of Gumusut using the unit-of-production method with the associated depreciation included in the �Depreciation, depletion and amortization� line on our consolidated income statement.
Note 9�Noncontrolling Interests
Activity attributable to common stockholders� equity and noncontrolling interests for the first nine months of 2014 and 2013 was as follows:
�
| � | �� | Millions of Dollars | � | |||||||||||||||||||||
| � | �� | 2014 | � | � | 2013 | � | ||||||||||||||||||
| � | �� | Common Stockholders� Equity |
� | � | Non- Controlling Interest |
� | � | Total Equity |
� | � | Common Stockholders� Equity |
� | � | Non- Controlling Interest |
� | � | Total Equity |
� | ||||||
| �� | � |
� |
� | |||||||||||||||||||||
| Balance at January�1 |
�� | $ | 52,090 | �� | � | � | 402 | �� | � | � | 52,492 | �� | � | � | 47,987 | �� | � | � | 440 | �� | � | � | 48,427 | �� |
| Net income |
�� | � | 6,908 | �� | � | � | 54 | �� | � | � | 6,962 | �� | � | � | 6,669 | �� | � | � | 43 | �� | � | � | 6,712 | �� |
| Dividends |
�� | � | (2,618 | )� | � | � | � | �� | � | � | (2,618 | )� | � | � | (2,481 | )� | � | � | � | �� | � | � | (2,481 | )� |
| Distributions to noncontrolling interests |
�� | � | � | �� | � | � | (69 | )� | � | � | (69 | )� | � | � | � | �� | � | � | (59 | )� | � | � | (59 | )� |
| Other changes, net* |
�� | � | (1,106 | )� | � | � | � | �� | � | � | (1,106 | )� | � | � | (1,062 | )� | � | � | � | �� | � | � | (1,062 | )� |
| � |
� | |||||||||||||||||||||||
| Balance at September�30 |
�� | $ | 55,274 | �� | � | � | 387 | �� | � | � | 55,661 | �� | � | � | 51,113 | �� | � | � | 424 | �� | � | � | 51,537 | �� |
| � |
� | |||||||||||||||||||||||
*Includes components of other comprehensive income, which are disclosed separately in the Consolidated Statement of Comprehensive Income.
�
10
Table of Contents
Note 10�Guarantees
At September�30, 2014, we were liable for certain contingent obligations under various contractual arrangements as described below. We recognize a liability, at inception, for the fair value of our obligation as a guarantor for newly issued or modified guarantees. Unless the carrying amount of the liability is noted below, we have not recognized a liability either because the guarantees were issued prior to December�31, 2002, or because the fair value of the obligation is immaterial. In addition, unless otherwise stated, we are not currently performing with any significance under the guarantees and expect future performance to be either immaterial or have only a remote chance of occurrence.
APLNG Guarantees
At September�30, 2014, we have outstanding multiple guarantees in connection with our 37.5 percent ownership interest in APLNG. The following is a description of the guarantees with values calculated utilizing September 2014 exchange rates:
�
| � | � | � | We have guaranteed APLNG�s performance with regard to a construction contract executed in connection with APLNG�s issuance of the Train 1 and Train 2 Notices to Proceed. We estimate the remaining term of this guarantee is three years. Our maximum potential amount of future payments related to this guarantee is approximately $110�million and would become payable if APLNG cancels the applicable construction contract and does not perform with respect to the amounts owed to the contractor. |
�
| � | � | � | We have issued a construction completion guarantee related to the third-party project financing secured by APLNG. Our maximum potential amount of future payments under the guarantee is estimated to be $3.2 billion, which could be payable if the full debt financing capacity is utilized and completion of the project is not achieved. Our guarantee of the project financing will be released upon meeting certain completion tests with milestones, which we estimate would occur beginning in 2016. Our maximum exposure at September�30, 2014, is approximately $3.0 billion based upon our pro-rata share of the facility used at that date. At September�30, 2014, the carrying value of this guarantee is $114 million. |
�
| � | � | � | In conjunction with our original acquisition of an ownership interest in APLNG in October 2008, we agreed to guarantee an existing obligation of APLNG to deliver natural gas under several sales agreements with remaining terms of 2 to 27 years. Our maximum potential amount of future payments, or cost of volume delivery, under these guarantees is estimated to be $1.4 billion (approximately $2.4 billion in the event of intentional or reckless breach), and would become payable if APLNG fails to meet its obligations under these agreements and the obligations cannot otherwise be mitigated. Future payments are considered unlikely, as the payments, or cost of volume delivery, would only be triggered if APLNG does not have enough natural gas to meet these sales commitments and if the co-venturers do not make necessary equity contributions into APLNG. |
�
| � | � | � | We have guaranteed the performance of APLNG with regard to certain other contracts executed in connection with the project�s continued development. The guarantees have remaining terms of up to 31 years or the life of the venture. Our maximum potential amount of future payments related to these guarantees is approximately $190�million and would become payable if APLNG does not perform. |
Other Guarantees
We have other guarantees with maximum future potential payment amounts totaling approximately $200�million, which consist primarily of guarantees of the residual value of leased corporate aircraft, guarantees to fund the short-term cash liquidity deficit of two joint ventures, a guarantee for our portion of a joint venture�s debt obligations and a guarantee of minimum charter revenue for an LNG vessel. These guarantees have remaining terms of up to 10 years or the life of the venture and would become payable if, upon sale, certain asset values are lower than guaranteed amounts, business conditions decline at guaranteed entities, or as a result of non-performance of contractual terms by guaranteed parties.
�
11
Table of Contents
Indemnifications
Over the years, we have entered into agreements to sell ownership interests in certain corporations, joint ventures and assets that gave rise to qualifying indemnifications. These agreements include indemnifications for taxes, environmental liabilities, employee claims, and litigation. The terms of these indemnifications vary greatly. The majority of these indemnifications are related to environmental issues, the term is generally indefinite and the maximum amount of future payments is generally unlimited. The carrying amount recorded for these indemnifications at September�30, 2014, was approximately $100 million. We amortize the indemnification liability over the relevant time period, if one exists, based on the facts and circumstances surrounding each type of indemnity. In cases where the indemnification term is indefinite, we will reverse the liability when we have information the liability is essentially relieved or amortize the liability over an appropriate time period as the fair value of our indemnification exposure declines. Although it is reasonably possible future payments may exceed amounts recorded, due to the nature of the indemnifications, it is not possible to make a reasonable estimate of the maximum potential amount of future payments. Included in the recorded carrying amount at September�30, 2014, were approximately $50�million of environmental accruals for known contamination that are included in the �Asset retirement obligations and accrued environmental costs� line on our consolidated balance sheet. For additional information about environmental liabilities, see Note 11�Contingencies and Commitments.
On April�30, 2012, the separation of our downstream businesses was completed, creating two independent energy companies: ConocoPhillips and Phillips 66. In connection with the separation, we entered into an Indemnification and Release Agreement, which provides for cross-indemnities between Phillips 66 and us and established procedures for handling claims subject to indemnification and related matters. We evaluated the impact of the indemnifications given and the Phillips 66 indemnifications received as of the separation date and concluded those fair values were immaterial.
Note 11�Contingencies and Commitments
A number of lawsuits involving a variety of claims arising in the ordinary course of business have been made against ConocoPhillips. We also may be required to remove or mitigate the effects on the environment of the placement, storage, disposal or release of certain chemical, mineral and petroleum substances at various active and inactive sites. We regularly assess the need for accounting recognition or disclosure of these contingencies. In the case of all known contingencies (other than those related to income taxes), we accrue a liability when the loss is probable and the amount is reasonably estimable. If a range of amounts can be reasonably estimated and no amount within the range is a better estimate than any other amount, then the minimum of the range is accrued. We do not reduce these liabilities for potential insurance or third-party recoveries. If applicable, we accrue receivables for probable insurance or other third-party recoveries. With respect to income-tax-related contingencies, we use a cumulative probability-weighted loss accrual in cases where sustaining a tax position is less than certain.
Based on currently available information, we believe it is remote that future costs related to known contingent liability exposures will exceed current accruals by an amount that would have a material adverse impact on our consolidated financial statements. As we learn new facts concerning contingencies, we reassess our position both with respect to accrued liabilities and other potential exposures. Estimates particularly sensitive to future changes include contingent liabilities recorded for environmental remediation, tax and legal matters. Estimated future environmental remediation costs are subject to change due to such factors as the uncertain magnitude of cleanup costs, the unknown time and extent of such remedial actions that may be required, and the determination of our liability in proportion to that of other responsible parties. Estimated future costs related to tax and legal matters are subject to change as events evolve and as additional information becomes available during the administrative and litigation processes.
Environmental
We are subject to international, federal, state and local environmental laws and regulations. When we prepare our consolidated financial statements, we record accruals for environmental liabilities based on management�s best estimates, using all information that is available at the time. We measure estimates and base liabilities on
�
12
Table of Contents
currently available facts, existing technology, and presently enacted laws and regulations, taking into account stakeholder and business considerations. When measuring environmental liabilities, we also consider our prior experience in remediation of contaminated sites, other companies� cleanup experience, and data released by the U.S.�Environmental Protection Agency (EPA) or other organizations. We consider unasserted claims in our determination of environmental liabilities, and we accrue them in the period they are both probable and reasonably estimable.
Although liability of those potentially responsible for environmental remediation costs is generally joint and several for federal sites and frequently so for other sites, we are usually only one of many companies cited at a particular site. Due to the joint and several liabilities, we could be responsible for all cleanup costs related to any site at which we have been designated as a potentially responsible party. We have been successful to date in sharing cleanup costs with other financially sound companies. Many of the sites at which we are potentially responsible are still under investigation by the EPA or the agency concerned. Prior to actual cleanup, those potentially responsible normally assess the site conditions, apportion responsibility and determine the appropriate remediation. In some instances, we may have no liability or may attain a settlement of liability. Where it appears that other potentially responsible parties may be financially unable to bear their proportional share, we consider this inability in estimating our potential liability, and we adjust our accruals accordingly. As a result of various acquisitions in the past, we assumed certain environmental obligations. Some of these environmental obligations are mitigated by indemnifications made by others for our benefit and some of the indemnifications are subject to dollar limits and time limits.
We are currently participating in environmental assessments and cleanups at numerous federal Superfund and comparable state and international sites. After an assessment of environmental exposures for cleanup and other costs, we make accruals on an undiscounted basis (except those acquired in a purchase business combination, which we record on a discounted basis) for planned investigation and remediation activities for sites where it is probable future costs will be incurred and these costs can be reasonably estimated. At September�30, 2014, our balance sheet included a total environmental accrual of $366 million, compared with $348�million at December�31, 2013, for remediation activities in the United States and Canada. We expect to incur a substantial amount of these expenditures within the next 30 years. We have not reduced these accruals for possible insurance recoveries. In the future, we may be involved in additional environmental assessments, cleanups and proceedings.
Legal Proceedings
We are subject to various lawsuits and claims including but not limited to matters involving oil and gas royalty and severance tax payments, gas measurement and valuation methods, contract disputes, environmental damages, personal injury, and property damage. Our primary exposures for such matters relate to alleged royalty underpayments on certain federal, state and privately owned properties and claims of alleged environmental contamination from historic operations. We will continue to defend ourselves vigorously in these matters.
Our legal organization applies its knowledge, experience and professional judgment to the specific characteristics of our cases, employing a litigation management process to manage and monitor the legal proceedings against us. Our process facilitates the early evaluation and quantification of potential exposures in individual cases. This process also enables us to track those cases that have been scheduled for trial and/or mediation. Based on professional judgment and experience in using these litigation management tools and available information about current developments in all our cases, our legal organization regularly assesses the adequacy of current accruals and determines if adjustment of existing accruals, or establishment of new accruals, is required.
Other Contingencies
We have contingent liabilities resulting from throughput agreements with pipeline and processing companies not associated with financing arrangements. Under these agreements, we may be required to provide any such company with additional funds through advances and penalties for fees related to throughput capacity not
�
13
Table of Contents
utilized. In addition, at September�30, 2014, we had performance obligations secured by letters of credit of $700 million�(issued as direct bank letters of credit) related to various purchase commitments for materials, supplies, commercial activities and services incident to the ordinary conduct of business.
In 2007 we announced we had been unable to reach agreement with respect to our migration to an empresa mixta structure mandated by the Venezuelan government�s Nationalization Decree. As a result, Venezuela�s national oil company, Petr�leos de Venezuela S.A. (PDVSA),�or its affiliates, directly assumed control over ConocoPhillips� interests in the Petrozuata and Hamaca heavy oil ventures and the offshore Corocoro development project. In response to this expropriation, we filed a request for international arbitration on November�2, 2007, with the World Bank�s International Centre for Settlement of Investment Disputes (ICSID). An arbitration hearing was held before an ICSID tribunal during the summer of 2010. On September�3, 2013, an ICSID arbitration tribunal held that Venezuela unlawfully expropriated ConocoPhillips� significant oil investments in June 2007. A separate arbitration phase is currently proceeding to determine the damages owed to ConocoPhillips for Venezuela�s actions. On October�10, 2014, we filed a separate arbitration under the rules of the International Chamber of Commerce against PDVSA for contractual compensation related to the Petrozuata and Hamaca heavy crude oil projects.
In 2008 Burlington Resources, Inc., a wholly owned subsidiary of ConocoPhillips, initiated arbitration before ICSID against The Republic of Ecuador, as a result of the newly enacted Windfall Profits Tax Law and government-mandated renegotiation of our production sharing contracts. Despite a restraining order issued by the ICSID tribunal, Ecuador confiscated the crude oil production of Burlington and its co-venturer and sold the seized crude oil.�In 2009 Ecuador took over operations in Blocks 7 and 21, fully expropriating our assets. In June 2010, the ICSID tribunal concluded it has jurisdiction to hear the expropriation claim. On April�24, 2012, Ecuador filed supplemental counterclaims asserting environmental damages, which we believe are not material. The ICSID tribunal issued a decision�on liability�on December�14, 2012, in favor of Burlington, finding that Ecuador�s seizure of Blocks 7 and 21 was an unlawful expropriation in violation of the Ecuador-U.S. Bilateral Investment Treaty. An additional arbitration phase is currently proceeding to determine the�damages�owed to ConocoPhillips for Ecuador�s actions and to address Ecuador�s counterclaims.
ConocoPhillips served a Notice of Arbitration on the Timor-Leste Minister of Finance in October 2012 for outstanding disputes related to a series of tax assessments. As of September 2014 ConocoPhillips paid, under protest, tax assessments totaling approximately $237 million, which are primarily recorded in the �Investments and long-term receivables� line on our consolidated balance sheet. The arbitration hearing was conducted in Singapore in June 2014 under the United Nations Commission on International Trade Laws (UNCITRAL) arbitration rules, pursuant to the terms of the Tax Stability Agreement with the Timor-Leste government. Post-hearing briefs from both parties were filed in August 2014. We are now awaiting the Tribunal�s decision. Future impacts on our business are not known at this time.
Note 12�Derivative and Financial Instruments
Derivative Instruments
We use futures, forwards, swaps and options in various markets to meet our customer needs and capture market opportunities. Our commodity business primarily consists of natural gas, crude oil, bitumen, LNG and natural gas liquids.
Our derivative instruments are held at fair value on our consolidated balance sheet. Where these balances have the right of setoff, they are presented on a net basis. Related cash flows are recorded as operating activities on the consolidated statement of cash flows. On our consolidated income statement, realized and unrealized gains and losses are recognized either on a gross basis if directly related to our physical business or a net basis if held for trading. Gains and losses related to contracts that meet and are designated with the normal purchase normal sale exception are recognized upon settlement. We generally apply this exception to eligible crude contracts. We do not use hedge accounting for our commodity derivatives.
�
14
Table of Contents
The following table presents the gross fair values of our commodity derivatives, excluding collateral, and the line items where they appear on our consolidated balance sheet:
�
| � | �� | Millions�of�Dollars | � | |||||
| � | �� | September�30 2014 |
� | �� | December�31 2013 |
� | ||
| �� | � |
� |
� | |||||
| Assets |
�� | �� | ||||||
| Prepaid expenses and other current assets |
�� | $ | 1,003 | �� | �� | � | 871 | �� |
| Other assets |
�� | � | 79 | �� | �� | � | 64 | �� |
| Liabilities |
�� | �� | ||||||
| Other accruals |
�� | � | 1,006 | �� | �� | � | 890 | �� |
| Other liabilities and deferred credits |
�� | � | 71 | �� | �� | � | 58 | �� |
| � |
� | |||||||
The gains (losses) from commodity derivatives incurred, and the line items where they appear on our consolidated income statement were:
�
| � | �� | Millions of Dollars | � | |||||||||||||
| � | �� | Three�Months�Ended September�30 |
� | � | Nine�Months�Ended September�30 |
� | ||||||||||
| � | �� | 2014 | � | � | 2013 | � | � | 2014 | � | � | 2013 | � | ||||
| �� | � |
� |
� | � | � |
� |
� | |||||||||
| Sales and other operating revenues |
�� | $ | (185 | )� | � | � | 61 | �� | � | � | 236 | �� | � | � | (122 | )� |
| Other income |
�� | � | 1 | �� | � | � | � | �� | � | � | 3 | �� | � | � | 3 | �� |
| Purchased commodities |
�� | � | 163 | �� | � | � | (68 | )� | � | � | (221 | )� | � | � | 103 | �� |
| � |
� | |||||||||||||||
The table below summarizes our material net exposures resulting from outstanding commodity derivative contracts:
�
| � | �� | Open Position Long/(Short) |
� | |||||
| � | �� | September�30 2014 |
� | � | December�31 2013 |
� | ||
| �� | � |
� |
� | |||||
| Commodity |
�� | � | ||||||
| Natural gas and power (billions of cubic feet equivalent) |
�� | � | ||||||
| Fixed price |
�� | � | (17 | )� | � | � | (18 | )� |
| Basis |
�� | � | 24 | �� | � | � | (10 | )� |
| � |
� | |||||||
Foreign Currency Exchange Derivatives
We have foreign currency exchange rate risk resulting from international operations. Our foreign currency exchange derivative activity primarily consists of transactions designed to mitigate our cash-related and foreign currency exchange rate exposures, such as firm commitments for capital programs or local currency tax payments, dividends, and cash returns from net investments in foreign affiliates. We do not elect hedge accounting on our foreign currency exchange derivatives.
�
15
Table of Contents
The following table presents the gross fair values of our foreign currency exchange derivatives, excluding collateral, and the line items where they appear on our consolidated balance sheet:
�
| � | �� | Millions of Dollars | � | |||||
| � | �� | September�30 2014 |
� | �� | December�31 2013 |
� | ||
| �� | � |
� |
� | |||||
| Assets |
�� | �� | ||||||
| Prepaid expenses and other current assets |
�� | $ | 2 | �� | �� | � | 1 | �� |
| � |
� | |||||||
The (gains) losses from foreign currency exchange derivatives incurred, and the line item where they appear on our consolidated income statement were:
�
| � | �� | Millions of Dollars | � | |||||||||||||
| � | �� | Three�Months�Ended September�30 |
� | � | Nine�Months�Ended September�30 |
� | ||||||||||
| � | �� | 2014 | � | �� | 2013 | � | � | 2014 | � | � | 2013 | � | ||||
| �� | � |
� |
� | |||||||||||||
| Foreign currency transaction (gains) losses |
�� | $ | 5 | �� | �� | � | (57 | )� | � | � | (2 | )� | � | � | � | �� |
| � |
� | |||||||||||||||
We had the following net notional position of outstanding foreign currency exchange derivatives:
�
| � | �� | In Millions Notional Currency |
� | |||||||
| � | �� | September�30 2014 |
� | �� | December�31 2013 |
� | ||||
| �� | � |
� | ||||||||
| Buy U.S. dollar, sell other currencies* |
�� | USD | �� | � | 36 | �� | �� | � | 6 | �� |
| Buy British pound, sell euro |
�� | GBP | �� | � | 50 | �� | �� | � | 17 | �� |
| � |
� | |||||||||
*Primarily Canadian dollar and Norwegian krone.
Financial Instruments
We have certain financial instruments on our consolidated balance sheet related to interest bearing time deposits and commercial paper.�These held-to-maturity financial instruments are included in �Cash and cash equivalents� on our consolidated balance sheet if the maturities at the time we made the investments were 90�days or less; otherwise, these investments are included in �Short-term investments� on our consolidated balance sheet.
�
| � | �� | Millions of Dollars | � | |||||||||||||
| � | �� | Carrying Amount | � | |||||||||||||
| � | �� | Cash�and�Cash�Equivalents | � | �� | Short-Term�Investments | � | ||||||||||
| � | �� | September�30 2014 |
� | �� | December�31 2013 |
� | �� | September�30 2014 |
� | �� | December�31 2013 |
� | ||||
| �� | � |
� |
� | �� | � |
� |
� | |||||||||
| Cash |
�� | $ | 713 | �� | �� | � | 636 | �� | �� | � | � | �� | �� | � | � | �� |
| Money Market Funds |
�� | � | 300 | �� | �� | � | � | �� | �� | � | � | �� | �� | � | � | �� |
| Time deposits |
�� | �� | �� | �� | ||||||||||||
| Remaining maturities from 1 to 90 days |
�� | � | 3,752 | �� | �� | � | 5,336 | �� | �� | � | 374 | �� | �� | � | 137 | �� |
| Commercial paper |
�� | �� | �� | �� | ||||||||||||
| Remaining maturities from 1 to 90 days |
�� | � | 643 | �� | �� | � | 274 | �� | �� | � | � | �� | �� | � | 135 | �� |
| � |
� | |||||||||||||||
| �� | $ | 5,408 | �� | �� | � | 6,246 | �� | �� | � | 374 | �� | �� | � | 272 | �� | |
| � |
� | |||||||||||||||
�
16
Table of Contents
Credit Risk
Financial instruments potentially exposed to concentrations of credit risk consist primarily of cash equivalents, short-term investments, over-the-counter (OTC) derivative contracts and trade receivables. Our cash equivalents and short-term investments are placed in high-quality commercial paper, money market funds, government debt securities and time deposits with major international banks and financial institutions.
The credit risk from our OTC derivative contracts, such as forwards and swaps, derives from the counterparty to the transaction. Individual counterparty exposure is managed within predetermined credit limits and includes the use of cash-call margins when appropriate, thereby reducing the risk of significant nonperformance. We also use futures, swaps and option contracts that have a negligible credit risk because these trades are cleared with an exchange clearinghouse and subject to mandatory margin requirements until settled; however, we are exposed to the credit risk of those exchange brokers for receivables arising from daily margin cash calls, as well as for cash deposited to meet initial margin requirements.
Our trade receivables result primarily from our petroleum operations and reflect a broad national and international customer base, which limits our exposure to concentrations of credit risk. The majority of these receivables have payment terms of 30 days or less, and we continually monitor this exposure and the creditworthiness of the counterparties. We do not generally require collateral to limit the exposure to loss; however, we will sometimes use letters of credit, prepayments and master netting arrangements to mitigate credit risk with counterparties that both buy from and sell to us, as these agreements permit the amounts owed by us or owed to others to be offset against amounts due us.
Certain of our derivative instruments contain provisions that require us to post collateral if the derivative exposure exceeds a threshold amount. We have contracts with fixed threshold amounts and other contracts with variable threshold amounts that are contingent on our credit rating. The variable threshold amounts typically decline for lower credit ratings, while both the variable and fixed threshold amounts typically revert to zero if we fall below investment grade. Cash is the primary collateral in all contracts; however, many also permit us to post letters of credit as collateral, such as transactions administered through the New York Mercantile Exchange or IntercontinentalExchange.
The aggregate fair value of all derivative instruments with such credit-risk-related contingent features that were in a liability position on September�30, 2014 and December�31, 2013, was $81 million and $57�million, respectively. For these instruments, no collateral was posted as of September�30, 2014 or December�31, 2013. If our credit rating had been lowered one level from its �A� rating (per Standard and Poor�s) on September�30, 2014, we would be required to post $1 million of additional collateral to our counterparties. If we had been downgraded below investment grade, we would be required to post $81 million of additional collateral, either with cash or letters of credit.
Note 13�Fair Value Measurement
We carry a portion of our assets and liabilities at fair value that are measured at a reporting date using an exit price (i.e., the price that would be received to sell an asset or paid to transfer a liability) and disclosed according to the quality of valuation inputs under the following hierarchy:
�
| � | � | � | Level 1: Quoted prices (unadjusted) in an active market for identical assets or liabilities. |
�
| � | � | � | Level 2: Inputs other than quoted prices that are directly or indirectly observable. |
�
| � | � | � | Level 3: Unobservable inputs that are significant to the fair value of assets or liabilities. |
The classification of an asset or liability is based on the lowest level of input significant to its fair value. Those that are initially classified as Level 3 are subsequently reported as Level 2 when the fair value derived from
�
17
Table of Contents
unobservable inputs is inconsequential to the overall fair value, or if corroborated market data becomes available. Assets and liabilities that are initially reported as Level 2 are subsequently reported as Level 3 if corroborated market data is no longer available. Transfers occur at the end of the reporting period. There were no material transfers in or out of Level 1 during 2014 or 2013.
Recurring Fair Value Measurement
Financial assets and liabilities reported at fair value on a recurring basis primarily include commodity derivatives and certain investments to support nonqualified deferred compensation plans. The deferred compensation investments are measured at fair value using unadjusted prices available from national securities exchanges; therefore, these assets are categorized as Level 1 in the fair value hierarchy. Level 1 derivative assets and liabilities primarily represent exchange-traded futures and options that are valued using unadjusted prices available from the underlying exchange. Level 2 derivative assets and liabilities primarily represent OTC�swaps, options and forward purchase and sale contracts that are valued using adjusted exchange prices, prices provided by brokers or pricing service companies that are all corroborated by market data. Level 3 derivative assets and liabilities consist of OTC swaps, options and forward purchase and sale contracts that are long term in nature and where a significant portion of fair value is calculated from underlying market data that is not readily available. The derived value uses industry standard methodologies that may consider the historical relationships among various commodities, modeled market prices, time value, volatility factors and other relevant economic measures. The use of these inputs results in management�s best estimate of fair value. Level�3 activity was not material for all periods presented.
The following table summarizes the fair value hierarchy for gross financial assets and liabilities (i.e., unadjusted where the right of setoff exists for commodity derivatives accounted for at fair value on a recurring basis):
�
| � | �� | Millions of Dollars | � | |||||||||||||||||||||||||||||
| � | �� | September�30, 2014 | � | �� | December�31, 2013 | � | ||||||||||||||||||||||||||
| � | �� | Level�1 | � | �� | Level�2 | � | �� | Level�3 | � | �� | Total | � | �� | Level�1 | � | �� | Level�2 | � | �� | Level�3 | � | �� | Total | � | ||||||||
| �� | � |
� |
� | �� | � |
� |
� | |||||||||||||||||||||||||
| Assets |
�� | �� | �� | �� | �� | �� | �� | �� | ||||||||||||||||||||||||
| Deferred compensation investments |
�� | $ | 300 | �� | �� | � | � | �� | �� | � | � | �� | �� | � | 300 | �� | �� | � | 306 | �� | �� | � | � | �� | �� | � | � | �� | �� | � | 306 | �� |
| Commodity derivatives |
�� | � | 873 | �� | �� | � | 197 | �� | �� | � | 12 | �� | �� | � | 1,082 | �� | �� | � | 744 | �� | �� | � | 177 | �� | �� | � | 10 | �� | �� | � | 931 | �� |
| � |
� | |||||||||||||||||||||||||||||||
| Total assets |
�� | $ | 1,173 | �� | �� | � | 197 | �� | �� | � | 12 | �� | �� | � | 1,382 | �� | �� | � | 1,050 | �� | �� | � | 177 | �� | �� | � | 10 | �� | �� | � | 1,237 | �� |
| � |
� | |||||||||||||||||||||||||||||||
| Liabilities |
�� | �� | �� | �� | �� | �� | �� | �� | ||||||||||||||||||||||||
| Commodity derivatives |
�� | $ | 871 | �� | �� | � | 190 | �� | �� | � | 16 | �� | �� | � | 1,077 | �� | �� | � | 765 | �� | �� | � | 172 | �� | �� | � | 7 | �� | �� | � | 944 | �� |
| � |
� | |||||||||||||||||||||||||||||||
| Total liabilities |
�� | $ | 871 | �� | �� | � | 190 | �� | �� | � | 16 | �� | �� | � | 1,077 | �� | �� | � | 765 | �� | �� | � | 172 | �� | �� | � | 7 | �� | �� | � | 944 | �� |
| � |
� | |||||||||||||||||||||||||||||||
�
18
Table of Contents
The following table summarizes those commodity derivative balances subject to the right of setoff as presented on our consolidated balance sheet. We have elected to offset the recognized fair value amounts for multiple derivative instruments executed with the same counterparty in our financial statements when a legal right of offset exists.
�
| � | �� | Millions of Dollars | � | |||||||||||||||||||||
| � | �� | Gross Amounts Recognized |
� | �� | Gross Amounts Offset |
� | �� | Net Amounts Presented |
� | �� | Cash Collateral |
� | �� | Gross�Amounts without Right�of Setoff |
� | �� | Net Amounts |
� | ||||||
| �� | � |
� |
� | |||||||||||||||||||||
| September 30, 2014 |
�� | �� | �� | �� | �� | �� | ||||||||||||||||||
| Assets |
�� | $ | 1,082 | �� | �� | � | 955 | �� | �� | � | 127 | �� | �� | � | 2 | �� | �� | � | 15 | �� | �� | � | 110 | �� |
| Liabilities |
�� | � | 1,077 | �� | �� | � | 955 | �� | �� | � | 122 | �� | �� | � | 10 | �� | �� | � | 13 | �� | �� | � | 99 | �� |
| � |
� | |||||||||||||||||||||||
| December 31, 2013 |
�� | �� | �� | �� | �� | �� | ||||||||||||||||||
| Assets |
�� | $ | 931 | �� | �� | � | 827 | �� | �� | � | 104 | �� | �� | � | 6 | �� | �� | � | 12 | �� | �� | � | 86 | �� |
| Liabilities |
�� | � | 944 | �� | �� | � | 827 | �� | �� | � | 117 | �� | �� | � | 26 | �� | �� | � | 9 | �� | �� | � | 82 | �� |
| � |
� | |||||||||||||||||||||||
At September�30, 2014 and December�31, 2013, we did not present any amounts gross on our consolidated balance sheet where we had the right of setoff.
Non-Recurring Fair Value Measurement
The following table shows the values of assets, by major category, measured at fair value on a nonrecurring basis in periods subsequent to their initial recognition:
�
| � | �� | Millions of Dollars | � | |||||||||
| � | �� | � | � | �� | Fair Value Measurements�Using |
� | ||||||
| � | �� | Fair�Value | � | �� | Level�3 Inputs |
� | �� | Before-Tax Loss |
� | |||
| September�30, 2014 |
�� | �� | �� | |||||||||
| Net PP&E (held for use) |
�� | $ | 12 | �� | �� | � | 12 | �� | �� | � | 102 | �� |
| Net PP&E (unproved property) |
�� | � | 38 | �� | �� | � | 38 | �� | �� | � | 138 | �� |
| � |
� | |||||||||||
Net PP&E held for use was written down to fair value, less costs to sell. The fair value was determined by internal discounted cash flow models using estimates of future production, prices from futures exchanges and pricing service companies, costs and a discount rate believed to be consistent with those used by principal market participants.
Net PP&E unproved property was written down to fair value less costs to sell based on a risk-weighted assessment of indicative offers received.
Reported Fair Values of Financial Instruments
We used the following methods and assumptions to estimate the fair value of financial instruments:
�
| � | � | � | Cash and cash equivalents and short-term investments: The carrying amount reported on the balance sheet approximates fair value. |
�
| � | � | � | Accounts and notes receivable (including long-term and related parties): The carrying amount reported on the balance sheet approximates fair value. The valuation technique and methods used to estimate the fair value of the current portion of fixed-rate related party loans is consistent with Loans and advances�related parties. |
�
19
Table of Contents
| � | � | � | Loans and advances�related parties: The carrying amount of floating-rate loans approximates fair value. The fair value of fixed-rate loan activity is measured using market observable data and is categorized as Level 2 in the fair value hierarchy. See Note 5�Investments, Loans and Long-Term Receivables, for additional information. |
�
| � | � | � | Accounts payable (including related parties) and floating-rate debt: The carrying amount of accounts payable and floating-rate debt reported on the balance sheet approximates fair value. |
�
| � | � | � | Fixed-rate debt: The estimated fair value of fixed-rate debt is measured using prices available from a pricing service that is corroborated by market data; therefore, these liabilities are categorized as Level 2 in the fair value hierarchy. |
The following table summarizes the net fair value of financial instruments (i.e., adjusted where the right of setoff exists for commodity derivatives):
�
| � | �� | Millions of Dollars | � | |||||||||||||
| � | �� | Carrying Amount | � | �� | Fair Value | � | ||||||||||
| � | �� | September�30 2014 |
� | �� | December�31 2013 |
� | �� | September�30 2014 |
� | �� | December�31 2013 |
� | ||||
| �� | � |
� |
� | �� | � |
� |
� | |||||||||
| Financial assets |
�� | �� | �� | �� | ||||||||||||
| Deferred compensation investments |
�� | $ | 300 | �� | �� | � | 306 | �� | �� | � | 300 | �� | �� | � | 306 | �� |
| Commodity derivatives |
�� | � | 125 | �� | �� | � | 99 | �� | �� | � | 125 | �� | �� | � | 99 | �� |
| Total loans and advances�related parties |
�� | � | 1,376 | �� | �� | � | 1,528 | �� | �� | � | 1,509 | �� | �� | � | 1,680 | �� |
| Financial liabilities |
�� | �� | �� | �� | ||||||||||||
| Total debt, excluding capital leases |
�� | � | 20,221 | �� | �� | � | 20,740 | �� | �� | � | 23,672 | �� | �� | � | 23,553 | �� |
| Commodity derivatives |
�� | � | 112 | �� | �� | � | 92 | �� | �� | � | 112 | �� | �� | � | 92 | �� |
| � |
� | |||||||||||||||
Note 14�Accumulated Other Comprehensive Income
Accumulated other comprehensive income in the equity section of our consolidated balance sheet included:
�
| � | �� | Millions of Dollars | � | |||||||||
| � | �� | Defined Benefit�Plans |
� | � | Foreign Currency Translation |
� | � | Accumulated Other Comprehensive Income (Loss) |
� | |||
| �� | � |
� |
� | |||||||||
| December�31, 2013 |
�� | $ | (824 | )� | � | � | 2,826 | �� | � | � | 2,002 | �� |
| Other comprehensive income (loss) |
�� | � | 64 | �� | � | � | (1,481 | )� | � | � | (1,417 | )� |
| � |
� | |||||||||||
| September�30, 2014 |
�� | $ | (760 | )� | � | � | 1,345 | �� | � | � | 585 | �� |
| � |
� | |||||||||||
There were no items within accumulated other comprehensive income related to noncontrolling interests.
The following table summarizes reclassifications out of accumulated other comprehensive income:
�
| � | �� | Millions of Dollars | � | |||||||||||||
| � | �� | Three�Months�Ended September�30 |
� | �� | Nine�Months�Ended September�30 |
� | ||||||||||
| � | �� | 2014 | � | �� | 2013 | � | �� | 2014 | � | �� | 2013 | � | ||||
| �� | � |
� |
� | �� | � |
� |
� | |||||||||
| Defined benefit plans |
�� | $ | 19 | �� | �� | � | 65 | �� | �� | � | 59 | �� | �� | � | 133 | �� |
| � |
� | |||||||||||||||
| Above amounts are included in the computation of net periodic benefit cost and are presented net of tax expense of: | �� | $ | 11 | �� | �� | � | 40 | �� | �� | � | 34 | �� | �� | � | 83 | �� |
See Note 16�Employee Benefit Plans, for additional information.
�
20
Table of Contents
Note 15�Cash Flow Information
�
| � | �� | Millions�of�Dollars | � | |||||
| � | �� | Nine�Months�Ended September�30 |
� | |||||
| � | �� | 2014 | � | � | 2013 | � | ||
| �� | � |
� |
� | |||||
| Cash Payments |
�� | � | ||||||
| Interest |
�� | $ | 491 | �� | � | � | 448 | �� |
| Income taxes |
�� | � | 3,359 | �� | � | � | 4,050 | �� |
| � |
� | |||||||
| Net Sales (Purchases) of Short-Term Investments |
�� | � | ||||||
| Short-term investments purchased |
�� | $ | (876 | )� | � | � | (97 | )� |
| Short-term investments sold |
�� | � | 767 | �� | � | � | 98 | �� |
| � |
� | |||||||
| �� | $ | (109 | )� | � | � | 1 | �� | |
| � |
� | |||||||
Note 16�Employee Benefit Plans
Pension and Postretirement Plans
�
| � | �� | Millions of Dollars | � | |||||||||||||||||||||
| � | �� | Pension Benefits | � | � | Other�Benefits | � | ||||||||||||||||||
| � | �� | 2014 | � | � | 2013 | � | � | 2014 | � | � | 2013 | � | ||||||||||||
| �� | � |
� |
� | � | � |
� |
� | |||||||||||||||||
| �� | � | U.S. | �� | � | � | Int�l. | �� | � | � | U.S. | �� | � | � | Int�l. | �� | � | � | |||||||
| �� | � |
� |
� | � | � | |||||||||||||||||||
| Components of Net Periodic Benefit Cost |
�� | � | � | � | � | � | ||||||||||||||||||
| Three Months Ended September�30 |
�� | � | � | � | � | � | ||||||||||||||||||
| Service cost |
�� | $ | 31 | �� | � | � | 27 | �� | � | � | 35 | �� | � | � | 25 | �� | � | � | 1 | �� | � | � | � | �� |
| Interest cost |
�� | � | 42 | �� | � | � | 42 | �� | � | � | 35 | �� | � | � | 35 | �� | � | � | 8 | �� | � | � | 8 | �� |
| Expected return on plan assets |
�� | � | (53 | )� | � | � | (45 | )� | � | � | (47 | )� | � | � | (40 | )� | � | � | � | �� | � | � | � | �� |
| Amortization of prior service cost (credit) |
�� | � | 1 | �� | � | � | (2 | )� | � | � | 2 | �� | � | � | (2 | )� | � | � | (1 | )� | � | � | (1 | )� |
| Recognized net actuarial loss (gain) |
�� | � | 19 | �� | � | � | 14 | �� | � | � | 38 | �� | � | � | 18 | �� | � | � | (1 | )� | � | � | � | �� |
| Settlements |
�� | � | � | �� | � | � | � | �� | � | � | 50 | �� | � | � | � | �� | � | � | � | �� | � | � | � | �� |
| � |
� | |||||||||||||||||||||||
| Net periodic benefit cost |
�� | $ | 40 | �� | � | � | 36 | �� | � | � | 113 | �� | � | � | 36 | �� | � | � | 7 | �� | � | � | 7 | �� |
| � |
� | |||||||||||||||||||||||
| Nine Months Ended September�30 | �� | � | � | � | � | � | � | � | � | � | � | � | � | � | � | � | � | � | ||||||
| Service cost |
�� | $ | 93 | �� | � | � | 83 | �� | � | � | 104 | �� | � | � | 76 | �� | � | � | 2 | �� | � | � | 2 | �� |
| Interest cost |
�� | � | 124 | �� | � | � | 126 | �� | � | � | 107 | �� | � | � | 108 | �� | � | � | 22 | �� | � | � | 20 | �� |
| Expected return on plan assets |
�� | � | (159 | )� | � | � | (137 | )� | � | � | (140 | )� | � | � | (120 | )� | � | � | � | �� | � | � | � | �� |
| Amortization of prior service cost (credit) |
�� | � | 4 | �� | � | � | (6 | )� | � | � | 5 | �� | � | � | (6 | )� | � | � | (3 | )� | � | � | (3 | )� |
| Recognized net actuarial loss (gain) |
�� | � | 57 | �� | � | � | 43 | �� | � | � | 113 | �� | � | � | 55 | �� | � | � | (2 | )� | � | � | 2 | �� |
| Settlements |
�� | � | � | �� | � | � | � | �� | � | � | 50 | �� | � | � | � | �� | � | � | � | �� | � | � | � | �� |
| � |
� | |||||||||||||||||||||||
| Net periodic benefit cost |
�� | $ | 119 | �� | � | � | 109 | �� | � | � | 239 | �� | � | � | 113 | �� | � | � | 19 | �� | � | � | 21 | �� |
| � |
� | |||||||||||||||||||||||
During the first nine months of 2014, we contributed $304 million to our domestic benefit plans and $111�million to our international benefit plans. In 2014 we expect to contribute approximately $320 million to our domestic qualified and nonqualified pension and postretirement benefit plans and $210 million to our international qualified and nonqualified pension and postretirement benefit plans.
During the three months ended September�30, 2013, we concluded that lump-sum benefit payments would exceed the sum of service and interest costs for the plan year for the U.S. qualified pension plan. As a result, we recognized a proportionate share of prior actuarial losses, or pension settlement expense, of $50 million. In
�
21
Table of Contents
conjunction with the recognition of pension settlement expense, the assets and pension benefit obligation of the U.S. qualified pension plan were remeasured. At the measurement date, the net pension liability decreased $301 million to $725 million, resulting in a corresponding increase to other comprehensive income.
Note 17�Related Party Transactions
We consider our equity method investments to be related parties. Significant transactions with related parties were:
�
| � | �� | Millions of Dollars | � | |||||||||||||
| � | �� | Three�Months�Ended September�30 |
� | �� | Nine�Months�Ended September�30 |
� | ||||||||||
| � | �� | 2014 | � | � | 2013 | � | �� | 2014 | � | � | 2013 | � | ||||
| �� | � |
� |
� | �� | � |
� |
� | |||||||||
| Operating revenues and other income |
�� | $ | 32 | �� | � | � | 35 | �� | �� | � | 89 | �� | � | � | 74 | �� |
| Purchases |
�� | � | 47 | �� | � | � | 48 | �� | �� | � | 147 | �� | � | � | 138 | �� |
| Operating expenses and selling, general and administrative expenses* |
�� | � | 21 | �� | � | � | 10 | �� | �� | � | 53 | �� | � | � | 25 | �� |
| Net interest (income) expense** |
�� | � | (12 | )� | � | � | 6 | �� | �� | � | (36 | )� | � | � | 22 | �� |
| � |
� | |||||||||||||||
*2013 has been restated to eliminate certain non-related party transactions.
**We paid interest to, or received interest from, various affiliates. See Note 5�Investments, Loans and Long-Term Receivables, for additional information on loans to affiliated companies.
Note 18�Segment Disclosures and Related Information
We explore for, produce, transport and market crude oil, bitumen, natural gas, LNG and natural gas liquids on a worldwide basis. We manage our operations through six operating segments, which are primarily defined by geographic region: Alaska, Lower 48, Canada, Europe, Asia Pacific and Middle East, and Other International.
Effective April�1, 2014, the Other International segment was restructured to focus on enhancing our capability to operate in emerging and new country business units. As a result, we moved the Latin America and Poland businesses from the historically presented Lower 48 and Latin America segment and the Europe segment to the Other International segment. Results of operations for the Lower 48, Europe and Other International segments have been revised for all periods presented. There was no impact on our consolidated financial statements, and the impact on our segment presentation was immaterial.
In 2012 we agreed to sell our Nigeria and Algeria businesses and our interest in Kashagan. We sold our Nigeria business in the third quarter of 2014, and we sold Kashagan and our Algeria business in the fourth quarter of 2013. Results for the Disposition Group have been reported as discontinued operations in all periods presented. For additional information, see Note 2�Discontinued Operations.
Corporate and Other represents costs not directly associated with an operating segment, such as most interest expense, corporate overhead and certain technology activities, including licensing revenues. Corporate assets include all cash and cash equivalents and short-term investments.
We evaluate performance and allocate resources based on net income attributable to ConocoPhillips. Intersegment sales are at prices that approximate market.
�
22
Table of Contents
Analysis of Results by Operating Segment
�
| � | �� | Millions of Dollars | � | |||||||||||||
| � | �� | Three�Months�Ended September�30 |
� | � | Nine�Months�Ended September�30 |
� | ||||||||||
| � | �� | 2014 | � | � | 2013 | � | � | 2014 | � | � | 2013 | � | ||||
| �� | � |
� |
� | � | � |
� |
� | |||||||||
| Sales and Other Operating Revenues |
�� | � | � | � | ||||||||||||
| Alaska |
�� | $ | 2,094 | �� | � | � | 2,102 | �� | � | � | 6,687 | �� | � | � | 6,375 | �� |
| � |
� | |||||||||||||||
| Lower 48 |
�� | � | 5,082 | �� | � | � | 4,938 | �� | � | � | 17,196 | �� | � | � | 14,661 | �� |
| Intersegment eliminations |
�� | � | (28 | )� | � | � | (24 | )� | � | � | (88 | )� | � | � | (79 | )� |
| � |
� | |||||||||||||||
| Lower 48 |
�� | � | 5,054 | �� | � | � | 4,914 | �� | � | � | 17,108 | �� | � | � | 14,582 | �� |
| � |
� | |||||||||||||||
| Canada |
�� | � | 1,086 | �� | � | � | 1,264 | �� | � | � | 4,113 | �� | � | � | 3,924 | �� |
| Intersegment eliminations |
�� | � | (128 | )� | � | � | (135 | )� | � | � | (618 | )� | � | � | (448 | )� |
| � |
� | |||||||||||||||
| Canada |
�� | � | 958 | �� | � | � | 1,129 | �� | � | � | 3,495 | �� | � | � | 3,476 | �� |
| � |
� | |||||||||||||||
| Europe |
�� | � | 2,241 | �� | � | � | 3,024 | �� | � | � | 8,195 | �� | � | � | 8,885 | �� |
| Intersegment eliminations |
�� | � | (3 | )� | � | � | ��� | �� | � | � | (47 | )� | � | � | ��� | �� |
| � |
� | |||||||||||||||
| Europe |
�� | � | 2,238 | �� | � | � | 3,024 | �� | � | � | 8,148 | �� | � | � | 8,885 | �� |
| � |
� | |||||||||||||||
| Asia Pacific and Middle East |
�� | � | 1,658 | �� | � | � | 2,196 | �� | � | � | 5,758 | �� | � | � | 6,500 | �� |
| Other International |
�� | � | 60 | �� | � | � | 262 | �� | � | � | 65 | �� | � | � | 1,202 | �� |
| Corporate and Other |
�� | � | 18 | �� | � | � | 16 | �� | � | � | 55 | �� | � | � | 139 | �� |
| � |
� | |||||||||||||||
| Consolidated sales and other operating revenues |
�� | $ | 12,080 | �� | � | � | 13,643 | �� | � | � | 41,316 | �� | � | � | 41,159 | �� |
| � |
� | |||||||||||||||
| Net Income Attributable to ConocoPhillips |
�� | � | � | � | ||||||||||||
| Alaska |
�� | $ | 473 | �� | � | � | 494 | �� | � | � | 1,698 | �� | � | � | 1,719 | �� |
| Lower 48 |
�� | � | 32 | �� | � | � | 209 | �� | � | � | 621 | �� | � | � | 547 | �� |
| Canada |
�� | � | 307 | �� | � | � | 642 | �� | � | � | 845 | �� | � | � | 780 | �� |
| Europe |
�� | � | 213 | �� | � | � | 288 | �� | � | � | 819 | �� | � | � | 1,005 | �� |
| Asia Pacific and Middle East |
�� | � | 749 | �� | � | � | 741 | �� | � | � | 2,336 | �� | � | � | 2,676 | �� |
| Other International |
�� | � | (18 | )� | � | � | 283 | �� | � | � | 74 | �� | � | � | 328 | �� |
| Corporate and Other |
�� | � | (130 | )� | � | � | (234 | )� | � | � | (616 | )� | � | � | (569 | )� |
| Discontinued operations |
�� | � | 1,078 | �� | � | � | 57 | �� | � | � | 1,131 | �� | � | � | 183 | �� |
| � |
� | |||||||||||||||
| Consolidated net income attributable to ConocoPhillips |
�� | $ | 2,704 | �� | � | � | 2,480 | �� | � | � | 6,908 | �� | � | � | 6,669 | �� |
| � |
� | |||||||||||||||
�
| � | �� | Millions of Dollars | � | |||||
| � | �� | September�30 2014 |
� | �� | December�31 2013 |
� | ||
| �� | � |
� |
� | |||||
| Total Assets |
�� | �� | ||||||
| Alaska |
�� | $ | 12,667 | �� | �� | � | 11,662 | �� |
| Lower 48 |
�� | � | 30,749 | �� | �� | � | 29,552 | �� |
| Canada |
�� | � | 21,963 | �� | �� | � | 22,394 | �� |
| Europe |
�� | � | 16,968 | �� | �� | � | 17,223 | �� |
| Asia Pacific and Middle East |
�� | � | 26,276 | �� | �� | � | 25,473 | �� |
| Other International |
�� | � | 2,190 | �� | �� | � | 1,705 | �� |
| Corporate and Other |
�� | � | 8,062 | �� | �� | � | 8,367 | �� |
| Discontinued operations |
�� | � | 111 | �� | �� | � | 1,681 | �� |
| � |
� | |||||||
| Consolidated total assets |
�� | $ | 118,986 | �� | �� | � | 118,057 | �� |
| � |
� | |||||||
�
23
Table of Contents
Note 19�Income Taxes
Our effective tax rates from continuing operations for the third quarter and first nine months of 2014 were 35�percent and 40 percent, respectively, compared with 45 percent for the same periods of 2013. The lower rates were primarily due to a smaller proportion of income in higher tax jurisdictions in 2014 and the election of the fair market value method of apportioning interest expense in the United States. The effective tax rate for the first nine months of 2013 was favorably impacted by the tax resolution associated with the sale of certain western Canada properties which occurred in a prior year.
For the first nine months of 2014, the effective tax rate in excess of the domestic federal statutory rate of 35�percent was primarily due to foreign taxes.
Note 20�New Accounting Standards
In May 2014 the Financial Accounting Standards Board (FASB) issued Accounting Standards Update (ASU) No.�2014-09, �Revenue from Contracts with Customers,� which outlines a single comprehensive model for entities to use in accounting for revenue arising from contracts with customers. This ASU supersedes the revenue recognition requirements in FASB Accounting Standards Codification (ASC) Topic 605, �Revenue Recognition,� and most industry-specific guidance. This ASU sets forth a five-step model for determining when and how revenue is recognized. Under the model, an entity will be required to recognize revenue to depict the transfer of goods or services to a customer at an amount reflecting the consideration it expects to receive in exchange for those goods or services. Additional disclosures will be required to describe the nature, amount, timing and uncertainty of revenue and cash flows arising from customer contracts. The ASU is effective for interim and annual periods beginning after December�15, 2016. Early adoption is not permitted. Entities may choose to adopt the standard using either a full retrospective approach or a modified retrospective approach. We are currently evaluating the impact of the adoption of this ASU.
�
24
Table of Contents
Supplementary Information�Condensed Consolidating Financial Information
We have various cross guarantees among ConocoPhillips, ConocoPhillips Company and ConocoPhillips Canada Funding Company I, with respect to publicly held debt securities. ConocoPhillips Company is 100�percent owned by ConocoPhillips. ConocoPhillips Canada Funding Company I is an indirect, 100 percent owned subsidiary of ConocoPhillips Company. ConocoPhillips and ConocoPhillips Company have fully and unconditionally guaranteed the payment obligations of ConocoPhillips Canada Funding Company I, with respect to its publicly held debt securities. Similarly, ConocoPhillips has fully and unconditionally guaranteed the payment obligations of ConocoPhillips Company with respect to its publicly held debt securities. In addition, ConocoPhillips Company has fully and unconditionally guaranteed the payment obligations of ConocoPhillips with respect to its publicly held debt securities. All guarantees are joint and several. The following condensed consolidating financial information presents the results of operations, financial position and cash flows for:
�
| � | � | � | ConocoPhillips, ConocoPhillips Company and ConocoPhillips Canada Funding Company I (in each case, reflecting investments in subsidiaries utilizing the equity method of accounting). |
�
| � | � | � | All other nonguarantor subsidiaries of ConocoPhillips. |
�
| � | � | � | The consolidating adjustments necessary to present ConocoPhillips� results on a consolidated basis. |
During 2013 ConocoPhillips Australia Funding Company�s guaranteed, publicly held debt was repaid. Beginning in the first quarter of 2014, financial information for ConocoPhillips Australia Funding Company is presented in the �All Other Subsidiaries� column of our condensed consolidating financial information.
In April 2014 ConocoPhillips received a $32 billion dividend from ConocoPhillips Company to settle certain accumulated intercompany balances.�This consisted of a $15 billion distribution of earnings and a $17 billion return of capital. The transaction was reflected in the second quarter 2014 Condensed Consolidating Financial Information for ConocoPhillips and ConocoPhillips Company and had no impact on our consolidated financial statements.
This condensed consolidating financial information should be read in conjunction with the accompanying consolidated financial statements and notes.
�
25
Table of Contents
| � | �� | Millions of Dollars | � | |||||||||||||||||||||
| � | �� | Three Months Ended September 30, 2014 | � | |||||||||||||||||||||
| Income Statement | �� | ConocoPhillips | � | � | ConocoPhillips Company |
� | � | ConocoPhillips Canada Funding Company I |
� | � | All Other Subsidiaries |
� | � | Consolidating Adjustments |
� | � | Total Consolidated |
� | ||||||
| Revenues and Other Income |
�� | � | � | � | � | � | ||||||||||||||||||
| Sales and other operating revenues |
�� | $ | � | �� | � | � | 4,672 | �� | � | � | � | �� | � | � | 7,408 | �� | � | � | � | �� | � | � | 12,080 | �� |
| Equity in earnings of affiliates |
�� | � | 1,722 | �� | � | � | 2,098 | �� | � | � | � | �� | � | � | 975 | �� | � | � | (4,031 | )� | � | � | 764 | �� |
| Gain on dispositions |
�� | � | � | �� | � | � | 2 | �� | � | � | � | �� | � | � | 2 | �� | � | � | � | �� | � | � | 4 | �� |
| Other income |
�� | � | 1 | �� | � | � | 15 | �� | � | � | � | �� | � | � | 53 | �� | � | � | � | �� | � | � | 69 | �� |
| Intercompany revenues |
�� | � | 20 | �� | � | � | 104 | �� | � | � | 72 | �� | � | � | 1,444 | �� | � | � | (1,640 | )� | � | � | � | �� |
| � |
� | |||||||||||||||||||||||
| Total Revenues and Other Income |
�� | � | 1,743 | �� | � | � | 6,891 | �� | � | � | 72 | �� | � | � | 9,882 | �� | � | � | (5,671 | )� | � | � | 12,917 | �� |
| � |
� | |||||||||||||||||||||||
| Costs and Expenses |
�� | � | � | � | � | � | ||||||||||||||||||
| Purchased commodities |
�� | � | � | �� | � | � | 4,036 | �� | � | � | � | �� | � | � | 2,139 | �� | � | � | (1,472 | )� | � | � | 4,703 | �� |
| Production and operating expenses |
�� | � | � | �� | � | � | 414 | �� | � | � | � | �� | � | � | 1,617 | �� | � | � | 10 | �� | � | � | 2,041 | �� |
| Selling, general and administrative expenses |
�� | � | 2 | �� | � | � | 136 | �� | � | � | 1 | �� | � | � | 65 | �� | � | � | (1 | )� | � | � | 203 | �� |
| Exploration expenses |
�� | � | � | �� | � | � | 331 | �� | � | � | � | �� | � | � | 128 | �� | � | � | � | �� | � | � | 459 | �� |
| Depreciation, depletion and amortization |
�� | � | � | �� | � | � | 273 | �� | � | � | � | �� | � | � | 1,823 | �� | � | � | � | �� | � | � | 2,096 | �� |
| Impairments |
�� | � | � | �� | � | � | 104 | �� | � | � | � | �� | � | � | 4 | �� | � | � | � | �� | � | � | 108 | �� |
| Taxes other than income taxes |
�� | � | � | �� | � | � | 69 | �� | � | � | � | �� | � | � | 424 | �� | � | � | � | �� | � | � | 493 | �� |
| Accretion on discounted liabilities |
�� | � | � | �� | � | � | 14 | �� | � | � | � | �� | � | � | 106 | �� | � | � | � | �� | � | � | 120 | �� |
| Interest and debt expense |
�� | � | 134 | �� | � | � | 77 | �� | � | � | 58 | �� | � | � | 57 | �� | � | � | (177 | )� | � | � | 149 | �� |
| Foreign currency transaction (gains) losses |
�� | � | 33 | �� | � | � | 3 | �� | � | � | (208 | )� | � | � | 164 | �� | � | � | � | �� | � | � | (8 | )� |
| � |
� | |||||||||||||||||||||||
| Total Costs and Expenses |
�� | � | 169 | �� | � | � | 5,457 | �� | � | � | (149 | )� | � | � | 6,527 | �� | � | � | (1,640 | )� | � | � | 10,364 | �� |
| � |
� | |||||||||||||||||||||||
| Income from continuing operations before income taxes |
�� | � | 1,574 | �� | � | � | 1,434 | �� | � | � | 221 | �� | � | � | 3,355 | �� | � | � | (4,031 | )� | � | � | 2,553 | �� |
| Provision (benefit) for income taxes |
�� | � | (52 | )� | � | � | (288 | )� | � | � | 9 | �� | � | � | 1,235 | �� | � | � | � | �� | � | � | 904 | �� |
| � |
� | |||||||||||||||||||||||
| Income From Continuing Operations |
�� | � | 1,626 | �� | � | � | 1,722 | �� | � | � | 212 | �� | � | � | 2,120 | �� | � | � | (4,031 | )� | � | � | 1,649 | �� |
| Income from discontinued operations |
�� | � | 1,078 | �� | � | � | 1,078 | �� | � | � | � | �� | � | � | 61 | �� | � | � | (1,139 | )� | � | � | 1,078 | �� |
| � |
� | |||||||||||||||||||||||
| Net income |
�� | � | 2,704 | �� | � | � | 2,800 | �� | � | � | 212 | �� | � | � | 2,181 | �� | � | � | (5,170 | )� | � | � | 2,727 | �� |
| Less: net income attributable to noncontrolling interests |
�� | � | � | �� | � | � | � | �� | � | � | � | �� | � | � | (23 | )� | � | � | � | �� | � | � | (23 | )� |
| � |
� | |||||||||||||||||||||||
| Net Income Attributable to ConocoPhillips |
�� | $ | 2,704 | �� | � | � | 2,800 | �� | � | � | 212 | �� | � | � | 2,158 | �� | � | � | (5,170 | )� | � | � | 2,704 | �� |
| � |
� | |||||||||||||||||||||||
| Comprehensive Income Attributable to ConocoPhillips |
�� | $ | 791 | �� | � | � | 887 | �� | � | � | 29 | �� | � | � | 255 | �� | � | � | (1,171 | )� | � | � | 791 | �� |
| � |
� | |||||||||||||||||||||||
�
| � | �� | Millions of Dollars | � | |||||||||||||||||||||||||
| � | �� | Three Months Ended September 30, 2013 | � | |||||||||||||||||||||||||
| Income Statement | �� | ConocoPhillips | � | � | ConocoPhillips Company |
� | � | ConocoPhillips Australia Funding Company |
� | �� | ConocoPhillips Canada Funding Company I |
� | � | All Other Subsidiaries |
� | � | Consolidating Adjustments |
� | � | Total Consolidated |
� | |||||||
| Revenues and Other Income |
�� | � | � | �� | � | � | � | |||||||||||||||||||||
| Sales and other operating revenues |
�� | $ | � | �� | � | � | 4,625 | �� | � | � | � | �� | �� | � | � | �� | � | � | 9,018 | �� | � | � | � | �� | � | � | 13,643 | �� |
| Equity in earnings of affiliates* |
�� | � | 2,502 | �� | � | � | 2,548 | �� | � | � | � | �� | �� | � | � | �� | � | � | 647 | �� | � | � | (4,988 | )� | � | � | 709 | �� |
| Gain on dispositions |
�� | � | � | �� | � | � | 418 | �� | � | � | � | �� | �� | � | � | �� | � | � | 651 | �� | � | � | � | �� | � | � | 1,069 | �� |
| Other income |
�� | � | � | �� | � | � | 29 | �� | � | � | � | �� | �� | � | � | �� | � | � | 20 | �� | � | � | � | �� | � | � | 49 | �� |
| Intercompany revenues* |
�� | � | 21 | �� | � | � | 106 | �� | � | � | � | �� | �� | � | 75 | �� | � | � | 1,338 | �� | � | � | (1,540 | )� | � | � | � | �� |
| � |
� | |||||||||||||||||||||||||||
| Total Revenues and Other Income |
�� | � | 2,523 | �� | � | � | 7,726 | �� | � | � | � | �� | �� | � | 75 | �� | � | � | 11,674 | �� | � | � | (6,528 | )� | � | � | 15,470 | �� |
| � |
� | |||||||||||||||||||||||||||
| Costs and Expenses |
�� | � | � | �� | � | � | � | |||||||||||||||||||||
| Purchased commodities |
�� | � | � | �� | � | � | 3,993 | �� | � | � | � | �� | �� | � | � | �� | � | � | 3,047 | �� | � | � | (1,332 | )� | � | � | 5,708 | �� |
| Production and operating expenses |
�� | � | � | �� | � | � | 385 | �� | � | � | � | �� | �� | � | � | �� | � | � | 1,580 | �� | � | � | (3 | )� | � | � | 1,962 | �� |
| Selling, general and administrative expenses |
�� | � | 3 | �� | � | � | 193 | �� | � | � | � | �� | �� | � | 1 | �� | � | � | 53 | �� | � | � | (1 | )� | � | � | 249 | �� |
| Exploration expenses |
�� | � | � | �� | � | � | 158 | �� | � | � | � | �� | �� | � | � | �� | � | � | 155 | �� | � | � | � | �� | � | � | 313 | �� |
| Depreciation, depletion and amortization |
�� | � | � | �� | � | � | 245 | �� | � | � | � | �� | �� | � | � | �� | � | � | 1,657 | �� | � | � | � | �� | � | � | 1,902 | �� |
| Impairments |
�� | � | � | �� | � | � | � | �� | � | � | � | �� | �� | � | � | �� | � | � | 1 | �� | � | � | � | �� | � | � | 1 | �� |
| Taxes other than income taxes |
�� | � | � | �� | � | � | 55 | �� | � | � | � | �� | �� | � | � | �� | � | � | 609 | �� | � | � | � | �� | � | � | 664 | �� |
| Accretion on discounted liabilities |
�� | � | � | �� | � | � | 14 | �� | � | � | � | �� | �� | � | � | �� | � | � | 92 | �� | � | � | � | �� | � | � | 106 | �� |
| Interest and debt expense* |
�� | � | 156 | �� | � | � | 86 | �� | � | � | � | �� | �� | � | 58 | �� | � | � | 55 | �� | � | � | (204 | )� | � | � | 151 | �� |
| Foreign currency transaction (gains) losses |
�� | � | (15 | )� | � | � | (1 | )� | � | � | � | �� | �� | � | 72 | �� | � | � | (47 | )� | � | � | � | �� | � | � | 9 | �� |
| � |
� | |||||||||||||||||||||||||||
| Total Costs and Expenses |
�� | � | 144 | �� | � | � | 5,128 | �� | � | � | � | �� | �� | � | 131 | �� | � | � | 7,202 | �� | � | � | (1,540 | )� | � | � | 11,065 | �� |
| � |
� | |||||||||||||||||||||||||||
| Income (loss) from continuing operations before income taxes |
�� | � | 2,379 | �� | � | � | 2,598 | �� | � | � | � | �� | �� | � | (56 | )� | � | � | 4,472 | �� | � | � | (4,988 | )� | � | � | 4,405 | �� |
| Provision (benefit) for income taxes |
�� | � | (44 | )� | � | � | 96 | �� | � | � | � | �� | �� | � | 7 | �� | � | � | 1,907 | �� | � | � | � | �� | � | � | 1,966 | �� |
| � |
� | |||||||||||||||||||||||||||
| Income (Loss) From Continuing Operations |
�� | � | 2,423 | �� | � | � | 2,502 | �� | � | � | � | �� | �� | � | (63 | )� | � | � | 2,565 | �� | � | � | (4,988 | )� | � | � | 2,439 | �� |
| Income from discontinued operations |
�� | � | 57 | �� | � | � | 57 | �� | � | � | � | �� | �� | � | � | �� | � | � | 57 | �� | � | � | (114 | )� | � | � | 57 | �� |
| � |
� | |||||||||||||||||||||||||||
| Net income (loss) |
�� | � | 2,480 | �� | � | � | 2,559 | �� | � | � | � | �� | �� | � | (63 | )� | � | � | 2,622 | �� | � | � | (5,102 | )� | � | � | 2,496 | �� |
| Less: net income attributable to noncontrolling interests |
�� | � | � | �� | � | � | � | �� | � | � | � | �� | �� | � | � | �� | � | � | (16 | )� | � | � | � | �� | � | � | (16 | )� |
| � |
� | |||||||||||||||||||||||||||
| Net Income (Loss) Attributable to ConocoPhillips |
�� | $ | 2,480 | �� | � | � | 2,559 | �� | � | � | � | �� | �� | � | (63 | )� | � | � | 2,606 | �� | � | � | (5,102 | )� | � | � | 2,480 | �� |
| � |
� | |||||||||||||||||||||||||||
| Comprehensive Income Attributable to ConocoPhillips |
�� | $ | 3,352 | �� | � | � | 3,431 | �� | � | � | � | �� | �� | � | 17 | �� | � | � | 3,212 | �� | � | � | (6,660 | )� | � | � | 3,352 | �� |
| � |
� | |||||||||||||||||||||||||||
*�Interest and debt expense� for ConocoPhillips was revised to reflect contractually agreed interest rates, with offsetting adjustments in the �Equity in earnings of affiliates� and �Intercompany revenues� lines for ConocoPhillips, ConocoPhillips Company and All Other Subsidiaries. There was no impact to Total Consolidated balances.
�
26
Table of Contents
| � | �� | Millions of Dollars | � | |||||||||||||||||||||
| � | �� | Nine Months Ended September 30, 2014 | � | |||||||||||||||||||||
| Income Statement | �� | ConocoPhillips | � | � | ConocoPhillips Company |
� | � | ConocoPhillips Canada Funding Company I |
� | � | All Other Subsidiaries |
� | � | Consolidating Adjustments |
� | � | Total Consolidated |
� | ||||||
| Revenues and Other Income |
�� | � | � | � | � | � | ||||||||||||||||||
| Sales and other operating revenues |
�� | $ | � | �� | � | � | 15,920 | �� | � | � | � | �� | � | � | 25,396 | �� | � | � | � | �� | � | � | 41,316 | �� |
| Equity in earnings of affiliates |
�� | � | 6,053 | �� | � | � | 7,063 | �� | � | � | � | �� | � | � | 2,235 | �� | � | � | (13,343 | )� | � | � | 2,008 | �� |
| Gain on dispositions |
�� | � | � | �� | � | � | 3 | �� | � | � | � | �� | � | � | 17 | �� | � | � | � | �� | � | � | 20 | �� |
| Other income |
�� | � | 1 | �� | � | � | 60 | �� | � | � | � | �� | � | � | 261 | �� | � | � | � | �� | � | � | 322 | �� |
| Intercompany revenues |
�� | � | 59 | �� | � | � | 369 | �� | � | � | 214 | �� | � | � | 4,685 | �� | � | � | (5,327 | )� | � | � | � | �� |
| � |
� | |||||||||||||||||||||||
| Total Revenues and Other Income |
�� | � | 6,113 | �� | � | � | 23,415 | �� | � | � | 214 | �� | � | � | 32,594 | �� | � | � | (18,670 | )� | � | � | 43,666 | �� |
| � |
� | |||||||||||||||||||||||
| Costs and Expenses |
�� | � | � | � | � | � | ||||||||||||||||||
| Purchased commodities |
�� | � | � | �� | � | � | 13,984 | �� | � | � | � | �� | � | � | 8,060 | �� | � | � | (4,719 | )� | � | � | 17,325 | �� |
| Production and operating expenses |
�� | � | � | �� | � | � | 1,255 | �� | � | � | � | �� | � | � | 4,751 | �� | � | � | (40 | )� | � | � | 5,966 | �� |
| Selling, general and administrative expenses |
�� | � | 8 | �� | � | � | 416 | �� | � | � | 1 | �� | � | � | 193 | �� | � | � | (15 | )� | � | � | 603 | �� |
| Exploration expenses |
�� | � | � | �� | � | � | 713 | �� | � | � | � | �� | � | � | 559 | �� | � | � | � | �� | � | � | 1,272 | �� |
| Depreciation, depletion and amortization |
�� | � | � | �� | � | � | 776 | �� | � | � | � | �� | � | � | 5,282 | �� | � | � | � | �� | � | � | 6,058 | �� |
| Impairments |
�� | � | � | �� | � | � | 122 | �� | � | � | � | �� | � | � | 4 | �� | � | � | � | �� | � | � | 126 | �� |
| Taxes other than income taxes |
�� | � | � | �� | � | � | 233 | �� | � | � | � | �� | � | � | 1,523 | �� | � | � | � | �� | � | � | 1,756 | �� |
| Accretion on discounted liabilities |
�� | � | � | �� | � | � | 43 | �� | � | � | � | �� | � | � | 314 | �� | � | � | � | �� | � | � | 357 | �� |
| Interest and debt expense |
�� | � | 441 | �� | � | � | 209 | �� | � | � | 174 | �� | � | � | 204 | �� | � | � | (553 | )� | � | � | 475 | �� |
| Foreign currency transaction (gains) losses |
�� | � | 36 | �� | � | � | 5 | �� | � | � | (196 | )� | � | � | 172 | �� | � | � | � | �� | � | � | 17 | �� |
| � |
� | |||||||||||||||||||||||
| Total Costs and Expenses |
�� | � | 485 | �� | � | � | 17,756 | �� | � | � | (21 | )� | � | � | 21,062 | �� | � | � | (5,327 | )� | � | � | 33,955 | �� |
| � |
� | |||||||||||||||||||||||
| Income from continuing operations before income taxes |
�� | � | 5,628 | �� | � | � | 5,659 | �� | � | � | 235 | �� | � | � | 11,532 | �� | � | � | (13,343 | )� | � | � | 9,711 | �� |
| Provision (benefit) for income taxes |
�� | � | (149 | )� | � | � | (394 | )� | � | � | 7 | �� | � | � | 4,416 | �� | � | � | � | �� | � | � | 3,880 | �� |
| � |
� | |||||||||||||||||||||||
| Income From Continuing Operations |
�� | � | 5,777 | �� | � | � | 6,053 | �� | � | � | 228 | �� | � | � | 7,116 | �� | � | � | (13,343 | )� | � | � | 5,831 | �� |
| Income from discontinued operations |
�� | � | 1,131 | �� | � | � | 1,131 | �� | � | � | � | �� | � | � | 114 | �� | � | � | (1,245 | )� | � | � | 1,131 | �� |
| � |
� | |||||||||||||||||||||||
| Net income |
�� | � | 6,908 | �� | � | � | 7,184 | �� | � | � | 228 | �� | � | � | 7,230 | �� | � | � | (14,588 | )� | � | � | 6,962 | �� |
| Less: net income attributable to noncontrolling interests |
�� | � | � | �� | � | � | � | �� | � | � | � | �� | � | � | (54 | )� | � | � | � | �� | � | � | (54 | )� |
| � |
� | |||||||||||||||||||||||
| Net Income Attributable to ConocoPhillips |
�� | $ | 6,908 | �� | � | � | 7,184 | �� | � | � | 228 | �� | � | � | 7,176 | �� | � | � | (14,588 | )� | � | � | 6,908 | �� |
| � |
� | |||||||||||||||||||||||
| Comprehensive Income Attributable to ConocoPhillips |
�� | $ | 5,491 | �� | � | � | 5,767 | �� | � | � | 24 | �� | � | � | 5,730 | �� | � | � | (11,521 | )� | � | � | 5,491 | �� |
| � |
� | |||||||||||||||||||||||
�
| � | �� | Millions of Dollars | � | |||||||||||||||||||||||||
| � | �� | Nine Months Ended September 30, 2013 | � | |||||||||||||||||||||||||
| Income Statement | �� | ConocoPhillips | � | � | ConocoPhillips Company |
� | �� | ConocoPhillips Australia Funding Company |
� | �� | ConocoPhillips Canada Funding Company I |
� | � | All Other Subsidiaries |
� | � | Consolidating Adjustments |
� | � | Total Consolidated |
� | |||||||
| Revenues and Other Income |
�� | � | �� | �� | � | � | � | |||||||||||||||||||||
| Sales and other operating revenues |
�� | $ | � | �� | � | � | 13,710 | �� | �� | � | � | �� | �� | � | � | �� | � | � | 27,449 | �� | � | � | � | �� | � | � | 41,159 | �� |
| Equity in earnings of affiliates* |
�� | � | 6,771 | �� | � | � | 7,234 | �� | �� | � | � | �� | �� | � | � | �� | � | � | 1,803 | �� | � | � | (14,243 | )� | � | � | 1,565 | �� |
| Gain on dispositions |
�� | � | � | �� | � | � | 419 | �� | �� | � | � | �� | �� | � | � | �� | � | � | 803 | �� | � | � | � | �� | � | � | 1,222 | �� |
| Other income |
�� | � | 1 | �� | � | � | 237 | �� | �� | � | � | �� | �� | � | � | �� | � | � | 79 | �� | � | � | � | �� | � | � | 317 | �� |
| Intercompany revenues* |
�� | � | 62 | �� | � | � | 341 | �� | �� | � | 13 | �� | �� | � | 229 | �� | � | � | 3,723 | �� | � | � | (4,368 | )� | � | � | � | �� |
| � |
� | |||||||||||||||||||||||||||
| Total Revenues and Other Income |
�� | � | 6,834 | �� | � | � | 21,941 | �� | �� | � | 13 | �� | �� | � | 229 | �� | � | � | 33,857 | �� | � | � | (18,611 | )� | � | � | 44,263 | �� |
| � |
� | |||||||||||||||||||||||||||
| Costs and Expenses |
�� | � | �� | �� | � | � | � | |||||||||||||||||||||
| Purchased commodities |
�� | � | � | �� | � | � | 11,901 | �� | �� | � | � | �� | �� | � | � | �� | � | � | 8,868 | �� | � | � | (3,706 | )� | � | � | 17,063 | �� |
| Production and operating expenses |
�� | � | � | �� | � | � | 1,106 | �� | �� | � | � | �� | �� | � | � | �� | � | � | 4,238 | �� | � | � | (23 | )� | � | � | 5,321 | �� |
| Selling, general and administrative expenses |
�� | � | 9 | �� | � | � | 443 | �� | �� | � | � | �� | �� | � | 1 | �� | � | � | 173 | �� | � | � | (19 | )� | � | � | 607 | �� |
| Exploration expenses |
�� | � | � | �� | � | � | 491 | �� | �� | � | � | �� | �� | � | � | �� | � | � | 420 | �� | � | � | � | �� | � | � | 911 | �� |
| Depreciation, depletion and amortization |
�� | � | � | �� | � | � | 674 | �� | �� | � | � | �� | �� | � | � | �� | � | � | 4,867 | �� | � | � | � | �� | � | � | 5,541 | �� |
| Impairments |
�� | � | � | �� | � | � | � | �� | �� | � | � | �� | �� | � | � | �� | � | � | 31 | �� | � | � | � | �� | � | � | 31 | �� |
| Taxes other than income taxes |
�� | � | � | �� | � | � | 180 | �� | �� | � | � | �� | �� | � | � | �� | � | � | 2,018 | �� | � | � | � | �� | � | � | 2,198 | �� |
| Accretion on discounted liabilities |
�� | � | � | �� | � | � | 42 | �� | �� | � | � | �� | �� | � | � | �� | � | � | 275 | �� | � | � | � | �� | � | � | 317 | �� |
| Interest and debt expense* |
�� | � | 467 | �� | � | � | 246 | �� | �� | � | 12 | �� | �� | � | 176 | �� | � | � | 139 | �� | � | � | (620 | )� | � | � | 420 | �� |
| Foreign currency transaction (gains) losses |
�� | � | 26 | �� | � | � | 8 | �� | �� | � | � | �� | �� | � | (209 | )� | � | � | 141 | �� | � | � | � | �� | � | � | (34 | )� |
| � |
� | |||||||||||||||||||||||||||
| Total Costs and Expenses |
�� | � | 502 | �� | � | � | 15,091 | �� | �� | � | 12 | �� | �� | � | (32 | )� | � | � | 21,170 | �� | � | � | (4,368 | )� | � | � | 32,375 | �� |
| � |
� | |||||||||||||||||||||||||||
| Income from continuing operations before income taxes |
�� | � | 6,332 | �� | � | � | 6,850 | �� | �� | � | 1 | �� | �� | � | 261 | �� | � | � | 12,687 | �� | � | � | (14,243 | )� | � | � | 11,888 | �� |
| Provision (benefit) for income taxes |
�� | � | (154 | )� | � | � | 79 | �� | �� | � | � | �� | �� | � | 28 | �� | � | � | 5,406 | �� | � | � | � | �� | � | � | 5,359 | �� |
| � |
� | |||||||||||||||||||||||||||
| Income From Continuing Operations |
�� | � | 6,486 | �� | � | � | 6,771 | �� | �� | � | 1 | �� | �� | � | 233 | �� | � | � | 7,281 | �� | � | � | (14,243 | )� | � | � | 6,529 | �� |
| Income from discontinued operations |
�� | � | 183 | �� | � | � | 183 | �� | �� | � | � | �� | �� | � | � | �� | � | � | 183 | �� | � | � | (366 | )� | � | � | 183 | �� |
| � |
� | |||||||||||||||||||||||||||
| Net income |
�� | � | 6,669 | �� | � | � | 6,954 | �� | �� | � | 1 | �� | �� | � | 233 | �� | � | � | 7,464 | �� | � | � | (14,609 | )� | � | � | 6,712 | �� |
| Less: net income attributable to noncontrolling interests |
�� | � | � | �� | � | � | � | �� | �� | � | � | �� | �� | � | � | �� | � | � | (43 | )� | � | � | � | �� | � | � | (43 | )� |
| � |
� | |||||||||||||||||||||||||||
| Net Income Attributable to ConocoPhillips |
�� | $ | 6,669 | �� | � | � | 6,954 | �� | �� | � | 1 | �� | �� | � | 233 | �� | � | � | 7,421 | �� | � | � | (14,609 | )� | � | � | 6,669 | �� |
| � |
� | |||||||||||||||||||||||||||
| Comprehensive Income Attributable to ConocoPhillips |
�� | $ | 5,294 | �� | � | � | 5,579 | �� | �� | � | 1 | �� | �� | � | 88 | �� | � | � | 5,747 | �� | � | � | (11,415 | )� | � | � | 5,294 | �� |
| � |
� | |||||||||||||||||||||||||||
*�Interest and debt expense� for ConocoPhillips was revised to reflect contractually agreed interest rates, with offsetting adjustments in the �Equity in earnings of affiliates� and �Intercompany revenues� lines for ConocoPhillips, ConocoPhillips Company and All Other Subsidiaries. There was no impact to Total Consolidated balances.
�
27
Table of Contents
| � | �� | Millions of Dollars | � | |||||||||||||||||||||
| � | �� | September 30, 2014 | � | |||||||||||||||||||||
| Balance Sheet | �� | ConocoPhillips | � | �� | ConocoPhillips Company |
� | �� | ConocoPhillips Canada Funding Company I |
� | � | All Other Subsidiaries |
� | �� | Consolidating Adjustments |
� | � | Total Consolidated |
� | ||||||
| Assets |
�� | �� | �� | � | �� | � | ||||||||||||||||||
| Cash and cash equivalents |
�� | $ | � | �� | �� | � | 1,182 | �� | �� | � | 239 | �� | � | � | 3,987 | �� | �� | � | � | �� | � | � | 5,408 | �� |
| Short-term investments |
�� | � | � | �� | �� | � | � | �� | �� | � | � | �� | � | � | 374 | �� | �� | � | � | �� | � | � | 374 | �� |
| Accounts and notes receivable |
�� | � | 22 | �� | �� | � | 3,102 | �� | �� | � | 17 | �� | � | � | 7,266 | �� | �� | � | (2,954 | )� | � | � | 7,453 | �� |
| Inventories |
�� | � | � | �� | �� | � | 248 | �� | �� | � | � | �� | � | � | 1,082 | �� | �� | � | � | �� | � | � | 1,330 | �� |
| Prepaid expenses and other current assets |
�� | � | 11 | �� | �� | � | 626 | �� | �� | � | 12 | �� | � | � | 1,086 | �� | �� | � | (47 | )� | � | � | 1,688 | �� |
| � |
� | |||||||||||||||||||||||
| Total Current Assets |
�� | � | 33 | �� | �� | � | 5,158 | �� | �� | � | 268 | �� | � | � | 13,795 | �� | �� | � | (3,001 | )� | � | � | 16,253 | �� |
| Investments, loans and long-term receivables* |
�� | � | 60,564 | �� | �� | � | 75,338 | �� | �� | � | 4,105 | �� | � | � | 36,674 | �� | �� | � | (150,864 | )� | � | � | 25,817 | �� |
| Net properties, plants and equipment |
�� | � | � | �� | �� | � | 9,554 | �� | �� | � | � | �� | � | � | 66,236 | �� | �� | � | � | �� | � | � | 75,790 | �� |
| Other assets |
�� | � | 42 | �� | �� | � | 289 | �� | �� | � | 144 | �� | � | � | 1,419 | �� | �� | � | (768 | )� | � | � | 1,126 | �� |
| � |
� | |||||||||||||||||||||||
| Total Assets |
�� | $ | 60,639 | �� | �� | � | 90,339 | �� | �� | � | 4,517 | �� | � | � | 118,124 | �� | �� | � | (154,633 | )� | � | � | 118,986 | �� |
| � |
� | |||||||||||||||||||||||
| Liabilities and Stockholders� Equity |
�� | �� | �� | � | �� | � | ||||||||||||||||||
| Accounts payable |
�� | $ | 1 | �� | �� | � | 4,114 | �� | �� | � | 6 | �� | � | � | 7,525 | �� | �� | � | (2,954 | )� | � | � | 8,692 | �� |
| Short-term debt |
�� | � | 1,498 | �� | �� | � | 6 | �� | �� | � | 6 | �� | � | � | 178 | �� | �� | � | � | �� | � | � | 1,688 | �� |
| Accrued income and other taxes |
�� | � | � | �� | �� | � | 83 | �� | �� | � | � | �� | � | � | 1,572 | �� | �� | � | � | �� | � | � | 1,655 | �� |
| Employee benefit obligations |
�� | � | � | �� | �� | � | 496 | �� | �� | � | � | �� | � | � | 217 | �� | �� | � | � | �� | � | � | 713 | �� |
| Other accruals |
�� | � | 115 | �� | �� | � | 330 | �� | �� | � | 99 | �� | � | � | 896 | �� | �� | � | (47 | )� | � | � | 1,393 | �� |
| � |
� | |||||||||||||||||||||||
| Total Current Liabilities |
�� | � | 1,614 | �� | �� | � | 5,029 | �� | �� | � | 111 | �� | � | � | 10,388 | �� | �� | � | (3,001 | )� | � | � | 14,141 | �� |
| Long-term debt |
�� | � | 7,539 | �� | �� | � | 5,204 | �� | �� | � | 2,976 | �� | � | � | 3,780 | �� | �� | � | � | �� | � | � | 19,499 | �� |
| Asset retirement obligations and accrued environmental costs |
�� | � | � | �� | �� | � | 1,330 | �� | �� | � | � | �� | � | � | 8,473 | �� | �� | � | � | �� | � | � | 9,803 | �� |
| Deferred income taxes |
�� | � | � | �� | �� | � | 663 | �� | �� | � | � | �� | � | � | 15,429 | �� | �� | � | (8 | )� | � | � | 16,084 | �� |
| Employee benefit obligations |
�� | � | � | �� | �� | � | 1,639 | �� | �� | � | � | �� | � | � | 580 | �� | �� | � | � | �� | � | � | 2,219 | �� |
| Other liabilities and deferred credits* |
�� | � | 2,770 | �� | �� | � | 10,942 | �� | �� | � | 1,454 | �� | � | � | 19,443 | �� | �� | � | (33,030 | )� | � | � | 1,579 | �� |
| � |
� | |||||||||||||||||||||||
| Total Liabilities |
�� | � | 11,923 | �� | �� | � | 24,807 | �� | �� | � | 4,541 | �� | � | � | 58,093 | �� | �� | � | (36,039 | )� | � | � | 63,325 | �� |
| Retained earnings |
�� | � | 38,930 | �� | �� | � | 23,893 | �� | �� | � | (1,272 | )� | � | � | 19,326 | �� | �� | � | (35,426 | )� | � | � | 45,451 | �� |
| Other common stockholders� equity |
�� | � | 9,786 | �� | �� | � | 41,639 | �� | �� | � | 1,248 | �� | � | � | 40,318 | �� | �� | � | (83,168 | )� | � | � | 9,823 | �� |
| Noncontrolling interests |
�� | � | � | �� | �� | � | � | �� | �� | � | � | �� | � | � | 387 | �� | �� | � | � | �� | � | � | 387 | �� |
| � |
� | |||||||||||||||||||||||
| Total Liabilities and Stockholders� Equity |
�� | $ | 60,639 | �� | �� | � | 90,339 | �� | �� | � | 4,517 | �� | � | � | 118,124 | �� | �� | � | (154,633 | )� | � | � | 118,986 | �� |
| � |
� | |||||||||||||||||||||||
| *Includes intercompany loans. | �� | �� | �� | � | �� | � | ||||||||||||||||||
�
| � | �� | Millions of Dollars | � | |||||||||||||||||||||||||
| � | �� | December 31, 2013 | � | |||||||||||||||||||||||||
| Balance Sheet | �� | ConocoPhillips | � | �� | ConocoPhillips Company |
� | �� | ConocoPhillips Australia Funding Company |
� | �� | ConocoPhillips Canada Funding Company I |
� | � | All Other Subsidiaries |
� | �� | Consolidating Adjustments |
� | � | Total Consolidated |
� | |||||||
| Assets |
�� | �� | �� | �� | � | �� | � | |||||||||||||||||||||
| Cash and cash equivalents |
�� | $ | � | �� | �� | � | 2,434 | �� | �� | � | � | �� | �� | � | 229 | �� | � | � | 3,583 | �� | �� | � | � | �� | � | � | 6,246 | �� |
| Short-term investments |
�� | � | � | �� | �� | � | � | �� | �� | � | � | �� | �� | � | � | �� | � | � | 272 | �� | �� | � | � | �� | � | � | 272 | �� |
| Accounts and notes receivable |
�� | � | 73 | �� | �� | � | 2,122 | �� | �� | � | 2 | �� | �� | � | � | �� | � | � | 9,267 | �� | �� | � | (2,977 | )� | � | � | 8,487 | �� |
| Inventories |
�� | � | � | �� | �� | � | 174 | �� | �� | � | � | �� | �� | � | � | �� | � | � | 1,020 | �� | �� | � | � | �� | � | � | 1,194 | �� |
| Prepaid expenses and other current assets |
�� | � | 20 | �� | �� | � | 535 | �� | �� | � | � | �� | �� | � | 35 | �� | � | � | 2,311 | �� | �� | � | (77 | )� | � | � | 2,824 | �� |
| � |
� | |||||||||||||||||||||||||||
| Total Current Assets |
�� | � | 93 | �� | �� | � | 5,265 | �� | �� | � | 2 | �� | �� | � | 264 | �� | � | � | 16,453 | �� | �� | � | (3,054 | )� | � | � | 19,023 | �� |
| Investments, loans and long-term receivables* |
�� | � | 86,836 | �� | �� | � | 100,052 | �� | �� | � | � | �� | �� | � | 4,259 | �� | � | � | 34,795 | �� | �� | � | (200,678 | )� | � | � | 25,264 | �� |
| Net properties, plants and equipment |
�� | � | � | �� | �� | � | 9,313 | �� | �� | � | � | �� | �� | � | � | �� | � | � | 63,514 | �� | �� | � | � | �� | � | � | 72,827 | �� |
| Other assets |
�� | � | 38 | �� | �� | � | 260 | �� | �� | � | � | �� | �� | � | 103 | �� | � | � | 1,394 | �� | �� | � | (852 | )� | � | � | 943 | �� |
| � |
� | |||||||||||||||||||||||||||
| Total Assets |
�� | $ | 86,967 | �� | �� | � | 114,890 | �� | �� | � | 2 | �� | �� | � | 4,626 | �� | � | � | 116,156 | �� | �� | � | (204,584 | )� | � | � | 118,057 | �� |
| � |
� | |||||||||||||||||||||||||||
| Liabilities and Stockholders� Equity |
�� | �� | �� | �� | � | �� | � | |||||||||||||||||||||
| Accounts payable |
�� | $ | � | �� | �� | � | 3,388 | �� | �� | � | � | �� | �� | � | 4 | �� | � | � | 8,899 | �� | �� | � | (2,977 | )� | � | � | 9,314 | �� |
| Short-term debt |
�� | � | 395 | �� | �� | � | 4 | �� | �� | � | � | �� | �� | � | 5 | �� | � | � | 185 | �� | �� | � | � | �� | � | � | 589 | �� |
| Accrued income and other taxes |
�� | � | � | �� | �� | � | 223 | �� | �� | � | � | �� | �� | � | � | �� | � | � | 2,517 | �� | �� | � | (27 | )� | � | � | 2,713 | �� |
| Employee benefit obligations |
�� | � | � | �� | �� | � | 566 | �� | �� | � | � | �� | �� | � | � | �� | � | � | 276 | �� | �� | � | � | �� | � | � | 842 | �� |
| Other accruals |
�� | � | 210 | �� | �� | � | 639 | �� | �� | � | � | �� | �� | � | 81 | �� | � | � | 790 | �� | �� | � | (49 | )� | � | � | 1,671 | �� |
| � |
� | |||||||||||||||||||||||||||
| Total Current Liabilities |
�� | � | 605 | �� | �� | � | 4,820 | �� | �� | � | � | �� | �� | � | 90 | �� | � | � | 12,667 | �� | �� | � | (3,053 | )� | � | � | 15,129 | �� |
| Long-term debt |
�� | � | 9,047 | �� | �� | � | 5,208 | �� | �� | � | � | �� | �� | � | 2,980 | �� | � | � | 3,838 | �� | �� | � | � | �� | � | � | 21,073 | �� |
| Asset retirement obligations and accrued environmental costs |
�� | � | � | �� | �� | � | 1,289 | �� | �� | � | � | �� | �� | � | � | �� | � | � | 8,594 | �� | �� | � | � | �� | � | � | 9,883 | �� |
| Deferred income taxes |
�� | � | 94 | �� | �� | � | 557 | �� | �� | � | � | �� | �� | � | � | �� | � | � | 14,569 | �� | �� | � | � | �� | � | � | 15,220 | �� |
| Employee benefit obligations |
�� | � | � | �� | �� | � | 1,791 | �� | �� | � | � | �� | �� | � | � | �� | � | � | 668 | �� | �� | � | � | �� | � | � | 2,459 | �� |
| Other liabilities and deferred credits* |
�� | � | 31,693 | �� | �� | � | 9,422 | �� | �� | � | � | �� | �� | � | 1,603 | �� | � | � | 22,204 | �� | �� | � | (63,121 | )� | � | � | 1,801 | �� |
| � |
� | |||||||||||||||||||||||||||
| Total Liabilities |
�� | � | 41,439 | �� | �� | � | 23,087 | �� | �� | � | � | �� | �� | � | 4,673 | �� | � | � | 62,540 | �� | �� | � | (66,174 | )� | � | � | 65,565 | �� |
| Retained earnings |
�� | � | 34,636 | �� | �� | � | 31,835 | �� | �� | � | � | �� | �� | � | (1,500 | )� | � | � | 12,848 | �� | �� | � | (36,659 | )� | � | � | 41,160 | �� |
| Other common stockholders� equity |
�� | � | 10,892 | �� | �� | � | 59,968 | �� | �� | � | 2 | �� | �� | � | 1,453 | �� | � | � | 40,366 | �� | �� | � | (101,751 | )� | � | � | 10,930 | �� |
| Noncontrolling interests |
�� | � | � | �� | �� | � | � | �� | �� | � | � | �� | �� | � | � | �� | � | � | 402 | �� | �� | � | � | �� | � | � | 402 | �� |
| � |
� | |||||||||||||||||||||||||||
| Total Liabilities and Stockholders� Equity |
�� | $ | 86,967 | �� | �� | � | 114,890 | �� | �� | � | 2 | �� | �� | � | 4,626 | �� | � | � | 116,156 | �� | �� | � | (204,584 | )� | � | � | 118,057 | �� |
| � |
� | |||||||||||||||||||||||||||
| *Includes intercompany loans. | �� | �� | �� | �� | � | �� | � | |||||||||||||||||||||
�
28
Table of Contents
| � | �� | Millions of Dollars | � | |||||||||||||||||||||
| � | �� | Nine Months Ended September 30, 2014 | � | |||||||||||||||||||||
| Statement of Cash Flows | �� | ConocoPhillips | � | � | ConocoPhillips Company |
� | � | ConocoPhillips Canada Funding Company I |
� | �� | All Other Subsidiaries |
� | � | Consolidating Adjustments |
� | � | Total Consolidated |
� | ||||||
| Cash Flows From Operating Activities |
�� | � | � | �� | � | � | ||||||||||||||||||
| Net cash provided by (used in) continuing operating activities |
�� | $ | 14,722 | �� | � | � | (146 | )� | � | � | 10 | �� | �� | � | 14,423 | �� | � | � | (15,014 | )� | � | � | 13,995 | �� |
| Net cash provided by discontinued operations |
�� | � | � | �� | � | � | 202 | �� | � | � | � | �� | �� | � | 394 | �� | � | � | (453 | )� | � | � | 143 | �� |
| � |
� | |||||||||||||||||||||||
| Net Cash Provided by Operating Activities |
�� | � | 14,722 | �� | � | � | 56 | �� | � | � | 10 | �� | �� | � | 14,817 | �� | � | � | (15,467 | )� | � | � | 14,138 | �� |
| � |
� | |||||||||||||||||||||||
| Cash Flows From Investing Activities |
�� | � | � | �� | � | � | ||||||||||||||||||
| Capital expenditures and investments |
�� | � | � | �� | � | � | (3,235 | )� | � | � | � | �� | �� | � | (11,132 | )� | � | � | 1,638 | �� | � | � | (12,729 | )� |
| Proceeds from asset dispositions |
�� | � | 16,912 | �� | � | � | 1,386 | �� | � | � | � | �� | �� | � | 105 | �� | � | � | (16,969 | )� | � | � | 1,434 | �� |
| Net purchases of short-term investments |
�� | � | � | �� | � | � | � | �� | � | � | � | �� | �� | � | (109 | )� | � | � | � | �� | � | � | (109 | )� |
| Long-term advances/loans�related parties |
�� | � | � | �� | � | � | (635 | )� | � | � | � | �� | �� | � | (7 | )� | � | � | 642 | �� | � | � | � | �� |
| Collection of advances/loans�related parties |
�� | � | � | �� | � | � | 47 | �� | � | � | � | �� | �� | � | 112 | �� | � | � | (16 | )� | � | � | 143 | �� |
| Intercompany cash management |
�� | � | (28,922 | )� | � | � | 33,392 | �� | � | � | � | �� | �� | � | (4,470 | )� | � | � | � | �� | � | � | � | �� |
| Other |
�� | � | � | �� | � | � | (429 | )� | � | � | � | �� | �� | � | (25 | )� | � | � | � | �� | � | � | (454 | )� |
| � |
� | |||||||||||||||||||||||
| Net cash provided by (used in) continuing investing activities |
�� | � | (12,010 | )� | � | � | 30,526 | �� | � | � | � | �� | �� | � | (15,526 | )� | � | � | (14,705 | )� | � | � | (11,715 | )� |
| Net cash provided by (used in) discontinued operations |
�� | � | � | �� | � | � | 133 | �� | � | � | � | �� | �� | � | (59 | )� | � | � | (133 | )� | � | � | (59 | )� |
| � |
� | |||||||||||||||||||||||
| Net Cash Provided by (Used in) Investing Activities |
�� | � | (12,010 | )� | � | � | 30,659 | �� | � | � | � | �� | �� | � | (15,585 | )� | � | � | (14,838 | )� | � | � | (11,774 | )� |
| � |
� | |||||||||||||||||||||||
| Cash Flows From Financing Activities |
�� | � | � | �� | � | � | ||||||||||||||||||
| Issuance of debt |
�� | � | � | �� | � | � | � | �� | � | � | � | �� | �� | � | 642 | �� | � | � | (642 | )� | � | � | � | �� |
| Repayment of debt |
�� | � | (400 | )� | � | � | (16 | )� | � | � | � | �� | �� | � | (105 | )� | � | � | 16 | �� | � | � | (505 | )� |
| Issuance of company common stock |
�� | � | 308 | �� | � | � | � | �� | � | � | � | �� | �� | � | � | �� | � | � | (281 | )� | � | � | 27 | �� |
| Dividends paid |
�� | � | (2,618 | )� | � | � | (15,088 | )� | � | � | � | �� | �� | � | (458 | )� | � | � | 15,546 | �� | � | � | (2,618 | )� |
| Other |
�� | � | (2 | )� | � | � | (16,863 | )� | � | � | � | �� | �� | � | 1,514 | �� | � | � | 15,331 | �� | � | � | (20 | )� |
| � |
� | |||||||||||||||||||||||
| Net cash provided by (used in) continuing financing activities |
�� | � | (2,712 | )� | � | � | (31,967 | )� | � | � | � | �� | �� | � | 1,593 | �� | � | � | 29,970 | �� | � | � | (3,116 | )� |
| Net cash used in discontinued operations |
�� | � | � | �� | � | � | � | �� | � | � | � | �� | �� | � | (335 | )� | � | � | 335 | �� | � | � | � | �� |
| � |
� | |||||||||||||||||||||||
| Net Cash Provided by (Used in) Financing Activities |
�� | � | (2,712 | )� | � | � | (31,967 | )� | � | � | � | �� | �� | � | 1,258 | �� | � | � | 30,305 | �� | � | � | (3,116 | )� |
| � |
� | |||||||||||||||||||||||
| Effect of Exchange Rate Changes on Cash and Cash Equivalents |
�� | � | � | �� | � | � | � | �� | � | � | � | �� | �� | � | (86 | )� | � | � | � | �� | � | � | (86 | )� |
| � |
� | |||||||||||||||||||||||
| Net Change in Cash and Cash Equivalents |
�� | � | � | �� | � | � | (1,252 | )� | � | � | 10 | �� | �� | � | 404 | �� | � | � | � | �� | � | � | (838 | )� |
| Cash and cash equivalents at beginning of period |
�� | � | � | �� | � | � | 2,434 | �� | � | � | 229 | �� | �� | � | 3,583 | �� | � | � | � | �� | � | � | 6,246 | �� |
| � |
� | |||||||||||||||||||||||
| Cash and Cash Equivalents at End of Period |
�� | $ | � | �� | � | � | 1,182 | �� | � | � | 239 | �� | �� | � | 3,987 | �� | � | � | � | �� | � | � | 5,408 | �� |
| � |
� | |||||||||||||||||||||||
�
| � | �� | Millions of Dollars | � | |||||||||||||||||||||||||
| � | �� | Nine Months Ended September 30, 2013* | � | |||||||||||||||||||||||||
| Statement of Cash Flows | �� | ConocoPhillips | � | � | ConocoPhillips Company |
� | � | ConocoPhillips Australia Funding Company |
� | � | ConocoPhillips Canada Funding Company I |
� | � | All Other Subsidiaries |
� | � | Consolidating Adjustments |
� | � | Total Consolidated |
� | |||||||
| Cash Flows From Operating Activities |
�� | � | � | � | � | � | � | |||||||||||||||||||||
| Net cash provided by (used in) continuing operating activities |
�� | $ | (377 | )� | � | � | 2,959 | �� | � | � | (2 | )� | � | � | (1 | )� | � | � | 10,978 | �� | � | � | (1,616 | )� | � | � | 11,941 | �� |
| Net cash provided by discontinued operations |
�� | � | � | �� | � | � | 91 | �� | � | � | � | �� | � | � | � | �� | � | � | 579 | �� | � | � | (435 | )� | � | � | 235 | �� |
| � |
� | |||||||||||||||||||||||||||
| Net Cash Provided by (Used in) Operating Activities |
�� | � | (377 | )� | � | � | 3,050 | �� | � | � | (2 | )� | � | � | (1 | )� | � | � | 11,557 | �� | � | � | (2,051 | )� | � | � | 12,176 | �� |
| � |
� | |||||||||||||||||||||||||||
| Cash Flows From Investing Activities |
�� | � | � | � | � | � | � | |||||||||||||||||||||
| Capital expenditures and investments |
�� | � | � | �� | � | � | (1,456 | )� | � | � | � | �� | � | � | � | �� | � | � | (9,825 | )� | � | � | � | �� | � | � | (11,281 | )� |
| Proceeds from asset dispositions |
�� | � | � | �� | � | � | 581 | �� | � | � | � | �� | � | � | � | �� | � | � | 2,646 | �� | � | � | (52 | )� | � | � | 3,175 | �� |
| Net sales of short-term investments |
�� | � | � | �� | � | � | � | �� | � | � | � | �� | � | � | � | �� | � | � | 1 | �� | � | � | � | �� | � | � | 1 | �� |
| Long-term advances/loans�related parties |
�� | � | � | �� | � | � | (283 | )� | � | � | � | �� | � | � | � | �� | � | � | (541 | )� | � | � | 824 | �� | � | � | � | �� |
| Collection of advances/loans�related parties |
�� | � | � | �� | � | � | 153 | �� | � | � | 750 | �� | � | � | 2 | �� | � | � | 2,026 | �� | � | � | (2,801 | )� | � | � | 130 | �� |
| Intercompany cash management |
�� | � | 1,793 | �� | � | � | (432 | )� | � | � | � | �� | � | � | � | �� | � | � | (1,361 | )� | � | � | � | �� | � | � | � | �� |
| Other |
�� | � | � | �� | � | � | 3 | �� | � | � | � | �� | � | � | � | �� | � | � | (54 | )� | � | � | � | �� | � | � | (51 | )� |
| � |
� | |||||||||||||||||||||||||||
| Net cash provided by (used in) continuing investing activities |
�� | � | 1,793 | �� | � | � | (1,434 | )� | � | � | 750 | �� | � | � | 2 | �� | � | � | (7,108 | )� | � | � | (2,029 | )� | � | � | (8,026 | )� |
| Net cash used in discontinued operations |
�� | � | � | �� | � | � | (52 | )� | � | � | � | �� | � | � | � | �� | � | � | (540 | )� | � | � | 52 | �� | � | � | (540 | )� |
| � |
� | |||||||||||||||||||||||||||
| Net Cash Provided by (Used in) Investing Activities |
�� | � | 1,793 | �� | � | � | (1,486 | )� | � | � | 750 | �� | � | � | 2 | �� | � | � | (7,648 | )� | � | � | (1,977 | )� | � | � | (8,566 | )� |
| � |
� | |||||||||||||||||||||||||||
| Cash Flows From Financing Activities |
�� | � | � | � | � | � | � | |||||||||||||||||||||
| Issuance of debt |
�� | � | � | �� | � | � | 523 | �� | � | � | � | �� | � | � | � | �� | � | � | 301 | �� | � | � | (824 | )� | � | � | � | �� |
| Repayment of debt |
�� | � | � | �� | � | � | (1,939 | )� | � | � | (750 | )� | � | � | � | �� | � | � | (1,058 | )� | � | � | 2,801 | �� | � | � | (946 | )� |
| Change in restricted cash |
�� | � | 748 | �� | � | � | � | �� | � | � | � | �� | � | � | � | �� | � | � | � | �� | � | � | � | �� | � | � | 748 | �� |
| Issuance of company common stock |
�� | � | 313 | �� | � | � | � | �� | � | � | � | �� | � | � | � | �� | � | � | � | �� | � | � | (301 | )� | � | � | 12 | �� |
| Dividends paid |
�� | � | (2,481 | )� | � | � | � | �� | � | � | (4 | )� | � | � | � | �� | � | � | (2,257 | )� | � | � | 2,261 | �� | � | � | (2,481 | )� |
| Other |
�� | � | 2 | �� | � | � | 39 | �� | � | � | � | �� | � | � | � | �� | � | � | (686 | )� | � | � | 52 | �� | � | � | (593 | )� |
| � |
� | |||||||||||||||||||||||||||
| Net cash used in continuing financing activities |
�� | � | (1,418 | )� | � | � | (1,377 | )� | � | � | (754 | )� | � | � | � | �� | � | � | (3,700 | )� | � | � | 3,989 | �� | � | � | (3,260 | )� |
| Net cash used in discontinued operations |
�� | � | � | �� | � | � | � | �� | � | � | � | �� | � | � | � | �� | � | � | (39 | )� | � | � | 39 | �� | � | � | � | �� |
| � |
� | |||||||||||||||||||||||||||
| Net Cash Used in Financing Activities |
�� | � | (1,418 | )� | � | � | (1,377 | )� | � | � | (754 | )� | � | � | � | �� | � | � | (3,739 | )� | � | � | 4,028 | �� | � | � | (3,260 | )� |
| � |
� | |||||||||||||||||||||||||||
| Effect of Exchange Rate Changes on Cash and Cash Equivalents |
�� | � | � | �� | � | � | (9 | )� | � | � | � | �� | � | � | � | �� | � | � | (76 | )� | � | � | � | �� | � | � | (85 | )� |
| � |
� | |||||||||||||||||||||||||||
| Net Change in Cash and Cash Equivalents |
�� | � | (2 | )� | � | � | 178 | �� | � | � | (6 | )� | � | � | 1 | �� | � | � | 94 | �� | � | � | � | �� | � | � | 265 | �� |
| Cash and cash equivalents at beginning of period |
�� | � | 2 | �� | � | � | 12 | �� | � | � | 6 | �� | � | � | 59 | �� | � | � | 3,539 | �� | � | � | � | �� | � | � | 3,618 | �� |
| � |
� | |||||||||||||||||||||||||||
| Cash and Cash Equivalents at End of Period |
�� | $ | � | �� | � | � | 190 | �� | � | � | � | �� | � | � | 60 | �� | � | � | 3,633 | �� | � | � | � | �� | � | � | 3,883 | �� |
| � |
� | |||||||||||||||||||||||||||
*Revised to reflect intercompany cash management activities previously presented as cash flows from continuing operating activities as both continuing activities and discontinued operations in �Cash Flows from Investing Activities� and �Cash Flows From Financing Activities.� There was no impact on Total Consolidated balances.
�
29
Table of Contents
| Item�2. | MANAGEMENT�S DISCUSSION AND ANALYSIS OF FINANCIAL CONDITION AND RESULTS OF OPERATIONS |
Management�s Discussion and Analysis is the Company�s analysis of its financial performance and of significant trends that may affect future performance. It should be read in conjunction with the financial statements and notes. It contains forward-looking statements including, without limitation, statements relating to the Company�s plans, strategies, objectives, expectations and intentions that are made pursuant to the �safe harbor� provisions of the Private Securities Litigation Reform Act of 1995. The words �anticipate,� �estimate,� �believe,� �budget,� �continue,� �could,� �intend,� �may,� �plan,� �potential,� �predict,� �seek,� �should,� �will,� �would,� �expect,� �objective,� �projection,� �forecast,� �goal,� �guidance,� �outlook,� �effort,� �target� and similar expressions identify forward-looking statements. The Company does not undertake to update, revise or correct any of the forward-looking information unless required to do so under the federal securities laws. Readers are cautioned that such forward-looking statements should be read in conjunction with the Company�s disclosures under the heading: �CAUTIONARY STATEMENT FOR THE PURPOSES OF THE �SAFE HARBOR� PROVISIONS OF THE PRIVATE SECURITIES LITIGATION REFORM ACT OF 1995,� beginning on page 50.
Due to discontinued operations reporting, income (loss) from continuing operations is more representative of ConocoPhillips� earnings. The terms �earnings� and �loss� as used in Management�s Discussion and Analysis refer to income (loss) from continuing operations. For additional information, see Note 2�Discontinued Operations, in the Notes to Consolidated Financial Statements.
BUSINESS ENVIRONMENT AND EXECUTIVE OVERVIEW
ConocoPhillips is the world�s largest independent exploration and production (E&P) company, based on production and proved reserves. Headquartered in Houston, Texas, we have operations and activities in 27�countries. At September�30, 2014, we had approximately 19,000�employees worldwide and total assets of $119 billion.
Overview
We are an independent E&P company focused on exploring for, developing and producing crude oil and natural gas globally. Our asset base reflects our legacy as a major company with a strategic focus on higher-margin developments. Our diverse portfolio primarily includes resource-rich North American shale and oil sands assets; lower-risk legacy assets in North America, Europe, Asia and Australia; several major international developments; and a growing inventory of global conventional and unconventional exploration prospects. Our value proposition to our shareholders is to deliver 3 to 5 percent production and 3 to 5 percent cash margin growth, normalized based on 2013 prices, achieve ongoing competitive dividends and returns on capital, while keeping our fundamental commitment to safety, operating excellence and environmental stewardship. To achieve these goals, we plan to continue to invest in high-margin developments, optimize our portfolio, apply technical capability and maintain financial flexibility.
In 2013 we successfully achieved the targets we set to sell non-core assets, advance major projects, progress development drilling and exploration programs and maintain a competitive dividend. Our success has enabled us to focus on growth in 2014, which we intend to deliver through investments in our legacy assets, continued success in our development drilling and exploration programs, continued ramp up in our unconventional plays and additional project startups, which include recent startups for Foster Creek Phase F, the Britannia Long-Term Compression Project and the Gumusut floating production system, and the anticipated startup at Kebabangan (KBB) later in 2014. As a result, we expect to deliver our value proposition in 2014. In the third quarter of 2014, we achieved production of 1,495�thousand barrels of oil equivalent per day (MBOED), including production from discontinued operations of 14 MBOED. Excluding Libya, our production from continuing operations was 1,473 MBOED. Adjusted for Libya and downtime, production from continuing operations increased by 62�MBOED, or 4 percent, compared with the third quarter of 2013.
�
30
Table of Contents
Consistent with our commitment to offer our shareholders a competitive dividend, in July 2014, our Board of Directors increased our quarterly dividend by 5.8 percent to $0.73 per share. Through September 2014, we generated $14.0 billion in cash from continuing operations, which included a $1.3 billion distribution from our 50 percent owned FCCL Partnership, and we generated $1.4 billion in proceeds from dispositions of non-core assets. We also paid dividends on our common stock of $2.6 billion and ended the quarter with $5.4 billion in cash and cash equivalents.
We participate in a capital-intensive industry. As a result, we invest significant capital to acquire acreage, explore for new oil and gas fields, develop newly discovered fields, maintain existing fields, and construct pipelines and liquefied natural gas (LNG) facilities. In December 2013 we announced a capital budget of $16.7 billion for 2014, and this guidance is unchanged. We funded $12.7 billion of capital expenditures through September 2014. We use a disciplined approach to select the appropriate projects which will provide the most attractive investment opportunities, with a continued focus on organic growth in volumes and margins through higher-margin oil, condensate and LNG projects and limited investment in North American natural gas. As investments have brought more liquids production online, we have experienced a corresponding shift in our production mix. In the nine-month period of 2014, our average liquids production from continuing operations, excluding Libya, increased 6 percent compared with the same period of 2013. As our major capital projects startup, we plan to direct more of our capital to the unconventionals and development drilling programs, while maintaining the flexibility to respond to changing market conditions. In response to recent weakening commodity prices, an assessment of our 2015 capital budget is ongoing.
Basis of Presentation
Effective April�1, 2014, the Other International segment was restructured to focus on enhancing our capability to operate in emerging and new country business units. As a result, we moved the Latin America and Poland businesses from the historically presented Lower 48 and Latin America segment and the Europe segment to the Other International segment. Results of operations for the Lower 48, Europe and Other International segments have been revised for all periods presented. There was no impact on our consolidated financial results, and the impact on our segment presentation was immaterial. For additional information, see Note 18�Segment Disclosures and Related Information, in the Notes to Consolidated Financial Statements.
Business Environment
The business environment for the energy industry has historically experienced many challenges which have influenced our operations and profitability, largely due to factors beyond our control, such as the global financial crisis and recession which began in 2008, supply disruptions or fears thereof caused by civil unrest or military conflicts, environmental laws, tax regulations, governmental policies and weather-related disruptions. North America�s energy landscape has been transformed from resource scarcity to an abundance of supply, as a result of advances in technology responsible for the rapid growth of shale production, successful exploration and development in the deepwater Gulf of Mexico and rising production from the Canadian oil sands. These dynamics generally influence world energy markets and commodity prices. The most significant factor impacting our profitability and related reinvestment of operating cash flows into our business is commodity prices, which can be very volatile; therefore, our strategy is to maintain a strong balance sheet with a diverse portfolio of assets, which will provide the financial flexibility to withstand challenging business cycles.
�
31
Table of Contents
Our earnings generally correlate with industry price levels for crude oil and natural gas. These are commodity products, the prices of which are subject to factors external to the Company and over which we have no control. The following graph depicts the trend in average benchmark prices for West Texas Intermediate (WTI) crude oil, Dated Brent crude oil and U.S. Henry Hub (HH) natural gas:
�
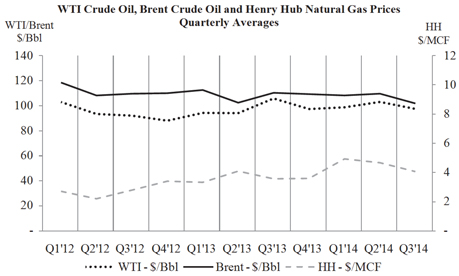
Brent crude oil prices averaged $101.85 per barrel in the third quarter of 2014, a decrease of 8 percent compared with $110.32 per barrel in the third quarter of 2013, and a decrease of 7 percent compared with $109.63 per barrel in the second quarter of 2014. Prices have been under pressure due to abundant supply and lower demand growth, particularly in Europe and Asia where economic growth is slowing. Industry crude prices for WTI averaged $97.48 per barrel in the third quarter of 2014, a decrease of 8 percent compared with $105.80 per barrel in the third quarter of 2013, and a decrease of 5 percent compared with $103.05 per barrel in the second quarter of 2014. Strong U.S. refinery runs and new pipeline and rail infrastructure contributed to reducing the discount of WTI relative to global oil prices during the third quarter of 2014. More recently, global crude oil prices have continued to experience the volatility associated with the supply/demand factors which drive commodity prices and margins. In the fourth quarter of 2014, crude oil prices have declined to their lowest levels in the past four years to the low-to-mid $80-per-barrel-range. Recent futures market prices for WTI and Brent are $80 to $90 per barrel, respectively, for years 2015�2018, based on October�23, 2014, futures settlements.
Henry Hub natural gas prices averaged $4.07 per thousand cubic feet (MCF) in the third quarter of 2014, an increase of 14 percent compared with $3.58 per MCF in the third quarter of 2013, and a decrease of 13 percent compared with $4.68 per MCF in the second quarter of 2014. Strong growth in demand in 2014 versus 2013, particularly winter weather-driven demand, pushed natural gas prices higher in 2014. Prices in the third quarter of 2014 declined relative to the second quarter of 2014, as cooler-than-normal summer weather softened demand growth while production grew more quickly.
Our realized bitumen price was $62.49 per barrel in the third quarter of 2014, a decrease of 18 percent compared with $76.06 per barrel in the third quarter of 2013, and a decrease of 5 percent compared with $65.82 per barrel in the second quarter of 2014. Bitumen prices weakened in the third quarter of 2014, compared with the same period of 2013, mainly as a result of increased supply, partly offset by stronger refinery demand, increased rail transportation and pipeline capacity improvements.
Our total average realized price was $64.78 per barrel of oil equivalent (BOE) in the third quarter of 2014, a decrease of 7 percent compared with $69.68 per BOE in the third quarter of 2013, which reflected lower average realized prices for crude oil, bitumen and natural gas liquids. In the first nine months of 2014, our
�
32
Table of Contents
total realized price was $68.71 per BOE compared with $68.36 per BOE in the first nine months of 2013. This reflected higher natural gas, bitumen and natural gas liquids prices, partially offset by lower crude oil prices.
Key Operating and Financial Highlights
�
| � | � | � | Increased quarterly dividend by 5.8 percent in July. |
| � | � | � | Third-quarter production of 1,473 MBOED from continuing operations, excluding Libya, represents 4�percent growth year-over-year when adjusted for downtime. |
| � | � | � | Eagle Ford and Bakken combined production increased by 33 percent compared with third-quarter 2013. |
| � | � | � | First production achieved from Foster Creek Phase F and the Britannia Long-Term Compression Project in September, as well as the Gumusut floating production system in October. |
| � | � | � | Major turnarounds completed in the Alaska, Canada, Europe, and Asia Pacific and Middle East segments. |
| � | � | � | Major project preparations continue for startup at KBB in the fourth quarter of 2014, and Eldfisk II, Surmont 2 and APLNG in 2015. |
| � | � | � | Oil discovered at the FAN-1 exploration well, offshore Senegal. |
| � | � | � | Exploration and appraisal activity continues with unconventional activities in the Lower 48, Canada and Poland, and conventional drilling in Angola, Australia, the Gulf of Mexico and Senegal. |
| � | � | � | Completed the sale of the Nigerian upstream business in July for net proceeds of $1.4 billion, inclusive of deposits previously received. |
Outlook
Production and Capital Guidance
We are on track to meet our value proposition in 2014. Full-year 2014 production from continuing operations, excluding Libya, is expected to be approximately 1,525 to 1,535 MBOED. Fourth-quarter 2014 production guidance from continuing operations, excluding Libya, is being adjusted to reflect anticipated impacts from the absence of ramp gas sales from Australia Pacific LNG Pty Ltd (APLNG) to a third-party LNG project, temporary third-party infrastructure constraints in Malaysia and value-driven ethane rejection in the Lower 48. Fourth-quarter production guidance is 1,545 to 1,575 MBOED.
We intend to release guidance on our 2015 capital expenditures in December 2014.
Freeport LNG
We have a long-term agreement with Freeport LNG Development, L.P. to use 0.9 billion cubic feet per day of regasification capacity at Freeport�s 1.5-billion-cubic-feet-per-day LNG receiving terminal in Quintana, Texas. In July 2013 we and Freeport LNG agreed to terminate this agreement, subject to Freeport LNG obtaining regulatory approval and project financing for an LNG liquefaction and export facility in Texas, in which we are not a participant.�In July 2014 Freeport LNG received conditional approval from the Federal Energy Regulatory Commission (FERC), and in October 2014 Freeport LNG received FERC�s permission to construct the facility. Upon satisfaction of their project financing conditions, currently expected to occur in the fourth quarter of 2014, we will pay Freeport LNG a termination fee of approximately $520 million.�Freeport LNG will repay the outstanding ConocoPhillips loan used by Freeport LNG to partially fund the original construction of the terminal. These transactions, plus miscellaneous items, will result in a one-time net cash outflow of approximately $50 million for us.�When the agreement becomes effective, we also expect to recognize an after-tax charge to earnings of approximately $520 million.�At that time, our terminal regasification capacity will be reduced from 0.9 billion cubic feet per day to 0.4�billion cubic feet per day, until July�1, 2016, at which time it will be reduced to zero. As a result of this transaction, we anticipate saving approximately $50 million to $60�million per year in operating costs over the next 19�years. For additional information, see Note 3�Variable Interest Entities (VIEs), in the Notes to Consolidated Financial Statements.
�
33
Table of Contents
RESULTS OF OPERATIONS
Unless otherwise indicated, discussion of results for the three- and nine-month periods ended September�30, 2014, is based on a comparison with the corresponding periods of 2013.
A summary of income (loss) from continuing operations by business segment follows:
�
| � | �� | Millions of Dollars | � | |||||||||||||
| � | �� | Three�Months�Ended September�30 |
� | � | Nine�Months�Ended September�30 |
� | ||||||||||
| � | �� | 2014 | � | � | 2013 | � | � | 2014 | � | � | 2013 | � | ||||
| �� | � |
� |
� | � | � |
� |
� | |||||||||
| Alaska |
�� | $ | 473 | �� | � | � | 494 | �� | � | � | 1,698 | �� | � | � | 1,719 | �� |
| Lower 48 |
�� | � | 32 | �� | � | � | 209 | �� | � | � | 621 | �� | � | � | 547 | �� |
| Canada |
�� | � | 307 | �� | � | � | 642 | �� | � | � | 845 | �� | � | � | 780 | �� |
| Europe |
�� | � | 213 | �� | � | � | 288 | �� | � | � | 819 | �� | � | � | 1,005 | �� |
| Asia Pacific and Middle East |
�� | � | 772 | �� | � | � | 757 | �� | � | � | 2,390 | �� | � | � | 2,719 | �� |
| Other International |
�� | � | (18 | )� | � | � | 283 | �� | � | � | 74 | �� | � | � | 328 | �� |
| Corporate and Other |
�� | � | (130 | )� | � | � | (234 | )� | � | � | (616 | )� | � | � | (569 | )� |
| � |
� | |||||||||||||||
| Income from continuing operations |
�� | $ | 1,649 | �� | � | � | 2,439 | �� | � | � | 5,831 | �� | � | � | 6,529 | �� |
| � |
� | |||||||||||||||
Earnings for ConocoPhillips decreased 32 percent in the third quarter of 2014, and earnings for the nine-month period ended September�30, 2014, decreased 11 percent. The decrease in earnings in both periods of 2014 primarily resulted from:
�
| � | � | � | Lower gains from asset sales. Gains realized in both periods of 2014 were not material. Gains realized in the third quarter and nine-month period of 2013 were approximately $777 million after-tax and $1,118 million after-tax, respectively. |
| � | � | � | Lower crude oil prices. |
| � | � | � | Higher operating expenses. |
| � | � | � | Higher impairments. |
| � | � | � | Lower LNG sales volumes, largely as a result of planned maintenance in Australia. |
| � | � | � | Higher depreciation, depletion and amortization (DD&A) expenses, mainly due to higher volumes in the Lower 48 and Europe, partly offset by lower volumes in Canada. |
These items were partially offset by:
�
| � | � | � | Higher crude oil and bitumen sales volumes and a continued portfolio shift toward liquids. |
| � | � | � | Higher recognition of net gains associated with pending claims and settlements. The third quarter and nine-month period of 2014 included net gains of $105 million after-tax and $204 million after-tax, respectively, compared with net expenses of $116 million after-tax and net gains of $118 million after-tax for the comparable periods of 2013. |
| � | � | � | Lower production taxes in Alaska, which mainly resulted from higher capital spending and lower production volumes. |
In addition, lower bitumen prices contributed to the decrease in earnings in the third quarter of 2014.
Earnings in the nine-month period of 2014 also benefitted from higher prices for natural gas, bitumen, LNG and natural gas liquids, as well as improved marketing of third-party North American natural gas volumes. These additional benefits were partly offset by an $83 million after-tax loss related to releases of capacity on transportation and storage capacity agreements.
See the �Segment Results� section for additional information.
�
34
Table of Contents
Income Statement Analysis
Sales and other operating revenues decreased 11 percent in the third quarter of 2014, mainly as a result of lower prices for crude oil and bitumen and lower LNG volumes, partly offset by higher crude oil and bitumen volumes.
Equity in earnings of affiliates increased 28 percent in the nine-month period of 2014, primarily as a result of higher earnings from FCCL Partnership due to higher bitumen volumes and prices.
Gain on dispositions decreased $1,065 million in the third quarter and $1,202 million in the nine-month period of 2014. Gains realized in both periods of 2014 were not material. Gains realized in the third quarter of 2013 primarily resulted from the disposition of our Clyden undeveloped oil sands leasehold in Canada and the disposition of our 39 percent equity interest in Phoenix Park, located in Trinidad and Tobago. Additional gains realized in the nine-month period of 2013 mainly resulted from the disposition of our interest in the Interconnector Pipeline in Europe and certain properties located in southwest Louisiana, partly offset by a loss on the disposition of the majority of our producing zones located in the Cedar Creek Anticline in the Lower 48.
Purchased commodities decreased 18 percent in the third quarter of 2014, largely as a result of lower natural gas prices in Europe and lower purchased natural gas volumes, partly offset by higher natural gas prices, in North America.
Production and operating expenses increased 12 percent in the nine-month period of 2014, primarily as a result of increased drilling and maintenance activity, mostly in the Lower 48, Australia, Alaska and Europe, in addition to the absence of the 2013 benefit of a $142 million accrual reduction related to the Federal Energy Regulatory Commission (FERC) approval of cost allocation (pooling) agreements with the remaining owners of the Trans-Alaska Pipeline System (TAPS). These increases were partly offset by the absence of a $155�million charge resulting from a settlement in the Asia Pacific and Middle East segment in 2013.
Exploration expenses increased 47 percent in the third quarter and 40 percent in the nine-month period of 2014. Both periods of 2014 were impacted by higher impairments of undeveloped leasehold costs. Higher dry hole costs, mostly associated with the Gulf of Mexico, also contributed to the increase in the nine-month period of 2014. For additional information on the impairments, see Note�7�Impairments, in the Notes to Consolidated Financial Statements.
DD&A increased 10 percent in the third quarter and 9 percent in the nine-month period of 2014. The increase in both periods of 2014 was mostly associated with higher production volumes in the United Kingdom and the Lower 48, partly offset by lower unit-of-production rates in Canada associated with year-end 2013 price-related reserve revisions and lower natural gas production volumes.
Impairments increased $107 million in the third quarter and $95 million in the nine-month period of 2014. For additional information, see Note 7�Impairments, in the Notes to Consolidated Financial Statements.
Taxes other than income taxes decreased 26 percent in the third quarter and 20 percent in the nine-month period of 2014, mainly as a result of lower production taxes due to higher capital spending and lower crude oil production volumes and prices in Alaska.
Interest and debt expense increased 13 percent in the nine-month period of 2014, primarily due to lower capitalized interest on projects, partly offset by lower interest expense from lower average debt levels and a $28 million benefit associated with interest on a favorable tax settlement.
See Note 19�Income Taxes, in the Notes to Consolidated Financial Statements, for information regarding our provision for income taxes and effective tax rate.
�
35
Table of Contents
Summary Operating Statistics
�
| � | �� | Three�Months�Ended September�30 |
� | �� | Nine�Months�Ended September�30 |
� | ||||||||||
| � | �� | 2014 | � | �� | 2013 | � | �� | 2014 | � | �� | 2013 | � | ||||
| �� | � |
� |
� | �� | � |
� |
� | |||||||||
| Average Net Production |
�� | �� | �� | �� | ||||||||||||
| Crude oil (MBD)* |
�� | � | 561 | �� | �� | � | 552 | �� | �� | � | 585 | �� | �� | � | 587 | �� |
| Natural gas liquids (MBD) |
�� | � | 157 | �� | �� | � | 156 | �� | �� | � | 161 | �� | �� | � | 158 | �� |
| Bitumen (MBD) |
�� | � | 124 | �� | �� | � | 107 | �� | �� | � | 125 | �� | �� | � | 105 | �� |
| Natural gas (MMCFD)** |
�� | � | 3,833 | �� | �� | � | 3,930 | �� | �� | � | 3,911 | �� | �� | � | 3,963 | �� |
| � |
� | |||||||||||||||
| Total Production (MBOED) |
�� | � | 1,481 | �� | �� | � | 1,470 | �� | �� | � | 1,523 | �� | �� | � | 1,511 | �� |
| � |
� | |||||||||||||||
| � | �� | Dollars Per Unit | � | |||||||||||||
| Average Sales Prices |
�� | �� | �� | �� | ||||||||||||
| Crude oil (per barrel) |
�� | $ | 96.63 | �� | �� | � | 106.60 | �� | �� | � | 100.56 | �� | �� | � | 104.20 | �� |
| Natural gas liquids (per barrel) |
�� | � | 37.83 | �� | �� | � | 41.14 | �� | �� | � | 41.46 | �� | �� | � | 40.64 | �� |
| Bitumen (per barrel) |
�� | � | 62.49 | �� | �� | � | 76.06 | �� | �� | � | 61.65 | �� | �� | � | 57.08 | �� |
| Natural gas (per thousand cubic feet) |
�� | � | 5.96 | �� | �� | � | 5.99 | �� | �� | � | 6.77 | �� | �� | � | 6.14 | �� |
| � |
� | |||||||||||||||
| � | �� | Millions of Dollars | � | |||||||||||||
| Exploration Expenses |
�� | �� | �� | �� | ||||||||||||
| General administrative, geological and geophysical, and lease rentals |
�� | $ | 194 | �� | �� | � | 180 | �� | �� | � | 604 | �� | �� | � | 566 | �� |
| Leasehold impairment |
�� | � | 179 | �� | �� | � | 32 | �� | �� | � | 414 | �� | �� | � | 142 | �� |
| Dry holes |
�� | � | 86 | �� | �� | � | 101 | �� | �� | � | 254 | �� | �� | � | 203 | �� |
| � |
� | |||||||||||||||
| �� | $ | 459 | �� | �� | � | 313 | �� | �� | � | 1,272 | �� | �� | � | 911 | �� | |
| � |
� | |||||||||||||||
Excludes discontinued operations.
��*Thousands of barrels per day.
**Millions of cubic feet per day. Represents quantities available for sale and excludes gas equivalent of natural gas liquids included above.
We explore for, produce, transport and market crude oil, bitumen, natural gas, LNG and natural gas liquids on a worldwide basis. At September�30, 2014, our continuing operations were producing in the United States, Norway, the United Kingdom, Canada, Australia, Timor-Leste, Indonesia, China, Malaysia, Qatar, Libya and Russia.
Total production from continuing operations, including Libya, increased 1 percent in both the third quarter and the nine-month period of 2014, while average liquids production increased 3 percent and 2 percent over the corresponding periods in 2013. The increase in total average production for both periods of 2014 primarily resulted from additional production from major developments, mainly from shale plays in the Lower 48 and the ramp up of production from Jasmine in the United Kingdom and Christina Lake in Canada, and increased drilling programs, mostly in the Lower 48, western Canada and China. These increases were largely offset by normal field decline, higher planned downtime, shut-in Libya production due to the closure of the Es Sider crude oil export terminal, and unfavorable market impacts. Adjusted for Libya and downtime, production from continuing operations increased by 62 MBOED, or 4 percent, compared with the third quarter of 2013.
�
36
Table of Contents
Segment Results
Alaska
�
| � | �� | Three�Months�Ended September�30 |
� | �� | Nine�Months�Ended September�30 |
� | ||||||||||
| � | �� | 2014 | � | �� | 2013 | � | �� | 2014 | � | �� | 2013 | � | ||||
| �� | � |
� |
� | �� | � |
� |
� | |||||||||
| Income From Continuing Operations (millions of dollars) |
�� | $ | 473 | �� | �� | � | 494 | �� | �� | � | 1,698 | �� | �� | � | 1,719 | �� |
| � |
� | |||||||||||||||
| Average Net Production |
�� | �� | �� | �� | ||||||||||||
| Crude oil (MBD) |
�� | � | 139 | �� | �� | � | 161 | �� | �� | � | 162 | �� | �� | � | 176 | �� |
| Natural gas liquids (MBD) |
�� | � | 8 | �� | �� | � | 11 | �� | �� | � | 13 | �� | �� | � | 15 | �� |
| Natural gas (MMCFD) |
�� | � | 48 | �� | �� | � | 35 | �� | �� | � | 50 | �� | �� | � | 43 | �� |
| � |
� | |||||||||||||||
| Total Production (MBOED) |
�� | � | 155 | �� | �� | � | 178 | �� | �� | � | 183 | �� | �� | � | 198 | �� |
| � |
� | |||||||||||||||
| Average Sales Prices |
�� | �� | �� | �� | ||||||||||||
| Crude oil (dollars per barrel) |
�� | $ | 102.36 | �� | �� | � | 110.95 | �� | �� | � | 106.06 | �� | �� | � | 109.14 | �� |
| Natural gas (dollars per thousand cubic feet) |
�� | � | 5.47 | �� | �� | � | 4.09 | �� | �� | � | 5.55 | �� | �� | � | 4.56 | �� |
| � |
� | |||||||||||||||
The Alaska segment primarily explores for, produces, transports and markets crude oil, natural gas liquids, natural gas and LNG. As of September�30, 2014, Alaska contributed 20 percent of our worldwide liquids production and 1 percent of our natural gas production.
Alaska earnings decreased 4 percent in the third quarter and 1 percent in the nine-month period of 2014 compared with the same periods of 2013. The decrease in both periods of 2014 was largely due to lower crude oil prices and volumes and higher operating expenses. These reductions to earnings were partly offset by lower production taxes, which resulted from higher 2014 capital spending and lower crude oil production volumes, and higher LNG sales.
The decrease in earnings in the nine-month period of 2014 was also attributable to the absence of a $97 million after-tax benefit associated with a FERC ruling in 2013. In 2012 the major owners of TAPS filed a proposed settlement with FERC to resolve pooling disputes prior to August 2012 and establish a voluntary pooling agreement to pool costs prospectively from August 2012. In July 2013 FERC approved the proposed settlement and pooling agreement without modification. As a result, we reduced a related accrual in the second quarter of 2013, which decreased our production and operating expenses by $97 million after-tax.
Average production decreased 13 percent in the third quarter and 8 percent in the nine-month period of 2014, compared with the corresponding periods of 2013. The reduction in both periods of 2014 was mainly due to higher planned maintenance and normal field decline, partly offset by lower unplanned downtime.
�
37
Table of Contents
Lower 48
�
| � | �� | Three�Months�Ended September�30 |
� | �� | Nine�Months�Ended September�30 |
� | ||||||||||
| � | �� | 2014 | � | �� | 2013 | � | �� | 2014 | � | �� | 2013 | � | ||||
| �� | � |
� |
� | �� | � |
� |
� | |||||||||
| Income From Continuing Operations (millions of dollars) |
�� | $ | 32 | �� | �� | � | 209 | �� | �� | � | 621 | �� | �� | � | 547 | �� |
| � |
� | |||||||||||||||
| Average Net Production |
�� | �� | �� | �� | ||||||||||||
| Crude oil (MBD) |
�� | � | 191 | �� | �� | � | 153 | �� | �� | � | 184 | �� | �� | � | 149 | �� |
| Natural gas liquids (MBD) |
�� | � | 104 | �� | �� | � | 94 | �� | �� | � | 99 | �� | �� | � | 91 | �� |
| Natural gas (MMCFD) |
�� | � | 1,485 | �� | �� | � | 1,511 | �� | �� | � | 1,482 | �� | �� | � | 1,490 | �� |
| � |
� | |||||||||||||||
| Total Production (MBOED) |
�� | � | 543 | �� | �� | � | 499 | �� | �� | � | 530 | �� | �� | � | 488 | �� |
| � |
� | |||||||||||||||
| Average Sales Prices |
�� | �� | �� | �� | ||||||||||||
| Crude oil (dollars per barrel) |
�� | $ | 87.91 | �� | �� | � | 100.25 | �� | �� | � | 91.02 | �� | �� | � | 95.92 | �� |
| Natural gas liquids (dollars per barrel) |
�� | � | 30.67 | �� | �� | � | 32.57 | �� | �� | � | 32.51 | �� | �� | � | 30.52 | �� |
| Natural gas (dollars per thousand cubic feet) |
�� | � | 3.96 | �� | �� | � | 3.39 | �� | �� | � | 4.48 | �� | �� | � | 3.48 | �� |
| � |
� | |||||||||||||||
As of September�30, 2014, the Lower 48 contributed 32 percent of our worldwide liquids production and 38�percent of our natural gas production. The Lower 48 segment consists of operations located in the U.S. Lower 48 states and exploration activities in the Gulf of Mexico.
Earnings from the Lower 48 decreased 85 percent in the third quarter and increased 14 percent in the nine-month period of 2014 compared with the same periods of 2013. Earnings in both periods of 2014 were largely impacted by a $151 million after-tax impairment as a result of reduced volume forecasts on proved properties and the associated undeveloped leasehold costs; lower crude oil prices; higher DD&A, mostly due to higher crude oil production; higher operating and exploration costs; and higher production taxes. These decreases were partially offset by higher crude oil and natural gas liquids volumes and higher natural gas prices.
Additional benefits to earnings in the nine-month period of 2014 included approximately $100 million after-tax from marketing third-party natural gas volumes, the absence of the $52 million after-tax loss recognized in the nine-month period of 2013 from the disposition of the majority of our producing zones in the Cedar Creek Anticline, and higher natural gas liquids prices. These increases in the nine-month period of 2014 were partially offset by an $83 million after-tax loss recognized upon the release of underutilized transportation and storage capacity at rates below our contractual rates, a $35 million after-tax legal accrual, and the absence of a $69 million after-tax gain on the 2013 disposition of certain properties in southwest Louisiana.
Dry hole expenses were also higher in the nine-month period of 2014 compared with the same period of 2013. Dry hole costs in the nine-month period of 2014 were approximately $130 million after-tax, primarily for the nonoperated Coronado wildcat and appraisal wells and the Deep Nansen wildcat well in the Gulf of Mexico, compared with approximately $90 million after-tax in the nine-month period of 2013 for the Thorn and Ardennes wells, also located in the Gulf of Mexico.
Rising U.S. production and an increase in pipeline capacity to the Gulf Coast have put downward pressure on Gulf Coast crude oil prices.�Prices for Permian Basin crude oil production have been impacted by production increases exceeding pipeline offtake additions. Our average realized prices in the Lower 48 have historically correlated with WTI prices; however, in the second half of 2013, our Lower 48 crude differential versus WTI began to widen. In the third quarter of 2014, our average realized crude oil price of $87.91 per barrel was 10�percent less than WTI of $97.48 per barrel. Current market dynamics indicate this crude differential may remain relatively wide in the near-term.
�
38
Table of Contents
Total average production in the Lower 48 increased 9 percent in both the third quarter and the nine-month period of 2014. Average crude oil production increased 25 percent and 23 percent over the same periods, respectively. The increases in both periods of 2014 were mainly attributable to new production, primarily from the Eagle Ford and Bakken, and improved drilling and well performance. These increases in production were partially offset by normal field decline. In addition, higher unplanned downtime and the impact from asset dispositions partly offset the increase in the nine-month period of 2014.
Canada
�
| � | �� | Three�Months�Ended September�30 |
� | �� | Nine�Months�Ended September�30 |
� | ||||||||||
| � | �� | 2014 | � | �� | 2013 | � | �� | 2014 | � | �� | 2013 | � | ||||
| �� | � |
� |
� | �� | � |
� |
� | |||||||||
| Income From Continuing Operations (millions of dollars) |
�� | $ | 307 | �� | �� | � | 642 | �� | �� | � | 845 | �� | �� | � | 780 | �� |
| � |
� | |||||||||||||||
| Average Net Production |
�� | �� | �� | �� | ||||||||||||
| Crude oil (MBD) |
�� | � | 13 | �� | �� | � | 13 | �� | �� | � | 13 | �� | �� | � | 14 | �� |
| Natural gas liquids (MBD) |
�� | � | 21 | �� | �� | � | 25 | �� | �� | � | 24 | �� | �� | � | 25 | �� |
| Bitumen (MBD) |
�� | �� | �� | �� | ||||||||||||
| Consolidated operations |
�� | � | 9 | �� | �� | � | 13 | �� | �� | � | 12 | �� | �� | � | 12 | �� |
| Equity affiliates |
�� | � | 115 | �� | �� | � | 94 | �� | �� | � | 113 | �� | �� | � | 93 | �� |
| � |
� | |||||||||||||||
| Total bitumen |
�� | � | 124 | �� | �� | � | 107 | �� | �� | � | 125 | �� | �� | � | 105 | �� |
| Natural gas (MMCFD) |
�� | � | 707 | �� | �� | � | 775 | �� | �� | � | 709 | �� | �� | � | 790 | �� |
| � |
� | |||||||||||||||
| Total Production (MBOED) |
�� | � | 276 | �� | �� | � | 274 | �� | �� | � | 280 | �� | �� | � | 276 | �� |
| � |
� | |||||||||||||||
| Average Sales Prices |
�� | �� | �� | �� | ||||||||||||
| Crude oil (dollars per barrel) |
�� | $ | 82.48 | �� | �� | � | 91.81 | �� | �� | � | 83.00 | �� | �� | � | 81.71 | �� |
| Natural gas liquids (dollars per barrel) |
�� | � | 45.29 | �� | �� | � | 46.90 | �� | �� | � | 49.53 | �� | �� | � | 47.07 | �� |
| Bitumen (dollars per barrel) |
�� | �� | �� | �� | ||||||||||||
| Consolidated operations |
�� | � | 64.95 | �� | �� | � | 76.90 | �� | �� | � | 64.95 | �� | �� | � | 59.18 | �� |
| Equity affiliates |
�� | � | 62.30 | �� | �� | � | 75.93 | �� | �� | � | 61.30 | �� | �� | � | 56.79 | �� |
| Total bitumen |
�� | � | 62.49 | �� | �� | � | 76.06 | �� | �� | � | 61.65 | �� | �� | � | 57.08 | �� |
| Natural gas (dollars per thousand cubic feet) |
�� | � | 3.50 | �� | �� | � | 2.42 | �� | �� | � | 4.47 | �� | �� | � | 2.86 | �� |
| � |
� | |||||||||||||||
Our Canadian operations mainly consist of natural gas fields in western Canada and oil sands developments in the Athabasca Region of northeastern Alberta. As of September�30, 2014, Canada contributed 19 percent of our worldwide liquids production and 18 percent of our natural gas production.
Canada earnings decreased 52 percent in the third quarter and increased 8 percent in the nine-month period of 2014 compared with the corresponding periods of 2013. Earnings in both periods of 2014 were largely impacted by lower gains from asset sales, as a result of the $461 million after-tax gain on disposition of our Clyden undeveloped oil sands leasehold in the third quarter of 2013, partly offset by higher bitumen volumes, higher natural gas prices and lower DD&A from western Canada. The lower DD&A mainly resulted from lower unit-of-production rates related to year-end 2013 price-related reserve revisions and lower natural gas production volumes. Both periods of 2014 also included a $47 million tax benefit resulting from a favorable tax settlement. Lower bitumen prices also contributed to the reduction in earnings in the third quarter of 2014.
Additional benefits to earnings in the nine-month period of 2014 included higher bitumen prices. The increases to earnings in the nine-month period of 2014 were partly offset by the absence of the 2013 recognition of a $224 million tax benefit, which related to the favorable tax resolution associated with the sale of certain western Canada properties in a prior year, and the $109 million after-tax impairment of undeveloped
�
39
Table of Contents
leasehold costs associated with the offshore Amauligak discovery, Arctic Islands and other Beaufort properties. The impairment resulted from our decision not to pursue future development at this time; however, we remain committed to the potential of the area as technology develops and the price environment improves. Lower natural gas volumes also partially offset the increase in earnings in the nine-month period of 2014.
For additional information on the Amauligak impairment, see Note 7�Impairments, in the Notes to Consolidated Financial Statements.
Total average production increased 1 percent in both the third quarter and nine-month period of 2014, while bitumen production increased 16 percent and 19 percent over the same periods, respectively. Increases in total production in both periods of 2014 were mainly attributable to the continued ramp-up of production from Christina Lake Phase E in FCCL and improved drilling and well performance. These increases were partly offset by normal field decline. Higher planned maintenance also partially offset the increase in the third quarter of 2014, while higher royalty impacts, which resulted from higher prices, partly offset the increase in the nine-month period of 2014.
Europe
�
| � | �� | Three�Months�Ended September�30 |
� | �� | Nine�Months�Ended September�30 |
� | ||||||||||
| � | �� | 2014 | � | �� | 2013 | � | �� | 2014 | � | �� | 2013 | � | ||||
| �� | � |
� |
� | �� | � |
� |
� | |||||||||
| Income From Continuing Operations (millions of dollars) |
�� | $ | 213 | �� | �� | � | 288 | �� | �� | � | 819 | �� | �� | � | 1,005 | �� |
| � |
� | |||||||||||||||
| Average Net Production |
�� | �� | �� | �� | ||||||||||||
| Crude oil (MBD) |
�� | � | 119 | �� | �� | � | 111 | �� | �� | � | 126 | �� | �� | � | 112 | �� |
| Natural gas liquids (MBD) |
�� | � | 8 | �� | �� | � | 5 | �� | �� | � | 8 | �� | �� | � | 5 | �� |
| Natural gas (MMCFD) |
�� | � | 404 | �� | �� | � | 357 | �� | �� | � | 452 | �� | �� | � | 409 | �� |
| � |
� | |||||||||||||||
| Total Production (MBOED) |
�� | � | 194 | �� | �� | � | 176 | �� | �� | � | 209 | �� | �� | � | 185 | �� |
| � |
� | |||||||||||||||
| Average Sales Prices |
�� | �� | �� | �� | ||||||||||||
| Crude oil (dollars per barrel) |
�� | $ | 103.17 | �� | �� | � | 112.28 | �� | �� | � | 107.79 | �� | �� | � | 110.40 | �� |
| Natural gas liquids (dollars per barrel) |
�� | � | 54.47 | �� | �� | � | 57.36 | �� | �� | � | 57.62 | �� | �� | � | 56.28 | �� |
| Natural gas (dollars per thousand cubic feet) |
�� | � | 7.86 | �� | �� | � | 10.48 | �� | �� | � | 9.32 | �� | �� | � | 10.53 | �� |
| � |
� | |||||||||||||||
The Europe segment consists of operations principally located in the Norwegian and U.K. sectors of the North Sea, as well as exploration activities in Greenland. As of September�30, 2014, our Europe operations contributed 15 percent of our worldwide liquids production and 12 percent of our natural gas production.
Earnings for Europe decreased 26 percent in the third quarter and 19 percent in the nine-month period of 2014 compared with the same periods of 2013. The decrease in earnings in both periods of 2014 was primarily due to higher DD&A, which mostly resulted from increased production volumes from Jasmine. Higher volumes were offset by lower prices in the third quarter of 2014. In the nine-month period of 2014, lower gains from asset dispositions, mostly due to the absence of the $83 million after-tax gain on the disposition of our interest in the Interconnector Pipeline in 2013; lower prices; and higher taxes and operating expenses were nearly offset by higher volumes.
Average production increased 10 percent in the third quarter and 13 percent in the nine-month period of 2014, mostly due to the continued ramp-up of production from Jasmine, the Rivers Acid Plant in the East Irish Sea and Ekofisk South, improved drilling and well performance in Norway and lower planned downtime. These increases were partly offset by normal field decline. Higher unplanned downtime also partly offset the increase in the third quarter of 2014.
�
40
Table of Contents
Asia Pacific and Middle East
�
| � | �� | Three�Months�Ended September�30 |
� | �� | Nine�Months�Ended September�30 |
� | ||||||||||
| � | �� | 2014 | � | �� | 2013 | � | �� | 2014 | � | �� | 2013 | � | ||||
| �� | � |
� |
� | �� | � |
� |
� | |||||||||
| Income From Continuing Operations (millions of dollars) |
�� | $ | 772 | �� | �� | � | 757 | �� | �� | � | 2,390 | �� | �� | � | 2,719 | �� |
| � |
� | |||||||||||||||
| Average Net Production |
�� | �� | �� | �� | ||||||||||||
| Crude oil (MBD) |
�� | �� | �� | �� | ||||||||||||
| Consolidated operations |
�� | � | 72 | �� | �� | � | 77 | �� | �� | � | 78 | �� | �� | � | 82 | �� |
| Equity affiliates |
�� | � | 15 | �� | �� | � | 16 | �� | �� | � | 15 | �� | �� | � | 15 | �� |
| � |
� | |||||||||||||||
| Total crude oil |
�� | � | 87 | �� | �� | � | 93 | �� | �� | � | 93 | �� | �� | � | 97 | �� |
| � |
� | |||||||||||||||
| Natural gas liquids (MBD) |
�� | �� | �� | �� | ||||||||||||
| Consolidated operations |
�� | � | 8 | �� | �� | � | 13 | �� | �� | � | 10 | �� | �� | � | 14 | �� |
| Equity affiliates |
�� | � | 8 | �� | �� | � | 8 | �� | �� | � | 7 | �� | �� | � | 8 | �� |
| � |
� | |||||||||||||||
| Total natural gas liquids |
�� | � | 16 | �� | �� | � | 21 | �� | �� | � | 17 | �� | �� | � | 22 | �� |
| � |
� | |||||||||||||||
| Natural gas (MMCFD) |
�� | �� | �� | �� | ||||||||||||
| Consolidated operations |
�� | � | 670 | �� | �� | � | 712 | �� | �� | � | 715 | �� | �� | � | 707 | �� |
| Equity affiliates |
�� | � | 518 | �� | �� | � | 507 | �� | �� | � | 501 | �� | �� | � | 494 | �� |
| � |
� | |||||||||||||||
| Total natural gas |
�� | � | 1,188 | �� | �� | � | 1,219 | �� | �� | � | 1,216 | �� | �� | � | 1,201 | �� |
| � |
� | |||||||||||||||
| Total Production (MBOED) |
�� | � | 301 | �� | �� | � | 317 | �� | �� | � | 314 | �� | �� | � | 320 | �� |
| � |
� | |||||||||||||||
| Average Sales Prices |
�� | �� | �� | �� | ||||||||||||
| Crude oil (dollars per barrel) |
�� | �� | �� | �� | ||||||||||||
| Consolidated operations |
�� | $ | 99.07 | �� | �� | � | 105.43 | �� | �� | � | 103.28 | �� | �� | � | 104.30 | �� |
| Equity affiliates |
�� | � | 104.09 | �� | �� | � | 105.78 | �� | �� | � | 106.57 | �� | �� | � | 104.51 | �� |
| Total crude oil |
�� | � | 99.92 | �� | �� | � | 105.48 | �� | �� | � | 103.82 | �� | �� | � | 104.33 | �� |
| Natural gas liquids (dollars per barrel) |
�� | �� | �� | �� | ||||||||||||
| Consolidated operations |
�� | � | 69.69 | �� | �� | � | 71.35 | �� | �� | � | 73.97 | �� | �� | � | 72.38 | �� |
| Equity affiliates |
�� | � | 67.13 | �� | �� | � | 69.90 | �� | �� | � | 71.51 | �� | �� | � | 70.68 | �� |
| Total natural gas liquids |
�� | � | 68.48 | �� | �� | � | 70.76 | �� | �� | � | 72.96 | �� | �� | � | 71.74 | �� |
| Natural gas (dollars per thousand cubic feet) |
�� | �� | �� | �� | ||||||||||||
| Consolidated operations |
�� | � | 9.39 | �� | �� | � | 10.81 | �� | �� | � | 10.03 | �� | �� | � | 10.87 | �� |
| Equity affiliates |
�� | � | 9.11 | �� | �� | � | 9.35 | �� | �� | � | 9.97 | �� | �� | � | 9.18 | �� |
| Total natural gas |
�� | � | 9.26 | �� | �� | � | 10.21 | �� | �� | � | 10.00 | �� | �� | � | 10.18 | �� |
| � |
� | |||||||||||||||
The Asia Pacific and Middle East segment has operations in China, Indonesia, Malaysia, Australia, Timor-Leste and Qatar, as well as exploration activities in Bangladesh and Brunei. As of September�30, 2014, Asia Pacific and Middle East contributed 13 percent of our worldwide liquids production and 31 percent of our natural gas production.
Asia Pacific and Middle East earnings increased 2 percent in the third quarter and decreased 12 percent in the nine-month period of 2014 compared with the same periods of 2013. The increase in third-quarter 2014 earnings was mainly due to the absence of a $116 million after-tax charge in 2013 associated with the Bohai Bay seepage incidents, largely offset by lower volumes. Lower prices and higher operating expenses were nearly offset by higher equity earnings, mostly due to a $60 million tax benefit from foreign currency exchange rate movements; lower taxes; and a $30 million after-tax benefit resulting from a legal settlement.
�
41
Table of Contents
The reduction in earnings in the nine-month period of 2014 was mainly due to lower volumes, primarily LNG and crude oil, and higher operating expenses, mostly as a result of major planned maintenance at our Bayu-Undan Field and Darwin LNG facility in Australia. Lower natural gas prices also contributed to the decrease in earnings. These decreases were partially offset by higher LNG prices and lower taxes. The 2014 benefits from the absence of the $116 million after-tax charge in 2013 related to Bohai Bay and the $30 million after-tax legal settlement in 2014 were offset by the absence of a $146 million after-tax insurance settlement received in 2013, also associated with the Bohai Bay seepage incidents.
Average production decreased 5 percent in the third quarter and 2 percent in the nine-month period of 2014 compared with the same periods of 2013. The decrease in both periods of 2014 was largely attributable to normal field decline and major planned maintenance at Bayu-Undan and Darwin LNG, partially offset by higher production, mainly from China, Indonesia and Malaysia.
KBB Update
We expect first gas for KBB in November 2014; however, our production rate will be significantly constrained, pending repairs on a third-party pipeline. We expect peak production by mid-2015.
Other International
| � | �� | Three�Months�Ended | � | �� | Nine�Months�Ended | � | ||||||||||
| � | �� | September�30 | � | �� | September�30 | � | ||||||||||
| � | �� | 2014 | � | � | 2013 | � | �� | 2014 | � | �� | 2013 | � | ||||
| �� | � |
� |
� | |||||||||||||
| Income (Loss) From Continuing Operations (millions of dollars) |
�� | $ | (18 | )� | � | � | 283 | �� | �� | � | 74 | �� | �� | � | 328 | �� |
| � |
� | |||||||||||||||
| Average Net Production* |
�� | � | �� | �� | ||||||||||||
| Crude oil (MBD) |
�� | � | �� | �� | ||||||||||||
| Consolidated operations |
�� | � | 8 | �� | � | � | 17 | �� | �� | � | 3 | �� | �� | � | 34 | �� |
| Equity affiliates |
�� | � | 4 | �� | � | � | 4 | �� | �� | � | 4 | �� | �� | � | 5 | �� |
| � |
� | |||||||||||||||
| Total crude oil |
�� | � | 12 | �� | � | � | 21 | �� | �� | � | 7 | �� | �� | � | 39 | �� |
| � |
� | |||||||||||||||
| Natural gas (MMCFD) |
�� | � | 1 | �� | � | � | 33 | �� | �� | � | 2 | �� | �� | � | 30 | �� |
| � |
� | |||||||||||||||
| Total Production (MBOED) |
�� | � | 12 | �� | � | � | 26 | �� | �� | � | 7 | �� | �� | � | 44 | �� |
| � |
� | |||||||||||||||
| Average Sales Prices* |
�� | � | �� | �� | ||||||||||||
| Crude oil (dollars per barrel) |
�� | � | �� | �� | ||||||||||||
| Consolidated operations |
�� | $ | 95.22 | �� | � | � | 107.49 | �� | �� | � | 95.82 | �� | �� | � | 107.21 | �� |
| Equity affiliates |
�� | � | 66.47 | �� | � | � | 75.90 | �� | �� | � | 68.96 | �� | �� | � | 73.66 | �� |
| Total crude oil |
�� | � | 83.22 | �� | � | � | 100.85 | �� | �� | � | 77.62 | �� | �� | � | 103.20 | �� |
| Natural gas (dollars per thousand cubic feet) |
�� | � | � | �� | � | � | 5.92 | �� | �� | � | 6.44 | �� | �� | � | 5.20 | �� |
| � |
� | |||||||||||||||
The Other International segment includes operations in Libya and Russia, as well as exploration activities in Colombia, Poland, Angola, Senegal and Azerbaijan. As of September�30, 2014, Other International contributed 1 percent of our worldwide liquids production.
Other International earnings decreased $301 million in the third quarter and $254 million in the nine-month period of 2014 compared with the same periods of 2013. The decrease in both periods of 2014 was primarily due to the absence of the $288 million after-tax gain recognized on the 2013 disposition of our equity investment in Phoenix Park Processors Limited, located in Trinidad and Tobago. Additionally, earnings in the nine-month period of 2014 were impacted by lower volumes from Libya and lower earnings from equity affiliates, which mostly resulted from the Phoenix Park disposition. The reduction in earnings in the nine-
�
42
Table of Contents
month period of 2014 was partially offset by the recognition of other income of $154 million after-tax associated with the favorable resolution of a contingent liability.
Average production decreased 54 percent in the third quarter and 84 percent in the nine-month period of 2014 compared with the same periods in 2013. The decreases primarily resulted from the shutdown of the Es Sider crude oil export terminal in Libya, which began at the end of July 2013. Although the Es Sider Terminal reopened in the third quarter of 2014 and production and liftings have resumed, we continue to monitor developments in Libya.
Venezuela Arbitration
In October 2014 we filed for arbitration under the rules of the International Chamber of Commerce (ICC) against Petroleos de Venezuela (PDVSA), the Venezuela state oil company, for contractual compensation related to the Petrozuata and Hamaca heavy crude oil projects. The ICC arbitration is a separate and independent legal action from the investment treaty arbitration against the government of Venezuela, which is pending before an arbitral tribunal under the World Bank�s International Centre for Settlement for Investment Disputes. For additional information, see Note 11�Contingencies and Commitments, in the Notes to Consolidated Financial Statements.
Exploration Update
In November 2014 we will plug and abandon the Kamoxi-1 exploration well, located in Block 36 offshore Angola. As a result, we plan to record an approximately $140 million after-tax charge to dry hole expense in the fourth quarter of 2014, which includes estimated costs through November 2014. After plugging Kamoxi-1, we expect to spud a well in adjacent Block 37, which will be the second wildcat in our planned four-well exploration program in the Kwanza Basin.
In October 2014 we announced oil was discovered at the FAN-1 well, offshore Senegal. Further evaluation is required to determine commerciality.
Asset Dispositions
In July 2014 we sold our Nigeria upstream affiliates, and we transferred our 17 percent interest in the Brass LNG Project to the remaining shareholders in Brass LNG Limited. In 2013, we sold our Algeria business and our interest in Kashagan. Results of operations related to Nigeria, Algeria and Kashagan have been classified as discontinued operations in all periods presented in this Form 10-Q. For additional information, see Note�2�Discontinued Operations, in the Notes to Consolidated Financial Statements.
�
43
Table of Contents
Corporate and Other
| � | �� | Millions of Dollars | � | |||||||||||||
| � | �� | Three�Months�Ended | � | � | Nine�Months�Ended | � | ||||||||||
| � | �� | September�30 | � | � | September�30 | � | ||||||||||
| � | �� | 2014 | � | � | 2013 | � | � | 2014 | � | � | 2013 | � | ||||
| �� | � |
� |
� | |||||||||||||
| Income (Loss) From Continuing Operations |
�� | � | � | � | ||||||||||||
| Net interest |
�� | $ | (36 | )� | � | � | (124 | )� | � | � | (357 | )� | � | � | (359 | )� |
| Corporate general and administrative expenses |
�� | � | (51 | )� | � | � | (77 | )� | � | � | (133 | )� | � | � | (147 | )� |
| Technology |
�� | � | (26 | )� | � | � | (26 | )� | � | � | (74 | )� | � | � | 7 | �� |
| Other |
�� | � | (17 | )� | � | � | (7 | )� | � | � | (52 | )� | � | � | (70 | )� |
| � |
� | |||||||||||||||
| �� | $ | (130 | )� | � | � | (234 | )� | � | � | (616 | )� | � | � | (569 | )� | |
| � |
� | |||||||||||||||
Net interest consists of interest and financing expense, net of interest income and capitalized interest, as well as premiums incurred on the early retirement of debt. Net interest decreased 71 percent in the third quarter of 2014 compared with the same period in 2013, primarily as a result of a $93 million tax benefit associated with the election of the fair market value method of apportioning interest expense in the United States, as well as a $28 million after-tax benefit associated with interest on a favorable tax settlement. These improvements were partly offset by lower capitalized interest on projects. In the nine-month period of 2014, these tax benefits were largely offset by lower capitalized interest on projects sold or completed.
Corporate general and administrative expenses decreased 34 percent in the third quarter of 2014, mainly due to lower pension settlement expense. Pension settlement expense incurred in the third quarter of 2013 was $31�million after-tax. We did not incur pension settlement expense in the third quarter of 2014.
Technology includes our investment in new technologies or businesses, as well as licensing revenues received. Activities are focused on heavy oil and oil sands, unconventional reservoirs, LNG, and subsurface, arctic and deepwater technologies, with an underlying commitment to environmental responsibility. Losses from Technology were $74 million in the nine-month period of 2014, compared with earnings of $7 million in the same period of 2013. The reduction in earnings primarily resulted from lower licensing revenues and higher research and development expenses.
The category �Other� includes certain foreign currency transaction gains and losses, environmental costs associated with sites no longer in operation, and other costs not directly associated with an operating segment. �Other� expenses improved 26 percent in the nine-month period of 2014 compared with the same period of 2013. This improvement was mainly due to foreign currency transaction gains, compared with foreign currency transaction losses in the same period of 2013.
�
44
Table of Contents
CAPITAL RESOURCES AND LIQUIDITY
Financial Indicators
�
| � | �� | Millions of Dollars | � | |||||
| � | �� | September�30 2014 |
� | � | December�31 2013 |
� | ||
| �� | � |
� |
� | |||||
| Short-term debt |
�� | $ | 1,688 | �� | � | � | 589 | �� |
| Total debt |
�� | � | 21,187 | �� | � | � | 21,662 | �� |
| Total equity |
�� | � | 55,661 | �� | � | � | 52,492 | �� |
| Percent of total debt to capital* |
�� | � | 28 | %� | � | � | 29 | �� |
| Percent of floating-rate debt to total debt** |
�� | � | 8 | %� | � | � | 8 | �� |
| � |
� | |||||||
| ��*Capital includes total debt and total equity. | �� | � | ||||||
| **Includes effect of interest rate swaps. | �� | � | ||||||
To meet our short- and long-term liquidity requirements, we look to a variety of funding sources. Cash generated from continuing operating activities is the primary source of funding. During the first nine months of 2014, the primary uses of our available cash were $12,729 million to support our ongoing capital expenditures and investments program, $2,618 million to pay dividends and $505 million to repay debt. During the first nine months of 2014, cash and cash equivalents decreased by $838�million, to $5,408�million.
In addition to cash flows from operating activities, we rely on our commercial paper and credit facility programs and our shelf registration statement to support our short- and long-term liquidity requirements. We believe current cash balances and cash generated by operations, together with access to external sources of funds as described below in the �Significant Sources of Capital� section, will be sufficient to meet our funding requirements in the near- and long-term, including our capital spending program, dividend payments, and required debt payments.
Significant Sources of Capital
Operating Activities
Cash provided by continuing operating activities was $13,995 million for the first nine months of 2014, compared with $11,941 million for the corresponding period of 2013, a 17 percent increase. The increase was primarily due to the $1.3 billion distribution from FCCL in the first quarter of 2014 and lower tax payments due to a smaller proportion of income in higher tax jurisdictions in 2014. The distribution from FCCL resulted from our $2.8 billion prepayment of the remaining joint venture acquisition obligation in 2013, which substantially increased the financial flexibility of our 50 percent owned FCCL Partnership. We do not expect this individually significant distribution to recur in the future under current economic conditions.
While the stability of our cash flows from operating activities benefits from geographic diversity, our short- and long-term operating cash flows are highly dependent upon prices for crude oil, bitumen, natural gas, LNG and natural gas liquids. Prices and margins in our industry have historically been volatile and are driven by market conditions over which we have no control. Absent other mitigating factors, as these prices and margins fluctuate, we would expect a corresponding change in our operating cash flows.
The level of absolute production volumes, as well as product and location mix, impacts our cash flows. Production levels are impacted by such factors as acquisitions and dispositions of fields, field production decline rates, new technologies, operating efficiencies, weather conditions, the addition of proved reserves through exploratory success, and their timely and cost-effective development. While we actively manage these factors, production levels can cause variability in cash flows, although generally this variability has not been as significant as that caused by commodity prices.
�
45
Table of Contents
Asset Sales
On July�30, 2014, we sold our Nigeria upstream affiliates for net proceeds of $1.4 billion, after customary adjustments, inclusive of deposits previously received. In 2013 we sold our Algeria business and our interest in Kashagan. Results of operations related to Nigeria, Algeria and Kashagan have been classified as discontinued operations in all periods presented in this Form 10-Q. For additional information, see Note 2�Discontinued Operations, in the Notes to Consolidated Financial Statements. We continue to evaluate opportunities to further optimize the portfolio.
Commercial Paper and Credit Facilities
In June 2014 we refinanced our revolving credit facility from a total of $7.5 billion to $7.0 billion, with a new expiration date of June 2019. Our revolving credit facility may be used for direct bank borrowings, for the issuance of letters of credit totaling up to $500 million, or as support for our commercial paper programs. The revolving credit facility is broadly syndicated among financial institutions and does not contain any material adverse change provisions or any covenants requiring maintenance of specified financial ratios or credit ratings. The facility agreement contains a cross-default provision relating to the failure to pay principal or interest on other debt obligations of $200 million or more by ConocoPhillips, or any of its consolidated subsidiaries.
Credit facility borrowings may bear interest at a margin above rates offered by certain designated banks in the London interbank market as administered by ICE Benchmark Administration or at a margin above the overnight federal funds rate or prime rates offered by certain designated banks in the United States. The agreement calls for commitment fees on available, but unused, amounts. The agreement also contains early termination rights if our current directors or their approved successors cease to be a majority of the Board of Directors.
Our primary funding source for short-term working capital needs is the ConocoPhillips $6.1�billion commercial paper program. Commercial paper maturities are generally limited to 90 days. We also have the ConocoPhillips Qatar Funding Ltd. $900 million commercial paper program, which is used to fund commitments relating to Qatar Liquefied Gas Company Limited (3). At both September�30, 2014 and December�31, 2013, we had no direct borrowings or letters of credit issued under the revolving credit facility. In addition, under the ConocoPhillips Qatar Funding Ltd. commercial paper�programs, $860�million of commercial paper was outstanding at September�30, 2014, compared with $961�million at December�31, 2013. Since we had $860�million of commercial paper outstanding and had issued no letters of credit, we had access to $6.1 billion in borrowing capacity under our revolving credit facility at September�30, 2014.
Certain of our project-related contracts and derivative instruments contain provisions requiring us to post collateral. Many of these contracts and instruments permit us to post either cash or letters of credit as collateral. At September�30, 2014 and December�31, 2013, we had direct bank letters of credit of $700 million and $827 million, respectively, which secured performance obligations related to various purchase commitments incident to the ordinary conduct of business.
Shelf Registration
We have a universal shelf registration statement on file with the U.S. Securities and Exchange Commission under which we, as a well-known seasoned issuer, have the ability to issue and sell an indeterminate amount of various types of debt and equity securities.
Off-Balance Sheet Arrangements
As part of our normal ongoing business operations and consistent with normal industry practice, we enter into numerous agreements with other parties to pursue business opportunities, which share costs and apportion risks among the parties as governed by the agreements.
For information about guarantees, see Note 10�Guarantees, in the Notes to Consolidated Financial Statements, which is incorporated herein by reference.
�
46
Table of Contents
Capital Requirements
For information about our capital expenditures and investments, see the �Capital Spending� section.
Our debt balance at September�30, 2014, was $21.2 billion, a decrease of $475 million from the balance at December�31, 2013. Our short-term debt balance at September�30, 2014, increased $1.1 billion compared with December�31, 2013, primarily as a result of the timing of scheduled maturities. During the first nine months of 2014, we repaid notes at maturity totaling $400 million. In October 2014 we notified holders of the outstanding $1.5 billion 4.60% Notes due January 2015 that early redemption will occur in November 2014. For more information, see Note 8�Debt, in the Notes to Consolidated Financial Statements.
In July 2014 we announced a 5.8 percent increase in the quarterly dividend rate to 73 cents per share. The dividend was paid September�2, 2014, to stockholders of record at the close of business on July�21, 2014. In October 2014 we announced a dividend of 73 cents per share. The dividend will be paid December�1, 2014, to stockholders of record at the close of business on October�14, 2014.
Capital Spending
�
| � | �� | Millions�of�Dollars | � | |||||
| � | �� | Nine�Months�Ended September�30 |
� | |||||
| � | �� | 2014 | � | �� | 2013 | � | ||
| �� | � |
� |
� | |||||
| Alaska |
�� | $ | 1,174 | �� | �� | � | 836 | �� |
| Lower 48 |
�� | � | 4,353 | �� | �� | � | 3,885 | �� |
| Canada |
�� | � | 1,750 | �� | �� | � | 1,602 | �� |
| Europe |
�� | � | 1,912 | �� | �� | � | 2,326 | �� |
| Asia Pacific and Middle East |
�� | � | 3,019 | �� | �� | � | 2,306 | �� |
| Other International |
�� | � | 403 | �� | �� | � | 229 | �� |
| Corporate and Other |
�� | � | 118 | �� | �� | � | 97 | �� |
| � |
� | |||||||
| Capital expenditures and investments from continuing operations |
�� | $ | 12,729 | �� | �� | � | 11,281 | �� |
| � |
� | |||||||
| Discontinued operations in Kashagan, Nigeria and Algeria |
�� | $ | 59 | �� | �� | � | 540 | �� |
| Joint venture acquisition obligation (principal)�Canada |
�� | � | � | �� | �� | � | 575 | �� |
| � |
� | |||||||
| Capital Program |
�� | $ | 12,788 | �� | �� | � | 12,396 | �� |
| � |
� | |||||||
During the first nine months of 2014, capital expenditures and investments from continuing operations supported key exploration and development programs, primarily:
�
| � | � | � | Oil and natural gas development and exploration activities in the Lower 48, including the Eagle Ford, Bakken and Niobrara shale plays, and the Permian Basin. |
| � | � | � | Development of coalbed methane projects associated with the APLNG joint venture in Australia. |
| � | � | � | Oil sands development and ongoing liquids-rich plays in Canada. |
| � | � | � | In Europe, development activities in the Greater Ekofisk, Aasta Hansteen, Clair Ridge and Jasmine areas, and appraisal activities in the Greater Clair Area. |
| � | � | � | Alaska activities related to development in the Greater Kuparuk Area and the Greater Prudhoe Area, as well as exploration and development activities in the Western North Slope. |
| � | � | � | Exploration and appraisal drilling in deepwater Gulf of Mexico. |
| � | � | � | Continued development of offshore fields in Malaysia and Indonesia and ongoing exploration, appraisal and development activity offshore Australia and China. |
| � | � | � | Exploration activities in Angola and Senegal. |
�
47
Table of Contents
Contingencies
A number of lawsuits involving a variety of claims arising in the ordinary course of business have been made against ConocoPhillips. We also may be required to remove or mitigate the effects on the environment of the placement, storage, disposal or release of certain chemical, mineral and petroleum substances at various active and inactive sites. We regularly assess the need for accounting recognition or disclosure of these contingencies. In the case of all known contingencies (other than those related to income taxes), we accrue a liability when the loss is probable and the amount is reasonably estimable. If a range of amounts can be reasonably estimated and no amount within the range is a better estimate than any other amount, then the minimum of the range is accrued. We do not reduce these liabilities for potential insurance or third-party recoveries. If applicable, we accrue receivables for probable insurance or other third-party recoveries. With respect to income-tax-related contingencies, we use a cumulative probability-weighted loss accrual in cases where sustaining a tax position is less than certain.
Based on currently available information, we believe it is remote that future costs related to known contingent liability exposures will exceed current accruals by an amount that would have a material adverse impact on our consolidated financial statements. As we learn new facts concerning contingencies, we reassess our position both with respect to accrued liabilities and other potential exposures. Estimates particularly sensitive to future changes include contingent liabilities recorded for environmental remediation, tax and legal matters. Estimated future environmental remediation costs are subject to change due to such factors as the uncertain magnitude of cleanup costs, the unknown time and extent of such remedial actions that may be required, and the determination of our liability in proportion to that of other responsible parties. Estimated future costs related to tax and legal matters are subject to change as events evolve and as additional information becomes available during the administrative and litigation processes. For information on other contingencies, see Note�11�Contingencies and Commitments, in the Notes to Consolidated Financial Statements.
Legal Matters
We are subject to various lawsuits and claims including but not limited to matters involving oil and gas royalty and severance tax payments, gas measurement and valuation methods, contract disputes, environmental damages, personal injury, and property damage. Our primary exposures for such matters relate to alleged royalty underpayments on certain federal, state and privately owned properties and claims of alleged environmental contamination from historic operations. We will continue to defend ourselves vigorously in these matters.
Our legal organization applies its knowledge, experience and professional judgment to the specific characteristics of our cases, employing a litigation management process to manage and monitor the legal proceedings against us. Our process facilitates the early evaluation and quantification of potential exposures in individual cases. This process also enables us to track those cases that have been scheduled for trial and/or mediation. Based on professional judgment and experience in using these litigation management tools and available information about current developments in all our cases, our legal organization regularly assesses the adequacy of current accruals and determines if adjustment of existing accruals, or establishment of new accruals, is required.
Environmental
We are subject to the same numerous international, federal, state and local environmental laws and regulations as other companies in our industry. For a discussion of the most significant of these environmental laws and regulations, including those with associated remediation obligations, see the �Environmental� section in Management�s Discussion and Analysis of Financial Condition and Results of Operations on pages 63�65 of our 2013 Annual Report on Form 10-K.
We occasionally receive requests for information or notices of potential liability from the Environmental Protection Agency (EPA) and state environmental agencies alleging that we are a potentially responsible party under the Federal Comprehensive Environmental Response, Compensation and Liability Act (CERCLA) or an equivalent state statute. On occasion, we also have been made a party to cost recovery litigation by those agencies or by private parties. These requests, notices and lawsuits assert potential liability for remediation
�
48
Table of Contents
costs at various sites that typically are not owned by us, but allegedly contain wastes attributable to our past operations. As of December�31, 2013, we reported we had been notified of potential liability under CERCLA and comparable state laws at 15 sites around the United States. As of September�30, 2014, there was no change in the number of sites.
At September�30, 2014, our balance sheet included a total environmental accrual of $366 million, compared with $348 million at December�31, 2013, for remediation activities in the United States and Canada. We expect to incur a substantial amount of these expenditures within the next 30 years.
Notwithstanding any of the foregoing, and as with other companies engaged in similar businesses, environmental costs and liabilities are inherent concerns in our operations and products, and there can be no assurance that material costs and liabilities will not be incurred. However, we currently do not expect any material adverse effect upon our results of operations or financial position as a result of compliance with current environmental laws and regulations.
Climate Change
There has been a broad range of proposed or promulgated state, national and international laws focusing on greenhouse gas (GHG) reduction. These proposed or promulgated laws apply or could apply in countries where we have interests or may have interests in the future. Laws in this field continue to evolve, and while it is not possible to accurately estimate either a timetable for implementation or our future compliance costs relating to implementation, such laws, if enacted, could have a material impact on our results of operations and financial condition. Examples of legislation and precursors for possible regulation that do or could affect our operations include the EPA�s announcement on March�29, 2010 (published as �Interpretation of Regulations that Determine Pollutants Covered by Clean Air Act Permitting Programs,� 75 Fed. Reg. 17004 (April 2, 2010)) and the EPA�s and U.S. Department of Transportation�s joint promulgation of a Final Rule on April�1, 2010, that trigger regulation of GHGs under the Clean Air Act, may trigger more climate-based claims for damages, and may result in longer agency review time for development projects.
For other examples of legislation or precursors for possible regulation and factors on which the ultimate impact on our financial performance will depend, see the �Climate Change� section in Management�s Discussion and Analysis of Financial Condition and Results of Operations on pages 65�66 of our 2013 Annual Report on Form 10-K.
�
49
Table of Contents
CAUTIONARY STATEMENT FOR THE PURPOSES OF THE �SAFE HARBOR� PROVISIONS OF THE PRIVATE SECURITIES LITIGATION REFORM ACT OF�1995
This report includes forward-looking statements within the meaning of Section�27A of the Securities Act of 1933 and Section�21E of the Securities Exchange Act of 1934. You can identify our forward-looking statements by the words �anticipate,� �estimate,� �believe,� �budget,� �continue,� �could,� �intend,� �may,� �plan,� �potential,� �predict,� �seek,� �should,� �will,� �would,� �expect,� �objective,� �projection,� �forecast,� �goal,� �guidance,� �outlook,� �effort,� �target� and similar expressions.
We based the forward-looking statements on our current expectations, estimates and projections about ourselves and the industries in which we operate in general. We caution you these statements are not guarantees of future performance as they involve assumptions that, while made in good faith, may prove to be incorrect, and involve risks and uncertainties we cannot predict. In addition, we based many of these forward-looking statements on assumptions about future events that may prove to be inaccurate. Accordingly, our actual outcomes and results may differ materially from what we have expressed or forecast in the forward-looking statements. Any differences could result from a variety of factors, including the following:
�
| � | � | � | Fluctuations in crude oil, bitumen, natural gas, LNG and natural gas liquids prices. |
| � | � | � | Potential failures or delays in achieving expected reserve or production levels from existing and future oil and gas developments due to operating hazards, drilling risks and the inherent uncertainties in predicting reserves and reservoir performance. |
| � | � | � | Unsuccessful exploratory drilling activities or the inability to obtain access to exploratory acreage. |
| � | � | � | Unexpected changes in costs or technical requirements for constructing, modifying or operating exploration and production facilities. |
| � | � | � | Lack of, or disruptions in, adequate and reliable transportation for our crude oil, bitumen, natural gas, LNG and natural gas liquids. |
| � | � | � | Inability to timely obtain or maintain permits, including those necessary for drilling and/or development, construction of LNG terminals or regasification facilities; comply with government regulations; or make capital expenditures required to maintain compliance. |
| � | � | � | Failure to complete definitive agreements and feasibility studies for, and to timely complete construction of, announced and future exploration and production and LNG development. |
| � | � | � | Potential disruption or interruption of our operations due to accidents, extraordinary weather events, civil unrest, political events, terrorism, cyber attacks or infrastructure constraints or disruptions. |
| � | � | � | International monetary conditions and exchange controls. |
| � | � | � | Substantial investment or reduced demand for products as a result of existing or future environmental rules and regulations. |
| � | � | � | Liability for remedial actions, including removal and reclamation obligations, under environmental regulations. |
| � | � | � | Liability resulting from litigation. |
| � | � | � | General domestic and international economic and political developments, including armed hostilities; expropriation of assets; changes in governmental policies relating to crude oil, bitumen, natural gas, LNG and natural gas liquids pricing, regulation or taxation; other political, economic or diplomatic developments; and international monetary fluctuations. |
| � | � | � | Changes in tax and other laws, regulations (including alternative energy mandates), or royalty rules applicable to our business. |
| � | � | � | Limited access to capital or significantly higher cost of capital related to illiquidity or uncertainty in the domestic or international financial markets. |
| � | � | � | Delays in, or our inability to, execute asset dispositions. |
| � | � | � | Inability to obtain economical financing for development, construction or modification of facilities and general corporate purposes. |
| � | � | � | The operation and financing of our joint ventures. |
| � | � | � | The factors generally described in Item�1A�Risk Factors in our 2013 Annual Report on Form 10-K. |
�
50
Table of Contents
| Item�3. | QUANTITATIVE AND QUALITATIVE DISCLOSURES ABOUT MARKET RISK |
Information about market risks for the nine months ended September�30, 2014, does not differ materially from that discussed under Item�7A in our 2013 Annual Report on Form 10-K.
�
| Item�4. | CONTROLS AND PROCEDURES |
We maintain disclosure controls and procedures designed to ensure that information required to be disclosed in reports we file or submit under the Securities Exchange Act of 1934, as amended (the Act), is recorded, processed, summarized and reported within the time periods specified in Securities and Exchange Commission rules and forms, and that such information is accumulated and communicated to management, including our principal executive and principal financial officers, as appropriate, to allow timely decisions regarding required disclosure. As of September�30, 2014, with the participation of our management, our Chairman and Chief Executive Officer (principal executive officer) and our Executive Vice President, Finance and Chief Financial Officer (principal financial officer) carried out an evaluation, pursuant to Rule 13a-15(b) of the Act, of ConocoPhillips� disclosure controls and procedures (as defined in Rule 13a-15(e) of the Act). Based upon that evaluation, our Chairman and Chief Executive Officer and our Executive Vice President, Finance and Chief Financial Officer concluded that our disclosure controls and procedures were operating effectively as of September�30, 2014.
There have been no changes in our internal control over financial reporting, as defined in Rule�13a-15(f) of the Act, in the period covered by this report that have materially affected, or are reasonably likely to materially affect, our internal control over financial reporting.
�
51
Table of Contents
�
| Item�1. | LEGAL PROCEEDINGS |
The following is a description of reportable legal proceedings including those involving governmental authorities under federal, state and local laws regulating the discharge of materials into the environment for this reporting period.�The following proceedings include those matters that arose during the third quarter of 2014 and any material developments with respect to matters previously reported in ConocoPhillips� 2013 Annual Report on Form�10-K.�While it is not possible to accurately predict the final outcome of these pending proceedings, if any one or more of such proceedings were to be decided adversely to ConocoPhillips, we expect there would be no material effect on our consolidated financial position.�Nevertheless, such proceedings are reported pursuant to the U.S. Securities and Exchange Commission (SEC) regulations.
On April�30, 2012, the separation of our downstream businesses was completed, creating two independent energy companies: ConocoPhillips and Phillips 66. In connection with the separation, we entered into an Indemnification and Release Agreement, which provides for cross-indemnities between Phillips 66 and us and established procedures for handling claims subject to indemnification and related matters, such as legal proceedings. We have included matters where we remain or have subsequently become a party to a proceeding relating to Phillips 66, in accordance with SEC regulations. We do not expect any of those matters to result in a net claim against us.
Matters previously reported�ConocoPhillips
The New Mexico Environment Department issued four Notices of Violation (NOVs) to ConocoPhillips alleging a total of 16 individual violations for failure to comply with air emission recordkeeping, reporting and testing requirements at various natural gas compression operations in northwestern New Mexico. These violations were alleged to have occurred between 2006 and 2012. ConocoPhillips worked with the agency and has resolved these NOVs by paying a penalty of $189,658.
Matters previously reported�Phillips 66
On May�19, 2010, the Lake Charles Refinery received a Consolidated Compliance Order and Notice of Potential Penalty from the Louisiana Department of Environmental Quality (LDEQ) alleging various violations of applicable air emission regulations, as well as certain provisions of the consent decree in Civil Action No. H-01-4430. Phillips 66 has resolved the consent decree issues and is working with the LDEQ to resolve the remaining allegations.
�
| Item�1A. | RISK FACTORS |
There have been no material changes from the risk factors disclosed in Item�1A of our 2013 Annual Report on Form 10-K.
�
52
Table of Contents
| Item�6. | EXHIBITS |
�
| 10.1* | �� | Form of Key Employee Award Terms and Conditions, as part of the ConocoPhillips Targeted Variable Long Term Incentive Program of ConocoPhillips, granted under the 2014 Omnibus Stock and Performance Incentive Plan of ConocoPhillips, dated September�15, 2014. |
| 12* | �� | Computation of Ratio of Earnings to Fixed Charges. |
| 31.1* | �� | Certification of Chief Executive Officer pursuant to Rule 13a-14(a) under the Securities Exchange Act of 1934. |
| 31.2* | �� | Certification of Chief Financial Officer pursuant to Rule 13a-14(a) under the Securities Exchange Act of 1934. |
| 32* | �� | Certifications pursuant to 18 U.S.C. Section 1350. |
| 101.INS* | �� | XBRL Instance Document. |
| 101.SCH* | �� | XBRL Schema Document. |
| 101.CAL* | �� | XBRL Calculation Linkbase Document. |
| 101.LAB* | �� | XBRL Labels Linkbase Document. |
| 101.PRE* | �� | XBRL Presentation Linkbase Document. |
| 101.DEF* | �� | XBRL Definition Linkbase Document. |
* Filed herewith.
�
53
Table of Contents
Pursuant to the requirements of the Securities Exchange Act of 1934, the registrant has duly caused this report to be signed on its behalf by the undersigned thereunto duly authorized.
�
| CONOCOPHILLIPS |
| /s/ Glenda M. Schwarz |
| Glenda M. Schwarz |
| Vice President and Controller |
| (Chief Accounting and Duly Authorized Officer) |
November�4, 2014
�
54
Exhibit 10.1
�

TARGETED VARIABLE LONG TERM INCENTIVE PROGRAM
SEPTEMBER 15, 2014
KEY EMPLOYEE AWARD
TERMS AND CONDITIONS
This Key Employee Award Terms and Conditions describes terms and conditions of Restricted Stock Unit Awards, as part of the ConocoPhillips Targeted Variable Long Term Incentive Program (Program), granted under the 2014 Omnibus Stock and Performance Incentive Plan of ConocoPhillips (referred to as the Plan) by ConocoPhillips (the Company) to certain eligible Employees (Employees). These Terms and Conditions, together with the Annual Award Summary given to each Employee receiving an Award, form the Award Agreement (the Agreement) relating to the Awards described. The Agreement covers Restricted Stock Units granted under the Program, and the term Employee covers recipients of Awards under the Program.
�
| 1. | Type and Size of Grant. Subject to the Plan and this Agreement, the Company grants to certain eligible Employees Restricted Stock Units. Individual awards will be as set forth in the Annual Award Summary given to each Employee to whom an Award is granted. The Annual Award Summary for each Employee is made a part of this Agreement with regard to such Employee. |
�
| 2. | Grant Date, Price, and Plan. The Grant Date and the Grant Price are set forth on the Award Summary given to each Employee to whom an Award is granted. Awards are made under the 2014 Omnibus Stock and Performance Incentive Plan. |
�
| 3. | Restrictions, Forfeiture, and Lapse of Restrictions. The Restricted Stock Units subject hereto may be canceled or forfeited as set forth herein. Except as otherwise noted in this Agreement, the following summary table describes restrictions and terms, forfeiture, and lapse of restrictions, subject to the more detailed provisions set forth below: |
Summary Table
�
| Summary of Termination Rules � | ||||
| Status |
�� | Termination Date |
�� | Forfeiture or Lapsing of Restrictions |
| Retirement (generally age 65 with at least 5 years of sevice, see Definitions section) |
�� | Prior to 6 months from Grant Date |
�� | Canceled upon Termination |
| �� | 6 months from Grant Date & after |
�� | Restrictions lapse on Termination date | |
| Layoff |
�� | Prior to 6 months from Grant Date |
�� | Canceled upon Termination |
| �� | 6 months from Grant Date & after |
�� | Award is prorated and restrictions on remaining units lapse on Termination date | |
| Disability |
�� | Prior to 1 month from Grant Date |
�� | Canceled upon Termination |
| �� | 1 month from Grant Date & after |
�� | Award is prorated and restrictions on remaining units lapse on Termination date | |
�
Effective 9/15/2014
�
Page 1 of 11
Exhibit 10.1
�
| � | � | � | ||
| Death |
�� | Prior to 1 month from�Grant�Date | �� | Canceled upon Termination |
| �� | 1 month from Grant Date & after |
�� | Award is prorated and restrictions on remaining units lapse on Termination date | |
| Divestitures, outsourcing, and moves to joint ventures |
�� | Any date after Grant Date |
�� | Canceled upon Termination, unless approval otherwise |
| All other Terminations |
�� | � | �� | Canceled upon Termination |
�
| (a) | Restrictions and Terms. |
�
| � | (i) | The Award shall be held in escrow by the Company until the lapsing of restrictions placed upon the Award. The Employee shall not have the right to sell, transfer, assign, or otherwise dispose of Restricted Stock Units granted in an Award until the escrow is terminated. Except as set forth below, the Award shall be forfeited and the related Restricted Stock Units canceled upon the Employee�s Termination of Employment with the Company prior to the lapsing of restrictions. Restrictions shall lapse on one-third of the Restricted Stock Units granted in an Award (rounded down to the nearest whole share) on the first anniversary of the Grant Date; restrictions shall lapse on a further one-third of the Restricted Stock Units granted in an Award (rounded down to the nearest whole share) on the second anniversary of the Grant Date; and restrictions shall lapse on the remaining Restricted Stock Units granted in an Award on the third anniversary of the Grant Date. Upon the lapsing of restrictions, the number of shares of unrestricted Stock equal to the number of shares of Restricted Stock Units for which the restrictions have so lapsed shall be registered in the Employee�s name, and the related shares of Restricted Stock Units shall be canceled; provided, however, that in places where it is determined by the Administrator that payout in the form of unrestricted Stock is prohibited by law, regulation, or decree, or where the cost of legal compliance to issue the unrestricted Stock would be unreasonably expensive, the Fair Market Value of such unrestricted Stock shall be paid in cash instead of settlement of the Award in unrestricted Stock. Cash payouts are only permitted where such legal restrictions exist. Settlement of the Award in unrestricted Stock or cash payout, if any, shall be made upon the lapsing of restrictions on the Award, but, in any event, shall be made no later than March�15 of the year following the year in which such restrictions lapse. |
�
| � | (ii) | Restricted Stock Units do not have any voting rights or other rights generally associated with Stock, and are merely an obligation of the Company to make settlement in accordance with the terms and conditions applicable to such Restricted Stock Units. Restricted Stock Units granted to Employees under the Program shall not accrue or be paid a dividend equivalent. |
�
| (b) | Termination of Employment. |
�
| � | (i) | General Rule for Termination. If, prior to the date on which restrictions lapse in accordance with the schedule set forth in the Award, the Employee�s employment with a Participating Company shall be terminated for any reason except death, Disability, Retirement, or Layoff, any Restricted Stock Units remaining in escrow pursuant to such Award shall be canceled and all rights thereunder shall cease; provided, however, that the Authorized Party may, in its or his sole discretion, determine that all or any portion of an Award shall not be canceled due to Termination of Employment. |
�
Effective 9/15/2014
�
Page 2 of 11
Exhibit 10.1
�
�
| � | (ii) | Layoff or Retirement Within Six Months. If, prior to a date six months from the Grant Date, the Employee�s employment with a Participating Company shall be terminated by reason of Layoff or Retirement, such Award shall be canceled and all rights thereunder shall cease. |
�
| � | (iii) | Layoff After Six Months. If, on or after a date six months from the Grant Date, the Employee�s employment with a Participating Company shall be terminated by reason of Layoff, the Employee shall retain a prorated number of the Restricted Stock Units of the Award. The number of Restricted Stock Units retained will be computed by multiplying the original number of Restricted Stock Units granted by a fraction, the numerator of which is the number of full months of employment from the first day of the month in which the Award was granted until the date the employee is terminated and the denominator of which is 36. Such calculation shall be rounded down to the nearest whole share. From this result the number of shares previously settled (or applied to tax withholding) from the Award shall be subtracted to determine the prorated Award. In such case, the restrictions on the prorated Award shall lapse on the date of Termination of the Employee from the employ of the Company and its subsidiaries, and settlement shall be made in accordance with the settlement provisions above. The remainder of the Award shall be canceled and all rights thereunder shall cease. |
�
| � | (iv) | Retirement After Six Months. If, on or after a date six months from the Grant Date, the Employee�s employment with a Participating Company shall be terminated by reason of Retirement, the Employee shall retain all rights provided by the Award at the time of such Termination of Employment. In such case, the restrictions on the Award shall lapse on the date of Termination of the Employee from the employ of the Company and its subsidiaries, and settlement shall be made in accordance with the settlement provisions above. |
�
| � | (v) | Disability. If, on or after a date one month from the Grant Date, an Employee shall terminate employment following Disability of the Employee, the Employee shall retain a prorated number of the Award shares or units granted. The number of Award shares or units retained will be computed by multiplying the original number of Award shares or units granted by a fraction, the numerator of which is the number of full months of employment from the first day of the month in which the Award was granted until the date the employee is terminated and the denominator of which is 36. Such calculation shall be rounded down to the nearest whole share. From this result the number of shares previously settled (or applied to tax withholding) from the Award shall be subtracted to determine the prorated Award. In such case, the restrictions on the prorated Award shall lapse on the date of Termination of the Employee from the employ of the Company and its subsidiaries, and settlement shall be made in accordance with the settlement provisions above. The remainder of the Award shall be canceled and all rights thereunder shall cease. |
�
| � | (vi) | Death. If, on or after a date one month from the Grant Date, an Employee shall die while in the employ of a Participating Company, the executor or administrator of the estate of the Employee or the person or persons to whom the Award shall have been validly transferred by the executor or the administrator pursuant to will or the laws of descent and distribution shall have the right to settlement of the Award to the same extent the Employee would have, had the Employee not died. In such case, the restrictions on a prorated number of the Restricted Stock Units granted in the Award shall lapse upon the determination of death by the Administrator, and settlement shall be made in accordance with the settlement provisions above. The number of Award shares or units retained will be computed by multiplying the original number of Award shares or units granted by a fraction, the numerator of which is the number of full months of employment from the first day of the month in which the Award was granted until the date the employee is |
�
Effective 9/15/2014
�
Page 3 of 11
Exhibit 10.1
�
| � | terminated and the denominator of which is 36. Such calculation shall be rounded down to the nearest whole share. From this result the number of shares previously settled (or applied to tax withholding) from the Award shall be subtracted to determine the prorated Award. In such case, the restrictions on the prorated Award shall lapse on the date of Termination of the Employee from the employ of the Company and its subsidiaries, and settlement shall be made in accordance with the settlement provisions above. The remainder of the Award shall be canceled and all rights thereunder shall cease. No transfer of an Award, or of the unrestricted Stock or other proceeds of an Award, by the Employee by will or by the laws of descent and distribution shall be effective to bind the Company unless the Administrator shall have been furnished with written notice thereof and a copy of the will and such other evidence as the Administrator may deem necessary to establish the validity of the transfer and the acceptance by the transferee or transferees of the terms and conditions of such Award. |
�
| � | (vii) | Transfers and Leaves. Transfer of employment between Participating Companies shall not constitute Termination of Employment for the purpose of any Award granted under the Program. Whether any leave of absence shall constitute Termination of Employment for the purposes of any Award granted under the Program shall be determined by the Administrator, in each case in accordance with applicable law and by application of the policies and procedures adopted by the Company in relation to such leave of absence. |
�
| � | (viii) | Divestiture, Outsourcing, or Move to Joint Venture. If, after the Grant Date, an Employee ceases to be employed by Participating Company as a result of (a)�the outsourcing of a function, (b)�the sale or transfer of all or a portion of the equity interest of such Participating Company (removing it from the controlled group of companies of which the Company is a part), (c)�the sale of all or substantially all of the assets of such Participating Company to another employer outside of the controlled group of corporations (whether the Employee is offered employment or accepts employment with the other employer), (d)�the Termination of the Employee by a Participating Company followed by employment within a reasonable time with a company or other entity in which the Company owns, directly or indirectly, at least a 50% interest, prior to exercise of an Award, or (e)�any other sale of assets determined by the Authorized Party to be considered a divestiture under this program, the Authorized Party may, in its or his sole discretion, determine that all or a portion of any such Award shall not be canceled. In such cases, the restrictions on the Award shall lapse on the date of Termination of the Employee from the employ of the Company and its subsidiaries, and settlement shall be made in accordance with the settlement provisions above. |
�
| � | (ix) | Change of Control. In the event of a Change of Control, as defined hereafter, unless explicitly provided otherwise in the applicable Award Agreement, all restrictions and other limitations applicable to any Restricted Stock Units granted in any Award shall remain in effect and will lapse in accordance with other provisions of this Award Agreement. Settlement in unrestricted Stock or cash shall be made at the same times and upon the same events as it would otherwise have been made in accordance with the settlement provisions above. |
�
| � | (x) | Notwithstanding anything herein to the contrary, in the event that this Award or any rights associated with this Award are includible in income pursuant to section 409A of the Internal Revenue Code, settlement of the Award or any other distribution hereunder due to Separation from Service with the Company and its subsidiaries shall not be made to a �specified employee� (as that term is defined in section 409A(a)(2)(B)(i)) prior to six months after the specified employee�s Separation from Service from the Company and its subsidiaries (or, if earlier, the date of death of the specified employee). |
�
| (c) | Detrimental Activities and Suspension of Award. |
�
Effective 9/15/2014
�
Page 4 of 11
Exhibit 10.1
�
�
| � | (i) | If the Authorized Party determines that, subsequent to the grant of any Award, the Employee has engaged or is engaging in any activity which, in the sole judgment of the Authorized Party, is or may be detrimental to the Company or a subsidiary, the Authorized Party may cancel all or part of the Restricted Stock Units held in escrow pursuant to the Award or Awards granted to that Employee. |
�
| � | (ii) | If the Authorized Party, in its or his sole discretion, determines that the lapsing of restrictions on Restricted Stock Units held in escrow pursuant to any Award has the possibility of violating any law, regulation, or decree pertaining to the Company, any of its subsidiaries, or the Employee, the Authorized Party may freeze or suspend the Employee�s right to settlement or payout of the Award until such time as the lapse of restrictions would no longer, in the sole discretion of the Authorized Party, have the possibility of violating such law, regulation, or decree. |
�
| � | (iii) | Notwithstanding anything herein to the contrary, any Award is subject to forfeiture or recoupment, in whole or in part, under applicable law, including the Sarbanes-Oxley Act and the Dodd-Frank Act. |
�
| 4. | Assignment of Award Upon Death. Rights under the Plans and this Agreement cannot be assigned or transferred other than by (i)�will or (ii)�the laws of descent and distribution. |
�
| 5. | Tax Withholding. In all cases the Employee will be responsible to pay all required withholding taxes associated with an Award. Should a withholding tax obligation arise with regard to an Award or the lapsing of restrictions on Restricted Stock Units granted in an Award, the withholding tax may be satisfied by withholding units or shares of Stock. The value of the units or shares of Stock withheld for this purpose shall not exceed the minimum withholding amount required by applicable laws and regulations. In cases where a withholding tax obligation arises prior to the lapse of restrictions on Restricted Stock Units granted in an Award, the withholding tax may be satisfied instead by other methods determined by the Administrator, such as payment of cash by the Employee or, if agreed by the Employee, payroll withholding. In cases where payment by payroll withholding cannot be made due to circumstances arising after the election or where the Administrator has determined that such withholding would violate any applicable law, regulation, or decree, shares of Stock shall be withheld instead. When necessary, lapsing of restrictions may be accelerated by the Authorized Party to the extent necessary to provide shares of Stock to satisfy any withholding tax obligation. This withholding tax obligation includes, but is not limited to, federal, state, and local taxes, including applicable non-U.S. taxes such as U.K. PAYE. |
�
| 6. | Shareholder Rights for Restricted Stock Units. The Employee shall not have the rights of a shareholder until the Restricted Stock Unit has been canceled and ownership of shares of Stock has been transferred to the Employee. |
�
| 7. | Certain Adjustments. In the event certain corporate transactions, recapitalizations, or stock splits occur while Restricted Stock Units are outstanding, the Grant Price and the number of Restricted Stock Units shall be correspondingly adjusted. |
�
| 8. | Relationship to the Plan. In addition to the terms and conditions described in this Agreement, Awards are subject to all other applicable provisions of the Plan. The decisions of the Committee with respect to questions arising as to the interpretation of the Plan or this Agreement or as to findings of fact, shall be final, conclusive, and binding. |
�
| 9. | No Employment Guarantee. No provision of this Agreement shall confer any right upon the Employee to continued employment with any Participating Company. |
�
Effective 9/15/2014
�
Page 5 of 11
Exhibit 10.1
�
�
| 10. | Governing Law. This Agreement shall be governed by, construed, and enforced in accordance with the laws of the State of Delaware. |
�
| 11. | Amendment. Without the consent of the Employee, this Agreement may be amended or supplemented (i)�to cure any ambiguity or to correct or supplement any provision herein which may be defective or inconsistent with any other provision herein, or (ii)�to add to the covenants and agreements of the Company for the benefit of an Employee or to add to the rights of an Employee or to surrender any right or power reserved to or conferred upon the Company in this Agreement, provided, in each case, that such changes or corrections shall not adversely affect the rights of the Employee with respect to the grant of an Award evidenced hereby without the Employee�s consent, or (iii)�to make such other changes as the Company, upon advice of counsel, determines are necessary or advisable because of the adoption or promulgation of, or change in or of the interpretation of, any law or governmental rule or regulation, including any applicable federal or state securities or tax laws. |
�
Effective 9/15/2014
�
Page 6 of 11
Exhibit 10.1
�
DEFINITIONS
Capitalized terms not defined below shall have the meanings set forth in the Plan.
�Authorized Party� means the person who is authorized to approve an Award, exercise discretion or take action under the Administrative Procedure for the Restricted Stock Program and pursuant to the Program. With regard to Senior Officers, the Committee is the Authorized Party. With regard to other Employees, the Chief Executive Officer, acting as the Special Equity Award Committee of the Board of Directors of the Company, is the Authorized Party, although the Committee may act concurrently as the Authorized Party.
�Award� means any Restricted Stock Units granted to an Employee pursuant to such applicable terms, conditions, and limitations as the Authorized Party may establish in order to fulfill the objectives of the Program.
�Change of Control� has the meaning set forth in Attachment A to these Terms and Conditions.
�Committee� means the Human Resources and Compensation Committee of the Board of Directors of the Company, or any successor committee to it.
�Company� means ConocoPhillips, a Delaware corporation.
�Disability� means a disability for which the employee in question has been determined to be entitled to either (i)�benefits under the applicable plan of long-term disability of the Company or its subsidiaries or (ii)�disability benefits under the Social Security Act. In the absence of any such determination, the Authorized Party may make a determination that the employee has a Disability.
�Fair Market Value� means, as of a particular date, the mean between the highest and lowest sales price per share of such Stock on the consolidated transaction reporting system for the principal national securities exchange on which shares of Stock are listed on that date, or, if there shall have been no such sale so reported on that date, on the next preceding date on which such a sale was so reported, or, at the discretion of the Committee, the price prevailing on the exchange at a designated time.
�Grant Price� means the Fair Market Value for one share of Stock as of the date of the grant of an Award. Grant Price is not adjusted for any restrictions applicable to the Award.
�Layoff� means an applicable Termination of Employment due to layoff under the ConocoPhillips Severance Pay Plan, the ConocoPhillips Executive Severance Plan, or the ConocoPhillips Key Employee Change in Control Severance Plan, or layoff or redundancy under any similar layoff or redundancy plan which the Company or its subsidiaries may adopt from time to time. If all or any portion of the benefits under the redundancy or layoff plan are contingent on the employee�s signing a general release of liability, such Termination shall not be considered as a �Layoff� for purposes of this Award unless the employee executes and does not revoke a general release of liability, acceptable to the Company, under the terms of such layoff or redundancy plan. In order to be considered a layoff for purposes of this Award, the Termination of Employment must also be considered a Separation from Service.
�Participating Company� includes ConocoPhillips and its 100% owned subsidiaries, including both those directly owned and those owned through subsidiaries, whose participation has been approved by the Authorized Party.
�Restricted Stock Unit� means a unit equal to one share of Stock (as determined by the Authorized Party) that is subject to forfeiture provisions or that has certain restrictions attached to the ownership thereof.
�
Effective 9/15/2014
�
Page 7 of 11
Exhibit 10.1
�
�Retirement� means Termination at age 65 or older with a minimum of 5 years service with a Participating Company with regard to Employees on the United States payroll. For Employees not on the United States payroll, Retirement means Termination at the earlier of: a) age 65 or older with a minimum of 5 years service with a Participating Company, or b) the government or company imposed mandatory retirement age with a minimum of 5 years service with a Participating Company. Service is defined by the policies of the Participating Company.
�Senior Officer� means the Chairman of the Board, the CEO, all other executive officers of the Company (determined in accordance with the Company�s custom and practice pursuant to section 16(b) of the Securities Exchange Act of 1934, as amended), all other employees of the Company who report directly to the CEO and whose salary grade is 23 or higher, and all other employees of the Company whose salary grade is 26 or higher.
�Separation from Service� means �separation from service� as that term is used in section 409A of the Internal Revenue Code.
�Stock� means shares of common stock of the Company, par value $.01. Stock may also be referred to as �Common Stock.�
�Termination� and �Termination of Employment� means cessation of employment with the Participating Companies, determined in accordance with the policies and practices of the Participating Company for whom the Employee was last performing services.
�
Effective 9/15/2014
�
Page 8 of 11
Exhibit 10.1
�
Attachment A
Change of Control
The following definitions apply to the Change of Control provision in Section�10 of the Plan.
�Affiliate� shall have the meaning ascribed to such term in Rule�12b-2 of the General Rules and Regulations under the Exchange Act, as in effect at the time of determination.
�Associate� shall mean, with reference to any Person, (a)�any corporation, firm, partnership, association, unincorporated organization or other entity (other than the Company or a subsidiary of the Company) of which such Person is an officer or general partner (or officer or general partner of a general partner) or is, directly or indirectly, the Beneficial Owner of 10% or more of any class of equity securities, (b)�any trust or other estate in which such Person has a substantial beneficial interest or as to which such Person serves as trustee or in a similar fiduciary capacity and (c)�any relative or spouse of such Person, or any relative of such spouse, who has the same home as such Person.
�Beneficial Owner� shall mean, with reference to any securities, any Person if:
(a) such Person or any of such Person�s Affiliates and Associates, directly or indirectly, is the �beneficial owner� of (as determined pursuant to Rule�13d-3 of the General Rules and Regulations under the Exchange Act, as in effect at the time of determination) such securities or otherwise has the right to vote or dispose of such securities;
(b) such Person or any of such Person�s Affiliates and Associates, directly or indirectly, has the right or obligation to acquire such securities (whether such right or obligation is exercisable or effective immediately or only after the passage of time or the occurrence of an event) pursuant to any agreement, arrangement or understanding (whether or not in writing) or upon the exercise of conversion rights, exchange rights, other rights, warrants or options, or otherwise; provided, however, that a Person shall not be deemed the Beneficial Owner of, or to �beneficially own,� (i)�securities tendered pursuant to a tender or exchange offer made by such Person or any of such Person�s Affiliates or Associates until such tendered securities are accepted for purchase or exchange or (ii)�securities issuable upon exercise of Exempt Rights; or
(c) such Person or any of such Person�s Affiliates or Associates (i)�has any agreement, arrangement or understanding (whether or not in writing) with any other Person (or any Affiliate or Associate thereof) that beneficially owns such securities for the purpose of acquiring, holding, voting (except as set forth in the proviso to subsection�(a) of this definition) or disposing of such securities or (ii)�is a member of a group (as that term is used in Rule�13d-5(b) of the General Rules and Regulations under the Exchange Act) that includes any other Person that beneficially owns such securities;
provided, however, that nothing in this definition shall cause a Person engaged in business as an underwriter of securities to be the Beneficial Owner of, or to �beneficially own,� any securities acquired through such Person�s participation in good faith in a firm commitment underwriting until the expiration of 40 days after the date of such acquisition. For purposes hereof, �voting� a security shall include voting, granting a proxy, consenting or making a request or demand relating to corporate action (including, without limitation, a demand for a shareholder list, to call a shareholder meeting or to inspect corporate books and records) or otherwise giving an authorization (within the meaning of section�14(a) of the Exchange Act) in respect of such security.
The terms �beneficially own� and �beneficially owning� shall have meanings that are correlative to this definition of the term Beneficial Owner.
�
Effective 9/15/2014
�
Page 9 of 11
Exhibit 10.1
�
�Board� shall have the meaning set forth in the Plan.
�Change of Control� shall mean any of the following occurring on or after January�1, 2014:
(a) any Person (other than an Exempt Person) shall become the Beneficial Owner of 20% or more of the shares of Common Stock then outstanding or 20% or more of the combined voting power of the Voting Stock of the Company then outstanding; provided, however, that no Change of Control shall be deemed to occur for purposes of this subsection�(a) if such Person shall become a Beneficial Owner of 20% or more of the shares of Common Stock then outstanding or 20% or more of the combined voting power of the Voting Stock of the Company then outstanding solely as a result of (i)�any acquisition directly from the Company or (ii)�any acquisition by a Person pursuant to a transaction that complies with clauses�(i), (ii), and (iii)�of subsection�(c) of this definition;
(b) individuals who, as of January�1, 2014, constitute the Board (the �Incumbent Board�) cease for any reason to constitute at least a majority of the Board; provided, however, that any individual becoming a director subsequent to January�1, 2014, whose election, or nomination for election by the Company�s shareholders, was approved by a vote of at least a majority of the directors then comprising the Incumbent Board shall be considered as though such individual were a member of the Incumbent Board; provided, further, that there shall be excluded, for this purpose, any such individual whose initial assumption of office occurs as a result of any actual or threatened election contest with respect to the election or removal of directors or other actual or threatened solicitation of proxies or consents by or on behalf of a Person other than the Board;
(c) the Company shall consummate a reorganization, merger, statutory share exchange, consolidation, or similar transaction involving the Company or any of its subsidiaries or sale or other disposition of all or substantially all of the assets of the Company, or the acquisition of assets or securities of another entity by the Company or any of its subsidiaries (a �Business Combination�), in each case, unless, following such Business Combination, (i)�50% or more of the then outstanding shares of common stock of the corporation, or common equity securities of an entity other than a corporation, resulting from such Business Combination and the combined voting power of the then outstanding Voting Stock of such corporation or other entity are beneficially owned, directly or indirectly, by all or substantially all of the Persons who were the Beneficial Owners of the outstanding Common Stock immediately prior to such Business Combination in substantially the same proportions as their ownership, immediately prior to such Business Combination, of the outstanding Common Stock, (ii)�no Person (excluding any Exempt Person or any Person beneficially owning, immediately prior to such Business Combination, directly or indirectly, 20% or more of the Common Stock then outstanding or 20% or more of the combined voting power of the Voting Stock of the Company then outstanding) beneficially owns, directly or indirectly, 20% or more of the then outstanding shares of common stock of the corporation, or common equity securities of an entity other than a corporation, resulting from such Business Combination or the combined voting power of the then outstanding Voting Stock of such corporation or other entity, and (iii)�at least a majority of the members of the board of directors of the corporation, or the body which is most analogous to the board of directors of a corporation if not a corporation, resulting from such Business Combination were members of the Incumbent Board at the time of the initial agreement or initial action by the Board providing for such Business Combination; or
(d) the shareholders of the Company shall approve a complete liquidation or dissolution of the Company unless such liquidation or dissolution is approved as part of a transaction that complies with clauses (i), (ii), and (iii)�of subsection (c)�of this definition.
�Common Stock� shall have the meaning set forth in the Plan.
�Company� shall have the meaning set forth in the Plan.
�
Effective 9/15/2014
�
Page 10 of 11
Exhibit 10.1
�
�Exchange Act� shall mean the Securities Exchange Act of 1934, as amended.
�Exempt Person� shall mean any of the Company, any entity controlled by the Company, any employee benefit plan (or related trust) sponsored or maintained by the Company or any entity controlled by the Company, and any Person organized, appointed, or established by the Company for or pursuant to the terms of any such employee benefit plan.
�Exempt Rights� shall mean any rights to purchase shares of Common Stock or other Voting Stock of the Company if at the time of the issuance thereof such rights are not separable from such Common Stock or other Voting Stock (i.e., are not transferable otherwise than in connection with a transfer of the underlying Common Stock or other Voting Stock), except upon the occurrence of a contingency, whether such rights exist as of January�1, 2014, or are thereafter issued by the Company as a dividend on shares of Common Stock or other Voting Securities or otherwise.
�Person� shall mean any individual, firm, corporation, partnership, association, trust, unincorporated organization, or other entity.
�Voting Stock� shall mean, (1)�with respect to a corporation, all securities of such corporation of any class or series that are entitled to vote generally in the election of, or to appoint by contract, directors of such corporation (excluding any class or series that would be entitled so to vote by reason of the occurrence of any contingency, so long as such contingency has not occurred) and (ii)�with respect to an entity which is not a corporation, all securities of any class or series that are entitled to vote generally in the election of, or to appoint by contract, members of the body which is most analogous to the board of directors of a corporation.
�
Effective 9/15/2014
�
Page 11 of 11
Exhibit 12
CONOCOPHILLIPS AND CONSOLIDATED SUBSIDIARIES
TOTAL ENTERPRISE
Computation of Ratio of Earnings to Fixed Charges
�
| � | �� | Millions�of�Dollars | � | |||||
| � | �� | Nine�Months�Ended September�30 |
� | |||||
| � | �� | 2014 | � | � | 2013 | � | ||
| �� | � |
� |
� | |||||
| Earnings Available for Fixed Charges |
�� | � | ||||||
| Income from continuing operations before income taxes and noncontrolling interests that have not incurred fixed charges |
�� | $ | 9,656 | �� | � | � | 11,844 | �� |
| Distributions greater (less) than equity in earnings of affiliates |
�� | � | 334 | *� | � | � | (585 | )� |
| Fixed charges, excluding capitalized interest** |
�� | � | 614 | �� | � | � | 548 | �� |
| � |
� | |||||||
| �� | $ | 10,604 | �� | � | � | 11,807 | �� | |
| � |
� | |||||||
| �� | � | |||||||
| Fixed Charges |
�� | � | ||||||
| Interest and debt expense, excluding capitalized interest |
�� | $ | 475 | �� | � | � | 420 | �� |
| Capitalized interest |
�� | � | 372 | �� | � | � | 538 | �� |
| Interest portion of rental expense |
�� | � | 57 | �� | � | � | 50 | �� |
| � |
� | |||||||
| �� | $ | 904 | �� | � | � | 1,008 | �� | |
| � |
� | |||||||
| Ratio of Earnings to Fixed Charges |
�� | � | 11.7 | �� | � | � | 11.7 | �� |
| � |
� | |||||||
| ��* | Includes a significant distribution from a Canadian joint venture. |
| ** | Includes amortization of capitalized interest totaling approximately $82 million in 2014 and $78�million in 2013. |
Exhibit 31.1
CERTIFICATION
I, Ryan M. Lance, certify that:
�
| 1. | I have reviewed this quarterly report on Form 10-Q of ConocoPhillips; |
�
| 2. | Based on my knowledge, this report does not contain any untrue statement of a material fact or omit to state a material fact necessary to make the statements made, in light of the circumstances under which such statements were made, not misleading with respect to the period covered by this report; |
�
| 3. | Based on my knowledge, the financial statements, and other financial information included in this report, fairly present in all material respects the financial condition, results of operations and cash flows of the registrant as of, and for, the periods presented in this report; |
�
| 4. | The registrant�s other certifying officer and I are responsible for establishing and maintaining disclosure controls and procedures (as defined in Exchange Act Rules 13a-15(e) and 15d-15(e)) and internal control over financial reporting (as defined in Exchange Act Rules 13a-15(f) and 15d-15(f)) for the registrant and have: |
�
| � | (a) | Designed such disclosure controls and procedures, or caused such disclosure controls and procedures to be designed under our supervision, to ensure that material information relating to the registrant, including its consolidated subsidiaries, is made known to us by others within those entities, particularly during the period in which this report is being prepared; |
�
| � | (b) | Designed such internal control over financial reporting, or caused such internal control over financial reporting to be designed under our supervision, to provide reasonable assurance regarding the reliability of financial reporting and the preparation of financial statements for external purposes in accordance with generally accepted accounting principles; |
�
| � | (c) | Evaluated the effectiveness of the registrant�s disclosure controls and procedures and presented in this report our conclusions about the effectiveness of the disclosure controls and procedures, as of the end of the period covered by this report based on such evaluation; and |
�
| � | (d) | Disclosed in this report any change in the registrant�s internal control over financial reporting that occurred during the registrant�s most recent fiscal quarter (the registrant�s fourth fiscal quarter in the case of an annual report) that has materially affected, or is reasonably likely to materially affect, the registrant�s internal control over financial reporting; and |
�
| 5. | The registrant�s other certifying officer and I have disclosed, based on our most recent evaluation of internal control over financial reporting, to the registrant�s auditors and the audit committee of the registrant�s board of directors (or persons performing the equivalent functions): |
�
| � | (a) | All significant deficiencies and material weaknesses in the design or operation of internal control over financial reporting which are reasonably likely to adversely affect the registrant�s ability to record, process, summarize and report financial information; and |
�
| � | (b) | Any fraud, whether or not material, that involves management or other employees who have a significant role in the registrant�s internal control over financial reporting. |
November�4, 2014
�
| /s/ Ryan M. Lance |
| Ryan M. Lance |
| Chairman and |
| Chief Executive Officer |
�
1
Exhibit 31.2
CERTIFICATION
I, Jeff W. Sheets, certify that:
�
| 1. | I have reviewed this quarterly report on Form 10-Q of ConocoPhillips; |
�
| 2. | Based on my knowledge, this report does not contain any untrue statement of a material fact or omit to state a material fact necessary to make the statements made, in light of the circumstances under which such statements were made, not misleading with respect to the period covered by this report; |
�
| 3. | Based on my knowledge, the financial statements, and other financial information included in this report, fairly present in all material respects the financial condition, results of operations and cash flows of the registrant as of, and for, the periods presented in this report; |
�
| 4. | The registrant�s other certifying officer and I are responsible for establishing and maintaining disclosure controls and procedures (as defined in Exchange Act Rules 13a-15(e) and 15d-15(e)) and internal control over financial reporting (as defined in Exchange Act Rules 13a-15(f) and 15d-15(f)) for the registrant and have: |
�
| � | (a) | Designed such disclosure controls and procedures, or caused such disclosure controls and procedures to be designed under our supervision, to ensure that material information relating to the registrant, including its consolidated subsidiaries, is made known to us by others within those entities, particularly during the period in which this report is being prepared; |
�
| � | (b) | Designed such internal control over financial reporting, or caused such internal control over financial reporting to be designed under our supervision, to provide reasonable assurance regarding the reliability of financial reporting and the preparation of financial statements for external purposes in accordance with generally accepted accounting principles; |
�
| � | (c) | Evaluated the effectiveness of the registrant�s disclosure controls and procedures and presented in this report our conclusions about the effectiveness of the disclosure controls and procedures, as of the end of the period covered by this report based on such evaluation; and |
�
| � | (d) | Disclosed in this report any change in the registrant�s internal control over financial reporting that occurred during the registrant�s most recent fiscal quarter (the registrant�s fourth fiscal quarter in the case of an annual report) that has materially affected, or is reasonably likely to materially affect, the registrant�s internal control over financial reporting; and |
�
| 5. | The registrant�s other certifying officer and I have disclosed, based on our most recent evaluation of internal control over financial reporting, to the registrant�s auditors and the audit committee of the registrant�s board of directors (or persons performing the equivalent functions): |
�
| � | (a) | All significant deficiencies and material weaknesses in the design or operation of internal control over financial reporting which are reasonably likely to adversely affect the registrant�s ability to record, process, summarize and report financial information; and |
�
| � | (b) | Any fraud, whether or not material, that involves management or other employees who have a significant role in the registrant�s internal control over financial reporting. |
November�4, 2014
�
| /s/ Jeff W. Sheets |
| Jeff W. Sheets |
| Executive Vice President, Finance and |
| Chief Financial Officer |
�
1
Exhibit 32
CERTIFICATIONS PURSUANT TO 18 U.S.C. SECTION 1350
In connection with the Quarterly Report of ConocoPhillips (the Company) on Form�10-Q for the period ended September�30, 2014, as filed with the U.S. Securities and Exchange Commission on the date hereof (the Report), each of the undersigned hereby certifies, pursuant to 18 U.S.C. Section�1350, as adopted pursuant to Section�906 of the Sarbanes-Oxley Act of 2002, that to their knowledge:
�
| � | (1) | The Report fully complies with the requirements of Sections 13(a) or 15(d) of the Securities Exchange Act of 1934; and |
�
| � | (2) | The information contained in the Report fairly presents, in all material respects, the financial condition and results of operations of the Company. |
November�4, 2014
�
| /s/ Ryan M. Lance |
| Ryan M. Lance |
| Chairman and |
| Chief Executive Officer |
�
| /s/ Jeff W. Sheets |
| Jeff W. Sheets |
| Executive Vice President, Finance and |
| Chief Financial Officer |
Serious News for Serious Traders! Try StreetInsider.com Premium Free!
You May Also Be Interested In
- ConocoPhillips (COP) PT Raised to $154 at Susquehanna
- Signal Gold to Commence Exploration at the Fowler Target, Directly Along Strike to the East of the Goldboro Deposit
- ParaZero Integrates its Safety Technology into Draganfly’s Commander 3XL Drones for Home Hospital Delivery and Emergency Response
Create E-mail Alert Related Categories
SEC FilingsSign up for StreetInsider Free!
Receive full access to all new and archived articles, unlimited portfolio tracking, e-mail alerts, custom newswires and RSS feeds - and more!
