Form 8-K INTERNATIONAL BUSINESS For: Jan 19
UNITED STATES
SECURITIES AND EXCHANGE COMMISSION
WASHINGTON, D.C. 20549
FORM 8-K
CURRENT REPORT PURSUANT TO SECTION 13 OR 15 (d)
OF THE SECURITIES EXCHANGE ACT OF 1934
Date of Report: January 19, 2017
(Date of earliest event reported)
INTERNATIONAL BUSINESS MACHINES
CORPORATION
(Exact name of registrant as specified in its charter)
|
New York |
|
1-2360 |
|
13-0871985 |
|
(State of Incorporation) |
|
(Commission File Number) |
|
(IRS employer Identification No.) |
|
ARMONK, NEW YORK |
|
10504 |
|
(Address of principal executive offices) |
|
(Zip Code) |
914-499-1900
(Registrant’s telephone number)
Check the appropriate box below if the Form 8-K filing is intended to simultaneously satisfy the filing obligation of the registrant under any of the following provisions:
o Written communications pursuant to Rule 425 under the Securities Act (17 CFR 230.425)
o Soliciting material pursuant to Rule 14a-12 under the Exchange Act (17 CFR 240.14a-12)
o Pre-commencement communications pursuant to Rule 14d-2(b) under the Exchange Act (17 CFR 240.14d-2(b))
o Pre-commencement communications pursuant to Rule 13e-4(c) under the Exchange Act (17 CFR 240.13e-4(c))
Item 7.01. Regulation FD Disclosure.
Exhibit 99.1 of this Form 8-K contains the prepared remarks for IBM’s Chief Financial Officer Martin Schroeter’s fourth-quarter and full-year 2016 earnings presentation to investors on January 19, 2017.
Reconciliations of non-GAAP financial measures discussed in the earnings presentation to the most directly comparable financial measures calculated and presented in accordance with GAAP are included as Exhibit 99.2 of this Form 8-K. The slides used in Mr. Schroeter’s fourth-quarter and full-year 2016 earnings presentation are Exhibit 99.3 to the company’s Form 8-K submitted to the SEC on January 19, 2017.
The information in this Item 7.01, including the corresponding Exhibits 99.1 and 99.2, is being furnished with the Commission and shall not be deemed “filed” for purposes of Section 18 of the Securities Exchange Act of 1934 (the “Exchange Act”), with the exception of the following information from Mr. Schroeter’s prepared remarks and question and answer period of the earnings presentation, which has been edited for clarity, and shall be deemed “filed” under the Exchange Act:
· As part of the ongoing transformation of IBM, the company reorganized its client and commercial financing business as a wholly owned subsidiary, IBM Credit LLC. This will drive operational benefits by consolidating the operations of the financing business. This combined corporate structure will, over time, meet its funding requirements by issuing debt directly to the market, and the company expects that the entity will be able to access the capital markets later this year. The company will increase the financing business leverage from 7:1 to 9:1 – which represents an increase of about $600M in Global Financing debt.
· For 2017, the company expects the GAAP tax rate to be approximately 3 points lower than the operating (non-GAAP) tax rate expectation. The company expects its operating (non-GAAP) tax rate for 2017 to be about 15%, plus or minus 3 points (excluding discrete items).
· The company is not relying on growth in IP income for 2017, and within guidance, it could be down year to year a bit. However, the company has a good pool of opportunities for IP income to be the same level as 2016.
· The company expects free cash flow to be basically flat year over year in 2017.
· The company expects to grow GBS signings in the first quarter of 2017.
Forward-Looking Statements
Certain statements contained in this Form 8-K may be characterized as forward-looking under the Private Securities Litigation Reform Act of 1995. These statements involve a number of factors that could cause actual results to differ materially. Additional information concerning these factors is contained in the Company’s filings with the U.S. Securities and Exchange Commission (SEC). Copies are available from the SEC or from the IBM web site (www.ibm.com).
Item 9.01. Financial Statements and Exhibits.
(d) Exhibits
Except as noted in Item 7.01, the following exhibits are being furnished as part of this report:
|
Exhibit No. |
|
Description of Exhibit |
|
99.1 |
|
Prepared Remarks of Earnings Presentation on January 19, 2017 |
|
99.2 |
|
Non-GAAP Supplemental Materials |
IBM’s web site (www.ibm.com) contains a significant amount of information about IBM, including financial and other information for investors (www.ibm.com/investor/). IBM encourages investors to visit its various web sites from time to time, as information is updated and new information is posted.
SIGNATURE
Pursuant to the requirements of the Securities Exchange Act of 1934, the registrant has duly caused this report to be signed on its behalf by the undersigned, hereunto duly authorized.
|
Date: January 20, 2017 |
| |
|
|
| |
|
|
By: |
/s/ Stanley J. Sutula III |
|
|
|
|
|
|
|
Stanley J. Sutula III |
|
|
|
Vice President and Controller |
Exhibit 99.1
Introduction
Thank you. Good afternoon, good evening, good morning, depending on where you are. This is Patricia Murphy, Vice President of Investor Relations for IBM. I’m here today with Martin Schroeter, IBM’s Senior Vice President and Chief Financial Officer. I’d like to welcome you to our fourth quarter earnings presentation.
The prepared remarks will be available within a couple of hours, and a replay of the webcast will be posted by this time tomorrow.
I’ll remind you that certain comments made in this presentation may be characterized as forward looking under the Private Securities Litigation Reform Act of 1995. Those statements involve a number of factors that could cause actual results to differ materially. Additional information concerning these factors is contained in the company’s filings with the SEC. Copies are available from the SEC, from the IBM website, or from us in Investor Relations.
Our presentation also includes certain non-GAAP financial measures, in an effort to provide additional information to investors. All non-GAAP measures have been reconciled to their related GAAP measures in accordance with SEC rules. You will find reconciliation charts at the end of the presentation, and in the Form 8-K submitted to the SEC.
So with that, I’ll turn the call over to Martin Schroeter.
Overview
Thanks Patricia. As is typical in January, I’ll start out with some top level comments on the quarter and the year, discuss the details of the quarter, and then conclude with our view of 2017.
In the fourth quarter, we delivered revenue of $21.8 billion, operating net income of $4.8 billion, and operating earnings per share of $5.01, which is up three-and-a-half percent.
There are significant opportunities and shifts in our industry, and we believe that to be successful with enterprise clients, you need to bring together cognitive technologies on cloud platforms, that create industry-based solutions to solve real-world problems.
So with that very brief context around our point of view, let me comment on what we achieved in the full year of 2016. We made progress in building new businesses and creating new markets and continued to deliver strong results in our strategic imperatives. We invested at a high level, and remixed our skills to address these new opportunity areas. We also continued to innovate in the businesses that we have traditionally provided to our clients. We returned capital to our shareholders. And we achieved the earnings and free cash flow expectations we set last January, with $13.59 of operating earnings per share, and free cash flow of $11.6 billion, which is 97 percent of GAAP net income.
So we did what we said we’d do, in a year not only with a lot of change in the industry, but also a year with a number of macro conditions and events, particularly in countries that are meaningful to our results.
I’ll cover our expectations shortly, but right up front I’ll say that we are exiting 2016 in a stronger position than we entered it, and that is reflected in our 2017 guidance.
Looking at some of the highlights of the fourth quarter, we had terrific growth in cloud, with revenue up 33 percent. We also had good growth in our analytics, security, and mobile solutions. We’re continuing to grow our substantial technology services business, reflecting the work our clients are demanding to help modernize and transform their infrastructures. And we had really good performance in our z Systems business, reflecting the value of differentiated, high value solutions running important parts of our client’s infrastructure.
There were some macro challenges in the quarter in certain countries like Brazil, the UK and Germany, as well as the impact of a stronger dollar. As always my comments throughout will be based on constant currency.
A Cognitive Solutions & Cloud Platform Company
Our results for the quarter and the year reflect the success we’re having in our strategic areas, and the investments we’ve been making to drive that shift. We delivered 14 percent revenue growth in our strategic imperatives for the year, led by cloud. We finished the year with $13.7 billion of cloud revenue, which was 17 percent of IBM’s revenues. Our strategic imperatives, together generated $33 billion of revenue in 2016, and now represent 41 percent of our revenue. To put this in perspective, when we first established the strategic imperatives, we said they’d grow to $40 billion, and represent over 40 percent of our revenue by 2018. The growth we achieved in 2016 keeps us ahead of track to the $40 billion. In fact, a growth rate of 10 to 11 percent from here gets us to the $40 billion in 2018.
We’re moving into a new phase. The debate about whether artificial intelligence is real is over, and we’re getting to work to solve real business problems. As we move into this new era, it’s important to understand what enterprise clients are looking for. They need a cognitive platform that turns vast amounts of data into insights, and allows them to use it for competitive advantage. They need access to a cloud platform not only for the capability, but for speed and agility. And they need a partner they trust, and who understands their industry work and process flows.
This is where we’re clear and confident about our point of view. Yes, we have world-class cognitive technology, but that’s table stakes. We are building datasets by industry that we either own, or we partner for. Importantly, we’ve designed Watson on the IBM Cloud to allow our clients to retain control of their data and their insights, rather than using client data to educate a central knowledge graph. And we’re using our tremendous industry expertise to build vertical solutions and train Watson on specific industry domains. We are amassing these capabilities, because you need more than public data and automation algorithms to solve real problems like improving healthcare outcomes or navigating the banking regulatory environment. So in this new phase, data, and the business model around data matters, industry matters, and time matters. And that’s why Watson is the AI platform for business.
Let me give you a couple of examples of the progress we made in 2016, bringing together cognitive, the IBM Cloud and our industry expertise.
Watson Health provides cognitive insights on our enterprise-grade Watson Health Cloud, and leverages broad datasets that we own, including 100 million electronic health records, 200 million claims records, and 30 billion images. We now have 7,000 Watson Health employees, including doctors, nurses, health policy experts and 1,000 data scientists. We brought this together because you can’t change the way healthcare works, or work on curing cancer with public data alone. You need clinical data, payer data, images, all of which is private. You need the expertise of the leading oncologists and geneticists. And you need to do this work within a quality management system that is HIPAA-compliant.
So Watson Health was our first vertical. Late in the year, we launched Watson Financial Services, to provide targeted solutions, bringing together cloud, cognitive, industry and ecosystem capabilities. In the fourth quarter, we acquired Promontory, a leader in regulatory compliance and risk management consulting. We acquired Promontory because you can’t help banks navigate regulatory environments by scraping the web or automating keystrokes. You need top industry specialists that understand the complexity and can train Watson to deal with risk management requirements that are specific to financial services, because who trains your AI platform matters.
So bringing together cognitive technology, private data, a cloud platform and industry expertise is what you need to do real work in the enterprise.
What is also becoming very clear is that as IT moves to the cloud and as business processes are delivered as digital services, it is essential they are enterprise-strength and that the transactions are trusted by all parties involved. That’s where the blockchain comes in. It’s a technology that brings together shared ledgers with smart contracts, to allow the transfer of any asset, whether a physical asset like a shipping container, a financial asset like a bond, or a digital asset like music, across any business network.
Blockchain increases transparency, auditability and trust. It reduces risk, and it can drive tremendous efficiencies. Bottom line, blockchain will help to fundamentally reengineer business processes and improve outcomes. We’re building a complete blockchain platform and we have already worked with over 300 clients to pioneer blockchain for business. Many are in financial services, to handle foreign exchange settlement, smart contracts, identity management and trade finance. Just last week we announced securities clearing and settlement with DTCC.
But the application for blockchain is well beyond financial services. For example we’re collaborating with Walmart to improve the way food is tracked, transported and sold to consumers across China, and with Everledger, who is using a cloud-based blockchain to track the provenance of diamonds and other high value goods as they move through the supply chain. Here too, the data needed to improve food safety or track diamonds isn’t on the web. It’s private data, owned by enterprises, who want to work with a partner they trust.
So in 2016 we built blockchain platforms and services, and in 2017 we expect to start scaling blockchain networks. I’ll touch on a few more examples in the segment discussions. But first, I’ll walk through our financial metrics for the quarter.
Key Financial Metrics
Our revenue for the quarter was $21.8 billion, which is down 70 basis points. Over the course of the year, we’ve had growth in our annuity businesses, and some growth pressure in the transactional content. In the fourth quarter, even with a seasonally higher transactional content, and a little less contribution from acquisitions, our constant currency revenue performance was similar to third quarter. With the strengthening of the dollar, currency returned to a headwind. In fact, with the change in rates since mid-October and the seasonal skew of our business toward the back end of the quarter, revenue was impacted by nearly $300 million.
On a geographic basis, we had sequential improvements in both the Americas and Asia Pacific, while EMEA decelerated. Performance by country would generally be what you’d expect, based on macro and geo-political trends. We’ve all read about various issues in countries such as the UK, Germany, Brazil, Russia, Turkey, and so our performance in these countries reflects that reality. Some of these countries, UK, Germany, and Brazil for instance, have a meaningful impact to our results. Collectively, these 3 countries had over a one point impact on our revenue performance in the quarter. Others, like Russia, Turkey and Egypt were also a drag on our growth, though less of an impact given their size. We had really good results in China. In fact, China grew strong double-digits in the fourth, which resulted in revenue growth for the full year. This strength was in the banking sector, where our largest clients are upgrading to our latest technology to continue to run their infrastructure. I should mention that we also had good revenue performance in the US, where we returned to growth.
Our gross margin reflects the impact of our investments, including the acquisitions we’ve made, and the mix to as-a-Service businesses that aren’t yet at scale.
Our expense overall is down 7 percent versus last year, and our expense-to-revenue ratio was down about a point and a half. This includes a 5 point year-to-year impact from the acquisitions we’ve closed over the last year,
and a modest impact from currency. Since early 2015 we’ve been talking about ramping the level of investment in the business in areas like cognitive and cloud. Our year-to-year expense dynamics reflect the fact that we’ve wrapped on that higher level of investment. We’re also seeing the yield from some of the workforce rebalancing actions earlier in the year. As we’ve discussed in the past, some of this is being reinvested in other areas, including cost.
Our expense dynamics also reflect the success we’ve had in rebuilding our intellectual property income base through IP partnerships. This is a model we’ve developed for some of our high value technologies that are more mature, but not necessarily in a priority investment area for us. So it made sense to work with partners who will invest and build businesses around some of these software assets It’s good for them and it’s good for IBM. We license the intellectual property to these partners, resulting in IP income for us. They take on the development mission, drive future innovation, and ultimately expand the client base as they take the product to market. As we generate revenue from our own sales, we pay our partner a royalty for the development mission they’ve assumed. As the partner expands their client base, they pay us a royalty because we retain ownership of the IP. So with this model, we continue to own the product and our revenue stream, but shift our spending profile to a more variable cost structure, while extending the life of these assets. This is another way of monetizing our research and innovation, while allocating our resources to where we see our best opportunities. This quarter, our IP income reflects licenses for several software products and we have a pipeline that will continue into 2017.
Our pre-tax margin in the quarter was down 20 basis points.
Our tax rate for the quarter reflects an ongoing effective tax rate just under 16 percent for the year. This is in line with the expectation we discussed at the beginning of the year, of 18 percent, plus or minus a couple of points.
We generated $4.8 billion of operating net income in the quarter, which is up one-and-a-half percent, and net income margin expanded by 60 basis points. With a share reduction of 2 percent, our EPS of $5.01 was better by three-and-a-half percent. We generated $4.7 billion of free cash flow in the quarter and $11.6 billion for the year, which is 97 percent of our GAAP net income. We returned three-quarters of our annual free cash flow to shareholders through dividends and share repurchases.
So summing up the metrics for the quarter, we had strength in our strategic areas with a growing annuity base, an improving expense trajectory, PTI margin that was essentially flat, and net margin that was up, modest growth in operating earnings per share, and free cash flow realization and shareholder return for the year that was in line with our longer-term model.
Cognitive Solutions Segment
Moving to our segments, Cognitive Solutions revenue was up 2 percent, and pre-tax income was up 1 percent. Our Solutions Software revenue was up, while Transaction Processing Software declined. Within Solutions Software, growth was again led by Analytics, including our Watson offerings such as Health, and Security. We continue to innovate the Watson Platform and extend cognitive across our solution offerings. We saw strong SaaS performance, with double-digit growth again this quarter. Our Cognitive Solutions margin profile reflects our continued investment into strategic areas, including acquisition content, and the ramp in our SaaS business.
Let me talk about the progress we’re making in parts of the portfolio. In Analytics, we are helping clients move data to the cloud and deliver actionable insights from the data with our cognitive capabilities. This quarter we introduced new offerings, like the Watson Data Platform, Watson Discovery Service and trade surveillance for Financial Services, spanning our core analytics platform, Watson platform, and industry platforms.
Our Watson platform, which underpins our cognitive strategy, continues to gain momentum in the marketplace. Natural language processing has long been at the core of Watson. Last quarter, we added new cognitive capabilities for conversation and the demand has been strong. We’ve seen significant growth in our API calls this year, especially around conversational services, where API calls increased 50 fold year to year. Let me give you an example. In Latin America, Bradesco deployed a Portuguese solution based on Watson across more than five-and-a-half thousand branches to assist employees in answering customers’ questions. Watson had already learned over 300,000 words in the Portuguese language, more than twice the number linguists say is necessary to be fluent. But this isn’t just about language translation — this is about understanding business. Watson was trained to answer questions on over 50 of Bradesco’s retail products. And since going live in October, Watson is now helping to answer nearly 9 out of every 10 questions every day.
As I mentioned, we’re combining cloud and cognitive with industry expertise. In Watson Health, we are building scale and bringing real-world benefits to researchers and clinicians. With our offerings across five areas, including oncology and genomics, government, life sciences, value based care and imaging, Watson is helping over 45 million people globally. Our oncology clients alone span more than 35 hospital systems. And with our acquisitions of Explorys, Phytel, Truven, and Merge, we have over 10,000 clients and partners.
Genomics is another area where we’re building scale. We announced partnerships with both Quest Diagnostics and Illumina, where both companies will leverage IBM Watson for Genomics, a new service that integrates Watson’s cognitive services into genomic sequencing applications. Through partners, we will make Watson’s genomic analysis available to oncologists who treat 70 percent of cancer patients in the United States.
In the area of Life Sciences, Barrow Neurological Institute is an example of where we’re seeing real-world benefits today. Barrow reported using Watson for Drug Discovery to help identify five never-before linked genes associated with ALS, or Lou Gehrig’s disease. This work gives researchers new insights that will pave the way for the development of new drug targets and therapies to combat ALS. Without Watson, researchers predicted the discovery would have taken years, rather than only a few months.
We had growth in Watson IoT this quarter where our clients are putting the power of Watson to work across the immense data pool created by the Internet of Things. We launched new industry solutions targeting manufacturing and insurance and new collaborations with clients, like BMW. We more than doubled both the number of new clients and the number of developers on our IoT platform.
We also had good results from our Weather platform. Here too, we have demonstrated our tremendous scale this quarter. During Hurricane Matthew, our platform served as a critical resource for over 100 million
people. Our platform delivered 350 million video streams over that week. Roughly 1.6 petabytes of data were delivered through a total of 141 billion API calls. With weather information, you have to be able to deliver that kind of scale, particularly when recognized as the most accurate forecaster.
Security also contributed to growth in the quarter, driven by areas such as data security and security intelligence. We announced a major expansion of our incident response capabilities, including the industry’s first Cyber Range for the commercial sector, at our new Security headquarters in Boston. Cyber Range uses live malware, ransomware and other real-world hacker tools culled from the dark web to deliver realistic cyber attack experiences. Clients learn how to prepare for and handle cyber attacks. And Watson for Cyber Security is providing insights on live cyber attacks to 40 clients, including as you would expect several large financial institutions and universities, who are participating in our beta program.
So for the Cognitive Solutions segment, we grew revenue and profit in the quarter, while we continued to embed cognitive into our offerings, scale our platforms, and build industry verticals.
Global Business Services Segment
Turning to Global Business Services, our performance reflects continued declines in the businesses we are shifting away from, such as large ERP engagements. From a line of business perspective, our consulting results were fairly consistent with our performance throughout the year, while application management decelerated.
We continue to aggressively shift our investments and resources to our digital practices, and growth in our strategic imperatives accelerated to 19 percent this quarter. Our cloud practice was up over 70 percent, mobile nearly 30 percent, and analytics was up 10 percent.
On a global basis, we continue to build out our digital design agency, the IBM Interactive Experience, which now has more than 30 global studios. In the fourth quarter, we announced a partnership with General Motors to bring the power of Onstar and Watson together to create the auto industry’s first cognitive mobility platform. Watson will learn the driver’s preferences, apply machine learning and sift through data to recognize patterns in their decisions and habits. This information will allow brand and marketing professionals working with Onstar to deliver personalized interactions that directly impact their target audiences. This solution brings together our cognitive technology with IBM differentiated data such as the rich weather data and IBM iX’s industry expertise in experience and mobile design.
As clients are looking to create new business models with our cognitive technologies, our industry experts in GBS are helping them scale. This quarter we announced a new global Watson IoT consulting practice to help clients introduce IoT innovation into their businesses. This will include 1,500 consultants, data scientists, and security experts with deep domain and industry expertise. We also announced that IBM MobileFirst for iOS apps can now be integrated with a broad set of Watson capabilities to increase the productivity and improve decision making for enterprise employees.
Turning to profit, GBS profit and margin were down. In the more traditional engagements, we continue to have some price and profit pressure. We
continue to shift away from these areas to our digital businesses, adding nearly 8,000 resources to these practices in 2016. This impacts productivity in the near term. We’re investing in enablement, hiring top talent, and bringing in new skills through acquisitions. Profit this quarter also continues to reflect additional spending in some accounts to deliver on our client commitments.
So for Global Business Services, we accelerated the growth in our digital practices, while managing a shift from the more traditional businesses, and we’re continuing to invest to build out capabilities and deliver on client commitments.
Technology Services and Cloud Platforms
Technology Services and Cloud Platforms revenue was up 2 percent year to year, and pre-tax income was up 4 percent. Within this segment, our GTS revenue and backlog continues to grow. And this quarter we signed 16 deals greater than $100 million.
We are modernizing our offerings and helping our clients move to the cloud. Our strategic imperatives for the segment were up over 35 percent, with cloud up 50 percent. We continue to invest to build out our cloud infrastructure and we now have more than 50 cloud centers globally. In the fourth quarter, we acquired Sanovi Technologies, a cloud-native company that will enable us to deliver disaster recovery as-a-Service to clients undergoing digital and hybrid cloud transformation. This adds to our leading resiliency capabilities.
Looking at the lines of business, Infrastructure Services grew 3 percent. We built the IBM Cloud for the enterprise. Clients can mix bare metal servers, virtual servers, storage and networking to find the right balance for their workloads. Our enterprise workloads on our public cloud continue to scale, contributing to growth in our as-a-Service content. Clients continue to turn to us for enablement of their new digital businesses. These digital businesses require IT infrastructure that is always-on, available-everywhere, and of course secure. Clients often struggle with the complexity of sourcing and integrating IT services such as multiple cloud platforms, on premise data centers, and mobile environments. As a Services Integrator, we help clients navigate the complexity of their hybrid cloud environment and deliver the needed end-to-end infrastructure services solution in an integrated and unified way.
For example, at a large Australian bank, we partnered with the client to build an IT architecture for the future. We are helping the bank design, build and manage a flexible hybrid cloud infrastructure. This solution automatically brokers, deploys, integrates and orchestrates across multiple environments and services. When the bank has a business need such as a new digital banking service, their IT is ready to support it immediately with
a secure, integrated and optimized solution. We are the premier partner when it comes to hybrid cloud services integration. Our depth of capability and experience is unmatched in the industry.
Technical Support Services was flat year to year and continues to generate substantial revenue and profit for our model. We are seeing growth in multi-vendor services, leveraging our global scale and deep technical skills. We’ve expanded our multi-vendor services into industries like banking, retail and healthcare, and into technologies including ATMs, mobile, point of sale, and Internet of Things. Think of this as providing wall-to-wall support for our clients.
Integration Software grew again this quarter as we continue to see momentum in our hybrid cloud integration capabilities and WebSphere Application Server, which grew double digits. We continue to scale our Bluemix platform, which has grown rapidly to become one of the largest open public cloud deployments globally. Based on open standards, it features a robust set of high value services including our cognitive, weather and blockchain APIs. American Airlines named IBM as its cloud provider for greater enterprise flexibility and scale. As part of the partnership, they will move enterprise applications to the IBM Cloud, leveraging a wide range of application development capabilities through Bluemix. At Majesco, a global provider of core insurance software and services, we announced a 5-year partnership where we’ll contribute cognitive APIs, that will allow insurance companies to better analyze, price, and understand business risk using new data sources such as the weather and social media. We’ll also add an engaging and personalized cognitive interface to their services. And one of the largest banks in Thailand tapped Bluemix to build a new secure blockchain network to transform their credit approval process.
Turning to profit, gross margin is down 1.4 points. Infrastructure Services margins were flat year to year, but Technical Support Services and Integration Software margins declined. In TSS we are shifting more of the business into multi-vendor services and in Integration Software we are shifting more capability to SaaS. This is impacting margins in the near term. The IP partnerships are a headwind to gross profit margins in Integration
Software, though a tailwind to pre-tax margin this quarter. Pre-tax profit for the segment is up, with margins expanding 40 basis points. We continue to focus on investing in our strategic areas, while innovating and driving productivity in our more traditional business.
So for Technology Services and Cloud Platforms, we grew backlog, revenue and profit in the quarter, with continued strength in our hybrid cloud capabilities across services and software. These results reflect our success in modernizing the services that we provide to our clients.
Systems Segment
Our Systems revenue reflects growth in z Systems, offset by declines in Power and storage as we continue to address shifting markets. Systems gross margin was up year to year due to both improvement in z margins, and the relative strength in that higher margin business.
In z Systems, we delivered 4 percent revenue growth, double-digit growth in MIPs, and we expanded our margins. These results reflect our continued success in driving innovation in our core systems. The mainframe is optimized for mobile and security, and is constantly being redesigned to drive new workloads, including instant payments and the emerging blockchain. Eight quarters into the cycle, we added 8 new clients in the quarter, 29 for the year and 80 since inception. New client adoption at this stage in our cycle further validates our clients’ perceived value and their ongoing commitment to the IBM platform. Clients are investing heavily to meet the demands for future growth. I mentioned earlier the strength we had in China. We closed significant z Systems deals in the quarter, including two large Chinese banks migrating their mainframe install base to our latest z13 technology. And in Europe we are helping our clients manage new requirements in the rapidly evolving area of financial services modernization. We had four wins in the quarter on instant payments. Given the critical nature of the European financial services backbone, TARGET2-Securities, or T2S, has been deployed on IBM z Systems to provide the necessary reliability, scalability and IT security. Overall, the mainframe continues to deliver a high value, secure and scalable platform that is critical in managing our clients’ complex environments.
Our Power performance reflects our ongoing shift to a growing Linux market while continuing to serve a high value, but declining, UNIX market. Linux workloads continued double-digit growth, and faster than the market, while the traditional UNIX base declined. We have been shifting our platform to address Linux, and with fully expanded Linux offerings, our Power-on-Linux represents over 15 percent of our overall portfolio. Supporting this is our success in HANA on Power. The Power platform is
critical to the workloads a cognitive world will demand. And in the fourth quarter we saw this in the US Department of Energy’s deployment of hundreds of IBM’s OpenPOWER servers. When complete, these two supercomputers will be among the world’s largest scientific and AI computing systems.
Storage hardware was down 10 percent this quarter, which reflects the shift in value towards software-defined environments. Storage revenue declines were mainly driven by midrange and high-end disk. However, we are now benefitting from a full suite of all flash array offerings and this portfolio grew double digits in the fourth quarter. We also continued to see double-digit revenue growth in Software-Defined Storage, particularly in our Spectrum Suite and Cloud Object Storage offerings, which is not reported in our Systems segment. Storage gross margins are down, as hardware continues to be impacted by both volume and price pressure.
So for Systems, our revenue and gross profit performance were driven by growth in z Systems, offset by Power and Storage declines. These results reflect the reinvention of our core systems for work in a new era of computing. We have optimized our systems to drive new types of workloads like blockchain and instant payments. We are expanding our footprint, building new capabilities, and solving new types of problems for our clients. And though we are facing some shifting market dynamics and product transitions in both Power and Storage, our portfolio overall remains optimized to address the demands of an era of cognitive and cloud computing.
Software Revenue
So now let me touch on our software performance across our segments. Our total software revenue was over $7 billion, up 1 percent. Software was up 1 percent for the year as well.
From a business area perspective this quarter, we had growth in Cognitive Solutions and Integration Software, while Operating Systems continued to be a drag, in line with the longer-term secular trend. Software annuity revenue was up mid-single digits, led by our SaaS offerings. Our software transaction revenue declined mid-single digits, which is a significant improvement from the performance in the first half. Given the seasonality in our software business, transactional revenue has a bigger impact on our total software performance in the fourth quarter.
Cash Flow & Balance Sheet Highlights
So moving on to cash flow, in the quarter, we generated $5.6 billion of cash from operations, excluding our financing receivables. We invested $900 million in cap ex, and generated $4.7 billion of free cash flow.
For the full year, we generated $15.3 billion of cash from operations. We invested $3.7 billion in capex this year, with over a billion in support of our cloud and Solutions businesses, as well as a significant portion going to support our services backlog and our upcoming hardware cycles. And so we generated free cash flow of $11.6 billion, and as I mentioned earlier, our cash realization remained strong at just over 97 percent of GAAP net income, consistent with our longer-term model of realization in the 90’s. So, our cash performance is right in line with our profit levels as we talked about all year, and includes significant cash payments related to the workforce rebalancing charge taken earlier in the year, as well as lower cash taxes. We did see an uptick in our working capital as we closed the year, which we attribute to timing and mix of substantial transactions in December.
Looking at uses of cash, we continued to strengthen our portfolio by investing $5.7 billion in acquisitions. We’ve acquired fifteen companies in 2016, including three in the fourth quarter. The acquisitions added to our capabilities in cognitive and analytics, cloud and security, and significant transactions included The Weather Company, Truven Health, Promontory, and three digital marketing agencies. Over the course of the year we’ve returned almost $9 billion to shareholders including dividends of over $5 billion and three-and-a-half billion in gross share repurchases. We bought back over 23 million shares, reducing our average share count by just under two-and-a-half percent, which is in line with our longer-term model. At the end of the year, we had $5.1 billion remaining in our buyback authorization.
Moving on to the balance sheet, we ended the quarter with a cash balance of $8.5 billion. Total debt was just over $42 billion, of which about two-thirds was in support of our financing business. The leverage in our financing business is 7 to 1 and the credit quality of our financing
receivables remains strong at 52 percent investment grade, a point better than September. I will come back to a change we’ll be making to the structure of our financing business starting in 2017.
Our non-financing debt of $14.3 billion was two billion lower than September, resulting in a non-financing debt-to-cap of just under 50 percent, 5 points lower than September, and more importantly 5 points lower than a year ago. Our debt-to-cap ratio was impacted again this year by a reduction in equity due to pension re-measurement, a $1.6 billion reduction to equity, or about 3 points to the ratio. Looking at our pension plans, as you know the U.S. plan has been frozen for some time, and the asset mix reflects that, with a relatively low risk, low return profile. The result of that is low odds of any required funding in the U.S. regardless of the interest rate environment. Our funding levels remain solid with the U.S. and worldwide tax-qualified plans at 102 percent and 98 percent respectively, a modest increase from last year. Information on the performance of our retirement-related assets, and return and discount rate assumptions at year-end are in our supplemental charts.
Importantly, our balance sheet continues to have the strength and flexibility to support our business over the long term.
So now let me spend just a minute on our financing business. As part of our own transformation, we saw an opportunity to drive some operational benefits by changing the structure of our financing business. First, let me say that the structure of the Global Financing segment that we report is unchanged. We have reorganized our client and commercial financing business as a wholly owned subsidiary, IBM Credit LLC. This combined corporate structure will, over time, meet its funding requirements by issuing debt directly to the market. This will drive operational benefits by consolidating the operations of our financing business. We will issue debt directly out of the new entity, and expect the entity to be able to access the capital markets later this year. And, we will increase our financing business leverage from 7 to 1 to 9 to 1, which represents an increase of about $600 million in Global Financing debt.
But as I said, our Global Financing segment is unchanged, and will continue to include our client and commercial financing business as well as our hardware remanufacturing and remarketing business.
Summary
So let me wrap this up. We have a very clear point of view on what it takes to be successful with enterprise clients in this new era. I’ll shorthand it as cognitive plus cloud plus industry. And what differentiates IBM is the ability to bring all three together, to change real business processes and outcomes. Enterprise clients rely on us to help them run their processes. We have the relationships, we know their process and workflows, and importantly, we have their trust. This incumbency positions us very well to take our clients to the new era.
In 2016 we continued to make a lot of progress in the transformation of our own business. We had strong growth in our strategic imperatives, cloud, analytics, security and mobile. These offerings generated $33 billion in revenue, and now represent over 40 percent of our revenue. And they’re high value offerings, with a gross margin that raises overall IBM.
We also invested at a high level, through organic investments, acquisitions and partnerships. In 2016 we spent nearly $6 billion in R&D, nearly $4 billion in capital expenditures, and nearly $6 billion to acquire 15 companies. We’re amassing a unique set of assets to build our cognitive solutions and cloud platforms, like the digital assets of The Weather Company, healthcare datasets from Truven and risk and compliance experts of Promontory. In 2016 we continued to remix our skills to new opportunities, while continuing to deliver innovation in our more traditional areas, like positioning z Systems as the ideal platform for blockchain, or Power for cognitive, or utilizing our intellectual property partnerships to extend some of our software assets.
So we’ll take all of these capabilities into 2017. Even recognizing the shifts in our industry, some country-specific challenges and opportunities, and some macro effects of currency and potential tax reform, as I said up front, we feel that we’re exiting 2016 in a stronger position than we entered it.
This confidence is reflected in our view of 2017. To simplify, we expect to stay on track in our strategic imperatives. We’ll continue to invest at a high
level, though as you saw in the fourth quarter, after ramping investment from 2015 through late 2016, we’ve wrapped on that higher level. We expect to grow our pre-tax income, and while there are a number of scenarios for tax, in all cases we expect tax to be a year-to-year headwind to our book rate in 2017. Put it all together, and we expect to deliver Operating EPS of at least $13.80 in 2017.
If you remember the first quarter of last year, we had a few larger items in our earnings, but they offset at the net income level. That first quarter was about 17 percent of our 2016 Operating EPS. We expect a benefit from discrete tax again in the first quarter of this year, though smaller in size. And like last year, other actions will offset some portion of the benefit. With this, we expect a similar skew for 2017, with about 17 percent of the full year expectation of $13.80 in the first quarter.
Looking at cash flow for the year, we expect free cash flow realization in excess of 90 percent of GAAP net income, and we’ll return 70 to 80 percent of our cash flow to shareholders, both in line with our longer term model.
Bottom line, we feel good about the progress we made in 2016, and our prospects for 2017. And now, we’ll take your questions.
Closing
Thank you, Martin. Before we begin the Q&A I’d like to mention a couple of items. First, we have supplemental charts at the end of the slide deck that provide additional information on the quarter and the full year. And second, I’d ask you to refrain from multi-part questions.
So let’s please open it up for questions.
Exhibit 99.2
IBM 4Q 2016 Earnings: Non GAAP Slides January 19, 2017 ibm.com/investor
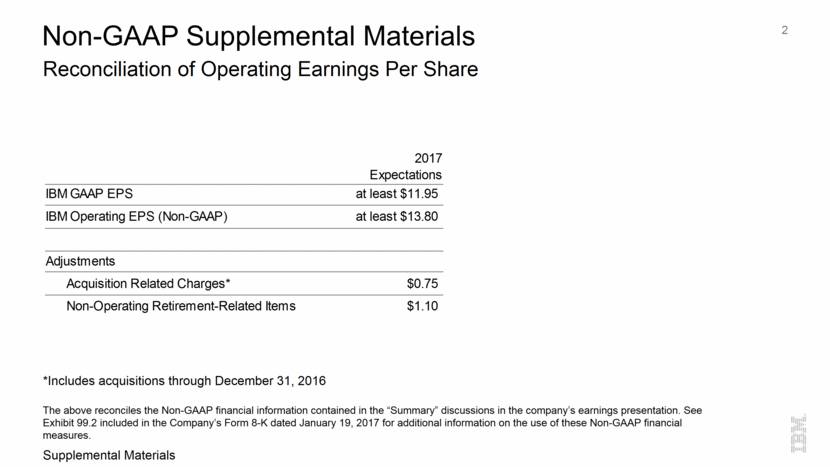
Reconciliation of Operating Earnings Per Share 2 Non-GAAP Supplemental Materials *Includes acquisitions through December 31, 2016 The above reconciles the Non-GAAP financial information contained in the “Summary” discussions in the company’s earnings presentation. See Exhibit 99.2 included in the Company’s Form 8-K dated January 19, 2017 for additional information on the use of these Non-GAAP financial measures. Supplemental Materials 2017 Expectations IBM GAAP EPS at least $11.95 IBM Operating EPS (Non-GAAP) at least $13.80 Adjustments Acquisition Related Charges* $0.75 Non-Operating Retirement-Related Items $1.10
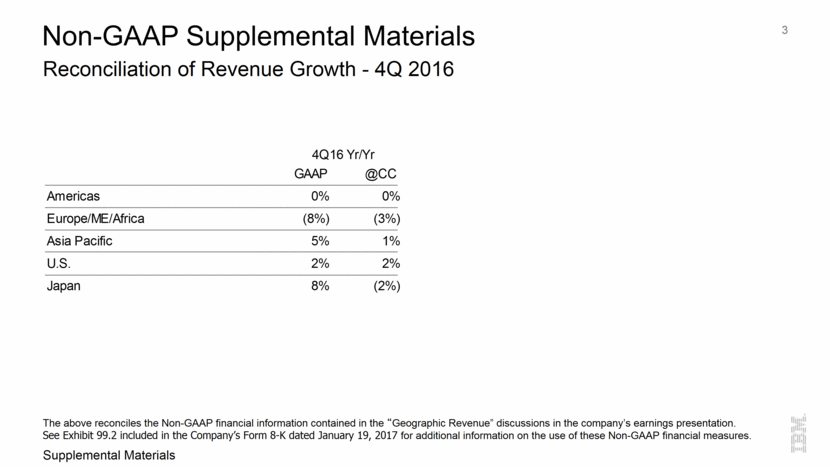
Reconciliation of Revenue Growth - 4Q 2016 3 Non-GAAP Supplemental Materials The above reconciles the Non-GAAP financial information contained in the “Geographic Revenue” discussions in the company’s earnings presentation. See Exhibit 99.2 included in the Company’s Form 8-K dated January 19, 2017 for additional information on the use of these Non-GAAP financial measures. Supplemental Materials GAAP @CC Americas 0% 0% Europe/ME/Africa (8%) (3%) Asia Pacific 5% 1% U.S. 2% 2% Japan 8% (2%) 4Q16 Yr/Yr
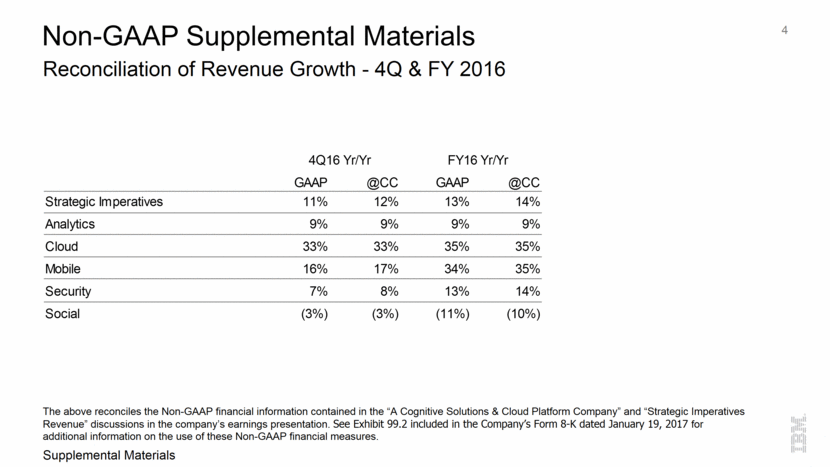
Reconciliation of Revenue Growth - 4Q & FY 2016 4 Non-GAAP Supplemental Materials The above reconciles the Non-GAAP financial information contained in the “A Cognitive Solutions & Cloud Platform Company” and “Strategic Imperatives Revenue” discussions in the company’s earnings presentation. See Exhibit 99.2 included in the Company’s Form 8-K dated January 19, 2017 for additional information on the use of these Non-GAAP financial measures. Supplemental Materials GAAP @CC GAAP @CC Strategic Imperatives 11% 12% 13% 14% Analytics 9% 9% 9% 9% Cloud 33% 33% 35% 35% Mobile 16% 17% 34% 35% Security 7% 8% 13% 14% Social (3%) (3%) (11%) (10%) 4Q16 Yr/Yr FY16 Yr/Yr
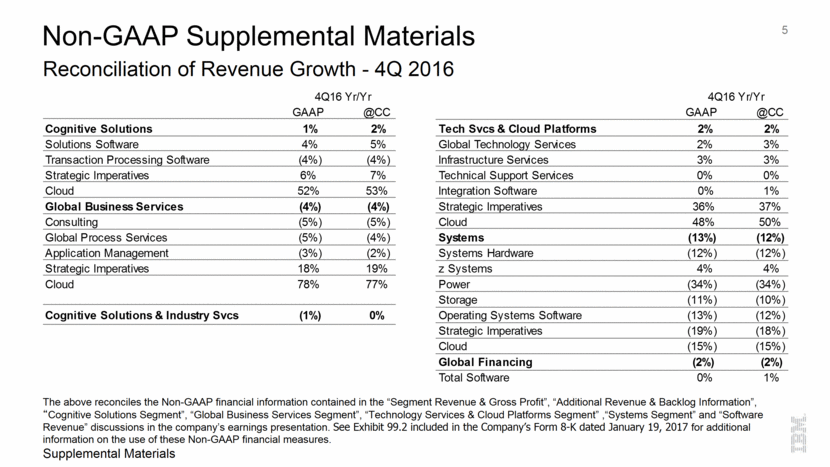
Reconciliation of Revenue Growth - 4Q 2016 5 Non-GAAP Supplemental Materials The above reconciles the Non-GAAP financial information contained in the “Segment Revenue & Gross Profit”, “Additional Revenue & Backlog Information”, “Cognitive Solutions Segment”, “Global Business Services Segment”, “Technology Services & Cloud Platforms Segment” ,“Systems Segment” and “Software Revenue” discussions in the company’s earnings presentation. See Exhibit 99.2 included in the Company’s Form 8-K dated January 19, 2017 for additional information on the use of these Non-GAAP financial measures. Supplemental Materials GAAP @CC GAAP @CC Cognitive Solutions 1% 2% Tech Svcs & Cloud Platforms 2% 2% Solutions Software 4% 5% Global Technology Services 2% 3% Transaction Processing Software (4%) (4%) Infrastructure Services 3% 3% Strategic Imperatives 6% 7% Technical Support Services 0% 0% Cloud 52% 53% Integration Software 0% 1% Global Business Services (4%) (4%) Strategic Imperatives 36% 37% Consulting (5%) (5%) Cloud 48% 50% Global Process Services (5%) (4%) Systems (13%) (12%) Application Management (3%) (2%) Systems Hardware (12%) (12%) Strategic Imperatives 18% 19% z Systems 4% 4% Cloud 78% 77% Power (34%) (34%) Storage (11%) (10%) Cognitive Solutions & Industry Svcs (1%) 0% Operating Systems Software (13%) (12%) Strategic Imperatives (19%) (18%) Cloud (15%) (15%) Global Financing (2%) (2%) Total Software 0% 1% 4Q16 Yr/Yr 4Q16 Yr/Yr
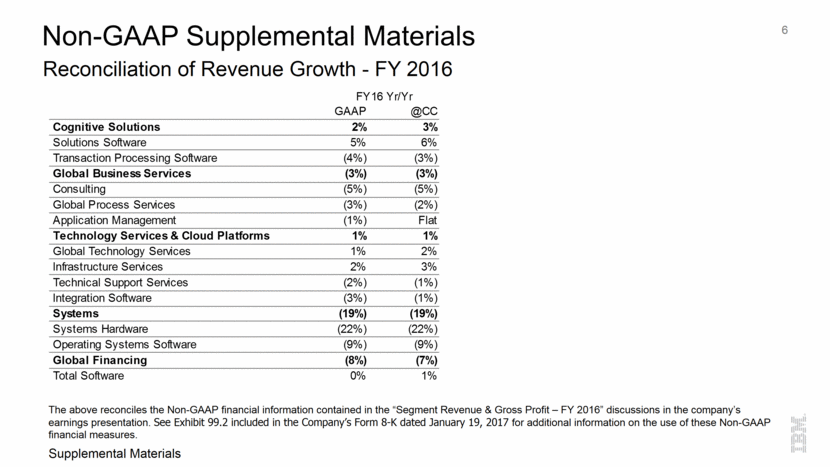
Reconciliation of Revenue Growth - FY 2016 6 Non-GAAP Supplemental Materials The above reconciles the Non-GAAP financial information contained in the “Segment Revenue & Gross Profit – FY 2016” discussions in the company’s earnings presentation. See Exhibit 99.2 included in the Company’s Form 8-K dated January 19, 2017 for additional information on the use of these Non-GAAP financial measures. Supplemental Materials GAAP @CC Cognitive Solutions 2% 3% Solutions Software 5% 6% Transaction Processing Software (4%) (3%) Global Business Services (3%) (3%) Consulting (5%) (5%) Global Process Services (3%) (2%) Application Management (1%) Flat Technology Services & Cloud Platforms 1% 1% Global Technology Services 1% 2% Infrastructure Services 2% 3% Technical Support Services (2%) (1%) Integration Software (3%) (1%) Systems (19%) (19%) Systems Hardware (22%) (22%) Operating Systems Software (9%) (9%) Global Financing (8%) (7%) Total Software 0% 1% FY16 Yr/Yr
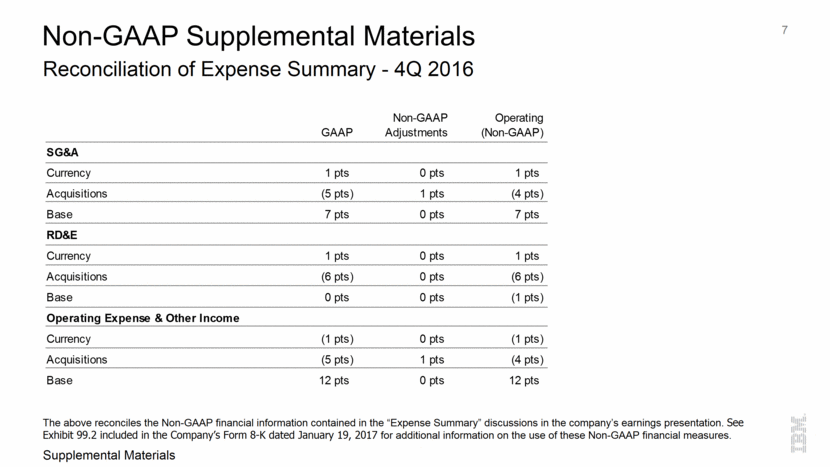
Reconciliation of Expense Summary - 4Q 2016 7 Non-GAAP Supplemental Materials The above reconciles the Non-GAAP financial information contained in the “Expense Summary” discussions in the company’s earnings presentation. See Exhibit 99.2 included in the Company’s Form 8-K dated January 19, 2017 for additional information on the use of these Non-GAAP financial measures. Supplemental Materials Non-GAAP Operating GAAP Adjustments (Non-GAAP) SG&A Currency 1 pts 0 pts 1 pts Acquisitions (5 pts) 1 pts (4 pts) Base 7 pts 0 pts 7 pts RD&E Currency 1 pts 0 pts 1 pts Acquisitions (6 pts) 0 pts (6 pts) Base 0 pts 0 pts (1 pts) Operating Expense & Other Income Currency (1 pts) 0 pts (1 pts) Acquisitions (5 pts) 1 pts (4 pts) Base 12 pts 0 pts 12 pts
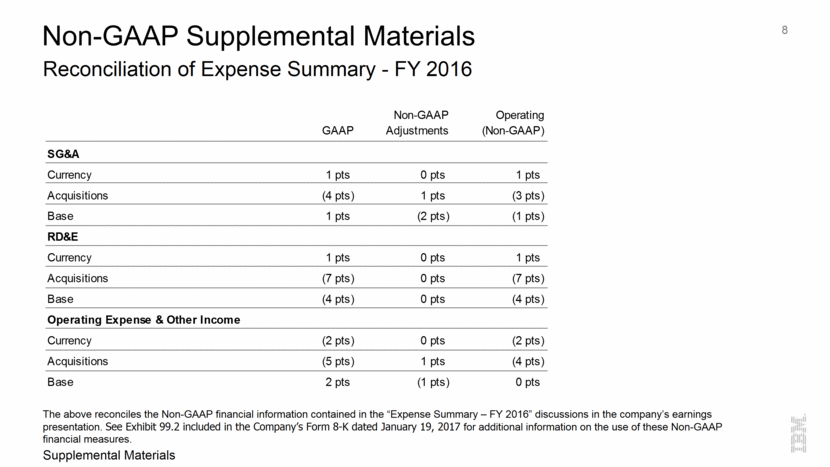
Reconciliation of Expense Summary - FY 2016 8 Non-GAAP Supplemental Materials The above reconciles the Non-GAAP financial information contained in the “Expense Summary – FY 2016” discussions in the company’s earnings presentation. See Exhibit 99.2 included in the Company’s Form 8-K dated January 19, 2017 for additional information on the use of these Non-GAAP financial measures. Supplemental Materials Non-GAAP Operating GAAP Adjustments (Non-GAAP) SG&A Currency 1 pts 0 pts 1 pts Acquisitions (4 pts) 1 pts (3 pts) Base 1 pts (2 pts) (1 pts) RD&E Currency 1 pts 0 pts 1 pts Acquisitions (7 pts) 0 pts (7 pts) Base (4 pts) 0 pts (4 pts) Operating Expense & Other Income Currency (2 pts) 0 pts (2 pts) Acquisitions (5 pts) 1 pts (4 pts) Base 2 pts (1 pts) 0 pts
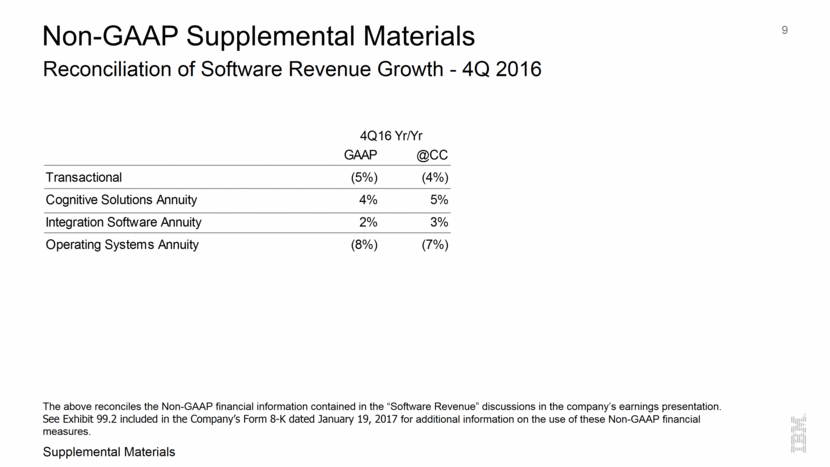
Reconciliation of Software Revenue Growth - 4Q 2016 9 Non-GAAP Supplemental Materials The above reconciles the Non-GAAP financial information contained in the “Software Revenue” discussions in the company’s earnings presentation. See Exhibit 99.2 included in the Company’s Form 8-K dated January 19, 2017 for additional information on the use of these Non-GAAP financial measures. Supplemental Materials GAAP @CC Transactional (5%) (4%) Cognitive Solutions Annuity 4% 5% Integration Software Annuity 2% 3% Operating Systems Annuity (8%) (7%) 4Q16 Yr/Yr
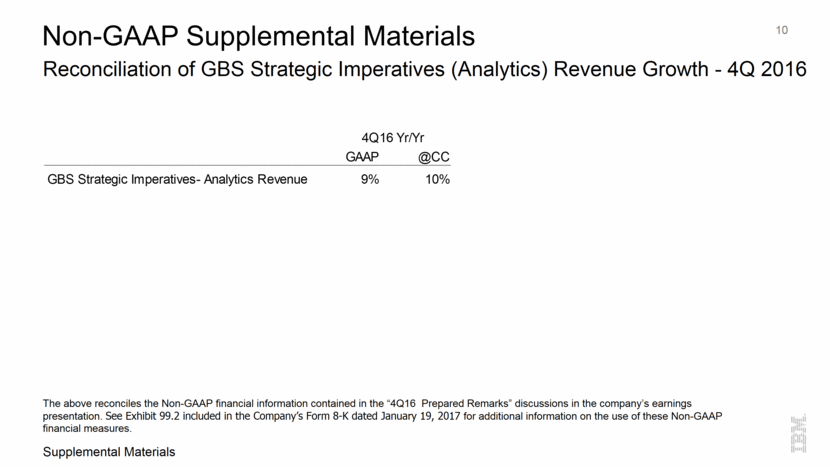
Reconciliation of GBS Strategic Imperatives (Analytics) Revenue Growth - 4Q 2016 10 Non-GAAP Supplemental Materials The above reconciles the Non-GAAP financial information contained in the “4Q16 Prepared Remarks” discussions in the company’s earnings presentation. See Exhibit 99.2 included in the Company’s Form 8-K dated January 19, 2017 for additional information on the use of these Non-GAAP financial measures. Supplemental Materials GAAP @CC GBS Strategic Imperatives- Analytics Revenue 9% 10% 4Q16 Yr/Yr
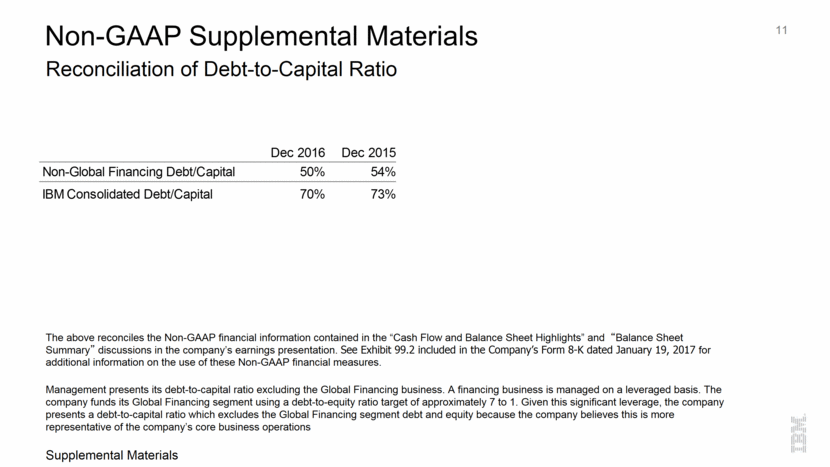
Reconciliation of Debt-to-Capital Ratio 11 Non-GAAP Supplemental Materials Supplemental Materials The above reconciles the Non-GAAP financial information contained in the “Cash Flow and Balance Sheet Highlights” and “Balance Sheet Summary” discussions in the company’s earnings presentation. See Exhibit 99.2 included in the Company’s Form 8-K dated January 19, 2017 for additional information on the use of these Non-GAAP financial measures. Management presents its debt-to-capital ratio excluding the Global Financing business. A financing business is managed on a leveraged basis. The company funds its Global Financing segment using a debt-to-equity ratio target of approximately 7 to 1. Given this significant leverage, the company presents a debt-to-capital ratio which excludes the Global Financing segment debt and equity because the company believes this is more representative of the company’s core business operations Dec 2016 Dec 2015 Non-Global Financing Debt/Capital 50% 54% IBM Consolidated Debt/Capital 70% 73%
Serious News for Serious Traders! Try StreetInsider.com Premium Free!
You May Also Be Interested In
- IBM RELEASES FIRST-QUARTER RESULTS
- Evercore ISI Comments on IBM (IBM) Earnings
- AS Tallink Grupp Unaudited Consolidated Interim Report Q1 2024
Create E-mail Alert Related Categories
SEC FilingsSign up for StreetInsider Free!
Receive full access to all new and archived articles, unlimited portfolio tracking, e-mail alerts, custom newswires and RSS feeds - and more!


 Tweet
Tweet Share
Share