

Form 6-K TOYOTA MOTOR CORP/ For: Nov 29
 Tweet
Tweet Share
Share
SECURITIES AND EXCHANGE COMMISSION
Washington, D.C. 20549
FORM 6-K
Report of Foreign Private Issuer
Pursuant to Rule 13a-16 or 15d-16 under
the Securities Exchange Act of 1934
For the month of November, 2016
Commission File Number 001-14948
Toyota Motor Corporation
(Translation of Registrant’s Name Into English)
1, Toyota-cho, Toyota City,
Aichi Prefecture 471-8571,
Japan
(Address of Principal Executive Offices)
Indicate by check mark whether the registrant files or will file annual reports under cover of Form 20-F or Form 40-F. Form 20-F X Form 40-F
Indicate by check mark if the registrant is submitting the Form 6-K in paper as permitted by Regulation S-T Rule 101(b)(1):
Indicate by check mark if the registrant is submitting the Form 6-K in paper as permitted by Regulation S-T Rule 101(b)(7):
Material Contained in this Report:
| I. |
Executive Summary of the Japanese-language Quarterly Securities Report, as filed with the Director of the Kanto Local Finance Bureau on November 11, 2016. |
| II. |
The registrant’s Unaudited Condensed Consolidated Financial Statements for the periods ended September 30, 2016, prepared in accordance with U.S. generally accepted accounting principles, which materially conform to the Consolidated Financial Statements filed with the Japanese-language Quarterly Securities Report referred to above. |
| III. |
English excerpt translation of a Report on Number of Listed Shares, as filed by the registrant with the Tokyo Stock Exchange on November 18, 2016. |
| IV. |
English excerpt translation of Semi-Annual Business Report for the registrant’s first half of the 113th period from April 1, 2016 through September 30, 2016, as distributed to the shareholders on November 28, 2016. |
SIGNATURES
Pursuant to the requirements of the Securities Exchange Act of 1934, the registrant has duly caused this report to be signed on its behalf by the undersigned, thereunto duly authorized.
| Toyota Motor Corporation | ||||
| By: |
/s/ Yasushi Kyoda | |||
| Name: |
Yasushi Kyoda | |||
| Title: |
General Manager of Accounting Division | |||
Date: November 29, 2016
Japanese-language Quarterly Securities Reports for the periods ended September 30, 2016, as filed with the Director of the Kanto Local Finance Bureau of the Ministry of Finance of Japan on November 11, 2016, and which includes the following:
| I. | Corporate information |
| A. | Corporate overview |
| 1. | History of changes in major business indices |
| 2. | Overview of business |
| B. | Business |
| 1. | Risk factors |
| 2. | Material contracts |
| 3. | Analysis of financial position, results of operations and cash flows |
| C. | Company information |
| 1. | Share information |
| 2. | Directors and corporate auditors |
| D. | Financial information |
| 1. | Consolidated financial statements and notes |
| 2. | Other |
| II. | Information on Guarantors |
Auditors Report
Certificate
TOYOTA MOTOR
CORPORATION
Unaudited Consolidated Financial Statements
For the periods ended
September 30, 2016
TOYOTA MOTOR CORPORATION
Unaudited Consolidated Balance Sheets
At March 31, 2016 and September 30, 2016
| Yen in millions | ||||||||
| March 31, 2016 | September 30, 2016 | |||||||
| Assets |
||||||||
| Current assets: |
||||||||
| Cash and cash equivalents |
2,939,428 | 2,767,004 | ||||||
| Time deposits |
1,032,034 | 987,985 | ||||||
| Marketable securities |
1,511,389 | 1,503,005 | ||||||
| Trade accounts and notes receivable, less allowance for doubtful accounts |
2,000,149 | 1,805,932 | ||||||
| Finance receivables, net |
5,912,684 | 5,349,933 | ||||||
| Other receivables |
451,406 | 425,195 | ||||||
| Inventories |
2,061,511 | 2,058,076 | ||||||
| Deferred income taxes |
967,607 | — | ||||||
| Prepaid expenses and other current assets |
1,333,345 | 756,009 | ||||||
|
|
|
|
|
|||||
| Total current assets |
18,209,553 | 15,653,139 | ||||||
|
|
|
|
|
|||||
| Noncurrent finance receivables, net |
8,642,947 | 7,944,409 | ||||||
| Investments and other assets: |
||||||||
| Marketable securities and other securities investments |
7,439,799 | 7,355,033 | ||||||
| Affiliated companies |
2,631,612 | 2,587,773 | ||||||
| Employees receivables |
32,998 | 29,075 | ||||||
| Other |
730,271 | 917,845 | ||||||
|
|
|
|
|
|||||
| Total investments and other assets |
10,834,680 | 10,889,726 | ||||||
|
|
|
|
|
|||||
| Property, plant and equipment: |
||||||||
| Land |
1,352,904 | 1,347,459 | ||||||
| Buildings |
4,311,895 | 4,253,545 | ||||||
| Machinery and equipment |
10,945,267 | 10,524,881 | ||||||
| Vehicles and equipment on operating leases |
5,652,622 | 5,282,596 | ||||||
| Construction in progress |
513,953 | 502,263 | ||||||
|
|
|
|
|
|||||
| Total property, plant and equipment, at cost |
22,776,641 | 21,910,744 | ||||||
|
|
|
|
|
|||||
| Less – Accumulated depreciation |
(13,036,224 | ) | (12,621,913 | ) | ||||
|
|
|
|
|
|||||
| Total property, plant and equipment, net |
9,740,417 | 9,288,831 | ||||||
|
|
|
|
|
|||||
| Total assets |
47,427,597 | 43,776,105 | ||||||
|
|
|
|
|
|||||
The accompanying notes are an integral part of these consolidated financial statements.
2
TOYOTA MOTOR CORPORATION
Unaudited Consolidated Balance Sheets
At March 31, 2016 and September 30, 2016
| Yen in millions | ||||||||
| March 31, 2016 | September 30, 2016 | |||||||
| Liabilities |
||||||||
| Current liabilities: |
||||||||
| Short-term borrowings |
4,698,134 | 4,600,148 | ||||||
| Current portion of long-term debt |
3,822,954 | 3,554,849 | ||||||
| Accounts payable |
2,389,515 | 2,225,891 | ||||||
| Other payables |
1,040,277 | 824,848 | ||||||
| Accrued expenses |
2,726,120 | 2,556,974 | ||||||
| Income taxes payable |
343,325 | 226,339 | ||||||
| Other current liabilities |
1,104,131 | 1,029,213 | ||||||
|
|
|
|
|
|||||
| Total current liabilities |
16,124,456 | 15,018,262 | ||||||
|
|
|
|
|
|||||
| Long-term liabilities: |
||||||||
| Long-term debt |
9,772,065 | 8,706,063 | ||||||
| Accrued pension and severance costs |
904,911 | 917,057 | ||||||
| Deferred income taxes |
2,046,089 | 1,230,450 | ||||||
| Other long-term liabilities |
491,890 | 462,009 | ||||||
|
|
|
|
|
|||||
| Total long-term liabilities |
13,214,955 | 11,315,579 | ||||||
|
|
|
|
|
|||||
| Total liabilities |
29,339,411 | 26,333,841 | ||||||
|
|
|
|
|
|||||
| Mezzanine equity |
||||||||
| Model AA Class Shares, no par value, |
479,779 | 483,452 | ||||||
|
|
|
|
|
|||||
| Shareholders’ equity |
||||||||
| Toyota Motor Corporation shareholders’ equity: |
||||||||
| Common stock, no par value, |
397,050 | 397,050 | ||||||
| Additional paid-in capital |
548,161 | 514,587 | ||||||
| Retained earnings |
16,794,240 | 17,401,371 | ||||||
| Accumulated other comprehensive income (loss) |
610,768 | (103,018 | ) | |||||
| Treasury stock, at cost, |
(1,603,284 | ) | (1,818,082 | ) | ||||
|
|
|
|
|
|||||
| Total Toyota Motor Corporation shareholders’ equity |
16,746,935 | 16,391,908 | ||||||
|
|
|
|
|
|||||
| Noncontrolling interests |
861,472 | 566,904 | ||||||
|
|
|
|
|
|||||
| Total shareholders’ equity |
17,608,407 | 16,958,812 | ||||||
|
|
|
|
|
|||||
| Commitments and contingencies |
||||||||
| Total liabilities, mezzanine equity and shareholders’ equity |
47,427,597 | 43,776,105 | ||||||
|
|
|
|
|
|||||
Note: The total number of authorized shares for common stock and Model AA Class Shares is 10,000,000,000 shares.
The accompanying notes are an integral part of these consolidated financial statements.
3
TOYOTA MOTOR CORPORATION
Unaudited Consolidated Statements of Income and
Unaudited Consolidated Statements of Comprehensive Income
For the first half ended September 30, 2016
Consolidated Statements of Income
| Yen in millions | ||||||||
| For the first half
ended September 30, 2015 |
For the first half
ended September 30, 2016 |
|||||||
| Net revenues: |
||||||||
| Sales of products |
13,162,616 | 12,216,706 | ||||||
| Financing operations |
928,872 | 853,827 | ||||||
|
|
|
|
|
|||||
| Total net revenues |
14,091,488 | 13,070,533 | ||||||
|
|
|
|
|
|||||
| Costs and expenses: |
||||||||
| Cost of products sold |
10,518,787 | 10,056,838 | ||||||
| Cost of financing operations |
588,751 | 533,813 | ||||||
| Selling, general and administrative |
1,400,545 | 1,363,017 | ||||||
|
|
|
|
|
|||||
| Total costs and expenses |
12,508,083 | 11,953,668 | ||||||
|
|
|
|
|
|||||
| Operating income |
1,583,405 | 1,116,865 | ||||||
|
|
|
|
|
|||||
| Other income (expense): |
||||||||
| Interest and dividend income |
83,036 | 79,754 | ||||||
| Interest expense |
(19,658 | ) | (11,113 | ) | ||||
| Foreign exchange gain (loss), net |
36,590 | (27,907 | ) | |||||
| Other income (loss), net |
(8,222 | ) | 18,935 | |||||
|
|
|
|
|
|||||
| Total other income (expense) |
91,746 | 59,669 | ||||||
|
|
|
|
|
|||||
| Income before income taxes and equity in earnings of affiliated companies |
1,675,151 | 1,176,534 | ||||||
|
|
|
|
|
|||||
| Provision for income taxes |
516,368 | 354,924 | ||||||
| Equity in earnings of affiliated companies |
161,662 | 168,395 | ||||||
|
|
|
|
|
|||||
| Net income |
1,320,445 | 990,005 | ||||||
|
|
|
|
|
|||||
| Less – Net income attributable to noncontrolling interests |
(62,333 | ) | (43,832 | ) | ||||
|
|
|
|
|
|||||
| Net income attributable to Toyota Motor Corporation |
1,258,112 | 946,173 | ||||||
|
|
|
|
|
|||||
| Note: | Net income attributable to common shareholders for the first half ended September 30, 2016 and 2015 is 941,275 million yen and 1,255,652 million yen, respectively, which is derived by deducting dividend and accretion to Model AA Class Shares of 4,898 million yen and 2,460 million yen, respectively, from Net income attributable to Toyota Motor Corporation. |
| Yen | ||||||||
| Net income attributable to Toyota Motor Corporation per common share |
||||||||
| Basic |
399.39 | 311.08 | ||||||
|
|
|
|
|
|||||
| Diluted |
397.75 | 307.84 | ||||||
|
|
|
|
|
|||||
The accompanying notes are an integral part of these consolidated financial statements.
4
TOYOTA MOTOR CORPORATION
Unaudited Consolidated Statements of Income and
Unaudited Consolidated Statements of Comprehensive Income
For the first half ended September 30, 2016
Consolidated Statements of Comprehensive Income
| Yen in millions | ||||||||
| For the first half ended September 30, 2015 |
For the first half ended September 30, 2016 |
|||||||
| Net income |
1,320,445 | 990,005 | ||||||
| Other comprehensive income (loss), net of tax |
||||||||
| Foreign currency translation adjustments |
(142,295 | ) | (554,883 | ) | ||||
| Unrealized gains (losses) on securities |
(252,582 | ) | (191,427 | ) | ||||
| Pension liability adjustments |
(535 | ) | (714 | ) | ||||
|
|
|
|
|
|||||
| Total other comprehensive income (loss) |
(395,412 | ) | (747,024 | ) | ||||
|
|
|
|
|
|||||
| Comprehensive income |
925,033 | 242,981 | ||||||
|
|
|
|
|
|||||
| Less – Comprehensive income attributable to noncontrolling interests |
(31,596 | ) | (8,368 | ) | ||||
|
|
|
|
|
|||||
| Comprehensive income attributable to Toyota Motor Corporation |
893,437 | 234,613 | ||||||
|
|
|
|
|
|||||
The accompanying notes are an integral part of these consolidated financial statements.
5
TOYOTA MOTOR CORPORATION
Unaudited Consolidated Statements of Income and
Unaudited Consolidated Statements of Comprehensive Income
For the second quarter ended September 30, 2016
Consolidated Statements of Income
| Yen in millions | ||||||||
| For the second quarter ended September 30, 2015 |
For the second quarter ended September 30, 2016 |
|||||||
| Net revenues: |
||||||||
| Sales of products |
6,634,883 | 6,057,702 | ||||||
| Financing operations |
468,957 | 423,718 | ||||||
|
|
|
|
|
|||||
| Total net revenues |
7,103,840 | 6,481,420 | ||||||
|
|
|
|
|
|||||
| Costs and expenses: |
||||||||
| Cost of products sold |
5,269,997 | 5,043,030 | ||||||
| Cost of financing operations |
280,376 | 268,395 | ||||||
| Selling, general and administrative |
726,063 | 695,360 | ||||||
|
|
|
|
|
|||||
| Total costs and expenses |
6,276,436 | 6,006,785 | ||||||
|
|
|
|
|
|||||
| Operating income |
827,404 | 474,635 | ||||||
|
|
|
|
|
|||||
| Other income (expense): |
||||||||
| Interest and dividend income |
29,710 | 22,993 | ||||||
| Interest expense |
(15,262 | ) | (6,190 | ) | ||||
| Foreign exchange gain, net |
2,402 | 1,398 | ||||||
| Other income (loss), net |
(14,362 | ) | 6,642 | |||||
|
|
|
|
|
|||||
| Total other income (expense) |
2,488 | 24,843 | ||||||
|
|
|
|
|
|||||
| Income before income taxes and equity in earnings of affiliated companies |
829,892 | 499,478 | ||||||
|
|
|
|
|
|||||
| Provision for income taxes |
248,411 | 167,099 | ||||||
| Equity in earnings of affiliated companies |
60,760 | 78,395 | ||||||
|
|
|
|
|
|||||
| Net income |
642,241 | 410,774 | ||||||
|
|
|
|
|
|||||
| Less – Net income attributable to noncontrolling interests |
(30,523 | ) | (17,066 | ) | ||||
|
|
|
|
|
|||||
| Net income attributable to Toyota Motor Corporation |
611,718 | 393,708 | ||||||
|
|
|
|
|
|||||
| Note: | Net income attributable to common shareholders for the second quarter ended September 30, 2016 and 2015 is 391,259 million yen and 609,258 million yen, respectively, which is derived by deducting dividend and accretion to Model AA Class Shares of 2,449 million yen and 2,460 million yen, respectively, from Net income attributable to Toyota Motor Corporation. |
| Yen | ||||||||
| Net income attributable to Toyota Motor Corporation per common share |
||||||||
| Basic |
193.97 | 129.77 | ||||||
|
|
|
|
|
|||||
| Diluted |
192.51 | 128.54 | ||||||
|
|
|
|
|
|||||
The accompanying notes are an integral part of these consolidated financial statements.
6
TOYOTA MOTOR CORPORATION
Unaudited Consolidated Statements of Income and
Unaudited Consolidated Statements of Comprehensive Income
For the second quarter ended September 30, 2016
Consolidated Statements of Comprehensive Income
| Yen in millions | ||||||||
| For the second quarter ended September 30, 2015 |
For the second quarter ended September 30, 2016 |
|||||||
| Net income |
642,241 | 410,774 | ||||||
| Other comprehensive income (loss), net of tax |
||||||||
| Foreign currency translation adjustments |
(227,562 | ) | (104,983 | ) | ||||
| Unrealized gains (losses) on securities |
(330,242 | ) | 73,775 | |||||
| Pension liability adjustments |
(2,376 | ) | 2,894 | |||||
|
|
|
|
|
|||||
| Total other comprehensive income (loss) |
(560,180 | ) | (28,314 | ) | ||||
|
|
|
|
|
|||||
| Comprehensive income |
82,061 | 382,460 | ||||||
|
|
|
|
|
|||||
| Less – Comprehensive income attributable to noncontrolling interests |
3,045 | (12,635 | ) | |||||
|
|
|
|
|
|||||
| Comprehensive income attributable to Toyota Motor Corporation |
85,106 | 369,825 | ||||||
|
|
|
|
|
|||||
The accompanying notes are an integral part of these consolidated financial statements.
7
TOYOTA MOTOR CORPORATION
Unaudited Condensed Consolidated Statements of Cash Flows
For the first half ended September 30, 2016
| Yen in millions | ||||||||
| For the first half ended September 30, 2015 |
For the first half ended September 30, 2016 |
|||||||
| Cash flows from operating activities: |
||||||||
| Net income |
1,320,445 | 990,005 | ||||||
| Adjustments to reconcile net income to net cash provided by operating activities |
||||||||
| Depreciation |
784,705 | 767,044 | ||||||
| Provision for doubtful accounts and credit losses |
43,737 | 37,763 | ||||||
| Pension and severance costs, less payments |
7,293 | 21,956 | ||||||
| Losses on disposal of fixed assets |
18,077 | 12,202 | ||||||
| Unrealized losses on available-for-sale securities, net |
6,197 | 5,990 | ||||||
| Deferred income taxes |
53,219 | 18,740 | ||||||
| Equity in earnings of affiliated companies |
(161,662 | ) | (168,395 | ) | ||||
| Changes in operating assets and liabilities, and other |
(114,488 | ) | (110,929 | ) | ||||
|
|
|
|
|
|||||
| Net cash provided by operating activities |
1,957,523 | 1,574,376 | ||||||
|
|
|
|
|
|||||
| Cash flows from investing activities: |
||||||||
| Additions to finance receivables |
(7,018,921 | ) | (6,471,350 | ) | ||||
| Collection of and proceeds from sales of finance receivables |
6,725,564 | 6,248,137 | ||||||
| Additions to fixed assets excluding equipment leased to others |
(631,430 | ) | (592,974 | ) | ||||
| Additions to equipment leased to others |
(1,422,814 | ) | (1,198,120 | ) | ||||
| Proceeds from sales of fixed assets excluding equipment leased to others |
14,846 | 15,866 | ||||||
| Proceeds from sales of equipment leased to others |
537,111 | 620,871 | ||||||
| Purchases of marketable securities and security investments |
(915,383 | ) | (1,220,327 | ) | ||||
| Proceeds from sales of and maturity of marketable securities and security investments |
1,580,087 | 864,289 | ||||||
| Changes in investments and other assets, and other |
(1,025,228 | ) | 698,684 | |||||
|
|
|
|
|
|||||
| Net cash used in investing activities |
(2,156,168 | ) | (1,034,924 | ) | ||||
|
|
|
|
|
|||||
| Cash flows from financing activities: |
||||||||
| Proceeds from issuance of long-term debt |
2,806,288 | 2,080,740 | ||||||
| Payments of long-term debt |
(2,150,070 | ) | (2,112,216 | ) | ||||
| Increase in short-term borrowings |
230,267 | 353,872 | ||||||
| Proceeds from issuance of class shares |
474,917 | — | ||||||
| Dividends paid to Toyota Motor Corporation class shareholders |
— | (1,224 | ) | |||||
| Dividends paid to Toyota Motor Corporation common shareholders |
(393,352 | ) | (334,144 | ) | ||||
| Dividends paid to noncontrolling interests |
(59,027 | ) | (47,934 | ) | ||||
| Reissuance (repurchase) of treasury stock, and other |
(245,819 | ) | (505,603 | ) | ||||
|
|
|
|
|
|||||
| Net cash provided by (used in) financing activities |
663,204 | (566,509 | ) | |||||
|
|
|
|
|
|||||
| Effect of exchange rate changes on cash and cash equivalents |
(58,265 | ) | (145,367 | ) | ||||
|
|
|
|
|
|||||
| Net increase (decrease) in cash and cash equivalents |
406,294 | (172,424 | ) | |||||
|
|
|
|
|
|||||
| Cash and cash equivalents at beginning of period |
2,284,557 | 2,939,428 | ||||||
|
|
|
|
|
|||||
| Cash and cash equivalents at end of period |
2,690,851 | 2,767,004 | ||||||
|
|
|
|
|
|||||
The accompanying notes are an integral part of these consolidated financial statements.
8
TOYOTA MOTOR CORPORATION
Notes to Unaudited Consolidated Financial Statements
| 1. | Basis of preparation: |
The accompanying unaudited condensed consolidated financial statements of Toyota Motor Corporation (the “parent company”) as of and for the periods ended September 30, 2016, have been prepared in accordance with U.S. generally accepted accounting principles (“U.S.GAAP”) and on substantially the same basis as its annual consolidated financial statements except for certain required disclosures which have been omitted. The unaudited condensed consolidated financial statements should be read in conjunction with the Annual Report on Form 20-F for the year ended March 31, 2016. The unaudited condensed consolidated financial statements reflect all adjustments, consisting of only normal recurring adjustments, necessary for a fair presentation of the result for that period and the financial condition at that date. The consolidated results for the six-month and the three-month periods are not necessarily indicative of results to be expected for the full year.
| 2. | Accounting changes and recent pronouncements to be adopted in future periods: |
Accounting changes -
In February 2015, the Financial Accounting Standards Board (“FASB”) issued updated guidance that amends the analysis a reporting entity must perform to determine whether it should consolidate certain legal entities. The parent company and its consolidated subsidiaries (“Toyota”) adopted this guidance on April 1, 2016. The adoption of this guidance did not have a material impact on Toyota’s consolidated financial statements.
In April 2015, the FASB issued updated guidance that requires debt issuance costs related to a recognized debt liability be presented in the balance sheet as a direct deduction from the carrying amount of the related debt liability instead of being presented as an asset. In August 2015, the FASB issued an additional update which clarifies that debt issuance costs for line of credit agreements may continue to be deferred and amortized. Toyota adopted this guidance on April 1, 2016. The adoption of this guidance did not have a material impact on Toyota’s consolidated financial statements.
In April 2015, the FASB issued updated guidance to help entities evaluate the accounting for fees paid by a customer in a cloud computing arrangement. Toyota adopted this guidance on April 1, 2016. The adoption of this guidance did not have a material impact on Toyota’s consolidated financial statements.
In May 2015, the FASB issued updated guidance on disclosures for investments in certain entities that calculate net asset value per share. This guidance removes the requirement to categorize within the fair value hierarchy all investments for which fair value is measured using the net asset value per share practical expedient. Toyota adopted this guidance on April 1, 2016. The adoption of this guidance did not have a material impact on Toyota’s consolidated financial statements. For a further discussion of additional disclosures by adoption of this guidance, see note 8 to the consolidated financial statements.
9
TOYOTA MOTOR CORPORATION
Notes to Unaudited Consolidated Financial Statements
In November 2015, the FASB issued updated guidance to simplify the balance sheet classification of deferred taxes. This guidance will require that deferred tax assets and liabilities be classified as noncurrent on the balance sheet. Toyota early adopted this guidance on April 1, 2016. Toyota adopted this guidance on a prospective basis from April 1, 2016 and prior periods were not retrospectively adjusted.
Recent pronouncements to be adopted in future periods -
In May 2014, the FASB issued updated guidance on the recognition of revenue from contracts with customers. This guidance will supersede the current revenue recognition guidance. In August 2015, the FASB issued updated guidance on the deferral of the effective date. As a result, this guidance is effective for annual reporting periods beginning after December 15, 2017, including interim periods within that reporting period. This guidance may be applied retrospectively to each prior reporting period presented or retrospectively with the cumulative effect of initially applying this guidance recognized at the date of initial application. Management is evaluating the impact of adopting this guidance on Toyota’s consolidated financial statements.
In July 2015, the FASB issued updated guidance to simplify the measurement of inventory. This guidance is effective for fiscal years beginning after December 15, 2016, including interim periods within those fiscal years. Management is evaluating the impact of adopting this guidance on Toyota’s consolidated financial statements.
In January 2016, the FASB issued updated guidance for financial instruments. This guidance addresses certain aspects of recognition, measurement, presentation, and disclosure of financial instruments and will require entities to measure equity investments at fair value and recognize any changes in fair value in net income. This guidance is effective for fiscal years beginning after December 15, 2017, including interim periods within those fiscal years. Management is evaluating the impact of adopting this guidance on Toyota’s consolidated financial statements.
In February 2016, the FASB issued updated guidance for leases. This guidance will require lessees to recognize almost all leases on their balance sheet as a right-of-use asset and a lease liability. This guidance is effective for fiscal years beginning after December 15, 2018, including interim periods within those fiscal years. Management is evaluating the impact of adopting this guidance on Toyota’s consolidated financial statements.
10
TOYOTA MOTOR CORPORATION
Notes to Unaudited Consolidated Financial Statements
In March 2016, the FASB issued updated guidance for effect of derivative contract novations on existing hedge accounting relationships. This guidance clarifies that a change in the counterparty to a designated derivative hedging instrument does not, in and of itself, require designation of that hedging relationship provided that all other hedge accounting criteria continue to be met. This guidance is effective for fiscal years beginning after December 15, 2016, including interim periods within those fiscal years. Management does not expect this guidance to have a material impact on Toyota’s consolidated financial statements.
In March 2016, the FASB issued updated guidance for contingent put and call options in debt instruments. This guidance clarifies whether embedded contingent put and call options are clearly and closely related to the debt host when bifurcating embedded derivatives. This guidance is effective for fiscal years beginning after December 15, 2016, including interim periods within those fiscal years. Management does not expect this guidance to have a material impact on Toyota’s consolidated financial statements.
In June 2016, the FASB issued updated guidance for measurement of credit losses on financial instruments. This guidance introduces an approach to estimate credit losses on certain types of financial instruments based on expected losses. It also modifies the impairment model for available-for-sale debt securities. This guidance is effective for fiscal years beginning after December 15, 2019, including interim periods within those fiscal years. Management is evaluating the impact of adopting this guidance on Toyota’s consolidated financial statements.
In August 2016, the FASB issued updated guidance for classification of statement of cash flows. This guidance clarifies classification of certain cash receipts and cash payments of statement of cash flows. This guidance is effective for fiscal years beginning after December 15, 2017, including interim periods within those fiscal years. Management is evaluating the impact of adopting this guidance on Toyota’s consolidated financial statements.
In October 2016, the FASB issued updated guidance that would require entities to recognize the income tax consequences of intercompany asset transfers. This guidance is effective for fiscal years beginning after December 15, 2017, including interim periods within those fiscal years. Management does not expect this guidance to have a material impact on Toyota’s consolidated financial statements.
In October 2016, the FASB issued updated guidance for consolidation. Under this guidance, a reporting entity would evaluate its indirect economic interest in a variable interest entity held through a related party under common control on a proportionate basis. This guidance is effective for fiscal years beginning after December 15, 2016, including interim periods within those fiscal years. Management does not expect this guidance to have a material impact on Toyota’s consolidated financial statements.
11
TOYOTA MOTOR CORPORATION
Notes to Unaudited Consolidated Financial Statements
| 3. | Accounting procedures specific to quarterly consolidated financial statements: |
Provision for income taxes -
The provision for income taxes is computed by multiplying income before income taxes and equity in earnings of affiliated companies for the first half by estimated annual effective tax rates. These estimated annual effective tax rates reflect anticipated investment tax credits, foreign tax credits and other items, including changes in valuation allowances, that are expected to affect estimated annual effective tax rates.
| 4. | Derivative financial instruments: |
Toyota employs derivative financial instruments, including foreign exchange forward contracts, foreign currency options, interest rate swaps, interest rate currency swap agreements and interest rate options to manage its exposure to fluctuations in interest rates and foreign currency exchange rates. Toyota does not use derivatives for speculation or trading.
Fair value hedges -
Toyota enters into interest rate swaps and interest rate currency swap agreements mainly to convert its fixed-rate debt to variable-rate debt. Toyota uses interest rate swap agreements in managing interest rate risk exposure. Interest rate swap agreements are executed as either an integral part of specific debt transactions or on a portfolio basis. Toyota uses interest rate currency swap agreements to hedge exposure to currency exchange rate fluctuations on principal and interest payments for borrowings denominated in foreign currencies. Notes and loans payable issued in foreign currencies are hedged by concurrently executing interest rate currency swap agreements, which involve the exchange of foreign currency principal and interest obligations for each functional currency obligations at agreed-upon currency exchange and interest rates.
For the first half and the second quarter ended September 30, 2015 and 2016, the ineffective portion of Toyota’s fair value hedge relationships was not material. For fair value hedging relationships, the components of each derivative’s gain or loss are included in the assessment of hedge effectiveness.
Undesignated derivative financial instruments -
Toyota uses foreign exchange forward contracts, foreign currency options, interest rate swaps, interest rate currency swap agreements, and interest rate options, to manage its exposure to foreign currency exchange rate fluctuations and interest rate fluctuations from an economic perspective, and for some of which Toyota is unable to or has elected not to apply hedge accounting.
12
TOYOTA MOTOR CORPORATION
Notes to Unaudited Consolidated Financial Statements
Fair value and gains or losses on derivative financial instruments -
The following table summarizes the fair values of derivative financial instruments as of March 31, 2016 and September 30, 2016:
| Yen in millions | ||||||||
| March 31, 2016 | September 30, 2016 | |||||||
| Derivative assets |
||||||||
| Derivative financial instruments designated as hedging instruments |
||||||||
| Interest rate and currency swap agreements |
||||||||
| Prepaid expenses and other current assets |
— | — | ||||||
| Investments and other assets - Other |
4,371 | 7,724 | ||||||
|
|
|
|
|
|||||
| Total |
4,371 | 7,724 | ||||||
|
|
|
|
|
|||||
| Undesignated derivative financial instruments |
||||||||
| Interest rate and currency swap agreements |
||||||||
| Prepaid expenses and other current assets |
96,996 | 60,428 | ||||||
| Investments and other assets - Other |
230,726 | 194,645 | ||||||
|
|
|
|
|
|||||
| Total |
327,722 | 255,073 | ||||||
|
|
|
|
|
|||||
| Foreign exchange forward and option contracts |
||||||||
| Prepaid expenses and other current assets |
34,290 | 30,476 | ||||||
| Investments and other assets - Other |
428 | 279 | ||||||
|
|
|
|
|
|||||
| Total |
34,718 | 30,755 | ||||||
|
|
|
|
|
|||||
| Total derivative assets |
366,811 | 293,552 | ||||||
| Counterparty netting |
(116,174 | ) | (87,187 | ) | ||||
| Collateral received |
(65,810 | ) | (64,095 | ) | ||||
|
|
|
|
|
|||||
| Carrying value of derivative assets |
184,827 | 142,270 | ||||||
|
|
|
|
|
|||||
| Derivative liabilities |
||||||||
| Derivative financial instruments designated as hedging instruments |
||||||||
| Interest rate and currency swap agreements |
||||||||
| Other current liabilities |
— | — | ||||||
| Other long-term liabilities |
— | — | ||||||
|
|
|
|
|
|||||
| Total |
— | — | ||||||
|
|
|
|
|
|||||
| Undesignated derivative financial instruments |
||||||||
| Interest rate and currency swap agreements |
||||||||
| Other current liabilities |
(42,404 | ) | (64,687 | ) | ||||
| Other long-term liabilities |
(180,716 | ) | (122,200 | ) | ||||
|
|
|
|
|
|||||
| Total |
(223,120 | ) | (186,887 | ) | ||||
|
|
|
|
|
|||||
| Foreign exchange forward and option contracts |
||||||||
| Other current liabilities |
(21,167 | ) | (7,646 | ) | ||||
| Other long-term liabilities |
— | (44 | ) | |||||
|
|
|
|
|
|||||
| Total |
(21,167 | ) | (7,690 | ) | ||||
|
|
|
|
|
|||||
| Total derivative liabilities |
(244,287 | ) | (194,577 | ) | ||||
| Counterparty netting |
116,174 | 87,187 | ||||||
| Collateral posted |
94,953 | 82,050 | ||||||
|
|
|
|
|
|||||
| Carrying value of derivative liabilities |
(33,160 | ) | (25,340 | ) | ||||
|
|
|
|
|
|||||
13
TOYOTA MOTOR CORPORATION
Notes to Unaudited Consolidated Financial Statements
The following table summarizes the notional amounts of derivative financial instruments as of March 31, 2016 and September 30, 2016:
| Yen in millions | ||||||||||||||||
| March 31, 2016 | September 30, 2016 | |||||||||||||||
| Designated derivative financial instruments |
Undesignated derivative financial instruments |
Designated derivative financial instruments |
Undesignated derivative financial instruments |
|||||||||||||
| Interest rate and currency swap agreements |
41,016 | 18,312,359 | 36,808 | 17,084,406 | ||||||||||||
| Foreign exchange forward and option contracts |
— | 2,742,102 | — | 2,355,589 | ||||||||||||
|
|
|
|
|
|
|
|
|
|||||||||
| Total |
41,016 | 21,054,461 | 36,808 | 19,439,995 | ||||||||||||
|
|
|
|
|
|
|
|
|
|||||||||
| The following table summarizes the gains and losses on derivative financial instruments and hedged items reported in the consolidated statements of income for the first half and the second quarter ended September 30, 2015 and 2016: |
| Yen in millions | ||||||||||||||||
| For the first half ended September 30, 2015 |
For the first half ended September 30, 2016 |
|||||||||||||||
| Gains or (losses) on derivative financial instruments |
Gains or (losses) on hedged items |
Gains or (losses) on derivative financial instruments |
Gains or (losses) on hedged items |
|||||||||||||
| Derivative financial instruments designated as hedging instruments |
||||||||||||||||
| Interest rate and currency swap agreements |
||||||||||||||||
| Cost of financing operations |
(2,137 | ) | 2,122 | 3,904 | (3,904 | ) | ||||||||||
| Undesignated derivative financial instruments |
||||||||||||||||
| Interest rate and currency swap agreements |
||||||||||||||||
| Cost of financing operations |
110,932 | 17,776 | ||||||||||||||
| Foreign exchange gain (loss), net |
13,646 | (3,711 | ) | |||||||||||||
| Foreign exchange forward and option contracts |
||||||||||||||||
| Cost of financing operations |
6,930 | 3,665 | ||||||||||||||
| Foreign exchange gain (loss), net |
33,493 | 124,289 | ||||||||||||||
14
TOYOTA MOTOR CORPORATION
Notes to Unaudited Consolidated Financial Statements
| Yen in millions | ||||||||||||||||
| For the second quarter ended September 30, 2015 |
For the second quarter ended September 30, 2016 |
|||||||||||||||
| Gains or (losses) on derivative financial instruments |
Gains or (losses) on hedged items |
Gains or (losses) on derivative financial instruments |
Gains or (losses) on hedged items |
|||||||||||||
| Derivative financial instruments designated as hedging instruments |
||||||||||||||||
| Interest rate and currency swap agreements |
||||||||||||||||
| Cost of financing operations |
(304 | ) | 314 | 298 | (289 | ) | ||||||||||
| Undesignated derivative financial instruments |
||||||||||||||||
| Interest rate and currency swap agreements |
||||||||||||||||
| Cost of financing operations |
115,862 | 18,604 | ||||||||||||||
| Foreign exchange gain (loss), net |
10,411 | (3,463 | ) | |||||||||||||
| Foreign exchange forward and option contracts |
||||||||||||||||
| Cost of financing operations |
11,869 | (3,092 | ) | |||||||||||||
| Foreign exchange gain (loss), net |
36,987 | 27,854 | ||||||||||||||
Undesignated derivative financial instruments are used to manage economic risks of fluctuations in foreign currency exchange rates and interest rates of certain receivables and payables. Those economic risks are offset by changes in the fair value of undesignated derivative financial instruments.
Cash flows from transactions of derivative financial instruments are included in cash flows from operating activities in the consolidated statements of cash flows.
Credit risk related contingent features -
Toyota enters into International Swaps and Derivatives Association Master Agreements with counterparties. These Master Agreements contain a provision requiring either Toyota or the counterparty to settle the contract or to post assets to the other party in the event of a ratings downgrade below a specified threshold.
The aggregate fair value amount of derivative financial instruments that contain credit risk related contingent features that are in a net liability position after being offset by cash collateral as of September 30, 2016 is ¥2,473 million. The aggregate fair value amount of assets that are already posted as cash collateral as of September 30, 2016 is ¥70,380 million. If the ratings of Toyota decline below specified thresholds, the maximum amount of assets to be posted or for which Toyota could be required to settle the contracts is ¥2,473 million as of September 30, 2016.
15
TOYOTA MOTOR CORPORATION
Notes to Unaudited Consolidated Financial Statements
| 5. | Contingencies: |
Guarantees -
Toyota enters into contracts with Toyota dealers to guarantee customers’ payments of their installment payables that arise from installment contracts between customers and Toyota dealers, as and when requested by Toyota dealers. Toyota is required to execute its guarantee primarily when customers are unable to make required payments. The maximum potential amount of future payments as of September 30, 2016 is ¥2,405,803 million. Liabilities for guarantees totaling ¥5,762 million have been provided as of September 30, 2016. Under these guarantee contracts, Toyota is entitled to recover any amount paid by Toyota from the customers whose original obligations Toyota has guaranteed.
Legal proceedings -
From time-to-time, Toyota issues vehicle recalls and takes other safety measures including safety campaigns relating to its vehicles. Since 2009, Toyota issued safety campaigns related to the risk of floor mat entrapment of accelerator pedals and vehicle recalls related to slow-to-return or sticky accelerator pedals. In March 2014, Toyota entered into a Deferred Prosecution Agreement (“DPA”) to resolve an investigation by the U.S. Attorney for the Southern District of New York (“SDNY”) related to unintended acceleration in certain of its vehicles. The DPA provides for an independent monitor to review and assess policies and procedures relating to Toyota’s safety communications process, its process for sharing vehicle accident information internally and its process for preparing and sharing certain technical reports.
In 2010, there was a recall related to the software program that controls the antilock braking system in certain models, including the Prius, which led to putative class action lawsuits on behalf of owners of recalled vehicles and owners of vehicles which were not recalled. The United States District Court for the Central District of California denied the plaintiffs’ motions for class certification and granted summary judgment in Toyota’s favor denying the plaintiffs’ claims related to both the recalled vehicles and the non-recalled vehicles. The District Court’s rulings have been affirmed by the Ninth Circuit Court of Appeals.
16
TOYOTA MOTOR CORPORATION
Notes to Unaudited Consolidated Financial Statements
Personal injury and wrongful death claims involving allegations of unintended acceleration are pending in several consolidated proceedings in federal and state courts, as well as in individual cases in various other states. The judges in the consolidated federal action and the consolidated California state action have approved an Intensive Settlement Process (“ISP”) for such claims in those actions. Under the ISP, all individual claims within the consolidated actions are stayed pending completion of a process to assess whether they can be resolved on terms acceptable to the parties. Cases not resolved after completion of the ISP will then proceed to discovery and toward trial. Toyota has offered the ISP process to plaintiffs in other consolidated actions and in individual cases, as well.
Toyota has been named as a defendant in 33 economic loss class action lawsuits in the United States, which, together with similar lawsuits against Takata and other automakers, have been made part of a multi-district litigation proceeding in the United States District Court for the Southern District of Florida, arising out of allegations that airbag inflators manufactured by Takata are defective. These lawsuits are at an early stage.
Toyota has received a request for information from the SDNY related to statements concerning one or more reported injuries sustained in Toyota vehicles following deployments of Takata airbags. Toyota is cooperating with the request.
Toyota self-reported a process gap in fulfilling certain emissions defect information reporting requirements with the U.S. Environmental Protection Agency (“EPA”) and California Air Resources Board, including updates on its repair completion rates for recalled emissions components and certain other reports concerning emissions related defects. Toyota is involved in discussions with these agencies. The SDNY and EPA have requested certain follow-up information regarding this reporting issue, and Toyota is cooperating with the request.
Toyota also has various other pending legal actions and claims, including without limitation personal injury and wrongful death lawsuits and claims in the United States, and is subject to government investigations from-time-to-time.
Beyond the amounts accrued with respect to all aforementioned matters, Toyota is unable to estimate a range of reasonably possible loss, if any, for the pending legal matters because (i) many of the proceedings are in evidence gathering stages, (ii) significant factual issues need to be resolved, (iii) the legal theory or nature of the claims is unclear, (iv) the outcome of future motions or appeals is unknown and/or (v) the outcomes of other matters of these types vary widely and do not appear sufficiently similar to offer meaningful guidance. Based upon information currently available to Toyota, however, Toyota believes that its losses from these matters, if any, beyond the amounts accrued, would not have a material adverse effect on Toyota’s financial position, results of operations or cash flows.
17
TOYOTA MOTOR CORPORATION
Notes to Unaudited Consolidated Financial Statements
| 6. | Segment data: |
The operating segments reported below are the segments of Toyota for which separate financial information is available and for which operating income/loss amounts are evaluated regularly by executive management in deciding how to allocate resources and in assessing performance.
The major portions of Toyota’s operations on a worldwide basis are derived from the Automotive and Financial Services business segments. The Automotive segment designs, manufactures and distributes sedans, minivans, compact cars, sport-utility vehicles, trucks and related parts and accessories. The Financial Services segment consists primarily of financing, and vehicle and equipment leasing operations to assist in the merchandising of the parent company and its affiliated companies products as well as other products. The All Other segment includes the design, manufacturing and sales of housing, telecommunications and other businesses.
The following tables present certain information regarding Toyota’s industry or geographic segments and overseas revenues by destination for the first half and the second quarter ended September 30, 2015 and 2016.
Segment operating results -
For the first half ended September 30, 2015:
| Yen in millions | ||||||||||||||||||||
| Automotive | Financial Services |
All Other | Inter-segment Elimination |
Consolidated | ||||||||||||||||
| Net revenues |
||||||||||||||||||||
| Sales to external customers |
12,856,840 | 928,872 | 305,776 | — | 14,091,488 | |||||||||||||||
| Inter-segment sales and transfers |
26,091 | 21,109 | 245,772 | (292,972 | ) | — | ||||||||||||||
|
|
|
|
|
|
|
|
|
|
|
|||||||||||
| Total |
12,882,931 | 949,981 | 551,548 | (292,972 | ) | 14,091,488 | ||||||||||||||
| Operating expenses |
11,491,577 | 784,138 | 524,313 | (291,945 | ) | 12,508,083 | ||||||||||||||
|
|
|
|
|
|
|
|
|
|
|
|||||||||||
| Operating income |
1,391,354 | 165,843 | 27,235 | (1,027 | ) | 1,583,405 | ||||||||||||||
|
|
|
|
|
|
|
|
|
|
|
|||||||||||
| For the first half ended September 30, 2016: |
||||||||||||||||||||
| Yen in millions | ||||||||||||||||||||
| Automotive | Financial Services |
All Other | Inter-segment Elimination |
Consolidated | ||||||||||||||||
| Net revenues |
||||||||||||||||||||
| Sales to external customers |
11,915,160 | 853,827 | 301,546 | — | 13,070,533 | |||||||||||||||
| Inter-segment sales and transfers |
22,849 | 17,137 | 231,306 | (271,292 | ) | — | ||||||||||||||
|
|
|
|
|
|
|
|
|
|
|
|||||||||||
| Total |
11,938,009 | 870,964 | 532,852 | (271,292 | ) | 13,070,533 | ||||||||||||||
| Operating expenses |
11,000,649 | 718,768 | 505,623 | (271,372 | ) | 11,953,668 | ||||||||||||||
|
|
|
|
|
|
|
|
|
|
|
|||||||||||
| Operating income |
937,360 | 152,196 | 27,229 | 80 | 1,116,865 | |||||||||||||||
|
|
|
|
|
|
|
|
|
|
|
|||||||||||
18
TOYOTA MOTOR CORPORATION
Notes to Unaudited Consolidated Financial Statements
| For the second quarter ended September 30, 2015: |
| Yen in millions | ||||||||||||||||||||
| Automotive | Financial Services |
All Other | Inter-segment Elimination |
Consolidated | ||||||||||||||||
| Net revenues |
||||||||||||||||||||
| Sales to external customers |
6,458,452 | 468,957 | 176,431 | — | 7,103,840 | |||||||||||||||
| Inter-segment sales and transfers |
13,089 | 10,722 | 118,168 | (141,979 | ) | — | ||||||||||||||
|
|
|
|
|
|
|
|
|
|
|
|||||||||||
| Total |
6,471,541 | 479,679 | 294,599 | (141,979 | ) | 7,103,840 | ||||||||||||||
| Operating expenses |
5,757,750 | 384,009 | 279,647 | (144,970 | ) | 6,276,436 | ||||||||||||||
|
|
|
|
|
|
|
|
|
|
|
|||||||||||
| Operating income |
713,791 | 95,670 | 14,952 | 2,991 | 827,404 | |||||||||||||||
|
|
|
|
|
|
|
|
|
|
|
|||||||||||
For the second quarter ended September 30, 2016:
| Yen in millions | ||||||||||||||||||||
| Automotive | Financial Services |
All Other | Inter-segment Elimination |
Consolidated | ||||||||||||||||
| Net revenues |
||||||||||||||||||||
| Sales to external customers |
5,897,299 | 423,718 | 160,403 | — | 6,481,420 | |||||||||||||||
| Inter-segment sales and transfers |
11,673 | 8,335 | 123,406 | (143,414 | ) | — | ||||||||||||||
|
|
|
|
|
|
|
|
|
|
|
|||||||||||
| Total |
5,908,972 | 432,053 | 283,809 | (143,414 | ) | 6,481,420 | ||||||||||||||
| Operating expenses |
5,515,053 | 370,098 | 266,908 | (145,274 | ) | 6,006,785 | ||||||||||||||
|
|
|
|
|
|
|
|
|
|
|
|||||||||||
| Operating income |
393,919 | 61,955 | 16,901 | 1,860 | 474,635 | |||||||||||||||
|
|
|
|
|
|
|
|
|
|
|
|||||||||||
19
TOYOTA MOTOR CORPORATION
Notes to Unaudited Consolidated Financial Statements
Geographic information -
For the first half ended September 30, 2015:
| Yen in millions | ||||||||||||||||||||||||||
| Japan | North America | Europe | Asia | Other | Inter-segment Elimination |
Consolidated | ||||||||||||||||||||
| Net revenues |
||||||||||||||||||||||||||
| Sales to external customers |
4,149,579 | 5,416,766 | 1,244,296 | 2,204,258 | 1,076,589 | — | 14,091,488 | |||||||||||||||||||
| Inter-segment sales and transfers |
3,072,596 | 114,026 | 65,017 | 236,834 | 108,233 | (3,596,706 | ) | — | ||||||||||||||||||
|
|
|
|
|
|
|
|
|
|
|
|
|
| ||||||||||||||
| Total |
7,222,175 | 5,530,792 | 1,309,313 | 2,441,092 | 1,184,822 | (3,596,706 | ) | 14,091,488 | ||||||||||||||||||
| Operating expenses |
6,263,942 | 5,255,398 | 1,279,062 | 2,196,962 | 1,117,928 | (3,605,209 | ) | 12,508,083 | ||||||||||||||||||
|
|
|
|
|
|
|
|
|
|
|
|
|
| ||||||||||||||
| Operating income |
958,233 | 275,394 | 30,251 | 244,130 | 66,894 | 8,503 | 1,583,405 | |||||||||||||||||||
|
|
|
|
|
|
|
|
|
|
|
|
|
| ||||||||||||||
|
For the first half ended September 30, 2016: | ||||||||||||||||||||||||||
| Yen in millions | ||||||||||||||||||||||||||
| Japan | North America | Europe | Asia | Other | Inter-segment Elimination |
| ||||||||||||||||||||
| Net revenues |
||||||||||||||||||||||||||
| Sales to external customers |
4,119,205 | 4,785,406 | 1,166,278 | 2,057,926 | 941,718 | — | 13,070,533 | |||||||||||||||||||
| Inter-segment sales and transfers |
2,861,212 | 90,989 | 59,639 | 243,644 | 104,894 | (3,360,378 | ) | — | ||||||||||||||||||
|
|
|
|
|
|
|
|
|
|
|
|
|
| ||||||||||||||
| Total |
6,980,417 | 4,876,395 | 1,225,917 | 2,301,570 | 1,046,612 | (3,360,378 | ) | 13,070,533 | ||||||||||||||||||
| Operating expenses |
6,495,708 | 4,565,136 | 1,191,392 | 2,078,779 | 993,761 | (3,371,108 | ) | 11,953,668 | ||||||||||||||||||
|
|
|
|
|
|
|
|
|
|
|
|
|
| ||||||||||||||
| Operating income |
484,709 | 311,259 | 34,525 | 222,791 | 52,851 | 10,730 | 1,116,865 | |||||||||||||||||||
|
|
|
|
|
|
|
|
|
|
|
|
|
| ||||||||||||||
|
“Other” consists of Central and South America, Oceania, Africa and the Middle East. | ||||||||||||||||||||||||||
20
TOYOTA MOTOR CORPORATION
Notes to Unaudited Consolidated Financial Statements
For the second quarter ended September 30, 2015:
| Yen in millions | ||||||||||||||||||||||||||
| Japan | North America | Europe | Asia | Other | Inter-segment Elimination |
Consolidated | ||||||||||||||||||||
| Net revenues |
||||||||||||||||||||||||||
| Sales to external customers |
2,142,419 | 2,635,474 | 636,733 | 1,160,467 | 528,747 | — | 7,103,840 | |||||||||||||||||||
| Inter-segment sales and transfers |
1,577,794 | 54,873 | 28,556 | 137,648 | 59,800 | (1,858,671 | ) | — | ||||||||||||||||||
|
|
|
|
|
|
|
|
|
|
|
|
|
| ||||||||||||||
| Total |
3,720,213 | 2,690,347 | 665,289 | 1,298,115 | 588,547 | (1,858,671 | ) | 7,103,840 | ||||||||||||||||||
| Operating expenses |
3,237,834 | 2,541,813 | 642,897 | 1,154,082 | 559,681 | (1,859,871 | ) | 6,276,436 | ||||||||||||||||||
|
|
|
|
|
|
|
|
|
|
|
|
|
| ||||||||||||||
| Operating income |
482,379 | 148,534 | 22,392 | 144,033 | 28,866 | 1,200 | 827,404 | |||||||||||||||||||
|
|
|
|
|
|
|
|
|
|
|
|
|
| ||||||||||||||
For the second quarter ended September 30, 2016:
| Yen in millions | ||||||||||||||||||||||||||
| Japan | North America | Europe | Asia | Other | Inter-segment Elimination |
Consolidated | ||||||||||||||||||||
| Net revenues |
||||||||||||||||||||||||||
| Sales to external customers |
2,139,769 | 2,300,602 | 576,245 | 994,421 | 470,383 | — | 6,481,420 | |||||||||||||||||||
| Inter-segment sales and transfers |
1,479,238 | 41,234 | 27,842 | 124,492 | 54,696 | (1,727,502 | ) | — | ||||||||||||||||||
|
|
|
|
|
|
|
|
|
|
|
|
|
| ||||||||||||||
| Total |
3,619,007 | 2,341,836 | 604,087 | 1,118,913 | 525,079 | (1,727,502 | ) | 6,481,420 | ||||||||||||||||||
| Operating expenses |
3,424,665 | 2,202,017 | 578,572 | 1,023,570 | 499,528 | (1,721,567 | ) | 6,006,785 | ||||||||||||||||||
|
|
|
|
|
|
|
|
|
|
|
|
|
| ||||||||||||||
| Operating income |
194,342 | 139,819 | 25,515 | 95,343 | 25,551 | (5,935 | ) | 474,635 | ||||||||||||||||||
|
|
|
|
|
|
|
|
|
|
|
|
|
| ||||||||||||||
“Other” consists of Central and South America, Oceania, Africa and the Middle East.
Revenues are attributed to geographies based on the country location of the parent company or the subsidiary that transacted the sale with the external customer.
Transfers between industry or geographic segments are made at amounts which Toyota’s management believes approximate arm’s-length transactions. In measuring the reportable segments’ income or losses, operating income consists of revenue less operating expenses.
21
TOYOTA MOTOR CORPORATION
Notes to Unaudited Consolidated Financial Statements
Overseas revenues by destination -
The following information shows revenues that are attributed to countries based on location of customers, excluding customers in Japan. In addition to the disclosure requirements under U.S.GAAP, Toyota discloses this information in order to provide financial statements users with valuable information.
For the first half ended September 30, 2015:
| Yen in millions | ||||||||||||||||||||
| North America | Europe | Asia | Other | Total | ||||||||||||||||
| Overseas sales |
5,394,689 | 1,138,140 | 2,063,518 | 2,472,122 | 11,068,469 | |||||||||||||||
| Consolidated sales |
— | — | — | — | 14,091,488 | |||||||||||||||
| Ratio of overseas sales to consolidated sales |
38.3 | % | 8.1 | % | 14.6 | % | 17.5 | % | 78.5 | % | ||||||||||
| For the first half ended September 30, 2016: | ||||||||||
| Yen in millions | ||||||||||||||||||||
| North America | Europe | Asia | Other | Total | ||||||||||||||||
| Overseas sales |
4,782,618 | 1,065,043 | 2,069,144 | 1,945,550 | 9,862,355 | |||||||||||||||
| Consolidated sales |
— | — | — | — | 13,070,533 | |||||||||||||||
| Ratio of overseas sales to consolidated sales |
36.6 | % | 8.2 | % | 15.8 | % | 14.9 | % | 75.5 | % | ||||||||||
| For the second quarter ended September 30, 2015: | ||||||||||
| Yen in millions | ||||||||||||||||||||
| North America | Europe | Asia | Other | Total | ||||||||||||||||
| Overseas sales |
2,623,311 | 582,153 | 1,021,745 | 1,301,260 | 5,528,469 | |||||||||||||||
| Consolidated sales |
— | — | — | — | 7,103,840 | |||||||||||||||
| Ratio of overseas sales to consolidated sales |
36.9 | % | 8.2 | % | 14.4 | % | 18.3 | % | 77.8 | % | ||||||||||
| For the second quarter ended September 30, 2016: | ||||||||||
| Yen in millions | ||||||||||||||||||||
| North America | Europe | Asia | Other | Total | ||||||||||||||||
| Overseas sales |
2,303,290 | 519,262 | 1,014,710 | 969,384 | 4,806,646 | |||||||||||||||
| Consolidated sales |
— | — | — | — | 6,481,420 | |||||||||||||||
| Ratio of overseas sales to consolidated sales |
35.5 | % | 8.0 | % | 15.7 | % | 15.0 | % | 74.2 | % | ||||||||||
“Other” consists of Central and South America, Oceania, Africa and the Middle East, etc.
22
TOYOTA MOTOR CORPORATION
Notes to Unaudited Consolidated Financial Statements
| 7. | Per share amounts: |
Reconciliations of the differences between basic and diluted net income attributable to Toyota Motor Corporation per common share for the first half and the second quarter ended September 30, 2015 and 2016 are as follows:
| Yen in millions |
Thousands of shares |
Yen | ||||||||||
| Net income attributable to Toyota Motor Corporation |
Weighted- average common shares |
Net income attributable to Toyota Motor Corporation per common share |
||||||||||
| For the first half ended September 30, 2015 |
||||||||||||
| Net income attributable to Toyota Motor Corporation |
1,258,112 | |||||||||||
| Accretion to Mezzanine equity |
(1,235 | ) | ||||||||||
| Dividends to Toyota Motor Corporation Model AA Class Shareholders |
(1,225 | ) | ||||||||||
|
|
|
|
|
|
|
|||||||
| Basic net income attributable to Toyota Motor Corporation per common share |
1,255,652 | 3,143,912 | 399.39 | |||||||||
| Effect of dilutive securities |
||||||||||||
| Model AA Class Shares |
2,460 | 17,759 | ||||||||||
| Assumed exercise of dilutive stock options |
(16 | ) | 1,384 | |||||||||
|
|
|
|
|
|
|
|||||||
| Diluted net income attributable to Toyota Motor Corporation per common share |
1,258,096 | 3,163,055 | 397.75 | |||||||||
|
|
|
|
|
|
|
|||||||
| For the first half ended September 30, 2016 |
||||||||||||
| Net income attributable to Toyota Motor Corporation |
946,173 | |||||||||||
| Accretion to Mezzanine equity |
(2,425 | ) | ||||||||||
| Dividends to Toyota Motor Corporation Model AA Class Shareholders |
(2,473 | ) | ||||||||||
|
|
|
|
|
|
|
|||||||
| Basic net income attributable to Toyota Motor Corporation per common share |
941,275 | 3,025,876 | 311.08 | |||||||||
| Effect of dilutive securities |
||||||||||||
| Model AA Class Shares |
4,898 | 47,100 | ||||||||||
| Assumed exercise of dilutive stock options |
(4 | ) | 636 | |||||||||
|
|
|
|
|
|
|
|||||||
| Diluted net income attributable to Toyota Motor Corporation per common share |
946,169 | 3,073,612 | 307.84 | |||||||||
|
|
|
|
|
|
|
|||||||
23
TOYOTA MOTOR CORPORATION
Notes to Unaudited Consolidated Financial Statements
| Yen in millions |
Thousands of shares |
Yen | ||||||||||
| Net income attributable to Toyota Motor Corporation |
Weighted- average common shares |
Net income attributable to Toyota Motor Corporation per common share |
||||||||||
| For the second quarter ended September 30, 2015 |
||||||||||||
| Net income attributable to Toyota Motor Corporation |
611,718 | |||||||||||
| Accretion to Mezzanine equity |
(1,235 | ) | ||||||||||
| Dividends to Toyota Motor Corporation Model AA Class Shareholders |
(1,225 | ) | ||||||||||
|
|
|
|
|
|
|
|||||||
| Basic net income attributable to Toyota Motor Corporation per common share |
609,258 | 3,140,962 | 193.97 | |||||||||
| Effect of dilutive securities |
||||||||||||
| Model AA Class Shares |
2,460 | 35,325 | ||||||||||
| Assumed exercise of dilutive stock options |
(6 | ) | 1,244 | |||||||||
|
|
|
|
|
|
|
|||||||
| Diluted net income attributable to Toyota Motor Corporation per common share |
611,712 | 3,177,531 | 192.51 | |||||||||
|
|
|
|
|
|
|
|||||||
| For the second quarter ended September 30, 2016 |
||||||||||||
| Net income attributable to Toyota Motor Corporation |
393,708 | |||||||||||
| Accretion to Mezzanine equity |
(1,212 | ) | ||||||||||
| Dividends to Toyota Motor Corporation Model AA Class Shareholders |
(1,237 | ) | ||||||||||
|
|
|
|
|
|
|
|||||||
| Basic net income attributable to Toyota Motor Corporation per common share |
391,259 | 3,015,060 | 129.77 | |||||||||
| Effect of dilutive securities |
||||||||||||
| Model AA Class Shares |
2,449 | 47,100 | ||||||||||
| Assumed exercise of dilutive stock options |
(2 | ) | 634 | |||||||||
|
|
|
|
|
|
|
|||||||
| Diluted net income attributable to Toyota Motor Corporation per common share |
393,706 | 3,062,794 | 128.54 | |||||||||
|
|
|
|
|
|
|
|||||||
On May 11, 2016, the Board of Directors of the parent company resolved to distribute year-end cash dividends of ¥334,144 million, ¥110 per common share, to common shareholders effective on June 2, 2016. On November 8, 2016, the Board of Directors of the parent company resolved to distribute interim cash dividends of ¥300,331 million, ¥100 per common share, to common shareholders effective on November 29, 2016.
24
TOYOTA MOTOR CORPORATION
Notes to Unaudited Consolidated Financial Statements
| 8. | Fair value measurements: |
In accordance with U.S.GAAP, Toyota classifies fair value into three levels of input as follows which are used to measure it.
| Level 1: | Quoted prices in active markets for identical assets or liabilities | |
| Level 2: | Quoted prices for similar assets or liabilities in active markets; quoted prices for identical or similar assets or liabilities in markets that are not active; valuation of assets or liabilities using inputs, other than quoted prices, that are observable | |
| Level 3: |
Valuation of assets or liabilities using unobservable inputs which reflect the reporting entity’s assumptions | |
The following table summarizes the fair values of the assets and liabilities measured at fair value on a recurring basis as of March 31, 2016 and September 30, 2016. Transfers between levels of the fair value are recognized at the end of their respective reporting periods:
| Yen in millions | ||||||||||||||||
| March 31, 2016 | ||||||||||||||||
| Level 1 | Level 2 | Level 3 | Total | |||||||||||||
| Assets |
||||||||||||||||
| Cash equivalents |
100,841 | 915,684 | — | 1,016,525 | ||||||||||||
| Time deposits |
— | 600,000 | — | 600,000 | ||||||||||||
| Marketable securities and other securities investments |
||||||||||||||||
| Public and corporate bonds |
4,911,769 | 1,029,478 | 10,334 | 5,951,581 | ||||||||||||
| Common stocks |
2,558,931 | — | — | 2,558,931 | ||||||||||||
| Other |
83,082 | 68,185 | — | 151,267 | ||||||||||||
| Investments measured at net asset value |
— | — | — | 197,215 | ||||||||||||
| Derivative financial instruments |
— | 362,388 | 4,423 | 366,811 | ||||||||||||
|
|
|
|
|
|
|
|
|
|||||||||
| Total |
7,654,623 | 2,975,735 | 14,757 | 10,842,330 | ||||||||||||
|
|
|
|
|
|
|
|
|
|||||||||
| Liabilities |
||||||||||||||||
| Derivative financial instruments |
— | (242,713 | ) | (1,574 | ) | (244,287 | ) | |||||||||
|
|
|
|
|
|
|
|
|
|||||||||
| Total |
— | (242,713 | ) | (1,574 | ) | (244,287 | ) | |||||||||
|
|
|
|
|
|
|
|
|
|||||||||
25
TOYOTA MOTOR CORPORATION
Notes to Unaudited Consolidated Financial Statements
| Yen in millions | ||||||||||||||||
| September 30, 2016 | ||||||||||||||||
| Level 1 | Level 2 | Level 3 | Total | |||||||||||||
| Assets |
||||||||||||||||
| Cash equivalents |
27,197 | 911,320 | — | 938,517 | ||||||||||||
| Time deposits |
— | 600,000 | — | 600,000 | ||||||||||||
| Marketable securities and other securities investments |
||||||||||||||||
| Public and corporate bonds |
4,722,401 | 933,768 | 8,603 | 5,664,772 | ||||||||||||
| Common stocks |
2,510,915 | — | — | 2,510,915 | ||||||||||||
| Other |
77,538 | 40,774 | — | 118,312 | ||||||||||||
| Investments measured at net asset value |
— | — | — | 470,544 | ||||||||||||
| Derivative financial instruments |
— | 290,148 | 3,404 | 293,552 | ||||||||||||
|
|
|
|
|
|
|
|
|
|||||||||
| Total |
7,338,051 | 2,776,010 | 12,007 | 10,596,612 | ||||||||||||
|
|
|
|
|
|
|
|
|
|||||||||
| Liabilities |
||||||||||||||||
| Derivative financial instruments |
— | (189,657 | ) | (4,920 | ) | (194,577 | ) | |||||||||
|
|
|
|
|
|
|
|
|
|||||||||
| Total |
— | (189,657 | ) | (4,920 | ) | (194,577 | ) | |||||||||
|
|
|
|
|
|
|
|
|
|||||||||
Certain investments that are measured at fair value using the net asset value per share (or its equivalent) practical expedient have not been classified in the fair value hierarchy.
The following is description of the assets and liabilities measured at fair value, information about the valuation techniques used to measure fair value, key inputs and significant assumptions:
Cash equivalents and time deposits -
Cash equivalents include money market funds and other investments with original maturities of three months or less. Cash equivalents classified in Level 2 include negotiable certificates of deposit with original maturities of three months or less. These are measured at fair value using primarily observable interest rates in the market. Time deposits consist of negotiable certificates of deposit with original maturities over three months. These are measured at fair value using primarily observable interest rates in the market.
Marketable securities and other securities investments -
Marketable securities and other securities investments include public and corporate bonds, common stocks and other investments. Public and corporate bonds include government bonds and represent 37% of Japanese bonds, and 63% of U.S., European and other bonds as of March 31, 2016, and 34% of Japanese bonds, and 66% of U.S., European and other bonds as of September 30, 2016. Listed stocks on the Japanese stock markets represent 90% and 90% of common stocks as of March 31, 2016 and September 30, 2016, respectively. Toyota uses primarily quoted market prices for identical assets to measure fair value of these securities. “Other” includes investment trusts. Generally, Toyota uses quoted market prices for similar assets or quoted non-active market prices for identical assets to measure fair value of these securities. These assets are classified in Level 2.
26
TOYOTA MOTOR CORPORATION
Notes to Unaudited Consolidated Financial Statements
Derivative financial instruments -
See note 4 to the consolidated financial statements about derivative financial instruments. Toyota primarily estimates the fair value of derivative financial instruments using industry-standard valuation models that require observable inputs including interest rates and foreign exchange rates, and the contractual terms. The usage of these models does not require significant judgment to be applied. These derivative financial instruments are classified in Level 2. In other certain cases when market data is not available, key inputs to the fair value measurement include quotes from counterparties, and other market data. Toyota assesses the reasonableness of changes of the quotes using observable market data. These derivative financial instruments are classified in Level 3. Toyota’s derivative fair value measurements consider assumptions about counterparty and Toyota’s own non-performance risk, using such as credit default probabilities.
The changes in Level 3 assets and liabilities measured at fair value on a recurring basis for the first half and second quarter ended September 30, 2015 and 2016 were not material.
Certain assets and liabilities are measured at fair value on a nonrecurring basis. The assets and liabilities measured at fair value on a nonrecurring basis for the first half and second quarter ended September 30, 2015 and 2016 were not material.
27
TOYOTA MOTOR CORPORATION
Notes to Unaudited Consolidated Financial Statements
| 9. | Accumulated other comprehensive income: |
Changes in accumulated other comprehensive income (loss) are as follows:
| Yen in millions | ||||||||||||||||
| Foreign currency translation adjustments |
Unrealized gains (losses) on securities |
Pension liability adjustments |
Accumulated other comprehensive income (loss) |
|||||||||||||
| For the first half ended September 30, 2015 |
||||||||||||||||
| Balance at March 31, 2015 |
(136,090 | ) | 1,727,565 | (113,930 | ) | 1,477,545 | ||||||||||
| Other comprehensive income (loss) before reclassifications |
(142,295 | ) | (242,828 | ) | (3,160 | ) | (388,283 | ) | ||||||||
| Reclassifications |
— | (9,754 | ) | 2,625 | (7,129 | ) | ||||||||||
|
|
|
|
|
|
|
|
|
|||||||||
| Other comprehensive income (loss), net of tax |
(142,295 | ) | (252,582 | ) | (535 | ) | (395,412 | ) | ||||||||
| Less – Other comprehensive income attributable to noncontrolling interests |
25,047 | 5,248 | 442 | 30,737 | ||||||||||||
|
|
|
|
|
|
|
|
|
|||||||||
| Balance at September 30, 2015 |
(253,338 | ) | 1,480,231 | (114,023 | ) | 1,112,870 | ||||||||||
|
|
|
|
|
|
|
|
|
|||||||||
| For the first half ended September 30, 2016 |
||||||||||||||||
| Balance at March 31, 2016 |
(499,055 | ) | 1,424,945 | (315,122 | ) | 610,768 | ||||||||||
| Other comprehensive income (loss) before reclassifications |
(554,883 | ) | (189,315 | ) | (6,002 | ) | (750,200 | ) | ||||||||
| Reclassifications |
— | (2,112 | ) | 5,288 | 3,176 | |||||||||||
|
|
|
|
|
|
|
|
|
|||||||||
| Other comprehensive income (loss), net of tax |
(554,883 | ) | (191,427 | ) | (714 | ) | (747,024 | ) | ||||||||
| Less – Other comprehensive income attributable to noncontrolling interests |
33,504 | 669 | 1,291 | 35,464 | ||||||||||||
| Equity transaction with noncontrolling interests and other |
(8,626 | ) | 9,060 | (2,660 | ) | (2,226 | ) | |||||||||
|
|
|
|
|
|
|
|
|
|||||||||
| Balance at September 30, 2016 |
(1,029,060 | ) | 1,243,247 | (317,205 | ) | (103,018 | ) | |||||||||
|
|
|
|
|
|
|
|
|
|||||||||
28
TOYOTA MOTOR CORPORATION
Notes to Unaudited Consolidated Financial Statements
Reclassifications consist of the following:
| Yen in millions | ||||||||||
| For the first half ended September 30, 2015 |
For the first half ended September 30, 2016 |
Affected line
items | ||||||||
| Unrealized gains (losses) on securities: |
||||||||||
| 1,221 | (8,717 | ) | Financing operations | |||||||
| (13,966 | ) | 198 | Foreign exchange gain (loss), net | |||||||
| (1,440 | ) | 4,096 | Other income (loss), net | |||||||
|
|
|
|
|
|||||||
| (14,185 | ) | (4,423 | ) | Income before income taxes and equity in earnings of affiliated companies | ||||||
| 4,431 | 2,444 | Provision for income taxes | ||||||||
| (0 | ) | (133 | ) | Equity in earnings of affiliated companies | ||||||
|
|
|
|
|
|||||||
| (9,754 | ) | (2,112 | ) | Net income | ||||||
|
|
|
|
|
|||||||
| Pension liability adjustments: |
||||||||||
| Recognized net actuarial loss |
6,325 | 9,888 | *1 | |||||||
| Amortization of prior service costs |
(2,114 | ) | (1,897 | ) | *1 | |||||
|
|
|
|
|
|||||||
| 4,211 | 7,991 | Income before income taxes and equity in earnings of affiliated companies | ||||||||
| (1,586 | ) | (2,703 | ) | Provision for income taxes | ||||||
|
|
|
|
|
|||||||
| 2,625 | 5,288 | Net income | ||||||||
|
|
|
|
|
|||||||
| Total reclassifications, net of tax |
(7,129 | ) | 3,176 | |||||||
|
|
|
|
|
|||||||
Amounts of reclassifications in parentheses indicate gains in the consolidated statements of income.
| *1: | These components are included in the computation of net periodic pension cost. |
29
TOYOTA MOTOR CORPORATION
Notes to Unaudited Consolidated Financial Statements
| 10. | Significant subsequent events: |
Repurchase of shares -
At the Meeting of the Board of Directors held on November 8, 2016, TMC resolved to repurchase its common shares pursuant to Article 156 of the Companies Act of Japan (the “Companies Act”) as applied to Article 165, Paragraph 3 of the Companies Act, as set forth below.
Reason for repurchasing shares
To return capital to shareholders in addition to promoting capital efficiency and agile capital policy in view of the business environment.
Details of matters relating to repurchase
| Kind of stock to be repurchased |
Common stock of TMC | |
| Number of shares to be repurchased |
40,000,000 shares (maximum) | |
| Total purchase price for repurchase of shares |
¥200,000 million (maximum) | |
| Method of acquisition |
Market purchase through a trust bank | |
| Period of repurchase |
From November 15, 2016 to February 14, 2017 |
Retirement of treasury stock -
At the Meeting of the Board of Directors held on November 8, 2016, TMC resolved to retire its treasury stock pursuant to Article 178 of the Companies Act.
Reason for retiring treasury stock
To relieve concerns regarding the dilution of TMC’s share value due to disposition of treasury stock in the future.
Details of matters relating to retirement
| Kind of stock to be retired |
Common stock of TMC | |
| Number of shares to be retired |
75,000,000 shares | |
| Scheduled date of retirement |
November 30, 2016 |
30
(Excerpt Translation)
November 18, 2016
Toyota Motor Corporation
1, Toyota-cho, Toyota City, Aichi Prefecture
Report on Number of Listed Shares
We hereby report changes in the number of listed securities, as a result of the exercise of stock acquisition rights, etc. in October 2016 (the “Current Month”).
| 1. | Summary |
| Number of listed shares as of the end of the preceding month |
3,337,997,492 shares | |||
| Total number of shares changed during the Current Month |
0 shares | |||
| (out of which, as a result of exercise of stock acquisition rights) |
(0 shares | ) | ||
| (out of which, as a result of other reasons) |
(0 shares | ) | ||
| Number of listed shares as of the end of the Current Month |
3,337,997,492 shares |
| 2. | Stock acquisition rights exercised |
<Details of shares delivered (issued or transferred) upon exercise of stock acquisition rights>
| (1) | Number of shares |
| Total number of shares delivered during the Current Month |
(out of which, number
of newly issued shares) |
(out of which, number of shares transferred from treasury shares) |
||||||||||
| 8th series |
3,000 shares | (0 shares | ) | (3,000 shares | ) | |||||||
| 9th series |
5,800 shares | (0 shares | ) | (5,800 shares | ) | |||||||
| (2) | Exercise price |
| Aggregate exercise
price during the Current Month |
(out of which,
aggregate amount of newly issued shares) |
(out of which, aggregate amount of shares transferred from treasury shares) |
||||||||||
| 8th series |
JPY 12,462,000 | (JPY 0 | ) | (JPY 12,462,000 | ) | |||||||
| 9th series |
JPY 18,287,400 | (JPY 0 | ) | (JPY 18,287,400 | ) | |||||||

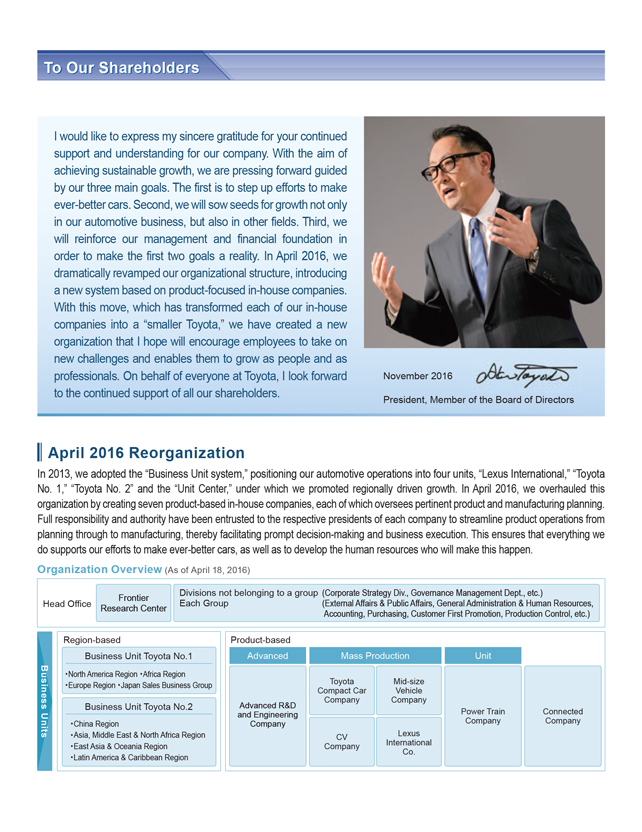


|
|
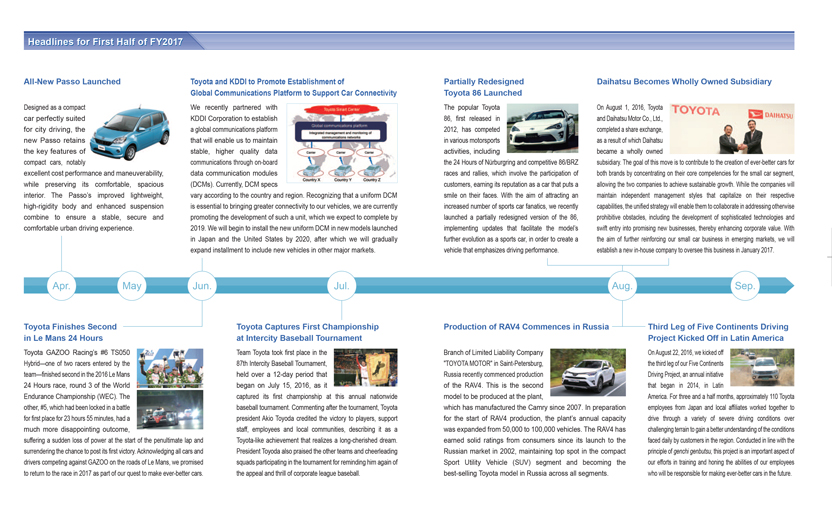
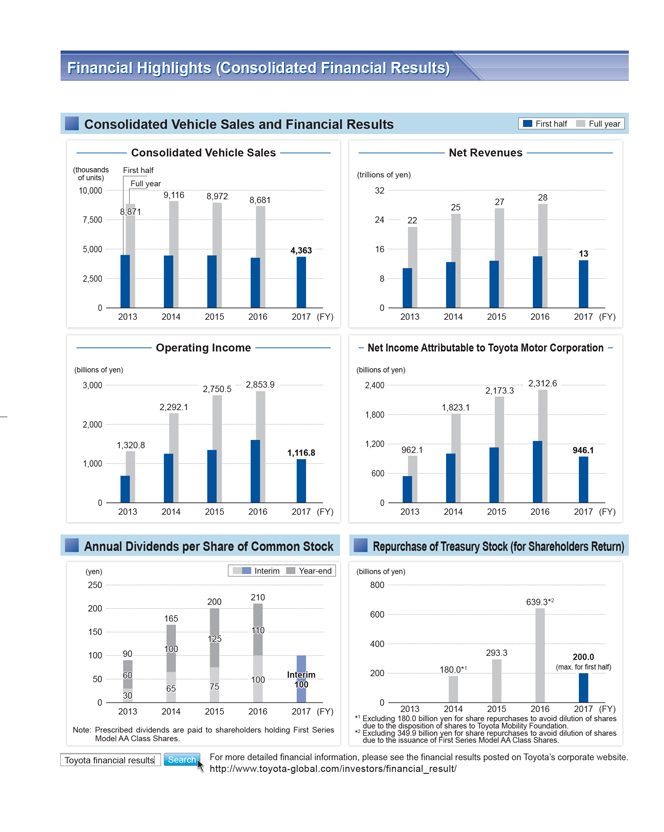
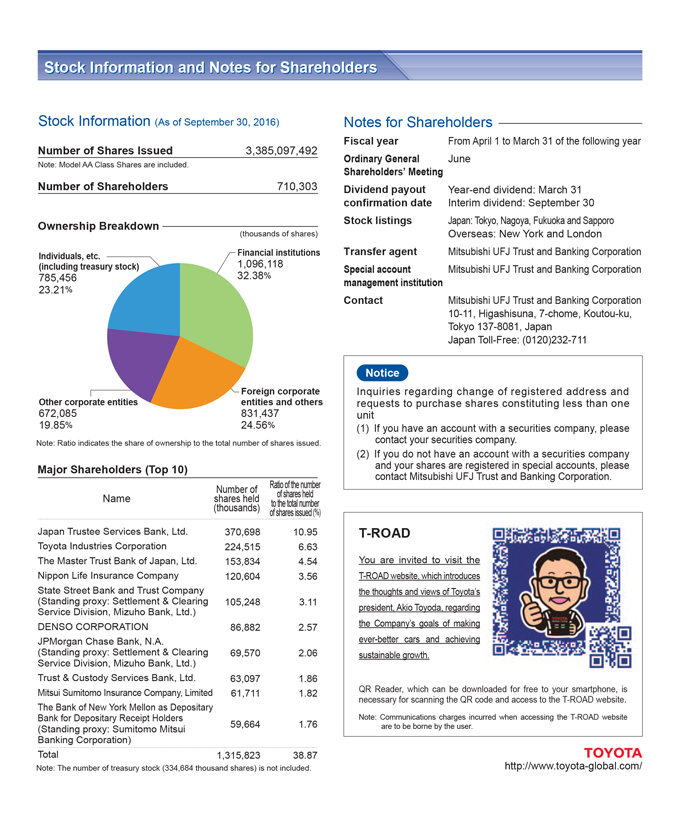
Serious News for Serious Traders! Try StreetInsider.com Premium Free!
You May Also Be Interested In
- Toyota Motor (TM) Announces Additional $1.4B US Investment
- ADSK INVESTOR ALERT: ROSEN, TOP RANKED INVESTOR COUNSEL, Encourages Autodesk, Inc. Investors to Secure Counsel Before Important Deadline in Securities Class Action First Filed by the Firm – ADSK
- Legendary Performance, Modern Power: 2024 Toyota Tacoma with i-FORCE MAX
Create E-mail Alert Related Categories
SEC FilingsSign up for StreetInsider Free!
Receive full access to all new and archived articles, unlimited portfolio tracking, e-mail alerts, custom newswires and RSS feeds - and more!
