Form 8-K KCG Holdings, Inc. For: Oct 20
UNITED STATES
SECURITIES AND EXCHANGE COMMISSION
Washington, D.C. 20549
FORM 8-K
CURRENT REPORT
Pursuant to Section 13 or 15(d)
of the Securities Exchange Act of 1934
Date of Report (Date of earliest event reported): October 20, 2016
KCG HOLDINGS, INC.
(Exact name of registrant as specified in its charter)
| DELAWARE | 000-54991 | 38-3898306 | ||
| (State or other jurisdiction of incorporation) |
(Commission File Number) |
(IRS Employer Identification No.) |
545 Washington Boulevard, Jersey City, NJ 07310
(Address of principal executive offices) (Zip Code)
(201) 222-9400
(Registrant’s telephone number, including area code)
Check the appropriate box below if the Form 8-K filing is intended to simultaneously satisfy the filing obligation of the registrant under any of the following provisions (see General Instruction A.2. below):
| ☐ | Written communications pursuant to Rule 425 under the Securities Act (17 CFR 230.425) |
| ☐ | Soliciting material pursuant to Rule 14a-12 under the Exchange Act (17 CFR 240.14a-12) |
| ☐ | Pre-commencement communications pursuant to Rule 14d-2(b) under the Exchange Act (17 CFR 240.14d-2(b)) |
| ☐ | Pre-commencement communications pursuant to Rule 13e-4(c) under the Exchange Act (17 CFR 240.13e-4(c)) |
| Item 2.02 | Results of Operation and Financial Condition |
See Item 9.01
| Item 7.01 | Regulation FD Disclosure |
The following information is furnished under Item 2.02, “Results of Operations and Financial Condition”, Item 7.01, “Regulation FD Disclosure”, and Item 9.01 “Financial Statements and Exhibits.” This information, including Exhibits 99.1 and 99.2, shall not be deemed “filed” for purposes of Section 18 of the Securities Exchange Act of 1934, as amended (the “Exchange Act”), or incorporated by reference in any filing under the Securities Act of 1933, as amended, or the Exchange Act, except as shall be expressly set forth by specific reference in such a filing.
On October 20, 2016, KCG Holdings, Inc. (the “Company” or “KCG”) issued a press release announcing its earnings for the third quarter of 2016. The press release did not include certain financial statements, related footnotes and certain other financial information relating to the Company that will be filed with the Securities and Exchange Commission as part of the Company’s Quarterly Report on Form 10-Q. A copy of the press release is attached hereto as Exhibit 99.1. Executives from KCG will review the earnings via teleconference and live audio webcast at 9:00 a.m. Eastern time on October 20, 2016. A copy of a visual presentation that will be a part of that review is attached as Exhibit 99.2. Exhibits 99.1 and 99.2 are incorporated by reference into this Current Report on Form 8-K.
| Item 9.01 | Financial Statements and Exhibits |
| (a) | Financial Statements of Businesses Acquired |
Not Applicable
| (b) | Pro Forma Financial Information |
Not Applicable
| (c) | Shell Company Transactions |
Not Applicable
| (d) | Exhibits |
Exhibit 99.1 – Press Release of KCG Holdings, Inc., issued on October 20, 2016.
Exhibit 99.2 – KCG Holdings, Inc. Earnings Presentation, dated October 20, 2016.
SIGNATURE
Pursuant to the requirements of the Securities Exchange Act of 1934, the Registrant has duly caused this report to be signed on its behalf by the undersigned’s duly authorized signatory.
Dated: October 20, 2016
| KCG HOLDINGS, INC. | ||
| By: | /s/ John McCarthy | |
| Name: | John McCarthy | |
| Title: | General Counsel | |
EXHIBIT INDEX
| Exhibit |
Description | |
| 99.1 | Press Release of KCG Holdings, Inc., issued on October 20, 2016. | |
| 99.2 | KCG Holdings, Inc. Earnings Presentation, dated October 20, 2016. | |
Exhibit 99.1
KCG ANNOUNCES CONSOLIDATED LOSS OF $0.13 PER SHARE
FOR THE THIRD QUARTER OF 2016
JERSEY CITY, New Jersey – October 20, 2016 – KCG Holdings, Inc. (NYSE: KCG) today reported a consolidated loss of $11.2 million, or $0.13 per share, for the third quarter of 2016. The third quarter consolidated loss includes an income tax benefit of approximately $6.1 million or $0.07 per share primarily related to tax deductions and credits generated from the company’s software development activities.
Select Financial Results
| ($ in thousands, except EPS) | ||||||||||||
| 3Q16 | 2Q16 | 3Q15 | ||||||||||
| Total Revenues |
208,532 | 319,914 | 377,036 | |||||||||
| Trading revenues, net |
113,829 | 186,882 | 277,677 | |||||||||
| Commissions and fees |
87,842 | 94,961 | 95,027 | |||||||||
| Net Revenues(1) |
111,999 | 190,076 | 283,796 | |||||||||
| Pre-tax (loss) earnings |
(27,974 | ) | 54,565 | 35,419 | ||||||||
| EPS |
(0.13 | ) | 0.38 | 0.24 | ||||||||
| (1) | See Exhibit 4 for a reconciliation of Total revenues to Net revenues. Net revenues is a non-GAAP measure the company uses to measure its performance as well as make certain strategic decisions. |
Third Quarter Highlights
| • | Averaged approximately 30 percent market share of retail SEC Rule 605 U.S. equity share volume among the leading market makers during the quarter |
| • | Averaged approximately 16 percent market share of U.S. ETF share volume from market making and agency-based trading activity during the quarter |
| • | Completed the migration of KCG MatchIt to a new matching engine |
| • | Acquired Neonet Securities AB, an independent agency broker and execution specialist based in Stockholm, Sweden |
| • | Named Mike Blum Chief Technology Officer effective October 1, 2016 |
Daniel Coleman, Chief Executive Officer of KCG, said, “Market activity quickly died down after a brief post-Brexit flurry to close the second quarter and remained subdued throughout July and August with cautious trading and realized volatility near all-time lows. Despite a modest pickup in September, the trading environment proved challenging for our quantitative trading models. Although KCG’s financial results for the quarter were disappointing, we nonetheless posted strong market share in core segments of the market. In addition, we completed the acquisition of Neonet, which expands KCG’s agency-based electronic trading in Europe ahead of anticipated opportunities from regulatory changes with the implementation of MiFID II.”
Market Making
The Market Making segment encompasses direct-to-client and non-client, exchange-based market making across multiple asset classes and is an active participant in all major cash, options and futures markets in the U.S., Europe and Asia. During the third quarter of 2016, the segment generated total revenues of $136.1 million and a pre-tax loss of $13.8 million.
In the third quarter of 2016, market volumes, realized volatility and bid-ask spreads in U.S. equities contracted due in part to the uncertain outlook. During the quarter, consolidated U.S. equity dollar volume declined 15 percent year over year. Amid intensified competition for retail order flow, KCG Market Making grew market share of retail U.S. equity share volume to approximately 30 percent. Market volumes outside U.S. equities were generally flat to down year over year, led by declines in European equities and currencies.
Mr. Coleman commented, “The unusually low volatility and generally poor market conditions combined with renewed competition for retail order flow negatively impacted the contribution from U.S. equities for the quarter. KCG market making underperformed as reflected in the average revenue capture per U.S. equity dollar value traded for the quarter. Market making outside U.S. equities faced similarly difficult conditions. As we build scale in select asset classes and regions, and market conditions generally improve, we expect contributions outside U.S. equities to become more significant to the segment revenues.”
In the second quarter of 2016, the segment generated total revenues of $211.8 million and pre-tax income of $40.5 million.
In the third quarter of 2015, the segment generated total revenues of $299.8 million and pre-tax income of $85.4 million, which includes expenses related to asset writedowns of $4.4 million.
Select Trade Statistics: U.S. Equity Market Making
| 3Q16 | 2Q16 | 3Q15 | ||||||||||
| Average daily dollar volume traded ($ millions) |
26,352 | 26,046 | 31,517 | |||||||||
| Average daily trades (thousands) |
3,288 | 3,577 | 4,025 | |||||||||
| Average daily shares traded (millions) |
3,768 | 4,680 | 4,823 | |||||||||
| NYSE and NASDAQ shares traded |
949 | 972 | 985 | |||||||||
| OTC Bulletin Board and OTC Market shares traded |
2,820 | 3,708 | 3,838 | |||||||||
| Average revenue capture per U.S. equity dollar value traded (bps) |
0.67 | 1.07 | 1.27 | |||||||||
Global Execution Services
The Global Execution Services segment comprises agency execution services and trading venues. During the third quarter of 2016, the segment generated total revenues of $63.7 million and a pre-tax loss of $0.4 million.
In the third quarter of 2016, institutional trading activity was predominantly defensive given the historic market valuations, negative outlook for corporate earnings and potential for disruptive market events. Outflows from U.S. equity mutual funds increased for the second straight quarter and redemption pressures on U.S. equity hedge funds continued from the first half of the year. Amid a 10 percent decline in consolidated U.S. equity share volume for the quarter compared to a year ago, KCG Algorithmic Trading grew U.S. equity share volume from the 25 largest U.S. asset managers by five percent. KCG BondPoint grew fixed income par value traded more than 50 percent year over year.
Mr. Coleman commented, “The results for agency trading during the quarter generally follow the declines in market volumes of U.S. equities and ETFs. Nonetheless, KCG Algorithmic Trading and KCG BondPoint made further inroads with the leading asset managers and retail brokers, respectively. As firms elevate best execution as a fiduciary in trading decisions, I believe we will become an even more important service provider to our clients.”
In the second quarter of 2016, the segment generated total revenues of $68.1 million and pre-tax income of $1.7 million.
In the third quarter of 2015, the segment generated total revenues of $69.7 million and a pre-tax loss of $1.1 million.
Select Trade Statistics: Agency Execution and Trading Venues
| 3Q16 | 2Q16 | 3Q15 | ||||||||||
| Average daily KCG Institutional Equities U.S. equities shares traded |
206.4 | 217.5 | 236.3 | |||||||||
| Average daily KCG BondPoint fixed income par value traded ($ millions) |
201.5 | 203.3 | 130.5 | |||||||||
| (1) | KCG Institutional Equities average daily U.S. National Market System (NMS) equity share volume represents trading on behalf of clients covering algorithmic trading and high touch sales trading in single stocks, ETFs and programs. In 2016, KCG modified the reporting of trading volumes within the Global Execution Services segment to remove internal volume generated by KCG trading desks and add volume from sales trading. Prior periods have been recast for this new presentation. |
Corporate and Other
The Corporate and Other segment includes strategic investments and corporate overhead expenses. During the third quarter of 2016, the segment generated total revenues of $8.7 million and a pre-tax loss of $13.8 million.
In the second quarter of 2016, the segment generated total revenues of $40.0 million and pre-tax income of $12.4 million. Included in these results is a gain of $33.4 million from the sale of a portion of the company’s investment in Bats Global Markets, Inc. (“Bats”). Following the sale, KCG retained a 13.7 percent ownership stake in Bats.
In the third quarter of 2015, the segment generated total revenues of $7.6 million and a pre-tax loss of $49.0 million, which included a writedown of assets and other real estate related charges of $29.7 million.
Financial Condition
As of September 30, 2016, KCG had $505.5 million in cash and cash equivalents and total outstanding debt of $453.5 million. KCG had $1.44 billion in stockholders’ equity, equivalent to a book value of $16.70 per share and tangible book value, which includes the value of its assets of businesses held for sale, of $15.54 per share based on total shares outstanding of 86.2 million, including restricted stock units.
During the third quarter of 2016, KCG repurchased warrants for $0.7 million.
KCG’s headcount was 981 full-time employees at September 30, 2016, including 51 employees from the acquisition of Neonet Securities AB, compared to 942 at June 30, 2016.
Other Events
On September 26, 2016, CBOE Holdings, Inc. (“CBOE”) and Bats announced that they had entered into a definitive merger agreement pursuant to which CBOE would acquire Bats. As of September 30, 2016, KCG held approximately 13.2 million shares of Bats Common Stock or approximately 13.7 percent of total Bats Common Stock outstanding (including the Bats non-voting common stock) based on the shares outstanding as of July 31, 2016, as reported by Bats in its Quarterly Report on Form 10-Q for the quarter ended June 30, 2016. In connection with its sale of shares in the IPO, KCG agreed to a lock-up agreement that restricts KCG’s ability to
transfer shares of Bats Common Stock for a period of time following the IPO. Pursuant to the terms of the lock-up agreement, approximately 4.4 million shares of Bats Common Stock held by KCG have been released from the lock-up. If the merger between CBOE and Bats is completed, the lock-up agreement will terminate and any shares of CBOE common stock that KCG receives in the transaction will be freely transferable.
Conference Call
KCG will hold a conference call to discuss third quarter 2016 financial results starting at 9:00 a.m. Eastern Time today, October 20, 2016. To access the call, dial 888-596-2581 (domestic) or 913-312-0728 (international) and enter passcode 7871836. In addition, the call will be webcast at http://edge.media-server.com/m/p/k72g28av. Following the conclusion of the call, a replay will be available by selecting a number based on country of origin from a list posted at: https://replaynumbers.conferencinghub.com/index.aspx?confid=3402400&passcode=3402400 and entering passcode 7871836.
Additional information for investors, including a presentation of the third quarter financial results, can be found at http://investors.kcg.com.
About KCG
KCG is a leading independent securities firm offering investors a range of services designed to address trading needs across asset classes, product types and time zones. The firm combines advanced technology with specialized client service across market making, agency execution and venues and also engages in principal trading via exchange-based market making. KCG has multiple access points to trade global equities, fixed income, options, currencies and commodities via voice or automated execution. www.kcg.com
Certain statements contained herein and the documents incorporated by reference containing the words “believes,” “intends,” “expects,” “anticipates,” and words of similar meaning, may constitute forward-looking statements as defined in the Private Securities Litigation Reform Act of 1995. These “forward-looking statements” are not historical facts and are based on current expectations, estimates and projections about KCG’s industry, management’s beliefs and certain assumptions made by management, many of which, by their nature, are inherently uncertain and beyond our control. Any forward-looking statement contained herein speaks only as of the date on which it is made. Accordingly, readers are cautioned that any such forward-looking statements are not guarantees of future performance and are subject to certain risks, uncertainties and assumptions that are difficult to predict including, without limitation, risks associated with: (i) the inability to manage trading strategy performance and grow revenue and earnings; (ii) the receipt of additional payments from the sale of KCG Hotspot that are subject to certain contingencies; (iii) changes in market structure, legislative, regulatory or financial reporting rules, including the increased focus by Congress, federal and state regulators, the SROs and the media on market structure issues, and in particular, the scrutiny of high frequency trading, alternative trading systems, market fragmentation, colocation, access to market data feeds, and remuneration arrangements such as payment for order flow and exchange fee structures; (iv) past or future changes to KCG’s organizational structure and management; (v) KCG’s ability to develop competitive new products and services in a timely manner and the acceptance of such products and services by KCG’s customers and potential customers; (vi) KCG’s ability to keep up with technological changes; (vii) KCG’s ability to effectively identify and manage market risk, operational and technology risk, cybersecurity risk, legal risk, liquidity risk, reputational risk, counterparty and credit risk, international risk, regulatory risk, and compliance risk; (viii) the cost and other effects of material contingencies, including litigation contingencies, and any adverse judicial, administrative or arbitral rulings or proceedings; (ix) the effects of increased competition and KCG’s ability to maintain and expand market share; (x) the announced plan to relocate KCG’s global headquarters from Jersey City, NJ to New York, NY; and (xi) KCG’s ability to complete the sale or disposition of any or all of the assets or businesses that are classified as held for sale. The list above is not exhaustive. Because forward looking statements involve risks and uncertainties, the actual results and performance of KCG may materially differ from the results expressed or implied by such statements. Given these uncertainties, readers are cautioned not to place undue reliance on such forward-looking statements. Unless otherwise required by law, KCG also disclaims any obligation to update its view of any such risks or uncertainties or to announce publicly the result of any revisions to the forward-looking statements made herein. Readers should carefully review the risks and uncertainties disclosed in KCG’s reports with the U.S. Securities and Exchange Commission (“SEC”), including those detailed in “Risk Factors” in Part I, Item 1A of KCG’s Annual Report on Form10-K for the year ended December 31, 2015, “Legal Proceedings” in Part I, Item 3, under “Certain Factors Affecting Results of Operations” in “Management’s Discussion and Analysis of Financial Condition and Results of Operations” in Part II, Item 7, in “Quantitative and Qualitative Disclosures About Market Risk” in Part II, Item 7A, and in other reports or documents KCG files with, or furnishes to, the SEC from time to time. This information should be read in conjunction with KCG’s Consolidated Financial Statements and the Notes thereto contained in its Annual Report on Form 10-K, Quarterly Report on Form 10-Q, and in other reports or documents KCG files with, or furnishes to, the SEC from time to time.
CONTACTS
| Sophie Sohn | Jonathan Mairs | |
| Communications & Marketing | Investor Relations | |
| 312-931-2299 | 201-356-1529 | |
| [email protected] | [email protected] |
| KCG HOLDINGS, INC. CONSOLIDATED STATEMENTS OF OPERATIONS (Unaudited) |
Exhibit 1 |
| For the three months ended | ||||||||||||
| September 30, 2016 | June 30, 2016 | September 30, 2015 | ||||||||||
| (In thousands, except per share amounts) | ||||||||||||
| Revenues |
||||||||||||
| Trading revenues, net |
$ | 113,829 | $ | 186,882 | $ | 277,677 | ||||||
| Commissions and fees |
87,842 | 94,961 | 95,027 | |||||||||
| Interest, net |
677 | 267 | (1,080 | ) | ||||||||
| Investment income and other, net |
6,184 | 37,804 | 5,412 | |||||||||
|
|
|
|
|
|
|
|||||||
| Total revenues |
208,532 | 319,914 | 377,036 | |||||||||
|
|
|
|
|
|
|
|||||||
| Expenses |
||||||||||||
| Employee compensation and benefits |
49,006 | 76,092 | 121,597 | |||||||||
| Execution and clearance fees |
71,995 | 73,742 | 67,502 | |||||||||
| Communications and data processing |
36,733 | 36,376 | 35,256 | |||||||||
| Depreciation and amortization |
21,876 | 22,234 | 23,813 | |||||||||
| Payments for order flow |
13,845 | 13,090 | 17,121 | |||||||||
| Collateralized financing interest |
10,693 | 9,609 | 8,617 | |||||||||
| Occupancy and equipment rentals |
9,275 | 9,829 | 7,472 | |||||||||
| Debt interest expense |
9,153 | 9,191 | 9,958 | |||||||||
| Professional fees |
4,139 | 5,301 | 4,406 | |||||||||
| Business development |
994 | 1,960 | 1,846 | |||||||||
| Writedown of assets and other real estate related charges |
— | — | 34,029 | |||||||||
| Other |
8,797 | 7,925 | 10,000 | |||||||||
|
|
|
|
|
|
|
|||||||
| Total expenses |
236,506 | 265,349 | 341,617 | |||||||||
|
|
|
|
|
|
|
|||||||
| (Loss) income before income taxes |
(27,974 | ) | 54,565 | 35,419 | ||||||||
| Income tax (benefit) expense |
(16,760 | ) | 21,011 | 13,482 | ||||||||
|
|
|
|
|
|
|
|||||||
| Net (loss) income |
$ | (11,214 | ) | $ | 33,554 | $ | 21,937 | |||||
|
|
|
|
|
|
|
|||||||
| Basic (loss) earnings per share |
$ | (0.13 | ) | $ | 0.39 | $ | 0.24 | |||||
|
|
|
|
|
|
|
|||||||
| Diluted (loss) earnings per share |
$ | (0.13 | ) | $ | 0.38 | $ | 0.24 | |||||
|
|
|
|
|
|
|
|||||||
| Shares used in computation of basic (loss) earnings per share |
85,009 | 86,138 | 91,134 | |||||||||
|
|
|
|
|
|
|
|||||||
| Shares used in computation of diluted (loss) earnings per share |
85,009 | 88,214 | 92,079 | |||||||||
|
|
|
|
|
|
|
|||||||
| For the nine months ended | ||||||||
| September 30, 2016 | September 30, 2015 | |||||||
| (In thousands, except per share amounts) | ||||||||
| Revenues |
||||||||
| Trading revenues, net |
$ | 524,649 | $ | 657,222 | ||||
| Commissions and fees |
288,904 | 282,358 | ||||||
| Interest, net |
1,061 | (1,699 | ) | |||||
| Investment income and other, net |
59,256 | 397,193 | ||||||
|
|
|
|
|
|||||
| Total revenues |
873,870 | 1,335,074 | ||||||
|
|
|
|
|
|||||
| Expenses |
||||||||
| Employee compensation and benefits |
222,684 | 337,786 | ||||||
| Execution and clearance fees |
219,371 | 198,573 | ||||||
| Communications and data processing |
108,766 | 103,260 | ||||||
| Depreciation and amortization |
66,015 | 65,154 | ||||||
| Payments for order flow |
39,590 | 47,277 | ||||||
| Collateralized financing interest |
29,465 | 25,932 | ||||||
| Occupancy and equipment rentals |
28,094 | 22,286 | ||||||
| Debt interest expense |
27,836 | 30,266 | ||||||
| Professional fees |
15,497 | 21,281 | ||||||
| Business development |
4,073 | 6,728 | ||||||
| Debt extinguishment charges |
— | 25,006 | ||||||
| Writedown of assets and other real estate related charges |
— | 40,488 | ||||||
| Other |
25,923 | 26,604 | ||||||
|
|
|
|
|
|||||
| Total expenses |
787,314 | 950,641 | ||||||
|
|
|
|
|
|||||
| Income before income taxes |
86,556 | 384,433 | ||||||
| Income tax expense |
27,051 | 132,357 | ||||||
|
|
|
|
|
|||||
| Net income |
$ | 59,505 | $ | 252,076 | ||||
|
|
|
|
|
|||||
| Basic earnings per share |
$ | 0.69 | $ | 2.42 | ||||
|
|
|
|
|
|||||
| Diluted earnings per share |
$ | 0.67 | $ | 2.36 | ||||
|
|
|
|
|
|||||
| Shares used in computation of basic earnings per share |
86,531 | 104,244 | ||||||
|
|
|
|
|
|||||
| Shares used in computation of diluted earnings per share |
88,481 | 106,816 | ||||||
|
|
|
|
|
|||||
| KCG HOLDINGS, INC. CONSOLIDATED STATEMENTS OF FINANCIAL CONDITION (In thousands) (Unaudited) |
Exhibit 2 |
| September 30, 2016 | December 31, 2015 | |||||||
| ASSETS |
||||||||
| Cash and cash equivalents |
$ | 505,462 | $ | 581,313 | ||||
| Cash and cash equivalents segregated under federal and other regulations |
3,000 | 3,000 | ||||||
| Financial instruments owned, at fair value: |
||||||||
| Equities |
2,641,499 | 2,129,208 | ||||||
| Debt securities |
251,264 | 136,387 | ||||||
| Listed options |
12,190 | 178,360 | ||||||
| Other financial instruments |
— | 445 | ||||||
|
|
|
|
|
|||||
| Total financial instruments owned, at fair value |
2,904,953 | 2,444,400 | ||||||
| Collateralized agreements: |
||||||||
| Securities borrowed |
1,958,095 | 1,636,284 | ||||||
| Receivable from brokers, dealers and clearing organizations |
696,495 | 681,211 | ||||||
| Fixed assets and leasehold improvements, less accumulated depreciation and amortization |
135,296 | 94,858 | ||||||
| Investments |
93,775 | 98,943 | ||||||
| Goodwill and Intangible assets, less accumulated amortization |
100,235 | 100,471 | ||||||
| Deferred tax asset, net |
151,024 | 151,225 | ||||||
| Assets of businesses held for sale |
8,194 | 25,999 | ||||||
| Other assets |
194,072 | 222,831 | ||||||
|
|
|
|
|
|||||
| Total assets |
$ | 6,750,601 | $ | 6,040,535 | ||||
|
|
|
|
|
|||||
| LIABILITIES & EQUITY |
||||||||
| Liabilities |
||||||||
| Financial instruments sold, not yet purchased, at fair value: |
||||||||
| Equities |
$ | 1,927,864 | $ | 1,856,171 | ||||
| Debt securities |
278,303 | 105,340 | ||||||
| Listed options |
16,319 | 151,893 | ||||||
| Other financial instruments |
302 | — | ||||||
|
|
|
|
|
|||||
| Total financial instruments sold, not yet purchased, at fair value |
2,222,788 | 2,113,404 | ||||||
| Collateralized financings: |
||||||||
| Securities loaned |
647,602 | 463,377 | ||||||
| Financial instruments sold under agreements to repurchase |
1,034,700 | 954,902 | ||||||
| Other collateralized financings |
50,000 | — | ||||||
|
|
|
|
|
|||||
| Total collateralized financings |
1,732,302 | 1,418,279 | ||||||
| Payable to brokers, dealers and clearing organizations |
647,089 | 273,805 | ||||||
| Payable to customers |
29,615 | 17,387 | ||||||
| Accrued compensation expense |
96,087 | 154,547 | ||||||
| Accrued expenses and other liabilities |
129,548 | 134,026 | ||||||
| Debt |
453,524 | 484,989 | ||||||
|
|
|
|
|
|||||
| Total liabilities |
5,310,953 | 4,596,437 | ||||||
|
|
|
|
|
|||||
| Equity |
||||||||
| Class A Common Stock |
1,090 | 1,060 | ||||||
| Additional paid-in capital |
1,460,313 | 1,436,671 | ||||||
| Retained earnings |
251,625 | 192,120 | ||||||
| Treasury stock, at cost |
(273,270 | ) | (186,103 | ) | ||||
| Accumulated other comprehensive income |
(110 | ) | 350 | |||||
|
|
|
|
|
|||||
| Total equity |
1,439,648 | 1,444,098 | ||||||
|
|
|
|
|
|||||
| Total liabilities and equity |
$ | 6,750,601 | $ | 6,040,535 | ||||
|
|
|
|
|
|||||
| KCG HOLDINGS, INC. PRE-TAX EARNINGS (LOSS) BY BUSINESS SEGMENT (In thousands) (Unaudited) |
Exhibit 3 |
| For the three months ended | ||||||||||||
| September 30, 2016 | June 30, 2016 | September 30, 2015 | ||||||||||
| Market Making |
||||||||||||
| Revenues |
$ | 136,107 | $ | 211,824 | $ | 299,755 | ||||||
| Expenses |
149,883 | 171,314 | 214,336 | |||||||||
|
|
|
|
|
|
|
|||||||
| Pre-tax (loss) earnings |
(13,776 | ) | 40,510 | 85,419 | ||||||||
|
|
|
|
|
|
|
|||||||
| Global Execution Services |
||||||||||||
| Revenues |
63,713 | 68,138 | 69,713 | |||||||||
| Expenses |
64,152 | 66,454 | 70,763 | |||||||||
|
|
|
|
|
|
|
|||||||
| Pre-tax (loss) earnings |
(439 | ) | 1,684 | (1,050 | ) | |||||||
|
|
|
|
|
|
|
|||||||
| Corporate and Other |
||||||||||||
| Revenues |
8,712 | 39,952 | 7,568 | |||||||||
| Expenses |
22,471 | 27,581 | 56,519 | |||||||||
|
|
|
|
|
|
|
|||||||
| Pre-tax (loss) earnings |
(13,759 | ) | 12,371 | (48,951 | ) | |||||||
|
|
|
|
|
|
|
|||||||
| Consolidated |
||||||||||||
| Revenues |
208,532 | 319,914 | 377,036 | |||||||||
| Expenses |
236,506 | 265,349 | 341,617 | |||||||||
|
|
|
|
|
|
|
|||||||
| Pre-tax (loss) earnings |
$ | (27,974 | ) | $ | 54,565 | $ | 35,419 | |||||
|
|
|
|
|
|
|
|||||||
| For the nine months ended | ||||||||
| September 30, 2016 | September 30, 2015 | |||||||
| Market Making |
||||||||
| Revenues |
$ | 606,849 | $ | 716,631 | ||||
| Expenses |
504,626 | 587,471 | ||||||
|
|
|
|
|
|||||
| Pre-tax earnings |
102,223 | 129,160 | ||||||
|
|
|
|
|
|||||
| Global Execution Services |
||||||||
| Revenues |
208,245 | 597,502 | ||||||
| Expenses |
200,739 | 227,430 | ||||||
|
|
|
|
|
|||||
| Pre-tax earnings |
7,506 | 370,072 | ||||||
|
|
|
|
|
|||||
| Corporate and Other |
||||||||
| Revenues |
58,776 | 20,941 | ||||||
| Expenses |
81,949 | 135,740 | ||||||
|
|
|
|
|
|||||
| Pre-tax loss |
(23,173 | ) | (114,799 | ) | ||||
|
|
|
|
|
|||||
| Consolidated |
||||||||
| Revenues |
873,870 | 1,335,074 | ||||||
| Expenses |
787,314 | 950,641 | ||||||
|
|
|
|
|
|||||
| Pre-tax earnings |
$ | 86,556 | $ | 384,433 | ||||
|
|
|
|
|
|||||
| KCG HOLDINGS, INC. RECONCILIATION OF TOTAL REVENUES TO NET REVENUES (In thousands) (Unaudited) |
Exhibit 4 |
| For the three months ended | ||||||||||||
| September 30, 2016 | June 30, 2016 | September 30, 2015 | ||||||||||
| Total revenues per Consolidated Statements of Operations |
$ | 208,532 | $ | 319,914 | $ | 377,036 | ||||||
| Less: |
||||||||||||
| Execution and clearance fees |
71,995 | 73,742 | 67,502 | |||||||||
| Payments for order flow |
13,845 | 13,090 | 17,121 | |||||||||
| Collaterlaized financing interest |
10,693 | 9,609 | 8,617 | |||||||||
| Gain from the sale of a portion of the Company’s investment in Bats |
— | 33,397 | — | |||||||||
|
|
|
|
|
|
|
|||||||
| Net revenues |
$ | 111,999 | $ | 190,076 | $ | 283,796 | ||||||
|
|
|
|
|
|
|
|||||||
| For the nine months ended | ||||||||
| September 30, 2016 | September 30, 2015 | |||||||
| Total revenues per Consolidated Statements of Operations |
$ | 873,870 | $ | 1,335,074 | ||||
| Less: |
||||||||
| Execution and clearance fees |
219,371 | 198,573 | ||||||
| Payments for order flow |
39,590 | 47,277 | ||||||
| Collaterlaized financing interest |
29,465 | 25,932 | ||||||
| Gain from the sale of a portion of the Company’s investment in Bats |
33,397 | — | ||||||
| Gain on sale of KCG Hotspot |
— | 385,026 | ||||||
|
|
|
|
|
|||||
| Net revenues |
$ | 552,047 | $ | 678,266 | ||||
|
|
|
|
|
|||||
KCG Holdings, Inc. (KCG) 3rd Quarter 2016 Earnings Presentation October 20, 2016 Exhibit 99.2
Safe Harbor Certain statements contained herein and the documents incorporated by reference containing the words "believes," "intends," "expects," "anticipates," and words of similar meaning, may constitute forward-looking statements as defined in the Private Securities Litigation Reform Act of 1995. These "forward-looking statements" are not historical facts and are based on current expectations, estimates and projections about KCG's industry, management's beliefs and certain assumptions made by management, many of which, by their nature, are inherently uncertain and beyond our control. Any forward-looking statement contained herein speaks only as of the date on which it is made. Accordingly, readers are cautioned that any such forward-looking statements are not guarantees of future performance and are subject to certain risks, uncertainties and assumptions that are difficult to predict including, without limitation, risks associated with: (i) the inability to manage trading strategy performance and grow revenue and earnings; (ii) the receipt of additional payments from the sale of KCG Hotspot that are subject to certain contingencies; (iii) changes in market structure, legislative, regulatory or financial reporting rules, including the increased focus by Congress, federal and state regulators, the SROs and the media on market structure issues, and in particular, the scrutiny of high frequency trading, alternative trading systems, market fragmentation, colocation, access to market data feeds, and remuneration arrangements such as payment for order flow and exchange fee structures; (iv) past or future changes to KCG's organizational structure and management; (v) KCG's ability to develop competitive new products and services in a timely manner and the acceptance of such products and services by KCG's customers and potential customers; (vi) KCG's ability to keep up with technological changes; (vii) KCG's ability to effectively identify and manage market risk, operational and technology risk, cybersecurity risk, legal risk, liquidity risk, reputational risk, counterparty and credit risk, international risk, regulatory risk, and compliance risk; (viii) the cost and other effects of material contingencies, including litigation contingencies, and any adverse judicial, administrative or arbitral rulings or proceedings; (ix) the effects of increased competition and KCG's ability to maintain and expand market share; (x) the announced plan to relocate KCG's global headquarters from Jersey City, NJ to New York, NY; and (xi) KCG's ability to complete the sale or disposition of any or all of the assets or businesses that are classified as held for sale. The list above is not exhaustive. Because forward looking statements involve risks and uncertainties, the actual results and performance of KCG may materially differ from the results expressed or implied by such statements. Given these uncertainties, readers are cautioned not to place undue reliance on such forward-looking statements. Unless otherwise required by law, KCG also disclaims any obligation to update its view of any such risks or uncertainties or to announce publicly the result of any revisions to the forward-looking statements made herein. Readers should carefully review the risks and uncertainties disclosed in KCG's reports with the U.S. Securities and Exchange Commission ("SEC"), including those detailed in "Risk Factors" in Part I, Item 1A of KCG's Annual Report on Form10-K for the year ended December 31, 2015, "Legal Proceedings" in Part I, Item 3, under "Certain Factors Affecting Results of Operations" in "Management's Discussion and Analysis of Financial Condition and Results of Operations" in Part II, Item 7, in "Quantitative and Qualitative Disclosures About Market Risk" in Part II, Item 7A, and in other reports or documents KCG files with, or furnishes to, the SEC from time to time. This information should be read in conjunction with KCG's Consolidated Financial Statements and the Notes thereto contained in its Annual Report on Form 10-K, Quarterly Report on Form 10-Q, and in other reports or documents KCG files with, or furnishes to, the SEC from time to time to time. For additional disclosures, please see https://www.kcg.com/legal/global-disclosures.
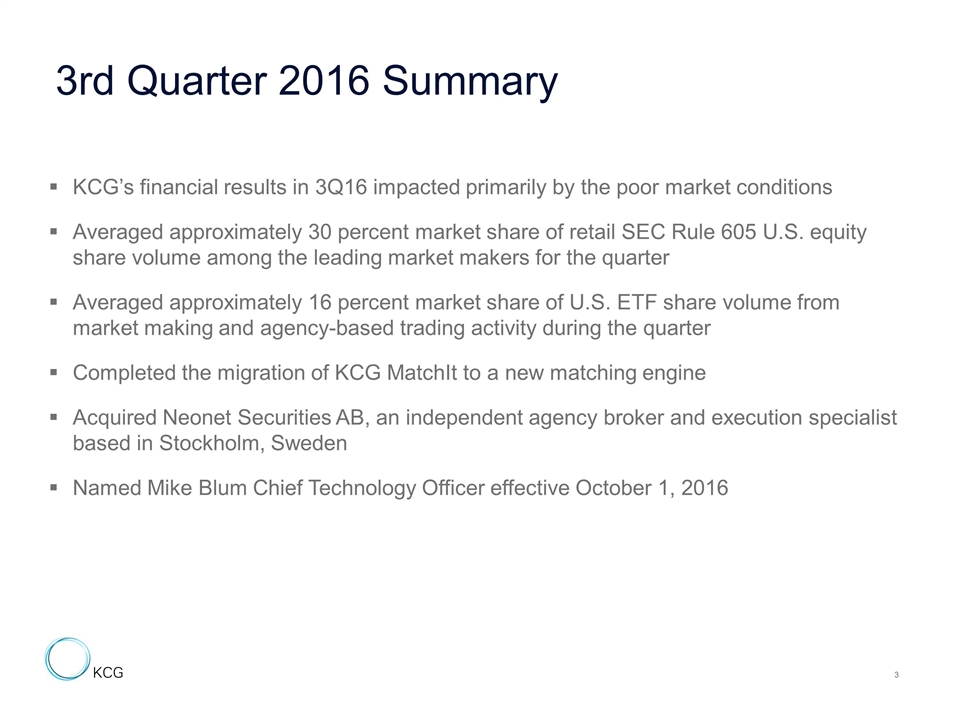
KCG’s financial results in 3Q16 impacted primarily by the poor market conditions Averaged approximately 30 percent market share of retail SEC Rule 605 U.S. equity share volume among the leading market makers for the quarter Averaged approximately 16 percent market share of U.S. ETF share volume from market making and agency-based trading activity during the quarter Completed the migration of KCG MatchIt to a new matching engine Acquired Neonet Securities AB, an independent agency broker and execution specialist based in Stockholm, Sweden Named Mike Blum Chief Technology Officer effective October 1, 2016 3rd Quarter 2016 Summary
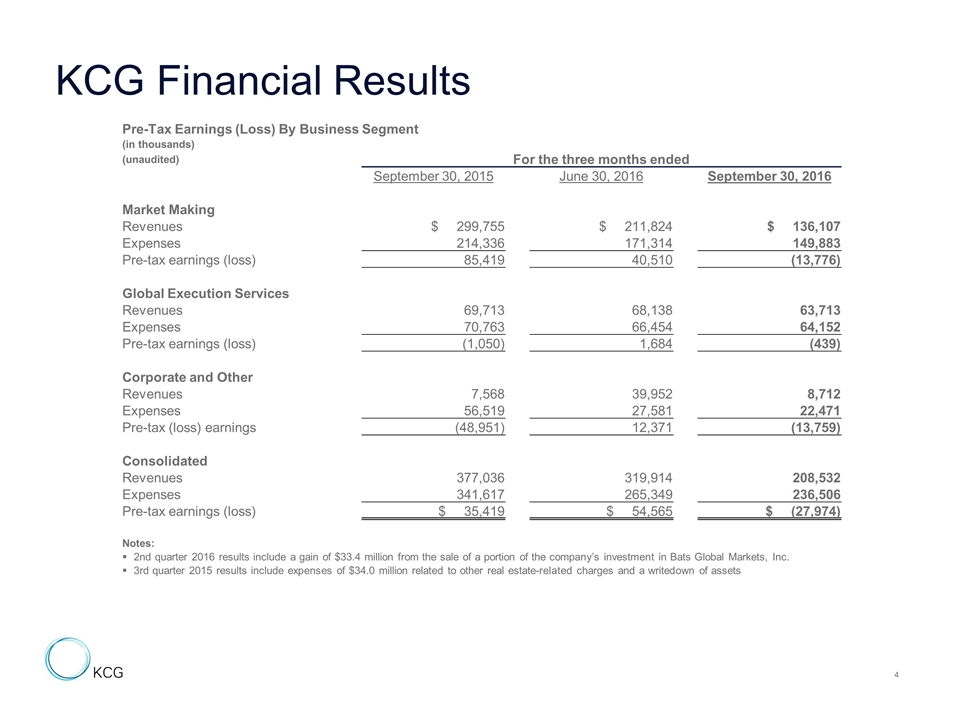
KCG Financial Results Pre-Tax Earnings (Loss) By Business Segment (in thousands) (unaudited) For the three months ended September 30, 2015 June 30, 2016 September 30, 2016 Market Making Revenues $ 299,755 $ 211,824 $ 136,107 Expenses 214,336 171,314 149,883 Pre-tax earnings (loss) 85,419 40,510 (13,776) Global Execution Services Revenues 69,713 68,138 63,713 Expenses 70,763 66,454 64,152 Pre-tax earnings (loss) (1,050) 1,684 (439) Corporate and Other Revenues 7,568 39,952 8,712 Expenses 56,519 27,581 22,471 Pre-tax (loss) earnings (48,951) 12,371 (13,759) Consolidated Revenues 377,036 319,914 208,532 Expenses 341,617 265,349 236,506 Pre-tax earnings (loss) $ 35,419 $ 54,565 $ (27,974) Notes: 2nd quarter 2016 results include a gain of $33.4 million from the sale of a portion of the company’s investment in Bats Global Markets, Inc. 3rd quarter 2015 results include expenses of $34.0 million related to other real estate-related charges and a writedown of assets
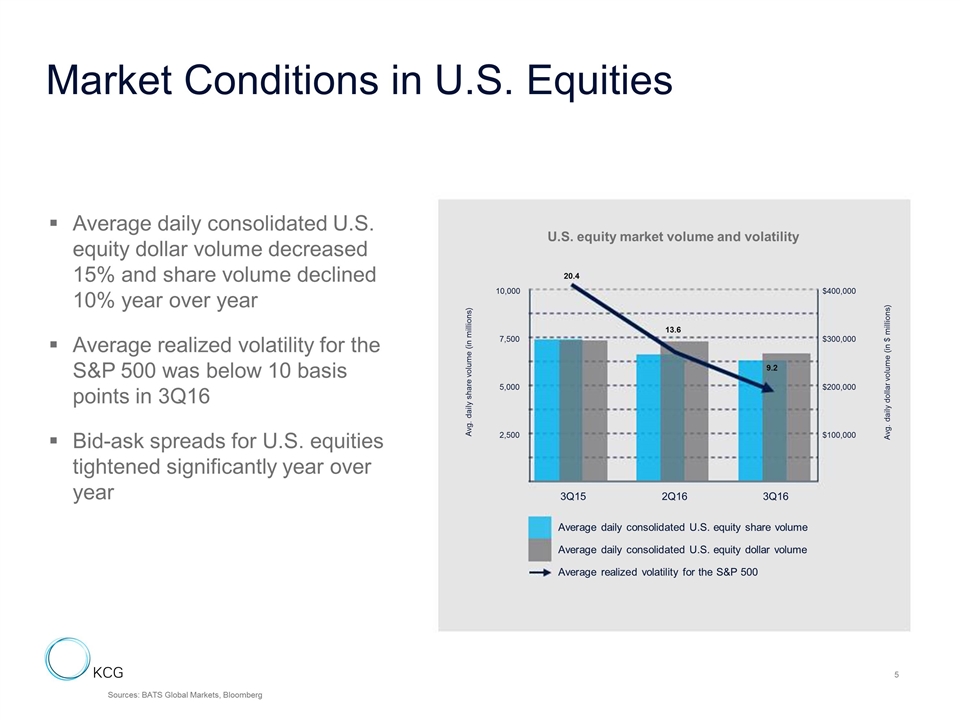
Market Conditions in U.S. Equities Average daily consolidated U.S. equity dollar volume decreased 15% and share volume declined 10% year over year Average realized volatility for the S&P 500 was below 10 basis points in 3Q16 Bid-ask spreads for U.S. equities tightened significantly year over year Sources: BATS Global Markets, Bloomberg U.S. equity market volume and volatility 13.6 20.4 9.2 10,000 $400,000 7,500 $300,000 5,000 $200,000 2,500 $100,000 3Q15 2Q16 3Q16 Average daily consolidated U.S. equity share volume Average daily consolidated U.S. equity dollar volume Average realized volatility for the S&P 500 Avg. daily share volume (in millions) Avg. daily dollar volume (in $ millions)
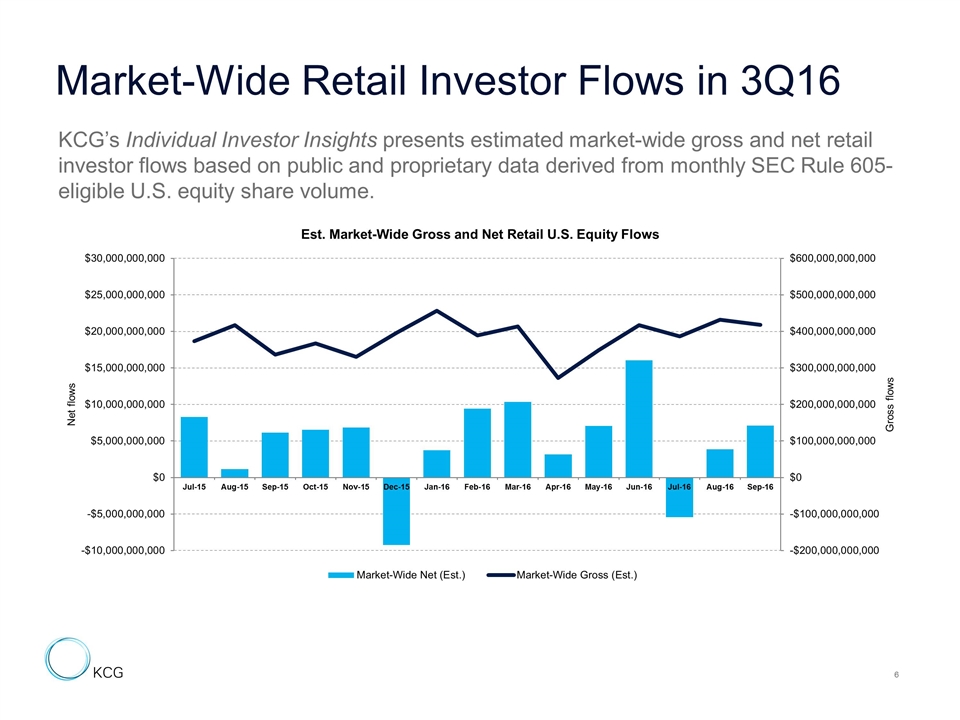
Market-Wide Retail Investor Flows in 3Q16 KCG’s Individual Investor Insights presents estimated market-wide gross and net retail investor flows based on public and proprietary data derived from monthly SEC Rule 605-eligible U.S. equity share volume.
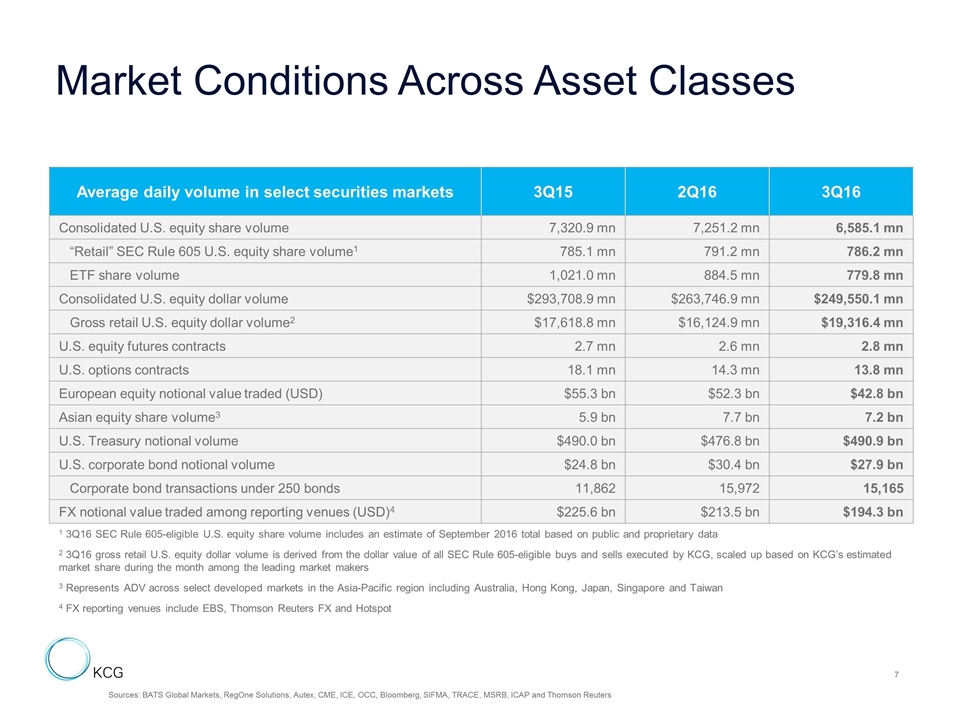
Market Conditions Across Asset Classes Average daily volume in select securities markets 3Q15 2Q16 3Q16 Consolidated U.S. equity share volume 7,320.9 mn 7,251.2 mn 6,585.1 mn “Retail” SEC Rule 605 U.S. equity share volume1 785.1 mn 791.2 mn 786.2 mn ETF share volume 1,021.0 mn 884.5 mn 779.8 mn Consolidated U.S. equity dollar volume $293,708.9 mn $263,746.9 mn $249,550.1 mn Gross retail U.S. equity dollar volume2 $17,618.8 mn $16,124.9 mn $19,316.4 mn U.S. equity futures contracts 2.7 mn 2.6 mn 2.8 mn U.S. options contracts 18.1 mn 14.3 mn 13.8 mn European equity notional value traded (USD) $55.3 bn $52.3 bn $42.8 bn Asian equity share volume3 5.9 bn 7.7 bn 7.2 bn U.S. Treasury notional volume $490.0 bn $476.8 bn $490.9 bn U.S. corporate bond notional volume $24.8 bn $30.4 bn $27.9 bn Corporate bond transactions under 250 bonds 11,862 15,972 15,165 FX notional value traded among reporting venues (USD)4 $225.6 bn $213.5 bn $194.3 bn 1 3Q16 SEC Rule 605-eligible U.S. equity share volume includes an estimate of September 2016 total based on public and proprietary data. 2 3Q16 gross retail U.S. equity dollar volume is derived from the dollar value of all SEC Rule 605-eligible buys and sells executed by KCG, scaled up based on KCG’s estimated market share during the month among the leading market makers 3 Represents ADV across select developed markets in the Asia-Pacific region including Australia, Hong Kong, Japan, Singapore and Taiwan 4 FX reporting venues include EBS, Thomson Reuters FX and Hotspot Sources: BATS Global Markets, RegOne Solutions, Autex, CME, ICE, OCC, Bloomberg, SIFMA, TRACE, MSRB, ICAP and Thomson Reuters
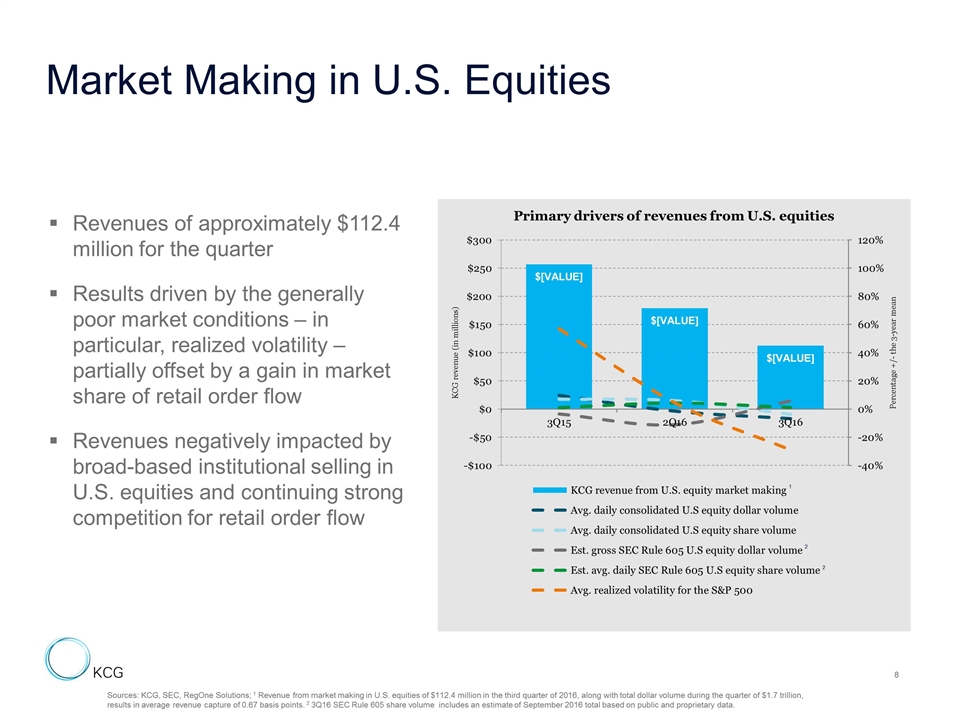
Market Making in U.S. Equities Sources: KCG, SEC, RegOne Solutions; 1 Revenue from market making in U.S. equities of $112.4 million in the third quarter of 2016, along with total dollar volume during the quarter of $1.7 trillion, results in average revenue capture of 0.67 basis points. 2 3Q16 SEC Rule 605 share volume includes an estimate of September 2016 total based on public and proprietary data. Revenues of approximately $112.4 million for the quarter Results driven by the generally poor market conditions – in particular, realized volatility – partially offset by a gain in market share of retail order flow Revenues negatively impacted by broad-based institutional selling in U.S. equities and continuing strong competition for retail order flow 1 2 2
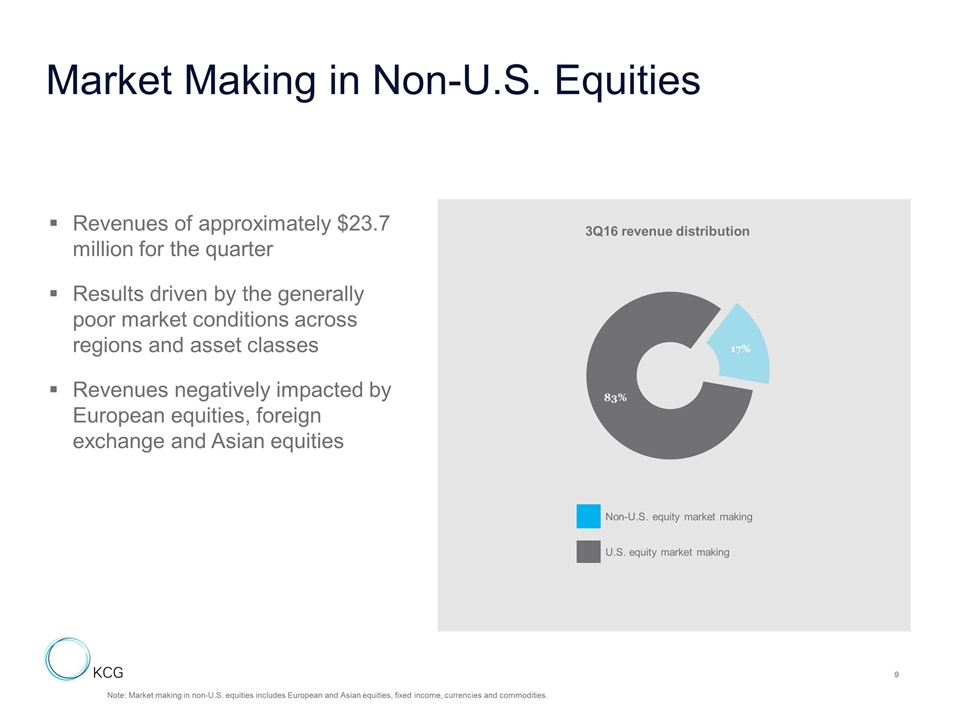
Market Making in Non-U.S. Equities Note: Market making in non-U.S. equities includes European and Asian equities, fixed income, currencies and commodities. Revenues of approximately $23.7 million for the quarter Results driven by the generally poor market conditions across regions and asset classes Revenues negatively impacted by European equities, foreign exchange and Asian equities Non-U.S. equity market making U.S. equity market making 3Q16 revenue distribution
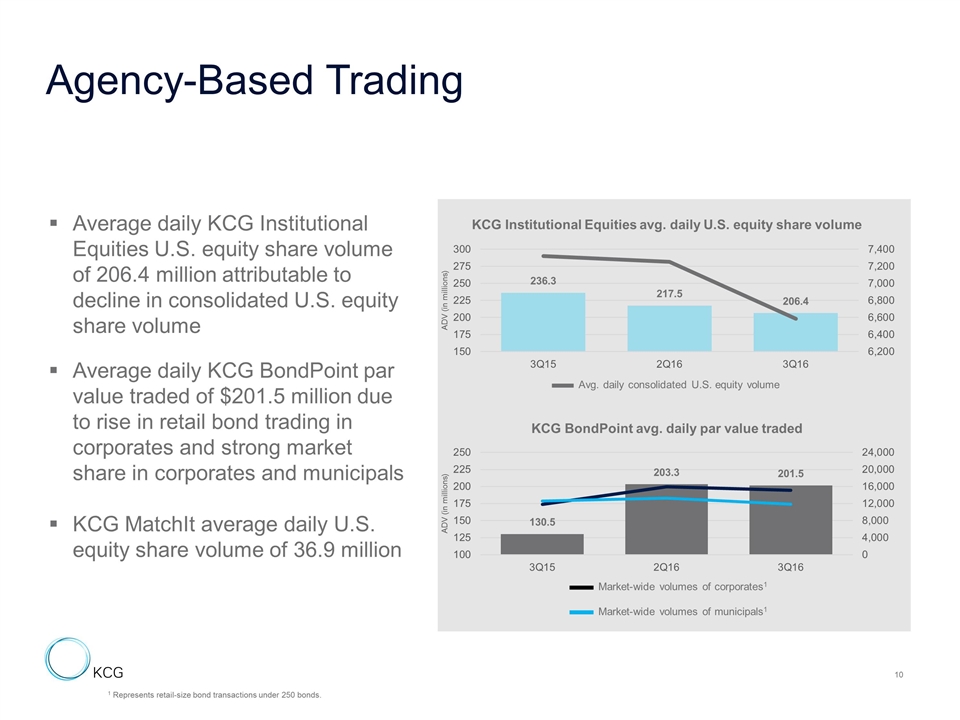
Agency-Based Trading Average daily KCG Institutional Equities U.S. equity share volume of 206.4 million attributable to decline in consolidated U.S. equity share volume Average daily KCG BondPoint par value traded of $201.5 million due to rise in retail bond trading in corporates and strong market share in corporates and municipals KCG MatchIt average daily U.S. equity share volume of 36.9 million KCG Institutional Equities avg. daily U.S. equity share volume KCG BondPoint avg. daily par value traded Market-wide volumes of corporates1 Market-wide volumes of municipals1 Avg. daily consolidated U.S. equity volume 1 Represents retail-size bond transactions under 250 bonds.
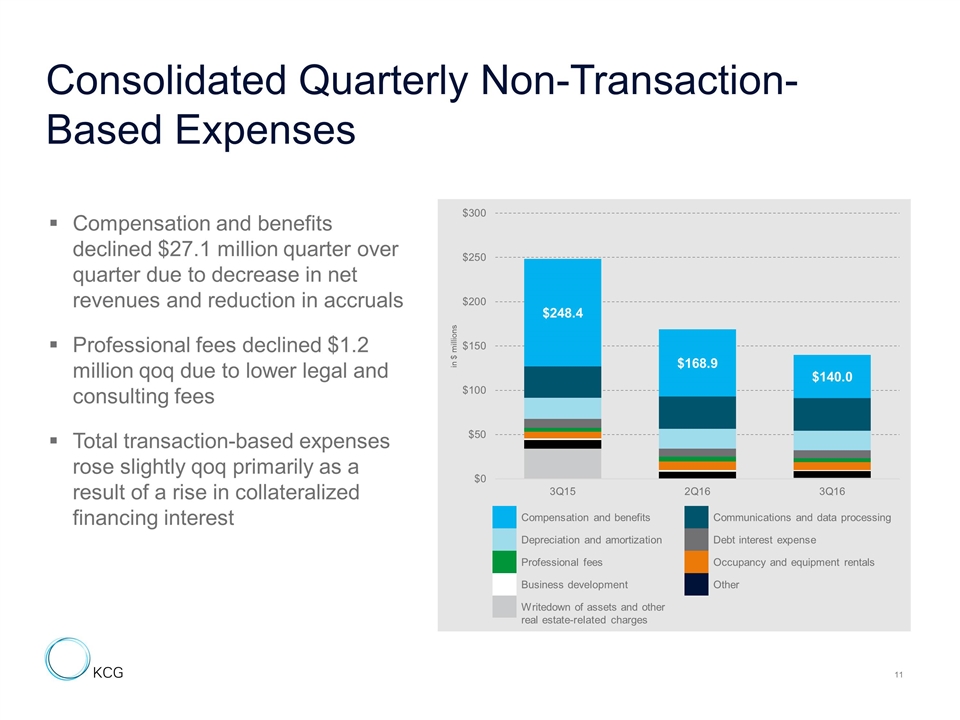
Consolidated Quarterly Non-Transaction-Based Expenses Compensation and benefits declined $27.1 million quarter over quarter due to decrease in net revenues and reduction in accruals Professional fees declined $1.2 million qoq due to lower legal and consulting fees Total transaction-based expenses rose slightly qoq primarily as a result of a rise in collateralized financing interest Compensation and benefits Communications and data processing Depreciation and amortization Debt interest expense Professional fees Occupancy and equipment rentals Business development Other Writedown of assets and other real estate-related charges
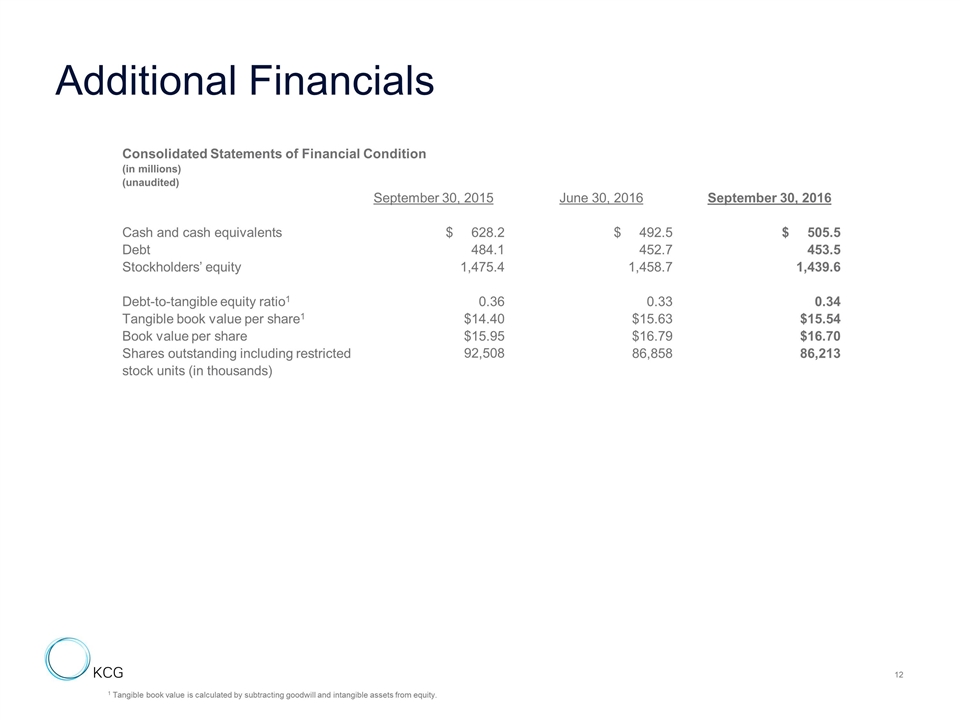
Additional Financials Consolidated Statements of Financial Condition (in millions) (unaudited) September 30, 2015 June 30, 2016 September 30, 2016 Cash and cash equivalents $ 628.2 $ 492.5 $ 505.5 Debt 484.1 452.7 453.5 Stockholders’ equity 1,475.4 1,458.7 1,439.6 Debt-to-tangible equity ratio1 0.36 0.33 0.34 Tangible book value per share1 $14.40 $15.63 $15.54 Book value per share $15.95 $16.79 $16.70 Shares outstanding including restricted 92,508 86,858 86,213 stock units (in thousands) 1 Tangible book value is calculated by subtracting goodwill and intangible assets from equity.
Serious News for Serious Traders! Try StreetInsider.com Premium Free!
You May Also Be Interested In
- Trailbreaker Commences Drilling at the Liberty Copper Property, BC.
- Less than half of veterinary professionals feel their profession is appreciated
- New CPS Protection Platform: TXOne Networks Presents SageOne in Hannover
Create E-mail Alert Related Categories
SEC FilingsSign up for StreetInsider Free!
Receive full access to all new and archived articles, unlimited portfolio tracking, e-mail alerts, custom newswires and RSS feeds - and more!


 Tweet
Tweet Share
Share