

Form 8-K REGIONS FINANCIAL CORP For: Oct 18
 Tweet
Tweet Share
ShareUNITED STATES
SECURITIES AND EXCHANGE COMMISSION
Washington, DC 20549
FORM 8-K
CURRENT REPORT
PURSUANT TO SECTION 13 OR 15(d) OF THE
SECURITIES EXCHANGE ACT OF 1934
Date of Report (Date of earliest event reported): October 18, 2016
REGIONS FINANCIAL CORPORATION
(Exact name of registrant as specified in its charter)
DELAWARE | 001-34034 | 63-0589368 | ||
(State or other jurisdiction of incorporation) | (Commission File Number) | (IRS Employer Identification No.) | ||
1900 FIFTH AVENUE NORTH
BIRMINGHAM, ALABAMA 35203
(Address, including zip code, of principal executive office)
Registrant’s telephone number, including area code: (800) 734-4667
Not applicable
(Former name or former address, if changed since last report.)
Check the appropriate box below if the Form 8-K filing is intended to simultaneously satisfy the filing obligation of the registrant under any of the following provisions:
☐ | Written communication pursuant to Rule 425 under the Securities Act (17 CFR 230.425) |
☐ | Soliciting material pursuant to Rule 14a-12 under the Exchange Act (17 CFR 240.14a-12) |
☐ | Pre-commencement communications pursuant to Rule 14d-2(b) under the Exchange Act (17 CFR 240.14d-2(b)) |
☐ | Pre-commencement communications pursuant to Rule 13e-4(c) under the Exchange Act (17 CFR 240.13e-4(c)) |
Item 7.01 Regulation FD Disclosure.
On October 18, 2016 Regions Financial Corporation (“Regions”) will disclose the results of its company-administered mid-year stress test on the Investor Relations webpage of www. regions.com. The disclosure is required by 12 CFR 252.148, which implements the requirements of Section 165(i)(2) of the Dodd-Frank Wall Street Reform and Consumer Protection Act. A copy of the summary of results that will be posted on Regions’ website is being furnished as Exhibit 99.1 to this report. Exhibit 99.1 is incorporated by reference under this Item 7.01.
Information contained on Regions’ website or that can be accessed through Regions’ website is not incorporated by reference into this Current Report on Form 8-K. Reference to Regions’ website is made as an inactive textual reference.
In accordance with general instruction B.2. of Form 8-K, the following information (including Exhibit 99.1) is furnished and shall not be deemed filed for purposes of Section 18 of the Securities Exchange Act of 1934.
Item 9.01 Financial Statements and Exhibits.
(d) Exhibits. In accordance with general instruction B.2 of Form 8-K, the exhibits listed in the exhibit index are furnished and shall not be deemed filed for purposes of Section 18 of the Securities Exchange Act of 1934.
Exhibit Index
No. | Exhibit |
99.1 | Summary of Results |
SIGNATURES
Pursuant to the requirements of the Securities Exchange Act of 1934, the registrant has duly caused this report to be signed on its behalf by the undersigned hereunto duly authorized.
REGIONS FINANCIAL CORPORATION | |
By: | /s/ Fournier J. Gale, III |
Name: | Fournier J. Gale, III |
Title: | Senior Executive Vice President, General Counsel and Corporate Secretary |
Date: October 18, 2016
Exhibit 99.1
Regions Financial Corporation - Mid-Year Dodd-Frank Act Stress Test Disclosure - October 18, 2016
This disclosure of mid-year summary stress test results is required by regulations adopted by the Board of Governors of the Federal Reserve System (the “Federal Reserve”) implementing the requirements of Section 165(i)(2) of the Dodd-Frank Wall Street Reform and Consumer Protection Act (the “Dodd-Frank Act”). These mid-year results present management’s estimation of the impact of the internally developed severely adverse stress test scenario on Regions Financial Corporation (“Regions” or “Company”) and Regions Bank, its wholly-owned banking subsidiary. The results reflect pro forma capital ratios, select Income Statement and Balance Sheet line items, and other related information for the Company’s severely adverse scenario.
Unlike the year-end Dodd-Frank Act Stress Test (“DFAST”) disclosed earlier this year on June 23, 2016, which was based upon a severely adverse scenario developed by the Federal Reserve, this mid-year DFAST is based solely upon macroeconomic assumptions developed by each bank holding company subject to 12 CFR 252.148. Therefore, Regions’ internal stress test results are not directly comparable to those disclosed by other bank holding companies since economic scenarios, modeling techniques, processes, and assumptions could differ significantly across companies. Regions’ mid-year severely adverse scenario is developed to appropriately stress macroeconomic conditions while considering idiosyncratic risks of the Company as of June 30, 2016. Therefore, these results are not necessarily comparable to the previous DFAST disclosure of stress tests results released by Regions on June 23, 2016. The mid-year DFAST exercise is not part of the annual Comprehensive Capital Analysis and Review (“CCAR”) process and accordingly, no objection or non-objection will be provided by the Federal Reserve with respect to these results.
Dodd-Frank Act Stress Test Assumptions
Pursuant to regulatory guidance for the mid-year DFAST, Regions is required to develop scenarios to appropriately stress the idiosyncratic risks of the Company. Given that Regions’ core businesses consist of traditional banking activities, the Company is most exposed to scenarios that stress the overall health of the broader economy, with particular emphasis on the southeastern U.S. markets given its geographic footprint. Thus, Regions’ severely adverse scenario is characterized by a substantial weakening in the U.S. economy. This scenario does not represent expected conditions, but rather is a hypothetical path of economic variables that are used to assess the strength of Regions and its capital base in a severely adverse economic environment. Specifically, the impact of this macroeconomic scenario can be best illustrated through key economic factors such as the level of interest rates, home prices, and unemployment. These key economic variables are produced at the national level, as well as for states within our footprint. The table below details key variables used in the Company’s severely adverse scenario.
For purposes of the table below, the period forecasted includes Q3 2016 through Q3 2018 where PQ1 represents Q3 2016 and PQ9 represents Q3 2018.
Projected Economic Variables through Q3 2018 in Regions' Severely Adverse Scenario | |||||||||
% | PQ1 | PQ2 | PQ3 | PQ4 | PQ5 | PQ6 | PQ7 | PQ8 | PQ9 |
Annual Gross Domestic Product ("GDP") | (4.7) | (6.7) | (4.1) | (2.3) | (3.2) | 1.5 | 2.7 | 4.0 | 2.8 |
Annual Consumer Price Index ("CPI") | (0.8) | (1.6) | (2.4) | (2.9) | (1.1) | (0.2) | 1.1 | 1.4 | 1.6 |
House Price Index ("HPI") (1) | (5.2) | (10.7) | (15.3) | (19.3) | (23.7) | (26.7) | (28.0) | (29.1) | (28.4) |
Unemployment Rate | 6.2 | 7.6 | 8.9 | 10.1 | 10.7 | 10.6 | 10.3 | 10.0 | 9.6 |
10 Year Treasury | 1.1 | 0.7 | 0.8 | 0.9 | 1.1 | 1.2 | 1.3 | 1.4 | 1.5 |
Fed Funds Rate | 0.3 | 0.3 | 0.3 | 0.3 | 0.3 | 0.3 | 0.3 | 0.3 | 0.3 |
3 Month LIBOR | 0.7 | 0.9 | 0.8 | 0.7 | 0.7 | 0.5 | 0.4 | 0.4 | 0.3 |
(1) | Core Logic cumulative percentage change from Q1 2016 |
Under the Federal Reserve’s regulations implementing the stress testing requirements established by the Dodd-Frank Act, bank holding companies, such as Regions, must assume a standard set of capital actions over the forecast horizon to estimate their severely adverse scenario. The use of a standard set of capital actions is intended to assist the public in comparing stress test results disclosed by the various institutions subject to the stress test requirements. In particular, the Dodd-Frank capital action assumptions for Regions are:
1
1) | Actual capital distributions completed in the third quarter of 2016, including: |
a. | payment of a $0.065 per share common stock dividend, and |
b. | repurchase of $215 million of common stock |
2) | Quarterly common stock dividends of approximately $0.0625 per share for each quarter from the fourth quarter of 2016 through the third quarter of 2018, which is the quarterly average dollar amount of common stock dividends that Regions paid over the four-quarter period beginning in the fourth quarter of 2015 and ending in the third quarter of 2016, |
3) | Continuation of payments on any other instrument that is eligible for inclusion in the numerator of a regulatory capital ratio equal to the stated dividend, interest, or principal due on such instrument during the nine quarter horizon (this includes subordinated debt and preferred stock), |
4) | No redemption or repurchase of any capital instrument that is eligible for inclusion in the numerator of a regulatory capital ratio, and |
5) | No issuances of capital securities beginning in the fourth quarter of 2016. |
These assumed capital actions may not represent the actual capital actions taken should severely adverse conditions develop. Additionally, these assumed capital actions and the summary stress test results in this disclosure do not assume the specific capital actions to which the Federal Reserve Board did not object as part of the 2016 CCAR process.
Description of the Types of Risks Included in the Stress Test
Regions undertakes a comprehensive risk identification process to determine the risks to be considered in its stress testing activities. These risks range from idiosyncratic risks, such as geographic footprint and industry concentrations in the credit portfolios, to broad economic, regulatory, and compliance risks, which Regions believes may impact it and its peers. Specifically, Regions considers the following key risks in its stress testing activities: (1) credit risk, or the risk of loss arising from a borrower or counterparty failing to meet a contractual obligation; (2) market risk, or the risk to Regions' financial condition resulting from adverse movements in market rates or prices, such as interest rates, foreign-exchange rates, or equity prices; (3) liquidity risk, or the risk that Regions will be unable to meet its obligations as they come due because of an inability to liquidate assets or obtain adequate funding (referred to as ‘‘funding liquidity risk’’) or that Regions will be unable to easily unwind or offset specific exposures without significantly lowering market prices because of inadequate market depth or market disruptions (referred to as “market liquidity risk”); (4) operational risk, or the risk of loss resulting from inadequate or failed internal processes, people, and systems, or from external events; (5) legal risk, or the risk that unenforceable contracts, lawsuits, or adverse judgments may disrupt or otherwise negatively affect the operations or financial condition of Regions; (6) compliance risk, or the risk to current or anticipated earnings or capital arising from violations of laws, rules or regulations, or from non-conformance with prescribed practices, internal policies and procedures, or ethical standards; (7) reputational risk, or the risk that negative publicity regarding Regions’ business practices, whether true or not, will cause a decline in its customer base, lead to costly litigation, or result in revenue reductions; and (8) strategic risk, or the risk to current or anticipated earnings, capital, or franchise or enterprise value arising from adverse business decisions, poor implementation of business decisions, or lack of responsiveness to changes in the banking industry and Regions’ operating environment.
Each of these risks, which are discussed in further detail below, are stressed within particular portfolios of assets where those risks are applicable. Additionally, these risks are assessed through a comprehensive risk identification process across Regions’ three Business Segments (namely, Corporate Bank, Consumer Bank, and Wealth Management), as well as general corporate functions such as Treasury. Regions, to the best of its ability, fully captures the impact of each risk as it relates to the defined scenarios. As part of its risk management practices, Regions monitors these risks through additional stress testing activities to ensure the risks are fully understood under a wide range of potential scenarios.
Credit Risk
Regions’ primary credit risk arises from the possibility that borrowers may not be able to repay loans and, to a lesser extent, the failure of securities issuers, obligors, or counterparties to perform as contractually required. In monitoring credit risk, Regions’ objective is to maintain a high-quality credit portfolio that provides for stable credit costs with acceptable volatility through an economic cycle. In order to assess the risk characteristics of the loan portfolio, Regions considers the current U.S. economic environment and that of its primary banking markets, as well as risk factors within the major categories of loans.
2
Credit risk spans all business segments, but is concentrated in the Corporate Bank and Consumer Bank segments. Regions specifically measures credit risk for each portfolio of assets on the balance sheet, as well as risks that arise from off-balance sheet unfunded commitments. The underlying credit quality of these assets is stressed per the methodologies discussed below under "Description of Methodologies Employed by Regions."
Market Risk
Regions’ primary market risk is interest rate risk, including uncertainty with respect to absolute interest rate levels as well as uncertainty with respect to relative interest rate levels, which is impacted by both the shape and the slope of the various yield curves that affect the financial products and services that the Company offers. To quantify this risk, Regions measures the change in its net interest income and other financing income in various interest rate scenarios compared to a base case scenario. Net interest income and other financing income sensitivity is a useful short-term indicator of Regions’ interest rate risk.
In addition, Regions, like most financial institutions, is subject to changing prepayment speeds on mortgage-related assets under different interest rate environments. Prepayment risk presents risk to earnings and specifically to net interest income and other financing income. Prepayment risk can also impact the value of securities and the carrying value of equity. Regions’ greatest exposures to prepayment risks primarily rest in its mortgage-backed securities portfolio, the mortgage fixed-rate loan portfolio and the residential mortgage servicing asset, all of which tend to be sensitive to interest rate movements. Regions also has prepayment risk that would be reflected in non-interest income in the form of servicing income on loans sold. Regions’ capital markets business includes derivatives, loan syndication, and foreign exchange trading activities, which exposes the Company to market risk. Further, the Company is exposed to non-trading market risk from mortgage hedging activities, which include secondary marketing of loans to government-sponsored entities and mortgage servicing rights valuation.
Liquidity Risk
Liquidity is an important factor in the financial condition of Regions and affects Regions’ ability to meet the borrowing needs and deposit withdrawal requirements of its customers. Regions considers liquidity risk in its stress testing activities through an evaluation of its funding sources and assumptions regarding how those liabilities may re-price during times of stress. Liquidity risks are most pronounced within deposit portfolios in all three Business Segments and within Treasury funding portfolios.
Operational and Legal Risks
Operational risk relates to the risk of loss resulting from inadequate or failed internal processes, people, and systems, or from external events. Legal risk reflects the inherent legal risk arising out of the daily banking and other operations of the Company that could result in disputes, threatened and/or actual litigation, civil monetary penalties, criminal penalties, enforcement actions, or reputational damage. Operational and legal risks are estimated for the stress tests considering modeled loss results, historical analysis, and evaluations of specific operational scenarios and expectations for how those types of losses may materialize in the scenarios. For example, the types of losses that would be considered as part of the operational scenario analysis include information security risks such as the risk of a cyber-attack.
Compliance, Reputational, and Strategic Risks
Other risks to the Company include compliance risk, reputational risk and strategic risks. Compliance risk represents the risk that the Company will fail to comply with the laws, regulations, supervisory guidance, regulatory expectations, and rules and standards that govern the activities of the Company, including Regions’ Code of Business Conduct and Ethics. Reputational risk relates to the risk that negative publicity regarding Regions’ business practices, whether true or not, will affect the Company’s profitability, operations, customer base, or result in costly litigation. Strategic risk is the risk to the Company due to uncertainty and actions (or inaction) related to strategic risk factors, including negative effects from business planning or decisions, environmental changes, competitive dynamics, or management of our resources and activities. These risks are evaluated and incorporated into stress testing results through methods such as scenario analysis to determine possible impacts to Regions’ financial condition if these risks were to materialize.
Description of Methodologies Employed by Regions
For stress testing purposes, the methodologies described herein translate identified risks into potential revenue and loss projections over the nine-quarter planning horizon, which are then aggregated into a net income or loss estimate over the nine-quarter stress test horizon. The projections are then used to estimate Regions’ regulatory capital and key capital ratios throughout the nine quarters in accordance with codified guidance from Regions’ regulators when applicable. In addition to estimating capital accretion or depletion from net income or loss over the nine-quarter planning horizon, Regions also estimates
3
impacts to regulatory capital based on prescribed actions (as is the case with the Dodd-Frank Act Stress Test scenarios) or planned capital actions. The resulting regulatory capital ratios are then compared against management’s targeted levels, which is a key step in Regions’ internal capital adequacy assessment.
For loss estimation, Regions aims to project losses that are appropriately sensitive to macroeconomic conditions that, in the severely adverse scenario, are meant to produce significant loss estimates with a corresponding stress on Regions’ capital levels. Regions estimates losses at a level of granularity that promotes the ability to capture unique risk drivers across different asset types. As in financial reporting, Regions establishes its stressed Allowance for Loan and Lease Losses (“ALLL”) in compliance with U.S. generally accepted accounting principles (“GAAP”). The primary consideration in estimating the ALLL is the modeled losses in the severely adverse scenario over the nine-quarter forecast period. Quantitative analysis is employed to ensure that the modeled ALLL is appropriately established.
In the development of projections for pre-provision net revenue (“PPNR,” which consists of net interest income and other financing income on a fully tax-equivalent basis plus non-interest revenues less non-interest expenses), Regions derives granular revenue and expense estimates across the Company and aggregates enterprise-level results under each macroeconomic scenario. Most revenue and expense line items are projected through specific models or driver-based approaches that are sensitive to the underlying behaviors and risks reflected in each revenue or expense category. Regions makes several key assumptions in modeling PPNR, including a determination of market interest rate projections throughout the nine-quarter period. Other key assumptions specific to Regions that impact PPNR are the level of expenses, drivers of non-interest income, the amount of loan growth, pricing levels for the products and services offered to our customers, usage and utilization assumptions, and other revenue and expense drivers.
The process of projecting revenues and expenses often employs projections of related asset and liability balances. Thus, the balance sheet and income statement projection processes are designed to be internally consistent with macroeconomic conditions across balances, revenues, and expenses. As with PPNR, macroeconomic-dependent models are utilized to develop key balance estimates. In creating these estimates, the Company makes several assumptions in addition to those enumerated previously, such as estimating the behavior of customers in adverse conditions and predicting deposit behavior in stress environments. Key assumptions such as these are discussed and challenged through the review process for reasonableness and effectiveness.
Once a consolidated balance sheet is created, on-and off- balance sheet risk-weighted assets are estimated based upon the final balance sheet. Regions’ risk-weighted asset projection process applies risk weights directly to scenario-specific balance sheet estimates. In many cases, the granularity of the balance sheet estimate allows for risk weights to be applied directly to the appropriate balance.
In projecting losses, revenues, and expenses, the ability to translate macroeconomic factors and key risk measurements into pro forma estimates relies upon the utilization of models across Regions. Robust model development, documentation, validation, and overall model governance practices are critical to the revenue and loss estimation process. These models and estimates rely on a sound risk measurement and management infrastructure that supports the identification, measurement, assessment, and control of all material risks arising from the Company’s exposures.
A comprehensive and active governance structure provides oversight of Regions’ stress testing activities throughout the process. The governance structure is designed to review and challenge estimation methodologies to ensure that adverse projections are appropriately stressful and reflect best estimates of potential outcomes given the assumed economic conditions.
Summary of Results for Regions Financial Corporation
The estimates shown below reflect the assumptions and methodologies previously described in this document for the Company’s severely adverse scenario.
Projected Stressed Capital Ratios through Q3 2018 in Regions' Severely Adverse Scenario | ||||||||
Actual | Stressed Capital Ratios(1) | |||||||
Q2 2016 | Ending | Minimum | ||||||
Common equity tier 1 capital ratio (%) | 11.0 | % | 8.3 | % | 8.3 | % | ||
Tier 1 risk-based capital ratio (%) | 11.7 | % | 9.0 | % | 9.0 | % | ||
Total risk-based capital ratio (%) | 13.9 | % | 11.3 | % | 11.3 | % | ||
Tier 1 leverage ratio (%) | 10.2 | % | 7.9 | % | 7.9 | % | ||
4
_________
(1) | The capital ratios are calculated using capital action assumptions provided within the Dodd-Frank Act stress testing rule. These projections represent hypothetical estimates that involve an economic outcome that is more adverse than expected. These are estimates are not forecasts of expected losses, revenues, net income before taxes, or capital ratios. The minimum capital ratio presented is for the period Q3 2016 to Q3 2018. |
Actual Q2 2016 and Projected Q3 2018 Risk-Weighted Assets in Regions' Severely Adverse Scenario | |||
Actual Q2 2016 | Projected Q3 2018 | ||
Risk-weighted assets (billions of dollars) | $104.8 | $97.9 | |
Projected Losses, Revenue, and Net Income Before Taxes through Q3 2018 in Regions' Severely Adverse Scenario | |||||
Billions of Dollars | Percent of Average Assets(1) | ||||
Pre-provision net revenue(2) | $2.6 | 2.2 | % | ||
Other revenue | — | 0.0 | % | ||
less | |||||
Provisions | 5.5 | 4.5 | % | ||
Realized losses/(gains) on securities (AFS/HTM) | 0.1 | 0.1 | % | ||
Trading and counterparty losses | — | 0.0 | % | ||
Other losses/(gains) | — | 0.0 | % | ||
equals | |||||
Net (loss)/income before taxes(3) | (3.0) | (2.4 | )% | ||
Memo item | |||||
AOCI included in capital (billions of dollars)(4) | N/A | N/A | |||
_________
(1) | Average assets is the nine-quarter average of total assets. |
(2) | Pre-provision net revenue includes losses from operational risk events and credit related expenses, which include other real estate owned (OREO) costs. |
(3) | Net (loss)/income before taxes may not appear to foot due to rounding. |
(4) | As Regions is not an advanced approaches bank holding company (BHC) and opted out of including Accumulated Other Comprehensive Income ("AOCI") in regulatory capital calculations, AOCI balances are not applicable for the purposes of this disclosure. |
5
Projected Loan Losses by Type of Loan, Q3 2016 - Q3 2018 in Regions' Severely Adverse Scenario | |||||
Billions of Dollars | Portfolio Loss Rates (%)(1) | ||||
Loan Losses(2) | $3.75 | 4.8 | % | ||
First lien mortgages, domestic | 0.54 | 3.2 | % | ||
Junior liens and HELOCs, domestic | 0.46 | 6.0 | % | ||
Commercial and industrial(3) | 1.28 | 5.8 | % | ||
Commercial real estate, domestic(4) | 0.71 | 5.2 | % | ||
Credit cards | 0.20 | 18.9 | % | ||
Other consumer(5) | 0.39 | 8.0 | % | ||
Other loans | 0.17 | 1.4 | % | ||
_________
(1) | Average loan balances used to calculate portfolio loss rates exclude loans held for sale and loans held for investment under the fair-value option, and are calculated over nine quarters. |
(2) | Total loan losses may not agree to the sum of the individual categories due to rounding. |
(3) | Commercial and industrial loans includes small- and medium-enterprise loans and business credit cards. |
(4) | Commercial real estate loans includes owner-occupied and non-owner occupied commercial real estate loans, and loans secured by farmland. |
(5) | Other consumer loans include automobile loans. |
Summary of Results for Regions Bank
The following results reflect pro forma capital ratios for Regions Bank under the Company’s severely adverse scenario. These capital levels are derived using a process identical to that described in this document for the holding company. As with Regions Financial Corporation, Regions Bank’s capital ratios decline over the nine-quarter planning horizon in this theoretical severely adverse scenario as credit losses exceed PPNR generation. In its scenario planning, the Company assumes capital actions at Regions Bank during the planning horizon are in alignment with its internal capital adequacy assessment process. These actions, which may include dividends from or infusions into Regions Bank, as well as issuances, redemptions, or repurchases of capital securities, are based on projected capital levels relative to management’s targets and limits, among other factors.
Projected Stressed Capital Ratios through Q3 2018 in Regions' Severely Adverse Scenario | ||||||||
Actual | Stressed Capital Ratios(1) | |||||||
Q2 2016 | Ending | Minimum | ||||||
Common equity tier 1 capital ratio (%) | 11.8 | % | 10.3 | % | 10.3 | % | ||
Tier 1 risk-based capital ratio (%) | 11.8 | % | 10.3 | % | 10.3 | % | ||
Total risk-based capital ratio (%) | 13.7 | % | 12.2 | % | 12.2 | % | ||
Tier 1 leverage ratio (%) | 10.3 | % | 9.0 | % | 9.0 | % | ||
(1) | These projections represent hypothetical estimates that involve an economic outcome that is more adverse than expected. These estimates are not forecasts of expected losses, revenues, net income before taxes, or capital ratios. The minimum capital ratio presented is for the period Q3 2016 to Q3 2018. |
Actual Q2 2016 and Projected Q3 2018 Risk-Weighted Assets in Regions' Severely Adverse Scenario | |||
Actual Q2 2016 | Projected Q3 2018 | ||
Risk-weighted assets (billions of dollars) | $104.5 | $97.7 | |
6
Projected Losses, Revenue, and Net Income Before Taxes through Q3 2018 in Regions' Severely Adverse Scenario | |||||
Billions of Dollars | Percent of Average Assets(1) | ||||
Pre-provision net revenue(2) | $3.1 | 2.6 | % | ||
Other revenue | — | 0.0 | % | ||
less | |||||
Provisions | 5.5 | 4.6 | % | ||
Realized losses/(gains) on securities (AFS/HTM) | 0.1 | 0.1 | % | ||
Trading and counterparty losses | — | 0.0 | % | ||
Other losses/(gains) | — | 0.0 | % | ||
equals | |||||
Net (loss)/income before taxes(3) | (2.5) | (2.1 | )% | ||
Memo item | |||||
AOCI included in capital (billions of dollars)(4) | N/A | N/A | |||
(1) | Average assets is the nine-quarter average of total assets. |
(2) | Pre-provision net revenue includes losses from operational risk events and credit related expenses, which include other real estate owned (OREO) costs. |
(3) | Net (loss)/income before taxes may not appear to foot due to rounding. |
(4) | As Regions Financial Corporation is not an advanced approaches BHC and opted out of including AOCI in regulatory capital calculations, AOCI balances are not applicable for the purposes of this disclosure. |
Projected Loan Losses by Type of Loan, Q3 2016 - Q3 2018 in Regions' Severely Adverse Scenario | |||||
Billions of Dollars | Portfolio Loss Rates (%)(1) | ||||
Loan Losses(2) | $3.75 | 4.8 | % | ||
First lien mortgages, domestic | 0.54 | 3.2 | % | ||
Junior liens and HELOCs, domestic | 0.46 | 6.0 | % | ||
Commercial and industrial(3) | 1.28 | 5.8 | % | ||
Commercial real estate, domestic(4) | 0.71 | 5.2 | % | ||
Credit cards | 0.20 | 18.9 | % | ||
Other consumer(5) | 0.39 | 8.0 | % | ||
Other loans | 0.17 | 1.4 | % | ||
(1) | Average loan balances used to calculate portfolio loss rates exclude loans held for sale and loans held for investment under the fair-value option, and are calculated over nine quarters. |
(2) | Total loan losses may not agree to the sum of the individual categories due to rounding. |
(3) | Commercial and industrial loans includes small- and medium-enterprise loans and business credit cards. |
(4) | Commercial real estate loans includes owner-occupied and non-owner occupied commercial real estate loans, and loans secured by farmland. |
(5) | Other consumer loans include automobile loans. |
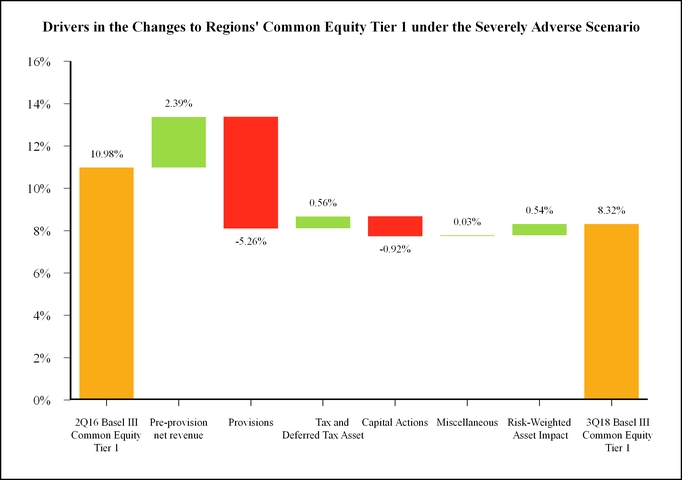
Explanation of the Most Significant Causes for the Changes in Regulatory Capital Ratios
The severely adverse scenario results in meaningful projected declines in regulatory capital ratios at both Regions and Regions Bank. In each case, these declines are primarily driven by credit losses prompted by a deteriorating economy, which are accompanied by declines in PPNR as market interest rates remain low and asset generation weakens. As detailed in the summary of results tables, this leads to a pre-tax net loss of approximately $3.0 billion over the forecast horizon for Regions and a $2.5 billion pre-tax net loss for Regions Bank on a stand-alone basis. With respect to regulatory capital ratios for both Regions and Regions Bank, effects from credit losses and lower PPNR income are partially offset by the projected balance sheet deleveraging evident in moderately lower ending risk-weighted asset balances. Additionally, the Federal Reserve’s
7
prescribed Dodd-Frank Act capital action assumption that the Company would continue to pay an average common stock dividend of approximately $0.0625 per share during the relevant period has a material impact on the resulting stressed capital levels, which may not be the capital actions pursued if a similar scenario were to actually unfold. The combination of the factors described previously account for the vast majority of the projected variation in regulatory capital ratios across the nine-quarter horizon in the severely adverse scenario.
8
Serious News for Serious Traders! Try StreetInsider.com Premium Free!
You May Also Be Interested In
- Regions Financial (RF) PT Lowered to $20 at Truist Securities
- Blackstone Credit and Insurance appoints Dan Leiter as Head of International
- Mativ Announces Appointment of New Chair of its Board of Directors
Create E-mail Alert Related Categories
SEC FilingsSign up for StreetInsider Free!
Receive full access to all new and archived articles, unlimited portfolio tracking, e-mail alerts, custom newswires and RSS feeds - and more!
