Form 8-K SALESFORCE COM INC For: Oct 04
UNITED STATES
SECURITIES AND EXCHANGE COMMISSION
Washington, D.C. 20549
________________________________________________________
FORM 8-K
________________________________________________________
CURRENT REPORT
Pursuant to Section 13 or 15(d) of the
Securities Exchange Act of 1934
October 4, 2016
Date of Report (Date of earliest event reported)
__________________________________________________________
salesforce.com, inc.
(Exact name of registrant as specified in its charter)
__________________________________________________________
Delaware | 001-32224 | 94-3320693 | ||
(State or other jurisdiction of incorporation) | (Commission File Number) | (I. R. S. Employer Identification No.) | ||
The Landmark @ One Market, Suite 300
San Francisco, CA 94105
(Address of principal executive offices)
Registrant’s telephone number, including area code: (415) 901-7000
N/A
(Former name or former address, if changed since last report)
________________________________________________
Check the appropriate box below if the Form 8-K filing is intended to simultaneously satisfy the filing obligation of the registrant under any of the following provisions (see General Instruction A.2. below):
¨ | Written communications pursuant to Rule 425 under the Securities Act (17 CFR 230.425) |
¨ | Soliciting material pursuant to Rule 14a-12 under the Exchange Act (17 CFR 240.14a-12) |
¨ | Pre-commencement communications pursuant to Rule 14d-2(b) under the Exchange Act (17 CFR 240.14d-2(b)) |
¨ | Pre-commencement communications pursuant to Rule 13e-4(c) under the Exchange Act (17 CFR 240.13e-4(c)) |
Item 8.01 Other Events.
On October 4, 2016, salesforce.com, inc., a Delaware corporation (the “Company”), posted to its website an investor presentation that the Company presented at its Analyst Day event held and audiocast live on its website on that date, including information regarding the Company’s financial performance, market opportunity, competitive position and economic model. A copy of the presentation is included with this Form 8-K for convenience and attached hereto as Exhibit 99.1.
The information in this current report on Form 8-K and the exhibit attached hereto shall not be deemed “filed” for purposes of Section 18 of the Securities Exchange Act of 1934, as amended (the “Exchange Act”) or otherwise subject to the liabilities of that section, nor shall it be deemed incorporated by reference in any filing under the Securities Act of 1933, as amended, or the Exchange Act, regardless of any general incorporation language in such filing.
Item 9.01 Financial Statements and Exhibits.
(d) Exhibits
Exhibit No. | Description | |
99.1 | Salesforce.com, inc. investor presentation dated October 4, 2016 | |
SIGNATURE
Pursuant to the requirements of the Securities Exchange Act of 1934, as amended, the Registrant has duly caused this report to be signed on its behalf by the undersigned hereunto duly authorized.
Dated: October 4, 2016 | SALESFORCE.COM, INC. | |||||||
By: | /s/ Mark J. Hawkins | |||||||
Name: | Mark J. Hawkins | |||||||
Title: | Executive Vice President and Chief Financial Officer | |||||||
EXHIBIT INDEX
Exhibit No. | Description | |
99.1 | Salesforce.com, inc. investor presentation dated October 4, 2016 | |


Safe Harbor
Safe harbor statement under the Private Securities Litigation Reform Act of 1995:
This presentation contains forward-looking statements about our financial and operational results. The achievement or success of the
matters covered by such forward-looking statements involves risks, uncertainties and assumptions. If any such risks or uncertainties
materialize or if any of the assumptions prove incorrect, our results could differ materially from the results expressed or implied by the
forward-looking statements we make.
The risks and uncertainties referred to above include -- but are not limited to -- risks associated with past and future acquisitions; risks
associated with possible fluctuations in our financial and operating results, such as our rate of growth and anticipated revenue run rate;
foreign currency exchange rates; errors, interruptions or delays in our services or our Web hosting; breaches of our security measures; the
nature of our business model; our ability to continue to release, and gain customer acceptance of, new and improved versions of our
services; successful customer deployment and utilization of our existing and future services; changes in our sales cycle; competition; various
financial aspects of our subscription model; unexpected increases in attrition or decreases in new business; our ability to realize benefits
from strategic partnerships and strategic investments; the emerging markets in which we operate; unique aspects of entering or expanding in
international markets, our ability to hire, retain and motivate employees and manage our growth; changes in our customer base;
technological developments; regulatory developments; litigation related to intellectual property and other matters, and any related claims,
negotiations and settlements; unanticipated changes in our effective tax rate; factors affecting our outstanding convertible notes and
revolving credit facility; fluctuations in the number of our shares outstanding and the price of such shares; collection of receivables; interest
rates; factors affecting our deferred tax assets and ability to value and utilize them; the potential negative impact of indirect tax exposure; the
risks and expenses associated with our real estate and office facilities space; and general developments in the economy, financial markets,
and credit markets.
Further information on these and other factors that could affect the financial results of salesforce.com, inc. is included in the reports on Forms
10-K, 10-Q and 8-K and in other filings we make with the Securities and Exchange Commission, available on the SEC Filings section of the
Investor Information section of our Investor Relations website.
Any unreleased services or features referenced in this or other presentations, press releases or public statements are not currently available
and may not be delivered on time or at all. Customers who purchase our services should make the purchase decisions based upon features
that are currently available. Salesforce.com, inc. assumes no obligation and does not intend to update these forward-looking statements.

`
Agenda
Tuesday, October 4
Mark Hawkins
David Havlek
Alex Dayon
Mike Rosenbaum
Bob Stutz
Stephanie Buscemi
Adam Seligman
John Wookey
Keith Block
Tyler Prince
10:00a
Business
Review &
Q&A
11:30a
Lunch 1:00p
Product
Q&A
2:45p
Go-to-
Market Q&A
Parker Harris
4:15p
Technology
Q&A
St. Regis Foyer
5:00p
Reception
St. Regis Terrace

`
Agenda
Wednesday, October 5
Mark Hawkins
David Havlek
Keith Block
Tyler Prince
10:00a
Business
Review &
Q&A
11:30a
Lunch
2:45p
Go-to-
Market Q&A
Parker Harris
4:15p
Technology
Q&A
St. Regis Foyer
5:00p
Reception
St. Regis Terrace
Wed. 10/5
3:30p
CEO Q&A
Marc Benioff
Alex Dayon
Mike Rosenbaum
Bob Stutz
Stephanie Buscemi
Adam Seligman
John Wookey
1:00p
Product
Q&A

IoT
Scaling to $20B and Beyond
Salesforce Investor Day
October 4, 2016

Competitive
Advantage with
Strong Core
MARK HAWKINS
CFO

`
1All references to operating margin refer to non-GAAP operating margin. Non-GAAP operating margin excludes the effects of stock-based compensation, amortization of purchased intangibles, lease termination resulting from purchase of office
building, and the potential impact of FX and M&A. A complete reconciliation of GAAP to non-GAAP measures can be found in the Appendix and at www.salesforce.com.
Growth/Margin Framework is Our Compass…
Balancing growth with improving profitability
PRIORITY
REV. GROWTH
NON-GAAP
OP. MARGIN
OCF GROWTH
Top Line
> 30%
Flat to Up Slightly
< Revenue Growth
Top & Bottom Line
20%-30%
+100-300 bps
≈ Revenue Growth
Bottom Line
< 20%
+200-400 bps
> Revenue Growth
HIGH GROWTH GROWTH LOW GROWTH
1
Mid-30s
percent
LONG-TERM OP.
MARGIN AT MATURITY

…and We’re on the Right Path
Strong core performance
Note: FY17 estimates represent guidance ranges provided August 31, 2016. Non-GAAP operating margin excludes the effects of stock-based compensation, amortization of purchased intangibles, and lease termination resulting from purchase of office
building. A complete reconciliation of GAAP to non-GAAP measures can be found in the Appendix and atwww.salesforce.com.
$4,071M
$5,374M
$6,667M
$8,275M-
$8,325M
8.9%
10.7%
12.4%
13.1%
FY14 FY15 FY16 FY17E
Revenue Non-GAAP Operating Margin
$884M
$1,181M
$1,672M
$2,000M+
FY14 FY15 FY16 FY17E
Operating Cash Flow
REVENUE
FY14 – FY17E
OCF
FY14 – FY17E
20%-
21%
Y/Y
EST.

Positioned for $20 Billion and Beyond
Fourth largest enterprise software company
Note: Salesforce consensus based on FY17 and FY18 analyst estimates per FactSet. All other consensus estimates represent annualized CY2016 and CY2017 per FactSet.
Welcome to
Base Camp
MT. REVENUE
Rank Company
FY17
Consensus
FY18
Consensus
YoY
Growth Rate
1 Microsoft $93.3 B $97.2 B 4%
2 Oracle $37.5 B $38.2 B 2%
3 SAP $24.3 B $25.8 B 6%
4 Salesforce $8.3 B $10.1 B 22%
5 VMware $7.0 B $7.3 B 4%

$7B $8B $9B $10B $11B
$12B $13B
$15B $17B
$19B
$26B
$28B
$30B
$32B
$34B $7B
$8B
$10B
$12B
$14B
$14B
$15B
$17B
$18B
$19B
$5B
$6B
$6B
$7B
$8B
$70B
$78B
$86B
$95B
$105B
2016 2017 2018 2019 2020
Total Market 11%
19%
CAGR % CY16-20
15%
8%
8%
13%
12%
Current Products Support $20 Billion Objective
Massive and growing TAM
Calculations performed by Salesforce and charts/graphics created by Salesforce based on Gartner research. Source: Gartner Forecast Enterprise Software Markets, Worldwide, 2013-2020, 3Q16 Update; Sales Cloud market defined as Sales; Service
Cloud market defined as Customer Service and Support; Marketing Cloud market defined as Marketing; Commerce Cloud market defined as Digital Commerce Platforms; Analytics Cloud market defined as Modern BI Platforms, Traditional BI
Platforms, Analytic Applications and Performance Management, and Advanced Analytics Platforms; App & Other market defined as Application Platform Software, Other AD, Application Platform as a Service (aPaaS), Business Process Management
Suites, Data Integration Tools, Identity Governance and Administration, Mobile App Development Platforms, Testing, Web Access Management (WAM), Application Services Governance, Collaboration/Social Software Suites, and Portal and Digital
Engagement Technologies. Annual totals and CAGRs are based on actual numbers and not on rounded numbers shown above.
COMMERCE
ANALYTICS
MARKETING
APP & OTHER
SERVICE
SALES

Consistent Share Gain
Extending our #1 CRM market share position
Source: Industry analysts, market research and Salesforce estimates. CRM market includes sales, customer service and support, and marketing software.
5.7%
4.3%
12.6%
7.8%
14.3%
10.2% 10.6%
19.7%
FY11 FY12 FY13 FY14 FY15 FY16

`
Competitive Advantage
Product Strength and
Innovation
Large, Loyal
Installed Base
World-Class Team
and Culture
Cloud
Mobile
Social
IoT
AI

17 Years of Unmatched Customer Innovation
Leader in capitalizing on key technology shifts
Multi-tenant
Cloud
Thunder
IoT Cloud
AppExchange
2005
Force.com
2007
Chatter
2009
Salesforce1
2013
Lightning
Platform
2014
Salesforce IQ
2015 1999
Wave
Analytics Cloud
Cloud
Socia
l
Mobile
IoT
AI
2016
Salesforce
Einstein

Undisputed CRM Product Leader
Community
Cloud
App
Cloud
Service
Cloud
Sales
Cloud
Marketing
Cloud
CommerceC
loud
Industry-Leading Products
Sources: Industry analyst reports.
Innovator of
the Decade
MT. PRODUCT

Strategy Focused on the Front Office
Everything we do is about the customer
Assisted
Service
Smart
Apps
Connected
Products
Intelligent
Communities
Actionable
Analytics
Guided
Sales
Unified
Commerce
Predictive
Marketing

M&A Strategy is Two-Fold
Augments existing clouds or accelerates new product initiatives
Minhash
Sales
Service
Marketing
Community
Analytics
Platform & Apps
Commerce
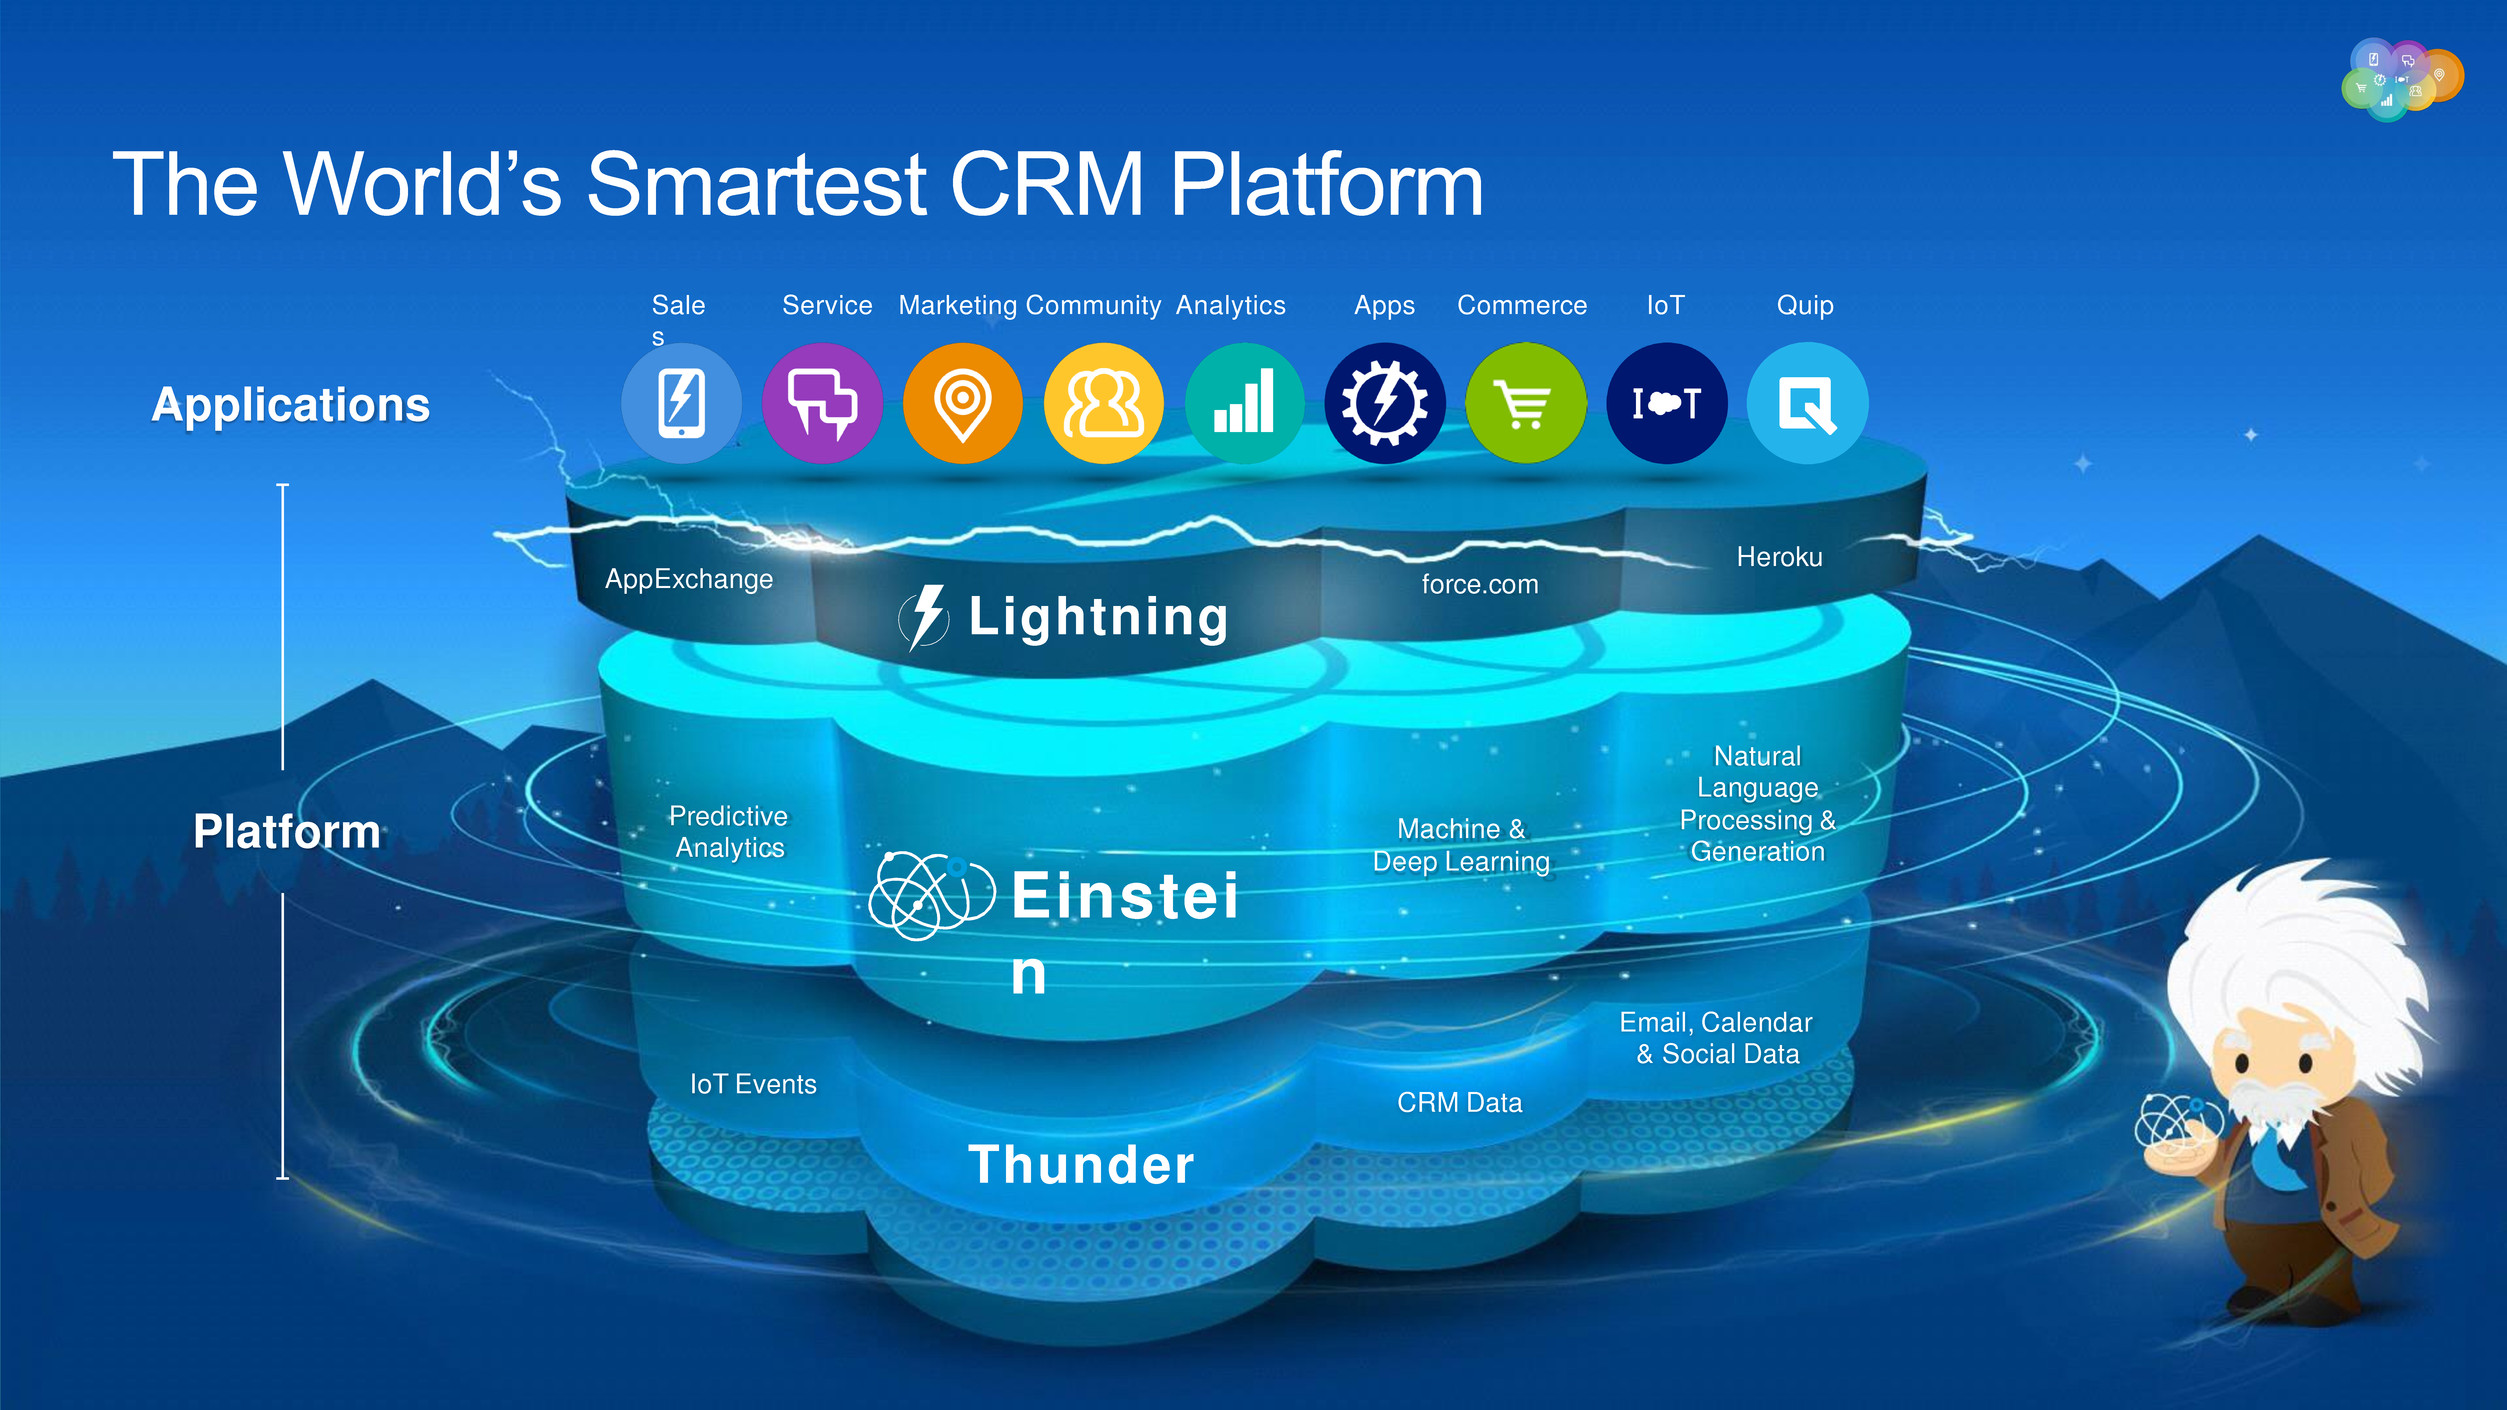
Einstei
n
Lightning
force.com
Heroku
AppExchange
Thunder
Sale
s
Service Marketing Community Analytics Apps Commerce IoT
Predictive
Analytics
Machine &
Deep Learning
Natural
Language
Processing &
Generation Platform
Applications
Email, Calendar
& Social Data
CRM Data
IoT Events
Quip
The World’s Smartest CRM Platform
`
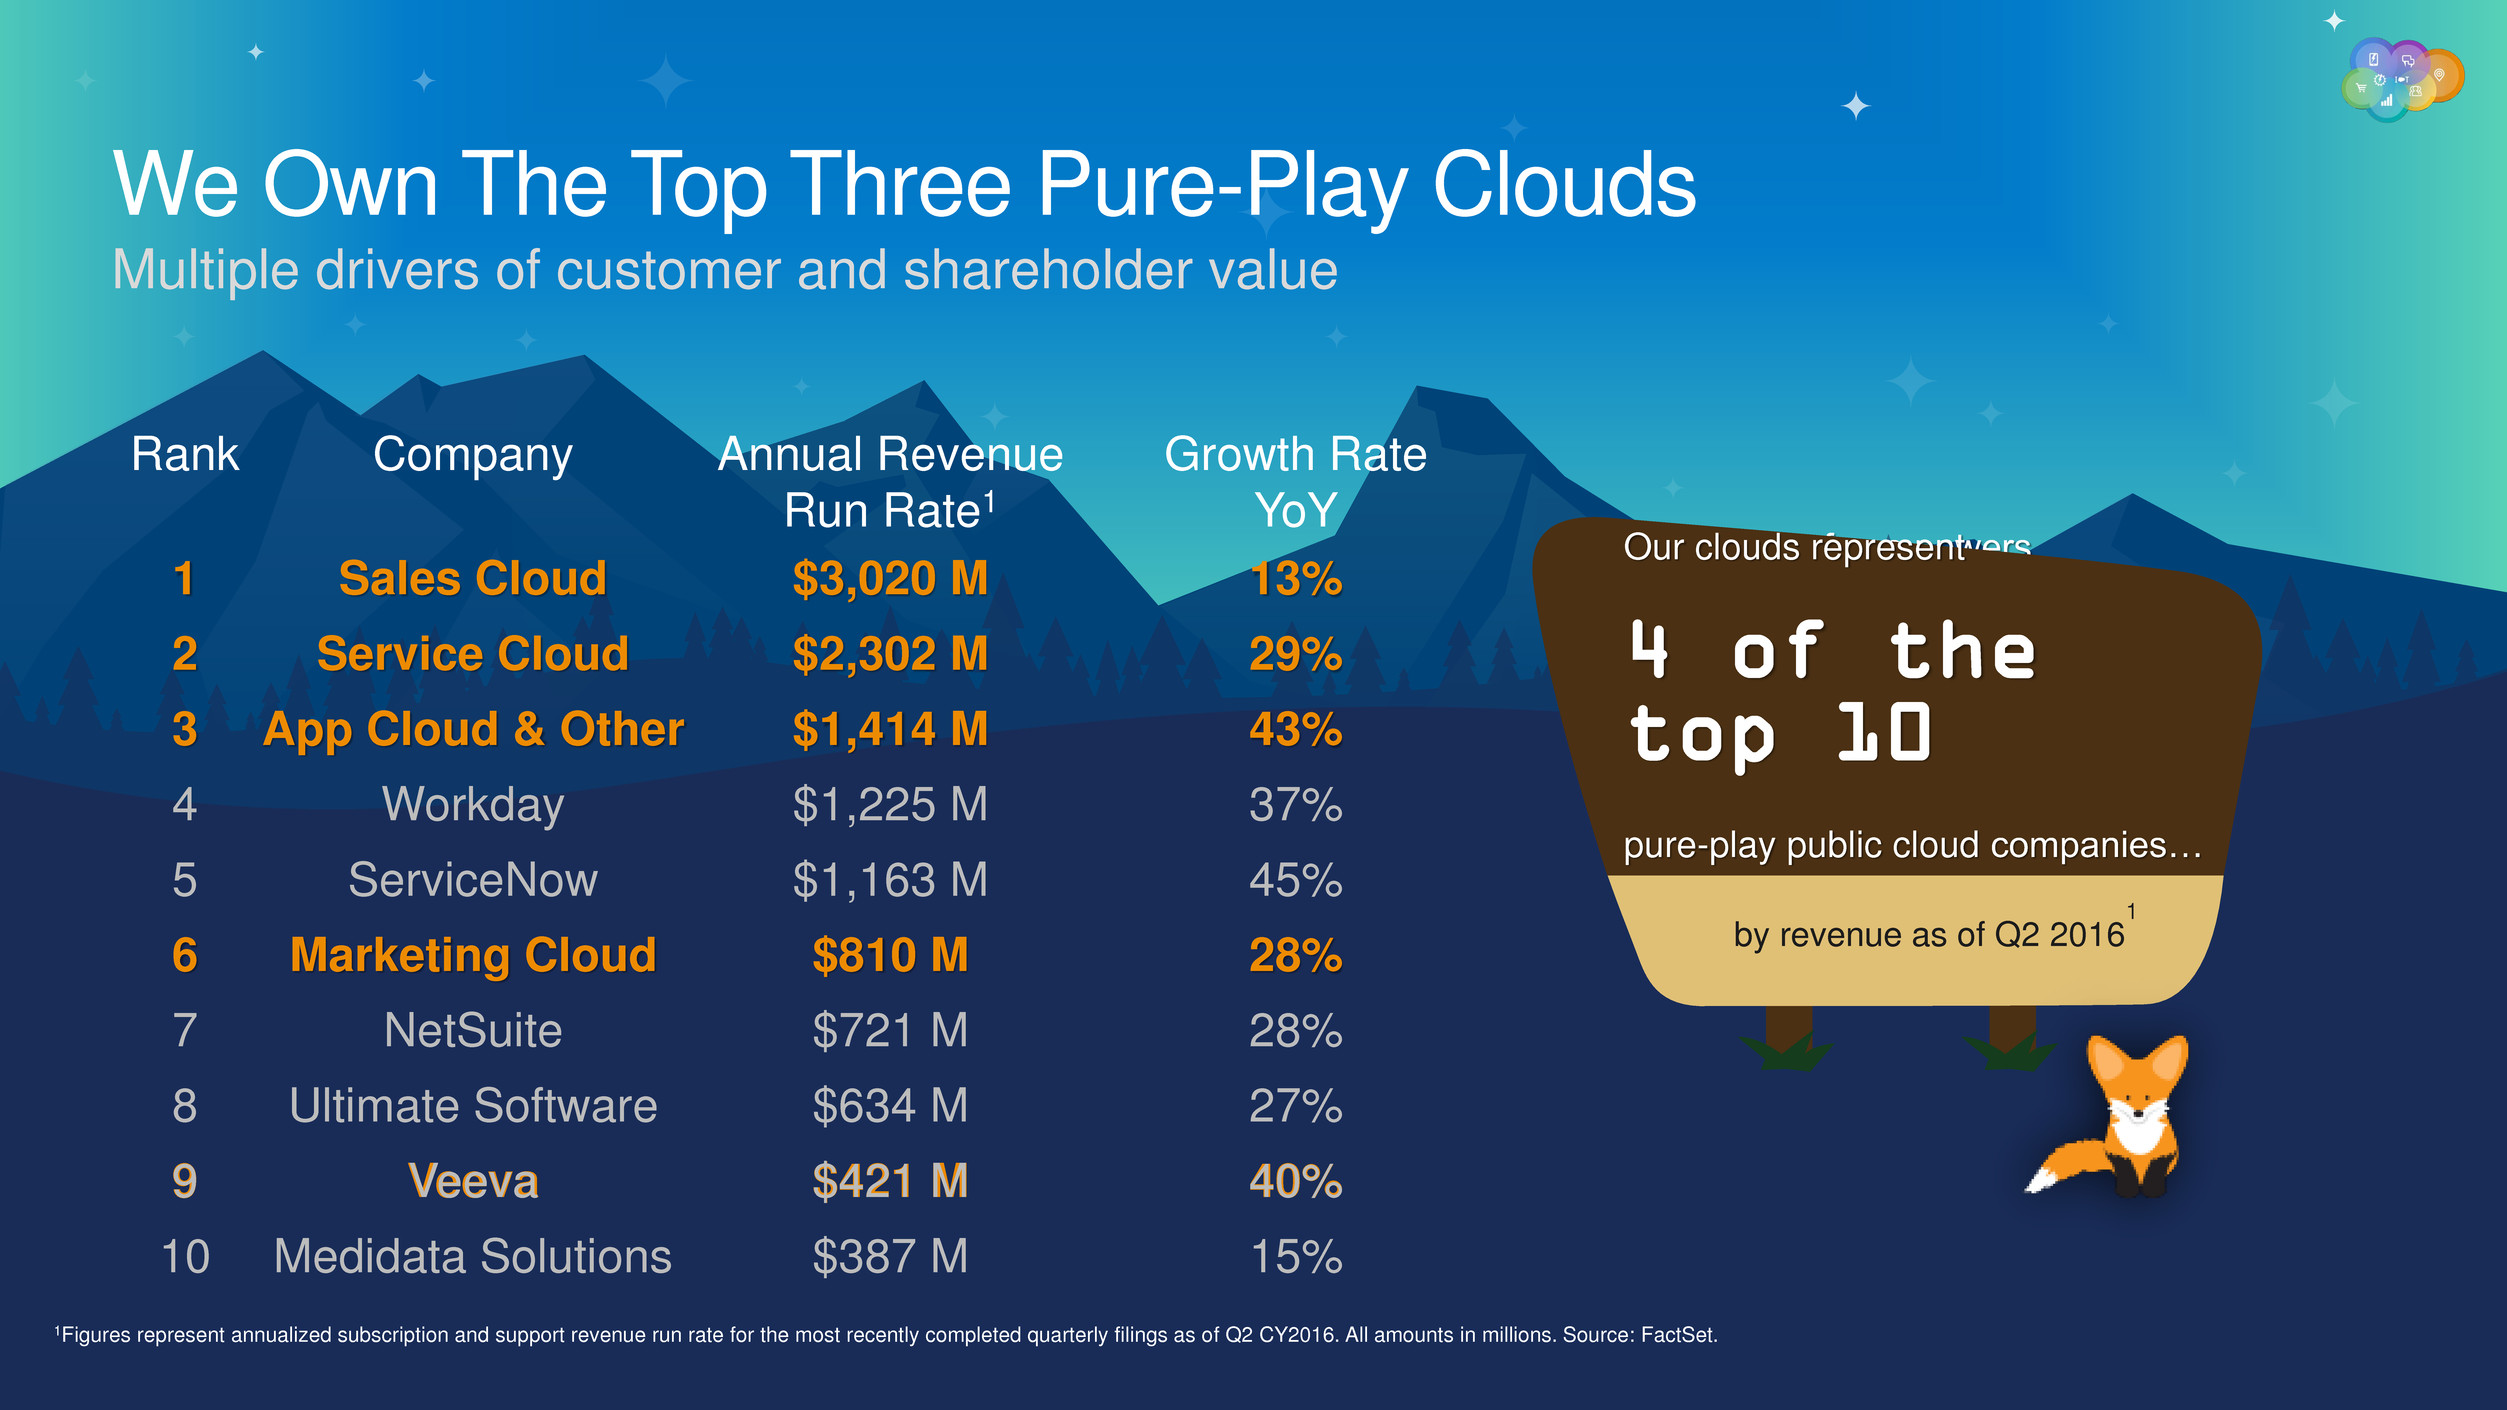
Rank Company Annual Revenue
Run Rate1
Growth Rate
YoY
1 Sales Cloud $3,020 M 13%
2 Service Cloud $2,302 M 29%
3 App Cloud & Other $1,414 M 43%
4 Workday $1,225 M 37%
5 ServiceNow $1,163 M 45%
6 Marketing Cloud $810 M 28%
7 NetSuite $721 M 28%
8 Ultimate Software $634 M 27%
9 Veeva $421 M 40%
10 Medidata Solutions $387 M 15%
by revenue as of Q2 2016
1
…and Salesforce powers
5 of the
top 10
pure-play public cloud companies…
Our clouds represent
4 o
1Figures represent annualized subscription and support revenue run rate for the most recently completed quarterly filings as of Q2 CY2016. All amounts in millions. Source: FactSet.
We Own The Top Three Pure-Play Clouds
Multiple drivers of customer and shareholder value

`
`
1Represents percentage of new business in which partners were involved during H117.
2Represents the increase in certified consultants during FY16
Unparalleled Cloud Ecosystem
Partners accelerate our value and opportunity
49%
Partner involvement
in new business
+30%
Number of certified
consultants 4M
Appexchange
installations
1
2

`
Competitive Advantage
Cloud
Mobile
Social
IoT
AI
World-Class Team
and Culture
Large, Loyal
Installed Base
Product Strength and
Innovation
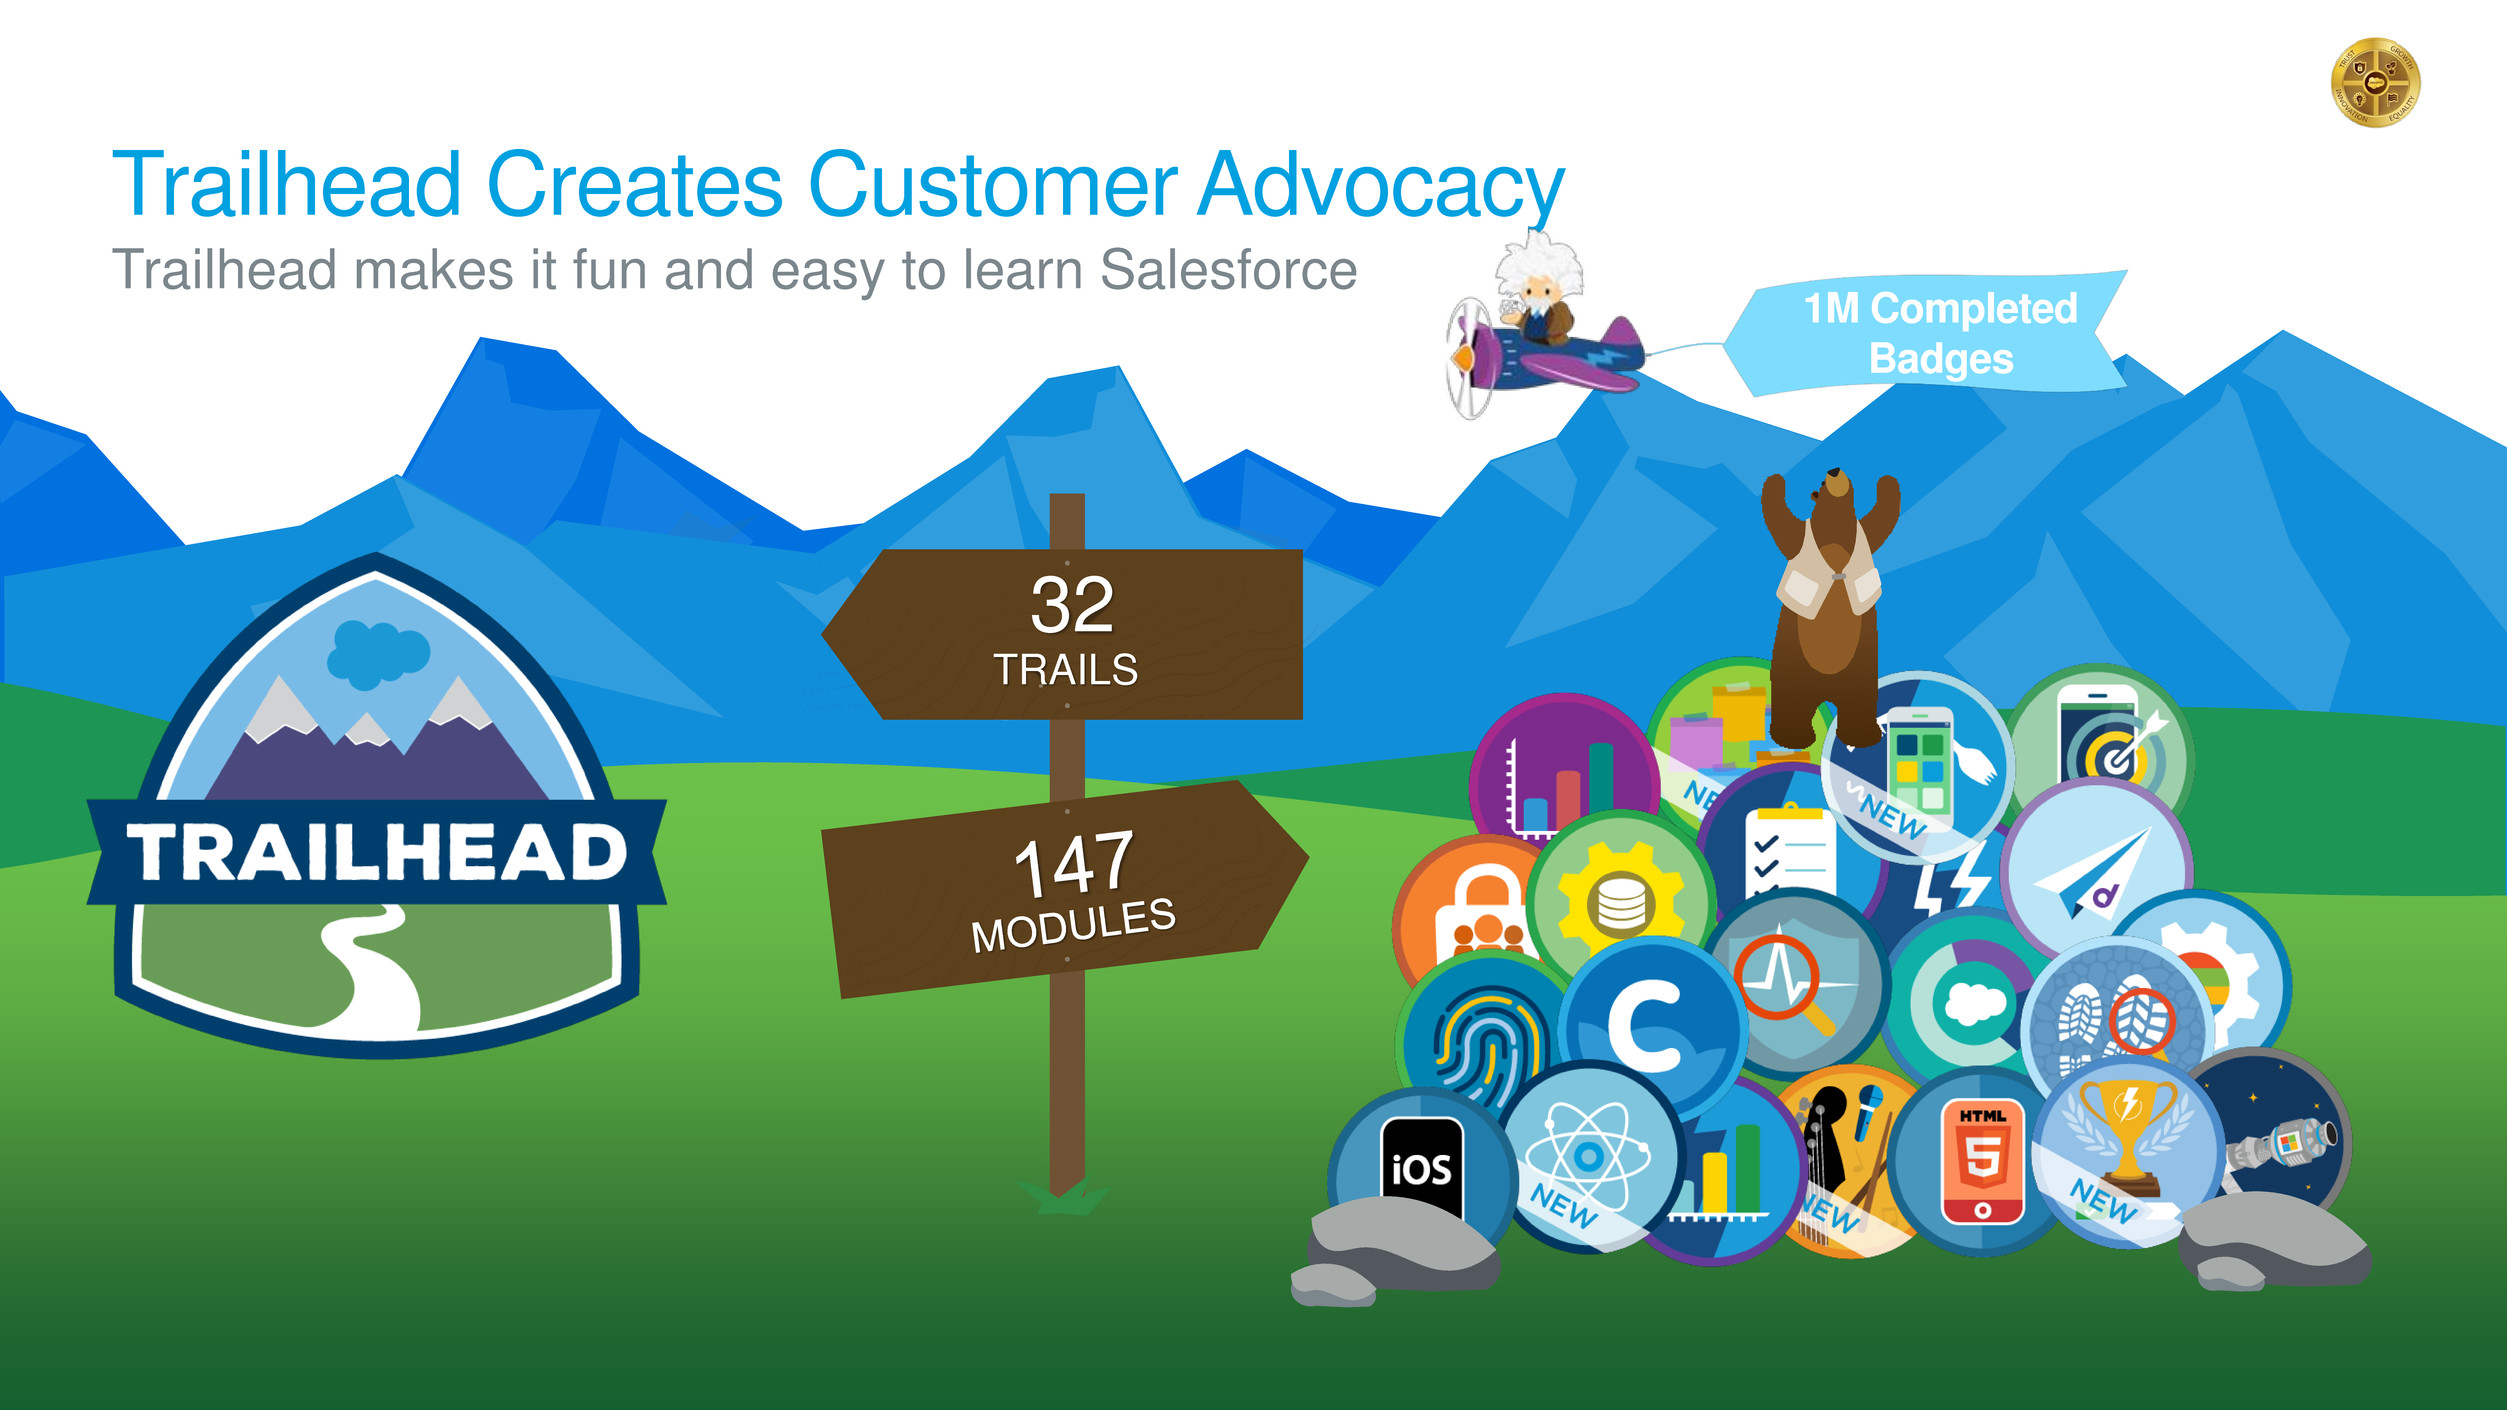
1M Completed
Badges
Trailhead Creates Customer Advocacy
Trailhead makes it fun and easy to learn Salesforce
TRAILS
32

`
Note: Chart of dollar attrition as a percentage of revenue when compared to the year-ago period for Sales Cloud, Service Cloud and the Force.com Platform. Numbers represent the second quarter for each respective year. $500 million run-rate savings
is calculated by applying the difference in attrition rate from Q211 to Q217 by FY16 annual revenue.
Customer Loyalty Drives Declining Attrition
Attrition rate is down 45% since FY11
0%
10%
20%
Q211 Q212 Q213 Q214 Q215 Q216 Q217
run-rate savings
~$500M
dollar attrition
<9%

Installed Base is an Important Growth Asset
150K+ customers and growing
Note: Ratios are based on annual revenue contribution for the four fiscal quarters ending Q217.
40%
60%
70%
30%
ADD-ONS &
UPGRADES
NEW PRODUCTS
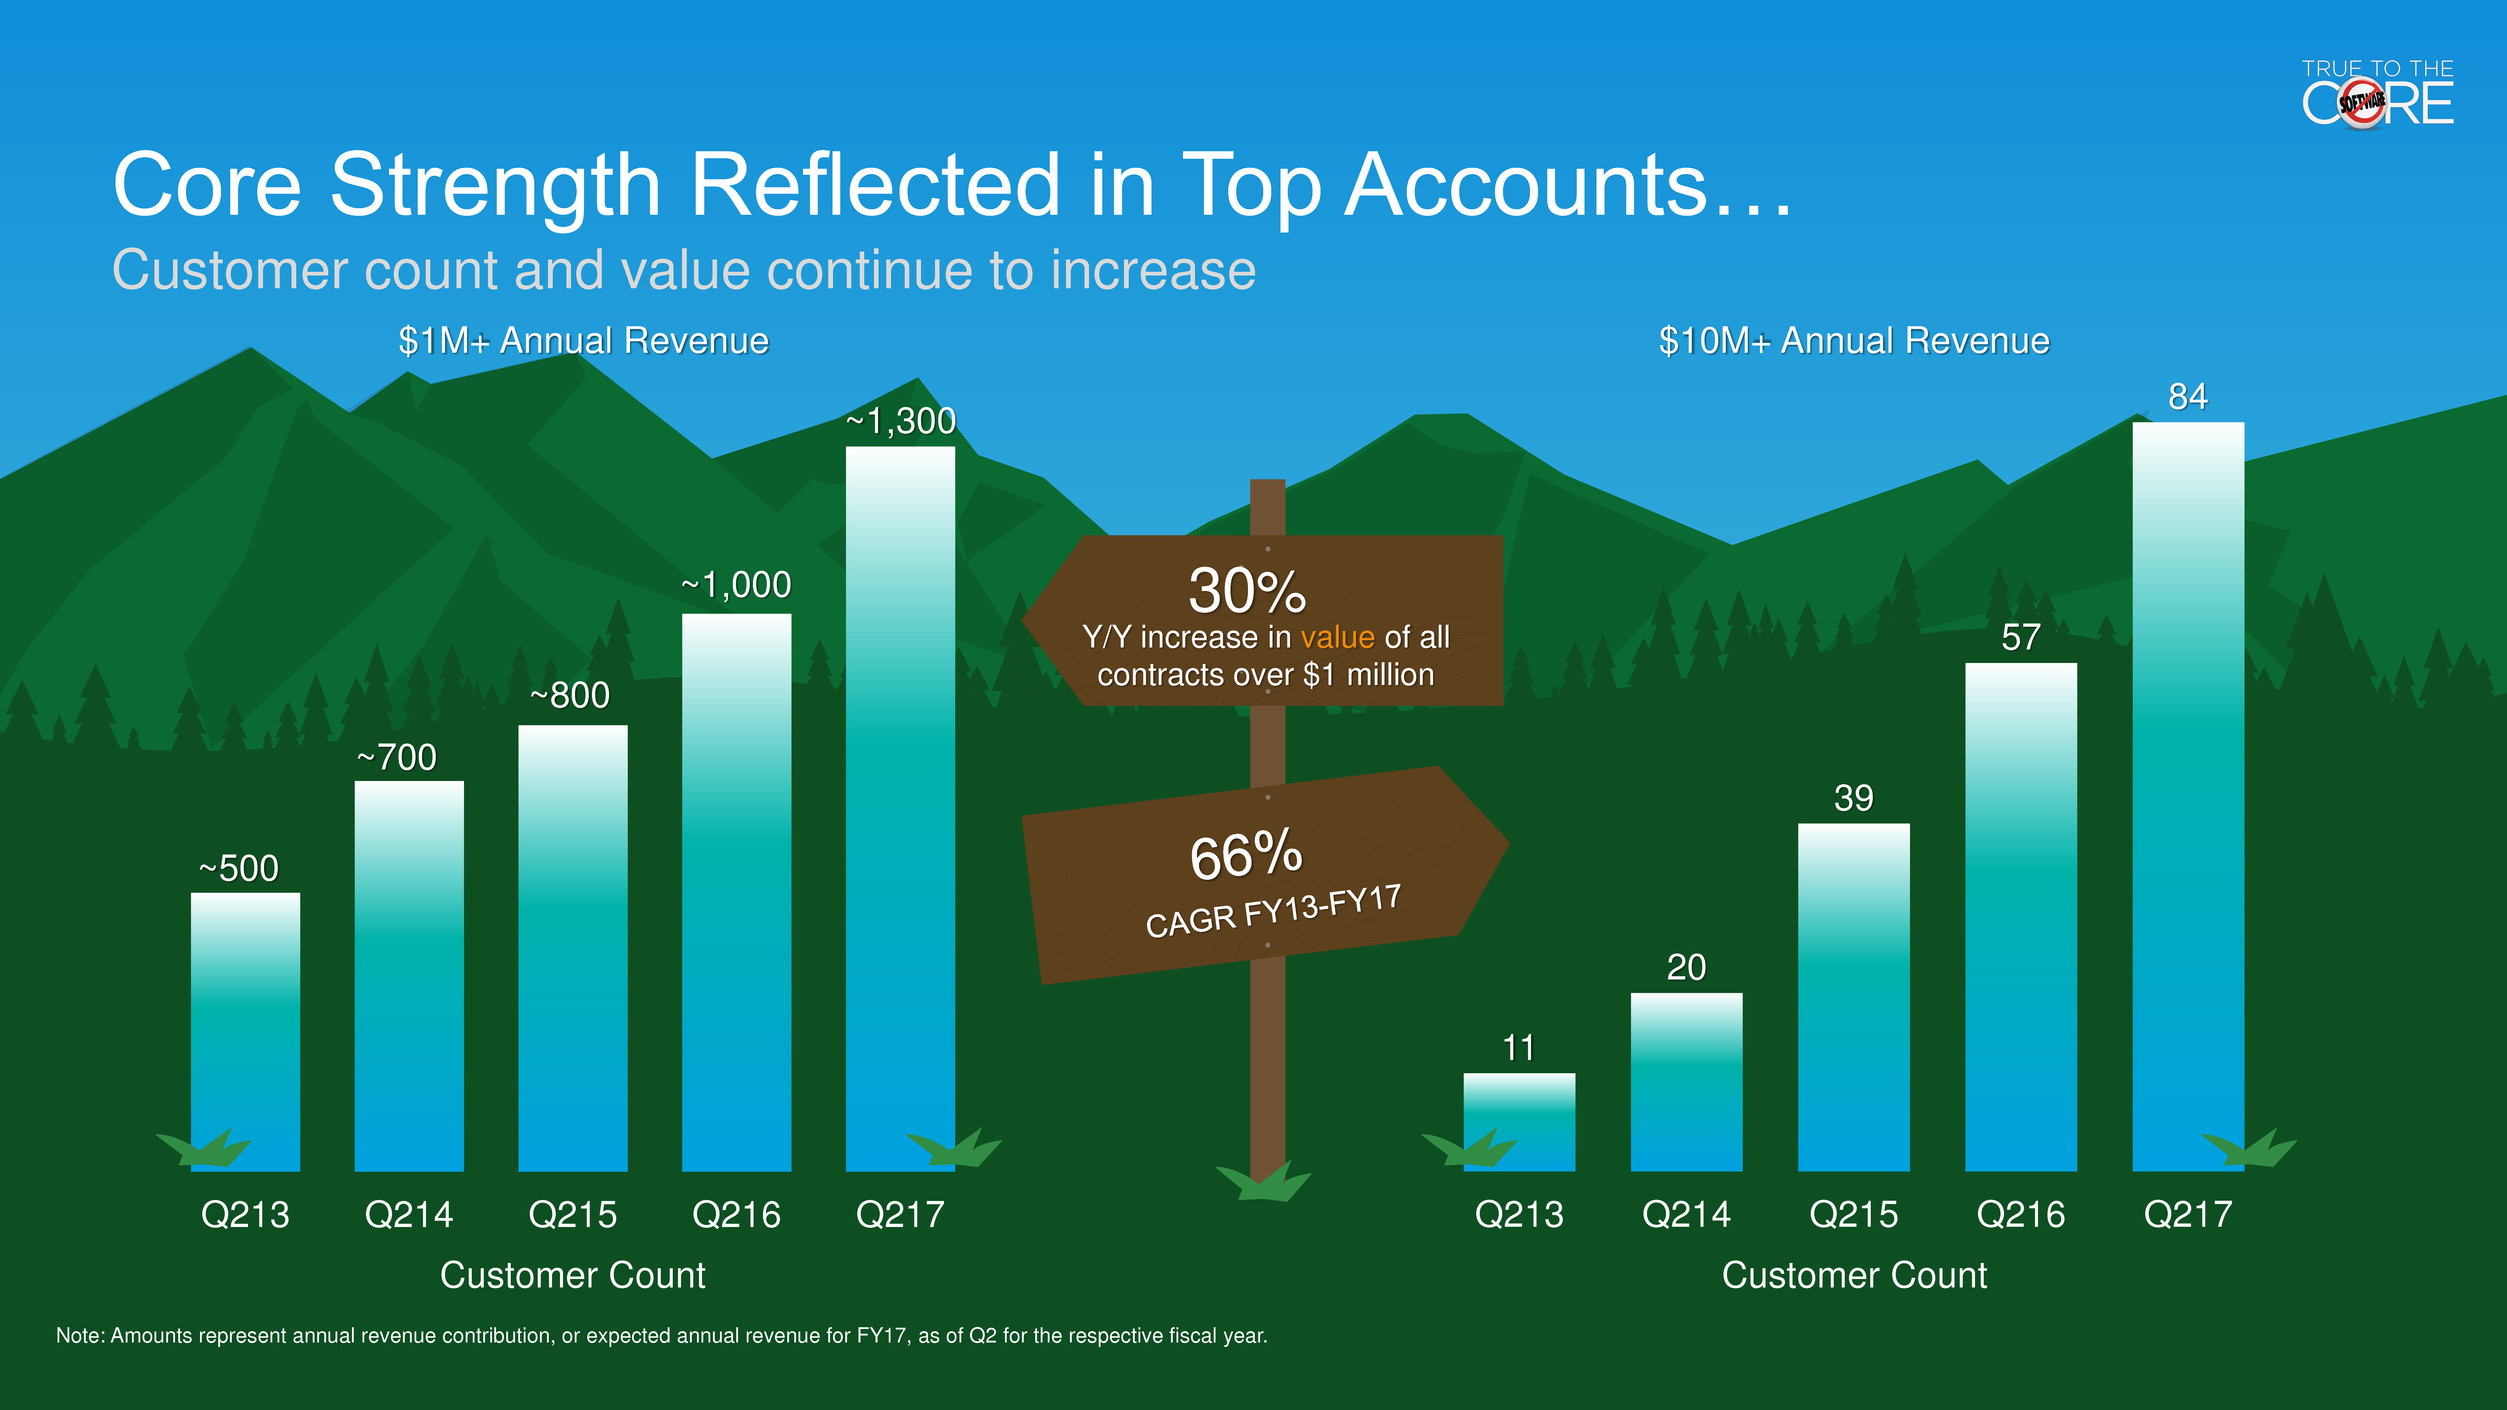
Core Strength Reflected in Top Accounts…
Customer count and value continue to increase
11
20
39
57
84
Q213 Q214 Q215 Q216 Q217
Note: Amounts represent annual revenue contribution, or expected annual revenue for FY17, as of Q2 for the respective fiscal year.
Customer Count
~500
~700
~800
~1,000
~1,300
Q213 Q214 Q215 Q216 Q217
Customer Count
$1M+ Annual Revenue $10M+ Annual Revenue
Y/Y increase in value of all
contracts over $1 million
30%

…and is Matched by Strength in SMB
Revenue from SMB customers has grown >30% annually
Note: Amounts represent annual revenue contribution, or expected annual revenue for FY17, as of Q2 for the respective fiscal year. Q217 SMB annual revenue contribution more than three times larger than Q213 SMB annual revenue contribution.
SMB is defined as customers with up to 3,500 employees.
8%
11%
15%
19%
22%
92%
89%
85%
81%
78%
Q213
Q214
Q215
Q216
Q217
Proportion of Revenue from Customers
Paying >$1M annually
Proportion of Revenue from Customers
Paying <$1M annually
SMB Annual Revenue Contribution
3X
`
`
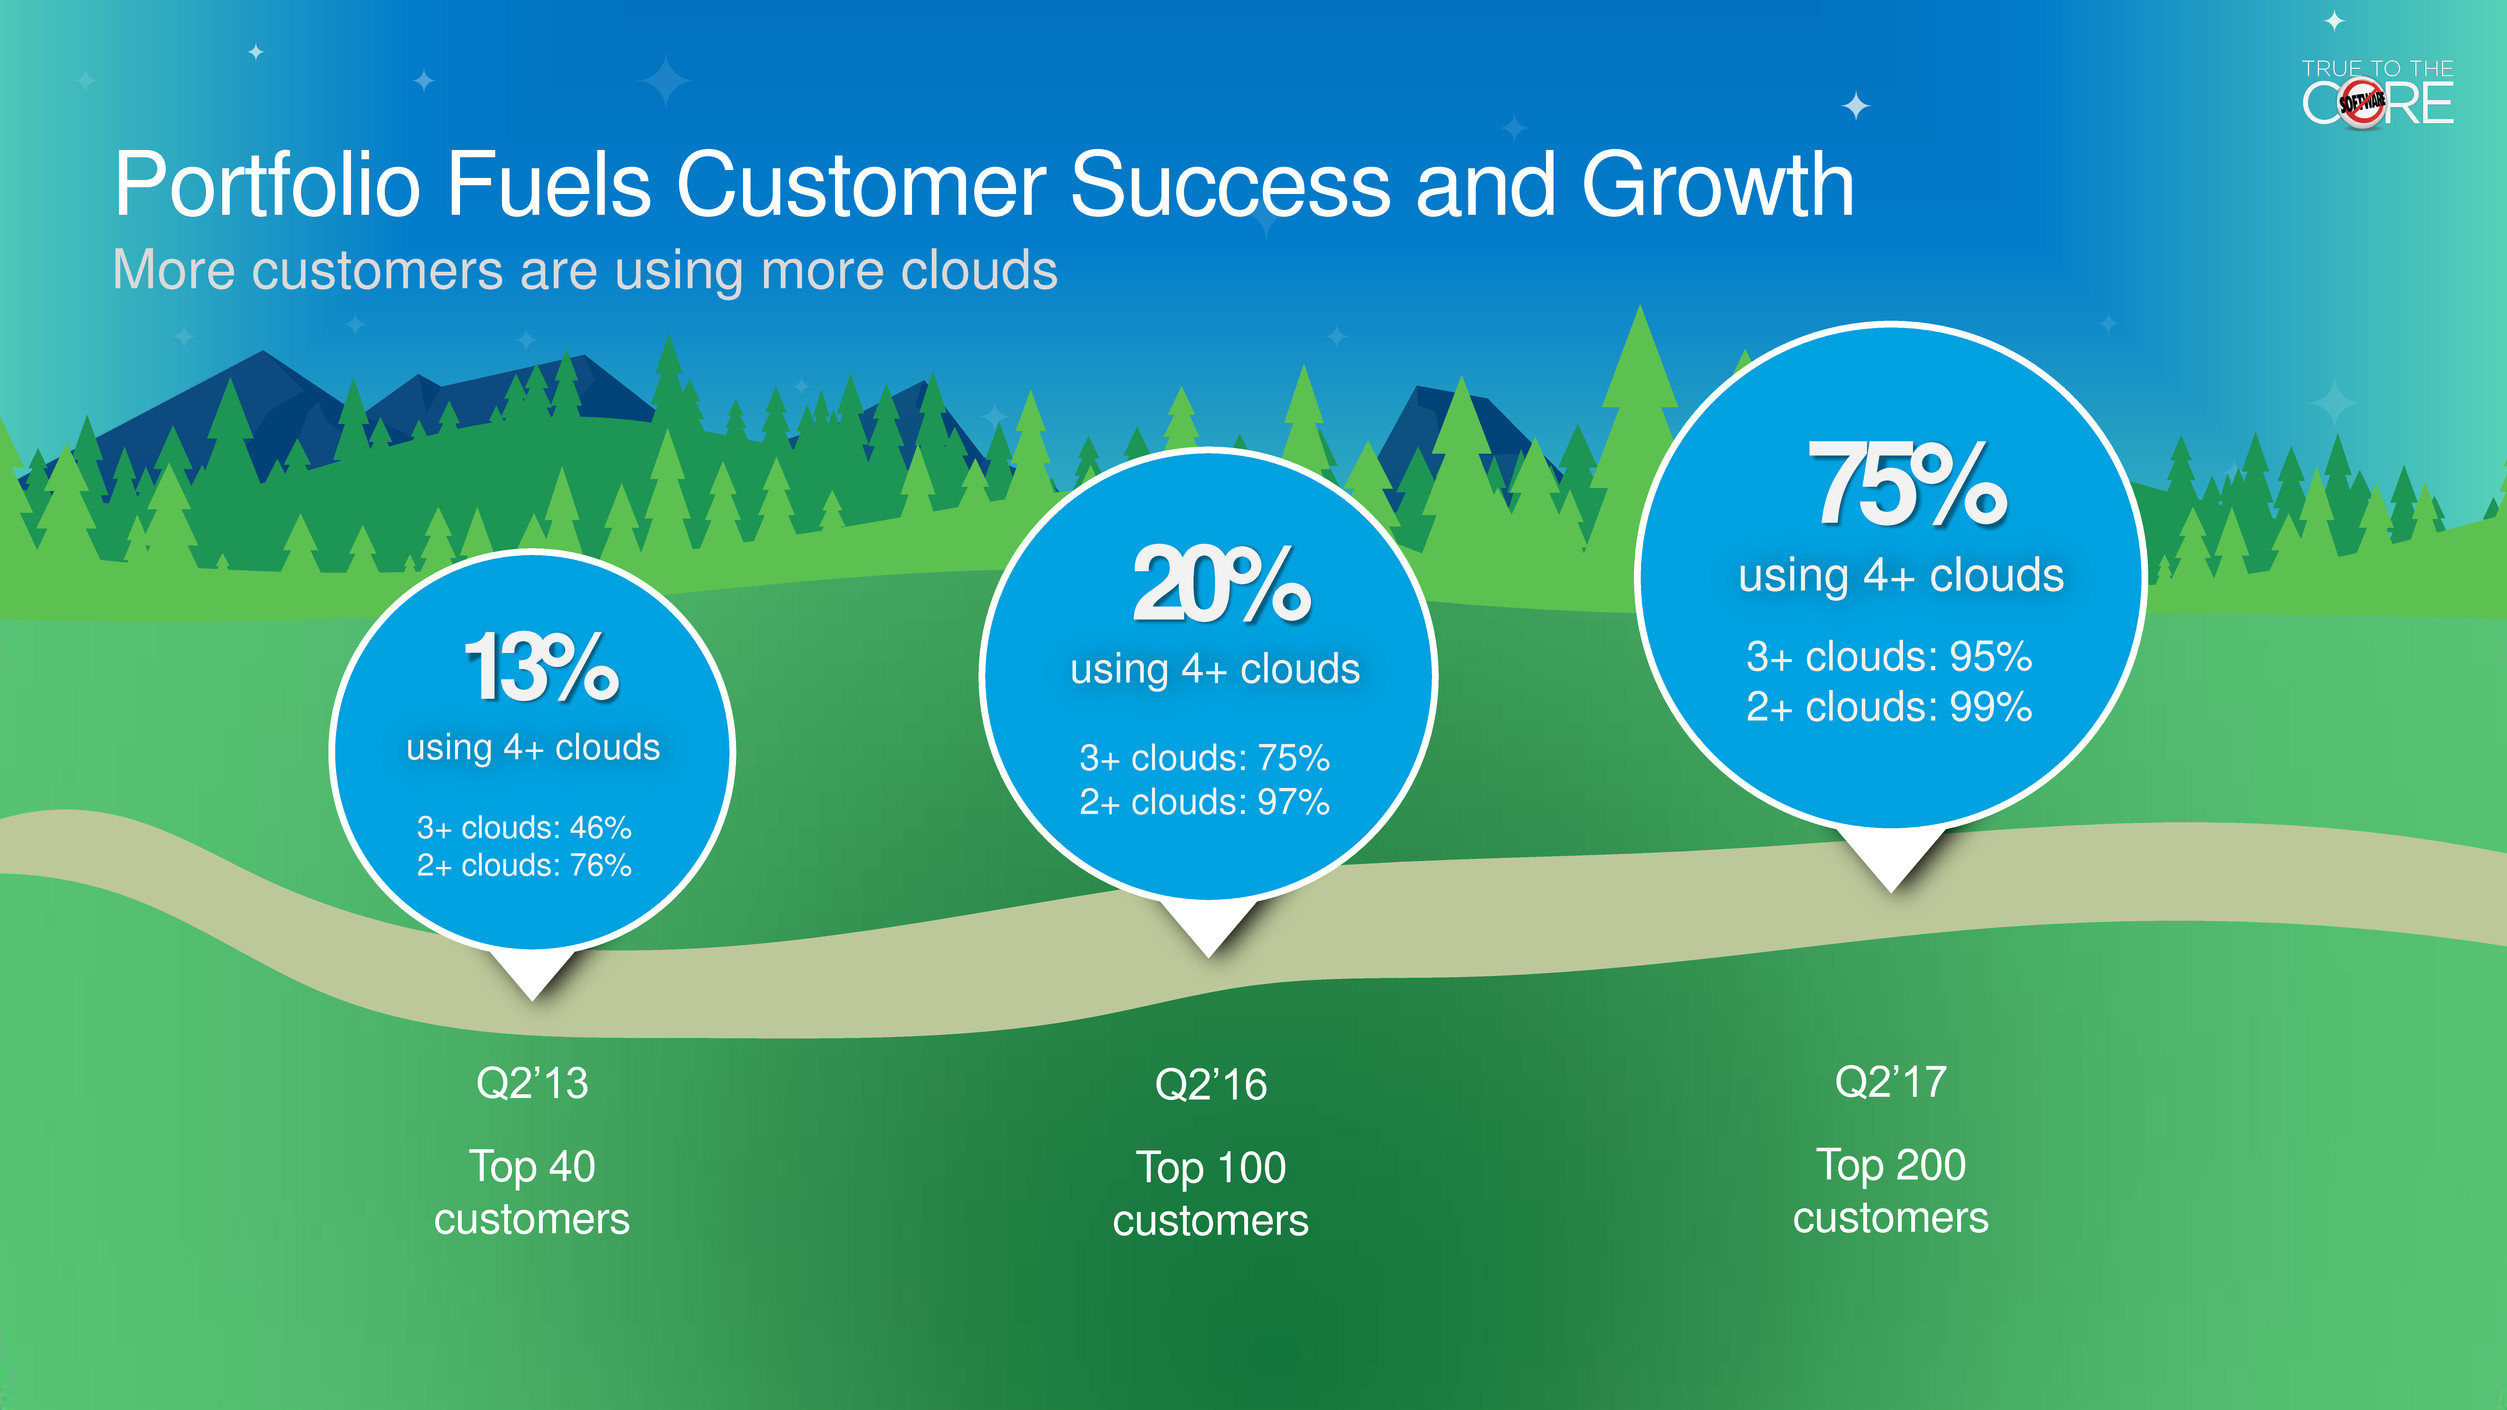
Portfolio Fuels Customer Success and Growth
More customers are using more clouds
Q2’13
Top 40
customers
13%
using 4+ clouds
Q2’16
Top 100
customers
20%
using 4+ clouds
Q2’17
Top 200
customers
75%
using 4+ clouds
3+ clouds: 46%
2+ clouds: 76%
3+ clouds: 75%
2+ clouds: 97%
3+ clouds: 95%
2+ clouds: 99%

`
Competitive Advantage
Product Strength and
Innovation
World-Class Team
and Culture
Large, Loyal
Installed Base
Cloud
Mobile
Social
IoT
AI

`
Salesforce Core Values
Our culture is a competitive advantage
Salesforce has its customers in its DNA.
The laser focus on customer value is
unrelenting. I love it.
SAIDEEP RAJ
MANAGING DIRECTOR, ACCENTURE
“
”
“ We wouldn’t be able to serve this many
communities if it weren’t for Salesforce.
JAY BANFIELD
EXECUTIVE DIRECTOR, YEAR UP BAY AREA
”
It’s an awesome product that helps you do
awesome things.
GITA BOROVSKY
DIRECTOR OF CRM,AMERICAN RED CROSS
“
”
This place oozes energy and passion
… that energy makes this place different.
TAYLOR HILFICKER
BUSINESS MANGER, BRAND, SALESFORCE
“
”

Unique Investments in Our Culture…
Creates customer and employee advocacy
Equality for All Women’s Leadership Environment
Women
in tech
Equa
l
pay
Net-Zero
by 2020
98% more
carbon efficient
Tony Prophet as new
Chief Equality Officer
$3M
salary
adjustment
for equal pay
1% Time 1% Equity 1% Product

4K
6K
9K
13K
15K
18K
23K
Q211 Q212 Q213 Q214 Q215 Q216 Q217
…Make us a Destination Employer…
San Francisco’s largest technology employer
Full-Time Headcount

… and a Magnet for Proven and Visionary Leaders
Neelie Kroes
Former VP of the European Commission,
Board Member
Bob Stutz
CEO, Marketing Cloud &
Chief Analytics Office
Tony Prophet
Chief Equality Officer
Bret Taylor
CEO, Quip
Richard Socher
Chief Scientist

Scaling to $20B and Beyond
$100B
TAM
Large, Loyal
Installed Base
Customer
Focused Culture
Track Record
of Innovation
Industry Leading
Products
Benefits of Scale
with Strong
Economics
DAVID HAVLEK
EVP, Finance

Benefits of Scale
P&L
Balance Sheet
& Cash Flow
Long-term
Economics

`
1All references to operating margin refer to non-GAAP operating margin. Non-GAAP operating margin excludes the effects of stock-based compensation, amortization of purchased intangibles, lease termination resulting from purchase of office
building, and the potential impact of FX and M&A. A complete reconciliation of GAAP to non-GAAP measures can be found in the Appendix and at www.salesforce.com.
Growth/Margin Framework is Our Compass
Balancing growth with improving profitability
PRIORITY
REV. GROWTH
NON-GAAP
OP. MARGIN
OCF GROWTH
Top Line
> 30%
Flat to Up Slightly
< Revenue Growth
Top & Bottom Line
20%-30%
+100-300 bps
≈ Revenue Growth
Bottom Line
< 20%
+200-400 bps
> Revenue Growth
HIGH GROWTH GROWTH LOW GROWTH
1
Mid-30s
percent
LONG-TERM OP.
MARGIN AT MATURITY

`
Note: FY17 estimate represents revenue guidance range provided August 31, 2016. *The FY17 constant currency growth rate represents the constant currency growth rate for the first half of fiscal 2017. Non-GAAP revenue constant currency growth
rates as compared to the comparable prior period. We present constant currency information for revenue to provide a framework for assessing how our underlying business performed excluding the effects of foreign currency rate fluctuations. To
present constant currency revenue, current and comparative prior period results for entities reporting in currencies other than United States dollars are converted into United States dollars at the weighted average exchange rate for the quarter being
compared to for growth rate calculations presented, rather than the actual exchange rates in effect during that period.
Sustained Growth at Scale
Forms the foundation for $20 billion objective
$1,657M
$2,267M
$3,050M
$4,071M
$5,374M
$6,667M
$8,275M-
$8,325M
28%
35%
37%
34% 33%
27% 27%*
FY11 FY12 FY13 FY14 FY15 FY16 FY17E
Annual Revenue C/C Growth Rate
(1H FY17)

Scale Benefits Margin Improvement
Absorbing M&A and investing in growth
Note: Non-GAAP operating margin excludes the effects of stock-based compensation, amortization of purchased intangibles, and lease termination resulting from purchase of office building. A complete reconciliation of GAAP to non-GAAP measures
can be found in the Appendix and atwww.salesforce.com.
5%
10%
15%
0
2,000
4,000
FY12 FY13 FY14 FY15 FY16 1H FY17
Organic Hiring Acquired Headcount NG Operating Margin
bluetail
Minhash
Net H
e
a
d
c
o
u
n
t
Add
iti
o
n
s
No
n
-GA
A
P
Ope
rat
in
g
Ma
rg
in

`
Scale Helps Navigate Through Variability
Managing through FX volatility
USD / JPY EUR / USD GBP / USD

International Growth Outpacing Americas
Increasing investment in datacenters and headcount
Note: Revenue growth rates represent constant currency revenue growth. Non-GAAP revenue constant currency growth rates as compared to the comparable prior period. We present constant currency information for revenue to provide a framework
for assessing how our underlying business performed excluding the effects of foreign currency rate fluctuations. To present constant currency revenue, current and comparative prior period results for entities reporting in currencies other than United
States dollars are converted into United States dollars at the weighted average exchange rate for the quarter being compared to for growth rate calculations presented, rather than the actual exchange rates in effect during that period.
21%
3 year
headcount CAGR
30%
3 year
headcount CAGR
27%
3 year
headcount CAGR
24%
Q217 revenue
growth
32%
Q217 revenue
growth
29%
Q217 revenue
growth
Americas
1999+
EMEA
2014 2015 2015
APAC
2011
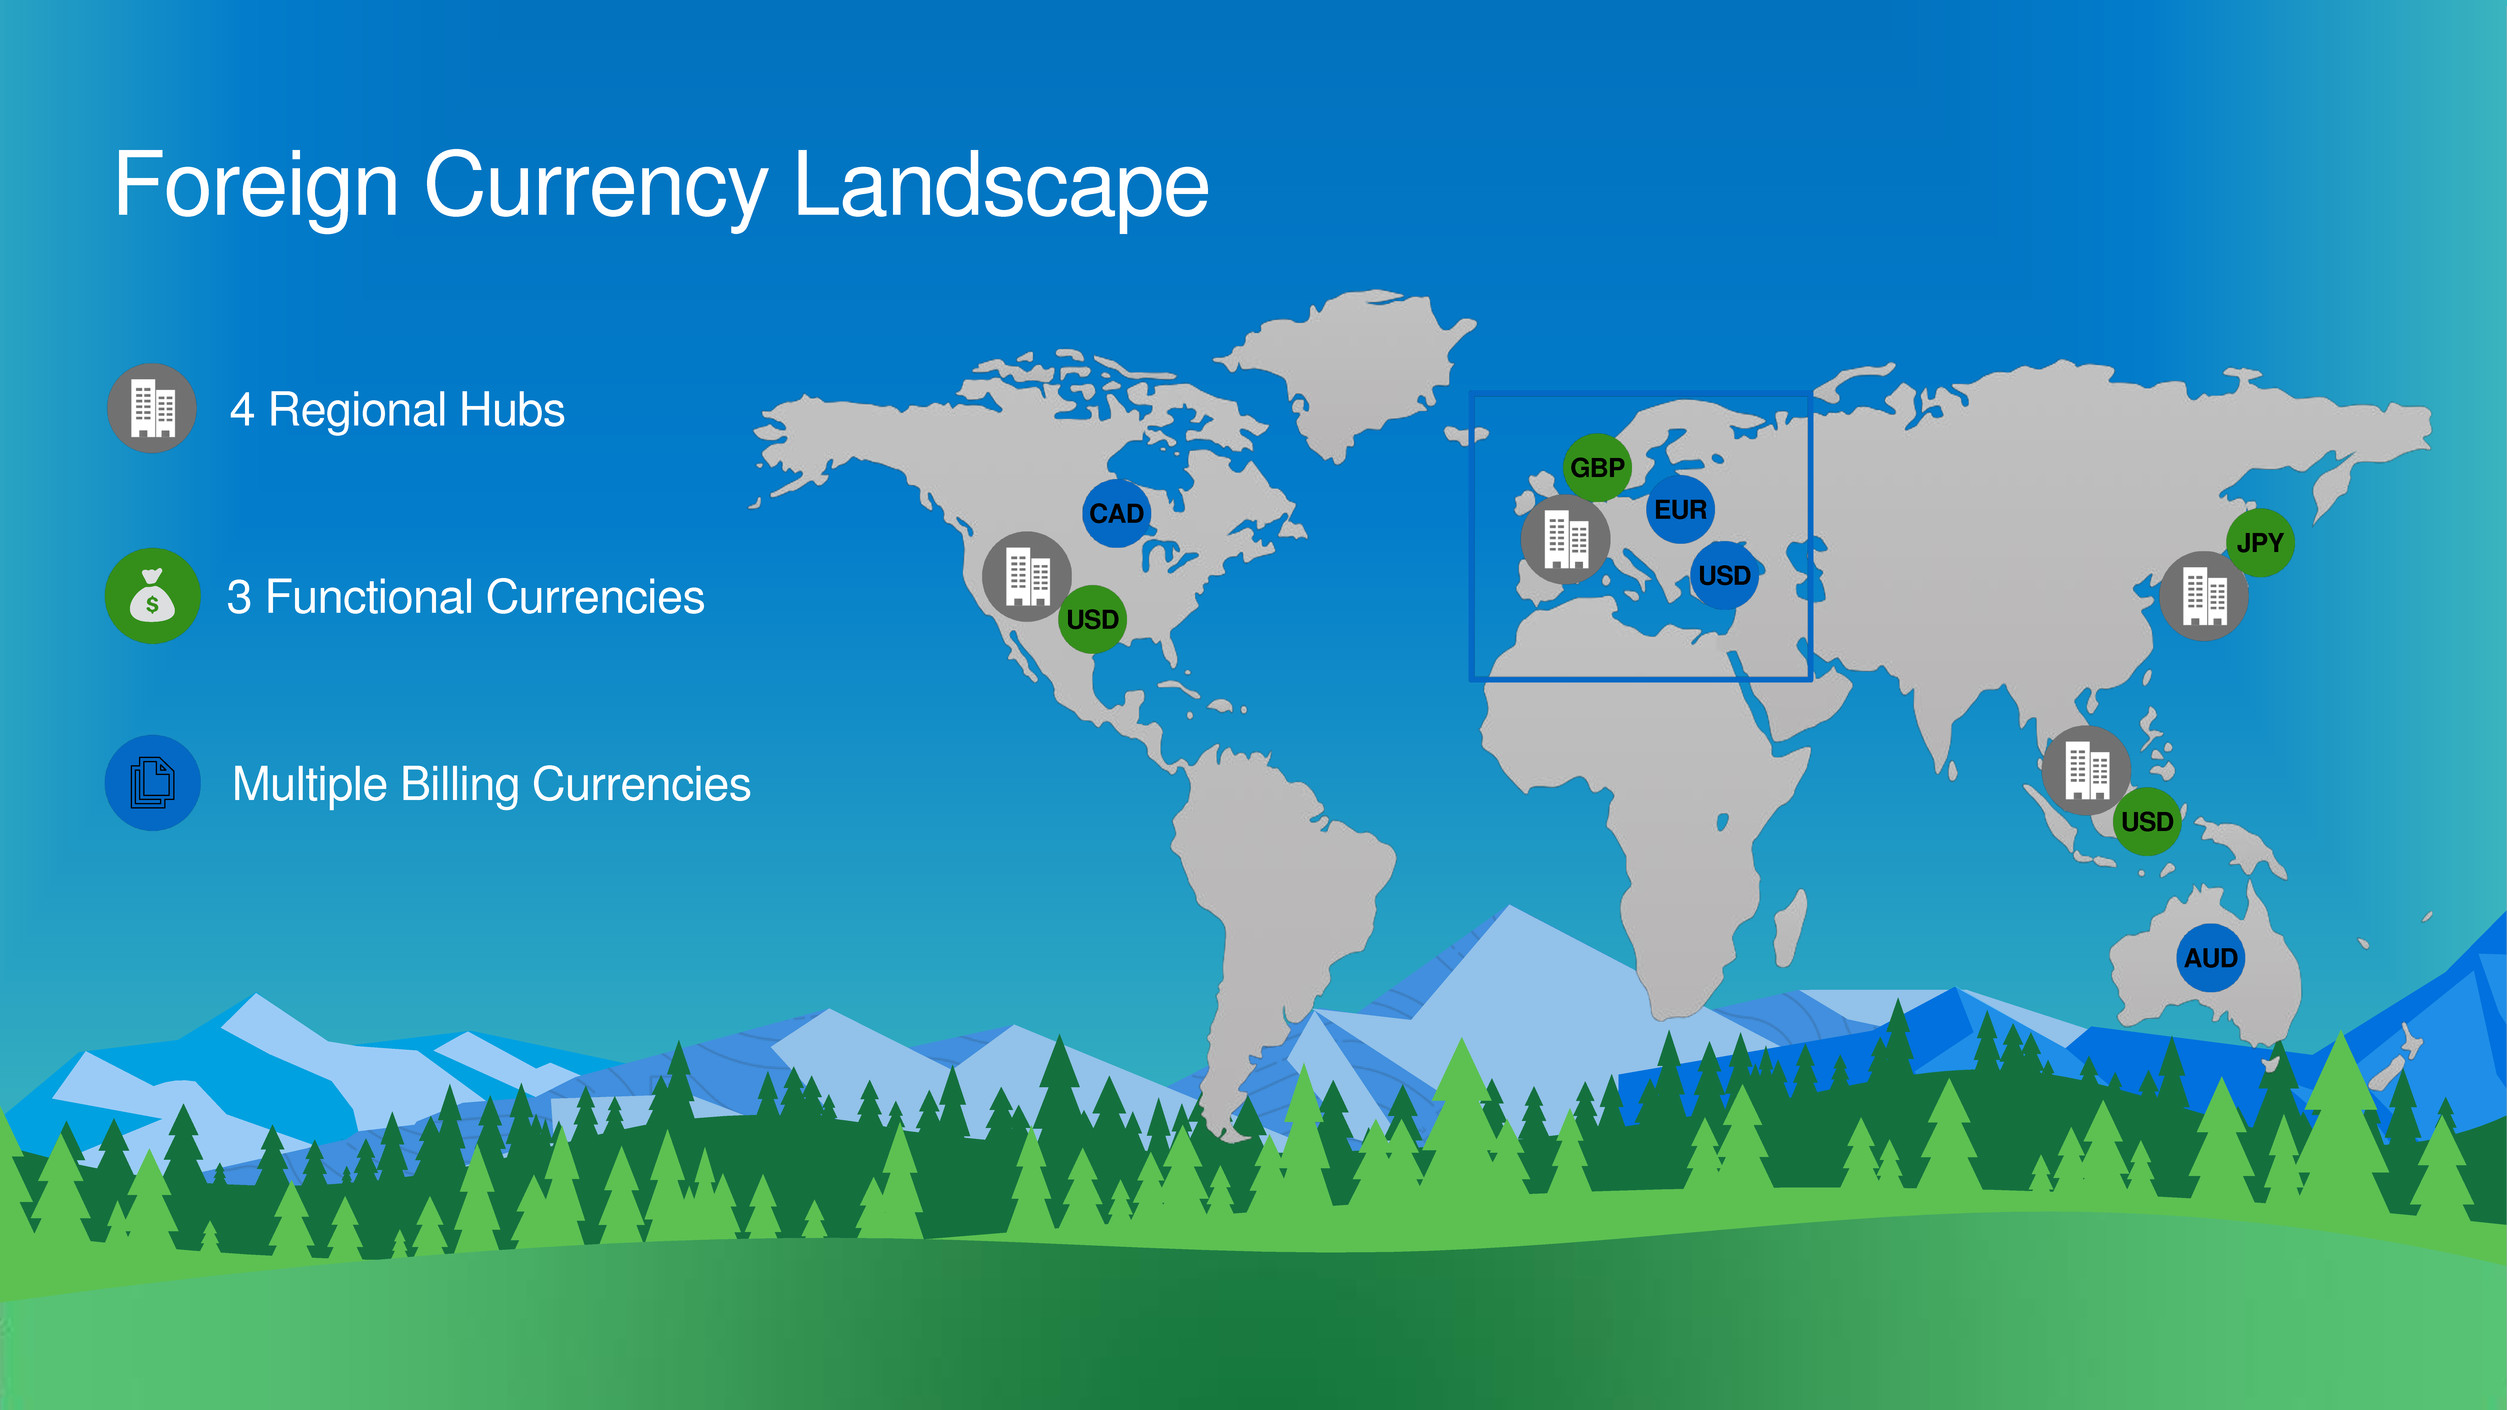
Foreign Currency Landscape
4 Regional Hubs
USD
CAD
GBP
EUR
AUD
JPY
USD
3 Functional Currencies
Multiple Billing Currencies
USD

FX Impacts to Growth and Margin
Example of a European contract
TRANSLATIONAL
FX
TRANSLATIONAL
FX
TRANSACTIONAL FX Billing
Currency
Functional
Currency
Consolidated
Currency
DR and Revenue Expenses

Benefits of Scale
P&L
Balance Sheet
& Cash Flow
Long-term
Economics
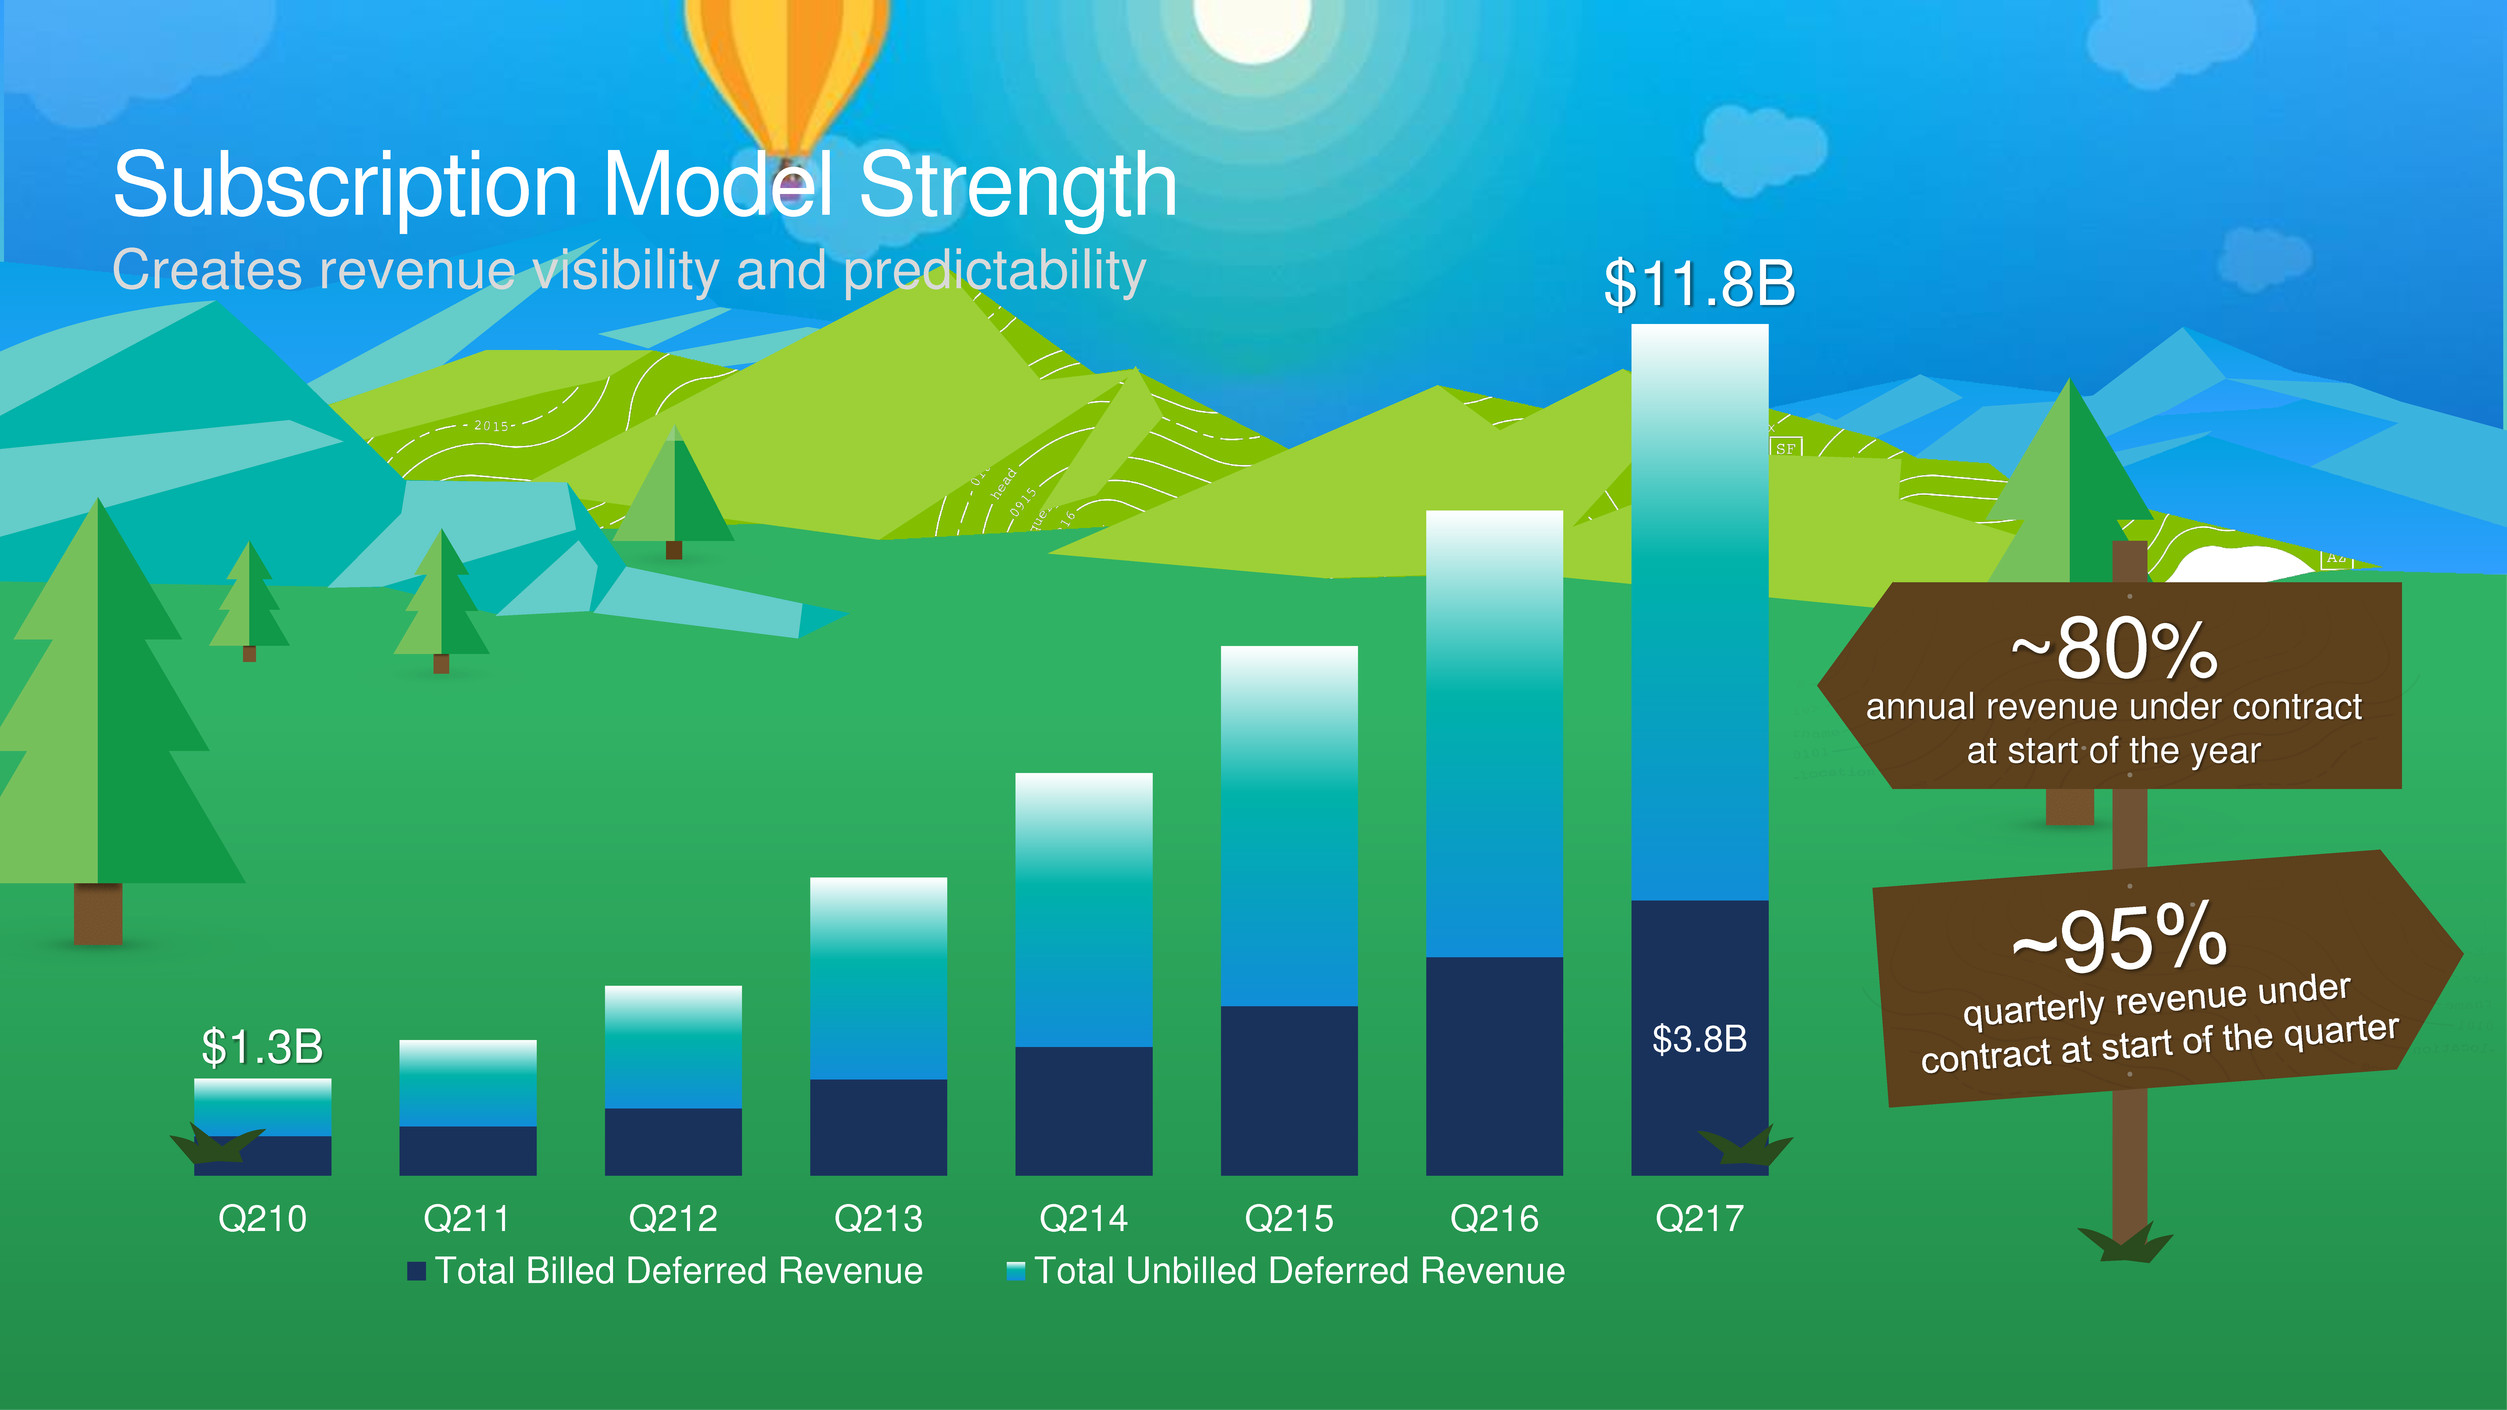
Subscription Model Strength
Creates revenue visibility and predictability
$3.8B $1.3B
$11.8B
Q210 Q211 Q212 Q213 Q214 Q215 Q216 Q217
Total Billed Deferred Revenue Total Unbilled Deferred Revenue
annual revenue under contract
at start of the year
~80%

Multiple Factors Impact Deferred Revenue
Creates growing invoicing seasonality as we scale
Co-terming
(Seasonality)
Compounding
(Seasonality)
Amortization
(Consistent)

Scale Impacts Deferred Revenue Seasonality
Q1 seasonality evolving
-10%
-5%
0%
5%
10%
15%
20%
Q105 Q106 Q107 Q108 Q109 Q110 Q111 Q112 Q113 Q114 Q115 Q116 Q117
Seq
u
e
n
ti
a
l
g
rowt
h

Scale Impacts Deferred Revenue Seasonality
Q2 seasonality evolving
-10%
-5%
0%
5%
10%
15%
20%
Q205 Q206 Q207 Q208 Q209 Q210 Q211 Q212 Q213 Q214 Q215 Q216 Q217
Seq
u
e
n
ti
a
l
g
rowt
h

Scale Impacts Deferred Revenue Seasonality
Q3 seasonality evolving
1Q3’17 deferred revenue guidance as of August 31st, 2016.
-10%
-5%
0%
5%
10%
15%
20%
Q305 Q306 Q307 Q308 Q309 Q310 Q311 Q312 Q313 Q314 Q315 Q316 Q317
Seq
u
e
n
ti
a
l
g
rowt
h
Guide1
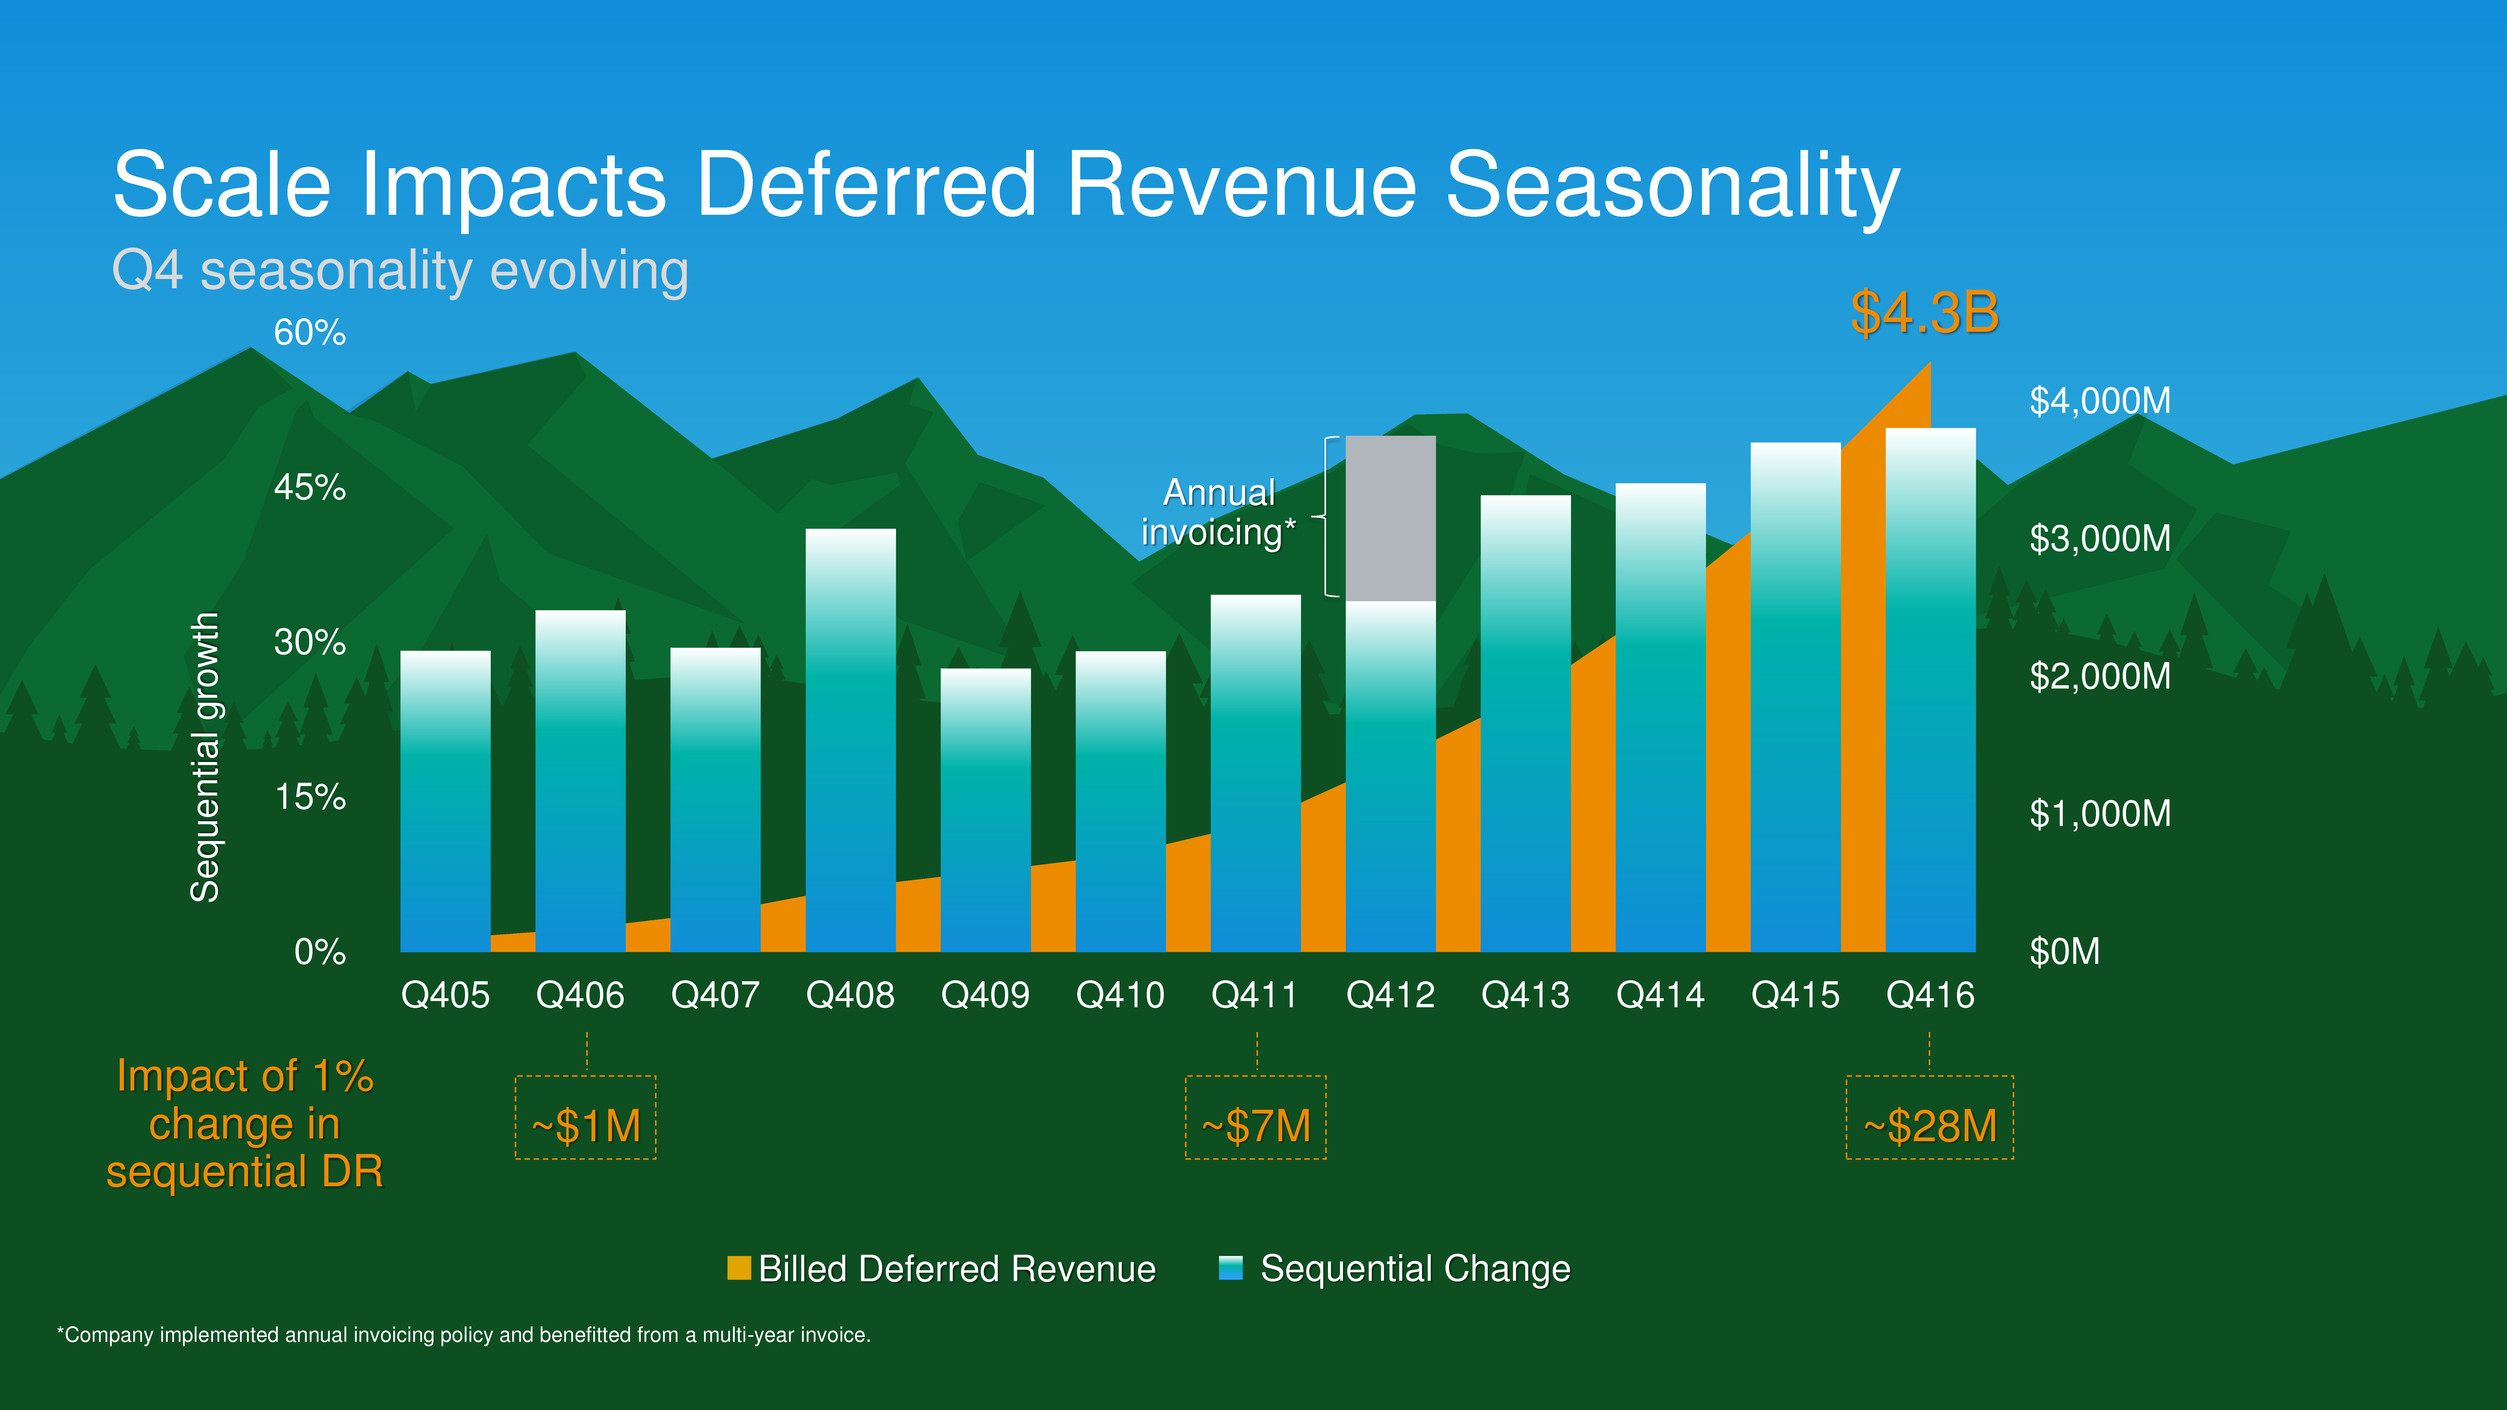
Scale Impacts Deferred Revenue Seasonality
Q4 seasonality evolving
$0M
$1,000M
$2,000M
$3,000M
$4,000M
0%
15%
30%
45%
60%
Q405 Q406 Q407 Q408 Q409 Q410 Q411 Q412 Q413 Q414 Q415 Q416
Seq
u
e
n
ti
a
l
g
rowt
h
$4.3B
Annual
invoicing*
Impact of 1%
change in
sequential DR
~$1M ~$7M ~$28M
Sequential Change Billed Deferred Revenue
*Company implemented annual invoicing policy and benefitted from a multi-year invoice.

`
Deferred Revenue Seasonality Continues to Deepen
Result of invoice compounding and amortization of larger and larger base
-20%
-10%
0%
10%
20%
30%
40%
50%
60%
Q1 Q2 Q3 Q4 Q1
FY06
FY11
FY15
FY16
Seq
u
e
n
ti
a
l
g
rowt
h
`
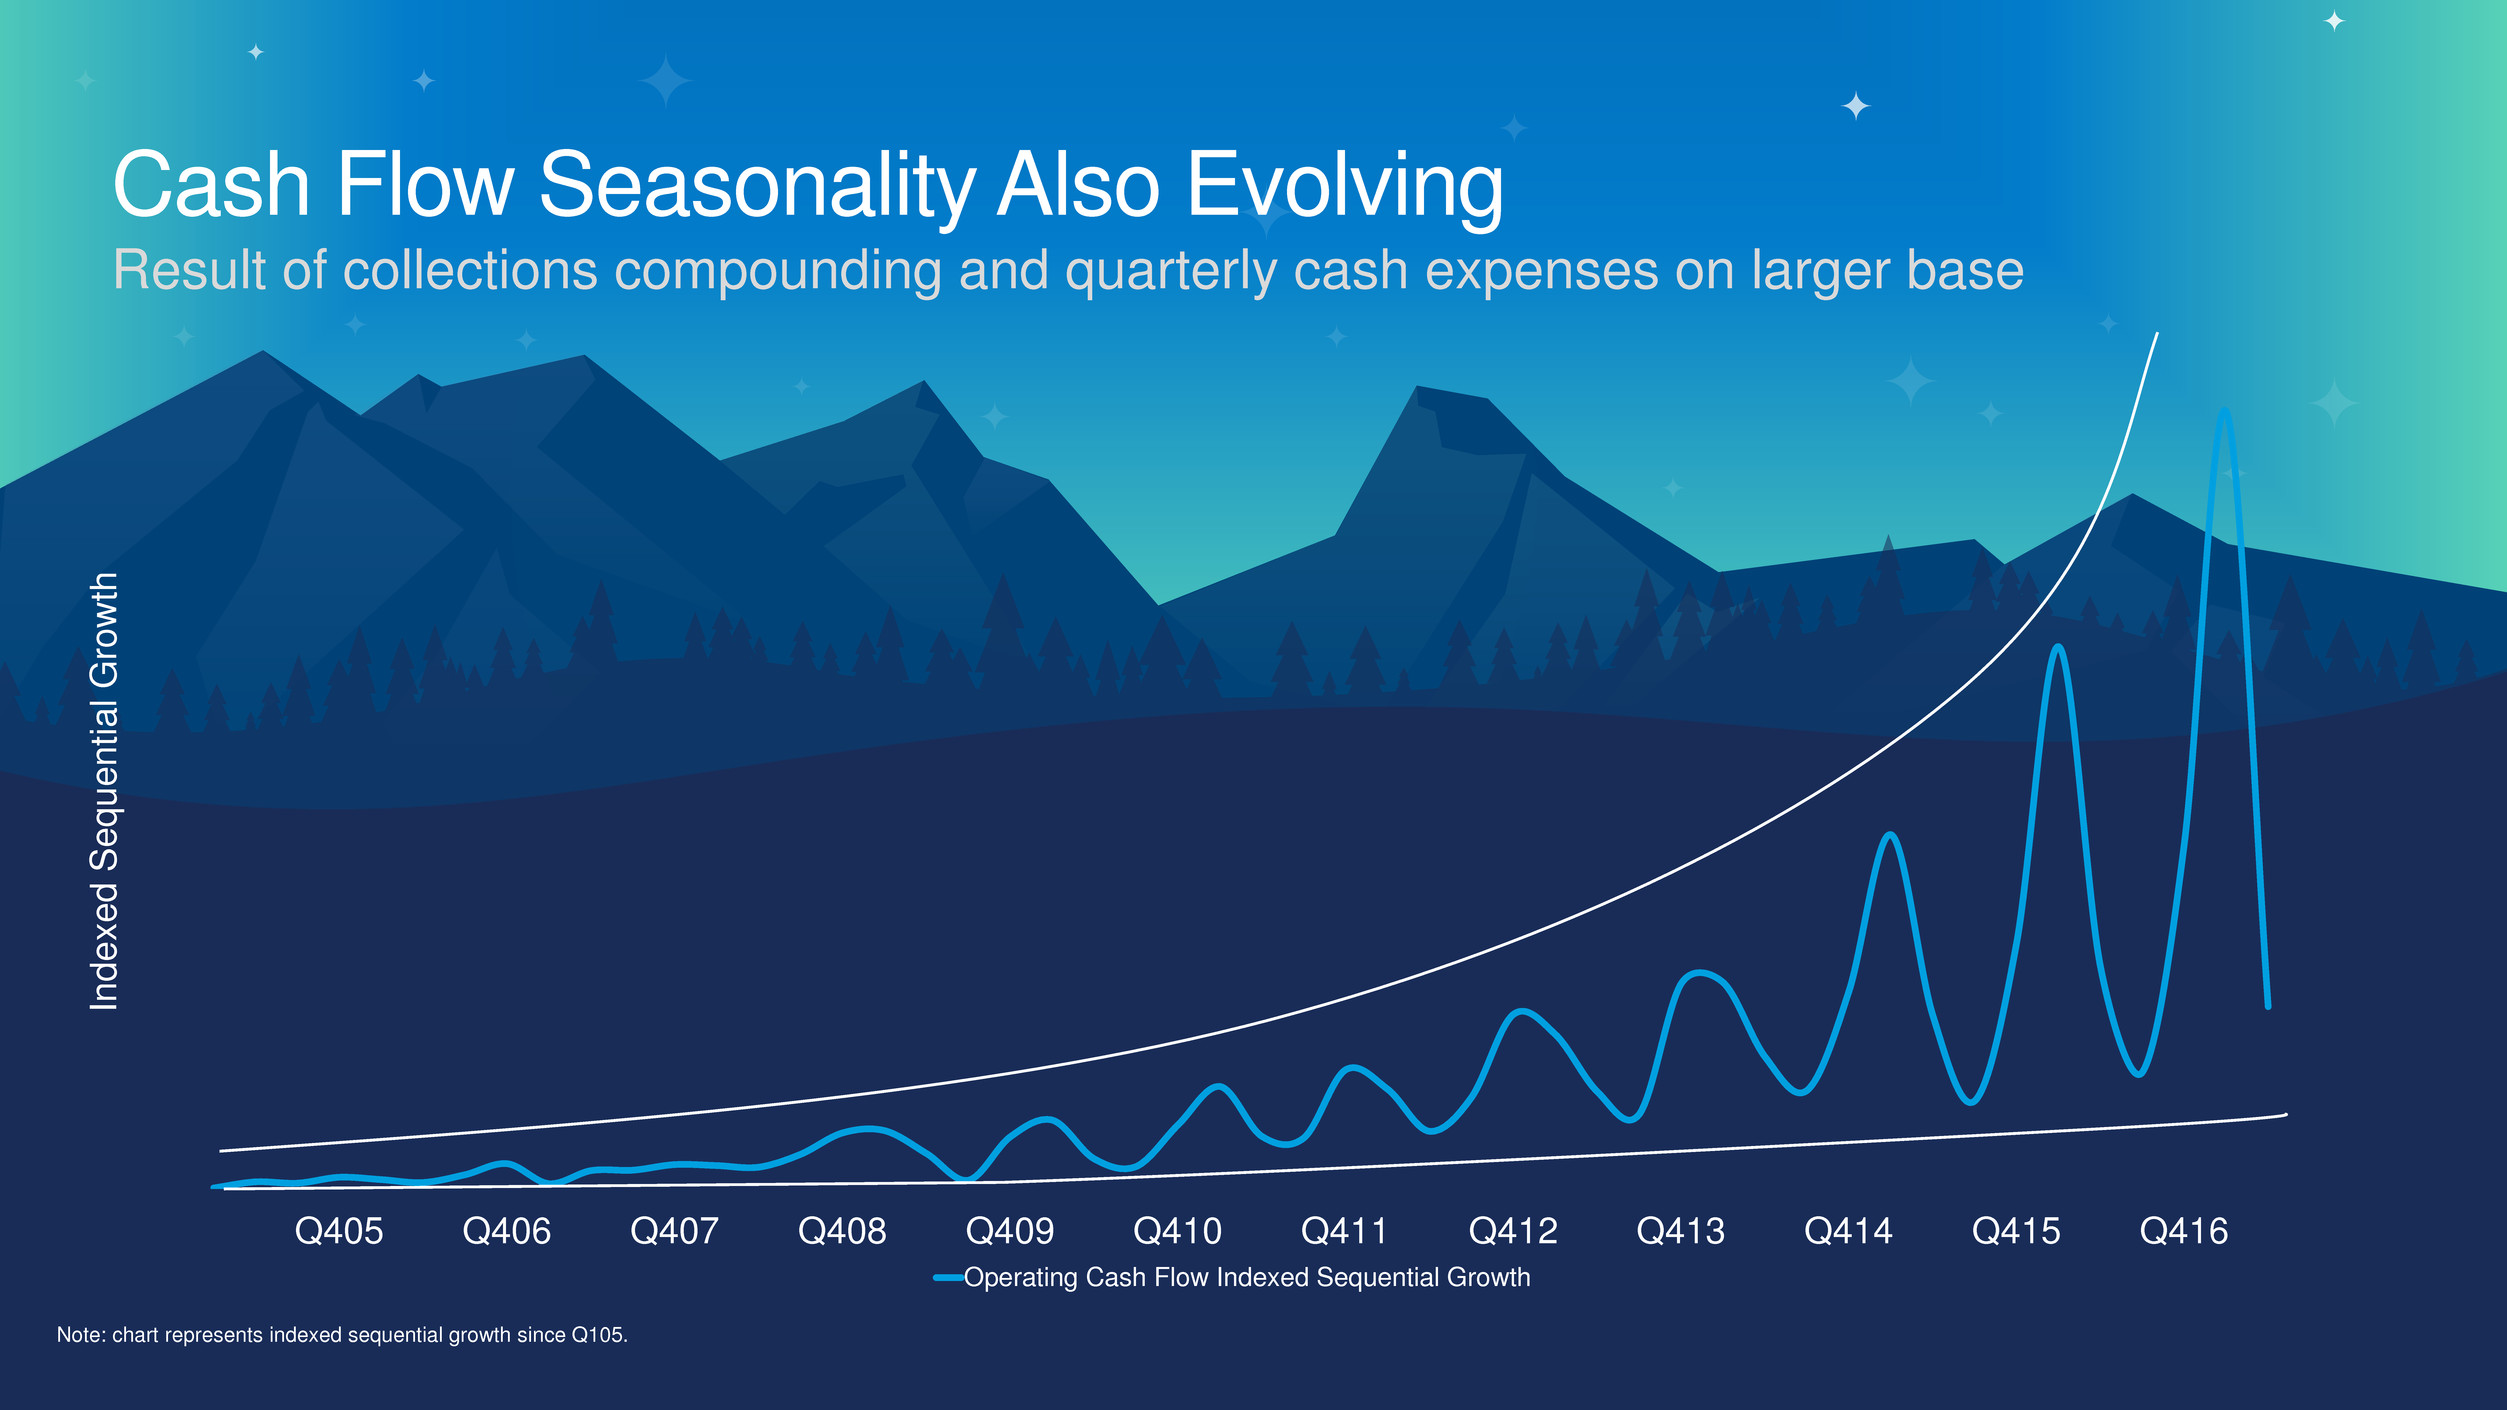
Q405 Q406 Q407 Q408 Q409 Q410 Q411 Q412 Q413 Q414 Q415 Q416
Operating Cash Flow Indexed Sequential Growth
Note: chart represents indexed sequential growth since Q105.
Cash Flow Seasonality Also Evolving
Result of collections compounding and quarterly cash expenses on larger base
In
d
e
x
e
d
Se
q
u
e
nt
ia
l
Growt
h

Benefits of Scale
P&L
Balance Sheet
& Cash Flow
Long-term
Economics

Prof. Havlek
Office hours: M-W-F, 8:00am- 10:00 Am

Lifetime Unit Economics 301
Subscription economics applied to the business lifecycle
2014: Lifetime Unit Economics
Lifetime Revenue (LTR):
Cumulative value of $1 annuity over expected life
(Value = $1 / attrition)
Cost to Book (CTB):
Cost to acquire $1 annuity
Cost to Serve (CTS):
Cost to serve $1 annuity over expected life
Attrition:
Defines expected life of $1 of annuity
Unit Lifetime Value Drivers
2015: Lifetime Unit Economics

Lifecycle Stage Impacts Growth and Margin
At maturity, companies approach their life-time margin potential
G
r
o
w
t
h
Start-Up Growth Mature
Choice enables top- and
Bottom-line Growth
time

High
Low
T
0
G
r
o
w
t
h
r
a
t
e
Example: Acme Cloud Company
time

High
Low
T
0
Revenue
New business
G
r
o
w
t
h
r
a
t
e
Example: Acme Cloud Company
T
1
time
Velocity = b
r
/R
r
where b
r
= new business rate and R
r
= Revenue rate

High
Low
T
0
Revenue
G
r
o
w
t
h
r
a
t
e
Example: Acme Cloud Company
T
1
time
T
1
Velocity = b
r
/R
r
where b
r
= new business rate and R
r
= Revenue rate
New business

Low
T
0
Example: Acme Cloud Company
T
1
G
r
o
w
t
h
r
a
t
e
time
High
Revenue
If CTB is flat, S&M
expense grows at the same
rate as new business
T
1
New business

High
Low
T
0
Example: Acme Cloud Company
S&M Expense (CTB FLAT)
time
G
r
o
w
t
h
r
a
t
e
Revenue
T
1 T
1

High
Low
T
0
Example: Acme Cloud Company
T
1
CTB Margin Pressure
time
G
r
o
w
t
h
r
a
t
e
S&M Expense (CTB FLAT)
Revenue
T
1

High
Low
T
0
Example: Acme Cloud Company
T
1
CTB Margin leverage
time
G
r
o
w
t
h
r
a
t
e
S&M Expense (CTB FLAT)
Revenue
T
1

High
Low
T
0
Example: Acme Cloud Company
CTB margin leverage
G
r
o
w
t
h
r
a
t
e
time
CTS creates
incremental leverage
S&M Expense (CTB FLAT)
Revenue
T
1 T
1
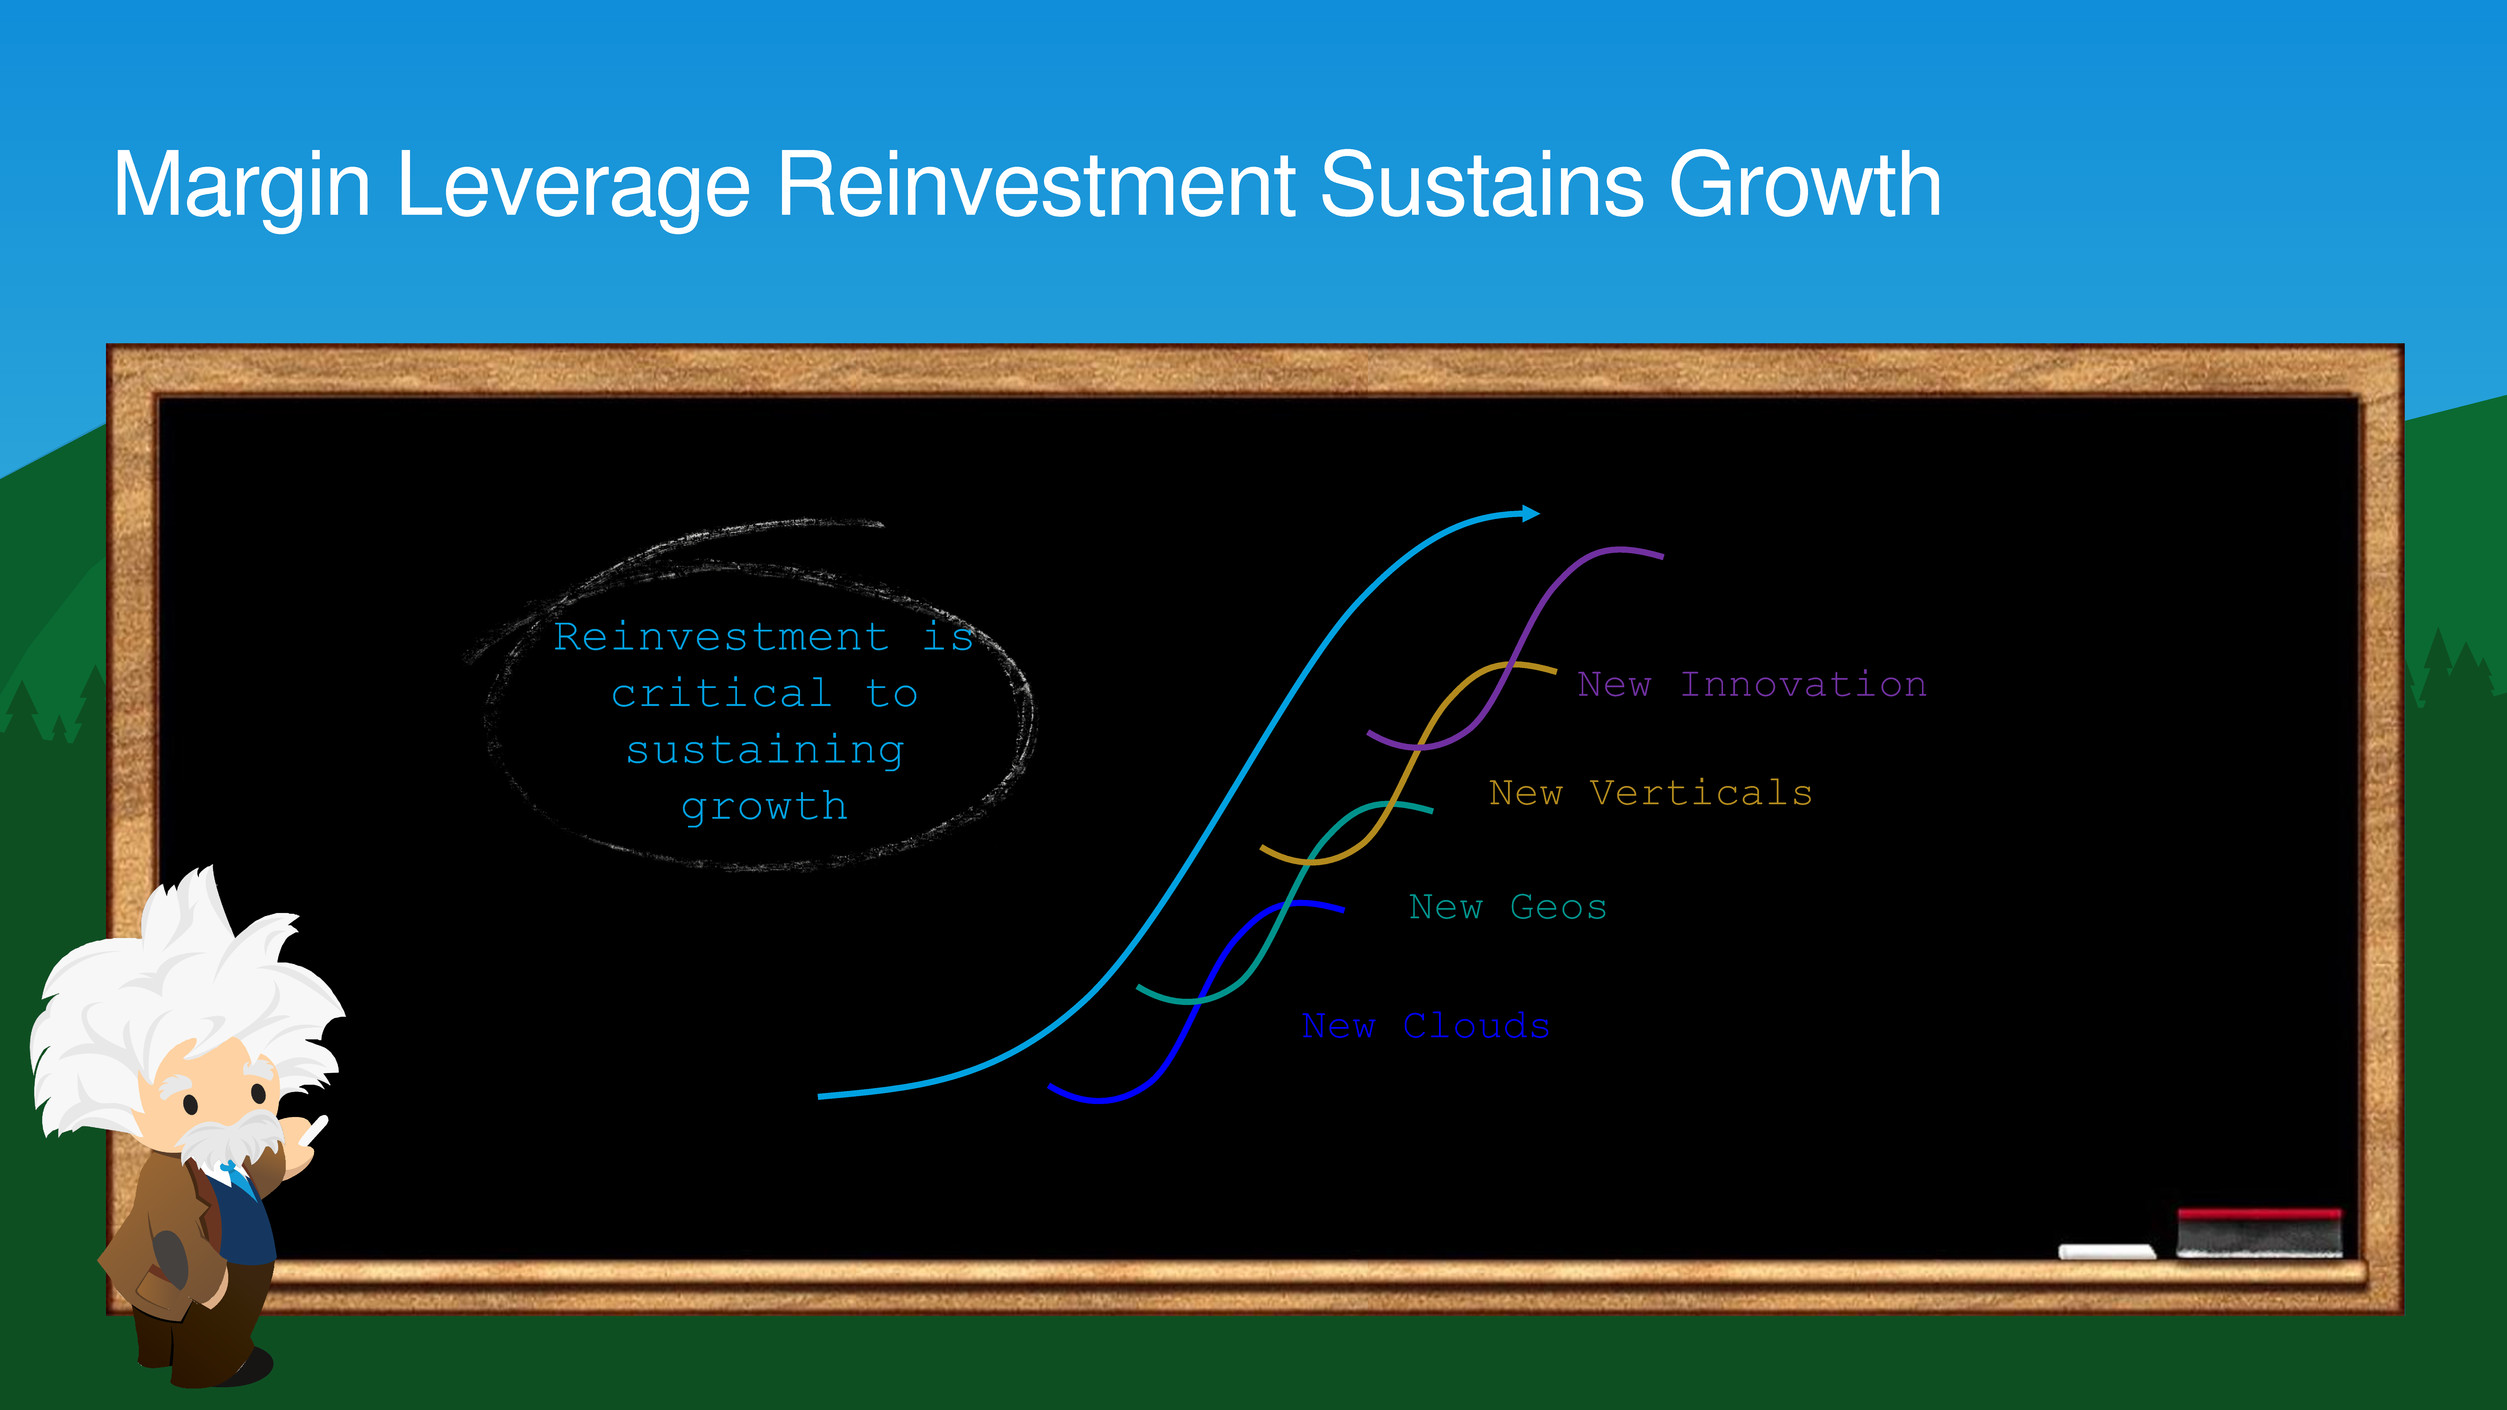
Margin Leverage Reinvestment Sustains Growth
time
New Clouds
New Geos
New Verticals
New Innovation
Reinvestment is
critical to
sustaining
growth

Scale Benefits Near- and Long-Term Performance
Fueling top and bottom line performance
time
PRIORITY
REV. GROWTH
NON-GAAP
OP. MARGIN
OCF
GROWTH
Top Line
30 0/0
Flat to Up
Revenue Growth
Bottom Line
20 0/0
+200-400 bps
Revenue Growth
HIGH GROWTH LOW GROWTH Growth
Top &
Bottom Line
20 0/0 – 30
0/0
+100-300 bps
≈ Revenue Growth
Mid-30s
Long-term op.
margin at
maturity

thank y u

Appendi
x

GAAP to Non GAAP Reconciliation
(in 000's)
Non-GAAP income from operations 1H FY17 FY16 FY15 FY14 FY13 FY12
GAAP income (loss) from operations 84,537$ 114,923$ (145,633)$ (286,074)$ (110,710)$ (35,085)$
Plus:
Amortization of purchased intangibles 86,296 158,070 154,973 146,535 88,171 67,319
Stock-based expenses 371,229 593,628 564,765 503,280 379,350 229,258
Less:
Operating lease termination resulting from purchase
of 50 Fremont 0 (36,617) 0 0 0 0
Non-GAAP income from operations 542,062$ 830,004$ 574,105$ 363,741$ 356,811$ 261,492$
As Margin %
Total revenues 3,953,221$ 6 ,667,216$ 5 ,373,586$ 4 ,071,003$ 3 ,050,195$ 2 ,266,539$
Non-GAAP operating margin 13.7% 12.4% 10.7% 8.9% 11.7% 11.5%

`
Finance
Q&A
Mark Hawkins
CFO
David Havlek
EVP, Finance

`
Salesforce Analyst Day will return at 1:30 p.m. PT

`
Product
Q&A
Alex Dayon
President, Products
Mike Rosenbaum
Sales Cloud & Service
Cloud
Bob Stutz
Marketing Cloud
Stephanie Buscemi
Analytics Cloud
Adam Seligman
Platform Cloud
John Wookey
Vertical Clouds

`
Go-to-
Market
Q&A
Keith Block
Vice Chairman, President, COO
Tyler Prince
EVP, WW
Alliances

`
Technolog
y Q&A
Parker Harris
Co-Founder and CTO
Serious News for Serious Traders! Try StreetInsider.com Premium Free!
You May Also Be Interested In
- BMO Capital Reiterates Outperform Rating on salesforce.com (CRM)
- ROSEN, A TRUSTED AND LEADING LAW FIRM, Encourages Zoetis Inc. Investors to Inquire About Securities Class Action Investigation – ZTS
- Inverness Graham Strengthens its Value Creation Group with the Addition of Two Seasoned Operating Executives
Create E-mail Alert Related Categories
SEC FilingsSign up for StreetInsider Free!
Receive full access to all new and archived articles, unlimited portfolio tracking, e-mail alerts, custom newswires and RSS feeds - and more!


 Tweet
Tweet Share
Share