

Form 8-K/A Sucampo Pharmaceuticals, For: Oct 20
 Tweet
Tweet Share
ShareUNITED STATES
SECURITIES AND EXCHANGE COMMISSION
Washington, DC 20549
FORM 8-K/A
CURRENT REPORT
Pursuant to Section 13 or 15(d) of
The Securities Exchange Act of 1934
Date of Report (Date of earliest event reported): October 20, 2015
Sucampo Pharmaceuticals, Inc.
(Exact name of registrant as specified in its charter)
| Delaware | 001-33609 | 30-0520478 |
| (State or other jurisdiction of incorporation) |
(Commission File Number) | (IRS Employer Identification No.) |
805 King Farm Boulevard, Suite 550
Rockville, MD 20850
(Address of principal executive offices, including zip code)
(301) 961-3400
(Registrant’s telephone number, including area code)
(Former name or former address, if changed since last report)
Check the appropriate box below if the Form 8-K filing is intended to simultaneously satisfy the filing obligation of the registrant under any of the following provisions:
[ ] Written communications pursuant to Rule 425 under the Securities Act (17 CFR 230.425)
[ ] Soliciting material pursuant to Rule 14a-12 under the Exchange Act (17 CFR 240.14a-12)
[ ] Pre-commencement communications pursuant to Rule 14d-2(b) under the Exchange Act (17 CFR 240.14d-2(b))
[ ] Pre-commencement communications pursuant to Rule 13e-4(c) under the Exchange Act (17 CFR 240.13e-4(c))
Item 2.01. Completion of Acquisition or Disposition of Assets.
On October 20, 2015, the Registrant completed its acquisition of 10,262,903 shares of R-Tech Ueno, a corporation organized under Japanese law (the “Target”) and 318,400 stock acquisition rights of Target pursuant to a tender offer in Japan (the “Tender Offer”) pursuant to which the Registrant’s wholly-owned Japanese subsidiary, Sucampo Pharma LLC (the “Purchaser”), offered to purchase all of the outstanding shares of the Target’s common stock (other than the shares acquired pursuant to the Purchase Agreement). In addition, on October 20, 2015, the Registrant acquired 8,571,900 shares of Target pursuant to the terms of the Share Purchase Agreement (“Purchase Agreement”) by and between the Registrant and the founders of the Target, who are also the founders of the Registrant, and a related entity. Following these acquisitions, the Registrant directly and indirectly owned approximately 98% of the outstanding shares of Target. The Registrant acquired the remaining 2% of outstanding shares of R-Tech Ueno through a squeeze-out process under Japanese law on December 8, 2015.
This amendment amends the Current Report on Form 8-K filed on October 22, 2015 (the “Current Report”) to file the financial statements and pro forma financial information required by Item 9.01 of Form 8-K. This amendment amends Item 9.01 of the Current Report to read in its entirety as set forth below and does not amend or otherwise affect the other disclosures in the Current Report.
Item 9.01. Financial Statements and Exhibits.
(a) Financial Statements of Business Acquired. The audited consolidated financial statements of R-Tech Ueno as of March 31, 2015 and 2014 for the fiscal years ended March 31, 2015, 2014 and 2013 are included as Exhibit 99.1 and are incorporated by reference into this Item 9.01(a) and made a part hereof.
(b) Pro Forma Financial Information. The following unaudited pro forma financial information related to the acquisition by the Registrant of R-Tech Ueno is attached hereto as Exhibit 99.2 and incorporated by reference into this Item 9.01(b) and made a part hereof.
(i) Unaudited pro forma condensed combined statement of operations for the nine months ended September 30, 2015 and the year ended December 31, 2014
(ii) Unaudited pro forma condensed combined balance sheet as of September 30, 2015
(c) Exhibits.
| Exhibit No. |
Description | |
| 23.1 | Consent of Deloitte, R-Tech Ueno’s independent auditors | |
| 99.1 | Audited Consolidated Financial Statements of R-Tech Ueno | |
| 99.2 | Pro Forma Condensed Combined Financial Statements |
SIGNATURES
Pursuant to the requirements of the Securities Exchange Act of 1934, the registrant has duly caused this report to be signed on its behalf by the undersigned hereunto duly authorized.
| SUCAMPO PHARMACEUTICALS, INC. | |||
| By: | /s/ Andrew Smith | ||
| Date: June 28, 2016 | Andrew Smith | ||
| Chief Financial Officer | |||
EXHIBIT INDEX
| Exhibit No. |
Description | |
| 23.1 | Consent of Deloitte, R-Tech Ueno’s independent auditors | |
| 99.1 | Audited Consolidated Financial Statements of R-Tech Ueno | |
| 99.2 | Pro Forma Condensed Combined Financial Statements |
Exhibit 23.1
INDEPENDENT AUDITORS’ CONSENT
We consent to the incorporation by reference in Registration Statement No. 333-201566 on Form S-3 and Registration Statement No. 333-147420 on Form S-8 of Sucampo Pharmaceuticals, Inc. of our report dated June 24, 2016, related to the financial statements of R Tech Ueno, Ltd. as of March 31, 2015 and 2014 and for each of the three years in the period ended March 31, 2015 (which report expresses an unmodified opinion and includes an emphasis-of-matter paragraph regarding the differences between accounting principles generally accepted in Japan and those generally accepted in the United States of America), appearing in this Current Report on Form 8-K/A of Sucampo Pharmaceuticals, Inc.
/s/ DELOITTE TOUCHE TOHMATSU LLC
Tokyo, Japan
June 24, 2016
Exhibit 99.1
|
R-Tech Ueno, Ltd.
Financial Statements for the Years Ended March 31, 2015, 2014 and 2013, and Independent Auditors' Report
|
INDEPENDENT AUDITORS' REPORT
To the Board of Directors and Shareholders of R-Tech Ueno, Ltd.
Tokyo, Japan:
We have audited the accompanying financial statements of R-Tech Ueno, Ltd. (the "Company"), which comprise the balance sheets as of March 31, 2015 and 2014 and the related statements of income, changes in equity, and cash flows for each of the three years in the period ended March 31, 2015, and the related notes to the financial statements (all expressed in Japanese yen).
Management's Responsibility for the Financial Statements
Management is responsible for the preparation and fair presentation of these financial statements in accordance with accounting principles generally accepted in Japan ("Japanese GAAP"); this includes the design, implementation, and maintenance of internal control relevant to the preparation and fair presentation of financial statements that are free from material misstatement, whether due to fraud or error.
Auditors' Responsibility
Our responsibility is to express an opinion on these financial statements based on our audits. We conducted our audits in accordance with auditing standards generally accepted in the United States of America. Those standards require that we plan and perform the audit to obtain reasonable assurance about whether the financial statements are free from material misstatement.
An audit involves performing procedures to obtain audit evidence about the amounts and disclosures in the financial statements. The procedures selected depend on the auditor's judgment, including the assessment of the risks of material misstatement of the financial statements, whether due to fraud or error. In making those risk assessments, the auditor considers internal control relevant to the Company's preparation and fair presentation of the financial statements in order to design audit procedures that are appropriate in the circumstances, but not for the purpose of expressing an opinion on the effectiveness of the Company's internal control. Accordingly, we express no such opinion. An audit also includes evaluating the appropriateness of accounting policies used and the reasonableness of significant accounting estimates made by management, as well as evaluating the overall presentation of the financial statements.
We believe that the audit evidence we have obtained is sufficient and appropriate to provide a basis for our audit opinion.
Opinion
In our opinion, the financial statements referred to above present fairly, in all material respects, the financial position of R-Tech Ueno, Ltd. as of March 31, 2015 and 2014 and the results of its operations and its cash flows for each of the three years in the period ended March 31, 2015, in accordance with Japanese GAAP.
Emphasis of Matter
Japanese GAAP varies in certain significant respects from accounting principles generally accepted in the United States of America. Information relating to the nature and effect of such differences is presented in Note 17 to the financial statements. Our opinion is not modified with respect to this matter.
Convenience Translation
Our audits also comprehended the translation of Japanese yen amounts into U.S. dollar amounts and, in our opinion, such translation has been made in conformity with the basis stated in Note 1 to the financial statements. Such U.S. dollar amounts are presented solely for the convenience of readers outside Japan.
June 24, 2016
R-Tech Ueno, Ltd.
Balance Sheets
March 31, 2015 and 2014
| Thousands of Yen | Thousands of U.S. Dollars (Note 1) | |||||||||||
| assets | 2015 | 2014 | 2015 | |||||||||
| CURRENT ASSETS: | ||||||||||||
| Cash and cash equivalents (Note 12) | ¥ | 4,362,911 | ¥ | 3,215,011 | $ | 36,358 | ||||||
| Time deposits (Note 12) | 3,400,000 | 3,400,000 | 28,333 | |||||||||
| Receivables (Note 13): | ||||||||||||
| Trade accounts (Note 12) | 824,949 | 415,900 | 6,875 | |||||||||
| Other | 79,235 | 127 | 660 | |||||||||
| Inventories (Note 4) | 1,544,071 | 1,319,444 | 12,867 | |||||||||
| Deferred tax assets (Note 10) | 142,418 | 50,650 | 1,187 | |||||||||
| Other current assets (Note 13) | 200,150 | 549,673 | 1,668 | |||||||||
| Total current assets | 10,553,734 | 8,950,805 | 87,948 | |||||||||
| PROPERTY, PLANT AND EQUIPMENT: | ||||||||||||
| Buildings and structures | 533,006 | 527,725 | 4,442 | |||||||||
| Machinery and equipment | 659,077 | 659,077 | 5,492 | |||||||||
| Furniture and fixtures | 736,699 | 730,575 | 6,139 | |||||||||
| Lease assets | 20,023 | 20,023 | 167 | |||||||||
| Total | 1,948,805 | 1,937,400 | 16,240 | |||||||||
| Accumulated depreciation | (1,600,484 | ) | (1,521,628 | ) | (13,337 | ) | ||||||
| Net property, plant and equipment | 348,321 | 415,772 | 2,903 | |||||||||
| INVESTMENTS AND OTHER ASSETS: | ||||||||||||
| Investment securities (Notes 3 and 12) | 4,646,846 | 1,828,767 | 38,724 | |||||||||
| Trademarks | 3,717 | 26,017 | 31 | |||||||||
| Software | 17,413 | 13,044 | 145 | |||||||||
| Security deposits and guarantee deposits (Note 13) | 52,360 | 70,797 | 436 | |||||||||
| Other assets | 41,166 | 48,937 | 343 | |||||||||
| Total investments and other assets | 4,761,502 | 1,987,562 | 39,679 | |||||||||
| TOTAL | ¥ | 15,663,557 | ¥ | 11,354,139 | $ | 130,530 | ||||||
| Thousands of Yen | Thousands of U.S. Dollars (Note 1) | |||||||||||
| LIABILITIES AND EQUITY | 2015 | 2014 | 2015 | |||||||||
| CURRENT LIABILITIES: | ||||||||||||
| Payables (Note 12): | ||||||||||||
| Trade accounts | ¥ | 360,257 | ¥ | 189,941 | $ | 3,002 | ||||||
| Lease liabilities (Note 5) | 4,948 | 5,153 | 41 | |||||||||
| Other (Note 13) | 199,877 | 220,951 | 1,666 | |||||||||
| Income taxes payable (Note 12) | 361,669 | 302,589 | 3,014 | |||||||||
| Accrued expenses | 18,226 | 13,564 | 152 | |||||||||
| Advance received from customers (Note 13) | 119,102 | 147,429 | 993 | |||||||||
| Other current liabilities | 91,098 | 19,299 | 759 | |||||||||
| Total current liabilities | 1,155,177 | 898,926 | 9,627 | |||||||||
| LONG-TERM LIABILITIES: | ||||||||||||
| Long-term debt (Notes 5 and 12) | 1,049,810 | 647,954 | 8,748 | |||||||||
| Lease liabilities (Note 5) | 4,743 | 9,691 | 40 | |||||||||
| Deferred tax liabilities (Note 10) | 1,416,290 | 572,735 | 11,802 | |||||||||
| Asset retirement obligations (Note 7) | 41,295 | 40,590 | 344 | |||||||||
| Other | 29,306 | 29,306 | 245 | |||||||||
| Total long-term liabilities | 2,541,444 | 1,300,276 | 21,179 | |||||||||
| COMMITMENTS AND CONTINGENT LIABILITIES | ||||||||||||
| EQUITY (Notes 8, 9 and 16): | ||||||||||||
| Common stock - authorized, 38,400,000 shares; issued, 19,311,800 shares in 2015, 19,301,600 shares in 2014 and 19,290,400 shares in 2013 | 661,760 | 658,675 | 5,515 | |||||||||
| Capital surplus | 601,560 | 598,475 | 5,013 | |||||||||
| Stock acquisition rights | 73,601 | 50,801 | 613 | |||||||||
| Retained earnings: | ||||||||||||
| Legal reserve | 14,540 | 14,540 | 121 | |||||||||
| Unappropriated | 7,506,747 | 6,690,276 | 62,556 | |||||||||
| Treasury stock - at cost, 52 shares in 2015 | (82 | ) | - | (1 | ) | |||||||
| Unrealized gain on available-for-sale securities | 3,108,810 | 1,142,170 | 25,907 | |||||||||
| Total equity | 11,966,936 | 9,154,937 | 99,724 | |||||||||
| TOTAL | ¥ | 15,663,557 | ¥ | 11,354,139 | $ | 130,530 | ||||||
See notes to financial statements.
- 3 -
R-Tech Ueno, Ltd.
Statements of Income
Years Ended March 31, 2015, 2014 and 2013
| Thousands of Yen | Thousands of U.S. Dollars (Note 1) | |||||||||||||||
| 2015 | 2014 | 2013 | 2015 | |||||||||||||
| NET SALES (Note 13) | ¥ | 6,559,429 | ¥ | 5,578,322 | ¥ | 4,540,011 | $ | 54,662 | ||||||||
| COST OF SALES | 2,286,181 | 2,026,644 | 1,703,348 | 19,052 | ||||||||||||
| Gross profit | 4,273,248 | 3,551,678 | 2,836,663 | 35,610 | ||||||||||||
| SELLING, GENERAL AND ADMINISTRATIVE EXPENSES (Note 11) | 2,663,760 | 2,172,710 | 2,064,522 | 22,198 | ||||||||||||
| Operating income | 1,609,488 | 1,378,968 | 772,141 | 13,412 | ||||||||||||
| OTHER INCOME (EXPENSES): | ||||||||||||||||
| Interest and dividend income | 2,505 | 2,610 | 5,493 | 21 | ||||||||||||
| Loss on disposal of property, plant and equipment | (87 | ) | (106 | ) | (4,668 | ) | (1 | ) | ||||||||
| Foreign exchange gain | 143,158 | 52,524 | 93,236 | 1,193 | ||||||||||||
| Other - net | 8,029 | 2,756 | 6,701 | 67 | ||||||||||||
| Other income - net | 153,605 | 57,784 | 100,762 | 1,280 | ||||||||||||
| INCOME BEFORE INCOME TAXES | 1,763,093 | 1,436,752 | 872,903 | 14,692 | ||||||||||||
| INCOME TAXES (Note 10): | ||||||||||||||||
| Current | 563,734 | 386,412 | 350,493 | 4,697 | ||||||||||||
| Deferred | (99,652 | ) | 16,004 | (30,322 | ) | (830 | ) | |||||||||
| Total income taxes | 464,082 | 402,416 | 320,171 | 3,867 | ||||||||||||
| NET INCOME | ¥ | 1,299,011 | ¥ | 1,034,336 | ¥ | 552,732 | $ | 10,825 | ||||||||
| Yen | U.S. Dollars | |||||||||||||||
| 2015 | 2014 | 2013 | 2015 | |||||||||||||
| PER SHARE OF COMMON STOCK (Note 14): | ||||||||||||||||
| Basic net income | ¥ | 67.3 | ¥ | 53.6 | ¥ | 28.3 | $ | 0.6 | ||||||||
| Diluted net income | 66.8 | 53.2 | 28.1 | 0.6 | ||||||||||||
| Cash dividends applicable to the year | 30.0 | 25.0 | 15.0 | 0.3 | ||||||||||||
See notes to financial statements.
- 4 -
R-Tech Ueno, Ltd.
Statements of Changes
in Equity
Years Ended March 31, 2015, 2014 and 2013
| Thousands | Thousands of Yen | |||||||||||||||||||||||||||||||||||
| Outstanding Number | Stock | Retained Earnings | Unrealized Gain on | |||||||||||||||||||||||||||||||||
| of Shares of Common Stock | Common Stock | Capital Surplus | Acquisition Rights | Legal Reserve | Unappropriated | Treasury Stock | Available-for-Sale Securities | Total Equity | ||||||||||||||||||||||||||||
| BALANCE, MARCH 31, 2012 | 19,588,800 | ¥ | 653,987 | ¥ | 593,787 | ¥ | 12,434 | ¥ | 14,540 | ¥ | 5,875,959 | ¥ | - | ¥ | 944,386 | ¥ | 8,095,093 | |||||||||||||||||||
| Net income | 552,732 | 552,732 | ||||||||||||||||||||||||||||||||||
| Cash dividends, ¥15 per share | (295,332 | ) | (295,332 | ) | ||||||||||||||||||||||||||||||||
| Purchase of treasury stock | (400,000 | ) | (188,062 | ) | (188,062 | ) | ||||||||||||||||||||||||||||||
| Retirement of treasury stock | (188,063 | ) | 188,062 | (1 | ) | |||||||||||||||||||||||||||||||
| Exercise of stock options | 1,600 | 264 | 264 | 528 | ||||||||||||||||||||||||||||||||
| Net change in the year | 12,768 | 4,436 | 17,204 | |||||||||||||||||||||||||||||||||
| BALANCE, MARCH 31, 2013 | 19,290,400 | 654,251 | 594,051 | 25,202 | 14,540 | 5,945,296 | - | 948,822 | 8,182,162 | |||||||||||||||||||||||||||
| Net income | 1,034,336 | 1,034,336 | ||||||||||||||||||||||||||||||||||
| Cash dividends, ¥15 per share | (289,356 | ) | (289,356 | ) | ||||||||||||||||||||||||||||||||
| Exercise of stock options | 11,200 | 4,424 | 4,424 | 8,848 | ||||||||||||||||||||||||||||||||
| Net change in the year | 25,599 | 193,348 | 218,947 | |||||||||||||||||||||||||||||||||
| BALANCE, MARCH 31, 2014 | 19,301,600 | 658,675 | 598,475 | 50,801 | 14,540 | 6,690,276 | - | 1,142,170 | 9,154,937 | |||||||||||||||||||||||||||
| Net income | 1,299,011 | 1,299,011 | ||||||||||||||||||||||||||||||||||
| Cash dividends, ¥25 per share | (482,540 | ) | (482,540 | ) | ||||||||||||||||||||||||||||||||
| Purchase of treasury stock | (82 | ) | (82 | ) | ||||||||||||||||||||||||||||||||
| Exercise of stock options | 10,200 | 3,085 | 3,085 | 6,170 | ||||||||||||||||||||||||||||||||
| Net change in the year | 22,800 | 1,966,640 | 1,989,440 | |||||||||||||||||||||||||||||||||
| BALANCE, MARCH 31, 2015 | 19,311,800 | ¥ | 661,760 | ¥ | 601,560 | ¥ | 73,601 | ¥ | 14,540 | ¥ | 7,506,747 | ¥ | (82 | ) | ¥ | 3,108,810 | ¥ | 11,966,936 | ||||||||||||||||||
| Thousands of U.S. Dollars (Note 1) | ||||||||||||||||||||||||||||||||||||
| Stock | Retained Earnings | Unrealized Gain on | ||||||||||||||||||||||||||||||||||
| Common Stock | Capital Surplus | Acquisition Rights | Legal Reserve | Unappropriated | Treasury Stock | Available-for-Sale Securities | Total Equity | |||||||||||||||||||||||||||||
| BALANCE, MARCH 31, 2014 | $ | 5,489 | $ | 4,987 | $ | 423 | $ | 121 | $ | 55,752 | $ | - | $ | 9,518 | $ | 76,290 | ||||||||||||||||||||
| Net income | 10,825 | 10,825 | ||||||||||||||||||||||||||||||||||
| Cash dividends, $0.2 per share | (4,021 | ) | (4,021 | ) | ||||||||||||||||||||||||||||||||
| Purchase of treasury stock | (1 | ) | (1 | ) | ||||||||||||||||||||||||||||||||
| Exercise of stock options | 26 | 26 | 52 | |||||||||||||||||||||||||||||||||
| Net change in the year | 190 | 16,389 | 16,579 | |||||||||||||||||||||||||||||||||
| BALANCE, MARCH 31, 2015 | $ | 5,515 | $ | 5,013 | $ | 613 | $ | 121 | $ | 62,556 | $ | (1 | ) | $ | 25,907 | $ | 99,724 | |||||||||||||||||||
See notes to financial statements.
The numbers of shares and dividends have been retrospectively restated for the share split conducted as of July 1, 2013 (at a ratio of 1:200).
- 5 -
R-Tech Ueno, Ltd.
Statements of Cash Flows
Years Ended March 31, 2015, 2014 and 2013
| Thousands of Yen | Thousands of U.S. Dollars (Note 1) | |||||||||||||||
| 2015 | 2014 | 2013 | 2015 | |||||||||||||
| OPERATING ACTIVITIES: | ||||||||||||||||
| Income before income taxes | ¥ | 1,763,093 | ¥ | 1,436,752 | ¥ | 872,903 | $ | 14,692 | ||||||||
| Adjustments for: | ||||||||||||||||
| Income taxes - paid | (514,389 | ) | (184,882 | ) | (407,359 | ) | (4,287 | ) | ||||||||
| Depreciation and amortization | 121,296 | 137,835 | 129,804 | 1,011 | ||||||||||||
| Share based compensation | 34,787 | 28,016 | 13,296 | 290 | ||||||||||||
| Foreign exchange gain | (121,994 | ) | (60,746 | ) | (81,224 | ) | (1,017 | ) | ||||||||
| Litigation settlement (Note 13) | (30,000 | ) | - | - | (250 | ) | ||||||||||
| Changes in assets and liabilities, net of effects: | ||||||||||||||||
| (Increase) decrease in trade accounts receivable | (409,049 | ) | 741,902 | (688,606 | ) | (3,409 | ) | |||||||||
| (Increase) decrease in inventories | (224,627 | ) | (37,059 | ) | 13,695 | (1,872 | ) | |||||||||
| (Increase) decrease in interest and dividends receivable | (137 | ) | 1,478 | (1,488 | ) | (1 | ) | |||||||||
| (Increase) decrease in prepaid expenses | (5,739 | ) | (1,140 | ) | 4,776 | (48 | ) | |||||||||
| (Increase) decrease in advance payments | 350,123 | (327,873 | ) | 76,256 | 2,918 | |||||||||||
| Increase (decrease) in trade accounts payable | 170,316 | (62,502 | ) | 128,433 | 1,419 | |||||||||||
| Increase (decrease) in other accounts payable | 26,620 | (158,951 | ) | 154,716 | 222 | |||||||||||
| Increase (decrease) in accrued expenses | 4,662 | (6,715 | ) | 2,074 | 39 | |||||||||||
| (Decrease) increase in advance received | (28,326 | ) | (50,480 | ) | 105,921 | (236 | ) | |||||||||
| Other - net | 2,066 | (27,455 | ) | (55,815 | ) | 18 | ||||||||||
| Total adjustments | (624,391 | ) | (8,572 | ) | (605,521 | ) | (5,203 | ) | ||||||||
| Net cash provided by operating activities | 1,138,702 | 1,428,180 | 267,382 | 9,489 | ||||||||||||
| INVESTING ACTIVITIES: | ||||||||||||||||
| Payment into time deposits | (6,800,000 | ) | (3,400,000 | ) | (4,600,000 | ) | (56,667 | ) | ||||||||
| Withdrawal of time deposits | 6,800,000 | 3,400,000 | 4,600,000 | 56,667 | ||||||||||||
| Purchases of property, plant and equipment | (18,605 | ) | (105,010 | ) | (72,332 | ) | (155 | ) | ||||||||
| Purchases of intangible assets | (9,627 | ) | (4,510 | ) | (68,111 | ) | (80 | ) | ||||||||
| Payments for security deposits and guarantee deposits | (1,833 | ) | - | - | (16 | ) | ||||||||||
| Other - net | 1 | 1,902 | (57,129 | ) | 0 | |||||||||||
| Net cash used in investing activities | (30,064 | ) | (107,618 | ) | (197,572 | ) | (251 | ) | ||||||||
| FINANCING ACTIVITIES: | ||||||||||||||||
| Repayment of lease liabilities | (4,758 | ) | (4,880 | ) | (4,006 | ) | (40 | ) | ||||||||
| Proceeds from issuance of long-term debt | 401,856 | 401,093 | 246,861 | 3,349 | ||||||||||||
| Repurchase of treasury stock | (82 | ) | - | (188,064 | ) | (1 | ) | |||||||||
| Dividends paid | (482,385 | ) | (288,626 | ) | (294,953 | ) | (4,019 | ) | ||||||||
| Exercise of stock options | 2,638 | 6,430 | 0 | 22 | ||||||||||||
| Net cash (used in) provided by financing activities | (82,731 | ) | 114,017 | (240,162 | ) | (689 | ) | |||||||||
| FOREIGN CURRENCY TRANSLATION ADJUSTMENTS ON CASH AND CASH EQUIVALENTS | 121,993 | 60,746 | 80,369 | 1,017 | ||||||||||||
| NET INCREASE (DECREASE) IN CASH AND CASH EQUIVALENTS | 1,147,900 | 1,495,325 | (89,983 | ) | 9,566 | |||||||||||
| CASH AND CASH EQUIVALENTS, BEGINNING OF YEAR | 3,215,011 | 1,719,686 | 1,809,669 | 26,792 | ||||||||||||
| CASH AND CASH EQUIVALENTS, END OF YEAR | ¥ | 4,362,911 | ¥ | 3,215,011 | ¥ | 1,719,686 | $ | 36,358 | ||||||||
See notes to financial statements.
- 6 -
R-Tech Ueno, Ltd.
Notes to Financial Statements
Years Ended March 31, 2015, 2014 and 2013
| 1. | BASIS OF PRESENTATION OF FINANCIAL STATEMENTS |
The accompanying financial statements have been prepared in accordance with the provisions set forth in the Japanese Financial Instruments and Exchange Act and its related accounting regulations and in accordance with accounting principles generally accepted in Japan ("Japanese GAAP"), which are different in certain respects from accounting principles generally accepted in the United States of America ("U.S. GAAP") as to the application and disclosure requirements. A discussion of certain significant differences between Japanese GAAP and U.S. GAAP is presented under Note 17 of these financial statements.
In preparing these financial statements, certain reclassifications and rearrangements have been made to the financial statements issued domestically in order to present them in a form which is more familiar to readers outside Japan. In addition, certain reclassifications have been made to the financial statements for the years ended March 31, 2014 and 2013 to conform to the classifications used in 2015.
The financial statements are stated in Japanese yen, the currency of the country in which R-Tech Ueno, Ltd. (the "Company") is incorporated and operates. The translations of Japanese yen amounts into U.S. dollar amounts are included solely for the convenience of readers outside Japan and have been made at the rate of ¥120.00 to $1, the approximate rate of exchange at March 31, 2015. Such translations should not be construed as representations that the Japanese yen amounts could be converted into U.S. dollars at that or any other rate.
| 2. | SUMMARY OF SIGNIFICANT ACCOUNTING POLICIES |
| a. | Cash Equivalents - Cash equivalents are short-term investments that are readily convertible into cash and that
are exposed to insignificant risk of changes in value. Cash equivalents include time deposits, which mature or become due within three months of the date of acquisition. |
| b. | Inventories - Inventories are stated at the lower of cost, determined by the average cost method for finished products, work in process and raw material, and by the actual cost method for supplies, or net selling value. |
| c. | Investment Securities - Investment securities are classified and accounted for, depending on management's intent, as available-for-sale securities and reported at fair value, with unrealized gains and losses, net of applicable taxes, reported in a separate component of equity. |
| d. | Property, Plant and Equipment - Property, plant and equipment are stated at cost. Depreciation of property, plant and equipment of the Company is computed by the declining-balance method except for buildings which are depreciated using the straight-line method, based on the estimated useful lives of the assets. |
The estimated useful lives are as follows:
| Buildings: | 5 to 34 years |
| Structures: | 4 to 15 years |
| Machinery and equipment: | 2 to 8 years |
| Furniture and fixtures: | 2 to 15 years |
- 7 -
| e. | Intangible Assets - Intangible assets with estimated useful lives are amortized over their estimated useful lives using the straight-line method. |
The estimated useful lives are as follows:
| Trademark | 10 years |
| Software | 5 years |
| f. | Long-Lived Assets - The Company reviews its long-lived assets for impairment whenever events or changes in circumstance indicate the carrying amount of an asset or asset group may not be recoverable. An impairment loss is recognized if the carrying amount of an asset or asset group exceeds the sum of the undiscounted future cash flows expected to result from the continued use and eventual disposition of the asset or asset group. The impairment loss would be measured as the amount by which the carrying amount of the asset exceeds its recoverable amount, which is the higher of the discounted cash flows from the continued use and eventual disposition of the asset or the net selling price at disposition. |
No impairment loss was recorded for the years ended March 31, 2015, 2014 and 2013.
| g. | Pension Plan - The Company participates in a defined contribution pension plan. Contributions to the pension plan are recorded as expenses when incurred because the plan assets attributable to each participant cannot be reasonably determined. |
| h. | Asset Retirement Obligations - In March 2008, the Accounting Standard Board of Japan ("ASBJ") issued ASBJ Statement No. 18, "Accounting Standard for Asset Retirement Obligations" and ASBJ Guidance No. 21, "Guidance on Accounting Standard for Asset Retirement Obligations." Under this accounting standard, an asset retirement obligation is defined as a legal obligation imposed either by law or contract that results from the acquisition, construction, development and normal operation of a tangible fixed asset and is associated with the retirement of such tangible fixed asset. The asset retirement obligation is recognized as the sum of the discounted cash flows required for the future asset retirement and is recorded in the period in which the obligation is incurred if a reasonable estimate can be made. If a reasonable estimate of the asset retirement obligation cannot be made in the period the asset retirement obligation is incurred, the liability should be recognized when a reasonable estimate of the asset retirement obligation can be made. Upon initial recognition of a liability for an asset retirement obligation, an asset retirement cost is capitalized by increasing the carrying amount of the related fixed asset by the amount of the liability. The asset retirement cost is subsequently allocated to expense through depreciation over the remaining useful life of the asset. Over time, the liability is accreted to its present value each period. Any subsequent revisions to the timing or the amount of the original estimate of undiscounted cash flows are reflected as an adjustment to the carrying amount of the liability and the capitalized amount of the related asset retirement cost. |
| i. | Stock Options - In December 2005, the ASBJ issued ASBJ Statement No. 8, "Accounting Standard for Stock Options" and related guidance. The new standard and guidance are applicable to stock options newly granted on and after May 1, 2006. This standard requires companies to measure the cost of employee stock options based on the fair value at the date of grant and recognize compensation expense over the vesting period as consideration for receiving goods or services. The standard also requires companies to account for stock options granted to non-employees based on the fair value of either the stock options or the goods or services received. In the balance sheet, stock options are presented as stock acquisition rights as a separate component of equity until exercised. The standard covers equity-settled, share-based payment transactions, but does not cover cash-settled, share-based payment transactions. In addition, the standard allows unlisted companies to measure options at their intrinsic value if they cannot reliably estimate fair value. |
- 8 -
| j. | Research and Development Costs - Research and development costs are charged to income as incurred. |
| k. | Leases - The accounting standard for lease transactions requires that all finance lease transactions be capitalized recognizing lease assets and lease obligations in the balance sheet.
The Company leases certain furniture, which is capitalized and included in lease assets in the balance sheet. Depreciation of leased assets is computed by the straight-line method over the leasing period with no residual value. |
| l. | Income Taxes - The provision for income taxes is computed based on the pretax income included in the statement of income. The asset and liability approach is used to recognize deferred tax assets and liabilities for the expected future tax consequences of temporary differences between the carrying amounts and the tax bases of assets and liabilities. Deferred taxes are measured by applying currently enacted income tax rates to the temporary differences. |
| m. | Foreign Currency Transactions - All short-term and long-term monetary receivables and payables denominated in foreign currencies are translated into Japanese yen at the exchange rates at the balance sheet date. The foreign exchange gains and losses from translation are recognized in the statement of income. |
| n. | Per Share Information - Basic net income per share is computed by dividing net income available to common shareholders by the weighted-average number of common shares outstanding for the period, retroactively adjusted for stock splits. |
Diluted net income per share reflects the potential dilution that could occur if securities were exercised or converted into common stock. Diluted net income per share of common stock assumes full conversion of the outstanding warrants at the beginning of the year (or at the time of issuance) with an applicable adjustment for related interest expense, net of tax, and full exercise of outstanding warrants.
Cash dividends per share presented in the accompanying statement of income are dividends applicable to the respective fiscal years, including dividends to be paid after the end of the year, retroactively adjusted for stock splits.
| o. | Consumption Taxes - Consumption taxes have been excluded from sales. |
| p. | Accounting Changes and Error Corrections - In December 2009, the ASBJ issued ASBJ Statement No. 24, "Accounting Standard for Accounting Changes and Error Corrections" and ASBJ Guidance No. 24, "Guidance on Accounting Standard for Accounting Changes and Error Corrections." Accounting treatments under this standard and guidance are as follows: (1) Changes in Accounting Policies - When a new accounting policy is applied following revision of an accounting standard, the new policy is applied retrospectively unless the revised accounting standard includes specific transitional provisions, in which case the entity shall comply with the specific transitional provisions. (2) Changes in Presentation - When the presentation of financial statements is changed, prior-period financial statements are reclassified in accordance with the new presentation. (3) Changes in Accounting Estimates - A change in an accounting estimate is accounted for in the period of the change if the change affects that period only, and is accounted for prospectively if the change affects both the period of the change and future periods. (4) Corrections of Prior-Period Errors - When an error in prior-period financial statements is discovered, those statements are restated. |
- 9 -
| 3. | INVESTMENT SECURITIES |
Investment securities as of March 31, 2015 and 2014, consisted of the following:
| Thousands of Yen | Thousands of U.S. Dollars | |||||||||||
| 2015 | 2014 | 2015 | ||||||||||
| Non-current: | ||||||||||||
| Marketable equity securities | ¥ | 4,646,846 | ¥ | 1,828,767 | $ | 38,724 | ||||||
| Total | ¥ | 4,646,846 | ¥ | 1,828,767 | $ | 38,724 | ||||||
The costs and aggregate fair values of investment securities at March 31, 2015 and 2014, were as follows:
| Thousands of Yen | ||||||||||||||||
| March 31, 2015 | Cost | Unrealized Gains | Unrealized Losses | Fair Value | ||||||||||||
| Securities classified as: | ||||||||||||||||
| Available-for-sale: | ||||||||||||||||
| Equity securities | ¥ | 55,486 | ¥ | 4,591,360 | ¥ | - | ¥ | 4,646,846 | ||||||||
| March 31, 2014 | ||||||||||||||||
| Securities classified as: | ||||||||||||||||
| Available-for-sale: | ||||||||||||||||
| Equity securities | ¥ | 55,486 | ¥ | 1,773,281 | ¥ | - | ¥ | 1,828,767 | ||||||||
| Thousands of U.S. Dollars | ||||||||||||||||
| March 31, 2015 | Cost | Unrealized Gains | Unrealized Losses | Fair Value | ||||||||||||
| Securities classified as: | ||||||||||||||||
| Available-for-sale: | ||||||||||||||||
| Equity securities | $ | 463 | $ | 38,261 | $ | - | $ | 38,724 | ||||||||
No impairment losses on available-for-sale equity securities were recorded for the years ended March 31, 2015, 2014 and 2013.
| 4. | INVENTORIES |
Inventories at March 31, 2015 and 2014, consisted of the following:
| Thousands of Yen | Thousands of U.S. Dollars | |||||||||||
| 2015 | 2014 | 2015 | ||||||||||
| Finished products | ¥ | 138,275 | ¥ | 127,800 | $ | 1,152 | ||||||
| Work in process | 1,160,809 | 1,126,444 | 9,673 | |||||||||
| Raw materials and supplies | 244,987 | 65,200 | 2,042 | |||||||||
| Total | ¥ | 1,544,071 | ¥ | 1,319,444 | $ | 12,867 | ||||||
- 10 -
| 5. | LONG-TERM DEBT |
Long-term debt as of March 31, 2015 and 2014 is summarized below.
| Thousands of Yen | Thousands of U.S. Dollars | |||||||||||
| 2015 | 2014 | 2015 | ||||||||||
| Unsecured non-interest-bearing loans from Japan Science and Technology Agency (JST) | ¥ | 1,049,810 | ¥ | 647,954 | $ | 8,748 | ||||||
| Obligations under finance leases | 9,691 | 14,844 | 81 | |||||||||
| Total | 1,059,501 | 662,798 | 8,829 | |||||||||
| Less current portion | (4,948 | ) | (5,153 | ) | (41 | ) | ||||||
| Long-term debt, less current portion | ¥ | 1,054,553 | ¥ | 657,645 | $ | 8,788 | ||||||
There is no long-term debt with a maturity date within five years. The maturity of long-term debt from JST will be determined for ten years from the launch of a product which is the outcome of related research and development activity.
| 6. | PENSION PLAN |
The Company participates in a defined contribution pension plan, and records the required contributions as retirement benefit expenses. The amount of retirement benefit expenses for the years ended March 31, 2015, 2014 and 2013 were \21,584 thousand ($180 thousand), \20,802 thousand and \21,818 thousand, respectively.
| 7. | ASSET RETIREMENT OBLIGATIONS |
| a. | Overview of the Asset Retirement Obligations |
Asset retirement obligations relate to restoration requirements associated with the real estate lease agreements for the Tokyo head office, Sanda plant and Kobe Research Center.
| b. | Method of Calculating the Amount of Asset Retirement Obligations |
The amount of asset retirement obligations was calculated by applying a usage period estimated to range between 13 and 27 years from lease inception date, and the discount rate was derived from the average yield of government bonds with terms corresponding to the usage period, which range from 1.146% to 2.266%.
| c. | Changes in Asset Retirement Obligations |
The changes in asset retirement obligations for the years ended March 31, 2015 and 2014, were as follows:
| Thousands of Yen | Thousands of U.S. Dollars | |||||||||||
| 2015 | 2014 | 2015 | ||||||||||
| Balance at beginning of year | ¥ | 40,590 | ¥ | 30,130 | $ | 338 | ||||||
| Additional provisions associated with the inception of lease assets | - | 9,658 | - | |||||||||
| Reconciliation associated with passage of time | 705 | 802 | 6 | |||||||||
| Balance at end of year | ¥ | 41,295 | ¥ | 40,590 | $ | 344 | ||||||
- 11 -
| 8. | EQUITY |
Japanese companies are subject to the Companies Act of Japan (the "Companies Act"). The significant provisions in the Companies Act that affect financial and accounting matters are summarized below:
| a. | Dividends Under the Companies Act, companies can pay dividends at any time during the fiscal year in addition to the year-end dividend upon resolution at the shareholders' meeting. For companies that meet certain criteria including (1) having a Board of Directors, (2) having independent auditors, (3) having an Audit & Supervisory Board, and (4) the term of service of the directors being prescribed as one year rather than the normal two-year term by its articles of incorporation, the Board of Directors may declare dividends (except for dividends-in-kind) at any time during the fiscal year if the Company has prescribed so in its articles of incorporation. The Company meets all the above criteria. |
Semiannual interim dividends may also be paid once a year upon resolution by the Board of Directors if the articles of incorporation of the Company so stipulate. The Companies Act provides certain limitations on the amounts available for dividends or the purchase of treasury stock. The limitation is defined as the amount available for distribution to the shareholders, but the amount of net assets after dividends must be maintained at no less than \3,000 thousand.
| b. | Increases/Decreases and Transfer of Common Stock, Reserve and Surplus The Companies Act requires that an amount equal to 10% of dividends must be appropriated as a legal reserve (a component of retained earnings) or as additional paid-in capital (a component of capital surplus), depending on the equity account charged upon the payment of such dividends, until the aggregate amount of legal reserve and additional paid-in capital equals 25% of the common stock. Under the Companies Act, the total amount of additional paid-in capital and legal reserve may be reversed without limitation. The Companies Act also provides that common stock, legal reserve, additional paid-in capital, other capital surplus and retained earnings can be transferred among the accounts within equity under certain conditions upon resolution of the shareholders. |
| c. | Treasury Stock and Treasury Stock Acquisition Rights The Companies Act also provides for companies to purchase treasury stock and dispose of such treasury stock by resolution of the Board of Directors. The amount of treasury stock purchased cannot exceed the amount available for distribution to the shareholders which is determined by a specific formula. Under the Companies Act, stock acquisition rights are presented as a separate component of equity. The Companies Act also provides that companies can purchase both treasury stock acquisition rights and treasury stock. Such treasury stock acquisition rights are presented as a separate component of equity or deducted directly from stock acquisition rights. On July 1, 2013, the Company made a two hundred-for-one stock split by way of a free share distribution based on the resolution of the Board of Directors' meeting held on May 15, 2013. The numbers of shares, earnings per share and dividends per share presented in the financial statements have been retrospectively restated for the share split. |
- 12 -
| 9. | STOCK OPTIONS |
| a. | Expenses for Stock Options and Account Titles |
| Thousands of Yen | Thousands of U.S. Dollars | |||||||||||||||
| 2015 | 2014 | 2013 | 2015 | |||||||||||||
| Share based compensation recorded as selling, general and administrative expenses | ¥ | 34,787 | ¥ | 26,599 | ¥ | 12,897 | $ | 290 | ||||||||
| b. | Amount Recorded as Other Income Due to Forfeiture of Unexercised Stock Options |
| Thousands of Yen | Thousands of U.S. Dollars | |||||||||||||||
| 2015 | 2014 | 2013 | 2015 | |||||||||||||
| Other income | ¥ | 8,453 | ¥ | - | ¥ | - | $ | 70 | ||||||||
| c. | Stock Options Outstanding as of March 31, 2015 |
Stock Option |
Persons Granted |
Number of Shares* | Date of Grant |
Exercise Price |
Exercise Period | |||||
| 2006 Stock Option (1) |
2 directors |
329,600 shares | 2/20/2006 |
¥1,475 ($12.3) |
From 2/17/2008 to 2/16/2016 | |||||
| 2006 Stock Option (2) |
3 directors |
53,600 shares | 7/1/2006 |
¥1,475 ($12.3) |
From 6/29/2008 to 6/28/2016 | |||||
| 2011 Stock Option (1) | 2 directors | 40,000 shares | 8/10/2011 |
¥1 ($0.0) |
From 8/11/2011 to 8/10/2041 | |||||
| 2011 Stock Option (2) | 9 employees | 10,000 shares | 8/10/2011 |
¥1 ($0.0) |
From 8/11/2011 to 8/10/2016 | |||||
| 2012 Stock Option (1) | 2 directors | 40,000 shares | 8/10/2012 |
¥1 ($0.0) |
From 8/11/2012 to 8/10/2042 | |||||
| 2012 Stock Option (2) | 17 employees | 19,000 shares | 8/10/2012 |
¥1 ($0.0) |
From 8/11/2012 to 8/10/2017 | |||||
| 2013 Stock Option (1) | 2 directors | 9,900 shares | 8/9/2013 |
¥1 ($0.0) |
From 8/10/2013 to 8/9/2043 | |||||
| 2013 Stock Option (2) | 12 employees | 8,800 shares | 8/9/2013 |
¥1 ($0.0) |
From 8/10/2013 to 8/9/2018 | |||||
| 2014 Stock Option (1) | 2 directors | 14,000 shares | 8/14/2014 |
¥1 ($0.0) |
From 8/15/2014 to 8/14/2044 | |||||
| 2014 Stock Option (2) | 13 employees | 15,400 shares | 8/14/2014 |
¥1 ($0.0) |
From 8/15/2014 to 8/14/2019 |
| * | The numbers of shares indicated above are calculated based on the number of shares after the share split was conducted as of July 1, 2013 (at a ratio of 1:200). |
- 13 -
The details of stock options are as follows:
| Stock Option | Vesting Conditions | Service Period | ||
| 2006 Stock Option (1) | Each holder shall hold the position of director, corporate auditor or employee of the Company at the time of exercising the stock option as well as its grant date. However, those who have retired from the position of director or corporate auditor due to expiry of the service term or employees who have lost their position for reasons other than for cause may exercise their stock options after the Company's IPO and within one month from the retirement date. | Not applicable | ||
| 2006 Stock Option (2) | Same as the above 2006 Stock Option (1) | Not applicable | ||
| 2011 Stock Option (1) | A person who was granted stock options may basically exercise the stock options only within 10 days following the date of retirement as the Company's director. In addition, each stock option may not be exercised in part. | Not applicable | ||
| 2011 Stock Option (2) | A person who was granted stock options is required to hold the position of director, corporate auditor, or employee of the Company at the time of exercise. However, those who retired from their office due to expiry of the service term or were separated from the Company for reasons other than for cause may exercise their stock options within 30 days from the separation date. In addition, each stock option may not be exercised in part. | Not applicable | ||
| 2012 Stock Option (1) | Same as the above 2011 Stock Option (1) | Not applicable | ||
| 2012 Stock Option (2) | Same as the above 2011 Stock Option (2) | Not applicable | ||
| 2013 Stock Option (1) | Same as the above 2011 Stock Option (1) | Not applicable | ||
| 2013 Stock Option (2) | Same as the above 2011 Stock Option (2) | Not applicable | ||
| 2014 Stock Option (1) | Same as the above 2011 Stock Option (1) | Not applicable | ||
| 2014 Stock Option (2) | Same as the above 2011 Stock Option (2) | Not applicable |
- 14 -
| d. | Stock Option Activity |
| The numbers of options indicated below have been retrospectively restated for the share split conducted as of July 1, 2013 (at a ratio of 1:200). |
| 2006 Stock Option (1) |
2006 Stock Option (2) |
2011 Stock Option (1) |
2011 Stock Option (2) |
2012 Stock Option (1) |
2012 Stock Option (2) |
2013 Stock Option (1) |
2013 Stock Option (2) |
2014 Stock Option (1) |
2014 Stock Option (2) |
||||||||||||
| (Shares) | |||||||||||||||||||||
| Year Ended March 31, 2014 | |||||||||||||||||||||
| Non-vested | |||||||||||||||||||||
| April 1, 2013 - Outstanding | - | - | - | 5,400 | - | 15,800 | - | - | - | - | |||||||||||
| Granted | - | - | - | - | - | - | 9,900 | 8,800 | - | - | |||||||||||
| Canceled | - | - | - | - | - | - | - | - | - | - | |||||||||||
| Vested | - | - | - | 5,400 | - | 5,600 | 9,900 | 1,000 | - | - | |||||||||||
| March 31, 2014 - Outstanding | - | - | - | - | - | 10,200 | - | 7,800 | - | - | |||||||||||
| Vested | |||||||||||||||||||||
| April 1, 2013 - Outstanding | 165,200 | 4,800 | 40,000 | 3,800 | 40,000 | 2,400 | - | - | - | - | |||||||||||
| Vested | - | - | - | 5,400 | - | 5,600 | 9,900 | 1,000 | - | - | |||||||||||
| Exercised | 4,000 | - | - | 3,200 | - | 3,000 | - | 200 | - | - | |||||||||||
| Canceled | - | - | - | - | - | - | - | - | - | - | |||||||||||
| March 31, 2014 - Outstanding | 161,200 | 4,800 | 40,000 | 6,000 | 40,000 | 5,000 | 9,900 | 800 | - | - | |||||||||||
| Year Ended March 31, 2015 | |||||||||||||||||||||
| Non-vested | |||||||||||||||||||||
| April 1, 2014 - Outstanding | - | - | - | - | - | 10,200 | - | 7,800 | - | - | |||||||||||
| Granted | - | - | - | - | - | - | - | - | 14,000 | 15,400 | |||||||||||
| Canceled | - | - | - | - | - | 1,200 | - | 1,600 | - | 1,500 | |||||||||||
| Vested | - | - | - | - | - | 9,000 | - | 3,000 | 14,000 | 3,400 | |||||||||||
| March 31, 2015 - Outstanding | - | - | - | - | - | - | - | 3,200 | - | 10,500 | |||||||||||
| Vested | |||||||||||||||||||||
| April 1, 2014 - Outstanding | 161,200 | 4,800 | 40,000 | 6,000 | 40,000 | 5,000 | 9,900 | 800 | - | - | |||||||||||
| Vested | - | - | - | - | - | 9,000 | - | 3,000 | 14,000 | 3,400 | |||||||||||
| Exercised | - | - | - | 400 | - | 4,600 | - | 800 | - | 400 | |||||||||||
| Canceled | - | - | - | 2,200 | - | 1,000 | - | 800 | - | 500 | |||||||||||
| March 31, 2015 - Outstanding | 161,200 | 4,800 | 40,000 | 3,400 | 40,000 | 8,400 | 9,900 | 2,200 | 14,000 | 2,500 | |||||||||||
| Exercise price | ¥1,475 ($12.3 |
) |
¥1,475 ($12.3 |
) |
¥1 ($0.0 |
) |
¥1 ($0.0 |
) |
¥1 ($0.0 |
) |
¥1 ($0.0 |
) |
¥1 ($0.0 |
) |
¥1 ($0.0 |
) |
¥1 ($0.0 |
) |
¥1 ($0.0 |
) | |
| Average stock price at exercise | ¥ - ($ - |
) |
¥ - ($ - |
) |
¥ - ($ - |
) |
¥1,499 ($12.5 |
) |
¥ - ($ - |
) |
¥1,459 ($12.2 |
) |
¥ - ($ - |
) |
¥1,499 ($12.5 |
) |
¥ - ($ - |
) |
¥1,499 ($12.5 |
) | |
| Fair value price at grant date |
¥ - ($ - |
) |
¥ - ($ - |
) |
¥259 ($2.2 |
) |
¥354 ($2.9 |
) |
¥223 ($1.9 |
) |
¥305 ($2.5 |
) |
¥1,736 ($14.5 |
) |
¥1,827 ($15.2 |
) |
¥1,188 ($9.9 |
) |
¥1,308 ($10.9 |
) | |
| e. | Assumptions Used to Measure the Fair Value of the 2015 Stock Option |
| i. | 2006 Stock Option (1) and 2006 Stock Option (2) When these stock options were granted, the Company was not listed on the public markets. Therefore, the Company estimates the fair value of these stock options based on their intrinsic value which is calculated using the DCF method. |
- 15 -
| ii. | Stock Options granted after 2011 Estimate method: Black-Scholes option pricing model |
| 2011 Stock Option (1) | 2011 Stock Option (2) | 2012 Stock Option (1) | 2012 Stock Option (2) | 2013 Stock Option (1) | 2013 Stock Option (2) | 2014 Stock Option (1) | 2014 Stock Option (2) | |||||||||||||||||||||||||
| Volatility of stock price *1 | 85.0 | % | 85.0 | % | 75.6 | % | 51.9 | % | 86.7 | % | 76.3 | % | 82.0 | % | 74.4 | % | ||||||||||||||||
| Estimated remaining outstanding period (Years) *2 | 12.0 | 3.5 | 10.9 | 3.5 | 9.9 | 3.5 | 8.9 | 3.5 | ||||||||||||||||||||||||
| Estimated dividend per share *3 | 15 | 15 | 15 | 15 | 15 | 15 | 25 | 25 | ||||||||||||||||||||||||
| Risk free interest rate *4 | 1.3 | % | 0.2 | % | 0.9 | % | 0.1 | % | 0.8 | % | 0.2 | % | 0.4 | % | 0.1 | % | ||||||||||||||||
Note
| *1 | Periods for computation using actual price: |
| 2011 Stock Option (1) and 2011 Stock Option (2) | - 3 years (from April 2008 to August 2011), |
| 2012 Stock Option (1) | - 4 years (from April 2008 to August 2012), |
| 2012 Stock Option (2) | - 3 years (from February 2009 to August 2012), |
| 2013 Stock Option (1) | - 5 years (from April 2008 to August 2013), |
| 2013 Stock Option (2) | - 3 years (from February 2010 to August 2013), |
| 2014 Stock Option (1) | - 6 years (from April 2008 to August 2014), |
| 2014 Stock Option (2) | - 3 years (from February 2011 to August 2014) |
| *2 | Estimated remaining outstanding period is determined based on the estimated remaining period to the retirement of persons granted or the assumption that all the options are exercised by the medium date of exercise period. |
| *3 | Estimated dividend per share is calculated using the actual dividends in each year. |
| *4 | For the risk free rate, the Company uses the yield of Japanese Treasury bonds applicable to the estimated remaining outstanding period of the options. |
| iii. | Estimation of the number of stock options vested Because it is difficult to reasonably estimate the number of options that will be forfeited in the future, only the number of actual forfeited options is reflected. |
| iv. | Intrinsic value |
| (i) | No stock options are measured at intrinsic value as of March 31, 2015. The total intrinsic value of stock options measured at intrinsic value is \6,756 thousand as of March 31, 2014. |
| (ii) | The total amount of intrinsic value of exercised stock options as of the exercise date was \2,055 thousand ($17 thousand) and \470 thousand for the years ended March 31, 2015 and 2014, respectively. |
- 16 -
| 10. | INCOME TAXES |
The Company is subject to Japanese national and local income taxes which, in the aggregate, resulted in normal effective statutory tax rates of approximately 35.6%, 38.0% and 38.0% for the years ended March 31, 2015, 2014 and 2013, respectively.
The tax effects of significant temporary differences which resulted in deferred tax assets and liabilities at March 31, 2015 and 2014, are as follows:
| Thousands of Yen | Thousands of U.S. Dollars | |||||||||||
| 2015 | 2014 | 2015 | ||||||||||
| Deferred tax assets: | ||||||||||||
| Research and development costs | ¥ | 135,171 | ¥ | 48,816 | $ | 1,126 | ||||||
| Enterprise tax payable | 31,018 | 28,222 | 258 | |||||||||
| Accrued expenses | 1,665 | 18,928 | 14 | |||||||||
| Asset retirement obligations | 13,334 | 14,445 | 111 | |||||||||
| Long-term non trade payables | 9,463 | 10,430 | 79 | |||||||||
| Other | 26,413 | 21,808 | 221 | |||||||||
| Less valuation allowance | - | (23,651 | ) | - | ||||||||
| Total | ¥ | 217,064 | ¥ | 118,998 | $ | 1,809 | ||||||
| Deferred tax liabilities: | ||||||||||||
| Unrealized gain on available-for-sale securities | ¥ | 1,482,550 | ¥ | 631,110 | $ | 12,354 | ||||||
| Other | 8,386 | 9,973 | 70 | |||||||||
| Total | 1,490,936 | 641,083 | 12,424 | |||||||||
| Net deferred tax liabilities | ¥ | 1,273,872 | ¥ | 522,085 | $ | 10,615 | ||||||
A reconciliation between the normal effective statutory tax rates and the actual effective tax rates reflected in the accompanying statement of income for the year ended March 31, 2015, with the corresponding figures for 2014 and 2013, is as follows:
| 2015 | 2014 | 2013 | ||||||||||
| Normal effective statutory tax rate | 35.6 | % | 38.0 | % | 38.0 | % | ||||||
| Tax deduction on research and development costs | (10.9 | ) | (10.3 | ) | (8.6 | ) | ||||||
| Tax on accumulated earnings | 1.7 | - | - | |||||||||
| Effect of reduction of income tax rates on net deferred tax assets | 1.2 | - | - | |||||||||
| Valuation allowance | (1.3 | ) | 0.5 | 0.4 | ||||||||
| Income taxes for prior year | - | - | 6.4 | |||||||||
| Other - net | 0.0 | (0.2 | ) | 0.5 | ||||||||
| Actual effective tax rate | 26.3 | % | 28.0 | % | 36.7 | % | ||||||
New tax reform laws enacted in 2015 in Japan changed the normal effective statutory tax rate for the fiscal year beginning on or after April 1, 2015, to approximately 33.0% and for the fiscal year beginning on or after April 1, 2016, to approximately 32.3%. The effect of these changes was to decrease deferred tax liabilities, net of deferred tax assets, by \131,109 thousand ($1,093 thousand) and increase unrealized gain on available-for-sale securities by \151,515 thousand ($1,263 thousand) in the balance sheet as of March 31, 2015, and to increase income taxes-deferred in the statement of income for the year then ended by \20,406 thousand ($170 thousand).
- 17 -
| 11. | RESEARCH AND DEVELOPMENT COSTS |
Research and development costs charged to income were ¥1,830,027 thousand ($15,250 thousand), ¥1,372,578 thousand and ¥1,279,566 thousand for the years ended March 31, 2015, 2014 and 2013, respectively.
| 12. | FINANCIAL INSTRUMENTS AND RELATED DISCLOSURES |
| a. | Company Policy for Financial Instruments The Company limits its fund management to short-term deposits, and does not have loans from banks or other financial institutions. However, the Company received non-interest-bearing loans from the JST for development of medicine for retinitis pigmentosa. In addition, the Company does not have any derivatives. |
| b. | Nature and Extent of Risks Arising from and Risk Management for Financial Instruments |
Trade receivables are exposed to customer credit risk and the Company mitigates such risk in accordance with its credit management policies. In addition, trade receivables from product sales are denominated in foreign currencies and exposed to the market risk of fluctuation in foreign currency exchange rates. The Company reduces such risks by setting policies for foreign currency-denominated financial assets.
All investment securities are common shares of Sucampo Pharmaceuticals Inc., and the Company monitors their market value on a quarterly basis.
All trade payables and other payables are due within one year.
| c. | Concentration of Credit Risk |
The ratio of receivables from major customers among trade receivables for the years ended March 31, 2015 and 2014 is as follows:
| Name of Customers | 2015 | 2014 | ||||||
| Santen Pharmaceutical Co., Ltd. | 21.0 | % | 18.4 | % | ||||
| Takeda Pharmaceutical Company Limited | 41.9 | % | 37.5 | % | ||||
| Sucampo AG | 36.1 | % | 43.1 | % | ||||
- 18 -
| d. | Fair Values of Financial Instruments Fair values of financial instruments are based on quoted prices in active markets. If a quoted price is not available, another rational valuation technique is used instead. |
i. Fair value of financial instruments
| Thousands of Yen | ||||||||||||
| Carrying Amount | Fair Value | Unrealized Gain/Loss | ||||||||||
| March 31, 2015 | ||||||||||||
| Cash and cash equivalents | ¥ | 4,362,911 | ¥ | 4,362,911 | ¥ | - | ||||||
| Time deposits | 3,400,000 | 3,400,000 | - | |||||||||
| Trade receivables | 824,949 | 824,949 | - | |||||||||
| Investment securities | 4,646,846 | 4,646,846 | - | |||||||||
| Total | ¥ | 13,234,706 | ¥ | 13,234,706 | ¥ | - | ||||||
| Trade payables | ¥ | 360,257 | ¥ | 360,257 | ¥ | - | ||||||
| Other payables | 199,877 | 199,877 | - | |||||||||
| Income taxes payable | 361,669 | 361,669 | - | |||||||||
| Total | ¥ | 921,803 | ¥ | 921,803 | ¥ | - | ||||||
| March 31, 2014 | ||||||||||||
| Cash and cash equivalents | ¥ | 3,215,011 | ¥ | 3,215,011 | ¥ | - | ||||||
| Time deposits | 3,400,000 | 3,400,000 | - | |||||||||
| Trade receivables | 415,900 | 415,900 | - | |||||||||
| Investment securities | 1,828,767 | 1,828,767 | - | |||||||||
| Total | ¥ | 8,859,678 | ¥ | 8,859,678 | ¥ | - | ||||||
| Trade payables | ¥ | 189,941 | ¥ | 189,941 | ¥ | - | ||||||
| Other payables | 220,951 | 220,951 | - | |||||||||
| Income taxes payable | 302,589 | 302,589 | - | |||||||||
| Total | ¥ | 713,481 | ¥ | 713,481 | ¥ | - | ||||||
Thousands of U.S. Dollars | ||||||||||||
| Carrying Amount | Fair Value | Unrealized Gain/Loss | ||||||||||
| March 31, 2015 | ||||||||||||
| Cash and cash equivalents | $ | 36,358 | $ | 36,358 | $ | - | ||||||
| Time deposits | 28,333 | 28,333 | - | |||||||||
| Trade receivables | 6,875 | 6,875 | - | |||||||||
| Investment securities | 38,724 | 38,724 | - | |||||||||
| Total | $ | 110,290 | $ | 110,290 | $ | - | ||||||
| Trade payables | $ | 3,002 | $ | 3,002 | $ | - | ||||||
| Other payables | 1,666 | 1,666 | - | |||||||||
| Income taxes payable | 3,014 | 3,014 | - | |||||||||
| Total | $ | 7,682 | $ | 7,682 | $ | - | ||||||
- 19 -
Cash and Cash Equivalents and Time Deposits
The carrying values of cash and cash equivalents and time deposits approximate fair value because of their short maturities.
Investment Securities
The fair values of investment securities are measured at the quoted market price of the stock exchange for the equity instruments. Fair value information for investment securities by classification is included in Note 3.
Trade Receivables, Trade Payables, Other Payables and Income Taxes Payables
The fair values of these receivables and payables approximate fair value because of their short maturities.
| ii. | Carrying amount of financial instruments whose fair value cannot be reliably determined |
| Thousands of Yen | Thousands of U.S. Dollars | |||||||||||
| 2015 | 2014 | 2015 | ||||||||||
| Long term debt | ¥ | 1,049,810 | ¥ | 647,954 | $ | 8,748 | ||||||
Long-term debt consists of borrowings from JST whose fair value cannot reliably determined because its repayment date has not been determined. The maturity of long-term debt from JST will be determined for ten years from the launch of a product which is the outcome of related research and development activity.
| e. | Maturity Analysis for Financial Assets and Securities with Contractual Maturities |
| Thousands of Yen | ||||||||||||||||
| March 31, 2015 | Due in One Year or Less | Due after One Year through Five Years | Due after Five Years through Ten Years | Due after Ten Years | ||||||||||||
| Cash and cash equivalents | ¥ | 4,362,911 | ¥ | - | ¥ | - | ¥ | - | ||||||||
| Time deposits | 3,400,000 | - | - | - | ||||||||||||
| Trade receivables | 824,949 | - | - | - | ||||||||||||
| Total | ¥ | 8,587,860 | ¥ | - | ¥ | - | ¥ | - | ||||||||
| Thousands of Yen | ||||||||||||||||
| March 31, 2014 | Due in One Year or Less | Due after One Year through Five Years | Due after Five Years through Ten Years | Due after Ten Years | ||||||||||||
| Cash and cash equivalents | ¥ | 3,215,011 | ¥ | - | ¥ | - | ¥ | - | ||||||||
| Time deposits | 3,400,000 | - | - | - | ||||||||||||
| Trade receivables | 415,900 | - | - | - | ||||||||||||
| Total | ¥ | 7,030,911 | ¥ | - | ¥ | - | ¥ | - | ||||||||
- 20 -
| Thousands of U.S. Dollars | ||||||||||||||||
| March 31, 2015 | Due in One Year or Less | Due after One Year through Five Years | Due after Five Years through Ten Years | Due after Ten Years | ||||||||||||
| Cash and cash equivalents | $ | 36,358 | $ | - | $ | - | $ | - | ||||||||
| Time deposits | 28,333 | - | - | - | ||||||||||||
| Trade receivables | 6,875 | - | - | - | ||||||||||||
| Total | $ | 71,566 | $ | - | $ | - | $ | - | ||||||||
| 13. | RELATED PARTY TRANSACTIONS |
The related party transactions of the Company for the years ended March 31, 2015, 2014 and 2013 are as follows:
| Thousands of Yen | Thousands of U.S. Dollars | |||||||||||||||
| 2015 | 2014 | 2013 | 2015 | |||||||||||||
| CRO arrangement with Sucampo Pharma Americas, Inc. (Note A) | ¥ | 66,212 | ¥ | 59,115 | ¥ | 74,006 | $ | 552 | ||||||||
| CRO arrangement with Sucampo Pharma, LLC (Note A) | 19,354 | 44,224 | 13,197 | 161 | ||||||||||||
| CRO arrangement with Sucampo AG (Note A) | 7,451 | 32,261 | 61,112 | 62 | ||||||||||||
| Sales of products to Sucampo AG (Note B) | 1,529,096 | 913,841 | 671,209 | 12,742 | ||||||||||||
| Lease of land to Sucampo Pharma, LLC (Note C) | 0 | 0 | 4,634 | 0 | ||||||||||||
| License granted to Sucampo AG (Note D) | 0 | 0 | 45,570 | 0 | ||||||||||||
| License granted by Sucampo AG (Note E) | 0 | 0 | 59,570 | 0 | ||||||||||||
| Lease of land and buildings from Ueno Fine Chemicals Industry, LTD. (Note F) | 4,812 | 4,812 | 67,288 | 40 | ||||||||||||
| Settlement payment to Ueno Fine Chemicals Industry, LTD. (Note G) | 30,000 | 0 | 0 | 250 | ||||||||||||
Note:
| A. | These Contract Research Organization (CRO) arrangements primarily consists of several R&D services related to medical drug products provided to Sucampo Pharma Americas, Inc., Sucampo Pharma, LLC and Sucampo AG, which are subsidiaries of a third party whose majority of shares are owned by the majority shareholders of the Company. The Company provided several R&D support services mainly to research medical drug products, summarize the results, and report to the customers. The terms of the transactions were determined in the same manner as third party transactions. |
- 21 -
| B. | Sales of products to Sucampo AG include sales of Rescula® (ophthalmic solution) and AMITIZA® (capsule), and their selling prices are determined by taking market prices into consideration. The terms of the transactions are determined in the same way as a third party transaction. |
| C. | On October 1, 2010, the Company entered into a lease agreement and leased facilities located in the Sanda factory to Sucampo Pharma, LLC. The rental payments were determined by taking real estate appraisal value into consideration. |
| D. | On April 23, 2009, the Company entered into a licensing agreement whereby the Company granted to Sucampo AG the exclusive rights to develop, manufacture, commercialize, and sell Unoprostone in North America and Canada, for all indications including glaucoma and ocular hypertension. The licensing agreement included contingent payments for reaching various milestones including launching the product within North America and Canada along with certain sales milestones. During the year ended March 31, 2013, Sucampo AG launched the product and paid the Company \45,570 thousand, which the Company recognized as revenue. The royalty for this license was determined based on negotiations and by considering market prices. |
| E. | On February 23, 2009, the Company entered into a licensing agreement whereby the Company was granted by Sucampo AG the exclusive rights to manufacture and market Amitiza in Japan and the Asia-Oceania region. The Company made a payment to Sucampo AG when New Drug Application for Amitiza was approved and beginning of commercialization launch in Japan. The royalty was determined based on negotiations and by considering market prices. |
| F. | On April 1, 2004, the Company entered into a lease agreement for land and buildings for the Sanda factory and paid rental fees to Ueno Fine Chemicals Industry, LTD., which is a company whose majority of shares are owned by the majority shareholders of the Company and their close family members. The rental fees for the land and buildings were determined by taking real estate appraisal amounts into consideration. |
| G. | On December 24, 2014, the Company settled a legal dispute with Ueno Fine Chemicals Industry, LTD. regarding the termination of the facilities subject to the lease agreement described in Note F above. In connection with the settlement, the Company paid Ueno Fine Chemicals Industry, LTD. \30,000 thousand. |
- 22 -
The balance due to or due from related parties at March 31, 2015 and 2014 is as follows:
| Thousands of Yen | Thousands of U.S. Dollars | |||||||||||
| 2015 | 2014 | 2015 | ||||||||||
| Sucampo Pharma Americas, Inc.: | ||||||||||||
| Trade receivable | ¥ | 7,163 | ¥ | 278 | $ | 60 | ||||||
| Advance received from customers | - | 31,881 | - | |||||||||
| Sucampo Pharma, LLC: | ||||||||||||
| Trade receivable | ¥ | - | ¥ | 1,771 | $ | - | ||||||
| Advance received from customers | 7,037 | 6,392 | 59 | |||||||||
| Sucampo AG: | ||||||||||||
| Trade receivable | ¥ | 297,850 | ¥ | 179,094 | $ | 2,482 | ||||||
| Other current assets | 90,915 | 75,032 | 758 | |||||||||
| Ueno Fine Chemicals Industry, LTD.: | ||||||||||||
| Security deposits and guarantee deposits | ¥ | 802 | ¥ | 21,072 | $ | 7 | ||||||
| Other current assets | 401 | 401 | 3 | |||||||||
| Other payables | 1,232 | 4,363 | 10 | |||||||||
| 14. | NET INCOME PER SHARE |
Reconciliation of the differences between basic and diluted net income per share ("EPS") for the years ended March 31, 2015, 2014 and 2013, is as follows:
Thousands | Thousands of Shares | Yen | U.S. Dollars | |||||||||||||
| Year Ended March 31, 2015 | Net Income | Weighted- Average Shares | EPS | |||||||||||||
| Basic EPS - Net income available to common shareholders | ¥ | 1,299,011 | 19,308 | ¥ | 67.3 | $ | 0.6 | |||||||||
| Effect of dilutive securities: | ||||||||||||||||
| Warrants | - | 137 | ||||||||||||||
| Diluted EPS - Net income for computation | ¥ | 1,299,011 | 19,445 | ¥ | 66.8 | $ | 0.6 | |||||||||
| Year Ended March 31, 2014 | ||||||||||||||||
| Basic EPS - Net income available to common shareholders | ¥ | 1,034,336 | 19,295 | ¥ | 53.6 | |||||||||||
| Effect of dilutive securities: | ||||||||||||||||
| Warrants | - | 137 | ||||||||||||||
| Diluted EPS - Net income for computation | ¥ | 1,034,336 | 19,432 | ¥ | 53.2 | |||||||||||
| Year Ended March 31, 2013 | ||||||||||||||||
| Basic EPS - Net income available to common shareholders | ¥ | 552,732 | 19,557 | ¥ | 28.3 | |||||||||||
| Effect of dilutive securities: | ||||||||||||||||
| Warrants | - | 84 | ||||||||||||||
| Diluted EPS - Net income for computation | ¥ | 552,732 | 19,641 | ¥ | 28.1 | |||||||||||
- 23 -
| 15. | SEGMENT INFORMATION |
| a. | Description of Reportable Segments The disclosures of reportable segments are omitted since the Company falls within a single segment of the manufacturing and sale of pharmaceutical products. |
| b. | Information about Products and Services |
| Thousands of Yen | ||||||||||||||||
| 2015 | ||||||||||||||||
| Rescula® Ophthalmic Solution | AMITIZA® Capsule | Research and Development Support Services of Pharmaceuticals | Total | |||||||||||||
| Sales to external customers | ¥ | 1,291,879 | ¥ | 5,171,116 | ¥ | 96,434 | ¥ | 6,559,429 | ||||||||
| Thousands of Yen | ||||||||||||||||
| 2014 | ||||||||||||||||
| Rescula® Ophthalmic Solution | AMITIZA® Capsule | Research and Development Support Services of Pharmaceuticals | Total | |||||||||||||
| Sales to external customers | ¥ | 1,483,934 | ¥ | 3,955,601 | ¥ | 138,787 | ¥ | 5,578,322 | ||||||||
| Thousands of Yen | ||||||||||||||||
| 2013 | ||||||||||||||||
| Rescula® Ophthalmic Solution | AMITIZA® Capsule | Research and Development Support Services of Pharmaceuticals | Total | |||||||||||||
| Sales to external customers | ¥ | 1,811,865 | ¥ | 2,579,829 | ¥ | 148,317 | ¥ | 4,540,011 | ||||||||
| Thousands of U.S. Dollars | ||||||||||||||||
| 2015 | ||||||||||||||||
| Rescula® Ophthalmic Solution | AMITIZA® Capsule | Research and Development Support Services of Pharmaceuticals | Total | |||||||||||||
| Sales to external customers | $ | 10,766 | $ | 43,093 | $ | 803 | $ | 54,662 | ||||||||
| c. | Information about Geographical Areas |
i. Sales
| Thousands of Yen | ||||||||||||||||||
| 2015 | ||||||||||||||||||
| Japan | U.S.A. | Europe | Other | Total | ||||||||||||||
| ¥ | 2,840,669 | ¥ | 3,677,643 | ¥ | 38,789 | ¥ | 2,328 | ¥ | 6,559,429 | |||||||||
- 24 -
| Thousands of Yen | ||||||||||||||||||
| 2014 | ||||||||||||||||||
| Japan | U.S.A. | Europe | Other | Total | ||||||||||||||
| ¥ | 2,235,527 | ¥ | 3,307,041 | ¥ | 32,261 | ¥ | 3,493 | ¥ | 5,578,322 | |||||||||
| Thousands of Yen | ||||||||||||||||||
| 2013 | ||||||||||||||||||
| Japan | U.S.A. | Europe | Other | Total | ||||||||||||||
| ¥ | 1,607,648 | ¥ | 2,866,427 | ¥ | 61,112 | ¥ | 4,824 | ¥ | 4,540,011 | |||||||||
| Thousands of U.S. Dollars | ||||||||||||||||||
| 2015 | ||||||||||||||||||
| Japan | U.S.A. | Europe | Other | Total | ||||||||||||||
| $ | 23,672 | $ | 30,647 | $ | 323 | $ | 20 | $ | 54,662 | |||||||||
Note: Sales are classified by country or region based on the location of customers.
| ii. | Property, plant and equipment Since the amount of property, plant and equipment located in Japan exceeds 90% of the amount of property, plant and equipment on the balance sheet, descriptions regarding the property, plant and equipment are omitted. |
| d. | Information about Major Customers |
| Thousands of Yen | ||||||||||||||||
| Name of Customers | Sales | Related Products and Services | ||||||||||||||
| 2015 | 2014 | 2013 | ||||||||||||||
| Santen Pharmaceutical Co., Ltd. | ¥ | 1,289,551 | ¥ | 1,378,951 | ¥ | 1,342,356 | Rescula® ophthalmic solution | |||||||||
| Takeda Pharmaceutical Company Limited | 3,610,682 | 3,146,436 | 2,327,735 | AMITIZA® capsule | ||||||||||||
| Sucampo AG | 1,536,547 | 946,102 | 777,892 | Rescula® ophthalmic solution, AMITIZA® capsule, research and development support services of pharmaceuticals | ||||||||||||
| Thousands of U.S. Dollars | ||||||||
| Name of Customers | Sales | Related Products and Services | ||||||
| 2015 | ||||||||
| Santen Pharmaceutical Co., Ltd. | $ | 10,746 | Rescula® ophthalmic solution | |||||
| Takeda Pharmaceutical Company Limited | 30,089 | AMITIZA® capsule | ||||||
| Sucampo AG | 12,805 | Rescula® ophthalmic solution, AMITIZA® capsule, research and development support services of pharmaceuticals | ||||||
- 25 -
| 16. | SUBSEQUENT EVENTS |
On May 6, 2015, Sucampo AG and the Company executed a transfer and termination agreement to effectuate the return of all licenses for Unoprostone to the Company. These licenses had provided Sucampo AG with exclusive development and commercialization rights to Unoprostone globally except for Japan, the People's Republic of China, Taiwan and Korea. As a result of this transfer and termination agreement, the Company paid \309,437 thousand ($2,600 thousand) to Sucampo AG, which included \238,000 thousand ($2,000 thousand) for the transfer and assignment of certain rights and assets and \71,437 thousand ($600 thousand) for the reimbursement of an FDA fee.
On June 23, 2015, a stock option plan for remuneration of directors was approved by the Board of Directors of the Company. In addition, a stock option plan for selected employees was approved by the Board of Directors and at the shareholders' meeting on the same date. These stock option plans provide options to purchase a maximum of 36,000 shares of the Company's common stock. The exercise price of these stock options is \1 ($0.0). The exercise period is from July 8, 2015 to July 8, 2045 for directors and from June 24, 2015 to June 23, 2020 for employees.
| 17. | Significant Differences between Japanese GAAP and U.S. GAAP |
Japanese GAAP differs in certain respects from U.S. GAAP. The significant differences between Japanese GAAP and U.S. GAAP as they pertain to the Company are described below, which also includes reconciliations of net income and equity under Japanese GAAP to net income and equity under U.S. GAAP.
Net Income Reconciliation
| Note | Thousands of Yen | Thousands of U.S. Dollars | ||||||||||||||
| 2015 | 2014 | 2015 | ||||||||||||||
| Net income under Japanese GAAP | ¥ | 1,299,011 | ¥ | 1,034,336 | $ | 10,825 | ||||||||||
| U.S. GAAP adjustments: | ||||||||||||||||
| Depreciation of property, plant and equipment | (a) | (25,863 | ) | (15,783 | ) | (215 | ) | |||||||||
| R&D revenue | (b) | (23,753 | ) | 299 | (198 | ) | ||||||||||
| Advance payment for R&D | (c) | 40,971 | (45,536 | ) | 341 | |||||||||||
| Accrued vacation | (d) | 1,378 | (2,506 | ) | 11 | |||||||||||
| Expired stock options | (e) | (8,453 | ) | - | (70 | ) | ||||||||||
| Trademark | (f) | 22,300 | 22,300 | 186 | ||||||||||||
| Royalty revenue | (g) | 88,557 | 88,557 | 738 | ||||||||||||
| Subtotal | 95,137 | 47,331 | 793 | |||||||||||||
| Tax effect of adjustments | (53,639 | ) | (22,000 | ) | (447 | ) | ||||||||||
| Effect of tax rate change on unrealized gain on available-for-sale securities | (h) | 151,515 | - | 1,262 | ||||||||||||
| Valuation allowance on deferred tax assets | (i) | (23,651 | ) | 6,344 | (197 | ) | ||||||||||
| Net income under U.S. GAAP | ¥ | 1,468,373 | ¥ | 1,066,010 | $ | 12,236 | ||||||||||
- 26 -
| Yen | U.S. Dollars | |||||||||||
| 2015 | 2014 | 2015 | ||||||||||
| Earnings per share - Basic: | ||||||||||||
| Under Japanese GAAP | ¥ | 67.3 | ¥ | 53.6 | $ | 0.6 | ||||||
| U.S. GAAP adjustments | 8.8 | 1.6 | 0.1 | |||||||||
| Under U.S. GAAP | ¥ | 76.1 | ¥ | 55.2 | $ | 0.7 | ||||||
| Earnings per share - Diluted: | ||||||||||||
| Under Japanese GAAP | ¥ | 66.8 | ¥ | 53.2 | $ | 0.6 | ||||||
| U.S. GAAP adjustments | 8.7 | 1.7 | 0.1 | |||||||||
| Under U.S. GAAP | ¥ | 75.5 | ¥ | 54.9 | $ | 0.7 | ||||||
Statements of Comprehensive Income
Under Japanese GAAP, the Company is not required to disclose statements of comprehensive income. The statements of comprehensive income under U.S. GAAP are as follows:
| Thousands of Yen | Thousands of U.S. Dollars | |||||||||||
| 2015 | 2014 | 2015 | ||||||||||
| Net income | ¥ | 1,468,373 | ¥ | 1,066,010 | $ | 12,236 | ||||||
| Unrealized gain on available-for-sale securities | 1,815,125 | 193,348 | 15,126 | |||||||||
| Total other comprehensive income | 1,815,125 | 193,348 | 15,126 | |||||||||
| Comprehensive income | ¥ | 3,283,498 | ¥ | 1,259,358 | $ | 27,362 | ||||||
Equity Reconciliation
| Note | Thousands of Yen | Thousands of U.S. Dollars | ||||||||||||||
| 2015 | 2014 | 2015 | ||||||||||||||
| Equity under Japanese GAAP | ¥ | 11,966,936 | ¥ | 9,154,937 | $ | 99,724 | ||||||||||
| U.S. GAAP adjustments: | ||||||||||||||||
| Depreciation of property, plant and equipment | (a) | 39,724 | 65,151 | 331 | ||||||||||||
| Inventory | (a) | 4,027 | 4,463 | 34 | ||||||||||||
| R&D revenue | (b) | (5,730 | ) | 18,023 | (48 | ) | ||||||||||
| Advance payment for R&D | (c) | (98,138 | ) | (139,109 | ) | (818 | ) | |||||||||
| Accrued vacation | (d) | (46,953 | ) | (48,331 | ) | (391 | ) | |||||||||
| Expired stock options | (e) | - | - | - | ||||||||||||
| Trademark | (f) | 283 | (22,017 | ) | 2 | |||||||||||
| Royalty revenue | (g) | (453,893 | ) | (542,450 | ) | (3,782 | ) | |||||||||
| Subtotal | (560,680 | ) | (664,270 | ) | (4,672 | ) | ||||||||||
| Tax effect of adjustments | 179,315 | 236,500 | 1,494 | |||||||||||||
| Valuation allowance on deferred tax assets | (i) | - | 23,651 | - | ||||||||||||
| Equity under U.S. GAAP | ¥ | 11,585,571 | ¥ | 8,750,818 | $ | 96,546 | ||||||||||
- 27 -
Cash Flows Reconciliation
There are no significant differences between Japanese GAAP and U.S. GAAP for purposes of presenting or reconciling the statements of cash flows for the years ended March 31, 2015 and 2014.
Notes:
| (a) | Depreciation of property, plant and equipment |
Under Japanese GAAP, the Company depreciates property, plant and equipment over the estimated useful life of each asset under the declining-balance method, except for buildings, which are depreciated using the straight-line method, and lease assets, which are depreciated using the straight-line method based on the terms of the lease.
Based on FASB ASC 360, "Property, Plant and Equipment," the cost of a productive facility is one of the costs of the services it renders during its useful economic life. U.S. GAAP requires that this cost be recognized over the expected useful life of the facility in such a way as to allocate it as equitably as possible to the periods during which services are obtained from the use of the facility. Accordingly, the Company applied the straight-line method to all property, plant and equipment for U.S. GAAP purposes.
This difference results in an adjustment to accumulated depreciation, inventory and cost of sales.
The total U.S. GAAP adjustments for depreciation expense are allocated to cost of sales and sales, general and administrative expenses, as follows:
| Thousands of Yen | Thousands of U.S. Dollars | |||||||||||||||
| 2015 | 2014 | 2015 | ||||||||||||||
| Cost of sales | ¥ | (11,580 | ) | ¥ | (12,229 | ) | $ | (96 | ) | |||||||
| Sales, general and administrative expenses | (14,283 | ) | (3,554 | ) | (119 | ) | ||||||||||
| ¥ | (25,863 | ) | ¥ | (15,783 | ) | $ | (215 | ) | ||||||||
The following table presents a reconciliation of property, plant and equipment from Japanese GAAP to U.S. GAAP as of March 31, 2015 and 2014:
| Thousands of Yen | Thousands of U.S. Dollars | |||||||||||||||||||||||
| 2015 | 2014 | 2015 | ||||||||||||||||||||||
| Gross Carrying Amount | Accumulated Depreciation | Gross Carrying Amount | Accumulated Depreciation | Gross Carrying Amount | Accumulated Depreciation | |||||||||||||||||||
| Balance under Japanese GAAP | ¥ | 1,948,805 | ¥ | (1,600,484 | ) | ¥ | 1,937,400 | ¥ | (1,521,628 | ) | $ | 16,240 | $ | (13,337 | ) | |||||||||
| U.S. GAAP adjustment: | ||||||||||||||||||||||||
| Change in accumulated depreciation | - | 39,724 | - | 65,151 | - | 331 | ||||||||||||||||||
| Balance under U.S. GAAP | ¥ | 1,948,805 | ¥ | (1,560,760 | ) | ¥ | 1,937,400 | ¥ | (1,456,477 | ) | $ | 16,240 | $ | (13,006 | ) | |||||||||
| (b) | R&D (Research and Development) revenue |
Under U.S. GAAP, revenue from Contract Research Organization (CRO) services shall be recognized on a straight-line basis over the contract period. Under Japanese GAAP, the revenue from CRO service is recognized when the final report is submitted to a customer.
| (c) | Advance payment for R&D activities |
Under U.S. GAAP, advance payment for R&D activities shall be recognized as an expense as the related services are performed. Under Japanese GAAP, advance payment is recognized as an expense when the final report of R&D service is delivered.
- 28 -
| (d) | Accrued vacation |
Under U.S. GAAP, an employer shall accrue a liability for employees' compensation for future absences, such as vacations, if certain conditions are met. Such liabilities are accrued in the periods in which the benefits are earned. Under Japanese GAAP, there is no specific accounting standard for compensated absence, and as a result, liabilities and the corresponding expenses are generally not recognized in Japan.
The total U.S. GAAP adjustments for accrued vacation are allocated to cost of sales and sales, general and administrative expenses, as follows:
| Thousands of Yen | Thousands of U.S. Dollars | |||||||||||
| 2015 | 2014 | 2015 | ||||||||||
| Cost of sales | ¥ | (21 | ) | ¥ | (768 | ) | $ | (0 | ) | |||
| Sales, general and administrative expenses | 1,399 | (1,738 | ) | 11 | ||||||||
| ¥ | 1,378 | ¥ | (2,506 | ) | $ | 11 | ||||||
| (e) | Expired stock options |
Under U.S. GAAP, previously recognized compensation cost shall not be reversed if an employee share option, for which the requisite service has been rendered, expires unexercised. Under Japanese GAAP, the Company reverses the amount of previously recognized compensation cost for the expired stock options.
| (f) | Trademark |
The Company acquired the trademark for Rescula from Sucampo AG on June 1, 2005. Under Japanese GAAP, the Company recorded the trademark on the balance sheet at the transaction price, which the Company amortized over 10 years. As of June 1, 2005, the Company and Sucampo AG were under common control. U.S. GAAP requires the Company to record such transaction under common control at the carrying amount for Rescula in the accounts of Sucampo AG at the time the Company purchased the trademark.
| (g) | Royalty revenue |
Under Japanese GAAP, the Company recognized royalty revenue for licensing agreements at the time of receipt of the non-refundable payments including upfront and milestone payments both from Sucampo Pharma Americas, Inc. and Sucampo AG. Under U.S. GAAP, the non-refundable upfront and milestone payments shall be recognized, on a straight-line basis, over the contract period and the remaining contract period after the respective milestones are achieved, respectively.
| (h) | Effect of tax rate change on unrealized gain on available-for-sale securities |
Under U.S. GAAP, when the effective income tax rate changes, the impact of the tax rate change on unrealized gain (loss) on available-for-securities is recognized in income as income taxes expense, whereas under Japanese GAAP, such impact is recognized within equity.
| (i) | Valuation allowance on deferred tax assets |
Under Japanese GAAP, there is prescriptive guidance for considering the realizability of deferred tax assets. Particularly, if an entity's taxable income does not sufficiently exceed the total of deductible temporary differences for each of the most recent years, no deferred tax assets can be recognized for deductible temporary differences whose timing of reversal cannot be reasonably expected.
- 29 -
In accordance with this accounting guidance, the Company recognized a valuation allowance for deferred tax assets relating to certain temporary differences before the year ended March 31, 2015, considering its taxable income level, although the Company had been profitable for many years. However, the valuation allowance was reversed for the year ended March 31, 2015, since the Company's taxable income sufficiently exceeded the total of deductible temporary differences.
Under U.S. GAAP, realizability of deferred tax assets is judgmentally determined based on weighing positive and negative consideration factors in accordance with ASC 740, "Income Tax." As a result of the consideration of such positive and negative factors, the Company does not recognize a valuation allowance on deferred tax assets under U.S. GAAP as of March 31, 2015 and 2014.
* * * * * *
- 30 -
Exhibit 99.2
UNAUDITED PRO FORMA COMBINED CONSOLIDATED FINANCIAL INFORMATION
The following unaudited pro forma combined consolidated financial information is presented to illustrate the estimated effects of the proposed acquisition of R-Tech Ueno, Ltd. (“R-Tech”) by Sucampo Pharmaceuticals, Inc. (“Sucampo”) and certain other adjustments listed below, which are collectively referred to as the acquisition adjustments, through the share purchase agreement that was announced on August 26, 2015 under which Sucampo exchanged each issued and outstanding R-Tech share for ¥1,400 in cash.
The unaudited pro forma combined consolidated balance sheet as of September 30, 2015 and the unaudited pro forma combined consolidated statements of operations for the nine months ended September 30, 2015 and the year ended December 31, 2014, respectively, are presented herein. The unaudited pro forma combined consolidated balance sheet combines the unaudited balance sheets of Sucampo and R-Tech as of September 30, 2015 and gives effect to the proposed business combination as if it occurred on September 30, 2015. R-Tech’s assets and liabilities have been measured at fair value as of October 20, 2015, which represents the date R-Tech was acquired by Sucampo. The purchase price has been allocated as of this date since this information was incorporated in our fiscal year 2015 Annual Report filed on Form 10-K and more accurately reflects the fair value of R-Tech’s assets acquired and liabilities assumed.
The unaudited pro forma combined consolidated statements of operations combine the historical results of Sucampo and R-Tech for the nine months ended September 30, 2015 and the year ended December 31, 2014 and give effect to the proposed business combination as if it occurred on January 1, 2014. The historical financial information has been adjusted to give effect to pro forma adjustments that are (i) directly attributable to the proposed business combination, (ii) factually supportable, and (iii) with respect to the unaudited combined consolidated statements of operations, expected to have a continuing impact on the combined entity’s results.
The unaudited pro forma combined consolidated financial information primarily gives effect to the following adjustments:
· Adjustments to reconcile R-Tech’s historical audited and unaudited financial statements prepared in accordance with Japanese GAAP to U.S. GAAP and to convert these statements from Japanese yen to U.S. dollars;
· Application of the acquisition method of accounting in connection with the business combination to reflect total purchase consideration of $275.1 million;
· Adjustments to reflect financing arrangements entered into in connection with the business combination;
· Reclassification of line items on R-Tech’s financial statements to conform to Sucampo’s presentation;
· Elimination of intercompany transactions between Sucampo and R-Tech; and
· Transaction costs in connection with the business combination.
The unaudited pro forma combined consolidated statements of operations also include certain other purchase accounting adjustments, including items expected to have a continuing impact on the combined results, such as increased amortization expense on acquired intangible assets. The unaudited pro forma combined consolidated statements of operations do not include the impact of any revenue, cost or other operating synergies that may result from the business combination or any related restructuring costs.
The unaudited pro forma combined consolidated financial information presented is based on the assumptions and adjustments described in the accompanying notes. The unaudited pro forma combined consolidated financial information is presented for illustrative purposes and does not purport to represent what the financial position or results of operations would actually have been if the business combination occurred as of the dates indicated or what the financial position or results would be for any future periods.
The unaudited pro forma combined consolidated financial information is derived from the historical financial statements of Sucampo and R-Tech, and should be read in conjunction with (1) the accompanying notes to the unaudited pro forma combined consolidated financial information, (2) the unaudited financial statements as of September 30, 2015 and for the nine months ended September 30, 2015 and notes thereto of Sucampo included in Sucampo’s Quarterly Report on Form 10-Q for the three and nine months ended September 30, 2015, which was filed with the SEC on November 4, 2015 and incorporated by reference, (3) the audited financial statements for the fiscal year ended December 31, 2014 and notes thereto of Sucampo included in Sucampo’s Annual Report on Form 10-K, which was filed with the SEC on March 9, 2015 and incorporated by reference, (4) the unaudited financial statements as of September 30, 2015 and for the six months ended September 30, 2015 and notes thereto of R-Tech, which are included in the Form 8-K/A, (5) the audited financial statements for the fiscal years ended March 31, 2014 and 2015 and notes thereto of R-Tech, which are included in the Form 8-K/A.
| 2 |

See accompanying Notes to unaudited pro forma combined consolidated financial information.
| 3 |

See accompanying Notes to unaudited pro forma combined consolidated financial information.
| 4 |

See accompanying Notes to unaudited pro forma combined consolidated financial information.
| 5 |
![]()
Note 1 – Description of the Business Combination
On August 26, 2015, Sucampo and R-Tech entered into the tender offer, whereby Sucampo offered to exchange each issued and outstanding R-Tech ordinary share intended to result in a business combination of R-Tech by Sucampo. On October 20, 2015, Sucampo completed its acquisition of 11,069,000 shares and 328,600 stock acquisition rights of R-Tech pursuant to a previously announced tender offer in Japan (the “Tender Offer”), according to which Sucampo’s wholly owned Japanese subsidiary, Sucampo Pharma LLC (the “Purchaser”), offered to purchase all of the outstanding shares of R-Tech’s common stock (other than the shares acquired pursuant to the Purchase Agreement). In addition, on October 20, 2015, the Registrant acquired 8,571,900 shares of R-Tech in accordance with the terms of the Share Purchase Agreement (“Purchase Agreement”) by and between Sucampo and the founders of R-Tech, who are also the founders of Sucampo, and a related entity. Following these acquisitions, Sucampo directly and indirectly owns approximately 98% of the outstanding shares of R-Tech and acquired the remaining shares of R-Tech through a squeeze-out process under Japanese law.
Subject to the terms and conditions of the business combination agreement, R-Tech shareholders who validly tender their shares in the tender offer will be entitled to receive consideration that is the equivalent of ¥1,400, or $11.73 in cash, for each issued and outstanding share of R-Tech common stock.
The overall tender offer is variable and subject to the U.S. dollar to yen exchange rate on the date of the acquisition.
Note 2 — Basis of Presentation
The accompanying unaudited pro forma combined consolidated financial information was prepared in accordance with Article 11 of SEC Regulation S-X. The unaudited pro forma combined consolidated balance sheet was prepared using the historical balance sheets of Sucampo and R-Tech as of September 30, 2015 and assumes the proposed business combination occurred on September 30, 2015. R-Tech’s assets and liabilities have been measured at fair value as of October 20, 2015, which represents the date R-Tech was acquired by Sucampo. R-Tech’s fiscal year ends on March 31 and Sucampo’s fiscal year ends on December 31. The pro forma combined consolidated financial information has been prepared to conform R-Tech’s historical financial information to a year-end of December 31. The unaudited pro forma combined consolidated statements of operations were prepared using:
· the historical unaudited statement of operations of Sucampo for the nine months ended September 30, 2015;
· the historical audited statement of operations of Sucampo for the year ended December 31, 2014;
· the historical unaudited statement of income (loss) of R-Tech for the six months ended September 30, 2015;
· the historical unaudited statement of income (loss) of R-Tech for the three months ended March 31, 2015;
· the historical unaudited statement of income (loss) of R-Tech for the three months ended March 31, 2014; and
· the historical audited statement of income (loss) of R-Tech for the year ended March 31, 2015.
Sucampo’s historical audited and unaudited financial statements were prepared in accordance with U.S. GAAP and presented in thousands of U.S. dollars. R-Tech’s historical audited and unaudited financial statements were prepared in accordance with Japanese GAAP and presented in thousands of yen. The historical R-Tech financial statements included within the unaudited pro forma combined consolidated balance sheet and statements of operations have been adjusted to conform to Sucampo’s year end, and certain reclassifications were made to align R-Tech’s financial statement presentation with that of Sucampo. R-Tech’s historical audited and unaudited financial statements were reconciled to U.S. GAAP, and the Japanese GAAP to U.S. GAAP conversion adjustments have been applied to the historical R-Tech column as presented and discussed in the accompanying notes. A description of the adjustments to convert R-Tech from Japanese GAAP to U.S. GAAP is included in the reconciliation footnote in R-Tech’s historical financial information included in this Form 8-K/A.
R-Tech’s historical audited and unaudited financial statements, Japanese GAAP to U.S. GAAP adjustments and pro forma adjustments were translated from yen to U.S. dollars using the period-end rate of $0.0083 per yen for the unaudited pro forma combined consolidated balance sheet as of September 30, 2015 and the historical average rates during the nine months ended September 30, 2015 and the year ended December 31, 2014 of $0.0083 and $0.0095 per yen, respectively, for the unaudited pro forma combined consolidated statements of operations. The income statements and balance sheet of R-Tech have been adjusted to conform to the Sucampo periods presented, reclassified to align to Sucampo’s presentation, converted to U.S. GAAP and converted to U.S. dollars as follows:
| 6 |
Conforming schedules of historical statement of income (loss) of R-Tech for the year ended December 31, 2014:

| 7 |
Conforming schedules of historical statement of income (loss) of R-Tech for the nine months ended September 30, 2015:

| 8 |
Conforming schedules of historical balance sheet of R-Tech as of September 30, 2015:
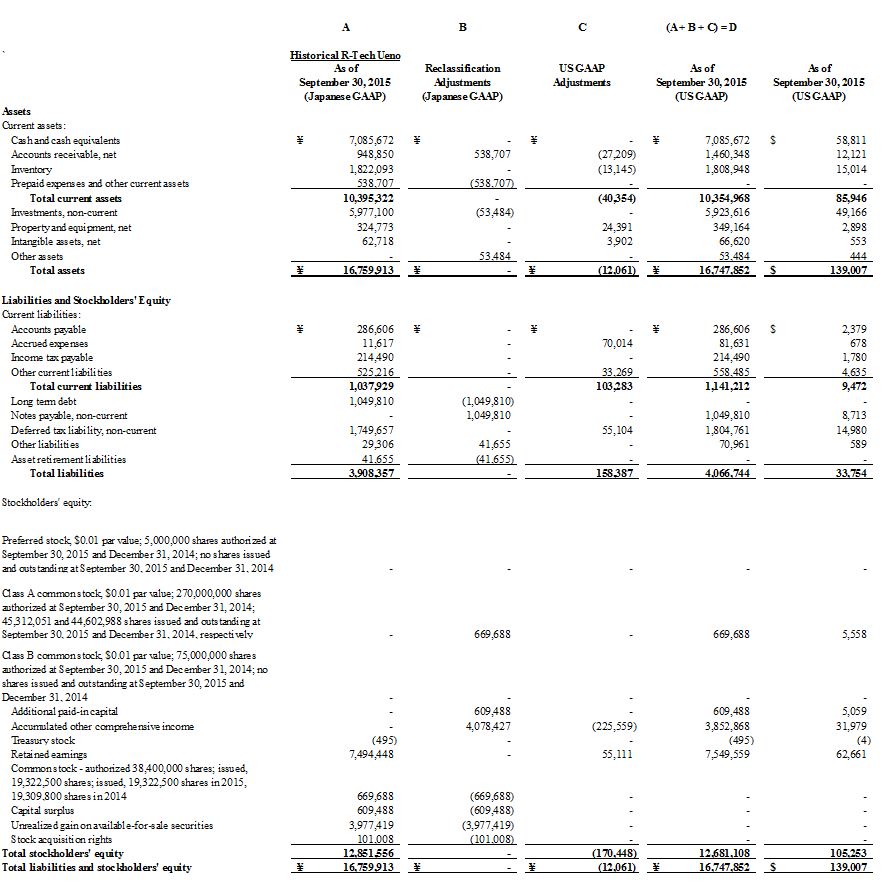
| 9 |
The proposed business combination of Sucampo and R-Tech will be accounted for using the acquisition method of accounting under the provisions of ASC 805, with Sucampo representing the accounting acquirer. Accordingly, the historical financial statements have been adjusted to give effect to the impact of the exchange offer consideration paid in connection with the business combination. In the unaudited pro forma combined consolidated balance sheet, Sucampo’s cost to acquire R-Tech has been allocated to the assets acquired and liabilities assumed based upon management’s preliminary estimate of what their respective fair values would be as of the date of the business combination. The pro forma adjustments are preliminary and are based upon available information and certain assumptions which management believes are reasonable under the circumstances and which are described in the accompanying notes herein. Actual results may differ materially from the assumptions within the accompanying unaudited pro forma combined consolidated financial information. Under ASC 805, generally all assets acquired and liabilities assumed are recorded at their acquisition date fair value. For purposes of the pro forma information presented herein, the fair value of R-Tech’s identifiable tangible and intangible assets acquired and liabilities assumed are based on a preliminary estimate of fair value. Any excess of the purchase price over the fair value of identified tangible and intangible assets acquired and liabilities assumed will be recognized as goodwill. Management believes the estimated fair values utilized for the assets to be acquired and liabilities to be assumed are based on reasonable estimates and assumptions. Preliminary fair value estimates may change as additional information becomes available and such changes could be material, as certain valuations and other studies have yet to commence or progress to a stage where there is sufficient information for definitive measurement.
The unaudited pro forma combined consolidated statements of operations also include certain purchase accounting adjustments, including items expected to have a continuing impact on the combined results, such as increased amortization expense on acquired intangible assets. The unaudited pro forma combined consolidated statements of operations do not include the impacts of any revenue, cost or other operating synergies that may result from the business combination or any related restructuring costs that may be contemplated. Sucampo and R-Tech have just recently begun collecting information in order to formulate detailed integration plans to deliver planned synergies. However, at this time, the status of the integration plans is too uncertain to include in the pro forma financial statements.
Financing Arrangement
On October 16, 2015, Sucampo entered into a credit facility that provides for term loans in the aggregate principal amount of $250.0 million (the “Term Loans”) and allows for the incurrence of incremental loans in an amount up to $25.0 million. The Term Loans bear interest, at Sucampo’s option, at either the Adjusted Eurodollar Rate (as defined in the credit facility) plus 7.25% or the Adjusted Base Rate (as defined in the credit facility) plus 6.25%. The Adjusted Eurodollar Rate is subject to a 1.00% floor and the Adjusted Base Rate is subject to a 2.00% floor. The proceeds of the Term Loans were used a) to finance a portion of the cash consideration of the purchase price to be paid in exchange for R-Tech ordinary shares pursuant to the tender offer, and b) to refinance R-Tech’s outstanding indebtedness at the time of closing. Upon closing of the exchange offer, outstanding borrowings under the Term Loan were approximately $250.0 million.
Note 3 – Intercompany Eliminations
Intercompany elimination adjustments represent the elimination of existing balances included within the balance sheets and statements of operations of Sucampo and R-Tech, which at the close of the acquisition would be considered intercompany transactions:
· R-Tech Product Sales revenue recorded as cost of goods sold by Sucampo.
· R-Tech R&D revenue recorded as R&D expenses by Sucampo.
· Sucampo contract and collaboration revenue recorded as Selling and marketing expenses by R-Tech.
· Sucampo deferred revenue resulting from the deferral of upfront payments relating to the exclusive supply agreements with R-Tech.
· Accounts payable between Sucampo and R-Tech.
Note 4 — Purchase Price
The total purchase consideration to acquire the shares and options of R-Tech was approximately $275.1 million. Under the terms of the tender offer, R-Tech shareholders were entitled to receive the tender offer consideration in cash at the equivalent of ¥1,400 or $11.73 for each issued and outstanding R-Tech ordinary share. Following these acquisitions, Sucampo directly and indirectly owned approximately 98% of the outstanding shares R-Tech. The Company acquired the remaining shares of R-Tech through a squeeze-out process under Japanese law on November 30, 2015. The estimated purchase price reflected in the unaudited pro forma combined consolidated financial information assumes that all issued and outstanding R-Tech ordinary shares were validly tendered in the offer and via the squeeze-out process and received the offer consideration.
| 10 |
For the purpose of preparing the accompanying unaudited pro forma combined consolidated balance sheet as of September 30, 2015, the preliminary estimate of the purchase price was calculated as follows (amounts in thousands, except share data):

The following is a summary of the preliminary allocation of the above purchase price as reflected in the unaudited pro forma combined consolidated balance sheet as of September 30, 2015 (amounts in thousands):
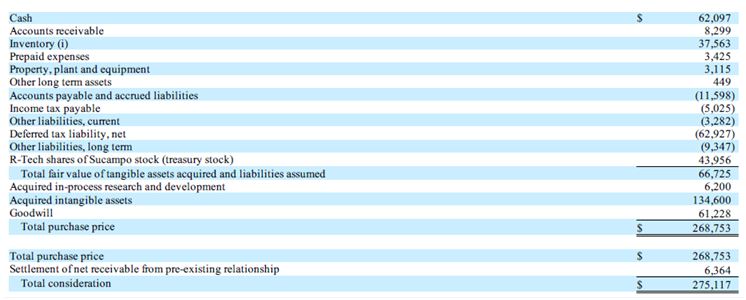
The goodwill balance is primarily attributed to the assembled workforce, expanded market opportunities and cost and other operating synergies anticipated upon the integration of the operations of Sucampo and R-Tech.
Note 5 – Unaudited Pro Forma Combined Consolidated Balance Sheet Adjustments
Purchase Accounting Adjustments:
(a) Reflects $268.8 million, which represents the cash portion of the purchase price paid to R-Tech common shareholders as calculated in Note [4].
(b) Reflects the change in book value for R-Tech’s asset and liability balances to reflect estimated fair value as of the acquisition date, October 20, 2015.
(c) Reflects an adjustment of $250.0 million to record the issuance of debt to finance the acquisition.
| 11 |
(d) Reflects transaction costs attributable to the transaction.
(e) Reflects debt issuance costs related to the new debt.
(f) Reflects the current and long term portions of the new debt.
(g) Reflects adjustments to eliminate R-Tech’s historical shareholders’ equity, which represents the historical book value of R-Tech’s net assets, as a result of the application of purchase accounting.
Note 6 – Unaudited Pro Forma Combined Consolidated Statements of Operations Adjustments
Purchase Accounting Adjustments:
(a) Reflects adjustments for the year ended December 31, 2014 and the nine months ended September 30, 2015 for amortization expense related to the fair value of identified intangible assets with definite lives.
(b) Reflects the removal of transaction costs related to the acquisition for the nine months ended September 30, 2015.
(c) Reflects the adjustments to interest expense and amortization of debt issuance costs resulting from the Term Loans.
(d) Reflects adjustments to income tax expense for the year ended December 31, 2014 and nine months ended September 30, 2015, for the tax effect of the transaction adjustments. Because the tax rate used for these pro forma financial statements is the statutory rate and an estimate, it will likely vary from the effective rate in periods subsequent to the completion of the business combination, and those differences may be material.
12
Serious News for Serious Traders! Try StreetInsider.com Premium Free!
You May Also Be Interested In
- AGM Trading Update - April 2024
- VAALCO Schedules First Quarter 2024 Earnings Release and Conference Call
- Inside information: Meriaura Group's board has conditionally decided to sell Meriaura's minority ownership to Meriaura Invest to rearrange the group's financing
Create E-mail Alert Related Categories
SEC FilingsSign up for StreetInsider Free!
Receive full access to all new and archived articles, unlimited portfolio tracking, e-mail alerts, custom newswires and RSS feeds - and more!
