

Form N-CSR FIDELITY COMMONWEALTH For: Apr 30
 Tweet
Tweet Share
ShareUNITED STATES
SECURITIES AND EXCHANGE COMMISSION
Washington, D.C. 20549
FORM N-CSR
CERTIFIED SHAREHOLDER REPORT OF REGISTERED
MANAGEMENT INVESTMENT COMPANIES
Investment Company Act file number 811-2546
Fidelity Commonwealth Trust
(Exact name of registrant as specified in charter)
245 Summer St., Boston, Massachusetts 02210
(Address of principal executive offices) (Zip code)
Marc Bryant, Secretary
245 Summer St.
Boston, Massachusetts 02210
(Name and address of agent for service)
Registrant's telephone number, including area code:
617-563-7000
Date of fiscal year end: | April 30 |
Date of reporting period: | April 30, 2016 |
Item 1.
Reports to Stockholders
|
Fidelity® Small Cap Stock Fund Annual Report April 30, 2016 |
 |
Contents
To view a fund's proxy voting guidelines and proxy voting record for the 12-month period ended June 30, visit http://www.fidelity.com/proxyvotingresults or visit the Securities and Exchange Commission's (SEC) web site at http://www.sec.gov.
You may also call 1-800-544-8544 to request a free copy of the proxy voting guidelines.
Standard & Poor's, S&P and S&P 500 are registered service marks of The McGraw-Hill Companies, Inc. and have been licensed for use by Fidelity Distributors Corporation.
Other third-party marks appearing herein are the property of their respective owners.
All other marks appearing herein are registered or unregistered trademarks or service marks of FMR LLC or an affiliated company. © 2016 FMR LLC. All rights reserved.
This report and the financial statements contained herein are submitted for the general information of the shareholders of the Fund. This report is not authorized for distribution to prospective investors in the Fund unless preceded or accompanied by an effective prospectus.
A fund files its complete schedule of portfolio holdings with the SEC for the first and third quarters of each fiscal year on Form N-Q. Forms N-Q are available on the SEC’s web site at http://www.sec.gov. A fund's Forms N-Q may be reviewed and copied at the SEC’s Public Reference Room in Washington, DC. Information regarding the operation of the SEC's Public Reference Room may be obtained by calling 1-800-SEC-0330.
For a complete list of a fund's portfolio holdings, view the most recent holdings listing, semiannual report, or annual report on Fidelity's web site at http://www.fidelity.com, http://www.advisor.fidelity.com, or http://www.401k.com, as applicable.
NOT FDIC INSURED •MAY LOSE VALUE •NO BANK GUARANTEE
Neither the Fund nor Fidelity Distributors Corporation is a bank.
Performance: The Bottom Line
Average annual total return reflects the change in the value of an investment, assuming reinvestment of distributions from dividend income and capital gains (the profits earned upon the sale of securities that have grown in value, if any) and assuming a constant rate of performance each year. The hypothetical investment and the average annual total returns do not reflect the deduction of taxes that a shareholder would pay on fund distributions or the redemption of fund shares. During periods of reimbursement by Fidelity, a fund’s total return will be greater than it would be had the reimbursement not occurred. How a fund did yesterday is no guarantee of how it will do tomorrow.
Average Annual Total Returns
| For the periods ended April 30, 2016 | Past 1 year | Past 5 years | Past 10 years |
| Fidelity® Small Cap Stock Fund | (2.79)% | 4.31% | 5.10% |
$10,000 Over 10 Years
Let's say hypothetically that $10,000 was invested in Fidelity® Small Cap Stock Fund on April 30, 2006.
The chart shows how the value of your investment would have changed, and also shows how the Russell 2000® Index performed over the same period.

| Period Ending Values | ||
|
| $16,448 | Fidelity® Small Cap Stock Fund |
|
| $16,958 | Russell 2000® Index |
Management's Discussion of Fund Performance
Market Recap: The S&P 500® index gained 1.21% for the 12 months ending April 30, 2016. Largely range-bound until mid-August, U.S. stocks suffered a steep, late-summer decline on concern about an economic slowdown in China. The market recovered in October, lifted by the U.S. Federal Reserve’s decision to delay raising near-term interest rates until mid-December, as well as a rate cut in China and economic stimulus in Europe. But continued oil-price weakness and U.S.-dollar strength pushed the S&P 500® to its worst January since 2009, followed by a volatile but ultimately flattish February, then a sharp rebound in March driven by U.S. jobs gains and perceived softening in the Fed’s rate-tightening posture. April brought minimal change. For the full period, growth-oriented and larger-cap stocks fared better overall than value and smaller-cap complements. Performance was split, as five of 10 S&P 500® sectors gained ground, with a wide gap separating leaders from laggards. Investor demand for more-stable and higher-yielding investments boosted traditionally defensive, dividend-rich groups such as utilities (+14%), telecommunication services (+10%) and consumer staples (+11%) – the latter also buoyed by rising wages and low inflation. Meanwhile, energy (-14%) foundered amid commodity weakness that also hurt materials (-4%). Comments from Portfolio Manager Lionel Harris: For the year, the fund returned -2.79%, substantially outperforming the -5.94% result of the benchmark Russell 2000® Index. Although I’m disappointed anytime the fund posts a negative result, I’m pleased the fund was able to hold up relatively well in difficult market conditions. Stock picking drove our outperformance of the benchmark, especially in the information technology sector, led by positions in technology products distributor Ingram Micro, IT management software company SolarWinds and online vacation rental agency HomeAway. All agreed to acquisitions at premium prices this period. At period end, none of these out-of-benchmark stocks was in the fund. Good results in health care and energy also added value, although positioning in utilities and materials hampered our relative result. On an individual basis, the fund especially benefited from its stake in Coca-Cola Bottling, an independent bottler of Coca-Cola products. The stock had a strong run in the first half of the period. On the negative side, OneMain Holdings meaningfully detracted, due partly to investors’ concerns about the company’s debt load. This, too, gave me pause, and I decided to exit the position. The fund also was hampered by poor performance from investments in retailers Dillard’s – an out-of-benchmark holding – and Zumiez.The views expressed above reflect those of the portfolio manager(s) only through the end of the period as stated on the cover of this report and do not necessarily represent the views of Fidelity or any other person in the Fidelity organization. Any such views are subject to change at any time based upon market or other conditions and Fidelity disclaims any responsibility to update such views. These views may not be relied on as investment advice and, because investment decisions for a Fidelity fund are based on numerous factors, may not be relied on as an indication of trading intent on behalf of any Fidelity fund.
Investment Summary (Unaudited)
Top Ten Stocks as of April 30, 2016
| % of fund's net assets | % of fund's net assets 6 months ago | |
| Landstar System, Inc. | 1.9 | 1.3 |
| Genpact Ltd. | 1.9 | 1.6 |
| World Fuel Services Corp. | 1.9 | 1.8 |
| HD Supply Holdings, Inc. | 1.8 | 1.0 |
| Investors Bancorp, Inc. | 1.8 | 1.6 |
| Silgan Holdings, Inc. | 1.7 | 1.8 |
| LivaNova PLC | 1.7 | 1.8 |
| Community Bank System, Inc. | 1.6 | 0.0 |
| ServiceMaster Global Holdings, Inc. | 1.5 | 0.8 |
| Coresite Realty Corp. | 1.4 | 1.2 |
| 17.2 |
Top Five Market Sectors as of April 30, 2016
| % of fund's net assets | % of fund's net assets 6 months ago | |
| Financials | 25.7 | 23.9 |
| Information Technology | 17.8 | 22.5 |
| Consumer Discretionary | 14.1 | 12.9 |
| Industrials | 13.7 | 12.2 |
| Health Care | 13.6 | 14.6 |
Asset Allocation (% of fund's net assets)
| As of April 30, 2016* | ||
| Stocks | 97.3% | |
| Short-Term Investments and Net Other Assets (Liabilities) | 2.7% | |

* Foreign investments - 19.1%
| As of October 31, 2015* | ||
| Stocks | 97.8% | |
| Short-Term Investments and Net Other Assets (Liabilities) | 2.2% | |

* Foreign investments - 17.9%
Percentages shown as 0.0% may reflect amounts less than 0.05%.
Investments April 30, 2016
Showing Percentage of Net Assets
| Common Stocks - 97.3% | |||
| Shares | Value (000s) | ||
| CONSUMER DISCRETIONARY - 14.1% | |||
| Diversified Consumer Services - 1.5% | |||
| ServiceMaster Global Holdings, Inc. (a) | 746,057 | $28,589 | |
| Hotels, Restaurants & Leisure - 3.0% | |||
| Buffalo Wild Wings, Inc. (a) | 90,000 | 12,029 | |
| Extended Stay America, Inc. unit | 554,000 | 8,670 | |
| Popeyes Louisiana Kitchen, Inc. (a) | 133,200 | 7,161 | |
| Ruth's Hospitality Group, Inc. | 450,478 | 7,154 | |
| Sonic Corp. | 698,000 | 23,990 | |
| 59,004 | |||
| Household Durables - 1.6% | |||
| KB Home (b) | 1,508,000 | 20,464 | |
| New Home Co. LLC (a) | 927,500 | 10,323 | |
| 30,787 | |||
| Internet & Catalog Retail - 0.8% | |||
| HSN, Inc. | 284,000 | 15,061 | |
| Leisure Products - 1.8% | |||
| Amer Group PLC (A Shares) | 293,062 | 8,664 | |
| Vista Outdoor, Inc. (a) | 544,047 | 26,103 | |
| 34,767 | |||
| Media - 1.8% | |||
| AMC Networks, Inc. Class A (a) | 230,000 | 15,003 | |
| MDC Partners, Inc. Class A | 505,000 | 10,221 | |
| Starz Series A (a) | 405,585 | 11,036 | |
| 36,260 | |||
| Multiline Retail - 0.3% | |||
| Dillard's, Inc. Class A | 77,200 | 5,439 | |
| Specialty Retail - 2.7% | |||
| GNC Holdings, Inc. | 642,600 | 15,654 | |
| Murphy U.S.A., Inc. (a) | 350,810 | 20,144 | |
| Select Comfort Corp. (a) | 415,000 | 10,242 | |
| Zumiez, Inc. (a)(b) | 414,858 | 6,961 | |
| 53,001 | |||
| Textiles, Apparel & Luxury Goods - 0.6% | |||
| G-III Apparel Group Ltd. (a) | 122,349 | 5,536 | |
| Steven Madden Ltd. (a) | 210,132 | 7,357 | |
| 12,893 | |||
| TOTAL CONSUMER DISCRETIONARY | 275,801 | ||
| CONSUMER STAPLES - 3.1% | |||
| Beverages - 1.7% | |||
| Boston Beer Co., Inc. Class A (a)(b) | 42,500 | 6,633 | |
| Coca-Cola Bottling Co. Consolidated (b) | 164,542 | 26,223 | |
| 32,856 | |||
| Food & Staples Retailing - 0.6% | |||
| United Natural Foods, Inc. (a) | 352,000 | 12,556 | |
| Food Products - 0.8% | |||
| TreeHouse Foods, Inc. (a) | 183,400 | 16,213 | |
| TOTAL CONSUMER STAPLES | 61,625 | ||
| ENERGY - 3.5% | |||
| Energy Equipment & Services - 0.6% | |||
| Dril-Quip, Inc. (a) | 171,800 | 11,136 | |
| Oil, Gas & Consumable Fuels - 2.9% | |||
| Ardmore Shipping Corp. (c) | 1,581,596 | 14,788 | |
| Newfield Exploration Co. (a) | 177,000 | 6,416 | |
| World Fuel Services Corp. | 776,900 | 36,305 | |
| 57,509 | |||
| TOTAL ENERGY | 68,645 | ||
| FINANCIALS - 25.7% | |||
| Banks - 10.8% | |||
| Camden National Corp. | 444,145 | 19,325 | |
| Community Bank System, Inc. | 787,545 | 31,163 | |
| East West Bancorp, Inc. | 327,803 | 12,289 | |
| FirstMerit Corp. | 1,240,000 | 27,478 | |
| Investors Bancorp, Inc. | 2,980,000 | 34,419 | |
| Popular, Inc. | 356,000 | 10,580 | |
| Prosperity Bancshares, Inc. | 473,878 | 25,007 | |
| Spar Nord Bank A/S | 719,924 | 5,870 | |
| UMB Financial Corp. | 389,409 | 21,710 | |
| United Community Bank, Inc. | 1,159,200 | 23,335 | |
| 211,176 | |||
| Capital Markets - 3.0% | |||
| Monex Group, Inc. | 4,353,000 | 11,230 | |
| OM Asset Management Ltd. | 1,633,505 | 21,922 | |
| Vontobel Holdings AG (b) | 570,099 | 24,663 | |
| 57,815 | |||
| Diversified Financial Services - 0.8% | |||
| MSCI, Inc. Class A | 203,000 | 15,416 | |
| Insurance - 5.1% | |||
| Allied World Assurance Co. Holdings AG | 743,000 | 26,436 | |
| AmTrust Financial Services, Inc. | 462,000 | 11,481 | |
| Employers Holdings, Inc. | 790,500 | 23,478 | |
| Primerica, Inc. | 269,408 | 13,352 | |
| ProAssurance Corp. | 253,573 | 12,103 | |
| Validus Holdings Ltd. | 265,400 | 12,232 | |
| 99,082 | |||
| Real Estate Investment Trusts - 4.1% | |||
| Coresite Realty Corp. | 371,037 | 27,802 | |
| Piedmont Office Realty Trust, Inc. Class A | 663,200 | 13,204 | |
| The GEO Group, Inc. | 576,300 | 18,459 | |
| WP Carey, Inc. | 352,000 | 21,504 | |
| 80,969 | |||
| Real Estate Management & Development - 1.1% | |||
| Leopalace21 Corp. (a) | 3,638,300 | 21,832 | |
| Thrifts & Mortgage Finance - 0.8% | |||
| TFS Financial Corp. | 932,518 | 16,692 | |
| TOTAL FINANCIALS | 502,982 | ||
| HEALTH CARE - 13.6% | |||
| Biotechnology - 2.7% | |||
| Acorda Therapeutics, Inc. (a) | 20,000 | 517 | |
| ArQule, Inc. (a) | 794,505 | 1,295 | |
| Avalanche Biotechnologies, Inc. (a) | 189,631 | 1,070 | |
| Aviragen Therapeutics, Inc. (a) | 611,600 | 966 | |
| BioCryst Pharmaceuticals, Inc. (a)(b) | 198,945 | 649 | |
| Celldex Therapeutics, Inc. (a) | 350,000 | 1,400 | |
| Dyax Corp. rights 12/31/19 (a) | 632,800 | 1,493 | |
| Eagle Pharmaceuticals, Inc. (a) | 77,000 | 2,915 | |
| Emergent BioSolutions, Inc. (a) | 55,000 | 2,119 | |
| Infinity Pharmaceuticals, Inc. (a) | 300,000 | 1,740 | |
| Kindred Biosciences, Inc. (a) | 253,052 | 934 | |
| MEI Pharma, Inc. (a)(b) | 250,000 | 350 | |
| Novavax, Inc. (a) | 960,306 | 5,032 | |
| Osiris Therapeutics, Inc. | 70,041 | 393 | |
| Otonomy, Inc. (a) | 292,000 | 4,164 | |
| PDL BioPharma, Inc. | 710,000 | 2,677 | |
| Rigel Pharmaceuticals, Inc. (a) | 298,706 | 845 | |
| Spark Therapeutics, Inc. (a) | 90,817 | 3,259 | |
| United Therapeutics Corp. (a) | 183,930 | 19,349 | |
| Vanda Pharmaceuticals, Inc. (a) | 7,729 | 69 | |
| Verastem, Inc. (a)(b) | 289,470 | 478 | |
| Vical, Inc. (a) | 3,630,092 | 1,448 | |
| 53,162 | |||
| Health Care Equipment & Supplies - 2.3% | |||
| Hill-Rom Holdings, Inc. | 60,000 | 2,901 | |
| LivaNova PLC (a) | 617,900 | 32,582 | |
| Steris PLC | 139,501 | 9,859 | |
| 45,342 | |||
| Health Care Providers & Services - 4.4% | |||
| Air Methods Corp. (a) | 568,395 | 21,019 | |
| HealthSouth Corp. | 288,092 | 11,944 | |
| Providence Service Corp. (a) | 359,418 | 17,913 | |
| Ship Healthcare Holdings, Inc. | 673,400 | 16,618 | |
| Team Health Holdings, Inc. (a) | 419,080 | 17,530 | |
| 85,024 | |||
| Life Sciences Tools & Services - 1.4% | |||
| PAREXEL International Corp. (a) | 450,000 | 27,495 | |
| Pharmaceuticals - 2.8% | |||
| Achaogen, Inc. (a) | 469,900 | 1,593 | |
| Alliance Pharma PLC | 14,750,939 | 9,699 | |
| Amphastar Pharmaceuticals, Inc. (a) | 459,171 | 5,648 | |
| Dechra Pharmaceuticals PLC | 1,447,122 | 23,386 | |
| Endocyte, Inc. (a)(b) | 241,284 | 941 | |
| Innoviva, Inc.(b) | 421,857 | 5,206 | |
| Relypsa, Inc. (a)(b) | 173,000 | 3,131 | |
| The Medicines Company (a) | 141,100 | 5,022 | |
| 54,626 | |||
| TOTAL HEALTH CARE | 265,649 | ||
| INDUSTRIALS - 13.7% | |||
| Aerospace & Defense - 1.7% | |||
| Moog, Inc. Class A (a) | 319,602 | 15,616 | |
| Teledyne Technologies, Inc. (a) | 185,418 | 17,235 | |
| 32,851 | |||
| Building Products - 0.7% | |||
| Gibraltar Industries, Inc. (a) | 530,294 | 14,026 | |
| Commercial Services & Supplies - 0.4% | |||
| Regus PLC | 2,039,129 | 8,712 | |
| Construction & Engineering - 1.3% | |||
| AECOM (a) | 750,063 | 24,370 | |
| Machinery - 1.2% | |||
| Rexnord Corp. (a) | 1,105,347 | 24,097 | |
| Professional Services - 4.2% | |||
| Advisory Board Co. (a) | 156,980 | 4,967 | |
| CEB, Inc. | 318,100 | 19,624 | |
| Resources Connection, Inc. | 1,328,704 | 19,625 | |
| TriNet Group, Inc. (a) | 1,053,136 | 17,503 | |
| WageWorks, Inc. (a) | 366,000 | 19,713 | |
| 81,432 | |||
| Road & Rail - 1.9% | |||
| Landstar System, Inc. | 568,200 | 37,241 | |
| Trading Companies & Distributors - 2.3% | |||
| HD Supply Holdings, Inc. (a) | 1,005,681 | 34,475 | |
| Watsco, Inc. | 75,800 | 10,193 | |
| 44,668 | |||
| TOTAL INDUSTRIALS | 267,397 | ||
| INFORMATION TECHNOLOGY - 17.8% | |||
| Communications Equipment - 1.7% | |||
| Brocade Communications Systems, Inc. | 1,068,600 | 10,269 | |
| NETGEAR, Inc. (a) | 526,503 | 22,324 | |
| 32,593 | |||
| Electronic Equipment & Components - 2.4% | |||
| IPG Photonics Corp. (a) | 118,080 | 10,234 | |
| Trimble Navigation Ltd. (a) | 669,491 | 16,034 | |
| Zebra Technologies Corp. Class A (a) | 318,500 | 19,925 | |
| 46,193 | |||
| Internet Software & Services - 2.1% | |||
| Bankrate, Inc. (a) | 1,970,674 | 18,012 | |
| j2 Global, Inc. | 196,000 | 12,450 | |
| Stamps.com, Inc. (a) | 122,100 | 10,056 | |
| 40,518 | |||
| IT Services - 5.2% | |||
| Genpact Ltd. (a) | 1,332,050 | 37,151 | |
| Maximus, Inc. | 435,000 | 23,012 | |
| Optimal Payments PLC (a) | 4,198,513 | 23,385 | |
| Perficient, Inc. (a) | 910,615 | 19,014 | |
| 102,562 | |||
| Software - 5.7% | |||
| Fleetmatics Group PLC (a) | 513,991 | 18,632 | |
| Imperva, Inc. (a) | 187,600 | 8,720 | |
| Mentor Graphics Corp. | 566,170 | 11,301 | |
| Micro Focus International PLC | 1,118,000 | 24,977 | |
| Parametric Technology Corp. (a) | 376,100 | 13,713 | |
| Synchronoss Technologies, Inc. (a) | 805,000 | 25,011 | |
| Tyler Technologies, Inc. (a) | 64,000 | 9,370 | |
| 111,724 | |||
| Technology Hardware, Storage & Peripherals - 0.7% | |||
| Super Micro Computer, Inc. (a)(b) | 526,780 | 14,176 | |
| TOTAL INFORMATION TECHNOLOGY | 347,766 | ||
| MATERIALS - 4.3% | |||
| Chemicals - 0.9% | |||
| Chemtura Corp. (a) | 654,200 | 18,219 | |
| Containers & Packaging - 2.5% | |||
| Graphic Packaging Holding Co. | 1,102,324 | 14,639 | |
| Silgan Holdings, Inc. | 655,412 | 33,256 | |
| 47,895 | |||
| Paper & Forest Products - 0.9% | |||
| Schweitzer-Mauduit International, Inc. | 520,686 | 17,906 | |
| TOTAL MATERIALS | 84,020 | ||
| UTILITIES - 1.5% | |||
| Electric Utilities - 1.0% | |||
| IDACORP, Inc. | 263,648 | 19,175 | |
| Independent Power and Renewable Electricity Producers - 0.5% | |||
| Pattern Energy Group, Inc. (b) | 458,500 | 9,629 | |
| TOTAL UTILITIES | 28,804 | ||
| TOTAL COMMON STOCKS | |||
| (Cost $1,716,435) | 1,902,689 | ||
| Money Market Funds - 5.7% | |||
| Fidelity Cash Central Fund, 0.38% (d) | 66,099,563 | 66,100 | |
| Fidelity Securities Lending Cash Central Fund, 0.42% (d)(e) | 45,166,481 | 45,166 | |
| TOTAL MONEY MARKET FUNDS | |||
| (Cost $111,266) | 111,266 | ||
| TOTAL INVESTMENT PORTFOLIO - 103.0% | |||
| (Cost $1,827,701) | 2,013,955 | ||
| NET OTHER ASSETS (LIABILITIES) - (3.0)% | (58,226) | ||
| NET ASSETS - 100% | $1,955,729 |
Legend
(a) Non-income producing
(b) Security or a portion of the security is on loan at period end.
(c) Affiliated company
(d) Affiliated fund that is generally available only to investment companies and other accounts managed by Fidelity Investments. The rate quoted is the annualized seven-day yield of the fund at period end. A complete unaudited listing of the fund's holdings as of its most recent quarter end is available upon request. In addition, each Fidelity Central Fund's financial statements, which are not covered by the Fund's Report of Independent Registered Public Accounting Firm, are available on the SEC's website or upon request.
(e) Investment made with cash collateral received from securities on loan.
Affiliated Central Funds
Information regarding fiscal year to date income earned by the Fund from investments in Fidelity Central Funds is as follows:
| Fund | Income earned |
| (Amounts in thousands) | |
| Fidelity Cash Central Fund | $143 |
| Fidelity Securities Lending Cash Central Fund | 511 |
| Total | $654 |
Other Affiliated Issuers
An affiliated company is a company in which the Fund has ownership of at least 5% of the voting securities. Fiscal year to date transactions with companies which are or were affiliates are as follows:
| Affiliate (Amounts in thousands) | Value, beginning of period | Purchases | Sales Proceeds | Dividend Income | Value, end of period |
| Ardmore Shipping Corp. | $16,225 | $4,096 | $1,687 | $748 | $14,788 |
| Total | $16,225 | $4,096 | $1,687 | $748 | $14,788 |
Investment Valuation
The following is a summary of the inputs used, as of April 30, 2016, involving the Fund's assets and liabilities carried at fair value. The inputs or methodology used for valuing securities may not be an indication of the risk associated with investing in those securities. For more information on valuation inputs, and their aggregation into the levels used below, please refer to the Investment Valuation section in the accompanying Notes to Financial Statements.
| Valuation Inputs at Reporting Date: | ||||
| Description | Total | Level 1 | Level 2 | Level 3 |
| (Amounts in thousands) | ||||
| Investments in Securities: | ||||
| Equities: | ||||
| Consumer Discretionary | $275,801 | $275,801 | $-- | $-- |
| Consumer Staples | 61,625 | 61,625 | -- | -- |
| Energy | 68,645 | 68,645 | -- | -- |
| Financials | 502,982 | 469,920 | 33,062 | -- |
| Health Care | 265,649 | 247,538 | 16,618 | 1,493 |
| Industrials | 267,397 | 267,397 | -- | -- |
| Information Technology | 347,766 | 347,766 | -- | -- |
| Materials | 84,020 | 84,020 | -- | -- |
| Utilities | 28,804 | 28,804 | -- | -- |
| Money Market Funds | 111,266 | 111,266 | -- | -- |
| Total Investments in Securities: | $2,013,955 | $1,962,782 | $49,680 | $1,493 |
The following is a summary of transfers between Level 1 and Level 2 for the period ended April 30, 2016. Transfers are assumed to have occurred at the beginning of the period, and are primarily attributable to the valuation techniques used for foreign equity securities, as discussed in the accompanying Notes to Financial Statements:
| Transfers | Total (000s) |
| Level 1 to Level 2 | $0 |
| Level 2 to Level 1 | $109,819 |
Other Information
Distribution of investments by country or territory of incorporation, as a percentage of Total Net Assets, is as follows (Unaudited):
| United States of America | 80.9% |
| United Kingdom | 6.3% |
| Switzerland | 2.7% |
| Japan | 2.6% |
| Bermuda | 2.5% |
| Isle of Man | 1.2% |
| Others (Individually Less Than 1%) | 3.8% |
| 100.0% |
See accompanying notes which are an integral part of the financial statements.
Financial Statements
Statement of Assets and Liabilities
| Amounts in thousands (except per-share amount) | April 30, 2016 | |
| Assets | ||
| Investment in securities, at value (including securities loaned of $43,436) — See accompanying schedule: Unaffiliated issuers (cost $1,699,409) | $1,887,901 | |
| Fidelity Central Funds (cost $111,266) | 111,266 | |
| Other affiliated issuers (cost $17,026) | 14,788 | |
| Total Investments (cost $1,827,701) | $2,013,955 | |
| Cash | 10 | |
| Receivable for investments sold | 18,820 | |
| Receivable for fund shares sold | 1,029 | |
| Dividends receivable | 1,806 | |
| Distributions receivable from Fidelity Central Funds | 58 | |
| Prepaid expenses | 1 | |
| Other receivables | 11 | |
| Total assets | 2,035,690 | |
| Liabilities | ||
| Payable for investments purchased | $26,165 | |
| Payable for fund shares redeemed | 6,815 | |
| Accrued management fee | 1,378 | |
| Other affiliated payables | 381 | |
| Other payables and accrued expenses | 56 | |
| Collateral on securities loaned, at value | 45,166 | |
| Total liabilities | 79,961 | |
| Net Assets | $1,955,729 | |
| Net Assets consist of: | ||
| Paid in capital | $1,741,131 | |
| Distributions in excess of net investment income | (1,529) | |
| Accumulated undistributed net realized gain (loss) on investments and foreign currency transactions | 29,852 | |
| Net unrealized appreciation (depreciation) on investments and assets and liabilities in foreign currencies | 186,275 | |
| Net Assets, for 111,906 shares outstanding | $1,955,729 | |
| Net Asset Value, offering price and redemption price per share ($1,955,729 ÷ 111,906 shares) | $17.48 |
See accompanying notes which are an integral part of the financial statements.
Statement of Operations
| Amounts in thousands | Year ended April 30, 2016 | |
| Investment Income | ||
| Dividends (including $748 earned from other affiliated issuers) | $22,345 | |
| Income from Fidelity Central Funds | 654 | |
| Total income | 22,999 | |
| Expenses | ||
| Management fee | ||
| Basic fee | $13,905 | |
| Performance adjustment | 956 | |
| Transfer agent fees | 4,113 | |
| Accounting and security lending fees | 619 | |
| Custodian fees and expenses | 72 | |
| Independent trustees' compensation | 9 | |
| Registration fees | 73 | |
| Audit | 58 | |
| Legal | 7 | |
| Miscellaneous | 16 | |
| Total expenses before reductions | 19,828 | |
| Expense reductions | (130) | 19,698 |
| Net investment income (loss) | 3,301 | |
| Realized and Unrealized Gain (Loss) | ||
| Net realized gain (loss) on: | ||
| Investment securities: | ||
| Unaffiliated issuers | 120,859 | |
| Other affiliated issuers | (594) | |
| Foreign currency transactions | (65) | |
| Futures contracts | (2,389) | |
| Total net realized gain (loss) | 117,811 | |
| Change in net unrealized appreciation (depreciation) on: Investment securities | (189,000) | |
| Assets and liabilities in foreign currencies | 11 | |
| Total change in net unrealized appreciation (depreciation) | (188,989) | |
| Net gain (loss) | (71,178) | |
| Net increase (decrease) in net assets resulting from operations | $(67,877) |
See accompanying notes which are an integral part of the financial statements.
Statement of Changes in Net Assets
| Amounts in thousands | Year ended April 30, 2016 | Year ended April 30, 2015 |
| Increase (Decrease) in Net Assets | ||
| Operations | ||
| Net investment income (loss) | $3,301 | $13,308 |
| Net realized gain (loss) | 117,811 | 263,745 |
| Change in net unrealized appreciation (depreciation) | (188,989) | (30,067) |
| Net increase (decrease) in net assets resulting from operations | (67,877) | 246,986 |
| Distributions to shareholders from net investment income | (11,174) | (11,462) |
| Distributions to shareholders from net realized gain | (189,953) | (320,672) |
| Total distributions | (201,127) | (332,134) |
| Share transactions | ||
| Proceeds from sales of shares | 511,008 | 165,755 |
| Reinvestment of distributions | 195,114 | 322,737 |
| Cost of shares redeemed | (394,729) | (540,719) |
| Net increase (decrease) in net assets resulting from share transactions | 311,393 | (52,227) |
| Redemption fees | 320 | 90 |
| Total increase (decrease) in net assets | 42,709 | (137,285) |
| Net Assets | ||
| Beginning of period | 1,913,020 | 2,050,305 |
| End of period (including distributions in excess of net investment income of $1,529 and undistributed net investment income of $6,245, respectively) | $1,955,729 | $1,913,020 |
| Other Information | ||
| Shares | ||
| Sold | 27,869 | 8,385 |
| Issued in reinvestment of distributions | 10,433 | 16,887 |
| Redeemed | (22,415) | (27,670) |
| Net increase (decrease) | 15,887 | (2,398) |
See accompanying notes which are an integral part of the financial statements.
Financial Highlights — Fidelity Small Cap Stock Fund
| Years ended April 30, | 2016 | 2015 | 2014 | 2013 | 2012 |
| Selected Per–Share Data | |||||
| Net asset value, beginning of period | $19.92 | $20.83 | $19.78 | $18.49 | $21.70 |
| Income from Investment Operations | |||||
| Net investment income (loss)A | .03 | .14 | .12B | .09 | (.05)C |
| Net realized and unrealized gain (loss) | (.50)D | 2.50 | 3.24 | 1.76 | (3.16) |
| Total from investment operations | (.47) | 2.64 | 3.36 | 1.85 | (3.21) |
| Distributions from net investment income | (.11) | (.12) | (.06) | (.08) | – |
| Distributions from net realized gain | (1.86) | (3.43) | (2.25) | (.48) | –E |
| Total distributions | (1.97) | (3.55) | (2.31) | (.56) | –E |
| Redemption fees added to paid in capitalA,E | – | – | – | – | – |
| Net asset value, end of period | $17.48 | $19.92 | $20.83 | $19.78 | $18.49 |
| Total ReturnF | (2.79)%D | 14.23% | 18.08% | 10.52% | (14.78)% |
| Ratios to Average Net AssetsG,H | |||||
| Expenses before reductions | 1.00% | .66% | .68% | .72% | 1.12% |
| Expenses net of fee waivers, if any | .99% | .66% | .67% | .72% | 1.12% |
| Expenses net of all reductions | .99% | .66% | .67% | .69% | 1.10% |
| Net investment income (loss) | .17% | .71% | .57%B | .51% | (.26)%C |
| Supplemental Data | |||||
| Net assets, end of period (in millions) | $1,956 | $1,913 | $2,050 | $2,500 | $3,219 |
| Portfolio turnover rateI | 59% | 64% | 50% | 75% | 104% |
A Calculated based on average shares outstanding during the period.
B Net Investment income per share reflects a large, non-recurring dividend which amounted to $.03 per share. Excluding this non-recurring dividend, the ratio of net investment income (loss) to average net assets would have been .43%.
C Net Investment income per share reflects a large, non-recurring dividend which amounted to $.02 per share. Excluding this non-recurring dividend, the ratio of net investment income (loss) to average net assets would have been (.35) %.
D Net realized and unrealized gain (loss) per share reflects proceeds received from litigation which amounted to $.03 per share. Excluding these litigation proceeds, the total return would have been (2.96)%.
E Amount represents less than $.005 per share.
F Total returns would have been lower if certain expenses had not been reduced during the applicable periods shown.
G Fees and expenses of any underlying Fidelity Central Funds are not included in the Fund's expense ratio. The Fund indirectly bears its proportionate share of the expenses of any underlying Fidelity Central Funds.
H Expense ratios reflect operating expenses of the Fund. Expenses before reductions do not reflect amounts reimbursed by the investment adviser or reductions from brokerage service arrangements or reductions from other expense offset arrangements and do not represent the amount paid by the Fund during periods when reimbursements or reductions occur. Expenses net of fee waivers reflect expenses after reimbursement by the investment adviser but prior to reductions from brokerage service arrangements or other expense offset arrangements. Expenses net of all reductions represent the net expenses paid by the Fund.
I Amount does not include the portfolio activity of any underlying Fidelity Central Funds.
See accompanying notes which are an integral part of the financial statements.
Notes to Financial Statements
For the period ended April 30, 2016
(Amounts in thousands except percentages)
1. Organization.
Fidelity Small Cap Stock Fund (the Fund) is a fund of Fidelity Commonwealth Trust (the Trust) and is authorized to issue an unlimited number of shares. Share transactions on the Statement of Changes in Net Assets may contain exchanges between affiliated funds. The Trust is registered under the Investment Company Act of 1940, as amended (the 1940 Act), as an open-end management investment company organized as a Massachusetts business trust.
2. Investments in Fidelity Central Funds.
The Fund invests in Fidelity Central Funds, which are open-end investment companies generally available only to other investment companies and accounts managed by the investment adviser and its affiliates. The Fund's Schedule of Investments lists each of the Fidelity Central Funds held as of period end, if any, as an investment of the Fund, but does not include the underlying holdings of each Fidelity Central Fund. As an Investing Fund, the Fund indirectly bears its proportionate share of the expenses of the underlying Fidelity Central Funds.
The Money Market Central Funds seek preservation of capital and current income and are managed by Fidelity Investments Money Management, Inc. (FIMM), an affiliate of the investment adviser. Annualized expenses of the Money Market Central Funds as of their most recent shareholder report date are less than .005%.
A complete unaudited list of holdings for each Fidelity Central Fund is available upon request or at the Securities and Exchange Commission (the SEC) website at www.sec.gov. In addition, the financial statements of the Fidelity Central Funds, which are not covered by the Fund's Report of Independent Registered Public Accounting Firm, are available on the SEC website or upon request.
3. Significant Accounting Policies.
The financial statements have been prepared in conformity with accounting principles generally accepted in the United States of America (GAAP), which require management to make certain estimates and assumptions at the date of the financial statements. Actual results could differ from those estimates. Subsequent events, if any, through the date that the financial statements were issued have been evaluated in the preparation of the financial statements. The following summarizes the significant accounting policies of the Fund:
Investment Valuation. Investments are valued as of 4:00 p.m. Eastern time on the last calendar day of the period. The Board of Trustees (the Board) has delegated the day to day responsibility for the valuation of the Fund's investments to the Fidelity Management & Research Company (FMR) Fair Value Committee (the Committee). In accordance with valuation policies and procedures approved by the Board, the Fund attempts to obtain prices from one or more third party pricing vendors or brokers to value its investments. When current market prices, quotations or currency exchange rates are not readily available or reliable, investments will be fair valued in good faith by the Committee, in accordance with procedures adopted by the Board. Factors used in determining fair value vary by investment type and may include market or investment specific events. The frequency with which these procedures are used cannot be predicted and they may be utilized to a significant extent. The Committee oversees the Fund's valuation policies and procedures and reports to the Board on the Committee's activities and fair value determinations. The Board monitors the appropriateness of the procedures used in valuing the Fund's investments and ratifies the fair value determinations of the Committee.
The Fund categorizes the inputs to valuation techniques used to value its investments into a disclosure hierarchy consisting of three levels as shown below:
- Level 1 – quoted prices in active markets for identical investments
- Level 2 – other significant observable inputs (including quoted prices for similar investments, interest rates, prepayment speeds, etc.)
- Level 3 – unobservable inputs (including the Fund's own assumptions based on the best information available)
Valuation techniques used to value the Fund's investments by major category are as follows:
Equity securities, including restricted securities, for which market quotations are readily available, are valued at the last reported sale price or official closing price as reported by a third party pricing vendor on the primary market or exchange on which they are traded and are categorized as Level 1 in the hierarchy. In the event there were no sales during the day or closing prices are not available, securities are valued at the last quoted bid price or may be valued using the last available price and are generally categorized as Level 2 in the hierarchy. For foreign equity securities, when market or security specific events arise, comparisons to the valuation of American Depositary Receipts (ADRs), futures contracts, Exchange-Traded Funds (ETFs) and certain indexes as well as quoted prices for similar securities may be used and would be categorized as Level 2 in the hierarchy. Utilizing these techniques may result in transfers between Level 1 and Level 2. For equity securities, including restricted securities, where observable inputs are limited, assumptions about market activity and risk are used and these securities may be categorized as Level 3 in the hierarchy.
Investments in open-end mutual funds, including the Fidelity Central Funds, are valued at their closing net asset value (NAV) each business day and are categorized as Level 1 in the hierarchy.
Changes in valuation techniques may result in transfers in or out of an assigned level within the disclosure hierarchy. The aggregate value of investments by input level as of April 30, 2016, including information on transfers between Levels 1 and 2 is included at the end of the Fund's Schedule of Investments.
Foreign Currency. The Fund may use foreign currency contracts to facilitate transactions in foreign-denominated securities. Gains and losses from these transactions may arise from changes in the value of the foreign currency or if the counterparties do not perform under the contracts' terms.
Foreign-denominated assets, including investment securities, and liabilities are translated into U.S. dollars at the exchange rates at period end. Purchases and sales of investment securities, income and dividends received and expenses denominated in foreign currencies are translated into U.S. dollars at the exchange rate in effect on the transaction date.
The effects of exchange rate fluctuations on investments are included with the net realized and unrealized gain (loss) on investment securities. Other foreign currency transactions resulting in realized and unrealized gain (loss) are disclosed separately.
Investment Transactions and Income. For financial reporting purposes, the Fund's investment holdings and NAV include trades executed through the end of the last business day of the period. The NAV per share for processing shareholder transactions is calculated as of the close of business of the New York Stock Exchange (NYSE), normally 4:00 p.m. Eastern time and includes trades executed through the end of the prior business day. Gains and losses on securities sold are determined on the basis of identified cost and may include proceeds received from litigation. Dividend income is recorded on the ex-dividend date, except for certain dividends from foreign securities where the ex-dividend date may have passed, which are recorded as soon as the Fund is informed of the ex-dividend date. Non-cash dividends included in dividend income, if any, are recorded at the fair market value of the securities received. Income and capital gain distributions from Fidelity Central Funds, if any, are recorded on the ex-dividend date. Distributions received on securities that represent a return of capital or capital gain are recorded as a reduction of cost of investments and/or as a realized gain. Subsequent to ex-dividend date the Fund determines the components of these distributions, based upon receipt of tax filings or other correspondence relating to the underlying investment. Interest income is accrued as earned and includes coupon interest and amortization of premium and accretion of discount on debt securities as applicable. Investment income is recorded net of foreign taxes withheld where recovery of such taxes is uncertain.
Expenses. Expenses directly attributable to a fund are charged to that fund. Expenses attributable to more than one fund are allocated among the respective funds on the basis of relative net assets or other appropriate methods. Expense estimates are accrued in the period to which they relate and adjustments are made when actual amounts are known.
Income Tax Information and Distributions to Shareholders. Each year, the Fund intends to qualify as a regulated investment company under Subchapter M of the Internal Revenue Code, including distributing substantially all of its taxable income and realized gains. As a result, no provision for U.S. Federal income taxes is required. As of April 30, 2016, the Fund did not have any unrecognized tax benefits in the financial statements; nor is the Fund aware of any tax positions for which it is reasonably possible that the total amounts of unrecognized tax benefits will significantly change in the next twelve months. The Fund files a U.S. federal tax return, in addition to state and local tax returns as required. The Fund's federal income tax returns are subject to examination by the Internal Revenue Service (IRS) for a period of three fiscal years after they are filed. State and local tax returns may be subject to examination for an additional fiscal year depending on the jurisdiction. Foreign taxes are provided for based on the Fund's understanding of the tax rules and rates that exist in the foreign markets in which it invests.
Distributions are declared and recorded on the ex-dividend date. Income and capital gain distributions are determined in accordance with income tax regulations, which may differ from GAAP. In addition, the Fund claimed a portion of the payment made to redeeming shareholders as a distribution for income tax purposes.
Capital accounts within the financial statements are adjusted for permanent book-tax differences. These adjustments have no impact on net assets or the results of operations. Capital accounts are not adjusted for temporary book-tax differences which will reverse in a subsequent period.
Book-tax differences are primarily due to futures contracts, foreign currency transactions, partnerships, and losses deferred due to wash sales and excise tax regulations.
The federal tax cost of investment securities and unrealized appreciation (depreciation) as of period end were as follows:
| Gross unrealized appreciation | $294,189 |
| Gross unrealized depreciation | (111,979) |
| Net unrealized appreciation (depreciation) on securities | $182,210 |
| Tax Cost | $1,831,745 |
The tax-based components of distributable earnings as of period end were as follows:
| Undistributed long-term capital gain | $45,216 |
| Net unrealized appreciation (depreciation) on securities and other investments | $182,224 |
The Fund intends to elect to defer to its next fiscal year $11,320 of capital losses recognized during the period November 1, 2015 to April 30, 2016. The Fund intends to elect to defer to its next fiscal year $1,522 of ordinary losses recognized during the period January 1, 2016 to April 30, 2016.
The tax character of distributions paid was as follows:
| April 30, 2016 | April 30, 2015 | |
| Ordinary Income | $17,512 | $ 11,553 |
| Long-term Capital Gains | 183,615 | 320,581 |
| Total | $201,127 | $ 332,134 |
Short-Term Trading (Redemption) Fees. Shares held by investors in the Fund less than 90 days may have been subject to a redemption fee equal to 2.00% of the NAV of shares redeemed. All redemption fees, which reduce the proceeds of the shareholder redemption, are retained by the Fund and accounted for as an addition to paid in capital.
4. Purchases and Sales of Investments.
Purchases and sales of securities, other than short-term securities, aggregated $1,267,158 and $1,128,485, respectively.
5. Fees and Other Transactions with Affiliates.
Management Fee. Fidelity Management & Research Company (the investment adviser) and its affiliates provide the Fund with investment management related services for which the Fund pays a monthly management fee. The management fee is the sum of an individual fund fee rate that is based on an annual rate of .45% of the Fund's average net assets and an annualized group fee rate that averaged .25% during the period. The group fee rate is based upon the average net assets of all the mutual funds advised by the investment adviser, including any mutual funds previously advised by the investment adviser that are currently advised by Fidelity SelectCo, LLC, an affiliate of the investment adviser. The group fee rate decreases as assets under management increase and increases as assets under management decrease. In addition, the management fee is subject to a performance adjustment (up to a maximum of +/- .20% of the Fund's average net assets over a 36 month performance period). The upward or downward adjustment to the management fee is based on the Fund's relative investment performance as compared to its benchmark index, the Russell 2000 Index, over the same 36 month performance period. For the reporting period, the total annual management fee rate, including the performance adjustment, was .75% of the Fund's average net assets. The performance adjustment included in the management fee rate may be higher or lower than the maximum performance adjustment rate due to the difference between the average net assets for the reporting and performance periods.
Transfer Agent Fees. Fidelity Investments Institutional Operations Company, Inc. (FIIOC), an affiliate of the investment adviser, is the Fund's transfer, dividend disbursing and shareholder servicing agent. FIIOC receives account fees and asset-based fees that vary according to account size and type of account. FIIOC pays for typesetting, printing and mailing of shareholder reports, except proxy statements. For the period, the transfer agent fees were equivalent to an annual rate of .21% of average net assets.
Accounting and Security Lending Fees. Fidelity Service Company, Inc. (FSC), an affiliate of the investment adviser, maintains the Fund's accounting records. The accounting fee is based on the level of average net assets for each month. Under a separate contract, FSC administers the security lending program. The security lending fee is based on the number and duration of lending transactions.
Brokerage Commissions. The Fund placed a portion of its portfolio transactions with brokerage firms which are affiliates of the investment adviser. Brokerage commissions are included in net realized gain (loss) and change in net unrealized appreciation (depreciation) in the Statement of Operations. The commissions paid to these affiliated firms were $80 for the period.
Interfund Trades. The Fund may purchase from or sell securities to other Fidelity Funds under procedures adopted by the Board. The procedures have been designed to ensure these interfund trades are executed in accordance with Rule 17a-7 of the 1940 Act. Interfund trades are included within the respective purchases and sales amounts shown in the Purchases and Sales of Investments note.
6. Committed Line of Credit.
The Fund participates with other funds managed by the investment adviser or an affiliate in a $4.25 billion credit facility (the "line of credit") to be utilized for temporary or emergency purposes to fund shareholder redemptions or for other short-term liquidity purposes. The Fund has agreed to pay commitment fees on its pro-rata portion of the line of credit, which amounted to $3 and is reflected in Miscellaneous expenses on the Statement of Operations. During the period, the Fund did not borrow on this line of credit.
7. Security Lending.
The Fund lends portfolio securities through a lending agent from time to time in order to earn additional income. For equity securities, a lending agent is used and may loan securities to certain qualified borrowers, including Fidelity Capital Markets (FCM), a broker-dealer affiliated with the Fund. On the settlement date of the loan, the Fund receives collateral (in the form of U.S. Treasury obligations, letters of credit and/or cash) against the loaned securities and maintains collateral in an amount not less than 100% of the market value of the loaned securities during the period of the loan. The market value of the loaned securities is determined at the close of business of the Fund and any additional required collateral is delivered to the Fund on the next business day. The Fund or borrower may terminate the loan at any time, and if the borrower defaults on its obligation to return the securities loaned because of insolvency or other reasons, the Fund may apply collateral received from the borrower against the obligation. The Fund may experience delays and costs in recovering the securities loaned. Any cash collateral received is invested in the Fidelity Securities Lending Cash Central Fund. The value of loaned securities and cash collateral at period end are disclosed on the Fund's Statement of Assets and Liabilities. At period end, there were no security loans outstanding with FCM. Security lending income represents the income earned on investing cash collateral, less rebates paid to borrowers and any lending agent fees associated with the loan, plus any premium payments received for lending certain types of securities. Security lending income is presented in the Statement of Operations as a component of income from Fidelity Central Funds. Total security lending income during the period amounted to $511, including $2 from securities loaned to FCM.
8. Expense Reductions.
Commissions paid to certain brokers with whom the investment adviser, or its affiliates, places trades on behalf of the Fund include an amount in addition to trade execution, which may be rebated back to the Fund to offset certain expenses. This amount totaled $65 for the period.
In addition, during the period the investment adviser reimbursed and/or waived a portion of operating expenses in the amount of $65.
9. Other.
The Fund's organizational documents provide former and current trustees and officers with a limited indemnification against liabilities arising in connection with the performance of their duties to the Fund. In the normal course of business, the Fund may also enter into contracts that provide general indemnifications. The Fund's maximum exposure under these arrangements is unknown as this would be dependent on future claims that may be made against the Fund. The risk of material loss from such claims is considered remote.
Report of Independent Registered Public Accounting Firm
To the Trustees of Fidelity Commonwealth Trust and Shareholders of Fidelity Small Cap Stock Fund:
We have audited the accompanying statement of assets and liabilities of Fidelity Small Cap Stock Fund (the Fund), a fund of Fidelity Commonwealth Trust, including the schedule of investments, as of April 30, 2016, and the related statement of operations for the year then ended, the statement of changes in net assets for each of the two years in the period then ended, and the financial highlights for each of the five years in the period then ended. These financial statements and financial highlights are the responsibility of the Fund's management. Our responsibility is to express an opinion on these financial statements and financial highlights based on our audits.
We conducted our audits in accordance with the standards of the Public Company Accounting Oversight Board (United States). Those standards require that we plan and perform the audit to obtain reasonable assurance about whether the financial statements and financial highlights are free of material misstatement. The Fund is not required to have, nor were we engaged to perform, an audit of its internal control over financial reporting. Our audits included consideration of internal control over financial reporting as a basis for designing audit procedures that are appropriate in the circumstances, but not for the purpose of expressing an opinion on the effectiveness of the Fund's internal control over financial reporting. Accordingly, we express no such opinion. An audit also includes examining, on a test basis, evidence supporting the amounts and disclosures in the financial statements, assessing the accounting principles used and significant estimates made by management, as well as evaluating the overall financial statement presentation. Our procedures included confirmation of securities owned as of April 30, 2016, by correspondence with the custodians and brokers; when replies were not received from brokers, we performed other auditing procedures. We believe that our audits provide a reasonable basis for our opinion.
In our opinion, such financial statements and financial highlights referred to above present fairly, in all material respects, the financial position of Fidelity Small Cap Stock Fund as of April 30, 2016, the results of its operations for the year then ended, the changes in its net assets for each of the two years in the period then ended, and the financial highlights for each of the five years in the period then ended in conformity with accounting principles generally accepted in the United States of America.
DELOITTE & TOUCHE LLP
Boston, Massachusetts
June 15, 2016
Trustees and Officers
The Trustees, Members of the Advisory Board (if any), and officers of the trust and fund, as applicable, are listed below. The Board of Trustees governs the fund and is responsible for protecting the interests of shareholders. The Trustees are experienced executives who meet periodically throughout the year to oversee the fund's activities, review contractual arrangements with companies that provide services to the fund, oversee management of the risks associated with such activities and contractual arrangements, and review the fund's performance. Each of the Trustees oversees 170 funds.
The Trustees hold office without limit in time except that (a) any Trustee may resign; (b) any Trustee may be removed by written instrument, signed by at least two-thirds of the number of Trustees prior to such removal; (c) any Trustee who requests to be retired or who has become incapacitated by illness or injury may be retired by written instrument signed by a majority of the other Trustees; and (d) any Trustee may be removed at any special meeting of shareholders by a two-thirds vote of the outstanding voting securities of the trust. Each Trustee who is not an interested person (as defined in the 1940 Act) of the trust and the fund is referred to herein as an Independent Trustee. Each Independent Trustee shall retire not later than the last day of the calendar year in which his or her 75th birthday occurs. The Independent Trustees may waive this mandatory retirement age policy with respect to individual Trustees. Officers and Advisory Board Members hold office without limit in time, except that any officer or Advisory Board Member may resign or may be removed by a vote of a majority of the Trustees at any regular meeting or any special meeting of the Trustees. Except as indicated, each individual has held the office shown or other offices in the same company for the past five years.
The fund’s Statement of Additional Information (SAI) includes more information about the Trustees. To request a free copy, call Fidelity at 1-800-544-8544.
Experience, Skills, Attributes, and Qualifications of the Trustees. The Governance and Nominating Committee has adopted a statement of policy that describes the experience, qualifications, attributes, and skills that are necessary and desirable for potential Independent Trustee candidates (Statement of Policy). The Board believes that each Trustee satisfied at the time he or she was initially elected or appointed a Trustee, and continues to satisfy, the standards contemplated by the Statement of Policy. The Governance and Nominating Committee also engages professional search firms to help identify potential Independent Trustee candidates who have the experience, qualifications, attributes, and skills consistent with the Statement of Policy. From time to time, additional criteria based on the composition and skills of the current Independent Trustees, as well as experience or skills that may be appropriate in light of future changes to board composition, business conditions, and regulatory or other developments, have also been considered by the professional search firms and the Governance and Nominating Committee. In addition, the Board takes into account the Trustees' commitment and participation in Board and committee meetings, as well as their leadership of standing and ad hoc committees throughout their tenure.
In determining that a particular Trustee was and continues to be qualified to serve as a Trustee, the Board has considered a variety of criteria, none of which, in isolation, was controlling. The Board believes that, collectively, the Trustees have balanced and diverse experience, qualifications, attributes, and skills, which allow the Board to operate effectively in governing the fund and protecting the interests of shareholders. Information about the specific experience, skills, attributes, and qualifications of each Trustee, which in each case led to the Board's conclusion that the Trustee should serve (or continue to serve) as a trustee of the fund, is provided below.
Board Structure and Oversight Function. James C. Curvey is an interested person and currently serves as Chairman. The Trustees have determined that an interested Chairman is appropriate and benefits shareholders because an interested Chairman has a personal and professional stake in the quality and continuity of services provided to the fund. Independent Trustees exercise their informed business judgment to appoint an individual of their choosing to serve as Chairman, regardless of whether the Trustee happens to be independent or a member of management. The Independent Trustees have determined that they can act independently and effectively without having an Independent Trustee serve as Chairman and that a key structural component for assuring that they are in a position to do so is for the Independent Trustees to constitute a substantial majority for the Board. The Independent Trustees also regularly meet in executive session. Ned C. Lautenbach serves as Chairman of the Independent Trustees and as such (i) acts as a liaison between the Independent Trustees and management with respect to matters important to the Independent Trustees and (ii) with management prepares agendas for Board meetings.
Fidelity® funds are overseen by different Boards of Trustees. The fund's Board oversees Fidelity's high income and certain equity funds, and other Boards oversee Fidelity's investment-grade bond, money market, asset allocation, and sector funds. The asset allocation funds may invest in Fidelity® funds overseen by the fund's Board. The use of separate Boards, each with its own committee structure, allows the Trustees of each group of Fidelity® funds to focus on the unique issues of the funds they oversee, including common research, investment, and operational issues. On occasion, the separate Boards establish joint committees to address issues of overlapping consequences for the Fidelity® funds overseen by each Board.
The Trustees operate using a system of committees to facilitate the timely and efficient consideration of all matters of importance to the Trustees, the fund, and fund shareholders and to facilitate compliance with legal and regulatory requirements and oversight of the fund's activities and associated risks. The Board, acting through its committees, has charged FMR and its affiliates with (i) identifying events or circumstances the occurrence of which could have demonstrably adverse effects on the fund's business and/or reputation; (ii) implementing processes and controls to lessen the possibility that such events or circumstances occur or to mitigate the effects of such events or circumstances if they do occur; and (iii) creating and maintaining a system designed to evaluate continuously business and market conditions in order to facilitate the identification and implementation processes described in (i) and (ii) above. Because the day-to-day operations and activities of the fund are carried out by or through FMR, its affiliates, and other service providers, the fund's exposure to risks is mitigated but not eliminated by the processes overseen by the Trustees. While each of the Board's committees has responsibility for overseeing different aspects of the fund's activities, oversight is exercised primarily through the Operations, Audit, and Compliance Committees. In addition, the Independent Trustees have worked with FMR to enhance the Board's oversight of investment and financial risks, legal and regulatory risks, technology risks, and operational risks, including the development of additional risk reporting to the Board. For example, a working group comprised of Independent Trustees and FMR has worked and continues to work to review the Fidelity® funds' valuation-related activities, reporting and risk management. Appropriate personnel, including but not limited to the fund's Chief Compliance Officer (CCO), FMR's internal auditor, the independent accountants, the fund's Treasurer and portfolio management personnel, make periodic reports to the Board's committees, as appropriate, including an annual review of Fidelity's risk management program for the Fidelity® funds. The responsibilities of each standing committee, including their oversight responsibilities, are described further under "Standing Committees of the Trustees."
Interested Trustees*:
Correspondence intended for a Trustee who is an interested person may be sent to Fidelity Investments, 245 Summer Street, Boston, Massachusetts 02210.
Name, Year of Birth; Principal Occupations and Other Relevant Experience+
James C. Curvey (1935)
Year of Election or Appointment: 2007
Trustee
Chairman of the Board of Trustees
Mr. Curvey also serves as Trustee of other Fidelity® funds. Mr. Curvey is a Director of Fidelity Research & Analysis Co. (investment adviser firm, 2009-present), and Vice Chairman (2007-present) and Director of FMR LLC (diversified financial services company). In addition, Mr. Curvey serves as an Overseer for the Boston Symphony Orchestra and a member of the board of Artis-Naples, Naples, Florida, and as a Trustee for Brewster Academy, Wolfeboro, New Hampshire. Previously, Mr. Curvey served as a Director of Fidelity Investments Money Management, Inc. (investment adviser firm, 2009-2014) and a Director of FMR and FMR Co., Inc. (investment adviser firms, 2007-2014).
Charles S. Morrison (1960)
Year of Election or Appointment: 2014
Trustee
Mr. Morrison also serves as Trustee of other funds. He serves as a Director of Fidelity Investments Money Management, Inc. (FIMM) (investment adviser firm, 2014-present), Director of Fidelity SelectCo, LLC (investment adviser firm, 2014-present), President, Asset Management (2014-present), and is an employee of Fidelity Investments. Previously, Mr. Morrison served as Vice President of Fidelity's Fixed Income and Asset Allocation Funds (2012-2014), President, Fixed Income (2011-2014), Vice President of Fidelity's Money Market Funds (2005-2009), President, Money Market Group Leader of FMR (investment adviser firm, 2009), and Senior Vice President, Money Market Group of FMR (2004-2009). Mr. Morrison also served as Vice President of Fidelity's Bond Funds (2002-2005), certain Balanced Funds (2002-2005), and certain Asset Allocation Funds (2002-2007), and as Senior Vice President (2002-2005) of Fidelity's Bond Division.
* Determined to be an “Interested Trustee” by virtue of, among other things, his or her affiliation with the trust or various entities under common control with FMR.
+ The information includes the Trustee's principal occupation during the last five years and other information relating to the experience, attributes, and skills relevant to the Trustee's qualifications to serve as a Trustee, which led to the conclusion that the Trustee should serve as a Trustee for the fund.
Independent Trustees:
Correspondence intended for an Independent Trustee may be sent to Fidelity Investments, P.O. Box 55235, Boston, Massachusetts 02205-5235.
Name, Year of Birth; Principal Occupations and Other Relevant Experience+
Dennis J. Dirks (1948)
Year of Election or Appointment: 2005
Trustee
Mr. Dirks also serves as Trustee of other Fidelity® funds. Prior to his retirement in May 2003, Mr. Dirks was Chief Operating Officer and a member of the Board of The Depository Trust & Clearing Corporation (DTCC). He also served as President, Chief Operating Officer, and Board member of The Depository Trust Company (DTC) and President and Board member of the National Securities Clearing Corporation (NSCC). In addition, Mr. Dirks served as Chief Executive Officer and Board member of the Government Securities Clearing Corporation, Chief Executive Officer and Board member of the Mortgage-Backed Securities Clearing Corporation, as a Trustee and a member of the Finance Committee of Manhattan College (2005-2008), as a Trustee and a member of the Finance Committee of AHRC of Nassau County (2006-2008), and as a member of the Independent Directors Council (IDC) Governing Council (2010-2015). Mr. Dirks is a member of the Board of Directors for The Brookville Center for Children's Services, Inc. (2009-present).
Alan J. Lacy (1953)
Year of Election or Appointment: 2008
Trustee
Mr. Lacy also serves as Trustee of other Fidelity® funds. Mr. Lacy serves as Chairman (2014-present) and a member (2010-present) of the Board of Directors of Dave & Buster's Entertainment, Inc. (restaurant and entertainment complexes) and a Director of Bristol-Myers Squibb Company (global pharmaceuticals, 2008-present). He is a Trustee of the California Chapter of The Nature Conservancy (2015-present) and a Director of the Center for Advanced Study in the Behavioral Sciences at Stanford University (2015-present). In addition, Mr. Lacy served as Senior Adviser (2007-2014) of Oak Hill Capital Partners, L.P. (private equity) and also served as Chief Executive Officer (2005) and Vice Chairman (2005-2006) of Sears Holdings Corporation (retail) and Chief Executive Officer and Chairman of the Board of Sears, Roebuck and Co. (retail, 2000-2005). Previously, Mr. Lacy served as Chairman (2008-2011) and a member (2006-2015) of the Board of Trustees of the National Parks Conservation Association and as a member of the Board of Directors for The Western Union Company (global money transfer, 2006-2011), The Hillman Companies, Inc. (hardware wholesalers, 2010-2014), and Earth Fare, Inc. (retail grocery, 2010-2014).
Ned C. Lautenbach (1944)
Year of Election or Appointment: 2000
Trustee
Chairman of the Independent Trustees
Mr. Lautenbach also serves as Trustee of other Fidelity® funds. Mr. Lautenbach currently serves as the Lead Director of the Eaton Corporation Board of Directors (diversified industrial, 1997-present). Mr. Lautenbach is Chairman of the Board of Directors of Artis-Naples in Naples, Florida (2012-present), a member of the Council on Foreign Relations (1994-present), and a member of the Board of Governors, State University System of Florida (2013-present). Previously, Mr. Lautenbach was a Partner/Advisory Partner at Clayton, Dubilier & Rice, LLC (private equity investment, 1998-2010), as well as a Director of Sony Corporation (2006-2007).
Joseph Mauriello (1944)
Year of Election or Appointment: 2008
Trustee
Mr. Mauriello also serves as Trustee of other Fidelity® funds. Prior to his retirement in January 2006, Mr. Mauriello served in numerous senior management positions including Deputy Chairman and Chief Operating Officer (2004-2005), and Vice Chairman of Financial Services (2002-2004) of KPMG LLP US (professional services, 1965-2005). Mr. Mauriello currently serves as a member of the Board of Directors of XL Group plc. (global insurance and re-insurance, 2006-present) and the Independent Directors Council (IDC) Governing Council (2015-present). Previously, Mr. Mauriello served as a Director of the Hamilton Funds of the Bank of New York (2006-2007) and of Arcadia Resources Inc. (health care services and products, 2007-2012).
Robert W. Selander (1950)
Year of Election or Appointment: 2011
Trustee
Mr. Selander also serves as Trustee of other Fidelity® funds. Mr. Selander serves as a Director of The Western Union Company (global money transfer, 2014-present) and a non-executive Chairman of Health Equity, Inc. (health savings custodian, 2015-present). Previously, Mr. Selander served as a Member of the Advisory Board of certain Fidelity® funds (2011), and Executive Vice Chairman (2010), Chief Executive Officer (2009-2010), and President and Chief Executive Officer (1997-2009) of Mastercard, Inc.
Cornelia M. Small (1944)
Year of Election or Appointment: 2005
Trustee
Ms. Small also serves as Trustee of other Fidelity® funds. Ms. Small is a member of the Board of Directors (2009-present) and Chair of the Investment Committee (2010-present) of the Teagle Foundation. Ms. Small also serves on the Investment Committee of the Berkshire Taconic Community Foundation (2008-present). Previously, Ms. Small served as Chairperson (2002-2008) and a member of the Investment Committee and Chairperson (2008-2012) and a member of the Board of Trustees of Smith College. In addition, Ms. Small served as Chief Investment Officer, Director of Global Equity Investments, and a member of the Board of Directors of Scudder, Stevens & Clark and Scudder Kemper Investments.
William S. Stavropoulos (1939)
Year of Election or Appointment: 2002
Trustee
Vice Chairman of the Independent Trustees
Mr. Stavropoulos also serves as Trustee of other Fidelity® funds. Mr. Stavropoulos serves as President and Founder of the Michigan Baseball Foundation, the Great Lakes Loons (2007-present). Mr. Stavropoulos is Chairman Emeritus of the Board of Directors of The Dow Chemical Company, where he previously served in numerous senior management positions, including President, CEO (1995-2000; 2002-2004), Chairman of the Executive Committee (2000-2006), and as a member of the Board of Directors (1990-2006). Currently, Mr. Stavropoulos is Chairman of the Board of Directors of Univar Inc. (global distributor of commodity and specialty chemicals), a Director of Teradata Corporation (data warehousing and technology solutions), and Maersk Inc. (industrial conglomerate), and a member of the Advisory Board for Metalmark Capital LLC (private equity investment, 2005-present). Mr. Stavropoulos is an operating advisor to Clayton, Dubilier & Rice, LLC (private equity investment). In addition, Mr. Stavropoulos is a member of the University of Notre Dame Advisory Council for the College of Science, a Trustee of the Rollin L. Gerstacker Foundation, and a Director of the Naples Philharmonic Center for the Arts. Previously, Mr. Stavropoulos served as a Director of Chemical Financial Corporation (bank holding company, 1993-2012) and Tyco International, Ltd. (multinational manufacturing and services, 2007-2012).
David M. Thomas (1949)
Year of Election or Appointment: 2008
Trustee
Mr. Thomas also serves as Trustee of other Fidelity® funds. Mr. Thomas serves as Non-Executive Chairman of the Board of Directors of Fortune Brands Home and Security (home and security products, 2011-present), as a member of the Board of Directors (2004-present) and Presiding Director (2013-present) of Interpublic Group of Companies, Inc. (marketing communication), and as a member of the Board of Trustees of the University of Florida (2013-present). Previously, Mr. Thomas served as Executive Chairman (2005-2006) and Chairman and Chief Executive Officer (2000-2005) of IMS Health, Inc. (pharmaceutical and healthcare information solutions), and a Director of Fortune Brands, Inc. (consumer products, 2000-2011).
+ The information includes the Trustee's principal occupation during the last five years and other information relating to the experience, attributes, and skills relevant to the Trustee's qualifications to serve as a Trustee, which led to the conclusion that the Trustee should serve as a Trustee for the fund.
Advisory Board Members and Officers:
Correspondence intended for an officer or Peter S. Lynch may be sent to Fidelity Investments, 245 Summer Street, Boston, Massachusetts 02210. Officers appear below in alphabetical order.
Name, Year of Birth; Principal Occupation
Peter S. Lynch (1944)
Year of Election or Appointment: 2003
Member of the Advisory Board
Mr. Lynch also serves as Member of the Advisory Board of other Fidelity® funds. Mr. Lynch is Vice Chairman and a Director of FMR (investment adviser firm) and FMR Co., Inc. (investment adviser firm). In addition, Mr. Lynch serves as a Trustee of Boston College and as the Chairman of the Inner-City Scholarship Fund. Previously, Mr. Lynch served on the Special Olympics International Board of Directors (1997-2006).
Marc R. Bryant (1966)
Year of Election or Appointment: 2015
Secretary and Chief Legal Officer (CLO)
Mr. Bryant also serves as Secretary and CLO of other funds. Mr. Bryant serves as CLO, Secretary, and Senior Vice President of Fidelity Management & Research Company (investment adviser firm, 2015-present) and FMR Co., Inc. (investment adviser firm, 2015-present); Secretary of Fidelity SelectCo, LLC (investment adviser firm, 2015-present) and Fidelity Investments Money Management, Inc. (investment adviser firm, 2015-present); and CLO of Fidelity Management & Research (Hong Kong) Limited and FMR Investment Management (U.K.) Limited (investment adviser firms, 2015-present) and Fidelity Management & Research (Japan) Limited (investment adviser firm, 2016-present). He is Senior Vice President and Deputy General Counsel of FMR LLC (diversified financial services company). Previously, Mr. Bryant served as Secretary and CLO of Fidelity Rutland Square Trust II (2010-2014) and Assistant Secretary of Fidelity's Fixed Income and Asset Allocation Funds (2013-2015). Prior to joining Fidelity Investments, Mr. Bryant served as a Senior Vice President and the Head of Global Retail Legal for AllianceBernstein L.P. (2006-2010), and as the General Counsel for ProFund Advisors LLC (2001-2006).
William C. Coffey (1969)
Year of Election or Appointment: 2009
Assistant Secretary
Mr. Coffey also serves as Assistant Secretary of other funds. He is Senior Vice President and Deputy General Counsel of FMR LLC (diversified financial services company, 2010-present), and is an employee of Fidelity Investments. Previously, Mr. Coffey served as Vice President and Associate General Counsel of FMR LLC (2005-2009).
Jeffrey S. Christian (1961)
Year of Election or Appointment: 2016
Assistant Treasurer
Mr. Christian also serves as Assistant Treasurer of other funds. Mr. Christian is an employee of Fidelity Investments (2003-present).
Jonathan Davis (1968)
Year of Election or Appointment: 2010
Assistant Treasurer
Mr. Davis also serves as Assistant Treasurer of other funds, and is an employee of Fidelity Investments. Previously, Mr. Davis served as Vice President and Associate General Counsel of FMR LLC (diversified financial services company, 2003-2010).
Adrien E. Deberghes (1967)
Year of Election or Appointment: 2016
Assistant Treasurer
Mr. Deberghes also serves as an officer of other funds. He is an employee of Fidelity Investments (2008-present). Prior to joining Fidelity Investments, Mr. Deberghes was Senior Vice President of Mutual Fund Administration at State Street Corporation (2007-2008), Senior Director of Mutual Fund Administration at Investors Bank & Trust (2005-2007), and Director of Finance for Dunkin' Brands (2000-2005). Previously, Mr. Deberghes served in other fund officer roles.
Stephanie J. Dorsey (1969)
Year of Election or Appointment: 2010
Assistant Treasurer
Ms. Dorsey also serves as an officer of other funds. She is an employee of Fidelity Investments (2008-present) and has served in other fund officer roles. Prior to joining Fidelity Investments, Ms. Dorsey served as Treasurer (2004-2008) of the JPMorgan Mutual Funds and Vice President (2004-2008) of JPMorgan Chase Bank.
Howard J. Galligan III (1966)
Year of Election or Appointment: 2014
Chief Financial Officer
Mr. Galligan also serves as Chief Financial Officer of other funds. Mr. Galligan serves as President of Fidelity Pricing and Cash Management Services (FPCMS) (2014-present) and as a Director of Strategic Advisers, Inc. (investment adviser firm, 2008-present). Previously, Mr. Galligan served as Chief Administrative Officer of Asset Management (2011-2014) and Chief Operating Officer and Senior Vice President of Investment Support for Strategic Advisers, Inc. (2003-2011).
Scott C. Goebel (1968)
Year of Election or Appointment: 2015
Vice President
Mr. Goebel serves as Vice President of other funds and is an employee of Fidelity Investments (2001-present). Previously, Mr. Goebel served as Secretary of Fidelity SelectCo, LLC (investment adviser firm, 2013-2015), Fidelity Investments Money Management, Inc. (FIMM) (investment adviser firm, 2010-2015), and Fidelity Research and Analysis Company (FRAC) (investment adviser firm, 2010-2015); General Counsel, Secretary, and Senior Vice President of Fidelity Management & Research Company (investment adviser firm, 2008-2015) and FMR Co., Inc. (investment adviser firm, 2008-2015); Assistant Secretary of Fidelity Management & Research (Japan) Limited (investment adviser firm, 2008-2015) and Fidelity Management & Research (U.K.) Inc. (investment adviser firm, 2008-2015); Chief Legal Officer (CLO) of Fidelity Management & Research (Hong Kong) Limited (investment adviser firm, 2008-2015); Secretary and CLO of certain Fidelity® funds (2008-2015); Assistant Secretary of FIMM (2008-2010), FRAC (2008-2010), and certain funds (2007-2008); and as Vice President and Secretary of Fidelity Distributors Corporation (FDC) (2005-2007).
Thomas C. Hense (1964)
Year of Election or Appointment: 2008, 2010, or 2015
Vice President
Mr. Hense serves as Vice President of Fidelity Advisor® Multi-Asset Income Fund (2015) and other funds (High Income (2008), Small Cap (2008), and Value (2010) funds), and is an employee of Fidelity Investments (1993-present). Previously, Mr. Hense served as a portfolio manager for Fidelity's Institutional Money Management Group (Pyramis) (2003-2008).
Brian B. Hogan (1964)
Year of Election or Appointment: 2009
Vice President
Mr. Hogan also serves as Trustee or Vice President of other funds. Mr. Hogan serves as a Director of FMR Investment Management (U.K.) Limited (investment adviser firm, 2015-present) and Fidelity SelectCo, LLC (investment adviser firm, 2014-present) and President of the Equity Division of FMR (investment adviser firm, 2009-present). Previously, Mr. Hogan served as Senior Vice President, Equity Research of FMR (2006-2009) and as a portfolio manager. Mr. Brian B. Hogan is not related to Mr. Colm A. Hogan.
Colm A. Hogan (1973)
Year of Election or Appointment: 2016
Deputy Treasurer
Mr. Hogan also serves as an officer of other funds. Mr. Hogan is an employee of Fidelity Investments (2005-present). Mr. Colm A. Hogan is not related to Mr. Brian B. Hogan.
Chris Maher (1972)
Year of Election or Appointment: 2013
Assistant Treasurer
Mr. Maher serves as Assistant Treasurer of other funds. Mr. Maher is Vice President of Valuation Oversight and is an employee of Fidelity Investments. Previously, Mr. Maher served as Vice President of Asset Management Compliance (2013), Vice President of the Program Management Group of FMR (investment adviser firm, 2010-2013), and Vice President of Valuation Oversight (2008-2010).
John F. Papandrea (1972)
Year of Election or Appointment: 2016
Anti-Money Laundering (AML) Officer
Mr. Papandrea also serves as AML Officer of other funds. Mr. Papandrea is Vice President of FMR LLC (diversified financial services company, 2008-present) and is an employee of Fidelity Investments (2005-present).
Kenneth B. Robins (1969)
Year of Election or Appointment: 2016
Chief Compliance Officer
Mr. Robins also serves as an officer of other funds. Mr. Robins serves as Executive Vice President of Fidelity Investments Money Management, Inc. (FIMM) (investment adviser firm, 2013-present) and is an employee of Fidelity Investments (2004-present). Previously, Mr. Robins served in other fund officer roles.
Stacie M. Smith (1974)
Year of Election or Appointment: 2016
President and Treasurer
Ms. Smith also serves as an officer of other funds. She is an employee of Fidelity Investments (2009-present) and has served in other fund officer roles. Prior to joining Fidelity Investments, Ms. Smith served as Senior Audit Manager of Ernst & Young LLP (1996-2009). Previously, Ms. Smith served as Deputy Treasurer of certain Fidelity® funds (2013-2016).
Renee Stagnone (1975)
Year of Election or Appointment: 2016
Assistant Treasurer
Ms. Stagnone also serves as an officer of other funds. Ms. Stagnone is an employee of Fidelity Investments (1997-present). Previously, Ms. Stagnone served as Deputy Treasurer of certain Fidelity® funds (2013-2016).
Shareholder Expense Example
As a shareholder of the Fund, you incur two types of costs: (1) transaction costs, including redemption fees and (2) ongoing costs, including management fees and other Fund expenses. This Example is intended to help you understand your ongoing costs (in dollars) of investing in the Fund and to compare these costs with the ongoing costs of investing in other mutual funds.
The Example is based on an investment of $1,000 invested at the beginning of the period and held for the entire period (November 1, 2015 to April 30, 2016).
Actual Expenses
The first line of the accompanying table provides information about actual account values and actual expenses. You may use the information in this line, together with the amount you invested, to estimate the expenses that you paid over the period. Simply divide your account value by $1,000.00 (for example, an $8,600 account value divided by $1,000.00 = 8.6), then multiply the result by the number in the first line under the heading entitled "Expenses Paid During Period" to estimate the expenses you paid on your account during this period. A small balance maintenance fee of $12.00 that is charged once a year may apply for certain accounts with a value of less than $2,000. This fee is not included in the table below. If it was, the estimate of expenses you paid during the period would be higher, and your ending account value lower, by this amount. In addition, the Fund, as a shareholder in the underlying Fidelity Central Funds, will indirectly bear its pro-rata share of the fees and expenses incurred by the underlying Fidelity Central Funds. These fees and expenses are not included in the Fund's annualized expense ratio used to calculate the expense estimate in the table below.
Hypothetical Example for Comparison Purposes
The second line of the accompanying table provides information about hypothetical account values and hypothetical expenses based on the Fund's actual expense ratio and an assumed rate of return of 5% per year before expenses, which is not the Fund's actual return. The hypothetical account values and expenses may not be used to estimate the actual ending account balance or expenses you paid for the period. You may use this information to compare the ongoing costs of investing in the Fund and other funds. To do so, compare this 5% hypothetical example with the 5% hypothetical examples that appear in the shareholder reports of the other funds. A small balance maintenance fee of $12.00 that is charged once a year may apply for certain accounts with a value of less than $2,000. This fee is not included in the table below. If it was, the estimate of expenses you paid during the period would be higher, and your ending account value lower, by this amount. In addition, the Fund, as a shareholder in the underlying Fidelity Central Funds, will indirectly bear its pro-rata share of the fees and expenses incurred by the underlying Fidelity Central Funds. These fees and expenses are not included in the Fund's annualized expense ratio used to calculate the expense estimate in the table below.
Please note that the expenses shown in the table are meant to highlight your ongoing costs only and do not reflect any transaction costs. Therefore, the second line of the table is useful in comparing ongoing costs only, and will not help you determine the relative total costs of owning different funds. In addition, if these transactional costs were included, your costs would have been higher.
| Annualized Expense Ratio-A | Beginning Account Value November 1, 2015 | Ending Account Value April 30, 2016 | Expenses Paid During Period-B November 1, 2015 to April 30, 2016 |
|
| Actual | 1.07% | $1,000.00 | $980.10 | $5.27 |
| Hypothetical-C | $1,000.00 | $1,019.54 | $5.37 |
A Annualized expense ratio reflects expenses net of applicable fee waivers.
B Expenses are equal to the Fund's annualized expense ratio, multiplied by the average account value over the period, multiplied by 182/366 (to reflect the one-half year period).
C 5% return per year before expenses
Distributions (Unaudited)
The Board of Trustees of Fidelity Small Cap Stock Fund voted to pay on June 13, 2016, to shareholders of record at the opening of business on June 10, 2016, a distribution of $0.409 per share derived from capital gains realized from sales of portfolio securities.
The fund hereby designates as a capital gain dividend with respect to the taxable year ended April 30, 2016 $122,216,434 or, if subsequently determined to be different, the net capital gain of such year.
The fund designates 100% of the dividends distributed during the fiscal year as qualifying for the dividends–received deduction for corporate shareholders.
The fund designates 100% of the dividends distributed during the fiscal year as amounts which may be taken into account as a dividend for the purposes of the maximum rate under section 1(h)(11) of the Internal Revenue Code.
The fund will notify shareholders in January 2017 of amounts for use in preparing 2016 income tax returns.
![]()
Corporate Headquarters
245 Summer St.
Boston, MA 02210
www.fidelity.com
SLCX-ANN-0616
1.703590.118
|
Fidelity® Mid-Cap Stock Fund Class K Annual Report April 30, 2016 |
|
|
Contents
To view a fund's proxy voting guidelines and proxy voting record for the 12-month period ended June 30, visit http://www.fidelity.com/proxyvotingresults or visit the Securities and Exchange Commission's (SEC) web site at http://www.sec.gov.
You may also call 1-800-835-5092 to request a free copy of the proxy voting guidelines.
Standard & Poor's, S&P and S&P 500 are registered service marks of The McGraw-Hill Companies, Inc. and have been licensed for use by Fidelity Distributors Corporation.
Other third-party marks appearing herein are the property of their respective owners.
All other marks appearing herein are registered or unregistered trademarks or service marks of FMR LLC or an affiliated company. © 2016 FMR LLC. All rights reserved.
This report and the financial statements contained herein are submitted for the general information of the shareholders of the Fund. This report is not authorized for distribution to prospective investors in the Fund unless preceded or accompanied by an effective prospectus.
A fund files its complete schedule of portfolio holdings with the SEC for the first and third quarters of each fiscal year on Form N-Q. Forms N-Q are available on the SEC’s web site at http://www.sec.gov. A fund's Forms N-Q may be reviewed and copied at the SEC’s Public Reference Room in Washington, DC. Information regarding the operation of the SEC's Public Reference Room may be obtained by calling 1-800-SEC-0330.
For a complete list of a fund's portfolio holdings, view the most recent holdings listing, semiannual report, or annual report on Fidelity's web site at http://www.fidelity.com, http://www.advisor.fidelity.com, or http://www.401k.com, as applicable.
NOT FDIC INSURED •MAY LOSE VALUE •NO BANK GUARANTEE
Neither the Fund nor Fidelity Distributors Corporation is a bank.
Performance: The Bottom Line
Average annual total return reflects the change in the value of an investment, assuming reinvestment of distributions from dividend income and capital gains (the profits earned upon the sale of securities that have grown in value, if any) and assuming a constant rate of performance each year. The hypothetical investment and the average annual total returns do not reflect the deduction of taxes that a shareholder would pay on fund distributions or the redemption of fund shares. During periods of reimbursement by Fidelity, a fund’s total return will be greater than it would be had the reimbursement not occurred. How a fund did yesterday is no guarantee of how it will do tomorrow.
Average Annual Total Returns
| For the periods ended April 30, 2016 | Past 1 year | Past 5 years | Past 10 years |
| Class K | (3.33)% | 9.01% | 6.39% |
The initial offering of Class K shares took place on May 9, 2008. Returns prior to May 9, 2008 are those of Fidelity® Mid-Cap Stock Fund, the original class of the fund.
$10,000 Over 10 Years
Let's say hypothetically that $10,000 was invested in Fidelity® Mid-Cap Stock Fund - Class K on April 30, 2006. The chart shows how the value of your investment would have changed, and also shows how the S&P MidCap 400® Index performed over the same period. See additional information above regarding the performance of Class K.

| Period Ending Values | ||
|
| $18,583 | Fidelity® Mid-Cap Stock Fund - Class K |
|
| $21,124 | S&P MidCap 400® Index |
Management's Discussion of Fund Performance
Market Recap: The S&P 500® index gained 1.21% for the 12 months ending April 30, 2016. Largely range-bound until mid-August, U.S. stocks suffered a steep, late-summer decline on concern about an economic slowdown in China. The market recovered in October, lifted by the U.S. Federal Reserve’s decision to delay raising near-term interest rates until mid-December, as well as a rate cut in China and economic stimulus in Europe. But continued oil-price weakness and U.S.-dollar strength pushed the S&P 500® to its worst January since 2009, followed by a volatile but ultimately flattish February, then a sharp rebound in March driven by U.S. jobs gains and perceived softening in the Fed’s rate-tightening posture. April brought minimal change. For the full period, growth-oriented and larger-cap stocks fared better overall than value and smaller-cap complements. Performance was split, as five of 10 S&P 500® sectors gained ground, with a wide gap separating leaders from laggards. Investor demand for more-stable and higher-yielding investments boosted traditionally defensive, dividend-rich groups such as utilities (+14%), telecommunication services (+10%) and consumer staples (+11%) – the latter also buoyed by rising wages and low inflation. Meanwhile, energy (-14%) foundered amid commodity weakness that also hurt materials (-4%). Comments from Portfolio Manager John Roth: For the year, the fund’s share classes returned about -3%, underperforming the -0.94% return of the benchmark S&P MidCap 400® Index. Security and market selection hindered the fund’s performance versus its benchmark. Positioning in energy and financials was detrimental, as were choices in the industrials sector. Among individual names, United Rentals was the fund’s biggest relative detractor. The stock was hurt by concerns that the company's rental rates would continue to fall into 2016. In July, United Rentals lowered earnings guidance for 2015 and announced disappointing results in January, along with worse-than-anticipated 2016 financial targets. Conversely, picks in health care, consumer discretionary, materials and information technology contributed to results. An average cash position of about 7% also lifted performance in a down market. Among individual stocks, not owning solar and wind technology firm SunEdison was the biggest contributor, as the index component lost nearly all its value the past year, amid volatility in the broader energy sector and an early-period slowdown in emerging markets, where the firm had big plans to expand. The company announced Chapter 11 bankruptcy near period end.The views expressed above reflect those of the portfolio manager(s) only through the end of the period as stated on the cover of this report and do not necessarily represent the views of Fidelity or any other person in the Fidelity organization. Any such views are subject to change at any time based upon market or other conditions and Fidelity disclaims any responsibility to update such views. These views may not be relied on as investment advice and, because investment decisions for a Fidelity fund are based on numerous factors, may not be relied on as an indication of trading intent on behalf of any Fidelity fund.
Investment Summary (Unaudited)
Top Ten Stocks as of April 30, 2016
| % of fund's net assets | % of fund's net assets 6 months ago | |
| Eurofins Scientific SA | 1.8 | 1.7 |
| Boston Scientific Corp. | 1.5 | 0.8 |
| United Rentals, Inc. | 1.4 | 1.4 |
| NVR, Inc. | 1.3 | 1.2 |
| Williams Partners LP | 1.3 | 0.3 |
| Atmos Energy Corp. | 1.3 | 0.8 |
| ARAMARK Holdings Corp. | 1.3 | 1.1 |
| First American Financial Corp. | 1.2 | 1.2 |
| The Williams Companies, Inc. | 1.2 | 0.0 |
| Pool Corp. | 1.2 | 1.2 |
| 13.5 |
Top Five Market Sectors as of April 30, 2016
| % of fund's net assets | % of fund's net assets 6 months ago | |
| Financials | 18.1 | 19.7 |
| Information Technology | 16.8 | 17.1 |
| Consumer Discretionary | 13.8 | 13.1 |
| Industrials | 13.3 | 14.6 |
| Energy | 10.9 | 7.4 |
Asset Allocation (% of fund's net assets)
| As of April 30, 2016* | ||
| Stocks | 93.8% | |
| Bonds | 0.1% | |
| Short-Term Investments and Net Other Assets (Liabilities) | 6.1% | |

* Foreign investments - 10.8%
| As of October 31, 2015* | ||
| Stocks | 93.2% | |
| Short-Term Investments and Net Other Assets (Liabilities) | 6.8% | |

* Foreign investments - 9.4%
Percentages shown as 0.0% may reflect amounts less than 0.05%.
Investments April 30, 2016
Showing Percentage of Net Assets
| Common Stocks - 93.8% | |||
| Shares | Value (000s) | ||
| CONSUMER DISCRETIONARY - 13.8% | |||
| Auto Components - 0.8% | |||
| Magna International, Inc. Class A (sub. vtg.) | 582,100 | $24,449 | |
| Tenneco, Inc. (a) | 634,700 | 33,830 | |
| 58,279 | |||
| Distributors - 1.2% | |||
| Pool Corp. | 982,201 | 85,854 | |
| Hotels, Restaurants & Leisure - 3.2% | |||
| ARAMARK Holdings Corp. | 2,639,840 | 88,461 | |
| Domino's Pizza, Inc. | 361,400 | 43,686 | |
| Marriott International, Inc. Class A (b) | 526,200 | 36,881 | |
| Noodles & Co. (a)(b)(c) | 2,385,600 | 26,599 | |
| Whitbread PLC | 540,321 | 30,569 | |
| 226,196 | |||
| Household Durables - 4.7% | |||
| D.R. Horton, Inc. | 1,622,133 | 48,761 | |
| Lennar Corp. Class A | 591,600 | 26,805 | |
| NVR, Inc. (a) | 55,100 | 91,537 | |
| Tempur Sealy International, Inc. (a) | 1,071,200 | 64,990 | |
| Toll Brothers, Inc. (a) | 2,139,187 | 58,400 | |
| Tupperware Brands Corp. | 762,300 | 44,267 | |
| 334,760 | |||
| Internet & Catalog Retail - 0.1% | |||
| Etsy, Inc. | 596,900 | 5,241 | |
| Leisure Products - 0.6% | |||
| New Academy Holding Co. LLC unit (a)(d)(e) | 294,000 | 45,267 | |
| Specialty Retail - 2.2% | |||
| Citi Trends, Inc. (c) | 899,353 | 16,152 | |
| GameStop Corp. Class A (b) | 446,200 | 14,635 | |
| Ross Stores, Inc. | 689,200 | 39,133 | |
| Sally Beauty Holdings, Inc. (a) | 901,600 | 28,310 | |
| Tiffany & Co., Inc. | 517,700 | 36,938 | |
| Ulta Salon, Cosmetics & Fragrance, Inc. (a) | 85,700 | 17,850 | |
| 153,018 | |||
| Textiles, Apparel & Luxury Goods - 1.0% | |||
| Brunello Cucinelli SpA (b) | 2,094,700 | 41,135 | |
| PVH Corp. | 311,700 | 29,799 | |
| 70,934 | |||
| TOTAL CONSUMER DISCRETIONARY | 979,549 | ||
| CONSUMER STAPLES - 3.2% | |||
| Beverages - 0.7% | |||
| Constellation Brands, Inc. Class A (sub. vtg.) | 307,400 | 47,973 | |
| Food & Staples Retailing - 0.3% | |||
| Tesco PLC (a) | 9,937,200 | 24,983 | |
| Food Products - 1.9% | |||
| Amira Nature Foods Ltd. (a)(b) | 1,806,875 | 13,100 | |
| Greencore Group PLC | 2,343,100 | 12,352 | |
| Mead Johnson Nutrition Co. Class A | 801,000 | 69,807 | |
| Premium Brands Holdings Corp. | 318,200 | 13,725 | |
| The Hershey Co. | 305,400 | 28,436 | |
| 137,420 | |||
| Household Products - 0.3% | |||
| Church & Dwight Co., Inc. | 223,200 | 20,691 | |
| TOTAL CONSUMER STAPLES | 231,067 | ||
| ENERGY - 10.8% | |||
| Energy Equipment & Services - 2.2% | |||
| Ensco PLC Class A | 1,035,200 | 12,381 | |
| FMC Technologies, Inc. (a) | 683,100 | 20,828 | |
| Helmerich & Payne, Inc. (b) | 936,000 | 61,888 | |
| Oceaneering International, Inc. | 1,757,900 | 64,427 | |
| 159,524 | |||
| Oil, Gas & Consumable Fuels - 8.6% | |||
| Antero Resources Corp. (a)(b) | 1,946,800 | 55,094 | |
| Cabot Oil & Gas Corp. | 2,090,000 | 48,906 | |
| Cimarex Energy Co. | 673,900 | 73,374 | |
| Cobalt International Energy, Inc. (a) | 3,126,100 | 10,097 | |
| Denbury Resources, Inc. (b) | 4,087,500 | 15,778 | |
| Diamondback Energy, Inc. | 235,600 | 20,398 | |
| Energy Transfer Equity LP | 3,058,900 | 38,022 | |
| GasLog Ltd. (b) | 2,755,877 | 35,303 | |
| Golar LNG Ltd. (b) | 1,378,600 | 22,857 | |
| Memorial Resource Development Corp. (a) | 1,008,400 | 13,190 | |
| Range Resources Corp. (b) | 671,400 | 29,615 | |
| SM Energy Co. (b) | 1,223,200 | 38,115 | |
| Southwestern Energy Co. (a)(b) | 955,300 | 12,830 | |
| The Williams Companies, Inc. | 4,446,800 | 86,223 | |
| Whiting Petroleum Corp. (a)(b) | 1,491,258 | 17,895 | |
| Williams Partners LP | 3,023,000 | 91,385 | |
| 609,082 | |||
| TOTAL ENERGY | 768,606 | ||
| FINANCIALS - 18.1% | |||
| Banks - 6.0% | |||
| First Republic Bank | 1,205,100 | 84,743 | |
| FirstMerit Corp. | 1,875,600 | 41,563 | |
| FNB Corp., Pennsylvania | 2,723,200 | 36,001 | |
| Huntington Bancshares, Inc. | 4,397,700 | 44,241 | |
| M&T Bank Corp. | 680,600 | 80,529 | |
| Prosperity Bancshares, Inc. | 579,300 | 30,570 | |
| Regions Financial Corp. | 4,377,900 | 41,065 | |
| SunTrust Banks, Inc. | 1,145,300 | 47,805 | |
| UMB Financial Corp. | 391,100 | 21,804 | |
| 428,321 | |||
| Capital Markets - 1.2% | |||
| Franklin Resources, Inc. | 753,100 | 28,121 | |
| KKR & Co. LP | 4,079,084 | 55,476 | |
| 83,597 | |||
| Insurance - 6.2% | |||
| Arch Capital Group Ltd. (a) | 1,095,000 | 77,187 | |
| Brown & Brown, Inc. | 1,197,500 | 42,044 | |
| Fairfax Financial Holdings Ltd. (sub. vtg.) | 72,200 | 38,698 | |
| First American Financial Corp. | 2,435,800 | 87,738 | |
| FNF Group | 2,035,900 | 64,945 | |
| Jardine Lloyd Thompson Group PLC | 1,694,194 | 21,462 | |
| Progressive Corp. | 1,798,100 | 58,618 | |
| Willis Group Holdings PLC | 412,400 | 51,509 | |
| 442,201 | |||
| Real Estate Investment Trusts - 2.6% | |||
| Apartment Investment & Management Co. Class A | 924,600 | 37,039 | |
| Essex Property Trust, Inc. | 266,100 | 58,662 | |
| Parkway Properties, Inc. | 3,259,000 | 53,611 | |
| VEREIT, Inc. | 4,064,300 | 36,091 | |
| 185,403 | |||
| Real Estate Management & Development - 0.7% | |||
| CBRE Group, Inc. (a) | 602,800 | 17,861 | |
| Realogy Holdings Corp. (a) | 981,700 | 35,086 | |
| 52,947 | |||
| Thrifts & Mortgage Finance - 1.4% | |||
| MGIC Investment Corp. (a) | 5,290,309 | 38,249 | |
| Radian Group, Inc. | 4,847,144 | 61,995 | |
| 100,244 | |||
| TOTAL FINANCIALS | 1,292,713 | ||
| HEALTH CARE - 10.1% | |||
| Health Care Equipment & Supplies - 3.5% | |||
| Align Technology, Inc. (a) | 567,000 | 40,932 | |
| Boston Scientific Corp. (a) | 4,796,000 | 105,128 | |
| HeartWare International, Inc. (a) | 604,214 | 20,157 | |
| Teleflex, Inc. | 144,300 | 22,479 | |
| The Cooper Companies, Inc. | 380,665 | 58,272 | |
| 246,968 | |||
| Health Care Providers & Services - 3.6% | |||
| Air Methods Corp. (a) | 595,400 | 22,018 | |
| Amplifon SpA | 3,124,782 | 28,749 | |
| Corvel Corp. (a) | 419,200 | 18,948 | |
| HealthSouth Corp. warrants 1/17/17 (a) | 3,255 | 12 | |
| Henry Schein, Inc. (a) | 288,700 | 48,704 | |
| MEDNAX, Inc. (a) | 949,000 | 67,654 | |
| Universal Health Services, Inc. Class B | 505,500 | 67,575 | |
| 253,660 | |||
| Health Care Technology - 0.6% | |||
| HealthStream, Inc. (a) | 865,700 | 19,582 | |
| Medidata Solutions, Inc. (a) | 482,800 | 21,065 | |
| 40,647 | |||
| Life Sciences Tools & Services - 2.2% | |||
| Agilent Technologies, Inc. | 821,100 | 33,599 | |
| Eurofins Scientific SA | 341,700 | 126,788 | |
| 160,387 | |||
| Pharmaceuticals - 0.2% | |||
| Catalent, Inc. (a) | 521,150 | 15,390 | |
| TOTAL HEALTH CARE | 717,052 | ||
| INDUSTRIALS - 13.3% | |||
| Aerospace & Defense - 2.8% | |||
| KEYW Holding Corp. (a)(b)(c) | 3,519,436 | 24,249 | |
| Rockwell Collins, Inc. | 232,100 | 20,469 | |
| Space Exploration Technologies Corp. Class A (a)(e) | 96,222 | 9,278 | |
| Teledyne Technologies, Inc. (a) | 482,700 | 44,867 | |
| Textron, Inc. | 1,421,800 | 54,995 | |
| TransDigm Group, Inc. (a) | 190,100 | 43,318 | |
| 197,176 | |||
| Air Freight & Logistics - 1.2% | |||
| C.H. Robinson Worldwide, Inc. | 502,200 | 35,641 | |
| Hub Group, Inc. Class A (a) | 467,100 | 17,993 | |
| PostNL NV (a) | 7,196,400 | 31,478 | |
| 85,112 | |||
| Commercial Services & Supplies - 0.7% | |||
| KAR Auction Services, Inc. | 724,200 | 27,230 | |
| U.S. Ecology, Inc. | 463,981 | 20,893 | |
| 48,123 | |||
| Construction & Engineering - 0.3% | |||
| Jacobs Engineering Group, Inc. (a) | 525,500 | 23,427 | |
| Electrical Equipment - 2.6% | |||
| AMETEK, Inc. | 1,205,692 | 57,982 | |
| Generac Holdings, Inc. (a) | 828,500 | 31,582 | |
| Hubbell, Inc. Class B | 434,300 | 45,932 | |
| Regal Beloit Corp. | 386,200 | 24,879 | |
| Rockwell Automation, Inc. | 215,400 | 24,441 | |
| 184,816 | |||
| Machinery - 1.1% | |||
| Donaldson Co., Inc. | 1,216,700 | 39,762 | |
| Rational AG | 77,000 | 39,090 | |
| 78,852 | |||
| Road & Rail - 3.0% | |||
| Genesee & Wyoming, Inc. Class A (a) | 1,180,700 | 76,875 | |
| J.B. Hunt Transport Services, Inc. | 876,900 | 72,677 | |
| Kansas City Southern | 718,700 | 68,097 | |
| 217,649 | |||
| Trading Companies & Distributors - 1.6% | |||
| Rush Enterprises, Inc. Class A (a) | 748,400 | 14,736 | |
| United Rentals, Inc. (a) | 1,444,273 | 96,665 | |
| 111,401 | |||
| TOTAL INDUSTRIALS | 946,556 | ||
| INFORMATION TECHNOLOGY - 16.8% | |||
| Communications Equipment - 1.0% | |||
| Brocade Communications Systems, Inc. | 4,650,100 | 44,687 | |
| Juniper Networks, Inc. | 1,287,100 | 30,118 | |
| 74,805 | |||
| Electronic Equipment & Components - 3.9% | |||
| Amphenol Corp. Class A | 1,453,400 | 81,143 | |
| Arrow Electronics, Inc. (a) | 1,346,600 | 83,624 | |
| CDW Corp. | 701,100 | 26,992 | |
| Fabrinet (a) | 1,132,031 | 36,191 | |
| IPG Photonics Corp. (a) | 340,900 | 29,546 | |
| Keysight Technologies, Inc. (a) | 681,700 | 17,779 | |
| 275,275 | |||
| Internet Software & Services - 1.7% | |||
| Akamai Technologies, Inc. (a) | 842,300 | 42,949 | |
| Endurance International Group Holdings, Inc. (a)(b) | 2,375,600 | 25,443 | |
| GoDaddy, Inc. (a)(b) | 1,143,000 | 34,713 | |
| Rightmove PLC | 311,900 | 17,582 | |
| 120,687 | |||
| IT Services - 5.8% | |||
| Alliance Data Systems Corp. (a) | 163,500 | 33,241 | |
| Fidelity National Information Services, Inc. | 835,886 | 55,001 | |
| First Data Corp. (f) | 2,497,973 | 28,452 | |
| First Data Corp. Class A (a) | 4,427,400 | 50,428 | |
| Fiserv, Inc. (a) | 541,900 | 52,954 | |
| FleetCor Technologies, Inc. (a) | 255,600 | 39,536 | |
| Gartner, Inc. Class A (a) | 593,900 | 51,770 | |
| Total System Services, Inc. | 632,300 | 32,336 | |
| WNS Holdings Ltd. sponsored ADR (a) | 2,124,300 | 67,319 | |
| 411,037 | |||
| Semiconductors & Semiconductor Equipment - 1.3% | |||
| Analog Devices, Inc. | 330,200 | 18,597 | |
| Lam Research Corp. | 288,600 | 22,049 | |
| Maxim Integrated Products, Inc. | 766,400 | 27,376 | |
| Silicon Laboratories, Inc. (a) | 535,494 | 25,061 | |
| 93,083 | |||
| Software - 3.1% | |||
| ANSYS, Inc. (a) | 725,200 | 65,826 | |
| Aspen Technology, Inc. (a) | 961,500 | 36,566 | |
| Citrix Systems, Inc. (a) | 756,400 | 61,904 | |
| Nuance Communications, Inc. (a) | 1,684,300 | 28,936 | |
| Red Hat, Inc. (a) | 376,200 | 27,602 | |
| 220,834 | |||
| TOTAL INFORMATION TECHNOLOGY | 1,195,721 | ||
| MATERIALS - 2.8% | |||
| Chemicals - 0.9% | |||
| Albemarle Corp. U.S. | 997,500 | 65,995 | |
| Containers & Packaging - 0.7% | |||
| WestRock Co. | 1,172,200 | 49,057 | |
| Metals & Mining - 1.2% | |||
| Franco-Nevada Corp. | 347,100 | 24,372 | |
| Freeport-McMoRan, Inc. (b) | 1,617,100 | 22,639 | |
| Novagold Resources, Inc. (a)(b) | 5,185,776 | 33,685 | |
| 80,696 | |||
| TOTAL MATERIALS | 195,748 | ||
| TELECOMMUNICATION SERVICES - 0.0% | |||
| Diversified Telecommunication Services - 0.0% | |||
| Iridium Communications, Inc. (a) | 132,200 | 1,067 | |
| UTILITIES - 4.9% | |||
| Electric Utilities - 2.2% | |||
| IDACORP, Inc. | 961,033 | 69,896 | |
| OGE Energy Corp. | 2,200,300 | 65,107 | |
| Xcel Energy, Inc. | 529,200 | 21,184 | |
| 156,187 | |||
| Gas Utilities - 1.6% | |||
| Atmos Energy Corp. | 1,230,697 | 89,287 | |
| Spire, Inc. | 337,400 | 21,580 | |
| 110,867 | |||
| Multi-Utilities - 1.1% | |||
| Alliant Energy Corp. | 1,163,500 | 82,050 | |
| TOTAL UTILITIES | 349,104 | ||
| TOTAL COMMON STOCKS | |||
| (Cost $5,501,938) | 6,677,183 | ||
| Principal Amount (000s) | Value (000s) | ||
| Nonconvertible Bonds - 0.1% | |||
| ENERGY - 0.1% | |||
| Energy Equipment & Services - 0.1% | |||
| Pacific Drilling SA 5.375% 6/1/20 (Cost $15,134)(f) | 26,460 | 8,017 | |
| Shares | |||
| Money Market Funds - 10.1% | |||
| Fidelity Cash Central Fund, 0.38% (g) | 442,991,344 | 442,991 | |
| Fidelity Securities Lending Cash Central Fund, 0.42% (g)(h) | 277,830,074 | 277,830 | |
| TOTAL MONEY MARKET FUNDS | |||
| (Cost $720,821) | 720,821 | ||
| TOTAL INVESTMENT PORTFOLIO - 104.0% | |||
| (Cost $6,237,893) | 7,406,021 | ||
| NET OTHER ASSETS (LIABILITIES) - (4.0)% | (282,074) | ||
| NET ASSETS - 100% | $7,123,947 |
Legend
(a) Non-income producing
(b) Security or a portion of the security is on loan at period end.
(c) Affiliated company
(d) Investment is owned by an entity that is treated as a U.S. Corporation for tax purposes in which the Fund holds a percentage ownership.
(e) Restricted securities - Investment in securities not registered under the Securities Act of 1933 (excluding 144A issues). At the end of the period, the value of restricted securities (excluding 144A issues) amounted to $54,545,000 or 0.8% of net assets.
(f) Security exempt from registration under Rule 144A of the Securities Act of 1933. These securities may be resold in transactions exempt from registration, normally to qualified institutional buyers. At the end of the period, the value of these securities amounted to $36,469,000 or 0.5% of net assets.
(g) Affiliated fund that is generally available only to investment companies and other accounts managed by Fidelity Investments. The rate quoted is the annualized seven-day yield of the fund at period end. A complete unaudited listing of the fund's holdings as of its most recent quarter end is available upon request. In addition, each Fidelity Central Fund's financial statements, which are not covered by the Fund's Report of Independent Registered Public Accounting Firm, are available on the SEC's website or upon request.
(h) Investment made with cash collateral received from securities on loan.
Additional information on each restricted holding is as follows:
| Security | Acquisition Date | Acquisition Cost (000s) |
| New Academy Holding Co. LLC unit | 8/1/11 | $30,988 |
| Space Exploration Technologies Corp. Class A | 4/8/16 | $9,278 |
Affiliated Central Funds
Information regarding fiscal year to date income earned by the Fund from investments in Fidelity Central Funds is as follows:
| Fund | Income earned |
| (Amounts in thousands) | |
| Fidelity Cash Central Fund | $1,201 |
| Fidelity Securities Lending Cash Central Fund | 6,672 |
| Total | $7,873 |
Other Affiliated Issuers
An affiliated company is a company in which the Fund has ownership of at least 5% of the voting securities. Fiscal year to date transactions with companies which are or were affiliates are as follows:
| Affiliate (Amounts in thousands) | Value, beginning of period | Purchases | Sales Proceeds* | Dividend Income | Value, end of period |
| Citi Trends, Inc. | $13,099 | $6,798 | $446 | $126 | $16,152 |
| KEYW Holding Corp. | 35,246 | -- | 951 | -- | 24,249 |
| Noodles & Co. | 19,353 | 23,182 | 1,633 | -- | 26,599 |
| Total | $67,698 | $29,980 | $3,030 | $126 | $67,000 |
* Includes the value of securities delivered through in-kind transactions, if applicable.
Investment Valuation
The following is a summary of the inputs used, as of April 30, 2016, involving the Fund's assets and liabilities carried at fair value. The inputs or methodology used for valuing securities may not be an indication of the risk associated with investing in those securities. For more information on valuation inputs, and their aggregation into the levels used below, please refer to the Investment Valuation section in the accompanying Notes to Financial Statements.
| Valuation Inputs at Reporting Date: | ||||
| Description | Total | Level 1 | Level 2 | Level 3 |
| (Amounts in thousands) | ||||
| Investments in Securities: | ||||
| Equities: | ||||
| Consumer Discretionary | $979,549 | $934,282 | $-- | $45,267 |
| Consumer Staples | 231,067 | 206,084 | 24,983 | -- |
| Energy | 768,606 | 768,606 | -- | -- |
| Financials | 1,292,713 | 1,292,713 | -- | -- |
| Health Care | 717,052 | 717,052 | -- | -- |
| Industrials | 946,556 | 937,278 | -- | 9,278 |
| Information Technology | 1,195,721 | 1,195,721 | -- | -- |
| Materials | 195,748 | 195,748 | -- | -- |
| Telecommunication Services | 1,067 | 1,067 | -- | -- |
| Utilities | 349,104 | 349,104 | -- | -- |
| Corporate Bonds | 8,017 | -- | 8,017 | -- |
| Money Market Funds | 720,821 | 720,821 | -- | -- |
| Total Investments in Securities: | $7,406,021 | $7,318,476 | $33,000 | $54,545 |
The following is a summary of transfers between Level 1 and Level 2 for the period ended April 30, 2016. Transfers are assumed to have occurred at the beginning of the period, and are primarily attributable to the valuation techniques used for foreign equity securities, as discussed in the accompanying Notes to Financial Statements:
| Transfers | Total (000s) |
| Level 1 to Level 2 | $0 |
| Level 2 to Level 1 | $233,430 |
The following is a reconciliation of Investments in Securities for which Level 3 inputs were used in determining value:
| (Amounts in thousands) | |
| Investments in Securities: | |
| Beginning Balance | $103,112 |
| Net Realized Gain (Loss) on Investment Securities | 13,135 |
| Net Unrealized Gain (Loss) on Investment Securities | (13,642) |
| Cost of Purchases | 9,278 |
| Proceeds of Sales | (57,338) |
| Amortization/Accretion | -- |
| Transfers into Level 3 | -- |
| Transfers out of Level 3 | -- |
| Ending Balance | $54,545 |
| The change in unrealized gain (loss) for the period attributable to Level 3 securities held at April 30, 2016 | $(9,361) |
The information used in the above reconciliation represents fiscal year to date activity for any Investments in Securities identified as using Level 3 inputs at either the beginning or the end of the current fiscal period. Transfers in or out of Level 3 represent the beginning value of any Security or Instrument where a change in the pricing level occurred from the beginning to the end of the period. The cost of purchases and the proceeds of sales may include securities received or delivered through corporate actions or exchanges. Realized and unrealized gains (losses) disclosed in the reconciliation are included in Net Gain (Loss) on the Fund's Statement of Operations.
Other Information
Distribution of investments by country or territory of incorporation, as a percentage of Total Net Assets, is as follows (Unaudited):
| United States of America | 89.2% |
| Canada | 2.0% |
| Bermuda | 1.9% |
| Luxembourg | 1.9% |
| United Kingdom | 1.4% |
| Italy | 1.0% |
| Others (Individually Less Than 1%) | 2.6% |
| 100.0% |
See accompanying notes which are an integral part of the financial statements.
Financial Statements
Statement of Assets and Liabilities
| Amounts in thousands (except per-share amounts) | April 30, 2016 | |
| Assets | ||
| Investment in securities, at value (including securities loaned of $271,110) — See accompanying schedule: Unaffiliated issuers (cost $5,408,172) | $6,618,200 | |
| Fidelity Central Funds (cost $720,821) | 720,821 | |
| Other affiliated issuers (cost $108,900) | 67,000 | |
| Total Investments (cost $6,237,893) | $7,406,021 | |
| Cash | 1,668 | |
| Receivable for investments sold | 39,554 | |
| Receivable for fund shares sold | 4,280 | |
| Dividends receivable | 1,482 | |
| Interest receivable | 593 | |
| Distributions receivable from Fidelity Central Funds | 482 | |
| Prepaid expenses | 7 | |
| Other receivables | 390 | |
| Total assets | 7,454,477 | |
| Liabilities | ||
| Payable for investments purchased | $35,257 | |
| Payable for fund shares redeemed | 13,056 | |
| Accrued management fee | 3,076 | |
| Other affiliated payables | 880 | |
| Other payables and accrued expenses | 431 | |
| Collateral on securities loaned, at value | 277,830 | |
| Total liabilities | 330,530 | |
| Net Assets | $7,123,947 | |
| Net Assets consist of: | ||
| Paid in capital | $5,581,061 | |
| Undistributed net investment income | 17,650 | |
| Accumulated undistributed net realized gain (loss) on investments and foreign currency transactions | 357,099 | |
| Net unrealized appreciation (depreciation) on investments and assets and liabilities in foreign currencies | 1,168,137 | |
| Net Assets | $7,123,947 | |
| Mid-Cap Stock: | ||
| Net Asset Value, offering price and redemption price per share ($5,135,762 ÷ 150,744 shares) | $34.07 | |
| Class K: | ||
| Net Asset Value, offering price and redemption price per share ($1,988,185 ÷ 58,331 shares) | $34.08 |
See accompanying notes which are an integral part of the financial statements.
Statement of Operations
| Amounts in thousands | Year ended April 30, 2016 | |
| Investment Income | ||
| Dividends (including $126 earned from other affiliated issuers) | $88,671 | |
| Interest | 1,473 | |
| Income from Fidelity Central Funds (including $6,672 from security lending) | 7,873 | |
| Total income | 98,017 | |
| Expenses | ||
| Management fee | ||
| Basic fee | $41,089 | |
| Performance adjustment | (1,100) | |
| Transfer agent fees | 9,926 | |
| Accounting and security lending fees | 1,228 | |
| Custodian fees and expenses | 116 | |
| Independent trustees' compensation | 35 | |
| Registration fees | 87 | |
| Audit | 80 | |
| Legal | 30 | |
| Miscellaneous | 55 | |
| Total expenses before reductions | 51,546 | |
| Expense reductions | (362) | 51,184 |
| Net investment income (loss) | 46,833 | |
| Realized and Unrealized Gain (Loss) | ||
| Net realized gain (loss) on: | ||
| Investment securities: | ||
| Unaffiliated issuers | 858,957 | |
| Other affiliated issuers | (1,393) | |
| Foreign currency transactions | (118) | |
| Total net realized gain (loss) | 857,446 | |
| Change in net unrealized appreciation (depreciation) on: Investment securities | (1,201,760) | |
| Assets and liabilities in foreign currencies | 3 | |
| Total change in net unrealized appreciation (depreciation) | (1,201,757) | |
| Net gain (loss) | (344,311) | |
| Net increase (decrease) in net assets resulting from operations | $(297,478) |
See accompanying notes which are an integral part of the financial statements.
Statement of Changes in Net Assets
| Amounts in thousands | Year ended April 30, 2016 | Year ended April 30, 2015 |
| Increase (Decrease) in Net Assets | ||
| Operations | ||
| Net investment income (loss) | $46,833 | $45,281 |
| Net realized gain (loss) | 857,446 | 880,850 |
| Change in net unrealized appreciation (depreciation) | (1,201,757) | (78,888) |
| Net increase (decrease) in net assets resulting from operations | (297,478) | 847,243 |
| Distributions to shareholders from net investment income | (48,569) | (24,651) |
| Distributions to shareholders from net realized gain | (930,371) | (854,512) |
| Total distributions | (978,940) | (879,163) |
| Share transactions - net increase (decrease) | (61,224) | (398,954) |
| Redemption fees | 35 | 117 |
| Total increase (decrease) in net assets | (1,337,607) | (430,757) |
| Net Assets | ||
| Beginning of period | 8,461,554 | 8,892,311 |
| End of period (including undistributed net investment income of $17,650 and undistributed net investment income of $12,057, respectively) | $7,123,947 | $8,461,554 |
See accompanying notes which are an integral part of the financial statements.
Financial Highlights — Fidelity Mid-Cap Stock Fund
| Years ended April 30, | 2016 | 2015 | 2014 | 2013 | 2012 |
| Selected Per–Share Data | |||||
| Net asset value, beginning of period | $40.11 | $40.26 | $33.69 | $30.15 | $31.78 |
| Income from Investment Operations | |||||
| Net investment income (loss)A | .21 | .18 | .10 | .29 | .10 |
| Net realized and unrealized gain (loss) | (1.54) | 3.52 | 7.69 | 4.45 | (.18) |
| Total from investment operations | (1.33) | 3.70 | 7.79 | 4.74 | (.08) |
| Distributions from net investment income | (.22) | (.09) | (.08) | (.33) | (.05) |
| Distributions from net realized gain | (4.49) | (3.76) | (1.14) | (.87) | (1.50) |
| Total distributions | (4.71) | (3.85) | (1.22) | (1.20) | (1.55) |
| Redemption fees added to paid in capitalA,B | – | – | – | – | – |
| Net asset value, end of period | $34.07 | $40.11 | $40.26 | $33.69 | $30.15 |
| Total ReturnC | (3.44)% | 9.83% | 23.50% | 16.54% | .19% |
| Ratios to Average Net AssetsD,E | |||||
| Expenses before reductions | .72% | .73% | .78% | .65% | .86% |
| Expenses net of fee waivers, if any | .72% | .72% | .78% | .65% | .86% |
| Expenses net of all reductions | .72% | .72% | .78% | .63% | .85% |
| Net investment income (loss) | .59% | .46% | .25% | .95% | .36% |
| Supplemental Data | |||||
| Net assets, end of period (in millions) | $5,136 | $5,874 | $5,966 | $4,750 | $5,170 |
| Portfolio turnover rateF | 23%G | 29% | 27% | 46% | 52% |
A Calculated based on average shares outstanding during the period.
B Amount represents less than $.005 per share.
C Total returns would have been lower if certain expenses had not been reduced during the applicable periods shown.
D Fees and expenses of any underlying Fidelity Central Funds are not included in the Fund's expense ratio. The Fund indirectly bears its proportionate share of the expenses of any underlying Fidelity Central Funds.
E Expense ratios reflect operating expenses of the class. Expenses before reductions do not reflect amounts reimbursed by the investment adviser or reductions from brokerage service arrangements or reductions from other expense offset arrangements and do not represent the amount paid by the class during periods when reimbursements or reductions occur. Expenses net of fee waivers reflect expenses after reimbursement by the investment adviser but prior to reductions from brokerage service arrangements or other expense offset arrangements. Expenses net of all reductions represent the net expenses paid by the class.
F Amount does not include the portfolio activity of any underlying Fidelity Central Funds.
G Portfolio turnover rate excludes securities received or delivered in-kind.
See accompanying notes which are an integral part of the financial statements.
Financial Highlights — Fidelity Mid-Cap Stock Fund Class K
| Years ended April 30, | 2016 | 2015 | 2014 | 2013 | 2012 |
| Selected Per–Share Data | |||||
| Net asset value, beginning of period | $40.12 | $40.27 | $33.68 | $30.15 | $31.77 |
| Income from Investment Operations | |||||
| Net investment income (loss)A | .25 | .22 | .15 | .33 | .15 |
| Net realized and unrealized gain (loss) | (1.54) | 3.51 | 7.69 | 4.45 | (.19) |
| Total from investment operations | (1.29) | 3.73 | 7.84 | 4.78 | (.04) |
| Distributions from net investment income | (.26) | (.13) | (.12) | (.38) | (.08) |
| Distributions from net realized gain | (4.49) | (3.76) | (1.14) | (.87) | (1.50) |
| Total distributions | (4.75) | (3.88)B | (1.25)C | (1.25) | (1.58) |
| Redemption fees added to paid in capitalA,D | – | – | – | – | – |
| Net asset value, end of period | $34.08 | $40.12 | $40.27 | $33.68 | $30.15 |
| Total ReturnE | (3.33)% | 9.92% | 23.67% | 16.72% | .35% |
| Ratios to Average Net AssetsF,G | |||||
| Expenses before reductions | .60% | .61% | .65% | .50% | .69% |
| Expenses net of fee waivers, if any | .60% | .61% | .65% | .50% | .69% |
| Expenses net of all reductions | .60% | .61% | .65% | .48% | .68% |
| Net investment income (loss) | .71% | .57% | .39% | 1.11% | .52% |
| Supplemental Data | |||||
| Net assets, end of period (in millions) | $1,988 | $2,588 | $2,927 | $2,447 | $1,643 |
| Portfolio turnover rateH | 23%I | 29% | 27% | 46% | 52% |
A Calculated based on average shares outstanding during the period.
B Total distributions of $3.88 per share is comprised of distributions from net investment income of $.127 and distributions from net realized gain of $3.757 per share.
C Total distributions of $1.25 per share is comprised of distributions from net investment income of $.116 and distributions from net realized gain of $1.136 per share.
D Amount represents less than $.005 per share.
E Total returns would have been lower if certain expenses had not been reduced during the applicable periods shown.
F Fees and expenses of any underlying Fidelity Central Funds are not included in the Fund's expense ratio. The Fund indirectly bears its proportionate share of the expenses of any underlying Fidelity Central Funds.
G Expense ratios reflect operating expenses of the class. Expenses before reductions do not reflect amounts reimbursed by the investment adviser or reductions from brokerage service arrangements or reductions from other expense offset arrangements and do not represent the amount paid by the class during periods when reimbursements or reductions occur. Expenses net of fee waivers reflect expenses after reimbursement by the investment adviser but prior to reductions from brokerage service arrangements or other expense offset arrangements. Expenses net of all reductions represent the net expenses paid by the class.
H Amount does not include the portfolio activity of any underlying Fidelity Central Funds.
I Portfolio turnover rate excludes securities received or delivered in-kind.
See accompanying notes which are an integral part of the financial statements.
Notes to Financial Statements
For the period ended April 30, 2016
(Amounts in thousands except percentages)
1. Organization.
Fidelity Mid-Cap Stock Fund (the Fund) is a fund of Fidelity Commonwealth Trust (the Trust) and is authorized to issue an unlimited number of shares. The Trust is registered under the Investment Company Act of 1940, as amended (the 1940 Act), as an open-end management investment company organized as a Massachusetts business trust. The Fund offers Mid-Cap Stock and Class K shares, each of which has equal rights as to assets and voting privileges.
2. Investments in Fidelity Central Funds.
The Fund invests in Fidelity Central Funds, which are open-end investment companies generally available only to other investment companies and accounts managed by the investment adviser and its affiliates. The Fund's Schedule of Investments lists each of the Fidelity Central Funds held as of period end, if any, as an investment of the Fund, but does not include the underlying holdings of each Fidelity Central Fund. As an Investing Fund, the Fund indirectly bears its proportionate share of the expenses of the underlying Fidelity Central Funds.
The Money Market Central Funds seek preservation of capital and current income and are managed by Fidelity Investments Money Management, Inc. (FIMM), an affiliate of the investment adviser. Annualized expenses of the Money Market Central Funds as of their most recent shareholder report date are less than .005%.
A complete unaudited list of holdings for each Fidelity Central Fund is available upon request or at the Securities and Exchange Commission (the SEC) website at www.sec.gov. In addition, the financial statements of the Fidelity Central Funds, which are not covered by the Fund's Report of Independent Registered Public Accounting Firm, are available on the SEC website or upon request.
3. Significant Accounting Policies.
The financial statements have been prepared in conformity with accounting principles generally accepted in the United States of America (GAAP), which require management to make certain estimates and assumptions at the date of the financial statements. Actual results could differ from those estimates. Subsequent events, if any, through the date that the financial statements were issued have been evaluated in the preparation of the financial statements. The following summarizes the significant accounting policies of the Fund:
Investment Valuation. Investments are valued as of 4:00 p.m. Eastern time on the last calendar day of the period. The Board of Trustees (the Board) has delegated the day to day responsibility for the valuation of the Fund's investments to the Fidelity Management & Research Company (FMR) Fair Value Committee (the Committee). In accordance with valuation policies and procedures approved by the Board, the Fund attempts to obtain prices from one or more third party pricing vendors or brokers to value its investments. When current market prices, quotations or currency exchange rates are not readily available or reliable, investments will be fair valued in good faith by the Committee, in accordance with procedures adopted by the Board. Factors used in determining fair value vary by investment type and may include market or investment specific events, changes in interest rates and credit quality. The frequency with which these procedures are used cannot be predicted and they may be utilized to a significant extent. The Committee oversees the Fund's valuation policies and procedures and reports to the Board on the Committee's activities and fair value determinations. The Board monitors the appropriateness of the procedures used in valuing the Fund's investments and ratifies the fair value determinations of the Committee.
The Fund categorizes the inputs to valuation techniques used to value its investments into a disclosure hierarchy consisting of three levels as shown below:
- Level 1 – quoted prices in active markets for identical investments
- Level 2 – other significant observable inputs (including quoted prices for similar investments, interest rates, prepayment speeds, etc.)
- Level 3 – unobservable inputs (including the Fund's own assumptions based on the best information available)
Valuation techniques used to value the Fund's investments by major category are as follows:
Equity securities, including restricted securities, for which market quotations are readily available, are valued at the last reported sale price or official closing price as reported by a third party pricing vendor on the primary market or exchange on which they are traded and are categorized as Level 1 in the hierarchy. In the event there were no sales during the day or closing prices are not available, securities are valued at the last quoted bid price or may be valued using the last available price and are generally categorized as Level 2 in the hierarchy. For foreign equity securities, when market or security specific events arise, comparisons to the valuation of American Depositary Receipts (ADRs), futures contracts, Exchange-Traded Funds (ETFs) and certain indexes as well as quoted prices for similar securities may be used and would be categorized as Level 2 in the hierarchy. Utilizing these techniques may result in transfers between Level 1 and Level 2. For equity securities, including restricted securities, where observable inputs are limited, assumptions about market activity and risk are used and these securities may be categorized as Level 3 in the hierarchy.
Debt securities, including restricted securities, are valued based on evaluated prices received from third party pricing vendors or from brokers who make markets in such securities. Corporate bonds are valued by pricing vendors who utilize matrix pricing which considers yield or price of bonds of comparable quality, coupon, maturity and type or by broker-supplied prices. When independent prices are unavailable or unreliable, debt securities may be valued utilizing pricing methodologies which consider similar factors that would be used by third party pricing vendors. Debt securities are generally categorized as Level 2 in the hierarchy but may be Level 3 depending on the circumstances.
Investments in open-end mutual funds, including the Fidelity Central Funds, are valued at their closing net asset value (NAV) each business day and are categorized as Level 1 in the hierarchy.
Changes in valuation techniques may result in transfers in or out of an assigned level within the disclosure hierarchy. The aggregate value of investments by input level as of April 30, 2016, including information on transfers between Levels 1 and 2, as well as a roll forward of Level 3 investments, is included at the end of the Fund's Schedule of Investments.
Foreign Currency. The Fund may use foreign currency contracts to facilitate transactions in foreign-denominated securities. Gains and losses from these transactions may arise from changes in the value of the foreign currency or if the counterparties do not perform under the contracts' terms.
Foreign-denominated assets, including investment securities, and liabilities are translated into U.S. dollars at the exchange rates at period end. Purchases and sales of investment securities, income and dividends received and expenses denominated in foreign currencies are translated into U.S. dollars at the exchange rate in effect on the transaction date.
The effects of exchange rate fluctuations on investments are included with the net realized and unrealized gain (loss) on investment securities. Other foreign currency transactions resulting in realized and unrealized gain (loss) are disclosed separately.
Investment Transactions and Income. For financial reporting purposes, the Fund's investment holdings and NAV include trades executed through the end of the last business day of the period. The NAV per share for processing shareholder transactions is calculated as of the close of business of the New York Stock Exchange (NYSE), normally 4:00 p.m. Eastern time and includes trades executed through the end of the prior business day. Gains and losses on securities sold are determined on the basis of identified cost and may include proceeds received from litigation. Dividend income is recorded on the ex-dividend date, except for certain dividends from foreign securities where the ex-dividend date may have passed, which are recorded as soon as the Fund is informed of the ex-dividend date. Non-cash dividends included in dividend income, if any, are recorded at the fair market value of the securities received. Income and capital gain distributions from Fidelity Central Funds, if any, are recorded on the ex-dividend date. Distributions received on securities that represent a return of capital or capital gain are recorded as a reduction of cost of investments and/or as a realized gain. Subsequent to ex-dividend date the Fund determines the components of these distributions, based upon receipt of tax filings or other correspondence relating to the underlying investment. Interest income is accrued as earned and includes coupon interest and amortization of premium and accretion of discount on debt securities as applicable. Investment income is recorded net of foreign taxes withheld where recovery of such taxes is uncertain.
Class Allocations and Expenses. Investment income, realized and unrealized capital gains and losses, common expenses of the Fund, and certain fund-level expense reductions, if any, are allocated daily on a pro-rata basis to each class based on the relative net assets of each class to the total net assets of the Fund. Each class differs with respect to transfer agent fees incurred. Certain expense reductions may also differ by class. For the reporting period, the allocated portion of income and expenses to each class as a percent of its average net assets may vary due to the timing of recording these transactions in relation to fluctuating net assets of the classes. Expenses directly attributable to a fund are charged to that fund. Expenses attributable to more than one fund are allocated among the respective funds on the basis of relative net assets or other appropriate methods. Expense estimates are accrued in the period to which they relate and adjustments are made when actual amounts are known.
Deferred Trustee Compensation. Under a Deferred Compensation Plan (the Plan), independent Trustees may elect to defer receipt of a portion of their annual compensation. Deferred amounts are invested in a cross-section of Fidelity funds, are marked-to-market and remain in the Fund until distributed in accordance with the Plan. The investment of deferred amounts and the offsetting payable to the Trustees are included in the accompanying Statement of Assets and Liabilities.
Income Tax Information and Distributions to Shareholders. Each year, the Fund intends to qualify as a regulated investment company under Subchapter M of the Internal Revenue Code, including distributing substantially all of its taxable income and realized gains. As a result, no provision for U.S. Federal income taxes is required. As of April 30, 2016, the Fund did not have any unrecognized tax benefits in the financial statements; nor is the Fund aware of any tax positions for which it is reasonably possible that the total amounts of unrecognized tax benefits will significantly change in the next twelve months. The Fund files a U.S. federal tax return, in addition to state and local tax returns as required. The Fund's federal income tax returns are subject to examination by the Internal Revenue Service (IRS) for a period of three fiscal years after they are filed. State and local tax returns may be subject to examination for an additional fiscal year depending on the jurisdiction. Foreign taxes are provided for based on the Fund's understanding of the tax rules and rates that exist in the foreign markets in which it invests.
Distributions are declared and recorded on the ex-dividend date. Income dividends and capital gain distributions are declared separately for each class. Income and capital gain distributions are determined in accordance with income tax regulations, which may differ from GAAP. In addition, the Fund claimed a portion of the payment made to redeeming shareholders as a distribution for income tax purposes.
Capital accounts within the financial statements are adjusted for permanent book-tax differences. These adjustments have no impact on net assets or the results of operations. Capital accounts are not adjusted for temporary book-tax differences which will reverse in a subsequent period.
Book-tax differences are primarily due to foreign currency transactions, partnerships, passive foreign investment companies (PFIC), market discount, redemptions in kind, deferred trustees compensation and losses deferred due to wash sales and excise tax regulations.
The federal tax cost of investment securities and unrealized appreciation (depreciation) as of period end were as follows:
| Gross unrealized appreciation | $1,665,992 |
| Gross unrealized depreciation | (506,826) |
| Net unrealized appreciation (depreciation) on securities | $1,159,166 |
| Tax Cost | $6,246,855 |
The tax-based components of distributable earnings as of period end were as follows:
| Undistributed ordinary income | $17,232 |
| Undistributed long-term capital gain | $366,849 |
| Net unrealized appreciation (depreciation) on securities and other investments | $1,159,175 |
The tax character of distributions paid was as follows:
| April 30, 2016 | April 30, 2015 | |
| Ordinary Income | $48,569 | $ 132,304 |
| Long-term Capital Gains | 930,371 | 746,859 |
| Total | $978,940 | $ 879,163 |
Short-Term Trading (Redemption) Fees. Shares held by investors in the Fund less than 30 days may have been subject to a redemption fee equal to .75% of the NAV of shares redeemed. All redemption fees, which reduce the proceeds of the shareholder redemption, are retained by the Fund and accounted for as an addition to paid in capital.
Restricted Securities. The Fund may invest in securities that are subject to legal or contractual restrictions on resale. These securities generally may be resold in transactions exempt from registration or to the public if the securities are registered. Disposal of these securities may involve time-consuming negotiations and expense, and prompt sale at an acceptable price may be difficult. Information regarding restricted securities is included at the end of the Fund's Schedule of Investments.
4. Purchases and Sales of Investments.
Purchases and sales of securities, other than short-term securities and in-kind transactions, aggregated $1,654,108 and $2,379,163, respectively.
Redemptions In-Kind. During the period, 7,169 shares of the Fund held by unaffiliated entities were redeemed in-kind for cash and investments, including accrued interest, with a value of $265,315. The net realized gain of $85,469 on investments delivered through in-kind redemptions is included in the accompanying Statement of Operations. The amount of in-kind redemptions is included in share transactions in the accompanying Statement of Changes in Net Assets as well as Note 10: Share Transactions. The Fund recognized no gain or loss for federal income tax purposes.
5. Fees and Other Transactions with Affiliates.
Management Fee. Fidelity Management & Research Company (the investment adviser) and its affiliates provide the Fund with investment management related services for which the Fund pays a monthly management fee. The management fee is the sum of an individual fund fee rate that is based on an annual rate of .30% of the Fund's average net assets and an annualized group fee rate that averaged .25% during the period. The group fee rate is based upon the average net assets of all the mutual funds advised by the investment adviser, including any mutual funds previously advised by the investment adviser that are currently advised by Fidelity SelectCo, LLC, an affiliate of the investment adviser. The group fee rate decreases as assets under management increase and increases as assets under management decrease. In addition, the management fee is subject to a performance adjustment (up to a maximum of +/- .20% of the Fund's average net assets over a 36 month performance period). The upward or downward adjustment to the management fee is based on the relative investment performance of Mid-Cap Stock as compared to its benchmark index, the S&P MidCap 400 Index, over the same 36 month performance period. For the reporting period, the total annual management fee rate, including the performance adjustment, was .53% of the Fund's average net assets. The performance adjustment included in the management fee rate may be higher or lower than the maximum performance adjustment rate due to the difference between the average net assets for the reporting and performance periods.
Transfer Agent Fees. Fidelity Investments Institutional Operations Company, Inc., (FIIOC), an affiliate of the investment adviser, is the transfer, dividend disbursing and shareholder servicing agent for each class of the Fund. FIIOC receives account fees and asset-based fees that vary according to the account size and type of account of the shareholders of Mid-Cap Stock. FIIOC receives an asset-based fee of Class K's average net assets. FIIOC pays for typesetting, printing and mailing of shareholder reports, except proxy statements.
For the period, transfer agent fees for each class were as follows:
| Amount | % of Class-Level Average Net Assets |
|
| Mid-Cap Stock | $8,902 | .17 |
| Class K | 1,024 | .05 |
| $9,926 |
Accounting and Security Lending Fees. Fidelity Service Company, Inc. (FSC), an affiliate of the investment adviser, maintains the Fund's accounting records. The accounting fee is based on the level of average net assets for each month. Under a separate contract, FSC administers the security lending program. The security lending fee is based on the number and duration of lending transactions.
Brokerage Commissions. The Fund placed a portion of its portfolio transactions with brokerage firms which are affiliates of the investment adviser. Brokerage commissions are included in net realized gain (loss) and change in net unrealized appreciation (depreciation) in the Statement of Operations. The commissions paid to these affiliated firms were $31 for the period.
Interfund Trades. The Fund may purchase from or sell securities to other Fidelity Funds under procedures adopted by the Board. The procedures have been designed to ensure these interfund trades are executed in accordance with Rule 17a-7 of the 1940 Act. Interfund trades are included within the respective purchases and sales amounts shown in the Purchases and Sales of Investments note.
6. Committed Line of Credit.
The Fund participates with other funds managed by the investment adviser or an affiliate in a $4.25 billion credit facility (the "line of credit") to be utilized for temporary or emergency purposes to fund shareholder redemptions or for other short-term liquidity purposes. The Fund has agreed to pay commitment fees on its pro-rata portion of the line of credit, which amounted to $11 and is reflected in Miscellaneous expenses on the Statement of Operations. During the period, the Fund did not borrow on this line of credit.
7. Security Lending.
The Fund lends portfolio securities through a lending agent from time to time in order to earn additional income. For equity securities, a lending agent is used and may loan securities to certain qualified borrowers, including Fidelity Capital Markets (FCM), a broker-dealer affiliated with the Fund. On the settlement date of the loan, the Fund receives collateral (in the form of U.S. Treasury obligations, letters of credit and/or cash) against the loaned securities and maintains collateral in an amount not less than 100% of the market value of the loaned securities during the period of the loan. The market value of the loaned securities is determined at the close of business of the Fund and any additional required collateral is delivered to the Fund on the next business day. The Fund or borrower may terminate the loan at any time, and if the borrower defaults on its obligation to return the securities loaned because of insolvency or other reasons, the Fund may apply collateral received from the borrower against the obligation. The Fund may experience delays and costs in recovering the securities loaned. Any cash collateral received is invested in the Fidelity Securities Lending Cash Central Fund. The value of loaned securities and cash collateral at period end are disclosed on the Fund's Statement of Assets and Liabilities. The value of securities loaned to FCM at period end was $181. Security lending income represents the income earned on investing cash collateral, less rebates paid to borrowers and any lending agent fees associated with the loan, plus any premium payments received for lending certain types of securities. Security lending income is presented in the Statement of Operations as a component of income from Fidelity Central Funds, and includes $561 from securities loaned to FCM.
8. Expense Reductions.
Commissions paid to certain brokers with whom the investment adviser, or its affiliates, places trades on behalf of the Fund include an amount in addition to trade execution, which may be rebated back to the Fund to offset certain expenses. This amount totaled $175 for the period.
Through arrangements with the Fund's custodian, credits realized as a result of certain uninvested cash balances were used to reduce the Fund's expenses. During the period, these credits reduced the Fund's custody expenses by $1.
In addition, during the period the investment adviser reimbursed and/or waived a portion of fund-level operating expenses in the amount of $59 and a portion of class-level operating expenses as follows:
| Amount | |
| Mid-Cap Stock | $127 |
9. Distributions to Shareholders.
Distributions to shareholders of each class were as follows:
| Year ended April 30, 2016 | Year ended April 30, 2015 | |
| From net investment income | ||
| Mid-Cap Stock | $32,540 | $14,061 |
| Class K | 16,029 | 10,590 |
| Total | $48,569 | $24,651 |
| From net realized gain | ||
| Mid-Cap Stock | $657,512 | $555,465 |
| Class K | 272,859 | 299,047 |
| Total | $930,371 | $854,512 |
10. Share Transactions.
Share transactions for each class were as follows and may contain automatic conversions between classes or exchanges between affiliated funds:
| Shares | Shares | Dollars | Dollars | |
| Year ended April 30, 2016 | Year ended April 30, 2015 | Year ended April 30, 2016 | Year ended April 30, 2015 | |
| Mid-Cap Stock | ||||
| Shares sold | 11,317 | 17,879 | $392,342 | $696,252 |
| Reinvestment of distributions | 18,581 | 14,253 | 658,782 | 546,835 |
| Shares redeemed | (25,606) | (33,853) | (889,201) | (1,316,568) |
| Net increase (decrease) | 4,292 | (1,721) | $161,923 | $(73,481) |
| Class K | ||||
| Shares sold | 10,618 | 21,440 | $370,206 | $843,958 |
| Reinvestment of distributions | 8,154 | 8,076 | 288,888 | 309,636 |
| Shares redeemed | (24,946)(a) | (37,691) | (882,241)(a) | (1,479,067) |
| Net increase (decrease) | (6,174) | (8,175) | $(223,147) | $(325,473) |
(a) Amount includes in-kind redemptions (see Note 4: Redemptions In-Kind).
11. Other.
The Fund's organizational documents provide former and current trustees and officers with a limited indemnification against liabilities arising in connection with the performance of their duties to the Fund. In the normal course of business, the Fund may also enter into contracts that provide general indemnifications. The Fund's maximum exposure under these arrangements is unknown as this would be dependent on future claims that may be made against the Fund. The risk of material loss from such claims is considered remote.
Report of Independent Registered Public Accounting Firm
To the Trustees of Fidelity Commonwealth Trust and Shareholders of Fidelity Mid-Cap Stock Fund:
We have audited the accompanying statement of assets and liabilities of Fidelity Mid-Cap Stock Fund (the Fund), a fund of Fidelity Commonwealth Trust, including the schedule of investments, as of April 30, 2016, and the related statement of operations for the year then ended, the statement of changes in net assets for each of the two years in the period then ended, and the financial highlights for each of the five years in the period then ended. These financial statements and financial highlights are the responsibility of the Fund's management. Our responsibility is to express an opinion on these financial statements and financial highlights based on our audits.
We conducted our audits in accordance with the standards of the Public Company Accounting Oversight Board (United States). Those standards require that we plan and perform the audit to obtain reasonable assurance about whether the financial statements and financial highlights are free of material misstatement. The Fund is not required to have, nor were we engaged to perform, an audit of its internal control over financial reporting. Our audits included consideration of internal control over financial reporting as a basis for designing audit procedures that are appropriate in the circumstances, but not for the purpose of expressing an opinion on the effectiveness of the Fund's internal control over financial reporting. Accordingly, we express no such opinion. An audit also includes examining, on a test basis, evidence supporting the amounts and disclosures in the financial statements, assessing the accounting principles used and significant estimates made by management, as well as evaluating the overall financial statement presentation. Our procedures included confirmation of securities owned as of April 30, 2016, by correspondence with the custodians and brokers; when replies were not received from brokers, we performed other auditing procedures. We believe that our audits provide a reasonable basis for our opinion.
In our opinion, such financial statements and financial highlights referred to above present fairly, in all material respects, the financial position of Fidelity Mid-Cap Stock Fund as of April 30, 2016, the results of its operations for the year then ended, the changes in its net assets for each of the two years in the period then ended, and the financial highlights for each of the five years in the period then ended, in conformity with accounting principles generally accepted in the United States of America.
DELOITTE & TOUCHE LLP
Boston, Massachusetts
June 17, 2016
Trustees and Officers
The Trustees, Members of the Advisory Board (if any), and officers of the trust and fund, as applicable, are listed below. The Board of Trustees governs the fund and is responsible for protecting the interests of shareholders. The Trustees are experienced executives who meet periodically throughout the year to oversee the fund's activities, review contractual arrangements with companies that provide services to the fund, oversee management of the risks associated with such activities and contractual arrangements, and review the fund's performance. Each of the Trustees oversees 170 funds.
The Trustees hold office without limit in time except that (a) any Trustee may resign; (b) any Trustee may be removed by written instrument, signed by at least two-thirds of the number of Trustees prior to such removal; (c) any Trustee who requests to be retired or who has become incapacitated by illness or injury may be retired by written instrument signed by a majority of the other Trustees; and (d) any Trustee may be removed at any special meeting of shareholders by a two-thirds vote of the outstanding voting securities of the trust. Each Trustee who is not an interested person (as defined in the 1940 Act) of the trust and the fund is referred to herein as an Independent Trustee. Each Independent Trustee shall retire not later than the last day of the calendar year in which his or her 75th birthday occurs. The Independent Trustees may waive this mandatory retirement age policy with respect to individual Trustees. Officers and Advisory Board Members hold office without limit in time, except that any officer or Advisory Board Member may resign or may be removed by a vote of a majority of the Trustees at any regular meeting or any special meeting of the Trustees. Except as indicated, each individual has held the office shown or other offices in the same company for the past five years.
The fund’s Statement of Additional Information (SAI) includes more information about the Trustees. To request a free copy, call Fidelity at 1-800-835-5092.
Experience, Skills, Attributes, and Qualifications of the Trustees. The Governance and Nominating Committee has adopted a statement of policy that describes the experience, qualifications, attributes, and skills that are necessary and desirable for potential Independent Trustee candidates (Statement of Policy). The Board believes that each Trustee satisfied at the time he or she was initially elected or appointed a Trustee, and continues to satisfy, the standards contemplated by the Statement of Policy. The Governance and Nominating Committee also engages professional search firms to help identify potential Independent Trustee candidates who have the experience, qualifications, attributes, and skills consistent with the Statement of Policy. From time to time, additional criteria based on the composition and skills of the current Independent Trustees, as well as experience or skills that may be appropriate in light of future changes to board composition, business conditions, and regulatory or other developments, have also been considered by the professional search firms and the Governance and Nominating Committee. In addition, the Board takes into account the Trustees' commitment and participation in Board and committee meetings, as well as their leadership of standing and ad hoc committees throughout their tenure.
In determining that a particular Trustee was and continues to be qualified to serve as a Trustee, the Board has considered a variety of criteria, none of which, in isolation, was controlling. The Board believes that, collectively, the Trustees have balanced and diverse experience, qualifications, attributes, and skills, which allow the Board to operate effectively in governing the fund and protecting the interests of shareholders. Information about the specific experience, skills, attributes, and qualifications of each Trustee, which in each case led to the Board's conclusion that the Trustee should serve (or continue to serve) as a trustee of the fund, is provided below.
Board Structure and Oversight Function. James C. Curvey is an interested person and currently serves as Chairman. The Trustees have determined that an interested Chairman is appropriate and benefits shareholders because an interested Chairman has a personal and professional stake in the quality and continuity of services provided to the fund. Independent Trustees exercise their informed business judgment to appoint an individual of their choosing to serve as Chairman, regardless of whether the Trustee happens to be independent or a member of management. The Independent Trustees have determined that they can act independently and effectively without having an Independent Trustee serve as Chairman and that a key structural component for assuring that they are in a position to do so is for the Independent Trustees to constitute a substantial majority for the Board. The Independent Trustees also regularly meet in executive session. Ned C. Lautenbach serves as Chairman of the Independent Trustees and as such (i) acts as a liaison between the Independent Trustees and management with respect to matters important to the Independent Trustees and (ii) with management prepares agendas for Board meetings.
Fidelity® funds are overseen by different Boards of Trustees. The fund's Board oversees Fidelity's high income and certain equity funds, and other Boards oversee Fidelity's investment-grade bond, money market, asset allocation, and sector funds. The asset allocation funds may invest in Fidelity® funds overseen by the fund's Board. The use of separate Boards, each with its own committee structure, allows the Trustees of each group of Fidelity® funds to focus on the unique issues of the funds they oversee, including common research, investment, and operational issues. On occasion, the separate Boards establish joint committees to address issues of overlapping consequences for the Fidelity® funds overseen by each Board.
The Trustees operate using a system of committees to facilitate the timely and efficient consideration of all matters of importance to the Trustees, the fund, and fund shareholders and to facilitate compliance with legal and regulatory requirements and oversight of the fund's activities and associated risks. The Board, acting through its committees, has charged FMR and its affiliates with (i) identifying events or circumstances the occurrence of which could have demonstrably adverse effects on the fund's business and/or reputation; (ii) implementing processes and controls to lessen the possibility that such events or circumstances occur or to mitigate the effects of such events or circumstances if they do occur; and (iii) creating and maintaining a system designed to evaluate continuously business and market conditions in order to facilitate the identification and implementation processes described in (i) and (ii) above. Because the day-to-day operations and activities of the fund are carried out by or through FMR, its affiliates, and other service providers, the fund's exposure to risks is mitigated but not eliminated by the processes overseen by the Trustees. While each of the Board's committees has responsibility for overseeing different aspects of the fund's activities, oversight is exercised primarily through the Operations, Audit, and Compliance Committees. In addition, the Independent Trustees have worked with FMR to enhance the Board's oversight of investment and financial risks, legal and regulatory risks, technology risks, and operational risks, including the development of additional risk reporting to the Board. For example, a working group comprised of Independent Trustees and FMR has worked and continues to work to review the Fidelity® funds' valuation-related activities, reporting and risk management. Appropriate personnel, including but not limited to the fund's Chief Compliance Officer (CCO), FMR's internal auditor, the independent accountants, the fund's Treasurer and portfolio management personnel, make periodic reports to the Board's committees, as appropriate, including an annual review of Fidelity's risk management program for the Fidelity® funds. The responsibilities of each standing committee, including their oversight responsibilities, are described further under "Standing Committees of the Trustees."
Interested Trustees*:
Correspondence intended for a Trustee who is an interested person may be sent to Fidelity Investments, 245 Summer Street, Boston, Massachusetts 02210.
Name, Year of Birth; Principal Occupations and Other Relevant Experience+
James C. Curvey (1935)
Year of Election or Appointment: 2007
Trustee
Chairman of the Board of Trustees
Mr. Curvey also serves as Trustee of other Fidelity® funds. Mr. Curvey is a Director of Fidelity Research & Analysis Co. (investment adviser firm, 2009-present), and Vice Chairman (2007-present) and Director of FMR LLC (diversified financial services company). In addition, Mr. Curvey serves as an Overseer for the Boston Symphony Orchestra and a member of the board of Artis-Naples, Naples, Florida, and as a Trustee for Brewster Academy, Wolfeboro, New Hampshire. Previously, Mr. Curvey served as a Director of Fidelity Investments Money Management, Inc. (investment adviser firm, 2009-2014) and a Director of FMR and FMR Co., Inc. (investment adviser firms, 2007-2014).
Charles S. Morrison (1960)
Year of Election or Appointment: 2014
Trustee
Mr. Morrison also serves as Trustee of other funds. He serves as a Director of Fidelity Investments Money Management, Inc. (FIMM) (investment adviser firm, 2014-present), Director of Fidelity SelectCo, LLC (investment adviser firm, 2014-present), President, Asset Management (2014-present), and is an employee of Fidelity Investments. Previously, Mr. Morrison served as Vice President of Fidelity's Fixed Income and Asset Allocation Funds (2012-2014), President, Fixed Income (2011-2014), Vice President of Fidelity's Money Market Funds (2005-2009), President, Money Market Group Leader of FMR (investment adviser firm, 2009), and Senior Vice President, Money Market Group of FMR (2004-2009). Mr. Morrison also served as Vice President of Fidelity's Bond Funds (2002-2005), certain Balanced Funds (2002-2005), and certain Asset Allocation Funds (2002-2007), and as Senior Vice President (2002-2005) of Fidelity's Bond Division.
* Determined to be an “Interested Trustee” by virtue of, among other things, his or her affiliation with the trust or various entities under common control with FMR.
+ The information includes the Trustee's principal occupation during the last five years and other information relating to the experience, attributes, and skills relevant to the Trustee's qualifications to serve as a Trustee, which led to the conclusion that the Trustee should serve as a Trustee for the fund.
Independent Trustees:
Correspondence intended for an Independent Trustee may be sent to Fidelity Investments, P.O. Box 55235, Boston, Massachusetts 02205-5235.
Name, Year of Birth; Principal Occupations and Other Relevant Experience+
Dennis J. Dirks (1948)
Year of Election or Appointment: 2005
Trustee
Mr. Dirks also serves as Trustee of other Fidelity® funds. Prior to his retirement in May 2003, Mr. Dirks was Chief Operating Officer and a member of the Board of The Depository Trust & Clearing Corporation (DTCC). He also served as President, Chief Operating Officer, and Board member of The Depository Trust Company (DTC) and President and Board member of the National Securities Clearing Corporation (NSCC). In addition, Mr. Dirks served as Chief Executive Officer and Board member of the Government Securities Clearing Corporation, Chief Executive Officer and Board member of the Mortgage-Backed Securities Clearing Corporation, as a Trustee and a member of the Finance Committee of Manhattan College (2005-2008), as a Trustee and a member of the Finance Committee of AHRC of Nassau County (2006-2008), and as a member of the Independent Directors Council (IDC) Governing Council (2010-2015). Mr. Dirks is a member of the Board of Directors for The Brookville Center for Children's Services, Inc. (2009-present).
Alan J. Lacy (1953)
Year of Election or Appointment: 2008
Trustee
Mr. Lacy also serves as Trustee of other Fidelity® funds. Mr. Lacy serves as Chairman (2014-present) and a member (2010-present) of the Board of Directors of Dave & Buster's Entertainment, Inc. (restaurant and entertainment complexes) and a Director of Bristol-Myers Squibb Company (global pharmaceuticals, 2008-present). He is a Trustee of the California Chapter of The Nature Conservancy (2015-present) and a Director of the Center for Advanced Study in the Behavioral Sciences at Stanford University (2015-present). In addition, Mr. Lacy served as Senior Adviser (2007-2014) of Oak Hill Capital Partners, L.P. (private equity) and also served as Chief Executive Officer (2005) and Vice Chairman (2005-2006) of Sears Holdings Corporation (retail) and Chief Executive Officer and Chairman of the Board of Sears, Roebuck and Co. (retail, 2000-2005). Previously, Mr. Lacy served as Chairman (2008-2011) and a member (2006-2015) of the Board of Trustees of the National Parks Conservation Association and as a member of the Board of Directors for The Western Union Company (global money transfer, 2006-2011), The Hillman Companies, Inc. (hardware wholesalers, 2010-2014), and Earth Fare, Inc. (retail grocery, 2010-2014).
Ned C. Lautenbach (1944)
Year of Election or Appointment: 2000
Trustee
Chairman of the Independent Trustees
Mr. Lautenbach also serves as Trustee of other Fidelity® funds. Mr. Lautenbach currently serves as the Lead Director of the Eaton Corporation Board of Directors (diversified industrial, 1997-present). Mr. Lautenbach is Chairman of the Board of Directors of Artis-Naples in Naples, Florida (2012-present), a member of the Council on Foreign Relations (1994-present), and a member of the Board of Governors, State University System of Florida (2013-present). Previously, Mr. Lautenbach was a Partner/Advisory Partner at Clayton, Dubilier & Rice, LLC (private equity investment, 1998-2010), as well as a Director of Sony Corporation (2006-2007).
Joseph Mauriello (1944)
Year of Election or Appointment: 2008
Trustee
Mr. Mauriello also serves as Trustee of other Fidelity® funds. Prior to his retirement in January 2006, Mr. Mauriello served in numerous senior management positions including Deputy Chairman and Chief Operating Officer (2004-2005), and Vice Chairman of Financial Services (2002-2004) of KPMG LLP US (professional services, 1965-2005). Mr. Mauriello currently serves as a member of the Board of Directors of XL Group plc. (global insurance and re-insurance, 2006-present) and the Independent Directors Council (IDC) Governing Council (2015-present). Previously, Mr. Mauriello served as a Director of the Hamilton Funds of the Bank of New York (2006-2007) and of Arcadia Resources Inc. (health care services and products, 2007-2012).
Robert W. Selander (1950)
Year of Election or Appointment: 2011
Trustee
Mr. Selander also serves as Trustee of other Fidelity® funds. Mr. Selander serves as a Director of The Western Union Company (global money transfer, 2014-present) and a non-executive Chairman of Health Equity, Inc. (health savings custodian, 2015-present). Previously, Mr. Selander served as a Member of the Advisory Board of certain Fidelity® funds (2011), and Executive Vice Chairman (2010), Chief Executive Officer (2009-2010), and President and Chief Executive Officer (1997-2009) of Mastercard, Inc.
Cornelia M. Small (1944)
Year of Election or Appointment: 2005
Trustee
Ms. Small also serves as Trustee of other Fidelity® funds. Ms. Small is a member of the Board of Directors (2009-present) and Chair of the Investment Committee (2010-present) of the Teagle Foundation. Ms. Small also serves on the Investment Committee of the Berkshire Taconic Community Foundation (2008-present). Previously, Ms. Small served as Chairperson (2002-2008) and a member of the Investment Committee and Chairperson (2008-2012) and a member of the Board of Trustees of Smith College. In addition, Ms. Small served as Chief Investment Officer, Director of Global Equity Investments, and a member of the Board of Directors of Scudder, Stevens & Clark and Scudder Kemper Investments.
William S. Stavropoulos (1939)
Year of Election or Appointment: 2002
Trustee
Vice Chairman of the Independent Trustees
Mr. Stavropoulos also serves as Trustee of other Fidelity® funds. Mr. Stavropoulos serves as President and Founder of the Michigan Baseball Foundation, the Great Lakes Loons (2007-present). Mr. Stavropoulos is Chairman Emeritus of the Board of Directors of The Dow Chemical Company, where he previously served in numerous senior management positions, including President, CEO (1995-2000; 2002-2004), Chairman of the Executive Committee (2000-2006), and as a member of the Board of Directors (1990-2006). Currently, Mr. Stavropoulos is Chairman of the Board of Directors of Univar Inc. (global distributor of commodity and specialty chemicals), a Director of Teradata Corporation (data warehousing and technology solutions), and Maersk Inc. (industrial conglomerate), and a member of the Advisory Board for Metalmark Capital LLC (private equity investment, 2005-present). Mr. Stavropoulos is an operating advisor to Clayton, Dubilier & Rice, LLC (private equity investment). In addition, Mr. Stavropoulos is a member of the University of Notre Dame Advisory Council for the College of Science, a Trustee of the Rollin L. Gerstacker Foundation, and a Director of the Naples Philharmonic Center for the Arts. Previously, Mr. Stavropoulos served as a Director of Chemical Financial Corporation (bank holding company, 1993-2012) and Tyco International, Ltd. (multinational manufacturing and services, 2007-2012).
David M. Thomas (1949)
Year of Election or Appointment: 2008
Trustee
Mr. Thomas also serves as Trustee of other Fidelity® funds. Mr. Thomas serves as Non-Executive Chairman of the Board of Directors of Fortune Brands Home and Security (home and security products, 2011-present), as a member of the Board of Directors (2004-present) and Presiding Director (2013-present) of Interpublic Group of Companies, Inc. (marketing communication), and as a member of the Board of Trustees of the University of Florida (2013-present). Previously, Mr. Thomas served as Executive Chairman (2005-2006) and Chairman and Chief Executive Officer (2000-2005) of IMS Health, Inc. (pharmaceutical and healthcare information solutions), and a Director of Fortune Brands, Inc. (consumer products, 2000-2011).
+ The information includes the Trustee's principal occupation during the last five years and other information relating to the experience, attributes, and skills relevant to the Trustee's qualifications to serve as a Trustee, which led to the conclusion that the Trustee should serve as a Trustee for the fund.
Advisory Board Members and Officers:
Correspondence intended for an officer or Peter S. Lynch may be sent to Fidelity Investments, 245 Summer Street, Boston, Massachusetts 02210. Officers appear below in alphabetical order.
Name, Year of Birth; Principal Occupation
Peter S. Lynch (1944)
Year of Election or Appointment: 2003
Member of the Advisory Board
Mr. Lynch also serves as Member of the Advisory Board of other Fidelity® funds. Mr. Lynch is Vice Chairman and a Director of FMR (investment adviser firm) and FMR Co., Inc. (investment adviser firm). In addition, Mr. Lynch serves as a Trustee of Boston College and as the Chairman of the Inner-City Scholarship Fund. Previously, Mr. Lynch served on the Special Olympics International Board of Directors (1997-2006).
Marc R. Bryant (1966)
Year of Election or Appointment: 2015
Secretary and Chief Legal Officer (CLO)
Mr. Bryant also serves as Secretary and CLO of other funds. Mr. Bryant serves as CLO, Secretary, and Senior Vice President of Fidelity Management & Research Company (investment adviser firm, 2015-present) and FMR Co., Inc. (investment adviser firm, 2015-present); Secretary of Fidelity SelectCo, LLC (investment adviser firm, 2015-present) and Fidelity Investments Money Management, Inc. (investment adviser firm, 2015-present); and CLO of Fidelity Management & Research (Hong Kong) Limited and FMR Investment Management (U.K.) Limited (investment adviser firms, 2015-present) and Fidelity Management & Research (Japan) Limited (investment adviser firm, 2016-present). He is Senior Vice President and Deputy General Counsel of FMR LLC (diversified financial services company). Previously, Mr. Bryant served as Secretary and CLO of Fidelity Rutland Square Trust II (2010-2014) and Assistant Secretary of Fidelity's Fixed Income and Asset Allocation Funds (2013-2015). Prior to joining Fidelity Investments, Mr. Bryant served as a Senior Vice President and the Head of Global Retail Legal for AllianceBernstein L.P. (2006-2010), and as the General Counsel for ProFund Advisors LLC (2001-2006).
William C. Coffey (1969)
Year of Election or Appointment: 2009
Assistant Secretary
Mr. Coffey also serves as Assistant Secretary of other funds. He is Senior Vice President and Deputy General Counsel of FMR LLC (diversified financial services company, 2010-present), and is an employee of Fidelity Investments. Previously, Mr. Coffey served as Vice President and Associate General Counsel of FMR LLC (2005-2009).
Jeffrey S. Christian (1961)
Year of Election or Appointment: 2016
Assistant Treasurer
Mr. Christian also serves as Assistant Treasurer of other funds. Mr. Christian is an employee of Fidelity Investments (2003-present).
Jonathan Davis (1968)
Year of Election or Appointment: 2010
Assistant Treasurer
Mr. Davis also serves as Assistant Treasurer of other funds, and is an employee of Fidelity Investments. Previously, Mr. Davis served as Vice President and Associate General Counsel of FMR LLC (diversified financial services company, 2003-2010).
Adrien E. Deberghes (1967)
Year of Election or Appointment: 2016
Assistant Treasurer
Mr. Deberghes also serves as an officer of other funds. He is an employee of Fidelity Investments (2008-present). Prior to joining Fidelity Investments, Mr. Deberghes was Senior Vice President of Mutual Fund Administration at State Street Corporation (2007-2008), Senior Director of Mutual Fund Administration at Investors Bank & Trust (2005-2007), and Director of Finance for Dunkin' Brands (2000-2005). Previously, Mr. Deberghes served in other fund officer roles.
Stephanie J. Dorsey (1969)
Year of Election or Appointment: 2010
Assistant Treasurer
Ms. Dorsey also serves as an officer of other funds. She is an employee of Fidelity Investments (2008-present) and has served in other fund officer roles. Prior to joining Fidelity Investments, Ms. Dorsey served as Treasurer (2004-2008) of the JPMorgan Mutual Funds and Vice President (2004-2008) of JPMorgan Chase Bank.
Howard J. Galligan III (1966)
Year of Election or Appointment: 2014
Chief Financial Officer
Mr. Galligan also serves as Chief Financial Officer of other funds. Mr. Galligan serves as President of Fidelity Pricing and Cash Management Services (FPCMS) (2014-present) and as a Director of Strategic Advisers, Inc. (investment adviser firm, 2008-present). Previously, Mr. Galligan served as Chief Administrative Officer of Asset Management (2011-2014) and Chief Operating Officer and Senior Vice President of Investment Support for Strategic Advisers, Inc. (2003-2011).
Scott C. Goebel (1968)
Year of Election or Appointment: 2015
Vice President
Mr. Goebel serves as Vice President of other funds and is an employee of Fidelity Investments (2001-present). Previously, Mr. Goebel served as Secretary of Fidelity SelectCo, LLC (investment adviser firm, 2013-2015), Fidelity Investments Money Management, Inc. (FIMM) (investment adviser firm, 2010-2015), and Fidelity Research and Analysis Company (FRAC) (investment adviser firm, 2010-2015); General Counsel, Secretary, and Senior Vice President of Fidelity Management & Research Company (investment adviser firm, 2008-2015) and FMR Co., Inc. (investment adviser firm, 2008-2015); Assistant Secretary of Fidelity Management & Research (Japan) Limited (investment adviser firm, 2008-2015) and Fidelity Management & Research (U.K.) Inc. (investment adviser firm, 2008-2015); Chief Legal Officer (CLO) of Fidelity Management & Research (Hong Kong) Limited (investment adviser firm, 2008-2015); Secretary and CLO of certain Fidelity® funds (2008-2015); Assistant Secretary of FIMM (2008-2010), FRAC (2008-2010), and certain funds (2007-2008); and as Vice President and Secretary of Fidelity Distributors Corporation (FDC) (2005-2007).
Brian B. Hogan (1964)
Year of Election or Appointment: 2009
Vice President
Mr. Hogan also serves as Trustee or Vice President of other funds. Mr. Hogan serves as a Director of FMR Investment Management (U.K.) Limited (investment adviser firm, 2015-present) and Fidelity SelectCo, LLC (investment adviser firm, 2014-present) and President of the Equity Division of FMR (investment adviser firm, 2009-present). Previously, Mr. Hogan served as Senior Vice President, Equity Research of FMR (2006-2009) and as a portfolio manager. Mr. Brian B. Hogan is not related to Mr. Colm A. Hogan.
Colm A. Hogan (1973)
Year of Election or Appointment: 2016
Deputy Treasurer
Mr. Hogan also serves as an officer of other funds. Mr. Hogan is an employee of Fidelity Investments (2005-present). Mr. Colm A. Hogan is not related to Mr. Brian B. Hogan.
Chris Maher (1972)
Year of Election or Appointment: 2013
Assistant Treasurer
Mr. Maher serves as Assistant Treasurer of other funds. Mr. Maher is Vice President of Valuation Oversight and is an employee of Fidelity Investments. Previously, Mr. Maher served as Vice President of Asset Management Compliance (2013), Vice President of the Program Management Group of FMR (investment adviser firm, 2010-2013), and Vice President of Valuation Oversight (2008-2010).
John F. Papandrea (1972)
Year of Election or Appointment: 2016
Anti-Money Laundering (AML) Officer
Mr. Papandrea also serves as AML Officer of other funds. Mr. Papandrea is Vice President of FMR LLC (diversified financial services company, 2008-present) and is an employee of Fidelity Investments (2005-present).
Melissa M. Reilly (1971)
Year of Election or Appointment: 2014
Vice President of certain Equity Funds
Ms. Reilly also serves as Vice President of other funds. Ms. Reilly is an employee of Fidelity Investments (2004-present).
Kenneth B. Robins (1969)
Year of Election or Appointment: 2016
Chief Compliance Officer
Mr. Robins also serves as an officer of other funds. Mr. Robins serves as Executive Vice President of Fidelity Investments Money Management, Inc. (FIMM) (investment adviser firm, 2013-present) and is an employee of Fidelity Investments (2004-present). Previously, Mr. Robins served in other fund officer roles.
Stacie M. Smith (1974)
Year of Election or Appointment: 2016
President and Treasurer
Ms. Smith also serves as an officer of other funds. She is an employee of Fidelity Investments (2009-present) and has served in other fund officer roles. Prior to joining Fidelity Investments, Ms. Smith served as Senior Audit Manager of Ernst & Young LLP (1996-2009). Previously, Ms. Smith served as Deputy Treasurer of certain Fidelity® funds (2013-2016).
Renee Stagnone (1975)
Year of Election or Appointment: 2016
Assistant Treasurer
Ms. Stagnone also serves as an officer of other funds. Ms. Stagnone is an employee of Fidelity Investments (1997-present). Previously, Ms. Stagnone served as Deputy Treasurer of certain Fidelity® funds (2013-2016).
Shareholder Expense Example
As a shareholder of the Fund, you incur two types of costs: (1) transaction costs, including redemption fees and (2) ongoing costs, including management fees and other Fund expenses. This Example is intended to help you understand your ongoing costs (in dollars) of investing in the Fund and to compare these costs with the ongoing costs of investing in other mutual funds.
The Example is based on an investment of $1,000 invested at the beginning of the period and held for the entire period (November 1, 2015 to April 30, 2016).
Actual Expenses
The first line of the accompanying table for each class of the Fund provides information about actual account values and actual expenses. You may use the information in this line, together with the amount you invested, to estimate the expenses that you paid over the period. Simply divide your account value by $1,000.00 (for example, an $8,600 account value divided by $1,000.00 = 8.6), then multiply the result by the number in the first line for a class of the Fund under the heading entitled "Expenses Paid During Period" to estimate the expenses you paid on your account during this period. A small balance maintenance fee of $12.00 that is charged once a year may apply for certain accounts with a value of less than $2,000. This fee is not included in the table below. If it was, the estimate of expenses you paid during the period would be higher, and your ending account value lower, by this amount. In addition, the Fund, as a shareholder in the underlying Fidelity Central Funds, will indirectly bear its pro-rata share of the fees and expenses incurred by the underlying Fidelity Central Funds. These fees and expenses are not included in the Fund's annualized expense ratio used to calculate the expense estimate in the table below.
Hypothetical Example for Comparison Purposes
The second line of the accompanying table for each class of the Fund provides information about hypothetical account values and hypothetical expenses based on a Class' actual expense ratio and an assumed rate of return of 5% per year before expenses, which is not the Class' actual return. The hypothetical account values and expenses may not be used to estimate the actual ending account balance or expenses you paid for the period. You may use this information to compare the ongoing costs of investing in the Fund and other funds. To do so, compare this 5% hypothetical example with the 5% hypothetical examples that appear in the shareholder reports of the other funds. A small balance maintenance fee of $12.00 that is charged once a year may apply for certain accounts with a value of less than $2,000. This fee is not included in the table below. If it was, the estimate of expenses you paid during the period would be higher, and your ending account value lower, by this amount. In addition, the Fund, as a shareholder in the underlying Fidelity Central Funds, will indirectly bear its pro-rata share of the fees and expenses incurred by the underlying Fidelity Central Funds. These fees and expenses are not included in the Fund's annualized expense ratio used to calculate the expense estimate in the table below.
Please note that the expenses shown in the table are meant to highlight your ongoing costs only and do not reflect any transaction costs. Therefore, the second line of the table is useful in comparing ongoing costs only, and will not help you determine the relative total costs of owning different funds. In addition, if these transactional costs were included, your costs would have been higher.
| Annualized Expense Ratio-A | Beginning Account Value November 1, 2015 | Ending Account Value April 30, 2016 | Expenses Paid During Period-B November 1, 2015 to April 30, 2016 |
|
| Mid-Cap Stock | .74% | |||
| Actual | $1,000.00 | $1,001.20 | $3.68 | |
| Hypothetical-C | $1,000.00 | $1,021.18 | $3.72 | |
| Class K | .62% | |||
| Actual | $1,000.00 | $1,001.50 | $3.09 | |
| Hypothetical-C | $1,000.00 | $1,021.78 | $3.12 |
A Annualized expense ratio reflects expenses net of applicable fee waivers.
B Expenses are equal to each Class' annualized expense ratio, multiplied by the average account value over the period, multiplied by 182/366 (to reflect the one-half year period).
C 5% return per year before expenses
Distributions (Unaudited)
The Board of Trustees of Fidelity Mid-Cap Stock Fund voted to pay to shareholders of record at the opening of business on record date, the following distributions per share derived from capital gains realized from sales of portfolio securities, and dividends derived from net investment income:
| Pay Date | Record Date | Dividends | Capital Gains | |
| Fidelity Mid-Cap Stock Fund | ||||
| Mid-Cap Stock Fund | 06/13/16 | 06/10/16 | $0.082 | $1.769 |
| Class K | 06/13/16 | 06/10/16 | $0.095 | $1.769 |
The fund hereby designates as a capital gain dividend with respect to the taxable year ended April 30, 2016, $728,675,220, or, if subsequently determined to be different, the net capital gain of such year.
Mid-Cap Stock Fund and Class K designates 100% of the dividends distributed during the fiscal year as qualifying for the dividends–received deduction for corporate shareholders.
Mid-Cap Stock Fund and Class K designates 100% of the dividends distributed during the fiscal year as amounts which may be taken into account as a dividend for purposes of the maximum rate under section 1(h)(11) of the Internal Revenue Code.
The fund will notify shareholders in January 2017 of amounts for use in preparing 2016 income tax returns.
![]()
Corporate Headquarters
245 Summer St.
Boston, MA 02210
www.fidelity.com
MCS-K-ANN-0616
1.863347.107
|
Fidelity Advisor® Event Driven Opportunities Fund Class I (formerly Institutional Class) Annual Report April 30, 2016 |
|
|
Contents
To view a fund's proxy voting guidelines and proxy voting record for the 12-month period ended June 30, visit http://www.fidelity.com/proxyvotingresults or visit the Securities and Exchange Commission's (SEC) web site at http://www.sec.gov.
You may also call 1-877-208-0098 to request a free copy of the proxy voting guidelines.
Standard & Poor's, S&P and S&P 500 are registered service marks of The McGraw-Hill Companies, Inc. and have been licensed for use by Fidelity Distributors Corporation.
Other third-party marks appearing herein are the property of their respective owners.
All other marks appearing herein are registered or unregistered trademarks or service marks of FMR LLC or an affiliated company. © 2016 FMR LLC. All rights reserved.
This report and the financial statements contained herein are submitted for the general information of the shareholders of the Fund. This report is not authorized for distribution to prospective investors in the Fund unless preceded or accompanied by an effective prospectus.
A fund files its complete schedule of portfolio holdings with the SEC for the first and third quarters of each fiscal year on Form N-Q. Forms N-Q are available on the SEC’s web site at http://www.sec.gov. A fund's Forms N-Q may be reviewed and copied at the SEC’s Public Reference Room in Washington, DC. Information regarding the operation of the SEC's Public Reference Room may be obtained by calling 1-800-SEC-0330.
For a complete list of a fund's portfolio holdings, view the most recent holdings listing, semiannual report, or annual report on Fidelity's web site at http://www.fidelity.com, http://www.advisor.fidelity.com, or http://www.401k.com, as applicable.
NOT FDIC INSURED •MAY LOSE VALUE •NO BANK GUARANTEE
Neither the Fund nor Fidelity Distributors Corporation is a bank.
Performance: The Bottom Line
Average annual total return reflects the change in the value of an investment, assuming reinvestment of distributions from dividend income and capital gains (the profits earned upon the sale of securities that have grown in value, if any) and assuming a constant rate of performance each year. The hypothetical investment and the average annual total returns do not reflect the deduction of taxes that a shareholder would pay on fund distributions or the redemption of fund shares. During periods of reimbursement by Fidelity, a fund’s total return will be greater than it would be had the reimbursement not occurred. How a fund did yesterday is no guarantee of how it will do tomorrow.
Average Annual Total Returns
| For the periods ended April 30, 2016 | Past 1 year | Life of fundA |
| Class I | (2.31)% | 5.11% |
A From December 12, 2013
$10,000 Over Life of Fund
Let's say hypothetically that $10,000 was invested in Fidelity Advisor® Event Driven Opportunities Fund - Class I on December 12, 2013, when the fund started.
The chart shows how the value of your investment would have changed, and also shows how the Russell 3000® Index performed over the same period.

| Period Ending Values | ||
|
| $11,262 | Fidelity Advisor® Event Driven Opportunities Fund - Class I |
|
| $11,992 | Russell 3000® Index |
Management's Discussion of Fund Performance
Market Recap: The S&P 500® index gained 1.21% for the 12 months ending April 30, 2016. Largely range-bound until mid-August, U.S. stocks suffered a steep, late-summer decline on concern about an economic slowdown in China. The market recovered in October, lifted by the U.S. Federal Reserve’s decision to delay raising near-term interest rates until mid-December, as well as a rate cut in China and economic stimulus in Europe. But continued oil-price weakness and U.S.-dollar strength pushed the S&P 500® to its worst January since 2009, followed by a volatile but ultimately flattish February, then a sharp rebound in March driven by U.S. jobs gains and perceived softening in the Fed’s rate-tightening posture. April brought minimal change. For the full period, growth-oriented and larger-cap stocks fared better overall than value and smaller-cap complements. Performance was split, as five of 10 S&P 500® sectors gained ground, with a wide gap separating leaders from laggards. Investor demand for more-stable and higher-yielding investments boosted traditionally defensive, dividend-rich groups such as utilities (+14%), telecommunication services (+10%) and consumer staples (+11%) – the latter also buoyed by rising wages and low inflation. Meanwhile, energy (-14%) foundered amid commodity weakness that also hurt materials (-4%). Comments from Portfolio Manager Arvind Navaratnam: For the year, the fund’s share classes (excluding sales charges, if applicable) underperformed the -0.18% result of the benchmark Russell 3000® Index. Versus the benchmark, stock selection hurt performance, as did the fund’s inherent small-cap bias because small caps lagged their large-cap peers, which dominate the Russell index. Our stake in Canada-based Valeant Pharmaceuticals International was the fund’s largest relative detractor. The stock underperformed during the period, as shares of Valeant tumbled in October after short-selling research firm Citron accused Valeant of filing fake invoices with one of its business partners in order to show increased revenue. Then, in mid-March, the firm said it may default on its debt and would not meet earnings targets. Valeant also announced an accounting error that it said would likely lead to financial restatements. On the flip side, the fund’s large stake in Journal Media Group was by far its biggest contributor. In March 2015, E.W. Scripps and Journal Communications Media announced their intent to merge the two firms’ broadcast assets and spin off both of their newspaper businesses into one company, Journal Media. Journal produces local newspapers in 14 markets across the United States. The stock popped in October after media firm Gannett announced it would acquire Journal at a premium. In March, Journal Media shareholders approved the deal, which was completed in April.The views expressed above reflect those of the portfolio manager(s) only through the end of the period as stated on the cover of this report and do not necessarily represent the views of Fidelity or any other person in the Fidelity organization. Any such views are subject to change at any time based upon market or other conditions and Fidelity disclaims any responsibility to update such views. These views may not be relied on as investment advice and, because investment decisions for a Fidelity fund are based on numerous factors, may not be relied on as an indication of trading intent on behalf of any Fidelity fund.
Investment Summary (Unaudited)
Top Ten Stocks as of April 30, 2016
| % of fund's net assets | % of fund's net assets 6 months ago | |
| Universal Corp. | 10.3 | 10.2 |
| Exterran Corp. | 3.2 | 0.0 |
| Time, Inc. | 3.2 | 0.8 |
| Triumph Group, Inc. | 3.0 | 1.0 |
| Mondelez International, Inc. | 3.0 | 0.9 |
| TopBuild Corp. | 3.0 | 0.9 |
| Outerwall, Inc. | 3.0 | 0.0 |
| The Madison Square Garden Co. | 2.9 | 1.0 |
| The Brink's Co. | 2.6 | 0.9 |
| Kimball Electronics, Inc. | 2.5 | 0.9 |
| 36.7 |
Top Five Market Sectors as of April 30, 2016
| % of fund's net assets | % of fund's net assets 6 months ago | |
| Consumer Discretionary | 25.0 | 31.2 |
| Industrials | 13.6 | 15.3 |
| Financials | 13.4 | 11.7 |
| Consumer Staples | 13.3 | 14.7 |
| Health Care | 9.2 | 7.3 |
Asset Allocation (% of fund's net assets)
| As of April 30, 2016* | ||
| Stocks and Equity Futures | 99.3% | |
| Short-Term Investments and Net Other Assets (Liabilities) | 0.7% | |

* Foreign investments - 2.8%
| As of October 31, 2015* | ||
| Stocks | 99.8% | |
| Short-Term Investments and Net Other Assets (Liabilities) | 0.2% | |

* Foreign investments - 7.6%
Percentages shown as 0.0% may reflect amounts less than 0.05%.
Investments April 30, 2016
Showing Percentage of Net Assets
| Common Stocks - 85.5% | |||
| Shares | Value | ||
| CONSUMER DISCRETIONARY - 25.0% | |||
| Diversified Consumer Services - 2.1% | |||
| Apollo Education Group, Inc. Class A (non-vtg.) (a) | 21,700 | $169,260 | |
| Hotels, Restaurants & Leisure - 0.9% | |||
| Darden Restaurants, Inc. | 1,230 | 76,568 | |
| Household Durables - 3.0% | |||
| TopBuild Corp. (a) | 7,732 | 241,393 | |
| Internet & Catalog Retail - 0.9% | |||
| Liberty TripAdvisor Holdings, Inc. (a) | 3,211 | 70,835 | |
| Leisure Products - 1.7% | |||
| Vista Outdoor, Inc. (a) | 2,970 | 142,501 | |
| Media - 10.3% | |||
| Cable One, Inc. | 196 | 89,956 | |
| Gannett Co., Inc. | 3,836 | 64,637 | |
| The Madison Square Garden Co. (a) | 1,506 | 236,412 | |
| Time, Inc. | 17,631 | 259,176 | |
| Twenty-First Century Fox, Inc. Class B | 6,157 | 185,449 | |
| 835,630 | |||
| Specialty Retail - 5.8% | |||
| Barnes & Noble Education, Inc. (a) | 17,751 | 166,149 | |
| Outerwall, Inc. | 5,800 | 239,598 | |
| Signet Jewelers Ltd. | 587 | 63,725 | |
| 469,472 | |||
| Textiles, Apparel & Luxury Goods - 0.3% | |||
| Fossil Group, Inc. (a) | 600 | 24,300 | |
| TOTAL CONSUMER DISCRETIONARY | 2,029,959 | ||
| CONSUMER STAPLES - 13.3% | |||
| Food Products - 3.0% | |||
| Mondelez International, Inc. | 5,728 | 246,075 | |
| Tobacco - 10.3% | |||
| Universal Corp. | 15,263 | 832,592 | |
| TOTAL CONSUMER STAPLES | 1,078,667 | ||
| ENERGY - 3.2% | |||
| Energy Equipment & Services - 3.2% | |||
| Exterran Corp. (a) | 17,340 | 265,302 | |
| FINANCIALS - 13.4% | |||
| Capital Markets - 4.8% | |||
| Ashford, Inc. (a) | 920 | 41,860 | |
| Greenhill & Co., Inc. | 8,520 | 187,610 | |
| NorthStar Asset Management Group, Inc. | 12,926 | 160,799 | |
| 390,269 | |||
| Consumer Finance - 2.1% | |||
| Encore Capital Group, Inc. (a) | 6,114 | 172,109 | |
| Insurance - 0.8% | |||
| FNF Group | 2,095 | 66,831 | |
| Real Estate Investment Trusts - 3.9% | |||
| Four Corners Property Trust, Inc. | 8,814 | 156,449 | |
| WP Glimcher, Inc. | 15,490 | 162,490 | |
| 318,939 | |||
| Thrifts & Mortgage Finance - 1.8% | |||
| Fannie Mae (a) | 42,135 | 71,630 | |
| Freddie Mac (a) | 46,035 | 71,354 | |
| 142,984 | |||
| TOTAL FINANCIALS | 1,091,132 | ||
| HEALTH CARE - 9.2% | |||
| Biotechnology - 1.9% | |||
| Baxalta, Inc. | 3,730 | 156,474 | |
| Health Care Equipment & Supplies - 1.9% | |||
| Halyard Health, Inc. (a) | 2,854 | 80,369 | |
| Masimo Corp. (a) | 1,714 | 74,302 | |
| 154,671 | |||
| Health Care Technology - 1.1% | |||
| Allscripts Healthcare Solutions, Inc. (a) | 6,780 | 90,852 | |
| Pharmaceuticals - 4.3% | |||
| DepoMed, Inc. (a) | 9,600 | 166,848 | |
| Valeant Pharmaceuticals International, Inc. (United States) (a) | 2,507 | 83,634 | |
| Zoetis, Inc. Class A | 2,035 | 95,706 | |
| 346,188 | |||
| TOTAL HEALTH CARE | 748,185 | ||
| INDUSTRIALS - 13.6% | |||
| Aerospace & Defense - 4.1% | |||
| KLX, Inc. (a) | 2,560 | 86,323 | |
| Triumph Group, Inc. | 6,834 | 247,254 | |
| 333,577 | |||
| Commercial Services & Supplies - 3.6% | |||
| Matthews International Corp. Class A | 1,611 | 84,803 | |
| The Brink's Co. | 6,243 | 211,263 | |
| 296,066 | |||
| Electrical Equipment - 1.9% | |||
| Babcock & Wilcox Enterprises, Inc. (a) | 6,843 | 156,363 | |
| Machinery - 2.4% | |||
| Allison Transmission Holdings, Inc. | 6,627 | 190,924 | |
| Professional Services - 1.3% | |||
| Insperity, Inc. | 1,939 | 102,321 | |
| Trading Companies & Distributors - 0.3% | |||
| Now, Inc. (a) | 1,370 | 24,742 | |
| TOTAL INDUSTRIALS | 1,103,993 | ||
| INFORMATION TECHNOLOGY - 6.9% | |||
| Electronic Equipment & Components - 2.5% | |||
| Kimball Electronics, Inc. (a) | 18,284 | 200,027 | |
| Internet Software & Services - 0.9% | |||
| Rackspace Hosting, Inc. (a) | 3,230 | 73,870 | |
| Semiconductors & Semiconductor Equipment - 1.0% | |||
| Marvell Technology Group Ltd. | 8,400 | 83,832 | |
| Software - 2.1% | |||
| CDK Global, Inc. | 1,896 | 90,193 | |
| Xura, Inc. (a) | 3,448 | 77,201 | |
| 167,394 | |||
| Technology Hardware, Storage & Peripherals - 0.4% | |||
| Quantum Corp. (a) | 76,574 | 35,247 | |
| TOTAL INFORMATION TECHNOLOGY | 560,370 | ||
| MATERIALS - 0.9% | |||
| Containers & Packaging - 0.9% | |||
| Owens-Illinois, Inc. (a) | 4,011 | 74,043 | |
| TOTAL COMMON STOCKS | |||
| (Cost $6,801,310) | 6,951,651 | ||
| Principal Amount | Value | ||
| U.S. Treasury Obligations - 0.5% | |||
| U.S. Treasury Bills, yield at date of purchase 0.3% 6/9/16 (b) | |||
| (Cost $39,987) | 40,000 | 39,995 | |
| Shares | Value | ||
| Money Market Funds - 8.6% | |||
| Fidelity Cash Central Fund, 0.38% (c) | |||
| (Cost $701,093) | 701,093 | 701,093 | |
| Equity Funds - 4.8% | |||
| Large Blend Funds - 4.8% | |||
| iShares Russell 3000 Index ETF | |||
| (Cost $391,438) | 3,200 | 387,648 | |
| TOTAL INVESTMENT PORTFOLIO - 99.4% | |||
| (Cost $7,933,828) | 8,080,387 | ||
| NET OTHER ASSETS (LIABILITIES) - 0.6% | 48,871 | ||
| NET ASSETS - 100% | $8,129,258 |
| Futures Contracts | |||
| Expiration Date | Underlying Face Amount at Value | Unrealized Appreciation/(Depreciation) | |
| Purchased | |||
| Equity Index Contracts | |||
| 6 CME E-mini S&P 500 Index Contracts (United States) | June 2016 | 617,730 | $21,136 |
| 1 ICE Russell 2000 Index Contracts (United States) | June 2016 | 112,760 | 6,997 |
| TOTAL FUTURES CONTRACTS | $28,133 |
The face value of futures purchased as a percentage of Net Assets is 9.0%
For the period, the average monthly underlying face amount at value for futures contracts in the aggregate was $262,798.
Security Type Abbreviations
ETF – Exchange-Traded Fund
Legend
(a) Non-income producing
(b) Security or a portion of the security was pledged to cover margin requirements for futures contracts. At period end, the value of securities pledged amounted to $39,995.
(c) Affiliated fund that is generally available only to investment companies and other accounts managed by Fidelity Investments. The rate quoted is the annualized seven-day yield of the fund at period end. A complete unaudited listing of the fund's holdings as of its most recent quarter end is available upon request. In addition, each Fidelity Central Fund's financial statements, which are not covered by the Fund's Report of Independent Registered Public Accounting Firm, are available on the SEC's website or upon request.
Affiliated Central Funds
Information regarding fiscal year to date income earned by the Fund from investments in Fidelity Central Funds is as follows:
| Fund | Income earned |
| Fidelity Cash Central Fund | $1,022 |
| Total | $1,022 |
Investment Valuation
The following is a summary of the inputs used, as of April 30, 2016, involving the Fund's assets and liabilities carried at fair value. The inputs or methodology used for valuing securities may not be an indication of the risk associated with investing in those securities. For more information on valuation inputs, and their aggregation into the levels used below, please refer to the Investment Valuation section in the accompanying Notes to Financial Statements.
| Valuation Inputs at Reporting Date: | ||||
| Description | Total | Level 1 | Level 2 | Level 3 |
| Investments in Securities: | ||||
| Equities: | ||||
| Consumer Discretionary | $2,029,959 | $2,029,959 | $-- | $-- |
| Consumer Staples | 1,078,667 | 1,078,667 | -- | -- |
| Energy | 265,302 | 265,302 | -- | -- |
| Financials | 1,091,132 | 1,091,132 | -- | -- |
| Health Care | 748,185 | 748,185 | -- | -- |
| Industrials | 1,103,993 | 1,103,993 | -- | -- |
| Information Technology | 560,370 | 560,370 | -- | -- |
| Materials | 74,043 | 74,043 | -- | -- |
| U.S. Government and Government Agency Obligations | 39,995 | -- | 39,995 | -- |
| Money Market Funds | 701,093 | 701,093 | -- | -- |
| Equity Funds | 387,648 | 387,648 | -- | -- |
| Total Investments in Securities: | $8,080,387 | $8,040,392 | $39,995 | $-- |
| Derivative Instruments: | ||||
| Assets | ||||
| Futures Contracts | $28,133 | $28,133 | $-- | $-- |
| Total Assets | $28,133 | $28,133 | $-- | $-- |
| Total Derivative Instruments: | $28,133 | $28,133 | $-- | $-- |
Value of Derivative Instruments
The following table is a summary of the Fund's value of derivative instruments by primary risk exposure as of April 30, 2016. For additional information on derivative instruments, please refer to the Derivative Instruments section in the accompanying Notes to Financial Statements.
| Primary Risk Exposure / Derivative Type | Value | |
| Asset | Liability | |
| Equity Risk | ||
| Futures Contracts(a) | $28,133 | $0 |
| Total Equity Risk | 28,133 | 0 |
| Total Value of Derivatives | $28,133 | $0 |
(a) Reflects gross cumulative appreciation (depreciation) on futures contracts as presented in the Schedule of Investments. In the Statement of Assets and Liabilities, the period end daily variation margin is included in receivable or payable for daily variation margin for derivative instruments, and the net cumulative appreciation (depreciation) is included in net unrealized appreciation (depreciation).
See accompanying notes which are an integral part of the financial statements.
Financial Statements
Statement of Assets and Liabilities
| April 30, 2016 | ||
| Assets | ||
| Investment in securities, at value — See accompanying schedule: Unaffiliated issuers (cost $7,232,735) | $7,379,294 | |
| Fidelity Central Funds (cost $701,093) | 701,093 | |
| Total Investments (cost $7,933,828) | $8,080,387 | |
| Cash | 26,173 | |
| Receivable for investments sold | 100,706 | |
| Receivable for fund shares sold | 639 | |
| Dividends receivable | 9,210 | |
| Distributions receivable from Fidelity Central Funds | 276 | |
| Prepaid expenses | 7 | |
| Receivable from investment adviser for expense reductions | 6,509 | |
| Other receivables | 270 | |
| Total assets | 8,224,177 | |
| Liabilities | ||
| Payable for investments purchased | $34,953 | |
| Payable for fund shares redeemed | 6,666 | |
| Accrued management fee | 5,382 | |
| Distribution and service plan fees payable | 1,821 | |
| Payable for daily variation margin for derivative instruments | 5,210 | |
| Audit fee payable | 38,166 | |
| Other affiliated payables | 1,642 | |
| Other payables and accrued expenses | 1,079 | |
| Total liabilities | 94,919 | |
| Net Assets | $8,129,258 | |
| Net Assets consist of: | ||
| Paid in capital | $7,997,633 | |
| Undistributed net investment income | 29,804 | |
| Accumulated undistributed net realized gain (loss) on investments and foreign currency transactions | (72,871) | |
| Net unrealized appreciation (depreciation) on investments | 174,692 | |
| Net Assets | $8,129,258 | |
| Calculation of Maximum Offering Price | ||
| Class A: | ||
| Net Asset Value and redemption price per share ($2,513,302 ÷ 231,219 shares) | $10.87 | |
| Maximum offering price per share (100/94.25 of $10.87) | $11.53 | |
| Class T: | ||
| Net Asset Value and redemption price per share ($966,062 ÷ 89,238 shares) | $10.83 | |
| Maximum offering price per share (100/96.50 of $10.83) | $11.22 | |
| Class C: | ||
| Net Asset Value and offering price per share ($1,045,781 ÷ 97,577 shares)(a) | $10.72 | |
| Class I: | ||
| Net Asset Value, offering price and redemption price per share ($3,604,113 ÷ 330,256 shares) | $10.91 |
(a) Redemption price per share is equal to net asset value less any applicable contingent deferred sales charge.
See accompanying notes which are an integral part of the financial statements.
Statement of Operations
| Year ended April 30, 2016 | ||
| Investment Income | ||
| Dividends | $133,771 | |
| Special dividends | 40,137 | |
| Interest | 41 | |
| Income from Fidelity Central Funds | 1,022 | |
| Total income | 174,971 | |
| Expenses | ||
| Management fee | ||
| Basic fee | $65,143 | |
| Performance adjustment | (4,562) | |
| Transfer agent fees | 16,065 | |
| Distribution and service plan fees | 26,974 | |
| Accounting fees and expenses | 2,985 | |
| Custodian fees and expenses | 5,331 | |
| Independent trustees' compensation | 35 | |
| Registration fees | 50,474 | |
| Audit | 47,919 | |
| Legal | 19 | |
| Miscellaneous | 265 | |
| Total expenses before reductions | 210,648 | |
| Expense reductions | (84,947) | 125,701 |
| Net investment income (loss) | 49,270 | |
| Realized and Unrealized Gain (Loss) | ||
| Net realized gain (loss) on: | ||
| Investment securities: | ||
| Unaffiliated issuers | 86,599 | |
| Foreign currency transactions | 158 | |
| Futures contracts | (26,794) | |
| Total net realized gain (loss) | 59,963 | |
| Change in net unrealized appreciation (depreciation) on: Investment securities | (361,065) | |
| Assets and liabilities in foreign currencies | 126 | |
| Futures contracts | 28,133 | |
| Total change in net unrealized appreciation (depreciation) | (332,806) | |
| Net gain (loss) | (272,843) | |
| Net increase (decrease) in net assets resulting from operations | $(223,573) |
See accompanying notes which are an integral part of the financial statements.
Statement of Changes in Net Assets
| Year ended April 30, 2016 | Year ended April 30, 2015 | |
| Increase (Decrease) in Net Assets | ||
| Operations | ||
| Net investment income (loss) | $49,270 | $(11,173) |
| Net realized gain (loss) | 59,963 | 62,309 |
| Change in net unrealized appreciation (depreciation) | (332,806) | 434,100 |
| Net increase (decrease) in net assets resulting from operations | (223,573) | 485,236 |
| Distributions to shareholders from net investment income | – | (8,784) |
| Distributions to shareholders from net realized gain | (78,048) | (156,929) |
| Total distributions | (78,048) | (165,713) |
| Share transactions - net increase (decrease) | (365,630) | 483,003 |
| Total increase (decrease) in net assets | (667,251) | 802,526 |
| Net Assets | ||
| Beginning of period | 8,796,509 | 7,993,983 |
| End of period (including undistributed net investment income of $29,804 and accumulated net investment loss of $13,274, respectively) | $8,129,258 | $8,796,509 |
See accompanying notes which are an integral part of the financial statements.
Financial Highlights — Fidelity Advisor Event Driven Opportunities Fund Class A
| Years ended April 30, | 2016 | 2015 | 2014 A |
| Selected Per–Share Data | |||
| Net asset value, beginning of period | $11.26 | $10.58 | $10.00 |
| Income from Investment Operations | |||
| Net investment income (loss)B | .08C | .01 | .02D |
| Net realized and unrealized gain (loss) | (.36)E | .89F | .56G |
| Total from investment operations | (.28) | .90 | .58 |
| Distributions from net investment income | – | (.01) | – |
| Distributions from net realized gain | (.11) | (.20) | – |
| Total distributions | (.11) | (.22)H | – |
| Net asset value, end of period | $10.87 | $11.26 | $10.58 |
| Total ReturnI,J,K | (2.49)%E | 8.55%F | 5.80%G |
| Ratios to Average Net AssetsL,M | |||
| Expenses before reductions | 2.76% | 2.82% | 4.76%N |
| Expenses net of fee waivers, if any | 1.55% | 1.55% | 1.55%N |
| Expenses net of all reductions | 1.54% | 1.53% | 1.55%N |
| Net investment income (loss) | .74%C | .10% | .59%D,N |
| Supplemental Data | |||
| Net assets, end of period (000 omitted) | $2,513 | $2,983 | $1,389 |
| Portfolio turnover rateO | 113% | 150% | 57%P |
A For the period December 12, 2013 (commencement of operations) to April 30, 2014.
B Calculated based on average shares outstanding during the period.
C Net Investment income per share reflects a large, non-recurring dividend which amounted to $.06 per share. Excluding this non-recurring dividend, the ratio of net investment income (loss) to average net assets would have been .22%.
D Net Investment income per share reflects large, non-recurring dividends which amounted to $.03 per share. Excluding these non-recurring dividends, the ratio of net investment income (loss) to average net assets would have been (.25) %.
E Amount includes a reimbursement from the investment adviser for an operational error which amounted to less than $.01 per share. Excluding this reimbursement, the total return would have been (2.52)%.
F Amount includes a reimbursement from the investment adviser for an operational error which amounted to $.01 per share. Excluding this reimbursement, the total return would have been 8.47%.
G Amount includes a reimbursement from the investment adviser for an operational error which amounted to $.01 per share. Excluding this reimbursement, the total return would have been 5.70%.
H Total distributions of $.22 per share is comprised of distributions from net investment income of $.014 and distributions from net realized gain of $.201 per share.
I Total returns for periods of less than one year are not annualized.
J Total returns would have been lower if certain expenses had not been reduced during the applicable periods shown.
K Total returns do not include the effect of the sales charges.
L Fees and expenses of any underlying Fidelity Central Funds are not included in the Fund's expense ratio. The Fund indirectly bears its proportionate share of the expenses of any underlying Fidelity Central Funds.
M Expense ratios reflect operating expenses of the class. Expenses before reductions do not reflect amounts reimbursed by the investment adviser or reductions from brokerage service arrangements or reductions from other expense offset arrangements and do not represent the amount paid by the class during periods when reimbursements or reductions occur. Expense ratios before reductions for start-up periods may not be representative of longer-term operating periods. Expenses net of fee waivers reflect expenses after reimbursement by the investment adviser but prior to reductions from brokerage service arrangements or other expense offset arrangements. Expenses net of all reductions represent the net expenses paid by the class.
N Annualized
O Amount does not include the portfolio activity of any underlying Fidelity Central Funds.
P Amount not annualized.
See accompanying notes which are an integral part of the financial statements.
Financial Highlights — Fidelity Advisor Event Driven Opportunities Fund Class T
| Years ended April 30, | 2016 | 2015 | 2014 A |
| Selected Per–Share Data | |||
| Net asset value, beginning of period | $11.25 | $10.57 | $10.00 |
| Income from Investment Operations | |||
| Net investment income (loss)B | .05C | (.02) | .01D |
| Net realized and unrealized gain (loss) | (.36)E | .89F | .56G |
| Total from investment operations | (.31) | .87 | .57 |
| Distributions from net investment income | – | (.01) | – |
| Distributions from net realized gain | (.11) | (.18) | – |
| Total distributions | (.11) | (.19) | – |
| Net asset value, end of period | $10.83 | $11.25 | $10.57 |
| Total ReturnH,I,J | (2.76)%E | 8.35%F | 5.70%G |
| Ratios to Average Net AssetsK,L | |||
| Expenses before reductions | 2.98% | 3.18% | 4.95%M |
| Expenses net of fee waivers, if any | 1.80% | 1.80% | 1.80%M |
| Expenses net of all reductions | 1.79% | 1.78% | 1.80%M |
| Net investment income (loss) | .49%C | (.15)% | .34%D,M |
| Supplemental Data | |||
| Net assets, end of period (000 omitted) | $966 | $1,977 | $1,631 |
| Portfolio turnover rateN | 113% | 150% | 57%O |
A For the period December 12, 2013 (commencement of operations) to April 30, 2014.
B Calculated based on average shares outstanding during the period.
C Net Investment income per share reflects a large, non-recurring dividend which amounted to $.06 per share. Excluding this non-recurring dividend, the ratio of net investment income (loss) to average net assets would have been (.03) %.
D Net Investment income per share reflects large, non-recurring dividends which amounted to $.03 per share. Excluding these non-recurring dividends, the ratio of net investment income (loss) to average net assets would have been (.50) %.
E Amount includes a reimbursement from the investment adviser for an operational error which amounted to less than $.01 per share. Excluding this reimbursement, the total return would have been (2.79)%.
F Amount includes a reimbursement from the investment adviser for an operational error which amounted to $.01 per share. Excluding this reimbursement, the total return would have been 8.27%.
G Amount includes a reimbursement from the investment adviser for an operational error which amounted to $.01 per share. Excluding this reimbursement, the total return would have been 5.60%.
H Total returns for periods of less than one year are not annualized.
I Total returns would have been lower if certain expenses had not been reduced during the applicable periods shown.
J Total returns do not include the effect of the sales charges.
K Fees and expenses of any underlying Fidelity Central Funds are not included in the Fund's expense ratio. The Fund indirectly bears its proportionate share of the expenses of any underlying Fidelity Central Funds.
L Expense ratios reflect operating expenses of the class. Expenses before reductions do not reflect amounts reimbursed by the investment adviser or reductions from brokerage service arrangements or reductions from other expense offset arrangements and do not represent the amount paid by the class during periods when reimbursements or reductions occur. Expense ratios before reductions for start-up periods may not be representative of longer-term operating periods. Expenses net of fee waivers reflect expenses after reimbursement by the investment adviser but prior to reductions from brokerage service arrangements or other expense offset arrangements. Expenses net of all reductions represent the net expenses paid by the class.
M Annualized
N Amount does not include the portfolio activity of any underlying Fidelity Central Funds.
O Amount not annualized.
See accompanying notes which are an integral part of the financial statements.
Financial Highlights — Fidelity Advisor Event Driven Opportunities Fund Class C
| Years ended April 30, | 2016 | 2015 | 2014 A |
| Selected Per–Share Data | |||
| Net asset value, beginning of period | $11.19 | $10.55 | $10.00 |
| Income from Investment Operations | |||
| Net investment income (loss)B | –C,D | (.07) | (.01)E |
| Net realized and unrealized gain (loss) | (.36)F | .88G | .56H |
| Total from investment operations | (.36) | .81 | .55 |
| Distributions from net realized gain | (.11) | (.17) | – |
| Total distributions | (.11) | (.17) | – |
| Net asset value, end of period | $10.72 | $11.19 | $10.55 |
| Total ReturnI,J,K | (3.23)%F | 7.75%G | 5.50%H |
| Ratios to Average Net AssetsL,M | |||
| Expenses before reductions | 3.46% | 3.63% | 5.38%N |
| Expenses net of fee waivers, if any | 2.30% | 2.30% | 2.30%N |
| Expenses net of all reductions | 2.29% | 2.29% | 2.30%N |
| Net investment income (loss) | (.01)%C | (.65)% | (.16)%E,N |
| Supplemental Data | |||
| Net assets, end of period (000 omitted) | $1,046 | $1,846 | $3,011 |
| Portfolio turnover rateO | 113% | 150% | 57%P |
A For the period December 12, 2013 (commencement of operations) to April 30, 2014.
B Calculated based on average shares outstanding during the period.
C Net Investment income per share reflects a large, non-recurring dividend which amounted to $.06 per share. Excluding this non-recurring dividend, the ratio of net investment income (loss) to average net assets would have been (.53) %.
D Amount represents less than $.005 per share.
E Net Investment income per share reflects large, non-recurring dividends which amounted to $.03 per share. Excluding these non-recurring dividends, the ratio of net investment income (loss) to average net assets would have been (1.00) %.
F Amount includes a reimbursement from the investment adviser for an operational error which amounted to less than $.01 per share. Excluding this reimbursement, the total return would have been (3.26)%.
G Amount includes a reimbursement from the investment adviser for an operational error which amounted to $.01 per share. Excluding this reimbursement, the total return would have been 7.67%.
H Amount includes a reimbursement from the investment adviser for an operational error which amounted to $.01 per share. Excluding this reimbursement, the total return would have been 5.40%.
I Total returns for periods of less than one year are not annualized.
J Total returns would have been lower if certain expenses had not been reduced during the applicable periods shown.
K Total returns do not include the effect of the contingent deferred sales charge.
L Fees and expenses of any underlying Fidelity Central Funds are not included in the Fund's expense ratio. The Fund indirectly bears its proportionate share of the expenses of any underlying Fidelity Central Funds.
M Expense ratios reflect operating expenses of the class. Expenses before reductions do not reflect amounts reimbursed by the investment adviser or reductions from brokerage service arrangements or reductions from other expense offset arrangements and do not represent the amount paid by the class during periods when reimbursements or reductions occur. Expense ratios before reductions for start-up periods may not be representative of longer-term operating periods. Expenses net of fee waivers reflect expenses after reimbursement by the investment adviser but prior to reductions from brokerage service arrangements or other expense offset arrangements. Expenses net of all reductions represent the net expenses paid by the class.
N Annualized
O Amount does not include the portfolio activity of any underlying Fidelity Central Funds.
P Amount not annualized.
See accompanying notes which are an integral part of the financial statements.
Financial Highlights — Fidelity Advisor Event Driven Opportunities Fund Class I
| Years ended April 30, | 2016 | 2015 | 2014 A |
| Selected Per–Share Data | |||
| Net asset value, beginning of period | $11.28 | $10.59 | $10.00 |
| Income from Investment Operations | |||
| Net investment income (loss)B | .11C | .04 | .03D |
| Net realized and unrealized gain (loss) | (.37)E | .89F | .56G |
| Total from investment operations | (.26) | .93 | .59 |
| Distributions from net investment income | – | (.03) | – |
| Distributions from net realized gain | (.11) | (.21) | – |
| Total distributions | (.11) | (.24) | – |
| Net asset value, end of period | $10.91 | $11.28 | $10.59 |
| Total ReturnH,I | (2.31)%E | 8.86%F | 5.90%G |
| Ratios to Average Net AssetsJ,K | |||
| Expenses before reductions | 2.17% | 2.63% | 4.50%L |
| Expenses net of fee waivers, if any | 1.30% | 1.30% | 1.30%L |
| Expenses net of all reductions | 1.28% | 1.28% | 1.30%L |
| Net investment income (loss) | 1.00%C | .35% | .84%D,L |
| Supplemental Data | |||
| Net assets, end of period (000 omitted) | $3,604 | $1,990 | $1,962 |
| Portfolio turnover rateM | 113% | 150% | 57%N |
A For the period December 12, 2013 (commencement of operations) to April 30, 2014.
B Calculated based on average shares outstanding during the period.
C Net Investment income per share reflects a large, non-recurring dividend which amounted to $.06 per share. Excluding this non-recurring dividend, the ratio of net investment income (loss) to average net assets would have been .47%.
D Net Investment income per share reflects large, non-recurring dividends which amounted to $.03 per share. Excluding these non-recurring dividends, the ratio of net investment income (loss) to average net assets would have been (.01) %.
E Amount includes a reimbursement from the investment adviser for an operational error which amounted to less than $.01 per share. Excluding this reimbursement, the total return would have been (2.34)%.
F Amount includes a reimbursement from the investment adviser for an operational error which amounted to $.01 per share. Excluding this reimbursement, the total return would have been 8.78%.
G Amount includes a reimbursement from the investment adviser for an operational error which amounted to $.01 per share. Excluding this reimbursement, the total return would have been 5.80%.
H Total returns for periods of less than one year are not annualized.
I Total returns would have been lower if certain expenses had not been reduced during the applicable periods shown.
J Fees and expenses of any underlying Fidelity Central Funds are not included in the Fund's expense ratio. The Fund indirectly bears its proportionate share of the expenses of any underlying Fidelity Central Funds.
K Expense ratios reflect operating expenses of the class. Expenses before reductions do not reflect amounts reimbursed by the investment adviser or reductions from brokerage service arrangements or reductions from other expense offset arrangements and do not represent the amount paid by the class during periods when reimbursements or reductions occur. Expense ratios before reductions for start-up periods may not be representative of longer-term operating periods. Expenses net of fee waivers reflect expenses after reimbursement by the investment adviser but prior to reductions from brokerage service arrangements or other expense offset arrangements. Expenses net of all reductions represent the net expenses paid by the class.
L Annualized
M Amount does not include the portfolio activity of any underlying Fidelity Central Funds.
N Amount not annualized.
See accompanying notes which are an integral part of the financial statements.
Notes to Financial Statements
For the period ended April 30, 2016
1. Organization.
Fidelity Advisor Event Driven Opportunities Fund (the Fund) is a non-diversified fund of Fidelity Commonwealth Trust (the Trust) and is authorized to issue an unlimited number of shares. The Trust is registered under the Investment Company Act of 1940, as amended (the 1940 Act), as an open-end management investment company organized as a Massachusetts business trust. The Fund offers Class A, Class T, Class C and Class I (formerly Institutional Class) shares, each of which has equal rights as to assets and voting privileges. Each class has exclusive voting rights with respect to matters that affect that class.
2. Investments in Fidelity Central Funds.
The Fund invests in Fidelity Central Funds, which are open-end investment companies generally available only to other investment companies and accounts managed by the investment adviser and its affiliates. The Fund's Schedule of Investments lists each of the Fidelity Central Funds held as of period end, if any, as an investment of the Fund, but does not include the underlying holdings of each Fidelity Central Fund. As an Investing Fund, the Fund indirectly bears its proportionate share of the expenses of the underlying Fidelity Central Funds.
The Money Market Central Funds seek preservation of capital and current income and are managed by Fidelity Investments Money Management, Inc. (FIMM), an affiliate of the investment adviser. Annualized expenses of the Money Market Central Funds as of their most recent shareholder report date are less than .005%.
A complete unaudited list of holdings for each Fidelity Central Fund is available upon request or at the Securities and Exchange Commission (the SEC) website at www.sec.gov. In addition, the financial statements of the Fidelity Central Funds, which are not covered by the Fund's Report of Independent Registered Public Accounting Firm, are available on the SEC website or upon request.
3. Significant Accounting Policies.
The financial statements have been prepared in conformity with accounting principles generally accepted in the United States of America (GAAP), which require management to make certain estimates and assumptions at the date of the financial statements. Actual results could differ from those estimates. Subsequent events, if any, through the date that the financial statements were issued have been evaluated in the preparation of the financial statements. The following summarizes the significant accounting policies of the Fund:
Investment Valuation. Investments are valued as of 4:00 p.m. Eastern time on the last calendar day of the period. The Board of Trustees (the Board) has delegated the day to day responsibility for the valuation of the Fund's investments to the Fidelity Management & Research Company (FMR) Fair Value Committee (the Committee). In accordance with valuation policies and procedures approved by the Board, the Fund attempts to obtain prices from one or more third party pricing vendors or brokers to value its investments. When current market prices, quotations or currency exchange rates are not readily available or reliable, investments will be fair valued in good faith by the Committee, in accordance with procedures adopted by the Board. Factors used in determining fair value vary by investment type and may include market or investment specific events, changes in interest rates and credit quality. The frequency with which these procedures are used cannot be predicted and they may be utilized to a significant extent. The Committee oversees the Fund's valuation policies and procedures and reports to the Board on the Committee's activities and fair value determinations. The Board monitors the appropriateness of the procedures used in valuing the Fund's investments and ratifies the fair value determinations of the Committee.
The Fund categorizes the inputs to valuation techniques used to value its investments into a disclosure hierarchy consisting of three levels as shown below:
- Level 1 – quoted prices in active markets for identical investments
- Level 2 – other significant observable inputs (including quoted prices for similar investments, interest rates, prepayment speeds, etc.)
- Level 3 – unobservable inputs (including the Fund's own assumptions based on the best information available)
Valuation techniques used to value the Fund's investments by major category are as follows:
Equity securities, including restricted securities, for which market quotations are readily available, are valued at the last reported sale price or official closing price as reported by a third party pricing vendor on the primary market or exchange on which they are traded and are categorized as Level 1 in the hierarchy. In the event there were no sales during the day or closing prices are not available, securities are valued at the last quoted bid price or may be valued using the last available price and are generally categorized as Level 2 in the hierarchy. For foreign equity securities, when market or security specific events arise, comparisons to the valuation of American Depositary Receipts (ADRs), futures contracts, Exchange-Traded Funds (ETFs) and certain indexes as well as quoted prices for similar securities may be used and would be categorized as Level 2 in the hierarchy. Utilizing these techniques may result in transfers between Level 1 and Level 2. For equity securities, including restricted securities, where observable inputs are limited, assumptions about market activity and risk are used and these securities may be categorized as Level 3 in the hierarchy.
Debt securities, including restricted securities, are valued based on evaluated prices received from third party pricing vendors or from brokers who make markets in such securities. U.S. government and government agency obligations are valued by pricing vendors who utilize matrix pricing which considers yield or price of bonds of comparable quality, coupon, maturity and type or by broker-supplied prices. When independent prices are unavailable or unreliable, debt securities may be valued utilizing pricing methodologies which consider similar factors that would be used by third party pricing vendors. Debt securities are generally categorized as Level 2 in the hierarchy but may be Level 3 depending on the circumstances.
ETFs are valued at their last sale price or official closing price as reported by a third party pricing vendor on the primary market or exchange on which they are traded and are categorized as Level 1 in the hierarchy. In the event there were no sales during the day but the exchange reports a closing bid level, ETFs are valued at the closing bid and would be categorized as Level 1 in the hierarchy. In the event there was no closing bid, ETFs may be valued by another method that the Board believes reflects fair value in accordance with the Board's fair value pricing policies and may be categorized as Level 2 in the hierarchy.
Futures contracts are valued at the settlement price established each day by the board of trade or exchange on which they are traded and are categorized as Level 1 in the hierarchy. Investments in open-end mutual funds, including the Fidelity Central Funds, are valued at their closing net asset value (NAV) each business day and are categorized as Level 1 in the hierarchy.
Changes in valuation techniques may result in transfers in or out of an assigned level within the disclosure hierarchy. The aggregate value of investments by input level as of April 30, 2016 is included at the end of the Fund's Schedule of Investments.
Foreign Currency. The Fund may use foreign currency contracts to facilitate transactions in foreign-denominated securities. Gains and losses from these transactions may arise from changes in the value of the foreign currency or if the counterparties do not perform under the contracts' terms.
Foreign-denominated assets, including investment securities, and liabilities are translated into U.S. dollars at the exchange rates at period end. Purchases and sales of investment securities, income and dividends received and expenses denominated in foreign currencies are translated into U.S. dollars at the exchange rate in effect on the transaction date.
The effects of exchange rate fluctuations on investments are included with the net realized and unrealized gain (loss) on investment securities. Other foreign currency transactions resulting in realized and unrealized gain (loss) are disclosed separately.
Investment Transactions and Income. For financial reporting purposes, the Fund's investment holdings and NAV include trades executed through the end of the last business day of the period. The NAV per share for processing shareholder transactions is calculated as of the close of business of the New York Stock Exchange (NYSE), normally 4:00 p.m. Eastern time and includes trades executed through the end of the prior business day. Gains and losses on securities sold are determined on the basis of identified cost. Dividend income is recorded on the ex-dividend date, except for certain dividends from foreign securities where the ex-dividend date may have passed, which are recorded as soon as the Fund is informed of the ex-dividend date. Non-cash dividends included in dividend income, if any, are recorded at the fair market value of the securities received. Income and capital gain distributions from Fidelity Central Funds, if any, are recorded on the ex-dividend date. Distributions received on securities that represent a return of capital or capital gain are recorded as a reduction of cost of investments and/or as a realized gain. Subsequent to ex-dividend date the Fund determines the components of these distributions, based upon receipt of tax filings or other correspondence relating to the underlying investment. Large, non-recurring dividends recognized by the Fund are presented separately on the Statement of Operations as "Special Dividends" and the impact of these dividends is presented in the Financial Highlights. Interest income is accrued as earned and includes coupon interest and amortization of premium and accretion of discount on debt securities as applicable. Investment income is recorded net of foreign taxes withheld where recovery of such taxes is uncertain.
Class Allocations and Expenses. Investment income, realized and unrealized capital gains and losses, common expenses of the Fund, and certain fund-level expense reductions, if any, are allocated daily on a pro-rata basis to each class based on the relative net assets of each class to the total net assets of the Fund. Each class differs with respect to transfer agent and distribution and service plan fees incurred. Certain expense reductions may also differ by class. For the reporting period, the allocated portion of income and expenses to each class as a percent of its average net assets may vary due to the timing of recording these transactions in relation to fluctuating net assets of the classes. Expenses directly attributable to a fund are charged to that fund. Expenses attributable to more than one fund are allocated among the respective funds on the basis of relative net assets or other appropriate methods. Expense estimates are accrued in the period to which they relate and adjustments are made when actual amounts are known.
Income Tax Information and Distributions to Shareholders. Each year, the Fund intends to qualify as a regulated investment company under Subchapter M of the Internal Revenue Code, including distributing substantially all of its taxable income and realized gains. As a result, no provision for U.S. Federal income taxes is required. As of April 30, 2016, the Fund did not have any unrecognized tax benefits in the financial statements; nor is the Fund aware of any tax positions for which it is reasonably possible that the total amounts of unrecognized tax benefits will significantly change in the next twelve months. The Fund files a U.S. federal tax return, in addition to state and local tax returns as required. The Fund's federal income tax returns are subject to examination by the Internal Revenue Service (IRS) for a period of three fiscal years after they are filed. State and local tax returns may be subject to examination for an additional fiscal year depending on the jurisdiction. Foreign taxes are provided for based on the Fund's understanding of the tax rules and rates that exist in the foreign markets in which it invests.
Distributions are declared and recorded on the ex-dividend date. Income dividends and capital gain distributions are declared separately for each class. Income and capital gain distributions are determined in accordance with income tax regulations, which may differ from GAAP. In addition, the Fund claimed a portion of the payment made to redeeming shareholders as a distribution for income tax purposes.
Capital accounts within the financial statements are adjusted for permanent book-tax differences. These adjustments have no impact on net assets or the results of operations. Capital accounts are not adjusted for temporary book-tax differences which will reverse in a subsequent period.
Book-tax differences are primarily due to futures contracts, foreign currency transactions, market discount and losses deferred due to wash sales and excise tax regulations.
The federal tax cost of investment securities and unrealized appreciation (depreciation) as of period end were as follows:
| Gross unrealized appreciation | $784,512 |
| Gross unrealized depreciation | (675,016) |
| Net unrealized appreciation (depreciation) on securities | $109,496 |
| Tax Cost | $7,970,891 |
The tax-based components of distributable earnings as of period end were as follows:
| Undistributed ordinary income | $29,786 |
| Net unrealized appreciation (depreciation) on securities and other investments | $109,496 |
The Fund intends to elect to defer to its next fiscal year $7,657 of capital losses recognized during the period November 1, 2015 to April 30, 2016.
The tax character of distributions paid was as follows:
| April 30, 2016 | April 30, 2015 | |
| Ordinary Income | $– | $ 165,713 |
| Long-term Capital Gains | 78,048 | – |
| Total | $78,048 | $ 165,713 |
4. Derivative Instruments.
Risk Exposures and the Use of Derivative Instruments. The Fund's investment objective allows the Fund to enter into various types of derivative contracts, including futures contracts. Derivatives are investments whose value is primarily derived from underlying assets, indices or reference rates and may be transacted on an exchange or over-the-counter (OTC). Derivatives may involve a future commitment to buy or sell a specified asset based on specified terms, to exchange future cash flows at periodic intervals based on a notional principal amount, or for one party to make one or more payments upon the occurrence of specified events in exchange for periodic payments from the other party.
The Fund used derivatives to increase returns and to manage exposure to certain risks as defined below. The success of any strategy involving derivatives depends on analysis of numerous economic factors, and if the strategies for investment do not work as intended, the Fund may not achieve its objectives.
The Fund's use of derivatives increased or decreased its exposure to the following risk:
| Equity Risk | Equity risk relates to the fluctuations in the value of financial instruments as a result of changes in market prices (other than those arising from interest rate risk or foreign exchange risk), whether caused by factors specific to an individual investment, its issuer, or all factors affecting all instruments traded in a market or market segment. |
The Fund is also exposed to additional risks from investing in derivatives, such as liquidity risk and counterparty credit risk. Liquidity risk is the risk that the Fund will be unable to close out the derivative in the open market in a timely manner. Counterparty credit risk is the risk that the counterparty will not be able to fulfill its obligation to the Fund. Counterparty credit risk related to exchange-traded futures contracts may be mitigated by the protection provided by the exchange on which they trade.
Investing in derivatives may involve greater risks than investing in the underlying assets directly and, to varying degrees, may involve risk of loss in excess of any initial investment and collateral received and amounts recognized in the Statement of Assets and Liabilities. In addition, there may be the risk that the change in value of the derivative contract does not correspond to the change in value of the underlying instrument.
Futures Contracts. A futures contract is an agreement between two parties to buy or sell a specified underlying instrument for a fixed price at a specified future date. The Fund used futures contracts to manage its exposure to the stock market.
Upon entering into a futures contract, a fund is required to deposit either cash or securities (initial margin) with a clearing broker in an amount equal to a certain percentage of the face value of the contract. Futures contracts are marked-to-market daily and subsequent daily payments (variation margin) are made or received by a fund depending on the daily fluctuations in the value of the futures contracts and are recorded as unrealized appreciation or (depreciation). This receivable and/or payable, if any, is included in daily variation margin for derivative instruments in the Statement of Assets and Liabilities. Realized gain or (loss) is recorded upon the expiration or closing of a futures contract.
Any open futures contracts at period end are presented in the Schedule of Investments under the caption "Futures Contracts". The underlying face amount at value reflects each contract's exposure to the underlying instrument or index at period end. Securities deposited to meet initial margin requirements are identified in the Schedule of Investments.
During the period the Fund recognized net realized gain (loss) of $(26,794) and a change in net unrealized appreciation (depreciation) of $28,133 related to its investment in futures contracts. These amounts are included in the Statement of Operations.
5. Purchases and Sales of Investments.
Purchases and sales of securities, other than short-term securities, aggregated $8,337,407 and $8,772,794, respectively.
6. Fees and Other Transactions with Affiliates.
Management Fee. Fidelity Management & Research Company (the investment adviser) and its affiliates provide the Fund with investment management related services for which the Fund pays a monthly management fee. The management fee is the sum of an individual fund fee rate that is based on an annual rate of .60% of the Fund's average net assets and an annualized group fee rate that averaged .25% during the period. The group fee rate is based upon the average net assets of all the mutual funds advised by the investment adviser, including any mutual funds previously advised by the investment adviser that are currently advised by Fidelity SelectCo, LLC, an affiliate of the investment adviser. The group fee rate decreases as assets under management increase and increases as assets under management decrease. In addition, the management fee is subject to a performance adjustment (up to a maximum of +/- .10% of the Fund's average net assets over a 36 month performance period). The upward or downward adjustment to the management fee is based on the relative investment performance of Class I of the Fund as compared to its benchmark index, the Russell 3000 Index, over the same 36 month performance period. For the reporting period, the total annual management fee rate, including the performance adjustment, was .79% of the Fund's average net assets. The performance adjustment included in the management fee rate may be higher or lower than the maximum performance adjustment rate due to the difference between the average net assets for the reporting and performance periods.
Distribution and Service Plan Fees. In accordance with Rule 12b-1 of the 1940 Act, the Fund has adopted separate Distribution and Service Plans for each class of shares. Certain classes pay Fidelity Distributors Corporation (FDC), an affiliate of the investment adviser, separate Distribution and Service Fees, each of which is based on an annual percentage of each class' average net assets. In addition, FDC may pay financial intermediaries for selling shares of the Fund and providing shareholder support services. For the period, the Distribution and Service Fee rates, total fees and amounts retained by FDC were as follows:
| Distribution Fee | Service Fee | Total Fees | Retained by FDC |
|
| Class A | -% | .25% | $6,743 | $6,743 |
| Class T | .25% | .25% | 6,542 | 6,542 |
| Class C | .75% | .25% | 13,689 | 13,689 |
| $26,974 | $26,974 |
Sales Load. FDC may receive a front-end sales charge of up to 5.75% for selling Class A shares and 3.50% for selling Class T shares, some of which is paid to financial intermediaries for selling shares of the Fund. Depending on the holding period, FDC may receive contingent deferred sales charges levied on Class A, Class T, and Class C redemptions. The deferred sales charges are 1.00% for Class C shares, 1.00% for certain purchases of Class A shares and .25% for certain purchases of Class T shares.
For the period, sales charge amounts retained by FDC were as follows:
| Retained by FDC |
|
| Class A | $6,177 |
| Class T | 223 |
| Class C(a) | 687 |
| $7,087 |
(a) When Class C shares are initially sold, FDC pays commissions from its own resources to financial intermediaries through which the sales are made.
Transfer Agent Fees. Fidelity Investments Institutional Operations Company, Inc., (FIIOC), an affiliate of the investment adviser, is the transfer, dividend disbursing and shareholder servicing agent for each class of the Fund. FIIOC receives account fees and asset-based fees that vary according to the account size and type of account of the shareholders of the respective classes of the Fund. FIIOC pays for typesetting, printing and mailing of shareholder reports, except proxy statements.
For the period, transfer agent fees for each class were as follows:
| Amount | % of Class-Level Average Net Assets |
|
| Class A | $6,507 | .24 |
| Class T | 3,444 | .26 |
| Class C | 2,696 | .20 |
| Class I | 3,418 | .15 |
| $16,065 |
Accounting Fees. Fidelity Service Company, Inc. (FSC), an affiliate of the investment adviser, maintains the Fund's accounting records. The fee is based on the level of average net assets for each month.
Brokerage Commissions. The Fund placed a portion of its portfolio transactions with brokerage firms which are affiliates of the investment adviser. Brokerage commissions are included in net realized gain (loss) and change in net unrealized appreciation (depreciation) in the Statement of Operations. The commissions paid to these affiliated firms were $426 for the period.
Interfund Trades. The Fund may purchase from or sell securities to other Fidelity Funds under procedures adopted by the Board. The procedures have been designed to ensure these interfund trades are executed in accordance with Rule 17a-7 of the 1940 Act. Interfund trades are included within the respective purchases and sales amounts shown in the Purchases and Sales of Investments note.
Other. During the period, the investment adviser reimbursed the Fund $2,547 for an operational error which is included in Net Realized Gain (Loss) in the accompanying Statement of Operations
7. Committed Line of Credit.
The Fund participates with other funds managed by the investment adviser or an affiliate in a $4.25 billion credit facility (the "line of credit") to be utilized for temporary or emergency purposes to fund shareholder redemptions or for other short-term liquidity purposes. The Fund has agreed to pay commitment fees on its pro-rata portion of the line of credit, which amounted to $12 and is reflected in Miscellaneous expenses on the Statement of Operations. During the period, the Fund did not borrow on this line of credit.
8. Expense Reductions.
The investment adviser contractually agreed to reimburse each class to the extent annual operating expenses exceeded certain levels of average net assets as noted in the table below. This reimbursement will remain in place through June 30, 2017. Some expenses, for example interest expense, including commitment fees, are excluded from this reimbursement.
The following classes were in reimbursement during the period:
| Expense Limitations | Reimbursement | |
| Class A | 1.55% | $32,601 |
| Class T | 1.80% | 15,516 |
| Class C | 2.30% | 15,886 |
| Class I | 1.30% | 19,896 |
| $83,899 |
Commissions paid to certain brokers with whom the investment adviser, or its affiliates, places trades on behalf of the Fund include an amount in addition to trade execution, which may be rebated back to the Fund to offset certain expenses. This amount totaled $955 for the period.
In addition, during the period the investment adviser reimbursed and/or waived a portion of fund-level operating expenses in the amount of $58 and a portion of class-level operating expenses as follows:
| Amount | |
| Class A | $11 |
| Class T | 8 |
| Class C | 8 |
| Class I | 8 |
| Total | $35 |
9. Distributions to Shareholders.
Distributions to shareholders of each class were as follows:
| Year ended April 30, 2016 | Year ended April 30, 2015 | |
| From net investment income | ||
| Class A | $– | $1,990 |
| Class T | – | 2,020 |
| Class I | – | 4,774 |
| Total | $– | $8,784 |
| From net realized gain | ||
| Class A | $28,471 | $31,194 |
| Class T | 16,290 | 34,008 |
| Class C | 15,945 | 51,111 |
| Class I | 17,342 | 40,616 |
| Total | $78,048 | $156,929 |
10. Share Transactions.
Share transactions for each class were as follows and may contain automatic conversions between classes or exchanges between affiliated funds:
| Shares | Shares | Dollars | Dollars | |
| Year ended April 30, 2016 | Year ended April 30, 2015 | Year ended April 30, 2016 | Year ended April 30, 2015 | |
| Class A | ||||
| Shares sold | 70,567 | 244,795 | $758,382 | $2,682,803 |
| Reinvestment of distributions | 2,331 | 2,832 | 26,229 | 30,556 |
| Shares redeemed | (106,527) | (114,029) | (1,162,165) | (1,198,530) |
| Net increase (decrease) | (33,629) | 133,598 | $(377,554) | $1,514,829 |
| Class T | ||||
| Shares sold | 8,615 | 102,961 | $93,355 | $1,112,751 |
| Reinvestment of distributions | 1,449 | 3,335 | 16,290 | 36,027 |
| Shares redeemed | (96,589) | (84,812) | (1,049,955) | (923,756) |
| Net increase (decrease) | (86,525) | 21,484 | $(940,310) | $225,022 |
| Class C | ||||
| Shares sold | 32,297 | 144,045 | $350,788 | $1,556,025 |
| Reinvestment of distributions | 1,393 | 4,679 | 15,570 | 50,538 |
| Shares redeemed | (101,079) | (269,041) | (1,079,870) | (2,793,045) |
| Net increase (decrease) | (67,389) | (120,317) | $(713,512) | $(1,186,482) |
| Class I | ||||
| Shares sold | 235,816 | 111,471 | $2,558,721 | $1,209,986 |
| Reinvestment of distributions | 1,488 | 4,075 | 16,789 | 44,003 |
| Shares redeemed | (83,510) | (124,299) | (909,764) | (1,324,355) |
| Net increase (decrease) | 153,794 | (8,753) | $1,665,746 | $(70,366) |
11. Other.
The Fund's organizational documents provide former and current trustees and officers with a limited indemnification against liabilities arising in connection with the performance of their duties to the Fund. In the normal course of business, the Fund may also enter into contracts that provide general indemnifications. The Fund's maximum exposure under these arrangements is unknown as this would be dependent on future claims that may be made against the Fund. The risk of material loss from such claims is considered remote.
Report of Independent Registered Public Accounting Firm
To the Trustees of Fidelity Commonwealth Trust and Shareholders of Fidelity Advisor Event Driven Opportunities Fund:
In our opinion, the accompanying statement of assets and liabilities, including the schedule of investments, and the related statements of operations and of changes in net assets and the financial highlights present fairly, in all material respects, the financial position of Fidelity Advisor Event Driven Opportunities Fund (a fund of Fidelity Commonwealth Trust) at April 30, 2016, the results of its operations for the year then ended, the changes in its net assets for each of the two years in the period then ended and the financial highlights for each of the periods indicated, in conformity with accounting principles generally accepted in the United States of America. These financial statements and financial highlights (hereafter referred to as “financial statements”) are the responsibility of the Fidelity Advisor Event Driven Opportunities Fund’s management. Our responsibility is to express an opinion on these financial statements based on our audits. We conducted our audits of these financial statements in accordance with the standards of the Public Company Accounting Oversight Board (United States). Those standards require that we plan and perform the audit to obtain reasonable assurance about whether the financial statements are free of material misstatement. An audit includes examining, on a test basis, evidence supporting the amounts and disclosures in the financial statements, assessing the accounting principles used and significant estimates made by management, and evaluating the overall financial statement presentation. We believe that our audits, which included confirmation of securities at April 30, 2016 by correspondence with the custodian and brokers, provide a reasonable basis for our opinion.
PricewaterhouseCoopers LLP
Boston, Massachusetts
June 17, 2016
Trustees and Officers
The Trustees, Members of the Advisory Board (if any), and officers of the trust and fund, as applicable, are listed below. The Board of Trustees governs the fund and is responsible for protecting the interests of shareholders. The Trustees are experienced executives who meet periodically throughout the year to oversee the fund's activities, review contractual arrangements with companies that provide services to the fund, oversee management of the risks associated with such activities and contractual arrangements, and review the fund's performance. Each of the Trustees oversees 170 funds.
The Trustees hold office without limit in time except that (a) any Trustee may resign; (b) any Trustee may be removed by written instrument, signed by at least two-thirds of the number of Trustees prior to such removal; (c) any Trustee who requests to be retired or who has become incapacitated by illness or injury may be retired by written instrument signed by a majority of the other Trustees; and (d) any Trustee may be removed at any special meeting of shareholders by a two-thirds vote of the outstanding voting securities of the trust. Each Trustee who is not an interested person (as defined in the 1940 Act) of the trust and the fund is referred to herein as an Independent Trustee. Each Independent Trustee shall retire not later than the last day of the calendar year in which his or her 75th birthday occurs. The Independent Trustees may waive this mandatory retirement age policy with respect to individual Trustees. Officers and Advisory Board Members hold office without limit in time, except that any officer or Advisory Board Member may resign or may be removed by a vote of a majority of the Trustees at any regular meeting or any special meeting of the Trustees. Except as indicated, each individual has held the office shown or other offices in the same company for the past five years.
The fund’s Statement of Additional Information (SAI) includes more information about the Trustees. To request a free copy, call Fidelity at 1-877-208-0098.
Experience, Skills, Attributes, and Qualifications of the Trustees. The Governance and Nominating Committee has adopted a statement of policy that describes the experience, qualifications, attributes, and skills that are necessary and desirable for potential Independent Trustee candidates (Statement of Policy). The Board believes that each Trustee satisfied at the time he or she was initially elected or appointed a Trustee, and continues to satisfy, the standards contemplated by the Statement of Policy. The Governance and Nominating Committee also engages professional search firms to help identify potential Independent Trustee candidates who have the experience, qualifications, attributes, and skills consistent with the Statement of Policy. From time to time, additional criteria based on the composition and skills of the current Independent Trustees, as well as experience or skills that may be appropriate in light of future changes to board composition, business conditions, and regulatory or other developments, have also been considered by the professional search firms and the Governance and Nominating Committee. In addition, the Board takes into account the Trustees' commitment and participation in Board and committee meetings, as well as their leadership of standing and ad hoc committees throughout their tenure.
In determining that a particular Trustee was and continues to be qualified to serve as a Trustee, the Board has considered a variety of criteria, none of which, in isolation, was controlling. The Board believes that, collectively, the Trustees have balanced and diverse experience, qualifications, attributes, and skills, which allow the Board to operate effectively in governing the fund and protecting the interests of shareholders. Information about the specific experience, skills, attributes, and qualifications of each Trustee, which in each case led to the Board's conclusion that the Trustee should serve (or continue to serve) as a trustee of the fund, is provided below.
Board Structure and Oversight Function. James C. Curvey is an interested person and currently serves as Chairman. The Trustees have determined that an interested Chairman is appropriate and benefits shareholders because an interested Chairman has a personal and professional stake in the quality and continuity of services provided to the fund. Independent Trustees exercise their informed business judgment to appoint an individual of their choosing to serve as Chairman, regardless of whether the Trustee happens to be independent or a member of management. The Independent Trustees have determined that they can act independently and effectively without having an Independent Trustee serve as Chairman and that a key structural component for assuring that they are in a position to do so is for the Independent Trustees to constitute a substantial majority for the Board. The Independent Trustees also regularly meet in executive session. Ned C. Lautenbach serves as Chairman of the Independent Trustees and as such (i) acts as a liaison between the Independent Trustees and management with respect to matters important to the Independent Trustees and (ii) with management prepares agendas for Board meetings.
Fidelity® funds are overseen by different Boards of Trustees. The fund's Board oversees Fidelity's high income and certain equity funds, and other Boards oversee Fidelity's investment-grade bond, money market, asset allocation, and sector funds. The asset allocation funds may invest in Fidelity® funds overseen by the fund's Board. The use of separate Boards, each with its own committee structure, allows the Trustees of each group of Fidelity® funds to focus on the unique issues of the funds they oversee, including common research, investment, and operational issues. On occasion, the separate Boards establish joint committees to address issues of overlapping consequences for the Fidelity® funds overseen by each Board.
The Trustees operate using a system of committees to facilitate the timely and efficient consideration of all matters of importance to the Trustees, the fund, and fund shareholders and to facilitate compliance with legal and regulatory requirements and oversight of the fund's activities and associated risks. The Board, acting through its committees, has charged FMR and its affiliates with (i) identifying events or circumstances the occurrence of which could have demonstrably adverse effects on the fund's business and/or reputation; (ii) implementing processes and controls to lessen the possibility that such events or circumstances occur or to mitigate the effects of such events or circumstances if they do occur; and (iii) creating and maintaining a system designed to evaluate continuously business and market conditions in order to facilitate the identification and implementation processes described in (i) and (ii) above. Because the day-to-day operations and activities of the fund are carried out by or through FMR, its affiliates, and other service providers, the fund's exposure to risks is mitigated but not eliminated by the processes overseen by the Trustees. While each of the Board's committees has responsibility for overseeing different aspects of the fund's activities, oversight is exercised primarily through the Operations, Audit, and Compliance Committees. In addition, the Independent Trustees have worked with FMR to enhance the Board's oversight of investment and financial risks, legal and regulatory risks, technology risks, and operational risks, including the development of additional risk reporting to the Board. For example, a working group comprised of Independent Trustees and FMR has worked and continues to work to review the Fidelity® funds' valuation-related activities, reporting and risk management. Appropriate personnel, including but not limited to the fund's Chief Compliance Officer (CCO), FMR's internal auditor, the independent accountants, the fund's Treasurer and portfolio management personnel, make periodic reports to the Board's committees, as appropriate, including an annual review of Fidelity's risk management program for the Fidelity® funds. The responsibilities of each standing committee, including their oversight responsibilities, are described further under "Standing Committees of the Trustees."
Interested Trustees*:
Correspondence intended for a Trustee who is an interested person may be sent to Fidelity Investments, 245 Summer Street, Boston, Massachusetts 02210.
Name, Year of Birth; Principal Occupations and Other Relevant Experience+
James C. Curvey (1935)
Year of Election or Appointment: 2007
Trustee
Chairman of the Board of Trustees
Mr. Curvey also serves as Trustee of other Fidelity® funds. Mr. Curvey is a Director of Fidelity Research & Analysis Co. (investment adviser firm, 2009-present), and Vice Chairman (2007-present) and Director of FMR LLC (diversified financial services company). In addition, Mr. Curvey serves as an Overseer for the Boston Symphony Orchestra and a member of the board of Artis-Naples, Naples, Florida, and as a Trustee for Brewster Academy, Wolfeboro, New Hampshire. Previously, Mr. Curvey served as a Director of Fidelity Investments Money Management, Inc. (investment adviser firm, 2009-2014) and a Director of FMR and FMR Co., Inc. (investment adviser firms, 2007-2014).
Charles S. Morrison (1960)
Year of Election or Appointment: 2014
Trustee
Mr. Morrison also serves as Trustee of other funds. He serves as a Director of Fidelity Investments Money Management, Inc. (FIMM) (investment adviser firm, 2014-present), Director of Fidelity SelectCo, LLC (investment adviser firm, 2014-present), President, Asset Management (2014-present), and is an employee of Fidelity Investments. Previously, Mr. Morrison served as Vice President of Fidelity's Fixed Income and Asset Allocation Funds (2012-2014), President, Fixed Income (2011-2014), Vice President of Fidelity's Money Market Funds (2005-2009), President, Money Market Group Leader of FMR (investment adviser firm, 2009), and Senior Vice President, Money Market Group of FMR (2004-2009). Mr. Morrison also served as Vice President of Fidelity's Bond Funds (2002-2005), certain Balanced Funds (2002-2005), and certain Asset Allocation Funds (2002-2007), and as Senior Vice President (2002-2005) of Fidelity's Bond Division.
* Determined to be an “Interested Trustee” by virtue of, among other things, his or her affiliation with the trust or various entities under common control with FMR.
+ The information includes the Trustee's principal occupation during the last five years and other information relating to the experience, attributes, and skills relevant to the Trustee's qualifications to serve as a Trustee, which led to the conclusion that the Trustee should serve as a Trustee for the fund.
Independent Trustees:
Correspondence intended for an Independent Trustee may be sent to Fidelity Investments, P.O. Box 55235, Boston, Massachusetts 02205-5235.
Name, Year of Birth; Principal Occupations and Other Relevant Experience+
Dennis J. Dirks (1948)
Year of Election or Appointment: 2005
Trustee
Mr. Dirks also serves as Trustee of other Fidelity® funds. Prior to his retirement in May 2003, Mr. Dirks was Chief Operating Officer and a member of the Board of The Depository Trust & Clearing Corporation (DTCC). He also served as President, Chief Operating Officer, and Board member of The Depository Trust Company (DTC) and President and Board member of the National Securities Clearing Corporation (NSCC). In addition, Mr. Dirks served as Chief Executive Officer and Board member of the Government Securities Clearing Corporation, Chief Executive Officer and Board member of the Mortgage-Backed Securities Clearing Corporation, as a Trustee and a member of the Finance Committee of Manhattan College (2005-2008), as a Trustee and a member of the Finance Committee of AHRC of Nassau County (2006-2008), and as a member of the Independent Directors Council (IDC) Governing Council (2010-2015). Mr. Dirks is a member of the Board of Directors for The Brookville Center for Children's Services, Inc. (2009-present).
Alan J. Lacy (1953)
Year of Election or Appointment: 2008
Trustee
Mr. Lacy also serves as Trustee of other Fidelity® funds. Mr. Lacy serves as Chairman (2014-present) and a member (2010-present) of the Board of Directors of Dave & Buster's Entertainment, Inc. (restaurant and entertainment complexes) and a Director of Bristol-Myers Squibb Company (global pharmaceuticals, 2008-present). He is a Trustee of the California Chapter of The Nature Conservancy (2015-present) and a Director of the Center for Advanced Study in the Behavioral Sciences at Stanford University (2015-present). In addition, Mr. Lacy served as Senior Adviser (2007-2014) of Oak Hill Capital Partners, L.P. (private equity) and also served as Chief Executive Officer (2005) and Vice Chairman (2005-2006) of Sears Holdings Corporation (retail) and Chief Executive Officer and Chairman of the Board of Sears, Roebuck and Co. (retail, 2000-2005). Previously, Mr. Lacy served as Chairman (2008-2011) and a member (2006-2015) of the Board of Trustees of the National Parks Conservation Association and as a member of the Board of Directors for The Western Union Company (global money transfer, 2006-2011), The Hillman Companies, Inc. (hardware wholesalers, 2010-2014), and Earth Fare, Inc. (retail grocery, 2010-2014).
Ned C. Lautenbach (1944)
Year of Election or Appointment: 2000
Trustee
Chairman of the Independent Trustees
Mr. Lautenbach also serves as Trustee of other Fidelity® funds. Mr. Lautenbach currently serves as the Lead Director of the Eaton Corporation Board of Directors (diversified industrial, 1997-present). Mr. Lautenbach is Chairman of the Board of Directors of Artis-Naples in Naples, Florida (2012-present), a member of the Council on Foreign Relations (1994-present), and a member of the Board of Governors, State University System of Florida (2013-present). Previously, Mr. Lautenbach was a Partner/Advisory Partner at Clayton, Dubilier & Rice, LLC (private equity investment, 1998-2010), as well as a Director of Sony Corporation (2006-2007).
Joseph Mauriello (1944)
Year of Election or Appointment: 2008
Trustee
Mr. Mauriello also serves as Trustee of other Fidelity® funds. Prior to his retirement in January 2006, Mr. Mauriello served in numerous senior management positions including Deputy Chairman and Chief Operating Officer (2004-2005), and Vice Chairman of Financial Services (2002-2004) of KPMG LLP US (professional services, 1965-2005). Mr. Mauriello currently serves as a member of the Board of Directors of XL Group plc. (global insurance and re-insurance, 2006-present) and the Independent Directors Council (IDC) Governing Council (2015-present). Previously, Mr. Mauriello served as a Director of the Hamilton Funds of the Bank of New York (2006-2007) and of Arcadia Resources Inc. (health care services and products, 2007-2012).
Robert W. Selander (1950)
Year of Election or Appointment: 2011
Trustee
Mr. Selander also serves as Trustee of other Fidelity® funds. Mr. Selander serves as a Director of The Western Union Company (global money transfer, 2014-present) and a non-executive Chairman of Health Equity, Inc. (health savings custodian, 2015-present). Previously, Mr. Selander served as a Member of the Advisory Board of certain Fidelity® funds (2011), and Executive Vice Chairman (2010), Chief Executive Officer (2009-2010), and President and Chief Executive Officer (1997-2009) of Mastercard, Inc.
Cornelia M. Small (1944)
Year of Election or Appointment: 2005
Trustee
Ms. Small also serves as Trustee of other Fidelity® funds. Ms. Small is a member of the Board of Directors (2009-present) and Chair of the Investment Committee (2010-present) of the Teagle Foundation. Ms. Small also serves on the Investment Committee of the Berkshire Taconic Community Foundation (2008-present). Previously, Ms. Small served as Chairperson (2002-2008) and a member of the Investment Committee and Chairperson (2008-2012) and a member of the Board of Trustees of Smith College. In addition, Ms. Small served as Chief Investment Officer, Director of Global Equity Investments, and a member of the Board of Directors of Scudder, Stevens & Clark and Scudder Kemper Investments.
William S. Stavropoulos (1939)
Year of Election or Appointment: 2002
Trustee
Vice Chairman of the Independent Trustees
Mr. Stavropoulos also serves as Trustee of other Fidelity® funds. Mr. Stavropoulos serves as President and Founder of the Michigan Baseball Foundation, the Great Lakes Loons (2007-present). Mr. Stavropoulos is Chairman Emeritus of the Board of Directors of The Dow Chemical Company, where he previously served in numerous senior management positions, including President, CEO (1995-2000; 2002-2004), Chairman of the Executive Committee (2000-2006), and as a member of the Board of Directors (1990-2006). Currently, Mr. Stavropoulos is Chairman of the Board of Directors of Univar Inc. (global distributor of commodity and specialty chemicals), a Director of Teradata Corporation (data warehousing and technology solutions), and Maersk Inc. (industrial conglomerate), and a member of the Advisory Board for Metalmark Capital LLC (private equity investment, 2005-present). Mr. Stavropoulos is an operating advisor to Clayton, Dubilier & Rice, LLC (private equity investment). In addition, Mr. Stavropoulos is a member of the University of Notre Dame Advisory Council for the College of Science, a Trustee of the Rollin L. Gerstacker Foundation, and a Director of the Naples Philharmonic Center for the Arts. Previously, Mr. Stavropoulos served as a Director of Chemical Financial Corporation (bank holding company, 1993-2012) and Tyco International, Ltd. (multinational manufacturing and services, 2007-2012).
David M. Thomas (1949)
Year of Election or Appointment: 2008
Trustee
Mr. Thomas also serves as Trustee of other Fidelity® funds. Mr. Thomas serves as Non-Executive Chairman of the Board of Directors of Fortune Brands Home and Security (home and security products, 2011-present), as a member of the Board of Directors (2004-present) and Presiding Director (2013-present) of Interpublic Group of Companies, Inc. (marketing communication), and as a member of the Board of Trustees of the University of Florida (2013-present). Previously, Mr. Thomas served as Executive Chairman (2005-2006) and Chairman and Chief Executive Officer (2000-2005) of IMS Health, Inc. (pharmaceutical and healthcare information solutions), and a Director of Fortune Brands, Inc. (consumer products, 2000-2011).
+ The information includes the Trustee's principal occupation during the last five years and other information relating to the experience, attributes, and skills relevant to the Trustee's qualifications to serve as a Trustee, which led to the conclusion that the Trustee should serve as a Trustee for the fund.
Advisory Board Members and Officers:
Correspondence intended for an officer or Peter S. Lynch may be sent to Fidelity Investments, 245 Summer Street, Boston, Massachusetts 02210. Officers appear below in alphabetical order.
Name, Year of Birth; Principal Occupation
Peter S. Lynch (1944)
Year of Election or Appointment: 2003
Member of the Advisory Board
Mr. Lynch also serves as Member of the Advisory Board of other Fidelity® funds. Mr. Lynch is Vice Chairman and a Director of FMR (investment adviser firm) and FMR Co., Inc. (investment adviser firm). In addition, Mr. Lynch serves as a Trustee of Boston College and as the Chairman of the Inner-City Scholarship Fund. Previously, Mr. Lynch served on the Special Olympics International Board of Directors (1997-2006).
Marc R. Bryant (1966)
Year of Election or Appointment: 2015
Secretary and Chief Legal Officer (CLO)
Mr. Bryant also serves as Secretary and CLO of other funds. Mr. Bryant serves as CLO, Secretary, and Senior Vice President of Fidelity Management & Research Company (investment adviser firm, 2015-present) and FMR Co., Inc. (investment adviser firm, 2015-present); Secretary of Fidelity SelectCo, LLC (investment adviser firm, 2015-present) and Fidelity Investments Money Management, Inc. (investment adviser firm, 2015-present); and CLO of Fidelity Management & Research (Hong Kong) Limited and FMR Investment Management (U.K.) Limited (investment adviser firms, 2015-present) and Fidelity Management & Research (Japan) Limited (investment adviser firm, 2016-present). He is Senior Vice President and Deputy General Counsel of FMR LLC (diversified financial services company). Previously, Mr. Bryant served as Secretary and CLO of Fidelity Rutland Square Trust II (2010-2014) and Assistant Secretary of Fidelity's Fixed Income and Asset Allocation Funds (2013-2015). Prior to joining Fidelity Investments, Mr. Bryant served as a Senior Vice President and the Head of Global Retail Legal for AllianceBernstein L.P. (2006-2010), and as the General Counsel for ProFund Advisors LLC (2001-2006).
William C. Coffey (1969)
Year of Election or Appointment: 2009
Assistant Secretary
Mr. Coffey also serves as Assistant Secretary of other funds. He is Senior Vice President and Deputy General Counsel of FMR LLC (diversified financial services company, 2010-present), and is an employee of Fidelity Investments. Previously, Mr. Coffey served as Vice President and Associate General Counsel of FMR LLC (2005-2009).
Jeffrey S. Christian (1961)
Year of Election or Appointment: 2016
Assistant Treasurer
Mr. Christian also serves as Assistant Treasurer of other funds. Mr. Christian is an employee of Fidelity Investments (2003-present).
Jonathan Davis (1968)
Year of Election or Appointment: 2010
Assistant Treasurer
Mr. Davis also serves as Assistant Treasurer of other funds, and is an employee of Fidelity Investments. Previously, Mr. Davis served as Vice President and Associate General Counsel of FMR LLC (diversified financial services company, 2003-2010).
Adrien E. Deberghes (1967)
Year of Election or Appointment: 2016
Assistant Treasurer
Mr. Deberghes also serves as an officer of other funds. He is an employee of Fidelity Investments (2008-present). Prior to joining Fidelity Investments, Mr. Deberghes was Senior Vice President of Mutual Fund Administration at State Street Corporation (2007-2008), Senior Director of Mutual Fund Administration at Investors Bank & Trust (2005-2007), and Director of Finance for Dunkin' Brands (2000-2005). Previously, Mr. Deberghes served in other fund officer roles.
Stephanie J. Dorsey (1969)
Year of Election or Appointment: 2010
Assistant Treasurer
Ms. Dorsey also serves as an officer of other funds. She is an employee of Fidelity Investments (2008-present) and has served in other fund officer roles. Prior to joining Fidelity Investments, Ms. Dorsey served as Treasurer (2004-2008) of the JPMorgan Mutual Funds and Vice President (2004-2008) of JPMorgan Chase Bank.
Howard J. Galligan III (1966)
Year of Election or Appointment: 2014
Chief Financial Officer
Mr. Galligan also serves as Chief Financial Officer of other funds. Mr. Galligan serves as President of Fidelity Pricing and Cash Management Services (FPCMS) (2014-present) and as a Director of Strategic Advisers, Inc. (investment adviser firm, 2008-present). Previously, Mr. Galligan served as Chief Administrative Officer of Asset Management (2011-2014) and Chief Operating Officer and Senior Vice President of Investment Support for Strategic Advisers, Inc. (2003-2011).
Scott C. Goebel (1968)
Year of Election or Appointment: 2015
Vice President
Mr. Goebel serves as Vice President of other funds and is an employee of Fidelity Investments (2001-present). Previously, Mr. Goebel served as Secretary of Fidelity SelectCo, LLC (investment adviser firm, 2013-2015), Fidelity Investments Money Management, Inc. (FIMM) (investment adviser firm, 2010-2015), and Fidelity Research and Analysis Company (FRAC) (investment adviser firm, 2010-2015); General Counsel, Secretary, and Senior Vice President of Fidelity Management & Research Company (investment adviser firm, 2008-2015) and FMR Co., Inc. (investment adviser firm, 2008-2015); Assistant Secretary of Fidelity Management & Research (Japan) Limited (investment adviser firm, 2008-2015) and Fidelity Management & Research (U.K.) Inc. (investment adviser firm, 2008-2015); Chief Legal Officer (CLO) of Fidelity Management & Research (Hong Kong) Limited (investment adviser firm, 2008-2015); Secretary and CLO of certain Fidelity® funds (2008-2015); Assistant Secretary of FIMM (2008-2010), FRAC (2008-2010), and certain funds (2007-2008); and as Vice President and Secretary of Fidelity Distributors Corporation (FDC) (2005-2007).
Brian B. Hogan (1964)
Year of Election or Appointment: 2009
Vice President
Mr. Hogan also serves as Trustee or Vice President of other funds. Mr. Hogan serves as a Director of FMR Investment Management (U.K.) Limited (investment adviser firm, 2015-present) and Fidelity SelectCo, LLC (investment adviser firm, 2014-present) and President of the Equity Division of FMR (investment adviser firm, 2009-present). Previously, Mr. Hogan served as Senior Vice President, Equity Research of FMR (2006-2009) and as a portfolio manager. Mr. Brian B. Hogan is not related to Mr. Colm A. Hogan.
Colm A. Hogan (1973)
Year of Election or Appointment: 2016
Deputy Treasurer
Mr. Hogan also serves as an officer of other funds. Mr. Hogan is an employee of Fidelity Investments (2005-present). Mr. Colm A. Hogan is not related to Mr. Brian B. Hogan.
Chris Maher (1972)
Year of Election or Appointment: 2013
Assistant Treasurer
Mr. Maher serves as Assistant Treasurer of other funds. Mr. Maher is Vice President of Valuation Oversight and is an employee of Fidelity Investments. Previously, Mr. Maher served as Vice President of Asset Management Compliance (2013), Vice President of the Program Management Group of FMR (investment adviser firm, 2010-2013), and Vice President of Valuation Oversight (2008-2010).
John F. Papandrea (1972)
Year of Election or Appointment: 2016
Anti-Money Laundering (AML) Officer
Mr. Papandrea also serves as AML Officer of other funds. Mr. Papandrea is Vice President of FMR LLC (diversified financial services company, 2008-present) and is an employee of Fidelity Investments (2005-present).
Melissa M. Reilly (1971)
Year of Election or Appointment: 2014
Vice President of certain Equity Funds
Ms. Reilly also serves as Vice President of other funds. Ms. Reilly is an employee of Fidelity Investments (2004-present).
Kenneth B. Robins (1969)
Year of Election or Appointment: 2016
Chief Compliance Officer
Mr. Robins also serves as an officer of other funds. Mr. Robins serves as Executive Vice President of Fidelity Investments Money Management, Inc. (FIMM) (investment adviser firm, 2013-present) and is an employee of Fidelity Investments (2004-present). Previously, Mr. Robins served in other fund officer roles.
Stacie M. Smith (1974)
Year of Election or Appointment: 2016
President and Treasurer
Ms. Smith also serves as an officer of other funds. She is an employee of Fidelity Investments (2009-present) and has served in other fund officer roles. Prior to joining Fidelity Investments, Ms. Smith served as Senior Audit Manager of Ernst & Young LLP (1996-2009). Previously, Ms. Smith served as Deputy Treasurer of certain Fidelity® funds (2013-2016).
Renee Stagnone (1975)
Year of Election or Appointment: 2016
Assistant Treasurer
Ms. Stagnone also serves as an officer of other funds. Ms. Stagnone is an employee of Fidelity Investments (1997-present). Previously, Ms. Stagnone served as Deputy Treasurer of certain Fidelity® funds (2013-2016).
Shareholder Expense Example
As a shareholder of the Fund, you incur two types of costs: (1) transaction costs, including sales charges (loads) on purchase payments or redemption proceeds, and (2) ongoing costs, including management fees, distribution and/or service (12b-1) fees and other Fund expenses. This Example is intended to help you understand your ongoing costs (in dollars) of investing in the Fund and to compare these costs with the ongoing costs of investing in other mutual funds.
The Example is based on an investment of $1,000 invested at the beginning of the period and held for the entire period (November 1, 2015 to April 30, 2016).
Actual Expenses
The first line of the accompanying table for each class of the Fund provides information about actual account values and actual expenses. You may use the information in this line, together with the amount you invested, to estimate the expenses that you paid over the period. Simply divide your account value by $1,000.00 (for example, an $8,600 account value divided by $1,000.00 = 8.6), then multiply the result by the number in the first line for a class of the Fund under the heading entitled "Expenses Paid During Period" to estimate the expenses you paid on your account during this period. In addition, the Fund, as a shareholder in the underlying Fidelity Central Funds, will indirectly bear its pro-rata share of the fees and expenses incurred by the underlying Fidelity Central Funds. These fees and expenses are not included in the Fund's annualized expense ratio used to calculate the expense estimate in the table below.
Hypothetical Example for Comparison Purposes
The second line of the accompanying table for each class of the Fund provides information about hypothetical account values and hypothetical expenses based on a Class' actual expense ratio and an assumed rate of return of 5% per year before expenses, which is not the Class' actual return. The hypothetical account values and expenses may not be used to estimate the actual ending account balance or expenses you paid for the period. You may use this information to compare the ongoing costs of investing in the Fund and other funds. To do so, compare this 5% hypothetical example with the 5% hypothetical examples that appear in the shareholder reports of the other funds. In addition, the Fund, as a shareholder in the underlying Fidelity Central Funds, will indirectly bear its pro-rata share of the fees and expenses incurred by the underlying Fidelity Central Funds. These fees and expenses are not included in the Fund's annualized expense ratio used to calculate the expense estimate in the table below.
Please note that the expenses shown in the table are meant to highlight your ongoing costs only and do not reflect any transaction costs. Therefore, the second line of the table is useful in comparing ongoing costs only, and will not help you determine the relative total costs of owning different funds. In addition, if these transactional costs were included, your costs would have been higher.
| Annualized Expense Ratio-A | Beginning Account Value November 1, 2015 | Ending Account Value April 30, 2016 | Expenses Paid During Period-B November 1, 2015 to April 30, 2016 |
|
| Class A | 1.55% | |||
| Actual | $1,000.00 | $986.70 | $7.66 | |
| Hypothetical-C | $1,000.00 | $1,017.16 | $7.77 | |
| Class T | 1.80% | |||
| Actual | $1,000.00 | $985.80 | $8.89 | |
| Hypothetical-C | $1,000.00 | $1,015.91 | $9.02 | |
| Class C | 2.30% | |||
| Actual | $1,000.00 | $982.90 | $11.34 | |
| Hypothetical-C | $1,000.00 | $1,013.43 | $11.51 | |
| Class I | 1.30% | |||
| Actual | $1,000.00 | $987.70 | $6.42 | |
| Hypothetical-C | $1,000.00 | $1,018.40 | $6.52 |
A Annualized expense ratio reflects expenses net of applicable fee waivers.
B Expenses are equal to each Class' annualized expense ratio, multiplied by the average account value over the period, multiplied by 182/366 (to reflect the one-half year period).
C 5% return per year before expenses
Distributions (Unaudited)
The fund hereby designates as a capital gain dividend with respect to the taxable year ended April 30, 2016, $9,451, or, if subsequently determined to be different, the net capital gain of such year.
The fund will notify shareholders in January 2017 of amounts for use in preparing 2016 income tax returns.
![]()
AEDOI-ANN-0616
1.9585377.102
|
Fidelity® Event Driven Opportunities Fund Annual Report April 30, 2016 |
|
|
Contents
To view a fund's proxy voting guidelines and proxy voting record for the 12-month period ended June 30, visit http://www.fidelity.com/proxyvotingresults or visit the Securities and Exchange Commission's (SEC) web site at http://www.sec.gov.
You may also call 1-800-544-8544 to request a free copy of the proxy voting guidelines.
Standard & Poor's, S&P and S&P 500 are registered service marks of The McGraw-Hill Companies, Inc. and have been licensed for use by Fidelity Distributors Corporation.
Other third-party marks appearing herein are the property of their respective owners.
All other marks appearing herein are registered or unregistered trademarks or service marks of FMR LLC or an affiliated company. © 2016 FMR LLC. All rights reserved.
This report and the financial statements contained herein are submitted for the general information of the shareholders of the Fund. This report is not authorized for distribution to prospective investors in the Fund unless preceded or accompanied by an effective prospectus.
A fund files its complete schedule of portfolio holdings with the SEC for the first and third quarters of each fiscal year on Form N-Q. Forms N-Q are available on the SEC’s web site at http://www.sec.gov. A fund's Forms N-Q may be reviewed and copied at the SEC’s Public Reference Room in Washington, DC. Information regarding the operation of the SEC's Public Reference Room may be obtained by calling 1-800-SEC-0330.
For a complete list of a fund's portfolio holdings, view the most recent holdings listing, semiannual report, or annual report on Fidelity's web site at http://www.fidelity.com, http://www.advisor.fidelity.com, or http://www.401k.com, as applicable.
NOT FDIC INSURED •MAY LOSE VALUE •NO BANK GUARANTEE
Neither the Fund nor Fidelity Distributors Corporation is a bank.
Performance: The Bottom Line
Average annual total return reflects the change in the value of an investment, assuming reinvestment of distributions from dividend income and capital gains (the profits earned upon the sale of securities that have grown in value, if any) and assuming a constant rate of performance each year. The hypothetical investment and the average annual total returns do not reflect the deduction of taxes that a shareholder would pay on fund distributions or the redemption of fund shares. During periods of reimbursement by Fidelity, a fund’s total return will be greater than it would be had the reimbursement not occurred. How a fund did yesterday is no guarantee of how it will do tomorrow.
Average Annual Total Returns
| For the periods ended April 30, 2016 | Past 1 year | Life of fundA |
| Fidelity® Event Driven Opportunities Fund | (1.89)% | 5.56% |
A From December 12, 2013
$10,000 Over Life of Fund
Let's say hypothetically that $10,000 was invested in Fidelity® Event Driven Opportunities Fund on December 12, 2013, when the fund started.
The chart shows how the value of your investment would have changed, and also shows how the Russell 3000® Index performed over the same period.

| Period Ending Values | ||
|
| $11,377 | Fidelity® Event Driven Opportunities Fund |
|
| $11,992 | Russell 3000® Index |
Management's Discussion of Fund Performance
Market Recap: The S&P 500® index gained 1.21% for the 12 months ending April 30, 2016. Largely range-bound until mid-August, U.S. stocks suffered a steep, late-summer decline on concern about an economic slowdown in China. The market recovered in October, lifted by the U.S. Federal Reserve’s decision to delay raising near-term interest rates until mid-December, as well as a rate cut in China and economic stimulus in Europe. But continued oil-price weakness and U.S.-dollar strength pushed the S&P 500® to its worst January since 2009, followed by a volatile but ultimately flattish February, then a sharp rebound in March driven by U.S. jobs gains and perceived softening in the Fed’s rate-tightening posture. April brought minimal change. For the full period, growth-oriented and larger-cap stocks fared better overall than value and smaller-cap complements. Performance was split, as five of 10 S&P 500® sectors gained ground, with a wide gap separating leaders from laggards. Investor demand for more-stable and higher-yielding investments boosted traditionally defensive, dividend-rich groups such as utilities (+14%), telecommunication services (+10%) and consumer staples (+11%) – the latter also buoyed by rising wages and low inflation. Meanwhile, energy (-14%) foundered amid commodity weakness that also hurt materials (-4%). Comments from Portfolio Manager Arvind Navaratnam: For the year, the fund returned -1.89%, trailing the -0.18% result of the benchmark Russell 3000® Index. Versus the benchmark, stock selection hurt performance, as did the fund’s inherent small-cap bias because small caps lagged their large-cap peers, which dominate the Russell index. Our stake in Canada-based Valeant Pharmaceuticals International was the fund’s largest relative detractor. The stock underperformed during the period, as shares of Valeant tumbled in October after short-selling research firm Citron accused Valeant of filing fake invoices with one of its business partners in order to show increased revenue. Then, in mid-March, the firm said it may default on its debt and would not meet earnings targets. Valeant also announced an accounting error that it said would likely lead to financial restatements. On the flip side, the fund’s large stake in Journal Media Group was by far its biggest contributor. In March 2015, E.W. Scripps and Journal Communications Media announced their intent to merge the two firms’ broadcast assets and spin off both of their newspaper businesses into one company, Journal Media. Journal produces local newspapers in 14 markets across the United States. The stock popped in October after media firm Gannett announced it would acquire Journal at a premium. In March, Journal Media shareholders approved the deal, which was completed in April.The views expressed above reflect those of the portfolio manager(s) only through the end of the period as stated on the cover of this report and do not necessarily represent the views of Fidelity or any other person in the Fidelity organization. Any such views are subject to change at any time based upon market or other conditions and Fidelity disclaims any responsibility to update such views. These views may not be relied on as investment advice and, because investment decisions for a Fidelity fund are based on numerous factors, may not be relied on as an indication of trading intent on behalf of any Fidelity fund.
Investment Summary (Unaudited)
Top Ten Stocks as of April 30, 2016
| % of fund's net assets | % of fund's net assets 6 months ago | |
| Universal Corp. | 11.8 | 9.8 |
| Exterran Corp. | 3.3 | 0.0 |
| Time, Inc. | 3.2 | 0.8 |
| Mondelez International, Inc. | 3.1 | 0.9 |
| Triumph Group, Inc. | 3.0 | 1.0 |
| TopBuild Corp. | 3.0 | 0.8 |
| Outerwall, Inc. | 3.0 | 0.0 |
| The Madison Square Garden Co. | 2.9 | 0.9 |
| The Brink's Co. | 2.6 | 0.9 |
| Kimball Electronics, Inc. | 2.5 | 0.8 |
| 38.4 |
Top Five Market Sectors as of April 30, 2016
| % of fund's net assets | % of fund's net assets 6 months ago | |
| Consumer Discretionary | 25.2 | 29.7 |
| Consumer Staples | 14.9 | 14.2 |
| Industrials | 14.2 | 14.8 |
| Financials | 13.7 | 11.4 |
| Health Care | 9.7 | 7.2 |
Asset Allocation (% of fund's net assets)
| As of April 30, 2016* | ||
| Stocks and Equity Futures | 97.2% | |
| Short-Term Investments and Net Other Assets (Liabilities) | 2.8% | |

* Foreign investments - 2.9%
| As of October 31, 2015* | ||
| Stocks and Equity Futures | 99.6% | |
| Short-Term Investments and Net Other Assets (Liabilities) | 0.4% | |

* Foreign investments - 7.2%
Percentages shown as 0.0% may reflect amounts less than 0.05%.
Investments April 30, 2016
Showing Percentage of Net Assets
| Common Stocks - 89.0% | |||
| Shares | Value | ||
| CONSUMER DISCRETIONARY - 25.2% | |||
| Diversified Consumer Services - 2.1% | |||
| Apollo Education Group, Inc. Class A (non-vtg.) (a) | 456,600 | $3,561,480 | |
| Hotels, Restaurants & Leisure - 1.1% | |||
| Darden Restaurants, Inc. | 29,500 | 1,836,375 | |
| Household Durables - 3.0% | |||
| TopBuild Corp. (a) | 162,284 | 5,066,506 | |
| Internet & Catalog Retail - 0.9% | |||
| Liberty TripAdvisor Holdings, Inc. (a) | 66,500 | 1,466,990 | |
| Leisure Products - 1.8% | |||
| Vista Outdoor, Inc. (a) | 62,200 | 2,984,356 | |
| Media - 10.3% | |||
| Cable One, Inc. | 4,100 | 1,881,736 | |
| Gannett Co., Inc. | 79,700 | 1,342,945 | |
| The Madison Square Garden Co. (a) | 31,219 | 4,900,759 | |
| Time, Inc. | 369,900 | 5,437,530 | |
| Twenty-First Century Fox, Inc. Class B | 126,600 | 3,813,192 | |
| 17,376,162 | |||
| Specialty Retail - 5.9% | |||
| Barnes & Noble Education, Inc. (a) | 366,356 | 3,429,092 | |
| Outerwall, Inc. (b) | 121,300 | 5,010,903 | |
| Signet Jewelers Ltd. | 14,200 | 1,541,552 | |
| 9,981,547 | |||
| Textiles, Apparel & Luxury Goods - 0.1% | |||
| Fossil Group, Inc. (a) | 5,994 | 242,757 | |
| TOTAL CONSUMER DISCRETIONARY | 42,516,173 | ||
| CONSUMER STAPLES - 14.9% | |||
| Food Products - 3.1% | |||
| Mondelez International, Inc. | 120,300 | 5,168,088 | |
| Tobacco - 11.8% | |||
| Universal Corp. (b) | 365,927 | 19,961,318 | |
| TOTAL CONSUMER STAPLES | 25,129,406 | ||
| ENERGY - 3.3% | |||
| Energy Equipment & Services - 3.3% | |||
| Exterran Corp. (a) | 363,192 | 5,556,838 | |
| FINANCIALS - 13.7% | |||
| Capital Markets - 5.0% | |||
| Ashford, Inc. (a) | 24,987 | 1,136,909 | |
| Greenhill & Co., Inc. | 177,500 | 3,908,550 | |
| NorthStar Asset Management Group, Inc. | 265,796 | 3,306,502 | |
| 8,351,961 | |||
| Consumer Finance - 2.1% | |||
| Encore Capital Group, Inc. (a)(b) | 126,259 | 3,554,191 | |
| Insurance - 0.9% | |||
| FNF Group | 50,196 | 1,601,252 | |
| Real Estate Investment Trusts - 3.9% | |||
| Four Corners Property Trust, Inc. | 181,838 | 3,227,625 | |
| WP Glimcher, Inc. | 323,100 | 3,389,319 | |
| 6,616,944 | |||
| Thrifts & Mortgage Finance - 1.8% | |||
| Fannie Mae (a)(b) | 890,642 | 1,514,091 | |
| Freddie Mac (a)(b) | 967,639 | 1,499,840 | |
| 3,013,931 | |||
| TOTAL FINANCIALS | 23,138,279 | ||
| HEALTH CARE - 9.7% | |||
| Biotechnology - 2.0% | |||
| Baxalta, Inc. | 78,600 | 3,297,270 | |
| Health Care Equipment & Supplies - 2.3% | |||
| Halyard Health, Inc. (a) | 65,100 | 1,833,216 | |
| Masimo Corp. (a) | 45,300 | 1,963,755 | |
| 3,796,971 | |||
| Health Care Technology - 1.1% | |||
| Allscripts Healthcare Solutions, Inc. (a) | 141,400 | 1,894,760 | |
| Pharmaceuticals - 4.3% | |||
| DepoMed, Inc. (a)(b) | 202,400 | 3,517,712 | |
| Valeant Pharmaceuticals International, Inc. (United States) (a) | 52,300 | 1,744,728 | |
| Zoetis, Inc. Class A | 41,968 | 1,973,755 | |
| 7,236,195 | |||
| TOTAL HEALTH CARE | 16,225,196 | ||
| INDUSTRIALS - 14.2% | |||
| Aerospace & Defense - 4.7% | |||
| KLX, Inc.(a) | 57,700 | 1,945,644 | |
| Triumph Group, Inc. | 141,801 | 5,130,360 | |
| Vectrus, Inc. (a) | 37,089 | 799,639 | |
| 7,875,643 | |||
| Commercial Services & Supplies - 3.6% | |||
| Matthews International Corp. Class A | 33,500 | 1,763,440 | |
| The Brink's Co. | 129,400 | 4,378,896 | |
| 6,142,336 | |||
| Electrical Equipment - 1.9% | |||
| Babcock & Wilcox Enterprises, Inc. (a) | 141,192 | 3,226,237 | |
| Machinery - 2.4% | |||
| Allison Transmission Holdings, Inc. | 137,349 | 3,957,025 | |
| Professional Services - 1.3% | |||
| Insperity, Inc. (b) | 42,400 | 2,237,448 | |
| Trading Companies & Distributors - 0.3% | |||
| Now, Inc. (a)(b) | 28,200 | 509,292 | |
| TOTAL INDUSTRIALS | 23,947,981 | ||
| INFORMATION TECHNOLOGY - 7.1% | |||
| Electronic Equipment & Components - 2.5% | |||
| Kimball Electronics, Inc. (a) | 380,219 | 4,159,596 | |
| Internet Software & Services - 1.1% | |||
| Rackspace Hosting, Inc. (a) | 78,300 | 1,790,721 | |
| Semiconductors & Semiconductor Equipment - 1.0% | |||
| Marvell Technology Group Ltd. | 173,600 | 1,732,528 | |
| Software - 2.0% | |||
| CDK Global, Inc. | 39,400 | 1,874,258 | |
| Xura, Inc. (a) | 70,573 | 1,580,129 | |
| 3,454,387 | |||
| Technology Hardware, Storage & Peripherals - 0.5% | |||
| Quantum Corp. (a)(b) | 1,797,278 | 827,287 | |
| TOTAL INFORMATION TECHNOLOGY | 11,964,519 | ||
| MATERIALS - 0.9% | |||
| Containers & Packaging - 0.9% | |||
| Owens-Illinois, Inc. (a) | 83,100 | 1,534,026 | |
| TOTAL COMMON STOCKS | |||
| (Cost $149,360,347) | 150,012,418 | ||
| Principal Amount | Value | ||
| U.S. Treasury Obligations - 0.8% | |||
| U.S. Treasury Bills, yield at date of purchase 0.29% to 0.34% 5/5/16 to 5/26/16 (c) | |||
| (Cost $1,269,818) | 1,270,000 | 1,269,915 | |
| Shares | Value | ||
| Money Market Funds - 17.7% | |||
| Fidelity Cash Central Fund, 0.38% (d) | 15,254,506 | $15,254,506 | |
| Fidelity Securities Lending Cash Central Fund, 0.42% (d)(e) | 14,642,661 | 14,642,661 | |
| TOTAL MONEY MARKET FUNDS | |||
| (Cost $29,897,167) | 29,897,167 | ||
| TOTAL INVESTMENT PORTFOLIO - 107.5% | |||
| (Cost $180,527,332) | 181,179,500 | ||
| NET OTHER ASSETS (LIABILITIES) - (7.5)% | (12,567,470) | ||
| NET ASSETS - 100% | $168,612,030 |
| Futures Contracts | |||
| Expiration Date | Underlying Face Amount at Value | Unrealized Appreciation/(Depreciation) | |
| Purchased | |||
| Equity Index Contracts | |||
| 117 CME E-mini S&P 500 Index Contracts (United States) | June 2016 | 12,045,735 | $228,405 |
| 17 ICE Russell 2000 Index Contracts (United States) | June 2016 | 1,916,920 | 75,842 |
| TOTAL FUTURES CONTRACTS | $304,247 |
The face value of futures purchased as a percentage of Net Assets is 8.2%
Legend
(a) Non-income producing
(b) Security or a portion of the security is on loan at period end.
(c) Security or a portion of the security was pledged to cover margin requirements for futures contracts. At period end, the value of securities pledged amounted to $654,953.
(d) Affiliated fund that is generally available only to investment companies and other accounts managed by Fidelity Investments. The rate quoted is the annualized seven-day yield of the fund at period end. A complete unaudited listing of the fund's holdings as of its most recent quarter end is available upon request. In addition, each Fidelity Central Fund's financial statements, which are not covered by the Fund's Report of Independent Registered Public Accounting Firm, are available on the SEC's website or upon request.
(e) Investment made with cash collateral received from securities on loan.
Affiliated Central Funds
Information regarding fiscal year to date income earned by the Fund from investments in Fidelity Central Funds is as follows:
| Fund | Income earned |
| Fidelity Cash Central Fund | $32,930 |
| Fidelity Securities Lending Cash Central Fund | 313,283 |
| Total | $346,213 |
Other Affiliated Issuers
An affiliated company is a company in which the Fund has ownership of at least 5% of the voting securities. Fiscal year to date transactions with companies which are or were affiliates are as follows:
| Affiliate | Value, beginning of period | Purchases | Sales Proceeds | Dividend Income | Value, end of period |
| Journal Media Group, Inc. | $12,536,279 | $10,662,287 | $16,571,571 | $547,263 | $-- |
| Total | $12,536,279 | $10,662,287 | $16,571,571 | $547,263 | $-- |
Investment Valuation
The following is a summary of the inputs used, as of April 30, 2016, involving the Fund's assets and liabilities carried at fair value. The inputs or methodology used for valuing securities may not be an indication of the risk associated with investing in those securities. For more information on valuation inputs, and their aggregation into the levels used below, please refer to the Investment Valuation section in the accompanying Notes to Financial Statements.
| Valuation Inputs at Reporting Date: | ||||
| Description | Total | Level 1 | Level 2 | Level 3 |
| Investments in Securities: | ||||
| Equities: | ||||
| Consumer Discretionary | $42,516,173 | $42,516,173 | $-- | $-- |
| Consumer Staples | 25,129,406 | 25,129,406 | -- | -- |
| Energy | 5,556,838 | 5,556,838 | -- | -- |
| Financials | 23,138,279 | 23,138,279 | -- | -- |
| Health Care | 16,225,196 | 16,225,196 | -- | -- |
| Industrials | 23,947,981 | 23,947,981 | -- | -- |
| Information Technology | 11,964,519 | 11,964,519 | -- | -- |
| Materials | 1,534,026 | 1,534,026 | -- | -- |
| U.S. Government and Government Agency Obligations | 1,269,915 | -- | 1,269,915 | -- |
| Money Market Funds | 29,897,167 | 29,897,167 | -- | -- |
| Total Investments in Securities: | $181,179,500 | $179,909,585 | $1,269,915 | $-- |
| Derivative Instruments: | ||||
| Assets | ||||
| Futures Contracts | $304,247 | $304,247 | $-- | $-- |
| Total Assets | $304,247 | $304,247 | $-- | $-- |
| Total Derivative Instruments: | $304,247 | $304,247 | $-- | $-- |
Value of Derivative Instruments
The following table is a summary of the Fund's value of derivative instruments by primary risk exposure as of April 30, 2016. For additional information on derivative instruments, please refer to the Derivative Instruments section in the accompanying Notes to Financial Statements.
| Primary Risk Exposure / Derivative Type | Value | |
| Asset | Liability | |
| Equity Risk | ||
| Futures Contracts(a) | $304,247 | $0 |
| Total Equity Risk | 304,247 | 0 |
| Total Value of Derivatives | $304,247 | $0 |
(a) Reflects gross cumulative appreciation (depreciation) on futures contracts as presented in the Schedule of Investments. In the Statement of Assets and Liabilities, the period end daily variation margin is included in receivable or payable for daily variation margin for derivative instruments, and the net cumulative appreciation (depreciation) is included in net unrealized appreciation (depreciation).
See accompanying notes which are an integral part of the financial statements.
Financial Statements
Statement of Assets and Liabilities
| April 30, 2016 | ||
| Assets | ||
| Investment in securities, at value (including securities loaned of $13,528,572) — See accompanying schedule: Unaffiliated issuers (cost $150,630,165) | $151,282,333 | |
| Fidelity Central Funds (cost $29,897,167) | 29,897,167 | |
| Total Investments (cost $180,527,332) | $181,179,500 | |
| Receivable for investments sold | 2,485,772 | |
| Receivable for fund shares sold | 61,187 | |
| Dividends receivable | 221,968 | |
| Distributions receivable from Fidelity Central Funds | 66,782 | |
| Prepaid expenses | 116 | |
| Other receivables | 7,911 | |
| Total assets | 184,023,236 | |
| Liabilities | ||
| Payable for investments purchased | $175,971 | |
| Payable for fund shares redeemed | 311,943 | |
| Accrued management fee | 115,296 | |
| Payable for daily variation margin for derivative instruments | 98,545 | |
| Other affiliated payables | 31,075 | |
| Other payables and accrued expenses | 35,715 | |
| Collateral on securities loaned, at value | 14,642,661 | |
| Total liabilities | 15,411,206 | |
| Net Assets | $168,612,030 | |
| Net Assets consist of: | ||
| Paid in capital | $171,220,903 | |
| Undistributed net investment income | 1,350,479 | |
| Accumulated undistributed net realized gain (loss) on investments and foreign currency transactions | (4,915,685) | |
| Net unrealized appreciation (depreciation) on investments and assets and liabilities in foreign currencies | 956,333 | |
| Net Assets, for 15,268,728 shares outstanding | $168,612,030 | |
| Net Asset Value, offering price and redemption price per share ($168,612,030 ÷ 15,268,728 shares) | $11.04 |
See accompanying notes which are an integral part of the financial statements.
Statement of Operations
| Year ended April 30, 2016 | ||
| Investment Income | ||
| Dividends (including $547,263 earned from other affiliated issuers) | $3,340,061 | |
| Special dividends | 984,412 | |
| Interest | 1,111 | |
| Income from Fidelity Central Funds (including $313,283 from security lending) | 346,213 | |
| Total income | 4,671,797 | |
| Expenses | ||
| Management fee | ||
| Basic fee | $1,681,735 | |
| Performance adjustment | (66,638) | |
| Transfer agent fees | 320,959 | |
| Accounting and security lending fees | 81,808 | |
| Custodian fees and expenses | 11,630 | |
| Independent trustees' compensation | 884 | |
| Registration fees | 32,645 | |
| Audit | 42,085 | |
| Legal | 475 | |
| Miscellaneous | 1,494 | |
| Total expenses before reductions | 2,107,077 | |
| Expense reductions | (36,192) | 2,070,885 |
| Net investment income (loss) | 2,600,912 | |
| Realized and Unrealized Gain (Loss) | ||
| Net realized gain (loss) on: | ||
| Investment securities: | ||
| Unaffiliated issuers | (11,331,056) | |
| Other affiliated issuers | 8,213,604 | |
| Foreign currency transactions | (7,506) | |
| Futures contracts | 50,938 | |
| Total net realized gain (loss) | (3,074,020) | |
| Change in net unrealized appreciation (depreciation) on: Investment securities | (6,497,987) | |
| Assets and liabilities in foreign currencies | (23) | |
| Futures contracts | 415,846 | |
| Total change in net unrealized appreciation (depreciation) | (6,082,164) | |
| Net gain (loss) | (9,156,184) | |
| Net increase (decrease) in net assets resulting from operations | $(6,555,272) |
See accompanying notes which are an integral part of the financial statements.
Statement of Changes in Net Assets
| Year ended April 30, 2016 | Year ended April 30, 2015 | |
| Increase (Decrease) in Net Assets | ||
| Operations | ||
| Net investment income (loss) | $2,600,912 | $889,388 |
| Net realized gain (loss) | (3,074,020) | (32,137) |
| Change in net unrealized appreciation (depreciation) | (6,082,164) | 6,850,452 |
| Net increase (decrease) in net assets resulting from operations | (6,555,272) | 7,707,703 |
| Distributions to shareholders from net investment income | (1,081,800) | (707,278) |
| Distributions to shareholders from net realized gain | (945,437) | (1,050,387) |
| Total distributions | (2,027,237) | (1,757,665) |
| Share transactions | ||
| Proceeds from sales of shares | 75,489,091 | 204,852,708 |
| Reinvestment of distributions | 1,849,958 | 1,664,683 |
| Cost of shares redeemed | (93,533,688) | (79,649,929) |
| Net increase (decrease) in net assets resulting from share transactions | (16,194,639) | 126,867,462 |
| Total increase (decrease) in net assets | (24,777,148) | 132,817,500 |
| Net Assets | ||
| Beginning of period | 193,389,178 | 60,571,678 |
| End of period (including undistributed net investment income of $1,350,479 and undistributed net investment income of $218,552, respectively) | $168,612,030 | $193,389,178 |
| Other Information | ||
| Shares | ||
| Sold | 6,802,513 | 18,552,162 |
| Issued in reinvestment of distributions | 163,583 | 153,776 |
| Redeemed | (8,718,246) | (7,414,968) |
| Net increase (decrease) | (1,752,150) | 11,290,970 |
See accompanying notes which are an integral part of the financial statements.
Financial Highlights — Fidelity Event Driven Opportunities Fund
| Years ended April 30, | 2016 | 2015 | 2014 A |
| Selected Per–Share Data | |||
| Net asset value, beginning of period | $11.36 | $10.57 | $10.00 |
| Income from Investment Operations | |||
| Net investment income (loss)B | .14C | .06 | .03D |
| Net realized and unrealized gain (loss) | (.35)E | .95F | .55G |
| Total from investment operations | (.21) | 1.01 | .58 |
| Distributions from net investment income | (.06) | (.06) | (.01) |
| Distributions from net realized gain | (.05) | (.16) | – |
| Total distributions | (.11) | (.22) | (.01) |
| Net asset value, end of period | $11.04 | $11.36 | $10.57 |
| Total ReturnH,I | (1.89)%E | 9.64%F | 5.77%G |
| Ratios to Average Net AssetsJ,K | |||
| Expenses before reductions | 1.06% | 1.13% | 1.52%L |
| Expenses net of fee waivers, if any | 1.06% | 1.13% | 1.30%L |
| Expenses net of all reductions | 1.04% | 1.12% | 1.30%L |
| Net investment income (loss) | 1.31%C | .58% | .82%D,L |
| Supplemental Data | |||
| Net assets, end of period (000 omitted) | $168,612 | $193,389 | $60,572 |
| Portfolio turnover rateM | 111% | 119% | 56%N |
A For the period December 12, 2013 (commencement of operations) to April 30 2014.
B Calculated based on average shares outstanding during the period.
C Net Investment income per share reflects a large, non-recurring dividend which amounted to $.05 per share. Excluding this non-recurring dividend, the ratio of net investment income (loss) to average net assets would have been .82%.
D Net Investment income per share reflects a large, non-recurring dividend which amounted to $.02 per share. Excluding this non-recurring dividend, the ratio of net investment income (loss) to average net assets would have been .28%.
E Amount includes a reimbursement from the investment adviser for an operational error which amounted to less than $.01 per share. Excluding this reimbursement, the total return would have been (1.92)%.
F Amount includes a reimbursement from the investment adviser for an operational error which amounted to less than $.01 per share. Excluding this reimbursement, the total return would have been 9.57%.
G Amount includes a reimbursement from the investment adviser for an operational error which amounted to less than $.01 per share. Excluding this reimbursement, the total return would have been 5.67%.
H Total returns for periods of less than one year are not annualized.
I Total returns would have been lower if certain expenses had not been reduced during the applicable periods shown.
J Fees and expenses of any underlying Fidelity Central Funds are not included in the Fund's expense ratio. The Fund indirectly bears its proportionate share of the expenses of any underlying Fidelity Central Funds.
K Expense ratios reflect operating expenses of the Fund. Expenses before reductions do not reflect amounts reimbursed by the investment adviser or reductions from brokerage service arrangements or reductions from other expense offset arrangements and do not represent the amount paid by the Fund during periods when reimbursements or reductions occur. Expense ratios before reductions for start-up periods may not be representative of longer term operating periods. Expenses net of fee waivers reflect expenses after reimbursement by the investment adviser but prior to reductions from brokerage service arrangements or other expense offset arrangements. Expenses net of all reductions represent the net expenses paid by the Fund.
L Annualized
M Amount does not include the portfolio activity of any underlying Fidelity Central Funds.
N Amount not annualized
See accompanying notes which are an integral part of the financial statements.
Notes to Financial Statements
For the period ended April 30, 2016
1. Organization.
Fidelity Event Driven Opportunities Fund (the Fund) is a non-diversified fund of Fidelity Commonwealth Trust (the Trust) and is authorized to issue an unlimited number of shares. Share transactions on the Statement of Changes in Net Assets may contain exchanges between affiliated funds. The Trust is registered under the Investment Company Act of 1940, as amended (the 1940 Act), as an open-end management investment company organized as a Massachusetts business trust.
2. Investments in Fidelity Central Funds.
The Fund invests in Fidelity Central Funds, which are open-end investment companies generally available only to other investment companies and accounts managed by the investment adviser and its affiliates. The Fund's Schedule of Investments lists each of the Fidelity Central Funds held as of period end, if any, as an investment of the Fund, but does not include the underlying holdings of each Fidelity Central Fund. As an Investing Fund, the Fund indirectly bears its proportionate share of the expenses of the underlying Fidelity Central Funds.
The Money Market Central Funds seek preservation of capital and current income and are managed by Fidelity Investments Money Management, Inc. (FIMM), an affiliate of the investment adviser. Annualized expenses of the Money Market Central Funds as of their most recent shareholder report date are less than .005%.
A complete unaudited list of holdings for each Fidelity Central Fund is available upon request or at the Securities and Exchange Commission (the SEC) website at www.sec.gov. In addition, the financial statements of the Fidelity Central Funds, which are not covered by the Fund's Report of Independent Registered Public Accounting Firm, are available on the SEC website or upon request.
3. Significant Accounting Policies.
The financial statements have been prepared in conformity with accounting principles generally accepted in the United States of America (GAAP), which require management to make certain estimates and assumptions at the date of the financial statements. Actual results could differ from those estimates. Subsequent events, if any, through the date that the financial statements were issued have been evaluated in the preparation of the financial statements. The following summarizes the significant accounting policies of the Fund:
Investment Valuation. Investments are valued as of 4:00 p.m. Eastern time on the last calendar day of the period. The Board of Trustees (the Board) has delegated the day to day responsibility for the valuation of the Fund's investments to the Fidelity Management & Research Company (FMR) Fair Value Committee (the Committee). In accordance with valuation policies and procedures approved by the Board, the Fund attempts to obtain prices from one or more third party pricing vendors or brokers to value its investments. When current market prices, quotations or currency exchange rates are not readily available or reliable, investments will be fair valued in good faith by the Committee, in accordance with procedures adopted by the Board. Factors used in determining fair value vary by investment type and may include market or investment specific events, changes in interest rates and credit quality. The frequency with which these procedures are used cannot be predicted and they may be utilized to a significant extent. The Committee oversees the Fund's valuation policies and procedures and reports to the Board on the Committee's activities and fair value determinations. The Board monitors the appropriateness of the procedures used in valuing the Fund's investments and ratifies the fair value determinations of the Committee.
The Fund categorizes the inputs to valuation techniques used to value its investments into a disclosure hierarchy consisting of three levels as shown below:
- Level 1 – quoted prices in active markets for identical investments
- Level 2 – other significant observable inputs (including quoted prices for similar investments, interest rates, prepayment speeds, etc.)
- Level 3 – unobservable inputs (including the Fund's own assumptions based on the best information available)
Valuation techniques used to value the Fund's investments by major category are as follows:
Equity securities, including restricted securities, for which market quotations are readily available, are valued at the last reported sale price or official closing price as reported by a third party pricing vendor on the primary market or exchange on which they are traded and are categorized as Level 1 in the hierarchy. In the event there were no sales during the day or closing prices are not available, securities are valued at the last quoted bid price or may be valued using the last available price and are generally categorized as Level 2 in the hierarchy. For foreign equity securities, when market or security specific events arise, comparisons to the valuation of American Depositary Receipts (ADRs), futures contracts, Exchange-Traded Funds (ETFs) and certain indexes as well as quoted prices for similar securities may be used and would be categorized as Level 2 in the hierarchy. Utilizing these techniques may result in transfers between Level 1 and Level 2. For equity securities, including restricted securities, where observable inputs are limited, assumptions about market activity and risk are used and these securities may be categorized as Level 3 in the hierarchy.
Debt securities, including restricted securities, are valued based on evaluated prices received from third party pricing vendors or from brokers who make markets in such securities. U.S. government and government agency obligations are valued by pricing vendors who utilize matrix pricing which considers yield or price of bonds of comparable quality, coupon, maturity and type or by broker-supplied prices. When independent prices are unavailable or unreliable, debt securities may be valued utilizing pricing methodologies which consider similar factors that would be used by third party pricing vendors. Debt securities are generally categorized as Level 2 in the hierarchy but may be Level 3 depending on the circumstances.
Futures contracts are valued at the settlement price established each day by the board of trade or exchange on which they are traded and are categorized as Level 1 in the hierarchy. Investments in open-end mutual funds, including the Fidelity Central Funds, are valued at their closing net asset value (NAV) each business day and are categorized as Level 1 in the hierarchy.
Changes in valuation techniques may result in transfers in or out of an assigned level within the disclosure hierarchy. The aggregate value of investments by input level as of April 30, 2016 is included at the end of the Fund's Schedule of Investments.
Foreign Currency. The Fund may use foreign currency contracts to facilitate transactions in foreign-denominated securities. Gains and losses from these transactions may arise from changes in the value of the foreign currency or if the counterparties do not perform under the contracts' terms.
Foreign-denominated assets, including investment securities, and liabilities are translated into U.S. dollars at the exchange rates at period end. Purchases and sales of investment securities, income and dividends received and expenses denominated in foreign currencies are translated into U.S. dollars at the exchange rate in effect on the transaction date.
The effects of exchange rate fluctuations on investments are included with the net realized and unrealized gain (loss) on investment securities. Other foreign currency transactions resulting in realized and unrealized gain (loss) are disclosed separately.
Investment Transactions and Income. For financial reporting purposes, the Fund's investment holdings and NAV include trades executed through the end of the last business day of the period. The NAV per share for processing shareholder transactions is calculated as of the close of business of the New York Stock Exchange (NYSE), normally 4:00 p.m. Eastern time and includes trades executed through the end of the prior business day. Gains and losses on securities sold are determined on the basis of identified cost. Dividend income is recorded on the ex-dividend date, except for certain dividends from foreign securities where the ex-dividend date may have passed, which are recorded as soon as the Fund is informed of the ex-dividend date. Non-cash dividends included in dividend income, if any, are recorded at the fair market value of the securities received. Income and capital gain distributions from Fidelity Central Funds, if any, are recorded on the ex-dividend date. Distributions received on securities that represent a return of capital or capital gain are recorded as a reduction of cost of investments and/or as a realized gain. Subsequent to ex-dividend date the Fund determines the components of these distributions, based upon receipt of tax filings or other correspondence relating to the underlying investment. Large, non-recurring dividends recognized by the Fund are presented separately on the Statement of Operations as "Special Dividends" and the impact of these dividends is presented in the Financial Highlights. Interest income is accrued as earned and includes coupon interest and amortization of premium and accretion of discount on debt securities as applicable. Investment income is recorded net of foreign taxes withheld where recovery of such taxes is uncertain.
Expenses. Expenses directly attributable to a fund are charged to that fund. Expenses attributable to more than one fund are allocated among the respective funds on the basis of relative net assets or other appropriate methods. Expense estimates are accrued in the period to which they relate and adjustments are made when actual amounts are known.
Income Tax Information and Distributions to Shareholders. Each year, the Fund intends to qualify as a regulated investment company under Subchapter M of the Internal Revenue Code, including distributing substantially all of its taxable income and realized gains. As a result, no provision for U.S. Federal income taxes is required. As of April 30, 2016, the Fund did not have any unrecognized tax benefits in the financial statements; nor is the Fund aware of any tax positions for which it is reasonably possible that the total amounts of unrecognized tax benefits will significantly change in the next twelve months. The Fund files a U.S. federal tax return, in addition to state and local tax returns as required. The Fund's federal income tax returns are subject to examination by the Internal Revenue Service (IRS) for a period of three fiscal years after they are filed. State and local tax returns may be subject to examination for an additional fiscal year depending on the jurisdiction. Foreign taxes are provided for based on the Fund's understanding of the tax rules and rates that exist in the foreign markets in which it invests.
Distributions are declared and recorded on the ex-dividend date. Income and capital gain distributions are determined in accordance with income tax regulations, which may differ from GAAP. In addition, the Fund claimed a portion of the payment made to redeeming shareholders as a distribution for income tax purposes.
Capital accounts within the financial statements are adjusted for permanent book-tax differences. These adjustments have no impact on net assets or the results of operations. Capital accounts are not adjusted for temporary book-tax differences which will reverse in a subsequent period.
Book-tax differences are primarily due to futures contracts, foreign currency transactions, market discount, capital loss carryforwards and losses deferred due to wash sales.
The federal tax cost of investment securities and unrealized appreciation (depreciation) as of period end were as follows:
| Gross unrealized appreciation | $17,538,446 |
| Gross unrealized depreciation | (17,831,693) |
| Net unrealized appreciation (depreciation) on securities | $(293,247) |
| Tax Cost | $181,472,747 |
The tax-based components of distributable earnings as of period end were as follows:
| Undistributed ordinary income | $1,349,803 |
| Capital loss carryforward | $(3,665,346) |
| Net unrealized appreciation (depreciation) on securities and other investments | $(293,329) |
Capital loss carryforwards are only available to offset future capital gains of the Fund to the extent provided by regulations and may be limited. Under the Regulated Investment Company Modernization Act of 2010 (the Act), the Fund is permitted to carry forward capital losses incurred in taxable years beginning after December 22, 2010 for an unlimited period and such capital losses are required to be used prior to any losses that expire. The capital loss carryforward information presented below, including any applicable limitation, is estimated as of fiscal period end and is subject to adjustment.
| No expiration | |
| Long-term | $(3,665,346) |
The tax character of distributions paid was as follows:
| April 30, 2016 | April 30, 2015 | |
| Ordinary Income | $1,081,800 | $ 1,757,665 |
| Long-term Capital Gains | 945,437 | – |
| Total | $2,027,237 | $ 1,757,665 |
4. Derivative Instruments.
Risk Exposures and the Use of Derivative Instruments. The Fund's investment objective allows the Fund to enter into various types of derivative contracts, including futures contracts. Derivatives are investments whose value is primarily derived from underlying assets, indices or reference rates and may be transacted on an exchange or over-the-counter (OTC). Derivatives may involve a future commitment to buy or sell a specified asset based on specified terms, to exchange future cash flows at periodic intervals based on a notional principal amount, or for one party to make one or more payments upon the occurrence of specified events in exchange for periodic payments from the other party.
The Fund used derivatives to increase returns and to manage exposure to certain risks as defined below. The success of any strategy involving derivatives depends on analysis of numerous economic factors, and if the strategies for investment do not work as intended, the Fund may not achieve its objectives.
The Fund's use of derivatives increased or decreased its exposure to the following risk:
| Equity Risk | Equity risk relates to the fluctuations in the value of financial instruments as a result of changes in market prices (other than those arising from interest rate risk or foreign exchange risk), whether caused by factors specific to an individual investment, its issuer, or all factors affecting all instruments traded in a market or market segment. |
The Fund is also exposed to additional risks from investing in derivatives, such as liquidity risk and counterparty credit risk. Liquidity risk is the risk that the Fund will be unable to close out the derivative in the open market in a timely manner. Counterparty credit risk is the risk that the counterparty will not be able to fulfill its obligation to the Fund. Counterparty credit risk related to exchange-traded futures contracts may be mitigated by the protection provided by the exchange on which they trade.
Investing in derivatives may involve greater risks than investing in the underlying assets directly and, to varying degrees, may involve risk of loss in excess of any initial investment and collateral received and amounts recognized in the Statement of Assets and Liabilities. In addition, there may be the risk that the change in value of the derivative contract does not correspond to the change in value of the underlying instrument.
Futures Contracts. A futures contract is an agreement between two parties to buy or sell a specified underlying instrument for a fixed price at a specified future date. The Fund used futures contracts to manage its exposure to the stock market.
Upon entering into a futures contract, a fund is required to deposit either cash or securities (initial margin) with a clearing broker in an amount equal to a certain percentage of the face value of the contract. Futures contracts are marked-to-market daily and subsequent daily payments (variation margin) are made or received by a fund depending on the daily fluctuations in the value of the futures contracts and are recorded as unrealized appreciation or (depreciation). This receivable and/or payable, if any, is included in daily variation margin for derivative instruments in the Statement of Assets and Liabilities. Realized gain or (loss) is recorded upon the expiration or closing of a futures contract.
Any open futures contracts at period end are presented in the Schedule of Investments under the caption "Futures Contracts". The underlying face amount at value reflects each contract's exposure to the underlying instrument or index at period end and is representative of volume of activity during the period. Securities deposited to meet initial margin requirements are identified in the Schedule of Investments.
During the period the Fund recognized net realized gain (loss) of $50,938 and a change in net unrealized appreciation (depreciation) of $415,846 related to its investment in futures contracts. These amounts are included in the Statement of Operations.
5. Purchases and Sales of Investments.
Purchases and sales of securities, other than short-term securities, aggregated $203,078,480 and $208,913,125, respectively.
6. Fees and Other Transactions with Affiliates.
Management Fee. Fidelity Management & Research Company (the investment adviser) and its affiliates provide the Fund with investment management related services for which the Fund pays a monthly management fee. The management fee is the sum of an individual fund fee rate that is based on an annual rate of .60% of the Fund's average net assets and an annualized group fee rate that averaged .25% during the period. The group fee rate is based upon the average net assets of all the mutual funds advised by the investment adviser, including any mutual funds previously advised by the investment adviser that are currently advised by Fidelity SelectCo, LLC, an affiliate of the investment adviser. The group fee rate decreases as assets under management increase and increases as assets under management decrease. In addition, the management fee is subject to a performance adjustment (up to a maximum of +/- .10% of the Fund's average net assets over a 36 month performance period). The upward or downward adjustment to the management fee is based on the Fund's relative investment performance as compared to its benchmark index, the Russell 3000 Index, over the same 36 month performance period. For the reporting period, the total annual management fee rate, including the performance adjustment, was .81% of the Fund's average net assets. The performance adjustment included in the management fee rate may be higher or lower than the maximum performance adjustment rate due to the difference between the average net assets for the reporting and performance periods.
Transfer Agent Fees. Fidelity Investments Institutional Operations Company, Inc. (FIIOC), an affiliate of the investment adviser, is the Fund's transfer, dividend disbursing and shareholder servicing agent. FIIOC receives account fees and asset-based fees that vary according to account size and type of account. FIIOC pays for typesetting, printing and mailing of shareholder reports, except proxy statements. For the period, the transfer agent fees were equivalent to an annual rate of .16% of average net assets.
Accounting and Security Lending Fees. Fidelity Service Company, Inc. (FSC), an affiliate of the investment adviser, maintains the Fund's accounting records. The accounting fee is based on the level of average net assets for each month. Under a separate contract, FSC administers the security lending program. The security lending fee is based on the number and duration of lending transactions.
Brokerage Commissions. The Fund placed a portion of its portfolio transactions with brokerage firms which are affiliates of the investment adviser. Brokerage commissions are included in net realized gain (loss) and change in net unrealized appreciation (depreciation) in the Statement of Operations. The commissions paid to these affiliated firms were $7,617 for the period.
Interfund Trades. The Fund may purchase from or sell securities to other Fidelity Funds under procedures adopted by the Board. The procedures have been designed to ensure these interfund trades are executed in accordance with Rule 17a-7 of the 1940 Act. Interfund trades are included within the respective purchases and sales amounts shown in the Purchases and Sales of Investments note.
Other. During the period, the investment adviser reimbursed the Fund $61,873 for an operational error which is included in Net Realized Gain (Loss) in the accompanying Statement of Operations.
7. Committed Line of Credit.
The Fund participates with other funds managed by the investment adviser or an affiliate in a $4.25 billion credit facility (the "line of credit") to be utilized for temporary or emergency purposes to fund shareholder redemptions or for other short-term liquidity purposes. The Fund has agreed to pay commitment fees on its pro-rata portion of the line of credit, which amounted to $306 and is reflected in Miscellaneous expenses on the Statement of Operations. During the period, the Fund did not borrow on this line of credit.
8. Security Lending.
The Fund lends portfolio securities through a lending agent from time to time in order to earn additional income. For equity securities, a lending agent is used and may loan securities to certain qualified borrowers, including Fidelity Capital Markets (FCM), a broker-dealer affiliated with the Fund. On the settlement date of the loan, the Fund receives collateral (in the form of U.S. Treasury obligations, letters of credit and/or cash) against the loaned securities and maintains collateral in an amount not less than 100% of the market value of the loaned securities during the period of the loan. The market value of the loaned securities is determined at the close of business of the Fund and any additional required collateral is delivered to the Fund on the next business day. The Fund or borrower may terminate the loan at any time, and if the borrower defaults on its obligation to return the securities loaned because of insolvency or other reasons, the Fund may apply collateral received from the borrower against the obligation. The Fund may experience delays and costs in recovering the securities loaned. Any cash collateral received is invested in the Fidelity Securities Lending Cash Central Fund. The value of loaned securities and cash collateral at period end are disclosed on the Fund's Statement of Assets and Liabilities. The value of securities loaned to FCM at period end was $1,044,365. Security lending income represents the income earned on investing cash collateral, less rebates paid to borrowers and any lending agent fees associated with the loan, plus any premium payments received for lending certain types of securities. Security lending income is presented in the Statement of Operations as a component of income from Fidelity Central Funds, and includes $3,991 from securities loaned to FCM.
9. Expense Reductions.
Commissions paid to certain brokers with whom the investment adviser, or its affiliates, places trades on behalf of the Fund include an amount in addition to trade execution, which may be rebated back to the Fund to offset certain expenses. This amount totaled $33,799 for the period. In addition, through arrangements with the Fund's custodian, credits realized as a result of certain uninvested cash balances were used to reduce the Fund's expenses. During the period, these credits reduced the Fund's custody expenses by $27.
In addition, during the period the investment adviser reimbursed and/or waived a portion of operating expenses in the amount of $2,366.
10. Other.
The Fund's organizational documents provide former and current trustees and officers with a limited indemnification against liabilities arising in connection with the performance of their duties to the Fund. In the normal course of business, the Fund may also enter into contracts that provide general indemnifications. The Fund's maximum exposure under these arrangements is unknown as this would be dependent on future claims that may be made against the Fund. The risk of material loss from such claims is considered remote.
Report of Independent Registered Public Accounting Firm
To the Trustees of Fidelity Commonwealth Trust and Shareholders of Fidelity Event Driven Opportunities Fund:
In our opinion, the accompanying statement of assets and liabilities, including the schedule of investments, and the related statements of operations and of changes in net assets and the financial highlights present fairly, in all material respects, the financial position of Fidelity Event Driven Opportunities Fund (a fund of Fidelity Commonwealth Trust) at April 30, 2016, the results of its operations for the year then ended, the changes in its net assets for each of the two years in the period then ended and the financial highlights for each of the periods indicated, in conformity with accounting principles generally accepted in the United States of America. These financial statements and financial highlights (hereafter referred to as “financial statements”) are the responsibility of the Fidelity Event Driven Opportunities Fund’s management. Our responsibility is to express an opinion on these financial statements based on our audits. We conducted our audits of these financial statements in accordance with the standards of the Public Company Accounting Oversight Board (United States). Those standards require that we plan and perform the audit to obtain reasonable assurance about whether the financial statements are free of material misstatement. An audit includes examining, on a test basis, evidence supporting the amounts and disclosures in the financial statements, assessing the accounting principles used and significant estimates made by management, and evaluating the overall financial statement presentation. We believe that our audits, which included confirmation of securities at April 30, 2016 by correspondence with the custodian and brokers, provide a reasonable basis for our opinion.
PricewaterhouseCoopers LLP
Boston, Massachusetts
June 16, 2016
Trustees and Officers
The Trustees, Members of the Advisory Board (if any), and officers of the trust and fund, as applicable, are listed below. The Board of Trustees governs the fund and is responsible for protecting the interests of shareholders. The Trustees are experienced executives who meet periodically throughout the year to oversee the fund's activities, review contractual arrangements with companies that provide services to the fund, oversee management of the risks associated with such activities and contractual arrangements, and review the fund's performance. Each of the Trustees oversees 170 funds.
The Trustees hold office without limit in time except that (a) any Trustee may resign; (b) any Trustee may be removed by written instrument, signed by at least two-thirds of the number of Trustees prior to such removal; (c) any Trustee who requests to be retired or who has become incapacitated by illness or injury may be retired by written instrument signed by a majority of the other Trustees; and (d) any Trustee may be removed at any special meeting of shareholders by a two-thirds vote of the outstanding voting securities of the trust. Each Trustee who is not an interested person (as defined in the 1940 Act) of the trust and the fund is referred to herein as an Independent Trustee. Each Independent Trustee shall retire not later than the last day of the calendar year in which his or her 75th birthday occurs. The Independent Trustees may waive this mandatory retirement age policy with respect to individual Trustees. Officers and Advisory Board Members hold office without limit in time, except that any officer or Advisory Board Member may resign or may be removed by a vote of a majority of the Trustees at any regular meeting or any special meeting of the Trustees. Except as indicated, each individual has held the office shown or other offices in the same company for the past five years.
The fund’s Statement of Additional Information (SAI) includes more information about the Trustees. To request a free copy, call Fidelity at 1-800-544-8544.
Experience, Skills, Attributes, and Qualifications of the Trustees. The Governance and Nominating Committee has adopted a statement of policy that describes the experience, qualifications, attributes, and skills that are necessary and desirable for potential Independent Trustee candidates (Statement of Policy). The Board believes that each Trustee satisfied at the time he or she was initially elected or appointed a Trustee, and continues to satisfy, the standards contemplated by the Statement of Policy. The Governance and Nominating Committee also engages professional search firms to help identify potential Independent Trustee candidates who have the experience, qualifications, attributes, and skills consistent with the Statement of Policy. From time to time, additional criteria based on the composition and skills of the current Independent Trustees, as well as experience or skills that may be appropriate in light of future changes to board composition, business conditions, and regulatory or other developments, have also been considered by the professional search firms and the Governance and Nominating Committee. In addition, the Board takes into account the Trustees' commitment and participation in Board and committee meetings, as well as their leadership of standing and ad hoc committees throughout their tenure.
In determining that a particular Trustee was and continues to be qualified to serve as a Trustee, the Board has considered a variety of criteria, none of which, in isolation, was controlling. The Board believes that, collectively, the Trustees have balanced and diverse experience, qualifications, attributes, and skills, which allow the Board to operate effectively in governing the fund and protecting the interests of shareholders. Information about the specific experience, skills, attributes, and qualifications of each Trustee, which in each case led to the Board's conclusion that the Trustee should serve (or continue to serve) as a trustee of the fund, is provided below.
Board Structure and Oversight Function. James C. Curvey is an interested person and currently serves as Chairman. The Trustees have determined that an interested Chairman is appropriate and benefits shareholders because an interested Chairman has a personal and professional stake in the quality and continuity of services provided to the fund. Independent Trustees exercise their informed business judgment to appoint an individual of their choosing to serve as Chairman, regardless of whether the Trustee happens to be independent or a member of management. The Independent Trustees have determined that they can act independently and effectively without having an Independent Trustee serve as Chairman and that a key structural component for assuring that they are in a position to do so is for the Independent Trustees to constitute a substantial majority for the Board. The Independent Trustees also regularly meet in executive session. Ned C. Lautenbach serves as Chairman of the Independent Trustees and as such (i) acts as a liaison between the Independent Trustees and management with respect to matters important to the Independent Trustees and (ii) with management prepares agendas for Board meetings.
Fidelity® funds are overseen by different Boards of Trustees. The fund's Board oversees Fidelity's high income and certain equity funds, and other Boards oversee Fidelity's investment-grade bond, money market, asset allocation, and sector funds. The asset allocation funds may invest in Fidelity® funds overseen by the fund's Board. The use of separate Boards, each with its own committee structure, allows the Trustees of each group of Fidelity® funds to focus on the unique issues of the funds they oversee, including common research, investment, and operational issues. On occasion, the separate Boards establish joint committees to address issues of overlapping consequences for the Fidelity® funds overseen by each Board.
The Trustees operate using a system of committees to facilitate the timely and efficient consideration of all matters of importance to the Trustees, the fund, and fund shareholders and to facilitate compliance with legal and regulatory requirements and oversight of the fund's activities and associated risks. The Board, acting through its committees, has charged FMR and its affiliates with (i) identifying events or circumstances the occurrence of which could have demonstrably adverse effects on the fund's business and/or reputation; (ii) implementing processes and controls to lessen the possibility that such events or circumstances occur or to mitigate the effects of such events or circumstances if they do occur; and (iii) creating and maintaining a system designed to evaluate continuously business and market conditions in order to facilitate the identification and implementation processes described in (i) and (ii) above. Because the day-to-day operations and activities of the fund are carried out by or through FMR, its affiliates, and other service providers, the fund's exposure to risks is mitigated but not eliminated by the processes overseen by the Trustees. While each of the Board's committees has responsibility for overseeing different aspects of the fund's activities, oversight is exercised primarily through the Operations, Audit, and Compliance Committees. In addition, the Independent Trustees have worked with FMR to enhance the Board's oversight of investment and financial risks, legal and regulatory risks, technology risks, and operational risks, including the development of additional risk reporting to the Board. For example, a working group comprised of Independent Trustees and FMR has worked and continues to work to review the Fidelity® funds' valuation-related activities, reporting and risk management. Appropriate personnel, including but not limited to the fund's Chief Compliance Officer (CCO), FMR's internal auditor, the independent accountants, the fund's Treasurer and portfolio management personnel, make periodic reports to the Board's committees, as appropriate, including an annual review of Fidelity's risk management program for the Fidelity® funds. The responsibilities of each standing committee, including their oversight responsibilities, are described further under "Standing Committees of the Trustees."
Interested Trustees*:
Correspondence intended for a Trustee who is an interested person may be sent to Fidelity Investments, 245 Summer Street, Boston, Massachusetts 02210.
Name, Year of Birth; Principal Occupations and Other Relevant Experience+
James C. Curvey (1935)
Year of Election or Appointment: 2007
Trustee
Chairman of the Board of Trustees
Mr. Curvey also serves as Trustee of other Fidelity® funds. Mr. Curvey is a Director of Fidelity Research & Analysis Co. (investment adviser firm, 2009-present), and Vice Chairman (2007-present) and Director of FMR LLC (diversified financial services company). In addition, Mr. Curvey serves as an Overseer for the Boston Symphony Orchestra and a member of the board of Artis-Naples, Naples, Florida, and as a Trustee for Brewster Academy, Wolfeboro, New Hampshire. Previously, Mr. Curvey served as a Director of Fidelity Investments Money Management, Inc. (investment adviser firm, 2009-2014) and a Director of FMR and FMR Co., Inc. (investment adviser firms, 2007-2014).
Charles S. Morrison (1960)
Year of Election or Appointment: 2014
Trustee
Mr. Morrison also serves as Trustee of other funds. He serves as a Director of Fidelity Investments Money Management, Inc. (FIMM) (investment adviser firm, 2014-present), Director of Fidelity SelectCo, LLC (investment adviser firm, 2014-present), President, Asset Management (2014-present), and is an employee of Fidelity Investments. Previously, Mr. Morrison served as Vice President of Fidelity's Fixed Income and Asset Allocation Funds (2012-2014), President, Fixed Income (2011-2014), Vice President of Fidelity's Money Market Funds (2005-2009), President, Money Market Group Leader of FMR (investment adviser firm, 2009), and Senior Vice President, Money Market Group of FMR (2004-2009). Mr. Morrison also served as Vice President of Fidelity's Bond Funds (2002-2005), certain Balanced Funds (2002-2005), and certain Asset Allocation Funds (2002-2007), and as Senior Vice President (2002-2005) of Fidelity's Bond Division.
* Determined to be an “Interested Trustee” by virtue of, among other things, his or her affiliation with the trust or various entities under common control with FMR.
+ The information includes the Trustee's principal occupation during the last five years and other information relating to the experience, attributes, and skills relevant to the Trustee's qualifications to serve as a Trustee, which led to the conclusion that the Trustee should serve as a Trustee for the fund.
Independent Trustees:
Correspondence intended for an Independent Trustee may be sent to Fidelity Investments, P.O. Box 55235, Boston, Massachusetts 02205-5235.
Name, Year of Birth; Principal Occupations and Other Relevant Experience+
Dennis J. Dirks (1948)
Year of Election or Appointment: 2005
Trustee
Mr. Dirks also serves as Trustee of other Fidelity® funds. Prior to his retirement in May 2003, Mr. Dirks was Chief Operating Officer and a member of the Board of The Depository Trust & Clearing Corporation (DTCC). He also served as President, Chief Operating Officer, and Board member of The Depository Trust Company (DTC) and President and Board member of the National Securities Clearing Corporation (NSCC). In addition, Mr. Dirks served as Chief Executive Officer and Board member of the Government Securities Clearing Corporation, Chief Executive Officer and Board member of the Mortgage-Backed Securities Clearing Corporation, as a Trustee and a member of the Finance Committee of Manhattan College (2005-2008), as a Trustee and a member of the Finance Committee of AHRC of Nassau County (2006-2008), and as a member of the Independent Directors Council (IDC) Governing Council (2010-2015). Mr. Dirks is a member of the Board of Directors for The Brookville Center for Children's Services, Inc. (2009-present).
Alan J. Lacy (1953)
Year of Election or Appointment: 2008
Trustee
Mr. Lacy also serves as Trustee of other Fidelity® funds. Mr. Lacy serves as Chairman (2014-present) and a member (2010-present) of the Board of Directors of Dave & Buster's Entertainment, Inc. (restaurant and entertainment complexes) and a Director of Bristol-Myers Squibb Company (global pharmaceuticals, 2008-present). He is a Trustee of the California Chapter of The Nature Conservancy (2015-present) and a Director of the Center for Advanced Study in the Behavioral Sciences at Stanford University (2015-present). In addition, Mr. Lacy served as Senior Adviser (2007-2014) of Oak Hill Capital Partners, L.P. (private equity) and also served as Chief Executive Officer (2005) and Vice Chairman (2005-2006) of Sears Holdings Corporation (retail) and Chief Executive Officer and Chairman of the Board of Sears, Roebuck and Co. (retail, 2000-2005). Previously, Mr. Lacy served as Chairman (2008-2011) and a member (2006-2015) of the Board of Trustees of the National Parks Conservation Association and as a member of the Board of Directors for The Western Union Company (global money transfer, 2006-2011), The Hillman Companies, Inc. (hardware wholesalers, 2010-2014), and Earth Fare, Inc. (retail grocery, 2010-2014).
Ned C. Lautenbach (1944)
Year of Election or Appointment: 2000
Trustee
Chairman of the Independent Trustees
Mr. Lautenbach also serves as Trustee of other Fidelity® funds. Mr. Lautenbach currently serves as the Lead Director of the Eaton Corporation Board of Directors (diversified industrial, 1997-present). Mr. Lautenbach is Chairman of the Board of Directors of Artis-Naples in Naples, Florida (2012-present), a member of the Council on Foreign Relations (1994-present), and a member of the Board of Governors, State University System of Florida (2013-present). Previously, Mr. Lautenbach was a Partner/Advisory Partner at Clayton, Dubilier & Rice, LLC (private equity investment, 1998-2010), as well as a Director of Sony Corporation (2006-2007).
Joseph Mauriello (1944)
Year of Election or Appointment: 2008
Trustee
Mr. Mauriello also serves as Trustee of other Fidelity® funds. Prior to his retirement in January 2006, Mr. Mauriello served in numerous senior management positions including Deputy Chairman and Chief Operating Officer (2004-2005), and Vice Chairman of Financial Services (2002-2004) of KPMG LLP US (professional services, 1965-2005). Mr. Mauriello currently serves as a member of the Board of Directors of XL Group plc. (global insurance and re-insurance, 2006-present) and the Independent Directors Council (IDC) Governing Council (2015-present). Previously, Mr. Mauriello served as a Director of the Hamilton Funds of the Bank of New York (2006-2007) and of Arcadia Resources Inc. (health care services and products, 2007-2012).
Robert W. Selander (1950)
Year of Election or Appointment: 2011
Trustee
Mr. Selander also serves as Trustee of other Fidelity® funds. Mr. Selander serves as a Director of The Western Union Company (global money transfer, 2014-present) and a non-executive Chairman of Health Equity, Inc. (health savings custodian, 2015-present). Previously, Mr. Selander served as a Member of the Advisory Board of certain Fidelity® funds (2011), and Executive Vice Chairman (2010), Chief Executive Officer (2009-2010), and President and Chief Executive Officer (1997-2009) of Mastercard, Inc.
Cornelia M. Small (1944)
Year of Election or Appointment: 2005
Trustee
Ms. Small also serves as Trustee of other Fidelity® funds. Ms. Small is a member of the Board of Directors (2009-present) and Chair of the Investment Committee (2010-present) of the Teagle Foundation. Ms. Small also serves on the Investment Committee of the Berkshire Taconic Community Foundation (2008-present). Previously, Ms. Small served as Chairperson (2002-2008) and a member of the Investment Committee and Chairperson (2008-2012) and a member of the Board of Trustees of Smith College. In addition, Ms. Small served as Chief Investment Officer, Director of Global Equity Investments, and a member of the Board of Directors of Scudder, Stevens & Clark and Scudder Kemper Investments.
William S. Stavropoulos (1939)
Year of Election or Appointment: 2002
Trustee
Vice Chairman of the Independent Trustees
Mr. Stavropoulos also serves as Trustee of other Fidelity® funds. Mr. Stavropoulos serves as President and Founder of the Michigan Baseball Foundation, the Great Lakes Loons (2007-present). Mr. Stavropoulos is Chairman Emeritus of the Board of Directors of The Dow Chemical Company, where he previously served in numerous senior management positions, including President, CEO (1995-2000; 2002-2004), Chairman of the Executive Committee (2000-2006), and as a member of the Board of Directors (1990-2006). Currently, Mr. Stavropoulos is Chairman of the Board of Directors of Univar Inc. (global distributor of commodity and specialty chemicals), a Director of Teradata Corporation (data warehousing and technology solutions), and Maersk Inc. (industrial conglomerate), and a member of the Advisory Board for Metalmark Capital LLC (private equity investment, 2005-present). Mr. Stavropoulos is an operating advisor to Clayton, Dubilier & Rice, LLC (private equity investment). In addition, Mr. Stavropoulos is a member of the University of Notre Dame Advisory Council for the College of Science, a Trustee of the Rollin L. Gerstacker Foundation, and a Director of the Naples Philharmonic Center for the Arts. Previously, Mr. Stavropoulos served as a Director of Chemical Financial Corporation (bank holding company, 1993-2012) and Tyco International, Ltd. (multinational manufacturing and services, 2007-2012).
David M. Thomas (1949)
Year of Election or Appointment: 2008
Trustee
Mr. Thomas also serves as Trustee of other Fidelity® funds. Mr. Thomas serves as Non-Executive Chairman of the Board of Directors of Fortune Brands Home and Security (home and security products, 2011-present), as a member of the Board of Directors (2004-present) and Presiding Director (2013-present) of Interpublic Group of Companies, Inc. (marketing communication), and as a member of the Board of Trustees of the University of Florida (2013-present). Previously, Mr. Thomas served as Executive Chairman (2005-2006) and Chairman and Chief Executive Officer (2000-2005) of IMS Health, Inc. (pharmaceutical and healthcare information solutions), and a Director of Fortune Brands, Inc. (consumer products, 2000-2011).
+ The information includes the Trustee's principal occupation during the last five years and other information relating to the experience, attributes, and skills relevant to the Trustee's qualifications to serve as a Trustee, which led to the conclusion that the Trustee should serve as a Trustee for the fund.
Advisory Board Members and Officers:
Correspondence intended for an officer or Peter S. Lynch may be sent to Fidelity Investments, 245 Summer Street, Boston, Massachusetts 02210. Officers appear below in alphabetical order.
Name, Year of Birth; Principal Occupation
Peter S. Lynch (1944)
Year of Election or Appointment: 2003
Member of the Advisory Board
Mr. Lynch also serves as Member of the Advisory Board of other Fidelity® funds. Mr. Lynch is Vice Chairman and a Director of FMR (investment adviser firm) and FMR Co., Inc. (investment adviser firm). In addition, Mr. Lynch serves as a Trustee of Boston College and as the Chairman of the Inner-City Scholarship Fund. Previously, Mr. Lynch served on the Special Olympics International Board of Directors (1997-2006).
Marc R. Bryant (1966)
Year of Election or Appointment: 2015
Secretary and Chief Legal Officer (CLO)
Mr. Bryant also serves as Secretary and CLO of other funds. Mr. Bryant serves as CLO, Secretary, and Senior Vice President of Fidelity Management & Research Company (investment adviser firm, 2015-present) and FMR Co., Inc. (investment adviser firm, 2015-present); Secretary of Fidelity SelectCo, LLC (investment adviser firm, 2015-present) and Fidelity Investments Money Management, Inc. (investment adviser firm, 2015-present); and CLO of Fidelity Management & Research (Hong Kong) Limited and FMR Investment Management (U.K.) Limited (investment adviser firms, 2015-present) and Fidelity Management & Research (Japan) Limited (investment adviser firm, 2016-present). He is Senior Vice President and Deputy General Counsel of FMR LLC (diversified financial services company). Previously, Mr. Bryant served as Secretary and CLO of Fidelity Rutland Square Trust II (2010-2014) and Assistant Secretary of Fidelity's Fixed Income and Asset Allocation Funds (2013-2015). Prior to joining Fidelity Investments, Mr. Bryant served as a Senior Vice President and the Head of Global Retail Legal for AllianceBernstein L.P. (2006-2010), and as the General Counsel for ProFund Advisors LLC (2001-2006).
William C. Coffey (1969)
Year of Election or Appointment: 2009
Assistant Secretary
Mr. Coffey also serves as Assistant Secretary of other funds. He is Senior Vice President and Deputy General Counsel of FMR LLC (diversified financial services company, 2010-present), and is an employee of Fidelity Investments. Previously, Mr. Coffey served as Vice President and Associate General Counsel of FMR LLC (2005-2009).
Jeffrey S. Christian (1961)
Year of Election or Appointment: 2016
Assistant Treasurer
Mr. Christian also serves as Assistant Treasurer of other funds. Mr. Christian is an employee of Fidelity Investments (2003-present).
Jonathan Davis (1968)
Year of Election or Appointment: 2010
Assistant Treasurer
Mr. Davis also serves as Assistant Treasurer of other funds, and is an employee of Fidelity Investments. Previously, Mr. Davis served as Vice President and Associate General Counsel of FMR LLC (diversified financial services company, 2003-2010).
Adrien E. Deberghes (1967)
Year of Election or Appointment: 2016
Assistant Treasurer
Mr. Deberghes also serves as an officer of other funds. He is an employee of Fidelity Investments (2008-present). Prior to joining Fidelity Investments, Mr. Deberghes was Senior Vice President of Mutual Fund Administration at State Street Corporation (2007-2008), Senior Director of Mutual Fund Administration at Investors Bank & Trust (2005-2007), and Director of Finance for Dunkin' Brands (2000-2005). Previously, Mr. Deberghes served in other fund officer roles.
Stephanie J. Dorsey (1969)
Year of Election or Appointment: 2010
Assistant Treasurer
Ms. Dorsey also serves as an officer of other funds. She is an employee of Fidelity Investments (2008-present) and has served in other fund officer roles. Prior to joining Fidelity Investments, Ms. Dorsey served as Treasurer (2004-2008) of the JPMorgan Mutual Funds and Vice President (2004-2008) of JPMorgan Chase Bank.
Howard J. Galligan III (1966)
Year of Election or Appointment: 2014
Chief Financial Officer
Mr. Galligan also serves as Chief Financial Officer of other funds. Mr. Galligan serves as President of Fidelity Pricing and Cash Management Services (FPCMS) (2014-present) and as a Director of Strategic Advisers, Inc. (investment adviser firm, 2008-present). Previously, Mr. Galligan served as Chief Administrative Officer of Asset Management (2011-2014) and Chief Operating Officer and Senior Vice President of Investment Support for Strategic Advisers, Inc. (2003-2011).
Scott C. Goebel (1968)
Year of Election or Appointment: 2015
Vice President
Mr. Goebel serves as Vice President of other funds and is an employee of Fidelity Investments (2001-present). Previously, Mr. Goebel served as Secretary of Fidelity SelectCo, LLC (investment adviser firm, 2013-2015), Fidelity Investments Money Management, Inc. (FIMM) (investment adviser firm, 2010-2015), and Fidelity Research and Analysis Company (FRAC) (investment adviser firm, 2010-2015); General Counsel, Secretary, and Senior Vice President of Fidelity Management & Research Company (investment adviser firm, 2008-2015) and FMR Co., Inc. (investment adviser firm, 2008-2015); Assistant Secretary of Fidelity Management & Research (Japan) Limited (investment adviser firm, 2008-2015) and Fidelity Management & Research (U.K.) Inc. (investment adviser firm, 2008-2015); Chief Legal Officer (CLO) of Fidelity Management & Research (Hong Kong) Limited (investment adviser firm, 2008-2015); Secretary and CLO of certain Fidelity® funds (2008-2015); Assistant Secretary of FIMM (2008-2010), FRAC (2008-2010), and certain funds (2007-2008); and as Vice President and Secretary of Fidelity Distributors Corporation (FDC) (2005-2007).
Brian B. Hogan (1964)
Year of Election or Appointment: 2009
Vice President
Mr. Hogan also serves as Trustee or Vice President of other funds. Mr. Hogan serves as a Director of FMR Investment Management (U.K.) Limited (investment adviser firm, 2015-present) and Fidelity SelectCo, LLC (investment adviser firm, 2014-present) and President of the Equity Division of FMR (investment adviser firm, 2009-present). Previously, Mr. Hogan served as Senior Vice President, Equity Research of FMR (2006-2009) and as a portfolio manager. Mr. Brian B. Hogan is not related to Mr. Colm A. Hogan.
Colm A. Hogan (1973)
Year of Election or Appointment: 2016
Deputy Treasurer
Mr. Hogan also serves as an officer of other funds. Mr. Hogan is an employee of Fidelity Investments (2005-present). Mr. Colm A. Hogan is not related to Mr. Brian B. Hogan.
Chris Maher (1972)
Year of Election or Appointment: 2013
Assistant Treasurer
Mr. Maher serves as Assistant Treasurer of other funds. Mr. Maher is Vice President of Valuation Oversight and is an employee of Fidelity Investments. Previously, Mr. Maher served as Vice President of Asset Management Compliance (2013), Vice President of the Program Management Group of FMR (investment adviser firm, 2010-2013), and Vice President of Valuation Oversight (2008-2010).
John F. Papandrea (1972)
Year of Election or Appointment: 2016
Anti-Money Laundering (AML) Officer
Mr. Papandrea also serves as AML Officer of other funds. Mr. Papandrea is Vice President of FMR LLC (diversified financial services company, 2008-present) and is an employee of Fidelity Investments (2005-present).
Melissa M. Reilly (1971)
Year of Election or Appointment: 2014
Vice President of certain Equity Funds
Ms. Reilly also serves as Vice President of other funds. Ms. Reilly is an employee of Fidelity Investments (2004-present).
Kenneth B. Robins (1969)
Year of Election or Appointment: 2016
Chief Compliance Officer
Mr. Robins also serves as an officer of other funds. Mr. Robins serves as Executive Vice President of Fidelity Investments Money Management, Inc. (FIMM) (investment adviser firm, 2013-present) and is an employee of Fidelity Investments (2004-present). Previously, Mr. Robins served in other fund officer roles.
Stacie M. Smith (1974)
Year of Election or Appointment: 2016
President and Treasurer
Ms. Smith also serves as an officer of other funds. She is an employee of Fidelity Investments (2009-present) and has served in other fund officer roles. Prior to joining Fidelity Investments, Ms. Smith served as Senior Audit Manager of Ernst & Young LLP (1996-2009). Previously, Ms. Smith served as Deputy Treasurer of certain Fidelity® funds (2013-2016).
Renee Stagnone (1975)
Year of Election or Appointment: 2016
Assistant Treasurer
Ms. Stagnone also serves as an officer of other funds. Ms. Stagnone is an employee of Fidelity Investments (1997-present). Previously, Ms. Stagnone served as Deputy Treasurer of certain Fidelity® funds (2013-2016).
Shareholder Expense Example
As a shareholder of the Fund, you incur two types of costs: (1) transaction costs, and (2) ongoing costs, including management fees and other Fund expenses. This Example is intended to help you understand your ongoing costs (in dollars) of investing in the Fund and to compare these costs with the ongoing costs of investing in other mutual funds.
The Example is based on an investment of $1,000 invested at the beginning of the period and held for the entire period (November 1, 2015 to April 30, 2016).
Actual Expenses
The first line of the accompanying table provides information about actual account values and actual expenses. You may use the information in this line, together with the amount you invested, to estimate the expenses that you paid over the period. Simply divide your account value by $1,000.00 (for example, an $8,600 account value divided by $1,000.00 = 8.6), then multiply the result by the number in the first line under the heading entitled "Expenses Paid During Period" to estimate the expenses you paid on your account during this period. A small balance maintenance fee of $12.00 that is charged once a year may apply for certain accounts with a value of less than $2,000. This fee is not included in the table below. If it was, the estimate of expenses you paid during the period would be higher, and your ending account value lower, by this amount. In addition, the Fund, as a shareholder in the underlying Fidelity Central Funds, will indirectly bear its pro-rata share of the fees and expenses incurred by the underlying Fidelity Central Funds. These fees and expenses are not included in the Fund's annualized expense ratio used to calculate the expense estimate in the table below.
Hypothetical Example for Comparison Purposes
The second line of the accompanying table provides information about hypothetical account values and hypothetical expenses based on the Fund's actual expense ratio and an assumed rate of return of 5% per year before expenses, which is not the Fund's actual return. The hypothetical account values and expenses may not be used to estimate the actual ending account balance or expenses you paid for the period. You may use this information to compare the ongoing costs of investing in the Fund and other funds. To do so, compare this 5% hypothetical example with the 5% hypothetical examples that appear in the shareholder reports of the other funds. A small balance maintenance fee of $12.00 that is charged once a year may apply for certain accounts with a value of less than $2,000. This fee is not included in the table below. If it was, the estimate of expenses you paid during the period would be higher, and your ending account value lower, by this amount. In addition, the Fund, as a shareholder in the underlying Fidelity Central Funds, will indirectly bear its pro-rata share of the fees and expenses incurred by the underlying Fidelity Central Funds. These fees and expenses are not included in the Fund's annualized expense ratio used to calculate the expense estimate in the table below.
Please note that the expenses shown in the table are meant to highlight your ongoing costs only and do not reflect any transaction costs. Therefore, the second line of the table is useful in comparing ongoing costs only, and will not help you determine the relative total costs of owning different funds.
| Annualized Expense Ratio-A | Beginning Account Value November 1, 2015 | Ending Account Value April 30, 2016 | Expenses Paid During Period-B November 1, 2015 to April 30, 2016 |
|
| Actual | 1.08% | $1,000.00 | $990.70 | $5.35 |
| Hypothetical-C | $1,000.00 | $1,019.49 | $5.42 |
A Annualized expense ratio reflects expenses net of applicable fee waivers.
B Expenses are equal to the Fund's annualized expense ratio, multiplied by the average account value over the period, multiplied by 182/366 (to reflect the one-half year period).
C 5% return per year before expenses
Distributions (Unaudited)
The fund designates 100% of the dividends distributed during the fiscal year as qualifying for the dividends–received deduction for corporate shareholders.
The fund designates 100% of the dividends distributed in June and December 2015, during the fiscal year as amounts which may be taken into account as a dividend for the purposes of the maximum rate under section 1(h)(11) of the Internal Revenue Code.
The fund will notify shareholders in January 2017 of amounts for use in preparing 2016 income tax returns.
![]()
Corporate Headquarters
245 Summer St.
Boston, MA 02210
www.fidelity.com
EDO-ANN-0616
1.9585357.102
|
Fidelity® Small Cap Discovery Fund Annual Report April 30, 2016 |
|
|
Contents
To view a fund's proxy voting guidelines and proxy voting record for the 12-month period ended June 30, visit http://www.fidelity.com/proxyvotingresults or visit the Securities and Exchange Commission's (SEC) web site at http://www.sec.gov.
You may also call 1-800-544-8544 to request a free copy of the proxy voting guidelines.
Standard & Poor's, S&P and S&P 500 are registered service marks of The McGraw-Hill Companies, Inc. and have been licensed for use by Fidelity Distributors Corporation.
Other third-party marks appearing herein are the property of their respective owners.
All other marks appearing herein are registered or unregistered trademarks or service marks of FMR LLC or an affiliated company. © 2016 FMR LLC. All rights reserved.
This report and the financial statements contained herein are submitted for the general information of the shareholders of the Fund. This report is not authorized for distribution to prospective investors in the Fund unless preceded or accompanied by an effective prospectus.
A fund files its complete schedule of portfolio holdings with the SEC for the first and third quarters of each fiscal year on Form N-Q. Forms N-Q are available on the SEC’s web site at http://www.sec.gov. A fund's Forms N-Q may be reviewed and copied at the SEC’s Public Reference Room in Washington, DC. Information regarding the operation of the SEC's Public Reference Room may be obtained by calling 1-800-SEC-0330.
For a complete list of a fund's portfolio holdings, view the most recent holdings listing, semiannual report, or annual report on Fidelity's web site at http://www.fidelity.com, http://www.advisor.fidelity.com, or http://www.401k.com, as applicable.
NOT FDIC INSURED •MAY LOSE VALUE •NO BANK GUARANTEE
Neither the Fund nor Fidelity Distributors Corporation is a bank.
Performance: The Bottom Line
Average annual total return reflects the change in the value of an investment, assuming reinvestment of distributions from dividend income and capital gains (the profits earned upon the sale of securities that have grown in value, if any) and assuming a constant rate of performance each year. The hypothetical investment and the average annual total returns do not reflect the deduction of taxes that a shareholder would pay on fund distributions or the redemption of fund shares. During periods of reimbursement by Fidelity, a fund’s total return will be greater than it would be had the reimbursement not occurred. How a fund did yesterday is no guarantee of how it will do tomorrow.
Average Annual Total Returns
| For the periods ended April 30, 2016 | Past 1 year | Past 5 years | Past 10 years |
| Fidelity® Small Cap Discovery Fund | (2.94)% | 10.32% | 9.76% |
$10,000 Over 10 Years
Let's say hypothetically that $10,000 was invested in Fidelity® Small Cap Discovery Fund on April 30, 2006.
The chart shows how the value of your investment would have changed, and also shows how the Russell 2000® Index performed over the same period.

| Period Ending Values | ||
|
| $25,379 | Fidelity® Small Cap Discovery Fund |
|
| $16,958 | Russell 2000® Index |
Management's Discussion of Fund Performance
Market Recap: The S&P 500® index gained 1.21% for the 12 months ending April 30, 2016. Largely range-bound until mid-August, U.S. stocks suffered a steep, late-summer decline on concern about an economic slowdown in China. The market recovered in October, lifted by the U.S. Federal Reserve’s decision to delay raising near-term interest rates until mid-December, as well as a rate cut in China and economic stimulus in Europe. But continued oil-price weakness and U.S.-dollar strength pushed the S&P 500® to its worst January since 2009, followed by a volatile but ultimately flattish February, then a sharp rebound in March driven by U.S. jobs gains and perceived softening in the Fed’s rate-tightening posture. April brought minimal change. For the full period, growth-oriented and larger-cap stocks fared better overall than value and smaller-cap complements. Performance was split, as five of 10 S&P 500® sectors gained ground, with a wide gap separating leaders from laggards. Investor demand for more-stable and higher-yielding investments boosted traditionally defensive, dividend-rich groups such as utilities (+14%), telecommunication services (+10%) and consumer staples (+11%) – the latter also buoyed by rising wages and low inflation. Meanwhile, energy (-14%) foundered amid commodity weakness that also hurt materials (-4%). Comments from Interim Portfolio Manager Derek Janssen: For the 12 months ending April 30, 2016, the fund returned –2.94%, significantly outpacing the -5.94% return of the benchmark Russell 2000® Index. On a relative basis, stock picking was extremely strong this period, especially in the health care and information technology sectors, and also to a lesser extent in consumer staples. In contrast, security selection in financials and telecommunication services hampered results. On an individual basis, the fund benefited from technology resellers Ingram Micro – which was not in the index – and Tech Data. Coming into the period, both companies were being priced as if they would create no or even negative value for shareholders over time – a view I did not share. Both stocks rose off low valuations this period, while Ingram's share price jumped in February when the company agreed to be acquired. Other relative contributors this period included food and consumer products company Post Holdings and AmSurg, which operates ambulatory surgical centers. On the negative side, asset manager Waddell & Reed returned -56%, as the out-of-benchmark holding faced big challenges including the departure of several key portfolio managers and new federal regulations that I thought threatened to weigh on the firm's future profits. I ultimately reduced the fund's stake prior to period end. In the energy sector, Tidewater and out-of-benchmark holding Superior Energy Services also detracted.The views expressed above reflect those of the portfolio manager(s) only through the end of the period as stated on the cover of this report and do not necessarily represent the views of Fidelity or any other person in the Fidelity organization. Any such views are subject to change at any time based upon market or other conditions and Fidelity disclaims any responsibility to update such views. These views may not be relied on as investment advice and, because investment decisions for a Fidelity fund are based on numerous factors, may not be relied on as an indication of trading intent on behalf of any Fidelity fund.
Investment Summary (Unaudited)
Top Ten Stocks as of April 30, 2016
| % of fund's net assets | % of fund's net assets 6 months ago | |
| WESCO International, Inc. | 3.2 | 2.6 |
| Cullen/Frost Bankers, Inc. | 3.0 | 0.0 |
| Post Holdings, Inc. | 3.0 | 2.7 |
| Federated Investors, Inc. Class B (non-vtg.) | 3.0 | 2.7 |
| Ingram Micro, Inc. Class A | 2.9 | 3.2 |
| TCF Financial Corp. | 2.9 | 3.0 |
| AmSurg Corp. | 2.9 | 2.5 |
| EnerSys | 2.9 | 2.8 |
| Tech Data Corp. | 2.7 | 3.3 |
| Aarons, Inc. Class A | 2.7 | 2.1 |
| 29.2 |
Top Five Market Sectors as of April 30, 2016
| % of fund's net assets | % of fund's net assets 6 months ago | |
| Financials | 23.7 | 24.0 |
| Information Technology | 17.3 | 22.0 |
| Industrials | 16.2 | 12.4 |
| Health Care | 14.0 | 15.8 |
| Consumer Discretionary | 13.1 | 12.6 |
Asset Allocation (% of fund's net assets)
| As of April 30, 2016 * | ||
| Stocks | 99.6% | |
| Short-Term Investments and Net Other Assets (Liabilities) | 0.4% | |

* Foreign investments - 4.2%
| As of October 31, 2015 * | ||
| Stocks | 98.6% | |
| Short-Term Investments and Net Other Assets (Liabilities) | 1.4% | |

* Foreign investments - 3.3%
Percentages shown as 0.0% may reflect amounts less than 0.05%.
Investments April 30, 2016
Showing Percentage of Net Assets
| Common Stocks - 99.6% | |||
| Shares | Value | ||
| CONSUMER DISCRETIONARY - 13.1% | |||
| Household Durables - 2.3% | |||
| KB Home (a) | 4,500,000 | $61,065,000 | |
| Meritage Homes Corp. (b) | 1,900,080 | 64,659,722 | |
| 125,724,722 | |||
| Leisure Products - 2.5% | |||
| Brunswick Corp. | 2,800,000 | 134,484,000 | |
| Multiline Retail - 1.6% | |||
| Dillard's, Inc. Class A | 1,200,000 | 84,540,000 | |
| Specialty Retail - 6.7% | |||
| Aarons, Inc. Class A (c) | 5,400,000 | 141,534,000 | |
| Finish Line, Inc. Class A (c) | 3,225,000 | 63,693,750 | |
| Genesco, Inc. (b)(c) | 1,697,300 | 117,419,214 | |
| Rent-A-Center, Inc. | 2,250,000 | 33,075,000 | |
| 355,721,964 | |||
| TOTAL CONSUMER DISCRETIONARY | 700,470,686 | ||
| CONSUMER STAPLES - 3.0% | |||
| Food Products - 3.0% | |||
| Post Holdings, Inc. (b) | 2,200,000 | 158,048,000 | |
| ENERGY - 5.5% | |||
| Energy Equipment & Services - 5.5% | |||
| Oil States International, Inc. (b) | 1,911,185 | 66,203,448 | |
| ShawCor Ltd. Class A | 3,000,000 | 81,055,232 | |
| Superior Energy Services, Inc. | 6,346,966 | 107,009,847 | |
| Tidewater, Inc. (c) | 4,675,000 | 40,953,000 | |
| 295,221,527 | |||
| FINANCIALS - 23.7% | |||
| Banks - 13.7% | |||
| Associated Banc-Corp. | 5,297,400 | 96,624,576 | |
| Cathay General Bancorp | 2,450,000 | 74,774,000 | |
| Cullen/Frost Bankers, Inc. (a) | 2,500,000 | 159,975,000 | |
| First Citizen Bancshares, Inc. | 390,951 | 99,692,505 | |
| First Citizen Bancshares, Inc. Class A (b) | 200,000 | 51,000,000 | |
| Hilltop Holdings, Inc. (b) | 1,985,968 | 39,441,324 | |
| PacWest Bancorp | 1,350,000 | 53,973,000 | |
| TCF Financial Corp. (c) | 11,500,000 | 156,860,000 | |
| 732,340,405 | |||
| Capital Markets - 3.9% | |||
| Federated Investors, Inc. Class B (non-vtg.) | 5,000,000 | 158,000,000 | |
| Waddell & Reed Financial, Inc. Class A | 2,336,986 | 47,534,295 | |
| 205,534,295 | |||
| Insurance - 1.0% | |||
| Amerisafe, Inc. (c) | 1,000,000 | 53,880,000 | |
| Real Estate Investment Trusts - 2.9% | |||
| Franklin Street Properties Corp. | 2,700,000 | 28,674,000 | |
| Store Capital Corp. | 1,202,497 | 30,868,098 | |
| The GEO Group, Inc. | 3,000,000 | 96,090,000 | |
| 155,632,098 | |||
| Thrifts & Mortgage Finance - 2.2% | |||
| Washington Federal, Inc. (c) | 4,720,755 | 114,667,139 | |
| TOTAL FINANCIALS | 1,262,053,937 | ||
| HEALTH CARE - 14.0% | |||
| Health Care Equipment & Supplies - 3.5% | |||
| Hill-Rom Holdings, Inc. | 1,800,000 | 87,030,000 | |
| Integra LifeSciences Holdings Corp. (b) | 1,400,000 | 99,148,000 | |
| 186,178,000 | |||
| Health Care Providers & Services - 8.7% | |||
| AmSurg Corp. (b) | 1,900,000 | 153,862,000 | |
| Chemed Corp. | 350,000 | 45,423,000 | |
| Owens & Minor, Inc. | 2,500,000 | 90,975,000 | |
| Team Health Holdings, Inc. (b) | 3,000,000 | 125,490,000 | |
| VCA, Inc. (b) | 750,000 | 47,227,500 | |
| 462,977,500 | |||
| Pharmaceuticals - 1.8% | |||
| Innoviva, Inc. (a)(c) | 7,661,928 | 94,548,192 | |
| TOTAL HEALTH CARE | 743,703,692 | ||
| INDUSTRIALS - 16.2% | |||
| Commercial Services & Supplies - 2.5% | |||
| Essendant, Inc. | 1,495,300 | 46,040,287 | |
| HNI Corp. | 2,050,226 | 89,635,881 | |
| 135,676,168 | |||
| Electrical Equipment - 3.6% | |||
| EnerSys (c) | 2,600,000 | 151,762,000 | |
| Powell Industries, Inc. (c) | 1,200,000 | 37,344,000 | |
| 189,106,000 | |||
| Machinery - 1.7% | |||
| Columbus McKinnon Corp. (NY Shares) | 498,432 | 8,229,112 | |
| Hillenbrand, Inc. | 1,650,000 | 50,011,500 | |
| Mueller Industries, Inc. | 1,000,000 | 31,560,000 | |
| 89,800,612 | |||
| Professional Services - 2.3% | |||
| FTI Consulting, Inc. (b)(c) | 3,000,000 | 120,900,000 | |
| Road & Rail - 2.3% | |||
| Genesee & Wyoming, Inc. Class A (b) | 622,388 | 40,523,683 | |
| Swift Transporation Co. (a)(b) | 5,075,000 | 84,346,500 | |
| 124,870,183 | |||
| Trading Companies & Distributors - 3.8% | |||
| Diploma PLC | 3,000,000 | 32,064,937 | |
| WESCO International, Inc. (a)(b)(c) | 2,897,470 | 170,342,263 | |
| 202,407,200 | |||
| TOTAL INDUSTRIALS | 862,760,163 | ||
| INFORMATION TECHNOLOGY - 17.3% | |||
| Electronic Equipment & Components - 7.2% | |||
| Ingram Micro, Inc. Class A | 4,500,000 | 157,275,000 | |
| SYNNEX Corp. | 1,012,681 | 83,617,070 | |
| Tech Data Corp. (b)(c) | 2,100,000 | 144,249,000 | |
| 385,141,070 | |||
| Internet Software & Services - 4.7% | |||
| Blucora, Inc. (b) | 1,647,048 | 13,192,854 | |
| Cimpress NV (a)(b) | 1,250,000 | 109,837,500 | |
| j2 Global, Inc. | 2,000,000 | 127,040,000 | |
| 250,070,354 | |||
| IT Services - 4.1% | |||
| Booz Allen Hamilton Holding Corp. Class A | 3,500,000 | 96,495,000 | |
| CACI International, Inc. Class A (b)(c) | 1,300,000 | 124,995,000 | |
| 221,490,000 | |||
| Software - 1.3% | |||
| SS&C Technologies Holdings, Inc. | 1,100,000 | 67,265,000 | |
| TOTAL INFORMATION TECHNOLOGY | 923,966,424 | ||
| MATERIALS - 5.9% | |||
| Containers & Packaging - 1.6% | |||
| Silgan Holdings, Inc. | 1,725,000 | 87,526,500 | |
| Metals & Mining - 4.3% | |||
| Carpenter Technology Corp. (a)(c) | 3,745,924 | 132,643,169 | |
| Compass Minerals International, Inc. | 700,000 | 52,472,000 | |
| Haynes International, Inc. (c) | 1,100,000 | 41,283,000 | |
| 226,398,169 | |||
| TOTAL MATERIALS | 313,924,669 | ||
| UTILITIES - 0.9% | |||
| Electric Utilities - 0.9% | |||
| Portland General Electric Co. | 1,200,000 | 47,664,000 | |
| TOTAL COMMON STOCKS | |||
| (Cost $4,096,523,235) | 5,307,813,098 | ||
| Money Market Funds - 5.1% | |||
| Fidelity Cash Central Fund, 0.38% (d) | 29,955,787 | 29,955,787 | |
| Fidelity Securities Lending Cash Central Fund, 0.42% (d)(e) | 242,102,031 | 242,102,031 | |
| TOTAL MONEY MARKET FUNDS | |||
| (Cost $272,057,818) | 272,057,818 | ||
| TOTAL INVESTMENT PORTFOLIO - 104.7% | |||
| (Cost $4,368,581,053) | 5,579,870,916 | ||
| NET OTHER ASSETS (LIABILITIES) - (4.7)% | (249,055,345) | ||
| NET ASSETS - 100% | $5,330,815,571 |
Legend
(a) Security or a portion of the security is on loan at period end.
(b) Non-income producing
(c) Affiliated company
(d) Affiliated fund that is generally available only to investment companies and other accounts managed by Fidelity Investments. The rate quoted is the annualized seven-day yield of the fund at period end. A complete unaudited listing of the fund's holdings as of its most recent quarter end is available upon request. In addition, each Fidelity Central Fund's financial statements, which are not covered by the Fund's Report of Independent Registered Public Accounting Firm, are available on the SEC's website or upon request.
(e) Investment made with cash collateral received from securities on loan.
Affiliated Central Funds
Information regarding fiscal year to date income earned by the Fund from investments in Fidelity Central Funds is as follows:
| Fund | Income earned |
| Fidelity Cash Central Fund | $187,195 |
| Fidelity Securities Lending Cash Central Fund | 4,403,817 |
| Total | $4,591,012 |
Other Affiliated Issuers
An affiliated company is a company in which the Fund has ownership of at least 5% of the voting securities. Fiscal year to date transactions with companies which are or were affiliates are as follows:
| Affiliate | Value, beginning of period | Purchases | Sales Proceeds | Dividend Income | Value, end of period |
| Aarons, Inc. Class A | $190,220,988 | $27,317,918 | $48,009,272 | $500,000 | $141,534,000 |
| Amerisafe, Inc. | 52,420,400 | -- | 8,576,418 | 3,678,000 | 53,880,000 |
| Blucora, Inc. | 28,069,800 | -- | 3,438,590 | -- | -- |
| CACI International, Inc. Class A | 163,244,000 | -- | 52,264,250 | -- | 124,995,000 |
| Carpenter Technology Corp. | 77,850,000 | 50,296,520 | -- | 2,229,668 | 132,643,169 |
| Chemed Corp. | 121,012,500 | -- | 95,435,005 | 796,605 | -- |
| Columbus McKinnon Corp. (NY Shares) | 47,423,200 | -- | 19,881,571 | 269,912 | -- |
| EnerSys | 183,330,000 | -- | 6,492,937 | 1,837,500 | 151,762,000 |
| Finish Line, Inc. Class A | -- | 55,646,482 | -- | 322,500 | 63,693,750 |
| First Citizen Bancshares, Inc. Class A | 48,068,000 | -- | -- | 240,000 | -- |
| FTI Consulting, Inc. | 164,440,000 | -- | 34,159,539 | -- | 120,900,000 |
| Genesco, Inc. | 114,903,000 | -- | 178,516 | -- | 117,419,214 |
| GrafTech International Ltd. | 55,646,211 | -- | 57,646,020 | -- | -- |
| Haynes International, Inc. | 48,917,000 | -- | -- | 968,000 | 41,283,000 |
| Innoviva, Inc. | 81,729,099 | 35,754,498 | 2,966,069 | 3,122,059 | 94,548,192 |
| Integra LifeSciences Holdings Corp. | 135,194,000 | -- | 57,193,156 | -- | -- |
| Intelsat SA | 73,022,000 | -- | 9,303,915 | -- | -- |
| j2 Global, Inc. | 180,362,000 | 11,565,189 | 59,495,365 | 2,857,500 | -- |
| Owens & Minor, Inc. | 107,904,000 | -- | 26,596,595 | 3,061,500 | -- |
| Powell Industries, Inc. | 39,828,000 | -- | -- | 1,248,000 | 37,344,000 |
| QuinStreet, Inc. | 21,720,000 | -- | 20,293,304 | -- | -- |
| Rent-A-Center, Inc. | 133,200,000 | 15,072,042 | 35,313,652 | 3,612,000 | -- |
| Rouse Properties, Inc. | 59,398,000 | -- | 61,325,728 | 1,836,000 | -- |
| RTI International Metals, Inc. | 79,065,000 | -- | 15,333,147 | -- | -- |
| TCF Financial Corp. | 172,260,000 | 6,770,886 | 1,532,797 | 2,780,000 | 156,860,000 |
| Tech Data Corp. | 177,565,500 | -- | 72,074,691 | -- | 144,249,000 |
| Tidewater, Inc. | 83,070,000 | 41,405,618 | -- | 3,462,500 | 40,953,000 |
| UIL Holdings Corp. | 144,652,000 | -- | 136,875,910 | 3,369,600 | -- |
| Vera Bradley, Inc. | 26,607,326 | 22,567,899 | 51,328,740 | -- | -- |
| Waddell & Reed Financial, Inc. Class A | 157,824,000 | 35,065,329 | 44,890,275 | 5,839,027 | -- |
| Washington Federal, Inc. | 109,116,720 | -- | 7,353,850 | 3,254,580 | 114,667,139 |
| WESCO International, Inc. | 115,424,000 | 77,398,675 | -- | -- | 170,342,263 |
| Total | $3,193,486,744 | $378,861,056 | $927,959,312 | $45,284,951 | $1,707,073,727 |
Investment Valuation
All investments are categorized as Level 1 under the Fair Value Hierarchy. The inputs or methodology used for valuing securities may not be an indication of the risk associated with investing in those securities. For more information on valuation inputs please refer to the Investment Valuation section in the accompanying Notes to Financial Statements.
See accompanying notes which are an integral part of the financial statements.
Financial Statements
Statement of Assets and Liabilities
| April 30, 2016 | ||
| Assets | ||
| Investment in securities, at value (including securities loaned of $235,687,011) — See accompanying schedule: Unaffiliated issuers (cost $2,543,622,239) | $3,600,739,371 | |
| Fidelity Central Funds (cost $272,057,818) | 272,057,818 | |
| Other affiliated issuers (cost $1,552,900,996) | 1,707,073,727 | |
| Total Investments (cost $4,368,581,053) | $5,579,870,916 | |
| Receivable for investments sold | 132,473 | |
| Receivable for fund shares sold | 4,128,396 | |
| Dividends receivable | 4,957,186 | |
| Distributions receivable from Fidelity Central Funds | 168,667 | |
| Prepaid expenses | 4,584 | |
| Other receivables | 38,892 | |
| Total assets | 5,589,301,114 | |
| Liabilities | ||
| Payable for fund shares redeemed | $12,078,729 | |
| Accrued management fee | 3,374,638 | |
| Other affiliated payables | 874,467 | |
| Other payables and accrued expenses | 55,678 | |
| Collateral on securities loaned, at value | 242,102,031 | |
| Total liabilities | 258,485,543 | |
| Net Assets | $5,330,815,571 | |
| Net Assets consist of: | ||
| Paid in capital | $4,122,817,506 | |
| Accumulated undistributed net realized gain (loss) on investments and foreign currency transactions | (3,291,798) | |
| Net unrealized appreciation (depreciation) on investments | 1,211,289,863 | |
| Net Assets, for 191,676,508 shares outstanding | $5,330,815,571 | |
| Net Asset Value, offering price and redemption price per share ($5,330,815,571 ÷ 191,676,508 shares) | $27.81 |
See accompanying notes which are an integral part of the financial statements.
Statement of Operations
| Year ended April 30, 2016 | ||
| Investment Income | ||
| Dividends (including $45,284,951 earned from other affiliated issuers) | $80,058,945 | |
| Income from Fidelity Central Funds (including $4,403,817 from security lending) | 4,591,012 | |
| Total income | 84,649,957 | |
| Expenses | ||
| Management fee | ||
| Basic fee | $38,413,484 | |
| Performance adjustment | 5,989,364 | |
| Transfer agent fees | 9,820,729 | |
| Accounting and security lending fees | 1,142,297 | |
| Custodian fees and expenses | 73,517 | |
| Independent trustees' compensation | 24,824 | |
| Registration fees | 52,737 | |
| Audit | 61,766 | |
| Legal | 13,890 | |
| Miscellaneous | 40,352 | |
| Total expenses before reductions | 55,632,960 | |
| Expense reductions | (316,145) | 55,316,815 |
| Net investment income (loss) | 29,333,142 | |
| Realized and Unrealized Gain (Loss) | ||
| Net realized gain (loss) on: | ||
| Investment securities: | ||
| Unaffiliated issuers | 205,552,210 | |
| Other affiliated issuers | (120,924,924) | |
| Foreign currency transactions | (31,325) | |
| Total net realized gain (loss) | 84,595,961 | |
| Change in net unrealized appreciation (depreciation) on: Investment securities | (307,147,011) | |
| Assets and liabilities in foreign currencies | 186 | |
| Total change in net unrealized appreciation (depreciation) | (307,146,825) | |
| Net gain (loss) | (222,550,864) | |
| Net increase (decrease) in net assets resulting from operations | $(193,217,722) |
See accompanying notes which are an integral part of the financial statements.
Statement of Changes in Net Assets
| Year ended April 30, 2016 | Year ended April 30, 2015 | |
| Increase (Decrease) in Net Assets | ||
| Operations | ||
| Net investment income (loss) | $29,333,142 | $22,360,445 |
| Net realized gain (loss) | 84,595,961 | 666,771,014 |
| Change in net unrealized appreciation (depreciation) | (307,146,825) | (77,566,555) |
| Net increase (decrease) in net assets resulting from operations | (193,217,722) | 611,564,904 |
| Distributions to shareholders from net investment income | (29,347,008) | (16,526,639) |
| Distributions to shareholders from net realized gain | (357,140,838) | (633,053,711) |
| Total distributions | (386,487,846) | (649,580,350) |
| Share transactions | ||
| Proceeds from sales of shares | 594,087,736 | 714,337,634 |
| Reinvestment of distributions | 358,786,583 | 606,823,541 |
| Cost of shares redeemed | (1,094,651,742) | (1,689,340,219) |
| Net increase (decrease) in net assets resulting from share transactions | (141,777,423) | (368,179,044) |
| Redemption fees | 219,477 | 373,398 |
| Total increase (decrease) in net assets | (721,263,514) | (405,821,092) |
| Net Assets | ||
| Beginning of period | 6,052,079,085 | 6,457,900,177 |
| End of period and undistributed net investment income of $0 and $8,541,169, respectively) | $5,330,815,571 | $6,052,079,085 |
| Other Information | ||
| Shares | ||
| Sold | 21,550,144 | 23,680,594 |
| Issued in reinvestment of distributions | 12,343,775 | 20,219,431 |
| Redeemed | (39,847,068) | (56,145,311) |
| Net increase (decrease) | (5,953,149) | (12,245,286) |
See accompanying notes which are an integral part of the financial statements.
Financial Highlights — Fidelity Small Cap Discovery Fund
| Years ended April 30, | 2016 | 2015 | 2014 | 2013 | 2012 |
| Selected Per–Share Data | |||||
| Net asset value, beginning of period | $30.62 | $30.77 | $27.46 | $22.37 | $22.78 |
| Income from Investment Operations | |||||
| Net investment income (loss)A | .15 | .11 | .05 | .25 | (.02) |
| Net realized and unrealized gain (loss) | (.99) | 3.00 | 5.10 | 5.55 | .11 |
| Total from investment operations | (.84) | 3.11 | 5.15 | 5.80 | .09 |
| Distributions from net investment income | (.15) | (.08) | (.03) | (.22) | – |
| Distributions from net realized gain | (1.82) | (3.18) | (1.81) | (.49) | (.51) |
| Total distributions | (1.97) | (3.26) | (1.84) | (.72)B | (.51) |
| Redemption fees added to paid in capitalA | –C | –C | –C | .01 | .01 |
| Net asset value, end of period | $27.81 | $30.62 | $30.77 | $27.46 | $22.37 |
| Total ReturnD | (2.94)% | 10.62% | 19.26% | 26.69% | .72% |
| Ratios to Average Net AssetsE,F | |||||
| Expenses before reductions | 1.01% | 1.06% | 1.01% | 1.06% | 1.07% |
| Expenses net of fee waivers, if any | 1.01% | 1.06% | 1.01% | 1.06% | 1.07% |
| Expenses net of all reductions | 1.00% | 1.05% | 1.01% | 1.05% | 1.07% |
| Net investment income (loss) | .53% | .36% | .15% | 1.02% | (.12)% |
| Supplemental Data | |||||
| Net assets, end of period (000 omitted) | $5,330,816 | $6,052,079 | $6,457,900 | $5,651,563 | $2,780,931 |
| Portfolio turnover rateG | 25% | 13% | 17% | 26% | 20% |
A Calculated based on average shares outstanding during the period.
B Total distributions of $.72 per share is comprised of distributions from net investment income of $.223 and distributions from net realized gain of $.493 per share.
C Amount represents less than $.005 per share.
D Total returns would have been lower if certain expenses had not been reduced during the applicable periods shown.
E Fees and expenses of any underlying Fidelity Central Funds are not included in the Fund's expense ratio. The Fund indirectly bears its proportionate share of the expenses of any underlying Fidelity Central Funds.
F Expense ratios reflect operating expenses of the Fund. Expenses before reductions do not reflect amounts reimbursed by the investment adviser or reductions from brokerage service arrangements or reductions from other expense offset arrangements and do not represent the amount paid by the Fund during periods when reimbursements or reductions occur. Expenses net of fee waivers reflect expenses after reimbursement by the investment adviser but prior to reductions from brokerage service arrangements or other expense offset arrangements. Expenses net of all reductions represent the net expenses paid by the Fund.
G Amount does not include the portfolio activity of any underlying Fidelity Central Funds.
See accompanying notes which are an integral part of the financial statements.
Notes to Financial Statements
For the period ended April 30, 2016
1. Organization.
Fidelity Small Cap Discovery Fund (the Fund) is a fund of Fidelity Commonwealth Trust (the Trust) and is authorized to issue an unlimited number of shares. Share transactions on the Statement of Changes in Net Assets may contain exchanges between affiliated funds. The Trust is registered under the Investment Company Act of 1940, as amended (the 1940 Act), as an open-end management investment company organized as a Massachusetts business trust. Effective after the close of business on January 31, 2013, the Fund was closed to new accounts with certain exceptions.
2. Investments in Fidelity Central Funds.
The Fund invests in Fidelity Central Funds, which are open-end investment companies generally available only to other investment companies and accounts managed by the investment adviser and its affiliates. The Fund's Schedule of Investments lists each of the Fidelity Central Funds held as of period end, if any, as an investment of the Fund, but does not include the underlying holdings of each Fidelity Central Fund. As an Investing Fund, the Fund indirectly bears its proportionate share of the expenses of the underlying Fidelity Central Funds.
The Money Market Central Funds seek preservation of capital and current income and are managed by Fidelity Investments Money Management, Inc. (FIMM), an affiliate of the investment adviser. Annualized expenses of the Money Market Central Funds as of their most recent shareholder report date are less than .005%.
A complete unaudited list of holdings for each Fidelity Central Fund is available upon request or at the Securities and Exchange Commission (the SEC) website at www.sec.gov. In addition, the financial statements of the Fidelity Central Funds, which are not covered by the Fund's Report of Independent Registered Public Accounting Firm, are available on the SEC website or upon request.
3. Significant Accounting Policies.
The financial statements have been prepared in conformity with accounting principles generally accepted in the United States of America (GAAP), which require management to make certain estimates and assumptions at the date of the financial statements. Actual results could differ from those estimates. Subsequent events, if any, through the date that the financial statements were issued have been evaluated in the preparation of the financial statements. The following summarizes the significant accounting policies of the Fund:
Investment Valuation. Investments are valued as of 4:00 p.m. Eastern time on the last calendar day of the period. The Board of Trustees (the Board) has delegated the day to day responsibility for the valuation of the Fund's investments to the Fidelity Management & Research Company (FMR) Fair Value Committee (the Committee). In accordance with valuation policies and procedures approved by the Board, the Fund attempts to obtain prices from one or more third party pricing vendors or brokers to value its investments. When current market prices, quotations or currency exchange rates are not readily available or reliable, investments will be fair valued in good faith by the Committee, in accordance with procedures adopted by the Board. Factors used in determining fair value vary by investment type and may include market or investment specific events. The frequency with which these procedures are used cannot be predicted and they may be utilized to a significant extent. The Committee oversees the Fund's valuation policies and procedures and reports to the Board on the Committee's activities and fair value determinations. The Board monitors the appropriateness of the procedures used in valuing the Fund's investments and ratifies the fair value determinations of the Committee.
The Fund categorizes the inputs to valuation techniques used to value its investments into a disclosure hierarchy consisting of three levels as shown below:
- Level 1 – quoted prices in active markets for identical investments
- Level 2 – other significant observable inputs (including quoted prices for similar investments, interest rates, prepayment speeds, etc.)
- Level 3 – unobservable inputs (including the Fund's own assumptions based on the best information available)
Valuation techniques used to value the Fund's investments by major category are as follows:
Equity securities, including restricted securities, for which market quotations are readily available, are valued at the last reported sale price or official closing price as reported by a third party pricing vendor on the primary market or exchange on which they are traded and are categorized as Level 1 in the hierarchy. In the event there were no sales during the day or closing prices are not available, securities are valued at the last quoted bid price or may be valued using the last available price and are generally categorized as Level 2 in the hierarchy. For foreign equity securities, when market or security specific events arise, comparisons to the valuation of American Depositary Receipts (ADRs), futures contracts, Exchange-Traded Funds (ETFs) and certain indexes as well as quoted prices for similar securities may be used and would be categorized as Level 2 in the hierarchy. Utilizing these techniques may result in transfers between Level 1 and Level 2. For equity securities, including restricted securities, where observable inputs are limited, assumptions about market activity and risk are used and these securities may be categorized as Level 3 in the hierarchy.
Investments in open-end mutual funds, including the Fidelity Central Funds, are valued at their closing net asset value (NAV) each business day and are categorized as Level 1 in the hierarchy.
Changes in valuation techniques may result in transfers in or out of an assigned level within the disclosure hierarchy.
Foreign Currency. The Fund may use foreign currency contracts to facilitate transactions in foreign-denominated securities. Gains and losses from these transactions may arise from changes in the value of the foreign currency or if the counterparties do not perform under the contracts' terms.
Foreign-denominated assets, including investment securities, and liabilities are translated into U.S. dollars at the exchange rates at period end. Purchases and sales of investment securities, income and dividends received and expenses denominated in foreign currencies are translated into U.S. dollars at the exchange rate in effect on the transaction date.
The effects of exchange rate fluctuations on investments are included with the net realized and unrealized gain (loss) on investment securities. Other foreign currency transactions resulting in realized and unrealized gain (loss) are disclosed separately.
Investment Transactions and Income. For financial reporting purposes, the Fund's investment holdings and NAV include trades executed through the end of the last business day of the period. The NAV per share for processing shareholder transactions is calculated as of the close of business of the New York Stock Exchange (NYSE), normally 4:00 p.m. Eastern time and includes trades executed through the end of the prior business day. Gains and losses on securities sold are determined on the basis of identified cost. Dividend income is recorded on the ex-dividend date, except for certain dividends from foreign securities where the ex-dividend date may have passed, which are recorded as soon as the Fund is informed of the ex-dividend date. Non-cash dividends included in dividend income, if any, are recorded at the fair market value of the securities received. Income and capital gain distributions from Fidelity Central Funds, if any, are recorded on the ex-dividend date. Distributions received on securities that represent a return of capital or capital gain are recorded as a reduction of cost of investments and/or as a realized gain. Subsequent to ex-dividend date the Fund determines the components of these distributions, based upon receipt of tax filings or other correspondence relating to the underlying investment. Investment income is recorded net of foreign taxes withheld where recovery of such taxes is uncertain.
Expenses. Expenses directly attributable to a fund are charged to that fund. Expenses attributable to more than one fund are allocated among the respective funds on the basis of relative net assets or other appropriate methods. Expense estimates are accrued in the period to which they relate and adjustments are made when actual amounts are known.
Income Tax Information and Distributions to Shareholders. Each year, the Fund intends to qualify as a regulated investment company under Subchapter M of the Internal Revenue Code, including distributing substantially all of its taxable income and realized gains. As a result, no provision for U.S. Federal income taxes is required. As of April 30, 2016, the Fund did not have any unrecognized tax benefits in the financial statements; nor is the Fund aware of any tax positions for which it is reasonably possible that the total amounts of unrecognized tax benefits will significantly change in the next twelve months. The Fund files a U.S. federal tax return, in addition to state and local tax returns as required. The Fund's federal income tax returns are subject to examination by the Internal Revenue Service (IRS) for a period of three fiscal years after they are filed. State and local tax returns may be subject to examination for an additional fiscal year depending on the jurisdiction. Foreign taxes are provided for based on the Fund's understanding of the tax rules and rates that exist in the foreign markets in which it invests.
Distributions are declared and recorded on the ex-dividend date. Income and capital gain distributions are determined in accordance with income tax regulations, which may differ from GAAP. In addition, the Fund claimed a portion of the payment made to redeeming shareholders as a distribution for income tax purposes.
Capital accounts within the financial statements are adjusted for permanent book-tax differences. These adjustments have no impact on net assets or the results of operations. Capital accounts are not adjusted for temporary book-tax differences which will reverse in a subsequent period.
Book-tax differences are primarily due to foreign currency transactions, passive foreign investment companies (PFIC) and losses deferred due to wash sales and excise tax regulations.
The federal tax cost of investment securities and unrealized appreciation (depreciation) as of period end were as follows:
| Gross unrealized appreciation | $1,481,512,173 |
| Gross unrealized depreciation | (271,719,768) |
| Net unrealized appreciation (depreciation) on securities | $1,209,792,405 |
| Tax Cost | $4,370,078,511 |
The tax-based components of distributable earnings as of period end were as follows:
| Net unrealized appreciation (depreciation) on securities and other investments | $1,209,792,405 |
The Fund intends to elect to defer to its next fiscal year $1,794,339 of capital losses recognized during the period November 1, 2015 to April 30, 2016.
The tax character of distributions paid was as follows:
| April 30, 2016 | April 30, 2015 | |
| Ordinary Income | $32,887,970 | $ 16,526,639 |
| Long-term Capital Gains | 353,599,876 | 633,053,711 |
| Total | $386,487,846 | $ 649,580,350 |
Short-Term Trading (Redemption) Fees. Shares held by investors in the Fund less than 90 days may have been subject to a redemption fee equal to 1.50% of the NAV of shares redeemed. All redemption fees, which reduce the proceeds of the shareholder redemption, are retained by the Fund and accounted for as an addition to paid in capital.
4. Purchases and Sales of Investments.
Purchases and sales of securities, other than short-term securities, aggregated $1,363,445,731 and $1,860,257,838, respectively.
5. Fees and Other Transactions with Affiliates.
Management Fee. Fidelity Management & Research Company (the investment adviser) and its affiliates provide the Fund with investment management related services for which the Fund pays a monthly management fee. The management fee is the sum of an individual fund fee rate that is based on an annual rate of .45% of the Fund's average net assets and an annualized group fee rate that averaged .25% during the period. The group fee rate is based upon the average net assets of all the mutual funds advised by the investment adviser, including any mutual funds previously advised by the investment adviser that are currently advised by Fidelity SelectCo, LLC, an affiliate of the investment adviser. The group fee rate decreases as assets under management increase and increases as assets under management decrease. In addition, the management fee is subject to a performance adjustment (up to a maximum of +/- .20% of the Fund's average net assets over a 36 month performance period). The upward or downward adjustment to the management fee is based on the Fund's relative investment performance as compared to its benchmark index, the Russell 2000 Index, over the same 36 month performance period. For the reporting period, the total annual management fee rate, including the performance adjustment, was .81% of the Fund's average net assets. The performance adjustment included in the management fee rate may be higher or lower than the maximum performance adjustment rate due to the difference between the average net assets for the reporting and performance periods.
Transfer Agent Fees. Fidelity Investments Institutional Operations Company, Inc. (FIIOC), an affiliate of the investment adviser, is the Fund's transfer, dividend disbursing and shareholder servicing agent. FIIOC receives account fees and asset-based fees that vary according to account size and type of account. FIIOC pays for typesetting, printing and mailing of shareholder reports, except proxy statements. For the period, the transfer agent fees were equivalent to an annual rate of .18% of average net assets.
Accounting and Security Lending Fees. Fidelity Service Company, Inc. (FSC), an affiliate of the investment adviser, maintains the Fund's accounting records. The accounting fee is based on the level of average net assets for each month. Under a separate contract, FSC administers the security lending program. The security lending fee is based on the number and duration of lending transactions.
Brokerage Commissions. The Fund placed a portion of its portfolio transactions with brokerage firms which are affiliates of the investment adviser. Brokerage commissions are included in net realized gain (loss) and change in net unrealized appreciation (depreciation) in the Statement of Operations. The commissions paid to these affiliated firms were $58,830 for the period.
Interfund Trades. The Fund may purchase from or sell securities to other Fidelity Funds under procedures adopted by the Board. The procedures have been designed to ensure these interfund trades are executed in accordance with Rule 17a-7 of the 1940 Act. Interfund trades are included within the respective purchases and sales amounts shown in the Purchases and Sales of Investments note.
6. Committed Line of Credit.
The Fund participates with other funds managed by the investment adviser or an affiliate in a $4.25 billion credit facility (the "line of credit") to be utilized for temporary or emergency purposes to fund shareholder redemptions or for other short-term liquidity purposes. The Fund has agreed to pay commitment fees on its pro-rata portion of the line of credit, which amounted to $8,369 and is reflected in Miscellaneous expenses on the Statement of Operations. During the period, the Fund did not borrow on this line of credit.
7. Security Lending.
The Fund lends portfolio securities through a lending agent from time to time in order to earn additional income. For equity securities, a lending agent is used and may loan securities to certain qualified borrowers, including Fidelity Capital Markets (FCM), a broker-dealer affiliated with the Fund. On the settlement date of the loan, the Fund receives collateral (in the form of U.S. Treasury obligations, letters of credit and/or cash) against the loaned securities and maintains collateral in an amount not less than 100% of the market value of the loaned securities during the period of the loan. The market value of the loaned securities is determined at the close of business of the Fund and any additional required collateral is delivered to the Fund on the next business day. The Fund or borrower may terminate the loan at any time, and if the borrower defaults on its obligation to return the securities loaned because of insolvency or other reasons, the Fund may apply collateral received from the borrower against the obligation. The Fund may experience delays and costs in recovering the securities loaned. Any cash collateral received is invested in the Fidelity Securities Lending Cash Central Fund. The value of loaned securities and cash collateral at period end are disclosed on the Fund's Statement of Assets and Liabilities. The value of securities loaned to FCM at period end was $3,674,852. Security lending income represents the income earned on investing cash collateral, less rebates paid to borrowers and any lending agent fees associated with the loan, plus any premium payments received for lending certain types of securities. Security lending income is presented in the Statement of Operations as a component of income from Fidelity Central Funds and includes $103,739 from securities loaned to FCM.
8. Expense Reductions.
Commissions paid to certain brokers with whom the investment adviser, or its affiliates, places trades on behalf of the Fund include an amount in addition to trade execution, which may be rebated back to the Fund to offset certain expenses. This amount totaled $129,684 for the period. In addition, through arrangements with the Fund's custodian, credits realized as a result of certain uninvested cash balances were used to reduce the Fund's expenses. During the period, these credits reduced the Fund's custody expenses by $200.
In addition, during the period the investment adviser reimbursed and/or waived a portion of operating expenses in the amount of $186,261.
9. Other.
The Fund's organizational documents provide former and current trustees and officers with a limited indemnification against liabilities arising in connection with the performance of their duties to the Fund. In the normal course of business, the Fund may also enter into contracts that provide general indemnifications. The Fund's maximum exposure under these arrangements is unknown as this would be dependent on future claims that may be made against the Fund. The risk of material loss from such claims is considered remote.
Report of Independent Registered Public Accounting Firm
To the Trustees of Fidelity Commonwealth Trust and Shareholders of Fidelity Small Cap Discovery Fund:
We have audited the accompanying statement of assets and liabilities of Fidelity Small Cap Discovery Fund (the Fund), a fund of Fidelity Commonwealth Trust, including the schedule of investments, as of April 30, 2016, and the related statement of operations for the year then ended, the statement of changes in net assets for each of the two years in the period then ended, and the financial highlights for each of the five years in the period then ended. These financial statements and financial highlights are the responsibility of the Fund's management. Our responsibility is to express an opinion on these financial statements and financial highlights based on our audits.
We conducted our audits in accordance with the standards of the Public Company Accounting Oversight Board (United States). Those standards require that we plan and perform the audit to obtain reasonable assurance about whether the financial statements and financial highlights are free of material misstatement. The Fund is not required to have, nor were we engaged to perform, an audit of its internal control over financial reporting. Our audits included consideration of internal control over financial reporting as a basis for designing audit procedures that are appropriate in the circumstances, but not for the purpose of expressing an opinion on the effectiveness of the Fund's internal control over financial reporting. Accordingly, we express no such opinion. An audit also includes examining, on a test basis, evidence supporting the amounts and disclosures in the financial statements, assessing the accounting principles used and significant estimates made by management, as well as evaluating the overall financial statement presentation. Our procedures included confirmation of securities owned as of April 30, 2016, by correspondence with the custodians and brokers; when replies were not received from brokers, we performed other auditing procedures. We believe that our audits provide a reasonable basis for our opinion.
In our opinion, such financial statements and financial highlights referred to above present fairly, in all material respects, the financial position of Fidelity Small Cap Discovery Fund as of April 30, 2016, the results of its operations for the year then ended, the changes in its net assets for each of the two years in the period then ended, and the financial highlights for each of the five years in the period then ended in conformity with accounting principles generally accepted in the United States of America.
DELOITTE & TOUCHE LLP
Boston, Massachusetts
June 15, 2016
Trustees and Officers
The Trustees, Members of the Advisory Board (if any), and officers of the trust and fund, as applicable, are listed below. The Board of Trustees governs the fund and is responsible for protecting the interests of shareholders. The Trustees are experienced executives who meet periodically throughout the year to oversee the fund's activities, review contractual arrangements with companies that provide services to the fund, oversee management of the risks associated with such activities and contractual arrangements, and review the fund's performance. Each of the Trustees oversees 170 funds.
The Trustees hold office without limit in time except that (a) any Trustee may resign; (b) any Trustee may be removed by written instrument, signed by at least two-thirds of the number of Trustees prior to such removal; (c) any Trustee who requests to be retired or who has become incapacitated by illness or injury may be retired by written instrument signed by a majority of the other Trustees; and (d) any Trustee may be removed at any special meeting of shareholders by a two-thirds vote of the outstanding voting securities of the trust. Each Trustee who is not an interested person (as defined in the 1940 Act) of the trust and the fund is referred to herein as an Independent Trustee. Each Independent Trustee shall retire not later than the last day of the calendar year in which his or her 75th birthday occurs. The Independent Trustees may waive this mandatory retirement age policy with respect to individual Trustees. Officers and Advisory Board Members hold office without limit in time, except that any officer or Advisory Board Member may resign or may be removed by a vote of a majority of the Trustees at any regular meeting or any special meeting of the Trustees. Except as indicated, each individual has held the office shown or other offices in the same company for the past five years.
The fund’s Statement of Additional Information (SAI) includes more information about the Trustees. To request a free copy, call Fidelity at 1-800-544-8544.
Experience, Skills, Attributes, and Qualifications of the Trustees. The Governance and Nominating Committee has adopted a statement of policy that describes the experience, qualifications, attributes, and skills that are necessary and desirable for potential Independent Trustee candidates (Statement of Policy). The Board believes that each Trustee satisfied at the time he or she was initially elected or appointed a Trustee, and continues to satisfy, the standards contemplated by the Statement of Policy. The Governance and Nominating Committee also engages professional search firms to help identify potential Independent Trustee candidates who have the experience, qualifications, attributes, and skills consistent with the Statement of Policy. From time to time, additional criteria based on the composition and skills of the current Independent Trustees, as well as experience or skills that may be appropriate in light of future changes to board composition, business conditions, and regulatory or other developments, have also been considered by the professional search firms and the Governance and Nominating Committee. In addition, the Board takes into account the Trustees' commitment and participation in Board and committee meetings, as well as their leadership of standing and ad hoc committees throughout their tenure.
In determining that a particular Trustee was and continues to be qualified to serve as a Trustee, the Board has considered a variety of criteria, none of which, in isolation, was controlling. The Board believes that, collectively, the Trustees have balanced and diverse experience, qualifications, attributes, and skills, which allow the Board to operate effectively in governing the fund and protecting the interests of shareholders. Information about the specific experience, skills, attributes, and qualifications of each Trustee, which in each case led to the Board's conclusion that the Trustee should serve (or continue to serve) as a trustee of the fund, is provided below.
Board Structure and Oversight Function. James C. Curvey is an interested person and currently serves as Chairman. The Trustees have determined that an interested Chairman is appropriate and benefits shareholders because an interested Chairman has a personal and professional stake in the quality and continuity of services provided to the fund. Independent Trustees exercise their informed business judgment to appoint an individual of their choosing to serve as Chairman, regardless of whether the Trustee happens to be independent or a member of management. The Independent Trustees have determined that they can act independently and effectively without having an Independent Trustee serve as Chairman and that a key structural component for assuring that they are in a position to do so is for the Independent Trustees to constitute a substantial majority for the Board. The Independent Trustees also regularly meet in executive session. Ned C. Lautenbach serves as Chairman of the Independent Trustees and as such (i) acts as a liaison between the Independent Trustees and management with respect to matters important to the Independent Trustees and (ii) with management prepares agendas for Board meetings.
Fidelity® funds are overseen by different Boards of Trustees. The fund's Board oversees Fidelity's high income and certain equity funds, and other Boards oversee Fidelity's investment-grade bond, money market, asset allocation, and sector funds. The asset allocation funds may invest in Fidelity® funds overseen by the fund's Board. The use of separate Boards, each with its own committee structure, allows the Trustees of each group of Fidelity® funds to focus on the unique issues of the funds they oversee, including common research, investment, and operational issues. On occasion, the separate Boards establish joint committees to address issues of overlapping consequences for the Fidelity® funds overseen by each Board.
The Trustees operate using a system of committees to facilitate the timely and efficient consideration of all matters of importance to the Trustees, the fund, and fund shareholders and to facilitate compliance with legal and regulatory requirements and oversight of the fund's activities and associated risks. The Board, acting through its committees, has charged FMR and its affiliates with (i) identifying events or circumstances the occurrence of which could have demonstrably adverse effects on the fund's business and/or reputation; (ii) implementing processes and controls to lessen the possibility that such events or circumstances occur or to mitigate the effects of such events or circumstances if they do occur; and (iii) creating and maintaining a system designed to evaluate continuously business and market conditions in order to facilitate the identification and implementation processes described in (i) and (ii) above. Because the day-to-day operations and activities of the fund are carried out by or through FMR, its affiliates, and other service providers, the fund's exposure to risks is mitigated but not eliminated by the processes overseen by the Trustees. While each of the Board's committees has responsibility for overseeing different aspects of the fund's activities, oversight is exercised primarily through the Operations, Audit, and Compliance Committees. In addition, the Independent Trustees have worked with FMR to enhance the Board's oversight of investment and financial risks, legal and regulatory risks, technology risks, and operational risks, including the development of additional risk reporting to the Board. For example, a working group comprised of Independent Trustees and FMR has worked and continues to work to review the Fidelity® funds' valuation-related activities, reporting and risk management. Appropriate personnel, including but not limited to the fund's Chief Compliance Officer (CCO), FMR's internal auditor, the independent accountants, the fund's Treasurer and portfolio management personnel, make periodic reports to the Board's committees, as appropriate, including an annual review of Fidelity's risk management program for the Fidelity® funds. The responsibilities of each standing committee, including their oversight responsibilities, are described further under "Standing Committees of the Trustees."
Interested Trustees*:
Correspondence intended for a Trustee who is an interested person may be sent to Fidelity Investments, 245 Summer Street, Boston, Massachusetts 02210.
Name, Year of Birth; Principal Occupations and Other Relevant Experience+
James C. Curvey (1935)
Year of Election or Appointment: 2007
Trustee
Chairman of the Board of Trustees
Mr. Curvey also serves as Trustee of other Fidelity® funds. Mr. Curvey is a Director of Fidelity Research & Analysis Co. (investment adviser firm, 2009-present), and Vice Chairman (2007-present) and Director of FMR LLC (diversified financial services company). In addition, Mr. Curvey serves as an Overseer for the Boston Symphony Orchestra and a member of the board of Artis-Naples, Naples, Florida, and as a Trustee for Brewster Academy, Wolfeboro, New Hampshire. Previously, Mr. Curvey served as a Director of Fidelity Investments Money Management, Inc. (investment adviser firm, 2009-2014) and a Director of FMR and FMR Co., Inc. (investment adviser firms, 2007-2014).
Charles S. Morrison (1960)
Year of Election or Appointment: 2014
Trustee
Mr. Morrison also serves as Trustee of other funds. He serves as a Director of Fidelity Investments Money Management, Inc. (FIMM) (investment adviser firm, 2014-present), Director of Fidelity SelectCo, LLC (investment adviser firm, 2014-present), President, Asset Management (2014-present), and is an employee of Fidelity Investments. Previously, Mr. Morrison served as Vice President of Fidelity's Fixed Income and Asset Allocation Funds (2012-2014), President, Fixed Income (2011-2014), Vice President of Fidelity's Money Market Funds (2005-2009), President, Money Market Group Leader of FMR (investment adviser firm, 2009), and Senior Vice President, Money Market Group of FMR (2004-2009). Mr. Morrison also served as Vice President of Fidelity's Bond Funds (2002-2005), certain Balanced Funds (2002-2005), and certain Asset Allocation Funds (2002-2007), and as Senior Vice President (2002-2005) of Fidelity's Bond Division.
* Determined to be an “Interested Trustee” by virtue of, among other things, his or her affiliation with the trust or various entities under common control with FMR.
+ The information includes the Trustee's principal occupation during the last five years and other information relating to the experience, attributes, and skills relevant to the Trustee's qualifications to serve as a Trustee, which led to the conclusion that the Trustee should serve as a Trustee for the fund.
Independent Trustees:
Correspondence intended for an Independent Trustee may be sent to Fidelity Investments, P.O. Box 55235, Boston, Massachusetts 02205-5235.
Name, Year of Birth; Principal Occupations and Other Relevant Experience+
Dennis J. Dirks (1948)
Year of Election or Appointment: 2005
Trustee
Mr. Dirks also serves as Trustee of other Fidelity® funds. Prior to his retirement in May 2003, Mr. Dirks was Chief Operating Officer and a member of the Board of The Depository Trust & Clearing Corporation (DTCC). He also served as President, Chief Operating Officer, and Board member of The Depository Trust Company (DTC) and President and Board member of the National Securities Clearing Corporation (NSCC). In addition, Mr. Dirks served as Chief Executive Officer and Board member of the Government Securities Clearing Corporation, Chief Executive Officer and Board member of the Mortgage-Backed Securities Clearing Corporation, as a Trustee and a member of the Finance Committee of Manhattan College (2005-2008), as a Trustee and a member of the Finance Committee of AHRC of Nassau County (2006-2008), and as a member of the Independent Directors Council (IDC) Governing Council (2010-2015). Mr. Dirks is a member of the Board of Directors for The Brookville Center for Children's Services, Inc. (2009-present).
Alan J. Lacy (1953)
Year of Election or Appointment: 2008
Trustee
Mr. Lacy also serves as Trustee of other Fidelity® funds. Mr. Lacy serves as Chairman (2014-present) and a member (2010-present) of the Board of Directors of Dave & Buster's Entertainment, Inc. (restaurant and entertainment complexes) and a Director of Bristol-Myers Squibb Company (global pharmaceuticals, 2008-present). He is a Trustee of the California Chapter of The Nature Conservancy (2015-present) and a Director of the Center for Advanced Study in the Behavioral Sciences at Stanford University (2015-present). In addition, Mr. Lacy served as Senior Adviser (2007-2014) of Oak Hill Capital Partners, L.P. (private equity) and also served as Chief Executive Officer (2005) and Vice Chairman (2005-2006) of Sears Holdings Corporation (retail) and Chief Executive Officer and Chairman of the Board of Sears, Roebuck and Co. (retail, 2000-2005). Previously, Mr. Lacy served as Chairman (2008-2011) and a member (2006-2015) of the Board of Trustees of the National Parks Conservation Association and as a member of the Board of Directors for The Western Union Company (global money transfer, 2006-2011), The Hillman Companies, Inc. (hardware wholesalers, 2010-2014), and Earth Fare, Inc. (retail grocery, 2010-2014).
Ned C. Lautenbach (1944)
Year of Election or Appointment: 2000
Trustee
Chairman of the Independent Trustees
Mr. Lautenbach also serves as Trustee of other Fidelity® funds. Mr. Lautenbach currently serves as the Lead Director of the Eaton Corporation Board of Directors (diversified industrial, 1997-present). Mr. Lautenbach is Chairman of the Board of Directors of Artis-Naples in Naples, Florida (2012-present), a member of the Council on Foreign Relations (1994-present), and a member of the Board of Governors, State University System of Florida (2013-present). Previously, Mr. Lautenbach was a Partner/Advisory Partner at Clayton, Dubilier & Rice, LLC (private equity investment, 1998-2010), as well as a Director of Sony Corporation (2006-2007).
Joseph Mauriello (1944)
Year of Election or Appointment: 2008
Trustee
Mr. Mauriello also serves as Trustee of other Fidelity® funds. Prior to his retirement in January 2006, Mr. Mauriello served in numerous senior management positions including Deputy Chairman and Chief Operating Officer (2004-2005), and Vice Chairman of Financial Services (2002-2004) of KPMG LLP US (professional services, 1965-2005). Mr. Mauriello currently serves as a member of the Board of Directors of XL Group plc. (global insurance and re-insurance, 2006-present) and the Independent Directors Council (IDC) Governing Council (2015-present). Previously, Mr. Mauriello served as a Director of the Hamilton Funds of the Bank of New York (2006-2007) and of Arcadia Resources Inc. (health care services and products, 2007-2012).
Robert W. Selander (1950)
Year of Election or Appointment: 2011
Trustee
Mr. Selander also serves as Trustee of other Fidelity® funds. Mr. Selander serves as a Director of The Western Union Company (global money transfer, 2014-present) and a non-executive Chairman of Health Equity, Inc. (health savings custodian, 2015-present). Previously, Mr. Selander served as a Member of the Advisory Board of certain Fidelity® funds (2011), and Executive Vice Chairman (2010), Chief Executive Officer (2009-2010), and President and Chief Executive Officer (1997-2009) of Mastercard, Inc.
Cornelia M. Small (1944)
Year of Election or Appointment: 2005
Trustee
Ms. Small also serves as Trustee of other Fidelity® funds. Ms. Small is a member of the Board of Directors (2009-present) and Chair of the Investment Committee (2010-present) of the Teagle Foundation. Ms. Small also serves on the Investment Committee of the Berkshire Taconic Community Foundation (2008-present). Previously, Ms. Small served as Chairperson (2002-2008) and a member of the Investment Committee and Chairperson (2008-2012) and a member of the Board of Trustees of Smith College. In addition, Ms. Small served as Chief Investment Officer, Director of Global Equity Investments, and a member of the Board of Directors of Scudder, Stevens & Clark and Scudder Kemper Investments.
William S. Stavropoulos (1939)
Year of Election or Appointment: 2002
Trustee
Vice Chairman of the Independent Trustees
Mr. Stavropoulos also serves as Trustee of other Fidelity® funds. Mr. Stavropoulos serves as President and Founder of the Michigan Baseball Foundation, the Great Lakes Loons (2007-present). Mr. Stavropoulos is Chairman Emeritus of the Board of Directors of The Dow Chemical Company, where he previously served in numerous senior management positions, including President, CEO (1995-2000; 2002-2004), Chairman of the Executive Committee (2000-2006), and as a member of the Board of Directors (1990-2006). Currently, Mr. Stavropoulos is Chairman of the Board of Directors of Univar Inc. (global distributor of commodity and specialty chemicals), a Director of Teradata Corporation (data warehousing and technology solutions), and Maersk Inc. (industrial conglomerate), and a member of the Advisory Board for Metalmark Capital LLC (private equity investment, 2005-present). Mr. Stavropoulos is an operating advisor to Clayton, Dubilier & Rice, LLC (private equity investment). In addition, Mr. Stavropoulos is a member of the University of Notre Dame Advisory Council for the College of Science, a Trustee of the Rollin L. Gerstacker Foundation, and a Director of the Naples Philharmonic Center for the Arts. Previously, Mr. Stavropoulos served as a Director of Chemical Financial Corporation (bank holding company, 1993-2012) and Tyco International, Ltd. (multinational manufacturing and services, 2007-2012).
David M. Thomas (1949)
Year of Election or Appointment: 2008
Trustee
Mr. Thomas also serves as Trustee of other Fidelity® funds. Mr. Thomas serves as Non-Executive Chairman of the Board of Directors of Fortune Brands Home and Security (home and security products, 2011-present), as a member of the Board of Directors (2004-present) and Presiding Director (2013-present) of Interpublic Group of Companies, Inc. (marketing communication), and as a member of the Board of Trustees of the University of Florida (2013-present). Previously, Mr. Thomas served as Executive Chairman (2005-2006) and Chairman and Chief Executive Officer (2000-2005) of IMS Health, Inc. (pharmaceutical and healthcare information solutions), and a Director of Fortune Brands, Inc. (consumer products, 2000-2011).
+ The information includes the Trustee's principal occupation during the last five years and other information relating to the experience, attributes, and skills relevant to the Trustee's qualifications to serve as a Trustee, which led to the conclusion that the Trustee should serve as a Trustee for the fund.
Advisory Board Members and Officers:
Correspondence intended for an officer or Peter S. Lynch may be sent to Fidelity Investments, 245 Summer Street, Boston, Massachusetts 02210. Officers appear below in alphabetical order.
Name, Year of Birth; Principal Occupation
Peter S. Lynch (1944)
Year of Election or Appointment: 2003
Member of the Advisory Board
Mr. Lynch also serves as Member of the Advisory Board of other Fidelity® funds. Mr. Lynch is Vice Chairman and a Director of FMR (investment adviser firm) and FMR Co., Inc. (investment adviser firm). In addition, Mr. Lynch serves as a Trustee of Boston College and as the Chairman of the Inner-City Scholarship Fund. Previously, Mr. Lynch served on the Special Olympics International Board of Directors (1997-2006).
Marc R. Bryant (1966)
Year of Election or Appointment: 2015
Secretary and Chief Legal Officer (CLO)
Mr. Bryant also serves as Secretary and CLO of other funds. Mr. Bryant serves as CLO, Secretary, and Senior Vice President of Fidelity Management & Research Company (investment adviser firm, 2015-present) and FMR Co., Inc. (investment adviser firm, 2015-present); Secretary of Fidelity SelectCo, LLC (investment adviser firm, 2015-present) and Fidelity Investments Money Management, Inc. (investment adviser firm, 2015-present); and CLO of Fidelity Management & Research (Hong Kong) Limited and FMR Investment Management (U.K.) Limited (investment adviser firms, 2015-present) and Fidelity Management & Research (Japan) Limited (investment adviser firm, 2016-present). He is Senior Vice President and Deputy General Counsel of FMR LLC (diversified financial services company). Previously, Mr. Bryant served as Secretary and CLO of Fidelity Rutland Square Trust II (2010-2014) and Assistant Secretary of Fidelity's Fixed Income and Asset Allocation Funds (2013-2015). Prior to joining Fidelity Investments, Mr. Bryant served as a Senior Vice President and the Head of Global Retail Legal for AllianceBernstein L.P. (2006-2010), and as the General Counsel for ProFund Advisors LLC (2001-2006).
William C. Coffey (1969)
Year of Election or Appointment: 2009
Assistant Secretary
Mr. Coffey also serves as Assistant Secretary of other funds. He is Senior Vice President and Deputy General Counsel of FMR LLC (diversified financial services company, 2010-present), and is an employee of Fidelity Investments. Previously, Mr. Coffey served as Vice President and Associate General Counsel of FMR LLC (2005-2009).
Jeffrey S. Christian (1961)
Year of Election or Appointment: 2016
Assistant Treasurer
Mr. Christian also serves as Assistant Treasurer of other funds. Mr. Christian is an employee of Fidelity Investments (2003-present).
Jonathan Davis (1968)
Year of Election or Appointment: 2010
Assistant Treasurer
Mr. Davis also serves as Assistant Treasurer of other funds, and is an employee of Fidelity Investments. Previously, Mr. Davis served as Vice President and Associate General Counsel of FMR LLC (diversified financial services company, 2003-2010).
Adrien E. Deberghes (1967)
Year of Election or Appointment: 2016
Assistant Treasurer
Mr. Deberghes also serves as an officer of other funds. He is an employee of Fidelity Investments (2008-present). Prior to joining Fidelity Investments, Mr. Deberghes was Senior Vice President of Mutual Fund Administration at State Street Corporation (2007-2008), Senior Director of Mutual Fund Administration at Investors Bank & Trust (2005-2007), and Director of Finance for Dunkin' Brands (2000-2005). Previously, Mr. Deberghes served in other fund officer roles.
Stephanie J. Dorsey (1969)
Year of Election or Appointment: 2010
Assistant Treasurer
Ms. Dorsey also serves as an officer of other funds. She is an employee of Fidelity Investments (2008-present) and has served in other fund officer roles. Prior to joining Fidelity Investments, Ms. Dorsey served as Treasurer (2004-2008) of the JPMorgan Mutual Funds and Vice President (2004-2008) of JPMorgan Chase Bank.
Howard J. Galligan III (1966)
Year of Election or Appointment: 2014
Chief Financial Officer
Mr. Galligan also serves as Chief Financial Officer of other funds. Mr. Galligan serves as President of Fidelity Pricing and Cash Management Services (FPCMS) (2014-present) and as a Director of Strategic Advisers, Inc. (investment adviser firm, 2008-present). Previously, Mr. Galligan served as Chief Administrative Officer of Asset Management (2011-2014) and Chief Operating Officer and Senior Vice President of Investment Support for Strategic Advisers, Inc. (2003-2011).
Scott C. Goebel (1968)
Year of Election or Appointment: 2015
Vice President
Mr. Goebel serves as Vice President of other funds and is an employee of Fidelity Investments (2001-present). Previously, Mr. Goebel served as Secretary of Fidelity SelectCo, LLC (investment adviser firm, 2013-2015), Fidelity Investments Money Management, Inc. (FIMM) (investment adviser firm, 2010-2015), and Fidelity Research and Analysis Company (FRAC) (investment adviser firm, 2010-2015); General Counsel, Secretary, and Senior Vice President of Fidelity Management & Research Company (investment adviser firm, 2008-2015) and FMR Co., Inc. (investment adviser firm, 2008-2015); Assistant Secretary of Fidelity Management & Research (Japan) Limited (investment adviser firm, 2008-2015) and Fidelity Management & Research (U.K.) Inc. (investment adviser firm, 2008-2015); Chief Legal Officer (CLO) of Fidelity Management & Research (Hong Kong) Limited (investment adviser firm, 2008-2015); Secretary and CLO of certain Fidelity® funds (2008-2015); Assistant Secretary of FIMM (2008-2010), FRAC (2008-2010), and certain funds (2007-2008); and as Vice President and Secretary of Fidelity Distributors Corporation (FDC) (2005-2007).
Thomas C. Hense (1964)
Year of Election or Appointment: 2008, 2010, or 2015
Vice President
Mr. Hense serves as Vice President of Fidelity Advisor® Multi-Asset Income Fund (2015) and other funds (High Income (2008), Small Cap (2008), and Value (2010) funds), and is an employee of Fidelity Investments (1993-present). Previously, Mr. Hense served as a portfolio manager for Fidelity's Institutional Money Management Group (Pyramis) (2003-2008).
Brian B. Hogan (1964)
Year of Election or Appointment: 2009
Vice President
Mr. Hogan also serves as Trustee or Vice President of other funds. Mr. Hogan serves as a Director of FMR Investment Management (U.K.) Limited (investment adviser firm, 2015-present) and Fidelity SelectCo, LLC (investment adviser firm, 2014-present) and President of the Equity Division of FMR (investment adviser firm, 2009-present). Previously, Mr. Hogan served as Senior Vice President, Equity Research of FMR (2006-2009) and as a portfolio manager. Mr. Brian B. Hogan is not related to Mr. Colm A. Hogan.
Colm A. Hogan (1973)
Year of Election or Appointment: 2016
Deputy Treasurer
Mr. Hogan also serves as an officer of other funds. Mr. Hogan is an employee of Fidelity Investments (2005-present). Mr. Colm A. Hogan is not related to Mr. Brian B. Hogan.
Chris Maher (1972)
Year of Election or Appointment: 2013
Assistant Treasurer
Mr. Maher serves as Assistant Treasurer of other funds. Mr. Maher is Vice President of Valuation Oversight and is an employee of Fidelity Investments. Previously, Mr. Maher served as Vice President of Asset Management Compliance (2013), Vice President of the Program Management Group of FMR (investment adviser firm, 2010-2013), and Vice President of Valuation Oversight (2008-2010).
John F. Papandrea (1972)
Year of Election or Appointment: 2016
Anti-Money Laundering (AML) Officer
Mr. Papandrea also serves as AML Officer of other funds. Mr. Papandrea is Vice President of FMR LLC (diversified financial services company, 2008-present) and is an employee of Fidelity Investments (2005-present).
Kenneth B. Robins (1969)
Year of Election or Appointment: 2016
Chief Compliance Officer
Mr. Robins also serves as an officer of other funds. Mr. Robins serves as Executive Vice President of Fidelity Investments Money Management, Inc. (FIMM) (investment adviser firm, 2013-present) and is an employee of Fidelity Investments (2004-present). Previously, Mr. Robins served in other fund officer roles.
Stacie M. Smith (1974)
Year of Election or Appointment: 2016
President and Treasurer
Ms. Smith also serves as an officer of other funds. She is an employee of Fidelity Investments (2009-present) and has served in other fund officer roles. Prior to joining Fidelity Investments, Ms. Smith served as Senior Audit Manager of Ernst & Young LLP (1996-2009). Previously, Ms. Smith served as Deputy Treasurer of certain Fidelity® funds (2013-2016).
Renee Stagnone (1975)
Year of Election or Appointment: 2016
Assistant Treasurer
Ms. Stagnone also serves as an officer of other funds. Ms. Stagnone is an employee of Fidelity Investments (1997-present). Previously, Ms. Stagnone served as Deputy Treasurer of certain Fidelity® funds (2013-2016).
Shareholder Expense Example
As a shareholder of the Fund, you incur two types of costs: (1) transaction costs, including redemption fees and (2) ongoing costs, including management fees and other Fund expenses. This Example is intended to help you understand your ongoing costs (in dollars) of investing in the Fund and to compare these costs with the ongoing costs of investing in other mutual funds.
The Example is based on an investment of $1,000 invested at the beginning of the period and held for the entire period (November 1, 2015 to April 30, 2016).
Actual Expenses
The first line of the accompanying table provides information about actual account values and actual expenses. You may use the information in this line, together with the amount you invested, to estimate the expenses that you paid over the period. Simply divide your account value by $1,000.00 (for example, an $8,600 account value divided by $1,000.00 = 8.6), then multiply the result by the number in the first line under the heading entitled "Expenses Paid During Period" to estimate the expenses you paid on your account during this period. A small balance maintenance fee of $12.00 that is charged once a year may apply for certain accounts with a value of less than $2,000. This fee is not included in the table below. If it was, the estimate of expenses you paid during the period would be higher, and your ending account value lower, by this amount. In addition, the Fund, as a shareholder in the underlying Fidelity Central Funds, will indirectly bear its pro-rata share of the fees and expenses incurred by the underlying Fidelity Central Funds. These fees and expenses are not included in the Fund's annualized expense ratio used to calculate the expense estimate in the table below.
Hypothetical Example for Comparison Purposes
The second line of the accompanying table provides information about hypothetical account values and hypothetical expenses based on the Fund's actual expense ratio and an assumed rate of return of 5% per year before expenses, which is not the Fund's actual return. The hypothetical account values and expenses may not be used to estimate the actual ending account balance or expenses you paid for the period. You may use this information to compare the ongoing costs of investing in the Fund and other funds. To do so, compare this 5% hypothetical example with the 5% hypothetical examples that appear in the shareholder reports of the other funds. A small balance maintenance fee of $12.00 that is charged once a year may apply for certain accounts with a value of less than $2,000. This fee is not included in the table below. If it was, the estimate of expenses you paid during the period would be higher, and your ending account value lower, by this amount. In addition, the Fund, as a shareholder in the underlying Fidelity Central Funds, will indirectly bear its pro-rata share of the fees and expenses incurred by the underlying Fidelity Central Funds. These fees and expenses are not included in the Fund's annualized expense ratio used to calculate the expense estimate in the table below.
Please note that the expenses shown in the table are meant to highlight your ongoing costs only and do not reflect any transaction costs. Therefore, the second line of the table is useful in comparing ongoing costs only, and will not help you determine the relative total costs of owning different funds. In addition, if these transactional costs were included, your costs would have been higher.
| Annualized Expense Ratio-A | Beginning Account Value November 1, 2015 | Ending Account Value April 30, 2016 | Expenses Paid During Period-B November 1, 2015 to April 30, 2016 |
|
| Actual | .94% | $1,000.00 | $1,005.30 | $4.69 |
| Hypothetical-C | $1,000.00 | $1,020.19 | $4.72 |
A Annualized expense ratio reflects expenses net of applicable fee waivers.
B Expenses are equal to the Fund's annualized expense ratio, multiplied by the average account value over the period, multiplied by 182/366 (to reflect the one-half year period).
C 5% return per year before expenses
Distributions (Unaudited)
The fund hereby designates as a capital gain dividend with respect to the taxable year ended April 30, 2016, $84,917,251, or, if subsequently determined to be different, the net capital gain of such year.
The fund designates 100% of the dividends distributed during the fiscal year as qualifying for the dividends–received deduction for corporate shareholders.
The fund designates 100% of the dividends distributed during the fiscal year as amounts which may be taken into account as a dividend for the purposes of the maximum rate under section 1(h)(11) of the Internal Revenue Code.
The fund will notify shareholders in January 2017 of amounts for use in preparing 2016 income tax returns.
![]()
Corporate Headquarters
245 Summer St.
Boston, MA 02210
www.fidelity.com
SMR-ANN-0616
1.757239.115
|
Fidelity® Large Cap Stock Fund Annual Report April 30, 2016 |
|
|
Contents
To view a fund's proxy voting guidelines and proxy voting record for the 12-month period ended June 30, visit http://www.fidelity.com/proxyvotingresults or visit the Securities and Exchange Commission's (SEC) web site at http://www.sec.gov.
You may also call 1-800-544-8544 to request a free copy of the proxy voting guidelines.
Standard & Poor's, S&P and S&P 500 are registered service marks of The McGraw-Hill Companies, Inc. and have been licensed for use by Fidelity Distributors Corporation.
Other third-party marks appearing herein are the property of their respective owners.
All other marks appearing herein are registered or unregistered trademarks or service marks of FMR LLC or an affiliated company. © 2016 FMR LLC. All rights reserved.
This report and the financial statements contained herein are submitted for the general information of the shareholders of the Fund. This report is not authorized for distribution to prospective investors in the Fund unless preceded or accompanied by an effective prospectus.
A fund files its complete schedule of portfolio holdings with the SEC for the first and third quarters of each fiscal year on Form N-Q. Forms N-Q are available on the SEC’s web site at http://www.sec.gov. A fund's Forms N-Q may be reviewed and copied at the SEC’s Public Reference Room in Washington, DC. Information regarding the operation of the SEC's Public Reference Room may be obtained by calling 1-800-SEC-0330.
For a complete list of a fund's portfolio holdings, view the most recent holdings listing, semiannual report, or annual report on Fidelity's web site at http://www.fidelity.com, http://www.advisor.fidelity.com, or http://www.401k.com, as applicable.
NOT FDIC INSURED •MAY LOSE VALUE •NO BANK GUARANTEE
Neither the Fund nor Fidelity Distributors Corporation is a bank.
Performance: The Bottom Line
Average annual total return reflects the change in the value of an investment, assuming reinvestment of distributions from dividend income and capital gains (the profits earned upon the sale of securities that have grown in value, if any) and assuming a constant rate of performance each year. The hypothetical investment and the average annual total returns do not reflect the deduction of taxes that a shareholder would pay on fund distributions or the redemption of fund shares. During periods of reimbursement by Fidelity, a fund’s total return will be greater than it would be had the reimbursement not occurred. How a fund did yesterday is no guarantee of how it will do tomorrow.
Average Annual Total Returns
| For the periods ended April 30, 2016 | Past 1 year | Past 5 years | Past 10 years |
| Fidelity® Large Cap Stock Fund | (4.82)% | 10.62% | 7.30% |
$10,000 Over 10 Years
Let's say hypothetically that $10,000 was invested in Fidelity® Large Cap Stock Fund on April 30, 2006.
The chart shows how the value of your investment would have changed, and also shows how the S&P 500® Index performed over the same period.
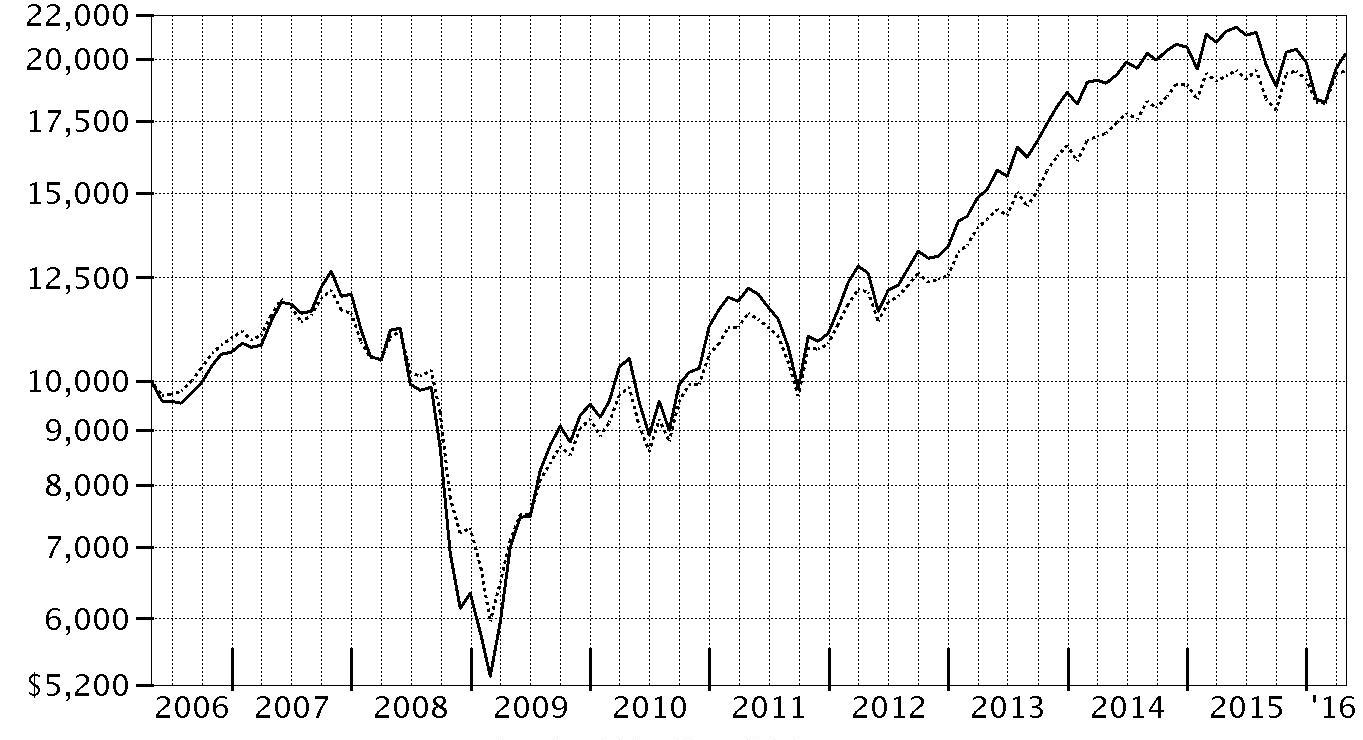
| Period Ending Values | ||
|
| $20,231 | Fidelity® Large Cap Stock Fund |
|
| $19,501 | S&P 500® Index |
Management's Discussion of Fund Performance
Market Recap: The S&P 500® index gained 1.21% for the 12 months ending April 30, 2016. Largely range-bound until mid-August, U.S. stocks suffered a steep, late-summer decline on concern about an economic slowdown in China. The market recovered in October, lifted by the U.S. Federal Reserve’s decision to delay raising near-term interest rates until mid-December, as well as a rate cut in China and economic stimulus in Europe. But continued oil-price weakness and U.S.-dollar strength pushed the S&P 500® to its worst January since 2009, followed by a volatile but ultimately flattish February, then a sharp rebound in March driven by U.S. jobs gains and perceived softening in the Fed’s rate-tightening posture. April brought minimal change. For the full period, growth-oriented and larger-cap stocks fared better overall than value and smaller-cap complements. Performance was split, as five of 10 S&P 500® sectors gained ground, with a wide gap separating leaders from laggards. Investor demand for more-stable and higher-yielding investments boosted traditionally defensive, dividend-rich groups such as utilities (+14%), telecommunication services (+10%) and consumer staples (+11%) – the latter also buoyed by rising wages and low inflation. Meanwhile, energy (-14%) foundered amid commodity weakness that also hurt materials (-4%). Comments from Portfolio Manager Matthew Fruhan: For the 12 months ending April 30, 2016, the fund returned –4.82%, substantially trailing the S&P 500®. Very little worked well the past year, as a difficult stretch for the valuation component of my investment philosophy continued. Poor stock picking in financials hampered the relative result most, while security selection in consumer discretionary, information technology and materials detracted to a lesser degree. Many financial institutions lagged this period, including fund holdings Citigroup, Morgan Stanley and Bank of America. In energy, the fund’s biggest individual detractor was Ensco, which struggled along with low commodity prices. Elsewhere, a significant detractor was Qualcomm, a maker of communications equipment. The company announced disappointing earnings due to poor results in its chipset business. Other relative detractors included a significant underweight in social networking giant Facebook and not owning Internet retailer Amazon, two strong-performing benchmark components this period. In contrast, the fund’s biggest individual contributor was General Electric. I believe this company's move to divest much of its financial services should enable the firm to return more capital to shareholders. Also adding value was the fund’s position in out-of-index medical device company Alere, which agreed to be acquired during the period and was no longer in the fund as of April 30, 2016.The views expressed above reflect those of the portfolio manager(s) only through the end of the period as stated on the cover of this report and do not necessarily represent the views of Fidelity or any other person in the Fidelity organization. Any such views are subject to change at any time based upon market or other conditions and Fidelity disclaims any responsibility to update such views. These views may not be relied on as investment advice and, because investment decisions for a Fidelity fund are based on numerous factors, may not be relied on as an indication of trading intent on behalf of any Fidelity fund.
Investment Summary (Unaudited)
Top Ten Stocks as of April 30, 2016
| % of fund's net assets | % of fund's net assets 6 months ago | |
| JPMorgan Chase & Co. | 3.6 | 4.3 |
| General Electric Co. | 3.1 | 3.6 |
| Bank of America Corp. | 2.9 | 2.9 |
| Microsoft Corp. | 2.6 | 2.7 |
| Apple, Inc. | 2.5 | 3.4 |
| Citigroup, Inc. | 2.4 | 2.6 |
| Chevron Corp. | 2.1 | 1.8 |
| Procter & Gamble Co. | 1.9 | 1.8 |
| Qualcomm, Inc. | 1.8 | 1.8 |
| Alphabet, Inc. Class A | 1.7 | 1.7 |
| 24.6 |
Top Five Market Sectors as of April 30, 2016
| % of fund's net assets | % of fund's net assets 6 months ago | |
| Information Technology | 21.0 | 22.7 |
| Financials | 20.6 | 21.6 |
| Energy | 13.3 | 9.2 |
| Health Care | 12.9 | 12.7 |
| Industrials | 12.8 | 12.6 |
Asset Allocation (% of fund's net assets)
| As of April 30, 2016 * | ||
| Stocks | 99.9% | |
| Short-Term Investments and Net Other Assets (Liabilities) | 0.1% | |

* Foreign Investments 9.6%
| As of October 31, 2015 * | ||
| Stocks | 99.9% | |
| Short-Term Investments and Net Other Assets (Liabilities) | 0.1% | |

* Foreign Investments 10.0%
Investments April 30, 2016
Showing Percentage of Net Assets
| Common Stocks - 99.9% | |||
| Shares | Value (000s) | ||
| CONSUMER DISCRETIONARY - 8.8% | |||
| Auto Components - 0.2% | |||
| BorgWarner, Inc. | 70,900 | $2,547 | |
| Johnson Controls, Inc. | 52,200 | 2,161 | |
| 4,708 | |||
| Automobiles - 0.1% | |||
| General Motors Co. | 33,300 | 1,059 | |
| Harley-Davidson, Inc. | 26,200 | 1,253 | |
| Tesla Motors, Inc. (a) | 1,200 | 289 | |
| 2,601 | |||
| Hotels, Restaurants & Leisure - 0.5% | |||
| Las Vegas Sands Corp. | 85,000 | 3,838 | |
| Yum! Brands, Inc. | 124,188 | 9,880 | |
| 13,718 | |||
| Household Durables - 0.5% | |||
| KB Home | 647,600 | 8,788 | |
| Taylor Morrison Home Corp. (a) | 316,382 | 4,556 | |
| 13,344 | |||
| Leisure Products - 0.1% | |||
| NJOY, Inc. (a)(b) | 871,003 | 111 | |
| Polaris Industries, Inc. | 27,900 | 2,731 | |
| 2,842 | |||
| Media - 4.4% | |||
| Comcast Corp. Class A | 692,513 | 42,077 | |
| Scripps Networks Interactive, Inc. Class A | 225,200 | 14,041 | |
| Sinclair Broadcast Group, Inc. Class A | 182,600 | 5,856 | |
| Time Warner, Inc. | 473,641 | 35,589 | |
| Viacom, Inc. Class B (non-vtg.) | 406,100 | 16,609 | |
| 114,172 | |||
| Multiline Retail - 1.6% | |||
| Target Corp. | 517,019 | 41,103 | |
| Specialty Retail - 1.3% | |||
| Dick's Sporting Goods, Inc. | 58,100 | 2,692 | |
| Lowe's Companies, Inc. | 387,870 | 29,486 | |
| 32,178 | |||
| Textiles, Apparel & Luxury Goods - 0.1% | |||
| Michael Kors Holdings Ltd. (a) | 38,300 | 1,979 | |
| TOTAL CONSUMER DISCRETIONARY | 226,645 | ||
| CONSUMER STAPLES - 6.1% | |||
| Beverages - 1.8% | |||
| Diageo PLC | 409,741 | 11,078 | |
| The Coca-Cola Co. | 814,575 | 36,493 | |
| 47,571 | |||
| Food & Staples Retailing - 1.0% | |||
| CVS Health Corp. | 128,289 | 12,893 | |
| United Natural Foods, Inc. (a) | 55,800 | 1,990 | |
| Walgreens Boots Alliance, Inc. | 118,795 | 9,418 | |
| Whole Foods Market, Inc. | 58,900 | 1,713 | |
| 26,014 | |||
| Food Products - 0.3% | |||
| Mead Johnson Nutrition Co. Class A | 79,500 | 6,928 | |
| Household Products - 1.9% | |||
| Procter & Gamble Co. | 609,168 | 48,807 | |
| Tobacco - 1.1% | |||
| British American Tobacco PLC sponsored ADR | 21,509 | 2,627 | |
| Philip Morris International, Inc. | 249,834 | 24,514 | |
| 27,141 | |||
| TOTAL CONSUMER STAPLES | 156,461 | ||
| ENERGY - 13.3% | |||
| Energy Equipment & Services - 1.8% | |||
| Baker Hughes, Inc. | 211,000 | 10,204 | |
| Ensco PLC Class A | 132,650 | 1,586 | |
| Helmerich & Payne, Inc. (c) | 55,800 | 3,689 | |
| National Oilwell Varco, Inc. | 321,118 | 11,573 | |
| Oceaneering International, Inc. | 293,300 | 10,749 | |
| Schlumberger Ltd. | 103,145 | 8,287 | |
| 46,088 | |||
| Oil, Gas & Consumable Fuels - 11.5% | |||
| Amyris, Inc. (a)(c) | 1,579,318 | 1,611 | |
| Anadarko Petroleum Corp. | 108,100 | 5,703 | |
| Apache Corp. | 516,140 | 28,078 | |
| Cabot Oil & Gas Corp. | 427,000 | 9,992 | |
| Cenovus Energy, Inc. | 767,400 | 12,165 | |
| Chevron Corp. | 531,157 | 54,274 | |
| ConocoPhillips Co. | 573,700 | 27,417 | |
| Devon Energy Corp. | 108,800 | 3,773 | |
| Energy Transfer Equity LP | 640,300 | 7,959 | |
| Golar LNG Ltd. | 108,700 | 1,802 | |
| Imperial Oil Ltd. | 571,600 | 18,956 | |
| Kinder Morgan, Inc. | 902,100 | 16,021 | |
| Legacy Reserves LP | 185,762 | 580 | |
| MPLX LP | 20,518 | 660 | |
| Noble Energy, Inc. | 60,700 | 2,192 | |
| SM Energy Co. (c) | 243,500 | 7,587 | |
| Suncor Energy, Inc. | 1,385,400 | 40,667 | |
| Teekay Offshore Partners LP | 187,597 | 1,120 | |
| The Williams Companies, Inc. | 1,303,741 | 25,280 | |
| Williams Partners LP | 1,000,000 | 30,230 | |
| 296,067 | |||
| TOTAL ENERGY | 342,155 | ||
| FINANCIALS - 20.6% | |||
| Banks - 13.7% | |||
| Bank of America Corp. | 5,059,250 | 73,663 | |
| Citigroup, Inc. | 1,365,558 | 63,198 | |
| Comerica, Inc. | 331,000 | 14,696 | |
| Cullen/Frost Bankers, Inc. | 12,100 | 774 | |
| Fifth Third Bancorp | 122,100 | 2,236 | |
| JPMorgan Chase & Co. | 1,490,971 | 94,226 | |
| Lloyds Banking Group PLC | 266,800 | 262 | |
| PNC Financial Services Group, Inc. | 86,020 | 7,551 | |
| Regions Financial Corp. | 2,071,700 | 19,433 | |
| Standard Chartered PLC (United Kingdom) | 816,085 | 6,583 | |
| SunTrust Banks, Inc. | 705,492 | 29,447 | |
| U.S. Bancorp | 675,485 | 28,836 | |
| Wells Fargo & Co. | 263,750 | 13,182 | |
| 354,087 | |||
| Capital Markets - 5.1% | |||
| Charles Schwab Corp. | 583,286 | 16,571 | |
| Franklin Resources, Inc. | 64,300 | 2,401 | |
| Goldman Sachs Group, Inc. | 17,200 | 2,823 | |
| KKR & Co. LP | 689,898 | 9,383 | |
| Legg Mason, Inc. | 67,800 | 2,177 | |
| Morgan Stanley | 905,307 | 24,498 | |
| Northern Trust Corp. | 345,806 | 24,580 | |
| State Street Corp. | 619,442 | 38,591 | |
| The Blackstone Group LP | 344,700 | 9,459 | |
| 130,483 | |||
| Diversified Financial Services - 0.1% | |||
| KKR Renaissance Co-Invest LP unit (a)(b) | 20,500 | 2,768 | |
| Markit Ltd. (a) | 33,300 | 1,162 | |
| 3,930 | |||
| Insurance - 0.7% | |||
| Marsh & McLennan Companies, Inc. | 6,700 | 423 | |
| MetLife, Inc. | 263,310 | 11,875 | |
| Principal Financial Group, Inc. | 107,300 | 4,580 | |
| 16,878 | |||
| Thrifts & Mortgage Finance - 1.0% | |||
| MGIC Investment Corp. (a) | 827,992 | 5,986 | |
| Radian Group, Inc. | 1,528,890 | 19,555 | |
| 25,541 | |||
| TOTAL FINANCIALS | 530,919 | ||
| HEALTH CARE - 12.9% | |||
| Biotechnology - 3.1% | |||
| AbbVie, Inc. | 113,900 | 6,948 | |
| Alnylam Pharmaceuticals, Inc. (a) | 32,100 | 2,152 | |
| Amgen, Inc. | 121,503 | 19,234 | |
| Biogen, Inc. (a) | 56,900 | 15,647 | |
| BioMarin Pharmaceutical, Inc. (a) | 55,300 | 4,683 | |
| Celgene Corp. (a) | 85,500 | 8,842 | |
| Celldex Therapeutics, Inc. (a) | 12,000 | 48 | |
| Discovery Laboratories, Inc. (a) | 82,403 | 222 | |
| Genocea Biosciences, Inc. (a) | 42,900 | 189 | |
| Gilead Sciences, Inc. | 2,700 | 238 | |
| Insmed, Inc. (a) | 132,244 | 1,607 | |
| Intercept Pharmaceuticals, Inc. (a) | 126,848 | 19,121 | |
| Spark Therapeutics, Inc. (a) | 42,400 | 1,522 | |
| Vertex Pharmaceuticals, Inc. (a) | 12,100 | 1,021 | |
| 81,474 | |||
| Health Care Equipment & Supplies - 3.1% | |||
| Abbott Laboratories | 308,775 | 12,011 | |
| Boston Scientific Corp. (a) | 1,747,427 | 38,304 | |
| Medtronic PLC | 214,400 | 16,970 | |
| Neovasc, Inc. (a) | 83,100 | 267 | |
| NxStage Medical, Inc. (a) | 125,700 | 2,026 | |
| Zimmer Biomet Holdings, Inc. | 80,800 | 9,354 | |
| 78,932 | |||
| Health Care Providers & Services - 1.3% | |||
| Express Scripts Holding Co. (a) | 145,567 | 10,733 | |
| McKesson Corp. | 134,904 | 22,640 | |
| 33,373 | |||
| Health Care Technology - 0.0% | |||
| Castlight Health, Inc. Class B (a) | 84,200 | 303 | |
| Life Sciences Tools & Services - 0.4% | |||
| Agilent Technologies, Inc. | 234,100 | 9,579 | |
| Pharmaceuticals - 5.0% | |||
| Allergan PLC (a) | 22,213 | 4,810 | |
| Bristol-Myers Squibb Co. | 34,000 | 2,454 | |
| GlaxoSmithKline PLC sponsored ADR | 968,511 | 41,559 | |
| Jazz Pharmaceuticals PLC (a) | 87,093 | 13,125 | |
| Johnson & Johnson | 245,710 | 27,539 | |
| Novartis AG sponsored ADR | 10,400 | 790 | |
| Sanofi SA | 29,384 | 2,422 | |
| Teva Pharmaceutical Industries Ltd. sponsored ADR | 574,201 | 31,265 | |
| TherapeuticsMD, Inc. (a) | 730,700 | 6,028 | |
| 129,992 | |||
| TOTAL HEALTH CARE | 333,653 | ||
| INDUSTRIALS - 12.8% | |||
| Aerospace & Defense - 1.7% | |||
| General Dynamics Corp. | 7,700 | 1,082 | |
| KEYW Holding Corp. (a) | 120,418 | 830 | |
| The Boeing Co. | 179,737 | 24,229 | |
| United Technologies Corp. | 156,278 | 16,311 | |
| 42,452 | |||
| Air Freight & Logistics - 2.1% | |||
| C.H. Robinson Worldwide, Inc. | 49,700 | 3,527 | |
| FedEx Corp. | 85,000 | 14,034 | |
| Hub Group, Inc. Class A (a) | 127,200 | 4,900 | |
| United Parcel Service, Inc. Class B | 289,775 | 30,447 | |
| 52,908 | |||
| Building Products - 0.2% | |||
| Caesarstone Sdot-Yam Ltd. (a) | 17,800 | 659 | |
| Lennox International, Inc. | 33,800 | 4,561 | |
| 5,220 | |||
| Commercial Services & Supplies - 0.1% | |||
| Stericycle, Inc. (a) | 37,000 | 3,536 | |
| Electrical Equipment - 1.2% | |||
| AMETEK, Inc. | 189,870 | 9,131 | |
| Eaton Corp. PLC | 75,200 | 4,758 | |
| Emerson Electric Co. | 228,300 | 12,472 | |
| Hubbell, Inc. Class B | 49,700 | 5,256 | |
| 31,617 | |||
| Industrial Conglomerates - 3.1% | |||
| General Electric Co. | 2,557,003 | 78,628 | |
| Machinery - 1.2% | |||
| Cummins, Inc. | 7,500 | 878 | |
| Deere & Co. | 114,200 | 9,605 | |
| Ingersoll-Rand PLC | 82,071 | 5,379 | |
| Joy Global, Inc. (c) | 188,700 | 4,019 | |
| Rexnord Corp. (a) | 324,200 | 7,068 | |
| Wabtec Corp. | 16,400 | 1,360 | |
| Xylem, Inc. | 33,200 | 1,387 | |
| 29,696 | |||
| Professional Services - 0.3% | |||
| Acacia Research Corp. (a) | 24,000 | 116 | |
| IHS, Inc. Class A (a) | 7,300 | 899 | |
| Verisk Analytics, Inc. (a) | 94,930 | 7,365 | |
| 8,380 | |||
| Road & Rail - 2.8% | |||
| Celadon Group, Inc. | 29,100 | 293 | |
| CSX Corp. | 798,199 | 21,767 | |
| Genesee & Wyoming, Inc. Class A (a) | 203,200 | 13,230 | |
| J.B. Hunt Transport Services, Inc. | 134,900 | 11,181 | |
| Kansas City Southern | 106,300 | 10,072 | |
| Norfolk Southern Corp. | 80,942 | 7,294 | |
| Old Dominion Freight Lines, Inc. (a) | 88,400 | 5,839 | |
| Union Pacific Corp. | 41,400 | 3,611 | |
| 73,287 | |||
| Trading Companies & Distributors - 0.1% | |||
| United Rentals, Inc. (a) | 46,500 | 3,112 | |
| TOTAL INDUSTRIALS | 328,836 | ||
| INFORMATION TECHNOLOGY - 21.0% | |||
| Communications Equipment - 1.6% | |||
| Cisco Systems, Inc. | 1,535,561 | 42,213 | |
| Electronic Equipment & Components - 0.1% | |||
| Fitbit, Inc. | 162,300 | 2,962 | |
| Internet Software & Services - 4.3% | |||
| Alphabet, Inc.: | |||
| Class A | 62,987 | 44,587 | |
| Class C | 54,678 | 37,892 | |
| Facebook, Inc. Class A (a) | 147,400 | 17,331 | |
| LinkedIn Corp. Class A (a) | 6,200 | 777 | |
| Twitter, Inc. (a) | 235,400 | 3,442 | |
| Yahoo!, Inc. (a) | 228,650 | 8,369 | |
| 112,398 | |||
| IT Services - 5.1% | |||
| Cognizant Technology Solutions Corp. Class A (a) | 75,516 | 4,408 | |
| First Data Corp. (d) | 620,516 | 7,068 | |
| First Data Corp. Class A (a) | 178,100 | 2,029 | |
| IBM Corp. | 174,569 | 25,477 | |
| MasterCard, Inc. Class A | 314,500 | 30,503 | |
| Paychex, Inc. | 223,339 | 11,640 | |
| PayPal Holdings, Inc. (a) | 144,700 | 5,669 | |
| Unisys Corp. (a)(c) | 632,195 | 4,874 | |
| Visa, Inc. Class A | 503,880 | 38,920 | |
| 130,588 | |||
| Semiconductors & Semiconductor Equipment - 2.0% | |||
| Marvell Technology Group Ltd. | 195,300 | 1,949 | |
| Maxim Integrated Products, Inc. | 55,800 | 1,993 | |
| Qualcomm, Inc. | 944,450 | 47,714 | |
| 51,656 | |||
| Software - 3.9% | |||
| Adobe Systems, Inc. (a) | 88,190 | 8,309 | |
| Autodesk, Inc. (a) | 134,769 | 8,062 | |
| Microsoft Corp. | 1,332,596 | 66,457 | |
| Mobileye NV (a)(c) | 82,800 | 3,159 | |
| Oracle Corp. | 302,839 | 12,071 | |
| Salesforce.com, Inc. (a) | 22,500 | 1,706 | |
| 99,764 | |||
| Technology Hardware, Storage & Peripherals - 4.0% | |||
| Apple, Inc. | 684,629 | 64,177 | |
| EMC Corp. | 1,124,700 | 29,366 | |
| Western Digital Corp. | 222,700 | 9,101 | |
| 102,644 | |||
| TOTAL INFORMATION TECHNOLOGY | 542,225 | ||
| MATERIALS - 3.1% | |||
| Chemicals - 2.4% | |||
| CF Industries Holdings, Inc. | 107,200 | 3,545 | |
| E.I. du Pont de Nemours & Co. | 103,638 | 6,831 | |
| Intrepid Potash, Inc. (a) | 587,905 | 753 | |
| LyondellBasell Industries NV Class A | 57,400 | 4,745 | |
| Monsanto Co. | 292,573 | 27,408 | |
| Potash Corp. of Saskatchewan, Inc. | 595,700 | 10,540 | |
| W.R. Grace & Co. | 87,100 | 6,679 | |
| 60,501 | |||
| Containers & Packaging - 0.5% | |||
| WestRock Co. | 325,069 | 13,604 | |
| Metals & Mining - 0.2% | |||
| Freeport-McMoRan, Inc. (c) | 412,800 | 5,779 | |
| TOTAL MATERIALS | 79,884 | ||
| TELECOMMUNICATION SERVICES - 0.4% | |||
| Diversified Telecommunication Services - 0.4% | |||
| Verizon Communications, Inc. | 223,300 | 11,375 | |
| UTILITIES - 0.9% | |||
| Electric Utilities - 0.7% | |||
| Exelon Corp. | 536,200 | 18,815 | |
| Independent Power and Renewable Electricity Producers - 0.2% | |||
| Dynegy, Inc. (a) | 306,000 | 5,395 | |
| TOTAL UTILITIES | 24,210 | ||
| TOTAL COMMON STOCKS | |||
| (Cost $2,190,395) | 2,576,363 | ||
| Principal Amount (000s) | Value (000s) | ||
| Convertible Bonds - 0.0% | |||
| ENERGY - 0.0% | |||
| Oil, Gas & Consumable Fuels - 0.0% | |||
| Amyris, Inc.: | |||
| 5% 10/15/18 (b) | 1,020 | 886 | |
| 9.5% 4/15/19 (d) | 639 | 516 | |
| (Cost $1,659) | 1,402 | ||
| Shares | Value (000s) | ||
| Money Market Funds - 0.6% | |||
| Fidelity Securities Lending Cash Central Fund, 0.42% (e)(f) | |||
| (Cost $15,358) | 15,358,125 | 15,358 | |
| TOTAL INVESTMENT PORTFOLIO - 100.5% | |||
| (Cost $2,207,412) | 2,593,123 | ||
| NET OTHER ASSETS (LIABILITIES) - (0.5)% | (13,396) | ||
| NET ASSETS - 100% | $2,579,727 |
Legend
(a) Non-income producing
(b) Restricted securities - Investment in securities not registered under the Securities Act of 1933 (excluding 144A issues). At the end of the period, the value of restricted securities (excluding 144A issues) amounted to $3,765,000 or 0.1% of net assets.
(c) Security or a portion of the security is on loan at period end.
(d) Security exempt from registration under Rule 144A of the Securities Act of 1933. These securities may be resold in transactions exempt from registration, normally to qualified institutional buyers. At the end of the period, the value of these securities amounted to $7,584,000 or 0.3% of net assets.
(e) Affiliated fund that is generally available only to investment companies and other accounts managed by Fidelity Investments. The rate quoted is the annualized seven-day yield of the fund at period end. A complete unaudited listing of the fund's holdings as of its most recent quarter end is available upon request. In addition, each Fidelity Central Fund's financial statements, which are not covered by the Fund's Report of Independent Registered Public Accounting Firm, are available on the SEC's website or upon request.
(f) Investment made with cash collateral received from securities on loan.
Additional information on each restricted holding is as follows:
| Security | Acquisition Date | Acquisition Cost (000s) |
| Amyris, Inc. 5% 10/15/18 | 10/16/13 - 4/15/16 | $1,020 |
| KKR Renaissance Co-Invest LP unit | 7/25/13 | $2,163 |
| NJOY, Inc. | 6/7/13 - 2/14/14 | $2,381 |
Affiliated Central Funds
Information regarding fiscal year to date income earned by the Fund from investments in Fidelity Central Funds is as follows:
| Fund | Income earned |
| (Amounts in thousands) | |
| Fidelity Cash Central Fund | $12 |
| Fidelity Securities Lending Cash Central Fund | 426 |
| Total | $438 |
Investment Valuation
The following is a summary of the inputs used, as of April 30, 2016, involving the Fund's assets and liabilities carried at fair value. The inputs or methodology used for valuing securities may not be an indication of the risk associated with investing in those securities. For more information on valuation inputs, and their aggregation into the levels used below, please refer to the Investment Valuation section in the accompanying Notes to Financial Statements.
| Valuation Inputs at Reporting Date: | ||||
| Description | Total | Level 1 | Level 2 | Level 3 |
| (Amounts in thousands) | ||||
| Investments in Securities: | ||||
| Equities: | ||||
| Consumer Discretionary | $226,645 | $226,534 | $-- | $111 |
| Consumer Staples | 156,461 | 145,383 | 11,078 | -- |
| Energy | 342,155 | 342,155 | -- | -- |
| Financials | 530,919 | 527,889 | 262 | 2,768 |
| Health Care | 333,653 | 331,231 | 2,422 | -- |
| Industrials | 328,836 | 328,836 | -- | -- |
| Information Technology | 542,225 | 542,225 | -- | -- |
| Materials | 79,884 | 79,884 | -- | -- |
| Telecommunication Services | 11,375 | 11,375 | -- | -- |
| Utilities | 24,210 | 24,210 | -- | -- |
| Corporate Bonds | 1,402 | -- | 1,402 | -- |
| Money Market Funds | 15,358 | 15,358 | -- | -- |
| Total Investments in Securities: | $2,593,123 | $2,575,080 | $15,164 | $2,879 |
See accompanying notes which are an integral part of the financial statements.
Financial Statements
Statement of Assets and Liabilities
| Amounts in thousands (except per-share amount) | April 30, 2016 | |
| Assets | ||
| Investment in securities, at value (including securities loaned of $15,417) — See accompanying schedule: Unaffiliated issuers (cost $2,192,054) | $2,577,765 | |
| Fidelity Central Funds (cost $15,358) | 15,358 | |
| Total Investments (cost $2,207,412) | $2,593,123 | |
| Receivable for investments sold | 25,404 | |
| Receivable for fund shares sold | 1,214 | |
| Dividends receivable | 2,833 | |
| Interest receivable | 34 | |
| Distributions receivable from Fidelity Central Funds | 25 | |
| Prepaid expenses | 2 | |
| Other receivables | 15 | |
| Total assets | 2,622,650 | |
| Liabilities | ||
| Payable for investments purchased | $10,600 | |
| Payable for fund shares redeemed | 13,662 | |
| Accrued management fee | 1,019 | |
| Other affiliated payables | 457 | |
| Other payables and accrued expenses | 1,827 | |
| Collateral on securities loaned, at value | 15,358 | |
| Total liabilities | 42,923 | |
| Net Assets | $2,579,727 | |
| Net Assets consist of: | ||
| Paid in capital | $2,169,357 | |
| Undistributed net investment income | 13,621 | |
| Accumulated undistributed net realized gain (loss) on investments and foreign currency transactions | 11,043 | |
| Net unrealized appreciation (depreciation) on investments and assets and liabilities in foreign currencies | 385,706 | |
| Net Assets, for 96,920 shares outstanding | $2,579,727 | |
| Net Asset Value, offering price and redemption price per share ($2,579,727 ÷ 96,920 shares) | $26.62 |
See accompanying notes which are an integral part of the financial statements.
Statement of Operations
| Amounts in thousands | Year ended April 30, 2016 | |
| Investment Income | ||
| Dividends | $61,021 | |
| Interest | 88 | |
| Income from Fidelity Central Funds | 438 | |
| Total income | 61,547 | |
| Expenses | ||
| Management fee | ||
| Basic fee | $15,681 | |
| Performance adjustment | (30) | |
| Transfer agent fees | 5,423 | |
| Accounting and security lending fees | 848 | |
| Custodian fees and expenses | 80 | |
| Independent trustees' compensation | 13 | |
| Registration fees | 70 | |
| Audit | 58 | |
| Legal | 10 | |
| Interest | 13 | |
| Miscellaneous | 22 | |
| Total expenses before reductions | 22,188 | |
| Expense reductions | (150) | 22,038 |
| Net investment income (loss) | 39,509 | |
| Realized and Unrealized Gain (Loss) | ||
| Net realized gain (loss) on: | ||
| Investment securities: | ||
| Unaffiliated issuers | 78,468 | |
| Foreign currency transactions | 59 | |
| Total net realized gain (loss) | 78,527 | |
| Change in net unrealized appreciation (depreciation) on: Investment securities | (302,559) | |
| Assets and liabilities in foreign currencies | (4) | |
| Total change in net unrealized appreciation (depreciation) | (302,563) | |
| Net gain (loss) | (224,036) | |
| Net increase (decrease) in net assets resulting from operations | $(184,527) |
See accompanying notes which are an integral part of the financial statements.
Statement of Changes in Net Assets
| Amounts in thousands | Year ended April 30, 2016 | Year ended April 30, 2015 |
| Increase (Decrease) in Net Assets | ||
| Operations | ||
| Net investment income (loss) | $39,509 | $33,473 |
| Net realized gain (loss) | 78,527 | 183,465 |
| Change in net unrealized appreciation (depreciation) | (302,563) | 131,034 |
| Net increase (decrease) in net assets resulting from operations | (184,527) | 347,972 |
| Distributions to shareholders from net investment income | (33,715) | (28,672) |
| Distributions to shareholders from net realized gain | (103,844) | (153,595) |
| Total distributions | (137,559) | (182,267) |
| Share transactions | ||
| Proceeds from sales of shares | 560,790 | 1,271,842 |
| Reinvestment of distributions | 133,799 | 177,147 |
| Cost of shares redeemed | (1,000,244) | (1,203,017) |
| Net increase (decrease) in net assets resulting from share transactions | (305,655) | 245,972 |
| Total increase (decrease) in net assets | (627,741) | 411,677 |
| Net Assets | ||
| Beginning of period | 3,207,468 | 2,795,791 |
| End of period (including undistributed net investment income of $13,621 and undistributed net investment income of $11,110, respectively) | $2,579,727 | $3,207,468 |
| Other Information | ||
| Shares | ||
| Sold | 20,614 | 45,162 |
| Issued in reinvestment of distributions | 4,813 | 6,299 |
| Redeemed | (38,055) | (42,633) |
| Net increase (decrease) | (12,628) | 8,828 |
See accompanying notes which are an integral part of the financial statements.
Financial Highlights — Fidelity Large Cap Stock Fund
| Years ended April 30, | 2016 | 2015 | 2014 | 2013 | 2012 |
| Selected Per–Share Data | |||||
| Net asset value, beginning of period | $29.28 | $27.76 | $23.17 | $19.55 | $19.10 |
| Income from Investment Operations | |||||
| Net investment income (loss)A | .37 | .31 | .28 | .25 | .16 |
| Net realized and unrealized gain (loss) | (1.74) | 2.92 | 5.48 | 3.58 | .46 |
| Total from investment operations | (1.37) | 3.23 | 5.76 | 3.83 | .62 |
| Distributions from net investment income | (.32) | (.27) | (.21) | (.20) | (.15) |
| Distributions from net realized gain | (.97) | (1.44) | (.96) | (.01) | (.03) |
| Total distributions | (1.29) | (1.71) | (1.17) | (.21) | (.17)B |
| Net asset value, end of period | $26.62 | $29.28 | $27.76 | $23.17 | $19.55 |
| Total ReturnC | (4.82)% | 11.97% | 25.53% | 19.74% | 3.40% |
| Ratios to Average Net AssetsD,E | |||||
| Expenses before reductions | .78% | .88% | .88% | .85% | 1.03% |
| Expenses net of fee waivers, if any | .77% | .88% | .88% | .85% | 1.03% |
| Expenses net of all reductions | .77% | .88% | .88% | .84% | 1.02% |
| Net investment income (loss) | 1.38% | 1.10% | 1.08% | 1.21% | .88% |
| Supplemental Data | |||||
| Net assets, end of period (in millions) | $2,580 | $3,207 | $2,796 | $1,488 | $951 |
| Portfolio turnover rateF | 31% | 36%G | 31% | 53% | 64% |
A Calculated based on average shares outstanding during the period.
B Total distributions of $.17 per share is comprised of distributions from net investment income of $.147 and distributions from net realized gain of $.027 per share.
C Total returns would have been lower if certain expenses had not been reduced during the applicable periods shown.
D Fees and expenses of any underlying Fidelity Central Funds are not included in the Fund's expense ratio. The Fund indirectly bears its proportionate share of the expenses of any underlying Fidelity Central Funds.
E Expense ratios reflect operating expenses of the Fund. Expenses before reductions do not reflect amounts reimbursed by the investment adviser or reductions from brokerage service arrangements or reductions from other expense offset arrangements and do not represent the amount paid by the Fund during periods when reimbursements or reductions occur. Expenses net of fee waivers reflect expenses after reimbursement by the investment adviser but prior to reductions from brokerage service arrangements or other expense offset arrangements. Expenses net of all reductions represent the net expenses paid by the Fund.
F Amount does not include the portfolio activity of any underlying Fidelity Central Funds.
G Portfolio turnover rate excludes securities received or delivered in-kind.
See accompanying notes which are an integral part of the financial statements.
Notes to Financial Statements
For the period ended April 30, 2016
(Amounts in thousands except percentages)
1. Organization.
Fidelity Large Cap Stock Fund (the Fund) is a fund of Fidelity Commonwealth Trust (the Trust) and is authorized to issue an unlimited number of shares. Share transactions on the Statement of Changes in Net Assets may contain exchanges between affiliated funds. The Trust is registered under the Investment Company Act of 1940, as amended (the 1940 Act), as an open-end management investment company organized as a Massachusetts business trust.
2. Investments in Fidelity Central Funds.
The Fund invests in Fidelity Central Funds, which are open-end investment companies generally available only to other investment companies and accounts managed by the investment adviser and its affiliates. The Fund's Schedule of Investments lists each of the Fidelity Central Funds held as of period end, if any, as an investment of the Fund, but does not include the underlying holdings of each Fidelity Central Fund. As an Investing Fund, the Fund indirectly bears its proportionate share of the expenses of the underlying Fidelity Central Funds.
The Money Market Central Funds seek preservation of capital and current income and are managed by Fidelity Investments Money Management, Inc. (FIMM), an affiliate of the investment adviser. Annualized expenses of the Money Market Central Funds as of their most recent shareholder report date are less than .005%.
A complete unaudited list of holdings for each Fidelity Central Fund is available upon request or at the Securities and Exchange Commission (the SEC) website at www.sec.gov. In addition, the financial statements of the Fidelity Central Funds, which are not covered by the Fund's Report of Independent Registered Public Accounting Firm, are available on the SEC website or upon request.
3. Significant Accounting Policies.
The financial statements have been prepared in conformity with accounting principles generally accepted in the United States of America (GAAP), which require management to make certain estimates and assumptions at the date of the financial statements. Actual results could differ from those estimates. Subsequent events, if any, through the date that the financial statements were issued have been evaluated in the preparation of the financial statements. The following summarizes the significant accounting policies of the Fund:
Investment Valuation. Investments are valued as of 4:00 p.m. Eastern time on the last calendar day of the period. The Board of Trustees (the Board) has delegated the day to day responsibility for the valuation of the Fund's investments to the Fidelity Management & Research Company (FMR) Fair Value Committee (the Committee). In accordance with valuation policies and procedures approved by the Board, the Fund attempts to obtain prices from one or more third party pricing vendors or brokers to value its investments. When current market prices, quotations or currency exchange rates are not readily available or reliable, investments will be fair valued in good faith by the Committee, in accordance with procedures adopted by the Board. Factors used in determining fair value vary by investment type and may include market or investment specific events, changes in interest rates and credit quality. The frequency with which these procedures are used cannot be predicted and they may be utilized to a significant extent. The Committee oversees the Fund's valuation policies and procedures and reports to the Board on the Committee's activities and fair value determinations. The Board monitors the appropriateness of the procedures used in valuing the Fund's investments and ratifies the fair value determinations of the Committee.
The Fund categorizes the inputs to valuation techniques used to value its investments into a disclosure hierarchy consisting of three levels as shown below:
- Level 1 – quoted prices in active markets for identical investments
- Level 2 – other significant observable inputs (including quoted prices for similar investments, interest rates, prepayment speeds, etc.)
- Level 3 – unobservable inputs (including the Fund's own assumptions based on the best information available)
Valuation techniques used to value the Fund's investments by major category are as follows:
Equity securities, including restricted securities, for which market quotations are readily available, are valued at the last reported sale price or official closing price as reported by a third party pricing vendor on the primary market or exchange on which they are traded and are categorized as Level 1 in the hierarchy. In the event there were no sales during the day or closing prices are not available, securities are valued at the last quoted bid price or may be valued using the last available price and are generally categorized as Level 2 in the hierarchy. For foreign equity securities, when market or security specific events arise, comparisons to the valuation of American Depositary Receipts (ADRs), futures contracts, Exchange-Traded Funds (ETFs) and certain indexes as well as quoted prices for similar securities may be used and would be categorized as Level 2 in the hierarchy. Utilizing these techniques may result in transfers between Level 1 and Level 2. For equity securities, including restricted securities, where observable inputs are limited, assumptions about market activity and risk are used and these securities may be categorized as Level 3 in the hierarchy.
Debt securities, including restricted securities, are valued based on evaluated prices received from third party pricing vendors or from brokers who make markets in such securities. Corporate bonds are valued by pricing vendors who utilize matrix pricing which considers yield or price of bonds of comparable quality, coupon, maturity and type or by broker-supplied prices. When independent prices are unavailable or unreliable, debt securities may be valued utilizing pricing methodologies which consider similar factors that would be used by third party pricing vendors. Debt securities are generally categorized as Level 2 in the hierarchy but may be Level 3 depending on the circumstances.
Investments in open-end mutual funds, including the Fidelity Central Funds, are valued at their closing net asset value (NAV) each business day and are categorized as Level 1 in the hierarchy.
Changes in valuation techniques may result in transfers in or out of an assigned level within the disclosure hierarchy. The aggregate value of investments by input level as of April 30, 2016 is included at the end of the Fund's Schedule of Investments.
Foreign Currency. The Fund may use foreign currency contracts to facilitate transactions in foreign-denominated securities. Gains and losses from these transactions may arise from changes in the value of the foreign currency or if the counterparties do not perform under the contracts' terms.
Foreign-denominated assets, including investment securities, and liabilities are translated into U.S. dollars at the exchange rates at period end. Purchases and sales of investment securities, income and dividends received and expenses denominated in foreign currencies are translated into U.S. dollars at the exchange rate in effect on the transaction date.
The effects of exchange rate fluctuations on investments are included with the net realized and unrealized gain (loss) on investment securities. Other foreign currency transactions resulting in realized and unrealized gain (loss) are disclosed separately.
Investment Transactions and Income. For financial reporting purposes, the Fund's investment holdings and NAV include trades executed through the end of the last business day of the period. The NAV per share for processing shareholder transactions is calculated as of the close of business of the New York Stock Exchange (NYSE), normally 4:00 p.m. Eastern time and includes trades executed through the end of the prior business day. Gains and losses on securities sold are determined on the basis of identified cost and may include proceeds received from litigation. Dividend income is recorded on the ex-dividend date, except for certain dividends from foreign securities where the ex-dividend date may have passed, which are recorded as soon as the Fund is informed of the ex-dividend date. Non-cash dividends included in dividend income, if any, are recorded at the fair market value of the securities received. Income and capital gain distributions from Fidelity Central Funds, if any, are recorded on the ex-dividend date. Distributions received on securities that represent a return of capital or capital gain are recorded as a reduction of cost of investments and/or as a realized gain. Subsequent to ex-dividend date the Fund determines the components of these distributions, based upon receipt of tax filings or other correspondence relating to the underlying investment. Interest income is accrued as earned and includes coupon interest and amortization of premium and accretion of discount on debt securities as applicable. Investment income is recorded net of foreign taxes withheld where recovery of such taxes is uncertain.
Expenses. Expenses directly attributable to a fund are charged to that fund. Expenses attributable to more than one fund are allocated among the respective funds on the basis of relative net assets or other appropriate methods. Expense estimates are accrued in the period to which they relate and adjustments are made when actual amounts are known.
Income Tax Information and Distributions to Shareholders. Each year, the Fund intends to qualify as a regulated investment company under Subchapter M of the Internal Revenue Code, including distributing substantially all of its taxable income and realized gains. As a result, no provision for U.S. Federal income taxes is required. As of April 30, 2016, the Fund did not have any unrecognized tax benefits in the financial statements; nor is the Fund aware of any tax positions for which it is reasonably possible that the total amounts of unrecognized tax benefits will significantly change in the next twelve months. The Fund files a U.S. federal tax return, in addition to state and local tax returns as required. The Fund's federal income tax returns are subject to examination by the Internal Revenue Service (IRS) for a period of three fiscal years after they are filed. State and local tax returns may be subject to examination for an additional fiscal year depending on the jurisdiction. Foreign taxes are provided for based on the Fund's understanding of the tax rules and rates that exist in the foreign markets in which it invests.
Distributions are declared and recorded on the ex-dividend date. Income and capital gain distributions are determined in accordance with income tax regulations, which may differ from GAAP. In addition, the Fund claimed a portion of the payment made to redeeming shareholders as a distribution for income tax purposes.
Capital accounts within the financial statements are adjusted for permanent book-tax differences. These adjustments have no impact on net assets or the results of operations. Capital accounts are not adjusted for temporary book-tax differences which will reverse in a subsequent period.
Book-tax differences are primarily due to foreign currency transactions, partnerships and losses deferred due to wash sales.
The federal tax cost of investment securities and unrealized appreciation (depreciation) as of period end were as follows:
| Gross unrealized appreciation | $561,221 |
| Gross unrealized depreciation | (192,206) |
| Net unrealized appreciation (depreciation) on securities | $369,015 |
| Tax Cost | $2,224,108 |
The tax-based components of distributable earnings as of period end were as follows:
| Undistributed ordinary income | $13,621 |
| Undistributed long-term capital gain | $27,990 |
| Net unrealized appreciation (depreciation) on securities and other investments | $369,010 |
The tax character of distributions paid was as follows:
| April 30, 2016 | April 30, 2015 | |
| Ordinary Income | $33,715 | $ 53,408 |
| Long-term Capital Gains | 103,844 | 128,859 |
| Total | $137,559 | $ 182,267 |
Restricted Securities. The Fund may invest in securities that are subject to legal or contractual restrictions on resale. These securities generally may be resold in transactions exempt from registration or to the public if the securities are registered. Disposal of these securities may involve time-consuming negotiations and expense, and prompt sale at an acceptable price may be difficult. Information regarding restricted securities is included at the end of the Fund's Schedule of Investments.
4. Purchases and Sales of Investments.
Purchases and sales of securities, other than short-term securities, aggregated $892,042 and $1,290,577, respectively.
5. Fees and Other Transactions with Affiliates.
Management Fee. Fidelity Management & Research Company (the investment adviser) and its affiliates provide the Fund with investment management related services for which the Fund pays a monthly management fee. The management fee is the sum of an individual fund fee rate that is based on an annual rate of .30% of the Fund's average net assets and an annualized group fee rate that averaged .25% during the period. The group fee rate is based upon the average net assets of all the mutual funds advised by the investment adviser, including any mutual funds previously advised by the investment adviser that are currently advised by Fidelity SelectCo, LLC, an affiliate of the investment adviser. The group fee rate decreases as assets under management increase and increases as assets under management decrease. In addition, the management fee is subject to a performance adjustment (up to a maximum of +/- .20% of the Fund's average net assets over a 36 month performance period.) The upward or downward adjustment to the management fee is based on the Fund's relative investment performance as compared to its benchmark index, the S&P 500 Index, over the same 36 month performance period. For the reporting period, the total annual management fee rate, including the performance adjustment, was .55% of the Fund's average net assets. The performance adjustment included in the management fee rate may be higher or lower than the maximum performance adjustment rate due to the difference between the average net assets for the reporting and performance periods.
Transfer Agent Fees. Fidelity Investments Institutional Operations Company, Inc. (FIIOC), an affiliate of the investment adviser, is the Fund's transfer, dividend disbursing and shareholder servicing agent. FIIOC receives account fees and asset-based fees that vary according to account size and type of account. FIIOC pays for typesetting, printing and mailing of shareholder reports, except proxy statements. For the period, the transfer agent fees were equivalent to an annual rate of .19% of average net assets.
Accounting and Security Lending Fees. Fidelity Service Company, Inc. (FSC), an affiliate of the investment adviser, maintains the Fund's accounting records. The accounting fee is based on the level of average net assets for each month. Under a separate contract, FSC administers the security lending program. The security lending fee is based on the number and duration of lending transactions.
Brokerage Commissions. The Fund placed a portion of its portfolio transactions with brokerage firms which are affiliates of the investment adviser. Brokerage commissions are included in net realized gain (loss) and change in net unrealized appreciation (depreciation) in the Statement of Operations. The commissions paid to these affiliated firms were $21 for the period.
Interfund Lending Program. Pursuant to an Exemptive Order issued by the SEC, the Fund, along with other registered investment companies having management contracts with FMR or other affiliated entities of FMR, may participate in an interfund lending program. This program provides an alternative credit facility allowing the funds to borrow from, or lend money to, other participating affiliated funds. At period end, there were no interfund loans outstanding. The Fund's activity in this program during the period for which loans were outstanding was as follows:
| Borrower or Lender | Average Loan Balance | Weighted Average Interest Rate | Interest Expense |
| Borrower | $9,540 | .47% | $11 |
Interfund Trades. The Fund may purchase from or sell securities to other Fidelity Funds under procedures adopted by the Board. The procedures have been designed to ensure these interfund trades are executed in accordance with Rule 17a-7 of the 1940 Act. Interfund trades are included within the respective purchases and sales amounts shown in the Purchases and Sales of Investments note.
Other. During the period, the investment adviser reimbursed the Fund for certain losses in the amount of $3.
6. Committed Line of Credit.
The Fund participates with other funds managed by the investment adviser or an affiliate in a $4.25 billion credit facility (the "line of credit") to be utilized for temporary or emergency purposes to fund shareholder redemptions or for other short-term liquidity purposes. The Fund has agreed to pay commitment fees on its pro-rata portion of the line of credit, which amounted to $4 and is reflected in Miscellaneous expenses on the Statement of Operations. During the period, the Fund did not borrow on this line of credit.
7. Security Lending.
The Fund lends portfolio securities through a lending agent from time to time in order to earn additional income. For equity securities, a lending agent is used and may loan securities to certain qualified borrowers, including Fidelity Capital Markets (FCM), a broker-dealer affiliated with the Fund. On the settlement date of the loan, the Fund receives collateral (in the form of U.S. Treasury obligations, letters of credit and/or cash) against the loaned securities and maintains collateral in an amount not less than 100% of the market value of the loaned securities during the period of the loan. The market value of the loaned securities is determined at the close of business of the Fund and any additional required collateral is delivered to the Fund on the next business day. The Fund or borrower may terminate the loan at any time, and if the borrower defaults on its obligation to return the securities loaned because of insolvency or other reasons, the Fund may apply collateral received from the borrower against the obligation. The Fund may experience delays and costs in recovering the securities loaned. Any cash collateral received is invested in the Fidelity Securities Lending Cash Central Fund. The value of loaned securities and cash collateral at period end are disclosed on the Fund's Statement of Assets and Liabilities. Security lending income represents the income earned on investing cash collateral, less rebates paid to borrowers and any lending agent fees associated with the loan, plus any premium payments received for lending certain types of securities. Security lending income is presented in the Statement of Operations as a component of income from Fidelity Central Funds. Total security lending income during the period amounted to $426. During the period there were no securities loaned to FCM.
8. Bank Borrowings.
The Fund is permitted to have bank borrowings for temporary or emergency purposes to fund shareholder redemptions or for other short-term liquidity requirements. The Fund has established borrowing arrangements with certain banks. The interest rate on the borrowings is the bank's base rate, as revised from time to time. The average loan balance during the period for which loans were outstanding amounted to $2,516. The weighted average interest rate was .82%. The interest expense amounted to $2 under the bank borrowing program.
9. Expense Reductions.
Commissions paid to certain brokers with whom the investment adviser, or its affiliates, places trades on behalf of the Fund include an amount in addition to trade execution, which may be rebated back to the Fund to offset certain expenses. This amount totaled $70 for the period.
In addition, during the period the investment adviser reimbursed and/or waived a portion of operating expenses in the amount of $80.
10. Other.
The Fund's organizational documents provide former and current trustees and officers with a limited indemnification against liabilities arising in connection with the performance of their duties to the Fund. In the normal course of business, the Fund may also enter into contracts that provide general indemnifications. The Fund's maximum exposure under these arrangements is unknown as this would be dependent on future claims that may be made against the Fund. The risk of material loss from such claims is considered remote.
Report of Independent Registered Public Accounting Firm
To the Trustees of Fidelity Commonwealth Trust and Shareholders of Fidelity Large Cap Stock Fund:
We have audited the accompanying statement of assets and liabilities of Fidelity Large Cap Stock Fund (the Fund), a fund of Fidelity Commonwealth Trust, including the schedule of investments, as of April 30, 2016, and the related statement of operations for the year then ended, the statement of changes in net assets for each of the two years in the period then ended, and the financial highlights for each of the five years in the period then ended. These financial statements and financial highlights are the responsibility of the Fund's management. Our responsibility is to express an opinion on these financial statements and financial highlights based on our audits.
We conducted our audits in accordance with the standards of the Public Company Accounting Oversight Board (United States). Those standards require that we plan and perform the audit to obtain reasonable assurance about whether the financial statements and financial highlights are free of material misstatement. The Fund is not required to have, nor were we engaged to perform, an audit of its internal control over financial reporting. Our audits included consideration of internal control over financial reporting as a basis for designing audit procedures that are appropriate in the circumstances, but not for the purpose of expressing an opinion on the effectiveness of the Fund's internal control over financial reporting. Accordingly, we express no such opinion. An audit also includes examining, on a test basis, evidence supporting the amounts and disclosures in the financial statements, assessing the accounting principles used and significant estimates made by management, as well as evaluating the overall financial statement presentation. Our procedures included confirmation of securities owned as of April 30, 2016, by correspondence with the custodians and brokers; when replies were not received from brokers, we performed other auditing procedures. We believe that our audits provide a reasonable basis for our opinion.
In our opinion, such financial statements and financial highlights referred to above present fairly, in all material respects, the financial position of Fidelity Large Cap Stock Fund as of April 30, 2016, the results of its operations for the year then ended, the changes in its net assets for each of the two years in the period then ended, and the financial highlights for each of the five years in the period then ended, in conformity with accounting principles generally accepted in the United States of America.
DELOITTE & TOUCHE LLP
Boston, Massachusetts
June 15, 2016
Trustees and Officers
The Trustees, Members of the Advisory Board (if any), and officers of the trust and fund, as applicable, are listed below. The Board of Trustees governs the fund and is responsible for protecting the interests of shareholders. The Trustees are experienced executives who meet periodically throughout the year to oversee the fund's activities, review contractual arrangements with companies that provide services to the fund, oversee management of the risks associated with such activities and contractual arrangements, and review the fund's performance. Each of the Trustees oversees 170 funds.
The Trustees hold office without limit in time except that (a) any Trustee may resign; (b) any Trustee may be removed by written instrument, signed by at least two-thirds of the number of Trustees prior to such removal; (c) any Trustee who requests to be retired or who has become incapacitated by illness or injury may be retired by written instrument signed by a majority of the other Trustees; and (d) any Trustee may be removed at any special meeting of shareholders by a two-thirds vote of the outstanding voting securities of the trust. Each Trustee who is not an interested person (as defined in the 1940 Act) of the trust and the fund is referred to herein as an Independent Trustee. Each Independent Trustee shall retire not later than the last day of the calendar year in which his or her 75th birthday occurs. The Independent Trustees may waive this mandatory retirement age policy with respect to individual Trustees. Officers and Advisory Board Members hold office without limit in time, except that any officer or Advisory Board Member may resign or may be removed by a vote of a majority of the Trustees at any regular meeting or any special meeting of the Trustees. Except as indicated, each individual has held the office shown or other offices in the same company for the past five years.
The fund’s Statement of Additional Information (SAI) includes more information about the Trustees. To request a free copy, call Fidelity at 1-800-544-8544.
Experience, Skills, Attributes, and Qualifications of the Trustees. The Governance and Nominating Committee has adopted a statement of policy that describes the experience, qualifications, attributes, and skills that are necessary and desirable for potential Independent Trustee candidates (Statement of Policy). The Board believes that each Trustee satisfied at the time he or she was initially elected or appointed a Trustee, and continues to satisfy, the standards contemplated by the Statement of Policy. The Governance and Nominating Committee also engages professional search firms to help identify potential Independent Trustee candidates who have the experience, qualifications, attributes, and skills consistent with the Statement of Policy. From time to time, additional criteria based on the composition and skills of the current Independent Trustees, as well as experience or skills that may be appropriate in light of future changes to board composition, business conditions, and regulatory or other developments, have also been considered by the professional search firms and the Governance and Nominating Committee. In addition, the Board takes into account the Trustees' commitment and participation in Board and committee meetings, as well as their leadership of standing and ad hoc committees throughout their tenure.
In determining that a particular Trustee was and continues to be qualified to serve as a Trustee, the Board has considered a variety of criteria, none of which, in isolation, was controlling. The Board believes that, collectively, the Trustees have balanced and diverse experience, qualifications, attributes, and skills, which allow the Board to operate effectively in governing the fund and protecting the interests of shareholders. Information about the specific experience, skills, attributes, and qualifications of each Trustee, which in each case led to the Board's conclusion that the Trustee should serve (or continue to serve) as a trustee of the fund, is provided below.
Board Structure and Oversight Function. James C. Curvey is an interested person and currently serves as Chairman. The Trustees have determined that an interested Chairman is appropriate and benefits shareholders because an interested Chairman has a personal and professional stake in the quality and continuity of services provided to the fund. Independent Trustees exercise their informed business judgment to appoint an individual of their choosing to serve as Chairman, regardless of whether the Trustee happens to be independent or a member of management. The Independent Trustees have determined that they can act independently and effectively without having an Independent Trustee serve as Chairman and that a key structural component for assuring that they are in a position to do so is for the Independent Trustees to constitute a substantial majority for the Board. The Independent Trustees also regularly meet in executive session. Ned C. Lautenbach serves as Chairman of the Independent Trustees and as such (i) acts as a liaison between the Independent Trustees and management with respect to matters important to the Independent Trustees and (ii) with management prepares agendas for Board meetings.
Fidelity® funds are overseen by different Boards of Trustees. The fund's Board oversees Fidelity's high income and certain equity funds, and other Boards oversee Fidelity's investment-grade bond, money market, asset allocation, and sector funds. The asset allocation funds may invest in Fidelity® funds overseen by the fund's Board. The use of separate Boards, each with its own committee structure, allows the Trustees of each group of Fidelity® funds to focus on the unique issues of the funds they oversee, including common research, investment, and operational issues. On occasion, the separate Boards establish joint committees to address issues of overlapping consequences for the Fidelity® funds overseen by each Board.
The Trustees operate using a system of committees to facilitate the timely and efficient consideration of all matters of importance to the Trustees, the fund, and fund shareholders and to facilitate compliance with legal and regulatory requirements and oversight of the fund's activities and associated risks. The Board, acting through its committees, has charged FMR and its affiliates with (i) identifying events or circumstances the occurrence of which could have demonstrably adverse effects on the fund's business and/or reputation; (ii) implementing processes and controls to lessen the possibility that such events or circumstances occur or to mitigate the effects of such events or circumstances if they do occur; and (iii) creating and maintaining a system designed to evaluate continuously business and market conditions in order to facilitate the identification and implementation processes described in (i) and (ii) above. Because the day-to-day operations and activities of the fund are carried out by or through FMR, its affiliates, and other service providers, the fund's exposure to risks is mitigated but not eliminated by the processes overseen by the Trustees. While each of the Board's committees has responsibility for overseeing different aspects of the fund's activities, oversight is exercised primarily through the Operations, Audit, and Compliance Committees. In addition, the Independent Trustees have worked with FMR to enhance the Board's oversight of investment and financial risks, legal and regulatory risks, technology risks, and operational risks, including the development of additional risk reporting to the Board. For example, a working group comprised of Independent Trustees and FMR has worked and continues to work to review the Fidelity® funds' valuation-related activities, reporting and risk management. Appropriate personnel, including but not limited to the fund's Chief Compliance Officer (CCO), FMR's internal auditor, the independent accountants, the fund's Treasurer and portfolio management personnel, make periodic reports to the Board's committees, as appropriate, including an annual review of Fidelity's risk management program for the Fidelity® funds. The responsibilities of each standing committee, including their oversight responsibilities, are described further under "Standing Committees of the Trustees."
Interested Trustees*:
Correspondence intended for a Trustee who is an interested person may be sent to Fidelity Investments, 245 Summer Street, Boston, Massachusetts 02210.
Name, Year of Birth; Principal Occupations and Other Relevant Experience+
James C. Curvey (1935)
Year of Election or Appointment: 2007
Trustee
Chairman of the Board of Trustees
Mr. Curvey also serves as Trustee of other Fidelity® funds. Mr. Curvey is a Director of Fidelity Research & Analysis Co. (investment adviser firm, 2009-present), and Vice Chairman (2007-present) and Director of FMR LLC (diversified financial services company). In addition, Mr. Curvey serves as an Overseer for the Boston Symphony Orchestra and a member of the board of Artis-Naples, Naples, Florida, and as a Trustee for Brewster Academy, Wolfeboro, New Hampshire. Previously, Mr. Curvey served as a Director of Fidelity Investments Money Management, Inc. (investment adviser firm, 2009-2014) and a Director of FMR and FMR Co., Inc. (investment adviser firms, 2007-2014).
Charles S. Morrison (1960)
Year of Election or Appointment: 2014
Trustee
Mr. Morrison also serves as Trustee of other funds. He serves as a Director of Fidelity Investments Money Management, Inc. (FIMM) (investment adviser firm, 2014-present), Director of Fidelity SelectCo, LLC (investment adviser firm, 2014-present), President, Asset Management (2014-present), and is an employee of Fidelity Investments. Previously, Mr. Morrison served as Vice President of Fidelity's Fixed Income and Asset Allocation Funds (2012-2014), President, Fixed Income (2011-2014), Vice President of Fidelity's Money Market Funds (2005-2009), President, Money Market Group Leader of FMR (investment adviser firm, 2009), and Senior Vice President, Money Market Group of FMR (2004-2009). Mr. Morrison also served as Vice President of Fidelity's Bond Funds (2002-2005), certain Balanced Funds (2002-2005), and certain Asset Allocation Funds (2002-2007), and as Senior Vice President (2002-2005) of Fidelity's Bond Division.
* Determined to be an “Interested Trustee” by virtue of, among other things, his or her affiliation with the trust or various entities under common control with FMR.
+ The information includes the Trustee's principal occupation during the last five years and other information relating to the experience, attributes, and skills relevant to the Trustee's qualifications to serve as a Trustee, which led to the conclusion that the Trustee should serve as a Trustee for the fund.
Independent Trustees:
Correspondence intended for an Independent Trustee may be sent to Fidelity Investments, P.O. Box 55235, Boston, Massachusetts 02205-5235.
Name, Year of Birth; Principal Occupations and Other Relevant Experience+
Dennis J. Dirks (1948)
Year of Election or Appointment: 2005
Trustee
Mr. Dirks also serves as Trustee of other Fidelity® funds. Prior to his retirement in May 2003, Mr. Dirks was Chief Operating Officer and a member of the Board of The Depository Trust & Clearing Corporation (DTCC). He also served as President, Chief Operating Officer, and Board member of The Depository Trust Company (DTC) and President and Board member of the National Securities Clearing Corporation (NSCC). In addition, Mr. Dirks served as Chief Executive Officer and Board member of the Government Securities Clearing Corporation, Chief Executive Officer and Board member of the Mortgage-Backed Securities Clearing Corporation, as a Trustee and a member of the Finance Committee of Manhattan College (2005-2008), as a Trustee and a member of the Finance Committee of AHRC of Nassau County (2006-2008), and as a member of the Independent Directors Council (IDC) Governing Council (2010-2015). Mr. Dirks is a member of the Board of Directors for The Brookville Center for Children's Services, Inc. (2009-present).
Alan J. Lacy (1953)
Year of Election or Appointment: 2008
Trustee
Mr. Lacy also serves as Trustee of other Fidelity® funds. Mr. Lacy serves as Chairman (2014-present) and a member (2010-present) of the Board of Directors of Dave & Buster's Entertainment, Inc. (restaurant and entertainment complexes) and a Director of Bristol-Myers Squibb Company (global pharmaceuticals, 2008-present). He is a Trustee of the California Chapter of The Nature Conservancy (2015-present) and a Director of the Center for Advanced Study in the Behavioral Sciences at Stanford University (2015-present). In addition, Mr. Lacy served as Senior Adviser (2007-2014) of Oak Hill Capital Partners, L.P. (private equity) and also served as Chief Executive Officer (2005) and Vice Chairman (2005-2006) of Sears Holdings Corporation (retail) and Chief Executive Officer and Chairman of the Board of Sears, Roebuck and Co. (retail, 2000-2005). Previously, Mr. Lacy served as Chairman (2008-2011) and a member (2006-2015) of the Board of Trustees of the National Parks Conservation Association and as a member of the Board of Directors for The Western Union Company (global money transfer, 2006-2011), The Hillman Companies, Inc. (hardware wholesalers, 2010-2014), and Earth Fare, Inc. (retail grocery, 2010-2014).
Ned C. Lautenbach (1944)
Year of Election or Appointment: 2000
Trustee
Chairman of the Independent Trustees
Mr. Lautenbach also serves as Trustee of other Fidelity® funds. Mr. Lautenbach currently serves as the Lead Director of the Eaton Corporation Board of Directors (diversified industrial, 1997-present). Mr. Lautenbach is Chairman of the Board of Directors of Artis-Naples in Naples, Florida (2012-present), a member of the Council on Foreign Relations (1994-present), and a member of the Board of Governors, State University System of Florida (2013-present). Previously, Mr. Lautenbach was a Partner/Advisory Partner at Clayton, Dubilier & Rice, LLC (private equity investment, 1998-2010), as well as a Director of Sony Corporation (2006-2007).
Joseph Mauriello (1944)
Year of Election or Appointment: 2008
Trustee
Mr. Mauriello also serves as Trustee of other Fidelity® funds. Prior to his retirement in January 2006, Mr. Mauriello served in numerous senior management positions including Deputy Chairman and Chief Operating Officer (2004-2005), and Vice Chairman of Financial Services (2002-2004) of KPMG LLP US (professional services, 1965-2005). Mr. Mauriello currently serves as a member of the Board of Directors of XL Group plc. (global insurance and re-insurance, 2006-present) and the Independent Directors Council (IDC) Governing Council (2015-present). Previously, Mr. Mauriello served as a Director of the Hamilton Funds of the Bank of New York (2006-2007) and of Arcadia Resources Inc. (health care services and products, 2007-2012).
Robert W. Selander (1950)
Year of Election or Appointment: 2011
Trustee
Mr. Selander also serves as Trustee of other Fidelity® funds. Mr. Selander serves as a Director of The Western Union Company (global money transfer, 2014-present) and a non-executive Chairman of Health Equity, Inc. (health savings custodian, 2015-present). Previously, Mr. Selander served as a Member of the Advisory Board of certain Fidelity® funds (2011), and Executive Vice Chairman (2010), Chief Executive Officer (2009-2010), and President and Chief Executive Officer (1997-2009) of Mastercard, Inc.
Cornelia M. Small (1944)
Year of Election or Appointment: 2005
Trustee
Ms. Small also serves as Trustee of other Fidelity® funds. Ms. Small is a member of the Board of Directors (2009-present) and Chair of the Investment Committee (2010-present) of the Teagle Foundation. Ms. Small also serves on the Investment Committee of the Berkshire Taconic Community Foundation (2008-present). Previously, Ms. Small served as Chairperson (2002-2008) and a member of the Investment Committee and Chairperson (2008-2012) and a member of the Board of Trustees of Smith College. In addition, Ms. Small served as Chief Investment Officer, Director of Global Equity Investments, and a member of the Board of Directors of Scudder, Stevens & Clark and Scudder Kemper Investments.
William S. Stavropoulos (1939)
Year of Election or Appointment: 2002
Trustee
Vice Chairman of the Independent Trustees
Mr. Stavropoulos also serves as Trustee of other Fidelity® funds. Mr. Stavropoulos serves as President and Founder of the Michigan Baseball Foundation, the Great Lakes Loons (2007-present). Mr. Stavropoulos is Chairman Emeritus of the Board of Directors of The Dow Chemical Company, where he previously served in numerous senior management positions, including President, CEO (1995-2000; 2002-2004), Chairman of the Executive Committee (2000-2006), and as a member of the Board of Directors (1990-2006). Currently, Mr. Stavropoulos is Chairman of the Board of Directors of Univar Inc. (global distributor of commodity and specialty chemicals), a Director of Teradata Corporation (data warehousing and technology solutions), and Maersk Inc. (industrial conglomerate), and a member of the Advisory Board for Metalmark Capital LLC (private equity investment, 2005-present). Mr. Stavropoulos is an operating advisor to Clayton, Dubilier & Rice, LLC (private equity investment). In addition, Mr. Stavropoulos is a member of the University of Notre Dame Advisory Council for the College of Science, a Trustee of the Rollin L. Gerstacker Foundation, and a Director of the Naples Philharmonic Center for the Arts. Previously, Mr. Stavropoulos served as a Director of Chemical Financial Corporation (bank holding company, 1993-2012) and Tyco International, Ltd. (multinational manufacturing and services, 2007-2012).
David M. Thomas (1949)
Year of Election or Appointment: 2008
Trustee
Mr. Thomas also serves as Trustee of other Fidelity® funds. Mr. Thomas serves as Non-Executive Chairman of the Board of Directors of Fortune Brands Home and Security (home and security products, 2011-present), as a member of the Board of Directors (2004-present) and Presiding Director (2013-present) of Interpublic Group of Companies, Inc. (marketing communication), and as a member of the Board of Trustees of the University of Florida (2013-present). Previously, Mr. Thomas served as Executive Chairman (2005-2006) and Chairman and Chief Executive Officer (2000-2005) of IMS Health, Inc. (pharmaceutical and healthcare information solutions), and a Director of Fortune Brands, Inc. (consumer products, 2000-2011).
+ The information includes the Trustee's principal occupation during the last five years and other information relating to the experience, attributes, and skills relevant to the Trustee's qualifications to serve as a Trustee, which led to the conclusion that the Trustee should serve as a Trustee for the fund.
Advisory Board Members and Officers:
Correspondence intended for an officer or Peter S. Lynch may be sent to Fidelity Investments, 245 Summer Street, Boston, Massachusetts 02210. Officers appear below in alphabetical order.
Name, Year of Birth; Principal Occupation
Peter S. Lynch (1944)
Year of Election or Appointment: 2003
Member of the Advisory Board
Mr. Lynch also serves as Member of the Advisory Board of other Fidelity® funds. Mr. Lynch is Vice Chairman and a Director of FMR (investment adviser firm) and FMR Co., Inc. (investment adviser firm). In addition, Mr. Lynch serves as a Trustee of Boston College and as the Chairman of the Inner-City Scholarship Fund. Previously, Mr. Lynch served on the Special Olympics International Board of Directors (1997-2006).
Marc R. Bryant (1966)
Year of Election or Appointment: 2015
Secretary and Chief Legal Officer (CLO)
Mr. Bryant also serves as Secretary and CLO of other funds. Mr. Bryant serves as CLO, Secretary, and Senior Vice President of Fidelity Management & Research Company (investment adviser firm, 2015-present) and FMR Co., Inc. (investment adviser firm, 2015-present); Secretary of Fidelity SelectCo, LLC (investment adviser firm, 2015-present) and Fidelity Investments Money Management, Inc. (investment adviser firm, 2015-present); and CLO of Fidelity Management & Research (Hong Kong) Limited and FMR Investment Management (U.K.) Limited (investment adviser firms, 2015-present) and Fidelity Management & Research (Japan) Limited (investment adviser firm, 2016-present). He is Senior Vice President and Deputy General Counsel of FMR LLC (diversified financial services company). Previously, Mr. Bryant served as Secretary and CLO of Fidelity Rutland Square Trust II (2010-2014) and Assistant Secretary of Fidelity's Fixed Income and Asset Allocation Funds (2013-2015). Prior to joining Fidelity Investments, Mr. Bryant served as a Senior Vice President and the Head of Global Retail Legal for AllianceBernstein L.P. (2006-2010), and as the General Counsel for ProFund Advisors LLC (2001-2006).
William C. Coffey (1969)
Year of Election or Appointment: 2009
Assistant Secretary
Mr. Coffey also serves as Assistant Secretary of other funds. He is Senior Vice President and Deputy General Counsel of FMR LLC (diversified financial services company, 2010-present), and is an employee of Fidelity Investments. Previously, Mr. Coffey served as Vice President and Associate General Counsel of FMR LLC (2005-2009).
Jeffrey S. Christian (1961)
Year of Election or Appointment: 2016
Assistant Treasurer
Mr. Christian also serves as Assistant Treasurer of other funds. Mr. Christian is an employee of Fidelity Investments (2003-present).
Jonathan Davis (1968)
Year of Election or Appointment: 2010
Assistant Treasurer
Mr. Davis also serves as Assistant Treasurer of other funds, and is an employee of Fidelity Investments. Previously, Mr. Davis served as Vice President and Associate General Counsel of FMR LLC (diversified financial services company, 2003-2010).
Adrien E. Deberghes (1967)
Year of Election or Appointment: 2016
Assistant Treasurer
Mr. Deberghes also serves as an officer of other funds. He is an employee of Fidelity Investments (2008-present). Prior to joining Fidelity Investments, Mr. Deberghes was Senior Vice President of Mutual Fund Administration at State Street Corporation (2007-2008), Senior Director of Mutual Fund Administration at Investors Bank & Trust (2005-2007), and Director of Finance for Dunkin' Brands (2000-2005). Previously, Mr. Deberghes served in other fund officer roles.
Stephanie J. Dorsey (1969)
Year of Election or Appointment: 2010
Assistant Treasurer
Ms. Dorsey also serves as an officer of other funds. She is an employee of Fidelity Investments (2008-present) and has served in other fund officer roles. Prior to joining Fidelity Investments, Ms. Dorsey served as Treasurer (2004-2008) of the JPMorgan Mutual Funds and Vice President (2004-2008) of JPMorgan Chase Bank.
Howard J. Galligan III (1966)
Year of Election or Appointment: 2014
Chief Financial Officer
Mr. Galligan also serves as Chief Financial Officer of other funds. Mr. Galligan serves as President of Fidelity Pricing and Cash Management Services (FPCMS) (2014-present) and as a Director of Strategic Advisers, Inc. (investment adviser firm, 2008-present). Previously, Mr. Galligan served as Chief Administrative Officer of Asset Management (2011-2014) and Chief Operating Officer and Senior Vice President of Investment Support for Strategic Advisers, Inc. (2003-2011).
Scott C. Goebel (1968)
Year of Election or Appointment: 2015
Vice President
Mr. Goebel serves as Vice President of other funds and is an employee of Fidelity Investments (2001-present). Previously, Mr. Goebel served as Secretary of Fidelity SelectCo, LLC (investment adviser firm, 2013-2015), Fidelity Investments Money Management, Inc. (FIMM) (investment adviser firm, 2010-2015), and Fidelity Research and Analysis Company (FRAC) (investment adviser firm, 2010-2015); General Counsel, Secretary, and Senior Vice President of Fidelity Management & Research Company (investment adviser firm, 2008-2015) and FMR Co., Inc. (investment adviser firm, 2008-2015); Assistant Secretary of Fidelity Management & Research (Japan) Limited (investment adviser firm, 2008-2015) and Fidelity Management & Research (U.K.) Inc. (investment adviser firm, 2008-2015); Chief Legal Officer (CLO) of Fidelity Management & Research (Hong Kong) Limited (investment adviser firm, 2008-2015); Secretary and CLO of certain Fidelity® funds (2008-2015); Assistant Secretary of FIMM (2008-2010), FRAC (2008-2010), and certain funds (2007-2008); and as Vice President and Secretary of Fidelity Distributors Corporation (FDC) (2005-2007).
Thomas C. Hense (1964)
Year of Election or Appointment: 2008, 2010, or 2015
Vice President
Mr. Hense serves as Vice President of Fidelity Advisor® Multi-Asset Income Fund (2015) and other funds (High Income (2008), Small Cap (2008), and Value (2010) funds), and is an employee of Fidelity Investments (1993-present). Previously, Mr. Hense served as a portfolio manager for Fidelity's Institutional Money Management Group (Pyramis) (2003-2008).
Brian B. Hogan (1964)
Year of Election or Appointment: 2009
Vice President
Mr. Hogan also serves as Trustee or Vice President of other funds. Mr. Hogan serves as a Director of FMR Investment Management (U.K.) Limited (investment adviser firm, 2015-present) and Fidelity SelectCo, LLC (investment adviser firm, 2014-present) and President of the Equity Division of FMR (investment adviser firm, 2009-present). Previously, Mr. Hogan served as Senior Vice President, Equity Research of FMR (2006-2009) and as a portfolio manager. Mr. Brian B. Hogan is not related to Mr. Colm A. Hogan.
Colm A. Hogan (1973)
Year of Election or Appointment: 2016
Deputy Treasurer
Mr. Hogan also serves as an officer of other funds. Mr. Hogan is an employee of Fidelity Investments (2005-present). Mr. Colm A. Hogan is not related to Mr. Brian B. Hogan.
Chris Maher (1972)
Year of Election or Appointment: 2013
Assistant Treasurer
Mr. Maher serves as Assistant Treasurer of other funds. Mr. Maher is Vice President of Valuation Oversight and is an employee of Fidelity Investments. Previously, Mr. Maher served as Vice President of Asset Management Compliance (2013), Vice President of the Program Management Group of FMR (investment adviser firm, 2010-2013), and Vice President of Valuation Oversight (2008-2010).
John F. Papandrea (1972)
Year of Election or Appointment: 2016
Anti-Money Laundering (AML) Officer
Mr. Papandrea also serves as AML Officer of other funds. Mr. Papandrea is Vice President of FMR LLC (diversified financial services company, 2008-present) and is an employee of Fidelity Investments (2005-present).
Kenneth B. Robins (1969)
Year of Election or Appointment: 2016
Chief Compliance Officer
Mr. Robins also serves as an officer of other funds. Mr. Robins serves as Executive Vice President of Fidelity Investments Money Management, Inc. (FIMM) (investment adviser firm, 2013-present) and is an employee of Fidelity Investments (2004-present). Previously, Mr. Robins served in other fund officer roles.
Stacie M. Smith (1974)
Year of Election or Appointment: 2016
President and Treasurer
Ms. Smith also serves as an officer of other funds. She is an employee of Fidelity Investments (2009-present) and has served in other fund officer roles. Prior to joining Fidelity Investments, Ms. Smith served as Senior Audit Manager of Ernst & Young LLP (1996-2009). Previously, Ms. Smith served as Deputy Treasurer of certain Fidelity® funds (2013-2016).
Renee Stagnone (1975)
Year of Election or Appointment: 2016
Assistant Treasurer
Ms. Stagnone also serves as an officer of other funds. Ms. Stagnone is an employee of Fidelity Investments (1997-present). Previously, Ms. Stagnone served as Deputy Treasurer of certain Fidelity® funds (2013-2016).
Shareholder Expense Example
As a shareholder of the Fund, you incur two types of costs: (1) transaction costs, and (2) ongoing costs, including management fees and other Fund expenses. This Example is intended to help you understand your ongoing costs (in dollars) of investing in the Fund and to compare these costs with the ongoing costs of investing in other mutual funds.
The Example is based on an investment of $1,000 invested at the beginning of the period and held for the entire period (November 1, 2015 to April 30, 2016).
Actual Expenses
The first line of the accompanying table provides information about actual account values and actual expenses. You may use the information in this line, together with the amount you invested, to estimate the expenses that you paid over the period. Simply divide your account value by $1,000.00 (for example, an $8,600 account value divided by $1,000.00 = 8.6), then multiply the result by the number in the first line under the heading entitled "Expenses Paid During Period" to estimate the expenses you paid on your account during this period. A small balance maintenance fee of $12.00 that is charged once a year may apply for certain accounts with a value of less than $2,000. This fee is not included in the table below. If it was, the estimate of expenses you paid during the period would be higher, and your ending account value lower, by this amount. In addition, the Fund, as a shareholder in the underlying Fidelity Central Funds, will indirectly bear its pro-rata share of the fees and expenses incurred by the underlying Fidelity Central Funds. These fees and expenses are not included in the Fund's annualized expense ratio used to calculate the expense estimate in the table below.
Hypothetical Example for Comparison Purposes
The second line of the accompanying table provides information about hypothetical account values and hypothetical expenses based on the Fund's actual expense ratio and an assumed rate of return of 5% per year before expenses, which is not the Fund's actual return. The hypothetical account values and expenses may not be used to estimate the actual ending account balance or expenses you paid for the period. You may use this information to compare the ongoing costs of investing in the Fund and other funds. To do so, compare this 5% hypothetical example with the 5% hypothetical examples that appear in the shareholder reports of the other funds. A small balance maintenance fee of $12.00 that is charged once a year may apply for certain accounts with a value of less than $2,000. This fee is not included in the table below. If it was, the estimate of expenses you paid during the period would be higher, and your ending account value lower, by this amount. In addition, the Fund, as a shareholder in the underlying Fidelity Central Funds, will indirectly bear its pro-rata share of the fees and expenses incurred by the underlying Fidelity Central Funds. These fees and expenses are not included in the Fund's annualized expense ratio used to calculate the expense estimate in the table below.
Please note that the expenses shown in the table are meant to highlight your ongoing costs only and do not reflect any transaction costs. Therefore, the second line of the table is useful in comparing ongoing costs only, and will not help you determine the relative total costs of owning different funds.
| Annualized Expense Ratio-A | Beginning Account Value November 1, 2015 | Ending Account Value April 30, 2016 | Expenses Paid During Period-B November 1, 2015 to April 30, 2016 |
|
| Actual | .67% | $1,000.00 | $996.10 | $3.33 |
| Hypothetical-C | $1,000.00 | $1,021.53 | $3.37 |
A Annualized expense ratio reflects expenses net of applicable fee waivers.
B Expenses are equal to the Fund's annualized expense ratio, multiplied by the average account value over the period, multiplied by 182/366 (to reflect the one-half year period).
C 5% return per year before expenses
Distributions (Unaudited)
The Board of Trustees of Fidelity Large Cap Stock Fund voted to pay on June 13, 2016, to shareholders of record at the opening of business on June 10, 2016, a distribution of $0.296 per share derived from capital gains realized from sales of portfolio securities and a dividend of $0.144 per share from net investment income.
The fund hereby designates as a capital gain dividend with respect to the taxable year ended April 30, 2016, $90,603,971, or, if subsequently determined to be different, the net capital gain of such year.
The fund designates 100% of the dividends distributed during the fiscal year as qualifying for the dividends–received deduction for corporate shareholders.
The fund designates 100% of the dividends distributed during the fiscal year as amounts which may be taken into account as a dividend for the purposes of the maximum rate under section 1(h)(11) of the Internal Revenue Code.
The fund will notify shareholders in January 2017 of amounts for use in preparing 2016 income tax returns.
![]()
Corporate Headquarters
245 Summer St.
Boston, MA 02210
www.fidelity.com
LCS-ANN-0616
1.703546.118
|
Fidelity® Series Small Cap Discovery Fund Fidelity® Series Small Cap Discovery Fund Annual Report April 30, 2016 |
|
|
Contents
To view a fund's proxy voting guidelines and proxy voting record for the 12-month period ended June 30, visit http://www.fidelity.com/proxyvotingresults or visit the Securities and Exchange Commission's (SEC) web site at http://www.sec.gov.
You may also call 1-800-544-8544, or for Class F, call 1-800-835-5092, to request a free copy of the proxy voting guidelines.
Standard & Poor's, S&P and S&P 500 are registered service marks of The McGraw-Hill Companies, Inc. and have been licensed for use by Fidelity Distributors Corporation.
Other third-party marks appearing herein are the property of their respective owners.
All other marks appearing herein are registered or unregistered trademarks or service marks of FMR LLC or an affiliated company. © 2016 FMR LLC. All rights reserved.
This report and the financial statements contained herein are submitted for the general information of the shareholders of the Fund. This report is not authorized for distribution to prospective investors in the Fund unless preceded or accompanied by an effective prospectus.
A fund files its complete schedule of portfolio holdings with the SEC for the first and third quarters of each fiscal year on Form N-Q. Forms N-Q are available on the SEC’s web site at http://www.sec.gov. A fund's Forms N-Q may be reviewed and copied at the SEC’s Public Reference Room in Washington, DC. Information regarding the operation of the SEC's Public Reference Room may be obtained by calling 1-800-SEC-0330.
For a complete list of a fund's portfolio holdings, view the most recent holdings listing, semiannual report, or annual report on Fidelity's web site at http://www.fidelity.com, http://www.advisor.fidelity.com, or http://www.401k.com, as applicable.
NOT FDIC INSURED •MAY LOSE VALUE •NO BANK GUARANTEE
Neither the Fund nor Fidelity Distributors Corporation is a bank.
Performance: The Bottom Line
Average annual total return reflects the change in the value of an investment, assuming reinvestment of distributions from dividend income and capital gains (the profits earned upon the sale of securities that have grown in value, if any) and assuming a constant rate of performance each year. The hypothetical investment and the average annual total returns do not reflect the deduction of taxes that a shareholder would pay on fund distributions or the redemption of fund shares. During periods of reimbursement by Fidelity, a fund’s total return will be greater than it would be had the reimbursement not occurred. How a fund did yesterday is no guarantee of how it will do tomorrow.
Average Annual Total Returns
| For the periods ended April 30, 2016 | Past 1 year | Life of fundA |
| Fidelity® Series Small Cap Discovery Fund | (4.82)% | 3.65% |
| Class F | (4.76)% | 3.79% |
A From November 7, 2013
$10,000 Over Life of Fund
Let's say hypothetically that $10,000 was invested in Fidelity® Series Small Cap Discovery Fund, a class of the fund, on November 7, 2013, when the fund started.
The chart shows how the value of your investment would have changed, and also shows how the Russell 2000® Index performed over the same period.

| Period Ending Values | ||
|
| $10,930 | Fidelity® Series Small Cap Discovery Fund |
|
| $10,841 | Russell 2000® Index |
Management's Discussion of Fund Performance
Market Recap: The S&P 500® index gained 1.21% for the year ending April 30, 2016. Largely range-bound until mid-August, U.S. stocks suffered a steep, late-summer decline on concern about an economic slowdown in China. The market recovered in October, lifted by the U.S. Federal Reserve’s decision to delay raising near-term interest rates until mid-December, as well as a rate cut in China and economic stimulus in Europe. But continued oil-price weakness and U.S.-dollar strength pushed the S&P 500® to its worst January since 2009, followed by a volatile but ultimately flattish February, then a sharp rebound in March driven by U.S. jobs gains and perceived softening in the Fed’s rate-tightening posture. April brought minimal change. For the full period, growth-oriented and larger-cap stocks fared better overall than value and smaller-cap complements. Performance was split, as five of 10 sectors gained ground, with a wide gap separating leaders from laggards. Investor demand for more-stable and higher-yielding investments boosted traditionally defensive, dividend-rich groups such as utilities (+14%), telecom services (+10%) and consumer staples (+11%) – the latter also buoyed by rising wages and low inflation. Meanwhile, energy (-14%) foundered amid commodity weakness that also hurt materials (-4%). Comments from Derek Janssen, who became interim Portfolio Manager on March 7, 2016, when Chuck Myers began a six-month leave of absence: For the year, the fund’s share classes delivered declines in the mid-single digits, outpacing the -5.94% return of the benchmark Russell 2000® Index. On a relative basis, stock picking was strong this period, especially in the health care and information technology sectors and, to a lesser extent, consumer staples. In contrast, security selection in financials, consumer discretionary and telecommunication services hampered results. On an individual basis, the fund benefited from stakes in technology resellers Ingram Micro – which was not in the index – and Tech Data. Coming into the period, both companies were being priced as if they would create no or even negative value for shareholders over time – a view we did not share. Both stocks rose off low valuations this period, while Ingram’s share price jumped in February when the company agreed to be acquired. Other relative contributors this period included food and consumer products company Post Holdings and AmSurg, which operates ambulatory surgical centers. On the negative side, asset manager Waddell & Reed returned -55%, as the out-of-benchmark holding faced big challenges including the departure of several key portfolio managers and new federal regulations that I thought threatened the firm’s future profits. I ultimately reduced the fund’s stake. In energy, offshore service providers Tidewater and Hornbeck Offshore Services also detracted.The views expressed above reflect those of the portfolio manager(s) only through the end of the period as stated on the cover of this report and do not necessarily represent the views of Fidelity or any other person in the Fidelity organization. Any such views are subject to change at any time based upon market or other conditions and Fidelity disclaims any responsibility to update such views. These views may not be relied on as investment advice and, because investment decisions for a Fidelity fund are based on numerous factors, may not be relied on as an indication of trading intent on behalf of any Fidelity fund.
Investment Summary (Unaudited)
Top Ten Stocks as of April 30, 2016
| % of fund's net assets | % of fund's net assets 6 months ago | |
| KB Home | 3.3 | 0.0 |
| WESCO International, Inc. | 3.2 | 2.7 |
| Cullen/Frost Bankers, Inc. | 3.0 | 0.0 |
| Aarons, Inc. Class A | 2.9 | 2.1 |
| Meritage Homes Corp. | 2.9 | 2.5 |
| First Citizen Bancshares, Inc. | 2.8 | 2.7 |
| TCF Financial Corp. | 2.7 | 2.6 |
| AmSurg Corp. | 2.6 | 2.5 |
| Tech Data Corp. | 2.6 | 3.0 |
| EnerSys | 2.6 | 2.8 |
| 28.6 |
Top Five Market Sectors as of April 30, 2016
| % of fund's net assets | % of fund's net assets 6 months ago | |
| Financials | 25.3 | 24.8 |
| Industrials | 16.1 | 13.0 |
| Information Technology | 15.7 | 21.6 |
| Consumer Discretionary | 15.1 | 11.0 |
| Health Care | 11.6 | 13.6 |
Asset Allocation (% of fund's net assets)
| As of April 30, 2016 * | ||
| Stocks | 98.8% | |
| Short-Term Investments and Net Other Assets (Liabilities) | 1.2% | |

* Foreign Investments 7.2%
| As of October 31, 2015 * | ||
| Stocks | 98.0% | |
| Short-Term Investments and Net Other Assets (Liabilities) | 2.0% | |

* Foreign Investments 7.9%
Percentages shown as 0.0% may reflect amounts less than 0.05%.
Investments April 30, 2016
Showing Percentage of Net Assets
| Common Stocks - 98.8% | |||
| Shares | Value | ||
| CONSUMER DISCRETIONARY - 15.1% | |||
| Household Durables - 7.5% | |||
| KB Home (a) | 3,750,000 | $50,887,501 | |
| Meritage Homes Corp. (b) | 1,300,000 | 44,239,000 | |
| Taylor Morrison Home Corp. (b) | 1,435,028 | 20,664,403 | |
| 115,790,904 | |||
| Multiline Retail - 1.6% | |||
| Dillard's, Inc. Class A | 350,000 | 24,657,500 | |
| Specialty Retail - 6.0% | |||
| Aarons, Inc. Class A | 1,690,000 | 44,294,900 | |
| Finish Line, Inc. Class A | 900,000 | 17,775,000 | |
| Genesco, Inc. (b) | 431,410 | 29,844,944 | |
| 91,914,844 | |||
| TOTAL CONSUMER DISCRETIONARY | 232,363,248 | ||
| CONSUMER STAPLES - 2.3% | |||
| Food Products - 2.3% | |||
| Post Holdings, Inc. (b) | 500,000 | 35,920,000 | |
| ENERGY - 5.9% | |||
| Energy Equipment & Services - 3.4% | |||
| Hornbeck Offshore Services, Inc. (a)(b) | 965,000 | 11,329,100 | |
| Oil States International, Inc. (b) | 570,900 | 19,775,976 | |
| Tidewater, Inc. (a)(c) | 2,370,000 | 20,761,200 | |
| 51,866,276 | |||
| Oil, Gas & Consumable Fuels - 2.5% | |||
| Northern Oil & Gas, Inc. (a)(b) | 2,950,000 | 16,107,000 | |
| World Fuel Services Corp. | 500,000 | 23,365,000 | |
| 39,472,000 | |||
| TOTAL ENERGY | 91,338,276 | ||
| FINANCIALS - 25.3% | |||
| Banks - 13.9% | |||
| Associated Banc-Corp. | 1,497,500 | 27,314,400 | |
| BOK Financial Corp. (a) | 500,000 | 30,090,000 | |
| Cullen/Frost Bankers, Inc. (a) | 725,000 | 46,392,750 | |
| First Citizen Bancshares, Inc. | 166,738 | 42,518,190 | |
| Hilltop Holdings, Inc. (b) | 572,249 | 11,364,865 | |
| PacWest Bancorp | 400,000 | 15,992,000 | |
| TCF Financial Corp. | 3,000,000 | 40,920,000 | |
| 214,592,205 | |||
| Capital Markets - 6.3% | |||
| Federated Investors, Inc. Class B (non-vtg.) | 1,200,000 | 37,920,000 | |
| Monex Group, Inc. | 8,062,200 | 20,798,203 | |
| OM Asset Management Ltd. | 2,100,000 | 28,182,000 | |
| Waddell & Reed Financial, Inc. Class A | 500,000 | 10,170,000 | |
| 97,070,203 | |||
| Insurance - 2.1% | |||
| Aspen Insurance Holdings Ltd. | 700,600 | 32,472,810 | |
| Real Estate Investment Trusts - 1.1% | |||
| Franklin Street Properties Corp. | 800,000 | 8,496,000 | |
| Store Capital Corp. | 349,363 | 8,968,148 | |
| 17,464,148 | |||
| Thrifts & Mortgage Finance - 1.9% | |||
| Washington Federal, Inc. | 1,182,100 | 28,713,209 | |
| TOTAL FINANCIALS | 390,312,575 | ||
| HEALTH CARE - 11.6% | |||
| Health Care Equipment & Supplies - 2.8% | |||
| Hill-Rom Holdings, Inc. | 600,000 | 29,010,000 | |
| Integra LifeSciences Holdings Corp. (b) | 200,000 | 14,164,000 | |
| 43,174,000 | |||
| Health Care Providers & Services - 7.1% | |||
| AmSurg Corp. (b) | 500,000 | 40,490,000 | |
| Civitas Solutions, Inc. (b) | 1,686,652 | 33,800,506 | |
| Team Health Holdings, Inc. (b) | 850,000 | 35,555,500 | |
| 109,846,006 | |||
| Pharmaceuticals - 1.7% | |||
| Innoviva, Inc. (a) | 2,171,139 | 26,791,855 | |
| TOTAL HEALTH CARE | 179,811,861 | ||
| INDUSTRIALS - 16.1% | |||
| Aerospace & Defense - 0.8% | |||
| Engility Holdings, Inc. (b) | 667,840 | 13,136,413 | |
| Commercial Services & Supplies - 3.2% | |||
| Essendant, Inc. | 579,800 | 17,852,042 | |
| HNI Corp. | 350,000 | 15,302,000 | |
| Knoll, Inc. | 670,200 | 15,649,170 | |
| 48,803,212 | |||
| Electrical Equipment - 2.6% | |||
| EnerSys | 675,000 | 39,399,750 | |
| Machinery - 2.7% | |||
| Columbus McKinnon Corp. (NY Shares) | 90,923 | 1,501,139 | |
| Hillenbrand, Inc. | 480,000 | 14,548,800 | |
| Mueller Industries, Inc. | 800,000 | 25,248,000 | |
| 41,297,939 | |||
| Professional Services - 1.3% | |||
| FTI Consulting, Inc. (b) | 500,000 | 20,150,000 | |
| Road & Rail - 2.3% | |||
| Genesee & Wyoming, Inc. Class A (b) | 178,212 | 11,603,383 | |
| Swift Transporation Co. (a)(b) | 1,475,000 | 24,514,500 | |
| 36,117,883 | |||
| Trading Companies & Distributors - 3.2% | |||
| WESCO International, Inc. (a)(b) | 852,430 | 50,114,360 | |
| TOTAL INDUSTRIALS | 249,019,557 | ||
| INFORMATION TECHNOLOGY - 15.7% | |||
| Electronic Equipment & Components - 6.3% | |||
| Ingram Micro, Inc. Class A | 1,100,000 | 38,445,000 | |
| SYNNEX Corp. | 239,900 | 19,808,543 | |
| Tech Data Corp. (b) | 575,000 | 39,496,750 | |
| 97,750,293 | |||
| Internet Software & Services - 6.0% | |||
| Blucora, Inc. (b) | 1,212,689 | 9,713,639 | |
| Cimpress NV (b) | 350,000 | 30,754,500 | |
| j2 Global, Inc. | 550,000 | 34,936,000 | |
| Monster Worldwide, Inc. (b)(c) | 5,500,000 | 17,600,000 | |
| 93,004,139 | |||
| IT Services - 2.7% | |||
| Booz Allen Hamilton Holding Corp. Class A | 450,000 | 12,406,500 | |
| CACI International, Inc. Class A (b) | 300,000 | 28,845,000 | |
| 41,251,500 | |||
| Software - 0.7% | |||
| SS&C Technologies Holdings, Inc. | 175,000 | 10,701,250 | |
| TOTAL INFORMATION TECHNOLOGY | 242,707,182 | ||
| MATERIALS - 5.6% | |||
| Containers & Packaging - 1.8% | |||
| Silgan Holdings, Inc. | 550,000 | 27,907,000 | |
| Metals & Mining - 3.8% | |||
| Carpenter Technology Corp. | 912,092 | 32,297,178 | |
| Compass Minerals International, Inc. | 200,000 | 14,992,000 | |
| Haynes International, Inc. | 300,000 | 11,259,000 | |
| 58,548,178 | |||
| TOTAL MATERIALS | 86,455,178 | ||
| UTILITIES - 1.2% | |||
| Gas Utilities - 1.2% | |||
| Southwest Gas Corp. | 289,100 | 18,765,481 | |
| TOTAL COMMON STOCKS | |||
| (Cost $1,467,695,189) | 1,526,693,358 | ||
| Money Market Funds - 9.0% | |||
| Fidelity Cash Central Fund, 0.38% (d) | 11,600,136 | 11,600,136 | |
| Fidelity Securities Lending Cash Central Fund, 0.42% (d)(e) | 126,566,371 | 126,566,371 | |
| TOTAL MONEY MARKET FUNDS | |||
| (Cost $138,166,507) | 138,166,507 | ||
| TOTAL INVESTMENT PORTFOLIO - 107.8% | |||
| (Cost $1,605,861,696) | 1,664,859,865 | ||
| NET OTHER ASSETS (LIABILITIES) - (7.8)% | (120,229,683) | ||
| NET ASSETS - 100% | $1,544,630,182 |
Legend
(a) Security or a portion of the security is on loan at period end.
(b) Non-income producing
(c) Affiliated company
(d) Affiliated fund that is generally available only to investment companies and other accounts managed by Fidelity Investments. The rate quoted is the annualized seven-day yield of the fund at period end. A complete unaudited listing of the fund's holdings as of its most recent quarter end is available upon request. In addition, each Fidelity Central Fund's financial statements, which are not covered by the Fund's Report of Independent Registered Public Accounting Firm, are available on the SEC's website or upon request.
(e) Investment made with cash collateral received from securities on loan.
Affiliated Central Funds
Information regarding fiscal year to date income earned by the Fund from investments in Fidelity Central Funds is as follows:
| Fund | Income earned |
| Fidelity Cash Central Fund | $66,643 |
| Fidelity Securities Lending Cash Central Fund | 970,716 |
| Total | $1,037,359 |
Other Affiliated Issuers
An affiliated company is a company in which the Fund has ownership of at least 5% of the voting securities. Fiscal year to date transactions with companies which are or were affiliates are as follows:
| Affiliate | Value, beginning of period | Purchases | Sales Proceeds | Dividend Income | Value, end of period |
| Blucora, Inc. | $28,023,500 | $-- | $9,266,145 | $-- | $-- |
| Monster Worldwide, Inc. | 17,081,000 | 16,521,348 | -- | -- | 17,600,000 |
| Tidewater, Inc. | -- | 40,853,696 | -- | 904,760 | 20,761,200 |
| Total | $45,104,500 | $57,375,044 | $9,266,145 | $904,760 | $38,361,200 |
Investment Valuation
The following is a summary of the inputs used, as of April 30, 2016, involving the Fund's assets and liabilities carried at fair value. The inputs or methodology used for valuing securities may not be an indication of the risk associated with investing in those securities. For more information on valuation inputs, and their aggregation into the levels used below, please refer to the Investment Valuation section in the accompanying Notes to Financial Statements.
| Valuation Inputs at Reporting Date: | ||||
| Description | Total | Level 1 | Level 2 | Level 3 |
| Investments in Securities: | ||||
| Equities: | ||||
| Consumer Discretionary | $232,363,248 | $232,363,248 | $-- | $-- |
| Consumer Staples | 35,920,000 | 35,920,000 | -- | -- |
| Energy | 91,338,276 | 91,338,276 | -- | -- |
| Financials | 390,312,575 | 369,514,372 | 20,798,203 | -- |
| Health Care | 179,811,861 | 179,811,861 | -- | -- |
| Industrials | 249,019,557 | 249,019,557 | -- | -- |
| Information Technology | 242,707,182 | 242,707,182 | -- | -- |
| Materials | 86,455,178 | 86,455,178 | -- | -- |
| Utilities | 18,765,481 | 18,765,481 | -- | -- |
| Money Market Funds | 138,166,507 | 138,166,507 | -- | -- |
| Total Investments in Securities: | $1,664,859,865 | $1,644,061,662 | $20,798,203 | $-- |
See accompanying notes which are an integral part of the financial statements.
Financial Statements
Statement of Assets and Liabilities
| April 30, 2016 | ||
| Assets | ||
| Investment in securities, at value (including securities loaned of $123,263,445) — See accompanying schedule: Unaffiliated issuers (cost $1,391,199,371) | $1,488,332,158 | |
| Fidelity Central Funds (cost $138,166,507) | 138,166,507 | |
| Other affiliated issuers (cost $76,495,818) | 38,361,200 | |
| Total Investments (cost $1,605,861,696) | $1,664,859,865 | |
| Receivable for investments sold | 28,967,183 | |
| Receivable for fund shares sold | 548 | |
| Dividends receivable | 1,032,126 | |
| Distributions receivable from Fidelity Central Funds | 161,215 | |
| Prepaid expenses | 994 | |
| Other receivables | 13,119 | |
| Total assets | 1,695,035,050 | |
| Liabilities | ||
| Payable for investments purchased | $298,219 | |
| Payable for fund shares redeemed | 22,377,816 | |
| Accrued management fee | 993,375 | |
| Other affiliated payables | 121,179 | |
| Other payables and accrued expenses | 47,908 | |
| Collateral on securities loaned, at value | 126,566,371 | |
| Total liabilities | 150,404,868 | |
| Net Assets | $1,544,630,182 | |
| Net Assets consist of: | ||
| Paid in capital | $1,522,094,343 | |
| Undistributed net investment income | 2,083,310 | |
| Accumulated undistributed net realized gain (loss) on investments and foreign currency transactions | (38,555,470) | |
| Net unrealized appreciation (depreciation) on investments and assets and liabilities in foreign currencies | 59,007,999 | |
| Net Assets | $1,544,630,182 | |
| Series Small Cap Discovery: | ||
| Net Asset Value, offering price and redemption price per share ($614,362,165 ÷ 60,487,711 shares) | $10.16 | |
| Class F: | ||
| Net Asset Value, offering price and redemption price per share ($930,268,017 ÷ 91,522,362 shares) | $10.16 |
See accompanying notes which are an integral part of the financial statements.
Statement of Operations
| Year ended April 30, 2016 | ||
| Investment Income | ||
| Dividends (including $904,760 earned from other affiliated issuers) | $18,261,133 | |
| Interest | 10 | |
| Income from Fidelity Central Funds (including $970,716 from security lending) | 1,037,359 | |
| Total income | 19,298,502 | |
| Expenses | ||
| Management fee | ||
| Basic fee | $10,904,835 | |
| Performance adjustment | 885,673 | |
| Transfer agent fees | 1,007,773 | |
| Accounting and security lending fees | 495,088 | |
| Custodian fees and expenses | 31,295 | |
| Independent trustees' compensation | 6,935 | |
| Audit | 57,310 | |
| Legal | 3,792 | |
| Miscellaneous | 11,261 | |
| Total expenses before reductions | 13,403,962 | |
| Expense reductions | (85,639) | 13,318,323 |
| Net investment income (loss) | 5,980,179 | |
| Realized and Unrealized Gain (Loss) | ||
| Net realized gain (loss) on: | ||
| Investment securities: | ||
| Unaffiliated issuers | 3,960,754 | |
| Other affiliated issuers | (15,255,149) | |
| Foreign currency transactions | (23,401) | |
| Total net realized gain (loss) | (11,317,796) | |
| Change in net unrealized appreciation (depreciation) on: Investment securities | (70,743,355) | |
| Assets and liabilities in foreign currencies | 10,961 | |
| Total change in net unrealized appreciation (depreciation) | (70,732,394) | |
| Net gain (loss) | (82,050,190) | |
| Net increase (decrease) in net assets resulting from operations | $(76,070,011) |
See accompanying notes which are an integral part of the financial statements.
Statement of Changes in Net Assets
| Year ended April 30, 2016 | Year ended April 30, 2015 | |
| Increase (Decrease) in Net Assets | ||
| Operations | ||
| Net investment income (loss) | $5,980,179 | $3,960,517 |
| Net realized gain (loss) | (11,317,796) | 65,292,674 |
| Change in net unrealized appreciation (depreciation) | (70,732,394) | 122,927,137 |
| Net increase (decrease) in net assets resulting from operations | (76,070,011) | 192,180,328 |
| Distributions to shareholders from net investment income | (4,499,268) | (4,193,249) |
| Distributions to shareholders from net realized gain | (78,812,351) | (28,817,135) |
| Total distributions | (83,311,619) | (33,010,384) |
| Share transactions - net increase (decrease) | 76,957,414 | 101,063,004 |
| Total increase (decrease) in net assets | (82,424,216) | 260,232,948 |
| Net Assets | ||
| Beginning of period | 1,627,054,398 | 1,366,821,450 |
| End of period (including undistributed net investment income of $2,083,310 and undistributed net investment income of $1,090,532, respectively) | $1,544,630,182 | $1,627,054,398 |
See accompanying notes which are an integral part of the financial statements.
Financial Highlights — Series Small Cap Discovery
| Years ended April 30, | 2016 | 2015 | 2014 A |
| Selected Per–Share Data | |||
| Net asset value, beginning of period | $11.23 | $10.16 | $10.00 |
| Income from Investment Operations | |||
| Net investment income (loss)B | .03 | .02 | .02 |
| Net realized and unrealized gain (loss) | (.54) | 1.28 | .15 |
| Total from investment operations | (.51) | 1.30 | .17 |
| Distributions from net investment income | (.02) | (.02) | (.01) |
| Distributions from net realized gain | (.54) | (.21) | – |
| Total distributions | (.56) | (.23) | (.01) |
| Net asset value, end of period | $10.16 | $11.23 | $10.16 |
| Total ReturnC,D | (4.82)% | 12.92% | 1.70% |
| Ratios to Average Net AssetsE,F | |||
| Expenses before reductions | .96% | .97% | .97%G |
| Expenses net of fee waivers, if any | .96% | .97% | .97%G |
| Expenses net of all reductions | .95% | .97% | .96%G |
| Net investment income (loss) | .29% | .17% | .35%G |
| Supplemental Data | |||
| Net assets, end of period (000 omitted) | $614,362 | $659,747 | $572,515 |
| Portfolio turnover rateH | 35% | 28% | 29%I,J |
A For the period November 7, 2013 (commencement of operations) to April 30, 2014.
B Calculated based on average shares outstanding during the period.
C Total returns for periods of less than one year are not annualized.
D Total returns would have been lower if certain expenses had not been reduced during the applicable periods shown.
E Fees and expenses of any underlying Fidelity Central Funds are not included in the Fund's expense ratio. The Fund indirectly bears its proportionate share of the expenses of any underlying Fidelity Central Funds.
F Expense ratios reflect operating expenses of the class. Expenses before reductions do not reflect amounts reimbursed by the investment adviser or reductions from brokerage service arrangements or reductions from other expense offset arrangements and do not represent the amount paid by the class during periods when reimbursements or reductions occur. Expense ratios before reductions for start-up periods may not be representative of longer-term operating periods. Expenses net of fee waivers reflect expenses after reimbursement by the investment adviser but prior to reductions from brokerage service arrangements or other expense offset arrangements. Expenses net of all reductions represent the net expenses paid by the class.
G Annualized
H Amount does not include the portfolio activity of any underlying Fidelity Central Funds.
I Portfolio turnover rate excludes securities received or delivered in-kind.
J Amount not annualized.
See accompanying notes which are an integral part of the financial statements.
Financial Highlights — Fidelity Series Small Cap Discovery Fund Class F
| Years ended April 30, | 2016 | 2015 | 2014 A |
| Selected Per–Share Data | |||
| Net asset value, beginning of period | $11.24 | $10.16 | $10.00 |
| Income from Investment Operations | |||
| Net investment income (loss)B | .05 | .04 | .03 |
| Net realized and unrealized gain (loss) | (.56) | 1.28 | .14 |
| Total from investment operations | (.51) | 1.32 | .17 |
| Distributions from net investment income | (.04) | (.04) | (.01) |
| Distributions from net realized gain | (.54) | (.21) | – |
| Total distributions | (.57)C | (.24)D | (.01) |
| Net asset value, end of period | $10.16 | $11.24 | $10.16 |
| Total ReturnE,F | (4.76)% | 13.19% | 1.73% |
| Ratios to Average Net AssetsG,H | |||
| Expenses before reductions | .80% | .80% | .79%I |
| Expenses net of fee waivers, if any | .80% | .80% | .79%I |
| Expenses net of all reductions | .79% | .80% | .79%I |
| Net investment income (loss) | .45% | .33% | .52%I |
| Supplemental Data | |||
| Net assets, end of period (000 omitted) | $930,268 | $967,308 | $794,307 |
| Portfolio turnover rateJ | 35% | 28% | 29%K,L |
A For the period November 7, 2013 (commencement of operations) to April 30, 2014.
B Calculated based on average shares outstanding during the period.
C Total distributions of $.57 per share is comprised of distributions from net investment income of $.037 and distributions from net realized gain of $.536 per share.
D Total distributions of $.24 per share is comprised of distributions from net investment income of $.036 and distributions from net realized gain of $.206 per share.
E Total returns for periods of less than one year are not annualized.
F Total returns would have been lower if certain expenses had not been reduced during the applicable periods shown.
G Fees and expenses of any underlying Fidelity Central Funds are not included in the Fund's expense ratio. The Fund indirectly bears its proportionate share of the expenses of any underlying Fidelity Central Funds.
H Expense ratios reflect operating expenses of the class. Expenses before reductions do not reflect amounts reimbursed by the investment adviser or reductions from brokerage service arrangements or reductions from other expense offset arrangements and do not represent the amount paid by the class during periods when reimbursements or reductions occur. Expense ratios before reductions for start-up periods may not be representative of longer-term operating periods. Expenses net of fee waivers reflect expenses after reimbursement by the investment adviser but prior to reductions from brokerage service arrangements or other expense offset arrangements. Expenses net of all reductions represent the net expenses paid by the class.
I Annualized
J Amount does not include the portfolio activity of any underlying Fidelity Central Funds.
K Portfolio turnover rate excludes securities received or delivered in-kind.
L Amount not annualized.
See accompanying notes which are an integral part of the financial statements.
Notes to Financial Statements
For the period ended April 30, 2016
1. Organization.
Fidelity Series Small Cap Discovery Fund (the Fund) is a fund of Fidelity Commonwealth Trust (the Trust) and is authorized to issue an unlimited number of shares. Shares of the Fund are only available for purchase by mutual funds for which Fidelity Management & Research Company (FMR) or an affiliate serves as an investment manager. The Trust is registered under the Investment Company Act of 1940, as amended (the 1940 Act), as an open-end management investment company organized as a Massachusetts business trust. The Fund offers Series Small Cap Discovery and Class F shares, each of which has equal rights as to assets and voting privileges. Each class has exclusive voting rights with respect to matters that affect that class.
2. Investments in Fidelity Central Funds.
The Fund invests in Fidelity Central Funds, which are open-end investment companies generally available only to other investment companies and accounts managed by the investment adviser and its affiliates. The Fund's Schedule of Investments lists each of the Fidelity Central Funds held as of period end, if any, as an investment of the Fund, but does not include the underlying holdings of each Fidelity Central Fund. As an Investing Fund, the Fund indirectly bears its proportionate share of the expenses of the underlying Fidelity Central Funds.
The Money Market Central Funds seek preservation of capital and current income and are managed by Fidelity Investments Money Management, Inc. (FIMM), an affiliate of the investment adviser. Annualized expenses of the Money Market Central Funds as of their most recent shareholder report date are less than .005%.
A complete unaudited list of holdings for each Fidelity Central Fund is available upon request or at the Securities and Exchange Commission (the SEC) website at www.sec.gov. In addition, the financial statements of the Fidelity Central Funds, which are not covered by the Fund's Report of Independent Registered Public Accounting Firm, are available on the SEC website or upon request.
3. Significant Accounting Policies.
The financial statements have been prepared in conformity with accounting principles generally accepted in the United States of America (GAAP), which require management to make certain estimates and assumptions at the date of the financial statements. Actual results could differ from those estimates. Subsequent events, if any, through the date that the financial statements were issued have been evaluated in the preparation of the financial statements. The following summarizes the significant accounting policies of the Fund:
Investment Valuation. Investments are valued as of 4:00 p.m. Eastern time on the last calendar day of the period. The Board of Trustees (the Board) has delegated the day to day responsibility for the valuation of the Fund's investments to the FMR Fair Value Committee (the Committee). In accordance with valuation policies and procedures approved by the Board, the Fund attempts to obtain prices from one or more third party pricing vendors or brokers to value its investments. When current market prices, quotations or currency exchange rates are not readily available or reliable, investments will be fair valued in good faith by the Committee, in accordance with procedures adopted by the Board. Factors used in determining fair value vary by investment type and may include market or investment specific events. The frequency with which these procedures are used cannot be predicted and they may be utilized to a significant extent. The Committee oversees the Fund's valuation policies and procedures and reports to the Board on the Committee's activities and fair value determinations. The Board monitors the appropriateness of the procedures used in valuing the Fund's investments and ratifies the fair value determinations of the Committee.
The Fund categorizes the inputs to valuation techniques used to value its investments into a disclosure hierarchy consisting of three levels as shown below:
- Level 1 – quoted prices in active markets for identical investments
- Level 2 – other significant observable inputs (including quoted prices for similar investments, interest rates, prepayment speeds, etc.)
- Level 3 – unobservable inputs (including the Fund's own assumptions based on the best information available)
Valuation techniques used to value the Fund's investments by major category are as follows:
Equity securities, including restricted securities, for which market quotations are readily available, are valued at the last reported sale price or official closing price as reported by a third party pricing vendor on the primary market or exchange on which they are traded and are categorized as Level 1 in the hierarchy. In the event there were no sales during the day or closing prices are not available, securities are valued at the last quoted bid price or may be valued using the last available price and are generally categorized as Level 2 in the hierarchy. For foreign equity securities, when market or security specific events arise, comparisons to the valuation of American Depositary Receipts (ADRs), futures contracts, Exchange-Traded Funds (ETFs) and certain indexes as well as quoted prices for similar securities may be used and would be categorized as Level 2 in the hierarchy. Utilizing these techniques may result in transfers between Level 1 and Level 2. For equity securities, including restricted securities, where observable inputs are limited, assumptions about market activity and risk are used and these securities may be categorized as Level 3 in the hierarchy.
Investments in open-end mutual funds , including the Fidelity Central Funds, are valued at their closing net asset value (NAV) each business day and are categorized as Level 1 in the hierarchy.
Changes in valuation techniques may result in transfers in or out of an assigned level within the disclosure hierarchy. The aggregate value of investments by input level as of April 30, 2016, is included at the end of the Fund's Schedule of Investments.
Foreign Currency. The Fund may use foreign currency contracts to facilitate transactions in foreign-denominated securities. Gains and losses from these transactions may arise from changes in the value of the foreign currency or if the counterparties do not perform under the contracts' terms.
Foreign-denominated assets, including investment securities, and liabilities are translated into U.S. dollars at the exchange rates at period end. Purchases and sales of investment securities, income and dividends received and expenses denominated in foreign currencies are translated into U.S. dollars at the exchange rate in effect on the transaction date.
The effects of exchange rate fluctuations on investments are included with the net realized and unrealized gain (loss) on investment securities. Other foreign currency transactions resulting in realized and unrealized gain (loss) are disclosed separately.
Investment Transactions and Income. For financial reporting purposes, the Fund's investment holdings and NAV include trades executed through the end of the last business day of the period. The NAV per share for processing shareholder transactions is calculated as of the close of business of the New York Stock Exchange (NYSE), normally 4:00 p.m. Eastern time and includes trades executed through the end of the prior business day. Gains and losses on securities sold are determined on the basis of identified cost. Dividend income is recorded on the ex-dividend date, except for certain dividends from foreign securities where the ex-dividend date may have passed, which are recorded as soon as the Fund is informed of the ex-dividend date. Non-cash dividends included in dividend income, if any, are recorded at the fair market value of the securities received. Income and capital gain distributions from Fidelity Central Funds, if any, are recorded on the ex-dividend date. Distributions received on securities that represent a return of capital or capital gain are recorded as a reduction of cost of investments and/or as a realized gain. Subsequent to ex-dividend date the Fund determines the components of these distributions, based upon receipt of tax filings or other correspondence relating to the underlying investment. Interest income is accrued as earned and includes coupon interest and amortization of premium and accretion of discount on debt securities as applicable. Investment income is recorded net of foreign taxes withheld where recovery of such taxes is uncertain.
Class Allocations and Expenses. Investment income, realized and unrealized capital gains and losses, common expenses of the Fund, and certain fund-level expense reductions, if any, are allocated daily on a pro-rata basis to each class based on the relative net assets of each class to the total net assets of the Fund. Each class differs with respect to transfer agent fees incurred. Certain expense reductions may also differ by class. For the reporting period, the allocated portion of income and expenses to each class as a percent of its average net assets may vary due to the timing of recording these transactions in relation to fluctuating net assets of the classes. Expenses directly attributable to a fund are charged to that fund. Expenses attributable to more than one fund are allocated among the respective funds on the basis of relative net assets or other appropriate methods. Expense estimates are accrued in the period to which they relate and adjustments are made when actual amounts are known.
Income Tax Information and Distributions to Shareholders. Each year, the Fund intends to qualify as a regulated investment company under Subchapter M of the Internal Revenue Code, including distributing substantially all of its taxable income and realized gains. As a result, no provision for U.S. Federal income taxes is required. As of April 30, 2016, the Fund did not have any unrecognized tax benefits in the financial statements; nor is the Fund aware of any tax positions for which it is reasonably possible that the total amounts of unrecognized tax benefits will significantly change in the next twelve months. The Fund files a U.S. federal tax return, in addition to state and local tax returns as required. The Fund's federal income tax returns are subject to examination by the Internal Revenue Service (IRS) for a period of three fiscal years after they are filed. State and local tax returns may be subject to examination for an additional fiscal year depending on the jurisdiction. Foreign taxes are provided for based on the Fund's understanding of the tax rules and rates that exist in the foreign markets in which it invests.
Distributions are declared and recorded on the ex-dividend date. Income dividends and capital gain distributions are declared separately for each class. Income and capital gain distributions are determined in accordance with income tax regulations, which may differ from GAAP.
Capital accounts within the financial statements are adjusted for permanent book-tax differences. These adjustments have no impact on net assets or the results of operations. Capital accounts are not adjusted for temporary book-tax differences which will reverse in a subsequent period.
Book-tax differences are primarily due to foreign currency transactions, passive foreign investment companies (PFIC) and losses deferred due to wash sales and excise tax regulations.
The federal tax cost of investment securities and unrealized appreciation (depreciation) as of period end were as follows:
| Gross unrealized appreciation | $213,319,873 |
| Gross unrealized depreciation | (154,607,328) |
| Net unrealized appreciation (depreciation) on securities | $58,712,545 |
| Tax Cost | $1,606,147,320 |
The tax-based components of distributable earnings as of period end were as follows:
| Undistributed ordinary income | $2,083,308 |
| Net unrealized appreciation (depreciation) on securities and other investments | $58,722,375 |
The Fund intends to elect to defer to its next fiscal year $38,269,847 of capital losses realized during the period November 1, 2015 to April 30, 2016.
The tax character of distributions paid was as follows:
| April 30, 2016 | April 30, 2015 | |
| Ordinary Income | $14,035,298 | $ 33,010,384 |
| Long-term Capital Gains | 69,276,321 | - |
| Total | $83,311,619 | $ 33,010,384 |
4. Purchases and Sales of Investments.
Purchases and sales of securities, other than short-term securities, aggregated $527,408,635 and $537,025,685, respectively.
5. Fees and Other Transactions with Affiliates.
Management Fee. Fidelity Management & Research Company (the investment adviser) and its affiliates provide the Fund with investment management related services for which the Fund pays a monthly management fee. The management fee is the sum of an individual fund fee rate that is based on an annual rate of .45% of the Fund's average net assets and an annualized group fee rate that averaged .25% during the period. The group fee rate is based upon the average net assets of all the mutual funds advised by the investment adviser, including any mutual funds previously advised by the investment adviser that are currently advised by Fidelity SelectCo, LLC, an affiliate of the investment adviser. The group fee rate decreases as assets under management increase and increases as assets under management decrease. In addition, the management fee is subject to a performance adjustment (up to a maximum of +/- .20% of the Fund's average net assets over a 36 month performance period). The upward or downward adjustment to the management fee is based on the relative investment performance of Series Small Cap Discovery as compared to its benchmark index, the Russell 2000 Index, over the same 36 month performance period. Under the management contract, effective December 1, 2013 the management fee was increased for a transitional management fee adjustment equal to $67,300 per month. This transitional management fee adjustment remained in place through May 31, 2015, and was discontinued effective June 1, 2015. For the reporting period, the total annual management fee rate, including the performance adjustment, was .76% of the Fund's average net assets. The performance adjustment included in the management fee rate may be higher or lower than the maximum performance adjustment rate due to the difference between the average net assets for the reporting and performance periods.
Transfer Agent Fees. Fidelity Investments Institutional Operations Company, Inc., (FIIOC), an affiliate of the investment adviser, is the transfer, dividend disbursing and shareholder servicing agent for each class of the Fund. FIIOC receives account fees and asset-based fees that vary according to the account size and type of account of the shareholders of Series Small Cap Discovery. FIIOC receives no fees for providing transfer agency services to Class F. FIIOC pays for typesetting, printing and mailing of shareholder reports, except proxy statements.
For the period, transfer agent fees for each applicable class were as follows:
| Amount | % of Class-Level Average Net Assets |
|
| Series Small Cap Discovery | $1,007,773 | .16 |
Accounting and Security Lending Fees. Fidelity Service Company, Inc. (FSC), an affiliate of the investment adviser, maintains the Fund's accounting records. The accounting fee is based on the level of average net assets for each month. Under a separate contract, FSC administers the security lending program. The security lending fee is based on the number and duration of lending transactions.
Brokerage Commissions. The Fund placed a portion of its portfolio transactions with brokerage firms which are affiliates of the investment adviser. Brokerage commissions are included in net realized gain (loss) and change in net unrealized appreciation (depreciation) in the Statement of Operations. The commissions paid to these affiliated firms were $21,833 for the period.
Interfund Trades. The Fund may purchase from or sell securities to other Fidelity Funds under procedures adopted by the Board. The procedures have been designed to ensure these interfund trades are executed in accordance with Rule 17a-7 of the 1940 Act. Interfund trades are included within the respective purchases and sales amounts shown in the Purchases and Sales of Investments note.
6. Committed Line of Credit.
The Fund participates with other funds managed by the investment adviser or an affiliate in a $4.25 billion credit facility (the "line of credit") to be utilized for temporary or emergency purposes to fund shareholder redemptions or for other short-term liquidity purposes. The Fund has agreed to pay commitment fees on its pro-rata portion of the line of credit, which amounted to $2,347 and is reflected in Miscellaneous expenses on the Statement of Operations. During the period, the Fund did not borrow on this line of credit.
7. Security Lending.
The Fund lends portfolio securities through a lending agent from time to time in order to earn additional income. For equity securities, a lending agent is used and may loan securities to certain qualified borrowers, including Fidelity Capital Markets (FCM), a broker-dealer affiliated with the Fund. On the settlement date of the loan, the Fund receives collateral (in the form of U.S. Treasury obligations, letters of credit and/or cash) against the loaned securities and maintains collateral in an amount not less than 100% of the market value of the loaned securities during the period of the loan. The market value of the loaned securities is determined at the close of business of the Fund and any additional required collateral is delivered to the Fund on the next business day. The Fund or borrower may terminate the loan at any time, and if the borrower defaults on its obligation to return the securities loaned because of insolvency or other reasons, the Fund may apply collateral received from the borrower against the obligation. The Fund may experience delays and costs in recovering the securities loaned. Any cash collateral received is invested in the Fidelity Securities Lending Cash Central Fund. The value of loaned securities and cash collateral at period end are disclosed on the Fund's Statement of Assets and Liabilities. Security lending income represents the income earned on investing cash collateral, less rebates paid to borrowers and any lending agent fees associated with the loan, plus any premium payments received for lending certain types of securities. Security lending income is presented in the Statement of Operations as a component of income from Fidelity Central Funds. During the period, there were no securities loaned to FCM.
8. Expense Reductions.
Commissions paid to certain brokers with whom the investment adviser, or its affiliates, places trades on behalf of the Fund include an amount in addition to trade execution, which may be rebated back to the Fund to offset certain expenses. This amount totaled $64,433 for the period. In addition, through arrangements with the Fund's custodian, credits realized as a result of certain uninvested cash balances were used to reduce the Fund's expenses. During the period, these credits reduced the Fund's custody expenses by $101.
In addition, during the period the investment adviser reimbursed and/or waived a portion of fund-level operating expenses in the amount of $12,077 and a portion of class-level operating expenses as follows:
| Amount | |
| Series Small Cap Discovery | $9,028 |
9. Distributions to Shareholders.
Distributions to shareholders of each class were as follows:
| 2016 | 2015 | |
| Years ended April 30,
From net investment income | ||
| Series Small Cap Discovery | $1,196,911 | $1,167,797 |
| Class F | 3,302,357 | 3,025,452 |
| Total | $4,499,268 | $4,193,249 |
| From net realized gain | ||
| Series Small Cap Discovery | $31,931,177 | $11,858,296 |
| Class F | 46,881,174 | 16,958,839 |
| Total | $78,812,351 | $28,817,135 |
10. Share Transactions.
Transactions for each class of shares were as follows:
| Shares | Shares | Dollars | Dollars | |
| Years ended
April 30, | 2016 | 2015 | 2016 | 2015 |
| Series Small Cap Discovery | ||||
| Shares sold | 6,809,741 | 9,694,971 | $70,648,062 | $99,780,926 |
| Reinvestment of distributions | 3,063,716 | 1,236,499 | 33,128,088 | 13,026,093 |
| Shares redeemed | (8,142,224) | (8,546,876) | (84,403,016) | (90,168,863) |
| Net increase (decrease) | 1,731,233 | 2,384,594 | $19,373,134 | $22,638,156 |
| Class F | ||||
| Shares sold | 15,260,748 | 18,439,706 | $155,435,426 | $190,886,537 |
| Reinvestment of distributions | 4,647,653 | 1,896,749 | 50,183,531 | 19,984,291 |
| Shares redeemed | (14,474,366) | (12,417,441) | (148,034,677) | (132,445,980) |
| Net increase decrease) | 5,434,035 | 7,919,014 | $57,584,280 | $78,424,848 |
11. Other.
The Fund's organizational documents provide former and current trustees and officers with a limited indemnification against liabilities arising in connection with the performance of their duties to the Fund. In the normal course of business, the Fund may also enter into contracts that provide general indemnifications. The Fund's maximum exposure under these arrangements is unknown as this would be dependent on future claims that may be made against the Fund. The risk of material loss from such claims is considered remote.
At the end of the period, mutual funds managed by the investment adviser or its affiliates were the owners of record of all of the outstanding shares of the fund.
Report of Independent Registered Public Accounting Firm
To the Trustees of Fidelity Commonwealth Trust and Shareholders of Fidelity Series Small Cap Discovery Fund:
We have audited the accompanying statement of assets and liabilities of Fidelity Series Small Cap Discovery Fund (the Fund), a fund of Fidelity Commonwealth Trust, including the schedule of investments, as of April 30, 2016, and the related statement of operations for the year then ended, the statement of changes in net assets for each of the two years in the period then ended, and the financial highlights for each of the two years in the period then ended and for the period November 7, 2013 (commencement of operations) to April 30, 2014. These financial statements and financial highlights are the responsibility of the Fund's management. Our responsibility is to express an opinion on these financial statements and financial highlights based on our audits.
We conducted our audits in accordance with the standards of the Public Company Accounting Oversight Board (United States). Those standards require that we plan and perform the audit to obtain reasonable assurance about whether the financial statements and financial highlights are free of material misstatement. The Fund is not required to have, nor were we engaged to perform, an audit of its internal control over financial reporting. Our audits included consideration of internal control over financial reporting as a basis for designing audit procedures that are appropriate in the circumstances, but not for the purpose of expressing an opinion on the effectiveness of the Fund's internal control over financial reporting. Accordingly, we express no such opinion. An audit also includes examining, on a test basis, evidence supporting the amounts and disclosures in the financial statements, assessing the accounting principles used and significant estimates made by management, as well as evaluating the overall financial statement presentation. Our procedures included confirmation of securities owned as of April 30, 2016, by correspondence with the custodians and brokers; when replies were not received from brokers, we performed other auditing procedures. We believe that our audits provide a reasonable basis for our opinion.
In our opinion, such financial statements and financial highlights referred to above present fairly, in all material respects, the financial position of Fidelity Series Small Cap Discovery Fund as of April 30, 2016, the results of its operations for the year then ended, the changes in its net assets for each of the two years in the period then ended, and the financial highlights for each of the two years in the period then ended and for the period November 7, 2013 (commencement of operations) to April 30, 2014 in conformity with accounting principles generally accepted in the United States of America.
DELOITTE & TOUCHE LLP
Boston, Massachusetts
June 15, 2016
Trustees and Officers
The Trustees, Members of the Advisory Board (if any), and officers of the trust and fund, as applicable, are listed below. The Board of Trustees governs the fund and is responsible for protecting the interests of shareholders. The Trustees are experienced executives who meet periodically throughout the year to oversee the fund's activities, review contractual arrangements with companies that provide services to the fund, oversee management of the risks associated with such activities and contractual arrangements, and review the fund's performance. Each of the Trustees oversees 170 funds.
The Trustees hold office without limit in time except that (a) any Trustee may resign; (b) any Trustee may be removed by written instrument, signed by at least two-thirds of the number of Trustees prior to such removal; (c) any Trustee who requests to be retired or who has become incapacitated by illness or injury may be retired by written instrument signed by a majority of the other Trustees; and (d) any Trustee may be removed at any special meeting of shareholders by a two-thirds vote of the outstanding voting securities of the trust. Each Trustee who is not an interested person (as defined in the 1940 Act) of the trust and the fund is referred to herein as an Independent Trustee. Each Independent Trustee shall retire not later than the last day of the calendar year in which his or her 75th birthday occurs. The Independent Trustees may waive this mandatory retirement age policy with respect to individual Trustees. Officers and Advisory Board Members hold office without limit in time, except that any officer or Advisory Board Member may resign or may be removed by a vote of a majority of the Trustees at any regular meeting or any special meeting of the Trustees. Except as indicated, each individual has held the office shown or other offices in the same company for the past five years.
The fund’s Statement of Additional Information (SAI) includes more information about the Trustees. To request a free copy, call Fidelity at 1-800-544-8544 for Fidelity® Series Small Cap Discovery Fund, or 1-800-835-5092 for Class F.
Experience, Skills, Attributes, and Qualifications of the Trustees. The Governance and Nominating Committee has adopted a statement of policy that describes the experience, qualifications, attributes, and skills that are necessary and desirable for potential Independent Trustee candidates (Statement of Policy). The Board believes that each Trustee satisfied at the time he or she was initially elected or appointed a Trustee, and continues to satisfy, the standards contemplated by the Statement of Policy. The Governance and Nominating Committee also engages professional search firms to help identify potential Independent Trustee candidates who have the experience, qualifications, attributes, and skills consistent with the Statement of Policy. From time to time, additional criteria based on the composition and skills of the current Independent Trustees, as well as experience or skills that may be appropriate in light of future changes to board composition, business conditions, and regulatory or other developments, have also been considered by the professional search firms and the Governance and Nominating Committee. In addition, the Board takes into account the Trustees' commitment and participation in Board and committee meetings, as well as their leadership of standing and ad hoc committees throughout their tenure.
In determining that a particular Trustee was and continues to be qualified to serve as a Trustee, the Board has considered a variety of criteria, none of which, in isolation, was controlling. The Board believes that, collectively, the Trustees have balanced and diverse experience, qualifications, attributes, and skills, which allow the Board to operate effectively in governing the fund and protecting the interests of shareholders. Information about the specific experience, skills, attributes, and qualifications of each Trustee, which in each case led to the Board's conclusion that the Trustee should serve (or continue to serve) as a trustee of the fund, is provided below.
Board Structure and Oversight Function. James C. Curvey is an interested person and currently serves as Chairman. The Trustees have determined that an interested Chairman is appropriate and benefits shareholders because an interested Chairman has a personal and professional stake in the quality and continuity of services provided to the fund. Independent Trustees exercise their informed business judgment to appoint an individual of their choosing to serve as Chairman, regardless of whether the Trustee happens to be independent or a member of management. The Independent Trustees have determined that they can act independently and effectively without having an Independent Trustee serve as Chairman and that a key structural component for assuring that they are in a position to do so is for the Independent Trustees to constitute a substantial majority for the Board. The Independent Trustees also regularly meet in executive session. Ned C. Lautenbach serves as Chairman of the Independent Trustees and as such (i) acts as a liaison between the Independent Trustees and management with respect to matters important to the Independent Trustees and (ii) with management prepares agendas for Board meetings.
Fidelity® funds are overseen by different Boards of Trustees. The fund's Board oversees Fidelity's high income and certain equity funds, and other Boards oversee Fidelity's investment-grade bond, money market, asset allocation, and sector funds. The asset allocation funds may invest in Fidelity® funds overseen by the fund's Board. The use of separate Boards, each with its own committee structure, allows the Trustees of each group of Fidelity® funds to focus on the unique issues of the funds they oversee, including common research, investment, and operational issues. On occasion, the separate Boards establish joint committees to address issues of overlapping consequences for the Fidelity® funds overseen by each Board.
The Trustees operate using a system of committees to facilitate the timely and efficient consideration of all matters of importance to the Trustees, the fund, and fund shareholders and to facilitate compliance with legal and regulatory requirements and oversight of the fund's activities and associated risks. The Board, acting through its committees, has charged FMR and its affiliates with (i) identifying events or circumstances the occurrence of which could have demonstrably adverse effects on the fund's business and/or reputation; (ii) implementing processes and controls to lessen the possibility that such events or circumstances occur or to mitigate the effects of such events or circumstances if they do occur; and (iii) creating and maintaining a system designed to evaluate continuously business and market conditions in order to facilitate the identification and implementation processes described in (i) and (ii) above. Because the day-to-day operations and activities of the fund are carried out by or through FMR, its affiliates, and other service providers, the fund's exposure to risks is mitigated but not eliminated by the processes overseen by the Trustees. While each of the Board's committees has responsibility for overseeing different aspects of the fund's activities, oversight is exercised primarily through the Operations, Audit, and Compliance Committees. In addition, the Independent Trustees have worked with FMR to enhance the Board's oversight of investment and financial risks, legal and regulatory risks, technology risks, and operational risks, including the development of additional risk reporting to the Board. For example, a working group comprised of Independent Trustees and FMR has worked and continues to work to review the Fidelity® funds' valuation-related activities, reporting and risk management. Appropriate personnel, including but not limited to the fund's Chief Compliance Officer (CCO), FMR's internal auditor, the independent accountants, the fund's Treasurer and portfolio management personnel, make periodic reports to the Board's committees, as appropriate, including an annual review of Fidelity's risk management program for the Fidelity® funds. The responsibilities of each standing committee, including their oversight responsibilities, are described further under "Standing Committees of the Trustees."
Interested Trustees*:
Correspondence intended for a Trustee who is an interested person may be sent to Fidelity Investments, 245 Summer Street, Boston, Massachusetts 02210.
Name, Year of Birth; Principal Occupations and Other Relevant Experience+
James C. Curvey (1935)
Year of Election or Appointment: 2007
Trustee
Chairman of the Board of Trustees
Mr. Curvey also serves as Trustee of other Fidelity® funds. Mr. Curvey is a Director of Fidelity Research & Analysis Co. (investment adviser firm, 2009-present), and Vice Chairman (2007-present) and Director of FMR LLC (diversified financial services company). In addition, Mr. Curvey serves as an Overseer for the Boston Symphony Orchestra and a member of the board of Artis-Naples, Naples, Florida, and as a Trustee for Brewster Academy, Wolfeboro, New Hampshire. Previously, Mr. Curvey served as a Director of Fidelity Investments Money Management, Inc. (investment adviser firm, 2009-2014) and a Director of FMR and FMR Co., Inc. (investment adviser firms, 2007-2014).
Charles S. Morrison (1960)
Year of Election or Appointment: 2014
Trustee
Mr. Morrison also serves as Trustee of other funds. He serves as a Director of Fidelity Investments Money Management, Inc. (FIMM) (investment adviser firm, 2014-present), Director of Fidelity SelectCo, LLC (investment adviser firm, 2014-present), President, Asset Management (2014-present), and is an employee of Fidelity Investments. Previously, Mr. Morrison served as Vice President of Fidelity's Fixed Income and Asset Allocation Funds (2012-2014), President, Fixed Income (2011-2014), Vice President of Fidelity's Money Market Funds (2005-2009), President, Money Market Group Leader of FMR (investment adviser firm, 2009), and Senior Vice President, Money Market Group of FMR (2004-2009). Mr. Morrison also served as Vice President of Fidelity's Bond Funds (2002-2005), certain Balanced Funds (2002-2005), and certain Asset Allocation Funds (2002-2007), and as Senior Vice President (2002-2005) of Fidelity's Bond Division.
* Determined to be an “Interested Trustee” by virtue of, among other things, his or her affiliation with the trust or various entities under common control with FMR.
+ The information includes the Trustee's principal occupation during the last five years and other information relating to the experience, attributes, and skills relevant to the Trustee's qualifications to serve as a Trustee, which led to the conclusion that the Trustee should serve as a Trustee for the fund.
Independent Trustees:
Correspondence intended for an Independent Trustee may be sent to Fidelity Investments, P.O. Box 55235, Boston, Massachusetts 02205-5235.
Name, Year of Birth; Principal Occupations and Other Relevant Experience+
Dennis J. Dirks (1948)
Year of Election or Appointment: 2005
Trustee
Mr. Dirks also serves as Trustee of other Fidelity® funds. Prior to his retirement in May 2003, Mr. Dirks was Chief Operating Officer and a member of the Board of The Depository Trust & Clearing Corporation (DTCC). He also served as President, Chief Operating Officer, and Board member of The Depository Trust Company (DTC) and President and Board member of the National Securities Clearing Corporation (NSCC). In addition, Mr. Dirks served as Chief Executive Officer and Board member of the Government Securities Clearing Corporation, Chief Executive Officer and Board member of the Mortgage-Backed Securities Clearing Corporation, as a Trustee and a member of the Finance Committee of Manhattan College (2005-2008), as a Trustee and a member of the Finance Committee of AHRC of Nassau County (2006-2008), and as a member of the Independent Directors Council (IDC) Governing Council (2010-2015). Mr. Dirks is a member of the Board of Directors for The Brookville Center for Children's Services, Inc. (2009-present).
Alan J. Lacy (1953)
Year of Election or Appointment: 2008
Trustee
Mr. Lacy also serves as Trustee of other Fidelity® funds. Mr. Lacy serves as Chairman (2014-present) and a member (2010-present) of the Board of Directors of Dave & Buster's Entertainment, Inc. (restaurant and entertainment complexes) and a Director of Bristol-Myers Squibb Company (global pharmaceuticals, 2008-present). He is a Trustee of the California Chapter of The Nature Conservancy (2015-present) and a Director of the Center for Advanced Study in the Behavioral Sciences at Stanford University (2015-present). In addition, Mr. Lacy served as Senior Adviser (2007-2014) of Oak Hill Capital Partners, L.P. (private equity) and also served as Chief Executive Officer (2005) and Vice Chairman (2005-2006) of Sears Holdings Corporation (retail) and Chief Executive Officer and Chairman of the Board of Sears, Roebuck and Co. (retail, 2000-2005). Previously, Mr. Lacy served as Chairman (2008-2011) and a member (2006-2015) of the Board of Trustees of the National Parks Conservation Association and as a member of the Board of Directors for The Western Union Company (global money transfer, 2006-2011), The Hillman Companies, Inc. (hardware wholesalers, 2010-2014), and Earth Fare, Inc. (retail grocery, 2010-2014).
Ned C. Lautenbach (1944)
Year of Election or Appointment: 2000
Trustee
Chairman of the Independent Trustees
Mr. Lautenbach also serves as Trustee of other Fidelity® funds. Mr. Lautenbach currently serves as the Lead Director of the Eaton Corporation Board of Directors (diversified industrial, 1997-present). Mr. Lautenbach is Chairman of the Board of Directors of Artis-Naples in Naples, Florida (2012-present), a member of the Council on Foreign Relations (1994-present), and a member of the Board of Governors, State University System of Florida (2013-present). Previously, Mr. Lautenbach was a Partner/Advisory Partner at Clayton, Dubilier & Rice, LLC (private equity investment, 1998-2010), as well as a Director of Sony Corporation (2006-2007).
Joseph Mauriello (1944)
Year of Election or Appointment: 2008
Trustee
Mr. Mauriello also serves as Trustee of other Fidelity® funds. Prior to his retirement in January 2006, Mr. Mauriello served in numerous senior management positions including Deputy Chairman and Chief Operating Officer (2004-2005), and Vice Chairman of Financial Services (2002-2004) of KPMG LLP US (professional services, 1965-2005). Mr. Mauriello currently serves as a member of the Board of Directors of XL Group plc. (global insurance and re-insurance, 2006-present) and the Independent Directors Council (IDC) Governing Council (2015-present). Previously, Mr. Mauriello served as a Director of the Hamilton Funds of the Bank of New York (2006-2007) and of Arcadia Resources Inc. (health care services and products, 2007-2012).
Robert W. Selander (1950)
Year of Election or Appointment: 2011
Trustee
Mr. Selander also serves as Trustee of other Fidelity® funds. Mr. Selander serves as a Director of The Western Union Company (global money transfer, 2014-present) and a non-executive Chairman of Health Equity, Inc. (health savings custodian, 2015-present). Previously, Mr. Selander served as a Member of the Advisory Board of certain Fidelity® funds (2011), and Executive Vice Chairman (2010), Chief Executive Officer (2009-2010), and President and Chief Executive Officer (1997-2009) of Mastercard, Inc.
Cornelia M. Small (1944)
Year of Election or Appointment: 2005
Trustee
Ms. Small also serves as Trustee of other Fidelity® funds. Ms. Small is a member of the Board of Directors (2009-present) and Chair of the Investment Committee (2010-present) of the Teagle Foundation. Ms. Small also serves on the Investment Committee of the Berkshire Taconic Community Foundation (2008-present). Previously, Ms. Small served as Chairperson (2002-2008) and a member of the Investment Committee and Chairperson (2008-2012) and a member of the Board of Trustees of Smith College. In addition, Ms. Small served as Chief Investment Officer, Director of Global Equity Investments, and a member of the Board of Directors of Scudder, Stevens & Clark and Scudder Kemper Investments.
William S. Stavropoulos (1939)
Year of Election or Appointment: 2002
Trustee
Vice Chairman of the Independent Trustees
Mr. Stavropoulos also serves as Trustee of other Fidelity® funds. Mr. Stavropoulos serves as President and Founder of the Michigan Baseball Foundation, the Great Lakes Loons (2007-present). Mr. Stavropoulos is Chairman Emeritus of the Board of Directors of The Dow Chemical Company, where he previously served in numerous senior management positions, including President, CEO (1995-2000; 2002-2004), Chairman of the Executive Committee (2000-2006), and as a member of the Board of Directors (1990-2006). Currently, Mr. Stavropoulos is Chairman of the Board of Directors of Univar Inc. (global distributor of commodity and specialty chemicals), a Director of Teradata Corporation (data warehousing and technology solutions), and Maersk Inc. (industrial conglomerate), and a member of the Advisory Board for Metalmark Capital LLC (private equity investment, 2005-present). Mr. Stavropoulos is an operating advisor to Clayton, Dubilier & Rice, LLC (private equity investment). In addition, Mr. Stavropoulos is a member of the University of Notre Dame Advisory Council for the College of Science, a Trustee of the Rollin L. Gerstacker Foundation, and a Director of the Naples Philharmonic Center for the Arts. Previously, Mr. Stavropoulos served as a Director of Chemical Financial Corporation (bank holding company, 1993-2012) and Tyco International, Ltd. (multinational manufacturing and services, 2007-2012).
David M. Thomas (1949)
Year of Election or Appointment: 2008
Trustee
Mr. Thomas also serves as Trustee of other Fidelity® funds. Mr. Thomas serves as Non-Executive Chairman of the Board of Directors of Fortune Brands Home and Security (home and security products, 2011-present), as a member of the Board of Directors (2004-present) and Presiding Director (2013-present) of Interpublic Group of Companies, Inc. (marketing communication), and as a member of the Board of Trustees of the University of Florida (2013-present). Previously, Mr. Thomas served as Executive Chairman (2005-2006) and Chairman and Chief Executive Officer (2000-2005) of IMS Health, Inc. (pharmaceutical and healthcare information solutions), and a Director of Fortune Brands, Inc. (consumer products, 2000-2011).
+ The information includes the Trustee's principal occupation during the last five years and other information relating to the experience, attributes, and skills relevant to the Trustee's qualifications to serve as a Trustee, which led to the conclusion that the Trustee should serve as a Trustee for the fund.
Advisory Board Members and Officers:
Correspondence intended for an officer or Peter S. Lynch may be sent to Fidelity Investments, 245 Summer Street, Boston, Massachusetts 02210. Officers appear below in alphabetical order.
Name, Year of Birth; Principal Occupation
Peter S. Lynch (1944)
Year of Election or Appointment: 2003
Member of the Advisory Board
Mr. Lynch also serves as Member of the Advisory Board of other Fidelity® funds. Mr. Lynch is Vice Chairman and a Director of FMR (investment adviser firm) and FMR Co., Inc. (investment adviser firm). In addition, Mr. Lynch serves as a Trustee of Boston College and as the Chairman of the Inner-City Scholarship Fund. Previously, Mr. Lynch served on the Special Olympics International Board of Directors (1997-2006).
Marc R. Bryant (1966)
Year of Election or Appointment: 2015
Secretary and Chief Legal Officer (CLO)
Mr. Bryant also serves as Secretary and CLO of other funds. Mr. Bryant serves as CLO, Secretary, and Senior Vice President of Fidelity Management & Research Company (investment adviser firm, 2015-present) and FMR Co., Inc. (investment adviser firm, 2015-present); Secretary of Fidelity SelectCo, LLC (investment adviser firm, 2015-present) and Fidelity Investments Money Management, Inc. (investment adviser firm, 2015-present); and CLO of Fidelity Management & Research (Hong Kong) Limited and FMR Investment Management (U.K.) Limited (investment adviser firms, 2015-present) and Fidelity Management & Research (Japan) Limited (investment adviser firm, 2016-present). He is Senior Vice President and Deputy General Counsel of FMR LLC (diversified financial services company). Previously, Mr. Bryant served as Secretary and CLO of Fidelity Rutland Square Trust II (2010-2014) and Assistant Secretary of Fidelity's Fixed Income and Asset Allocation Funds (2013-2015). Prior to joining Fidelity Investments, Mr. Bryant served as a Senior Vice President and the Head of Global Retail Legal for AllianceBernstein L.P. (2006-2010), and as the General Counsel for ProFund Advisors LLC (2001-2006).
William C. Coffey (1969)
Year of Election or Appointment: 2009
Assistant Secretary
Mr. Coffey also serves as Assistant Secretary of other funds. He is Senior Vice President and Deputy General Counsel of FMR LLC (diversified financial services company, 2010-present), and is an employee of Fidelity Investments. Previously, Mr. Coffey served as Vice President and Associate General Counsel of FMR LLC (2005-2009).
Jeffrey S. Christian (1961)
Year of Election or Appointment: 2016
Assistant Treasurer
Mr. Christian also serves as Assistant Treasurer of other funds. Mr. Christian is an employee of Fidelity Investments (2003-present).
Jonathan Davis (1968)
Year of Election or Appointment: 2010
Assistant Treasurer
Mr. Davis also serves as Assistant Treasurer of other funds, and is an employee of Fidelity Investments. Previously, Mr. Davis served as Vice President and Associate General Counsel of FMR LLC (diversified financial services company, 2003-2010).
Adrien E. Deberghes (1967)
Year of Election or Appointment: 2016
Assistant Treasurer
Mr. Deberghes also serves as an officer of other funds. He is an employee of Fidelity Investments (2008-present). Prior to joining Fidelity Investments, Mr. Deberghes was Senior Vice President of Mutual Fund Administration at State Street Corporation (2007-2008), Senior Director of Mutual Fund Administration at Investors Bank & Trust (2005-2007), and Director of Finance for Dunkin' Brands (2000-2005). Previously, Mr. Deberghes served in other fund officer roles.
Stephanie J. Dorsey (1969)
Year of Election or Appointment: 2010
Assistant Treasurer
Ms. Dorsey also serves as an officer of other funds. She is an employee of Fidelity Investments (2008-present) and has served in other fund officer roles. Prior to joining Fidelity Investments, Ms. Dorsey served as Treasurer (2004-2008) of the JPMorgan Mutual Funds and Vice President (2004-2008) of JPMorgan Chase Bank.
Howard J. Galligan III (1966)
Year of Election or Appointment: 2014
Chief Financial Officer
Mr. Galligan also serves as Chief Financial Officer of other funds. Mr. Galligan serves as President of Fidelity Pricing and Cash Management Services (FPCMS) (2014-present) and as a Director of Strategic Advisers, Inc. (investment adviser firm, 2008-present). Previously, Mr. Galligan served as Chief Administrative Officer of Asset Management (2011-2014) and Chief Operating Officer and Senior Vice President of Investment Support for Strategic Advisers, Inc. (2003-2011).
Scott C. Goebel (1968)
Year of Election or Appointment: 2015
Vice President
Mr. Goebel serves as Vice President of other funds and is an employee of Fidelity Investments (2001-present). Previously, Mr. Goebel served as Secretary of Fidelity SelectCo, LLC (investment adviser firm, 2013-2015), Fidelity Investments Money Management, Inc. (FIMM) (investment adviser firm, 2010-2015), and Fidelity Research and Analysis Company (FRAC) (investment adviser firm, 2010-2015); General Counsel, Secretary, and Senior Vice President of Fidelity Management & Research Company (investment adviser firm, 2008-2015) and FMR Co., Inc. (investment adviser firm, 2008-2015); Assistant Secretary of Fidelity Management & Research (Japan) Limited (investment adviser firm, 2008-2015) and Fidelity Management & Research (U.K.) Inc. (investment adviser firm, 2008-2015); Chief Legal Officer (CLO) of Fidelity Management & Research (Hong Kong) Limited (investment adviser firm, 2008-2015); Secretary and CLO of certain Fidelity® funds (2008-2015); Assistant Secretary of FIMM (2008-2010), FRAC (2008-2010), and certain funds (2007-2008); and as Vice President and Secretary of Fidelity Distributors Corporation (FDC) (2005-2007).
Thomas C. Hense (1964)
Year of Election or Appointment: 2008, 2010, or 2015
Vice President
Mr. Hense serves as Vice President of Fidelity Advisor® Multi-Asset Income Fund (2015) and other funds (High Income (2008), Small Cap (2008), and Value (2010) funds), and is an employee of Fidelity Investments (1993-present). Previously, Mr. Hense served as a portfolio manager for Fidelity's Institutional Money Management Group (Pyramis) (2003-2008).
Brian B. Hogan (1964)
Year of Election or Appointment: 2009
Vice President
Mr. Hogan also serves as Trustee or Vice President of other funds. Mr. Hogan serves as a Director of FMR Investment Management (U.K.) Limited (investment adviser firm, 2015-present) and Fidelity SelectCo, LLC (investment adviser firm, 2014-present) and President of the Equity Division of FMR (investment adviser firm, 2009-present). Previously, Mr. Hogan served as Senior Vice President, Equity Research of FMR (2006-2009) and as a portfolio manager. Mr. Brian B. Hogan is not related to Mr. Colm A. Hogan.
Colm A. Hogan (1973)
Year of Election or Appointment: 2016
Deputy Treasurer
Mr. Hogan also serves as an officer of other funds. Mr. Hogan is an employee of Fidelity Investments (2005-present). Mr. Colm A. Hogan is not related to Mr. Brian B. Hogan.
Chris Maher (1972)
Year of Election or Appointment: 2013
Assistant Treasurer
Mr. Maher serves as Assistant Treasurer of other funds. Mr. Maher is Vice President of Valuation Oversight and is an employee of Fidelity Investments. Previously, Mr. Maher served as Vice President of Asset Management Compliance (2013), Vice President of the Program Management Group of FMR (investment adviser firm, 2010-2013), and Vice President of Valuation Oversight (2008-2010).
John F. Papandrea (1972)
Year of Election or Appointment: 2016
Anti-Money Laundering (AML) Officer
Mr. Papandrea also serves as AML Officer of other funds. Mr. Papandrea is Vice President of FMR LLC (diversified financial services company, 2008-present) and is an employee of Fidelity Investments (2005-present).
Kenneth B. Robins (1969)
Year of Election or Appointment: 2016
Chief Compliance Officer
Mr. Robins also serves as an officer of other funds. Mr. Robins serves as Executive Vice President of Fidelity Investments Money Management, Inc. (FIMM) (investment adviser firm, 2013-present) and is an employee of Fidelity Investments (2004-present). Previously, Mr. Robins served in other fund officer roles.
Stacie M. Smith (1974)
Year of Election or Appointment: 2016
President and Treasurer
Ms. Smith also serves as an officer of other funds. She is an employee of Fidelity Investments (2009-present) and has served in other fund officer roles. Prior to joining Fidelity Investments, Ms. Smith served as Senior Audit Manager of Ernst & Young LLP (1996-2009). Previously, Ms. Smith served as Deputy Treasurer of certain Fidelity® funds (2013-2016).
Renee Stagnone (1975)
Year of Election or Appointment: 2016
Assistant Treasurer
Ms. Stagnone also serves as an officer of other funds. Ms. Stagnone is an employee of Fidelity Investments (1997-present). Previously, Ms. Stagnone served as Deputy Treasurer of certain Fidelity® funds (2013-2016).
Shareholder Expense Example
As a shareholder of the Fund, you incur two types of costs: (1) transaction costs and (2) ongoing costs, including management fees and other Fund expenses. This Example is intended to help you understand your ongoing costs (in dollars) of investing in the Fund and to compare these costs with the ongoing costs of investing in other mutual funds.
The Example is based on an investment of $1,000 invested at the beginning of the period and held for the entire period (November 1, 2015 to April 30, 2016).
Actual Expenses
The first line of the accompanying table for each class of the Fund provides information about actual account values and actual expenses. You may use the information in this line, together with the amount you invested, to estimate the expenses that you paid over the period. Simply divide your account value by $1,000.00 (for example, an $8,600 account value divided by $1,000.00 = 8.6), then multiply the result by the number in the first line for a class of the Fund under the heading entitled "Expenses Paid During Period" to estimate the expenses you paid on your account during this period. In addition, the Fund, as a shareholder in the underlying Fidelity Central Funds, will indirectly bear its pro-rata share of the fees and expenses incurred by the underlying Fidelity Central Funds. These fees and expenses are not included in the Fund's annualized expense ratio used to calculate the expense estimate in the table below.
Hypothetical Example for Comparison Purposes
The second line of the accompanying table for each class of the Fund provides information about hypothetical account values and hypothetical expenses based on a Class' actual expense ratio and an assumed rate of return of 5% per year before expenses, which is not the Class' actual return. The hypothetical account values and expenses may not be used to estimate the actual ending account balance or expenses you paid for the period. You may use this information to compare the ongoing costs of investing in the Fund and other funds. To do so, compare this 5% hypothetical example with the 5% hypothetical examples that appear in the shareholder reports of the other funds. In addition, the Fund, as a shareholder in the underlying Fidelity Central Funds, will indirectly bear its pro-rata share of the fees and expenses incurred by the underlying Fidelity Central Funds. These fees and expenses are not included in the Fund's annualized expense ratio used to calculate the expense estimate in the table below.
Please note that the expenses shown in the table are meant to highlight your ongoing costs only and do not reflect any transaction costs. Therefore, the second line of the table is useful in comparing ongoing costs only, and will not help you determine the relative total costs of owning different funds.
| Annualized Expense Ratio-A | Beginning Account Value November 1, 2015 | Ending Account Value April 30, 2016 | Expenses Paid During Period-B November 1, 2015 to April 30, 2016 |
|
| Series Small Cap Discovery | .95% | |||
| Actual | $1,000.00 | $987.10 | $4.69 | |
| Hypothetical-C | $1,000.00 | $1,020.14 | $4.77 | |
| Class F | .79% | |||
| Actual | $1,000.00 | $987.20 | $3.90 | |
| Hypothetical-C | $1,000.00 | $1,020.93 | $3.97 |
A Annualized expense ratio reflects expenses net of applicable fee waivers.
B Expenses are equal to each Class' annualized expense ratio, multiplied by the average account value over the period, multiplied by 182/366 (to reflect the one-half year period).
C 5% return per year before expenses
Distributions (Unaudited)
The fund hereby designates as a capital gain dividend with respect to the taxable year ended April 30, 2016, $20,202,338, or, if subsequently determined to be different, the net capital gain of such year.
Series Small Cap Discovery and Class F designate 100% of the dividends distributed during the fiscal year as qualifying for the dividends–received deduction for corporate shareholders.
Series Small Cap Discovery and Class F designate 100% of the dividends distributed during the fiscal year as amounts which may be taken into account as a dividend for purposes of the maximum rate under section 1(h)(11) of the Internal Revenue Code.
The fund will notify shareholders in January 2017 of amounts for use in preparing 2016 income tax returns.
![]()
Corporate Headquarters
245 Summer St.
Boston, MA 02210
www.fidelity.com
XS4-ANN-0616
1.968029.102
|
Fidelity® Mid-Cap Stock Fund Annual Report April 30, 2016 |
|
|
Contents
To view a fund's proxy voting guidelines and proxy voting record for the 12-month period ended June 30, visit http://www.fidelity.com/proxyvotingresults or visit the Securities and Exchange Commission's (SEC) web site at http://www.sec.gov.
You may also call 1-800-544-8544 to request a free copy of the proxy voting guidelines.
Standard & Poor's, S&P and S&P 500 are registered service marks of The McGraw-Hill Companies, Inc. and have been licensed for use by Fidelity Distributors Corporation.
Other third-party marks appearing herein are the property of their respective owners.
All other marks appearing herein are registered or unregistered trademarks or service marks of FMR LLC or an affiliated company. © 2016 FMR LLC. All rights reserved.
This report and the financial statements contained herein are submitted for the general information of the shareholders of the Fund. This report is not authorized for distribution to prospective investors in the Fund unless preceded or accompanied by an effective prospectus.
A fund files its complete schedule of portfolio holdings with the SEC for the first and third quarters of each fiscal year on Form N-Q. Forms N-Q are available on the SEC’s web site at http://www.sec.gov. A fund's Forms N-Q may be reviewed and copied at the SEC’s Public Reference Room in Washington, DC. Information regarding the operation of the SEC's Public Reference Room may be obtained by calling 1-800-SEC-0330.
For a complete list of a fund's portfolio holdings, view the most recent holdings listing, semiannual report, or annual report on Fidelity's web site at http://www.fidelity.com, http://www.advisor.fidelity.com, or http://www.401k.com, as applicable.
NOT FDIC INSURED •MAY LOSE VALUE •NO BANK GUARANTEE
Neither the Fund nor Fidelity Distributors Corporation is a bank.
Performance: The Bottom Line
Average annual total return reflects the change in the value of an investment, assuming reinvestment of distributions from dividend income and capital gains (the profits earned upon the sale of securities that have grown in value, if any) and assuming a constant rate of performance each year. The hypothetical investment and the average annual total returns do not reflect the deduction of taxes that a shareholder would pay on fund distributions or the redemption of fund shares. During periods of reimbursement by Fidelity, a fund’s total return will be greater than it would be had the reimbursement not occurred. How a fund did yesterday is no guarantee of how it will do tomorrow.
Average Annual Total Returns
| For the periods ended April 30, 2016 | Past 1 year | Past 5 years | Past 10 years |
| Fidelity® Mid-Cap Stock Fund | (3.44)% | 8.87% | 6.26% |
$10,000 Over 10 Years
Let's say hypothetically that $10,000 was invested in Fidelity® Mid-Cap Stock Fund, a class of the fund, on April 30, 2006.
The chart shows how the value of your investment would have changed, and also shows how the S&P MidCap 400® Index performed over the same period.

| Period Ending Values | ||
|
| $18,345 | Fidelity® Mid-Cap Stock Fund |
|
| $21,124 | S&P MidCap 400® Index |
Management's Discussion of Fund Performance
Market Recap: The S&P 500® index gained 1.21% for the 12 months ending April 30, 2016. Largely range-bound until mid-August, U.S. stocks suffered a steep, late-summer decline on concern about an economic slowdown in China. The market recovered in October, lifted by the U.S. Federal Reserve’s decision to delay raising near-term interest rates until mid-December, as well as a rate cut in China and economic stimulus in Europe. But continued oil-price weakness and U.S.-dollar strength pushed the S&P 500® to its worst January since 2009, followed by a volatile but ultimately flattish February, then a sharp rebound in March driven by U.S. jobs gains and perceived softening in the Fed’s rate-tightening posture. April brought minimal change. For the full period, growth-oriented and larger-cap stocks fared better overall than value and smaller-cap complements. Performance was split, as five of 10 S&P 500® sectors gained ground, with a wide gap separating leaders from laggards. Investor demand for more-stable and higher-yielding investments boosted traditionally defensive, dividend-rich groups such as utilities (+14%), telecommunication services (+10%) and consumer staples (+11%) – the latter also buoyed by rising wages and low inflation. Meanwhile, energy (-14%) foundered amid commodity weakness that also hurt materials (-4%). Comments from Portfolio Manager John Roth: For the year, the fund’s share classes returned about -3%, underperforming the -0.94% return of the benchmark S&P MidCap 400® Index. Security and market selection hindered the fund’s performance versus its benchmark. Positioning in energy and financials was detrimental, as were choices in the industrials sector. Among individual names, United Rentals was the fund’s biggest relative detractor. The stock was hurt by concerns that the company's rental rates would continue to fall into 2016. In July, United Rentals lowered earnings guidance for 2015 and announced disappointing results in January, along with worse-than-anticipated 2016 financial targets. Conversely, picks in health care, consumer discretionary, materials and information technology contributed to results. An average cash position of about 7% also lifted performance in a down market. Among individual stocks, not owning solar and wind technology firm SunEdison was the biggest contributor, as the index component lost nearly all its value the past year, amid volatility in the broader energy sector and an early-period slowdown in emerging markets, where the firm had big plans to expand. The company announced Chapter 11 bankruptcy near period end.The views expressed above reflect those of the portfolio manager(s) only through the end of the period as stated on the cover of this report and do not necessarily represent the views of Fidelity or any other person in the Fidelity organization. Any such views are subject to change at any time based upon market or other conditions and Fidelity disclaims any responsibility to update such views. These views may not be relied on as investment advice and, because investment decisions for a Fidelity fund are based on numerous factors, may not be relied on as an indication of trading intent on behalf of any Fidelity fund.
Investment Summary (Unaudited)
Top Ten Stocks as of April 30, 2016
| % of fund's net assets | % of fund's net assets 6 months ago | |
| Eurofins Scientific SA | 1.8 | 1.7 |
| Boston Scientific Corp. | 1.5 | 0.8 |
| United Rentals, Inc. | 1.4 | 1.4 |
| NVR, Inc. | 1.3 | 1.2 |
| Williams Partners LP | 1.3 | 0.3 |
| Atmos Energy Corp. | 1.3 | 0.8 |
| ARAMARK Holdings Corp. | 1.3 | 1.1 |
| First American Financial Corp. | 1.2 | 1.2 |
| The Williams Companies, Inc. | 1.2 | 0.0 |
| Pool Corp. | 1.2 | 1.2 |
| 13.5 |
Top Five Market Sectors as of April 30, 2016
| % of fund's net assets | % of fund's net assets 6 months ago | |
| Financials | 18.1 | 19.7 |
| Information Technology | 16.8 | 17.1 |
| Consumer Discretionary | 13.8 | 13.1 |
| Industrials | 13.3 | 14.6 |
| Energy | 10.9 | 7.4 |
Asset Allocation (% of fund's net assets)
| As of April 30, 2016* | ||
| Stocks | 93.8% | |
| Bonds | 0.1% | |
| Short-Term Investments and Net Other Assets (Liabilities) | 6.1% | |

* Foreign investments - 10.8%
| As of October 31, 2015* | ||
| Stocks | 93.2% | |
| Short-Term Investments and Net Other Assets (Liabilities) | 6.8% | |

* Foreign investments - 9.4%
Percentages shown as 0.0% may reflect amounts less than 0.05%.
Investments April 30, 2016
Showing Percentage of Net Assets
| Common Stocks - 93.8% | |||
| Shares | Value (000s) | ||
| CONSUMER DISCRETIONARY - 13.8% | |||
| Auto Components - 0.8% | |||
| Magna International, Inc. Class A (sub. vtg.) | 582,100 | $24,449 | |
| Tenneco, Inc. (a) | 634,700 | 33,830 | |
| 58,279 | |||
| Distributors - 1.2% | |||
| Pool Corp. | 982,201 | 85,854 | |
| Hotels, Restaurants & Leisure - 3.2% | |||
| ARAMARK Holdings Corp. | 2,639,840 | 88,461 | |
| Domino's Pizza, Inc. | 361,400 | 43,686 | |
| Marriott International, Inc. Class A (b) | 526,200 | 36,881 | |
| Noodles & Co. (a)(b)(c) | 2,385,600 | 26,599 | |
| Whitbread PLC | 540,321 | 30,569 | |
| 226,196 | |||
| Household Durables - 4.7% | |||
| D.R. Horton, Inc. | 1,622,133 | 48,761 | |
| Lennar Corp. Class A | 591,600 | 26,805 | |
| NVR, Inc. (a) | 55,100 | 91,537 | |
| Tempur Sealy International, Inc. (a) | 1,071,200 | 64,990 | |
| Toll Brothers, Inc. (a) | 2,139,187 | 58,400 | |
| Tupperware Brands Corp. | 762,300 | 44,267 | |
| 334,760 | |||
| Internet & Catalog Retail - 0.1% | |||
| Etsy, Inc. | 596,900 | 5,241 | |
| Leisure Products - 0.6% | |||
| New Academy Holding Co. LLC unit (a)(d)(e) | 294,000 | 45,267 | |
| Specialty Retail - 2.2% | |||
| Citi Trends, Inc. (c) | 899,353 | 16,152 | |
| GameStop Corp. Class A (b) | 446,200 | 14,635 | |
| Ross Stores, Inc. | 689,200 | 39,133 | |
| Sally Beauty Holdings, Inc. (a) | 901,600 | 28,310 | |
| Tiffany & Co., Inc. | 517,700 | 36,938 | |
| Ulta Salon, Cosmetics & Fragrance, Inc. (a) | 85,700 | 17,850 | |
| 153,018 | |||
| Textiles, Apparel & Luxury Goods - 1.0% | |||
| Brunello Cucinelli SpA (b) | 2,094,700 | 41,135 | |
| PVH Corp. | 311,700 | 29,799 | |
| 70,934 | |||
| TOTAL CONSUMER DISCRETIONARY | 979,549 | ||
| CONSUMER STAPLES - 3.2% | |||
| Beverages - 0.7% | |||
| Constellation Brands, Inc. Class A (sub. vtg.) | 307,400 | 47,973 | |
| Food & Staples Retailing - 0.3% | |||
| Tesco PLC (a) | 9,937,200 | 24,983 | |
| Food Products - 1.9% | |||
| Amira Nature Foods Ltd. (a)(b) | 1,806,875 | 13,100 | |
| Greencore Group PLC | 2,343,100 | 12,352 | |
| Mead Johnson Nutrition Co. Class A | 801,000 | 69,807 | |
| Premium Brands Holdings Corp. | 318,200 | 13,725 | |
| The Hershey Co. | 305,400 | 28,436 | |
| 137,420 | |||
| Household Products - 0.3% | |||
| Church & Dwight Co., Inc. | 223,200 | 20,691 | |
| TOTAL CONSUMER STAPLES | 231,067 | ||
| ENERGY - 10.8% | |||
| Energy Equipment & Services - 2.2% | |||
| Ensco PLC Class A | 1,035,200 | 12,381 | |
| FMC Technologies, Inc. (a) | 683,100 | 20,828 | |
| Helmerich & Payne, Inc. (b) | 936,000 | 61,888 | |
| Oceaneering International, Inc. | 1,757,900 | 64,427 | |
| 159,524 | |||
| Oil, Gas & Consumable Fuels - 8.6% | |||
| Antero Resources Corp. (a)(b) | 1,946,800 | 55,094 | |
| Cabot Oil & Gas Corp. | 2,090,000 | 48,906 | |
| Cimarex Energy Co. | 673,900 | 73,374 | |
| Cobalt International Energy, Inc. (a) | 3,126,100 | 10,097 | |
| Denbury Resources, Inc. (b) | 4,087,500 | 15,778 | |
| Diamondback Energy, Inc. | 235,600 | 20,398 | |
| Energy Transfer Equity LP | 3,058,900 | 38,022 | |
| GasLog Ltd. (b) | 2,755,877 | 35,303 | |
| Golar LNG Ltd. (b) | 1,378,600 | 22,857 | |
| Memorial Resource Development Corp. (a) | 1,008,400 | 13,190 | |
| Range Resources Corp. (b) | 671,400 | 29,615 | |
| SM Energy Co. (b) | 1,223,200 | 38,115 | |
| Southwestern Energy Co. (a)(b) | 955,300 | 12,830 | |
| The Williams Companies, Inc. | 4,446,800 | 86,223 | |
| Whiting Petroleum Corp. (a)(b) | 1,491,258 | 17,895 | |
| Williams Partners LP | 3,023,000 | 91,385 | |
| 609,082 | |||
| TOTAL ENERGY | 768,606 | ||
| FINANCIALS - 18.1% | |||
| Banks - 6.0% | |||
| First Republic Bank | 1,205,100 | 84,743 | |
| FirstMerit Corp. | 1,875,600 | 41,563 | |
| FNB Corp., Pennsylvania | 2,723,200 | 36,001 | |
| Huntington Bancshares, Inc. | 4,397,700 | 44,241 | |
| M&T Bank Corp. | 680,600 | 80,529 | |
| Prosperity Bancshares, Inc. | 579,300 | 30,570 | |
| Regions Financial Corp. | 4,377,900 | 41,065 | |
| SunTrust Banks, Inc. | 1,145,300 | 47,805 | |
| UMB Financial Corp. | 391,100 | 21,804 | |
| 428,321 | |||
| Capital Markets - 1.2% | |||
| Franklin Resources, Inc. | 753,100 | 28,121 | |
| KKR & Co. LP | 4,079,084 | 55,476 | |
| 83,597 | |||
| Insurance - 6.2% | |||
| Arch Capital Group Ltd. (a) | 1,095,000 | 77,187 | |
| Brown & Brown, Inc. | 1,197,500 | 42,044 | |
| Fairfax Financial Holdings Ltd. (sub. vtg.) | 72,200 | 38,698 | |
| First American Financial Corp. | 2,435,800 | 87,738 | |
| FNF Group | 2,035,900 | 64,945 | |
| Jardine Lloyd Thompson Group PLC | 1,694,194 | 21,462 | |
| Progressive Corp. | 1,798,100 | 58,618 | |
| Willis Group Holdings PLC | 412,400 | 51,509 | |
| 442,201 | |||
| Real Estate Investment Trusts - 2.6% | |||
| Apartment Investment & Management Co. Class A | 924,600 | 37,039 | |
| Essex Property Trust, Inc. | 266,100 | 58,662 | |
| Parkway Properties, Inc. | 3,259,000 | 53,611 | |
| VEREIT, Inc. | 4,064,300 | 36,091 | |
| 185,403 | |||
| Real Estate Management & Development - 0.7% | |||
| CBRE Group, Inc. (a) | 602,800 | 17,861 | |
| Realogy Holdings Corp. (a) | 981,700 | 35,086 | |
| 52,947 | |||
| Thrifts & Mortgage Finance - 1.4% | |||
| MGIC Investment Corp. (a) | 5,290,309 | 38,249 | |
| Radian Group, Inc. | 4,847,144 | 61,995 | |
| 100,244 | |||
| TOTAL FINANCIALS | 1,292,713 | ||
| HEALTH CARE - 10.1% | |||
| Health Care Equipment & Supplies - 3.5% | |||
| Align Technology, Inc. (a) | 567,000 | 40,932 | |
| Boston Scientific Corp. (a) | 4,796,000 | 105,128 | |
| HeartWare International, Inc. (a) | 604,214 | 20,157 | |
| Teleflex, Inc. | 144,300 | 22,479 | |
| The Cooper Companies, Inc. | 380,665 | 58,272 | |
| 246,968 | |||
| Health Care Providers & Services - 3.6% | |||
| Air Methods Corp. (a) | 595,400 | 22,018 | |
| Amplifon SpA | 3,124,782 | 28,749 | |
| Corvel Corp. (a) | 419,200 | 18,948 | |
| HealthSouth Corp. warrants 1/17/17 (a) | 3,255 | 12 | |
| Henry Schein, Inc. (a) | 288,700 | 48,704 | |
| MEDNAX, Inc. (a) | 949,000 | 67,654 | |
| Universal Health Services, Inc. Class B | 505,500 | 67,575 | |
| 253,660 | |||
| Health Care Technology - 0.6% | |||
| HealthStream, Inc. (a) | 865,700 | 19,582 | |
| Medidata Solutions, Inc. (a) | 482,800 | 21,065 | |
| 40,647 | |||
| Life Sciences Tools & Services - 2.2% | |||
| Agilent Technologies, Inc. | 821,100 | 33,599 | |
| Eurofins Scientific SA | 341,700 | 126,788 | |
| 160,387 | |||
| Pharmaceuticals - 0.2% | |||
| Catalent, Inc. (a) | 521,150 | 15,390 | |
| TOTAL HEALTH CARE | 717,052 | ||
| INDUSTRIALS - 13.3% | |||
| Aerospace & Defense - 2.8% | |||
| KEYW Holding Corp. (a)(b)(c) | 3,519,436 | 24,249 | |
| Rockwell Collins, Inc. | 232,100 | 20,469 | |
| Space Exploration Technologies Corp. Class A (a)(e) | 96,222 | 9,278 | |
| Teledyne Technologies, Inc. (a) | 482,700 | 44,867 | |
| Textron, Inc. | 1,421,800 | 54,995 | |
| TransDigm Group, Inc. (a) | 190,100 | 43,318 | |
| 197,176 | |||
| Air Freight & Logistics - 1.2% | |||
| C.H. Robinson Worldwide, Inc. | 502,200 | 35,641 | |
| Hub Group, Inc. Class A (a) | 467,100 | 17,993 | |
| PostNL NV (a) | 7,196,400 | 31,478 | |
| 85,112 | |||
| Commercial Services & Supplies - 0.7% | |||
| KAR Auction Services, Inc. | 724,200 | 27,230 | |
| U.S. Ecology, Inc. | 463,981 | 20,893 | |
| 48,123 | |||
| Construction & Engineering - 0.3% | |||
| Jacobs Engineering Group, Inc. (a) | 525,500 | 23,427 | |
| Electrical Equipment - 2.6% | |||
| AMETEK, Inc. | 1,205,692 | 57,982 | |
| Generac Holdings, Inc. (a) | 828,500 | 31,582 | |
| Hubbell, Inc. Class B | 434,300 | 45,932 | |
| Regal Beloit Corp. | 386,200 | 24,879 | |
| Rockwell Automation, Inc. | 215,400 | 24,441 | |
| 184,816 | |||
| Machinery - 1.1% | |||
| Donaldson Co., Inc. | 1,216,700 | 39,762 | |
| Rational AG | 77,000 | 39,090 | |
| 78,852 | |||
| Road & Rail - 3.0% | |||
| Genesee & Wyoming, Inc. Class A (a) | 1,180,700 | 76,875 | |
| J.B. Hunt Transport Services, Inc. | 876,900 | 72,677 | |
| Kansas City Southern | 718,700 | 68,097 | |
| 217,649 | |||
| Trading Companies & Distributors - 1.6% | |||
| Rush Enterprises, Inc. Class A (a) | 748,400 | 14,736 | |
| United Rentals, Inc. (a) | 1,444,273 | 96,665 | |
| 111,401 | |||
| TOTAL INDUSTRIALS | 946,556 | ||
| INFORMATION TECHNOLOGY - 16.8% | |||
| Communications Equipment - 1.0% | |||
| Brocade Communications Systems, Inc. | 4,650,100 | 44,687 | |
| Juniper Networks, Inc. | 1,287,100 | 30,118 | |
| 74,805 | |||
| Electronic Equipment & Components - 3.9% | |||
| Amphenol Corp. Class A | 1,453,400 | 81,143 | |
| Arrow Electronics, Inc. (a) | 1,346,600 | 83,624 | |
| CDW Corp. | 701,100 | 26,992 | |
| Fabrinet (a) | 1,132,031 | 36,191 | |
| IPG Photonics Corp. (a) | 340,900 | 29,546 | |
| Keysight Technologies, Inc. (a) | 681,700 | 17,779 | |
| 275,275 | |||
| Internet Software & Services - 1.7% | |||
| Akamai Technologies, Inc. (a) | 842,300 | 42,949 | |
| Endurance International Group Holdings, Inc. (a)(b) | 2,375,600 | 25,443 | |
| GoDaddy, Inc. (a)(b) | 1,143,000 | 34,713 | |
| Rightmove PLC | 311,900 | 17,582 | |
| 120,687 | |||
| IT Services - 5.8% | |||
| Alliance Data Systems Corp. (a) | 163,500 | 33,241 | |
| Fidelity National Information Services, Inc. | 835,886 | 55,001 | |
| First Data Corp. (f) | 2,497,973 | 28,452 | |
| First Data Corp. Class A (a) | 4,427,400 | 50,428 | |
| Fiserv, Inc. (a) | 541,900 | 52,954 | |
| FleetCor Technologies, Inc. (a) | 255,600 | 39,536 | |
| Gartner, Inc. Class A (a) | 593,900 | 51,770 | |
| Total System Services, Inc. | 632,300 | 32,336 | |
| WNS Holdings Ltd. sponsored ADR (a) | 2,124,300 | 67,319 | |
| 411,037 | |||
| Semiconductors & Semiconductor Equipment - 1.3% | |||
| Analog Devices, Inc. | 330,200 | 18,597 | |
| Lam Research Corp. | 288,600 | 22,049 | |
| Maxim Integrated Products, Inc. | 766,400 | 27,376 | |
| Silicon Laboratories, Inc. (a) | 535,494 | 25,061 | |
| 93,083 | |||
| Software - 3.1% | |||
| ANSYS, Inc. (a) | 725,200 | 65,826 | |
| Aspen Technology, Inc. (a) | 961,500 | 36,566 | |
| Citrix Systems, Inc. (a) | 756,400 | 61,904 | |
| Nuance Communications, Inc. (a) | 1,684,300 | 28,936 | |
| Red Hat, Inc. (a) | 376,200 | 27,602 | |
| 220,834 | |||
| TOTAL INFORMATION TECHNOLOGY | 1,195,721 | ||
| MATERIALS - 2.8% | |||
| Chemicals - 0.9% | |||
| Albemarle Corp. U.S. | 997,500 | 65,995 | |
| Containers & Packaging - 0.7% | |||
| WestRock Co. | 1,172,200 | 49,057 | |
| Metals & Mining - 1.2% | |||
| Franco-Nevada Corp. | 347,100 | 24,372 | |
| Freeport-McMoRan, Inc. (b) | 1,617,100 | 22,639 | |
| Novagold Resources, Inc. (a)(b) | 5,185,776 | 33,685 | |
| 80,696 | |||
| TOTAL MATERIALS | 195,748 | ||
| TELECOMMUNICATION SERVICES - 0.0% | |||
| Diversified Telecommunication Services - 0.0% | |||
| Iridium Communications, Inc. (a) | 132,200 | 1,067 | |
| UTILITIES - 4.9% | |||
| Electric Utilities - 2.2% | |||
| IDACORP, Inc. | 961,033 | 69,896 | |
| OGE Energy Corp. | 2,200,300 | 65,107 | |
| Xcel Energy, Inc. | 529,200 | 21,184 | |
| 156,187 | |||
| Gas Utilities - 1.6% | |||
| Atmos Energy Corp. | 1,230,697 | 89,287 | |
| Spire, Inc. | 337,400 | 21,580 | |
| 110,867 | |||
| Multi-Utilities - 1.1% | |||
| Alliant Energy Corp. | 1,163,500 | 82,050 | |
| TOTAL UTILITIES | 349,104 | ||
| TOTAL COMMON STOCKS | |||
| (Cost $5,501,938) | 6,677,183 | ||
| Principal Amount (000s) | Value (000s) | ||
| Nonconvertible Bonds - 0.1% | |||
| ENERGY - 0.1% | |||
| Energy Equipment & Services - 0.1% | |||
| Pacific Drilling SA 5.375% 6/1/20 (Cost $15,134)(f) | 26,460 | 8,017 | |
| Shares | |||
| Money Market Funds - 10.1% | |||
| Fidelity Cash Central Fund, 0.38% (g) | 442,991,344 | 442,991 | |
| Fidelity Securities Lending Cash Central Fund, 0.42% (g)(h) | 277,830,074 | 277,830 | |
| TOTAL MONEY MARKET FUNDS | |||
| (Cost $720,821) | 720,821 | ||
| TOTAL INVESTMENT PORTFOLIO - 104.0% | |||
| (Cost $6,237,893) | 7,406,021 | ||
| NET OTHER ASSETS (LIABILITIES) - (4.0)% | (282,074) | ||
| NET ASSETS - 100% | $7,123,947 |
Legend
(a) Non-income producing
(b) Security or a portion of the security is on loan at period end.
(c) Affiliated company
(d) Investment is owned by an entity that is treated as a U.S. Corporation for tax purposes in which the Fund holds a percentage ownership.
(e) Restricted securities - Investment in securities not registered under the Securities Act of 1933 (excluding 144A issues). At the end of the period, the value of restricted securities (excluding 144A issues) amounted to $54,545,000 or 0.8% of net assets.
(f) Security exempt from registration under Rule 144A of the Securities Act of 1933. These securities may be resold in transactions exempt from registration, normally to qualified institutional buyers. At the end of the period, the value of these securities amounted to $36,469,000 or 0.5% of net assets.
(g) Affiliated fund that is generally available only to investment companies and other accounts managed by Fidelity Investments. The rate quoted is the annualized seven-day yield of the fund at period end. A complete unaudited listing of the fund's holdings as of its most recent quarter end is available upon request. In addition, each Fidelity Central Fund's financial statements, which are not covered by the Fund's Report of Independent Registered Public Accounting Firm, are available on the SEC's website or upon request.
(h) Investment made with cash collateral received from securities on loan.
Additional information on each restricted holding is as follows:
| Security | Acquisition Date | Acquisition Cost (000s) |
| New Academy Holding Co. LLC unit | 8/1/11 | $30,988 |
| Space Exploration Technologies Corp. Class A | 4/8/16 | $9,278 |
Affiliated Central Funds
Information regarding fiscal year to date income earned by the Fund from investments in Fidelity Central Funds is as follows:
| Fund | Income earned |
| (Amounts in thousands) | |
| Fidelity Cash Central Fund | $1,201 |
| Fidelity Securities Lending Cash Central Fund | 6,672 |
| Total | $7,873 |
Other Affiliated Issuers
An affiliated company is a company in which the Fund has ownership of at least 5% of the voting securities. Fiscal year to date transactions with companies which are or were affiliates are as follows:
| Affiliate (Amounts in thousands) | Value, beginning of period | Purchases | Sales Proceeds* | Dividend Income | Value, end of period |
| Citi Trends, Inc. | $13,099 | $6,798 | $446 | $126 | $16,152 |
| KEYW Holding Corp. | 35,246 | -- | 951 | -- | 24,249 |
| Noodles & Co. | 19,353 | 23,182 | 1,633 | -- | 26,599 |
| Total | $67,698 | $29,980 | $3,030 | $126 | $67,000 |
* Includes the value of securities delivered through in-kind transactions, if applicable.
Investment Valuation
The following is a summary of the inputs used, as of April 30, 2016, involving the Fund's assets and liabilities carried at fair value. The inputs or methodology used for valuing securities may not be an indication of the risk associated with investing in those securities. For more information on valuation inputs, and their aggregation into the levels used below, please refer to the Investment Valuation section in the accompanying Notes to Financial Statements.
| Valuation Inputs at Reporting Date: | ||||
| Description | Total | Level 1 | Level 2 | Level 3 |
| (Amounts in thousands) | ||||
| Investments in Securities: | ||||
| Equities: | ||||
| Consumer Discretionary | $979,549 | $934,282 | $-- | $45,267 |
| Consumer Staples | 231,067 | 206,084 | 24,983 | -- |
| Energy | 768,606 | 768,606 | -- | -- |
| Financials | 1,292,713 | 1,292,713 | -- | -- |
| Health Care | 717,052 | 717,052 | -- | -- |
| Industrials | 946,556 | 937,278 | -- | 9,278 |
| Information Technology | 1,195,721 | 1,195,721 | -- | -- |
| Materials | 195,748 | 195,748 | -- | -- |
| Telecommunication Services | 1,067 | 1,067 | -- | -- |
| Utilities | 349,104 | 349,104 | -- | -- |
| Corporate Bonds | 8,017 | -- | 8,017 | -- |
| Money Market Funds | 720,821 | 720,821 | -- | -- |
| Total Investments in Securities: | $7,406,021 | $7,318,476 | $33,000 | $54,545 |
The following is a summary of transfers between Level 1 and Level 2 for the period ended April 30, 2016. Transfers are assumed to have occurred at the beginning of the period, and are primarily attributable to the valuation techniques used for foreign equity securities, as discussed in the accompanying Notes to Financial Statements:
| Transfers | Total (000s) |
| Level 1 to Level 2 | $0 |
| Level 2 to Level 1 | $233,430 |
The following is a reconciliation of Investments in Securities for which Level 3 inputs were used in determining value:
| (Amounts in thousands) | |
| Investments in Securities: | |
| Beginning Balance | $103,112 |
| Net Realized Gain (Loss) on Investment Securities | 13,135 |
| Net Unrealized Gain (Loss) on Investment Securities | (13,642) |
| Cost of Purchases | 9,278 |
| Proceeds of Sales | (57,338) |
| Amortization/Accretion | -- |
| Transfers into Level 3 | -- |
| Transfers out of Level 3 | -- |
| Ending Balance | $54,545 |
| The change in unrealized gain (loss) for the period attributable to Level 3 securities held at April 30, 2016 | $(9,361) |
The information used in the above reconciliation represents fiscal year to date activity for any Investments in Securities identified as using Level 3 inputs at either the beginning or the end of the current fiscal period. Transfers in or out of Level 3 represent the beginning value of any Security or Instrument where a change in the pricing level occurred from the beginning to the end of the period. The cost of purchases and the proceeds of sales may include securities received or delivered through corporate actions or exchanges. Realized and unrealized gains (losses) disclosed in the reconciliation are included in Net Gain (Loss) on the Fund's Statement of Operations.
Other Information
Distribution of investments by country or territory of incorporation, as a percentage of Total Net Assets, is as follows (Unaudited):
| United States of America | 89.2% |
| Canada | 2.0% |
| Bermuda | 1.9% |
| Luxembourg | 1.9% |
| United Kingdom | 1.4% |
| Italy | 1.0% |
| Others (Individually Less Than 1%) | 2.6% |
| 100.0% |
See accompanying notes which are an integral part of the financial statements.
Financial Statements
Statement of Assets and Liabilities
| Amounts in thousands (except per-share amounts) | April 30, 2016 | |
| Assets | ||
| Investment in securities, at value (including securities loaned of $271,110) — See accompanying schedule: Unaffiliated issuers (cost $5,408,172) | $6,618,200 | |
| Fidelity Central Funds (cost $720,821) | 720,821 | |
| Other affiliated issuers (cost $108,900) | 67,000 | |
| Total Investments (cost $6,237,893) | $7,406,021 | |
| Cash | 1,668 | |
| Receivable for investments sold | 39,554 | |
| Receivable for fund shares sold | 4,280 | |
| Dividends receivable | 1,482 | |
| Interest receivable | 593 | |
| Distributions receivable from Fidelity Central Funds | 482 | |
| Prepaid expenses | 7 | |
| Other receivables | 390 | |
| Total assets | 7,454,477 | |
| Liabilities | ||
| Payable for investments purchased | $35,257 | |
| Payable for fund shares redeemed | 13,056 | |
| Accrued management fee | 3,076 | |
| Other affiliated payables | 880 | |
| Other payables and accrued expenses | 431 | |
| Collateral on securities loaned, at value | 277,830 | |
| Total liabilities | 330,530 | |
| Net Assets | $7,123,947 | |
| Net Assets consist of: | ||
| Paid in capital | $5,581,061 | |
| Undistributed net investment income | 17,650 | |
| Accumulated undistributed net realized gain (loss) on investments and foreign currency transactions | 357,099 | |
| Net unrealized appreciation (depreciation) on investments and assets and liabilities in foreign currencies | 1,168,137 | |
| Net Assets | $7,123,947 | |
| Mid-Cap Stock: | ||
| Net Asset Value, offering price and redemption price per share ($5,135,762 ÷ 150,744 shares) | $34.07 | |
| Class K: | ||
| Net Asset Value, offering price and redemption price per share ($1,988,185 ÷ 58,331 shares) | $34.08 |
See accompanying notes which are an integral part of the financial statements.
Statement of Operations
| Amounts in thousands | Year ended April 30, 2016 | |
| Investment Income | ||
| Dividends (including $126 earned from other affiliated issuers) | $88,671 | |
| Interest | 1,473 | |
| Income from Fidelity Central Funds (including $6,672 from security lending) | 7,873 | |
| Total income | 98,017 | |
| Expenses | ||
| Management fee | ||
| Basic fee | $41,089 | |
| Performance adjustment | (1,100) | |
| Transfer agent fees | 9,926 | |
| Accounting and security lending fees | 1,228 | |
| Custodian fees and expenses | 116 | |
| Independent trustees' compensation | 35 | |
| Registration fees | 87 | |
| Audit | 80 | |
| Legal | 30 | |
| Miscellaneous | 55 | |
| Total expenses before reductions | 51,546 | |
| Expense reductions | (362) | 51,184 |
| Net investment income (loss) | 46,833 | |
| Realized and Unrealized Gain (Loss) | ||
| Net realized gain (loss) on: | ||
| Investment securities: | ||
| Unaffiliated issuers | 858,957 | |
| Other affiliated issuers | (1,393) | |
| Foreign currency transactions | (118) | |
| Total net realized gain (loss) | 857,446 | |
| Change in net unrealized appreciation (depreciation) on: Investment securities | (1,201,760) | |
| Assets and liabilities in foreign currencies | 3 | |
| Total change in net unrealized appreciation (depreciation) | (1,201,757) | |
| Net gain (loss) | (344,311) | |
| Net increase (decrease) in net assets resulting from operations | $(297,478) |
See accompanying notes which are an integral part of the financial statements.
Statement of Changes in Net Assets
| Amounts in thousands | Year ended April 30, 2016 | Year ended April 30, 2015 |
| Increase (Decrease) in Net Assets | ||
| Operations | ||
| Net investment income (loss) | $46,833 | $45,281 |
| Net realized gain (loss) | 857,446 | 880,850 |
| Change in net unrealized appreciation (depreciation) | (1,201,757) | (78,888) |
| Net increase (decrease) in net assets resulting from operations | (297,478) | 847,243 |
| Distributions to shareholders from net investment income | (48,569) | (24,651) |
| Distributions to shareholders from net realized gain | (930,371) | (854,512) |
| Total distributions | (978,940) | (879,163) |
| Share transactions - net increase (decrease) | (61,224) | (398,954) |
| Redemption fees | 35 | 117 |
| Total increase (decrease) in net assets | (1,337,607) | (430,757) |
| Net Assets | ||
| Beginning of period | 8,461,554 | 8,892,311 |
| End of period (including undistributed net investment income of $17,650 and undistributed net investment income of $12,057, respectively) | $7,123,947 | $8,461,554 |
See accompanying notes which are an integral part of the financial statements.
Financial Highlights — Fidelity Mid-Cap Stock Fund
| Years ended April 30, | 2016 | 2015 | 2014 | 2013 | 2012 |
| Selected Per–Share Data | |||||
| Net asset value, beginning of period | $40.11 | $40.26 | $33.69 | $30.15 | $31.78 |
| Income from Investment Operations | |||||
| Net investment income (loss)A | .21 | .18 | .10 | .29 | .10 |
| Net realized and unrealized gain (loss) | (1.54) | 3.52 | 7.69 | 4.45 | (.18) |
| Total from investment operations | (1.33) | 3.70 | 7.79 | 4.74 | (.08) |
| Distributions from net investment income | (.22) | (.09) | (.08) | (.33) | (.05) |
| Distributions from net realized gain | (4.49) | (3.76) | (1.14) | (.87) | (1.50) |
| Total distributions | (4.71) | (3.85) | (1.22) | (1.20) | (1.55) |
| Redemption fees added to paid in capitalA,B | – | – | – | – | – |
| Net asset value, end of period | $34.07 | $40.11 | $40.26 | $33.69 | $30.15 |
| Total ReturnC | (3.44)% | 9.83% | 23.50% | 16.54% | .19% |
| Ratios to Average Net AssetsD,E | |||||
| Expenses before reductions | .72% | .73% | .78% | .65% | .86% |
| Expenses net of fee waivers, if any | .72% | .72% | .78% | .65% | .86% |
| Expenses net of all reductions | .72% | .72% | .78% | .63% | .85% |
| Net investment income (loss) | .59% | .46% | .25% | .95% | .36% |
| Supplemental Data | |||||
| Net assets, end of period (in millions) | $5,136 | $5,874 | $5,966 | $4,750 | $5,170 |
| Portfolio turnover rateF | 23%G | 29% | 27% | 46% | 52% |
A Calculated based on average shares outstanding during the period.
B Amount represents less than $.005 per share.
C Total returns would have been lower if certain expenses had not been reduced during the applicable periods shown.
D Fees and expenses of any underlying Fidelity Central Funds are not included in the Fund's expense ratio. The Fund indirectly bears its proportionate share of the expenses of any underlying Fidelity Central Funds.
E Expense ratios reflect operating expenses of the class. Expenses before reductions do not reflect amounts reimbursed by the investment adviser or reductions from brokerage service arrangements or reductions from other expense offset arrangements and do not represent the amount paid by the class during periods when reimbursements or reductions occur. Expenses net of fee waivers reflect expenses after reimbursement by the investment adviser but prior to reductions from brokerage service arrangements or other expense offset arrangements. Expenses net of all reductions represent the net expenses paid by the class.
F Amount does not include the portfolio activity of any underlying Fidelity Central Funds.
G Portfolio turnover rate excludes securities received or delivered in-kind.
See accompanying notes which are an integral part of the financial statements.
Financial Highlights — Fidelity Mid-Cap Stock Fund Class K
| Years ended April 30, | 2016 | 2015 | 2014 | 2013 | 2012 |
| Selected Per–Share Data | |||||
| Net asset value, beginning of period | $40.12 | $40.27 | $33.68 | $30.15 | $31.77 |
| Income from Investment Operations | |||||
| Net investment income (loss)A | .25 | .22 | .15 | .33 | .15 |
| Net realized and unrealized gain (loss) | (1.54) | 3.51 | 7.69 | 4.45 | (.19) |
| Total from investment operations | (1.29) | 3.73 | 7.84 | 4.78 | (.04) |
| Distributions from net investment income | (.26) | (.13) | (.12) | (.38) | (.08) |
| Distributions from net realized gain | (4.49) | (3.76) | (1.14) | (.87) | (1.50) |
| Total distributions | (4.75) | (3.88)B | (1.25)C | (1.25) | (1.58) |
| Redemption fees added to paid in capitalA,D | – | – | – | – | – |
| Net asset value, end of period | $34.08 | $40.12 | $40.27 | $33.68 | $30.15 |
| Total ReturnE | (3.33)% | 9.92% | 23.67% | 16.72% | .35% |
| Ratios to Average Net AssetsF,G | |||||
| Expenses before reductions | .60% | .61% | .65% | .50% | .69% |
| Expenses net of fee waivers, if any | .60% | .61% | .65% | .50% | .69% |
| Expenses net of all reductions | .60% | .61% | .65% | .48% | .68% |
| Net investment income (loss) | .71% | .57% | .39% | 1.11% | .52% |
| Supplemental Data | |||||
| Net assets, end of period (in millions) | $1,988 | $2,588 | $2,927 | $2,447 | $1,643 |
| Portfolio turnover rateH | 23%I | 29% | 27% | 46% | 52% |
A Calculated based on average shares outstanding during the period.
B Total distributions of $3.88 per share is comprised of distributions from net investment income of $.127 and distributions from net realized gain of $3.757 per share.
C Total distributions of $1.25 per share is comprised of distributions from net investment income of $.116 and distributions from net realized gain of $1.136 per share.
D Amount represents less than $.005 per share.
E Total returns would have been lower if certain expenses had not been reduced during the applicable periods shown.
F Fees and expenses of any underlying Fidelity Central Funds are not included in the Fund's expense ratio. The Fund indirectly bears its proportionate share of the expenses of any underlying Fidelity Central Funds.
G Expense ratios reflect operating expenses of the class. Expenses before reductions do not reflect amounts reimbursed by the investment adviser or reductions from brokerage service arrangements or reductions from other expense offset arrangements and do not represent the amount paid by the class during periods when reimbursements or reductions occur. Expenses net of fee waivers reflect expenses after reimbursement by the investment adviser but prior to reductions from brokerage service arrangements or other expense offset arrangements. Expenses net of all reductions represent the net expenses paid by the class.
H Amount does not include the portfolio activity of any underlying Fidelity Central Funds.
I Portfolio turnover rate excludes securities received or delivered in-kind.
See accompanying notes which are an integral part of the financial statements.
Notes to Financial Statements
For the period ended April 30, 2016
(Amounts in thousands except percentages)
1. Organization.
Fidelity Mid-Cap Stock Fund (the Fund) is a fund of Fidelity Commonwealth Trust (the Trust) and is authorized to issue an unlimited number of shares. The Trust is registered under the Investment Company Act of 1940, as amended (the 1940 Act), as an open-end management investment company organized as a Massachusetts business trust. The Fund offers Mid-Cap Stock and Class K shares, each of which has equal rights as to assets and voting privileges.
2. Investments in Fidelity Central Funds.
The Fund invests in Fidelity Central Funds, which are open-end investment companies generally available only to other investment companies and accounts managed by the investment adviser and its affiliates. The Fund's Schedule of Investments lists each of the Fidelity Central Funds held as of period end, if any, as an investment of the Fund, but does not include the underlying holdings of each Fidelity Central Fund. As an Investing Fund, the Fund indirectly bears its proportionate share of the expenses of the underlying Fidelity Central Funds.
The Money Market Central Funds seek preservation of capital and current income and are managed by Fidelity Investments Money Management, Inc. (FIMM), an affiliate of the investment adviser. Annualized expenses of the Money Market Central Funds as of their most recent shareholder report date are less than .005%.
A complete unaudited list of holdings for each Fidelity Central Fund is available upon request or at the Securities and Exchange Commission (the SEC) website at www.sec.gov. In addition, the financial statements of the Fidelity Central Funds, which are not covered by the Fund's Report of Independent Registered Public Accounting Firm, are available on the SEC website or upon request.
3. Significant Accounting Policies.
The financial statements have been prepared in conformity with accounting principles generally accepted in the United States of America (GAAP), which require management to make certain estimates and assumptions at the date of the financial statements. Actual results could differ from those estimates. Subsequent events, if any, through the date that the financial statements were issued have been evaluated in the preparation of the financial statements. The following summarizes the significant accounting policies of the Fund:
Investment Valuation. Investments are valued as of 4:00 p.m. Eastern time on the last calendar day of the period. The Board of Trustees (the Board) has delegated the day to day responsibility for the valuation of the Fund's investments to the Fidelity Management & Research Company (FMR) Fair Value Committee (the Committee). In accordance with valuation policies and procedures approved by the Board, the Fund attempts to obtain prices from one or more third party pricing vendors or brokers to value its investments. When current market prices, quotations or currency exchange rates are not readily available or reliable, investments will be fair valued in good faith by the Committee, in accordance with procedures adopted by the Board. Factors used in determining fair value vary by investment type and may include market or investment specific events, changes in interest rates and credit quality. The frequency with which these procedures are used cannot be predicted and they may be utilized to a significant extent. The Committee oversees the Fund's valuation policies and procedures and reports to the Board on the Committee's activities and fair value determinations. The Board monitors the appropriateness of the procedures used in valuing the Fund's investments and ratifies the fair value determinations of the Committee.
The Fund categorizes the inputs to valuation techniques used to value its investments into a disclosure hierarchy consisting of three levels as shown below:
- Level 1 – quoted prices in active markets for identical investments
- Level 2 – other significant observable inputs (including quoted prices for similar investments, interest rates, prepayment speeds, etc.)
- Level 3 – unobservable inputs (including the Fund's own assumptions based on the best information available)
Valuation techniques used to value the Fund's investments by major category are as follows:
Equity securities, including restricted securities, for which market quotations are readily available, are valued at the last reported sale price or official closing price as reported by a third party pricing vendor on the primary market or exchange on which they are traded and are categorized as Level 1 in the hierarchy. In the event there were no sales during the day or closing prices are not available, securities are valued at the last quoted bid price or may be valued using the last available price and are generally categorized as Level 2 in the hierarchy. For foreign equity securities, when market or security specific events arise, comparisons to the valuation of American Depositary Receipts (ADRs), futures contracts, Exchange-Traded Funds (ETFs) and certain indexes as well as quoted prices for similar securities may be used and would be categorized as Level 2 in the hierarchy. Utilizing these techniques may result in transfers between Level 1 and Level 2. For equity securities, including restricted securities, where observable inputs are limited, assumptions about market activity and risk are used and these securities may be categorized as Level 3 in the hierarchy.
Debt securities, including restricted securities, are valued based on evaluated prices received from third party pricing vendors or from brokers who make markets in such securities. Corporate bonds are valued by pricing vendors who utilize matrix pricing which considers yield or price of bonds of comparable quality, coupon, maturity and type or by broker-supplied prices. When independent prices are unavailable or unreliable, debt securities may be valued utilizing pricing methodologies which consider similar factors that would be used by third party pricing vendors. Debt securities are generally categorized as Level 2 in the hierarchy but may be Level 3 depending on the circumstances.
Investments in open-end mutual funds, including the Fidelity Central Funds, are valued at their closing net asset value (NAV) each business day and are categorized as Level 1 in the hierarchy.
Changes in valuation techniques may result in transfers in or out of an assigned level within the disclosure hierarchy. The aggregate value of investments by input level as of April 30, 2016, including information on transfers between Levels 1 and 2, as well as a roll forward of Level 3 investments, is included at the end of the Fund's Schedule of Investments.
Foreign Currency. The Fund may use foreign currency contracts to facilitate transactions in foreign-denominated securities. Gains and losses from these transactions may arise from changes in the value of the foreign currency or if the counterparties do not perform under the contracts' terms.
Foreign-denominated assets, including investment securities, and liabilities are translated into U.S. dollars at the exchange rates at period end. Purchases and sales of investment securities, income and dividends received and expenses denominated in foreign currencies are translated into U.S. dollars at the exchange rate in effect on the transaction date.
The effects of exchange rate fluctuations on investments are included with the net realized and unrealized gain (loss) on investment securities. Other foreign currency transactions resulting in realized and unrealized gain (loss) are disclosed separately.
Investment Transactions and Income. For financial reporting purposes, the Fund's investment holdings and NAV include trades executed through the end of the last business day of the period. The NAV per share for processing shareholder transactions is calculated as of the close of business of the New York Stock Exchange (NYSE), normally 4:00 p.m. Eastern time and includes trades executed through the end of the prior business day. Gains and losses on securities sold are determined on the basis of identified cost and may include proceeds received from litigation. Dividend income is recorded on the ex-dividend date, except for certain dividends from foreign securities where the ex-dividend date may have passed, which are recorded as soon as the Fund is informed of the ex-dividend date. Non-cash dividends included in dividend income, if any, are recorded at the fair market value of the securities received. Income and capital gain distributions from Fidelity Central Funds, if any, are recorded on the ex-dividend date. Distributions received on securities that represent a return of capital or capital gain are recorded as a reduction of cost of investments and/or as a realized gain. Subsequent to ex-dividend date the Fund determines the components of these distributions, based upon receipt of tax filings or other correspondence relating to the underlying investment. Interest income is accrued as earned and includes coupon interest and amortization of premium and accretion of discount on debt securities as applicable. Investment income is recorded net of foreign taxes withheld where recovery of such taxes is uncertain.
Class Allocations and Expenses. Investment income, realized and unrealized capital gains and losses, common expenses of the Fund, and certain fund-level expense reductions, if any, are allocated daily on a pro-rata basis to each class based on the relative net assets of each class to the total net assets of the Fund. Each class differs with respect to transfer agent fees incurred. Certain expense reductions may also differ by class. For the reporting period, the allocated portion of income and expenses to each class as a percent of its average net assets may vary due to the timing of recording these transactions in relation to fluctuating net assets of the classes. Expenses directly attributable to a fund are charged to that fund. Expenses attributable to more than one fund are allocated among the respective funds on the basis of relative net assets or other appropriate methods. Expense estimates are accrued in the period to which they relate and adjustments are made when actual amounts are known.
Deferred Trustee Compensation. Under a Deferred Compensation Plan (the Plan), independent Trustees may elect to defer receipt of a portion of their annual compensation. Deferred amounts are invested in a cross-section of Fidelity funds, are marked-to-market and remain in the Fund until distributed in accordance with the Plan. The investment of deferred amounts and the offsetting payable to the Trustees are included in the accompanying Statement of Assets and Liabilities.
Income Tax Information and Distributions to Shareholders. Each year, the Fund intends to qualify as a regulated investment company under Subchapter M of the Internal Revenue Code, including distributing substantially all of its taxable income and realized gains. As a result, no provision for U.S. Federal income taxes is required. As of April 30, 2016, the Fund did not have any unrecognized tax benefits in the financial statements; nor is the Fund aware of any tax positions for which it is reasonably possible that the total amounts of unrecognized tax benefits will significantly change in the next twelve months. The Fund files a U.S. federal tax return, in addition to state and local tax returns as required. The Fund's federal income tax returns are subject to examination by the Internal Revenue Service (IRS) for a period of three fiscal years after they are filed. State and local tax returns may be subject to examination for an additional fiscal year depending on the jurisdiction. Foreign taxes are provided for based on the Fund's understanding of the tax rules and rates that exist in the foreign markets in which it invests.
Distributions are declared and recorded on the ex-dividend date. Income dividends and capital gain distributions are declared separately for each class. Income and capital gain distributions are determined in accordance with income tax regulations, which may differ from GAAP. In addition, the Fund claimed a portion of the payment made to redeeming shareholders as a distribution for income tax purposes.
Capital accounts within the financial statements are adjusted for permanent book-tax differences. These adjustments have no impact on net assets or the results of operations. Capital accounts are not adjusted for temporary book-tax differences which will reverse in a subsequent period.
Book-tax differences are primarily due to foreign currency transactions, partnerships, passive foreign investment companies (PFIC), market discount, redemptions in kind, deferred trustees compensation and losses deferred due to wash sales and excise tax regulations.
The federal tax cost of investment securities and unrealized appreciation (depreciation) as of period end were as follows:
| Gross unrealized appreciation | $1,665,992 |
| Gross unrealized depreciation | (506,826) |
| Net unrealized appreciation (depreciation) on securities | $1,159,166 |
| Tax Cost | $6,246,855 |
The tax-based components of distributable earnings as of period end were as follows:
| Undistributed ordinary income | $17,232 |
| Undistributed long-term capital gain | $366,849 |
| Net unrealized appreciation (depreciation) on securities and other investments | $1,159,175 |
The tax character of distributions paid was as follows:
| April 30, 2016 | April 30, 2015 | |
| Ordinary Income | $48,569 | $ 132,304 |
| Long-term Capital Gains | 930,371 | 746,859 |
| Total | $978,940 | $ 879,163 |
Short-Term Trading (Redemption) Fees. Shares held by investors in the Fund less than 30 days may have been subject to a redemption fee equal to .75% of the NAV of shares redeemed. All redemption fees, which reduce the proceeds of the shareholder redemption, are retained by the Fund and accounted for as an addition to paid in capital.
Restricted Securities. The Fund may invest in securities that are subject to legal or contractual restrictions on resale. These securities generally may be resold in transactions exempt from registration or to the public if the securities are registered. Disposal of these securities may involve time-consuming negotiations and expense, and prompt sale at an acceptable price may be difficult. Information regarding restricted securities is included at the end of the Fund's Schedule of Investments.
4. Purchases and Sales of Investments.
Purchases and sales of securities, other than short-term securities and in-kind transactions, aggregated $1,654,108 and $2,379,163, respectively.
Redemptions In-Kind. During the period, 7,169 shares of the Fund held by unaffiliated entities were redeemed in-kind for cash and investments, including accrued interest, with a value of $265,315. The net realized gain of $85,469 on investments delivered through in-kind redemptions is included in the accompanying Statement of Operations. The amount of in-kind redemptions is included in share transactions in the accompanying Statement of Changes in Net Assets as well as Note 10: Share Transactions. The Fund recognized no gain or loss for federal income tax purposes.
5. Fees and Other Transactions with Affiliates.
Management Fee. Fidelity Management & Research Company (the investment adviser) and its affiliates provide the Fund with investment management related services for which the Fund pays a monthly management fee. The management fee is the sum of an individual fund fee rate that is based on an annual rate of .30% of the Fund's average net assets and an annualized group fee rate that averaged .25% during the period. The group fee rate is based upon the average net assets of all the mutual funds advised by the investment adviser, including any mutual funds previously advised by the investment adviser that are currently advised by Fidelity SelectCo, LLC, an affiliate of the investment adviser. The group fee rate decreases as assets under management increase and increases as assets under management decrease. In addition, the management fee is subject to a performance adjustment (up to a maximum of +/- .20% of the Fund's average net assets over a 36 month performance period). The upward or downward adjustment to the management fee is based on the relative investment performance of Mid-Cap Stock as compared to its benchmark index, the S&P MidCap 400 Index, over the same 36 month performance period. For the reporting period, the total annual management fee rate, including the performance adjustment, was .53% of the Fund's average net assets. The performance adjustment included in the management fee rate may be higher or lower than the maximum performance adjustment rate due to the difference between the average net assets for the reporting and performance periods.
Transfer Agent Fees. Fidelity Investments Institutional Operations Company, Inc., (FIIOC), an affiliate of the investment adviser, is the transfer, dividend disbursing and shareholder servicing agent for each class of the Fund. FIIOC receives account fees and asset-based fees that vary according to the account size and type of account of the shareholders of Mid-Cap Stock. FIIOC receives an asset-based fee of Class K's average net assets. FIIOC pays for typesetting, printing and mailing of shareholder reports, except proxy statements.
For the period, transfer agent fees for each class were as follows:
| Amount | % of Class-Level Average Net Assets |
|
| Mid-Cap Stock | $8,902 | .17 |
| Class K | 1,024 | .05 |
| $9,926 |
Accounting and Security Lending Fees. Fidelity Service Company, Inc. (FSC), an affiliate of the investment adviser, maintains the Fund's accounting records. The accounting fee is based on the level of average net assets for each month. Under a separate contract, FSC administers the security lending program. The security lending fee is based on the number and duration of lending transactions.
Brokerage Commissions. The Fund placed a portion of its portfolio transactions with brokerage firms which are affiliates of the investment adviser. Brokerage commissions are included in net realized gain (loss) and change in net unrealized appreciation (depreciation) in the Statement of Operations. The commissions paid to these affiliated firms were $31 for the period.
Interfund Trades. The Fund may purchase from or sell securities to other Fidelity Funds under procedures adopted by the Board. The procedures have been designed to ensure these interfund trades are executed in accordance with Rule 17a-7 of the 1940 Act. Interfund trades are included within the respective purchases and sales amounts shown in the Purchases and Sales of Investments note.
6. Committed Line of Credit.
The Fund participates with other funds managed by the investment adviser or an affiliate in a $4.25 billion credit facility (the "line of credit") to be utilized for temporary or emergency purposes to fund shareholder redemptions or for other short-term liquidity purposes. The Fund has agreed to pay commitment fees on its pro-rata portion of the line of credit, which amounted to $11 and is reflected in Miscellaneous expenses on the Statement of Operations. During the period, the Fund did not borrow on this line of credit.
7. Security Lending.
The Fund lends portfolio securities through a lending agent from time to time in order to earn additional income. For equity securities, a lending agent is used and may loan securities to certain qualified borrowers, including Fidelity Capital Markets (FCM), a broker-dealer affiliated with the Fund. On the settlement date of the loan, the Fund receives collateral (in the form of U.S. Treasury obligations, letters of credit and/or cash) against the loaned securities and maintains collateral in an amount not less than 100% of the market value of the loaned securities during the period of the loan. The market value of the loaned securities is determined at the close of business of the Fund and any additional required collateral is delivered to the Fund on the next business day. The Fund or borrower may terminate the loan at any time, and if the borrower defaults on its obligation to return the securities loaned because of insolvency or other reasons, the Fund may apply collateral received from the borrower against the obligation. The Fund may experience delays and costs in recovering the securities loaned. Any cash collateral received is invested in the Fidelity Securities Lending Cash Central Fund. The value of loaned securities and cash collateral at period end are disclosed on the Fund's Statement of Assets and Liabilities. The value of securities loaned to FCM at period end was $181. Security lending income represents the income earned on investing cash collateral, less rebates paid to borrowers and any lending agent fees associated with the loan, plus any premium payments received for lending certain types of securities. Security lending income is presented in the Statement of Operations as a component of income from Fidelity Central Funds, and includes $561 from securities loaned to FCM.
8. Expense Reductions.
Commissions paid to certain brokers with whom the investment adviser, or its affiliates, places trades on behalf of the Fund include an amount in addition to trade execution, which may be rebated back to the Fund to offset certain expenses. This amount totaled $175 for the period.
Through arrangements with the Fund's custodian, credits realized as a result of certain uninvested cash balances were used to reduce the Fund's expenses. During the period, these credits reduced the Fund's custody expenses by $1.
In addition, during the period the investment adviser reimbursed and/or waived a portion of fund-level operating expenses in the amount of $59 and a portion of class-level operating expenses as follows:
| Amount | |
| Mid-Cap Stock | $127 |
9. Distributions to Shareholders.
Distributions to shareholders of each class were as follows:
| Year ended April 30, 2016 | Year ended April 30, 2015 | |
| From net investment income | ||
| Mid-Cap Stock | $32,540 | $14,061 |
| Class K | 16,029 | 10,590 |
| Total | $48,569 | $24,651 |
| From net realized gain | ||
| Mid-Cap Stock | $657,512 | $555,465 |
| Class K | 272,859 | 299,047 |
| Total | $930,371 | $854,512 |
10. Share Transactions.
Share transactions for each class were as follows and may contain automatic conversions between classes or exchanges between affiliated funds:
| Shares | Shares | Dollars | Dollars | |
| Year ended April 30, 2016 | Year ended April 30, 2015 | Year ended April 30, 2016 | Year ended April 30, 2015 | |
| Mid-Cap Stock | ||||
| Shares sold | 11,317 | 17,879 | $392,342 | $696,252 |
| Reinvestment of distributions | 18,581 | 14,253 | 658,782 | 546,835 |
| Shares redeemed | (25,606) | (33,853) | (889,201) | (1,316,568) |
| Net increase (decrease) | 4,292 | (1,721) | $161,923 | $(73,481) |
| Class K | ||||
| Shares sold | 10,618 | 21,440 | $370,206 | $843,958 |
| Reinvestment of distributions | 8,154 | 8,076 | 288,888 | 309,636 |
| Shares redeemed | (24,946)(a) | (37,691) | (882,241)(a) | (1,479,067) |
| Net increase (decrease) | (6,174) | (8,175) | $(223,147) | $(325,473) |
(a) Amount includes in-kind redemptions (see Note 4: Redemptions In-Kind).
11. Other.
The Fund's organizational documents provide former and current trustees and officers with a limited indemnification against liabilities arising in connection with the performance of their duties to the Fund. In the normal course of business, the Fund may also enter into contracts that provide general indemnifications. The Fund's maximum exposure under these arrangements is unknown as this would be dependent on future claims that may be made against the Fund. The risk of material loss from such claims is considered remote.
Report of Independent Registered Public Accounting Firm
To the Trustees of Fidelity Commonwealth Trust and Shareholders of Fidelity Mid-Cap Stock Fund:
We have audited the accompanying statement of assets and liabilities of Fidelity Mid-Cap Stock Fund (the Fund), a fund of Fidelity Commonwealth Trust, including the schedule of investments, as of April 30, 2016, and the related statement of operations for the year then ended, the statement of changes in net assets for each of the two years in the period then ended, and the financial highlights for each of the five years in the period then ended. These financial statements and financial highlights are the responsibility of the Fund's management. Our responsibility is to express an opinion on these financial statements and financial highlights based on our audits.
We conducted our audits in accordance with the standards of the Public Company Accounting Oversight Board (United States). Those standards require that we plan and perform the audit to obtain reasonable assurance about whether the financial statements and financial highlights are free of material misstatement. The Fund is not required to have, nor were we engaged to perform, an audit of its internal control over financial reporting. Our audits included consideration of internal control over financial reporting as a basis for designing audit procedures that are appropriate in the circumstances, but not for the purpose of expressing an opinion on the effectiveness of the Fund's internal control over financial reporting. Accordingly, we express no such opinion. An audit also includes examining, on a test basis, evidence supporting the amounts and disclosures in the financial statements, assessing the accounting principles used and significant estimates made by management, as well as evaluating the overall financial statement presentation. Our procedures included confirmation of securities owned as of April 30, 2016, by correspondence with the custodians and brokers; when replies were not received from brokers, we performed other auditing procedures. We believe that our audits provide a reasonable basis for our opinion.
In our opinion, such financial statements and financial highlights referred to above present fairly, in all material respects, the financial position of Fidelity Mid-Cap Stock Fund as of April 30, 2016, the results of its operations for the year then ended, the changes in its net assets for each of the two years in the period then ended, and the financial highlights for each of the five years in the period then ended, in conformity with accounting principles generally accepted in the United States of America.
DELOITTE & TOUCHE LLP
Boston, Massachusetts
June 17, 2016
Trustees and Officers
The Trustees, Members of the Advisory Board (if any), and officers of the trust and fund, as applicable, are listed below. The Board of Trustees governs the fund and is responsible for protecting the interests of shareholders. The Trustees are experienced executives who meet periodically throughout the year to oversee the fund's activities, review contractual arrangements with companies that provide services to the fund, oversee management of the risks associated with such activities and contractual arrangements, and review the fund's performance. Each of the Trustees oversees 170 funds.
The Trustees hold office without limit in time except that (a) any Trustee may resign; (b) any Trustee may be removed by written instrument, signed by at least two-thirds of the number of Trustees prior to such removal; (c) any Trustee who requests to be retired or who has become incapacitated by illness or injury may be retired by written instrument signed by a majority of the other Trustees; and (d) any Trustee may be removed at any special meeting of shareholders by a two-thirds vote of the outstanding voting securities of the trust. Each Trustee who is not an interested person (as defined in the 1940 Act) of the trust and the fund is referred to herein as an Independent Trustee. Each Independent Trustee shall retire not later than the last day of the calendar year in which his or her 75th birthday occurs. The Independent Trustees may waive this mandatory retirement age policy with respect to individual Trustees. Officers and Advisory Board Members hold office without limit in time, except that any officer or Advisory Board Member may resign or may be removed by a vote of a majority of the Trustees at any regular meeting or any special meeting of the Trustees. Except as indicated, each individual has held the office shown or other offices in the same company for the past five years.
The fund’s Statement of Additional Information (SAI) includes more information about the Trustees. To request a free copy, call Fidelity at 1-800-544-8544.
Experience, Skills, Attributes, and Qualifications of the Trustees. The Governance and Nominating Committee has adopted a statement of policy that describes the experience, qualifications, attributes, and skills that are necessary and desirable for potential Independent Trustee candidates (Statement of Policy). The Board believes that each Trustee satisfied at the time he or she was initially elected or appointed a Trustee, and continues to satisfy, the standards contemplated by the Statement of Policy. The Governance and Nominating Committee also engages professional search firms to help identify potential Independent Trustee candidates who have the experience, qualifications, attributes, and skills consistent with the Statement of Policy. From time to time, additional criteria based on the composition and skills of the current Independent Trustees, as well as experience or skills that may be appropriate in light of future changes to board composition, business conditions, and regulatory or other developments, have also been considered by the professional search firms and the Governance and Nominating Committee. In addition, the Board takes into account the Trustees' commitment and participation in Board and committee meetings, as well as their leadership of standing and ad hoc committees throughout their tenure.
In determining that a particular Trustee was and continues to be qualified to serve as a Trustee, the Board has considered a variety of criteria, none of which, in isolation, was controlling. The Board believes that, collectively, the Trustees have balanced and diverse experience, qualifications, attributes, and skills, which allow the Board to operate effectively in governing the fund and protecting the interests of shareholders. Information about the specific experience, skills, attributes, and qualifications of each Trustee, which in each case led to the Board's conclusion that the Trustee should serve (or continue to serve) as a trustee of the fund, is provided below.
Board Structure and Oversight Function. James C. Curvey is an interested person and currently serves as Chairman. The Trustees have determined that an interested Chairman is appropriate and benefits shareholders because an interested Chairman has a personal and professional stake in the quality and continuity of services provided to the fund. Independent Trustees exercise their informed business judgment to appoint an individual of their choosing to serve as Chairman, regardless of whether the Trustee happens to be independent or a member of management. The Independent Trustees have determined that they can act independently and effectively without having an Independent Trustee serve as Chairman and that a key structural component for assuring that they are in a position to do so is for the Independent Trustees to constitute a substantial majority for the Board. The Independent Trustees also regularly meet in executive session. Ned C. Lautenbach serves as Chairman of the Independent Trustees and as such (i) acts as a liaison between the Independent Trustees and management with respect to matters important to the Independent Trustees and (ii) with management prepares agendas for Board meetings.
Fidelity® funds are overseen by different Boards of Trustees. The fund's Board oversees Fidelity's high income and certain equity funds, and other Boards oversee Fidelity's investment-grade bond, money market, asset allocation, and sector funds. The asset allocation funds may invest in Fidelity® funds overseen by the fund's Board. The use of separate Boards, each with its own committee structure, allows the Trustees of each group of Fidelity® funds to focus on the unique issues of the funds they oversee, including common research, investment, and operational issues. On occasion, the separate Boards establish joint committees to address issues of overlapping consequences for the Fidelity® funds overseen by each Board.
The Trustees operate using a system of committees to facilitate the timely and efficient consideration of all matters of importance to the Trustees, the fund, and fund shareholders and to facilitate compliance with legal and regulatory requirements and oversight of the fund's activities and associated risks. The Board, acting through its committees, has charged FMR and its affiliates with (i) identifying events or circumstances the occurrence of which could have demonstrably adverse effects on the fund's business and/or reputation; (ii) implementing processes and controls to lessen the possibility that such events or circumstances occur or to mitigate the effects of such events or circumstances if they do occur; and (iii) creating and maintaining a system designed to evaluate continuously business and market conditions in order to facilitate the identification and implementation processes described in (i) and (ii) above. Because the day-to-day operations and activities of the fund are carried out by or through FMR, its affiliates, and other service providers, the fund's exposure to risks is mitigated but not eliminated by the processes overseen by the Trustees. While each of the Board's committees has responsibility for overseeing different aspects of the fund's activities, oversight is exercised primarily through the Operations, Audit, and Compliance Committees. In addition, the Independent Trustees have worked with FMR to enhance the Board's oversight of investment and financial risks, legal and regulatory risks, technology risks, and operational risks, including the development of additional risk reporting to the Board. For example, a working group comprised of Independent Trustees and FMR has worked and continues to work to review the Fidelity® funds' valuation-related activities, reporting and risk management. Appropriate personnel, including but not limited to the fund's Chief Compliance Officer (CCO), FMR's internal auditor, the independent accountants, the fund's Treasurer and portfolio management personnel, make periodic reports to the Board's committees, as appropriate, including an annual review of Fidelity's risk management program for the Fidelity® funds. The responsibilities of each standing committee, including their oversight responsibilities, are described further under "Standing Committees of the Trustees."
Interested Trustees*:
Correspondence intended for a Trustee who is an interested person may be sent to Fidelity Investments, 245 Summer Street, Boston, Massachusetts 02210.
Name, Year of Birth; Principal Occupations and Other Relevant Experience+
James C. Curvey (1935)
Year of Election or Appointment: 2007
Trustee
Chairman of the Board of Trustees
Mr. Curvey also serves as Trustee of other Fidelity® funds. Mr. Curvey is a Director of Fidelity Research & Analysis Co. (investment adviser firm, 2009-present), and Vice Chairman (2007-present) and Director of FMR LLC (diversified financial services company). In addition, Mr. Curvey serves as an Overseer for the Boston Symphony Orchestra and a member of the board of Artis-Naples, Naples, Florida, and as a Trustee for Brewster Academy, Wolfeboro, New Hampshire. Previously, Mr. Curvey served as a Director of Fidelity Investments Money Management, Inc. (investment adviser firm, 2009-2014) and a Director of FMR and FMR Co., Inc. (investment adviser firms, 2007-2014).
Charles S. Morrison (1960)
Year of Election or Appointment: 2014
Trustee
Mr. Morrison also serves as Trustee of other funds. He serves as a Director of Fidelity Investments Money Management, Inc. (FIMM) (investment adviser firm, 2014-present), Director of Fidelity SelectCo, LLC (investment adviser firm, 2014-present), President, Asset Management (2014-present), and is an employee of Fidelity Investments. Previously, Mr. Morrison served as Vice President of Fidelity's Fixed Income and Asset Allocation Funds (2012-2014), President, Fixed Income (2011-2014), Vice President of Fidelity's Money Market Funds (2005-2009), President, Money Market Group Leader of FMR (investment adviser firm, 2009), and Senior Vice President, Money Market Group of FMR (2004-2009). Mr. Morrison also served as Vice President of Fidelity's Bond Funds (2002-2005), certain Balanced Funds (2002-2005), and certain Asset Allocation Funds (2002-2007), and as Senior Vice President (2002-2005) of Fidelity's Bond Division.
* Determined to be an “Interested Trustee” by virtue of, among other things, his or her affiliation with the trust or various entities under common control with FMR.
+ The information includes the Trustee's principal occupation during the last five years and other information relating to the experience, attributes, and skills relevant to the Trustee's qualifications to serve as a Trustee, which led to the conclusion that the Trustee should serve as a Trustee for the fund.
Independent Trustees:
Correspondence intended for an Independent Trustee may be sent to Fidelity Investments, P.O. Box 55235, Boston, Massachusetts 02205-5235.
Name, Year of Birth; Principal Occupations and Other Relevant Experience+
Dennis J. Dirks (1948)
Year of Election or Appointment: 2005
Trustee
Mr. Dirks also serves as Trustee of other Fidelity® funds. Prior to his retirement in May 2003, Mr. Dirks was Chief Operating Officer and a member of the Board of The Depository Trust & Clearing Corporation (DTCC). He also served as President, Chief Operating Officer, and Board member of The Depository Trust Company (DTC) and President and Board member of the National Securities Clearing Corporation (NSCC). In addition, Mr. Dirks served as Chief Executive Officer and Board member of the Government Securities Clearing Corporation, Chief Executive Officer and Board member of the Mortgage-Backed Securities Clearing Corporation, as a Trustee and a member of the Finance Committee of Manhattan College (2005-2008), as a Trustee and a member of the Finance Committee of AHRC of Nassau County (2006-2008), and as a member of the Independent Directors Council (IDC) Governing Council (2010-2015). Mr. Dirks is a member of the Board of Directors for The Brookville Center for Children's Services, Inc. (2009-present).
Alan J. Lacy (1953)
Year of Election or Appointment: 2008
Trustee
Mr. Lacy also serves as Trustee of other Fidelity® funds. Mr. Lacy serves as Chairman (2014-present) and a member (2010-present) of the Board of Directors of Dave & Buster's Entertainment, Inc. (restaurant and entertainment complexes) and a Director of Bristol-Myers Squibb Company (global pharmaceuticals, 2008-present). He is a Trustee of the California Chapter of The Nature Conservancy (2015-present) and a Director of the Center for Advanced Study in the Behavioral Sciences at Stanford University (2015-present). In addition, Mr. Lacy served as Senior Adviser (2007-2014) of Oak Hill Capital Partners, L.P. (private equity) and also served as Chief Executive Officer (2005) and Vice Chairman (2005-2006) of Sears Holdings Corporation (retail) and Chief Executive Officer and Chairman of the Board of Sears, Roebuck and Co. (retail, 2000-2005). Previously, Mr. Lacy served as Chairman (2008-2011) and a member (2006-2015) of the Board of Trustees of the National Parks Conservation Association and as a member of the Board of Directors for The Western Union Company (global money transfer, 2006-2011), The Hillman Companies, Inc. (hardware wholesalers, 2010-2014), and Earth Fare, Inc. (retail grocery, 2010-2014).
Ned C. Lautenbach (1944)
Year of Election or Appointment: 2000
Trustee
Chairman of the Independent Trustees
Mr. Lautenbach also serves as Trustee of other Fidelity® funds. Mr. Lautenbach currently serves as the Lead Director of the Eaton Corporation Board of Directors (diversified industrial, 1997-present). Mr. Lautenbach is Chairman of the Board of Directors of Artis-Naples in Naples, Florida (2012-present), a member of the Council on Foreign Relations (1994-present), and a member of the Board of Governors, State University System of Florida (2013-present). Previously, Mr. Lautenbach was a Partner/Advisory Partner at Clayton, Dubilier & Rice, LLC (private equity investment, 1998-2010), as well as a Director of Sony Corporation (2006-2007).
Joseph Mauriello (1944)
Year of Election or Appointment: 2008
Trustee
Mr. Mauriello also serves as Trustee of other Fidelity® funds. Prior to his retirement in January 2006, Mr. Mauriello served in numerous senior management positions including Deputy Chairman and Chief Operating Officer (2004-2005), and Vice Chairman of Financial Services (2002-2004) of KPMG LLP US (professional services, 1965-2005). Mr. Mauriello currently serves as a member of the Board of Directors of XL Group plc. (global insurance and re-insurance, 2006-present) and the Independent Directors Council (IDC) Governing Council (2015-present). Previously, Mr. Mauriello served as a Director of the Hamilton Funds of the Bank of New York (2006-2007) and of Arcadia Resources Inc. (health care services and products, 2007-2012).
Robert W. Selander (1950)
Year of Election or Appointment: 2011
Trustee
Mr. Selander also serves as Trustee of other Fidelity® funds. Mr. Selander serves as a Director of The Western Union Company (global money transfer, 2014-present) and a non-executive Chairman of Health Equity, Inc. (health savings custodian, 2015-present). Previously, Mr. Selander served as a Member of the Advisory Board of certain Fidelity® funds (2011), and Executive Vice Chairman (2010), Chief Executive Officer (2009-2010), and President and Chief Executive Officer (1997-2009) of Mastercard, Inc.
Cornelia M. Small (1944)
Year of Election or Appointment: 2005
Trustee
Ms. Small also serves as Trustee of other Fidelity® funds. Ms. Small is a member of the Board of Directors (2009-present) and Chair of the Investment Committee (2010-present) of the Teagle Foundation. Ms. Small also serves on the Investment Committee of the Berkshire Taconic Community Foundation (2008-present). Previously, Ms. Small served as Chairperson (2002-2008) and a member of the Investment Committee and Chairperson (2008-2012) and a member of the Board of Trustees of Smith College. In addition, Ms. Small served as Chief Investment Officer, Director of Global Equity Investments, and a member of the Board of Directors of Scudder, Stevens & Clark and Scudder Kemper Investments.
William S. Stavropoulos (1939)
Year of Election or Appointment: 2002
Trustee
Vice Chairman of the Independent Trustees
Mr. Stavropoulos also serves as Trustee of other Fidelity® funds. Mr. Stavropoulos serves as President and Founder of the Michigan Baseball Foundation, the Great Lakes Loons (2007-present). Mr. Stavropoulos is Chairman Emeritus of the Board of Directors of The Dow Chemical Company, where he previously served in numerous senior management positions, including President, CEO (1995-2000; 2002-2004), Chairman of the Executive Committee (2000-2006), and as a member of the Board of Directors (1990-2006). Currently, Mr. Stavropoulos is Chairman of the Board of Directors of Univar Inc. (global distributor of commodity and specialty chemicals), a Director of Teradata Corporation (data warehousing and technology solutions), and Maersk Inc. (industrial conglomerate), and a member of the Advisory Board for Metalmark Capital LLC (private equity investment, 2005-present). Mr. Stavropoulos is an operating advisor to Clayton, Dubilier & Rice, LLC (private equity investment). In addition, Mr. Stavropoulos is a member of the University of Notre Dame Advisory Council for the College of Science, a Trustee of the Rollin L. Gerstacker Foundation, and a Director of the Naples Philharmonic Center for the Arts. Previously, Mr. Stavropoulos served as a Director of Chemical Financial Corporation (bank holding company, 1993-2012) and Tyco International, Ltd. (multinational manufacturing and services, 2007-2012).
David M. Thomas (1949)
Year of Election or Appointment: 2008
Trustee
Mr. Thomas also serves as Trustee of other Fidelity® funds. Mr. Thomas serves as Non-Executive Chairman of the Board of Directors of Fortune Brands Home and Security (home and security products, 2011-present), as a member of the Board of Directors (2004-present) and Presiding Director (2013-present) of Interpublic Group of Companies, Inc. (marketing communication), and as a member of the Board of Trustees of the University of Florida (2013-present). Previously, Mr. Thomas served as Executive Chairman (2005-2006) and Chairman and Chief Executive Officer (2000-2005) of IMS Health, Inc. (pharmaceutical and healthcare information solutions), and a Director of Fortune Brands, Inc. (consumer products, 2000-2011).
+ The information includes the Trustee's principal occupation during the last five years and other information relating to the experience, attributes, and skills relevant to the Trustee's qualifications to serve as a Trustee, which led to the conclusion that the Trustee should serve as a Trustee for the fund.
Advisory Board Members and Officers:
Correspondence intended for an officer or Peter S. Lynch may be sent to Fidelity Investments, 245 Summer Street, Boston, Massachusetts 02210. Officers appear below in alphabetical order.
Name, Year of Birth; Principal Occupation
Peter S. Lynch (1944)
Year of Election or Appointment: 2003
Member of the Advisory Board
Mr. Lynch also serves as Member of the Advisory Board of other Fidelity® funds. Mr. Lynch is Vice Chairman and a Director of FMR (investment adviser firm) and FMR Co., Inc. (investment adviser firm). In addition, Mr. Lynch serves as a Trustee of Boston College and as the Chairman of the Inner-City Scholarship Fund. Previously, Mr. Lynch served on the Special Olympics International Board of Directors (1997-2006).
Marc R. Bryant (1966)
Year of Election or Appointment: 2015
Secretary and Chief Legal Officer (CLO)
Mr. Bryant also serves as Secretary and CLO of other funds. Mr. Bryant serves as CLO, Secretary, and Senior Vice President of Fidelity Management & Research Company (investment adviser firm, 2015-present) and FMR Co., Inc. (investment adviser firm, 2015-present); Secretary of Fidelity SelectCo, LLC (investment adviser firm, 2015-present) and Fidelity Investments Money Management, Inc. (investment adviser firm, 2015-present); and CLO of Fidelity Management & Research (Hong Kong) Limited and FMR Investment Management (U.K.) Limited (investment adviser firms, 2015-present) and Fidelity Management & Research (Japan) Limited (investment adviser firm, 2016-present). He is Senior Vice President and Deputy General Counsel of FMR LLC (diversified financial services company). Previously, Mr. Bryant served as Secretary and CLO of Fidelity Rutland Square Trust II (2010-2014) and Assistant Secretary of Fidelity's Fixed Income and Asset Allocation Funds (2013-2015). Prior to joining Fidelity Investments, Mr. Bryant served as a Senior Vice President and the Head of Global Retail Legal for AllianceBernstein L.P. (2006-2010), and as the General Counsel for ProFund Advisors LLC (2001-2006).
William C. Coffey (1969)
Year of Election or Appointment: 2009
Assistant Secretary
Mr. Coffey also serves as Assistant Secretary of other funds. He is Senior Vice President and Deputy General Counsel of FMR LLC (diversified financial services company, 2010-present), and is an employee of Fidelity Investments. Previously, Mr. Coffey served as Vice President and Associate General Counsel of FMR LLC (2005-2009).
Jeffrey S. Christian (1961)
Year of Election or Appointment: 2016
Assistant Treasurer
Mr. Christian also serves as Assistant Treasurer of other funds. Mr. Christian is an employee of Fidelity Investments (2003-present).
Jonathan Davis (1968)
Year of Election or Appointment: 2010
Assistant Treasurer
Mr. Davis also serves as Assistant Treasurer of other funds, and is an employee of Fidelity Investments. Previously, Mr. Davis served as Vice President and Associate General Counsel of FMR LLC (diversified financial services company, 2003-2010).
Adrien E. Deberghes (1967)
Year of Election or Appointment: 2016
Assistant Treasurer
Mr. Deberghes also serves as an officer of other funds. He is an employee of Fidelity Investments (2008-present). Prior to joining Fidelity Investments, Mr. Deberghes was Senior Vice President of Mutual Fund Administration at State Street Corporation (2007-2008), Senior Director of Mutual Fund Administration at Investors Bank & Trust (2005-2007), and Director of Finance for Dunkin' Brands (2000-2005). Previously, Mr. Deberghes served in other fund officer roles.
Stephanie J. Dorsey (1969)
Year of Election or Appointment: 2010
Assistant Treasurer
Ms. Dorsey also serves as an officer of other funds. She is an employee of Fidelity Investments (2008-present) and has served in other fund officer roles. Prior to joining Fidelity Investments, Ms. Dorsey served as Treasurer (2004-2008) of the JPMorgan Mutual Funds and Vice President (2004-2008) of JPMorgan Chase Bank.
Howard J. Galligan III (1966)
Year of Election or Appointment: 2014
Chief Financial Officer
Mr. Galligan also serves as Chief Financial Officer of other funds. Mr. Galligan serves as President of Fidelity Pricing and Cash Management Services (FPCMS) (2014-present) and as a Director of Strategic Advisers, Inc. (investment adviser firm, 2008-present). Previously, Mr. Galligan served as Chief Administrative Officer of Asset Management (2011-2014) and Chief Operating Officer and Senior Vice President of Investment Support for Strategic Advisers, Inc. (2003-2011).
Scott C. Goebel (1968)
Year of Election or Appointment: 2015
Vice President
Mr. Goebel serves as Vice President of other funds and is an employee of Fidelity Investments (2001-present). Previously, Mr. Goebel served as Secretary of Fidelity SelectCo, LLC (investment adviser firm, 2013-2015), Fidelity Investments Money Management, Inc. (FIMM) (investment adviser firm, 2010-2015), and Fidelity Research and Analysis Company (FRAC) (investment adviser firm, 2010-2015); General Counsel, Secretary, and Senior Vice President of Fidelity Management & Research Company (investment adviser firm, 2008-2015) and FMR Co., Inc. (investment adviser firm, 2008-2015); Assistant Secretary of Fidelity Management & Research (Japan) Limited (investment adviser firm, 2008-2015) and Fidelity Management & Research (U.K.) Inc. (investment adviser firm, 2008-2015); Chief Legal Officer (CLO) of Fidelity Management & Research (Hong Kong) Limited (investment adviser firm, 2008-2015); Secretary and CLO of certain Fidelity® funds (2008-2015); Assistant Secretary of FIMM (2008-2010), FRAC (2008-2010), and certain funds (2007-2008); and as Vice President and Secretary of Fidelity Distributors Corporation (FDC) (2005-2007).
Brian B. Hogan (1964)
Year of Election or Appointment: 2009
Vice President
Mr. Hogan also serves as Trustee or Vice President of other funds. Mr. Hogan serves as a Director of FMR Investment Management (U.K.) Limited (investment adviser firm, 2015-present) and Fidelity SelectCo, LLC (investment adviser firm, 2014-present) and President of the Equity Division of FMR (investment adviser firm, 2009-present). Previously, Mr. Hogan served as Senior Vice President, Equity Research of FMR (2006-2009) and as a portfolio manager. Mr. Brian B. Hogan is not related to Mr. Colm A. Hogan.
Colm A. Hogan (1973)
Year of Election or Appointment: 2016
Deputy Treasurer
Mr. Hogan also serves as an officer of other funds. Mr. Hogan is an employee of Fidelity Investments (2005-present). Mr. Colm A. Hogan is not related to Mr. Brian B. Hogan.
Chris Maher (1972)
Year of Election or Appointment: 2013
Assistant Treasurer
Mr. Maher serves as Assistant Treasurer of other funds. Mr. Maher is Vice President of Valuation Oversight and is an employee of Fidelity Investments. Previously, Mr. Maher served as Vice President of Asset Management Compliance (2013), Vice President of the Program Management Group of FMR (investment adviser firm, 2010-2013), and Vice President of Valuation Oversight (2008-2010).
John F. Papandrea (1972)
Year of Election or Appointment: 2016
Anti-Money Laundering (AML) Officer
Mr. Papandrea also serves as AML Officer of other funds. Mr. Papandrea is Vice President of FMR LLC (diversified financial services company, 2008-present) and is an employee of Fidelity Investments (2005-present).
Melissa M. Reilly (1971)
Year of Election or Appointment: 2014
Vice President of certain Equity Funds
Ms. Reilly also serves as Vice President of other funds. Ms. Reilly is an employee of Fidelity Investments (2004-present).
Kenneth B. Robins (1969)
Year of Election or Appointment: 2016
Chief Compliance Officer
Mr. Robins also serves as an officer of other funds. Mr. Robins serves as Executive Vice President of Fidelity Investments Money Management, Inc. (FIMM) (investment adviser firm, 2013-present) and is an employee of Fidelity Investments (2004-present). Previously, Mr. Robins served in other fund officer roles.
Stacie M. Smith (1974)
Year of Election or Appointment: 2016
President and Treasurer
Ms. Smith also serves as an officer of other funds. She is an employee of Fidelity Investments (2009-present) and has served in other fund officer roles. Prior to joining Fidelity Investments, Ms. Smith served as Senior Audit Manager of Ernst & Young LLP (1996-2009). Previously, Ms. Smith served as Deputy Treasurer of certain Fidelity® funds (2013-2016).
Renee Stagnone (1975)
Year of Election or Appointment: 2016
Assistant Treasurer
Ms. Stagnone also serves as an officer of other funds. Ms. Stagnone is an employee of Fidelity Investments (1997-present). Previously, Ms. Stagnone served as Deputy Treasurer of certain Fidelity® funds (2013-2016).
Shareholder Expense Example
As a shareholder of the Fund, you incur two types of costs: (1) transaction costs, including redemption fees and (2) ongoing costs, including management fees and other Fund expenses. This Example is intended to help you understand your ongoing costs (in dollars) of investing in the Fund and to compare these costs with the ongoing costs of investing in other mutual funds.
The Example is based on an investment of $1,000 invested at the beginning of the period and held for the entire period (November 1, 2015 to April 30, 2016).
Actual Expenses
The first line of the accompanying table for each class of the Fund provides information about actual account values and actual expenses. You may use the information in this line, together with the amount you invested, to estimate the expenses that you paid over the period. Simply divide your account value by $1,000.00 (for example, an $8,600 account value divided by $1,000.00 = 8.6), then multiply the result by the number in the first line for a class of the Fund under the heading entitled "Expenses Paid During Period" to estimate the expenses you paid on your account during this period. A small balance maintenance fee of $12.00 that is charged once a year may apply for certain accounts with a value of less than $2,000. This fee is not included in the table below. If it was, the estimate of expenses you paid during the period would be higher, and your ending account value lower, by this amount. In addition, the Fund, as a shareholder in the underlying Fidelity Central Funds, will indirectly bear its pro-rata share of the fees and expenses incurred by the underlying Fidelity Central Funds. These fees and expenses are not included in the Fund's annualized expense ratio used to calculate the expense estimate in the table below.
Hypothetical Example for Comparison Purposes
The second line of the accompanying table for each class of the Fund provides information about hypothetical account values and hypothetical expenses based on a Class' actual expense ratio and an assumed rate of return of 5% per year before expenses, which is not the Class' actual return. The hypothetical account values and expenses may not be used to estimate the actual ending account balance or expenses you paid for the period. You may use this information to compare the ongoing costs of investing in the Fund and other funds. To do so, compare this 5% hypothetical example with the 5% hypothetical examples that appear in the shareholder reports of the other funds. A small balance maintenance fee of $12.00 that is charged once a year may apply for certain accounts with a value of less than $2,000. This fee is not included in the table below. If it was, the estimate of expenses you paid during the period would be higher, and your ending account value lower, by this amount. In addition, the Fund, as a shareholder in the underlying Fidelity Central Funds, will indirectly bear its pro-rata share of the fees and expenses incurred by the underlying Fidelity Central Funds. These fees and expenses are not included in the Fund's annualized expense ratio used to calculate the expense estimate in the table below.
Please note that the expenses shown in the table are meant to highlight your ongoing costs only and do not reflect any transaction costs. Therefore, the second line of the table is useful in comparing ongoing costs only, and will not help you determine the relative total costs of owning different funds. In addition, if these transactional costs were included, your costs would have been higher.
| Annualized Expense Ratio-A | Beginning Account Value November 1, 2015 | Ending Account Value April 30, 2016 | Expenses Paid During Period-B November 1, 2015 to April 30, 2016 |
|
| Mid-Cap Stock | .74% | |||
| Actual | $1,000.00 | $1,001.20 | $3.68 | |
| Hypothetical-C | $1,000.00 | $1,021.18 | $3.72 | |
| Class K | .62% | |||
| Actual | $1,000.00 | $1,001.50 | $3.09 | |
| Hypothetical-C | $1,000.00 | $1,021.78 | $3.12 |
A Annualized expense ratio reflects expenses net of applicable fee waivers.
B Expenses are equal to each Class' annualized expense ratio, multiplied by the average account value over the period, multiplied by 182/366 (to reflect the one-half year period).
C 5% return per year before expenses
Distributions (Unaudited)
The Board of Trustees of Fidelity Mid-Cap Stock Fund voted to pay to shareholders of record at the opening of business on record date, the following distributions per share derived from capital gains realized from sales of portfolio securities, and dividends derived from net investment income:
| Pay Date | Record Date | Dividends | Capital Gains | |
| Fidelity Mid-Cap Stock Fund | ||||
| Mid-Cap Stock Fund | 06/13/16 | 06/10/16 | $0.082 | $1.769 |
| Class K | 06/13/16 | 06/10/16 | $0.095 | $1.769 |
The fund hereby designates as a capital gain dividend with respect to the taxable year ended April 30, 2016, $728,675,220, or, if subsequently determined to be different, the net capital gain of such year.
Mid-Cap Stock Fund and Class K designates 100% of the dividends distributed during the fiscal year as qualifying for the dividends–received deduction for corporate shareholders.
Mid-Cap Stock Fund and Class K designates 100% of the dividends distributed during the fiscal year as amounts which may be taken into account as a dividend for purposes of the maximum rate under section 1(h)(11) of the Internal Revenue Code.
The fund will notify shareholders in January 2017 of amounts for use in preparing 2016 income tax returns.
![]()
Corporate Headquarters
245 Summer St.
Boston, MA 02210
www.fidelity.com
MCS-ANN-0616
1.703594.118
|
Fidelity Advisor® Event Driven Opportunities Fund Class A, Class T and Class C Annual Report April 30, 2016 |
|
|
Contents
To view a fund's proxy voting guidelines and proxy voting record for the 12-month period ended June 30, visit http://www.fidelity.com/proxyvotingresults or visit the Securities and Exchange Commission's (SEC) web site at http://www.sec.gov.
You may also call 1-877-208-0098 to request a free copy of the proxy voting guidelines.
Standard & Poor's, S&P and S&P 500 are registered service marks of The McGraw-Hill Companies, Inc. and have been licensed for use by Fidelity Distributors Corporation.
Other third-party marks appearing herein are the property of their respective owners.
All other marks appearing herein are registered or unregistered trademarks or service marks of FMR LLC or an affiliated company. © 2016 FMR LLC. All rights reserved.
This report and the financial statements contained herein are submitted for the general information of the shareholders of the Fund. This report is not authorized for distribution to prospective investors in the Fund unless preceded or accompanied by an effective prospectus.
A fund files its complete schedule of portfolio holdings with the SEC for the first and third quarters of each fiscal year on Form N-Q. Forms N-Q are available on the SEC’s web site at http://www.sec.gov. A fund's Forms N-Q may be reviewed and copied at the SEC’s Public Reference Room in Washington, DC. Information regarding the operation of the SEC's Public Reference Room may be obtained by calling 1-800-SEC-0330.
For a complete list of a fund's portfolio holdings, view the most recent holdings listing, semiannual report, or annual report on Fidelity's web site at http://www.fidelity.com, http://www.advisor.fidelity.com, or http://www.401k.com, as applicable.
NOT FDIC INSURED •MAY LOSE VALUE •NO BANK GUARANTEE
Neither the Fund nor Fidelity Distributors Corporation is a bank.
Performance: The Bottom Line
Average annual total return reflects the change in the value of an investment, assuming reinvestment of distributions from dividend income and capital gains (the profits earned upon the sale of securities that have grown in value, if any) and assuming a constant rate of performance each year. The hypothetical investment and the average annual total returns do not reflect the deduction of taxes that a shareholder would pay on fund distributions or the redemption of fund shares. During periods of reimbursement by Fidelity, a fund’s total return will be greater than it would be had the reimbursement not occurred. How a fund did yesterday is no guarantee of how it will do tomorrow.
Average Annual Total Returns
| For the periods ended April 30, 2016 | Past 1 year | Life of fundA |
| Class A (incl. 5.75% sales charge) | (8.10)% | 2.29% |
| Class T (incl. 3.50% sales charge) | (6.17)% | 3.06% |
| Class C (incl. contingent deferred sales charge) | (4.19)% | 4.08% |
A From December 12, 2013
Class C shares' contingent deferred sales charges included in the past one year and life of fund total return figures are 1% and 0%, respectively.
$10,000 Over Life of Fund
Let's say hypothetically that $10,000 was invested in Fidelity Advisor® Event Driven Opportunities Fund - Class A on December 12, 2013, when the fund started, and the current 5.75% sales charge was paid.
The chart shows how the value of your investment would have changed, and also shows how the Russell 3000® Index performed over the same period.

| Period Ending Values | ||
|
| $10,554 | Fidelity Advisor® Event Driven Opportunities Fund - Class A |
|
| $11,992 | Russell 3000® Index |
Management's Discussion of Fund Performance
Market Recap: The S&P 500® index gained 1.21% for the 12 months ending April 30, 2016. Largely range-bound until mid-August, U.S. stocks suffered a steep, late-summer decline on concern about an economic slowdown in China. The market recovered in October, lifted by the U.S. Federal Reserve’s decision to delay raising near-term interest rates until mid-December, as well as a rate cut in China and economic stimulus in Europe. But continued oil-price weakness and U.S.-dollar strength pushed the S&P 500® to its worst January since 2009, followed by a volatile but ultimately flattish February, then a sharp rebound in March driven by U.S. jobs gains and perceived softening in the Fed’s rate-tightening posture. April brought minimal change. For the full period, growth-oriented and larger-cap stocks fared better overall than value and smaller-cap complements. Performance was split, as five of 10 S&P 500® sectors gained ground, with a wide gap separating leaders from laggards. Investor demand for more-stable and higher-yielding investments boosted traditionally defensive, dividend-rich groups such as utilities (+14%), telecommunication services (+10%) and consumer staples (+11%) – the latter also buoyed by rising wages and low inflation. Meanwhile, energy (-14%) foundered amid commodity weakness that also hurt materials (-4%). Comments from Portfolio Manager Arvind Navaratnam: For the year, the fund’s share classes (excluding sales charges, if applicable) underperformed the -0.18% result of the benchmark Russell 3000® Index. Versus the benchmark, stock selection hurt performance, as did the fund’s inherent small-cap bias because small caps lagged their large-cap peers, which dominate the Russell index. Our stake in Canada-based Valeant Pharmaceuticals International was the fund’s largest relative detractor. The stock underperformed during the period, as shares of Valeant tumbled in October after short-selling research firm Citron accused Valeant of filing fake invoices with one of its business partners in order to show increased revenue. Then, in mid-March, the firm said it may default on its debt and would not meet earnings targets. Valeant also announced an accounting error that it said would likely lead to financial restatements. On the flip side, the fund’s large stake in Journal Media Group was by far its biggest contributor. In March 2015, E.W. Scripps and Journal Communications Media announced their intent to merge the two firms’ broadcast assets and spin off both of their newspaper businesses into one company, Journal Media. Journal produces local newspapers in 14 markets across the United States. The stock popped in October after media firm Gannett announced it would acquire Journal at a premium. In March, Journal Media shareholders approved the deal, which was completed in April.The views expressed above reflect those of the portfolio manager(s) only through the end of the period as stated on the cover of this report and do not necessarily represent the views of Fidelity or any other person in the Fidelity organization. Any such views are subject to change at any time based upon market or other conditions and Fidelity disclaims any responsibility to update such views. These views may not be relied on as investment advice and, because investment decisions for a Fidelity fund are based on numerous factors, may not be relied on as an indication of trading intent on behalf of any Fidelity fund.
Investment Summary (Unaudited)
Top Ten Stocks as of April 30, 2016
| % of fund's net assets | % of fund's net assets 6 months ago | |
| Universal Corp. | 10.3 | 10.2 |
| Exterran Corp. | 3.2 | 0.0 |
| Time, Inc. | 3.2 | 0.8 |
| Triumph Group, Inc. | 3.0 | 1.0 |
| Mondelez International, Inc. | 3.0 | 0.9 |
| TopBuild Corp. | 3.0 | 0.9 |
| Outerwall, Inc. | 3.0 | 0.0 |
| The Madison Square Garden Co. | 2.9 | 1.0 |
| The Brink's Co. | 2.6 | 0.9 |
| Kimball Electronics, Inc. | 2.5 | 0.9 |
| 36.7 |
Top Five Market Sectors as of April 30, 2016
| % of fund's net assets | % of fund's net assets 6 months ago | |
| Consumer Discretionary | 25.0 | 31.2 |
| Industrials | 13.6 | 15.3 |
| Financials | 13.4 | 11.7 |
| Consumer Staples | 13.3 | 14.7 |
| Health Care | 9.2 | 7.3 |
Asset Allocation (% of fund's net assets)
| As of April 30, 2016* | ||
| Stocks and Equity Futures | 99.3% | |
| Short-Term Investments and Net Other Assets (Liabilities) | 0.7% | |

* Foreign investments - 2.8%
| As of October 31, 2015* | ||
| Stocks | 99.8% | |
| Short-Term Investments and Net Other Assets (Liabilities) | 0.2% | |

* Foreign investments - 7.6%
Percentages shown as 0.0% may reflect amounts less than 0.05%.
Investments April 30, 2016
Showing Percentage of Net Assets
| Common Stocks - 85.5% | |||
| Shares | Value | ||
| CONSUMER DISCRETIONARY - 25.0% | |||
| Diversified Consumer Services - 2.1% | |||
| Apollo Education Group, Inc. Class A (non-vtg.) (a) | 21,700 | $169,260 | |
| Hotels, Restaurants & Leisure - 0.9% | |||
| Darden Restaurants, Inc. | 1,230 | 76,568 | |
| Household Durables - 3.0% | |||
| TopBuild Corp. (a) | 7,732 | 241,393 | |
| Internet & Catalog Retail - 0.9% | |||
| Liberty TripAdvisor Holdings, Inc. (a) | 3,211 | 70,835 | |
| Leisure Products - 1.7% | |||
| Vista Outdoor, Inc. (a) | 2,970 | 142,501 | |
| Media - 10.3% | |||
| Cable One, Inc. | 196 | 89,956 | |
| Gannett Co., Inc. | 3,836 | 64,637 | |
| The Madison Square Garden Co. (a) | 1,506 | 236,412 | |
| Time, Inc. | 17,631 | 259,176 | |
| Twenty-First Century Fox, Inc. Class B | 6,157 | 185,449 | |
| 835,630 | |||
| Specialty Retail - 5.8% | |||
| Barnes & Noble Education, Inc. (a) | 17,751 | 166,149 | |
| Outerwall, Inc. | 5,800 | 239,598 | |
| Signet Jewelers Ltd. | 587 | 63,725 | |
| 469,472 | |||
| Textiles, Apparel & Luxury Goods - 0.3% | |||
| Fossil Group, Inc. (a) | 600 | 24,300 | |
| TOTAL CONSUMER DISCRETIONARY | 2,029,959 | ||
| CONSUMER STAPLES - 13.3% | |||
| Food Products - 3.0% | |||
| Mondelez International, Inc. | 5,728 | 246,075 | |
| Tobacco - 10.3% | |||
| Universal Corp. | 15,263 | 832,592 | |
| TOTAL CONSUMER STAPLES | 1,078,667 | ||
| ENERGY - 3.2% | |||
| Energy Equipment & Services - 3.2% | |||
| Exterran Corp. (a) | 17,340 | 265,302 | |
| FINANCIALS - 13.4% | |||
| Capital Markets - 4.8% | |||
| Ashford, Inc. (a) | 920 | 41,860 | |
| Greenhill & Co., Inc. | 8,520 | 187,610 | |
| NorthStar Asset Management Group, Inc. | 12,926 | 160,799 | |
| 390,269 | |||
| Consumer Finance - 2.1% | |||
| Encore Capital Group, Inc. (a) | 6,114 | 172,109 | |
| Insurance - 0.8% | |||
| FNF Group | 2,095 | 66,831 | |
| Real Estate Investment Trusts - 3.9% | |||
| Four Corners Property Trust, Inc. | 8,814 | 156,449 | |
| WP Glimcher, Inc. | 15,490 | 162,490 | |
| 318,939 | |||
| Thrifts & Mortgage Finance - 1.8% | |||
| Fannie Mae (a) | 42,135 | 71,630 | |
| Freddie Mac (a) | 46,035 | 71,354 | |
| 142,984 | |||
| TOTAL FINANCIALS | 1,091,132 | ||
| HEALTH CARE - 9.2% | |||
| Biotechnology - 1.9% | |||
| Baxalta, Inc. | 3,730 | 156,474 | |
| Health Care Equipment & Supplies - 1.9% | |||
| Halyard Health, Inc. (a) | 2,854 | 80,369 | |
| Masimo Corp. (a) | 1,714 | 74,302 | |
| 154,671 | |||
| Health Care Technology - 1.1% | |||
| Allscripts Healthcare Solutions, Inc. (a) | 6,780 | 90,852 | |
| Pharmaceuticals - 4.3% | |||
| DepoMed, Inc. (a) | 9,600 | 166,848 | |
| Valeant Pharmaceuticals International, Inc. (United States) (a) | 2,507 | 83,634 | |
| Zoetis, Inc. Class A | 2,035 | 95,706 | |
| 346,188 | |||
| TOTAL HEALTH CARE | 748,185 | ||
| INDUSTRIALS - 13.6% | |||
| Aerospace & Defense - 4.1% | |||
| KLX, Inc. (a) | 2,560 | 86,323 | |
| Triumph Group, Inc. | 6,834 | 247,254 | |
| 333,577 | |||
| Commercial Services & Supplies - 3.6% | |||
| Matthews International Corp. Class A | 1,611 | 84,803 | |
| The Brink's Co. | 6,243 | 211,263 | |
| 296,066 | |||
| Electrical Equipment - 1.9% | |||
| Babcock & Wilcox Enterprises, Inc. (a) | 6,843 | 156,363 | |
| Machinery - 2.4% | |||
| Allison Transmission Holdings, Inc. | 6,627 | 190,924 | |
| Professional Services - 1.3% | |||
| Insperity, Inc. | 1,939 | 102,321 | |
| Trading Companies & Distributors - 0.3% | |||
| Now, Inc. (a) | 1,370 | 24,742 | |
| TOTAL INDUSTRIALS | 1,103,993 | ||
| INFORMATION TECHNOLOGY - 6.9% | |||
| Electronic Equipment & Components - 2.5% | |||
| Kimball Electronics, Inc. (a) | 18,284 | 200,027 | |
| Internet Software & Services - 0.9% | |||
| Rackspace Hosting, Inc. (a) | 3,230 | 73,870 | |
| Semiconductors & Semiconductor Equipment - 1.0% | |||
| Marvell Technology Group Ltd. | 8,400 | 83,832 | |
| Software - 2.1% | |||
| CDK Global, Inc. | 1,896 | 90,193 | |
| Xura, Inc. (a) | 3,448 | 77,201 | |
| 167,394 | |||
| Technology Hardware, Storage & Peripherals - 0.4% | |||
| Quantum Corp. (a) | 76,574 | 35,247 | |
| TOTAL INFORMATION TECHNOLOGY | 560,370 | ||
| MATERIALS - 0.9% | |||
| Containers & Packaging - 0.9% | |||
| Owens-Illinois, Inc. (a) | 4,011 | 74,043 | |
| TOTAL COMMON STOCKS | |||
| (Cost $6,801,310) | 6,951,651 | ||
| Principal Amount | Value | ||
| U.S. Treasury Obligations - 0.5% | |||
| U.S. Treasury Bills, yield at date of purchase 0.3% 6/9/16 (b) | |||
| (Cost $39,987) | 40,000 | 39,995 | |
| Shares | Value | ||
| Money Market Funds - 8.6% | |||
| Fidelity Cash Central Fund, 0.38% (c) | |||
| (Cost $701,093) | 701,093 | 701,093 | |
| Equity Funds - 4.8% | |||
| Large Blend Funds - 4.8% | |||
| iShares Russell 3000 Index ETF | |||
| (Cost $391,438) | 3,200 | 387,648 | |
| TOTAL INVESTMENT PORTFOLIO - 99.4% | |||
| (Cost $7,933,828) | 8,080,387 | ||
| NET OTHER ASSETS (LIABILITIES) - 0.6% | 48,871 | ||
| NET ASSETS - 100% | $8,129,258 |
| Futures Contracts | |||
| Expiration Date | Underlying Face Amount at Value | Unrealized Appreciation/(Depreciation) | |
| Purchased | |||
| Equity Index Contracts | |||
| 6 CME E-mini S&P 500 Index Contracts (United States) | June 2016 | 617,730 | $21,136 |
| 1 ICE Russell 2000 Index Contracts (United States) | June 2016 | 112,760 | 6,997 |
| TOTAL FUTURES CONTRACTS | $28,133 |
The face value of futures purchased as a percentage of Net Assets is 9.0%
For the period, the average monthly underlying face amount at value for futures contracts in the aggregate was $262,798.
Security Type Abbreviations
ETF – Exchange-Traded Fund
Legend
(a) Non-income producing
(b) Security or a portion of the security was pledged to cover margin requirements for futures contracts. At period end, the value of securities pledged amounted to $39,995.
(c) Affiliated fund that is generally available only to investment companies and other accounts managed by Fidelity Investments. The rate quoted is the annualized seven-day yield of the fund at period end. A complete unaudited listing of the fund's holdings as of its most recent quarter end is available upon request. In addition, each Fidelity Central Fund's financial statements, which are not covered by the Fund's Report of Independent Registered Public Accounting Firm, are available on the SEC's website or upon request.
Affiliated Central Funds
Information regarding fiscal year to date income earned by the Fund from investments in Fidelity Central Funds is as follows:
| Fund | Income earned |
| Fidelity Cash Central Fund | $1,022 |
| Total | $1,022 |
Investment Valuation
The following is a summary of the inputs used, as of April 30, 2016, involving the Fund's assets and liabilities carried at fair value. The inputs or methodology used for valuing securities may not be an indication of the risk associated with investing in those securities. For more information on valuation inputs, and their aggregation into the levels used below, please refer to the Investment Valuation section in the accompanying Notes to Financial Statements.
| Valuation Inputs at Reporting Date: | ||||
| Description | Total | Level 1 | Level 2 | Level 3 |
| Investments in Securities: | ||||
| Equities: | ||||
| Consumer Discretionary | $2,029,959 | $2,029,959 | $-- | $-- |
| Consumer Staples | 1,078,667 | 1,078,667 | -- | -- |
| Energy | 265,302 | 265,302 | -- | -- |
| Financials | 1,091,132 | 1,091,132 | -- | -- |
| Health Care | 748,185 | 748,185 | -- | -- |
| Industrials | 1,103,993 | 1,103,993 | -- | -- |
| Information Technology | 560,370 | 560,370 | -- | -- |
| Materials | 74,043 | 74,043 | -- | -- |
| U.S. Government and Government Agency Obligations | 39,995 | -- | 39,995 | -- |
| Money Market Funds | 701,093 | 701,093 | -- | -- |
| Equity Funds | 387,648 | 387,648 | -- | -- |
| Total Investments in Securities: | $8,080,387 | $8,040,392 | $39,995 | $-- |
| Derivative Instruments: | ||||
| Assets | ||||
| Futures Contracts | $28,133 | $28,133 | $-- | $-- |
| Total Assets | $28,133 | $28,133 | $-- | $-- |
| Total Derivative Instruments: | $28,133 | $28,133 | $-- | $-- |
Value of Derivative Instruments
The following table is a summary of the Fund's value of derivative instruments by primary risk exposure as of April 30, 2016. For additional information on derivative instruments, please refer to the Derivative Instruments section in the accompanying Notes to Financial Statements.
| Primary Risk Exposure / Derivative Type | Value | |
| Asset | Liability | |
| Equity Risk | ||
| Futures Contracts(a) | $28,133 | $0 |
| Total Equity Risk | 28,133 | 0 |
| Total Value of Derivatives | $28,133 | $0 |
(a) Reflects gross cumulative appreciation (depreciation) on futures contracts as presented in the Schedule of Investments. In the Statement of Assets and Liabilities, the period end daily variation margin is included in receivable or payable for daily variation margin for derivative instruments, and the net cumulative appreciation (depreciation) is included in net unrealized appreciation (depreciation).
See accompanying notes which are an integral part of the financial statements.
Financial Statements
Statement of Assets and Liabilities
| April 30, 2016 | ||
| Assets | ||
| Investment in securities, at value — See accompanying schedule: Unaffiliated issuers (cost $7,232,735) | $7,379,294 | |
| Fidelity Central Funds (cost $701,093) | 701,093 | |
| Total Investments (cost $7,933,828) | $8,080,387 | |
| Cash | 26,173 | |
| Receivable for investments sold | 100,706 | |
| Receivable for fund shares sold | 639 | |
| Dividends receivable | 9,210 | |
| Distributions receivable from Fidelity Central Funds | 276 | |
| Prepaid expenses | 7 | |
| Receivable from investment adviser for expense reductions | 6,509 | |
| Other receivables | 270 | |
| Total assets | 8,224,177 | |
| Liabilities | ||
| Payable for investments purchased | $34,953 | |
| Payable for fund shares redeemed | 6,666 | |
| Accrued management fee | 5,382 | |
| Distribution and service plan fees payable | 1,821 | |
| Payable for daily variation margin for derivative instruments | 5,210 | |
| Audit fee payable | 38,166 | |
| Other affiliated payables | 1,642 | |
| Other payables and accrued expenses | 1,079 | |
| Total liabilities | 94,919 | |
| Net Assets | $8,129,258 | |
| Net Assets consist of: | ||
| Paid in capital | $7,997,633 | |
| Undistributed net investment income | 29,804 | |
| Accumulated undistributed net realized gain (loss) on investments and foreign currency transactions | (72,871) | |
| Net unrealized appreciation (depreciation) on investments | 174,692 | |
| Net Assets | $8,129,258 | |
| Calculation of Maximum Offering Price | ||
| Class A: | ||
| Net Asset Value and redemption price per share ($2,513,302 ÷ 231,219 shares) | $10.87 | |
| Maximum offering price per share (100/94.25 of $10.87) | $11.53 | |
| Class T: | ||
| Net Asset Value and redemption price per share ($966,062 ÷ 89,238 shares) | $10.83 | |
| Maximum offering price per share (100/96.50 of $10.83) | $11.22 | |
| Class C: | ||
| Net Asset Value and offering price per share ($1,045,781 ÷ 97,577 shares)(a) | $10.72 | |
| Class I: | ||
| Net Asset Value, offering price and redemption price per share ($3,604,113 ÷ 330,256 shares) | $10.91 |
(a) Redemption price per share is equal to net asset value less any applicable contingent deferred sales charge.
See accompanying notes which are an integral part of the financial statements.
Statement of Operations
| Year ended April 30, 2016 | ||
| Investment Income | ||
| Dividends | $133,771 | |
| Special dividends | 40,137 | |
| Interest | 41 | |
| Income from Fidelity Central Funds | 1,022 | |
| Total income | 174,971 | |
| Expenses | ||
| Management fee | ||
| Basic fee | $65,143 | |
| Performance adjustment | (4,562) | |
| Transfer agent fees | 16,065 | |
| Distribution and service plan fees | 26,974 | |
| Accounting fees and expenses | 2,985 | |
| Custodian fees and expenses | 5,331 | |
| Independent trustees' compensation | 35 | |
| Registration fees | 50,474 | |
| Audit | 47,919 | |
| Legal | 19 | |
| Miscellaneous | 265 | |
| Total expenses before reductions | 210,648 | |
| Expense reductions | (84,947) | 125,701 |
| Net investment income (loss) | 49,270 | |
| Realized and Unrealized Gain (Loss) | ||
| Net realized gain (loss) on: | ||
| Investment securities: | ||
| Unaffiliated issuers | 86,599 | |
| Foreign currency transactions | 158 | |
| Futures contracts | (26,794) | |
| Total net realized gain (loss) | 59,963 | |
| Change in net unrealized appreciation (depreciation) on: Investment securities | (361,065) | |
| Assets and liabilities in foreign currencies | 126 | |
| Futures contracts | 28,133 | |
| Total change in net unrealized appreciation (depreciation) | (332,806) | |
| Net gain (loss) | (272,843) | |
| Net increase (decrease) in net assets resulting from operations | $(223,573) |
See accompanying notes which are an integral part of the financial statements.
Statement of Changes in Net Assets
| Year ended April 30, 2016 | Year ended April 30, 2015 | |
| Increase (Decrease) in Net Assets | ||
| Operations | ||
| Net investment income (loss) | $49,270 | $(11,173) |
| Net realized gain (loss) | 59,963 | 62,309 |
| Change in net unrealized appreciation (depreciation) | (332,806) | 434,100 |
| Net increase (decrease) in net assets resulting from operations | (223,573) | 485,236 |
| Distributions to shareholders from net investment income | – | (8,784) |
| Distributions to shareholders from net realized gain | (78,048) | (156,929) |
| Total distributions | (78,048) | (165,713) |
| Share transactions - net increase (decrease) | (365,630) | 483,003 |
| Total increase (decrease) in net assets | (667,251) | 802,526 |
| Net Assets | ||
| Beginning of period | 8,796,509 | 7,993,983 |
| End of period (including undistributed net investment income of $29,804 and accumulated net investment loss of $13,274, respectively) | $8,129,258 | $8,796,509 |
See accompanying notes which are an integral part of the financial statements.
Financial Highlights — Fidelity Advisor Event Driven Opportunities Fund Class A
| Years ended April 30, | 2016 | 2015 | 2014 A |
| Selected Per–Share Data | |||
| Net asset value, beginning of period | $11.26 | $10.58 | $10.00 |
| Income from Investment Operations | |||
| Net investment income (loss)B | .08C | .01 | .02D |
| Net realized and unrealized gain (loss) | (.36)E | .89F | .56G |
| Total from investment operations | (.28) | .90 | .58 |
| Distributions from net investment income | – | (.01) | – |
| Distributions from net realized gain | (.11) | (.20) | – |
| Total distributions | (.11) | (.22)H | – |
| Net asset value, end of period | $10.87 | $11.26 | $10.58 |
| Total ReturnI,J,K | (2.49)%E | 8.55%F | 5.80%G |
| Ratios to Average Net AssetsL,M | |||
| Expenses before reductions | 2.76% | 2.82% | 4.76%N |
| Expenses net of fee waivers, if any | 1.55% | 1.55% | 1.55%N |
| Expenses net of all reductions | 1.54% | 1.53% | 1.55%N |
| Net investment income (loss) | .74%C | .10% | .59%D,N |
| Supplemental Data | |||
| Net assets, end of period (000 omitted) | $2,513 | $2,983 | $1,389 |
| Portfolio turnover rateO | 113% | 150% | 57%P |
A For the period December 12, 2013 (commencement of operations) to April 30, 2014.
B Calculated based on average shares outstanding during the period.
C Net Investment income per share reflects a large, non-recurring dividend which amounted to $.06 per share. Excluding this non-recurring dividend, the ratio of net investment income (loss) to average net assets would have been .22%.
D Net Investment income per share reflects large, non-recurring dividends which amounted to $.03 per share. Excluding these non-recurring dividends, the ratio of net investment income (loss) to average net assets would have been (.25) %.
E Amount includes a reimbursement from the investment adviser for an operational error which amounted to less than $.01 per share. Excluding this reimbursement, the total return would have been (2.52)%.
F Amount includes a reimbursement from the investment adviser for an operational error which amounted to $.01 per share. Excluding this reimbursement, the total return would have been 8.47%.
G Amount includes a reimbursement from the investment adviser for an operational error which amounted to $.01 per share. Excluding this reimbursement, the total return would have been 5.70%.
H Total distributions of $.22 per share is comprised of distributions from net investment income of $.014 and distributions from net realized gain of $.201 per share.
I Total returns for periods of less than one year are not annualized.
J Total returns would have been lower if certain expenses had not been reduced during the applicable periods shown.
K Total returns do not include the effect of the sales charges.
L Fees and expenses of any underlying Fidelity Central Funds are not included in the Fund's expense ratio. The Fund indirectly bears its proportionate share of the expenses of any underlying Fidelity Central Funds.
M Expense ratios reflect operating expenses of the class. Expenses before reductions do not reflect amounts reimbursed by the investment adviser or reductions from brokerage service arrangements or reductions from other expense offset arrangements and do not represent the amount paid by the class during periods when reimbursements or reductions occur. Expense ratios before reductions for start-up periods may not be representative of longer-term operating periods. Expenses net of fee waivers reflect expenses after reimbursement by the investment adviser but prior to reductions from brokerage service arrangements or other expense offset arrangements. Expenses net of all reductions represent the net expenses paid by the class.
N Annualized
O Amount does not include the portfolio activity of any underlying Fidelity Central Funds.
P Amount not annualized.
See accompanying notes which are an integral part of the financial statements.
Financial Highlights — Fidelity Advisor Event Driven Opportunities Fund Class T
| Years ended April 30, | 2016 | 2015 | 2014 A |
| Selected Per–Share Data | |||
| Net asset value, beginning of period | $11.25 | $10.57 | $10.00 |
| Income from Investment Operations | |||
| Net investment income (loss)B | .05C | (.02) | .01D |
| Net realized and unrealized gain (loss) | (.36)E | .89F | .56G |
| Total from investment operations | (.31) | .87 | .57 |
| Distributions from net investment income | – | (.01) | – |
| Distributions from net realized gain | (.11) | (.18) | – |
| Total distributions | (.11) | (.19) | – |
| Net asset value, end of period | $10.83 | $11.25 | $10.57 |
| Total ReturnH,I,J | (2.76)%E | 8.35%F | 5.70%G |
| Ratios to Average Net AssetsK,L | |||
| Expenses before reductions | 2.98% | 3.18% | 4.95%M |
| Expenses net of fee waivers, if any | 1.80% | 1.80% | 1.80%M |
| Expenses net of all reductions | 1.79% | 1.78% | 1.80%M |
| Net investment income (loss) | .49%C | (.15)% | .34%D,M |
| Supplemental Data | |||
| Net assets, end of period (000 omitted) | $966 | $1,977 | $1,631 |
| Portfolio turnover rateN | 113% | 150% | 57%O |
A For the period December 12, 2013 (commencement of operations) to April 30, 2014.
B Calculated based on average shares outstanding during the period.
C Net Investment income per share reflects a large, non-recurring dividend which amounted to $.06 per share. Excluding this non-recurring dividend, the ratio of net investment income (loss) to average net assets would have been (.03) %.
D Net Investment income per share reflects large, non-recurring dividends which amounted to $.03 per share. Excluding these non-recurring dividends, the ratio of net investment income (loss) to average net assets would have been (.50) %.
E Amount includes a reimbursement from the investment adviser for an operational error which amounted to less than $.01 per share. Excluding this reimbursement, the total return would have been (2.79)%.
F Amount includes a reimbursement from the investment adviser for an operational error which amounted to $.01 per share. Excluding this reimbursement, the total return would have been 8.27%.
G Amount includes a reimbursement from the investment adviser for an operational error which amounted to $.01 per share. Excluding this reimbursement, the total return would have been 5.60%.
H Total returns for periods of less than one year are not annualized.
I Total returns would have been lower if certain expenses had not been reduced during the applicable periods shown.
J Total returns do not include the effect of the sales charges.
K Fees and expenses of any underlying Fidelity Central Funds are not included in the Fund's expense ratio. The Fund indirectly bears its proportionate share of the expenses of any underlying Fidelity Central Funds.
L Expense ratios reflect operating expenses of the class. Expenses before reductions do not reflect amounts reimbursed by the investment adviser or reductions from brokerage service arrangements or reductions from other expense offset arrangements and do not represent the amount paid by the class during periods when reimbursements or reductions occur. Expense ratios before reductions for start-up periods may not be representative of longer-term operating periods. Expenses net of fee waivers reflect expenses after reimbursement by the investment adviser but prior to reductions from brokerage service arrangements or other expense offset arrangements. Expenses net of all reductions represent the net expenses paid by the class.
M Annualized
N Amount does not include the portfolio activity of any underlying Fidelity Central Funds.
O Amount not annualized.
See accompanying notes which are an integral part of the financial statements.
Financial Highlights — Fidelity Advisor Event Driven Opportunities Fund Class C
| Years ended April 30, | 2016 | 2015 | 2014 A |
| Selected Per–Share Data | |||
| Net asset value, beginning of period | $11.19 | $10.55 | $10.00 |
| Income from Investment Operations | |||
| Net investment income (loss)B | –C,D | (.07) | (.01)E |
| Net realized and unrealized gain (loss) | (.36)F | .88G | .56H |
| Total from investment operations | (.36) | .81 | .55 |
| Distributions from net realized gain | (.11) | (.17) | – |
| Total distributions | (.11) | (.17) | – |
| Net asset value, end of period | $10.72 | $11.19 | $10.55 |
| Total ReturnI,J,K | (3.23)%F | 7.75%G | 5.50%H |
| Ratios to Average Net AssetsL,M | |||
| Expenses before reductions | 3.46% | 3.63% | 5.38%N |
| Expenses net of fee waivers, if any | 2.30% | 2.30% | 2.30%N |
| Expenses net of all reductions | 2.29% | 2.29% | 2.30%N |
| Net investment income (loss) | (.01)%C | (.65)% | (.16)%E,N |
| Supplemental Data | |||
| Net assets, end of period (000 omitted) | $1,046 | $1,846 | $3,011 |
| Portfolio turnover rateO | 113% | 150% | 57%P |
A For the period December 12, 2013 (commencement of operations) to April 30, 2014.
B Calculated based on average shares outstanding during the period.
C Net Investment income per share reflects a large, non-recurring dividend which amounted to $.06 per share. Excluding this non-recurring dividend, the ratio of net investment income (loss) to average net assets would have been (.53) %.
D Amount represents less than $.005 per share.
E Net Investment income per share reflects large, non-recurring dividends which amounted to $.03 per share. Excluding these non-recurring dividends, the ratio of net investment income (loss) to average net assets would have been (1.00) %.
F Amount includes a reimbursement from the investment adviser for an operational error which amounted to less than $.01 per share. Excluding this reimbursement, the total return would have been (3.26)%.
G Amount includes a reimbursement from the investment adviser for an operational error which amounted to $.01 per share. Excluding this reimbursement, the total return would have been 7.67%.
H Amount includes a reimbursement from the investment adviser for an operational error which amounted to $.01 per share. Excluding this reimbursement, the total return would have been 5.40%.
I Total returns for periods of less than one year are not annualized.
J Total returns would have been lower if certain expenses had not been reduced during the applicable periods shown.
K Total returns do not include the effect of the contingent deferred sales charge.
L Fees and expenses of any underlying Fidelity Central Funds are not included in the Fund's expense ratio. The Fund indirectly bears its proportionate share of the expenses of any underlying Fidelity Central Funds.
M Expense ratios reflect operating expenses of the class. Expenses before reductions do not reflect amounts reimbursed by the investment adviser or reductions from brokerage service arrangements or reductions from other expense offset arrangements and do not represent the amount paid by the class during periods when reimbursements or reductions occur. Expense ratios before reductions for start-up periods may not be representative of longer-term operating periods. Expenses net of fee waivers reflect expenses after reimbursement by the investment adviser but prior to reductions from brokerage service arrangements or other expense offset arrangements. Expenses net of all reductions represent the net expenses paid by the class.
N Annualized
O Amount does not include the portfolio activity of any underlying Fidelity Central Funds.
P Amount not annualized.
See accompanying notes which are an integral part of the financial statements.
Financial Highlights — Fidelity Advisor Event Driven Opportunities Fund Class I
| Years ended April 30, | 2016 | 2015 | 2014 A |
| Selected Per–Share Data | |||
| Net asset value, beginning of period | $11.28 | $10.59 | $10.00 |
| Income from Investment Operations | |||
| Net investment income (loss)B | .11C | .04 | .03D |
| Net realized and unrealized gain (loss) | (.37)E | .89F | .56G |
| Total from investment operations | (.26) | .93 | .59 |
| Distributions from net investment income | – | (.03) | – |
| Distributions from net realized gain | (.11) | (.21) | – |
| Total distributions | (.11) | (.24) | – |
| Net asset value, end of period | $10.91 | $11.28 | $10.59 |
| Total ReturnH,I | (2.31)%E | 8.86%F | 5.90%G |
| Ratios to Average Net AssetsJ,K | |||
| Expenses before reductions | 2.17% | 2.63% | 4.50%L |
| Expenses net of fee waivers, if any | 1.30% | 1.30% | 1.30%L |
| Expenses net of all reductions | 1.28% | 1.28% | 1.30%L |
| Net investment income (loss) | 1.00%C | .35% | .84%D,L |
| Supplemental Data | |||
| Net assets, end of period (000 omitted) | $3,604 | $1,990 | $1,962 |
| Portfolio turnover rateM | 113% | 150% | 57%N |
A For the period December 12, 2013 (commencement of operations) to April 30, 2014.
B Calculated based on average shares outstanding during the period.
C Net Investment income per share reflects a large, non-recurring dividend which amounted to $.06 per share. Excluding this non-recurring dividend, the ratio of net investment income (loss) to average net assets would have been .47%.
D Net Investment income per share reflects large, non-recurring dividends which amounted to $.03 per share. Excluding these non-recurring dividends, the ratio of net investment income (loss) to average net assets would have been (.01) %.
E Amount includes a reimbursement from the investment adviser for an operational error which amounted to less than $.01 per share. Excluding this reimbursement, the total return would have been (2.34)%.
F Amount includes a reimbursement from the investment adviser for an operational error which amounted to $.01 per share. Excluding this reimbursement, the total return would have been 8.78%.
G Amount includes a reimbursement from the investment adviser for an operational error which amounted to $.01 per share. Excluding this reimbursement, the total return would have been 5.80%.
H Total returns for periods of less than one year are not annualized.
I Total returns would have been lower if certain expenses had not been reduced during the applicable periods shown.
J Fees and expenses of any underlying Fidelity Central Funds are not included in the Fund's expense ratio. The Fund indirectly bears its proportionate share of the expenses of any underlying Fidelity Central Funds.
K Expense ratios reflect operating expenses of the class. Expenses before reductions do not reflect amounts reimbursed by the investment adviser or reductions from brokerage service arrangements or reductions from other expense offset arrangements and do not represent the amount paid by the class during periods when reimbursements or reductions occur. Expense ratios before reductions for start-up periods may not be representative of longer-term operating periods. Expenses net of fee waivers reflect expenses after reimbursement by the investment adviser but prior to reductions from brokerage service arrangements or other expense offset arrangements. Expenses net of all reductions represent the net expenses paid by the class.
L Annualized
M Amount does not include the portfolio activity of any underlying Fidelity Central Funds.
N Amount not annualized.
See accompanying notes which are an integral part of the financial statements.
Notes to Financial Statements
For the period ended April 30, 2016
1. Organization.
Fidelity Advisor Event Driven Opportunities Fund (the Fund) is a non-diversified fund of Fidelity Commonwealth Trust (the Trust) and is authorized to issue an unlimited number of shares. The Trust is registered under the Investment Company Act of 1940, as amended (the 1940 Act), as an open-end management investment company organized as a Massachusetts business trust. The Fund offers Class A, Class T, Class C and Class I (formerly Institutional Class) shares, each of which has equal rights as to assets and voting privileges. Each class has exclusive voting rights with respect to matters that affect that class.
2. Investments in Fidelity Central Funds.
The Fund invests in Fidelity Central Funds, which are open-end investment companies generally available only to other investment companies and accounts managed by the investment adviser and its affiliates. The Fund's Schedule of Investments lists each of the Fidelity Central Funds held as of period end, if any, as an investment of the Fund, but does not include the underlying holdings of each Fidelity Central Fund. As an Investing Fund, the Fund indirectly bears its proportionate share of the expenses of the underlying Fidelity Central Funds.
The Money Market Central Funds seek preservation of capital and current income and are managed by Fidelity Investments Money Management, Inc. (FIMM), an affiliate of the investment adviser. Annualized expenses of the Money Market Central Funds as of their most recent shareholder report date are less than .005%.
A complete unaudited list of holdings for each Fidelity Central Fund is available upon request or at the Securities and Exchange Commission (the SEC) website at www.sec.gov. In addition, the financial statements of the Fidelity Central Funds, which are not covered by the Fund's Report of Independent Registered Public Accounting Firm, are available on the SEC website or upon request.
3. Significant Accounting Policies.
The financial statements have been prepared in conformity with accounting principles generally accepted in the United States of America (GAAP), which require management to make certain estimates and assumptions at the date of the financial statements. Actual results could differ from those estimates. Subsequent events, if any, through the date that the financial statements were issued have been evaluated in the preparation of the financial statements. The following summarizes the significant accounting policies of the Fund:
Investment Valuation. Investments are valued as of 4:00 p.m. Eastern time on the last calendar day of the period. The Board of Trustees (the Board) has delegated the day to day responsibility for the valuation of the Fund's investments to the Fidelity Management & Research Company (FMR) Fair Value Committee (the Committee). In accordance with valuation policies and procedures approved by the Board, the Fund attempts to obtain prices from one or more third party pricing vendors or brokers to value its investments. When current market prices, quotations or currency exchange rates are not readily available or reliable, investments will be fair valued in good faith by the Committee, in accordance with procedures adopted by the Board. Factors used in determining fair value vary by investment type and may include market or investment specific events, changes in interest rates and credit quality. The frequency with which these procedures are used cannot be predicted and they may be utilized to a significant extent. The Committee oversees the Fund's valuation policies and procedures and reports to the Board on the Committee's activities and fair value determinations. The Board monitors the appropriateness of the procedures used in valuing the Fund's investments and ratifies the fair value determinations of the Committee.
The Fund categorizes the inputs to valuation techniques used to value its investments into a disclosure hierarchy consisting of three levels as shown below:
- Level 1 – quoted prices in active markets for identical investments
- Level 2 – other significant observable inputs (including quoted prices for similar investments, interest rates, prepayment speeds, etc.)
- Level 3 – unobservable inputs (including the Fund's own assumptions based on the best information available)
Valuation techniques used to value the Fund's investments by major category are as follows:
Equity securities, including restricted securities, for which market quotations are readily available, are valued at the last reported sale price or official closing price as reported by a third party pricing vendor on the primary market or exchange on which they are traded and are categorized as Level 1 in the hierarchy. In the event there were no sales during the day or closing prices are not available, securities are valued at the last quoted bid price or may be valued using the last available price and are generally categorized as Level 2 in the hierarchy. For foreign equity securities, when market or security specific events arise, comparisons to the valuation of American Depositary Receipts (ADRs), futures contracts, Exchange-Traded Funds (ETFs) and certain indexes as well as quoted prices for similar securities may be used and would be categorized as Level 2 in the hierarchy. Utilizing these techniques may result in transfers between Level 1 and Level 2. For equity securities, including restricted securities, where observable inputs are limited, assumptions about market activity and risk are used and these securities may be categorized as Level 3 in the hierarchy.
Debt securities, including restricted securities, are valued based on evaluated prices received from third party pricing vendors or from brokers who make markets in such securities. U.S. government and government agency obligations are valued by pricing vendors who utilize matrix pricing which considers yield or price of bonds of comparable quality, coupon, maturity and type or by broker-supplied prices. When independent prices are unavailable or unreliable, debt securities may be valued utilizing pricing methodologies which consider similar factors that would be used by third party pricing vendors. Debt securities are generally categorized as Level 2 in the hierarchy but may be Level 3 depending on the circumstances.
ETFs are valued at their last sale price or official closing price as reported by a third party pricing vendor on the primary market or exchange on which they are traded and are categorized as Level 1 in the hierarchy. In the event there were no sales during the day but the exchange reports a closing bid level, ETFs are valued at the closing bid and would be categorized as Level 1 in the hierarchy. In the event there was no closing bid, ETFs may be valued by another method that the Board believes reflects fair value in accordance with the Board's fair value pricing policies and may be categorized as Level 2 in the hierarchy.
Futures contracts are valued at the settlement price established each day by the board of trade or exchange on which they are traded and are categorized as Level 1 in the hierarchy. Investments in open-end mutual funds, including the Fidelity Central Funds, are valued at their closing net asset value (NAV) each business day and are categorized as Level 1 in the hierarchy.
Changes in valuation techniques may result in transfers in or out of an assigned level within the disclosure hierarchy. The aggregate value of investments by input level as of April 30, 2016 is included at the end of the Fund's Schedule of Investments.
Foreign Currency. The Fund may use foreign currency contracts to facilitate transactions in foreign-denominated securities. Gains and losses from these transactions may arise from changes in the value of the foreign currency or if the counterparties do not perform under the contracts' terms.
Foreign-denominated assets, including investment securities, and liabilities are translated into U.S. dollars at the exchange rates at period end. Purchases and sales of investment securities, income and dividends received and expenses denominated in foreign currencies are translated into U.S. dollars at the exchange rate in effect on the transaction date.
The effects of exchange rate fluctuations on investments are included with the net realized and unrealized gain (loss) on investment securities. Other foreign currency transactions resulting in realized and unrealized gain (loss) are disclosed separately.
Investment Transactions and Income. For financial reporting purposes, the Fund's investment holdings and NAV include trades executed through the end of the last business day of the period. The NAV per share for processing shareholder transactions is calculated as of the close of business of the New York Stock Exchange (NYSE), normally 4:00 p.m. Eastern time and includes trades executed through the end of the prior business day. Gains and losses on securities sold are determined on the basis of identified cost. Dividend income is recorded on the ex-dividend date, except for certain dividends from foreign securities where the ex-dividend date may have passed, which are recorded as soon as the Fund is informed of the ex-dividend date. Non-cash dividends included in dividend income, if any, are recorded at the fair market value of the securities received. Income and capital gain distributions from Fidelity Central Funds, if any, are recorded on the ex-dividend date. Distributions received on securities that represent a return of capital or capital gain are recorded as a reduction of cost of investments and/or as a realized gain. Subsequent to ex-dividend date the Fund determines the components of these distributions, based upon receipt of tax filings or other correspondence relating to the underlying investment. Large, non-recurring dividends recognized by the Fund are presented separately on the Statement of Operations as "Special Dividends" and the impact of these dividends is presented in the Financial Highlights. Interest income is accrued as earned and includes coupon interest and amortization of premium and accretion of discount on debt securities as applicable. Investment income is recorded net of foreign taxes withheld where recovery of such taxes is uncertain.
Class Allocations and Expenses. Investment income, realized and unrealized capital gains and losses, common expenses of the Fund, and certain fund-level expense reductions, if any, are allocated daily on a pro-rata basis to each class based on the relative net assets of each class to the total net assets of the Fund. Each class differs with respect to transfer agent and distribution and service plan fees incurred. Certain expense reductions may also differ by class. For the reporting period, the allocated portion of income and expenses to each class as a percent of its average net assets may vary due to the timing of recording these transactions in relation to fluctuating net assets of the classes. Expenses directly attributable to a fund are charged to that fund. Expenses attributable to more than one fund are allocated among the respective funds on the basis of relative net assets or other appropriate methods. Expense estimates are accrued in the period to which they relate and adjustments are made when actual amounts are known.
Income Tax Information and Distributions to Shareholders. Each year, the Fund intends to qualify as a regulated investment company under Subchapter M of the Internal Revenue Code, including distributing substantially all of its taxable income and realized gains. As a result, no provision for U.S. Federal income taxes is required. As of April 30, 2016, the Fund did not have any unrecognized tax benefits in the financial statements; nor is the Fund aware of any tax positions for which it is reasonably possible that the total amounts of unrecognized tax benefits will significantly change in the next twelve months. The Fund files a U.S. federal tax return, in addition to state and local tax returns as required. The Fund's federal income tax returns are subject to examination by the Internal Revenue Service (IRS) for a period of three fiscal years after they are filed. State and local tax returns may be subject to examination for an additional fiscal year depending on the jurisdiction. Foreign taxes are provided for based on the Fund's understanding of the tax rules and rates that exist in the foreign markets in which it invests.
Distributions are declared and recorded on the ex-dividend date. Income dividends and capital gain distributions are declared separately for each class. Income and capital gain distributions are determined in accordance with income tax regulations, which may differ from GAAP. In addition, the Fund claimed a portion of the payment made to redeeming shareholders as a distribution for income tax purposes.
Capital accounts within the financial statements are adjusted for permanent book-tax differences. These adjustments have no impact on net assets or the results of operations. Capital accounts are not adjusted for temporary book-tax differences which will reverse in a subsequent period.
Book-tax differences are primarily due to futures contracts, foreign currency transactions, market discount and losses deferred due to wash sales and excise tax regulations.
The federal tax cost of investment securities and unrealized appreciation (depreciation) as of period end were as follows:
| Gross unrealized appreciation | $784,512 |
| Gross unrealized depreciation | (675,016) |
| Net unrealized appreciation (depreciation) on securities | $109,496 |
| Tax Cost | $7,970,891 |
The tax-based components of distributable earnings as of period end were as follows:
| Undistributed ordinary income | $29,786 |
| Net unrealized appreciation (depreciation) on securities and other investments | $109,496 |
The Fund intends to elect to defer to its next fiscal year $7,657 of capital losses recognized during the period November 1, 2015 to April 30, 2016.
The tax character of distributions paid was as follows:
| April 30, 2016 | April 30, 2015 | |
| Ordinary Income | $– | $ 165,713 |
| Long-term Capital Gains | 78,048 | – |
| Total | $78,048 | $ 165,713 |
4. Derivative Instruments.
Risk Exposures and the Use of Derivative Instruments. The Fund's investment objective allows the Fund to enter into various types of derivative contracts, including futures contracts. Derivatives are investments whose value is primarily derived from underlying assets, indices or reference rates and may be transacted on an exchange or over-the-counter (OTC). Derivatives may involve a future commitment to buy or sell a specified asset based on specified terms, to exchange future cash flows at periodic intervals based on a notional principal amount, or for one party to make one or more payments upon the occurrence of specified events in exchange for periodic payments from the other party.
The Fund used derivatives to increase returns and to manage exposure to certain risks as defined below. The success of any strategy involving derivatives depends on analysis of numerous economic factors, and if the strategies for investment do not work as intended, the Fund may not achieve its objectives.
The Fund's use of derivatives increased or decreased its exposure to the following risk:
| Equity Risk | Equity risk relates to the fluctuations in the value of financial instruments as a result of changes in market prices (other than those arising from interest rate risk or foreign exchange risk), whether caused by factors specific to an individual investment, its issuer, or all factors affecting all instruments traded in a market or market segment. |
The Fund is also exposed to additional risks from investing in derivatives, such as liquidity risk and counterparty credit risk. Liquidity risk is the risk that the Fund will be unable to close out the derivative in the open market in a timely manner. Counterparty credit risk is the risk that the counterparty will not be able to fulfill its obligation to the Fund. Counterparty credit risk related to exchange-traded futures contracts may be mitigated by the protection provided by the exchange on which they trade.
Investing in derivatives may involve greater risks than investing in the underlying assets directly and, to varying degrees, may involve risk of loss in excess of any initial investment and collateral received and amounts recognized in the Statement of Assets and Liabilities. In addition, there may be the risk that the change in value of the derivative contract does not correspond to the change in value of the underlying instrument.
Futures Contracts. A futures contract is an agreement between two parties to buy or sell a specified underlying instrument for a fixed price at a specified future date. The Fund used futures contracts to manage its exposure to the stock market.
Upon entering into a futures contract, a fund is required to deposit either cash or securities (initial margin) with a clearing broker in an amount equal to a certain percentage of the face value of the contract. Futures contracts are marked-to-market daily and subsequent daily payments (variation margin) are made or received by a fund depending on the daily fluctuations in the value of the futures contracts and are recorded as unrealized appreciation or (depreciation). This receivable and/or payable, if any, is included in daily variation margin for derivative instruments in the Statement of Assets and Liabilities. Realized gain or (loss) is recorded upon the expiration or closing of a futures contract.
Any open futures contracts at period end are presented in the Schedule of Investments under the caption "Futures Contracts". The underlying face amount at value reflects each contract's exposure to the underlying instrument or index at period end. Securities deposited to meet initial margin requirements are identified in the Schedule of Investments.
During the period the Fund recognized net realized gain (loss) of $(26,794) and a change in net unrealized appreciation (depreciation) of $28,133 related to its investment in futures contracts. These amounts are included in the Statement of Operations.
5. Purchases and Sales of Investments.
Purchases and sales of securities, other than short-term securities, aggregated $8,337,407 and $8,772,794, respectively.
6. Fees and Other Transactions with Affiliates.
Management Fee. Fidelity Management & Research Company (the investment adviser) and its affiliates provide the Fund with investment management related services for which the Fund pays a monthly management fee. The management fee is the sum of an individual fund fee rate that is based on an annual rate of .60% of the Fund's average net assets and an annualized group fee rate that averaged .25% during the period. The group fee rate is based upon the average net assets of all the mutual funds advised by the investment adviser, including any mutual funds previously advised by the investment adviser that are currently advised by Fidelity SelectCo, LLC, an affiliate of the investment adviser. The group fee rate decreases as assets under management increase and increases as assets under management decrease. In addition, the management fee is subject to a performance adjustment (up to a maximum of +/- .10% of the Fund's average net assets over a 36 month performance period). The upward or downward adjustment to the management fee is based on the relative investment performance of Class I of the Fund as compared to its benchmark index, the Russell 3000 Index, over the same 36 month performance period. For the reporting period, the total annual management fee rate, including the performance adjustment, was .79% of the Fund's average net assets. The performance adjustment included in the management fee rate may be higher or lower than the maximum performance adjustment rate due to the difference between the average net assets for the reporting and performance periods.
Distribution and Service Plan Fees. In accordance with Rule 12b-1 of the 1940 Act, the Fund has adopted separate Distribution and Service Plans for each class of shares. Certain classes pay Fidelity Distributors Corporation (FDC), an affiliate of the investment adviser, separate Distribution and Service Fees, each of which is based on an annual percentage of each class' average net assets. In addition, FDC may pay financial intermediaries for selling shares of the Fund and providing shareholder support services. For the period, the Distribution and Service Fee rates, total fees and amounts retained by FDC were as follows:
| Distribution Fee | Service Fee | Total Fees | Retained by FDC |
|
| Class A | -% | .25% | $6,743 | $6,743 |
| Class T | .25% | .25% | 6,542 | 6,542 |
| Class C | .75% | .25% | 13,689 | 13,689 |
| $26,974 | $26,974 |
Sales Load. FDC may receive a front-end sales charge of up to 5.75% for selling Class A shares and 3.50% for selling Class T shares, some of which is paid to financial intermediaries for selling shares of the Fund. Depending on the holding period, FDC may receive contingent deferred sales charges levied on Class A, Class T, and Class C redemptions. The deferred sales charges are 1.00% for Class C shares, 1.00% for certain purchases of Class A shares and .25% for certain purchases of Class T shares.
For the period, sales charge amounts retained by FDC were as follows:
| Retained by FDC |
|
| Class A | $6,177 |
| Class T | 223 |
| Class C(a) | 687 |
| $7,087 |
(a) When Class C shares are initially sold, FDC pays commissions from its own resources to financial intermediaries through which the sales are made.
Transfer Agent Fees. Fidelity Investments Institutional Operations Company, Inc., (FIIOC), an affiliate of the investment adviser, is the transfer, dividend disbursing and shareholder servicing agent for each class of the Fund. FIIOC receives account fees and asset-based fees that vary according to the account size and type of account of the shareholders of the respective classes of the Fund. FIIOC pays for typesetting, printing and mailing of shareholder reports, except proxy statements.
For the period, transfer agent fees for each class were as follows:
| Amount | % of Class-Level Average Net Assets |
|
| Class A | $6,507 | .24 |
| Class T | 3,444 | .26 |
| Class C | 2,696 | .20 |
| Class I | 3,418 | .15 |
| $16,065 |
Accounting Fees. Fidelity Service Company, Inc. (FSC), an affiliate of the investment adviser, maintains the Fund's accounting records. The fee is based on the level of average net assets for each month.
Brokerage Commissions. The Fund placed a portion of its portfolio transactions with brokerage firms which are affiliates of the investment adviser. Brokerage commissions are included in net realized gain (loss) and change in net unrealized appreciation (depreciation) in the Statement of Operations. The commissions paid to these affiliated firms were $426 for the period.
Interfund Trades. The Fund may purchase from or sell securities to other Fidelity Funds under procedures adopted by the Board. The procedures have been designed to ensure these interfund trades are executed in accordance with Rule 17a-7 of the 1940 Act. Interfund trades are included within the respective purchases and sales amounts shown in the Purchases and Sales of Investments note.
Other. During the period, the investment adviser reimbursed the Fund $2,547 for an operational error which is included in Net Realized Gain (Loss) in the accompanying Statement of Operations
7. Committed Line of Credit.
The Fund participates with other funds managed by the investment adviser or an affiliate in a $4.25 billion credit facility (the "line of credit") to be utilized for temporary or emergency purposes to fund shareholder redemptions or for other short-term liquidity purposes. The Fund has agreed to pay commitment fees on its pro-rata portion of the line of credit, which amounted to $12 and is reflected in Miscellaneous expenses on the Statement of Operations. During the period, the Fund did not borrow on this line of credit.
8. Expense Reductions.
The investment adviser contractually agreed to reimburse each class to the extent annual operating expenses exceeded certain levels of average net assets as noted in the table below. This reimbursement will remain in place through June 30, 2017. Some expenses, for example interest expense, including commitment fees, are excluded from this reimbursement.
The following classes were in reimbursement during the period:
| Expense Limitations | Reimbursement | |
| Class A | 1.55% | $32,601 |
| Class T | 1.80% | 15,516 |
| Class C | 2.30% | 15,886 |
| Class I | 1.30% | 19,896 |
| $83,899 |
Commissions paid to certain brokers with whom the investment adviser, or its affiliates, places trades on behalf of the Fund include an amount in addition to trade execution, which may be rebated back to the Fund to offset certain expenses. This amount totaled $955 for the period.
In addition, during the period the investment adviser reimbursed and/or waived a portion of fund-level operating expenses in the amount of $58 and a portion of class-level operating expenses as follows:
| Amount | |
| Class A | $11 |
| Class T | 8 |
| Class C | 8 |
| Class I | 8 |
| Total | $35 |
9. Distributions to Shareholders.
Distributions to shareholders of each class were as follows:
| Year ended April 30, 2016 | Year ended April 30, 2015 | |
| From net investment income | ||
| Class A | $– | $1,990 |
| Class T | – | 2,020 |
| Class I | – | 4,774 |
| Total | $– | $8,784 |
| From net realized gain | ||
| Class A | $28,471 | $31,194 |
| Class T | 16,290 | 34,008 |
| Class C | 15,945 | 51,111 |
| Class I | 17,342 | 40,616 |
| Total | $78,048 | $156,929 |
10. Share Transactions.
Share transactions for each class were as follows and may contain automatic conversions between classes or exchanges between affiliated funds:
| Shares | Shares | Dollars | Dollars | |
| Year ended April 30, 2016 | Year ended April 30, 2015 | Year ended April 30, 2016 | Year ended April 30, 2015 | |
| Class A | ||||
| Shares sold | 70,567 | 244,795 | $758,382 | $2,682,803 |
| Reinvestment of distributions | 2,331 | 2,832 | 26,229 | 30,556 |
| Shares redeemed | (106,527) | (114,029) | (1,162,165) | (1,198,530) |
| Net increase (decrease) | (33,629) | 133,598 | $(377,554) | $1,514,829 |
| Class T | ||||
| Shares sold | 8,615 | 102,961 | $93,355 | $1,112,751 |
| Reinvestment of distributions | 1,449 | 3,335 | 16,290 | 36,027 |
| Shares redeemed | (96,589) | (84,812) | (1,049,955) | (923,756) |
| Net increase (decrease) | (86,525) | 21,484 | $(940,310) | $225,022 |
| Class C | ||||
| Shares sold | 32,297 | 144,045 | $350,788 | $1,556,025 |
| Reinvestment of distributions | 1,393 | 4,679 | 15,570 | 50,538 |
| Shares redeemed | (101,079) | (269,041) | (1,079,870) | (2,793,045) |
| Net increase (decrease) | (67,389) | (120,317) | $(713,512) | $(1,186,482) |
| Class I | ||||
| Shares sold | 235,816 | 111,471 | $2,558,721 | $1,209,986 |
| Reinvestment of distributions | 1,488 | 4,075 | 16,789 | 44,003 |
| Shares redeemed | (83,510) | (124,299) | (909,764) | (1,324,355) |
| Net increase (decrease) | 153,794 | (8,753) | $1,665,746 | $(70,366) |
11. Other.
The Fund's organizational documents provide former and current trustees and officers with a limited indemnification against liabilities arising in connection with the performance of their duties to the Fund. In the normal course of business, the Fund may also enter into contracts that provide general indemnifications. The Fund's maximum exposure under these arrangements is unknown as this would be dependent on future claims that may be made against the Fund. The risk of material loss from such claims is considered remote.
Report of Independent Registered Public Accounting Firm
To the Trustees of Fidelity Commonwealth Trust and Shareholders of Fidelity Advisor Event Driven Opportunities Fund:
In our opinion, the accompanying statement of assets and liabilities, including the schedule of investments, and the related statements of operations and of changes in net assets and the financial highlights present fairly, in all material respects, the financial position of Fidelity Advisor Event Driven Opportunities Fund (a fund of Fidelity Commonwealth Trust) at April 30, 2016, the results of its operations for the year then ended, the changes in its net assets for each of the two years in the period then ended and the financial highlights for each of the periods indicated, in conformity with accounting principles generally accepted in the United States of America. These financial statements and financial highlights (hereafter referred to as “financial statements”) are the responsibility of the Fidelity Advisor Event Driven Opportunities Fund’s management. Our responsibility is to express an opinion on these financial statements based on our audits. We conducted our audits of these financial statements in accordance with the standards of the Public Company Accounting Oversight Board (United States). Those standards require that we plan and perform the audit to obtain reasonable assurance about whether the financial statements are free of material misstatement. An audit includes examining, on a test basis, evidence supporting the amounts and disclosures in the financial statements, assessing the accounting principles used and significant estimates made by management, and evaluating the overall financial statement presentation. We believe that our audits, which included confirmation of securities at April 30, 2016 by correspondence with the custodian and brokers, provide a reasonable basis for our opinion.
PricewaterhouseCoopers LLP
Boston, Massachusetts
June 17, 2016
Trustees and Officers
The Trustees, Members of the Advisory Board (if any), and officers of the trust and fund, as applicable, are listed below. The Board of Trustees governs the fund and is responsible for protecting the interests of shareholders. The Trustees are experienced executives who meet periodically throughout the year to oversee the fund's activities, review contractual arrangements with companies that provide services to the fund, oversee management of the risks associated with such activities and contractual arrangements, and review the fund's performance. Each of the Trustees oversees 170 funds.
The Trustees hold office without limit in time except that (a) any Trustee may resign; (b) any Trustee may be removed by written instrument, signed by at least two-thirds of the number of Trustees prior to such removal; (c) any Trustee who requests to be retired or who has become incapacitated by illness or injury may be retired by written instrument signed by a majority of the other Trustees; and (d) any Trustee may be removed at any special meeting of shareholders by a two-thirds vote of the outstanding voting securities of the trust. Each Trustee who is not an interested person (as defined in the 1940 Act) of the trust and the fund is referred to herein as an Independent Trustee. Each Independent Trustee shall retire not later than the last day of the calendar year in which his or her 75th birthday occurs. The Independent Trustees may waive this mandatory retirement age policy with respect to individual Trustees. Officers and Advisory Board Members hold office without limit in time, except that any officer or Advisory Board Member may resign or may be removed by a vote of a majority of the Trustees at any regular meeting or any special meeting of the Trustees. Except as indicated, each individual has held the office shown or other offices in the same company for the past five years.
The fund’s Statement of Additional Information (SAI) includes more information about the Trustees. To request a free copy, call Fidelity at 1-877-208-0098.
Experience, Skills, Attributes, and Qualifications of the Trustees. The Governance and Nominating Committee has adopted a statement of policy that describes the experience, qualifications, attributes, and skills that are necessary and desirable for potential Independent Trustee candidates (Statement of Policy). The Board believes that each Trustee satisfied at the time he or she was initially elected or appointed a Trustee, and continues to satisfy, the standards contemplated by the Statement of Policy. The Governance and Nominating Committee also engages professional search firms to help identify potential Independent Trustee candidates who have the experience, qualifications, attributes, and skills consistent with the Statement of Policy. From time to time, additional criteria based on the composition and skills of the current Independent Trustees, as well as experience or skills that may be appropriate in light of future changes to board composition, business conditions, and regulatory or other developments, have also been considered by the professional search firms and the Governance and Nominating Committee. In addition, the Board takes into account the Trustees' commitment and participation in Board and committee meetings, as well as their leadership of standing and ad hoc committees throughout their tenure.
In determining that a particular Trustee was and continues to be qualified to serve as a Trustee, the Board has considered a variety of criteria, none of which, in isolation, was controlling. The Board believes that, collectively, the Trustees have balanced and diverse experience, qualifications, attributes, and skills, which allow the Board to operate effectively in governing the fund and protecting the interests of shareholders. Information about the specific experience, skills, attributes, and qualifications of each Trustee, which in each case led to the Board's conclusion that the Trustee should serve (or continue to serve) as a trustee of the fund, is provided below.
Board Structure and Oversight Function. James C. Curvey is an interested person and currently serves as Chairman. The Trustees have determined that an interested Chairman is appropriate and benefits shareholders because an interested Chairman has a personal and professional stake in the quality and continuity of services provided to the fund. Independent Trustees exercise their informed business judgment to appoint an individual of their choosing to serve as Chairman, regardless of whether the Trustee happens to be independent or a member of management. The Independent Trustees have determined that they can act independently and effectively without having an Independent Trustee serve as Chairman and that a key structural component for assuring that they are in a position to do so is for the Independent Trustees to constitute a substantial majority for the Board. The Independent Trustees also regularly meet in executive session. Ned C. Lautenbach serves as Chairman of the Independent Trustees and as such (i) acts as a liaison between the Independent Trustees and management with respect to matters important to the Independent Trustees and (ii) with management prepares agendas for Board meetings.
Fidelity® funds are overseen by different Boards of Trustees. The fund's Board oversees Fidelity's high income and certain equity funds, and other Boards oversee Fidelity's investment-grade bond, money market, asset allocation, and sector funds. The asset allocation funds may invest in Fidelity® funds overseen by the fund's Board. The use of separate Boards, each with its own committee structure, allows the Trustees of each group of Fidelity® funds to focus on the unique issues of the funds they oversee, including common research, investment, and operational issues. On occasion, the separate Boards establish joint committees to address issues of overlapping consequences for the Fidelity® funds overseen by each Board.
The Trustees operate using a system of committees to facilitate the timely and efficient consideration of all matters of importance to the Trustees, the fund, and fund shareholders and to facilitate compliance with legal and regulatory requirements and oversight of the fund's activities and associated risks. The Board, acting through its committees, has charged FMR and its affiliates with (i) identifying events or circumstances the occurrence of which could have demonstrably adverse effects on the fund's business and/or reputation; (ii) implementing processes and controls to lessen the possibility that such events or circumstances occur or to mitigate the effects of such events or circumstances if they do occur; and (iii) creating and maintaining a system designed to evaluate continuously business and market conditions in order to facilitate the identification and implementation processes described in (i) and (ii) above. Because the day-to-day operations and activities of the fund are carried out by or through FMR, its affiliates, and other service providers, the fund's exposure to risks is mitigated but not eliminated by the processes overseen by the Trustees. While each of the Board's committees has responsibility for overseeing different aspects of the fund's activities, oversight is exercised primarily through the Operations, Audit, and Compliance Committees. In addition, the Independent Trustees have worked with FMR to enhance the Board's oversight of investment and financial risks, legal and regulatory risks, technology risks, and operational risks, including the development of additional risk reporting to the Board. For example, a working group comprised of Independent Trustees and FMR has worked and continues to work to review the Fidelity® funds' valuation-related activities, reporting and risk management. Appropriate personnel, including but not limited to the fund's Chief Compliance Officer (CCO), FMR's internal auditor, the independent accountants, the fund's Treasurer and portfolio management personnel, make periodic reports to the Board's committees, as appropriate, including an annual review of Fidelity's risk management program for the Fidelity® funds. The responsibilities of each standing committee, including their oversight responsibilities, are described further under "Standing Committees of the Trustees."
Interested Trustees*:
Correspondence intended for a Trustee who is an interested person may be sent to Fidelity Investments, 245 Summer Street, Boston, Massachusetts 02210.
Name, Year of Birth; Principal Occupations and Other Relevant Experience+
James C. Curvey (1935)
Year of Election or Appointment: 2007
Trustee
Chairman of the Board of Trustees
Mr. Curvey also serves as Trustee of other Fidelity® funds. Mr. Curvey is a Director of Fidelity Research & Analysis Co. (investment adviser firm, 2009-present), and Vice Chairman (2007-present) and Director of FMR LLC (diversified financial services company). In addition, Mr. Curvey serves as an Overseer for the Boston Symphony Orchestra and a member of the board of Artis-Naples, Naples, Florida, and as a Trustee for Brewster Academy, Wolfeboro, New Hampshire. Previously, Mr. Curvey served as a Director of Fidelity Investments Money Management, Inc. (investment adviser firm, 2009-2014) and a Director of FMR and FMR Co., Inc. (investment adviser firms, 2007-2014).
Charles S. Morrison (1960)
Year of Election or Appointment: 2014
Trustee
Mr. Morrison also serves as Trustee of other funds. He serves as a Director of Fidelity Investments Money Management, Inc. (FIMM) (investment adviser firm, 2014-present), Director of Fidelity SelectCo, LLC (investment adviser firm, 2014-present), President, Asset Management (2014-present), and is an employee of Fidelity Investments. Previously, Mr. Morrison served as Vice President of Fidelity's Fixed Income and Asset Allocation Funds (2012-2014), President, Fixed Income (2011-2014), Vice President of Fidelity's Money Market Funds (2005-2009), President, Money Market Group Leader of FMR (investment adviser firm, 2009), and Senior Vice President, Money Market Group of FMR (2004-2009). Mr. Morrison also served as Vice President of Fidelity's Bond Funds (2002-2005), certain Balanced Funds (2002-2005), and certain Asset Allocation Funds (2002-2007), and as Senior Vice President (2002-2005) of Fidelity's Bond Division.
* Determined to be an “Interested Trustee” by virtue of, among other things, his or her affiliation with the trust or various entities under common control with FMR.
+ The information includes the Trustee's principal occupation during the last five years and other information relating to the experience, attributes, and skills relevant to the Trustee's qualifications to serve as a Trustee, which led to the conclusion that the Trustee should serve as a Trustee for the fund.
Independent Trustees:
Correspondence intended for an Independent Trustee may be sent to Fidelity Investments, P.O. Box 55235, Boston, Massachusetts 02205-5235.
Name, Year of Birth; Principal Occupations and Other Relevant Experience+
Dennis J. Dirks (1948)
Year of Election or Appointment: 2005
Trustee
Mr. Dirks also serves as Trustee of other Fidelity® funds. Prior to his retirement in May 2003, Mr. Dirks was Chief Operating Officer and a member of the Board of The Depository Trust & Clearing Corporation (DTCC). He also served as President, Chief Operating Officer, and Board member of The Depository Trust Company (DTC) and President and Board member of the National Securities Clearing Corporation (NSCC). In addition, Mr. Dirks served as Chief Executive Officer and Board member of the Government Securities Clearing Corporation, Chief Executive Officer and Board member of the Mortgage-Backed Securities Clearing Corporation, as a Trustee and a member of the Finance Committee of Manhattan College (2005-2008), as a Trustee and a member of the Finance Committee of AHRC of Nassau County (2006-2008), and as a member of the Independent Directors Council (IDC) Governing Council (2010-2015). Mr. Dirks is a member of the Board of Directors for The Brookville Center for Children's Services, Inc. (2009-present).
Alan J. Lacy (1953)
Year of Election or Appointment: 2008
Trustee
Mr. Lacy also serves as Trustee of other Fidelity® funds. Mr. Lacy serves as Chairman (2014-present) and a member (2010-present) of the Board of Directors of Dave & Buster's Entertainment, Inc. (restaurant and entertainment complexes) and a Director of Bristol-Myers Squibb Company (global pharmaceuticals, 2008-present). He is a Trustee of the California Chapter of The Nature Conservancy (2015-present) and a Director of the Center for Advanced Study in the Behavioral Sciences at Stanford University (2015-present). In addition, Mr. Lacy served as Senior Adviser (2007-2014) of Oak Hill Capital Partners, L.P. (private equity) and also served as Chief Executive Officer (2005) and Vice Chairman (2005-2006) of Sears Holdings Corporation (retail) and Chief Executive Officer and Chairman of the Board of Sears, Roebuck and Co. (retail, 2000-2005). Previously, Mr. Lacy served as Chairman (2008-2011) and a member (2006-2015) of the Board of Trustees of the National Parks Conservation Association and as a member of the Board of Directors for The Western Union Company (global money transfer, 2006-2011), The Hillman Companies, Inc. (hardware wholesalers, 2010-2014), and Earth Fare, Inc. (retail grocery, 2010-2014).
Ned C. Lautenbach (1944)
Year of Election or Appointment: 2000
Trustee
Chairman of the Independent Trustees
Mr. Lautenbach also serves as Trustee of other Fidelity® funds. Mr. Lautenbach currently serves as the Lead Director of the Eaton Corporation Board of Directors (diversified industrial, 1997-present). Mr. Lautenbach is Chairman of the Board of Directors of Artis-Naples in Naples, Florida (2012-present), a member of the Council on Foreign Relations (1994-present), and a member of the Board of Governors, State University System of Florida (2013-present). Previously, Mr. Lautenbach was a Partner/Advisory Partner at Clayton, Dubilier & Rice, LLC (private equity investment, 1998-2010), as well as a Director of Sony Corporation (2006-2007).
Joseph Mauriello (1944)
Year of Election or Appointment: 2008
Trustee
Mr. Mauriello also serves as Trustee of other Fidelity® funds. Prior to his retirement in January 2006, Mr. Mauriello served in numerous senior management positions including Deputy Chairman and Chief Operating Officer (2004-2005), and Vice Chairman of Financial Services (2002-2004) of KPMG LLP US (professional services, 1965-2005). Mr. Mauriello currently serves as a member of the Board of Directors of XL Group plc. (global insurance and re-insurance, 2006-present) and the Independent Directors Council (IDC) Governing Council (2015-present). Previously, Mr. Mauriello served as a Director of the Hamilton Funds of the Bank of New York (2006-2007) and of Arcadia Resources Inc. (health care services and products, 2007-2012).
Robert W. Selander (1950)
Year of Election or Appointment: 2011
Trustee
Mr. Selander also serves as Trustee of other Fidelity® funds. Mr. Selander serves as a Director of The Western Union Company (global money transfer, 2014-present) and a non-executive Chairman of Health Equity, Inc. (health savings custodian, 2015-present). Previously, Mr. Selander served as a Member of the Advisory Board of certain Fidelity® funds (2011), and Executive Vice Chairman (2010), Chief Executive Officer (2009-2010), and President and Chief Executive Officer (1997-2009) of Mastercard, Inc.
Cornelia M. Small (1944)
Year of Election or Appointment: 2005
Trustee
Ms. Small also serves as Trustee of other Fidelity® funds. Ms. Small is a member of the Board of Directors (2009-present) and Chair of the Investment Committee (2010-present) of the Teagle Foundation. Ms. Small also serves on the Investment Committee of the Berkshire Taconic Community Foundation (2008-present). Previously, Ms. Small served as Chairperson (2002-2008) and a member of the Investment Committee and Chairperson (2008-2012) and a member of the Board of Trustees of Smith College. In addition, Ms. Small served as Chief Investment Officer, Director of Global Equity Investments, and a member of the Board of Directors of Scudder, Stevens & Clark and Scudder Kemper Investments.
William S. Stavropoulos (1939)
Year of Election or Appointment: 2002
Trustee
Vice Chairman of the Independent Trustees
Mr. Stavropoulos also serves as Trustee of other Fidelity® funds. Mr. Stavropoulos serves as President and Founder of the Michigan Baseball Foundation, the Great Lakes Loons (2007-present). Mr. Stavropoulos is Chairman Emeritus of the Board of Directors of The Dow Chemical Company, where he previously served in numerous senior management positions, including President, CEO (1995-2000; 2002-2004), Chairman of the Executive Committee (2000-2006), and as a member of the Board of Directors (1990-2006). Currently, Mr. Stavropoulos is Chairman of the Board of Directors of Univar Inc. (global distributor of commodity and specialty chemicals), a Director of Teradata Corporation (data warehousing and technology solutions), and Maersk Inc. (industrial conglomerate), and a member of the Advisory Board for Metalmark Capital LLC (private equity investment, 2005-present). Mr. Stavropoulos is an operating advisor to Clayton, Dubilier & Rice, LLC (private equity investment). In addition, Mr. Stavropoulos is a member of the University of Notre Dame Advisory Council for the College of Science, a Trustee of the Rollin L. Gerstacker Foundation, and a Director of the Naples Philharmonic Center for the Arts. Previously, Mr. Stavropoulos served as a Director of Chemical Financial Corporation (bank holding company, 1993-2012) and Tyco International, Ltd. (multinational manufacturing and services, 2007-2012).
David M. Thomas (1949)
Year of Election or Appointment: 2008
Trustee
Mr. Thomas also serves as Trustee of other Fidelity® funds. Mr. Thomas serves as Non-Executive Chairman of the Board of Directors of Fortune Brands Home and Security (home and security products, 2011-present), as a member of the Board of Directors (2004-present) and Presiding Director (2013-present) of Interpublic Group of Companies, Inc. (marketing communication), and as a member of the Board of Trustees of the University of Florida (2013-present). Previously, Mr. Thomas served as Executive Chairman (2005-2006) and Chairman and Chief Executive Officer (2000-2005) of IMS Health, Inc. (pharmaceutical and healthcare information solutions), and a Director of Fortune Brands, Inc. (consumer products, 2000-2011).
+ The information includes the Trustee's principal occupation during the last five years and other information relating to the experience, attributes, and skills relevant to the Trustee's qualifications to serve as a Trustee, which led to the conclusion that the Trustee should serve as a Trustee for the fund.
Advisory Board Members and Officers:
Correspondence intended for an officer or Peter S. Lynch may be sent to Fidelity Investments, 245 Summer Street, Boston, Massachusetts 02210. Officers appear below in alphabetical order.
Name, Year of Birth; Principal Occupation
Peter S. Lynch (1944)
Year of Election or Appointment: 2003
Member of the Advisory Board
Mr. Lynch also serves as Member of the Advisory Board of other Fidelity® funds. Mr. Lynch is Vice Chairman and a Director of FMR (investment adviser firm) and FMR Co., Inc. (investment adviser firm). In addition, Mr. Lynch serves as a Trustee of Boston College and as the Chairman of the Inner-City Scholarship Fund. Previously, Mr. Lynch served on the Special Olympics International Board of Directors (1997-2006).
Marc R. Bryant (1966)
Year of Election or Appointment: 2015
Secretary and Chief Legal Officer (CLO)
Mr. Bryant also serves as Secretary and CLO of other funds. Mr. Bryant serves as CLO, Secretary, and Senior Vice President of Fidelity Management & Research Company (investment adviser firm, 2015-present) and FMR Co., Inc. (investment adviser firm, 2015-present); Secretary of Fidelity SelectCo, LLC (investment adviser firm, 2015-present) and Fidelity Investments Money Management, Inc. (investment adviser firm, 2015-present); and CLO of Fidelity Management & Research (Hong Kong) Limited and FMR Investment Management (U.K.) Limited (investment adviser firms, 2015-present) and Fidelity Management & Research (Japan) Limited (investment adviser firm, 2016-present). He is Senior Vice President and Deputy General Counsel of FMR LLC (diversified financial services company). Previously, Mr. Bryant served as Secretary and CLO of Fidelity Rutland Square Trust II (2010-2014) and Assistant Secretary of Fidelity's Fixed Income and Asset Allocation Funds (2013-2015). Prior to joining Fidelity Investments, Mr. Bryant served as a Senior Vice President and the Head of Global Retail Legal for AllianceBernstein L.P. (2006-2010), and as the General Counsel for ProFund Advisors LLC (2001-2006).
William C. Coffey (1969)
Year of Election or Appointment: 2009
Assistant Secretary
Mr. Coffey also serves as Assistant Secretary of other funds. He is Senior Vice President and Deputy General Counsel of FMR LLC (diversified financial services company, 2010-present), and is an employee of Fidelity Investments. Previously, Mr. Coffey served as Vice President and Associate General Counsel of FMR LLC (2005-2009).
Jeffrey S. Christian (1961)
Year of Election or Appointment: 2016
Assistant Treasurer
Mr. Christian also serves as Assistant Treasurer of other funds. Mr. Christian is an employee of Fidelity Investments (2003-present).
Jonathan Davis (1968)
Year of Election or Appointment: 2010
Assistant Treasurer
Mr. Davis also serves as Assistant Treasurer of other funds, and is an employee of Fidelity Investments. Previously, Mr. Davis served as Vice President and Associate General Counsel of FMR LLC (diversified financial services company, 2003-2010).
Adrien E. Deberghes (1967)
Year of Election or Appointment: 2016
Assistant Treasurer
Mr. Deberghes also serves as an officer of other funds. He is an employee of Fidelity Investments (2008-present). Prior to joining Fidelity Investments, Mr. Deberghes was Senior Vice President of Mutual Fund Administration at State Street Corporation (2007-2008), Senior Director of Mutual Fund Administration at Investors Bank & Trust (2005-2007), and Director of Finance for Dunkin' Brands (2000-2005). Previously, Mr. Deberghes served in other fund officer roles.
Stephanie J. Dorsey (1969)
Year of Election or Appointment: 2010
Assistant Treasurer
Ms. Dorsey also serves as an officer of other funds. She is an employee of Fidelity Investments (2008-present) and has served in other fund officer roles. Prior to joining Fidelity Investments, Ms. Dorsey served as Treasurer (2004-2008) of the JPMorgan Mutual Funds and Vice President (2004-2008) of JPMorgan Chase Bank.
Howard J. Galligan III (1966)
Year of Election or Appointment: 2014
Chief Financial Officer
Mr. Galligan also serves as Chief Financial Officer of other funds. Mr. Galligan serves as President of Fidelity Pricing and Cash Management Services (FPCMS) (2014-present) and as a Director of Strategic Advisers, Inc. (investment adviser firm, 2008-present). Previously, Mr. Galligan served as Chief Administrative Officer of Asset Management (2011-2014) and Chief Operating Officer and Senior Vice President of Investment Support for Strategic Advisers, Inc. (2003-2011).
Scott C. Goebel (1968)
Year of Election or Appointment: 2015
Vice President
Mr. Goebel serves as Vice President of other funds and is an employee of Fidelity Investments (2001-present). Previously, Mr. Goebel served as Secretary of Fidelity SelectCo, LLC (investment adviser firm, 2013-2015), Fidelity Investments Money Management, Inc. (FIMM) (investment adviser firm, 2010-2015), and Fidelity Research and Analysis Company (FRAC) (investment adviser firm, 2010-2015); General Counsel, Secretary, and Senior Vice President of Fidelity Management & Research Company (investment adviser firm, 2008-2015) and FMR Co., Inc. (investment adviser firm, 2008-2015); Assistant Secretary of Fidelity Management & Research (Japan) Limited (investment adviser firm, 2008-2015) and Fidelity Management & Research (U.K.) Inc. (investment adviser firm, 2008-2015); Chief Legal Officer (CLO) of Fidelity Management & Research (Hong Kong) Limited (investment adviser firm, 2008-2015); Secretary and CLO of certain Fidelity® funds (2008-2015); Assistant Secretary of FIMM (2008-2010), FRAC (2008-2010), and certain funds (2007-2008); and as Vice President and Secretary of Fidelity Distributors Corporation (FDC) (2005-2007).
Brian B. Hogan (1964)
Year of Election or Appointment: 2009
Vice President
Mr. Hogan also serves as Trustee or Vice President of other funds. Mr. Hogan serves as a Director of FMR Investment Management (U.K.) Limited (investment adviser firm, 2015-present) and Fidelity SelectCo, LLC (investment adviser firm, 2014-present) and President of the Equity Division of FMR (investment adviser firm, 2009-present). Previously, Mr. Hogan served as Senior Vice President, Equity Research of FMR (2006-2009) and as a portfolio manager. Mr. Brian B. Hogan is not related to Mr. Colm A. Hogan.
Colm A. Hogan (1973)
Year of Election or Appointment: 2016
Deputy Treasurer
Mr. Hogan also serves as an officer of other funds. Mr. Hogan is an employee of Fidelity Investments (2005-present). Mr. Colm A. Hogan is not related to Mr. Brian B. Hogan.
Chris Maher (1972)
Year of Election or Appointment: 2013
Assistant Treasurer
Mr. Maher serves as Assistant Treasurer of other funds. Mr. Maher is Vice President of Valuation Oversight and is an employee of Fidelity Investments. Previously, Mr. Maher served as Vice President of Asset Management Compliance (2013), Vice President of the Program Management Group of FMR (investment adviser firm, 2010-2013), and Vice President of Valuation Oversight (2008-2010).
John F. Papandrea (1972)
Year of Election or Appointment: 2016
Anti-Money Laundering (AML) Officer
Mr. Papandrea also serves as AML Officer of other funds. Mr. Papandrea is Vice President of FMR LLC (diversified financial services company, 2008-present) and is an employee of Fidelity Investments (2005-present).
Melissa M. Reilly (1971)
Year of Election or Appointment: 2014
Vice President of certain Equity Funds
Ms. Reilly also serves as Vice President of other funds. Ms. Reilly is an employee of Fidelity Investments (2004-present).
Kenneth B. Robins (1969)
Year of Election or Appointment: 2016
Chief Compliance Officer
Mr. Robins also serves as an officer of other funds. Mr. Robins serves as Executive Vice President of Fidelity Investments Money Management, Inc. (FIMM) (investment adviser firm, 2013-present) and is an employee of Fidelity Investments (2004-present). Previously, Mr. Robins served in other fund officer roles.
Stacie M. Smith (1974)
Year of Election or Appointment: 2016
President and Treasurer
Ms. Smith also serves as an officer of other funds. She is an employee of Fidelity Investments (2009-present) and has served in other fund officer roles. Prior to joining Fidelity Investments, Ms. Smith served as Senior Audit Manager of Ernst & Young LLP (1996-2009). Previously, Ms. Smith served as Deputy Treasurer of certain Fidelity® funds (2013-2016).
Renee Stagnone (1975)
Year of Election or Appointment: 2016
Assistant Treasurer
Ms. Stagnone also serves as an officer of other funds. Ms. Stagnone is an employee of Fidelity Investments (1997-present). Previously, Ms. Stagnone served as Deputy Treasurer of certain Fidelity® funds (2013-2016).
Shareholder Expense Example
As a shareholder of the Fund, you incur two types of costs: (1) transaction costs, including sales charges (loads) on purchase payments or redemption proceeds, and (2) ongoing costs, including management fees, distribution and/or service (12b-1) fees and other Fund expenses. This Example is intended to help you understand your ongoing costs (in dollars) of investing in the Fund and to compare these costs with the ongoing costs of investing in other mutual funds.
The Example is based on an investment of $1,000 invested at the beginning of the period and held for the entire period (November 1, 2015 to April 30, 2016).
Actual Expenses
The first line of the accompanying table for each class of the Fund provides information about actual account values and actual expenses. You may use the information in this line, together with the amount you invested, to estimate the expenses that you paid over the period. Simply divide your account value by $1,000.00 (for example, an $8,600 account value divided by $1,000.00 = 8.6), then multiply the result by the number in the first line for a class of the Fund under the heading entitled "Expenses Paid During Period" to estimate the expenses you paid on your account during this period. In addition, the Fund, as a shareholder in the underlying Fidelity Central Funds, will indirectly bear its pro-rata share of the fees and expenses incurred by the underlying Fidelity Central Funds. These fees and expenses are not included in the Fund's annualized expense ratio used to calculate the expense estimate in the table below.
Hypothetical Example for Comparison Purposes
The second line of the accompanying table for each class of the Fund provides information about hypothetical account values and hypothetical expenses based on a Class' actual expense ratio and an assumed rate of return of 5% per year before expenses, which is not the Class' actual return. The hypothetical account values and expenses may not be used to estimate the actual ending account balance or expenses you paid for the period. You may use this information to compare the ongoing costs of investing in the Fund and other funds. To do so, compare this 5% hypothetical example with the 5% hypothetical examples that appear in the shareholder reports of the other funds. In addition, the Fund, as a shareholder in the underlying Fidelity Central Funds, will indirectly bear its pro-rata share of the fees and expenses incurred by the underlying Fidelity Central Funds. These fees and expenses are not included in the Fund's annualized expense ratio used to calculate the expense estimate in the table below.
Please note that the expenses shown in the table are meant to highlight your ongoing costs only and do not reflect any transaction costs. Therefore, the second line of the table is useful in comparing ongoing costs only, and will not help you determine the relative total costs of owning different funds. In addition, if these transactional costs were included, your costs would have been higher.
| Annualized Expense Ratio-A | Beginning Account Value November 1, 2015 | Ending Account Value April 30, 2016 | Expenses Paid During Period-B November 1, 2015 to April 30, 2016 |
|
| Class A | 1.55% | |||
| Actual | $1,000.00 | $986.70 | $7.66 | |
| Hypothetical-C | $1,000.00 | $1,017.16 | $7.77 | |
| Class T | 1.80% | |||
| Actual | $1,000.00 | $985.80 | $8.89 | |
| Hypothetical-C | $1,000.00 | $1,015.91 | $9.02 | |
| Class C | 2.30% | |||
| Actual | $1,000.00 | $982.90 | $11.34 | |
| Hypothetical-C | $1,000.00 | $1,013.43 | $11.51 | |
| Class I | 1.30% | |||
| Actual | $1,000.00 | $987.70 | $6.42 | |
| Hypothetical-C | $1,000.00 | $1,018.40 | $6.52 |
A Annualized expense ratio reflects expenses net of applicable fee waivers.
B Expenses are equal to each Class' annualized expense ratio, multiplied by the average account value over the period, multiplied by 182/366 (to reflect the one-half year period).
C 5% return per year before expenses
Distributions (Unaudited)
The fund hereby designates as a capital gain dividend with respect to the taxable year ended April 30, 2016, $9,451, or, if subsequently determined to be different, the net capital gain of such year.
The fund will notify shareholders in January 2017 of amounts for use in preparing 2016 income tax returns.
![]()
AEDO-ANN-0616
1.9585367.102
Item 2.
Code of Ethics
As of the end of the period, April 30, 2016, Fidelity Commonwealth Trust (the trust) has adopted a code of ethics, as defined in Item 2 of Form N-CSR, that applies to its President and Treasurer and its Chief Financial Officer. A copy of the code of ethics is filed as an exhibit to this Form N-CSR.
Item 3.
Audit Committee Financial Expert
The Board of Trustees of the trust has determined that Joseph Mauriello is an audit committee financial expert, as defined in Item 3 of Form N-CSR. Mr. Mauriello is independent for purposes of Item 3 of Form N-CSR.
Item 4.
Principal Accountant Fees and Services
Fees and Services
The following table presents fees billed by Deloitte & Touche LLP, the member firms of Deloitte Touche Tohmatsu, and their respective affiliates (collectively, “Deloitte Entities”) in each of the last two fiscal years for services rendered to Fidelity Large Cap Stock Fund, Fidelity Mid-Cap Stock Fund, Fidelity Small Cap Discovery Fund, Fidelity Small Cap Stock Fund and Fidelity Series Small Cap Discovery Fund (the “Funds”):
Services Billed by Deloitte Entities
April 30, 2016 FeesA
Audit Fees | Audit-Related Fees | Tax Fees | All Other Fees | |
Fidelity Large Cap Stock Fund | $44,000 | $- | $5,200 | $1,300 |
Fidelity Mid-Cap Stock Fund | $52,000 | $- | $8,200 | $2,000 |
Fidelity Small Cap Discovery Fund | $46,000 | $- | $5,100 | $1,700 |
Fidelity Small Cap Stock Fund | $46,000 | $- | $5,200 | $1,100 |
Fidelity Series Small Cap Discovery Fund | $45,000 | $- | $5,400 | $1,100 |
April 30, 2015 FeesA
Audit Fees | Audit-Related Fees | Tax Fees | All Other Fees | |
Fidelity Large Cap Stock Fund | $50,000 | $- | $6,200 | $1,300 |
Fidelity Mid-Cap Stock Fund | $42,000 | $- | $7,000 | $2,600 |
Fidelity Small Cap Discovery Fund | $45,000 | $- | $4,700 | $1,900 |
Fidelity Small Cap Stock Fund | $45,000 | $- | $5,200 | $1,000 |
Fidelity Series Small Cap Discovery Fund | $44,000 | $- | $4,700 | $900 |
A Amounts may reflect rounding.
.
The following table presents fees billed by PricewaterhouseCoopers LLP (“PwC”) in each of the last two fiscal years for services rendered to Fidelity Advisor Event Driven Opportunities Fund and Fidelity Event Driven Opportunities Fund (the “Funds”):
Services Billed by PwC
April 30, 2016 FeesA
Audit Fees | Audit-Related Fees | Tax Fees | All Other Fees | |
Fidelity Advisor Event Driven Opportunities Fund | $42,000 | $- | $3,900 | $1,900 |
Fidelity Event Driven Opportunities Fund | $38,000 | $- | $2,800 | $1,900 |
April 30, 2015 FeesA
Audit Fees | Audit-Related Fees | Tax Fees | All Other Fees | |
Fidelity Advisor Event Driven Opportunities Fund | $41,000 | $- | $3,200 | $1,600 |
Fidelity Event Driven Opportunities Fund | $36,000 | $- | $2,800 | $1,600 |
A Amounts may reflect rounding.
The following table presents fees billed by PwC and Deloitte Entities that were required to be approved by the Audit Committee for services that relate directly to the operations and financial reporting of the Funds and that are rendered on behalf of Fidelity Management & Research Company (“FMR”) and entities controlling, controlled by, or under common control with FMR (not including any sub-adviser whose role is primarily portfolio management and is subcontracted with or overseen by another investment adviser) that provide ongoing services to the Funds (“Fund Service Providers”):
Services Billed by Deloitte Entities
April 30, 2016A | April 30, 2015A | |
Audit-Related Fees | $35,000 | $- |
Tax Fees | $10,000 | $- |
All Other Fees | $- | $220,000 |
A Amounts may reflect rounding.
Services Billed by PwC
April 30, 2016A | April 30, 2015A | |
Audit-Related Fees | $5,695,000 | $5,900,000 |
Tax Fees | $- | $- |
All Other Fees | $- | $- |
A Amounts may reflect rounding.
“Audit-Related Fees” represent fees billed for assurance and related services that are reasonably related to the performance of the fund audit or the review of the fund's financial statements and that are not reported under Audit Fees.
“Tax Fees” represent fees billed for tax compliance, tax advice or tax planning that relate directly to the operations and financial reporting of the fund.
“All Other Fees” represent fees billed for services provided to the fund or Fund Service Provider, a significant portion of which are assurance related, that relate directly to the operations and financial reporting of the fund, excluding those services that are reported under Audit Fees, Audit-Related Fees or Tax Fees.
Assurance services must be performed by an independent public accountant.
* * *
The aggregate non-audit fees billed by PwC and Deloitte Entities for services rendered to the Funds, FMR (not including any sub-adviser whose role is primarily portfolio management and is subcontracted with or overseen by another investment adviser), and any Fund Service Provider for each of the last two fiscal years of the Funds are as follows:
Billed By | April 30, 2016 A | April 30, 2015 A |
Deloitte Entities | $125,000 | $1,330,000 |
PwC | $6,080,000 | $8,075,000 |
A Amounts may reflect rounding.
The trust's Audit Committee has considered non-audit services that were not pre-approved that were provided by PwC and Deloitte Entities to Fund Service Providers to be compatible with maintaining the independence of PwC and Deloitte Entities in their audits of the Funds, taking into account representations from PwC and Deloitte Entities, in accordance with Public Company Accounting Oversight Board rules, regarding their
independence from the Funds and their related entities and FMR’s review of the appropriateness and permissibility under applicable law of such non-audit services prior to their provision to the Fund Service Providers.
Audit Committee Pre-Approval Policies and Procedures
The trust’s Audit Committee must pre-approve all audit and non-audit services provided by a fund’s independent registered public accounting firm relating to the operations or financial reporting of the fund. Prior to the commencement of any audit or non-audit services to a fund, the Audit Committee reviews the services to determine whether they are appropriate and permissible under applicable law.
The Audit Committee has adopted policies and procedures to, among other purposes, provide a framework for the Committee’s consideration of non-audit services by the audit firms that audit the Fidelity funds. The policies and procedures require that any non-audit service provided by a fund audit firm to a Fidelity fund and any non-audit service provided by a fund auditor to a Fund Service Provider that relates directly to the operations and financial reporting of a Fidelity fund (“Covered Service”) are subject to approval by the Audit Committee before such service is provided.
All Covered Services must be approved in advance of provision of the service either: (i) by formal resolution of the Audit Committee, or (ii) by oral or written approval of the service by the Chair of the Audit Committee (or if the Chair is unavailable, such other member of the Audit Committee as may be designated by the Chair to act in the Chair’s absence). The approval contemplated by (ii) above is permitted where the Treasurer determines that action on such an engagement is necessary before the next meeting of the Audit Committee.
Non-audit services provided by a fund audit firm to a Fund Service Provider that do not relate directly to the operations and financial reporting of a Fidelity fund are reported to the Audit Committee on a periodic basis.
Non-Audit Services Approved Pursuant to Rule 2-01(c)(7)(i)(C) and (ii) of Regulation S-X (“De Minimis Exception”)
There were no non-audit services approved or required to be approved by the Audit Committee pursuant to the De Minimis Exception during the Funds’ last two fiscal years relating to services provided to (i) the Funds or (ii) any Fund Service Provider that relate directly to the operations and financial reporting of the Funds.
Item 5.
Audit Committee of Listed Registrants
Not applicable.
Item 6.
Investments
(a)
Not applicable.
(b)
Not applicable
Item 7.
Disclosure of Proxy Voting Policies and Procedures for Closed-End Management Investment Companies
Not applicable.
Item 8.
Portfolio Managers of Closed-End Management Investment Companies
Not applicable.
Item 9.
Purchase of Equity Securities by Closed-End Management Investment Company and Affiliated Purchasers
Not applicable.
Item 10.
Submission of Matters to a Vote of Security Holders
There were no material changes to the procedures by which shareholders may recommend nominees to the trust’s Board of Trustees.
Item 11.
Controls and Procedures
(a)(i) The President and Treasurer and the Chief Financial Officer have concluded that the trust’s disclosure controls and procedures (as defined in Rule 30a-3(c) under the Investment Company Act) provide reasonable assurances that material information relating to the trust is made known to them by the appropriate persons, based on their evaluation of these controls and procedures as of a date within 90 days of the filing date of this report.
(a)(ii) There was no change in the trust’s internal control over financial reporting (as defined in Rule 30a-3(d) under the Investment Company Act) that occurred during the second fiscal quarter of the period covered by this report that has materially affected, or is reasonably likely to materially affect, the trust’s internal control over financial reporting.
Item 12.
Exhibits
(a) | (1) | Code of Ethics pursuant to Item 2 of Form N-CSR is filed and attached hereto as EX-99.CODE ETH. |
(a) | (2) | Certification pursuant to Rule 30a-2(a) under the Investment Company Act of 1940 (17 CFR 270.30a-2(a)) is filed and attached hereto as Exhibit 99.CERT. |
(a) | (3) | Not applicable. |
(b) | Certification pursuant to Rule 30a-2(b) under the Investment Company Act of 1940 (17 CFR 270.30a-2(b)) is furnished and attached hereto as Exhibit 99.906CERT. |
SIGNATURES
Pursuant to the requirements of the Securities Exchange Act of 1934 and the Investment Company Act of 1940, the registrant has duly caused this report to be signed on its behalf by the undersigned, thereunto duly authorized.
Fidelity Commonwealth Trust
By: | /s/Stacie M. Smith |
Stacie M. Smith | |
President and Treasurer | |
Date: | June 24, 2016 |
Pursuant to the requirements of the Securities Exchange Act of 1934 and the Investment Company Act of 1940, this report has been signed below by the following persons on behalf of the registrant and in the capacities and on the dates indicated.
By: | /s/Stacie M. Smith |
Stacie M. Smith | |
President and Treasurer | |
Date: | June 24, 2016 |
By: | /s/Howard J. Galligan III |
Howard J. Galligan III | |
Chief Financial Officer | |
Date: | June 24, 2016 |
Exhibit EX-99.CERT
I, Stacie M. Smith, certify that:
1.
I have reviewed this report on Form N-CSR of Fidelity Commonwealth Trust;
2.
Based on my knowledge, this report does not contain any untrue statement of a material fact or omit to state a material fact necessary to make the statements made, in light of the circumstances under which such statements were made, not misleading with respect to the period covered by this report;
3.
Based on my knowledge, the financial statements, and other financial information included in this report, fairly present in all material respects the financial condition, results of operations, changes in net assets, and cash flows (if the financial statements are required to include a statement of cash flows) of the registrant as of, and for, the periods presented in this report;
4.
The registrant's other certifying officer(s) and I are responsible for establishing and maintaining disclosure controls and procedures (as defined in Rule 30a-3(c) under the Investment Company Act of 1940) and internal control over financial reporting (as defined in Rule 30a-3(d) under the Investment Company Act of 1940) for the registrant and have:
a.
Designed such disclosure controls and procedures, or caused such disclosure controls and procedures to be designed under our supervision, to ensure that material information relating to the registrant, including its consolidated subsidiaries, is made known to us by others within those entities, particularly during the period in which this report is being prepared;
b.
Designed such internal control over financial reporting, or caused such internal control over financial reporting to be designed under our supervision, to provide reasonable assurance regarding the reliability of financial reporting and the preparation of financial statements for external purposes in accordance with generally accepted accounting principles;
c.
Evaluated the effectiveness of the registrant's disclosure controls and procedures and presented in this report our conclusions about the effectiveness of the disclosure controls and procedures, as of a date within 90 days prior to the filing date of this report based upon such evaluation; and
d.
Disclosed in this report any change in the registrant’s internal control over financial reporting that occurred during the second fiscal quarter of the period covered by this report that has materially affected, or is reasonably likely to materially affect, the registrant’s internal control over financial reporting; and
5.
The registrant's other certifying officer(s) and I have disclosed to the registrant's auditors and the audit committee of the registrant's board of directors (or persons performing the equivalent functions):
a.
All significant deficiencies and material weaknesses in the design or operation of internal control over financial reporting which are reasonably likely to adversely affect the registrant's ability to record, process, summarize, and report financial information; and
b.
Any fraud, whether or not material, that involves management or other employees who have a significant role in the registrant's internal control over financial reporting.
Date:
June 24, 2016
/s/Stacie M. Smith |
Stacie M. Smith |
President and Treasurer |
I, Howard J. Galligan III, certify that:
1.
I have reviewed this report on Form N-CSR of Fidelity Commonwealth Trust;
2.
Based on my knowledge, this report does not contain any untrue statement of a material fact or omit to state a material fact necessary to make the statements made, in light of the circumstances under which such statements were made, not misleading with respect to the period covered by this report;
3.
Based on my knowledge, the financial statements, and other financial information included in this report, fairly present in all material respects the financial condition, results of operations, changes in net assets, and cash flows (if the financial statements are required to include a statement of cash flows) of the registrant as of, and for, the periods presented in this report;
4.
The registrant's other certifying officer(s) and I are responsible for establishing and maintaining disclosure controls and procedures (as defined in Rule 30a-3(c) under the Investment Company Act of 1940) and internal control over financial reporting (as defined in Rule 30a-3(d) under the Investment Company Act of 1940) for the registrant and have:
a.
Designed such disclosure controls and procedures, or caused such disclosure controls and procedures to be designed under our supervision, to ensure that material information relating to the registrant, including its consolidated subsidiaries, is made known to us by others within those entities, particularly during the period in which this report is being prepared;
b.
Designed such internal control over financial reporting, or caused such internal control over financial reporting to be designed under our supervision, to provide reasonable assurance regarding the reliability of financial reporting and the preparation of financial statements for external purposes in accordance with generally accepted accounting principles;
c.
Evaluated the effectiveness of the registrant's disclosure controls and procedures and presented in this report our conclusions about the effectiveness of the disclosure controls and procedures, as of a date within 90 days prior to the filing date of this report based upon such evaluation; and
d.
Disclosed in this report any change in the registrant’s internal control over financial reporting that occurred during the second fiscal quarter of the period covered by this report that has materially affected, or is reasonably likely to materially affect, the registrant’s internal control over financial reporting; and
5.
The registrant's other certifying officer(s) and I have disclosed to the registrant's auditors and the audit committee of the registrant's board of directors (or persons performing the equivalent functions):
a.
All significant deficiencies and material weaknesses in the design or operation of internal control over financial reporting which are reasonably likely to adversely affect the registrant's ability to record, process, summarize, and report financial information; and
b.
Any fraud, whether or not material, that involves management or other employees who have a significant role in the registrant's internal control over financial reporting.
Date:
June 24, 2016
/s/Howard J. Galligan III |
Howard J. Galligan III |
Chief Financial Officer |
Exhibit EX-99.906CERT
Certification Pursuant to Section 906 of the Sarbanes-Oxley Act of 2002 (subsections (a) and (b) of section 1350, chapter 63 of title 18, United States Code)
In connection with the attached Report of Fidelity Commonwealth Trust (the “Trust”) on Form N-CSR to be filed with the Securities and Exchange Commission (the “Report”), each of the undersigned officers of the Trust does hereby certify that, to the best of such officer’s knowledge:
1.
The Report fully complies with the requirements of 13(a) or 15(d) of the Securities Exchange Act of 1934; and
2.
The information contained in the Report fairly presents, in all material respects, the financial condition and results of operations of the Trust as of, and for, the periods presented in the Report.
Dated:
June 24, 2016
/s/Stacie M. Smith |
Stacie M. Smith |
President and Treasurer |
Dated:
June 24, 2016
/s/Howard J. Galligan III |
Howard J. Galligan III |
Chief Financial Officer |
A signed original of this written statement required by Section 906, or other document authenticating, acknowledging, or otherwise adopting the signature that appears in typed form within the electronic version of this written statement required by Section 906, has been provided to the Trust and will be retained by the Trust and furnished to the Securities and Exchange Commission or its staff upon request.
EXHIBIT EX-99.CODE ETH
FIDELITY FUNDS’ CODE OF ETHICS FOR
PRESIDENT, TREASURER AND PRINCIPAL ACCOUNTING OFFICER
I. Purposes of the Code/Covered Officers
This document constitutes the Code of Ethics (Code) adopted by the Fidelity Funds (Funds) pursuant to the provisions of Rule 30b2-1(a) under the Investment Company Act of 1940), which Rule implements Sections 406 of the Sarbanes-Oxley Act of 2002 with respect to registered investment companies. The Code applies to the Fidelity Funds’ President and Treasurer, and Chief Financial Officer (Covered Officers). Fidelity’s Ethics Office, a part of Corporate Compliance Group within Core Compliance, administers the Code.
The purposes of the Code are to deter wrongdoing and to promote, on the part of the Covered Officers:
·
honest and ethical conduct, including the ethical handling of actual or apparent conflicts of interest between personal and professional relationships;
·
full, fair, accurate, timely and understandable disclosure in reports and documents that the Fidelity Funds submit to the Securities and Exchange Commission (SEC), and in other public communications by a Fidelity Fund;
·
compliance with applicable laws and governmental rules and regulations;
·
the prompt internal reporting to an appropriate person or persons identified in the Code of violations of the Code; and
·
accountability for adherence to the Code.
Each Covered Officer should adhere to a high standard of business ethics and should be sensitive to situations that may give rise to actual as well as apparent conflicts of interest.
II.
Covered Officers Should Handle Ethically
Actual and Apparent Conflicts of Interest
Overview. A “conflict of interest” occurs when a Covered Officer’s private interest interferes with the interests of, or his service to, the Fidelity Funds. For example, a conflict of interest would arise if a Covered Officer, or a member of his family, receives improper personal benefits as a result of his position with the Fidelity Funds.
Certain conflicts of interest arise out of the relationships between Covered Officers and the Fidelity Funds and already are subject to conflict of interest provisions in the Investment Company Act of 1940 (Investment Company Act) and the Investment Advisers Act of 1940 (Investment Advisers Act). For example, Covered Officers may not individually engage in certain transactions (such as the purchase or sale of securities or other property) with a Fidelity Fund because of their status as “affiliated persons” of the Fund. Separate compliance programs and procedures of the Fidelity Funds, Fidelity Management & Research Company (FMR) and the other Fidelity companies are designed to prevent, or identify and correct, violations of these provisions. This Code does not, and is not intended to, repeat or replace these programs and procedures, and such conflicts fall outside of the parameters of this Code.
Although typically not presenting an opportunity for improper personal benefit, conflicts arise from, or as a result of, the contractual relationship between the Fidelity Funds and FMR (or another Fidelity company) of which the Covered Officers are also officers or employees. As a result, this Code recognizes that the Covered Officers will, in the normal course of their duties (whether formally for the Fidelity Funds, FMR or another Fidelity company), be involved in establishing policies and implementing decisions that have different effects on the Fidelity Funds, FMR and other Fidelity companies. The participation of the Covered Officers in such activities is inherent in the contractual relationship between the Fidelity Funds and FMR (or another Fidelity company), and is consistent with the performance by the Covered Officers of their duties as officers of the Fidelity Funds. Thus, if performed in conformity with the provisions of the Investment Company Act and the Investment Advisers Act, such activities will be deemed to have been handled ethically. In addition, it is recognized by the Funds’ Board of Trustees (Board) that the Covered Officers also may be officers or employees of one or more other Fidelity Funds covered by this Code.
Other conflicts of interest are covered by the Code, even if such conflicts of interest are not subject to provisions in the Investment Company Act and the Investment Advisers Act. The following list provides examples of conflicts of interest under the Code, but Covered Officers should keep in mind that these examples are not exhaustive. The overarching principle is that the personal interest of a Covered Officer should not be placed improperly before the interest of a Fidelity Fund.
* * *
Each Covered Officer must:
·
not use his or her personal influence or personal relationships improperly to influence investment decisions or financial reporting by any Fidelity Fund whereby the Covered Officer would benefit personally to the detriment of any Fidelity Fund;
·
not cause a Fidelity Fund to take action, or fail to take action, for the individual personal benefit of the Covered Officer rather than the benefit of the Fidelity Fund;
·
not engage in any outside business activity, including serving as a director or trustee, that prevents the Covered Officer from devoting appropriate time and attention to the Covered Officer’s responsibilities with the Fidelity Funds;
·
not have a consulting or employment relationship with any of the Fidelity Funds’ service providers that are not affiliated with Fidelity; and
·
not retaliate against any employee or Covered Officer for reports of actual or potential misconduct, which are made in good faith.
With respect to other fact patterns, if a Covered Officer is in doubt, other potential conflict of interest situations should be described immediately to the Fidelity Ethics Office for resolution. Similarly, any questions a Covered Officer has generally regarding the application or interpretation of the Code should be directed to the Fidelity Ethics Office immediately.
III. Disclosure and Compliance
·
Each Covered Officer should familiarize himself with the disclosure requirements generally applicable to the Fidelity Funds.
·
Each Covered Officer should not knowingly misrepresent, or cause others to misrepresent, facts about any Fidelity Fund to others, whether within or outside Fidelity, including to the Board and auditors, and to governmental regulators and self-regulatory organizations;
·
Each Covered Officer should, to the extent appropriate within his area of responsibility, consult with other officers and employees of the Fidelity Funds, FMR and the Fidelity service providers, and with the Board’s Compliance Committee, with the goal of promoting full, fair, accurate, timely and understandable disclosure in the reports and documents the Fidelity Funds file with, or submit to, the SEC and in other public communications made by the Fidelity Funds; and
·
It is the responsibility of each Covered Officer to promote compliance with the standards and restrictions imposed by applicable laws, rules and regulations.
IV. Reporting and Accountability
Each Covered Officer must:
·
upon receipt of the Code, and annually thereafter, submit to the Fidelity Ethics Office an acknowledgement stating that he or she has received, read, and understands the Code; and
·
notify the Fidelity Ethics Office promptly if he or she knows of any violation of the Code. Failure to do so is itself a violation of this Code.
The Fidelity Ethics Office shall take all action it considers appropriate to investigate any actual or potential violations reported to it. Upon completion of the investigation, if necessary, the matter will be reviewed with senior management or other appropriate parties, and a determination will be made as to whether any action should be taken as detailed below. The Covered Officer will be informed of any action determined to be appropriate. The Fidelity Ethics Office will inform the Personal Trading Committee of all Code violations and actions taken in response. Without implied limitation, appropriate remedial, disciplinary or preventive action may include a written warning, a letter of censure, suspension, dismissal or, in the event of criminal or other serious violations of law, notification of the SEC or other appropriate law enforcement authorities. Additionally, other legal remedies may be pursued.
The policies and procedures described in the Code do not create any obligations to any person or entity other than the Fidelity Funds. The Code is intended solely for the internal use by the Fidelity Funds and does not constitute a promise, contract or an admission by or on behalf of any Fidelity Fund as to any fact, circumstance, or legal conclusion. The Fidelity Funds, the Fidelity companies and the Fidelity Chief Ethics Officer retain the discretion to decide whether the Code applies to a specific situation, and how it should be interpreted.
V. Oversight
Material violations of this Code will be reported promptly by FMR to the Board’s Compliance Committee. In addition, at least once each year, FMR will provide a written report to the Board, which describes any issues arising under the Code since the last report to the Board, including, but not limited to, information about material violations of the Code and action taken in response to the material violations.
VI. Other Policies and Procedures
This Code shall be the sole code of ethics adopted by the Fidelity Funds for purposes of Section 406 of the Sarbanes-Oxley Act and the rules and forms applicable to registered investment companies thereunder. Other Fidelity policies or procedures that cover the behavior or activities of Covered Officers are separate requirements applying to the Covered Officers (and others), and are not part of this Code.
VII. Amendments
Any material amendments or changes to this Code must be approved or ratified by a majority vote of the Board, including a majority of the Trustees who are not interested persons of the Fidelity Funds.
VIII. Records and Confidentiality
Records of any violation of the Code and of the actions taken as a result of such violations will be kept by the Fidelity Ethics Office. All reports and records prepared or maintained pursuant to this Code will be considered confidential and shall be maintained and protected accordingly. Except as otherwise required by law or this Code, such matters shall not be disclosed to anyone other than the Fidelity Ethics Office, the Personal Trading Committee, the Board, appropriate personnel at the relevant Fidelity company or companies and the legal counsel of any or all of the foregoing.
Serious News for Serious Traders! Try StreetInsider.com Premium Free!
You May Also Be Interested In
- Averill & Reaney Attorneys at Law Unveils New Community Recovery Initiative
- ContextLogic Completes Sale of Substantially All Operating Assets and Liabilities Associated with Wish to Qoo10
- Ridgeline Minerals Announces Upsized Non-Brokered Private Placement to $2.2M
Create E-mail Alert Related Categories
SEC FilingsSign up for StreetInsider Free!
Receive full access to all new and archived articles, unlimited portfolio tracking, e-mail alerts, custom newswires and RSS feeds - and more!
