

Form 10-K J M SMUCKER Co For: Apr 30
 Tweet
Tweet Share
ShareUNITED STATES
SECURITIES AND EXCHANGE COMMISSION
WASHINGTON, D.C. 20549
________________________________________________
FORM 10-K
________________________________________________
x | ANNUAL REPORT PURSUANT TO SECTION 13 OR 15(d) OF THE SECURITIES EXCHANGE ACT OF 1934 |
For the fiscal year ended April 30, 2016
or
o | TRANSITION REPORT PURSUANT TO SECTION 13 OR 15(d) OF THE SECURITIES EXCHANGE ACT OF 1934 |
For the transition period from to
Commission file number 001-5111
________________________________________________
THE J. M. SMUCKER COMPANY
(Exact name of registrant as specified in its charter)
________________________________________________
Ohio | 34-0538550 | |
(State or other jurisdiction of incorporation or organization) | (I.R.S. Employer Identification No.) | |
One Strawberry Lane | ||
Orrville, Ohio | 44667-0280 | |
(Address of principal executive offices) | (Zip code) | |
Registrant’s telephone number, including area code (330) 682-3000 | ||
Securities registered pursuant to Section 12(b) of the Act: | ||
Title of each class | Name of each exchange on which registered | |
Common shares, no par value | New York Stock Exchange | |
Rights to purchase preferred shares | New York Stock Exchange | |
Securities registered pursuant to Section 12(g) of the Act: None
________________________________________________
Indicate by check mark if the registrant is a well-known seasoned issuer, as defined in Rule 405 of the Securities Act. Yes x No o
Indicate by check mark if the registrant is not required to file reports pursuant to Section 13 or Section 15(d) of the Act. Yes o No x
Indicate by check mark whether the registrant (1) has filed all reports required to be filed by Section 13 or 15(d) of the Securities Exchange Act of 1934 during the preceding 12 months (or for such shorter period that the registrant was required to file such reports), and (2) has been subject to such filing requirements for the past 90 days. Yes x No o
Indicate by check mark whether the registrant has submitted electronically and posted on its corporate website, if any, every Interactive Data File required to be submitted and posted pursuant to Rule 405 of Regulation S-T (§232.405 of this chapter) during the preceding 12 months (or for such shorter period that the registrant was required to submit and post such files). Yes x No o
Indicate by check mark if disclosure of delinquent filers pursuant to Item 405 of Regulation S-K (§ 229.405 of this chapter) is not contained herein, and will not be contained, to the best of registrant’s knowledge, in definitive proxy or information statements incorporated by reference in Part III of this Form 10-K or any amendment to this Form 10-K. o
Indicate by check mark whether the registrant is a large accelerated filer, an accelerated filer, a non-accelerated filer, or a smaller reporting company. See the definition of “large accelerated filer,” “accelerated filer” and “smaller reporting company” in Rule 12b-2 of the Exchange Act. (Check one):
Large accelerated filer | x | Accelerated filer | o | |||
Non-accelerated filer | o | Smaller reporting company | o | |||
Indicate by check mark whether the registrant is a shell company (as defined in Rule 12b-2 of the Exchange Act). Yes o No x
The aggregate market value of the common shares held by nonaffiliates of the registrant at October 31, 2015, was $13,168,504,516. As of June 14, 2016, 116,426,335 common shares of The J. M. Smucker Company were issued and outstanding.
DOCUMENTS INCORPORATED BY REFERENCE
Certain sections of the registrant’s definitive Proxy Statement to be filed in connection with its Annual Meeting of Shareholders to be held on August 17, 2016, are incorporated by reference into Part III of this Report, and certain sections of the registrant’s 2016 Annual Report to Shareholders are incorporated by reference into Parts I and II of this Report.
PART I
Item 1. Business.
The Company. The J. M. Smucker Company (“Company,” “registrant,” “we,” “us,” or “our”) was established in 1897, was incorporated in Ohio in 1921, and is often referred to as Smucker’s (a registered trademark). We operate principally in one industry, the manufacturing and marketing of branded food and beverage products on a worldwide basis, although the majority of our sales are in the U.S. Our operations outside the U.S. are principally in Canada, although products are exported to other countries as well. Net sales outside the U.S., subject to foreign currency translation, represented 6 percent of consolidated net sales for 2016. Our branded food and beverage products include a strong portfolio of trusted, iconic, market-leading brands that are sold to consumers through retail outlets in North America.
On December 31, 2015, we sold our U.S. canned milk brands and operations to Eagle Family Foods Group LLC, a subsidiary of funds affiliated with Kelso & Company. The transaction included canned milk products that were primarily sold in U.S. retail and foodservice channels under the Eagle Brand® and Magnolia® brands, along with other branded and private label trade names, with annual net sales of approximately $200.0 million. For additional information on the U.S. canned milk transaction, see “Note 4: Divestiture” in our 2016 Annual Report to Shareholders.
On March 23, 2015, we completed the acquisition of Big Heart Pet Brands (“Big Heart”), a leading producer, distributor, and marketer of premium-quality, branded pet food and pet snacks in the U.S. The cash and stock transaction was valued at $5.9 billion, which included the issuance of 17.9 million shares of our common stock to the shareholders of Blue Acquisition Group, Inc., Big Heart’s parent company. After the closing of the transaction, we had approximately 120.0 million common shares outstanding. We assumed $2.6 billion in debt that we repaid at closing and paid an additional $1.2 billion in cash, net of a working capital adjustment. As part of the transaction, new debt of $5.5 billion was borrowed. For additional information on the Big Heart acquisition, see “Note 2: Acquisitions” in our 2016 Annual Report to Shareholders.
We have three reportable segments: U.S. Retail Coffee, U.S. Retail Consumer Foods, and U.S. Retail Pet Foods. The U.S. retail market segments in total comprised over 85 percent of 2016 consolidated net sales and represent a major portion of our strategic focus – the sale of branded food and beverage products with leadership positions to consumers through retail outlets in North America. Within our segment results, International and Foodservice represents a combination of the strategic business areas not included in the U.S. retail market segments.
Principal Products. Our principal products are coffee, pet food, pet snacks, peanut butter, fruit spreads, shortening and oils, baking mixes and ready-to-spread frostings, frozen sandwiches, flour and baking ingredients, juices and beverages, and portion control products.
Product sales information for the years 2016, 2015, and 2014 is incorporated herein by reference to information set forth in our 2016 Annual Report to Shareholders under “Note 5: Reportable Segments.”
In the U.S. retail market segments, our products are primarily sold through a combination of direct sales and brokers to food retailers, food wholesalers, drug stores, club stores, mass merchandisers, discount and dollar stores, military commissaries, natural foods stores and distributors, and pet specialty stores. In International and Foodservice, our products are distributed domestically and in foreign countries through retail channels and foodservice distributors and operators (e.g., restaurants, lodging, schools and universities, health care operators).
Sources and Availability of Raw Materials. The raw materials used in each of our segments are primarily commodities and agricultural-based products. Green coffee, grains, peanuts, edible oils, sweeteners, fruit, and other ingredients are obtained from various suppliers. The availability, quality, and costs of many of these commodities have fluctuated, and may continue to fluctuate, over time. Basis, futures, and options contracts are used to manage price volatility for a significant portion of our commodity costs. Green coffee, along with certain other raw materials, is sourced solely from foreign countries and its supply and price is subject to high volatility due to factors such as weather, global supply and demand, pest damage, investor speculation, and political and economic conditions in the source countries. We source grains, peanuts, and edible oils mainly from North America. The principal packaging materials we use are plastic, glass, metal cans, caps, carton board, and corrugate. For additional information on the commodities we purchase, see “Commodities Overview” in our 2016 Annual Report to Shareholders.
Raw materials are generally available from numerous sources, although we have elected to source certain plastic packaging materials from single sources of supply pursuant to long-term contracts. While availability may vary year-to-year, we believe that we will continue to be able to obtain adequate supplies and that alternatives to single-sourced materials are
2
available. We have not historically encountered significant shortages of key raw materials. We consider our relationships with key raw material suppliers to be in good standing.
Trademarks and Patents. Our products are produced under certain patents and marketed under numerous trademarks owned or licensed by us or one of our subsidiaries. Our major trademarks are listed below.
Primary Reportable Segment/Business Area | Major Trademark | |
U.S. Retail Coffee | Folgers®, Dunkin’ Donuts®, and Café Bustelo® | |
U.S. Retail Consumer Foods | Jif®, Smucker’s®, Crisco®, Pillsbury®, and Uncrustables® | |
U.S. Retail Pet Foods | Meow Mix®, Milk-Bone®, Natural Balance®, Kibbles ‘n Bits®, 9Lives®, Pup-Peroni®, Nature’s Recipe®, and Gravy Train® | |
International and Foodservice | Folgers, Smucker’s, and Douwe Egberts® | |
Dunkin’ Donuts is a registered trademark of DD IP Holder LLC used under two licenses (the “Dunkin’ Licenses”) for packaged coffee products, including K-Cup® pods, sold in retail channels such as grocery stores, mass merchandisers, club stores, and drug stores. The Dunkin’ Licenses do not pertain to Dunkin’ Donuts coffee or other products for sale in Dunkin’ Donuts restaurants. The terms of the Dunkin’ Licenses include the payment of royalties to an affiliate of DD IP Holder LLC and other financial commitments by the Company. The Dunkin’ Licenses are in effect until January 1, 2039.
Pillsbury, the Barrelhead logo, and the Doughboy character are trademarks of The Pillsbury Company, LLC and are used under a 20-year, perpetually renewable, royalty-free license. Borden® and the Elsie design are trademarks used by our Canadian subsidiary on certain products under a perpetual, exclusive, and royalty-free license. Carnation® is a trademark of Société des Produits Nestlé S.A. used by our Canadian subsidiary for certain canned milk products in certain territories under an exclusive and royalty-free license with an initial term of 10 years which expires in October 2017, renewable for two successive 5-year terms, and which becomes perpetual at the end of the renewal terms under certain circumstances. Douwe Egberts and Pickwick® are registered trademarks of Jacobs Douwe Egberts and are used under a license which expires in January 2019. In accordance with a multi-year licensing and distribution agreement entered into with Cumberland Packing Corp. (“Cumberland”), we market and distribute Cumberland’s branded tabletop sweeteners sold under the Sweet‘N Low®, NatraTaste®, Sugar In The Raw®, and other “In The Raw” brands to foodservice customers in the U.S. and to retail and foodservice customers in Canada. Keurig® and K-Cup® are trademarks of Keurig Green Mountain, Inc. (“Keurig”), used with permission. In addition, we and our subsidiaries license the use of several other trademarks, none of which are individually material to our business.
Slogans or designs considered to be important trademarks include, without limitation, “With A Name Like Smucker’s, It Has To Be Good®,” “The Best Part of Wakin’ Up Is Folgers In Your Cup®,” “Choosy Moms Choose Jif®,” “Purely The Finest®,” “Crisco is Cooking®,” “Everybody’s Happy When It’s Hungry Jack®,” “Goodness Gracious, It’s Good®,” “The Only One Cats Ask For By Name®,” “Say It With Milk-Bone®,” the Smucker’s banner, the Crock Jar shape, the Gingham design, the Mountain Grown design, and the Smucker’s Strawberry, Milk-Bone, and 9Lives logos.
We own several hundred patents worldwide in addition to proprietary trade secrets, technology, know-how processes, and other intellectual property rights that are not registered.
We consider all of our owned and licensed intellectual property, taken as a whole, to be essential to our business.
Seasonality. The U.S. Retail Coffee and U.S. Retail Consumer Foods segments are particularly seasonal around the Fall Bake and Holiday period, which generally results in higher sales and profits in our second and third quarters. Our success in promoting and merchandising our coffee and baking brands during the Fall Bake and Holiday period has a significant impact on our results for a fiscal year. The Back to School period and the Spring Holiday season are two other important promotional periods, although their impact is not as significant as the Fall Bake and Holiday period.
Working Capital. Working capital requirements are greatest during the first half of our fiscal year mainly due to the timing of the buildup of coffee, oil, and baking inventories necessary to support the Fall Bake and Holiday period and the additional buildup of coffee inventory in advance of the Atlantic hurricane season. Although we still expect an inventory buildup during the first half of the fiscal year within the U.S. Retail Coffee and U.S. Retail Consumer Foods businesses, our working capital requirements have become less seasonal overall with the addition of the pet food business.
3
Customers. Sales to Wal-Mart Stores, Inc. and subsidiaries amounted to 30 percent, 28 percent, and 27 percent of net sales in 2016, 2015, and 2014, respectively. These sales are primarily included in the U.S. retail market segments. The increase in 2016 was driven by a full year of sales from the pet food business, in which sales to Wal-Mart Stores, Inc. and subsidiaries represent a larger portion of net sales, as compared to our business prior to the Big Heart acquisition. No other customer exceeded 10 percent of net sales during 2016, 2015, or 2014.
During 2016, our top 10 customers, collectively, accounted for approximately 70 percent of consolidated net sales. Supermarkets, warehouse clubs, and food distributors continue to consolidate, and we expect that a significant portion of our revenues will continue to be derived from a limited number of customers. Although the loss of any large customer for an extended length of time could negatively impact our sales and profits, we do not anticipate that this will occur to a significant extent due to strong consumer demand for our brands.
Orders. Generally, orders are filled within a few days of receipt, and the backlog of unfilled orders at any particular time has not been material on a historical basis.
Government Business. No material portion of our business is subject to renegotiation of profits or termination of contracts at the election of the government.
Competition. We are the branded market leader in the coffee, peanut butter, dog snacks, fruit spreads, shortening, natural beverage, and ice cream toppings categories in the U.S. In Canada, we are the branded market leader in the flour, pickles, canned milk, fruit spreads, shortening, and ice cream toppings categories. Our business is highly competitive as all of our brands compete for retail shelf space with other branded products as well as private label products.
In order to remain competitive, companies in the food industry need to consider emerging consumer preferences, technological advances, product and packaging innovations, and the continued growth of alternative store formats, including warehouse clubs, convenience stores, and e-commerce. The primary ways in which products and brands are distinguished are brand recognition, product quality, price, packaging, new product introductions, nutritional value, convenience, advertising, promotion, and the ability to identify and satisfy consumer preferences. Positive factors pertaining to our competitive position include well-recognized brands, high-quality products, consumer trust, experienced brand and category management, a single national grocery broker in the U.S., varied product offerings, product innovation, good customer service, and an integrated distribution network.
The packaged foods industry has been challenged recently by a general decline in sales volume in the center of the store. Certain evolving consumer trends have contributed to the decline, such as a heightened focus on health and wellness, an increased desire for fresh foods, and the growing impact of social media and e-commerce on consumer behavior. To address these dynamics, we continue to focus on innovation with an increased emphasis on products that satisfy evolving consumer trends.
In addition, private label has grown in recent years due to general economic uncertainty, improvements in private label quality, and the increased emphasis of store brands by retailers in an effort to cultivate customer loyalty. We believe that both private label and leading brands play an important role in the food categories in which we compete, appealing to different consumer segments. We closely monitor the price gap or price premium between our brands and private label brands, with the view that value is about more than price and the expectation that number one brands will continue to be an integral part of consumers’ shopping baskets.
4
Our primary brands, the brands with which they compete, and our major competitors are listed below.
Our Primary Products | Our Primary Brands | Competing Brands | Competitors |
U.S. Retail Coffee | |||
Mainstream roast and ground coffee | Folgers(A) and Café Bustelo | Maxwell House and Yuban | The Kraft Heinz Company |
Chock full o'Nuts | Massimo Zanetti Beverage Group | ||
Cafe La Llave | Gaviña | ||
Private Label Brands | Various | ||
Single serve coffee - K-Cup® | Dunkin' Donuts, Folgers, and Café Bustelo | Green Mountain Coffee(A) | Keurig Green Mountain, Inc. |
Starbucks | Starbucks Corporation | ||
Eight O'Clock | Tata Global Beverages | ||
McCafe, Maxwell House, and Gevalia | The Kraft Heinz Company | ||
Private Label Brands | Various | ||
Premium coffee | Dunkin' Donuts and Folgers Gourmet Selections® | Starbucks(A) and Seattle's Best Coffee | Starbucks Corporation |
Peet's Coffee & Tea | JAB Holding Company | ||
Eight O'Clock | Tata Global Beverages | ||
Gevalia and McCafe | The Kraft Heinz Company | ||
Private Label Brands | Various | ||
U.S. Retail Consumer Foods | |||
Peanut butter and specialty spreads | Jif (A) | Private Label Brands | Various |
Skippy | Hormel Foods | ||
Nutella | Ferrero | ||
Peter Pan | ConAgra Foods, Inc. | ||
Fruit spreads | Smucker's(A) | Welch's | Welch Foods, Inc. |
Private Label Brands | Various | ||
Shortening and oils | Crisco(B) | Private Label Brands(B) | Various |
Wesson | ConAgra Foods, Inc. | ||
Dessert baking mixes and frosting | Pillsbury | Betty Crocker(A) | General Mills, Inc. |
Duncan Hines | Pinnacle Foods Inc. | ||
Private Label Brands | Various | ||
U.S. Retail Pet Foods | |||
Pet foods | Meow Mix, Kibbles 'n Bits, and 9Lives | Dog Chow(A), One, Beneful, Cat Chow(A), Friskies, Kit & Kaboodle, and Fancy Feast | Nestlé Purina PetCare Company |
Pedigree, Iams, and Sheba | Mars Petcare | ||
Rachael Ray Nutrish | Ainsworth Pet Nutrition | ||
Pet snacks | Milk-Bone(A) and Pup-Peroni | Beggin' Strips and Waggin' Train | Nestlé Purina PetCare Company |
Dentastix and Greenies | Mars Petcare | ||
Pet premium | Natural Balance and Nature's Recipe | Blue(A) | Blue Buffalo Pet Products Inc. |
Nutro | Mars Petcare | ||
Hill's | Hills Pet Nutrition, Inc. | ||
International and Foodservice | |||
Foodservice hot beverage | Folgers and Douwe Egberts | Nescafé | Société des Produits Nestlé S.A. |
Maxwell House | The Kraft Heinz Company | ||
Private Label Brands | Various | ||
Foodservice portion control | Smucker's | Heinz, Welch's, and Private Label Brands | The Kraft Heinz Company |
Private Label Brands | Various | ||
Canada coffee | Folgers | Maxwell House(A) | The Kraft Heinz Company |
Private Label Brands | Various | ||
Canada flour | Robin Hood®(A) and Five Roses® | Private Label Brands | Various |
(A) Identifies the current market leader within the product category. In certain categories, the market leader is not identified as two or more brands compete
for the largest share.
(B) Crisco is the market leader within the shortening category. In the oils category, private label brands, collectively, maintain the largest share.
5
Research and Development. We predominantly utilize in-house resources to both develop new products and improve existing products in each of our business areas. Amounts expensed for research and development were $58.8 million, $32.5 million, and $24.3 million in 2016, 2015, and 2014, respectively.
Environmental Matters. We consider environmental sustainability to be our responsibility as a good corporate citizen and a key strategic focus area. We have implemented and manage a variety of programs, including the utilization of renewable energy technology, wastewater management, the usage of sustainable raw materials including green coffee, and the reuse of resources rather than consuming new ones, in support of our commitment to environmental sustainability. We continue to evaluate and modify our processes on an ongoing basis to further reduce waste and limit our impact on the environment.
Compliance with the provisions of enacted or pending federal, state, and local environmental regulations regarding either the discharge of materials into the environment or the protection of the environment is not expected to have a material effect upon our capital expenditures, earnings, or competitive position in 2017.
Employees. At April 30, 2016, we had 6,910 full-time employees worldwide, of which 30 percent, located at 11 manufacturing facilities, are covered by union contracts. These contracts vary in term depending on the location, with one contract expiring in 2017, representing 8 percent of our total employees. We believe our relations with our employees are good.
Financial Information about Industry Segments and Geographical Areas. The financial information required to be included in this item concerning reportable industry segments and international operations for the years 2016, 2015, and 2014 is incorporated herein by reference to information set forth in our 2016 Annual Report to Shareholders under “Note 5: Reportable Segments.” Our international operations are primarily in Canada with risks similar to those associated with the U.S. retail markets. Approximately 40 percent of our 2016 Canada sales represented the sale of Canadian produced products to Canadian customers. The majority of the remaining Canada sales represented the sale of products produced in the U.S. to Canadian customers, primarily Folgers coffee, Bick’s® pickles, Smucker’s fruit spreads, and Crisco shortening and oils.
Forward-Looking Statements. This Report includes forward-looking statements that are based on current expectations and are subject to a number of risks and uncertainties that could cause actual results to differ materially from expected or projected results. The descriptions of risks and uncertainties relating to forward-looking statements are incorporated herein by reference to information set forth in our 2016 Annual Report to Shareholders under the caption “Forward-Looking Statements.”
Available Information. Access to all of our Securities and Exchange Commission (“SEC”) filings, including our Annual Report on Form 10-K, quarterly reports on Form 10-Q, current reports on Form 8-K, and amendments to those reports filed or furnished pursuant to Section 13(a) or 15(d) of the Securities Exchange Act of 1934, as amended (the “Exchange Act”), is provided, free of charge, on our website (jmsmucker.com/investor-relations) as soon as reasonably practicable after such reports are electronically filed with, or furnished to, the SEC.
Item 1A. Risk Factors.
Our business, operations, and financial condition are subject to various risks and uncertainties. The risk factors described below should be carefully considered, together with the other information contained or incorporated by reference in this Report and our other filings with the SEC, in connection with evaluating the Company, our business, and the forward-looking statements contained in this Report. Additional risks and uncertainties not presently known to us or that we currently deem immaterial also may affect us. The occurrence of any of these known or unknown risks could have a material adverse impact on our business, financial condition, and results of operations.
• | We may be unable to grow market share of our products. |
We operate in the competitive food industry whose growth potential is generally correlated to population growth. Our success depends in part on our ability to grow our brands faster than the population in general. We consider our ability to build and sustain the equity of our brands critical to our market share growth. If we do not succeed in these efforts, our market share growth may slow, which could have a material impact on our results of operations.
6
• | Our proprietary brands, packaging designs, and manufacturing methods are essential to the value of our business, and the inability to protect these could harm the value of our brands and adversely affect our sales and profitability. |
The success of our business depends significantly on our brands, know-how, and other intellectual property. We rely on a combination of trademarks, service marks, trade secrets, patents, copyrights, and similar rights to protect our intellectual property. The success of our growth strategy depends on our continued ability to use our existing trademarks and service marks in order to maintain and increase brand awareness and further develop our brand. If our efforts to protect our intellectual property are not adequate, or if any third party misappropriates or infringes on our intellectual property, the value of our brand may be harmed, which could have a material adverse effect on our business. From time to time, we are engaged in litigation to protect our intellectual property, which could result in substantial costs as well as diversion of management attention.
In particular, we consider our proprietary coffee roasting methods essential to the consistent flavor and richness of our coffee products and, therefore, essential to our coffee brands. Because many of the roasting methods we use are not protected by patents, it may be difficult for us to prevent competitors from copying our roasting methods if such methods become known. We also believe that our packaging innovations, such as brick packaging technology and our AromaSeal™ canisters, are important to the coffee business’ marketing and operational efforts. If our competitors copy our roasting or packaging methods or develop more advanced roasting or packaging methods, the value of our coffee brands may be diminished, and we could lose customers to our competitors.
• | We use a single national broker to represent a portion of our branded products to the retail grocery trade and any failure by the broker to effectively represent us could adversely affect our business. |
We use a single national broker in the U.S. to represent a portion of our branded products to the retail grocery trade. Our business would suffer disruption if this broker were to default in the performance of its obligations to perform brokerage services or if this broker fails to effectively represent us to the retail grocery trade, which could adversely affect our business.
• | Loss or interruption of supply from single-source suppliers of raw materials and finished goods could have a disruptive effect on our business and adversely affect our results of operations. |
We have elected to source certain raw materials, such as packaging for our Folgers coffee products, as well as our Jif peanut butter and Crisco oil products, and finished goods, such as K-Cup® pods and our Pup-Peroni dog snacks, from single sources of supply. While we believe that, except as set forth below, alternative sources of these raw materials and finished goods could be obtained on commercially reasonable terms, loss or an extended interruption in supplies from a single-source supplier would result in additional costs, could have a disruptive short-term effect on our business, and could adversely affect our results of operations.
Keurig is our single-source supplier for K-Cup® pods which are used in its proprietary Keurig® K-Cup® brewing system. There are a limited number of manufacturers other than Keurig that are making cups that will work in such proprietary brewing system. If Keurig is unable to supply K-Cup® pods to us for any reason, it could be difficult to find an alternative supplier for such goods on commercially reasonable terms, which could have a material adverse effect on our results of operations.
• | Our results may be adversely impacted as a result of increased cost, limited availability, and/or insufficient quality of raw materials, including commodities and agricultural products. |
We and our business partners purchase and use large quantities of many different commodities and agricultural products in the manufacturing of our products, including green coffee, grains, peanuts, edible oils, sweeteners, and fruit. In addition, we and our business partners utilize significant quantities of plastic, glass, and cardboard to package our products and natural gas and fuel oil to manufacture, package, and distribute our products. The prices of these commodities, agricultural products, and other materials are subject to volatility and can fluctuate due to conditions that are difficult to predict, including global supply and demand, commodity market fluctuations, crop sizes and yield fluctuations, weather, natural disasters, foreign currency fluctuations, investor speculation, trade agreements, political unrest, consumer demand, and changes in governmental agricultural programs. In addition, we compete for certain raw materials, notably corn and soy-based agricultural products, with the biofuels industry, which has resulted in increased prices
7
for these raw materials. Additionally, farm acreage currently devoted to other agricultural products we purchase may be utilized for biofuels crops resulting in higher cost for the other agricultural products we utilize. Although we use basis, futures, and options contracts to manage commodity price volatility in some instances, commodity price increases ultimately result in corresponding increases in our raw material and energy costs.
Due to the significance of green coffee to our coffee business, combined with our ability to only partially mitigate future price risk through purchasing practices and hedging activities, significant increases or decreases in the cost of green coffee could have an adverse impact on our profitability. In addition, if we are not able to purchase sufficient quantities of green coffee due to any of the above factors or to a worldwide or regional shortage, we may not be able to fulfill the demand for our coffee, which could have a material adverse effect on our business, financial condition, and results of operations.
• | Our efforts to manage commodity, foreign currency exchange, and other price volatility through derivative instruments could adversely affect our results of operations and financial condition. |
We use derivative instruments, including commodity futures and options, to reduce the price volatility associated with anticipated commodity purchases. The extent of our derivative position at any given time depends on our assessment of the markets for these commodities. If we fail to take a derivative position and costs subsequently increase, or if we institute a position and costs subsequently decrease, our costs may be greater than anticipated or higher than our competitors’ costs and our financial results could be adversely affected. In addition, our liquidity may be adversely impacted by the cash margin requirements of the commodities exchanges or the failure of a counterparty to perform in accordance with a contract.
We currently do not qualify any of our commodity or foreign currency exchange derivatives for hedge accounting. We instead mark-to-market our derivatives through the Statement of Consolidated Income, which results in changes in the fair value of all of our derivatives being immediately recognized in consolidated earnings, resulting in potential volatility in both gross profit and net income. These gains and losses are reported in cost of products sold in our Statement of Consolidated Income but are excluded from our segment operating results and non-GAAP earnings until the related inventory is sold, at which time the gains and losses are reclassified to segment profit and non-GAAP earnings. Although this accounting treatment aligns the derivative gains and losses with the underlying exposure being hedged within segment results, it may result in volatility in our consolidated earnings.
• | We may be limited in our ability to pass cost increases on to our customers in the form of price increases or may realize a decrease in sales volume to the extent price increases are implemented. |
We may not be able to pass some or all of any increases in the price of raw materials, energy, and other input costs to our customers by raising prices. To the extent competitors do not also increase their prices, customers and consumers may choose to purchase competing products or may shift purchases to private label or other lower-priced offerings, which may adversely affect our results of operations.
Consumers may be less willing or able to pay a price differential for our branded products, and may increasingly purchase lower-priced offerings and may forego some purchases altogether, especially during economic downturns. Retailers may also increase levels of promotional activity for lower-priced offerings as they seek to maintain sales volumes during times of economic uncertainty. Accordingly, sales volumes of our branded products could be reduced or lead to a shift in sales mix toward our lower-margin offerings. As a result, decreased demand for our products may adversely affect our results of operations.
• | Certain of our products are sourced from single manufacturing sites. |
We have consolidated our production capacity for certain products, including substantially all of our coffee, Milk-Bone dog snacks, and fruit spreads, syrups, and toppings production, into single manufacturing sites. We could experience a production disruption at these or any of our manufacturing sites resulting in a reduction or elimination of the availability of some of our products. If we are not able to obtain alternate production capability in a timely manner, our business, financial condition, and results of operations could be adversely affected.
8
• | A significant interruption in the operation of any of our supply chain or distribution capabilities could have an adverse effect on our business, financial condition, and results of operations. |
Our ability and the ability of our third-party suppliers and service providers, distributors, and contract manufacturers to manufacture, distribute, and sell products is critical to our success. A significant interruption in the operation of any of our manufacturing or distribution capabilities, or the manufacturing or distribution capabilities of our suppliers, distributors, or contract manufacturers, or a service failure by a third-party service provider, whether as a result of adverse weather conditions or a natural disaster, work stoppage, terrorism, pandemic illness, or other causes, could significantly impair our ability to operate our business. Notably, substantially all of our coffee production takes place in New Orleans, Louisiana, which is subject to risks associated with hurricane and other weather-related events. Additionally, some of our production facilities are located in places where tornadoes can frequently occur, such as Alabama and Kansas. Failure to take adequate steps to mitigate the likelihood or potential impact of such events, or to effectively manage such events if they occur, could adversely affect our business, financial condition, and results of operations.
• | Our business could be harmed by strikes or work stoppages. |
As of April 30, 2016, 30 percent of our employees, located at 11 manufacturing facilities, are covered by collective bargaining agreements. These contracts vary in term depending on location, with one contract expiring in 2017, representing 8 percent of our total employees. We cannot assure that we will be able to renew these collective bargaining agreements on the same or more favorable terms as the current agreements, or at all, without production interruptions caused by labor stoppages. If a strike or work stoppage were to occur in connection with negotiations of new collective bargaining agreements or as a result of disputes under collective bargaining agreements with labor unions, our business, financial condition, and results of operations could be materially adversely affected.
• | Our ability to competitively serve customers depends on the availability of reliable transportation. Increases in logistics and other transportation-related costs could adversely impact our results of operations. |
Logistics and other transportation-related costs have a significant impact on our earnings and results of operations. We use multiple forms of transportation, including ships, trucks, and railcars, to bring our products to market. Disruption to the timely supply of these services or increases in the cost of these services for any reason, including availability or cost of fuel, regulations affecting the industry, labor shortages in the transportation industry, service failures by third-party service providers, accidents, or natural disasters, which may impact the transportation infrastructure or demand for transportation services, could have an adverse effect on our ability to serve our customers, and could have a material adverse effect on our business, financial condition, and results of operations.
• | Our operations are subject to the general risks of the food industry. |
The food industry is subject to risks posed by food spoilage and contamination, product tampering, product recall, and consumer product liability claims. Our operations could be impacted by both genuine and fictitious claims regarding our products, as well as our competitors’ products. In the event of product contamination or tampering, we may need to recall some of our products. A widespread product recall could result in significant loss due to the cost of conducting a product recall, including destruction of inventory and the loss of sales resulting from the unavailability of product for a period of time. We could also suffer losses from a significant product liability judgment against us. A significant product recall or a product liability judgment, involving either us or our competitors, could also result in a loss of consumer confidence in our food products or the food category, and an actual or perceived loss of value of our brands, materially impacting consumer demand.
• | Changes in our relationships with significant customers, including the loss of our largest customer, could adversely affect our results of operations. |
Sales to Wal-Mart Stores, Inc. and subsidiaries amounted to 30 percent of net sales in 2016. These sales are primarily included in the U.S. retail market segments. Trade receivables at April 30, 2016, included amounts due from Wal-Mart Stores, Inc. and subsidiaries of $118.1 million, or 26 percent of the total trade receivables balance. During 2016, our top 10 customers, collectively, accounted for approximately 70 percent of consolidated net sales. We expect that a significant portion of our revenues will continue to be derived from a
9
limited number of customers. Our customers are generally not contractually obligated to purchase from us. These customers make purchase decisions based on a combination of price, promotional support, product quality, consumer demand, customer service performance, their desired inventory levels, and other factors. Changes in customers’ strategies, including a reduction in the number of brands they carry or a shift of shelf space to private label products, may adversely affect sales. Customers also may respond to price increases by reducing distribution, resulting in reduced sales of our products. Additionally, our customers may face financial or other difficulties that may impact their operations and their purchases from us, which could adversely affect our results of operations. A reduction in sales to one or more major customers could have a material adverse effect on our business, financial condition, and results of operations.
• | We operate in the competitive food industry and continued demand for our products may be affected by changes in consumer preferences. |
We face competition across our product lines from other food companies with the primary methods and factors in competition being product quality, price, packaging, product innovation, nutritional value, convenience, customer service, advertising, and promotion. Continued success is dependent on product innovation, the ability to secure and maintain adequate retail shelf space and to compete in new and growing channels, such as e-commerce, and effective and sufficient trade merchandising, advertising, and marketing programs. Some of our competitors have substantial financial, marketing, and other resources, and competition with them in our various markets, channels, and product lines could cause us to reduce prices, increase marketing or other expenditures, or lose category share. Category share and growth could be adversely impacted if we are not successful in introducing new products. In order to generate future revenues and profits, we must continue to sell products that appeal to our customers and consumers. Specifically, there are a number of trends in consumer preferences that may impact us and the food industry as a whole, including convenience, flavor variety, an emphasis on protein and snacking, and the desire for transparent product labeling and simple and natural ingredients.
Prolonged negative perceptions concerning the health implications of certain food products could influence consumer preferences and acceptance of some of our products and marketing programs. Although we strive to respond to consumer preferences and social expectations, we may not be successful in these efforts. Increasing public concern regarding health issues and failure to satisfy consumer preferences could decrease demand for certain of our products and adversely affect our profitability.
• | The success of our business depends substantially on consumer perceptions of our brands. |
We are the branded market leader in several categories both in the U.S. and Canada. We believe that maintaining and continually enhancing the value of our brands is critical to the success of our business. Brand value is based in large part on consumer perceptions. Success in promoting and enhancing brand value depends in large part on our ability to provide high-quality products. Brand value could diminish significantly as a result of a number of factors, such as if we fail to preserve the quality of our products, if we are perceived to act in an irresponsible manner, if the Company or our brands otherwise receive negative publicity, if our brands fail to deliver a consistently positive consumer experience, or if our products become unavailable to consumers. The growing use of social and digital media by consumers increases the speed and extent that information and opinions can be shared. Negative posts or comments about us or our brands or products on social or digital media could damage our brands and reputation. If our brand values are diminished, our revenues and operating results could be materially adversely affected. In addition, anything that harms the Pillsbury, Dunkin’ Donuts, Carnation, Douwe Egberts, Sweet‘N Low, or Sugar In The Raw brands could adversely affect the success of our exclusive licensing agreements with the owners of these brands.
• | We could be subject to adverse publicity or claims from consumers. |
Certain of our products contain ingredients, the health effects of which are the subject of public scrutiny, including the suggestion that consumption may have adverse health effects. An unfavorable report on the health effects of ingredients present in our products, product recalls, or negative publicity or litigation arising from other health risks could significantly reduce the demand for our products.
We may also be subject to complaints from or litigation by consumers who allege food and beverage-related illness, or other quality, health, or operational concerns. Adverse publicity resulting from such allegations
10
could materially adversely affect us, regardless of whether such allegations are true or whether we are ultimately held liable. A lawsuit or claim could result in an adverse decision against us, which could have a material adverse effect on our business, financial condition, and results of operations.
• | Our operations are subject to the general risks associated with acquisitions and divestitures. Specifically, we may not realize all of the anticipated benefits of the acquisition of Big Heart or those benefits may take longer to realize than expected. |
Our stated long-term strategy is to own and market leading North American food brands sold in the center of the store while maintaining a global perspective. We have historically made strategic acquisitions of brands and businesses and intend to do so in the future in support of this strategy. If we are unable to complete acquisitions or to successfully integrate and develop acquired businesses, including the effective management of integration and related restructuring costs, we could fail to achieve the anticipated synergies and cost savings, or the expected increases in revenues and operating results, either of which could have a material adverse effect on our financial results. In addition, we have made strategic divestitures of brands and businesses and we may do so in the future. If we are unable to complete divestitures or to successfully transition divested businesses, our business or financial results could be negatively impacted.
• | Weak financial performance, downgrades in our credit ratings, or disruptions in the financial markets may adversely affect our ability to access capital in the future. |
We may need new or additional financing in the future to conduct our operations, expand our business, or refinance existing indebtedness, which would be dependent upon our financial performance. Any downgrade in our credit ratings, particularly our short-term rating, would likely impact the amount of commercial paper we could issue and increase our commercial paper borrowing costs. The liquidity of the overall capital markets and the state of the economy, including the food and beverage industry, may make credit and capital markets more difficult for us to access, even though we have an established revolving credit facility. From time to time, we have relied, and also may rely in the future, on access to financial markets as a source of liquidity for working capital requirements, acquisitions, and general corporate purposes. In particular, our access to funds under our revolving credit facility is dependent on the ability of the financial institutions that are parties to that facility to meet their funding commitments. The obligations of the financial institutions under our revolving credit facility are several and not joint and, as a result, a funding default by one or more institutions does not need to be made up by the others. In addition, long-term volatility and disruptions in the capital and credit markets as a result of uncertainty, changing or increased regulation of financial institutions, reduced alternatives, or the failure of significant financial institutions could adversely affect our access to the liquidity needed for our businesses in the longer term. Such disruptions could require us to take measures to conserve cash until the markets stabilize or until alternative credit arrangements or other funding for our business needs can be arranged. Disruptions in the capital and credit markets could also result in higher interest rates on publicly issued debt securities and increased costs under credit facilities. Continuation of these disruptions would increase our interest expense and capital costs and could adversely affect our results of operations and financial position.
• | Our substantial debt obligations could restrict our operations and financial condition. |
As of April 30, 2016, we had approximately $5.4 billion of short-term borrowings and long-term debt. We may also incur additional indebtedness in the future. Our substantial indebtedness could have adverse consequences, including:
• | making it more difficult for us to satisfy our financial obligations; |
• | increasing our vulnerability to adverse economic, regulatory, and industry conditions, and placing us at a disadvantage compared to our competitors that are less leveraged; |
• | limiting our ability to compete and our flexibility in planning for, or reacting to, changes in our business and the industry in which we operate; |
• | limiting our ability to borrow additional funds for working capital, capital expenditures, acquisitions, and general corporate or other purposes; and |
11
• | exposing us to greater interest rate risk to the extent that the interest rate on the applicable borrowings is variable. |
Our debt service obligations will require us to use a portion of our operating cash flow to pay interest and principal on indebtedness instead of for other corporate purposes, including funding future expansion of our business and ongoing capital expenditures, which could impede our growth. If our operating cash flow and capital resources are insufficient to service our debt obligations, we may be forced to sell assets, seek additional equity or debt financing, or restructure our debt, which could harm our long-term business prospects. Our failure to comply with the terms of any existing or future indebtedness could result in an event of default which, if not cured or waived, could result in the acceleration of all of our debt.
• | Servicing our indebtedness will require a significant amount of cash. Our ability to generate cash depends on many factors beyond our control. |
Our ability to make payments on, and to refinance, our indebtedness and to fund planned capital expenditures will depend on our ability to generate cash in the future. This is subject to general economic, financial, competitive, legislative, regulatory, and other factors, many of which are beyond our control. Our business may not generate sufficient cash flow from operations, and we may not have available to us future borrowings in an amount sufficient to enable us to pay our indebtedness or to fund our other liquidity needs. In these circumstances, we may need to refinance all or a portion of our indebtedness on or before maturity. Any refinancing of our debt could be at higher interest rates and may require make-whole payments and compliance with more onerous covenants, which could further restrict our business operations. Our ability to refinance our indebtedness or obtain additional financing would depend on, among other things, our financial condition at the time, restriction in the agreements governing our indebtedness, and the condition of the financial markets and the industry in which we operate. As a result, we may not be able to refinance any of our indebtedness on commercially reasonable terms or at all. Without this financing, we could be forced to sell assets to make up for any shortfall in our payment obligations under unfavorable circumstances. In addition, we may not be able to sell assets quickly enough or for sufficient amounts to enable us to meet our obligations.
• | A material impairment in the carrying value of acquired goodwill or other intangible assets could negatively affect our consolidated operating results and net worth. |
A significant portion of our assets is goodwill and other intangible assets, the majority of which are not amortized but are reviewed at least annually for impairment. At April 30, 2016, the carrying value of goodwill and other intangible assets totaled $12.6 billion, compared to total assets of $16.0 billion and total shareholders’ equity of $7.0 billion. If the carrying value of these assets exceeds the current estimated fair value, the asset is considered impaired and this could result in a noncash charge to earnings. Any such impairment charge would reduce earnings and could be material. Events and conditions that could result in impairment include a sustained drop in the market price of our common shares, increased competition or loss of market share, obsolescence, or product claims that result in a significant loss of sales or profitability over the product life. As a result of the Big Heart acquisition in 2015, we recognized $3.0 billion of goodwill. We also recorded $1.5 billion of indefinite-lived intangible assets based on their estimated fair values on the acquisition date. Since these assets were recently acquired, they could be more susceptible to future impairment. A change to the assumptions regarding the future performance of the pet food business, or a portion of it, a change to other assumptions, or the failure of any of our reporting units to achieve its anticipated synergies related to the Big Heart acquisition could result in significant impairment losses in the future.
• | Changes in tax, environmental, or other regulations and laws, or their application, or failure to comply with existing licensing, trade, and other regulations and laws could have a material adverse effect on our financial condition. |
Our operations are subject to various regulations and laws administered by federal, state, and local government agencies in the U.S., as well as to regulations and laws administered by government agencies in Canada and other countries in which we have operations and our products are sold. In particular, the manufacturing, marketing, packaging, labeling, and distribution of food products are each subject to governmental regulation that is increasingly extensive, encompassing such matters as ingredients (including whether a product contains genetically modified ingredients), packaging, advertising, relations with
12
distributors and retailers, health, safety, and the environment. Additionally, we are routinely subject to new or modified tax and securities regulations, other laws and regulations, and accounting and reporting standards.
In the U.S., we are required to comply with federal laws, such as the Food, Drug and Cosmetic Act, the Food Safety Modernization Act, the Occupational Safety and Health Act, the Clean Air Act, the Clean Water Act, the Resource Conservation and Recovery Act, the Tariff Act, laws governing equal employment opportunity, and various other federal statutes and regulations. We are also subject to various state and local statutes and regulations. For instance, the California Safe Drinking Water and Toxic Enforcement Act of 1986 (commonly referred to as “Proposition 65”) requires that a specific warning appear on any product sold in the State of California that contains a substance listed by that state as having been found to cause cancer or birth defects. This law exposes all food and beverage producers to the possibility of having to provide warnings on their products. The detection of even a trace amount of a listed substance can subject an affected product to the requirement of a warning label. Products containing listed substances that occur naturally or that are contributed to such products solely by a municipal water supply are generally exempt from the warning requirement. If we are required to add warning labels to any of our products or place warnings in certain locations where our products are sold as a result of Proposition 65, sales of those products could suffer not only in those locations but elsewhere.
Complying with new regulations and laws, or changes to existing regulations and laws, or their application could increase our production costs or adversely affect our sales of certain products. In addition, our failure or inability to comply with applicable regulations and laws could subject us to civil remedies, including fines, injunctions, recalls or seizures, as well as potential criminal sanctions, which could have a material adverse effect on our business and financial condition.
• | Our operations in certain developing markets expose us to regulatory risks. |
In many countries outside of the U.S., particularly in those with developing economies, it may be common for others to engage in business practices prohibited by laws and regulations applicable to us, such as the U.S. Foreign Corrupt Practices Act or similar local anti-bribery or anti-corruption laws. These laws generally prohibit companies and their employees, contractors, or agents from making improper payments to government officials for the purpose of obtaining or retaining business. Failure to comply with these laws could subject us to civil and criminal penalties that could have a material adverse effect on our financial condition and results of operations.
• | Changes in climate or legal, regulatory, or market measures to address climate change may negatively affect our business and operations. |
There is significant political and scientific concern that emissions of carbon dioxide and other greenhouse gases may alter the composition of the global atmosphere in ways that are affecting and are expected to continue affecting the global climate. The emission of such greenhouse gases may have an adverse impact on global temperatures, weather patterns, and the frequency and severity of extreme weather and natural disasters. In the event that climate change has a negative effect on agricultural productivity, we may be subject to decreased availability or less favorable pricing for certain commodities that are necessary for our products, such as green coffee, grains, peanuts, edible oils, sweeteners, and fruit. We may also be subjected to decreased availability or less favorable pricing for water as a result of such change, which could impact our manufacturing and distribution operations. In addition, natural disasters and extreme weather conditions may disrupt the productivity of our facilities or the operation of our supply chain.
Increasing concern over climate change also may result in more regulatory requirements to reduce or mitigate the effects of greenhouse gases. In the event that such regulations are enacted and are more rigorous than existing regulations, we may experience significant increases in costs of operation and delivery. In particular, increased regulation of utility providers, fuel emissions, or suppliers could substantially increase our operating, distribution, or supply chain costs. We could also face increased costs related to defending and resolving legal claims and other litigation related to climate change. As a result, climate change could negatively affect our results of operations, cash flows, or financial position.
13
• | If our information technology systems fail to perform adequately or we are unable to protect such information technology systems against data corruption, cyber-based attacks, or network security breaches, our operations could be disrupted, and we may suffer financial damage or loss because of lost or misappropriated information. |
We rely on information technology networks and systems, including the Internet, to process, transmit, and store electronic information. In particular, we depend on our information technology infrastructure to effectively manage our business data, supply chain, logistics, finance, and other business processes and for digital marketing activities and electronic communications between Company personnel and our customers and suppliers. If we do not allocate and effectively manage the resources necessary to build, sustain, and protect an appropriate technology infrastructure, or we do not effectively implement system upgrades, our business or financial results could be negatively impacted. Security breaches or system failures of our infrastructure, whether due to attacks by hackers, employee error, or other causes, can create system disruptions, shutdowns, or unauthorized disclosure of confidential information. If we are unable to prevent such breaches or failures, our operations could be disrupted, or we may suffer financial damage or loss because of lost or misappropriated information.
In addition, we have outsourced several information technology support services and administrative functions, including benefit plan administration and other functions, to third-party service providers, and may outsource other functions in the future to achieve cost savings and efficiencies. If the service providers to which we outsource these functions do not perform effectively, we may not be able to achieve the expected cost savings and may have to incur additional costs to correct errors made by such service providers. Depending on the function involved, such errors may also lead to business disruption, processing inefficiencies, the loss of or damage to intellectual property through security breach, the loss of sensitive data through security breach, or otherwise.
Item 1B. Unresolved Staff Comments.
None.
14
Item 2. Properties.
The table below lists all of our manufacturing and processing facilities at April 30, 2016. All of our properties are maintained and updated on a regular basis, and we continue to make investments for expansion and safety and technological improvements. We believe that existing capacity at these facilities is sufficient to sustain current operations and anticipated near-term growth.
We own all of the properties listed below, except as noted. Additionally, our principal distribution centers in the U.S. include three that we own, nine that we lease, and two that are leased and operated by third parties with whom we have agreements. We also lease our principal distribution center in Canada. Our distribution facilities are in good condition, and we believe that they have sufficient capacity to meet our distribution needs in the near future. We lease nine sales and administrative offices in the U.S., and one each in China, Canada, and Mexico. Our corporate headquarters are located in Orrville, Ohio, and our Canadian headquarters are located in Markham, Ontario. We lease the principal headquarters of our pet food business located in San Francisco, California, as well as additional administrative facilities dedicated to that business in Pittsburgh, Pennsylvania, and Burbank, California. We plan to close the Pittsburgh office during the first quarter of 2017.
U.S. Locations | Products Produced/Processed/Stored | Primary Reportable Segment/Business Area | ||
Bloomsburg, Pennsylvania | Wet dog and cat food and dry dog and cat food | U.S. Retail Pet Foods | ||
Buffalo, New York | Dog snacks | U.S. Retail Pet Foods | ||
Chico, California | Fruit and vegetable juices and beverages | U.S. Retail Consumer Foods | ||
Cincinnati, Ohio | Shortening and oils | U.S. Retail Consumer Foods | ||
Decatur, Alabama | Dry dog and cat food | U.S. Retail Pet Foods | ||
Grandview, Washington | Fruit | U.S. Retail Consumer Foods | ||
Harahan, Louisiana (B) | Coffee | International and Foodservice | ||
Havre de Grace, Maryland | Fruit and vegetable juices and beverages | U.S. Retail Consumer Foods | ||
Lawrence, Kansas | Dry dog food | U.S. Retail Pet Foods | ||
Lexington, Kentucky | Peanut butter | U.S. Retail Consumer Foods | ||
Livermore, California (A) | Grain products | U.S. Retail Consumer Foods | ||
Memphis, Tennessee | Peanut butter and fruit spreads | U.S. Retail Consumer Foods | ||
New Bethlehem, Pennsylvania | Peanut butter and combination peanut butter and jelly products | U.S. Retail Consumer Foods | ||
New Orleans, Louisiana (four facilities) (A) | Coffee | U.S. Retail Coffee | ||
Orrville, Ohio | Fruit spreads, toppings, and syrups | U.S. Retail Consumer Foods | ||
Oxnard, California | Fruit | U.S. Retail Consumer Foods | ||
Ripon, Wisconsin | Fruit spreads, toppings, syrups, and condiments | U.S. Retail Consumer Foods | ||
Scottsville, Kentucky | Frozen sandwiches and ready-to-eat waffles | U.S. Retail Consumer Foods | ||
Seattle, Washington (A) | Nut mix products | U.S. Retail Consumer Foods | ||
Suffolk, Virginia | Coffee | International and Foodservice | ||
Toledo, Ohio | Baking mixes, frostings, and flour | U.S. Retail Consumer Foods | ||
Topeka, Kansas | Dry dog and cat food and dog and cat snacks | U.S. Retail Pet Foods | ||
Canada Location | Product Produced | Primary Business Area | ||
Sherbrooke, Quebec | Canned milk | International and Foodservice | ||
(A) | We lease our facilities in Livermore and Seattle, as well as our coffee silo facility in New Orleans. We plan to exit our Livermore facilities during 2017 as a result of our plan to move production into our existing facility in Chico, as described in our 2016 Annual Report to Shareholders under “Note 3: Integration and Restructuring Costs.” |
(B) | Our Harahan location is expected to close during 2018 as a result of our plan to consolidate production into one of our existing facilities in New Orleans, as described in our 2016 Annual Report to Shareholders under “Note 3: Integration and Restructuring Costs.” |
15
Item 3. Legal Proceedings.
We are a defendant in a variety of legal proceedings. While we cannot predict with certainty the ultimate results of these proceedings, we do not believe that the final outcome of these proceedings will have a material adverse effect on our financial position, results of operations, or cash flows.
Item 4. Mine Safety Disclosures.
Not applicable.
Executive Officers of the Registrant.
The names, ages as of June 15, 2016, and current positions of the executive officers are listed below. All executive officers serve at the pleasure of the Board of Directors, with no fixed term of office.
Name | Age | Years with Company | Position | Served as an Officer Since | ||||
Richard K. Smucker | 68 | 43 | Executive Chairman (A) | 1974 | ||||
Mark T. Smucker | 46 | 18 | President and Chief Executive Officer (B) | 2001 | ||||
Mark R. Belgya | 55 | 31 | Vice Chair and Chief Financial Officer (C) | 1997 | ||||
Barry C. Dunaway | 53 | 29 | President, Pet Food and Pet Snacks (D) | 2001 | ||||
Jeannette L. Knudsen | 46 | 13 | Senior Vice President, General Counsel and Secretary (E) | 2009 | ||||
David J. Lemmon | 48 | 22 | President, Canada and International (F) | 2012 | ||||
Steven Oakland | 55 | 33 | Vice Chair and President, U.S. Food and Beverage (G) | 1999 | ||||
Jill R. Penrose | 43 | 12 | Senior Vice President, Human Resources and Corporate Communications (H) | 2014 | ||||
(A) | Mr. Richard Smucker was elected to his present position in May 2016, having served as Chief Executive Officer since August 2011. Prior to that time, he served as Executive Chairman, Co-Chief Executive Officer and President since August 2008. |
(B) | Mr. Mark Smucker was elected to his present position in May 2016, having served as President and President, Consumer and Natural Foods since April 2015. Prior to that time, he served as President, U.S. Retail Coffee since May 2011 and President, Special Markets since August 2008. |
(C) | Mr. Belgya was elected to his present position in May 2016, having served as Senior Vice President and Chief Financial Officer since October 2009. Prior to that time, he served as Vice President and Chief Financial Officer since October 2008. |
(D) | Mr. Dunaway was elected to his present position in March 2016, having served as President, International and Chief Administrative Officer since April 2015. Prior to that time, he served as Senior Vice President and Chief Administrative Officer since May 2011, and Senior Vice President, Corporate and Organizational Development since August 2008. |
(E) | Ms. Knudsen was elected to her present position in May 2016, having served as Vice President, General Counsel and Corporate Secretary since August 2010. Prior to that time, she served as Vice President, Deputy General Counsel and Corporate Secretary since April 2010, and as Corporate Secretary since April 2009. |
(F) | Mr. Lemmon was elected to his present position in May 2016, having served as Vice President and Managing Director, Canada and International since April 2015. Prior to that time, he served as Vice President and Managing Director, Canada since May 2012, and Managing Director, Canada since May 2007. |
16
(G) | Mr. Oakland was elected to his present position in May 2016, having served as President, Coffee and Foodservice since April 2015. Prior to that time, he served as President, International, Foodservice, and Natural Foods since May 2011, and President, U.S. Retail - Smucker’s, Jif and Hungry Jack since August 2008. |
(H) | Ms. Penrose was elected to her present position in May 2016, having served as Vice President, Human Resources since June 2014. Prior to that time, she served as Vice President, Strategy and Organization Development since April 2010, and Director, Corporate Strategy and Organization Development since March 2009. |
17
PART II
Item 5. Market for Registrant’s Common Equity, Related Stockholder Matters and Issuer Purchases of Equity Securities.
(a) The information pertaining to the market for our common shares and other related shareholder information is incorporated herein by reference to the information set forth in our 2016 Annual Report to Shareholders under the captions “Stock Price Data” and “Comparison of Five-Year Cumulative Total Shareholder Return.”
(b) Not applicable.
(c) Issuer Purchases of Equity Securities
Period | (a) | (b) | (c) | (d) | |||||||||
Total number of shares purchased | Average price paid per share | Total number of shares purchased as part of publicly announced plans or programs | Maximum number (or approximate dollar value) of shares that may yet be purchased under the plans or programs | ||||||||||
February 1, 2016 - February 29, 2016 | 1,582 | $ | 127.05 | — | 10,004,661 | ||||||||
March 1, 2016 - March 31, 2016 | 1,419,243 | 128.88 | 1,418,063 | 8,586,598 | |||||||||
April 1, 2016 - April 30, 2016 | 2,003,825 | 127.54 | 2,000,000 | 6,586,598 | |||||||||
Total | 3,424,650 | $ | 128.10 | 3,418,063 | 6,586,598 | ||||||||
Information set forth in the table above represents the activity in our fourth fiscal quarter.
(a) | This column includes shares repurchased as part of publicly announced plans as well as shares repurchased from stock plan recipients in lieu of cash payments. |
(c) During the fourth quarter, we repurchased 3,418,063 common shares, which included 2,000,000 common shares under the 10b5-1 trading plan entered into on March 31, 2016.
(d) As of April 30, 2016, there were 6,586,598 common shares remaining available for future repurchase pursuant to our Board of Directors' authorizations.
Item 6. Selected Financial Data.
Five-year summaries of our selected financial data and discussions of items which materially affect the comparability of the selected financial data are incorporated herein by reference to the information set forth in our 2016 Annual Report to Shareholders under the following captions: “Five-Year Summary of Selected Financial Data,” “Management’s Discussion and Analysis,” “Note 1: Accounting Policies,” “Note 2: Acquisitions,” and “Note 3: Integration and Restructuring Costs.”
Item 7. Management's Discussion and Analysis of Financial Condition and Results of Operations.
Management’s discussion and analysis of financial condition and results of operations, including a discussion of liquidity and capital resources and critical accounting estimates and policies, is incorporated herein by reference to the information set forth in our 2016 Annual Report to Shareholders under the caption “Management’s Discussion and Analysis.”
Item 7A. Quantitative and Qualitative Disclosures About Market Risk.
Quantitative and qualitative disclosures about market risk are incorporated herein by reference to the information set forth in our 2016 Annual Report to Shareholders under the caption “Derivative Financial Instruments and Market Risk.”
18
Item 8. Financial Statements and Supplementary Data.
Consolidated financial statements at April 30, 2016 and 2015, and for each of the years in the three-year period ended April 30, 2016, with the report of independent registered public accounting firm and selected unaudited quarterly financial data, are incorporated herein by reference to the information set forth in our 2016 Annual Report to Shareholders under the caption “Summary of Quarterly Results of Operations” and beginning with “Report of Management on Internal Control Over Financial Reporting” through “Note 17: Common Shares.”
Item 9. Changes in and Disagreements with Accountants on Accounting and Financial Disclosure.
None.
Item 9A. Controls and Procedures.
Evaluation of Disclosure Controls and Procedures. Management, including the principal executive officer and principal financial officer, evaluated the effectiveness of our disclosure controls and procedures (as defined in Rule 13a-15(e) or 15d-15(e) under the Exchange Act), as of April 30, 2016 (the “Evaluation Date”). Based on that evaluation, the principal executive officer and principal financial officer have concluded that, as of the Evaluation Date, our disclosure controls and procedures were effective in ensuring that information required to be disclosed in reports that we file or submit under the Exchange Act is (1) recorded, processed, summarized, and reported within the time periods specified in SEC rules and forms, and (2) accumulated and communicated to management, including the chief executive officer and chief financial officer, as appropriate to allow timely decisions regarding required disclosure.
Changes in Internal Controls. There were no changes in internal control over financial reporting that occurred during the fourth quarter ended April 30, 2016, that have materially affected, or are reasonably likely to materially affect, our internal control over financial reporting.
Management’s report on internal control over financial reporting and the attestation report of our independent registered public accounting firm are set forth in our 2016 Annual Report to Shareholders under the headings “Report of Management on Internal Control Over Financial Reporting” and “Report of Independent Registered Public Accounting Firm on Internal Control Over Financial Reporting,” which reports are incorporated herein by reference.
Item 9B. Other Information.
None.
19
PART III
Item 10. Directors, Executive Officers and Corporate Governance.
The information required by this Item as to the directors of the Company, the Audit Committee, the Audit Committee financial expert, and compliance with Section 16(a) of the Exchange Act is incorporated herein by reference to the information set forth under the captions “Election of Directors,” “Corporate Governance,” “Board and Committee Meetings,” and “Ownership of Common Shares” in our definitive Proxy Statement for the Annual Meeting of Shareholders to be held on August 17, 2016. Information required by Item 10 as to the executive officers of the Company is included in Part I of this Annual Report on Form 10-K as permitted by Instruction 3 to Item 401(b) of Regulation S-K.
The Board of Directors has adopted a Code of Business Conduct and Ethics, last revised February 2015, which applies to our directors, principal executive officer, and principal financial and accounting officer. The Board of Directors has adopted charters for each of the Audit, Executive Compensation, and Nominating and Corporate Governance committees and has also adopted Corporate Governance Guidelines. Copies of these documents are available on our website (jmsmucker.com/investor-relations).
Item 11. Executive Compensation.
The information required by this Item is incorporated by reference to the information set forth under the captions “Executive Compensation,” “Board and Committee Meetings,” and “Compensation Committee Interlocks and Insider Participation” in our definitive Proxy Statement for the Annual Meeting of Shareholders to be held on August 17, 2016.
Item 12. Security Ownership of Certain Beneficial Owners and Management and Related Stockholder Matters.
The information required by this Item is incorporated by reference to the information set forth under the captions “Ownership of Common Shares” and “Equity Compensation Plan Information” in our definitive Proxy Statement for the Annual Meeting of Shareholders to be held on August 17, 2016.
Item 13. Certain Relationships and Related Transactions, and Director Independence.
The information required by this Item is incorporated by reference to the information set forth under the caption “Related Party Transactions” in our definitive Proxy Statement for the Annual Meeting of Shareholders to be held on August 17, 2016.
Item 14. Principal Accountant Fees and Services.
The information required by this Item is incorporated by reference to the information set forth under the captions “Service Fees Paid to the Independent Registered Public Accounting Firm” and “Audit Committee Pre-Approval Policies and Procedures” in our definitive Proxy Statement for the Annual Meeting of Shareholders to be held on August 17, 2016.
20
PART IV
Item 15. Exhibits and Financial Statement Schedules.
(a)(1) | Financial Statements | |
See the Index to Financial Statements, which is included on page F-1 of this Report. | ||
(a)(2) | Financial Statement Schedules | |
Financial statement schedules are omitted because they are not applicable or because the information required is set forth in the Consolidated Financial Statements or notes thereto. | ||
(a)(3) | Exhibits | |
See the Index of Exhibits beginning on page 23 of this Report. | ||
21
SIGNATURES
Pursuant to the requirements of Section 13 or 15(d) of the Securities Exchange Act of 1934, the registrant has duly caused this report to be signed on its behalf by the undersigned, thereunto duly authorized.
Date: June 21, 2016 | The J. M. Smucker Company | |
/s/ Mark R. Belgya | ||
By: | Mark R. Belgya | |
Vice Chair and Chief Financial Officer | ||
Pursuant to the requirements of the Securities Exchange Act of 1934, this report has been signed below by the following persons on behalf of the registrant and in the capacities and on the dates indicated.
* | ||||
Mark T. Smucker | President and Chief Executive Officer and Director (Principal Executive Officer) | June 21, 2016 | ||
/s/ Mark R. Belgya | ||||
Mark R. Belgya | Vice Chair and Chief Financial Officer (Principal Financial Officer and Principal Accounting Officer) | June 21, 2016 | ||
* | ||||
Timothy P. Smucker | Chairman Emeritus | June 21, 2016 | ||
* | ||||
Richard K. Smucker | Executive Chairman | June 21, 2016 | ||
* | ||||
Vincent C. Byrd | Director | June 21, 2016 | ||
* | ||||
Kathryn W. Dindo | Director | June 21, 2016 | ||
* | ||||
Paul J. Dolan | Director | June 21, 2016 | ||
* | ||||
Nancy Lopez Knight | Director | June 21, 2016 | ||
* | ||||
Elizabeth Valk Long | Director | June 21, 2016 | ||
* | ||||
Gary A. Oatey | Director | June 21, 2016 | ||
* | ||||
Sandra Pianalto | Director | June 21, 2016 | ||
* | ||||
Alex Shumate | Director | June 21, 2016 | ||
* | ||||
David J. West | Director | June 21, 2016 | ||
* | The undersigned, by signing her name hereto, does sign and execute this report pursuant to the powers of attorney executed by the above-named officers and directors of the registrant, which are being filed herewith with the Securities and Exchange Commission on behalf of such officers and directors. |
Date: June 21, 2016 | /s/ Jeannette L. Knudsen | |||
By: | Jeannette L. Knudsen Attorney-in-Fact | |||
22
INDEX OF EXHIBITS
Exhibit Number | Exhibit Description | Filed Herewith | Incorporated by Reference from Form | Exhibit | Filing Date |
2.1 | Agreement and Plan of Merger, dated as of February 3, 2015, by and among Blue Acquisition Group, Inc., the Company, SPF Holdings I, Inc., SPF Holdings II, LLC and, for the limited purposes set forth therein, Blue Holdings I, L.P. | 8-K | 2.1 | 2/4/2015 | |
2.2 | Purchase Agreement dated as of October 9, 2013, among Del Monte Corporation, Del Monte Foods Consumer Products, Inc. and, for the limited purposes set forth therein, Del Monte Pacific Limited | 10-Q (A) | 10.3 | 12/9/2013 | |
3.1 | Amended Articles of Incorporation of The J. M. Smucker Company | 10-Q | 3.1 | 8/28/2013 | |
3.2 | Amended Regulations of The J. M. Smucker Company | 8-K | 3.1 | 6/21/2016 | |
3.3 | Articles of Organization of J.M. Smucker LLC | S-4 | 3.3 | 6/30/2015 | |
3.4 | Third Amended and Restated Operating Agreement of J.M. Smucker LLC | S-4 | 3.4 | 6/30/2015 | |
3.5 | Certificate of Incorporation of The Folgers Coffee Company | S-4 | 3.5 | 6/30/2015 | |
3.6 | Bylaws of The Folgers Coffee Company | S-4 | 3.6 | 6/30/2015 | |
4.1 | Rights Agreement, dated as of May 20, 2009, by and between the Company and Computershare Trust Company, N.A. | 8-A | 4.1 | 5/21/2009 | |
4.2 | Amendment No. 1, dated as of February 3, 2015, to the Rights Agreement, dated as of May 20, 2009, between the Company and Computershare Trust Company, N.A. as rights agent | 8-K | 4.1 | 2/4/2015 | |
4.3 | Indenture, dated as of October 18, 2011, between the Company and U.S. Bank National Association | 8-K | 4.1 | 10/18/2011 | |
4.4 | First Supplemental Indenture, dated as of October 18, 2011, among the Company, the guarantors party thereto, and U.S. Bank National Association | 8-K | 4.2 | 10/18/2011 | |
4.5 | Third Amended and Restated Intercreditor Agreement, dated June 11, 2010, among KeyBank National Association and Bank of Montreal, as administrative agents, and the other parties identified therein | S-3 | 4.7 | 10/13/2011 | |
4.6 | Indenture, dated as of March 20, 2015, between the Company and U.S. Bank National Association, as trustee | 8-K | 4.1 | 3/23/2015 | |
4.7 | First Supplemental Indenture, dated as of March 20, 2015, by and among the Company, the guarantors party thereto and U.S. Bank National Association, as trustee | 8-K | 4.2 | 3/23/2015 | |
4.8 | Registration Rights Agreement, dated as of March 20, 2015, by and among the Company, the initial guarantors set forth therein, and J.P. Morgan Securities LLC and Merrill Lynch, Pierce, Fenner & Smith Incorporated, as representatives of the several initial purchasers | 8-K | 4.3 | 3/23/2015 | |
10.1 | Nonemployee Director Stock Plan dated January 1, 1997* | 10-K | 10(e) | 7/23/1997 | |
10.2 | The J. M. Smucker Company Top Management Supplemental Retirement Benefit Plan, restated as of January 1, 2013* | 10-Q | 10.1 | 2/27/2014 | |
10.3 | First Amendment, effective as of April 1, 2016, to The J. M. Smucker Company Top Management Supplemental Retirement Plan, restated as of January 1, 2013* | X | |||
10.4 | Amended and Restated Consulting and Noncompete Agreement of Timothy P. Smucker, dated as of December 31, 2010* | 10-Q | 10.2 | 3/11/2011 | |
23
INDEX OF EXHIBITS
Exhibit Number | Exhibit Description | Filed Herewith | Incorporated by Reference from Form | Exhibit | Filing Date |
10.5 | Amended and Restated Consulting and Noncompete Agreement of Richard K. Smucker, dated as of December 31, 2010* | 10-Q | 10.3 | 3/11/2011 | |
10.6 | Termination Amendment to Amended and Restated Consulting and Noncompete Agreement of Timothy P. Smucker, dated as of April 25, 2011* | 8-K | 10.1 | 4/25/2011 | |
10.7 | Termination Amendment to Amended and Restated Consulting and Noncompete Agreement of Richard K. Smucker, dated as of April 25, 2011* | 8-K | 10.2 | 4/25/2011 | |
10.8 | The J. M. Smucker Company Voluntary Deferred Compensation Plan, amended and restated as of December 1, 2012* | 10-Q | 10.3 | 3/1/2013 | |
10.9 | The J. M. Smucker Company 2006 Equity Compensation Plan, effective August 17, 2006* | 8-K | 10.1 | 8/21/2006 | |
10.1 | The J. M. Smucker Company 2010 Equity and Incentive Compensation Plan* | 8-K | 10.1 | 8/20/2010 | |
10.11 | Form of Deferred Stock Units Agreement* | 10-Q | 10.6 | 9/9/2010 | |
10.12 | Form of Deferred Stock Units Agreement* | 8-K | 10.2 | 10/28/2010 | |
10.13 | Form of Restricted Stock Agreement* | 10-Q | 10.2 | 12/10/2010 | |
10.14 | Omnibus Amendment to Restricted Stock Agreements for Folgers Employees, dated as of November 4, 2010* | 10-Q | 10.1 | 3/11/2011 | |
10.15 | Form of Restricted Stock Agreement* | 8-K | 10.1 | 4/20/2012 | |
10.16 | Form of Deferred Stock Units Agreement* | 8-K | 10.2 | 4/20/2012 | |
10.17 | Form of Restricted Stock Agreement* | 10-K | 10.26 | 6/21/2013 | |
10.18 | Form of Deferred Stock Units Agreement* | 10-K | 10.27 | 6/21/2013 | |
10.19 | Form of Special One-Time Grant of Restricted Stock Agreement* | 10-K | 10.28 | 6/21/2013 | |
10.20 | Form of Restricted Stock Agreement* | 10-Q | 10.1 | 9/2/2015 | |
10.21 | The J. M. Smucker Company Nonemployee Director Deferred Compensation Plan (Amended and Restated Effective January 1, 2007)* | 10-Q | 10.5 | 3/10/2009 | |
10.22 | The J. M. Smucker Company Nonemployee Director Deferred Compensation Plan (Amended and Restated Effective January 1, 2014)* | 10-Q | 10.2 | 11/27/2013 | |
10.23 | The J. M. Smucker Company Defined Contribution Supplemental Executive Retirement Plan, restated effective as of May 1, 2015* | 10-K | 10.23 | 6/25/2015 | |
10.24 | The J. M. Smucker Company Restoration Plan, amended and restated effective as of January 1, 2013* | 10-K | 10.24 | 6/25/2015 | |
10.25 | Amendment No. 1 to The J. M. Smucker Company Restoration Plan, dated as of May 1, 2015* | 10-K | 10.25 | 6/25/2015 | |
10.26 | Form of Nonstatutory Stock Option Agreement between the Company and the Optionee (one-year vesting)* | 8-K | 10.2 | 3/23/2015 | |
10.27 | Form of Nonstatutory Stock Option Agreement between the Company and the Optionee (three-year vesting)* | 8-K | 10.3 | 3/23/2015 | |
10.28 | Form of Nonstatutory Stock Option Agreement between the Company and David J. West* | 8-K | 10.4 | 3/23/2015 | |
10.29 | Form of Change in Control Severance Agreement between the Company and the Executive party thereto* | 8-K | 10.5 | 3/23/2015 | |
10.30 | Employment Agreement, effective as of March 23, 2015, between the Company and David J. West* | 10-K | 10.30 | 6/25/2015 | |
10.31 | Amendment to Employment Agreement, dated as of April 9, 2015, between the Company and David J. West* | 10-K | 10.31 | 6/25/2015 | |
24
INDEX OF EXHIBITS
Exhibit Number | Exhibit Description | Filed Herewith | Incorporated by Reference from Form | Exhibit | Filing Date |
10.32 | Employment Agreement Consent to Change in Role, dated December 11, 2015, by and between The J. M. Smucker Company and David J. West* | 8-K | 10.1 | 12/15/2015 | |
10.33 | The J. M. Smucker Company 1998 Equity and Performance Incentive Plan (as amended and restated effective as of June 6, 2005)* | 8-K | 10.1 | 6/9/2005 | |
10.34 | Del Monte Corporation Annual Incentive Plan, adopted September 8, 2011* | 8-K (A) | 10.1 | 9/13/2011 | |
10.35 | Del Monte Corporation Supplemental Executive Retirement Plan (Fourth Restatement), amended and restated effective January 1, 2009* | 10-Q (B) | 10.4 | 3/4/2009 | |
10.36 | Del Monte Corporation Additional Benefits Plan, amended and restated effective January 1, 2009* | 10-Q (B) | 10.2 | 3/4/2009 | |
10.37 | Del Monte Executive Severance Plan, amended July 23, 2009* | 10-Q (B) | 10.2 | 9/9/2009 | |
10.38 | Amendment Number One to the Del Monte Corporation Executive Severance Plan, dated November 24, 2010* | 10-Q (B) | 10.7 | 3/4/2011 | |
10.39 | Del Monte Executive Perquisite Plan, amended and restated effective July 1, 2008* | 10-K (B) | 10.74 | 6/25/2008 | |
10.40 | Amended and Restated Asset Purchase and Sale Agreement, dated as of October 24, 2001, by and among General Mills, Inc., The Pillsbury Company, and International Multifoods Corporation | 8-K (C) | 2.1 | 11/28/2001 | |
10.41 | Retail Trademark License Agreement, dated November 13, 2001, between The Pillsbury Company and International Multifoods Corporation | 10-Q (C) | 10.2 | 1/14/2002 | |
10.42 | Amendment to Retail Trademark License Agreement, dated December 23, 2002, between The Pillsbury Company and International Multifoods Corporation | 10-K (C) | 10.29 | 5/12/2003 | |
10.43 | Closing Agreement, dated as of November 13, 2001, by and among General Mills, Inc., The Pillsbury Company, and International Multifoods Corporation | 8-K (C) | 2.2 | 11/28/2001 | |
10.44 | Omnibus Amendment Agreement, dated as of January 16, 2003, by and among General Mills, Inc., The Pillsbury Company, International Multifoods Corporation, and Sebesta Blomberg & Associates, Inc. | 8-K (C) | 10.1 | 1/28/2003 | |
10.45 | Tax Matters Agreement between The Procter & Gamble Company, The Folgers Coffee Company, and the Company, dated November 6, 2008 | 10-Q | 10.20 | 12/9/2008 | |
10.46 | Intellectual Property Matters Agreement between The Procter & Gamble Company and The Folgers Coffee Company, dated November 6, 2008 | 10-Q | 10.21 | 12/9/2008 | |
10.47 | Third Amended and Restated Credit Agreement, dated as of September 6, 2013, among the Company and Smucker Foods of Canada Corp., as borrowers, the lenders and guarantors party thereto, and Bank of Montreal, as administrative agent | 8-K | 10.1 | 9/10/2013 | |
10.48 | Amendment No. 1, dated as of February 23, 2015, to the Third Amended and Restated Credit Agreement dated as of September 6, 2013, among the Company and Smucker Foods of Canada Corp., as borrowers, the lenders and guarantors party thereto, and Bank of Montreal, as administrative agent | 8-K | 10.1 | 2/24/2015 | |
10.49 | Form of Commercial Paper Dealer Agreement between the Company, as Issuer, and the Dealer party thereto | 10-Q | 10.1 | 8/27/2014 | |
25
INDEX OF EXHIBITS
Exhibit Number | Exhibit Description | Filed Herewith | Incorporated by Reference from Form | Exhibit | Filing Date |
10.50 | Shareholders Agreement, dated as of February 3, 2015, by and among The J. M. Smucker Company, Blue Holdings I, L.P., Kohlberg Kravis Roberts & Co. L.P., Vestar Capital Partners, Centerview Capital Management LLC, AlpInvest Partners US Holdings, LLC, and the shareholders named therein | 8-K | 10.1 | 2/4/2015 | |
10.51 | Term Loan Credit Agreement, dated as of March 2, 2015, among the Company, as borrower, the lenders and guarantors party thereto, and Bank of America, N.A., as administrative agent | 8-K | 10.1 | 3/3/2015 | |
12.1 | Computation of Ratio of Earnings to Fixed Charges | X | |||
13 | Excerpts from our 2016 Annual Report to Shareholders. Such Annual Report, except those portions thereof that are expressly incorporated herein by reference, is furnished for the information of the Commission only and is not deemed to be filed as part of this Annual Report on Form 10-K | X | |||
21 | Subsidiaries of the Registrant | X | |||
23 | Consent of Independent Registered Public Accounting Firm | X | |||
24 | Powers of Attorney | X | |||
31.1 | Certifications of Mark T. Smucker pursuant to Rule 13a-14(a) and Rule 15d-14(a) of the Securities Exchange Act, as amended | X | |||
31.2 | Certifications of Mark R. Belgya pursuant to Rule 13a-14(a) and Rule 15d-14(a) of the Securities Exchange Act, as amended | X | |||
32 | Certification pursuant to 18 U.S.C. Section 1350, as adopted pursuant to Section 906 of The Sarbanes-Oxley Act of 2002 | X | |||
101.INS | XBRL Instance Document | X | |||
101.SCH | XBRL Taxonomy Extension Schema Document | X | |||
101.PRE | XBRL Taxonomy Extension Presentation Linkbase Document | X | |||
101.DEF | XBRL Taxonomy Extension Definition Linkbase Document | X | |||
101.CAL | XBRL Taxonomy Extension Calculation Linkbase Document | X | |||
101.LAB | XBRL Taxonomy Extension Label Linkbase Document | X | |||
* Identifies exhibits that consist of a management contract or compensatory plan or arrangement.
(A) Identifies exhibits filed under Del Monte Corp. (Commission File No. 333-107830-05).
(B) Identifies exhibits filed under Del Monte Foods Co. (Commission File No. 001-14335).
(C) Identifies exhibits filed under International Multifoods Corp. (Commission File No. 001-6699).
26
THE J. M. SMUCKER COMPANY
ANNUAL REPORT ON FORM 10-K
INDEX TO FINANCIAL STATEMENTS
Annual Report to Shareholders | |
Data incorporated by reference to the 2016 Annual Report to Shareholders of The J. M. Smucker Company: | |
Report of Management on Internal Control Over Financial Reporting | 37 |
Report of Independent Registered Public Accounting Firm on Internal Control Over Financial Reporting | 38 |
Report of Independent Registered Public Accounting Firm on the Consolidated Financial Statements | 39 |
Consolidated Balance Sheets at April 30, 2016 and 2015 | 42-43 |
For the years ended April 30, 2016, 2015, and 2014: | |
Statements of Consolidated Income | 41 |
Statements of Consolidated Comprehensive Income | 41 |
Statements of Consolidated Cash Flows | 44 |
Statements of Consolidated Shareholders’ Equity | 45 |
Notes to Consolidated Financial Statements | 46-80 |
Financial statement schedules are omitted because they are not applicable or because the information required is set forth in the Consolidated Financial Statements or the notes thereto.
F-1
Exhibit 10.3
FIRST AMENDMENT TO
THE J. M. SMUCKER COMPANY TOP MANAGEMENT
SUPPLEMENTAL RETIREMENT PLAN
(January 1, 2013 RESTATEMENT)
The J. M. Smucker Company Top Management Supplemental Retirement Plan, established effective January 1, 1985, as amended and restated effective as of May 1, 1994, May 1, 1999, January 1, 2005, January 1, 2009 and January 1, 2013 (the “Plan”), hereby is amended further effective April 1, 2016;
WHEREAS, effective May 1, 2016 (the “Transition Date”), Richard K. Smucker (“Mr. R. Smucker”), the Chief Executive Officer of The J. M. Smucker Company (the “Company”), will no longer serve as the Chief Executive Officer but will become the Executive Chairman of the Board of Directors of the Company (the “Board”);
WHEREAS, following the Transition Date, the Company desires for Mr. R. Smucker to continue to provide services to the Company, including focusing his efforts on corporate strategy, succession planning, serving as an ambassador of the Company with employees, customers, and other constituents, and other matters as requested by the Board;
WHEREAS, the Executive Compensation Committee of the Board (the “Committee”), by actions taken on March 7, 2016, has determined that it is in the best interest of the Company to amend the Plan to provide Mr. R. Smucker with the same level of monthly benefits under the Plan that he would be entitled to receive if he ceased providing services to the Company on March 31, 2016;
WHEREAS, such actions of the Committee further authorize officers of the Company to perform any and all acts and execute any and all documents that they may deem necessary to effectuate the Committee’s resolutions; and
WHEREAS, pursuant to Section 7.1 of the Plan and the authority delegated by the Board, the Committee has the power to amend the Plan;
NOW, THEREFORE, the Plan hereby is amended as follows:
1. The penultimate paragraph of Section 2.3 of the Plan is hereby amended in its entirety to read as follows:
“Notwithstanding the foregoing provisions of this Section 2.3, (a) the Monthly Retirement Benefit payable to Timothy P. Smucker (“Mr. T. Smucker”) shall be calculated as if Mr. T. Smucker had ceased providing services to the Company on August 16, 2011, and (b) the Monthly Retirement Benefit payable to Richard K. Smucker (“Mr. R. Smucker”) shall be calculated as if Mr. R. Smucker had ceased providing services to the Company on March 31, 2016.”
2. The last paragraph of Section 2.6 of the Plan is hereby amended in its entirety to read as follows:
“Notwithstanding the foregoing provisions of this Section 2.6, (a) the Benefit Target Date for Mr. T. Smucker will be August 16, 2011, and the amount of any benefit paid to Mr. T. Smucker as a single lump sum form of benefit at any time from September 1, 2014 through April 1, 2015 shall be based on a date of payment of September 1, 2014, and (b) the Benefit Target Date for Mr. R. Smucker will be April 1, 2016.”
Executed at Orrville, Ohio on this 7th day of March, 2016, effective as of April 1, 2016.
THE J. M. SMUCKER COMPANY
By its duly authorized officer
/s/ Jeannette L. Knudsen
By: Jeannette L. Knudsen, Vice President,
General Counsel and Corporate Secretary
Exhibit 12.1
The J. M. Smucker Company
Computation of Ratio of Earnings to Fixed Charges
(in millions of dollars)
April 30, 2016 Year Ended | |||
Earnings before fixed charges: | |||
Income before income taxes | $ | 977.9 | |
Total fixed charges | 204.7 | ||
Less: capitalized interest | (0.9 | ) | |
Earnings available for fixed charges | $ | 1,181.7 | |
Fixed charges: | |||
Interest and other debt expense, net of capitalized interest | $ | 173.0 | |
Capitalized interest | 0.9 | ||
Estimated interest portion of rent expense (A) | 30.8 | ||
Total fixed charges | $ | 204.7 | |
Ratio of earnings to fixed charges | 5.8 | ||
(A) | For purposes of this calculation, management estimates approximately one-third of rent expense is representative of interest expense. |


2016 FINANCIAL REVIEW
The J.M. Smucker Company
FIVE-YEAR SUMMARY OF SELECTED FINANCIAL DATA
The following table presents selected financial data for each of the five years in the period ended April 30, 2016. The selected financial data should be read in conjunction with the “Results of Operations” and “Financial Condition” sections of “Management’s Discussion and Analysis” and the consolidated financial statements and notes thereto.
Year Ended April 30, | |||||||||||||||||||||||||
(Dollars in millions, except per share data) | 2016 | 2015 | 2014 | 2013 | 2012 | ||||||||||||||||||||
Statements of Income: | |||||||||||||||||||||||||
Net sales | $ | 7,811.2 | $ | 5,692.7 | $ | 5,610.6 | $ | 5,897.7 | $ | 5,525.8 | |||||||||||||||
Gross profit | $ | 2,967.8 | $ | 1,968.7 | $ | 2,031.0 | $ | 2,027.6 | $ | 1,845.2 | |||||||||||||||
% of net sales | 38.0 | % | 34.6 | % | 36.2 | % | 34.4 | % | 33.4 | % | |||||||||||||||
Operating income | $ | 1,145.3 | $ | 772.0 | $ | 919.0 | $ | 910.4 | $ | 778.3 | |||||||||||||||
% of net sales | 14.7 | % | 13.6 | % | 16.4 | % | 15.4 | % | 14.1 | % | |||||||||||||||
Net income | $ | 688.7 | $ | 344.9 | $ | 565.2 | $ | 544.2 | $ | 459.7 | |||||||||||||||
Financial Position: | |||||||||||||||||||||||||
Cash and cash equivalents | $ | 109.8 | $ | 125.6 | $ | 153.5 | $ | 256.4 | $ | 229.7 | |||||||||||||||
Total assets | 15,984.1 | 16,806.3 | 9,041.4 | 9,010.7 | 9,095.4 | ||||||||||||||||||||
Total debt | 5,430.0 | 6,170.9 | 2,216.3 | 2,010.1 | 2,061.8 | ||||||||||||||||||||
Shareholders’ equity | 7,008.5 | 7,086.9 | 5,029.6 | 5,148.8 | 5,163.4 | ||||||||||||||||||||
Liquidity: | |||||||||||||||||||||||||
Net cash provided by operating activities | $ | 1,458.3 | $ | 733.2 | $ | 856.0 | $ | 855.8 | $ | 730.9 | |||||||||||||||
Capital expenditures | 201.4 | 247.7 | 279.5 | 206.5 | 274.2 | ||||||||||||||||||||
Free cash flow (A) | 1,256.9 | 485.5 | 576.5 | 649.3 | 456.7 | ||||||||||||||||||||
Quarterly dividends paid | 316.6 | 254.0 | 238.0 | 222.8 | 213.7 | ||||||||||||||||||||
Purchase of treasury shares | 441.1 | 24.3 | 508.5 | 364.2 | 315.8 | ||||||||||||||||||||
Earnings before interest, taxes, depreciation, and amortization (A) | 1,579.1 | 871.3 | 1,185.5 | 1,161.6 | 1,028.0 | ||||||||||||||||||||
Share Data: | |||||||||||||||||||||||||
Weighted-average shares outstanding | 119,436,199 | 103,691,978 | 104,332,241 | 108,827,897 | 113,263,951 | ||||||||||||||||||||
Weighted-average shares outstanding – assuming dilution | 119,477,312 | 103,697,261 | 104,346,587 | 108,851,153 | 113,313,567 | ||||||||||||||||||||
Dividends declared per common share | $ | 2.68 | $ | 2.56 | $ | 2.32 | $ | 2.08 | $ | 1.92 | |||||||||||||||
Earnings per Common Share: | |||||||||||||||||||||||||
Net income | $ | 5.77 | $ | 3.33 | $ | 5.42 | $ | 5.00 | $ | 4.06 | |||||||||||||||
Net income – assuming dilution | 5.76 | 3.33 | 5.42 | 5.00 | 4.06 | ||||||||||||||||||||
Other Non-GAAP Measures: (A) | |||||||||||||||||||||||||
Non-GAAP gross profit | $ | 2,968.0 | $ | 1,999.4 | $ | 2,035.1 | $ | 2,032.5 | $ | 1,896.9 | |||||||||||||||
% of net sales | 38.0 | % | 35.1 | % | 36.3 | % | 34.5 | % | 34.3 | % | |||||||||||||||
Non-GAAP operating income | $ | 1,281.4 | $ | 859.3 | $ | 948.7 | $ | 964.8 | $ | 902.5 | |||||||||||||||
% of net sales | 16.4 | % | 15.1 | % | 16.9 | % | 16.4 | % | 16.3 | % | |||||||||||||||
Non-GAAP income and income per common share: | |||||||||||||||||||||||||
Non-GAAP income | $ | 784.6 | $ | 402.5 | $ | 584.9 | $ | 580.4 | $ | 541.2 | |||||||||||||||
Non-GAAP income per common share – assuming dilution | $ | 6.57 | $ | 3.88 | $ | 5.61 | $ | 5.33 | $ | 4.78 | |||||||||||||||
(A) Refer to “Non-GAAP Measures” in the “Management’s Discussion and Analysis” section for a reconciliation to the comparable GAAP financial measure.


2016 ANNUAL REPORT 21
SUMMARY OF QUARTERLY RESULTS OF OPERATIONS
The J. M. Smucker Company
The following is a summary of unaudited quarterly results of operations for the years ended April 30, 2016 and 2015.
(Dollars in millions, except per share data) | Quarter Ended | Net Sales | Gross Profit | Net Income (Loss) | Net Income (Loss) per Common Share | Net Income (Loss) per Common Share – Assuming Dilution | |||||||||||||||
2016 | July 31, 2015 | $ | 1,952.0 | $ | 728.7 | $ | 136.4 | $ | 1.14 | $ | 1.14 | ||||||||||
October 31, 2015 | 2,077.7 | 787.3 | 176.0 | 1.47 | 1.47 | ||||||||||||||||
January 31, 2016 | 1,973.9 | 763.8 | 185.3 | 1.55 | 1.55 | ||||||||||||||||
April 30, 2016 | 1,807.6 | 688.0 | 191.0 | 1.61 | 1.61 | ||||||||||||||||
2015 | July 31, 2014 | $ | 1,323.8 | $ | 478.7 | $ | 116.0 | $ | 1.14 | $ | 1.14 | ||||||||||
October 31, 2014 | 1,481.8 | 536.5 | 158.3 | 1.55 | 1.55 | ||||||||||||||||
January 31, 2015 | 1,440.0 | 522.9 | 160.9 | 1.58 | 1.58 | ||||||||||||||||
April 30, 2015 | 1,447.1 | 430.6 | (90.3 | ) | (0.82 | ) | (0.82 | ) | |||||||||||||
Annual net income (loss) per common share may not equal the sum of the individual quarters due to differences in the average number of shares outstanding during the respective periods, primarily due to share repurchases in 2016 and the issuance of shares related to the Big Heart Pet Brands acquisition in 2015.
STOCK PRICE DATA
Our common shares are listed on the New York Stock Exchange – ticker symbol SJM. The table below presents the high and low market prices for the shares and the quarterly dividends declared. There were approximately 306,800 shareholders of record as of June 14, 2016, of which approximately 43,300 were registered holders of common shares.
Quarter Ended | High | Low | Dividends | ||||||||||
2016 | July 31, 2015 | $ | 120.65 | $ | 104.81 | $ | 0.67 | ||||||
October 31, 2015 | 120.44 | 104.30 | 0.67 | ||||||||||
January 31, 2016 | 128.43 | 111.01 | 0.67 | ||||||||||
April 30, 2016 | 132.64 | 121.79 | 0.67 | ||||||||||
2015 | July 31, 2014 | $ | 107.74 | $ | 95.89 | $ | 0.64 | ||||||
October 31, 2014 | 104.51 | 95.60 | 0.64 | ||||||||||
January 31, 2015 | 107.21 | 97.28 | 0.64 | ||||||||||
April 30, 2015 | 118.64 | 101.88 | 0.64 | ||||||||||
22 THE J. M.SMUCKER COMPANY
COMPARISON OF FIVE-YEAR CUMULATIVE
TOTAL SHAREHOLDER RETURN
The J. M. Smucker Company
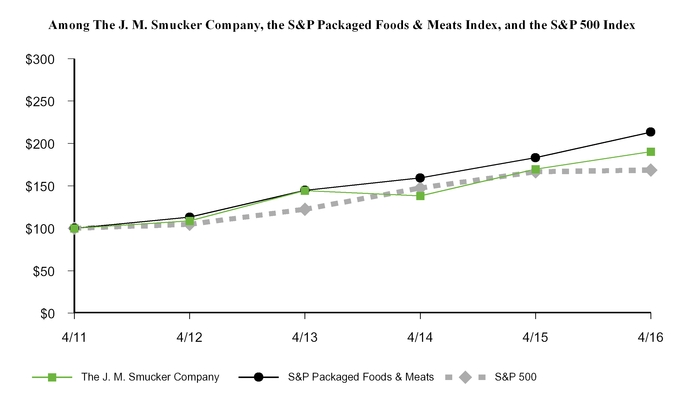
April 30, | |||||||||||||||||||||||
2011 | 2012 | 2013 | 2014 | 2015 | 2016 | ||||||||||||||||||
The J. M. Smucker Company | $ | 100.00 | $ | 108.73 | $ | 144.50 | $ | 138.29 | $ | 169.87 | $ | 190.34 | |||||||||||
S&P Packaged Foods & Meats | 100.00 | 113.07 | 144.77 | 159.30 | 183.17 | 213.44 | |||||||||||||||||
S&P 500 | 100.00 | 104.76 | 122.45 | 147.48 | 166.62 | 168.63 | |||||||||||||||||
The above graph compares the cumulative total shareholder return for the five years ended April 30, 2016, for our common shares, the S&P Packaged Foods & Meats Index, and the S&P 500 Index. These figures assume all dividends are reinvested when received and are based on $100 invested in our common shares and the referenced index funds on April 30, 2011.
Copyright © 2016 Standard & Poor’s, a division of The McGraw-Hill Companies Inc. All rights reserved.
www.researchdatagroup.com/S&P.htm
2016 ANNUAL REPORT 23
MANAGEMENT’S DISCUSSION AND ANALYSIS
The J. M. Smucker Company
(Dollars in millions, unless otherwise noted, except per share data)
DESCRIPTION OF THE COMPANY
For nearly 120 years, The J. M. Smucker Company (“Company,” “we,” “us,” or “our”) headquartered in Orrville, Ohio, has been committed to offering consumers quality products that bring families together to share memorable meals and moments. Today, we are a leading marketer and manufacturer of consumer food and beverage products and pet food and pet snacks in North America. In consumer foods and beverages, our brands include Smucker’s®, Folgers®, Jif®, Dunkin’ Donuts®, Crisco®, Pillsbury®, R.W. Knudsen Family®, Hungry Jack®, Café Bustelo®, Martha White®, truRoots®, Sahale Snacks®, Robin Hood®, and Bick’s®. In pet food and pet snacks, our brands include Meow Mix®, Milk-Bone®, Kibbles ’n Bits®, Natural Balance®, and 9Lives®.
We have three reportable segments: U.S. Retail Coffee, U.S. Retail Consumer Foods, and U.S. Retail Pet Foods. The U.S. retail market segments in total comprised over 85 percent of net sales in 2016 and represent a major portion of our strategic focus – the sale of branded food and beverage products with leadership positions to consumers through retail outlets in North America. In the U.S. retail market segments, our products are sold primarily to food retailers, food wholesalers, drug stores, club stores, mass merchandisers, discount and dollar stores, military commissaries, natural foods stores and distributors, and pet specialty stores. Within our segment results, International and Foodservice represents a combination of the strategic business areas not included in the U.S. retail market segments. The products included in International and Foodservice are distributed domestically and in foreign countries through retail channels and foodservice distributors and operators (e.g., restaurants, lodging, schools and universities, health care operators).
STRATEGIC OVERVIEW
We remain rooted in our Basic Beliefs of Quality, People, Ethics, Growth, and Independence established by our founder and namesake, Jerome Smucker, more than a century ago. Today, these Basic Beliefs are the core of our unique corporate culture and serve as a foundation for decision-making and actions. During 2016, our Board of Directors elected our sixth chief executive officer, who represents the fifth generation of family leadership in 119 years. This continuity of management and thought extends to the broader leadership team that embodies the values and embraces the business practices that have contributed to our consistent growth.
Our strategic vision is to own and market a portfolio of food brands that combines number one and leading brands with emerging, on-trend brands to drive balanced growth.
Our strategic long-term growth objectives are to increase net sales by 3 percent and earnings per share, measured on a non-GAAP basis, by 8 percent annually on average. We expect organic growth, including new products, to drive much of our top-line growth, while the contribution from acquisitions will vary from year to year.
Net sales has increased at a compound annual growth rate of
10 percent over the past five years, largely driven by the recent acquisition of Big Heart Pet Brands (“Big Heart”), while income
per diluted share excluding certain items affecting comparability (“non-GAAP income per diluted share”) has increased at a rate of 7 percent over the same period. Certain items affecting comparability include merger and integration and restructuring costs and unallocated gains and losses on commodity and foreign currency exchange derivatives, which reflect the changes in fair value of these derivative contracts.
During 2015, we acquired Big Heart, a leading producer, distributor, and marketer of premium-quality, branded pet food and pet snacks in the U.S. This transformational acquisition provided an immediate and significant presence in the large and growing pet food and pet snacks categories, and increased our center-of-the-store presence with consumers and retailers.
Net cash provided by operating activities has increased at a compound annual growth rate of 30 percent over the past five years. Our current cash deployment strategy includes a significant focus on debt repayment, the continuation of our dividend policy, and investment in the business through capital expenditures. We will also consider acquisition opportunities and share repurchases.
RESULTS OF OPERATIONS
All comparisons presented in this discussion and analysis are to the corresponding period of the prior year, unless otherwise noted. On March 23, 2015, we completed the acquisition of Big Heart, and on September 2, 2014, we completed the acquisition of Sahale Snacks, Inc. (“Sahale”). We completed the acquisition of Enray Inc. (“Enray”) on August 20, 2013. All of these transactions were accounted for as purchase business combinations, and the operations of each business are included in our consolidated financial statements from the date of acquisition. Due to the timing of the closing of the Big Heart transaction during the fourth quarter of 2015, approximately 11 months of incremental Big Heart operations are included in 2016 results. Our results also include the impact of our licensing and distribution agreement with Cumberland Packing Corp. (“Cumberland”), which commenced on July 1, 2013.
On December 31, 2015, we sold our U.S. canned milk brands and operations to Eagle Family Foods Group LLC, a subsidiary of funds affiliated with Kelso & Company. The transaction included canned milk products that were primarily sold in U.S. retail and foodservice channels under the Eagle Brand® and Magnolia® brands, along with other branded and private label trade names, with annual net sales of approximately $200.0. Our manufacturing facilities in El Paso, Texas, and Seneca, Missouri, were included in the transaction, but our canned milk business in Canada was not included. The operating results for this business were primarily included in the U.S. Retail Consumer Foods segment prior to the sale. We received proceeds from the divestiture of $193.7, which were net of transaction costs and a working capital adjustment, and recognized a pre-tax gain of $25.3.
The acquisition of Big Heart was a cash and stock transaction valued at $5.9 billion, which included the issuance of 17.9 million shares of our common stock to the shareholders of Blue Acquisition Group, Inc., Big Heart’s parent company. After the
24 THE J. M.SMUCKER COMPANY
MANAGEMENT’S DISCUSSION AND ANALYSIS
The J. M. Smucker Company
closing of the transaction, we had approximately 120.0 million common shares outstanding. We assumed $2.6 billion in debt that we repaid at closing and paid an additional $1.2 billion in cash, net of a working capital adjustment. As part of the transaction, new debt of $5.5 billion was borrowed, as discussed in Note 8: Debt and Financing Arrangements.
Total one-time costs related to the Big Heart acquisition are anticipated to be approximately $275.0 and are expected to be
incurred through 2018. These costs primarily consist of employee-
related costs, outside service and consulting costs, and other costs
related to the acquisition. We have incurred total costs of $181.2 related to the integration of Big Heart, including $145.2 in 2016.
We anticipate synergies related to the Big Heart acquisition, as well as our organization optimization program discussed in the “Restructuring” section of this discussion and analysis, to result in net realized savings of approximately $200.0 annually by the end of 2018. We realized $37.0 of these savings in 2016 and expect to realize $100.0 of incremental savings in 2017.
Year Ended April 30, | ||||||||||||||||||||||
2016 | 2015 | 2014 | 2016 % Increase | 2015 % Increase (Decrease) | ||||||||||||||||||
Net sales | $ | 7,811.2 | $ | 5,692.7 | $ | 5,610.6 | 37 | % | 1 | % | ||||||||||||
Gross profit | $ | 2,967.8 | $ | 1,968.7 | $ | 2,031.0 | 51 | % | (3 | )% | ||||||||||||
% of net sales | 38.0 | % | 34.6 | % | 36.2 | % | ||||||||||||||||
Operating income | $ | 1,145.3 | $ | 772.0 | $ | 919.0 | 48 | % | (16 | )% | ||||||||||||
% of net sales | 14.7 | % | 13.6 | % | 16.4 | % | ||||||||||||||||
Net income: | ||||||||||||||||||||||
Net income | $ | 688.7 | $ | 344.9 | $ | 565.2 | 100 | % | (39 | )% | ||||||||||||
Net income per common share – assuming dilution | $ | 5.76 | $ | 3.33 | $ | 5.42 | 73 | % | (39 | )% | ||||||||||||
Non-GAAP gross profit (A) | $ | 2,968.0 | $ | 1,999.4 | $ | 2,035.1 | 48 | % | (2 | )% | ||||||||||||
% of net sales | 38.0 | % | 35.1 | % | 36.3 | % | ||||||||||||||||
Non-GAAP operating income (A) | $ | 1,281.4 | $ | 859.3 | $ | 948.7 | 49 | % | (9 | )% | ||||||||||||
% of net sales | 16.4 | % | 15.1 | % | 16.9 | % | ||||||||||||||||
Non-GAAP income: (A) | ||||||||||||||||||||||
Income | $ | 784.6 | $ | 402.5 | $ | 584.9 | 95 | % | (31 | )% | ||||||||||||
Income per common share – assuming dilution | $ | 6.57 | $ | 3.88 | $ | 5.61 | 69 | % | (31 | )% | ||||||||||||
(A) Refer to “Non-GAAP Measures” in this discussion and analysis for a reconciliation to the comparable GAAP financial measure.
Summary of 2016
Net sales in 2016 increased 37 percent, driven by the Big Heart acquisition. Approximately 11 months of incremental Big Heart net sales, totaling $2.1 billion, was realized in 2016. Operating income increased 48 percent, driven by the incremental Big Heart business, partially offset by an increase in merger and integration costs. Operating income excluding certain items affecting comparability (“non-GAAP operating income”) increased 49 percent. Net income per diluted share increased 73 percent in 2016, while non-GAAP income per diluted share increased 69 percent. In comparison to the prior year, both 2016 per share measures reflect a benefit from the one-time recognition in 2015 of $173.3 of other debt costs incurred in connection with the Big Heart acquisition and the related refinancing activities, a decrease in our effective tax rate in 2016, and the gain on the divestiture of the U.S. canned milk business. These items were mostly offset by the impact of the issuance of 17.9 million shares of our common stock and an increase in interest expense due to new borrowings in the fourth quarter of 2015 to finance the Big Heart acquisition. For additional information on the change in our effective tax rate, see the “Income Taxes” section of this discussion and analysis.
Summary of 2015
Net sales in 2015 increased 1 percent, reflecting the contribution from acquisitions, partially offset by unfavorable volume/mix in the U.S. Retail Coffee segment. Operating income decreased
16 percent, reflecting the impact of a $47.0 fair value purchase accounting adjustment to acquired Big Heart inventory and Big Heart integration costs of $36.0. Non-GAAP operating income decreased 9 percent over the same period. Net income per diluted share decreased 39 percent in 2015, while non-GAAP income per diluted share decreased 31 percent. The significant decreases from the prior year resulted from the recognition of $173.3 of other debt costs incurred in 2015 in connection with the Big Heart acquisition and the related refinancing activities, as well as the decrease in operating income.
2016 ANNUAL REPORT 25
MANAGEMENT’S DISCUSSION AND ANALYSIS
The J. M. Smucker Company
Net Sales
2016 Compared to 2015
Year Ended April 30, | ||||||||||||||
2016 | 2015 | Increase (Decrease) | % | |||||||||||
Net sales | $ | 7,811.2 | $ | 5,692.7 | $ | 2,118.5 | 37 | % | ||||||
Acquisitions | (2,067.2 | ) | — | (2,067.2 | ) | (36 | ) | |||||||
Divestiture | — | (47.6 | ) | 47.6 | 1 | |||||||||
Foreign currency exchange | 59.8 | — | 59.8 | 1 | ||||||||||
Net sales excluding acquisitions, divestiture, and foreign currency exchange (A) | $ | 5,803.8 | $ | 5,645.1 | $ | 158.7 | 3 | % | ||||||
Amounts may not add due to rounding.
(A) | Net sales excluding acquisitions, divestiture, and foreign currency exchange is a non-GAAP measure used in evaluating performance internally. This measure provides useful information to investors because it enables comparison of results on a year-over-year basis. Net sales excluding acquisitions, divestiture, and foreign currency exchange in the table above excludes the incremental impact of the Big Heart and Sahale acquisitions, the U.S. canned milk divestiture, and foreign currency exchange. |
The net sales increase in 2016 was driven by incremental Big Heart net sales of $2.1 billion in the current year. Net sales excluding acquisitions, divestiture, and foreign currency exchange increased 3 percent, primarily due to favorable volume/mix, which contributed 4 percentage points to the net sales increase. The favorable volume/mix was driven by Dunkin’ Donuts K-Cup® pods, which were introduced at the beginning of 2016. Net price realization was lower, contributing a 1 percentage point decline to the net sales change, driven mainly by Folgers, Jif, Crisco, and Pillsbury.
2015 Compared to 2014
Year Ended April 30, | ||||||||||||||
2015 | 2014 | Increase (Decrease) | % | |||||||||||
Net sales | $ | 5,692.7 | $ | 5,610.6 | $ | 82.1 | 1 | % | ||||||
Acquisitions | (295.0 | ) | — | (295.0 | ) | (5 | ) | |||||||
Distribution agreement | (6.1 | ) | — | (6.1 | ) | — | ||||||||
Foreign currency exchange | 35.0 | — | 35.0 | 1 | ||||||||||
Net sales excluding acquisitions, distribution agreement, and foreign currency exchange (A) | $ | 5,426.6 | $ | 5,610.6 | $ | (184.0 | ) | (3 | )% | |||||
Amounts may not add due to rounding.
(A) | Net sales excluding acquisitions, distribution agreement, and foreign currency exchange is a non-GAAP measure used in evaluating performance internally. This measure provides useful information to investors because it enables comparison of results on a year-over-year basis. Net sales excluding acquisitions, distribution agreement, and |
foreign currency exchange in the table above excludes the impact of the Big Heart and Sahale acquisitions, the incremental impact of the Enray acquisition and the Cumberland distribution agreement, and foreign currency exchange.
The net sales increase in 2015 reflected a $295.0 contribution from acquisitions, primarily the Big Heart contribution of $244.5. Excluding the impact of acquisitions, the distribution agreement, and foreign currency exchange, net sales decreased 3 percent, primarily due to unfavorable volume/mix in the U.S. Retail Coffee segment driven by the Folgers brand and the impact of the private-label foodservice hot beverage business exits. The impact of net price realization was essentially neutral as lower net price realization on the Jif and Crisco brands mostly offset higher net price realization on the Folgers brand.
Operating Income
The following table presents the components of operating income as a percentage of net sales.
Year Ended April 30, | ||||||||
2016 | 2015 | 2014 | ||||||
Gross profit | 38.0 | % | 34.6 | % | 36.2 | % | ||
Selling, distribution, and administrative expenses: | ||||||||
Marketing | 3.5 | % | 3.1 | % | 3.0 | % | ||
Advertising | 2.2 | 1.9 | 2.2 | |||||
Selling | 4.0 | 3.7 | 3.6 | |||||
Distribution | 2.9 | 2.9 | 2.8 | |||||
General and administrative | 6.7 | 6.6 | 6.0 | |||||
Total selling, distribution, and administrative expenses | 19.3 | % | 18.1 | % | 17.6 | % | ||
Amortization | 2.7 | 1.9 | 1.8 | |||||
Other special project costs | 1.7 | 1.0 | 0.5 | |||||
Other operating income – net | (0.4 | ) | — | — | ||||
Operating income | 14.7 | % | 13.6 | % | 16.4 | % | ||
Amounts may not add due to rounding.
2016 Compared to 2015
Gross profit increased $999.1, or 51 percent, in 2016, primarily due to the incremental Big Heart business. Excluding the incremental Big Heart business, gross profit was still higher, driven by Dunkin’ Donuts K-Cup® pods and the net benefit of a reduction in commodity costs, primarily attributed to green coffee, which was partially offset by lower net pricing. Non-GAAP gross profit increased $968.6, or 48 percent, over the same period and excluded a $36.5 favorable change in the impact of unallocated derivative gains and losses as compared to the prior year.
Selling, distribution, and administrative (“SD&A”) expenses increased $479.0, or 46 percent, in 2016, primarily driven by the incremental Big Heart business and higher selling expense due to royalties related to Dunkin’ Donuts K-Cup® pods. Big Heart SD&A expenses represented a higher percentage of net sales in 2016 than the remainder of the business.
Amortization expense increased $97.5 in 2016, primarily due to the addition of Big Heart finite-lived intangible assets.
26 THE J. M.SMUCKER COMPANY
MANAGEMENT’S DISCUSSION AND ANALYSIS
The J. M. Smucker Company
Operating income increased $373.3, or 48 percent, in 2016, reflecting the incremental Big Heart business and the $25.3 gain on the divestiture of the U.S. canned milk business, partially offset by an increase in Big Heart integration costs of $109.2. Non-GAAP operating income increased $422.1, or 49 percent, over the same period, and excluded the impact of merger and integration costs and the $36.5 favorable change in the impact of unallocated derivative gains and losses as compared to the prior year.
2015 Compared to 2014
Gross profit decreased $62.3, or 3 percent, in 2015, driven by unfavorable volume/mix and the impact of higher costs, which were not fully offset by higher net price realization. Higher green coffee costs in 2015 were not fully recovered by higher net price realization. This unfavorable net impact was partially offset by lower peanut costs in 2015, which were not fully offset by lower net prices. The Big Heart business contributed $46.1 to gross profit in 2015, which included the one-time unfavorable impact of a fair value purchase accounting adjustment to acquired inventory that increased costs of products sold by $47.0. Non-GAAP gross profit decreased $35.7, or 2 percent, over the same period and excluded a $29.8 unfavorable change in the impact of unallocated derivative gains and losses as compared to the prior year.
SD&A expenses increased $42.5, or 4 percent, in 2015, driven by the addition of Big Heart, partially offset by a decrease in marketing expense, mainly in the U.S. Retail Coffee segment.
Amortization expense increased $12.0, or 12 percent, in 2015, primarily due to the addition of Big Heart finite-lived intangible assets during the fourth quarter.
Operating income decreased $147.0, or 16 percent, in 2015, reflecting Big Heart integration costs of $36.0 in 2015. Non-GAAP operating income decreased $89.4, or 9 percent.
Interest Expense and Other Debt Costs
Net interest expense increased $91.2 in 2016, primarily due to the impact of the incremental interest related to the debt issued to partially finance the Big Heart acquisition.
Net interest expense was essentially flat in 2015, as the impact of incremental interest related to the debt issued to partially finance the Big Heart acquisition was offset by the impact of long-term debt repayments made during 2015. In addition to interest expense, we incurred $173.3 of other debt costs during 2015 related to the Big Heart acquisition. The majority of these costs were make-whole payments incurred when we prepaid our outstanding privately placed Senior Notes of $1.1 billion.
Income Taxes
Income taxes increased 62 percent in 2016, due to an 87 percent increase in income before income taxes, partially offset by a lower effective tax rate in 2016. The effective tax rate of 29.6 percent in 2016 was significantly lower than the rate of 34.1 percent in 2015, mainly due to the recognition in the fourth quarter of a $50.5 noncash deferred tax benefit related to the integration of Big Heart into the Company.
Income taxes decreased 37 percent in 2015, primarily as a result of a 38 percent reduction in income before income taxes. The effective tax rate of 34.1 percent in 2015 was slightly higher than the rate in 2014.
Commodities Overview
The raw materials we use are primarily commodities, agricultural-based products, and packaging materials. The most significant of these materials, based on annual spend, are green coffee, grains, plastic, peanuts, and edible oils. Green coffee, certain grains, and certain edible oils are traded on active regulated exchanges, and the price of these commodities fluctuates based on market conditions. Derivative instruments, including futures and options, are used to minimize the impact of price volatility for these commodities.
We source green coffee from more than 20 coffee-producing countries. Its price is subject to high volatility due to factors such as weather, global supply and demand, pest damage, investor speculation, and political and economic conditions in the source countries.
We source grains, peanuts, and edible oils mainly from North America. The grains we purchase are mainly wheat and corn. We are one of the largest procurers of peanuts in the U.S. and frequently enter into long-term purchase contracts for various periods of time to mitigate the risk of a shortage of this commodity. The edible oils we purchase are mainly soybean and canola. The price of grains, peanuts, and edible oils are driven primarily by weather, which impacts crop sizes and yield, as well as global demand, especially from large importing countries such as China and India. In addition, the prices of edible oils and certain grains, such as corn, have been impacted by the biofuels industry’s demand for these commodities.
We frequently enter into long-term contracts to purchase plastic packaging, which is sourced mainly from within the U.S. Plastic resin is made from petrochemical feedstock and natural gas feedstock, and the price can be influenced by feedstock, energy, and crude oil prices, as well as global economic conditions.
In 2016, our overall commodity costs were lower than in 2015, primarily due to lower costs for green coffee, milk, oils, and peanuts.
Restructuring
During the fourth quarter of 2016, an organization optimization program was approved as part of our ongoing efforts to reduce costs, integrate, and optimize the combined organization subsequent to the Big Heart acquisition. As previously noted, we anticipate synergies related to the Big Heart acquisition to result in net realized savings of approximately $200.0 annually by the end of 2018. In addition, we anticipate approximately $50.0 of incremental cost savings to be recognized over the next few years.
Total restructuring costs related to the organization optimization program are anticipated to be approximately $40.0, primarily consisting of employee-related, site preparation, equipment relocation, and production start-up costs. In addition, we expect to
2016 ANNUAL REPORT 27
MANAGEMENT’S DISCUSSION AND ANALYSIS
The J. M. Smucker Company
invest approximately $15.0 to $17.0 in capital expenditures. The expense incurred in 2016 was not material. The remaining costs are anticipated to be recognized through 2018, with the majority of the costs expected to be recognized in 2017. Upon completion, the restructuring plan will result in a reduction of approximately
125 full-time positions.
As part of this program, we will discontinue the production of coffee at our Harahan, Louisiana, facility and consolidate all roast and ground coffee production into one of our facilities in New Orleans, Louisiana, which we expect to complete by December 2017. Additionally, we will exit two leased facilities in Livermore, California, and consolidate all ancient grains and pasta production into our facility in Chico, California, which we expect to complete by January 2017.
Segment Results
Effective May 1, 2015, our reportable segments were modified to align with the way performance is currently evaluated by our segment management and chief operating decision maker, our Chief Executive Officer, and the way in which we currently report information internally. We now have three reportable segments: U.S. Retail Coffee, U.S. Retail Consumer Foods, and U.S. Retail
Pet Foods. Within our segment results, International and Foodservice represents a combination of the strategic business areas not included in the U.S. retail market segments. The U.S.
Retail Consumer Foods segment is a combination of the former U.S. Retail Consumer Foods segment and the Natural Foods strategic business area, previously included in the former International, Foodservice, and Natural Foods segment. Prior year segment results have been modified to reflect the realignment of our segments.
The U.S. Retail Coffee segment primarily includes the domestic sales of Folgers, Dunkin’ Donuts, and Café Bustelo branded coffee; the U.S. Retail Consumer Foods segment primarily includes domestic sales of Jif, Smucker’s, Crisco, and Pillsbury branded products; and the U.S. Retail Pet Foods segment primarily includes domestic sales of Meow Mix, Milk-Bone, Natural Balance,
Kibbles ’n Bits, 9Lives, Pup-Peroni®, Nature’s Recipe®, and Gravy Train® branded products. International and Foodservice is comprised of products distributed domestically and in foreign countries through retail channels and foodservice distributors and operators (e.g., restaurants, lodging, schools and universities, health care operators).
Year Ended April 30, | |||||||||||||||||||||||
2016 | 2015 | 2014 | 2016 % Increase (Decrease) | 2015 % Increase (Decrease) | |||||||||||||||||||
Net sales: | |||||||||||||||||||||||
U.S. Retail Coffee | $ | 2,239.2 | $ | 2,076.1 | $ | 2,161.7 | 8 | % | (4 | )% | |||||||||||||
U.S. Retail Consumer Foods | 2,269.7 | 2,330.8 | 2,379.9 | (3 | ) | (2 | ) | ||||||||||||||||
U.S. Retail Pet Foods | 2,250.4 | 239.1 | — | n/m | n/a | ||||||||||||||||||
International and Foodservice | 1,051.9 | 1,046.7 | 1,069.0 | — | (2 | ) | |||||||||||||||||
Segment profit (loss): | |||||||||||||||||||||||
U.S. Retail Coffee | $ | 645.9 | $ | 549.2 | $ | 639.8 | 18 | % | (14 | )% | |||||||||||||
U.S. Retail Consumer Foods | 459.9 | 459.2 | 420.1 | — | 9 | ||||||||||||||||||
U.S. Retail Pet Foods | 392.0 | (15.3 | ) | — | n/m | n/a | |||||||||||||||||
International and Foodservice | 156.8 | 140.4 | 140.7 | 12 | — | ||||||||||||||||||
Segment profit (loss) margin: | |||||||||||||||||||||||
U.S. Retail Coffee | 28.8 | % | 26.5 | % | 29.6 | % | |||||||||||||||||
U.S. Retail Consumer Foods | 20.3 | 19.7 | 17.7 | ||||||||||||||||||||
U.S. Retail Pet Foods | 17.4 | (6.4 | ) | — | |||||||||||||||||||
International and Foodservice | 14.9 | 13.4 | 13.2 | ||||||||||||||||||||
U.S. Retail Coffee
The U.S. Retail Coffee segment net sales increased 8 percent in 2016, reflecting favorable volume/mix, which contributed
9 percentage points of growth, driven by Dunkin’ Donuts K-Cup® pods. Within the Folgers brand, growth in mainstream roast and ground offerings was offset by a decline in Folgers K-Cup® pods. Segment profit increased $96.7, reflecting the benefit of lower green coffee costs, which was partially offset by lower net price realization, and the contribution from Dunkin’ Donuts K-Cup® pods.
In May 2016, in response to sustained declines in green coffee costs, we announced a 6 percent list price decrease for the majority of our packaged coffee products sold in the U.S., excluding
K-Cup® pods.
The U.S. Retail Coffee segment net sales decreased 4 percent in 2015, driven by unfavorable volume/mix, which contributed
7 percentage points to the net sales decline, primarily due to an
11 percent volume decrease in the Folgers brand. The impact of the unfavorable volume/mix was partially offset by favorable net price realization. The benefit of list price increases taken in 2015 was partially offset by the impact of an increase in promotional spending during the year. Segment profit decreased $90.6 in 2015, primarily due to the impact of the unfavorable volume/mix and the unfavorable impact of higher costs, which were not fully recovered by higher net price realization, driven by K-Cup® pods profitability. A decrease in marketing expense contributed favorably to segment profit in 2015.
28 THE J. M.SMUCKER COMPANY
MANAGEMENT’S DISCUSSION AND ANALYSIS
The J. M. Smucker Company
U.S. Retail Consumer Foods
The U.S. Retail Consumer Foods segment net sales decreased
3 percent in 2016, primarily due to lower net price realization and the impact of $41.0 of noncomparable net sales in the prior year related to the divested U.S. canned milk business, slightly offset by favorable volume/mix. The lower net price realization was primarily related to the Jif, Crisco, and Pillsbury brands. The favorable volume/mix, which contributed 1 percentage point of growth to segment net sales, was led by Smucker’s Uncrustables® frozen sandwiches and Jif peanut butter, slightly offset by Pillsbury baking mixes and frosting. Volume for Smucker’s Uncrustables increased 26 percent. Segment profit was flat in 2016, compared to 2015, as overall lower commodity costs, primarily for milk, oils, and peanuts, and the $25.3 gain on the divestiture of the U.S. canned milk business were offset by lower net price realization and higher manufacturing overhead costs.
Net sales for the U.S. Retail Consumer Foods segment decreased
2 percent in 2015, reflecting lower net price realization, primarily for the Jif and Crisco brands, and unfavorable volume/mix, which contributed 1 percentage point to the net sales decline, partially offset by a $49.7 combined contribution from the Sahale business and the incremental impact of the Enray acquisition. Smucker’s Uncrustables frozen sandwiches volume increased 17 percent, while volume for the Pillsbury brand decreased 5 percent, and was the primary contributor to the unfavorable volume/mix for the segment. Segment profit increased $39.1 in 2015, driven by lower commodity costs, primarily for peanuts and oils, which were not entirely offset by lower net price realization.
U.S. Retail Pet Foods
The U.S. Retail Pet Foods segment contributed net sales of
$2.3 billion in 2016, representing low single-digit percent growth compared to the results of the business for the prior year, the majority of which were reported under previous ownership. The net sales increase was driven by distribution gains for the Natural Balance brand and growth in Milk-Bone dog snacks, which more than offset declines in Kibbles’n Bits dry dog food and Meow Mix cat food. The segment contributed profit of $392.0 in 2016, impacted by lower commodity costs and favorable volume/mix as compared to the prior year, partially offset by lower net price realization, reflecting incremental promotional activities.
The U.S. Retail Pet Foods segment had net sales of $239.1 and a segment loss of $15.3 for 2015, representing the six weeks of operations following the close of the acquisition. The segment loss reflected the one-time unfavorable impact of a fair value purchase accounting adjustment to acquired inventory, which increased cost of products sold for the segment. Incremental promotional spending and marketing expense to support new product introductions and certain other initiatives also reduced segment profit.
International and Foodservice
International and Foodservice net sales were flat in 2016, compared to 2015, as incremental Big Heart net sales of $36.9 and favorable volume/mix, which contributed 3 percentage points of growth to net sales, were mostly offset by the $59.8 unfavorable impact of foreign currency exchange. Segment profit increased $16.4, reflecting favorable volume/mix in Foodservice, which was
partially offset by the unfavorable net impact of lower prices and lower costs. In Canada, the benefit of higher net price realization, decreased marketing expense, and favorable volume/mix offset the impact of a weaker Canadian dollar compared to a year ago. We expect the impact of foreign currency exchange to remain unfavorable into next fiscal year.
Net sales for International and Foodservice decreased 2 percent in 2015. Excluding the impact of acquisitions, the incremental impact of Cumberland, and foreign currency exchange, net sales was flat, compared to 2014. Unfavorable volume/mix, which contributed
1 percentage point to the net sales change, reflected the impact of the planned exit of our private label foodservice hot beverage business and decreases in the Robin Hood and Five Roses® brands. Segment profit was flat in 2015, compared to 2014, impacted by the realization of higher costs in Canada, which were attributed to sourcing certain products from the U.S., reflecting the impact of a weaker Canadian dollar compared to 2014, and an increase in green coffee costs. The impact of higher costs and the volume decline were mostly offset by favorable mix in the foodservice business.
FINANCIAL CONDITION
Liquidity
Our principal source of funds is cash generated from operations, supplemented by borrowings against our commercial paper program and revolving credit facility. Total cash and cash equivalents decreased to $109.8 at April 30, 2016, compared to $125.6 at April 30, 2015.
We have historically expected a significant use of cash to fund working capital requirements during the first half of each fiscal year, primarily due to the buildup of inventories to support the Fall Bake and Holiday period, the additional increase of coffee inventory in advance of the Atlantic hurricane season, and seasonal fruit procurement. We expected cash provided by operations in the second half of the fiscal year to significantly exceed the amount in the first half of the year, upon completion of the Fall Bake and Holiday period. Although we still expect an inventory buildup during the first half of the fiscal year within the U.S. Retail Coffee and U.S. Retail Consumer Foods businesses for the reasons noted above, our working capital requirements have become less seasonal overall with the addition of the pet food business. Total cash provided by operating activities in the second half of 2016 was $877.8, as compared to $580.5 provided through the first half of the year.
2016 ANNUAL REPORT 29
MANAGEMENT’S DISCUSSION AND ANALYSIS
The J. M. Smucker Company
The following table presents selected cash flow information.
Year Ended April 30, | |||||||||||
2016 | 2015 | 2014 | |||||||||
Net cash provided by operating activities | $ | 1,458.3 | $ | 733.2 | $ | 856.0 | |||||
Net cash provided by (used for) investing activities | 21.7 | (1,595.7 | ) | (370.3 | ) | ||||||
Net cash (used for) provided by financing activities | (1,496.2 | ) | 863.2 | (575.5 | ) | ||||||
Net cash provided by operating activities | $ | 1,458.3 | $ | 733.2 | $ | 856.0 | |||||
Additions to property, plant, and equipment | (201.4 | ) | (247.7 | ) | (279.5 | ) | |||||
Free cash flow (A) | $ | 1,256.9 | $ | 485.5 | $ | 576.5 | |||||
(A) | Free cash flow is a non-GAAP measure used by management to evaluate the amount of cash available for debt repayment, dividend distribution, acquisition opportunities, share repurchases, and other corporate purposes. |
Cash provided by operating activities increased $725.1 in 2016, mainly due to an increase in net income adjusted for noncash items, notably depreciation and amortization, and a decrease in working capital, driven by a decrease in inventory and the timing of certain accrued liabilities. During 2016, we established a working capital reduction target of $200.0, the majority of which was achieved in 2016. The remainder is expected to be achieved by the end of 2017. This initiative, as well as the impact of lower green coffee costs, drove the reduction in inventory during 2016.
Cash provided by operating activities decreased $122.8 in 2015, primarily due to reduced net income in 2015, as well as a greater amount of cash required to fund working capital, driven by the payment in the fourth quarter of 2015 of liabilities assumed as part of the Big Heart acquisition.
Cash provided by investing activities in 2016 consisted primarily of $193.7 in proceeds from the divestiture of the U.S. canned milk business and a $34.8 reduction in our derivative cash margin account balances during 2016, mostly offset by $201.4 in capital expenditures. In 2015, cash used for investing activities consisted primarily of $1.3 billion related to the acquisitions of Big Heart and Sahale and $247.7 in capital expenditures. In 2014, cash used for investing activities consisted primarily of $279.5 in capital expenditures and $101.8 related to the acquisitions of Enray and Silocaf of New Orleans, Inc.
Cash used for financing activities in 2016 consisted primarily of $800.0 in repayments on our $1.8 billion Term Loan (as hereinafter defined), the purchase of treasury shares for $441.1, mainly representing the repurchase of 3.4 million common shares available under Board of Directors’ authorizations, and dividend payments of $316.6. Cash provided by financing activities during 2015 consisted primarily of $5.4 billion in long-term debt proceeds, which were partially offset by $4.2 billion in long-term debt repayments and dividend payments of $254.0. New borrowings in 2015 were comprised of the $1.8 billion Term Loan and $3.7 billion in Senior Notes. Long-term debt repayments in 2015 were comprised of the $2.6 billion repayment of the Big
Heart debt assumed, the $1.1 billion prepayment of our outstanding privately placed Senior Notes and the related make-whole payments, the $200.0 prepayment on the $1.8 billion Term Loan, and the $100.0 scheduled repayment of certain Senior Notes. Cash used for financing activities during 2014 consisted primarily of the purchase of treasury shares for $508.5, mainly representing the repurchase of 4.9 million common shares available under a Board of Directors’ authorization, dividend payments of $238.0, and a Senior Notes principal payment of $50.0, partially offset by $248.4 of borrowings under our revolving credit facility.
Capital Resources
The following table presents our capital structure.
April 30, | |||||||
2016 | 2015 | ||||||
Short-term borrowings | $ | 284.0 | $ | 226.0 | |||
Long-term debt, less current portion | 5,146.0 | 5,944.9 | |||||
Total debt | $ | 5,430.0 | $ | 6,170.9 | |||
Shareholders’ equity | 7,008.5 | 7,086.9 | |||||
Total capital | $ | 12,438.5 | $ | 13,257.8 | |||
In March 2015, we entered into a senior unsecured delayed-draw Term Loan Credit Agreement (“Term Loan”) with a syndicate of banks and an available commitment amount of $1.8 billion. The weighted-average interest rate on the Term Loan at April 30, 2016, was 1.69 percent. The Term Loan requires quarterly amortization payments of 2.50 percent of the original principal amount starting in the third quarter of 2016. Voluntary prepayments are permitted without premium or penalty and are applied to the schedule of required quarterly minimum payment obligations in direct order of maturity. As of April 30, 2016, we have prepaid $1.0 billion on the Term Loan to date, including $800.0 in 2016, and therefore no additional payments are required until final maturity of the loan agreement on March 23, 2020.
Also in March 2015, we completed an offering of $3.7 billion in Senior Notes due beginning March 15, 2018 through March 15, 2045. The proceeds from the offering, along with the Term Loan, were used to partially finance the Big Heart acquisition, pay off the debt assumed as part of the Big Heart acquisition, and prepay our privately placed Senior Notes.
We have available a $1.5 billion revolving credit facility with a group of 11 banks that matures in September 2018. Additionally, under our commercial paper program, we can issue short-term, unsecured commercial paper not to exceed $1.0 billion at any time. The commercial paper program is backed by our revolving credit facility and reduces what we can borrow under the revolving credit facility by the amount of commercial paper outstanding. Along with the revolving credit facility, commercial paper is used as a continuing source of short-term financing for general corporate purposes. As of April 30, 2016, we had $284.0 of short-term borrowings outstanding, all of which were issued under our commercial paper program, at a weighted-average interest rate of 0.65 percent.
During 2016, we reduced total debt by $740.9, driven by the $800.0 prepayment on the Term Loan, partially offset by an
30 THE J. M.SMUCKER COMPANY
MANAGEMENT’S DISCUSSION AND ANALYSIS
The J. M. Smucker Company
increase in short-term borrowings outstanding. We intend to continue our focus on debt repayment in the near term. Reducing our leverage will provide the flexibility to consider other strategic uses of cash, including acquisition opportunities and share repurchases.
We are in compliance with all of our debt covenants. For additional information on our new borrowings, sources of liquidity, and debt covenants, see Note 8: Debt and Financing Arrangements.
On March 31, 2016, we entered into a 10b5-1 trading plan (“the Plan”) to facilitate the repurchase of 2.0 million common shares under the Board of Directors’ authorizations. Purchases under the Plan commenced on April 1, 2016, and concluded on April 30, 2016, and were transacted by a broker based upon the guidelines and parameters of the Plan. During 2016, we repurchased a total of 3.4 million shares, including 2.0 million shares under the Plan, for $437.8. At April 30, 2016, approximately 6.6 million common shares were available for repurchase under the Board of Directors’ authorizations. There is no guarantee as to the exact number of shares that may be repurchased or when such purchases may occur.
The following table presents certain cash requirements related to 2017 financing and investing activities. Although no principal payments are required on our debt obligations in 2017 due to the $1.0 billion prepayment to date on the $1.8 billion Term Loan, we intend to utilize a portion of cash provided by operations for further debt repayment as noted above. Additionally, in 2018, a portion of our Senior Notes will mature and a $500.0 principal payment will be required at that time.
Projection Year Ending April 30, 2017 | ||||
Dividend payments – based on current rates and common shares outstanding | $ | 310.0 | ||
Capital expenditures | 240.0 | |||
Interest payments – based on current interest rate outlook | 160.0 | |||
Absent any further acquisitions or other significant investments, we believe that cash on hand, combined with cash provided by operations and borrowings available under our commercial paper program and revolving credit facility, will be sufficient to meet cash requirements for the next 12 months. As of April 30, 2016, total cash and cash equivalents of $99.4 was held by our international subsidiaries. We do not intend to repatriate these funds to meet these cash requirements. Should we repatriate these funds, we will be required to provide taxes based on the applicable U.S. tax rates, net of any foreign tax credit consideration.
NON-GAAP MEASURES
We use non-GAAP financial measures including: net sales excluding acquisitions, divestiture, distribution agreement, and foreign currency exchange; non-GAAP gross profit, operating income, income, income per diluted share; earnings before interest, taxes, depreciation, and amortization; and free cash flow, as key measures for purposes of evaluating performance internally. In addition, non-GAAP income per diluted share and free cash flow are used as components of the Board of Directors’ measurement of performance for incentive compensation purposes. We believe that these measures provide useful information to investors because they are the measures we use to evaluate performance on a comparable year-over-year basis. Non-GAAP measures exclude certain items affecting comparability, which include merger and integration and restructuring costs (“special project costs”) and unallocated gains and losses on commodity and foreign currency exchange derivatives (“unallocated derivative gains and losses”). The special project costs relate to specific merger and integration and restructuring projects that are each nonrecurring in nature and can significantly affect the year-over-year assessment of operating results. Unallocated derivative gains and losses reflect the changes in fair value of our commodity and foreign currency exchange contracts and affect comparability on a year-over-year basis. These non-GAAP financial measures are not intended to replace the presentation of financial results in accordance with U.S. generally accepted accounting principles (“GAAP”). Rather, the presentation of these non-GAAP financial measures supplements other metrics we use to internally evaluate our businesses and facilitate the comparison of past and present operations and liquidity. These non-GAAP financial measures may not be comparable to similar measures used by other companies and may exclude certain nondiscretionary expenses and cash payments.
2016 ANNUAL REPORT 31
MANAGEMENT’S DISCUSSION AND ANALYSIS
The J. M. Smucker Company
The following table reconciles certain non-GAAP financial measures to the comparable GAAP financial measure. See page 26 for a reconciliation of net sales adjusted for certain noncomparable items to the comparable GAAP financial measure.
Year Ended April 30, | ||||||||||||||||||||
2016 | 2015 | 2014 | 2013 | 2012 | ||||||||||||||||
Gross profit reconciliation: | ||||||||||||||||||||
Gross profit | $ | 2,967.8 | $ | 1,968.7 | $ | 2,031.0 | $ | 2,027.6 | $ | 1,845.2 | ||||||||||
Unallocated derivative (gains) losses | (12.0 | ) | 24.5 | (5.3 | ) | (6.6 | ) | 8.5 | ||||||||||||
Cost of products sold – special project costs | 12.2 | 6.2 | 9.4 | 11.5 | 43.2 | |||||||||||||||
Non-GAAP gross profit | $ | 2,968.0 | $ | 1,999.4 | $ | 2,035.1 | $ | 2,032.5 | $ | 1,896.9 | ||||||||||
Operating income reconciliation: | ||||||||||||||||||||
Operating income | $ | 1,145.3 | $ | 772.0 | $ | 919.0 | $ | 910.4 | $ | 778.3 | ||||||||||
Unallocated derivative (gains) losses | (12.0 | ) | 24.5 | (5.3 | ) | (6.6 | ) | 8.5 | ||||||||||||
Cost of products sold – special project costs | 12.2 | 6.2 | 9.4 | 11.5 | 43.2 | |||||||||||||||
Other special project costs | 135.9 | 56.6 | 25.6 | 49.5 | 72.5 | |||||||||||||||
Non-GAAP operating income | $ | 1,281.4 | $ | 859.3 | $ | 948.7 | $ | 964.8 | $ | 902.5 | ||||||||||
Net income reconciliation: | ||||||||||||||||||||
Net income | $ | 688.7 | $ | 344.9 | $ | 565.2 | $ | 544.2 | $ | 459.7 | ||||||||||
Income taxes | 289.2 | 178.1 | 284.5 | 273.1 | 241.5 | |||||||||||||||
Unallocated derivative (gains) losses | (12.0 | ) | 24.5 | (5.3 | ) | (6.6 | ) | 8.5 | ||||||||||||
Cost of products sold – special project costs | 12.2 | 6.2 | 9.4 | 11.5 | 43.2 | |||||||||||||||
Other special project costs | 135.9 | 56.6 | 25.6 | 49.5 | 72.5 | |||||||||||||||
Non-GAAP income before income taxes | $ | 1,114.0 | $ | 610.3 | $ | 879.4 | $ | 871.7 | $ | 825.4 | ||||||||||
Income taxes, as adjusted (A) | 329.4 | 207.8 | 294.5 | 291.3 | 284.2 | |||||||||||||||
Non-GAAP income | $ | 784.6 | $ | 402.5 | $ | 584.9 | $ | 580.4 | $ | 541.2 | ||||||||||
Weighted-average shares – assuming dilution | 119,477,312 | 103,697,261 | 104,346,587 | 108,851,153 | 113,313,567 | |||||||||||||||
Non-GAAP income per common share – assuming dilution | $ | 6.57 | $ | 3.88 | $ | 5.61 | $ | 5.33 | $ | 4.78 | ||||||||||
Reconciliation to net income: | ||||||||||||||||||||
Net income | $ | 688.7 | $ | 344.9 | $ | 565.2 | $ | 544.2 | $ | 459.7 | ||||||||||
Income taxes | 289.2 | 178.1 | 284.5 | 273.1 | 241.5 | |||||||||||||||
Interest expense – net | 171.1 | 79.9 | 79.4 | 93.4 | 79.8 | |||||||||||||||
Depreciation | 221.7 | 157.5 | 157.5 | 154.1 | 158.9 | |||||||||||||||
Amortization | 208.4 | 110.9 | 98.9 | 96.8 | 88.1 | |||||||||||||||
Earnings before interest, taxes, depreciation, and amortization | $ | 1,579.1 | $ | 871.3 | $ | 1,185.5 | $ | 1,161.6 | $ | 1,028.0 | ||||||||||
Free cash flow: | ||||||||||||||||||||
Net cash provided by operating activities | $ | 1,458.3 | $ | 733.2 | $ | 856.0 | $ | 855.8 | $ | 730.9 | ||||||||||
Additions to property, plant, and equipment | (201.4 | ) | (247.7 | ) | (279.5 | ) | (206.5 | ) | (274.2 | ) | ||||||||||
Free cash flow | $ | 1,256.9 | $ | 485.5 | $ | 576.5 | $ | 649.3 | $ | 456.7 | ||||||||||
(A) Income taxes, as adjusted is based upon our GAAP effective tax rate and reflects the impact of items excluded from GAAP net income to derive
non-GAAP income.
OFF-BALANCE SHEET ARRANGEMENTS
We do not have material off-balance sheet arrangements, financings, or other relationships with unconsolidated entities or other persons, also known as variable interest entities. Transactions with related parties are in the ordinary course of business, and are not material to our results of operations, financial condition, or cash flows.
32 THE J. M.SMUCKER COMPANY
MANAGEMENT’S DISCUSSION AND ANALYSIS
The J. M. Smucker Company
CONTRACTUAL OBLIGATIONS
The following table summarizes our contractual obligations by fiscal year at April 30, 2016.
Total | 2017 | 2018–2019 | 2020–2021 | 2022 and beyond | |||||||||||||||
Long-term debt obligations, including current portion (A) | $ | 5,150.0 | $ | — | $ | 500.0 | $ | 1,250.0 | $ | 3,400.0 | |||||||||
Interest payments (B) | 1,956.2 | 163.9 | 325.4 | 285.0 | 1,181.9 | ||||||||||||||
Operating lease obligations (C) | 200.7 | 39.4 | 68.0 | 46.4 | 46.9 | ||||||||||||||
Purchase obligations (D) | 1,223.2 | 940.8 | 282.1 | 0.3 | — | ||||||||||||||
Other liabilities (E) | 346.5 | 31.6 | 35.1 | 15.6 | 264.2 | ||||||||||||||
Total | $ | 8,876.6 | $ | 1,175.7 | $ | 1,210.6 | $ | 1,597.3 | $ | 4,893.0 | |||||||||
(A) | Excludes the impact of offering discounts, make-whole payments, and debt issuance costs. |
(B) | Includes interest payments on our long-term debt, which reflects estimated payments for our variable-rate debt based on the current interest rate outlook. |
(C) | Includes the minimum rental commitments under non-cancelable operating leases. |
(D) | Includes agreements that are enforceable and legally bind us to purchase goods or services, including certain obligations related to normal, ongoing purchase obligations in which we have guaranteed payment to ensure availability of raw materials, packaging supplies, and co-pack arrangements. We expect to receive consideration for these purchase obligations in the form of materials and services. These purchase obligations do not represent the entire anticipated purchases in the future, but represent only those items for which we are contractually obligated. |
(E) | Mainly consists of projected commitments associated with our defined benefit pension and other postretirement benefit plans. The liability for unrecognized tax benefits and tax-related net interest of $44.4 under Financial Accounting Standards Board Accounting Standards Codification 740, Income Taxes, is excluded, since we are unable to reasonably estimate the timing of cash settlements with the respective taxing authorities. |
CRITICAL ACCOUNTING ESTIMATES AND POLICIES
The preparation of financial statements in conformity with U.S. GAAP requires that we make estimates and assumptions that in certain circumstances affect amounts reported in the accompanying consolidated financial statements. In preparing these financial statements, we have made our best estimates and judgments of certain amounts included in the financial statements, giving due consideration to materiality. We do not believe there is a great likelihood that materially different amounts would be reported under different conditions or using different assumptions related to the accounting policies described below. However, application of these accounting policies involves the exercise of judgment and use of assumptions as to future uncertainties and, as a result, actual results could differ from these estimates.
Revenue Recognition: We recognize revenue, net of estimated returns and allowances, when all of the following criteria have been met: a valid customer order with a determinable price has been received; title and risk of loss have transferred to the customer; there is no further significant obligation to assist in the resale of the product; and collectibility is reasonably assured.
In connection with the integration of the Big Heart business and to achieve consistency across the majority of our customer base, we modified our standard shipping terms during the fourth quarter of 2016. Our products are shipped with FOB destination terms, with the exception of certain export customers and those customers that elect to pick up. The change to our terms did not have a material impact on the year ended April 30, 2016.
Trade marketing and merchandising programs are classified as a reduction of sales. A provision for estimated returns and allowances is recognized as a reduction of sales at the time revenue is recognized.
Trade Marketing and Merchandising Programs: In order to support our products, various promotional activities are conducted through retail trade, distributors, or directly with consumers, including in-store display and product placement programs, feature price discounts, coupons, and other similar activities. We regularly review and revise, when we deem necessary, estimates of costs for these promotional programs based on estimates of what will be redeemed by retail trade, distributors, or consumers. These estimates are made using various techniques, including historical data on performance of similar promotional programs. Differences between estimated expenditures and actual performance are recognized as a change in estimate in a subsequent period. Subsequent period adjustments have approximated 1 percent of both consolidated pretax income and cash provided by operating activities in 2016, 2015, and 2014. However, as total promotional expenditures, including amounts classified as a reduction of sales, represented 31 percent of net sales in 2016, the possibility exists that reported results could be different if factors such as the level and success of the promotional programs or other conditions differ from expectations.
Income Taxes: We account for income taxes using the liability method. In the ordinary course of business, we are exposed to uncertainties related to tax filing positions and periodically assess the technical merits of these tax positions for all tax years that remain subject to examination, based upon the latest information available. For uncertain tax positions, we have recognized a liability for unrecognized tax benefits, including any applicable interest and penalty charges.
In assessing the need for a valuation allowance, we estimate future taxable income, considering the viability of ongoing tax planning strategies and the probable recognition of future tax deductions and loss carryforwards. Valuation allowances related to deferred tax assets can be affected by changes in tax laws, statutory tax rates,
2016 ANNUAL REPORT 33
MANAGEMENT’S DISCUSSION AND ANALYSIS
The J. M. Smucker Company
and projected future taxable income levels. Changes in estimated realization of deferred tax assets would result in an adjustment to income in the period in which that determination is made, unless such changes are determined to be an adjustment to goodwill within the allowable measurement period under the acquisition method of accounting.
The future tax benefit arising from the net deductible temporary differences and tax carryforwards is $252.9 and $270.0 at April 30, 2016 and 2015, respectively. We believe that the earnings during the periods when the temporary differences become deductible will be sufficient to realize the related future income tax benefits. For those jurisdictions where the expiration date of tax carryforwards or the projected operating results indicate that realization is not likely, a valuation allowance would have been provided.
Long-Lived Assets: Long-lived assets, other than goodwill and other indefinite-lived intangible assets, are reviewed for impairment whenever events or changes in circumstances indicate that the carrying amount of the asset may not be recoverable. Recoverability of assets to be held and used is measured by a comparison of the carrying amount of the assets to future net undiscounted cash flows estimated to be generated by such assets. If such assets are considered to be impaired, the impairment to be recognized is the amount by which the carrying amount of the assets exceeds the estimated fair value of the assets. However, determining fair value is subject to estimates of both cash flows and discount rates, and different estimates could yield different results. There are no events or changes in circumstances of which we are aware that indicate the carrying value of our long-lived assets may not be recoverable at April 30, 2016.
Goodwill and Other Indefinite-Lived Intangible Assets:
A significant portion of our assets is goodwill and other intangible assets, the majority of which are not amortized but are reviewed at least annually for impairment. At April 30, 2016, the carrying value of goodwill and other intangible assets totaled $12.6 billion, compared to total assets of $16.0 billion and total shareholders’ equity of $7.0 billion. If the carrying value of these assets exceeds the current estimated fair value, the asset is considered impaired and this would result in a noncash charge to earnings. Any such impairment charge would reduce earnings and could be material. Events and conditions that could result in impairment include a sustained drop in the market price of our common shares, increased competition or loss of market share, obsolescence, or product claims that result in a significant loss of sales or profitability over the product life.
We are required to test goodwill for impairment annually and more often if indicators of impairment exist. To test for goodwill impairment, we estimate the fair value of each of our reporting units using both a discounted cash flow valuation technique and a market-based approach. The impairment test incorporates estimates of future cash flows; allocations of certain assets, liabilities, and cash flows among reporting units; future growth rates; terminal value amounts; and the applicable weighted-average cost of capital used to discount those estimated cash flows. The estimates and projections used in the calculation of fair value are consistent with our current and long-range plans, including anticipated changes in market conditions, industry trends, growth rates, and planned
capital expenditures. Changes in forecasted operations and other estimates and assumptions could impact the assessment of impairment in the future.
At April 30, 2016, goodwill totaled $6.1 billion. Goodwill is substantially concentrated within the U.S. Retail Pet Foods, U.S. Retail Coffee, and U.S. Retail Consumer Foods segments. No goodwill impairment was recognized as a result of the annual evaluation performed as of February 1, 2016. The estimated fair value of each of our seven reporting units was substantially in excess of its carrying value as of the annual test date, with the exception of the Pet Foods reporting unit, for which its fair value exceeded its carrying value by $198.0, or 4 percent. A sensitivity analysis was performed for the Pet Foods reporting unit, assuming a hypothetical 50-basis-point decrease in the expected long-term growth rate and yielded an estimated fair value slightly below carrying value. The goodwill related to the U.S. Retail Pet Foods segment is a result of the Big Heart acquisition in the fourth quarter of 2015 and remains susceptible to future impairment as the current estimated fair value is close to the carrying value at the date of the acquisition. A change to the assumptions regarding the future performance of the U.S. Retail Pet Foods segment, or a portion of it, or a change to other assumptions, could result in impairment losses in the future.
Other indefinite-lived intangible assets, consisting entirely of trademarks, are also tested for impairment annually and whenever events or changes in circumstances indicate their carrying value may not be recoverable. To test these assets for impairment, we estimate the fair value of each asset based on a discounted cash flow model using various inputs, including projected revenues, an assumed royalty rate, and a discount rate. Changes in these estimates and assumptions could impact the assessment of impairment in the future.
At April 30, 2016, other indefinite-lived intangible assets totaled $3.1 billion. Trademarks that represent our leading brands comprise more than 90 percent of the total carrying value of other indefinite-lived intangible assets. Each of these leading brand trademarks had an estimated fair value substantially in excess of its carrying value as of the annual test date, with the exception of the trademarks acquired in the fourth quarter of 2015 as part of the Big Heart acquisition, which are equally as sensitive to a hypothetical
50-basis-point decrease in the expected long-term growth rate as noted above for the Pet Foods reporting unit. A change to the assumptions regarding future performance of the U.S. Retail Pet Foods segment or its brands, or a change to other assumptions, could result in impairment losses in the future.
Pension and Other Postretirement Benefit Plans: To determine the ultimate obligation under our defined benefit pension and other postretirement benefit plans, we must estimate the future cost of benefits and attribute that cost to the time period during which each covered employee works. Various actuarial assumptions must be made in order to predict and measure costs and obligations many years prior to the settlement date, the most significant being the interest rates used to discount the obligations of the plans, the long-term rates of return on the plans’ assets, mortality assumptions, assumed pay increases, and the health care cost trend rates. We, along with third-party actuaries and investment
34 THE J. M.SMUCKER COMPANY
MANAGEMENT’S DISCUSSION AND ANALYSIS
The J. M. Smucker Company
managers, review all of these assumptions on an ongoing basis to ensure that the most reasonable information available is being considered. For 2017 expense recognition, we will use a weighted-average discount rate of 3.76 percent and 3.60 percent for the U.S. and Canadian plans, respectively, and a rate of compensation increase of 3.96 percent for the U.S. plans. We anticipate using an expected rate of return on plan assets of 6.27 percent for U.S. plans. For the Canadian plans, we anticipate using an expected rate of return on plan assets of 5.25 percent for the hourly plan and
5.90 percent for all other plans.
As part of the Big Heart acquisition, we assumed the obligation for pension and other postretirement plans and now participate in one multi-employer pension plan. For additional information, see
Note 9: Pensions and Other Postretirement Benefits.
DERIVATIVE FINANCIAL INSTRUMENTS AND MARKET RISK
The following discussions about our market risk disclosures involve forward-looking statements. Actual results could differ from those projected in the forward-looking statements. We are exposed to market risk related to changes in interest rates, foreign currency exchange rates, and commodity prices.
Interest Rate Risk: The fair value of our cash and cash equivalents at April 30, 2016, approximates carrying value. We are exposed to interest rate risk with regard to existing debt consisting of fixed- and variable-rate maturities. Our interest rate exposure primarily includes U.S. Treasury rates, London Interbank Offered Rate, and commercial paper rates in the U.S.
We utilize derivative instruments to manage changes in the fair value of our debt. Interest rate swaps mitigate the risk associated with the underlying hedged item. At the inception of the contract, the instrument is evaluated and documented for hedge accounting treatment. If the contract is designated as a cash flow hedge, the swap would be recognized at fair value on the balance sheets and the mark-to-market gains or losses on the swap would be deferred and included as a component of accumulated other comprehensive loss to the extent effective, and reclassified to interest expense in the period during which the hedged transaction affects earnings. If the contract is designated as a fair value hedge, the swap would be recognized at fair value on the balance sheet, and changes in the fair value would be recognized in interest expense. Generally, changes in the fair value of the derivative are equal to changes in the fair value of the underlying debt and have no net impact on earnings.
In 2015, we entered into a series of forward-starting interest rate swaps to partially hedge the risk of an increase in the benchmark interest rate during the period leading up to the anticipated issuance of our long-term Senior Notes. The interest rate swaps were designated as cash flow hedges with an aggregate notional amount of $1.1 billion. In March 2015, in conjunction with the pricing of the series of Senior Notes, we terminated the interest rate swaps prior to maturity. The termination resulted in a net loss of $4.0, which is being amortized over the life of the remaining debt.
During 2014, we entered into an interest rate swap, designated as a fair value hedge, on a portion of fixed-rate Senior Notes in an effort to achieve a mix of variable-rate versus fixed-rate debt under favorable market conditions. In January 2015, we terminated this interest rate swap agreement prior to maturity. As a result of the
early termination, we received $58.1 in cash, which included $4.6 of accrued and prepaid interest and a $53.5 benefit that is deferred as a component of the carrying value of the long-term debt and will be recognized ratably as a reduction to future interest expense over the remaining life of the related debt. At April 30, 2016, the remaining benefit of $43.9 was recorded as an increase in the long-term debt balance.
Based on our overall interest rate exposure as of and during the year ended April 30, 2016, including derivatives and other instruments sensitive to interest rates, a hypothetical 10 percent movement in interest rates would not materially affect our results of operations. In measuring interest rate risk by the amount of net change in the fair value of our financial liabilities, a hypothetical 100-basis-point decrease in interest rates at April 30, 2016, would increase the fair value of our long-term debt by $387.4.
Foreign Currency Exchange Risk: We have operations outside the U.S. with foreign currency denominated assets and liabilities, primarily denominated in Canadian currency. Because we have foreign currency denominated assets and liabilities, financial exposure may result, primarily from the timing of transactions and the movement of exchange rates. The foreign currency balance sheet exposures as of April 30, 2016, are not expected to result in a significant impact on future earnings or cash flows.
We utilize foreign currency exchange forwards and options contracts to manage the price volatility of foreign currency exchange fluctuations on future cash payments in Canada, primarily related to purchases of certain raw materials and finished goods. The contracts generally have maturities of less than one year. We do not qualify instruments used to manage foreign currency exchange exposures for hedge accounting treatment. Therefore, the change in value of these instruments is immediately recognized in the cost of products sold. Based on our hedged foreign currency positions as of April 30, 2016, a hypothetical
10 percent change in exchange rates would result in a $17.5 loss of fair value.
Revenues from customers outside the U.S., subject to foreign currency translation, represented 6 percent of net sales during 2016. Thus, certain revenues and expenses have been, and are expected to be, subject to the effect of foreign currency fluctuations, and these fluctuations may have an impact on operating results.
Commodity Price Risk: We use certain raw materials and other commodities that are subject to price volatility caused by supply and demand conditions, political and economic variables, weather, investor speculation, and other unpredictable factors. To manage the volatility related to anticipated commodity purchases, we use derivatives with maturities of generally less than one year. We do not qualify commodity derivatives for hedge accounting treatment. As a result, the gains and losses on all commodity derivatives are immediately recognized in cost of products sold.
2016 ANNUAL REPORT 35
MANAGEMENT’S DISCUSSION AND ANALYSIS
The J. M. Smucker Company
The following sensitivity analysis presents our potential loss of fair value resulting from a hypothetical 10 percent change in market prices related to commodities.
Year Ended April 30, | |||||||
2016 | 2015 | ||||||
High | $ | 40.0 | $ | 39.6 | |||
Low | 16.5 | 19.3 | |||||
Average | 32.9 | 28.6 | |||||
The estimated fair value was determined using quoted market prices and was based on our net derivative position by commodity at each quarter end during the fiscal year. The calculations are not intended to represent actual losses in fair value that we expect to incur. In practice, as markets move, we actively manage our risk and adjust hedging strategies as appropriate. The commodities hedged have a high inverse correlation to price changes of the derivative commodity instrument; thus, we would expect that any gain or loss in the estimated fair value of its derivatives would generally be offset by an increase or decrease in the estimated fair value of the underlying exposures.
FORWARD-LOOKING STATEMENTS
Certain statements included in this Annual Report contain forward-looking statements within the meaning of federal securities laws. The forward-looking statements may include statements concerning our current expectations, estimates, assumptions, and beliefs concerning future events, conditions, plans, and strategies that are not historical fact. Any statement that is not historical in nature is a forward-looking statement and may be identified by the use of words and phrases such as “expect,” “anticipate,” “believe,” “intend,” “will,” “plan,” and similar phrases.
Federal securities laws provide a safe harbor for forward-looking statements to encourage companies to provide prospective information. We are providing this cautionary statement in connection with the safe harbor provisions. Readers are cautioned not to place undue reliance on any forward-looking statements, as such statements are by nature subject to risks, uncertainties, and other factors, many of which are outside of our control and could cause actual results to differ materially from such statements and from our historical results and experience. These risks and uncertainties include, but are not limited to, those set forth under the caption “Risk Factors” in our Annual Report on Form 10-K, as well as the following:
• our ability to achieve synergies and cost savings related to the Big Heart acquisition in the amounts and within the time frames currently anticipated and to effectively manage the related integration costs; |
• our ability to generate sufficient cash flow to meet our deleveraging objectives; |
• volatility of commodity, energy, and other input costs; |
• risks associated with derivative and purchasing strategies we employ to manage commodity pricing risks; |
• the availability of reliable transportation on acceptable terms; |
• our ability to implement and realize the full benefit of price changes, and the impact of the timing of the price changes to profits and cash flow in a particular period; |
• the success and cost of marketing and sales programs and strategies intended to promote growth in our businesses, including the introduction of new products; |
• general competitive activity in the market, including competitors’ pricing practices and promotional spending levels; |
• the impact of food security concerns involving either our products or our competitors’ products; |
• the impact of accidents, extreme weather, and natural disasters; |
• the concentration of certain of our businesses with key customers and suppliers, including single-source suppliers of certain key raw materials and finished goods, and our ability to manage and maintain key relationships; |
• the timing and amount of capital expenditures and share repurchases; |
• impairments in the carrying value of goodwill, other intangible assets, or other long-lived assets or changes in useful lives of other intangible assets; |
• the impact of new or changes to existing governmental laws and regulations and their application; |
• the outcome of tax examinations, changes in tax laws, and other tax matters; |
• foreign currency and interest rate fluctuations; and |
• risks related to other factors described under “Risk Factors” in other reports and statements we have filed with the Securities and Exchange Commission. |
Readers are cautioned not to unduly rely on such forward-looking statements, which speak only as of the date made, when evaluating the information presented in this Annual Report. We do not undertake any obligation to update or revise these forward-looking statements to reflect new events or circumstances subsequent to the filing of this Annual Report.
36 THE J. M.SMUCKER COMPANY
REPORT OF MANAGEMENT ON INTERNAL CONTROL OVER FINANCIAL REPORTING
The J. M. Smucker Company
Shareholders
The J. M. Smucker Company
Management is responsible for establishing and maintaining adequate accounting and internal control systems over financial reporting, as such term is defined in Rules 13a-15(f) and 15d-15(f) under the Securities and Exchange Act of 1934, as amended. Our internal control system is designed to provide reasonable assurance that we have the ability to record, process, summarize, and report reliable financial information on a timely basis.
Our management, with the participation of the principal financial and executive officers, assessed the effectiveness of the internal control over financial reporting as of April 30, 2016. In making this assessment, we used the criteria established in Internal Control – Integrated Framework issued by the Committee of Sponsoring Organizations of the Treadway Commission (2013 Framework) (“the COSO criteria”).
Based on our assessment of internal control over financial reporting under the COSO criteria, we concluded the internal control over financial reporting was effective as of April 30, 2016.
Ernst & Young LLP, an independent registered public accounting firm, audited the effectiveness of our internal control over financial reporting as of April 30, 2016, and their report thereon is included on page 38 of this report.
Mark T. Smucker | Mark R. Belgya | |||
President and | Vice Chair and | |||
Chief Executive Officer | Chief Financial Officer | |||
2016 ANNUAL REPORT 37
REPORT OF INDEPENDENT REGISTERED PUBLIC ACCOUNTING FIRM ON INTERNAL CONTROL OVER FINANCIAL REPORTING
The J. M. Smucker Company
Board of Directors and Shareholders
The J. M. Smucker Company
We have audited The J. M. Smucker Company’s internal control over financial reporting as of April 30, 2016, based on criteria established in Internal Control – Integrated Framework issued by the Committee of Sponsoring Organizations of the Treadway Commission (2013 framework) (“the COSO criteria”). The J. M. Smucker Company’s management is responsible for maintaining effective internal control over financial reporting, and for its assessment of the effectiveness of internal control over financial reporting included in the accompanying Report of Management on Internal Control Over Financial Reporting. Our responsibility is to express an opinion on the Company’s internal control over financial reporting based on our audit.
We conducted our audit in accordance with the standards of the Public Company Accounting Oversight Board (United States). Those standards require that we plan and perform the audit to obtain reasonable assurance about whether effective internal control over financial reporting was maintained in all material respects. Our audit included obtaining an understanding of internal control over financial reporting, assessing the risk that a material weakness exists, testing and evaluating the design and operating effectiveness of internal control based on the assessed risk, and performing such other procedures as we considered necessary in the circumstances. We believe that our audit provides a reasonable basis for our opinion.
A company’s internal control over financial reporting is a process designed to provide reasonable assurance regarding the reliability of financial reporting and the preparation of financial statements for external purposes in accordance with generally accepted accounting principles. A company’s internal control over financial reporting includes those policies and procedures that (1) pertain to the maintenance of records that, in reasonable detail, accurately and fairly reflect the transactions and dispositions of the assets of the company; (2) provide reasonable assurance that transactions are recorded as necessary to permit preparation of financial statements in accordance with generally accepted accounting principles, and that receipts and expenditures of the company are being made only in accordance with authorizations of management and directors of the company; and (3) provide reasonable assurance regarding prevention or timely detection of unauthorized acquisition, use, or disposition of the company’s assets that could have a material effect on the financial statements.
Because of its inherent limitations, internal control over financial reporting may not prevent or detect misstatements. Also, projections of any evaluation of effectiveness to future periods are subject to the risk that controls may become inadequate because of changes in conditions, or that the degree of compliance with the policies or procedures may deteriorate.
In our opinion, The J. M. Smucker Company maintained, in all material respects, effective internal control over financial reporting as of April 30, 2016, based on the COSO criteria.
We also have audited, in accordance with the standards of the Public Company Accounting Oversight Board (United States), the consolidated balance sheets of The J. M. Smucker Company as of April 30, 2016 and 2015, and the related statements of consolidated income, comprehensive income, shareholders’ equity and cash flows for each of the three years in the period ended April 30, 2016, and our report dated June 21, 2016, expressed an unqualified opinion thereon.

Akron, Ohio
June 21, 2016
38 THE J. M.SMUCKER COMPANY
REPORT OF INDEPENDENT REGISTERED PUBLIC ACCOUNTING FIRM ON THE CONSOLIDATED FINANCIAL STATEMENTS
The J. M. Smucker Company
Board of Directors and Shareholders
The J. M. Smucker Company
We have audited the accompanying consolidated balance sheets of The J. M. Smucker Company as of April 30, 2016 and 2015, and the related statements of consolidated income, comprehensive income, shareholders’ equity, and cash flows for each of the three years in the period ended April 30, 2016. These financial statements are the responsibility of the Company’s management. Our responsibility is to express an opinion on these financial statements based on our audits.
We conducted our audits in accordance with the standards of the Public Company Accounting Oversight Board (United States). Those standards require that we plan and perform the audit to obtain reasonable assurance about whether the financial statements are free of material misstatement. An audit includes examining, on a test basis, evidence supporting the amounts and disclosures in the financial statements. An audit also includes assessing the accounting principles used and significant estimates made by management, as well as evaluating the overall financial statement presentation. We believe that our audits provide a reasonable basis for our opinion.
In our opinion, the consolidated financial statements referred to above present fairly, in all material respects, the consolidated financial position of The J. M. Smucker Company at April 30, 2016 and 2015, and the consolidated results of its operations and its cash flows for each of the three years in the period ended April 30, 2016, in conformity with U.S. generally accepted accounting principles.
We also have audited, in accordance with the standards of the Public Company Accounting Oversight Board (United States), The J. M. Smucker Company’s internal control over financial reporting as of April 30, 2016, based on criteria established in Internal Control – Integrated Framework issued by the Committee of Sponsoring Organizations of the Treadway Commission (2013 framework) and our report dated June 21, 2016, expressed an unqualified opinion thereon.

Akron, Ohio
June 21, 2016
2016 ANNUAL REPORT 39
REPORT OF MANAGEMENT ON RESPONSIBILITY
FOR FINANCIAL REPORTING
The J. M. Smucker Company
Shareholders
The J. M. Smucker Company
Management of The J. M. Smucker Company is responsible for the preparation, integrity, accuracy, and consistency of the consolidated financial statements and the related financial information in this report. Such information has been prepared in accordance with U.S. generally accepted accounting principles and is based on our best estimates and judgments.
We maintain systems of internal accounting controls supported by formal policies and procedures that are communicated throughout the Company. There is a program of audits performed by our internal audit staff designed to evaluate the adequacy of and adherence to these controls, policies, and procedures.
Ernst & Young LLP, an independent registered public accounting firm, has audited our financial statements in accordance with the standards of the Public Company Accounting Oversight Board (United States). Management has made all financial records and related data available to Ernst & Young LLP during its audit.
Our audit committee, comprised of four non-employee members of the Board of Directors, meets regularly with the independent registered public accounting firm and management to review the work of the internal audit staff and the work, audit scope, timing arrangements, and fees of the independent registered public accounting firm. The audit committee also regularly satisfies itself as to the adequacy of controls, systems, and financial records. The director of the internal audit department is required to report directly to the chair of the audit committee as to internal audit matters.
It is our best judgment that our policies and procedures, our program of internal and independent audits, and the oversight activity of the audit committee work together to provide reasonable assurance that our operations are conducted according to law and in compliance with the high standards of business ethics and conduct to which we subscribe.
Mark T. Smucker | Mark R. Belgya | |||
President and | Vice Chair and | |||
Chief Executive Officer | Chief Financial Officer | |||
40 THE J. M.SMUCKER COMPANY
STATEMENTS OF CONSOLIDATED INCOME
The J. M. Smucker Company
Year Ended April 30, | |||||||||||
(Dollars in millions, except per share data) | 2016 | 2015 | 2014 | ||||||||
Net sales | $ | 7,811.2 | $ | 5,692.7 | $ | 5,610.6 | |||||
Cost of products sold | 4,843.4 | 3,724.0 | 3,579.6 | ||||||||
Gross Profit | 2,967.8 | 1,968.7 | 2,031.0 | ||||||||
Selling, distribution, and administrative expenses | 1,510.3 | 1,031.3 | 988.8 | ||||||||
Amortization | 208.4 | 110.9 | 98.9 | ||||||||
Other special project costs (A) | 135.9 | 56.6 | 25.6 | ||||||||
Other operating income – net | (32.1 | ) | (2.1 | ) | (1.3 | ) | |||||
Operating Income | 1,145.3 | 772.0 | 919.0 | ||||||||
Interest expense – net | (171.1 | ) | (79.9 | ) | (79.4 | ) | |||||
Other debt costs | — | (173.3 | ) | — | |||||||
Other income – net | 3.7 | 4.2 | 10.1 | ||||||||
Income Before Income Taxes | 977.9 | 523.0 | 849.7 | ||||||||
Income taxes | 289.2 | 178.1 | 284.5 | ||||||||
Net Income | $ | 688.7 | $ | 344.9 | $ | 565.2 | |||||
Earnings per common share: | |||||||||||
Net Income | $ | 5.77 | $ | 3.33 | $ | 5.42 | |||||
Net Income – Assuming Dilution | $ | 5.76 | $ | 3.33 | $ | 5.42 | |||||
Dividends Declared per Common Share | $ | 2.68 | $ | 2.56 | $ | 2.32 | |||||
(A) Other special project costs includes merger and integration and restructuring costs. For more information, see Note 3: Integration and Restructuring Costs.
See notes to consolidated financial statements.
STATEMENTS OF CONSOLIDATED COMPREHENSIVE INCOME
The J. M. Smucker Company
Year Ended April 30, | |||||||||||
(Dollars in millions) | 2016 | 2015 | 2014 | ||||||||
Net income | $ | 688.7 | $ | 344.9 | $ | 565.2 | |||||
Other comprehensive (loss) income: | |||||||||||
Foreign currency translation adjustments | (10.8 | ) | (34.0 | ) | (29.8 | ) | |||||
Cash flow hedging derivative activity, net of tax | 0.4 | (20.5 | ) | 26.5 | |||||||
Pension and other postretirement benefit plans activity, net of tax | (28.5 | ) | (3.6 | ) | 29.4 | ||||||
Available-for-sale securities activity, net of tax | 0.3 | (0.1 | ) | (1.1 | ) | ||||||
Total Other Comprehensive (Loss) Income | (38.6 | ) | (58.2 | ) | 25.0 | ||||||
Comprehensive Income | $ | 650.1 | $ | 286.7 | $ | 590.2 | |||||
See notes to consolidated financial statements.
2016 ANNUAL REPORT 41
CONSOLIDATED BALANCE SHEETS
The J. M. Smucker Company
ASSETS
April 30, | |||||||
(Dollars in millions) | 2016 | 2015 | |||||
Current Assets | |||||||
Cash and cash equivalents | $ | 109.8 | $ | 125.6 | |||
Trade receivables, less allowance for doubtful accounts | 450.1 | 430.1 | |||||
Inventories: | |||||||
Finished products | 560.0 | 815.0 | |||||
Raw materials | 339.4 | 348.6 | |||||
Total Inventory | 899.4 | 1,163.6 | |||||
Other current assets | 114.1 | 264.6 | |||||
Total Current Assets | 1,573.4 | 1,983.9 | |||||
Property, Plant, and Equipment | |||||||
Land and land improvements | 114.6 | 113.7 | |||||
Buildings and fixtures | 727.7 | 666.3 | |||||
Machinery and equipment | 1,870.7 | 1,783.8 | |||||
Construction in progress | 91.3 | 135.3 | |||||
Gross Property, Plant, and Equipment | 2,804.3 | 2,699.1 | |||||
Accumulated depreciation | (1,176.6 | ) | (1,020.8 | ) | |||
Total Property, Plant, and Equipment | 1,627.7 | 1,678.3 | |||||
Other Noncurrent Assets | |||||||
Goodwill | 6,091.1 | 6,011.6 | |||||
Other intangible assets – net | 6,494.4 | 6,950.3 | |||||
Other noncurrent assets | 197.5 | 182.2 | |||||
Total Other Noncurrent Assets | 12,783.0 | 13,144.1 | |||||
Total Assets | $ | 15,984.1 | $ | 16,806.3 | |||
See notes to consolidated financial statements.
42 THE J. M.SMUCKER COMPANY
CONSOLIDATED BALANCE SHEETS
The J. M. Smucker Company
LIABILITIES AND SHAREHOLDERS’ EQUITY
April 30, | |||||||
(Dollars in millions) | 2016 | 2015 | |||||
Current Liabilities | |||||||
Accounts payable | $ | 459.4 | $ | 402.8 | |||
Accrued compensation | 139.6 | 100.4 | |||||
Accrued trade marketing and merchandising | 112.3 | 104.9 | |||||
Dividends payable | 77.9 | 76.5 | |||||
Short-term borrowings | 284.0 | 226.0 | |||||
Other current liabilities | 139.8 | 112.0 | |||||
Total Current Liabilities | 1,213.0 | 1,022.6 | |||||
Noncurrent Liabilities | |||||||
Long-term debt | 5,146.0 | 5,944.9 | |||||
Defined benefit pensions | 222.3 | 188.9 | |||||
Other postretirement benefits | 75.9 | 74.6 | |||||
Deferred income taxes | 2,230.3 | 2,397.0 | |||||
Other noncurrent liabilities | 88.1 | 91.4 | |||||
Total Noncurrent Liabilities | 7,762.6 | 8,696.8 | |||||
Total Liabilities | 8,975.6 | 9,719.4 | |||||
Shareholders’ Equity | |||||||
Serial preferred shares – no par value: Authorized – 6,000,000 shares; outstanding – none | — | — | |||||
Common shares – no par value: Authorized – 300,000,000 shares; outstanding – 116,306,894 at April 30, 2016, and 119,577,333 at April 30, 2015 (net of 30,190,836 and 26,920,397 treasury shares, respectively), at stated value | 29.1 | 29.9 | |||||
Additional capital | 5,860.1 | 6,007.7 | |||||
Retained income | 1,267.7 | 1,159.2 | |||||
Amount due from ESOP Trust | — | (0.1 | ) | ||||
Accumulated other comprehensive loss | (148.4 | ) | (109.8 | ) | |||
Total Shareholders’ Equity | 7,008.5 | 7,086.9 | |||||
Total Liabilities and Shareholders’ Equity | $ | 15,984.1 | $ | 16,806.3 | |||
See notes to consolidated financial statements.
2016 ANNUAL REPORT 43
STATEMENTS OF CONSOLIDATED CASH FLOWS
The J. M. Smucker Company
Year Ended April 30, | |||||||||||
(Dollars in millions) | 2016 | 2015 | 2014 | ||||||||
Operating Activities | |||||||||||
Net income | $ | 688.7 | $ | 344.9 | $ | 565.2 | |||||
Adjustments to reconcile net income to net cash provided by operations: | |||||||||||
Depreciation | 221.7 | 157.5 | 157.5 | ||||||||
Amortization | 208.4 | 110.9 | 98.9 | ||||||||
Share-based compensation expense | 34.6 | 23.5 | 22.9 | ||||||||
Gain on divestiture | (25.3 | ) | — | — | |||||||
Loss on disposal of assets – net | 5.6 | 6.0 | 3.0 | ||||||||
Gain on sale of marketable securities | — | — | (3.7 | ) | |||||||
Deferred income tax (benefit) expense | (95.2 | ) | 7.7 | (8.0 | ) | ||||||
Other noncash adjustments | (2.2 | ) | (12.0 | ) | (0.2 | ) | |||||
Make-whole payments included in financing activities | — | 163.3 | — | ||||||||
Defined benefit pension contributions | (8.6 | ) | (15.7 | ) | (9.4 | ) | |||||
Changes in assets and liabilities, net of effect from businesses acquired: | |||||||||||
Trade receivables | (21.9 | ) | 21.8 | 6.1 | |||||||
Inventories | 240.1 | 25.3 | 15.4 | ||||||||
Other current assets | 14.6 | 74.1 | (26.9 | ) | |||||||
Accounts payable | 46.1 | (25.4 | ) | 3.3 | |||||||
Accrued liabilities | 2.4 | (140.3 | ) | 9.1 | |||||||
Proceeds from settlement of interest rate swaps – net | — | 53.5 | — | ||||||||
Income and other taxes | 144.2 | (41.6 | ) | (9.5 | ) | ||||||
Other – net | 5.1 | (20.3 | ) | 32.3 | |||||||
Net Cash Provided by Operating Activities | 1,458.3 | 733.2 | 856.0 | ||||||||
Investing Activities | |||||||||||
Businesses acquired, net of cash acquired | 7.9 | (1,320.5 | ) | (101.8 | ) | ||||||
Equity investment in affiliate | (16.0 | ) | — | — | |||||||
Additions to property, plant, and equipment | (201.4 | ) | (247.7 | ) | (279.5 | ) | |||||
Sales and maturities of marketable securities | — | — | 10.0 | ||||||||
Proceeds from divestiture | 193.7 | — | — | ||||||||
Proceeds from disposal of property, plant, and equipment | 4.0 | 2.6 | 10.7 | ||||||||
Other – net | 33.5 | (30.1 | ) | (9.7 | ) | ||||||
Net Cash Provided by (Used for) Investing Activities | 21.7 | (1,595.7 | ) | (370.3 | ) | ||||||
Financing Activities | |||||||||||
Short-term borrowings (repayments) – net | 58.0 | (22.4 | ) | 248.4 | |||||||
Proceeds from long-term debt | — | 5,382.5 | — | ||||||||
Repayments of long-term debt, including make-whole payments | (800.0 | ) | (4,193.9 | ) | (50.0 | ) | |||||
Quarterly dividends paid | (316.6 | ) | (254.0 | ) | (238.0 | ) | |||||
Purchase of treasury shares | (441.1 | ) | (24.3 | ) | (508.5 | ) | |||||
Other – net | 3.5 | (24.7 | ) | (27.4 | ) | ||||||
Net Cash (Used for) Provided by Financing Activities | (1,496.2 | ) | 863.2 | (575.5 | ) | ||||||
Effect of exchange rate changes on cash | 0.4 | (28.6 | ) | (13.1 | ) | ||||||
Net decrease in cash and cash equivalents | (15.8 | ) | (27.9 | ) | (102.9 | ) | |||||
Cash and cash equivalents at beginning of year | 125.6 | 153.5 | 256.4 | ||||||||
Cash and Cash Equivalents at End of Year | $ | 109.8 | $ | 125.6 | $ | 153.5 | |||||
( ) | Denotes use of cash |
See notes to consolidated financial statements.
44 THE J. M.SMUCKER COMPANY
STATEMENTS OF CONSOLIDATED SHAREHOLDERS’ EQUITY
The J. M. Smucker Company
(Dollars in millions) | Common Shares Outstanding | Common Shares | Additional Capital | Retained Income | Amount Due from ESOP Trust | Accumulated Other Comprehensive Loss | Total Shareholders' Equity | |||||||||||||||||||
Balance at May 1, 2013 | 106,486,935 | $ | 26.6 | $ | 4,125.1 | $ | 1,075.5 | $ | (1.8 | ) | $ | (76.6 | ) | $ | 5,148.8 | |||||||||||
Net income | 565.2 | 565.2 | ||||||||||||||||||||||||
Other comprehensive income | 25.0 | 25.0 | ||||||||||||||||||||||||
Comprehensive Income | 590.2 | |||||||||||||||||||||||||
Purchase of treasury shares | (5,072,158 | ) | (1.3 | ) | (199.0 | ) | (308.2 | ) | (508.5 | ) | ||||||||||||||||
Stock plans (includes tax benefit of $7.3) | 282,623 | 0.1 | 39.7 | 39.8 | ||||||||||||||||||||||
Cash dividends declared | (241.6 | ) | (241.6 | ) | ||||||||||||||||||||||
Other | 0.1 | 0.8 | 0.9 | |||||||||||||||||||||||
Balance at April 30, 2014 | 101,697,400 | 25.4 | 3,965.8 | 1,091.0 | (1.0 | ) | (51.6 | ) | 5,029.6 | |||||||||||||||||
Net income | 344.9 | 344.9 | ||||||||||||||||||||||||
Other comprehensive loss | (58.2 | ) | (58.2 | ) | ||||||||||||||||||||||
Comprehensive Income | 286.7 | |||||||||||||||||||||||||
Purchase of treasury shares | (225,262 | ) | (0.1 | ) | (19.2 | ) | (5.0 | ) | (24.3 | ) | ||||||||||||||||
Issuance of shares for acquisition | 17,892,565 | 4.5 | 2,031.0 | 2,035.5 | ||||||||||||||||||||||
Stock plans (includes tax benefit of $5.9) | 212,630 | 0.1 | 30.1 | 30.2 | ||||||||||||||||||||||
Cash dividends declared | (271.5 | ) | (271.5 | ) | ||||||||||||||||||||||
Other | (0.2 | ) | 0.9 | 0.7 | ||||||||||||||||||||||
Balance at April 30, 2015 | 119,577,333 | 29.9 | 6,007.7 | 1,159.2 | (0.1 | ) | (109.8 | ) | 7,086.9 | |||||||||||||||||
Net income | 688.7 | 688.7 | ||||||||||||||||||||||||
Other comprehensive loss | (38.6 | ) | (38.6 | ) | ||||||||||||||||||||||
Comprehensive Income | 650.1 | |||||||||||||||||||||||||
Purchase of treasury shares | (3,451,591 | ) | (0.9 | ) | (177.9 | ) | (262.3 | ) | (441.1 | ) | ||||||||||||||||
Stock plans (includes tax benefit of $2.7) | 181,152 | 0.1 | 30.7 | 30.8 | ||||||||||||||||||||||
Cash dividends declared | (317.9 | ) | (317.9 | ) | ||||||||||||||||||||||
Other | (0.4 | ) | 0.1 | (0.3 | ) | |||||||||||||||||||||
Balance at April 30, 2016 | 116,306,894 | $ | 29.1 | $ | 5,860.1 | $ | 1,267.7 | $ | — | $ | (148.4 | ) | $ | 7,008.5 | ||||||||||||
See notes to consolidated financial statements.
2016 ANNUAL REPORT 45
NOTES TO CONSOLIDATED FINANCIAL STATEMENTS
The J. M. Smucker Company
(Dollars in millions, unless otherwise noted, except per share data)
NOTE 1 | ACCOUNTING POLICIES | |
Principles of Consolidation: The consolidated financial statements include the accounts of the Company, its wholly-owned subsidiaries, and its majority-owned investments, if any. Intercompany transactions and accounts are eliminated in consolidation.
Use of Estimates: The preparation of consolidated financial statements in conformity with U.S. generally accepted accounting principles (“GAAP”) requires that we make certain estimates and assumptions that affect the amounts reported in the consolidated financial statements and accompanying notes. Significant estimates in these consolidated financial statements include: allowances for doubtful trade receivables, estimates of future cash flows associated with assets, potential asset impairments, useful lives and residual values of long-lived assets used in determining depreciation and amortization, net realizable value of inventories, accruals for trade marketing and merchandising programs, income taxes, and the determination of discount and other assumptions for defined benefit pension and other postretirement benefit expenses. Actual results could differ from these estimates.
Cash and Cash Equivalents: We consider all short-term, highly-liquid investments with a maturity of three months or less when purchased to be cash equivalents.
Revenue Recognition: We recognize revenue, net of estimated returns and allowances, when all of the following criteria have been met: a valid customer order with a determinable price has been received; title and risk of loss have transferred to the customer; there is no further significant obligation to assist in the resale of the product; and collectibility is reasonably assured.
In connection with the integration of the Big Heart business and to achieve consistency across the majority of our customer base, we modified our standard shipping terms during the fourth quarter of 2016. Our products are shipped with FOB destination terms, with the exception of certain export customers and those customers that elect to pick up. The change to our terms did not have a material impact on the year ended April 30, 2016.
Trade marketing and merchandising programs are classified as a reduction of sales. A provision for estimated returns and allowances is recognized as a reduction of sales at the time revenue is recognized.
Trade Marketing and Merchandising Programs: In order to support our products, various promotional activities are conducted through retail trade, distributors, or directly with consumers, including in-store display and product placement programs, feature price discounts, coupons, and other similar activities. We regularly review and revise, when we deem necessary, estimates of costs for these promotional programs based on estimates of what will be redeemed by retail trade, distributors, or consumers. These estimates are made using various techniques, including historical data on performance of similar promotional programs. Differences between estimated expenditures and actual performance are recognized as a change in estimate in a subsequent period. Subsequent period adjustments have approximated
1 percent of both consolidated pretax income and cash provided by operating activities in 2016, 2015, and 2014. However, as total promotional expenditures, including amounts classified as a reduction of sales, represented 31 percent, 29 percent, and 27 percent of net sales in 2016, 2015, and 2014, respectively, the possibility exists that reported results could be different if factors such as the level and success of the promotional programs or other conditions differ from expectations.
Shipping and Handling Costs: Transportation costs included in cost of products sold relate to the costs incurred to ship our products. Distribution costs are included in selling, distribution, and administrative expenses (“SD&A”) and relate to the warehousing costs incurred to store our products. Total shipping and handling costs recorded within SD&A were $236.1, $168.5, and $164.8 in 2016, 2015, and 2014, respectively.
Advertising Expense: Advertising costs are expensed as incurred. Advertising expense was $170.3, $107.0, and $124.7 in 2016, 2015, and 2014, respectively.
Research and Development Costs: Research and development (“R&D”) costs are expensed as incurred and are included in SD&A in the Statements of Consolidated Income. R&D costs include expenditures for new product and manufacturing process innovation, which are comprised primarily of internal salaries and wages, consulting, and other supplies attributable to time spent on R&D activities. Other costs include the depreciation and maintenance of research facilities. Total R&D expense was $58.8, $32.5, and $24.3 in 2016, 2015, and 2014, respectively.
Share-Based Payments: Share-based compensation expense, excluding stock options, is recognized on a straight-line basis over the requisite service period, which includes a one-year performance period plus the defined forfeiture period, which is typically 4 years of service or the attainment of a defined age and years of service. Compensation expense related to stock options is recognized ratably over
46 THE J. M.SMUCKER COMPANY
NOTES TO CONSOLIDATED FINANCIAL STATEMENTS
The J. M. Smucker Company
the service period for each vesting tranche from the grant date through the end of the requisite service period if it is probable that the performance criteria will be met. The options vest over a period of 1 to 3 years, dependent on continued service of the option holder, as well as the achievement of the performance objectives established on the grant date.
The following table summarizes amounts related to share-based payments.
Year Ended April 30, | |||||||||||
2016 | 2015 | 2014 | |||||||||
Share-based compensation expense included in SD&A | $ | 26.3 | $ | 22.3 | $ | 22.1 | |||||
Share-based compensation expense included in other special project costs | 8.3 | 1.2 | 0.8 | ||||||||
Total share-based compensation expense | $ | 34.6 | $ | 23.5 | $ | 22.9 | |||||
Related income tax benefit | $ | 10.2 | $ | 8.0 | $ | 7.7 | |||||
As of April 30, 2016, total unrecognized share-based compensation cost related to nonvested share-based awards was $54.1. The weighted-average period over which this amount is expected to be recognized is 2.7 years.
Corporate income tax benefits realized upon exercise or vesting of an award in excess of that previously recognized in earnings, referred to as excess tax benefits, are presented in the Statements of Consolidated Cash Flows as a financing activity. Realized excess tax benefits are credited to additional capital in the Consolidated Balance Sheets. Realized shortfall tax benefits, amounts which are less than those previously recognized in earnings, are first offset against the cumulative balance of excess tax benefits, if any, and then charged directly to income tax expense. For 2016, 2015, and 2014, the excess tax benefits realized upon exercise or vesting of share-based compensation were $2.7, $5.9, and $7.3, respectively. For further discussion on share-based compensation expense, see Note 12: Share-Based Payments.
Defined Contribution Plans: We offer employee savings plans for domestic and Canadian employees. Our contributions under these plans are based on a specified percentage of employee contributions. Charges to operations for these plans in 2016, 2015, and 2014 were $25.9, $21.1, and $20.1, respectively. For information on our defined benefit plans, see Note 9: Pensions and Other Postretirement Benefits.
Income Taxes: We account for income taxes using the liability method. Accordingly, deferred tax assets and liabilities are recognized for the future tax consequences attributable to differences between financial statement carrying amounts of existing assets and liabilities and their respective tax bases. Deferred tax assets and liabilities are measured using enacted tax rates expected to apply to taxable income in the years in which those temporary differences are expected to be recovered or settled. The effect on deferred tax assets and liabilities of a change in the applicable tax rate is recognized in income or expense in the period that the change is enacted. A valuation allowance is established when it is more likely than not that all or a portion of a deferred tax asset will not be realized. A tax benefit is recognized when it is more likely than not to be sustained.
We account for the financial statement recognition and measurement criteria of a tax position taken or expected to be taken in a tax return under Financial Accounting Standards Board (“FASB”) Accounting Standards Codification (“ASC”) 740, Income Taxes. ASC 740 also provides guidance on derecognition, classification, interest and penalties, accounting in interim periods, and disclosure.
In accordance with the requirements of ASC 740, uncertain tax positions have been classified in the Consolidated Balance Sheets as noncurrent, except to the extent payment is expected within 1 year. We recognize net interest and penalties related to unrecognized tax benefits in income tax expense.
Trade Receivables: In the normal course of business, we extend credit to customers. Trade receivables, less allowances, reflects the net realizable value of receivables and approximates fair value. We evaluate our trade receivables and establish an allowance for doubtful accounts based on a combination of factors. When aware that a specific customer has been impacted by circumstances such as bankruptcy filings or deterioration in the customer’s operating results or financial position, potentially making it unable to meet its financial obligations, we record a specific reserve for bad debt to reduce the related receivable to the amount we reasonably believe is collectible. We also record reserves for bad debt for all other customers based on a variety of factors, including the length of time the receivables are past due, historical collection experience, and an evaluation of current and projected economic conditions at the balance sheet date. Trade receivables are charged off against the allowance after we determine that the potential for recovery is remote. At April 30, 2016 and 2015, the allowance for doubtful accounts was $1.1 and $1.0, respectively. We believe there is no concentration of risk with any single customer whose failure or nonperformance would materially affect results other than as discussed in Note 5: Reportable Segments.
Inventories: Inventories are stated at the lower of cost or market, with market being defined as net realizable value, less costs to sell. Cost for all inventories is determined using the first-in, first-out method applied on a consistent basis.
2016 ANNUAL REPORT 47
NOTES TO CONSOLIDATED FINANCIAL STATEMENTS
The J. M. Smucker Company
The cost of finished products and work-in-process inventory includes materials, direct labor, and overhead. Work-in-process is included in finished products in the Consolidated Balance Sheets and was $67.6 and $81.5 at April 30, 2016 and 2015, respectively.
Derivative Financial Instruments: We account for derivative instruments in accordance with FASB ASC 815, Derivatives and Hedging, which requires all derivative instruments to be recognized in the financial statements and measured at fair value, regardless of the purpose or intent for holding them.
We do not qualify commodity derivatives or instruments used to manage foreign currency exchange exposures for hedge accounting treatment and, as a result, the derivative gains and losses are immediately recognized in earnings. Although we do not perform the assessments required to achieve hedge accounting for commodity derivatives or instruments used to manage foreign currency exchange exposures, we believe all of our derivatives are economic hedges of our risk exposure. The exposures hedged have a high inverse correlation to price changes of the derivative instrument; thus, we expect that any gain or loss in the estimated fair value of our derivatives would generally be offset by an increase or decrease in the estimated fair value of the underlying exposures.
We utilize derivative instruments to manage changes in the fair value and cash flows of our debt. Interest rate swaps mitigate the risk associated with the underlying hedged item. At the inception of the contract, the instrument is evaluated and documented for hedge accounting treatment. If the contract is designated as a cash flow hedge, the mark-to-market gains or losses on the swap are deferred and included as a component of accumulated other comprehensive loss to the extent effective, and reclassified to interest expense in the period during which the hedged transaction affects earnings. If the contract is designated as a fair value hedge, the swap is recognized at fair value on the balance sheet, and changes in the fair value are recognized in interest expense. Generally, changes in the fair value of the derivative are equal to changes in the fair value of the underlying debt and have no net impact on earnings.
Property, Plant, and Equipment: Property, plant, and equipment is recognized at cost and is depreciated on a straight-line basis over the estimated useful life of the asset (3 to 20 years for machinery and equipment, 1 to 7 years for capitalized software costs, and 5 to 40 years for buildings, fixtures, and improvements).
We lease certain land, buildings, and equipment for varying periods of time, with renewal options. Rent expense in 2016, 2015, and 2014 totaled $92.5, $67.1, and $60.6, respectively. As of April 30, 2016, our minimum operating lease obligations were as follows: $39.4 in 2017, $37.4 in 2018, $30.6 in 2019, $24.8 in 2020, and $21.6 in 2021.
In accordance with FASB ASC 360, Property, Plant, and Equipment, long-lived assets, other than goodwill and other indefinite-lived intangible assets, are reviewed for impairment when circumstances indicate the carrying value of an asset may not be recoverable. Recoverability of assets to be held and used is measured by a comparison of the carrying amount of the assets to future net undiscounted cash flows we estimate to be generated by such assets. If such assets are considered to be impaired, the impairment to be recognized is the amount by which the carrying amount of the assets exceeds their estimated fair value. Assets to be disposed of by sale are recognized as held for sale at the lower of carrying value or fair value less costs to sell.
Goodwill and Other Intangible Assets: Goodwill is the excess of the purchase price paid over the estimated fair value of the net assets of a business acquired. In accordance with FASB ASC 350, Intangibles – Goodwill and Other, goodwill and other indefinite-lived intangible assets are not amortized but are reviewed at least annually for impairment. We conduct our annual test for impairment of goodwill and other indefinite-lived intangible assets as of February 1 of each year. As of the annual impairment test, we had seven reporting units. A discounted cash flow valuation technique was utilized to estimate the fair value of our reporting units and indefinite-lived intangible assets. We also used a market-based approach to estimate the fair value of our reporting units. The discount rates utilized in the cash flow analyses were developed using a weighted-average cost of capital methodology. In addition to the annual test, we test for impairment if events or circumstances occur that would more likely than not reduce the fair value of a reporting unit below its carrying amount. Finite-lived intangible assets are amortized on a straight-line basis over their estimated useful lives, which are evaluated on an annual basis. For additional information, see Note 7: Goodwill and Other Intangible Assets.
Marketable Securities and Other Investments: We maintain funds for the payment of benefits associated with nonqualified retirement plans. These funds include investments considered to be available-for-sale marketable securities. At April 30, 2016 and 2015, the fair value of these investments was $48.8 and $48.4, respectively, and was included in other noncurrent assets in the Consolidated Balance Sheets. Included in accumulated other comprehensive loss at April 30, 2016 and 2015, were unrealized pre-tax gains of $5.7 and $5.2, respectively.
Equity Method Investments: Investments in common stock of entities other than our subsidiaries are accounted for under the equity method in accordance with FASB ASC 323, Investments – Equity Method and Joint Ventures. Under the equity method, the initial investment is recorded at cost and the investment is subsequently adjusted for its proportionate share of earnings or losses, including consideration of basis differences resulting from the difference between the initial carrying amount of the investment and the underlying equity in net assets. The difference between the carrying amount of the investment and the underlying equity in net assets is primarily attributable to goodwill and other intangible assets.
48 THE J. M.SMUCKER COMPANY
NOTES TO CONSOLIDATED FINANCIAL STATEMENTS
The J. M. Smucker Company
We have a 25 percent equity interest in Guilin Seamild Biologic Technology Development Co., Ltd. (“Seamild”), a privately-owned manufacturer and marketer of oats products in China. The initial investment in Seamild in 2013 was $35.9 and is included in other noncurrent assets in the Consolidated Balance Sheets. The value of our investment in Seamild did not change significantly and did not have a material impact on International and Foodservice or the consolidated financial statements for the years ended April 30, 2016 and 2015.
As part of the Big Heart Pet Brands (“Big Heart”) acquisition, we acquired a 50 percent equity interest in Natural Blend Vegetable Dehydration, LLC; however, we exited the relationship in 2016. The investment did not have a material impact on the U.S. Retail Pet Foods segment or the consolidated financial statements for the years ended April 30, 2016 and 2015.
Additionally, we acquired a 20 percent equity interest in Mountain Country Foods, LLC (“Mountain Country Foods”) as part of the Big Heart acquisition. Mountain Country Foods is a privately-owned contract manufacturer of Big Heart pet products. The carrying amount of the Mountain Country Foods interest of $19.1 was included in other noncurrent assets in the Consolidated Balance Sheets. The investment in Mountain Country Foods did not have a material impact on the U.S. Retail Pet Foods segment or the consolidated financial statements for the years ended April 30, 2016 and 2015. For additional information related to the acquisition, see Note 2: Acquisitions.
We have a 44 percent equity interest in Numi, Inc. (“Numi”), the manufacturer and marketer of Numi® brand premium organic teas located in Oakland, California. During 2016, we invested $16.0 in Numi, and the investment is included in other noncurrent assets in the Consolidated Balance Sheets. Our investment in Numi did not have a material impact on the U.S. Retail Consumer Foods segment or the consolidated financial statements for the year ended April 30, 2016.
Foreign Currency Translation: Assets and liabilities of foreign subsidiaries are translated using the exchange rates in effect at the balance sheet dates, while income and expenses are translated using average rates throughout the periods. Translation adjustments are reported as a component of shareholders’ equity in accumulated other comprehensive loss. Included in accumulated other comprehensive loss at April 30, 2016 and 2015, were foreign currency losses of $13.1 and $2.3, respectively.
Recently Issued Accounting Standards: In March 2016, the FASB issued Accounting Standards Update (“ASU”) 2016-09, Stock Compensation (Topic 718) Improvements to Employee Share-Based Payment Accounting. ASU 2016-09 includes provisions intended to simplify various aspects related to how share-based payments are accounted for and presented in the financial statements, including the income tax consequences, classification of awards as either equity or liabilities, and classification on the statement of cash flows.
ASU 2016-09 will be effective for us on May 1, 2017. Certain amendments will require a prospective approach, while others will require a retrospective approach. We are currently evaluating the impact the application of ASU 2016-09 will have on our financial statements and disclosures and will consider early adoption in 2017, as permitted.
In February 2016, the FASB issued ASU 2016-02, Leases (Topic 842). ASU 2016-02 will be effective for us on May 1, 2019, and will require a modified retrospective approach for leases existing at, or entered into after, the beginning of the earliest comparative period presented and excludes any leases that expired before the date of initial application. We are currently evaluating the impact the application of ASU 2016-02 will have on our financial statements and disclosures.
In May 2014, the FASB issued ASU 2014-09, Revenue from Contracts with Customers (Topic 606). ASU 2014-09 requires either retrospective application to each prior reporting period presented or retrospective application with the cumulative effect of initially applying the standard recognized at the date of adoption. In August 2015, the FASB issued ASU 2015-14, Revenue from Contracts with Customers (Topic 606) Deferral of the Effective Date, which extends the standard effective date by one year. As a result of this issuance, the standard will be effective for us on May 1, 2018, with the option to early adopt at the original effective date of May 1, 2017. We have performed a preliminary review of the new guidance as compared to our current accounting policies, and a contract review is in process. Based on our findings to date, we do not expect the standard to have a material impact on our results of operations or financial position. In 2017, we plan to finalize our review and determine our date of adoption.
Risks and Uncertainties: The raw materials we use are primarily commodities, agricultural-based products, and packaging materials. The principal packaging materials we use are plastic, glass, metal cans, caps, carton board, and corrugate. Green coffee, grains, peanuts, edible oils, sweeteners, fruit, and other ingredients are obtained from various suppliers. The availability, quality, and cost of many of these commodities have fluctuated, and may continue to fluctuate over time. Green coffee is sourced solely from foreign countries and its supply and price are subject to high volatility due to factors such as weather, global supply and demand, pest damage, speculative influences, and political and economic conditions in the source countries. Raw materials are generally available from numerous sources, although we have elected to source certain plastic packaging materials and finished goods, such as our Pup-Peroni® dog snacks, from single sources of supply pursuant to long-term contracts. While availability may vary from year to year, we believe that we will continue to be able to obtain adequate supplies and that alternatives to single-sourced materials are available. We have not historically encountered significant shortages of key raw materials. We consider our relationships with key material suppliers to be in good standing.
2016 ANNUAL REPORT 49
NOTES TO CONSOLIDATED FINANCIAL STATEMENTS
The J. M. Smucker Company
We have consolidated our production capacity for certain products, including substantially all of our coffee, Milk-Bone® dog snacks, and fruit spreads, syrups, and toppings production, into single manufacturing sites. Although steps are taken at all of our manufacturing sites to reduce the likelihood of a production disruption, an interruption at a single manufacturing site would result in a reduction or elimination of the availability of some of our products for a period of time.
Of our total employees, 30 percent are covered by union contracts at 11 manufacturing locations. The contracts vary in term, with one contract expiring in 2017, representing 8 percent of our total employees.
We insure our business and assets in each country against insurable risks, to the extent that we deem appropriate, based upon an analysis of the relative risks and costs.
NOTE 2 | ACQUISITIONS | |
On March 23, 2015, we completed the acquisition of Big Heart, a leading producer, distributor, and marketer of premium-quality, branded pet food and pet snacks in the U.S., through the acquisition of Blue Acquisition Group, Inc. (“BAG”), Big Heart’s parent company. As a result of the acquisition, the assets and liabilities of BAG are now held by the Company.
The total consideration paid in connection with the acquisition was $5.9 billion, as set forth below, which included the issuance of
17.9 million of our common shares to BAG’s former shareholders, valued at $2.0 billion based on the average stock price of our common shares on March 23, 2015. After the closing of the transaction, we had approximately 120.0 million common shares outstanding. We assumed $2.6 billion in debt, including Big Heart’s senior secured term loan and senior notes, and we paid an additional $1.2 billion in cash, net of a working capital adjustment. As part of the transaction, new debt of $5.5 billion was borrowed, as discussed in Note 8: Debt and Financing Arrangements.
Shares issued | $ | 2,035.5 | |
Assumed debt from Big Heart | 2,630.2 | ||
Cash consideration, net of cash acquired | 1,232.1 | ||
Total purchase price | $ | 5,897.8 | |
The final Big Heart purchase price was allocated to the underlying assets acquired and liabilities assumed based upon their estimated fair values at the date of acquisition. We determined the estimated fair values based on independent appraisals, discounted cash flow analyses, quoted market prices, and estimates made by management. The purchase price exceeded the estimated fair value of the net identifiable tangible and intangible assets acquired and, as such, the excess was allocated to goodwill.
In September 2015, the FASB issued ASU 2015-16, Business Combinations (Topic 805) Simplifying the Accounting for Measurement-Period Adjustments. ASU 2015-16 requires that adjustments identified during the measurement period be made to provisional amounts recognized in a business combination in the reporting period in which the acquirer determines the adjustments, including the effect on earnings of any amounts they would have recorded in previous periods if the accounting had been completed at the acquisition date.
ASU 2015-16 is effective for us on May 1, 2016, but we elected early adoption in the second quarter of 2016, as permitted. Based on early adoption of this ASU, effective with the reporting period beginning August 1, 2015, we no longer revise prior period results for adjustments to provisional amounts. Prior to our adoption of ASU 2015-16, changes to the preliminary fair values were retrospectively applied to the Consolidated Balance Sheet as of April 30, 2015, which included a net adjustment to goodwill of $1.8, as a result of a favorable working capital adjustment and other fair value adjustments. After our adoption of ASU 2015-16, changes to these preliminary fair values during 2016 resulted in a net adjustment to goodwill of $131.7, which is attributable to the finalization of the acquisition date fair value of goodwill and intangibles, certain liabilities, and the related impact on deferred taxes.
50 THE J. M.SMUCKER COMPANY
NOTES TO CONSOLIDATED FINANCIAL STATEMENTS
The J. M. Smucker Company
The following table summarizes the fair values of the assets acquired and liabilities assumed at the acquisition date.
Assets acquired: | |||
Trade receivables | $ | 142.0 | |
Inventories | 254.5 | ||
Other current assets | 191.3 | ||
Property, plant, and equipment | 324.0 | ||
Other intangible assets – net | 3,831.8 | ||
Goodwill | 3,004.7 | ||
Other noncurrent assets | 28.0 | ||
Total assets acquired | $ | 7,776.3 | |
Liabilities assumed: | |||
Current liabilities | $ | 446.8 | |
Deferred income taxes | 1,349.6 | ||
Other noncurrent liabilities | 82.1 | ||
Total liabilities assumed | $ | 1,878.5 | |
Net assets acquired | $ | 5,897.8 | |
As a result of the acquisition, we recognized a total of $3.0 billion of goodwill, representing the value we expect to achieve through the implementation of operational synergies and growth opportunities across our segments. Goodwill was allocated across all reportable segments based on the synergies anticipated to be achieved by each individual reporting unit as a result of the acquisition. Of the total goodwill, $70.4 was deductible for tax purposes. For additional information related to goodwill, refer to Note 7: Goodwill and Other Intangibles.
The purchase price was allocated to the identifiable intangible assets acquired as follows:
Intangible assets with finite lives: | |||
Customer relationships (25-year useful life) | $ | 2,111.8 | |
Trademarks (15-year useful life) | 257.0 | ||
Intangible assets with indefinite lives: | |||
Trademarks | 1,463.0 | ||
Total intangible assets | $ | 3,831.8 | |
Big Heart’s results of operations are included in our consolidated financial statements from the date of the transaction. Had the transaction occurred at the beginning of the full comparable prior year period, the unaudited pro forma consolidated results would have been as follows:
Year Ended April 30, 2015 | ||||
Net sales | $ | 7,732.5 | ||
Net income | 541.8 | |||
Net income per common share – assuming dilution | 4.53 | |||
The unaudited pro forma consolidated results are based on our historical financial statements and those of Big Heart, and do not necessarily indicate the results of operations that would have resulted had the acquisition been completed at the beginning of the full comparable prior year period. The most significant pro forma adjustments relate to amortization of intangible assets, higher interest expense associated with the new debt borrowed, and the impact of additional common shares issued as a result of the acquisition. The unaudited pro forma consolidated results do not give effect to the synergies of the acquisition and are not indicative of the results of operations in future periods.
2016 ANNUAL REPORT 51
NOTES TO CONSOLIDATED FINANCIAL STATEMENTS
The J. M. Smucker Company
In addition to the Big Heart acquisition, on September 2, 2014, we completed the acquisition of Sahale Snacks, Inc. (“Sahale”), a privately-held manufacturer and marketer of premium, branded nut and fruit snacks for $80.5 in cash, net of a working capital adjustment. As a result, Sahale became a wholly-owned subsidiary of the Company. The final Sahale purchase price was allocated to the underlying assets acquired and liabilities assumed based upon their estimated fair values at the date of acquisition. The purchase price allocation included total intangible assets of $30.4. The purchase price exceeded the estimated fair value of the net identifiable tangible and intangible assets acquired and, as a result, the excess was allocated to goodwill. Valuations resulted in Sahale goodwill of $47.0, and the entire amount was assigned to the U.S. Retail Consumer Foods segment. The results of operations of Sahale are included in the consolidated financial statements from the date of the transaction and did not have a material impact on the years ended April 30, 2016 and 2015.
NOTE 3 | INTEGRATION AND RESTRUCTURING COSTS | |
Integration Costs: Total one-time costs related to the Big Heart acquisition are anticipated to be approximately $275.0, of which approximately $50.0 are expected to be noncash charges. These costs are anticipated to be incurred through 2018 and primarily consist of employee-related costs, outside service and consulting costs, and other costs related to the acquisition. Employee separation costs include severance, retention bonuses, and relocation costs. Severance costs and retention bonuses are recognized over the estimated future service period of the affected employees and the remainder are expensed as incurred. The obligation related to employee separation costs is included in other current liabilities in the Consolidated Balance Sheets. Other costs include professional fees, information systems costs, and other miscellaneous expenditures associated with the integration, which are expensed as incurred. Of the total anticipated one-time costs, we expect to incur $120.0, $100.0, and $55.0 in employee-related costs, outside service and consulting costs, and other costs, respectively.
We incurred costs of $145.2 in 2016 related to the integration of Big Heart, resulting in total costs of $181.2 from the date of acquisition. The majority of these charges were reported in other special project costs in the Statements of Consolidated Income and are not allocated to segment profit. Total one-time costs related to the acquisition include $65.8, $72.1, and $43.3 of employee-related costs, outside service and consulting costs, and other costs, respectively, including noncash charges of $24.6, primarily consisting of share-based compensation and accelerated depreciation. In 2016, we incurred $52.4, $56.0, and $36.8 of employee-related costs, outside service and consulting costs, and other costs, respectively, including noncash charges of $18.9. The obligation related to severance costs and retention bonuses was $13.4 and $6.0 at April 30, 2016 and 2015, respectively.
Restructuring Costs: In addition to the integration costs discussed above, an organization optimization program was approved as part of our ongoing efforts to reduce costs, integrate, and optimize the combined organization, during the fourth quarter of 2016. Total restructuring costs are expected to be approximately $40.0, of which approximately half represents employee-related costs, with the remaining consisting of costs related to site preparation, equipment relocation, and production start-up. Included in the total restructuring costs are approximately $8.0 of noncash charges related to accelerated depreciation. In addition, we expect to invest approximately $15.0 to $17.0 in capital expenditures. We have incurred employee-related costs of $1.3 through April 30, 2016. The remaining costs are anticipated to be recognized through 2018, with the majority of the costs expected to be recognized in 2017. Upon completion, the restructuring plan will result in a reduction of approximately 125 full-time positions.
As part of this program, we will discontinue the production of coffee at our Harahan, Louisiana, facility and consolidate all roast and ground coffee production into one of our facilities in New Orleans, Louisiana, which we expect to complete by December 2017. Additionally, we will exit two leased facilities in Livermore, California, and consolidate all ancient grains and pasta production into our facility in Chico, California, which we expect to complete by January 2017.
During 2015, we completed a multi-year restructuring initiative that was focused on the coffee, fruit spreads, and Canadian pickle and condiment operations in an effort to achieve enhanced long-term strength and profitability of our leading brands. We incurred total restructuring costs of $263.6 through April 30, 2015. During the years ended April 30, 2015 and 2014, total restructuring charges of $15.4 and $20.8, respectively, were reported in the Statements of Consolidated Income, and there were no charges incurred in 2016. Of the total restructuring charges, $1.1 and $5.1 were reported in cost of products sold in the years ended April 30, 2015 and 2014, respectively. The remaining charges were reported in other special project costs. The restructuring costs classified as cost of products sold primarily include long-lived asset charges for accelerated depreciation related to property, plant, and equipment that had been used at the affected production facilities prior to closure.
52 THE J. M.SMUCKER COMPANY
NOTES TO CONSOLIDATED FINANCIAL STATEMENTS
The J. M. Smucker Company
NOTE 4 | DIVESTITURE | |
On December 31, 2015, we sold our U.S. canned milk brands and operations to Eagle Family Foods Group LLC, a subsidiary of funds affiliated with Kelso & Company. The transaction included canned milk products that were primarily sold in U.S. retail and foodservice channels under the Eagle Brand® and Magnolia® brands, along with other branded and private label trade names, with annual net sales of approximately $200.0. Our manufacturing facilities in El Paso, Texas, and Seneca, Missouri, were included in the transaction, but our canned milk business in Canada was not included.
The operating results for this business were primarily included in the U.S. Retail Consumer Foods segment prior to the sale on December 31, 2015. We received proceeds from the divestiture of $193.7, which were net of transaction costs and a working capital adjustment. Upon completion of the transaction, we recognized a pre-tax gain of $25.3 in 2016, which is included in other operating income – net within the Statement of Consolidated Income.
NOTE 5 | REPORTABLE SEGMENTS | |
We operate in one industry: the manufacturing and marketing of food and beverage products. Effective May 1, 2015, our reportable segments were modified to align with the way performance is currently evaluated by our segment management and chief operating decision maker, our Chief Executive Officer, and the way in which we currently report information internally. We now have three reportable segments: U.S. Retail Coffee, U.S. Retail Consumer Foods, and U.S. Retail Pet Foods. Within our segment results, International and Foodservice represents a combination of the strategic business areas not included in the U.S. retail market segments. The U.S. Retail Consumer Foods segment is a combination of the former U.S. Retail Consumer Foods segment and the Natural Foods strategic business area, previously included in the former International, Foodservice, and Natural Foods segment. Prior year segment results have been modified to reflect the realignment of our segments.
The U.S. Retail Coffee segment primarily includes the domestic sales of Folgers®, Dunkin’ Donuts®, and Café Bustelo® branded coffee; the U.S. Retail Consumer Foods segment primarily includes domestic sales of Jif®, Smucker’s®, Crisco®, and Pillsbury® branded products; and the U.S. Retail Pet Foods segment primarily includes domestic sales of Meow Mix®, Milk-Bone, Natural Balance®, Kibbles ’n Bits®, 9Lives®, Pup-Peroni, Nature’s Recipe®, and Gravy Train® branded products. International and Foodservice is comprised of products distributed domestically and in foreign countries through retail channels and foodservice distributors and operators (e.g., restaurants, lodging, schools and universities, health care operators).
Segment profit represents net sales, less direct and allocable operating expenses, and is consistent with the way in which we manage our segments. However, we do not represent that the segments, if operated independently, would report operating profit equal to the segment profit set forth below, as segment profit excludes certain operating expenses such as corporate administrative expenses and unallocated gains and losses on commodity and foreign currency exchange derivative activities. Commodity and foreign currency exchange derivative gains and losses are reported in unallocated derivative gains and losses outside of segment operating results until the related inventory is sold. At that time, we reclassify the hedge gains and losses from unallocated derivative gains and losses to segment profit, allowing our segments to realize the economic effect of the hedge without experiencing any mark-to-market volatility. We would expect that any gain or loss in the estimated fair value of the derivatives would generally be offset by a change in the estimated fair value of the underlying exposures.
2016 ANNUAL REPORT 53
NOTES TO CONSOLIDATED FINANCIAL STATEMENTS
The J. M. Smucker Company
Year Ended April 30, | |||||||||||
2016 | 2015 | 2014 | |||||||||
Net sales: | |||||||||||
U.S. Retail Coffee | $ | 2,239.2 | $ | 2,076.1 | $ | 2,161.7 | |||||
U.S. Retail Consumer Foods | 2,269.7 | 2,330.8 | 2,379.9 | ||||||||
U.S. Retail Pet Foods | 2,250.4 | 239.1 | — | ||||||||
International and Foodservice | 1,051.9 | 1,046.7 | 1,069.0 | ||||||||
Total net sales | $ | 7,811.2 | $ | 5,692.7 | $ | 5,610.6 | |||||
Segment profit (loss): | |||||||||||
U.S. Retail Coffee | $ | 645.9 | $ | 549.2 | $ | 639.8 | |||||
U.S. Retail Consumer Foods | 459.9 | 459.2 | 420.1 | ||||||||
U.S. Retail Pet Foods | 392.0 | (15.3 | ) | — | |||||||
International and Foodservice | 156.8 | 140.4 | 140.7 | ||||||||
Total segment profit | $ | 1,654.6 | $ | 1,133.5 | $ | 1,200.6 | |||||
Interest expense – net | (171.1 | ) | (79.9 | ) | (79.4 | ) | |||||
Other debt costs | — | (173.3 | ) | — | |||||||
Unallocated derivative gains (losses) | 12.0 | (24.5 | ) | 5.3 | |||||||
Cost of products sold – special project costs | (12.2 | ) | (6.2 | ) | (9.4 | ) | |||||
Other special project costs | (135.9 | ) | (56.6 | ) | (25.6 | ) | |||||
Corporate administrative expenses | (373.2 | ) | (274.2 | ) | (251.9 | ) | |||||
Other income – net | 3.7 | 4.2 | 10.1 | ||||||||
Income before income taxes | $ | 977.9 | $ | 523.0 | $ | 849.7 | |||||
Assets: | |||||||||||
U.S. Retail Coffee | $ | 5,002.0 | $ | 4,852.4 | $ | 4,884.0 | |||||
U.S. Retail Consumer Foods | 3,288.5 | 3,063.1 | 2,908.8 | ||||||||
U.S. Retail Pet Foods | 6,321.6 | 7,556.4 | — | ||||||||
International and Foodservice | 1,168.6 | 1,105.1 | 1,018.2 | ||||||||
Unallocated (A) | 203.4 | 229.3 | 230.4 | ||||||||
Total assets | $ | 15,984.1 | $ | 16,806.3 | $ | 9,041.4 | |||||
Depreciation, amortization, and impairment charges: | |||||||||||
U.S. Retail Coffee | $ | 104.0 | $ | 102.7 | $ | 99.9 | |||||
U.S. Retail Consumer Foods | 60.7 | 59.4 | 57.6 | ||||||||
U.S. Retail Pet Foods | 164.9 | 14.3 | — | ||||||||
International and Foodservice | 66.2 | 60.7 | 62.7 | ||||||||
Unallocated (B) | 34.3 | 31.3 | 36.2 | ||||||||
Total depreciation, amortization, and impairment charges | $ | 430.1 | $ | 268.4 | $ | 256.4 | |||||
Additions to property, plant, and equipment: | |||||||||||
U.S. Retail Coffee | $ | 51.4 | $ | 56.7 | $ | 50.7 | |||||
U.S. Retail Consumer Foods | 90.3 | 117.7 | 145.3 | ||||||||
U.S. Retail Pet Foods | 11.9 | 19.4 | — | ||||||||
International and Foodservice | 47.8 | 53.9 | 83.5 | ||||||||
Total additions to property, plant, and equipment | $ | 201.4 | $ | 247.7 | $ | 279.5 | |||||
(A) Primarily represents unallocated cash and cash equivalents and corporate-held investments.
(B) Primarily represents unallocated corporate administrative expense, mainly depreciation and software amortization.
54 THE J. M.SMUCKER COMPANY
NOTES TO CONSOLIDATED FINANCIAL STATEMENTS
The J. M. Smucker Company
The following table presents certain geographical information.
Year Ended April 30, | |||||||||||
2016 | 2015 | 2014 | |||||||||
Net sales: | |||||||||||
United States | $ | 7,300.8 | $ | 5,188.5 | $ | 5,092.0 | |||||
International: | |||||||||||
Canada | $ | 416.0 | $ | 413.8 | $ | 437.2 | |||||
All other international | 94.4 | 90.4 | 81.4 | ||||||||
Total international | $ | 510.4 | $ | 504.2 | $ | 518.6 | |||||
Total net sales | $ | 7,811.2 | $ | 5,692.7 | $ | 5,610.6 | |||||
Assets: | |||||||||||
United States | $ | 15,501.1 | $ | 16,332.0 | $ | 8,621.4 | |||||
International: | |||||||||||
Canada | $ | 396.2 | $ | 360.8 | $ | 256.1 | |||||
All other international | 86.8 | 113.5 | 163.9 | ||||||||
Total international | $ | 483.0 | $ | 474.3 | $ | 420.0 | |||||
Total assets | $ | 15,984.1 | $ | 16,806.3 | $ | 9,041.4 | |||||
Long-lived assets (excluding goodwill and other intangible assets): | |||||||||||
United States | $ | 1,773.9 | $ | 1,805.3 | $ | 1,343.2 | |||||
International: | |||||||||||
Canada | $ | 10.7 | $ | 14.3 | $ | 16.5 | |||||
All other international | 40.6 | 40.9 | 38.9 | ||||||||
Total international | $ | 51.3 | $ | 55.2 | $ | 55.4 | |||||
Total long-lived assets (excluding goodwill and other intangible assets) | $ | 1,825.2 | $ | 1,860.5 | $ | 1,398.6 | |||||
The following table presents product category sales as a percentage of consolidated net sales.
Year Ended April 30, | |||||||||||
2016 | 2015 | 2014 | |||||||||
Coffee | 34 | % | 44 | % | 46 | % | |||||
Pet food | 19 | 3 | — | ||||||||
Pet snacks | 10 | 1 | — | ||||||||
Peanut butter | 9 | 13 | 13 | ||||||||
Fruit spreads | 4 | 6 | 6 | ||||||||
Shortening and oils | 4 | 6 | 6 | ||||||||
Baking mixes and frostings | 3 | 5 | 6 | ||||||||
Frozen handheld | 3 | 3 | 3 | ||||||||
Canned milk | 3 | 4 | 5 | ||||||||
Flour and baking ingredients | 2 | 4 | 4 | ||||||||
Juices and beverages | 2 | 3 | 3 | ||||||||
Portion control | 2 | 2 | 2 | ||||||||
Other | 5 | 6 | 6 | ||||||||
Total product sales | 100 | % | 100 | % | 100 | % | |||||
Sales to Wal-Mart Stores, Inc. and subsidiaries amounted to 30 percent, 28 percent, and 27 percent of net sales in 2016, 2015, and 2014, respectively. These sales are primarily included in our U.S. retail market segments. No other customer exceeded 10 percent of net sales for any year. Trade receivables at April 30, 2016 and 2015, included amounts due from Wal-Mart Stores, Inc. and subsidiaries of $118.1 and $122.6, respectively.
2016 ANNUAL REPORT 55
NOTES TO CONSOLIDATED FINANCIAL STATEMENTS
The J. M. Smucker Company
NOTE 6 | EARNINGS PER SHARE | |
The following table sets forth the computation of net income per common share and net income per common share – assuming dilution under the two-class method.
Year Ended April 30, | ||||||||||||
2016 | 2015 | 2014 | ||||||||||
Net income | $ | 688.7 | $ | 344.9 | $ | 565.2 | ||||||
Less: Net income allocated to participating securities | 3.0 | 2.2 | 4.5 | |||||||||
Net income allocated to common stockholders | $ | 685.7 | $ | 342.7 | $ | 560.7 | ||||||
Weighted-average common shares outstanding | 118,918,701 | 103,038,271 | 103,504,121 | |||||||||
Add: Dilutive effect of stock options | 41,113 | 5,283 | 14,346 | |||||||||
Weighted-average common shares outstanding – assuming dilution | 118,959,814 | 103,043,554 | 103,518,467 | |||||||||
Net income per common share | $ | 5.77 | $ | 3.33 | $ | 5.42 | ||||||
Net income per common share – assuming dilution | $ | 5.76 | $ | 3.33 | $ | 5.42 | ||||||
NOTE 7 | GOODWILL AND OTHER INTANGIBLE ASSETS | |
A summary of changes in goodwill during the years ended April 30, 2016 and 2015, by reportable segment is as follows:
U.S. Retail Coffee | U.S. Retail Consumer Foods | U.S. Retail Pet Foods | International and Foodservice | Total | ||||||||||||||||
Balance at May 1, 2014 | $ | 1,743.1 | $ | 1,095.5 | $ | — | $ | 259.6 | $ | 3,098.2 | ||||||||||
Acquisitions | (0.3 | ) | 47.9 | 2,812.1 | 60.9 | 2,920.6 | ||||||||||||||
Other (A) | 0.1 | (2.6 | ) | — | (4.7 | ) | (7.2 | ) | ||||||||||||
Balance at April 30, 2015 | $ | 1,742.9 | $ | 1,140.8 | $ | 2,812.1 | $ | 315.8 | $ | 6,011.6 | ||||||||||
Acquisitions (B) | 348.0 | 494.7 | (842.6 | ) | 130.7 | 130.8 | ||||||||||||||
Divestiture | — | (33.6 | ) | — | (14.2 | ) | (47.8 | ) | ||||||||||||
Other (A) | — | (1.0 | ) | — | (2.5 | ) | (3.5 | ) | ||||||||||||
Balance at April 30, 2016 | $ | 2,090.9 | $ | 1,600.9 | $ | 1,969.5 | $ | 429.8 | $ | 6,091.1 | ||||||||||
(A) | The amounts classified as other represent foreign currency exchange for the years ended April 30, 2016 and 2015. |
(B) | As a result of the Big Heart acquisition, we recognized a total of $3.0 billion of goodwill, representing the value we expect to achieve through the implementation of operational synergies and growth opportunities across our segments, which includes finalization of the fair value adjustments, as discussed in Note 2: Acquisitions. In addition, the goodwill related to the 2015 acquisition was allocated across all reportable segments based on the synergies anticipated to be achieved by each individual reporting unit, which were finalized in 2016. The purchase price allocation was finalized for the Sahale acquisition in 2016, resulting in an immaterial adjustment to goodwill. |
56 THE J. M.SMUCKER COMPANY
NOTES TO CONSOLIDATED FINANCIAL STATEMENTS
The J. M. Smucker Company
The following table summarizes our other intangible assets and related accumulated amortization and impairment charges, including foreign currency exchange.
April 30, 2016 | April 30, 2015 | |||||||||||||||||||||||
Acquisition Cost | Accumulated Amortization/ Impairment Charges/ Foreign Currency Exchange | Net | Acquisition Cost | Accumulated Amortization/ Impairment Charges/ Foreign Currency Exchange | Net | |||||||||||||||||||
Finite-lived intangible assets subject to amortization: | ||||||||||||||||||||||||
Customer and contractual relationships | $ | 3,520.1 | $ | 639.9 | $ | 2,880.2 | $ | 3,733.9 | $ | 477.9 | $ | 3,256.0 | ||||||||||||
Patents and technology | 168.5 | 88.4 | 80.1 | 169.0 | 74.8 | 94.2 | ||||||||||||||||||
Trademarks | 525.4 | 78.7 | 446.7 | 328.0 | 47.6 | 280.4 | ||||||||||||||||||
Total intangible assets subject to amortization | $ | 4,214.0 | $ | 807.0 | $ | 3,407.0 | $ | 4,230.9 | $ | 600.3 | $ | 3,630.6 | ||||||||||||
Indefinite-lived intangible assets not subject to amortization: | ||||||||||||||||||||||||
Trademarks | $ | 3,109.1 | $ | 21.7 | $ | 3,087.4 | $ | 3,338.0 | $ | 18.3 | $ | 3,319.7 | ||||||||||||
Total other intangible assets | $ | 7,323.1 | $ | 828.7 | $ | 6,494.4 | $ | 7,568.9 | $ | 618.6 | $ | 6,950.3 | ||||||||||||
Amortization expense for finite-lived intangible assets was $204.7, $110.3, and $98.7 in 2016, 2015, and 2014, respectively. The weighted-average useful lives of the customer and contractual relationships, patents and technology, and trademarks are 23, 13, and 16 years, respectively. The weighted-average useful life of total finite-lived intangible assets is 22 years. Based on the carrying amount of intangible assets subject to amortization at April 30, 2016, the estimated amortization expense is $206.9 for 2017, $204.4 for 2018, $202.7 for 2019, $198.3 for 2020, and $196.7 for 2021. During 2016, we began amortizing the Crisco trademark that was previously an indefinite-lived intangible. The trademark was included in the annual impairment review performed as of February 1, 2016, and was not impaired. The annual amortization expense related to the Crisco trademark is approximately $8.0.
We review goodwill and other indefinite-lived intangible assets at least annually for impairment. The annual impairment review was performed as of February 1, 2016. Goodwill impairment is tested at the reporting unit level. At February 1, 2016, we had seven reporting units. No goodwill impairment was recognized as a result of the annual evaluation performed as of February 1, 2016. The estimated fair value of each reporting unit and material other indefinite-lived intangible asset was substantially in excess of its carrying value as of the annual test date, with the exception of the Pet Food reporting unit and all trademarks within the U.S. Retail Pet Foods segment. The fair value of the Pet Foods reporting unit exceeded the carrying value by $198.0, or 4 percent. A sensitivity analysis was performed for the Pet Foods reporting unit, assuming a hypothetical 50-basis-point decrease in the expected long-term growth rate and yielded an estimated fair value slightly below carrying value. The trademarks acquired with Big Heart are also equally as sensitive to a hypothetical 50-basis-point decrease in the expected long-term growth rate for the Pet Foods reporting unit. The goodwill and intangibles related to the U.S. Retail Pet Food segment resulting from the Big Heart acquisition remain susceptible to future impairment as the current fair values are close to the carrying values at date of the acquisition. A change to the assumptions regarding future performance of the U.S. Retail Pet Foods segment, or a portion of it, or a change to other assumptions, could result in impairment losses in the future.
2016 ANNUAL REPORT 57
NOTES TO CONSOLIDATED FINANCIAL STATEMENTS
The J. M. Smucker Company
NOTE 8 | DEBT AND FINANCING ARRANGEMENTS | |
Long-term debt consists of the following:
April 30, 2016 | April 30, 2015 | |||||||||||||||
Principal Outstanding | Carrying Amount (A) | Principal Outstanding | Carrying Amount (A) | |||||||||||||
1.75% Senior Notes due March 15, 2018 | $ | 500.0 | $ | 498.0 | $ | 500.0 | $ | 496.9 | ||||||||
2.50% Senior Notes due March 15, 2020 | 500.0 | 495.5 | 500.0 | 494.3 | ||||||||||||
3.50% Senior Notes due October 15, 2021 | 750.0 | 789.4 | 750.0 | 796.0 | ||||||||||||
3.00% Senior Notes due March 15, 2022 | 400.0 | 395.9 | 400.0 | 395.3 | ||||||||||||
3.50% Senior Notes due March 15, 2025 | 1,000.0 | 992.7 | 1,000.0 | 991.9 | ||||||||||||
4.25% Senior Notes due March 15, 2035 | 650.0 | 642.2 | 650.0 | 641.8 | ||||||||||||
4.38% Senior Notes due March 15, 2045 | 600.0 | 584.4 | 600.0 | 583.8 | ||||||||||||
Term Loan Credit Agreement due March 23, 2020 | 750.0 | 747.9 | 1,550.0 | 1,544.9 | ||||||||||||
Total long-term debt | $ | 5,150.0 | $ | 5,146.0 | $ | 5,950.0 | $ | 5,944.9 | ||||||||
(A) Represents the carrying amount included in the Consolidated Balance Sheets, which includes the impact of interest rate swaps, offering discounts, and capitalized debt issuance costs.
In March 2015, we entered into a senior unsecured delayed-draw Term Loan Credit Agreement (“Term Loan”) with a syndicate of banks and an available commitment amount of $1.8 billion. Borrowings under the Term Loan bear interest on the prevailing U.S. Prime Rate or London Interbank Offered Rate (“LIBOR”), based on our election, and is payable either on a quarterly basis or at the end of the borrowing term. The weighted-average interest rate on the Term Loan at April 30, 2016, was 1.69 percent. The Term Loan requires quarterly amortization payments of 2.50 percent of the original principal amount starting in the third quarter of 2016. Voluntary prepayments are permitted without premium or penalty and are applied to the schedule of required quarterly minimum payment obligations in direct order of maturity. As of April 30, 2016, we have prepaid $1.0 billion on the Term Loan to date, including $800.0 in 2016, and therefore no additional payments are required until final maturity of the loan agreement on March 23, 2020.
Also in March 2015, we completed an offering of $3.7 billion in Senior Notes due beginning March 15, 2018 through March 15, 2045. The proceeds from the offering, along with the Term Loan, were used to partially finance the Big Heart acquisition, pay off the debt assumed as part of the acquisition, and prepay our privately placed Senior Notes. The prepayment of our Senior Notes resulted in a principal prepayment of $1.1 billion and $163.3 of related make-whole payments. Other debt costs of $173.3 in the Statement of Consolidated Income consist primarily of make-whole payments and Bridge Loan financing fees, offset by the write-off of the remaining fair value interest rate swap gain.
All of our Senior Notes outstanding at April 30, 2016, are unsecured and interest is paid semiannually. There are no required scheduled principal payments on our Senior Notes. We may prepay at any time all or part of the Senior Notes at 100 percent of the principal amount thereof, together with the accrued and unpaid interest, and any applicable make-whole amount.
During 2015, we entered into a series of forward-starting interest rate swaps that were designated as cash flow hedges. In conjunction with the pricing of the series of Senior Notes, we terminated the interest rate swaps prior to maturity, resulting in a net loss of $4.0, which will be amortized over the life of the remaining debt. During 2014, we entered into an interest rate swap designated as a fair value hedge of the
3.50 percent Senior Notes due October 15, 2021. In 2015, we terminated the interest rate swap agreement and we received $58.1 in cash. At April 30, 2016, the remaining benefit of $43.9 was recorded as an increase in the long-term debt balance and will be recognized ratably as a reduction to future interest expense over the remaining life of the related debt. For additional information, see Note 10: Derivative Financial Instruments.
We have available a $1.5 billion revolving credit facility with a group of 11 banks that matures in September 2018. Borrowings under the revolving credit facility bear interest based on the prevailing U.S. Prime Rate, Canadian Base Rate, LIBOR, or Canadian Dealer Offered Rate, based on our election. Interest is payable either on a quarterly basis or at the end of the borrowing term. At April 30, 2016 and 2015, we did not have a balance outstanding under the revolving credit facility.
During 2015, we entered into a commercial paper program under which we can issue short-term, unsecured commercial paper not to exceed $1.0 billion at any time. The commercial paper program is backed by our revolving credit facility and reduces what we can borrow under the revolving credit facility by the amount of commercial paper outstanding. Commercial paper will be used as a continuing source of short-term financing for general corporate purposes. As of April 30, 2016 and 2015, we had $284.0 and $226.0 of short-term borrowings outstanding, all of which were issued under our commercial paper program at a weighted-average interest rate of 0.65 percent and 0.45 percent, respectively.
58 THE J. M.SMUCKER COMPANY
NOTES TO CONSOLIDATED FINANCIAL STATEMENTS
The J. M. Smucker Company
Interest paid totaled $167.3, $92.3, and $83.3 in 2016, 2015, and 2014, respectively. This differs from interest expense due to the timing of payments, amortization of fair value swap adjustments, effect of the interest rate swap, amortization of debt issuance costs, and capitalized interest.
Our debt instruments contain certain financial covenant restrictions, including a leverage ratio and an interest coverage ratio. We are in compliance with all covenants.
NOTE 9 | PENSIONS AND OTHER POSTRETIREMENT BENEFITS | |
We have defined benefit pension plans covering certain U.S. and Canadian employees, including the acquired pension and other postretirement plans of Big Heart. Pension benefits are based on the employee’s years of service and compensation levels. Our plans are funded in conformity with the funding requirements of applicable government regulations.
In addition to providing pension benefits, we sponsor several unfunded postretirement plans that provide health care and life insurance benefits to certain retired U.S. and Canadian employees. These plans are contributory, with retiree contributions adjusted periodically, and contain other cost-sharing features, such as deductibles and coinsurance. Covered employees generally are eligible for these benefits when they reach age 55 and have attained 10 years of credited service.
The following table summarizes the components of net periodic benefit cost and the change in accumulated other comprehensive loss related to the defined benefit pension and other postretirement plans.
Defined Benefit Pension Plans | Other Postretirement Benefits | |||||||||||||||||||||||
Year Ended April 30, | 2016 | 2015 | 2014 | 2016 | 2015 | 2014 | ||||||||||||||||||
Service cost | $ | 17.8 | $ | 9.0 | $ | 8.7 | $ | 2.3 | $ | 2.3 | $ | 2.3 | ||||||||||||
Interest cost | 27.7 | 23.2 | 21.8 | 2.8 | 2.4 | 2.3 | ||||||||||||||||||
Expected return on plan assets | (32.9 | ) | (25.6 | ) | (25.4 | ) | — | — | — | |||||||||||||||
Amortization of prior service cost (credit) | 0.7 | 1.0 | 1.2 | (1.1 | ) | (1.1 | ) | (1.1 | ) | |||||||||||||||
Amortization of net actuarial loss (gain) | 10.9 | 10.0 | 13.2 | (0.3 | ) | (0.1 | ) | — | ||||||||||||||||
Curtailment gain | (6.5 | ) | — | — | (0.3 | ) | — | — | ||||||||||||||||
Settlement loss | — | 3.5 | — | — | — | — | ||||||||||||||||||
Net periodic benefit cost | $ | 17.7 | $ | 21.1 | $ | 19.5 | $ | 3.4 | $ | 3.5 | $ | 3.5 | ||||||||||||
Other changes in plan assets and benefit liabilities recognized in accumulated other comprehensive loss before income taxes: | ||||||||||||||||||||||||
Prior service (cost) credit arising during the year | $ | (5.3 | ) | $ | (0.3 | ) | $ | — | $ | — | $ | — | $ | 1.7 | ||||||||||
Net actuarial (loss) gain arising during the year | (43.3 | ) | (23.7 | ) | 19.3 | — | 1.6 | 7.5 | ||||||||||||||||
Amortization of prior service cost (credit) | 0.7 | 1.0 | 1.2 | (1.1 | ) | (1.1 | ) | (1.1 | ) | |||||||||||||||
Amortization of net actuarial loss (gain) | 10.9 | 10.0 | 13.2 | (0.3 | ) | (0.1 | ) | — | ||||||||||||||||
Curtailment gain | (6.5 | ) | — | — | (0.3 | ) | — | — | ||||||||||||||||
Settlement loss | — | 3.5 | — | — | — | — | ||||||||||||||||||
Foreign currency translation | 0.8 | 2.7 | 2.9 | — | — | — | ||||||||||||||||||
Net change for year | $ | (42.7 | ) | $ | (6.8 | ) | $ | 36.6 | $ | (1.7 | ) | $ | 0.4 | $ | 8.1 | |||||||||
Weighted-average assumptions used in determining net periodic benefit costs: | |||||||||||||||||||||||
U.S. plans: | |||||||||||||||||||||||
Discount rate | 4.06 | % | 4.42 | % | 3.99 | % | 4.04 | % | 4.27 | % | 3.80 | % | |||||||||||
Expected return on plan assets | 6.58 | 6.72 | 6.75 | — | — | — | |||||||||||||||||
Rate of compensation increase | 4.06 | 4.13 | 4.13 | — | — | — | |||||||||||||||||
Canadian plans: | |||||||||||||||||||||||
Discount rate | 3.51 | % | 4.11 | % | 3.65 | % | 3.50 | % | 4.10 | % | 3.70 | % | |||||||||||
Expected return on plan assets | 5.65 | 5.64 | 5.78 | — | — | — | |||||||||||||||||
Rate of compensation increase | 3.00 | 3.00 | 3.00 | — | — | — | |||||||||||||||||
2016 ANNUAL REPORT 59
NOTES TO CONSOLIDATED FINANCIAL STATEMENTS
The J. M. Smucker Company
We amortize gains and losses for our postretirement plans over the average expected future period of vested service. For plans that consist of less than 5 percent of participants that are active, average life expectancy is used instead of the average expected useful service period.
We use a measurement date of April 30 to determine defined benefit pension and other postretirement benefit plans’ assets and benefit obligations. The following table sets forth the combined status of the plans as recognized in the Consolidated Balance Sheets.
Defined Benefit Pension Plans | Other Postretirement Benefits | ||||||||||||||
April 30, | 2016 | 2015 | 2016 | 2015 | |||||||||||
Change in benefit obligation: | |||||||||||||||
Benefit obligation at beginning of year | $ | 740.4 | $ | 542.3 | $ | 75.8 | $ | 58.5 | |||||||
Service cost | 17.8 | 9.0 | 2.3 | 2.3 | |||||||||||
Interest cost | 27.7 | 23.2 | 2.8 | 2.4 | |||||||||||
Amendments | 5.3 | 0.3 | — | — | |||||||||||
Actuarial loss (gain) | 20.3 | 39.8 | 0.3 | (1.6 | ) | ||||||||||
Participant contributions | 0.1 | 0.1 | 0.6 | 0.7 | |||||||||||
Benefits paid | (45.7 | ) | (31.8 | ) | (5.2 | ) | (4.4 | ) | |||||||
Foreign currency translation adjustments | (4.1 | ) | (10.6 | ) | (0.4 | ) | (1.1 | ) | |||||||
Curtailment | (10.1 | ) | — | (0.3 | ) | — | |||||||||
Settlement | (3.0 | ) | (8.6 | ) | — | — | |||||||||
Acquisition | (2.8 | ) | 176.7 | — | 18.9 | ||||||||||
Other adjustments | — | — | — | 0.1 | |||||||||||
Benefit obligation at end of year | $ | 745.9 | $ | 740.4 | $ | 75.9 | $ | 75.8 | |||||||
Change in plan assets: | |||||||||||||||
Fair value of plan assets at beginning of year | $ | 550.0 | $ | 402.1 | $ | — | $ | — | |||||||
Actual return on plan assets | (0.2 | ) | 41.7 | — | — | ||||||||||
Company contributions | 8.6 | 15.7 | 4.6 | 3.7 | |||||||||||
Participant contributions | 0.1 | 0.1 | 0.6 | 0.7 | |||||||||||
Benefits paid | (45.7 | ) | (31.8 | ) | (5.2 | ) | (4.4 | ) | |||||||
Settlement | (3.0 | ) | (8.6 | ) | — | — | |||||||||
Acquisition | — | 141.1 | — | — | |||||||||||
Foreign currency translation adjustments | (4.2 | ) | (10.3 | ) | — | — | |||||||||
Fair value of plan assets at end of year | $ | 505.6 | $ | 550.0 | $ | — | $ | — | |||||||
Funded status of the plans | $ | (240.3 | ) | $ | (190.4 | ) | $ | (75.9 | ) | $ | (75.8 | ) | |||
Defined benefit pensions | $ | (222.3 | ) | $ | (188.9 | ) | $ | — | $ | — | |||||
Other noncurrent assets | — | 2.0 | — | — | |||||||||||
Accrued compensation | (18.0 | ) | (3.5 | ) | — | (1.2 | ) | ||||||||
Postretirement benefits other than pensions | — | — | (75.9 | ) | (74.6 | ) | |||||||||
Net benefit liability | $ | (240.3 | ) | $ | (190.4 | ) | $ | (75.9 | ) | $ | (75.8 | ) | |||
The following table summarizes amounts recognized in accumulated other comprehensive loss in the Consolidated Balance Sheets, before income taxes.
Defined Benefit Pension Plans | Other Postretirement Benefits | ||||||||||||||
April 30, | 2016 | 2015 | 2016 | 2015 | |||||||||||
Net actuarial (loss) gain | $ | (212.3 | ) | $ | (174.2 | ) | $ | 6.3 | $ | 6.9 | |||||
Prior service (cost) credit | (8.8 | ) | (4.2 | ) | 9.2 | 10.3 | |||||||||
Total recognized in accumulated other comprehensive loss | $ | (221.1 | ) | $ | (178.4 | ) | $ | 15.5 | $ | 17.2 | |||||
During 2017, we expect to recognize amortization of net actuarial losses and prior service cost of $14.8 and $0.2, respectively, in net periodic benefit cost.
60 THE J. M.SMUCKER COMPANY
NOTES TO CONSOLIDATED FINANCIAL STATEMENTS
The J. M. Smucker Company
The following table sets forth the weighted-average assumptions used in determining the benefit obligations.
Defined Benefit Pension Plans | Other Postretirement Benefits | ||||||||||||||
April 30, | 2016 | 2015 | 2016 | 2015 | |||||||||||
U.S. plans: | |||||||||||||||
Discount rate | 3.76 | % | 4.01 | % | 3.80 | % | 3.97 | % | |||||||
Rate of compensation increase | 3.96 | 4.06 | — | — | |||||||||||
Canadian plans: | |||||||||||||||
Discount rate | 3.60 | % | 3.51 | % | 3.50 | % | 3.50 | % | |||||||
Rate of compensation increase | 3.00 | 3.00 | — | — | |||||||||||
For 2017, the assumed health care trend rates are 7.3 percent and 4.5 percent for the U.S. and Canadian plans, respectively. The rate for participants under age 65 is assumed to decrease to 5.0 percent in 2026 for U.S. plans and stay consistent at 4.5 percent in 2017 for Canadian plans. The health care cost trend rate assumption impacts the amount of the other postretirement benefits obligation and periodic other postretirement benefits cost reported. A one percentage point annual change in the assumed health care cost trend rate would have the following effect as of April 30, 2016:
One Percentage Point | ||||||||
Increase | Decrease | |||||||
Effect on total service and interest cost components | $ | 0.1 | $ | 0.1 | ||||
Effect on benefit obligation | 2.2 | 2.1 | ||||||
The following table sets forth selective information pertaining to our Canadian pension and other postretirement benefit plans, which is included in the consolidated information presented on pages 59 and 60.
Defined Benefit Pension Plans | Other Postretirement Benefits | ||||||||||||||
Year Ended April 30, | 2016 | 2015 | 2016 | 2015 | |||||||||||
Benefit obligation at end of year | $ | 97.3 | $ | 104.4 | $ | 10.2 | $ | 10.9 | |||||||
Fair value of plan assets at end of year | 96.0 | 104.1 | — | — | |||||||||||
Funded status of the plans | $ | (1.3 | ) | $ | (0.3 | ) | $ | (10.2 | ) | $ | (10.9 | ) | |||
Components of net periodic benefit cost: | |||||||||||||||
Service cost | $ | 0.3 | $ | 0.4 | $ | — | $ | — | |||||||
Interest cost | 3.3 | 4.3 | 0.3 | 0.4 | |||||||||||
Expected return on plan assets | (5.4 | ) | (5.6 | ) | — | — | |||||||||
Amortization of net actuarial loss | 0.8 | 0.9 | — | — | |||||||||||
Net periodic benefit cost | $ | (1.0 | ) | $ | — | $ | 0.3 | $ | 0.4 | ||||||
Changes in plan assets: | |||||||||||||||
Company contributions | $ | 3.3 | $ | 5.1 | $ | 0.6 | $ | 0.7 | |||||||
Participant contributions | 0.1 | 0.1 | — | — | |||||||||||
Benefits paid | (6.7 | ) | (8.4 | ) | (0.6 | ) | (0.7 | ) | |||||||
Actual return on plan assets | (0.6 | ) | 11.9 | — | — | ||||||||||
Foreign currency translation | (4.2 | ) | (10.3 | ) | — | — | |||||||||
The following table sets forth additional information related to our defined benefit pension plans.
April 30, | |||||||
2016 | 2015 | ||||||
Accumulated benefit obligation for all pension plans | $ | 697.5 | $ | 691.8 | |||
Plans with an accumulated benefit obligation in excess of plan assets: | |||||||
Accumulated benefit obligation | $ | 697.5 | $ | 481.6 | |||
Fair value of plan assets | 505.6 | 337.8 | |||||
Plans with a projected benefit obligation in excess of plan assets: | |||||||
Projected benefit obligation | $ | 745.9 | $ | 669.3 | |||
Fair value of plan assets | 505.6 | 477.3 | |||||
2016 ANNUAL REPORT 61
NOTES TO CONSOLIDATED FINANCIAL STATEMENTS
The J. M. Smucker Company
We employ a total return on investment approach for the defined benefit pension plans’ assets. A mix of equity, fixed-income, and alternative investments is used to maximize the long-term rate of return on assets for the level of risk. In determining the expected long-term rate of return on the defined benefit pension plans’ assets, we consider the historical rates of return, the nature of investments, the asset allocation, and expectations of future investment strategies. The actual rate of return was 1.7 percent and 11.6 percent for the years ended April 30, 2016 and 2015, respectively, which excludes administrative and investment expenses.
In May 2015, the FASB issued ASU 2015-07, Fair Value Measurement (Topic 820) Disclosure for Investments in Certain Entities That Calculate Net Asset Value per Share (or Its Equivalent). ASU 2015-07 requires that investments measured using the net asset value (“NAV”) per share, or its equivalent practical expedient, be disclosed as a reconciling item between the balance sheet amounts and the amounts reported in the fair value hierarchy. Although ASU 2015-07 is not effective for us until May 1, 2016, we elected early adoption, as permitted, and presented the impacted investments as of April 30, 2016, in accordance with ASU 2015-07. In addition, the prior year presentation of Level 3 assets valued using NAV have been modified to conform to the current year presentation in accordance with
ASU 2015-07.
The following tables summarize the major asset classes for the U.S. and Canadian defined benefit pension plans and the levels within the fair value hierarchy for those assets measured at fair value.
Quoted Prices in Active Markets for Identical Assets (Level 1) | Significant Observable Inputs (Level 2) | Significant Unobservable Inputs (Level 3) | Plan Assets at April 30, 2016 | |||||||||||||
Cash and cash equivalents (A) | $ | 2.5 | $ | — | $ | — | $ | 2.5 | ||||||||
Equity securities: | ||||||||||||||||
U.S. (B) | 122.0 | 13.5 | — | 135.5 | ||||||||||||
International (C) | 83.7 | 11.0 | — | 94.7 | ||||||||||||
Fixed-income securities: | ||||||||||||||||
Bonds (D) | 188.1 | — | — | 188.1 | ||||||||||||
Fixed income (E) | 62.4 | — | — | 62.4 | ||||||||||||
Other types of investments (F) | 6.2 | — | 3.2 | 9.4 | ||||||||||||
Total financial assets measured at fair value | $ | 464.9 | $ | 24.5 | $ | 3.2 | $ | 492.6 | ||||||||
Total financial assets measured at NAV (G) | $ | 13.0 | ||||||||||||||
Total plan assets | $ | 505.6 | ||||||||||||||
Quoted Prices in Active Markets for Identical Assets (Level 1) | Significant Observable Inputs (Level 2) | Significant Unobservable Inputs (Level 3) | Plan Assets at April 30, 2015 | |||||||||||||
Cash and cash equivalents (A) | $ | 4.6 | $ | — | $ | — | $ | 4.6 | ||||||||
Equity securities: | ||||||||||||||||
U.S. (B) | 105.0 | 45.5 | — | 150.5 | ||||||||||||
International (C) | 81.0 | 24.5 | — | 105.5 | ||||||||||||
Fixed-income securities: | ||||||||||||||||
Bonds (D) | 151.3 | — | — | 151.3 | ||||||||||||
Fixed income (E) | 44.1 | 68.5 | — | 112.6 | ||||||||||||
Other types of investments (F) | — | 7.0 | 2.8 | 9.8 | ||||||||||||
Total financial assets measured at fair value | $ | 386.0 | $ | 145.5 | $ | 2.8 | $ | 534.3 | ||||||||
Total financial assets measured at NAV (G) | $ | 15.7 | ||||||||||||||
Total plan assets | $ | 550.0 | ||||||||||||||
(A) This category includes money market holdings with maturities of three months or less and are classified as Level 1 assets. Based on the short-term nature of these assets, carrying value approximates fair value.
(B) This category is invested primarily in a diversified portfolio of common stocks and index funds that invest in U.S. stocks with market capitalization ranges similar to those found in the S&P 500 Index and/or the various Russell Indexes and are traded on active exchanges. The Level 1 assets are valued using quoted market prices for identical securities in active markets. In 2016, the Level 2 assets are comprised of pooled funds only, and in 2015, the Level 2 assets are comprised of pooled and common collective trust funds that consist of equity securities traded on active exchanges.
(C) This category is invested primarily in common stocks and other equity securities traded on active exchanges whose issuers are located outside the U.S. The fund invests primarily in developed countries, but may also invest in emerging markets. The Level 1 assets are valued using quoted market prices
62 THE J. M.SMUCKER COMPANY
NOTES TO CONSOLIDATED FINANCIAL STATEMENTS
The J. M. Smucker Company
for identical securities in active markets. In 2016, the Level 2 assets are comprised of pooled funds only, and in 2015, the Level 2 assets are comprised of pooled and common collective trust funds that consist of equity securities traded on active exchanges.
(D) This category is comprised of bond funds, which seek to duplicate the return characteristics of high-quality corporate bonds with a duration range of
10 to 13 years. The Level 1 assets are valued using quoted market prices for identical securities in active markets.
(E) This category is comprised of fixed-income funds that invest primarily in government-related bonds of non-U.S. issuers and include investments in the Canadian market as well as emerging markets. The Level 1 assets are valued using quoted market prices for identical securities in active markets. In 2015, contained within the Level 2 assets is a Core Plus pool of funds investing primarily in high-yield, emerging market debt and global bonds, as well as an international bond fund which invests in fixed-income securities denominated in currencies other than U.S. dollars. These Level 2 assets are pooled or common collective trust funds that consist of fixed-income securities traded on active exchanges.
(F) This category is comprised of a dynamic asset allocation mutual fund and a private limited investment partnership in 2016, and in 2015, the category also included a global alpha collective trust fund. The dynamic asset allocation mutual fund and the global alpha collective trust fund are comprised of U.S. and global equities and fixed-income securities inclusive of derivatives within the asset mix. The dynamic asset allocation mutual fund is classified as a Level 1 asset, whereby the assets are valued using quoted market prices for identical securities in active markets. However, the collective trust fund is classified as a Level 2 asset, whereby the underlying securities are valued utilizing quoted market prices for identical securities in active markets. The private investment limited partnership is classified as a Level 3 asset. The investments in the partnership are valued at estimated fair value based on audited financial statements received from the general partner. The private investment limited partnership cannot be redeemed, and the return of principal is based on the liquidation of the underlying assets.
(G) This category is comprised of a private equity fund that consists primarily of limited partnership interests in corporate finance and venture capital funds. The fair value estimate of the private equity fund is based on the underlying funds' net asset values further as a practical expedient equivalent to the Company's defined benefit plan's ownership interest in partners' capital, whereby a proportionate share of the net assets are attributed and further corroborated by our review. The private equity fund is non-redeemable and the return of principal is based on the liquidation of the underlying assets. In accordance with ASU 2015-07, the private equity fund is removed from the total financial assets measured at fair value and disclosed separately.
The following table presents a rollforward of activity for Level 3 assets.
2016 | 2015 | ||||||
Balance at May 1, | $ | 2.8 | $ | — | |||
Big Heart pension assets acquired | — | 2.8 | |||||
Actual return on plan assets still held at reporting date | 0.4 | — | |||||
Balance at April 30, | $ | 3.2 | $ | 2.8 | |||
Our current investment policy is to invest 50 percent of assets in both equity securities and fixed-income securities. Included in equity securities were 317,552 of our common shares at April 30, 2016. The total market value of these shares was $40.3 at April 30, 2016. We paid dividends of $0.9 on these shares during 2016.
We expect to contribute approximately $7.5 to the defined benefit pension plans in 2017. We expect the following payments to be made from the defined benefit pension and other postretirement benefit plans: $77.0 in 2017, $50.1 in 2018, $50.6 in 2019, $53.3 in 2020, $54.4 in 2021, and $295.7 in 2022 through 2026.
As a result of the Big Heart acquisition, we now participate in one multi-employer pension plan, the Bakery and Confectionery Union and Industry International Pension Fund (“Bakery and Confectionery Union Fund”) (52-6118572), which provides defined benefits to certain union employees. During 2016 and 2015, a total of $1.8 and $1.7 was contributed to the plan, respectively, and we anticipate contributions of $1.9 in 2017. During 2015, only $0.1 was contributed and recognized in the Statement of Consolidated Income following the acquisition in the fourth quarter of 2015.
The risks of participating in multi-employer pension plans are different from the risks of participating in single-employer pension plans. For instance, the assets contributed to the multi-employer plan by one employer may be used to provide benefits to employees of other participating employers and if a participating employer stops contributing to the plan, the unfunded obligations of the plan allocable to the withdrawing employer may be the responsibility of the remaining participating employers. Additionally, if we stop participating in the multi-employer pension plan, we may be required to pay the plan an amount based on our allocable share of the underfunded status of the plan, referred to as a withdrawal liability.
The Pension Protection Act of 2006 ranks the funded status of multi-employer pension plans depending upon a plan’s current and projected funding. A plan is in the Red Zone (Critical) if it has a current funded percentage less than 65 percent. A plan is in the Yellow Zone (Endangered) if it has a current funded percentage of less than 80 percent or projects a credit balance deficit within seven years. A plan is in the Green Zone (Healthy) if it has a current funded percentage greater than 80 percent and does not have a projected credit balance deficit within seven years. The zone status is based on the plan’s year end, not our fiscal year end. The zone status is based on information that we received from the plan and is certified by the plan’s actuary. During calendar year 2015, the Bakery and Confectionery Union Fund was in Red Zone status, as the current funding status as of calendar year 2015 was 62.8 percent. A funding improvement plan or rehabilitation plan has been implemented.
2016 ANNUAL REPORT 63
NOTES TO CONSOLIDATED FINANCIAL STATEMENTS
The J. M. Smucker Company
NOTE 10 | DERIVATIVE FINANCIAL INSTRUMENTS | |
We are exposed to market risks, such as changes in commodity prices, foreign currency exchange rates, and interest rates. To manage the volatility related to these exposures, we enter into various derivative transactions. We have policies in place that define acceptable instrument types we may enter into and establish controls to limit our market risk exposure.
Commodity Price Management: We enter into commodity derivatives to manage the price volatility and reduce the variability of future cash flows related to anticipated inventory purchases of key raw materials, notably green coffee, corn, edible oils, soybean meal, and wheat. We also enter into commodity derivatives to manage price risk for energy input costs, including diesel fuel and natural gas. Our derivative instruments generally have maturities of less than one year.
We do not qualify commodity derivatives for hedge accounting treatment and, as a result, the derivative gains and losses are immediately recognized in earnings. Although we do not perform the assessments required to achieve hedge accounting for derivative positions, we believe all of our commodity derivatives are economic hedges of our risk exposure.
The commodities hedged have a high inverse correlation to price changes of the derivative commodity instrument. Thus, we would expect that over time any gain or loss in the estimated fair value of the derivatives would generally be offset by an increase or decrease in the estimated fair value of the underlying exposures.
Foreign Currency Exchange Rate Hedging: We utilize foreign currency derivatives to manage the effect of foreign currency exchange fluctuations on future cash payments primarily related to purchases of certain raw materials and finished goods. The contracts generally have maturities of less than one year. We do not qualify instruments used to manage foreign currency exchange exposures for hedge accounting treatment.
Interest Rate Hedging: We utilize derivative instruments to manage changes in the fair value of our debt. Interest rate swaps mitigate the risk associated with the underlying hedged item. At the inception of the contract, the instrument is evaluated and documented for hedge accounting treatment. If the contract is designated as a cash flow hedge, the mark-to-market gains or losses on the swap are deferred and included as a component of accumulated other comprehensive loss to the extent effective, and reclassified to interest expense in the period during which the hedged transaction affects earnings. If the contract is designated as a fair value hedge, the swap would be recognized at fair value on the balance sheet and changes in the fair value would be recognized in interest expense. Generally, changes in the fair value of the derivative are equal to changes in the fair value of the underlying debt and have no impact on earnings.
During 2015, we entered into a series of forward-starting interest rate swaps to hedge a portion of the interest rate risk related to our anticipated issuance of Senior Notes. The notional hedged amount was $1.1 billion, with expected maturity tenors of 10, 20, and 30 years. The swap agreements were designated as cash flow hedges, where changes in fair value are recorded in other comprehensive loss. In March 2015, in conjunction with the pricing of the Senior Notes, we terminated the interest rate swaps prior to maturity. The termination resulted in a net loss of $4.0, which will be amortized through 2045. For additional information, see Note 8: Debt and Financing Arrangements.
During 2014, we entered into an interest rate swap on the 3.50 percent Senior Notes due October 15, 2021, which was designated as a fair value hedge and used to hedge against the changes in the fair value of the debt. We received cash flows from the counterparty at a fixed rate and paid the counterparty variable rates based on LIBOR. In 2015, we terminated the interest rate swap on the 3.50 percent Senior Notes prior to maturity. As a result of the early termination, we received $58.1 in cash, which included $4.6 of accrued and prepaid interest. The gain on termination was deferred and will be recognized over the remaining life of the underlying debt as a reduction of future interest expense. We recognized $7.4 and $2.2 in 2016 and 2015, respectively. The remaining will be recognized as follows: $7.6 in 2017, $7.8 in 2018, $8.0 in 2019, $8.1 in 2020, $8.4 in 2021, and $4.0 in 2022. For additional information, see Note 8: Debt and Financing Arrangements.
64 THE J. M.SMUCKER COMPANY
NOTES TO CONSOLIDATED FINANCIAL STATEMENTS
The J. M. Smucker Company
The following tables set forth the gross fair value amounts of derivative instruments recognized in the Consolidated Balance Sheets.
April 30, 2016 | ||||||||||||||||
Other Current Assets | Other Current Liabilities | Other Noncurrent Assets | Other Noncurrent Liabilities | |||||||||||||
Derivatives not designated as hedging instruments: | ||||||||||||||||
Commodity contracts | $ | 20.3 | $ | 14.1 | $ | 2.0 | $ | 1.2 | ||||||||
Foreign currency exchange contracts | 0.2 | 8.9 | 0.3 | 0.4 | ||||||||||||
Total derivative instruments | $ | 20.5 | $ | 23.0 | $ | 2.3 | $ | 1.6 | ||||||||
April 30, 2015 | ||||||||||||||||
Other Current Assets | Other Current Liabilities | Other Noncurrent Assets | Other Noncurrent Liabilities | |||||||||||||
Derivatives not designated as hedging instruments: | ||||||||||||||||
Commodity contracts | $ | 6.4 | $ | 23.9 | $ | 0.2 | $ | 3.8 | ||||||||
Foreign currency exchange contracts | 4.8 | 1.0 | — | — | ||||||||||||
Total derivative instruments | $ | 11.2 | $ | 24.9 | $ | 0.2 | $ | 3.8 | ||||||||
We have elected to not offset fair value amounts recognized for our exchange-traded commodity derivative instruments and our cash margin accounts executed with the same counterparty that are generally subject to enforceable netting agreements. We are required to maintain cash margin accounts in connection with funding the settlement of our open positions. At April 30, 2016 and 2015, we maintained cash margin account balances of $3.4 and $38.2, respectively, included in other current assets in the Consolidated Balance Sheets. The change in the cash margin account balances is included in other – net, investing activities in the Statements of Consolidated Cash Flows. In the event of default and immediate net settlement of all of our open positions with individual counterparties, all of our derivative liabilities would be fully offset by either our derivative asset positions or margin accounts based on the net asset or liability position with our individual counterparties.
The following table presents information on pre-tax commodity contract net gains recognized on derivatives designated as cash flow hedges prior to May 1, 2014, and pre-tax losses related to the termination of interest rate swaps.
Year Ended April 30, | |||||||
2016 | 2015 | ||||||
Losses recognized in other comprehensive loss (effective portion) | $ | — | $ | (4.0 | ) | ||
Gains reclassified from accumulated other comprehensive loss to cost of products sold (effective portion) | — | 29.1 | |||||
Losses reclassified from accumulated other comprehensive loss to interest expense (effective portion) | (0.6 | ) | (0.6 | ) | |||
Change in accumulated other comprehensive loss | $ | 0.6 | $ | (32.5 | ) | ||
Losses recognized in interest expense (ineffective portion) | $ | — | $ | (0.1 | ) | ||
Included as a component of accumulated other comprehensive loss at April 30, 2016 and 2015, were deferred pre-tax losses of $7.6 and $8.2, respectively, related to the termination of interest rate swaps. The related tax benefit recognized in accumulated other comprehensive loss was $2.7 and $2.9 at April 30, 2016 and 2015, respectively. Approximately $0.6 of the pre-tax loss will be recognized over the next 12 months.
The following table presents the net gains and losses recognized in cost of products sold on derivatives not designated as hedging instruments.
Year Ended April 30, | |||||||
2016 | 2015 | ||||||
Losses on commodity contracts | $ | (31.6 | ) | $ | (48.5 | ) | |
Gains on foreign currency exchange contracts | 2.0 | 8.8 | |||||
Total losses recognized in costs of products sold | $ | (29.6 | ) | $ | (39.7 | ) | |
2016 ANNUAL REPORT 65
NOTES TO CONSOLIDATED FINANCIAL STATEMENTS
The J. M. Smucker Company
Commodity and foreign currency exchange derivative gains and losses are reported in unallocated derivative gains and losses outside of segment operating results until the related inventory is sold. At that time, we reclassify the hedge gains and losses from unallocated derivative gains and losses to segment profit, allowing our segments to realize the economic effect of the hedge without experiencing any mark-to-market volatility. The following table presents the activity in unallocated derivative gains and losses.
Year Ended April 30, | |||||||||||
2016 | 2015 | 2014 | |||||||||
Net (losses) gains on mark-to-market valuation of unallocated derivative positions | $ | (29.6 | ) | $ | (39.7 | ) | $ | 8.5 | |||
Net losses (gains) on derivative positions reclassified to segment operating profit | 41.6 | 15.2 | (3.2 | ) | |||||||
Unallocated derivative gains (losses) | $ | 12.0 | $ | (24.5 | ) | $ | 5.3 | ||||
The net cumulative unallocated derivative losses at April 30, 2016 and 2015 were $8.4 and $20.4, respectively. As of April 30, 2016, net realized losses of $3.6 were included in cumulative unallocated derivative losses and will be reclassified to segment operating profit when the related inventory is sold.
The following table presents the gross contract notional value of outstanding derivative contracts.
Year Ended April 30, | |||||||
2016 | 2015 | ||||||
Commodity contracts | $ | 545.7 | $ | 640.6 | |||
Foreign currency exchange contracts | 212.5 | 136.4 | |||||
NOTE 11 | OTHER FINANCIAL INSTRUMENTS AND FAIR VALUE MEASUREMENTS | |
Financial instruments, other than derivatives, that potentially subject us to significant concentrations of credit risk consist principally of cash investments, short-term borrowings, and trade receivables. The carrying value of these financial instruments approximates fair value. Our other financial instruments, with the exception of long-term debt, are recognized at estimated fair value in the Consolidated Balance Sheets.
The following table provides information on the carrying amounts and fair values of our financial instruments.
April 30, 2016 | April 30, 2015 | ||||||||||||||
Carrying Amount | Fair Value | Carrying Amount | Fair Value | ||||||||||||
Other investments | $ | 48.8 | $ | 48.8 | $ | 48.4 | $ | 48.4 | |||||||
Derivative financial instruments – net | (1.8 | ) | (1.8 | ) | (17.3 | ) | (17.3 | ) | |||||||
Long-term debt | (5,146.0 | ) | (5,319.9 | ) | (5,944.9 | ) | (6,011.3 | ) | |||||||
Fair value is defined as the price that would be received to sell an asset or paid to transfer a liability in an orderly transaction between market participants at the measurement date. Valuation techniques are based on observable and unobservable inputs. Observable inputs reflect readily obtainable data from independent sources, while unobservable inputs reflect our market assumptions.
66 THE J. M.SMUCKER COMPANY
NOTES TO CONSOLIDATED FINANCIAL STATEMENTS
The J. M. Smucker Company
The following tables summarize the fair values and the levels within the fair value hierarchy in which the fair value measurements fall for our financial instruments.
Quoted Prices in Active Markets for Identical Assets (Level 1) | Significant Observable Inputs (Level 2) | Significant Unobservable Inputs (Level 3) | Fair Value at April 30, 2016 | |||||||||||||
Other investments: (A) | ||||||||||||||||
Equity mutual funds | $ | 9.8 | $ | — | $ | — | $ | 9.8 | ||||||||
Municipal obligations | — | 37.6 | — | 37.6 | ||||||||||||
Money market funds | 1.4 | — | — | 1.4 | ||||||||||||
Derivative financial instruments: (B) | ||||||||||||||||
Commodity contracts – net | 15.0 | (8.0 | ) | — | 7.0 | |||||||||||
Foreign currency exchange contracts – net | (1.7 | ) | (7.1 | ) | — | (8.8 | ) | |||||||||
Long-term debt (C) | (4,569.0 | ) | (750.9 | ) | — | (5,319.9 | ) | |||||||||
Total financial instruments measured at fair value | $ | (4,544.5 | ) | $ | (728.4 | ) | $ | — | $ | (5,272.9 | ) | |||||
Quoted Prices in Active Markets for Identical Assets (Level 1) | Significant Observable Inputs (Level 2) | Significant Unobservable Inputs (Level 3) | Fair Value at April 30, 2015 | |||||||||||||
Other investments: (A) | ||||||||||||||||
Equity mutual funds | $ | 9.7 | $ | — | $ | — | $ | 9.7 | ||||||||
Municipal obligations | — | 37.9 | — | 37.9 | ||||||||||||
Money market funds | 0.8 | — | — | 0.8 | ||||||||||||
Derivative financial instruments: (B) | ||||||||||||||||
Commodity contracts – net | (12.4 | ) | (8.7 | ) | — | (21.1 | ) | |||||||||
Foreign currency exchange contracts – net | (0.2 | ) | 4.0 | — | 3.8 | |||||||||||
Long-term debt (C) | (4,459.0 | ) | (1,552.3 | ) | — | (6,011.3 | ) | |||||||||
Total financial instruments measured at fair value | $ | (4,461.1 | ) | $ | (1,519.1 | ) | $ | — | $ | (5,980.2 | ) | |||||
(A) | Other investments consist of funds maintained for the payment of benefits associated with nonqualified retirement plans. The funds include equity securities listed in active markets, municipal obligations valued by a third party using valuation techniques that utilize inputs that are derived principally from or corroborated by observable market data, and money market funds with maturities of three months or less. Based on the short-term nature of these money market funds, carrying value approximates fair value. As of April 30, 2016, our municipal obligations are scheduled to mature as follows: $1.3 in 2017, $1.0 in 2018, $2.9 in 2019, $2.2 in 2020, and the remaining $30.2 in 2021 and beyond. For additional information, see Marketable Securities and Other Investments in Note 1: Accounting Policies. |
(B) | Level 1 commodity and foreign currency exchange derivatives are valued using quoted market prices for identical instruments in active markets. Level 2 commodity and foreign currency exchange derivatives are valued using quoted prices for similar assets or liabilities in active markets. |
(C) | Long-term debt is comprised of public Senior Notes classified as Level 1 and the Term Loan classified as Level 2. The public Senior Notes are traded in an active secondary market and valued using quoted prices. The value of the Term Loan is based on the net present value of each interest and principal payment calculated, utilizing an interest rate derived from an estimated yield curve obtained from independent pricing sources for similar types of term loan borrowing arrangements. For additional information, see Note 8: Debt and Financing Arrangements. |
NOTE 12 | SHARE-BASED PAYMENTS | |
We provide for equity-based incentives to be awarded to key employees and non-employee directors. Currently, these incentives consist of restricted shares, restricted stock units (which may also be referred to as deferred stock units), performance units, and stock options. These awards are administered primarily through the 2010 Equity and Incentive Compensation Plan initially approved by our shareholders in August 2010 and re-approved in August 2015. Awards under this plan may be in the form of stock options, stock appreciation rights, restricted shares, restricted stock units, performance shares, performance units, incentive awards, and other share-based awards. Awards under this plan may be granted to our non-employee directors, consultants, officers, and other employees. Deferred stock units granted to non-employee directors vest immediately and, along with dividends credited on those deferred stock units, are paid out in the form of common shares upon termination of service as a non-employee director. At April 30, 2016, there were 5,436,296 shares available for future issuance under this plan.
2016 ANNUAL REPORT 67
NOTES TO CONSOLIDATED FINANCIAL STATEMENTS
The J. M. Smucker Company
Under the 2010 Equity and Incentive Compensation Plan, we have the option to settle share-based awards by issuing common shares from treasury, issuing new Company common shares, or issuing a combination of common shares from treasury and new Company common shares.
Stock Options: We granted 370,000 and 955,000 stock options during 2016 and 2015, respectively, under the 2010 Equity and Incentive Compensation Plan. The options vest over a period of 1 to 3 years dependent on the continued service of the option holder, as well as the achievement of performance objectives established on the grant date. The exercise price of all options granted is equal to the market value of the shares on the date of grant. All options granted during 2016 and 2015 have a contractual term of 10 years.
The fair value of each option is estimated on the date of grant using a Black-Scholes option-pricing model with the following weighted-average assumptions for stock options granted:
2016 | 2015 | ||||||
Expected volatility (%) | 20.7 | % | 25.0 | % | |||
Dividend Yield (%) | 2.3 | % | 2.2 | % | |||
Risk-free interest rate (%) | 1.9 | % | 1.5 | % | |||
Expected life of stock option (years) | 5.9 | 5.6 | |||||
Expected volatility was calculated in accordance with the provisions of FASB ASC 718, Compensation – Stock Compensation, based on consideration of both historical and implied volatilities. The expected life of a stock option represents the period from the grant date through the expected exercise date of the option. This was calculated using a simplified method whereby the midpoint between the vesting date and the end of the contractual term is utilized to compute the expected term.
The following table is a summary of our option activity.
Number of Options | Weighted-Average Exercise Price | |||||
Outstanding at May 1, 2015 | 957,000 | $ | 112.45 | |||
Granted | 370,000 | 114.71 | ||||
Exercised | 2,000 | 47.78 | ||||
Cancelled | 80,000 | 111.52 | ||||
Outstanding at April 30, 2016 | 1,245,000 | $ | 113.29 | |||
Exercisable at April 30, 2016 | — | $ | — | |||
Options outstanding at April 30, 2016 have an aggregate intrinsic value of $17.0 with an average remaining contractual term of 9.0 years. The options granted in 2016 and 2015 have a weighted-average grant date fair value of $18.67 and $21.68 per option, respectively. No options were granted in 2014. The total intrinsic value of options exercised was $0.1, $1.9, and $0.8 for 2016, 2015, and 2014, respectively. The closing market price of our common stock on the last trading day of 2016 was $126.98 per share.
For options granted during 2016 and 2015, compensation cost will be recognized ratably over the service period for each vesting tranche from the grant date through the end of the requisite service period to the extent the performance objectives are likely to be achieved. Compensation cost for stock option awards totaled $8.1 and $1.2 million for the years ended April 30, 2016 and 2015, respectively, and was included in other special project costs in the Statements of Consolidated Income. No compensation cost was incurred during 2014 related to stock options. The tax benefit related to the stock option expense was $3.0 and $0.4 million for 2016 and 2015, respectively. At April 30, 2016, we had $14.7 of total unrecognized compensation expense, net of estimated forfeitures, related to stock options that will be recognized over a weighted-average period of 1.7 years.
Cash received from option exercises for the years ended April 30, 2016, 2015, and 2014 was $0.1, $0.8, and $0.5, respectively.
68 THE J. M.SMUCKER COMPANY
NOTES TO CONSOLIDATED FINANCIAL STATEMENTS
The J. M. Smucker Company
Other Equity Awards: The following table is a summary of our restricted shares, deferred stock units, and performance units.
Restricted Shares and Deferred Stock Units | Weighted- Average Grant Date Fair Value | Performance Units | Weighted- Average Conversion Date Fair Value | ||||||||||
Outstanding at May 1, 2015 | 596,889 | $ | 91.21 | 75,848 | $ | 111.41 | |||||||
Granted | 97,922 | 113.57 | 121,936 | 132.46 | |||||||||
Converted | 75,848 | 111.41 | (75,848 | ) | 111.41 | ||||||||
Vested | (216,145 | ) | 86.55 | — | — | ||||||||
Forfeited | (8,772 | ) | 105.24 | — | — | ||||||||
Outstanding at April 30, 2016 | 545,742 | $ | 99.65 | 121,936 | $ | 132.46 | |||||||
The weighted-average grant date fair value of equity awards other than stock options that vested in 2016, 2015, and 2014 was $18.7, $28.6, and $20.8, respectively. The vesting date fair value of equity awards other than stock options that vested in 2016, 2015, and 2014 was $24.4, $43.4, and $40.2, respectively. The weighted-average grant date fair value of restricted shares and deferred stock units is the average of the high and the low share price on the date of grant. The weighted-average conversion date fair value of performance units is the average of the high and the low share price on the date of conversion to restricted shares. The following table summarizes the weighted-average fair values of the equity awards granted in 2016, 2015, and 2014.
Year Ended April 30, | Restricted Shares and Deferred Stock Units | Weighted- Average Grant Date Fair Value | Performance Units | Weighted- Average Conversion Date Fair Value | |||||||||
2016 | 97,922 | $ | 113.57 | 121,936 | $ | 132.46 | |||||||
2015 | 109,091 | 104.82 | 75,848 | 111.41 | |||||||||
2014 | 167,134 | 101.08 | 101,020 | 104.91 | |||||||||
The performance units column represents the number of restricted shares received by certain executive officers, subsequent to year end, upon conversion of the performance units earned during the year. Restricted shares and deferred stock units generally vest 4 years from the date of grant or upon the attainment of a defined age and years of service, subject to certain retention requirements.
NOTE 13 | INCOME TAXES | |
Income before income taxes is as follows:
Year Ended April 30, | |||||||||||
2016 | 2015 | 2014 | |||||||||
Domestic | $ | 959.3 | $ | 500.7 | $ | 827.4 | |||||
Foreign | 18.6 | 22.3 | 22.3 | ||||||||
Income before income taxes | $ | 977.9 | $ | 523.0 | $ | 849.7 | |||||
The components of the provision for income taxes are as follows:
Year Ended April 30, | |||||||||||
2016 | 2015 | 2014 | |||||||||
Current: | |||||||||||
Federal | $ | 342.5 | $ | 147.8 | $ | 265.4 | |||||
Foreign | 4.8 | 4.7 | 4.2 | ||||||||
State and local | 37.1 | 17.9 | 22.9 | ||||||||
Deferred: | |||||||||||
Federal | (32.1 | ) | 2.3 | (13.9 | ) | ||||||
Foreign | 1.3 | 0.5 | 2.4 | ||||||||
State and local | (64.4 | ) | 4.9 | 3.5 | |||||||
Total income tax expense | $ | 289.2 | $ | 178.1 | $ | 284.5 | |||||
2016 ANNUAL REPORT 69
NOTES TO CONSOLIDATED FINANCIAL STATEMENTS
The J. M. Smucker Company
A reconciliation of the statutory federal income tax rate and the effective income tax rate is as follows:
Year Ended April 30, | ||||||||||||||
Percent of Pretax Income | 2016 | 2015 | 2014 | |||||||||||
Statutory federal income tax rate | 35.0 | % | 35.0 | % | 35.0 | % | ||||||||
State and local income taxes | 2.5 | 2.4 | 1.9 | |||||||||||
Domestic manufacturing deduction | (3.5 | ) | (2.9 | ) | (3.0 | ) | ||||||||
Deferred tax benefit from integration | (5.2 | ) | — | — | ||||||||||
Other items – net | 0.8 | (0.4 | ) | (0.4 | ) | |||||||||
Effective income tax rate | 29.6 | % | 34.1 | % | 33.5 | % | ||||||||
Income taxes paid | $ | 290.5 | $ | 199.3 | $ | 294.4 | ||||||||
The effective tax rate of 29.6 percent in 2016 includes the recognition in the fourth quarter of a $50.5 noncash deferred tax benefit related to the integration of Big Heart into the Company.
We are a voluntary participant in the Compliance Assurance Process (“CAP”) program offered by the Internal Revenue Service (“IRS”) and are currently under a CAP examination for the tax year ended April 30, 2016. Through the contemporaneous exchange of information with the IRS, this program is designed to identify and resolve tax positions with the IRS prior to the filing of a tax return, which allows us to remain current with our IRS examinations. The IRS has completed the CAP examinations for tax years ended April 30, 2013, 2014, and 2015. Tax years prior to 2013 are no longer subject to U.S. federal tax examination. With limited exceptions, we are no longer subject to examination for state and local jurisdictions for tax years prior to 2012 and for tax years prior to 2009 for foreign jurisdictions. BAG, the former parent company of Big Heart that was merged into one of our subsidiaries, is under IRS examination of its federal income tax returns for the fiscal years ended April 29, 2013, April 27, 2014, and the period ended March 22, 2015.
In November 2015, the FASB issued ASU 2015-17, Income Taxes (Topic 740): Balance Sheet Classification of Deferred Taxes.
ASU 2015-17 requires all deferred tax liabilities and assets to be classified as noncurrent on the balance sheet in order to simplify the presentation of deferred income taxes. Although ASU 2015-17 is not effective for us until May 1, 2017, we have elected early adoption. As of April 30, 2016, we have classified all deferred tax liabilities and assets as noncurrent on our Consolidated Balance Sheets. Prior year amounts have been reclassified from current deferred tax assets to noncurrent deferred tax liabilities to conform to the current year in accordance with ASU 2015-17, resulting in an adjustment to noncurrent deferred income taxes of $76.3 for the year ended April 30, 2015.
Deferred income taxes reflect the tax effects of temporary differences between the carrying amounts of assets and liabilities for financial- reporting purposes and the amounts used for income tax reporting. Significant components of our deferred tax assets and liabilities are as follows:
April 30, | |||||||
2016 | 2015 | ||||||
Deferred tax liabilities: | |||||||
Intangible assets | $ | 2,330.8 | $ | 2,499.4 | |||
Property, plant, and equipment | 140.5 | 158.0 | |||||
Other | 11.9 | 9.6 | |||||
Total deferred tax liabilities | $ | 2,483.2 | $ | 2,667.0 | |||
Deferred tax assets: | |||||||
Post-employment and other employee benefits | $ | 171.8 | $ | 143.4 | |||
Tax credit and loss carryforwards | 3.7 | 44.8 | |||||
Intangible assets | 23.2 | 22.1 | |||||
Inventory | 8.0 | 11.6 | |||||
Property, plant, and equipment | 5.1 | 19.4 | |||||
Other | 47.3 | 32.9 | |||||
Total deferred tax assets | $ | 259.1 | $ | 274.2 | |||
Valuation allowance | (6.2 | ) | (4.2 | ) | |||
Total deferred tax assets, less allowance | $ | 252.9 | $ | 270.0 | |||
Net deferred tax liability | $ | 2,230.3 | $ | 2,397.0 | |||
70 THE J. M.SMUCKER COMPANY
NOTES TO CONSOLIDATED FINANCIAL STATEMENTS
The J. M. Smucker Company
The following table summarizes domestic loss and credit carryforwards at April 30, 2016.
Related Tax Deduction | Deferred Tax Asset | Valuation Allowance | Expiration Date | |||||||||||
Tax carryforwards: | ||||||||||||||
Federal loss carryforwards | $ | — | $ | 3.3 | $ | 3.3 | 2021 | |||||||
State loss carryforwards | 2.7 | 0.1 | — | 2021 to 2036 | ||||||||||
State tax credit carryforwards | — | 0.3 | — | 2022 | ||||||||||
Total tax carryforwards | $ | 2.7 | $ | 3.7 | $ | 3.3 | ||||||||
We evaluate the realizability of deferred tax assets for each of the jurisdictions in which we operate. The total valuation allowance increased by a net amount of $2.0 during the year. The 2015 valuation allowance of $4.2, related to a federal capital loss carryforward recorded with the Big Heart acquisition, was reversed in 2016 as an adjustment to purchase accounting within the measurement period. Furthermore, in 2016, an additional valuation allowance related to a separate federal capital loss carryforward was recorded with the Big Heart acquisition in accordance with purchase accounting.
Deferred income taxes have not been provided on approximately $217.4 of undistributed earnings of foreign subsidiaries since these amounts are considered to be permanently reinvested and we do not intend to repatriate any of the amounts. Any additional taxes payable on the earnings of foreign subsidiaries, if remitted, would be partially offset by domestic tax deductions or tax credits for foreign taxes paid. It is not practical to estimate the amount of additional taxes that might be payable on such undistributed earnings.
Our unrecognized tax benefits were $46.3, $45.0, and $29.1, of which $32.6, $32.2, and $19.5 would affect the effective tax rate, if recognized, as of April 30, 2016, 2015, and 2014, respectively. Our accrual for tax-related net interest and penalties totaled $3.8, $3.4, and $2.0 as of April 30, 2016, 2015, and 2014, respectively. Interest charged to earnings totaled $0.6, $0.7, and $0.1 during 2016, 2015, and 2014, respectively.
Within the next 12 months, it is reasonably possible that we could decrease our unrecognized tax benefits by an estimated $4.5, primarily as a result of the expiration of statute of limitation periods.
A reconciliation of our unrecognized tax benefits is as follows:
2016 | 2015 | 2014 | |||||||||
Balance at May 1, | $ | 45.0 | $ | 29.1 | $ | 29.7 | |||||
Increases: | |||||||||||
Current year tax positions | 3.3 | 2.4 | 5.1 | ||||||||
Prior year tax positions | 0.2 | 1.2 | 0.1 | ||||||||
Acquired businesses | 3.3 | 13.4 | — | ||||||||
Decreases: | |||||||||||
Prior year tax positions | 0.9 | 0.4 | 1.6 | ||||||||
Settlement with tax authorities | 2.5 | — | 1.5 | ||||||||
Expiration of statute of limitations periods | 2.1 | 0.7 | 2.7 | ||||||||
Balance at April 30, | $ | 46.3 | $ | 45.0 | $ | 29.1 | |||||
2016 ANNUAL REPORT 71
NOTES TO CONSOLIDATED FINANCIAL STATEMENTS
The J. M. Smucker Company
NOTE 14 | ACCUMULATED OTHER COMPREHENSIVE LOSS | |
The components of accumulated other comprehensive loss, including the reclassification adjustments for items that are reclassified from accumulated other comprehensive loss to net income, are shown below.
Foreign Currency Translation Adjustment | Unrealized (Loss) Gain on Cash Flow Hedging Derivatives (A) | Pension and Other Postretirement Liabilities (B) | Unrealized Gain on Available-for-Sale Securities (C) | Accumulated Other Comprehensive Loss | ||||||||||||||||
Balance at May 1, 2013 | $ | 61.5 | $ | (11.2 | ) | $ | (131.4 | ) | $ | 4.5 | $ | (76.6 | ) | |||||||
Reclassification adjustments | — | 20.9 | 13.3 | (3.7 | ) | 30.5 | ||||||||||||||
Current period (charge) credit | (29.8 | ) | 21.0 | 31.4 | 1.9 | 24.5 | ||||||||||||||
Income tax (expense) benefit | — | (15.4 | ) | (15.3 | ) | 0.7 | (30.0 | ) | ||||||||||||
Balance at April 30, 2014 | $ | 31.7 | $ | 15.3 | $ | (102.0 | ) | $ | 3.4 | $ | (51.6 | ) | ||||||||
Reclassification adjustments | — | (28.5 | ) | 9.8 | — | (18.7 | ) | |||||||||||||
Current period charge | (34.0 | ) | (4.0 | ) | (16.2 | ) | (0.1 | ) | (54.3 | ) | ||||||||||
Income tax benefit | — | 12.0 | 2.8 | — | 14.8 | |||||||||||||||
Balance at April 30, 2015 | $ | (2.3 | ) | $ | (5.2 | ) | $ | (105.6 | ) | $ | 3.3 | $ | (109.8 | ) | ||||||
Reclassification adjustments | — | 0.6 | 10.2 | — | 10.8 | |||||||||||||||
Current period (charge) credit | (10.8 | ) | — | (54.6 | ) | 0.4 | (65.0 | ) | ||||||||||||
Income tax expense | — | (0.2 | ) | 15.9 | (0.1 | ) | 15.6 | |||||||||||||
Balance at April 30, 2016 | $ | (13.1 | ) | $ | (4.8 | ) | $ | (134.1 | ) | $ | 3.6 | $ | (148.4 | ) | ||||||
(A) | Of the total losses reclassified from accumulated other comprehensive loss, $0.6 was reclassified to interest expense related to the interest rate swaps during 2016, 2015, and 2014. An additional $29.1 of income and $20.3 of expense were reclassified to cost of products sold related to commodity derivatives during 2015 and 2014, respectively. At April 30, 2016, the remaining balance in accumulated other comprehensive loss related entirely to the interest rate swaps. For additional information, see Note 10: Derivative Financial Instruments. |
(B) | Amortization of net losses was reclassified from accumulated other comprehensive loss to SD&A. |
(C) | The gain on the sale of marketable securities was reclassified from accumulated other comprehensive loss to other income – net during 2014. |
NOTE 15 | CONTINGENCIES | |
We, like other food manufacturers, are from time to time subject to various administrative, regulatory, and other legal proceedings arising in the ordinary course of business. We are currently a defendant in a variety of such legal proceedings. We cannot predict with certainty the ultimate results of these proceedings or reasonably determine a range of potential loss. Our policy is to accrue costs for contingent liabilities when such liabilities are probable and amounts can be reasonably estimated. Based on the information known to date, we do not believe the final outcome of these proceedings will have a material adverse effect on our financial position, results of operations, or cash flows.
On October 9, 2013, Big Heart entered into a Purchase Agreement with Del Monte Pacific Limited and its subsidiary, Del Monte Foods Consumer Products, Inc. (which changed its name to Del Monte Foods, Inc.) (“DMFI”). Big Heart sold to DMFI the interests of certain subsidiaries related to Big Heart’s consumer products business and generally all assets and liabilities primarily related to the business for a purchase price of $1.7 billion, subject to a post-closing working capital adjustment. In connection with the closing of the transaction, Big Heart received approximately $110.0 in incremental proceeds representing the preliminary working capital adjustment subject to a true-up in accordance with the terms of the Purchase Agreement. In May 2014, Big Heart made a claim of an additional $16.3 for the final working capital adjustment related to the sale of the consumer products business. In June 2014, Big Heart received a notice of disagreement from DMFI disputing the $16.3 working capital adjustment, as well as the incremental preliminary working capital adjustment of approximately $110.0 paid by DMFI at closing. Although we believed the working capital adjustment that was presented to DMFI was appropriate and was in accordance with the terms of the Purchase Agreement, a mutually agreed upon independent certified public accounting firm ruled in favor of DMFI with respect to certain aspects of the methodology by which the working capital adjustment should be calculated. In connection with such ruling, during the third quarter of 2016, we resubmitted the original working capital adjustment. In the fourth quarter of 2016, we settled the working capital adjustment and a liability of $38.0 was recorded to the opening balance sheet during the measurement period, as discussed in Note 2: Acquisitions, and was subsequently paid as of April 30, 2016.
72 THE J. M.SMUCKER COMPANY
NOTES TO CONSOLIDATED FINANCIAL STATEMENTS
The J. M. Smucker Company
NOTE 16 | GUARANTOR AND NON-GUARANTOR FINANCIAL INFORMATION | |
Our Senior Notes are fully and unconditionally guaranteed, on a joint and several basis, by J.M. Smucker LLC and The Folgers Coffee Company (the “subsidiary guarantors”), which are 100 percent wholly-owned subsidiaries of the Company. A subsidiary guarantor will be released from its obligations under the indentures governing the notes (a) with respect to each series of notes, if we exercise our legal or covenant defeasance option with respect to such series of notes or if our obligations under an indenture are discharged in accordance with the terms of such indenture in respect of such series of notes; (b) with respect to all series of notes issued in March 2015, upon the issuance, sale, exchange, transfer, or other disposition (including through merger, consolidation, amalgamation, or otherwise) of the capital stock of the applicable subsidiary guarantor (including any issuance, sale, exchange, transfer, or other disposition following which the applicable subsidiary guarantor is no longer a subsidiary) if such issuance, sale, exchange, transfer, or other disposition is made in a manner not in violation of the indenture in respect of such series of notes; or (c) with respect to all series of notes, upon the substantially simultaneous release or discharge of the guarantee by such subsidiary guarantor of all of our primary senior indebtedness other than through discharges as a result of payment by such guarantor on such guarantees.
Condensed consolidating financial statements for the Company, the subsidiary guarantors, and the other subsidiaries of the Company that are not guaranteeing the indebtedness under the Senior Notes (the “non-guarantor subsidiaries”) are provided below. The principal elimination entries relate to investments in subsidiaries and intercompany balances and transactions, including transactions with our
100 percent wholly-owned subsidiary guarantors and non-guarantor subsidiaries. We have accounted for investments in subsidiaries using the equity method.
2016 ANNUAL REPORT 73
NOTES TO CONSOLIDATED FINANCIAL STATEMENTS
The J. M. Smucker Company
CONDENSED CONSOLIDATING STATEMENTS OF COMPREHENSIVE INCOME | Year Ended April 30, 2016 | |||||||||||||||||||
The J. M. Smucker Company (Parent) | Subsidiary Guarantors | Non-Guarantor Subsidiaries | Eliminations | Consolidated | ||||||||||||||||
Net sales | $ | 3,155.3 | $ | 1,184.5 | $ | 8,724.9 | $ | (5,253.5 | ) | $ | 7,811.2 | |||||||||
Cost of products sold | 2,468.0 | 1,083.3 | 6,549.6 | (5,257.5 | ) | 4,843.4 | ||||||||||||||
Gross Profit | 687.3 | 101.2 | 2,175.3 | 4.0 | 2,967.8 | |||||||||||||||
Selling, distribution, and administrative expenses and other special project costs | 290.9 | 40.5 | 1,314.8 | — | 1,646.2 | |||||||||||||||
Amortization | 4.2 | — | 204.2 | — | 208.4 | |||||||||||||||
Other operating (income) expense – net | (25.2 | ) | 1.1 | (8.0 | ) | — | (32.1 | ) | ||||||||||||
Operating Income | 417.4 | 59.6 | 664.3 | 4.0 | 1,145.3 | |||||||||||||||
Interest (expense) income – net | (172.0 | ) | 1.2 | (0.3 | ) | — | (171.1 | ) | ||||||||||||
Other income (expense) – net | 9.6 | 1.2 | (70.5 | ) | 63.4 | 3.7 | ||||||||||||||
Equity in net earnings of subsidiaries | 513.1 | 138.3 | 60.8 | (712.2 | ) | — | ||||||||||||||
Income Before Income Taxes | 768.1 | 200.3 | 654.3 | (644.8 | ) | 977.9 | ||||||||||||||
Income taxes | 79.4 | 0.4 | 209.4 | — | 289.2 | |||||||||||||||
Net Income | $ | 688.7 | $ | 199.9 | $ | 444.9 | $ | (644.8 | ) | $ | 688.7 | |||||||||
Other comprehensive loss, net of tax | (38.6 | ) | (1.7 | ) | (20.7 | ) | 22.4 | (38.6 | ) | |||||||||||
Comprehensive Income | $ | 650.1 | $ | 198.2 | $ | 424.2 | $ | (622.4 | ) | $ | 650.1 | |||||||||
CONDENSED CONSOLIDATING STATEMENTS OF COMPREHENSIVE INCOME | Year Ended April 30, 2015 | |||||||||||||||||||
The J. M. Smucker Company (Parent) | Subsidiary Guarantors | Non-Guarantor Subsidiaries | Eliminations | Consolidated | ||||||||||||||||
Net sales | $ | 2,998.0 | $ | 1,184.0 | $ | 6,622.4 | $ | (5,111.7 | ) | $ | 5,692.7 | |||||||||
Cost of products sold | 2,457.8 | 1,080.0 | 5,301.6 | (5,115.4 | ) | 3,724.0 | ||||||||||||||
Gross Profit | 540.2 | 104.0 | 1,320.8 | 3.7 | 1,968.7 | |||||||||||||||
Selling, distribution, and administrative expenses and other special project costs | 234.9 | 53.8 | 799.2 | — | 1,087.9 | |||||||||||||||
Amortization | 4.2 | — | 106.7 | — | 110.9 | |||||||||||||||
Other operating expense (income) – net | 0.3 | (2.4 | ) | — | — | (2.1 | ) | |||||||||||||
Operating Income | 300.8 | 52.6 | 414.9 | 3.7 | 772.0 | |||||||||||||||
Interest (expense) income – net | (80.7 | ) | 1.2 | (0.4 | ) | — | (79.9 | ) | ||||||||||||
Other debt costs | (173.3 | ) | — | — | — | (173.3 | ) | |||||||||||||
Other income – net | 0.6 | 0.1 | 3.5 | — | 4.2 | |||||||||||||||
Equity in net earnings of subsidiaries | 312.6 | 131.4 | 52.7 | (496.7 | ) | — | ||||||||||||||
Income Before Income Taxes | 360.0 | 185.3 | 470.7 | (493.0 | ) | 523.0 | ||||||||||||||
Income taxes | 15.1 | 0.4 | 162.6 | — | 178.1 | |||||||||||||||
Net Income | $ | 344.9 | $ | 184.9 | $ | 308.1 | $ | (493.0 | ) | $ | 344.9 | |||||||||
Other comprehensive loss, net of tax | (58.2 | ) | (18.5 | ) | (43.3 | ) | 61.8 | (58.2 | ) | |||||||||||
Comprehensive Income | $ | 286.7 | $ | 166.4 | $ | 264.8 | $ | (431.2 | ) | $ | 286.7 | |||||||||
74 THE J. M.SMUCKER COMPANY
NOTES TO CONSOLIDATED FINANCIAL STATEMENTS
The J. M. Smucker Company
CONDENSED CONSOLIDATING STATEMENTS OF COMPREHENSIVE INCOME | Year Ended April 30, 2014 | |||||||||||||||||||
The J. M. Smucker Company (Parent) | Subsidiary Guarantors | Non-Guarantor Subsidiaries | Eliminations | Consolidated | ||||||||||||||||
Net sales | $ | 3,162.8 | $ | 1,278.8 | $ | 6,601.3 | $ | (5,432.3 | ) | $ | 5,610.6 | |||||||||
Cost of products sold | 2,573.6 | 1,166.0 | 5,268.5 | (5,428.5 | ) | 3,579.6 | ||||||||||||||
Gross Profit | 589.2 | 112.8 | 1,332.8 | (3.8 | ) | 2,031.0 | ||||||||||||||
Selling, distribution, and administrative expenses and other special project costs | 197.1 | 47.5 | 769.8 | — | 1,014.4 | |||||||||||||||
Amortization | 4.2 | — | 94.7 | — | 98.9 | |||||||||||||||
Other operating (income) expense – net | (1.3 | ) | 0.9 | (0.9 | ) | — | (1.3 | ) | ||||||||||||
Operating Income | 389.2 | 64.4 | 469.2 | (3.8 | ) | 919.0 | ||||||||||||||
Interest (expense) income – net | (80.8 | ) | 1.2 | (1.5 | ) | 1.7 | (79.4 | ) | ||||||||||||
Other income (expense) – net | 10.8 | — | 1.0 | (1.7 | ) | 10.1 | ||||||||||||||
Equity in net earnings of subsidiaries | 345.1 | 141.4 | 64.4 | (550.9 | ) | — | ||||||||||||||
Income Before Income Taxes | 664.3 | 207.0 | 533.1 | (554.7 | ) | 849.7 | ||||||||||||||
Income taxes | 99.1 | 0.4 | 185.0 | — | 284.5 | |||||||||||||||
Net Income | $ | 565.2 | $ | 206.6 | $ | 348.1 | $ | (554.7 | ) | $ | 565.2 | |||||||||
Other comprehensive income, net of tax | 25.0 | 27.4 | 6.0 | (33.4 | ) | 25.0 | ||||||||||||||
Comprehensive Income | $ | 590.2 | $ | 234.0 | $ | 354.1 | $ | (588.1 | ) | $ | 590.2 | |||||||||
CONDENSED CONSOLIDATING BALANCE SHEETS | April 30, 2016 | |||||||||||||||||||
The J. M. Smucker Company (Parent) | Subsidiary Guarantors | Non-Guarantor Subsidiaries | Eliminations | Consolidated | ||||||||||||||||
ASSETS | ||||||||||||||||||||
Current Assets | ||||||||||||||||||||
Cash and cash equivalents | $ | 7.0 | $ | — | $ | 102.8 | $ | — | $ | 109.8 | ||||||||||
Inventories | — | 143.2 | 752.0 | 4.2 | 899.4 | |||||||||||||||
Other current assets | 497.3 | 5.9 | 71.9 | (10.9 | ) | 564.2 | ||||||||||||||
Total Current Assets | 504.3 | 149.1 | 926.7 | (6.7 | ) | 1,573.4 | ||||||||||||||
Property, Plant, and Equipment – Net | 296.3 | 587.0 | 744.4 | — | 1,627.7 | |||||||||||||||
Investments in Subsidiaries | 15,092.2 | 4,317.9 | 331.6 | (19,741.7 | ) | — | ||||||||||||||
Intercompany Receivable | — | 404.7 | 1,543.9 | (1,948.6 | ) | — | ||||||||||||||
Other Noncurrent Assets | ||||||||||||||||||||
Goodwill | 1,494.8 | — | 4,596.3 | — | 6,091.1 | |||||||||||||||
Other intangible assets – net | 428.3 | — | 6,066.1 | — | 6,494.4 | |||||||||||||||
Other noncurrent assets | 57.4 | 10.4 | 129.7 | — | 197.5 | |||||||||||||||
Total Other Noncurrent Assets | 1,980.5 | 10.4 | 10,792.1 | — | 12,783.0 | |||||||||||||||
Total Assets | $ | 17,873.3 | $ | 5,469.1 | $ | 14,338.7 | $ | (21,697.0 | ) | $ | 15,984.1 | |||||||||
LIABILITIES AND SHAREHOLDERS’ EQUITY | ||||||||||||||||||||
Current Liabilities | $ | 723.3 | $ | 78.9 | $ | 421.6 | $ | (10.8 | ) | $ | 1,213.0 | |||||||||
Noncurrent Liabilities | ||||||||||||||||||||
Long-term debt | 5,146.0 | — | — | — | 5,146.0 | |||||||||||||||
Deferred income taxes | 60.7 | — | 2,169.6 | — | 2,230.3 | |||||||||||||||
Intercompany payable | 4,644.7 | — | — | (4,644.7 | ) | — | ||||||||||||||
Other noncurrent liabilities | 290.1 | 17.9 | 78.3 | — | 386.3 | |||||||||||||||
Total Noncurrent Liabilities | 10,141.5 | 17.9 | 2,247.9 | (4,644.7 | ) | 7,762.6 | ||||||||||||||
Total Liabilities | 10,864.8 | 96.8 | 2,669.5 | (4,655.5 | ) | 8,975.6 | ||||||||||||||
Total Shareholders’ Equity | 7,008.5 | 5,372.3 | 11,669.2 | (17,041.5 | ) | 7,008.5 | ||||||||||||||
Total Liabilities and Shareholders’ Equity | $ | 17,873.3 | $ | 5,469.1 | $ | 14,338.7 | $ | (21,697.0 | ) | $ | 15,984.1 | |||||||||
2016 ANNUAL REPORT 75
NOTES TO CONSOLIDATED FINANCIAL STATEMENTS
The J. M. Smucker Company
CONDENSED CONSOLIDATING BALANCE SHEETS | April 30, 2015 | |||||||||||||||||||
The J. M. Smucker Company (Parent) | Subsidiary Guarantors | Non-Guarantor Subsidiaries | Eliminations | Consolidated | ||||||||||||||||
ASSETS | ||||||||||||||||||||
Current Assets | ||||||||||||||||||||
Cash and cash equivalents | $ | 7.1 | $ | — | $ | 118.5 | $ | — | $ | 125.6 | ||||||||||
Inventories | — | 180.3 | 979.6 | 3.7 | 1,163.6 | |||||||||||||||
Other current assets | 413.8 | 4.8 | 288.7 | (12.6 | ) | 694.7 | ||||||||||||||
Total Current Assets | 420.9 | 185.1 | 1,386.8 | (8.9 | ) | 1,983.9 | ||||||||||||||
Property, Plant, and Equipment – Net | 258.0 | 591.3 | 829.0 | — | 1,678.3 | |||||||||||||||
Investments in Subsidiaries | 14,610.4 | 4,179.7 | 272.4 | (19,062.5 | ) | — | ||||||||||||||
Intercompany Receivable | — | 305.2 | 133.1 | (438.3 | ) | — | ||||||||||||||
Other Noncurrent Assets | ||||||||||||||||||||
Goodwill | 1,082.0 | — | 4,929.6 | — | 6,011.6 | |||||||||||||||
Other intangible assets – net | 501.1 | — | 6,449.2 | — | 6,950.3 | |||||||||||||||
Other noncurrent assets | 55.6 | 10.5 | 116.1 | — | 182.2 | |||||||||||||||
Total Other Noncurrent Assets | 1,638.7 | 10.5 | 11,494.9 | — | 13,144.1 | |||||||||||||||
Total Assets | $ | 16,928.0 | $ | 5,271.8 | $ | 14,116.2 | $ | (19,509.7 | ) | $ | 16,806.3 | |||||||||
LIABILITIES AND SHAREHOLDERS’ EQUITY | ||||||||||||||||||||
Current Liabilities | $ | 484.0 | $ | 82.6 | $ | 468.6 | $ | (12.6 | ) | $ | 1,022.6 | |||||||||
Noncurrent Liabilities | ||||||||||||||||||||
Long-term debt | 5,944.9 | — | — | — | 5,944.9 | |||||||||||||||
Deferred income taxes | 93.3 | — | 2,303.7 | — | 2,397.0 | |||||||||||||||
Intercompany payable | 3,080.2 | — | — | (3,080.2 | ) | — | ||||||||||||||
Other noncurrent liabilities | 238.7 | 15.2 | 101.0 | — | 354.9 | |||||||||||||||
Total Noncurrent Liabilities | 9,357.1 | 15.2 | 2,404.7 | (3,080.2 | ) | 8,696.8 | ||||||||||||||
Total Liabilities | 9,841.1 | 97.8 | 2,873.3 | (3,092.8 | ) | 9,719.4 | ||||||||||||||
Total Shareholders’ Equity | 7,086.9 | 5,174.0 | 11,242.9 | (16,416.9 | ) | 7,086.9 | ||||||||||||||
Total Liabilities and Shareholders’ Equity | $ | 16,928.0 | $ | 5,271.8 | $ | 14,116.2 | $ | (19,509.7 | ) | $ | 16,806.3 | |||||||||
76 THE J. M.SMUCKER COMPANY
NOTES TO CONSOLIDATED FINANCIAL STATEMENTS
The J. M. Smucker Company
CONDENSED CONSOLIDATING STATEMENTS OF CASH FLOWS | Year Ended April 30, 2016 | |||||||||||||||||||
The J. M. Smucker Company (Parent) | Subsidiary Guarantors | Non-Guarantor Subsidiaries | Eliminations | Consolidated | ||||||||||||||||
Net Cash (Used for) Provided by Operating Activities | $ | (192.8 | ) | $ | 151.4 | $ | 1,499.7 | $ | — | $ | 1,458.3 | |||||||||
Investing Activities | ||||||||||||||||||||
Businesses acquired, net of cash acquired | — | — | 7.9 | — | 7.9 | |||||||||||||||
Equity investment in affiliate | — | — | (16.0 | ) | — | (16.0 | ) | |||||||||||||
Additions to property, plant, and equipment | (71.8 | ) | (53.7 | ) | (75.9 | ) | — | (201.4 | ) | |||||||||||
Proceeds from divestiture | 193.7 | — | — | — | 193.7 | |||||||||||||||
Proceeds from disposal of property, plant, and equipment | 3.7 | 0.1 | 0.2 | — | 4.0 | |||||||||||||||
(Disbursements of) repayments from intercompany loans | — | (99.4 | ) | (1,465.1 | ) | 1,564.5 | — | |||||||||||||
Other – net | (1.2 | ) | 1.6 | 33.1 | — | 33.5 | ||||||||||||||
Net Cash Provided by (Used for) Investing Activities | 124.4 | (151.4 | ) | (1,515.8 | ) | 1,564.5 | 21.7 | |||||||||||||
Financing Activities | ||||||||||||||||||||
Short-term borrowings– net | 58.0 | — | — | — | 58.0 | |||||||||||||||
Repayments of long-term debt | (800.0 | ) | — | — | — | (800.0 | ) | |||||||||||||
Quarterly dividends paid | (316.6 | ) | — | — | — | (316.6 | ) | |||||||||||||
Purchase of treasury shares | (441.1 | ) | — | — | — | (441.1 | ) | |||||||||||||
Intercompany payable | 1,564.5 | — | — | (1,564.5 | ) | — | ||||||||||||||
Other – net | 3.5 | — | — | — | 3.5 | |||||||||||||||
Net Cash Provided by (Used for) Financing Activities | 68.3 | — | — | (1,564.5 | ) | (1,496.2 | ) | |||||||||||||
Effect of exchange rate changes on cash | — | — | 0.4 | — | 0.4 | |||||||||||||||
Net decrease in cash and cash equivalents | (0.1 | ) | — | (15.7 | ) | — | (15.8 | ) | ||||||||||||
Cash and cash equivalents at beginning of year | 7.1 | — | 118.5 | — | 125.6 | |||||||||||||||
Cash and Cash Equivalents at End of Year | $ | 7.0 | $ | — | $ | 102.8 | $ | — | $ | 109.8 | ||||||||||
( ) | Denotes use of cash |
2016 ANNUAL REPORT 77
NOTES TO CONSOLIDATED FINANCIAL STATEMENTS
The J. M. Smucker Company
CONDENSED CONSOLIDATING STATEMENTS OF CASH FLOWS | Year Ended April 30, 2015 | |||||||||||||||||||
The J. M. Smucker Company (Parent) | Subsidiary Guarantors | Non-Guarantor Subsidiaries | Eliminations | Consolidated | ||||||||||||||||
Net Cash Provided by Operating Activities | $ | 239.2 | $ | 87.8 | $ | 406.2 | $ | — | $ | 733.2 | ||||||||||
Investing Activities | ||||||||||||||||||||
Businesses acquired, net of cash acquired | (1,240.0 | ) | — | (80.5 | ) | — | (1,320.5 | ) | ||||||||||||
Additions to property, plant, and equipment | (56.3 | ) | (93.3 | ) | (98.1 | ) | — | (247.7 | ) | |||||||||||
Proceeds from disposal of property, plant, and equipment | — | 1.1 | 1.5 | — | 2.6 | |||||||||||||||
Equity investments in subsidiaries | (2,715.3 | ) | — | — | 2,715.3 | — | ||||||||||||||
Repayments from (disbursements of) intercompany loans | — | 10.2 | (297.5 | ) | 287.3 | — | ||||||||||||||
Other – net | — | (5.8 | ) | (24.3 | ) | — | (30.1 | ) | ||||||||||||
Net Cash (Used for) Provided by Investing Activities | (4,011.6 | ) | (87.8 | ) | (498.9 | ) | 3,002.6 | (1,595.7 | ) | |||||||||||
Financing Activities | ||||||||||||||||||||
Short-term repayments – net | (5.3 | ) | — | (17.1 | ) | — | (22.4 | ) | ||||||||||||
Proceeds from long-term debt | 5,382.5 | — | — | — | 5,382.5 | |||||||||||||||
Repayments of long-term debt, including make-whole payments | (1,580.8 | ) | — | (2,613.1 | ) | — | (4,193.9 | ) | ||||||||||||
Quarterly dividends paid | (254.0 | ) | — | — | — | (254.0 | ) | |||||||||||||
Purchase of treasury shares | (24.3 | ) | — | — | — | (24.3 | ) | |||||||||||||
Investments in subsidiaries | — | — | 2,715.3 | (2,715.3 | ) | — | ||||||||||||||
Intercompany payable | 287.3 | — | — | (287.3 | ) | — | ||||||||||||||
Other – net | (32.7 | ) | — | 8.0 | — | (24.7 | ) | |||||||||||||
Net Cash Provided by (Used For) Financing Activities | 3,772.7 | — | 93.1 | (3,002.6 | ) | 863.2 | ||||||||||||||
Effect of exchange rate changes on cash | — | — | (28.6 | ) | — | (28.6 | ) | |||||||||||||
Net increase (decrease) in cash and cash equivalents | 0.3 | — | (28.2 | ) | — | (27.9 | ) | |||||||||||||
Cash and cash equivalents at beginning of year | 6.8 | — | 146.7 | — | 153.5 | |||||||||||||||
Cash and Cash Equivalents at End of Year | $ | 7.1 | $ | — | $ | 118.5 | $ | — | $ | 125.6 | ||||||||||
( ) | Denotes use of cash |
78 THE J. M.SMUCKER COMPANY
NOTES TO CONSOLIDATED FINANCIAL STATEMENTS
The J. M. Smucker Company
CONDENSED CONSOLIDATING STATEMENTS OF CASH FLOWS | Year Ended April 30, 2014 | |||||||||||||||||||
The J. M. Smucker Company (Parent) | Subsidiary Guarantors | Non-Guarantor Subsidiaries | Eliminations | Consolidated | ||||||||||||||||
Net Cash Provided by Operating Activities | $ | 297.8 | $ | 168.5 | $ | 389.7 | $ | — | $ | 856.0 | ||||||||||
Investing Activities | ||||||||||||||||||||
Businesses acquired, net of cash acquired | — | — | (101.8 | ) | — | (101.8 | ) | |||||||||||||
Additions to property, plant, and equipment | (31.1 | ) | (163.2 | ) | (85.2 | ) | — | (279.5 | ) | |||||||||||
Sales and maturities of marketable securities | 10.0 | — | — | — | 10.0 | |||||||||||||||
Proceeds from disposal of property, plant, and equipment | — | 0.6 | 10.1 | — | 10.7 | |||||||||||||||
Equity investments in subsidiaries | (108.9 | ) | (17.1 | ) | — | 126.0 | — | |||||||||||||
Repayments from (disbursements of) intercompany loans | — | 9.3 | (283.0 | ) | 273.7 | — | ||||||||||||||
Other – net | (3.2 | ) | 0.2 | (6.7 | ) | — | (9.7 | ) | ||||||||||||
Net Cash (Used for) Provided by Investing Activities | (133.2 | ) | (170.2 | ) | (466.6 | ) | 399.7 | (370.3 | ) | |||||||||||
Financing Activities | ||||||||||||||||||||
Short-term borrowing – net | 248.4 | — | — | — | 248.4 | |||||||||||||||
Repayments of long-term debt | (50.0 | ) | — | — | — | (50.0 | ) | |||||||||||||
Quarterly dividends paid | (238.0 | ) | — | — | — | (238.0 | ) | |||||||||||||
Purchase of treasury shares | (508.5 | ) | — | — | — | (508.5 | ) | |||||||||||||
Investments in subsidiaries | — | — | 126.0 | (126.0 | ) | — | ||||||||||||||
Intercompany payable | 273.7 | — | — | (273.7 | ) | — | ||||||||||||||
Other – net | 8.6 | 1.7 | (37.7 | ) | — | (27.4 | ) | |||||||||||||
Net Cash (Used for) Provided by Financing Activities | (265.8 | ) | 1.7 | 88.3 | (399.7 | ) | (575.5 | ) | ||||||||||||
Effect of exchange rate changes on cash | — | — | (13.1 | ) | — | (13.1 | ) | |||||||||||||
Net decrease in cash and cash equivalents | (101.2 | ) | — | (1.7 | ) | — | (102.9 | ) | ||||||||||||
Cash and cash equivalents at beginning of year | 108.0 | — | 148.4 | — | 256.4 | |||||||||||||||
Cash and Cash Equivalents at End of Year | $ | 6.8 | $ | — | $ | 146.7 | $ | — | $ | 153.5 | ||||||||||
( ) | Denotes use of cash |
NOTE 17 | COMMON SHARES | |
Voting: The Amended Articles of Incorporation (“Articles”) provide that each holder of a common share outstanding is entitled to one vote on each matter submitted to a vote of the shareholders, except for the following specific matters:
• any matter that relates to or would result in the dissolution or liquidation of the Company;
• the adoption of any amendment to the Articles or Amended Regulations, or the adoption of amended Articles, other than the adoption of any amendment or amended Articles that increases the number of votes to which holders of our common shares are entitled or expands the matters to which time-phased voting applies;
• any proposal or other action to be taken by our shareholders relating to the Rights Agreement, dated as of May 20, 2009, between the Company and Computershare Trust Company, N.A., or any successor plan;
• any matter relating to any stock option plan, stock purchase plan, executive compensation plan, executive benefit plan, or other similar plan, arrangement, or agreement;
• the adoption of any agreement or plan of or for the merger, consolidation, or majority share acquisition of us or any of our subsidiaries with or into any other person, whether domestic or foreign, corporate or noncorporate, or the authorization of the lease, sale, exchange, transfer, or other disposition of all, or substantially all, of our assets;
• any matter submitted to our shareholders pursuant to Article Fifth (which relates to procedures applicable to certain business combinations) or Article Seventh (which relates to procedures applicable to certain proposed acquisitions of specified percentages of our outstanding common shares) of the Articles, as they may be further amended, or any issuance of our common shares for which shareholder approval is required by applicable stock exchange rules; and
• any matter relating to the issuance of our common shares or the repurchase of our common shares that the Board of Directors (“Board”) determines is required or appropriate to be submitted to our shareholders under the Ohio Revised Code or applicable stock exchange rules.
2016 ANNUAL REPORT 79
NOTES TO CONSOLIDATED FINANCIAL STATEMENTS
The J. M. Smucker Company
On the matters listed above, common shares are entitled to 10 votes per share if they meet the requirements set forth in the Articles. Common shares which would be entitled to 10 votes per share must meet one of the following criteria:
• common shares for which there has not been a change in beneficial ownership in the past 4 years; or
• common shares received through our various equity plans that have not been sold or otherwise transferred.
In the event of a change in beneficial ownership, the new owner of that common share will be entitled to only one vote with respect to that share on all matters until four years pass without a further change in beneficial ownership of the share.
Shareholders’ Rights Plan: Pursuant to a Shareholders’ Rights Plan adopted by the Board on May 20, 2009, one share purchase right is associated with each of our outstanding common shares.
Under the plan, the rights will initially trade together with our common shares and will not be exercisable. In the absence of further action by the directors, the rights generally will become exercisable and allow the holder to acquire our common shares at a discounted price if a person or group acquires 10 percent or more of our outstanding common shares. Rights held by persons who exceed the applicable threshold will be void. Shares held by members of the Smucker family are not subject to the threshold. If exercisable, each right entitles the shareholder to buy one common share at a discounted price. Under certain circumstances, the rights will entitle the holder to buy shares in an acquiring entity at a discounted price.
The plan also includes an exchange option. In general, if the rights become exercisable, the directors may, at their option, effect an exchange of part or all of the rights, other than rights that have become void, for common shares. Under this option, we would issue
one common share for each right, in each case subject to adjustment in certain circumstances.
The directors may, at their option, redeem all rights for $0.001 per right, generally at any time prior to the rights becoming exercisable. The rights will expire June 3, 2019, unless earlier redeemed, exchanged, or amended by the directors.
In connection with the Big Heart acquisition, we and the rights agent entered into an amendment to the plan providing that neither the approval, execution, delivery, or performance of the merger agreement or the shareholders’ agreement entered into in connection with the transaction will in any way give rise to any provision of the plan becoming effective, and that none of Blue Holdings I, L.P., the controlling stockholder of BAG, or any of its affiliates will be deemed to be an acquiring person for purposes of the plan.
Repurchase Programs: On March 31, 2016, we entered into a 10b5-1 trading plan (“the Plan”) to facilitate the repurchase of 2.0 million common shares under the Board’s authorizations. Purchases under the Plan commenced on April 1, 2016, and concluded on April 30, 2016, and were transacted by a broker based upon the guidelines and parameters of the Plan. During 2016, we repurchased a total of 3.4 million shares, including 2.0 million shares under the Plan, for $437.8. We did not repurchase any shares in 2015.
At April 30, 2016, approximately 6.6 million common shares were available for repurchase pursuant to the Board’s authorizations.
80 THE J. M.SMUCKER COMPANY
DIRECTORS AND OFFICERS
The J. M. Smucker Company
DIRECTORS | ||
Vincent C. Byrd | Nancy Lopez KnightG | Alex ShumateG |
Retired Vice Chairman | Founder | Managing Partner, North America |
The J. M. Smucker Company | Nancy Lopez Golf Company | Squire Patton Boggs (US) LLP |
Auburn, Alabama | Columbus, Ohio | |
Kathryn W. DindoA, E | ||
Retired Vice President and | Elizabeth Valk LongA, E | Mark T. Smucker |
Chief Risk Officer | Former Executive Vice President | President and Chief Executive Officer |
FirstEnergy Corp. | Time Inc. | The J. M. Smucker Company |
Akron, Ohio | New York, New York | |
Richard K. Smucker | ||
Paul J. DolanE | Gary A. OateyG | Executive Chairman |
Chairman and Chief Executive Officer | Executive Chairman | The J. M. Smucker Company |
Cleveland Indians | Oatey Co. | |
Cleveland, Ohio | Cleveland, Ohio | Timothy P. Smucker |
Chairman Emeritus | ||
Robert B. Heisler, Jr.A | Sandra PianaltoA | The J. M. Smucker Company |
Retired Chairman of the Board | Retired President and | |
KeyBank | Chief Executive Officer | David J. West |
Cleveland, Ohio | Federal Reserve Bank of Cleveland Cleveland, Ohio | Retired President, Big Heart Pet Foods and Snacks |
The J. M. Smucker Company | ||
A Audit Committee Member; E Executive Compensation Committee Member; G Nominating and Corporate Governance Committee Member
2016 ANNUAL REPORT 81
DIRECTORS AND OFFICERS
The J. M. Smucker Company
EXECUTIVE OFFICERS | ||
Richard K. Smucker | Robert D. Ferguson | Jill R. Penrose |
Executive Chairman | Senior Vice President, Supply Chain | Senior Vice President, Human Resources |
and Corporate Communications | ||
Mark T. Smucker | Tamara J. Fynan | |
President and Chief Executive Officer | Vice President, Marketing Services | Christopher P. Resweber |
Senior Vice President, Industry Affairs | ||
Dennis J. Armstrong* | Kevin G. Jackson | |
Senior Vice President, Logistics and | Vice President, U.S. Retail Sales | Julia L. Sabin |
Operations Support | and Market Development Organization | Vice President, Government Affairs |
and Corporate Sustainability | ||
Mark R. Belgya | Jeannette L. Knudsen | |
Vice Chair and Chief Financial Officer | Senior Vice President, General Counsel | Geoff E. Tanner |
and Secretary | Senior Vice President, Growth | |
James R. Day | and Innovation | |
Senior Vice President, Operations | David J. Lemmon | |
President, Canada and International | ||
John W. Denman | ||
Vice President, Human Resource | John F. Mayer^ | |
Operations | Corporate Vice President | |
Barry C. Dunaway | Steven Oakland | |
President, Pet Food and Pet Snacks | Vice Chair and President, U.S. Food and | |
Beverage | ||
* Retiring September 30, 2016; ^ Retiring July 31, 2016
82 THE J. M.SMUCKER COMPANY
OUR LOCATIONS
The J. M. Smucker Company
CORPORATE OFFICE
Orrville, Ohio
DOMESTIC MANUFACTURING LOCATIONS
Bloomsburg, Pennsylvania | Lawrence, Kansas | Ripon, Wisconsin | ||
Buffalo, New York | Lexington, Kentucky | Scottsville, Kentucky | ||
Chico, California | Livermore, California | Seattle, Washington | ||
Cincinnati, Ohio | Memphis, Tennessee | Suffolk, Virginia | ||
Decatur, Alabama | New Bethlehem, Pennsylvania | Toledo, Ohio | ||
Grandview, Washington | New Orleans, Louisiana (3) | Topeka, Kansas | ||
Harahan, Louisiana | Orrville, Ohio | |||
Havre de Grace, Maryland | Oxnard, California | |||
INTERNATIONAL MANUFACTURING LOCATION
Sherbrooke, Quebec, Canada
2016 ANNUAL REPORT 83


Exhibit 21
SUBSIDIARIES OF THE COMPANY
(As of April 30, 2016)1
Subsidiaries | State or Jurisdiction of Incorporation or Organization | |
BHPB Service, LLC | Delaware | |
BHPI Service, LLC | Delaware | |
Big Heart Distribution, LLC | Delaware | |
Big Heart Manufacturing, LLC | Delaware | |
Big Heart Pet Brands, Inc. | Delaware | |
Big Heart Pet Foods, LLC | Delaware | |
Big Heart Pet, Inc. | Delaware | |
Big Heart Retail Sales, LLC | Delaware | |
Big Heart Services, LLC | Delaware | |
Big Heart, LLC | Delaware | |
CAFÉ Holding, LLC | Ohio | |
DECS International Mexico, S. de R.L. C.V. | Mexico | |
Eagle Family Foods, Inc. | Delaware | |
Enray Inc. | California | |
Fantasia Confections, Inc. | California | |
Folgers Café Servicos de Pesquisas, Ltda. | Brazil | |
J.M. Smucker de Mexico, S.A. de C.V. | Mexico (domesticated in Delaware) | |
J.M. Smucker Holdings, LLC | Ohio | |
J.M. Smucker LLC | Ohio | |
JMS Foodservice, LLC | Delaware | |
Juice Creations Co. | Ohio | |
King Kelly, LLC | Ohio | |
Knudsen & Sons, Inc. | Ohio | |
Martha White Foods, Inc. | Delaware | |
Mary Ellen’s, Incorporated | Ohio | |
Meow Mix Decatur Production I LLC | Delaware | |
Millstone Coffee, Inc. | Washington | |
Milnot Company | Delaware | |
Milo’s Kitchen, LLC | Delaware | |
Natural Balance Organic Formulas, LLC | California | |
Natural Balance Pet Foods, Inc. | California | |
Nature’s Recipe, LLC | Delaware | |
Rowland Coffee Roasters, Inc. | Ohio | |
Sahale Snacks, Inc. | Delaware | |
Santa Cruz Natural Incorporated | California | |
Simply Smucker’s, Inc. | Ohio | |
Smucker Coffee Silo Operations, LLC | Louisiana | |
Smucker Direct, Inc. | Ohio | |
Smucker Foods Holding Company | Ohio | |
Smucker Foods of Canada Corp. | Canada | |
Smucker Foods, Inc. | Delaware | |
Smucker Foodservice, Inc. | Delaware | |
Smucker Foodservice Operations, Inc. | Delaware | |
Smucker Fruit Processing Co. | Ohio | |
Smucker Holdings, B.V. | Netherlands | |
Smucker Holdings, Inc. | Ohio | |
Smucker Hong Kong Limited | Hong Kong | |
Smucker International Holding Company | Ohio | |
Smucker International, Inc. | Ohio | |
Smucker International (Shanghai) Co., Ltd. | China | |
Smucker Manufacturing, Inc. | Ohio | |
Smucker Mexico, LLC | Ohio | |
Smucker Natural Foods, Inc. | California | |
Smucker Netherlands, C.V. | Netherlands | |
Smucker Retail Foods, Inc. | Ohio | |
Smucker Sales and Distribution Company | Ohio | |
Smucker Services Company | Ohio | |
The Dickinson Family, Inc. | Ohio | |
The Folger Coffee Company | Ohio | |
The Folgers Coffee Company | Delaware | |
1 Pursuant to Item 601(b)(21)(ii) of Regulation S-K, the names of certain subsidiaries of the Company have been omitted because such
unnamed subsidiaries, considered in the aggregate as a single subsidiary, would not constitute a significant subsidiary as of April 30, 2016.
Exhibit 23
Consent of Independent Registered Public Accounting Firm
We consent to the incorporation by reference in this Annual Report (Form 10-K) of The J. M. Smucker Company of our reports dated June 21, 2016, with respect to the consolidated financial statements of The J. M. Smucker Company and the effectiveness of internal control over financial reporting of The J. M. Smucker Company, included in the 2016 Annual Report to Shareholders of The J. M. Smucker Company.
We also consent to the incorporation by reference in the following Registration Statements of our reports dated June 21, 2016, with respect to the consolidated financial statements of The J. M. Smucker Company and the effectiveness of internal control over financial reporting of The J. M. Smucker Company incorporated by reference in this Annual Report (Form 10-K) of The J. M. Smucker Company for the year ended April 30, 2016:
Registration Statement | Registration Number | Description | ||
Form S-8 | 333-98335 | The J. M. Smucker Company Amended and Restated 1998 Equity and Performance Incentive Plan | ||
Form S-8 | 333-116622 | Amended and Restated 1986 Stock Option Incentive Plan of The J. M. Smucker Company | ||
Amended and Restated 1989 Stock-Based Incentive Plan of The J. M. Smucker Company | ||||
Amended and Restated 1997 Stock-Based Incentive Plan of The J. M. Smucker Company | ||||
Form S-8 | 333-137629 | The J. M. Smucker Company 2006 Equity Compensation Plan | ||
Form S-8 | 333-139167 | The J. M. Smucker Company Nonemployee Director Deferred Compensation Plan | ||
Form S-8 | 333-170653 | The J. M. Smucker Company 2010 Equity and Incentive Compensation Plan | ||
Form S-3 | 333-177279 | Automatic Shelf Registration Statement | ||
Form S-3 | 333-197428 | Automatic Shelf Registration Statement | ||
/s/ Ernst & Young LLP
Akron, Ohio
June 21, 2016
Exhibit 24
THE J. M. SMUCKER COMPANY
REGISTRATION ON FORM 10-K
POWER OF ATTORNEY
KNOW ALL MEN BY THESE PRESENTS, that VINCENT C. BYRD, director of The J. M. Smucker Company, hereby appoints Mark T. Smucker, Mark R. Belgya, and Jeannette L. Knudsen, and each of them, with full power of substitution, as attorney or attorneys of the undersigned, to execute an Annual Report on Form 10-K for the fiscal year ended April 30, 2016, in a form that The J. M. Smucker Company deems appropriate and to file the same, with all exhibits thereto and other documents in connection therewith, with the Securities and Exchange Commission, all pursuant to applicable legal provisions, with full power and authority to do and perform each and every act and thing requisite and necessary to be done, as fully to all intents and purposes as the undersigned director might or could do in person, in furtherance of the foregoing.
June 21, 2016 | /s/ Vincent C. Byrd | |
Date | Director | |
THE J. M. SMUCKER COMPANY
REGISTRATION ON FORM 10-K
POWER OF ATTORNEY
KNOW ALL MEN BY THESE PRESENTS, that KATHRYN W. DINDO, director of The J. M. Smucker Company, hereby appoints Mark T. Smucker, Mark R. Belgya, and Jeannette L. Knudsen, and each of them, with full power of substitution, as attorney or attorneys of the undersigned, to execute an Annual Report on Form 10-K for the fiscal year ended April 30, 2016, in a form that The J. M. Smucker Company deems appropriate and to file the same, with all exhibits thereto and other documents in connection therewith, with the Securities and Exchange Commission, all pursuant to applicable legal provisions, with full power and authority to do and perform each and every act and thing requisite and necessary to be done, as fully to all intents and purposes as the undersigned director might or could do in person, in furtherance of the foregoing.
June 21, 2016 | /s/ Kathryn W. Dindo | |
Date | Director | |
THE J. M. SMUCKER COMPANY
REGISTRATION ON FORM 10-K
POWER OF ATTORNEY
KNOW ALL MEN BY THESE PRESENTS, that PAUL J. DOLAN, director of The J. M. Smucker Company, hereby appoints Mark T. Smucker, Mark R. Belgya, and Jeannette L. Knudsen, and each of them, with full power of substitution, as attorney or attorneys of the undersigned, to execute an Annual Report on Form 10-K for the fiscal year ended April 30, 2016, in a form that The J. M. Smucker Company deems appropriate and to file the same, with all exhibits thereto and other documents in connection therewith, with the Securities and Exchange Commission, all pursuant to applicable legal provisions, with full power and authority to do and perform each and every act and thing requisite and necessary to be done, as fully to all intents and purposes as the undersigned director might or could do in person, in furtherance of the foregoing.
June 21, 2016 | /s/ Paul J. Dolan | |
Date | Director | |
THE J. M. SMUCKER COMPANY
REGISTRATION ON FORM 10-K
POWER OF ATTORNEY
KNOW ALL MEN BY THESE PRESENTS, that NANCY LOPEZ KNIGHT, director of The J. M. Smucker Company, hereby appoints Mark T. Smucker, Mark R. Belgya, and Jeannette L. Knudsen, and each of them, with full power of substitution, as attorney or attorneys of the undersigned, to execute an Annual Report on Form 10-K for the fiscal year ended April 30, 2016, in a form that The J. M. Smucker Company deems appropriate and to file the same, with all exhibits thereto and other documents in connection therewith, with the Securities and Exchange Commission, all pursuant to applicable legal provisions, with full power and authority to do and perform each and every act and thing requisite and necessary to be done, as fully to all intents and purposes as the undersigned director might or could do in person, in furtherance of the foregoing.
June 21, 2016 | /s/ Nancy Lopez Knight | |
Date | Director | |
THE J. M. SMUCKER COMPANY
REGISTRATION ON FORM 10-K
POWER OF ATTORNEY
KNOW ALL MEN BY THESE PRESENTS, that ELIZABETH VALK LONG, director of The J. M. Smucker Company, hereby appoints Mark T. Smucker, Mark R. Belgya, and Jeannette L. Knudsen, and each of them, with full power of substitution, as attorney or attorneys of the undersigned, to execute an Annual Report on Form 10-K for the fiscal year ended April 30, 2016, in a form that The J. M. Smucker Company deems appropriate and to file the same, with all exhibits thereto and other documents in connection therewith, with the Securities and Exchange Commission, all pursuant to applicable legal provisions, with full power and authority to do and perform each and every act and thing requisite and necessary to be done, as fully to all intents and purposes as the undersigned director might or could do in person, in furtherance of the foregoing.
June 21, 2016 | /s/ Elizabeth Valk Long | |
Date | Director | |
THE J. M. SMUCKER COMPANY
REGISTRATION ON FORM 10-K
POWER OF ATTORNEY
KNOW ALL MEN BY THESE PRESENTS, that GARY A. OATEY, director of The J. M. Smucker Company, hereby appoints Mark T. Smucker, Mark R. Belgya, and Jeannette L. Knudsen, and each of them, with full power of substitution, as attorney or attorneys of the undersigned, to execute an Annual Report on Form 10-K for the fiscal year ended April 30, 2016, in a form that The J. M. Smucker Company deems appropriate and to file the same, with all exhibits thereto and other documents in connection therewith, with the Securities and Exchange Commission, all pursuant to applicable legal provisions, with full power and authority to do and perform each and every act and thing requisite and necessary to be done, as fully to all intents and purposes as the undersigned director might or could do in person, in furtherance of the foregoing.
June 21, 2016 | /s/ Gary A. Oatey | |
Date | Director | |
THE J. M. SMUCKER COMPANY
REGISTRATION ON FORM 10-K
POWER OF ATTORNEY
KNOW ALL MEN BY THESE PRESENTS, that SANDRA PIANALTO, director of The J. M. Smucker Company, hereby appoints Mark T. Smucker, Mark R. Belgya, and Jeannette L. Knudsen, and each of them, with full power of substitution, as attorney or attorneys of the undersigned, to execute an Annual Report on Form 10-K for the fiscal year ended April 30, 2016, in a form that The J. M. Smucker Company deems appropriate and to file the same, with all exhibits thereto and other documents in connection therewith, with the Securities and Exchange Commission, all pursuant to applicable legal provisions, with full power and authority to do and perform each and every act and thing requisite and necessary to be done, as fully to all intents and purposes as the undersigned director might or could do in person, in furtherance of the foregoing.
June 21, 2016 | /s/ Sandra Pianalto | |
Date | Director | |
THE J. M. SMUCKER COMPANY
REGISTRATION ON FORM 10-K
POWER OF ATTORNEY
KNOW ALL MEN BY THESE PRESENTS, that MARK T. SMUCKER, President and Chief Executive Officer and director of The J. M. Smucker Company, hereby appoints Mark R. Belgya and Jeannette L. Knudsen, and each of them, with full power of substitution, as attorney or attorneys of the undersigned, to execute an Annual Report on Form 10-K for the fiscal year ended April 30, 2016, in a form that The J. M. Smucker Company deems appropriate and to file the same, with all exhibits thereto and other documents in connection therewith, with the Securities and Exchange Commission, all pursuant to applicable legal provisions, with full power and authority to do and perform each and every act and thing requisite and necessary to be done, as fully to all intents and purposes as the undersigned director might or could do in person, in furtherance of the foregoing.
June 21, 2016 | /s/ Mark T. Smucker | |
Date | President and Chief Executive Officer and Director | |
THE J. M. SMUCKER COMPANY
REGISTRATION ON FORM 10-K
POWER OF ATTORNEY
KNOW ALL MEN BY THESE PRESENTS, that RICHARD K. SMUCKER, director of The J. M. Smucker Company, hereby appoints Mark T. Smucker, Mark R. Belgya, and Jeannette L. Knudsen, and each of them, with full power of substitution, as attorney or attorneys of the undersigned, to execute an Annual Report on Form 10-K for the fiscal year ended April 30, 2016, in a form that The J. M. Smucker Company deems appropriate and to file the same, with all exhibits thereto and other documents in connection therewith, with the Securities and Exchange Commission, all pursuant to applicable legal provisions, with full power and authority to do and perform each and every act and thing requisite and necessary to be done, as fully to all intents and purposes as the undersigned director might or could do in person, in furtherance of the foregoing.
June 21, 2016 | /s/ Richard K. Smucker | |
Date | Director | |
THE J. M. SMUCKER COMPANY
REGISTRATION ON FORM 10-K
POWER OF ATTORNEY
KNOW ALL MEN BY THESE PRESENTS, that TIMOTHY P. SMUCKER, director of The J. M. Smucker Company, hereby appoints Mark T. Smucker, Mark R. Belgya, and Jeannette L. Knudsen, and each of them, with full power of substitution, as attorney or attorneys of the undersigned, to execute an Annual Report on Form 10-K for the fiscal year ended April 30, 2016, in a form that The J. M. Smucker Company deems appropriate and to file the same, with all exhibits thereto and other documents in connection therewith, with the Securities and Exchange Commission, all pursuant to applicable legal provisions, with full power and authority to do and perform each and every act and thing requisite and necessary to be done, as fully to all intents and purposes as the undersigned director might or could do in person, in furtherance of the foregoing.
June 21, 2016 | /s/ Timothy P. Smucker | |
Date | Director | |
THE J. M. SMUCKER COMPANY
REGISTRATION ON FORM 10-K
POWER OF ATTORNEY
KNOW ALL MEN BY THESE PRESENTS, that ALEX SHUMATE, director of The J. M. Smucker Company, hereby appoints Mark T. Smucker, Mark R. Belgya, and Jeannette L. Knudsen, and each of them, with full power of substitution, as attorney or attorneys of the undersigned, to execute an Annual Report on Form 10-K for the fiscal year ended April 30, 2016, in a form that The J. M. Smucker Company deems appropriate and to file the same, with all exhibits thereto and other documents in connection therewith, with the Securities and Exchange Commission, all pursuant to applicable legal provisions, with full power and authority to do and perform each and every act and thing requisite and necessary to be done, as fully to all intents and purposes as the undersigned director might or could do in person, in furtherance of the foregoing.
June 21, 2016 | /s/ Alex Shumate | |
Date | Director | |
THE J. M. SMUCKER COMPANY
REGISTRATION ON FORM 10-K
POWER OF ATTORNEY
KNOW ALL MEN BY THESE PRESENTS, that DAVID J. WEST, director of The J. M. Smucker Company, hereby appoints Mark T. Smucker, Mark R. Belgya, and Jeannette L. Knudsen, and each of them, with full power of substitution, as attorney or attorneys of the undersigned, to execute an Annual Report on Form 10-K for the fiscal year ended April 30, 2016, in a form that The J. M. Smucker Company deems appropriate and to file the same, with all exhibits thereto and other documents in connection therewith, with the Securities and Exchange Commission, all pursuant to applicable legal provisions, with full power and authority to do and perform each and every act and thing requisite and necessary to be done, as fully to all intents and purposes as the undersigned director might or could do in person, in furtherance of the foregoing.
June 14, 2016 | /s/ David J. West | |
Date | Director | |
Exhibit 31.1
RULE 13a-14(a)/15d-14(a) CERTIFICATIONS
I, Mark T. Smucker, President and Chief Executive Officer of The J. M. Smucker Company, certify that:
(1) | I have reviewed this annual report on Form 10-K of The J. M. Smucker Company; |
(2) | Based on my knowledge, this report does not contain any untrue statement of a material fact or omit to state a material fact necessary to make the statements made, in light of the circumstances under which such statements were made, not misleading with respect to the period covered by this report; |
(3) | Based on my knowledge, the financial statements, and other financial information included in this report, fairly present in all material respects the financial condition, results of operations, and cash flows of the registrant as of, and for, the periods presented in this report; |
(4) | The registrant’s other certifying officer and I are responsible for establishing and maintaining disclosure controls and procedures (as defined in Exchange Act Rules 13a-15(e) and 15d-15(e)) and internal control over financial reporting (as defined in Exchange Act Rules 13a-15(f) and 15d-15(f)) for the registrant and have: |
a. | Designed such disclosure controls and procedures, or caused such disclosure controls and procedures to be designed under our supervision, to ensure that material information relating to the registrant, including its consolidated subsidiaries, is made known to us by others within those entities, particularly during the period in which this report is being prepared; |
b. | Designed such internal control over financial reporting, or caused such internal control over financial reporting to be designed under our supervision, to provide reasonable assurance regarding the reliability of financial reporting and the preparation of financial statements for external purposes in accordance with generally accepted accounting principles; |
c. | Evaluated the effectiveness of the registrant’s disclosure controls and procedures and presented in this report our conclusions about the effectiveness of the disclosure controls and procedures, as of the end of the period covered by this report based on such evaluation; and |
d. | Disclosed in this report any change in the registrant’s internal control over financial reporting that occurred during the registrant’s most recent fiscal quarter (the registrant’s fourth fiscal quarter in the case of an annual report) that has materially affected, or is reasonably likely to materially affect, the registrant’s internal control over financial reporting; and |
(5) | The registrant’s other certifying officer and I have disclosed, based on our most recent evaluation of internal control over financial reporting, to the registrant’s auditors and the audit committee of the registrant’s board of directors (or persons performing the equivalent functions): |
a. | All significant deficiencies and material weaknesses in the design or operation of internal control over financial reporting which are reasonably likely to adversely affect the registrant’s ability to record, process, summarize, and report financial information; and |
b. | Any fraud, whether or not material, that involves management or other employees who have a significant role in the registrant’s internal control over financial reporting. |
Date: June 21, 2016
/s/ Mark T. Smucker | ||
Name: | Mark T. Smucker | |
Title: | President and Chief Executive Officer | |
Exhibit 31.2
RULE 13a-14(a)/15d-14(a) CERTIFICATIONS
I, Mark R. Belgya, Vice Chair and Chief Financial Officer of The J. M. Smucker Company, certify that:
(1) | I have reviewed this annual report on Form 10-K of The J. M. Smucker Company; |
(2) | Based on my knowledge, this report does not contain any untrue statement of a material fact or omit to state a material fact necessary to make the statements made, in light of the circumstances under which such statements were made, not misleading with respect to the period covered by this report; |
(3) | Based on my knowledge, the financial statements, and other financial information included in this report, fairly present in all material respects the financial condition, results of operations, and cash flows of the registrant as of, and for, the periods presented in this report; |
(4) | The registrant’s other certifying officer and I are responsible for establishing and maintaining disclosure controls and procedures (as defined in Exchange Act Rules 13a-15(e) and 15d-15(e)) and internal control over financial reporting (as defined in Exchange Act Rules 13a-15(f) and 15d-15(f)) for the registrant and have: |
a. | Designed such disclosure controls and procedures, or caused such disclosure controls and procedures to be designed under our supervision, to ensure that material information relating to the registrant, including its consolidated subsidiaries, is made known to us by others within those entities, particularly during the period in which this report is being prepared; |
b. | Designed such internal control over financial reporting, or caused such internal control over financial reporting to be designed under our supervision, to provide reasonable assurance regarding the reliability of financial reporting and the preparation of financial statements for external purposes in accordance with generally accepted accounting principles; |
c. | Evaluated the effectiveness of the registrant’s disclosure controls and procedures and presented in this report our conclusions about the effectiveness of the disclosure controls and procedures, as of the end of the period covered by this report based on such evaluation; and |
d. | Disclosed in this report any change in the registrant’s internal control over financial reporting that occurred during the registrant’s most recent fiscal quarter (the registrant’s fourth fiscal quarter in the case of an annual report) that has materially affected, or is reasonably likely to materially affect, the registrant’s internal control over financial reporting; and |
(5) | The registrant’s other certifying officer and I have disclosed, based on our most recent evaluation of internal control over financial reporting, to the registrant’s auditors and the audit committee of the registrant’s board of directors (or persons performing the equivalent functions): |
a. | All significant deficiencies and material weaknesses in the design or operation of internal control over financial reporting which are reasonably likely to adversely affect the registrant’s ability to record, process, summarize, and report financial information; and |
b. | Any fraud, whether or not material, that involves management or other employees who have a significant role in the registrant’s internal control over financial reporting. |
Date: June 21, 2016
/s/ Mark R. Belgya | ||
Name: | Mark R. Belgya | |
Title: | Vice Chair and Chief Financial Officer | |
Exhibit 32
CERTIFICATION PURSUANT TO 18 U.S.C. SECTION 1350, AS ADOPTED
PURSUANT TO SECTION 906 OF THE SARBANES-OXLEY ACT OF 2002
In connection with the Annual Report on Form 10-K of The J. M. Smucker Company (the “Company”) for the year ended April 30, 2016, as filed with the Securities and Exchange Commission on the date hereof (the “Report”), each of the undersigned officers of the Company certifies, pursuant to 18 U.S.C. Section 1350, as adopted pursuant to Section 906 of the Sarbanes-Oxley Act of 2002, that, to such officer’s knowledge:
(1)The Report fully complies with the requirements of Section 13(a) or 15(d) of the Securities Exchange Act of 1934; and
(2)The information contained in the Report fairly presents, in all material respects, the financial condition and results of operations of the Company as of the dates and for the periods expressed in the Report.
/s/ Mark T. Smucker | |||
Name: | Mark T. Smucker | ||
Title: | President and Chief Executive Officer | ||
/s/ Mark R. Belgya | |||
Name: | Mark R. Belgya | ||
Title: | Vice Chair and Chief Financial Officer | ||
Date: June 21, 2016
The foregoing certification is being furnished solely pursuant to 18 U.S.C. Section 1350 and is not being filed as part of the Report or as a separate disclosure document.
Serious News for Serious Traders! Try StreetInsider.com Premium Free!
You May Also Be Interested In
- J. M. Smucker (SJM) Declares $1.06 Quarterly Dividend; 3.8% Yield
- Dimensional Fund Advisors Ltd. : Form 8.3 - DS SMITH PLC - Ordinary Shares
- Travel + Leisure Co. Reports First Quarter 2024 Results
Create E-mail Alert Related Categories
SEC FilingsSign up for StreetInsider Free!
Receive full access to all new and archived articles, unlimited portfolio tracking, e-mail alerts, custom newswires and RSS feeds - and more!
