

Form 8-K VALERO ENERGY CORP/TX For: Jun 15
 Tweet
Tweet Share
Share
UNITED STATES
SECURITIES AND EXCHANGE COMMISSION
Washington, D.C. 20549
FORM 8-K
CURRENT REPORT
Pursuant to Section 13 or 15(d)
of the Securities Exchange Act of 1934
Date of Report (Date of earliest event reported): June 15, 2016
VALERO ENERGY CORPORATION
(Exact name of registrant as specified in its charter)
| Delaware | 1-13175 | 74-1828067 | ||
| (State or other jurisdiction of incorporation) |
(Commission File Number) |
(IRS Employer Identification No.) | ||
| One Valero Way San Antonio, Texas |
78249 | |||
| (Address of principal executive offices) | (Zip Code) | |||
Registrant’s telephone number, including area code: (210) 345-2000
Check the appropriate box below if the Form 8-K filing is intended to simultaneously satisfy the filing obligation of the registrant under any of the following provisions (see General Instruction A.2. below):
| ¨ | Written communications pursuant to Rule 425 under the Securities Act (17 CFR 230.425) |
| ¨ | Soliciting material pursuant to Rule 14a-12 under the Exchange Act (17 CFR 240.14a-12) |
| ¨ | Pre-commencement communications pursuant to Rule 14d-2(b) under the Exchange Act (17 CFR 240.14d-2(b)) |
| ¨ | Pre-commencement communications pursuant to Rule 13e-4(c) under the Exchange Act (17 CFR 240.13e-4(c)) |
| Item 7.01 | Regulation FD Disclosure. |
Senior management of Valero Energy Corporation (the “Company”) will make certain investor presentations beginning as early as June 16, 2016. The slides attached to this report were prepared for management’s presentations. The slides are included in Exhibit 99.01 to this report and are incorporated herein by reference. The slides will be available on the Company’s website at www.valero.com.
The information in this report is being furnished, not filed, pursuant to Regulation FD. Accordingly, the information in Items 7.01 and 9.01 of this report will not be incorporated by reference into any registration statement filed by the Company under the Securities Act of 1933, as amended, unless specifically identified therein as being incorporated therein by reference. The furnishing of the information in this report is not intended to, and does not, constitute a determination or admission by the Company that the information in this report is material or complete, or that investors should consider this information before making an investment decision with respect to any security of the Company or any of its affiliates.
Safe Harbor Statement
Statements contained in the exhibit to this report that state the Company’s or its management’s expectations or predictions of the future are forward-looking statements intended to be covered by the safe harbor provisions of the Securities Act of 1933, as amended, and the Securities Exchange Act of 1934, as amended. It is important to note that the Company’s actual results could differ materially from those projected in such forward-looking statements. Factors that could affect those results include those mentioned in the documents that the Company has filed with the Securities and Exchange Commission.
| Item 9.01 | Financial Statements and Exhibits. |
| (d) | Exhibits. |
| 99.01 | Slides from management presentation. |
2
SIGNATURE
Pursuant to the requirements of the Securities Exchange Act of 1934, the Company has duly caused this report to be signed on its behalf by the undersigned hereunto duly authorized.
| VALERO ENERGY CORPORATION | ||||
| Date: June 15, 2016 | by: | /s/ Jay D. Browning | ||
| Jay D. Browning | ||||
| Executive Vice President and General Counsel | ||||
3
 Investor Presentation
June 2016 Exhibit 99.01 |
 2 Safe Harbor Statement Statements contained in this presentation that state the company’s or management’s expectations or predictions of the future are forward–looking statements intended to be covered by the safe harbor provisions of the Securities Act of 1933 and the Securities Exchange Act of 1934. The words “believe,” “expect,” “should,” “estimates,” “intend,” and other similar expressions identify forward–looking statements. It is important to note that actual results could differ materially from those projected in such forward– looking statements. For more information concerning factors that could cause actual results to differ from those expressed or forecasted, see Valero’s annual reports on Form 10-K and quarterly reports on Form 10-Q, filed with the Securities and Exchange Commission, and available on Valero’s website at www.valero.com. |
 3 Who We Are • 15 refineries, 3 million barrels per day (BPD) of high-complexity throughput capacity • Greater than 70% of refining capacity located in U.S. Gulf Coast and Mid-Continent • Wholesale fuels marketed and distributed through branded and unbranded channels Approximately 7,500 branded marketing sites in the U.S., Canada, United Kingdom and Ireland Brands include Valero, Ultramar, Texaco, Shamrock, Diamond Shamrock and Beacon • Approximately 10,000 employees World’s Largest Independent Refiner Operator of Liquids-Focused Logistics Assets • General partner and majority owner of Valero Energy Partners LP (NYSE: VLP), a fee-based master limited partnership (MLP) • Significant inventory of logistics assets within Valero One of North America’s Largest Renewable Fuels Producers • 11 corn ethanol plants, 1.4 billion gallons per year (85,000 BPD) production capacity • Operator and 50% owner of Diamond Green Diesel joint venture – 10,800 BPD renewable diesel production capacity |
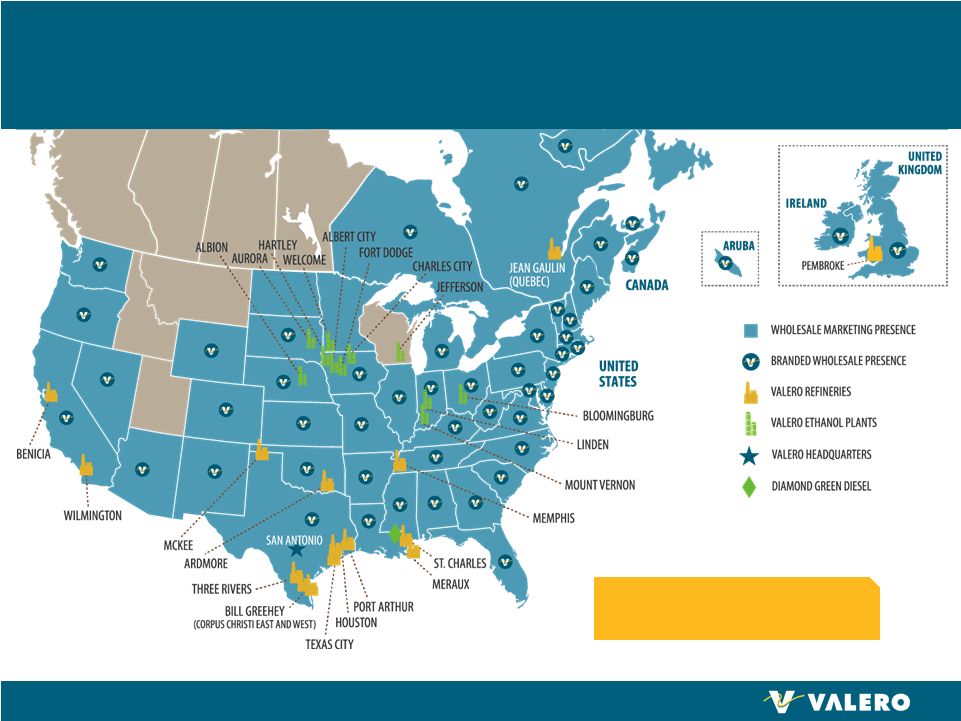 4 Strong U.S. Gulf Coast and Mid-Continent Presence Refineries and ethanol plants are in advantaged locations See slide 19 for capacities |
 5 Current Macro Environment See slide 18 in Appendix for notes regarding this slide and slides 24 – 27 for supply and demand details. Expect ample supply to keep prices low, which should continue driving increased petroleum demand.
Abundant global supply of crude oil
and natural gas Forecasted world GDP growth Product shortages in Latin America, Europe, Africa and Eastern Canada Demand response to lower product prices North American logistics build out added efficiency and removed mid-continent bottlenecks 1 2 3 4 5 SUPPLY DEMAND |
 6 Disciplined Capital Mgmt to Unlock Value Commercial and Operational Flexibility Operate Safely and Reliably Safety and Reliability are Imperative for Profitability 1.60 0.70 Personnel Safety Employees Contractors Industry Mechanical Availability Personnel Index Maintenance Index Non-Energy Cash Opex Energy Intensity Index VLO’s Performance Versus Industry Benchmarks 2008 2010 2012 2014 4 th Quartile 1 st Quartile 3 rd Quartile 2 nd Quartile See slide 18 in Appendix for notes regarding this slide. 0.19 0.08 Tier 1 Process Safety |
 7 Disciplined Capital Mgmt to Unlock Value Commercial and Operational Flexibility Operate Safely and Reliably Advantaged Location in U.S. Gulf Coast 1,354 1,084 743 189 0 0 VLO MPC PSX PBF TSO HFC U.S Gulf Coast CDU Capacity (MBPD) See slide 18 in Appendix for notes regarding this slide. Capacities as of January 1, 2016.
Over 55% of our throughput capacity is
located in U.S. Gulf Coast
– Access to low cost natural gas, North American and foreign crudes, deep skilled labor pool – Pipeline takeaway capacity additions have increased crude competition – Proximity to growing product export markets in Mexico and Latin America – Competitive refined products supplier to Eastern Canada and Northwest Europe – 13.4 weighted average regional Nelson Complexity Index – Flexibility to process wide range of crudes and feedstocks |
 8 Disciplined Capital Mgmt to Unlock Value Commercial and Operational Flexibility Operate Safely and Reliably $5.60 $3.60 $4.55 $3 $6 Refining Peers 1Q16 Refining Cash Operating Expenses Per Barrel of Throughput (Excludes Turnaround and D&A) High Complexity Refineries and Lowest Cost Operator 24% 17% 16% 12% 4% 34% 34% 34% 23% 10% Feedstock Ranges in U.S. Gulf Coast (2012 – 1Q16) See slide 18 in Appendix for notes regarding this slide. |
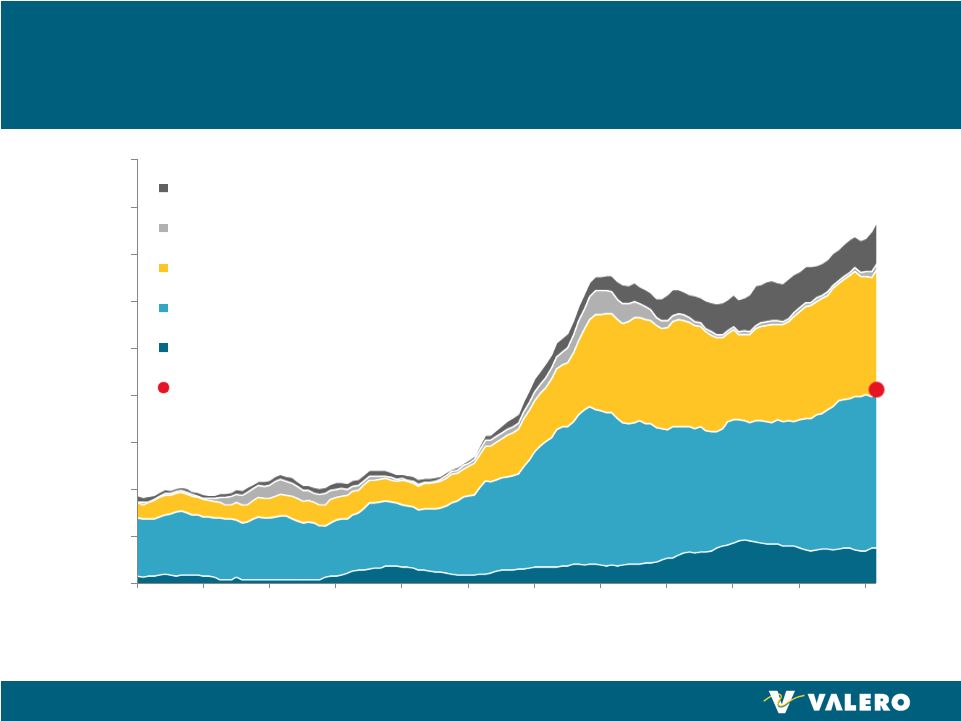
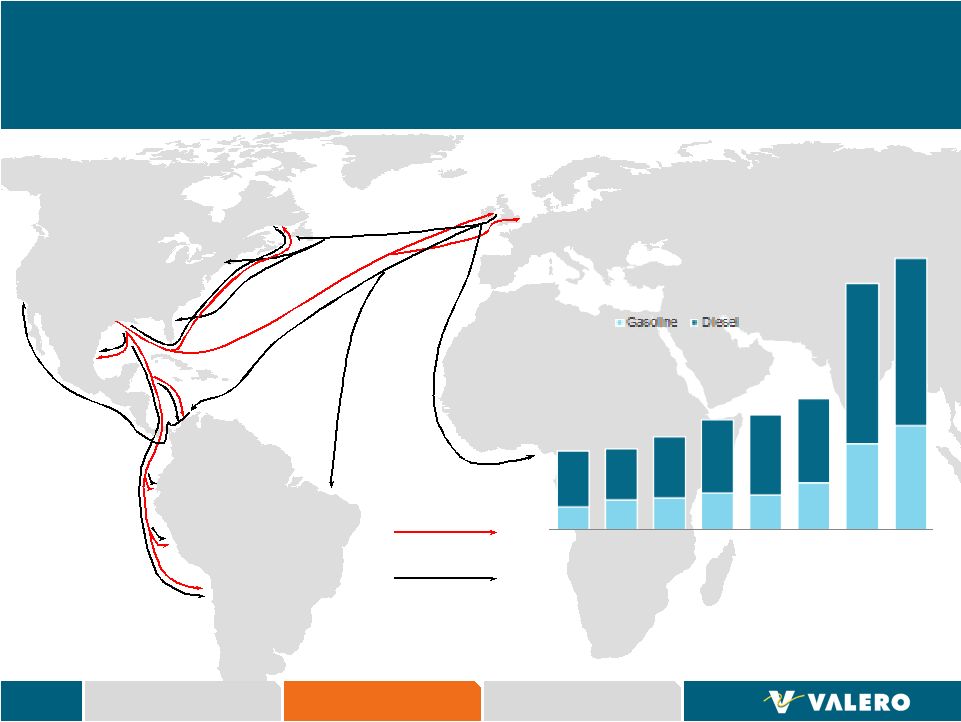 9 Disciplined Capital Mgmt to Unlock Value Commercial and Operational Flexibility Operate Safely and Reliably Our Portfolio Facilitates Optimization of Product Exports Distillate Gasoline 69 138 255 308 164 249 472 492 2011 2012 2013 2014 2015 2016* Current Capacity Potential Future Capacity VLO’s U.S. Product Exports (MBPD) Gasoline Diesel *Actual export volumes; 2016 volumes through March 31. See slide 18 in Appendix
for notes regarding this slide. |
 10 Disciplined Capital Mgmt to Unlock Value Commercial and Operational Flexibility Operate Safely and Reliably Capital Allocation Maintain Strong Balance Sheet (1) Debt-to-cap ratio based on total debt reduced by $2 billion of cash. (2) Peer group includes PSX, MPC, TSO, HFC, and PBF. (3) Payout ratio is the sum of dividends plus stock buybacks divided by net income from continuing operations excluding special items.
Sustaining Capex
• Approximately $1.5 billion annually • Key to safe and reliable operations Dividend • Commitment to shareholders • Targeting a dividend payout at the high end of our peer group (2) Growth Capex • 25% IRR hurdle rate for refining projects • Lower hurdle rate for logistics projects with steady cash flows Cash Returns • Targeting at least 75% payout (3) of net income for 2016 • Stock buyback program consists of ratable and opportunistic purchases Acquisitions • Evaluate versus alternative uses of cash • Maintain investment grade credit rating • Target 20% to 30% debt-to-cap ratio (1) 1 2 3 |
 11 Disciplined Capital Mgmt to Unlock Value Commercial and Operational Flexibility Operate Safely and Reliably Sustaining $1,640 Logistics $460 Asset Optimization $480 2016 Capital Budget ($MM) Capital Investments Focused on Maintaining Asset Base, Enhancing Margins, and Growing Logistics • Budgeted $2.6 billion in 2016 • 2016 growth investments allocated approximately 50/50 for logistics and asset optimization – Logistics • Expect about 95% to be MLP-eligible • Expect cash proceeds to VLO via drop downs to VLP – Asset optimization • Advantaged feedstocks and upgrading • Focused on shorter payback cycle projects • 2016 sustaining investments include a major turnaround at the Port Arthur refinery, which occurs every 5 years – Commences 3Q16 |
 12 Disciplined Capital Mgmt to Unlock Value Commercial and Operational Flexibility Operate Safely and Reliably Investing in Asset Optimization See slide 30 in Appendix for non-GAAP disclosures. • New CDU capacity at Corpus Christi (Dec 2015) and Houston (Jun 2016) to process up to 50 API sweet crude • 160 MBPD crude processing capacity replaces approximately 55 MBPD of purchased low sulfur resid for FCCs with indigenous production • Expect net throughput capacity increase of about 105 MBPD • Estimated $35 MM EBITDA contribution from Corpus Christi CDU for 1Q16 • Hydrocracker expansions at Port Arthur (Oct 2015) and St. Charles (Mar 2016) expected to increase distillate yield by an estimated 23 MBPD • New 13 MPBD Houston alkylation unit expected to startup in 1H19 • Projects under development: Octane enhancement Feedstock flexibility FCC feed desalting Cogeneration Diamond Green Diesel expansion Light Crude Products & Other |
 13 Disciplined Capital Mgmt to Unlock Value Commercial and Operational Flexibility Operate Safely and Reliably 4Q13 1Q14 2Q14 3Q14 4Q14 1Q15 2Q15 3Q15 4Q15 1Q16 Distributable Cash Flow (millions) 4Q13* 1Q14 2Q14 3Q14 4Q14 1Q15 2Q15 3Q15 4Q15 1Q16 Distribution per LP Unit • VLO owns entire 2% GP interest, all incentive distribution rights, and a 67% of outstanding LP interests • VLP’s assets are integrated with VLO’s refineries • Targeting 25% annual distribution growth through 2017 Our Sponsored MLP Valero Energy Partners LP (NYSE:VLP) Summary * This is the minimum quarterly distribution (MQD). The actual distribution was
smaller as it was prorated for the period of December 16 – 31. • 60% increase in quarterly cash distribution over MQD • $1.5 billion of drop down transactions completed • 4.25 million common unit follow-on equity offering completed in Nov 2015 • Sponsor demonstrated support via loans and taking back units as consideration for drop downs Accomplishments since IPO |
 14 Disciplined Capital Mgmt to Unlock Value Commercial and Operational Flexibility Operate Safely and Reliably Approximately $1 Billion of Estimated MLP Eligible EBITDA Inventory Racks, Terminals, and Storage (1) • Over 75 million barrels of active shell capacity for crude oil and products • 139 truck rack bays Rail • Approximately 5,300 purchased railcars, expected to serve long-term needs of ethanol, asphalt, aromatics, and other products Pipelines (1) • Over 1,200 miles of active pipelines • 440-mile Diamond Pipeline from Cushing to Memphis expected to start up in 4Q17 Marine (1) • 51 docks • Two Panamax class vessels (1) Includes assets that have other joint venture or minority interests. Wholesale Fuels Marketing • Approximately 800 MBPD fuels distribution volume |
 15 Disciplined Capital Mgmt to Unlock Value Commercial and Operational Flexibility Operate Safely and Reliably Renewables Business Renewables Operations • 11 ethanol plants with 1.4 billion gallons annual production capacity – Low capital investment with scale, located in corn belt – Operational best practices transferred from refining • Diamond Green Diesel plant – 50-50 JV with approximately 11 MBPD of renewable diesel production capacity – Evaluating 7.5 MBPD capacity expansion Renewables Outlook • Ethanol margins have improved versus 1Q16 • Expect ethanol demand to be strong globally, driven by increasing usage mandates, low absolute finished gasoline prices, and increased vehicle miles traveled • Expect renewable diesel margins to be supported by increased usage mandates and carbon pricing Ethanol plant in Linden, Indiana |
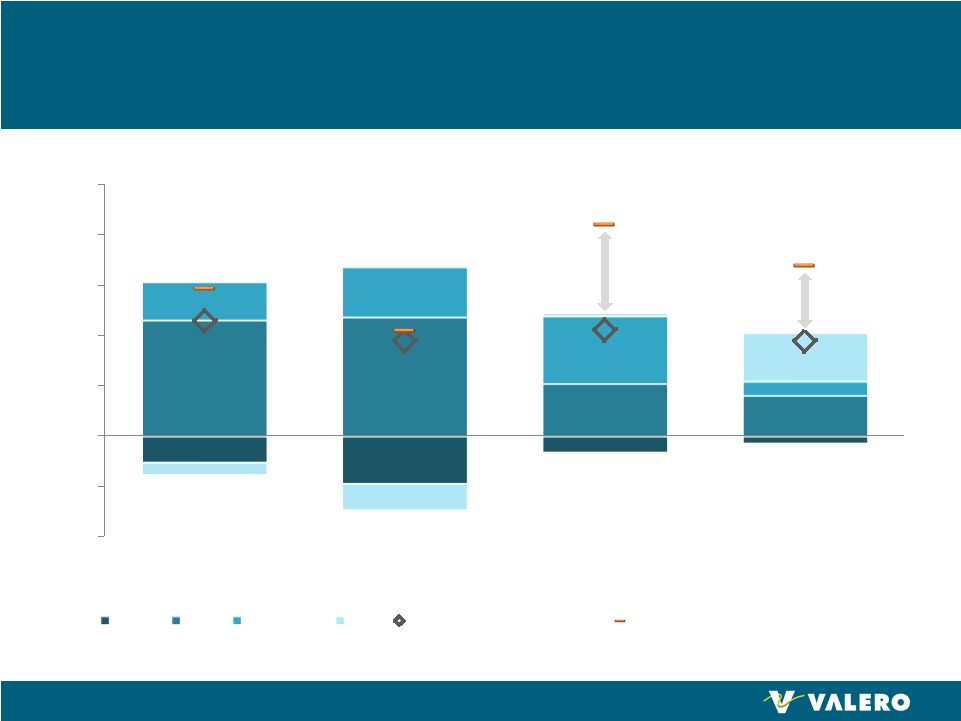
 16 We Believe Valero is an Excellent Investment Chart data sources: Company reports and Bloomberg as of June 13, 2016. See slide 18 in Appendix for notes.
We Believe VLO is Undervalued
• Disciplined management team • Strong financial position • Favorable macro environment • Proven operations excellence – Reliability drives profitability • Delivering industry-leading returns – Disciplined investing to drive earnings growth – Unlocking value through growth in MLP-eligible assets and drop-downs to VLP – Demonstrated commitment to capital allocation to stockholders 47% 10% 47% 30% 5% 50% 2015 Total Stockholder Return 5.1% 2.6% 4.6% 4.1% 2.1% 5.5% Current Dividend Yield |
 17 Appendix Contents Topic Pages Notes 18 Refining Operating Statistics 19 – 20 Natural Gas Cost Sensitivity 21 Crude Oil Transportation 22 – 23 Fundamentals 24 – 27 Valero Energy Partners LP 28 – 29 Non-GAAP Disclosures 30 Investor Relations Contacts 31 |
 18 Notes Slide 5 Macro environment themes represent industry consultant views. Slide 6 Contractor total recordable incident rate from U.S. Bureau of Labor Statistics. Tier 1 process safety event defined
within API Recommended Practice 754. Industry benchmarking and VLO performance
statistics from Solomon Associates and Valero.
Slide 7 Crude distillation capacities from company reports by geographic location.
Slide 8 Valero’s U.S. Gulf Coast feedstock ranges are based upon quarterly processing rates between 2012 and 1Q16.
Refining cash operating expenses per barrel of throughput, excluding D&A, from
company reports and Barclays Research. Peer group includes PSX, MPC, TSO,
HFC, and PBF. Slide 9
Valero’s potential future gasoline and distillate export capacities are based upon
expansion opportunities at the St. Charles and Port Arthur refineries.
Slide 16 Peer groups in total stockholder return and dividend yield consist of PSX, MPC, TSO, HFC, and PBF. |
 19 Our Refining Capacity and Nelson Complexity Refinery Capacities (MBPD) (1) Nelson Complexity Index Throughput Crude Corpus Christi (2) 370 275 15.1 Houston 175 90 15.4 Meraux 135 125 9.7 Port Arthur 375 335 12.7 St. Charles 305 215 16.1 Texas City 260 225 11.1 Three Rivers 100 89 13.2 U.S. Gulf Coast 1,720 1,354 13.4 Ardmore 90 86 12.1 McKee 200 195 8.3 Memphis 195 180 7.9 U.S. Mid-Continent 485 461 8.9 Pembroke 270 210 10.1 Quebec City 235 230 7.7 North Atlantic 505 440 8.8 Benicia 170 145 16.1 Wilmington 135 85 15.8 U.S. West Coast 305 230 16.0 Total 3,015 2,485 12.0* (1) Capacities and Nelson complexity indices as of Jan 1, 2016. (2) Represents the combined capacities of two refineries—Corpus Christi East and Corpus Christi West. 45MBPD increase in throughput compared to 2014 is related to the 70MBPD Crude Unit commissioned in December of 2015, net of 25MBPD of displaced low sulfur atmospheric resid purchases. *Weighted average. |
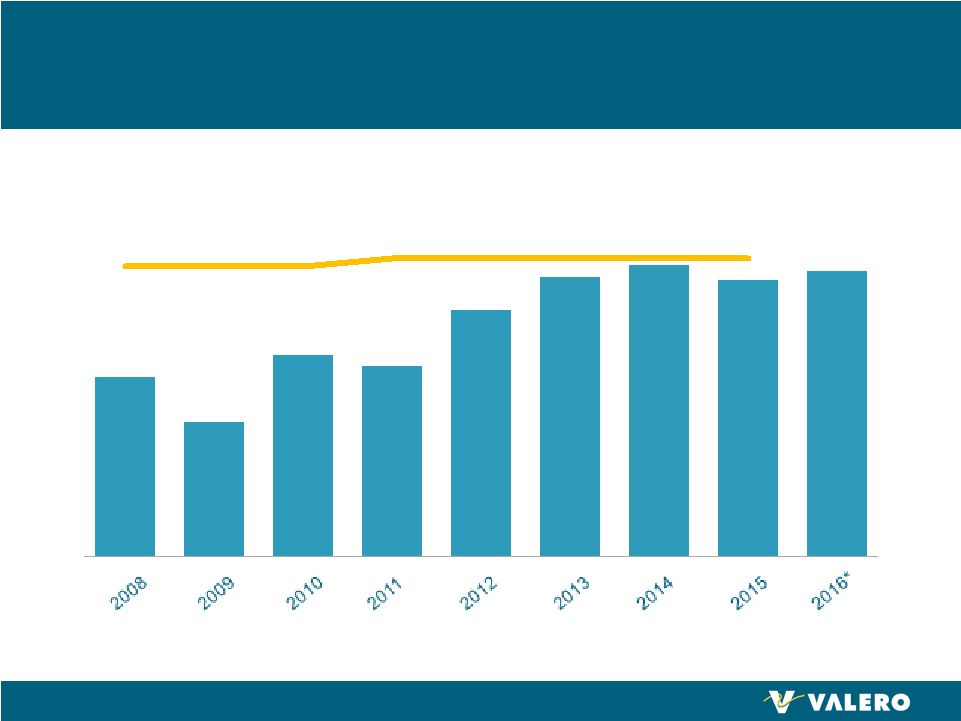 20 Reliability Initiatives Have Improved Refinery Availability and Enabled Higher Utilization 86% 82% 88% 87% 92% 95% 96% 95% 96% Solomon availability Valero Refinery Availability and Utilization Rates * 2016 through March 31. |
 21 $2.00/mmBtu U.S. $0.65/bbl $4.25/mmBtu Europe $1.36/bbl Natural Gas Cost Sensitivity for Valero’s Refineries U.S. Natural Gas Provides Opex and Feedstock Cost Advantages Natural gas prices year to date as of June 5, 2016 for U.S. and Europe. Estimated per barrel cost of 898,000 mmBtu/day of natural gas consumption
at 93% refinery throughput capacity utilization, or 2.8
MMBPD. $731 MM
higher pre-tax annual costs • Our refining operations consume approximately 898,000 mmBtu/day of natural gas, of which
56% is operating expense and balance is cost of goods sold
• Significant annual pre-tax cost savings compared to refiners in Europe • Prices expected to remain low and disconnected from global oil and gas markets |
       22 KEY Pipeline Takeaway Capacity Additions Have Increased Crude Competition in the U.S. Gulf Coast Niobrara Completed 2016 or Later Startup Capacities in MBPD. Pipeline completion and startup dates are subject to change. Bayou Bridge Phase 1 operational
with Phase 2 completion expected in 2017.
Cushing Alberta Permian • Pipeline takeaway capacity additions increased market liquidity and crude competition in U.S. Gulf Coast • Discounts for inland crudes versus WTI and Brent have narrowed • Eagle Ford and Houston WTI likely to price at quality adjusted differentials to LLS Eagle Ford Bakken |
 23 Investing to Improve Access to North American Crude Diamond Pipeline • 440 miles of 20-inch pipe (200 MBPD capacity) connecting Memphis to Cushing
• Received permits required to begin construction; project is on track for completion in 4Q17
• Provides supply flexibility and ability to improve crude blend quality • Approximately $925 MM total project cost Exercised option in Dec 2015 to acquire 50% interest; approximately $136 MM spent in 2015 and $170
MM budgeted in 2016 Expect to receive cash proceeds if 50% interest is dropped to VLP and 12% pre-tax IRR for VLP |
 24 Production Growth Provides Resource Advantage to North American Refiners U.S. Natural Gas Production (Bcf/day) Source: DOE, 2016 data through March 9,213 7,872 5,476 9,145 U.S. Crude Oil Production and Imports (MBPD) 74.6 58.4 |
 25 -0.8 -0.4 0.0 0.4 0.8 1.2 1.6 2.0 2013 2014 2015 2016E-2020E Avg MMBPD Europe China Middle East Other Net CDU Capacity Additions World Petroleum Demand Growth Source: Consultant and Valero estimates. Net Global Refinery CDU Additions = New Capacity + Restarts – Announced Closures. (Does not include Condensate Splitters) Global Petroleum Demand Growth Expected to Outpace Refinery Capacity Expansion |
 26 0 100 200 300 400 500 600 700 800 900 2005 2006 2007 2008 2009 2010 2011 2012 2013 2014 2015 2016 Other Europe Other Latin America Mexico Canada Latest 4 Wk avg estimate (Finished only) 12 Month Moving Average (MBPD) Gasoline represents all finished gasoline plus all blendstocks (including ethanol, MTBE, and other oxygenates)
Source: DOE Petroleum Supply Monthly data through March 2016. 4 Week Average estimate from Weekly Petroleum Statistics Report and Valero
estimates. U.S. Gasoline Exports |
 27 Source: DOE Petroleum Supply Monthly data through March 2016. 4 Week Average estimate from Weekly Petroleum Statistics Report.
U.S. Diesel Exports 0 200 400 600 800 1000 1200 1400 2005 2006 2007 2008 2009 2010 2011 2012 2013 2014 2015 2016 Other Europe Other Latin America Mexico Canada Latest 4 Wk avg estimate 12 Month Moving Average (MBPD) |
 28 VLP’s Competitive Strengths Strong Sponsor • Strategic relationship with investment grade sponsor VLO Quality Assets • High quality, well maintained assets integrated with VLO’s refineries and located in advantaged regions Stable and Predictable Revenues • Fee-based agreements with no direct exposure to commodity price risks • Contracts with 10 year initial terms and five year renewal terms • About 85% of revenues supported by minimum volume commitments Strong Balance Sheet • Financial flexibility to fund DCF and distribution growth with 2.0x coverage and 2.4x debt/EBITDA (1) • Targeting investment grade credit ratings Long Runway for Growth • Drop downs from sponsor to primarily fuel growth • Opportunities to diversify business and develop third party volumes as VLP matures Top Tier Distribution Growth • 25% annual distribution growth target through 2017 (1) Coverage and debt/EBITDA ratios as of March 31, 2016. Debt/EBITDA calculated in accordance with debt covenants. See page 30 for non-GAAP
disclosures. |
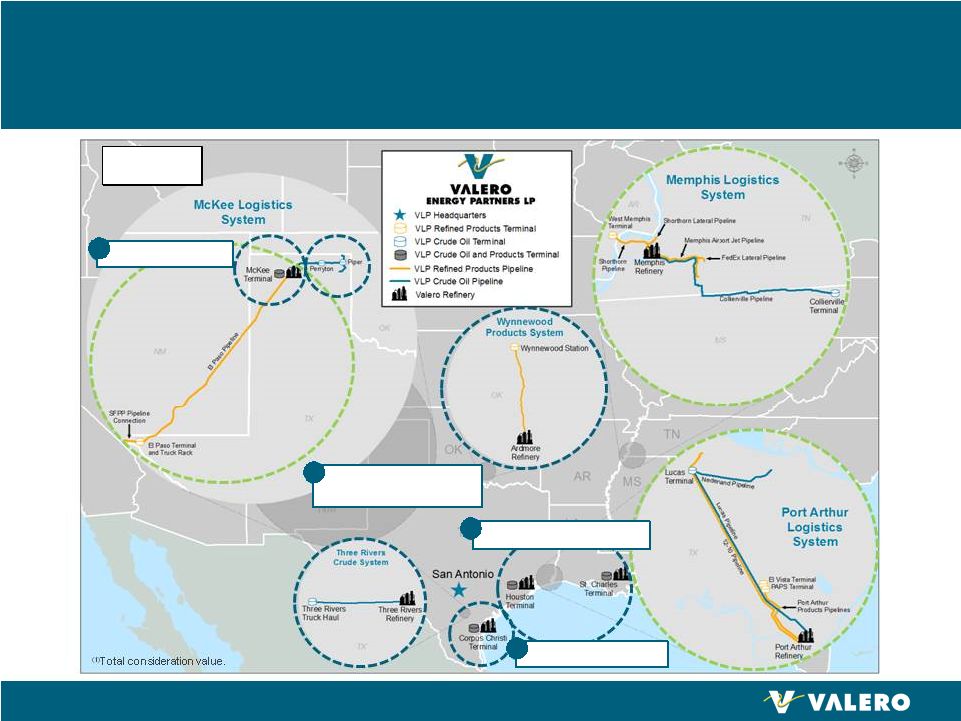 29 Diversified VLP Portfolio Integrated With VLO’s Refining Assets Texas Crude Systems McKee, Three Rivers, Wynnewood July 1, 2014 - $154 mm (1) Houston and St. Charles Terminals March 1, 2015 - $671 mm (1) Corpus Christi Terminal October 1, 2015 - $465 mm (1) McKee Terminal April 1, 2016 - $240 mm (1) 4 1 2 3 IPO assets Drop downs |
 30 Non-GAAP Disclosures We define EBITDA as net income before income tax expense, interest expense, and depreciation expense. We define distributable cash flow as EBITDA less cash payments during the period for interest, income taxes, and maintenance capital expenditures, plus adjustments related to
minimum throughput commitments, capital projects prefunded by Valero, and
certain other items. We define coverage ratio as the ratio of
distributable cash flow to the total distribution declared.
EBITDA, distributable cash flow, and coverage ratio are supplemental financial measures that are not defined under GAAP. They may be used by management and external users of our financial statements, such as industry analysts, investors, lenders, and rating agencies, to:
• describe our expectation of forecasted earnings; • assess our operating performance as compared to other publicly traded limited partnerships in the transportation and logistics industry, without
regard to historical cost basis or, in the case of EBITDA, financing
methods; •
assess the ability of our business to generate sufficient cash to support our decision
to make distributions to our unitholders; •
assess our ability to incur and service debt and fund capital expenditures;
and •
assess the viability of acquisitions and other capital expenditure projects and the
returns on investment of various investment opportunities. We believe that
the presentation of EBITDA provides useful information to investors in assessing our financial condition and results of operations. The GAAP measures most directly comparable to EBITDA are net income and net cash provided by operating activities. EBITDA should not be considered an alternative to net income or net cash provided by operating activities presented in accordance with GAAP. EBITDA has important
limitations
as an analytical tool because it excludes some, but not all, items that affect net income or net cash provided by operating activities. EBITDA should not be considered in isolation or as a substitute for analysis of our results as reported under GAAP. Additionally, because EBITDA
may be defined differently by other companies in our industry, our
definition of EBITDA may not be comparable to similarly titled measures of
other companies, thereby diminishing its utility.
We use distributable cash flow to measure whether we have generated from our
operations, or “earned,” an amount of cash sufficient to support
the payment of the minimum quarterly distributions. Distributable cash flow is not
necessarily indicative of the actual cash we have on hand to distribute
or that we are required to distribute. We use the distribution coverage
ratio to reflect the relationship between our distributable cash flow and the total distribution declared. |
 31 Investor Relations Contacts For more information, please contact: John Locke Vice President, Investor Relations 210.345.3077 john.locke@valero.com Karen Ngo Manager, Investor Relations 210.345.4574 karen.ngo@valero.com |
Serious News for Serious Traders! Try StreetInsider.com Premium Free!
You May Also Be Interested In
- Valero Energy (VLO) PT Raised to $192 at Citi
- Biosenta Announces Private Placement Financing
- Valero Energy (VLO) PT Raised to $187 at Morgan Stanley
Create E-mail Alert Related Categories
SEC FilingsSign up for StreetInsider Free!
Receive full access to all new and archived articles, unlimited portfolio tracking, e-mail alerts, custom newswires and RSS feeds - and more!
