

Form 6-K AGNICO EAGLE MINES LTD For: May 02
 Tweet
Tweet Share
Share
UNITED STATES
SECURITIES AND EXCHANGE COMMISSION
Washington, D.C. 20549
Form 6-K
REPORT OF FOREIGN PRIVATE ISSUER PURSUANT TO RULE 13a-16 OR 15d-16 UNDER THE
SECURITIES EXCHANGE ACT OF 1934
For the month of May, 2016
Commission File Number 001-13422
AGNICO EAGLE MINES LIMITED
(Translation of registrant’s name into English)
145 King Street East, Suite 400, Toronto, Ontario M5C 2Y7
(Address of principal executive office)
Indicate by check mark whether the registrant files or will file annual reports under cover of Form 20-F or Form 40-F.
Form 20-F o Form 40-F x
Indicate by check mark if the registrant is submitting the Form 6-K in paper as permitted by Regulation S-T Rule 101 (b)( 1): o
Note: Regulation S-T Rule 101 (b)( 1) only permits the submission in paper of a Form 6-K if submitted solely to provide an attached annual report to security holders.
Indicate by check mark if the registrant is submitting the Form 6-K in paper as permitted by Regulation S-T Rule 101 (b)(7): o
Note: Regulation S-T Rule 101(b)(7) only permits the submission in paper of a Form 6-K if submitted to furnish a report or other document that the registrant foreign private issuer must furnish and make public under the laws of the jurisdiction in which the registrant is incorporated, domiciled or legally organized (the registrant’s “home country”), or under the rules of the home country exchange on which the registrant’s securities are traded, as long as the report or other document is not a press release, is not required to be and has not been distributed to the registrant’s security holders, and, if discussing a material event, has already been the subject of a Form 6-K submission or other Commission filing on EDGAR.
Indicate by check mark whether the registrant by furnishing the information contained in this Form is also thereby furnishing the information to the Commission pursuant to Rule 12g3-2(b) under the Securities Exchange Act of 1934. Yes o No x
If “Yes” is marked, indicate below the file number assigned to the registrant in connection with Rule 12g3-2(b): 82- .
EXHIBITS
|
Exhibit No. |
|
Exhibit Description |
|
99.1 |
|
Press Release dated April 28, 2016 announcing the Corporation’s First Quarter 2016 Operating and Financial Results |
SIGNATURES
Pursuant to the requirements of the Securities Exchange Act of 1934, the registrant has duly caused this report to be signed on its behalf by the undersigned, thereunto duly authorized.
|
|
AGNICO EAGLE MINES LIMITED | |
|
|
(Registrant) | |
|
|
| |
|
|
| |
|
Date: May 2, 2016 |
By: |
/s/ R. Gregory Laing |
|
|
|
R. Gregory Laing |
|
|
|
General Counsel, Sr. Vice-President, Legal |
|
|
|
and Corporate Secretary |
Exhibit 99.1

|
Stock Symbol: |
AEM (NYSE and TSX) |
|
|
|
|
For further information: |
Investor Relations |
|
|
(416) 947-1212 |
(All amounts expressed in U.S. dollars unless otherwise noted)
AGNICO EAGLE REPORTS FIRST QUARTER 2016 OPERATING AND FINANCIAL RESULTS — CONTINUED STRONG OPERATIONAL PERFORMANCE — AMARUQ, EL BARQUENO AND BARSELE DRILL PROGRAMS YIELD POSITIVE RESULTS
Toronto (April 28, 2016) — Agnico Eagle Mines Limited (NYSE:AEM, TSX: AEM) (“Agnico Eagle” or the “Company”) today reported quarterly net income of $27.8 million, or $0.13 per share, for the first quarter of 2016. This result includes unrealized gains on financial instruments of $9.6 million ($0.04 per share), non-cash foreign currency translation gains on deferred tax liabilities of $8.0 million ($0.04 per share), non-cash foreign currency translation losses of $6.8 million ($0.03 per share), non-cash stock option expense of $5.9 million ($0.03 per share), non-recurring losses of $1.9 million ($0.01 per share) and various mark-to-market and other adjustment losses of $0.9 million (nil per share). Excluding these items would result in adjusted net income of $25.7 million or $0.12 per share for the first quarter of 2016. In the first quarter of 2015, the Company reported net income of $28.7 million or $0.13 per share.
First quarter 2016 cash provided by operating activities was $145.7 million ($167.5 million before changes in non-cash components of working capital). This compares to cash provided by operating activities of $143.5 million in the first quarter of 2015 ($176.8 million before changes in non-cash components of working capital). The decrease in cash provided by operating activities before changes in working capital during the current period was largely due to higher exploration and corporate development expenditures (up 70%, period over period) which were partially offset by higher sales volumes.
“The year is off to a good start with a more constructive gold price environment and continued strong operating performance from all of our mines. As a result of the strong operating results, we now expect to meet the top end of our production guidance for 2016”, said Sean Boyd, Agnico Eagle’s Chief Executive Officer. “At current margins, Agnico Eagle is generating sufficient cash flow to support its expanded exploration and development activities and potentially pay down additional debt”, added Mr. Boyd.
First Quarter 2016 highlights include:
· Quarterly gold production — Payable gold production1 in the first quarter of 2016 was 411,336 ounces of gold at total cash costs2 per ounce on a by-product basis of $573 and all-in sustaining costs per ounce 3 (“AISC”) on a by-product basis of $797
· Strong operational performance at Mexican operations - In the first quarter of 2016, payable gold production was 87,899 ounces at the Company’s Mexican mines. Silver production was a new quarterly record of 752,000 ounces. Total cash costs per ounce of gold on a by-product basis averaged $364
· 2016 production now expected to reach high end of the guidance range — Production for 2016 is now expected to meet the high end of the guidance range of approximately 1.525 to 1.565 million ounces of gold with total cash costs per ounce on a by-product basis of between $590 to $630 and AISC of approximately $850 to $890 per ounce
· Continued strong operating performance enhances financial flexibility — In the first quarter of 2016, $55 million was repaid under the Company’s credit facility
1 Payable production of a mineral means the quantity of mineral produced during a period contained in products that are sold by the Company whether such products are shipped during the period or held as inventory at the end of the period.
2 Total cash costs per ounce is a Non-GAAP measure. For a reconciliation to production costs, see “Reconciliation of Non-GAAP Financial Performance Measures” below. Total cash costs per ounce of gold produced is presented on both a by-product basis (deducting by-product metal revenues from production costs) and co-product basis (before by-product metal revenues). Total cash costs per ounce of gold produced on a by-product basis is calculated by adjusting production costs as recorded in the consolidated statements of income (loss) for by-product revenues, unsold concentrate inventory production costs, smelting, refining and marketing charges and other adjustments, and then dividing by the number of ounces of gold produced. Total cash costs per ounce of gold produced on a co-product basis is calculated in the same manner as total cash costs per ounce of gold produced on a by-product basis except that no adjustment for by-product metal revenues is made. See “Note Regarding Certain Measures of Performance”. For information about the Company’s total cash costs per ounce on a co-product basis please see “Reconciliation of Non-GAAP Performance Measures”.
3 All-in-sustaining costs per ounce is a Non-GAAP measure and is used to show the full cost of gold production from current operations. For a reconciliation to production costs, see “Reconciliation of Non-GAAP Financial Performance Measures below. The Company calculates all-in sustaining costs per ounce of gold produced as the aggregate of total cash costs per ounce on a by-product basis, sustaining capital expenditures (including capitalized exploration), general and administrative expenses (including stock option expense) and reclamation expenses divided by the amount of gold produced. All-in sustaining costs per ounce of gold produced on a co-product basis is calculated in the same manner as all-in sustaining costs per ounce of gold produced on a by-product basis except that no adjustment for by-product metal revenues is made. For information about the Company’s AISC on a co-product basis please see “Reconciliation of Non-GAAP Performance Measures”. The Company’s methodology for calculating all-in sustaining costs per ounce may not be similar to the methodology used by other producers that disclose all-in sustaining costs per ounce. See “Note Regarding Certain Measures of Performance”. The Company may change the methodology it uses to calculate all-in sustaining costs per ounce in the future, including in response to the adoption of formal industry guidance regarding this measure by the World Gold Council.
and net debt was reduced by approximately $89 million to $923 million at March 31, 2016. For the sixth consecutive quarter, the Company has reduced net debt
· Amaruq Project, Nunavut — Further drilling refines the geometry of the Whale Tail Ore Shoot and IVR deposit — Drilling resumed in January and results show that the Whale Tail Ore shoot is larger in the central area than previously interpreted and confirms that the IVR deposit extends to the East and to a depth of 230 metres
· Drilling at Barsele, in Sweden, extends the mineralization at depth and suggests the potential for a Goldex type deposit — Highlights include: 2.01 grams per tonne (“g/t”) gold (capped) over an estimated true width of 84.0 metres at a depth of approximately 310 metres in the Skirasen zone
· A quarterly dividend of $0.08 per share was declared
First Quarter Financial and Production Highlights — Higher Gold Production, Lower Production Costs
In the first quarter of 2016, strong operational performance continued at the Company’s mines, which led to payable gold production of 411,336 ounces compared to 404,210 ounces in the first quarter of 2015. The higher level of production in the 2016 period was primarily due to higher grades and better recoveries at LaRonde, increased throughput at Goldex and Kittila and higher grades at Canadian Malartic. A detailed description of the production and cost performance of each mine is set out below.
Total cash costs per ounce on a by-product basis for the first quarter of 2016 were lower at $573 compared to $588 per ounce for the first quarter 2015. Total cash costs per ounce on a by-product basis in the first quarter of 2016 were positively affected by higher production levels at LaRonde, Goldex, Canadian Malartic and La India compared to the first quarter of 2015, as well as weaker local currencies (the Canadian dollar was 9% lower and the Mexican peso was 17% lower when compared to the first quarter of 2015).
AISC for the first quarter of 2016 were $797 per ounce on a by-product basis compared to $804 in the first quarter of 2015. The lower AISC is primarily due to lower total cash costs per ounce on a by-product basis compared to the first quarter of 2015.
Cash Position Remains Strong and Debt Levels Reduced
Cash and cash equivalents and short term investments increased to $168.0 million at March 31, 2016 from the December 31, 2015 balance of $131.6 million. The outstanding balance on the Company’s $1.2 billion credit facility was reduced from $265 million at December 31, 2015 to $210 million at March 31, 2016, resulting in current availability under the Company’s credit lines of approximately $990 million, not including the $300 million accordion facility.
Total capital expenditures (including sustaining) made by the Company in the first quarter of 2016 were $100.7 million, including $16.0 million at Pinos Altos, $15.2 million at Goldex, $15.1 million at Meliadine, $14.3 million at LaRonde, $14.1 million at Kittila, $11.5 million at Meadowbank, $10.5 million at Canadian Malartic, $1.7 million at La India and $1.3 million at Creston Mascota.
Sustaining capital expenditures made by the Company in the first quarter of 2016 were $66.3 million, including $14.3 million at LaRonde, $11.7 million at Kittila, $11.5 million at Meadowbank, $10.8 million at Pinos Altos, $10.0 million at Canadian Malartic, $5.0 million at Goldex, $1.7 million at La India and $1.3 million at Creston Mascota.
Dividend Record and Payment Dates for the Second Quarter of 2016
Agnico Eagle’s Board of Directors has declared a quarterly cash dividend of $0.08 per common share, payable on June 15, 2016 to shareholders of record as of June 1, 2016. Agnico Eagle has declared a cash dividend every year since 1983.
Other Expected Dividend and Record Dates for 2016
|
Record Date |
|
Payment Date |
|
September 1 |
|
September 15 |
|
December 1 |
|
December 15 |
Dividend Reinvestment Plan
Please see the following link for information on the Company’s dividend reinvestment plan: Dividend Reinvestment Plan
First Quarter 2016 Results Conference Call and Webcast Tomorrow
Agnico Eagle’s senior management will host a conference call on Friday, April 29, 2016 at 8:30 AM (E.D.T.) to discuss the Company’s financial and operating results.
Via Webcast:
A live audio webcast of the conference call will be available on the Company’s website at www.agnicoeagle.com.
Via Telephone:
For those preferring to listen by telephone, please dial 416-260-0113 or toll-free 1-800-524-8950. To ensure your participation, please call approximately five minutes prior to the scheduled start of the call.
Replay archive:
Please dial 1-647-436-0148 or toll-free 1-888-203-1112, access code 531498.
The conference call replay will expire on May 30, 2016. The webcast, along with presentation slides, will be archived for 180 days on the Company’s website.
Annual and Special Meeting
The Company will host its Annual and Special Meeting (“AGM”) on Friday, April 29, 2016 at 11:00 am (E.D.T). The AGM will be held at the Sheraton Centre Toronto Hotel (Dominion Ballroom) - 123 Queen Street West, Toronto, ON.
During the AGM, management will provide an overview of the Company’s activities. For those unable to attend in person, the alternatives to participate are listed below.
Via Webcast:
A live audio webcast of the AGM will be available on the Company’s website at www.agnicoeagle.com.
Via Telephone:
For those preferring to listen by telephone, please dial 1-416-260-0113 or toll-free 1-800-524-8950. To ensure your participation, please call approximately five minutes prior to the scheduled start of the AGM.
Replay archive:
Please dial 1-647-436-0148 or toll-free 1-888-203-1112, access code 5039640.
The conference call replay will expire on May 30, 2016. The webcast, along with presentation slides, will be archived for 180 days on the Company’s website.
NORTHERN BUSINESS OPERATING REVIEW
ABITIBI REGION, QUEBEC
Agnico Eagle is currently Quebec’s largest gold producer with a 100% interest in three mines (LaRonde, Goldex and Lapa) and a 50% interest in the Canadian Malartic mine. These mines are located within 50 kilometres of each other, which provides operating synergies and allows for the sharing of technical expertise.
LaRonde Mine — Strong Operational Performance Driven by Increased Tonnage from the High-grade Mining Area (293 Pyramid)
The 100% owned LaRonde mine in northwestern Quebec achieved commercial production in 1988.
The LaRonde mill processed an average of 6,348 tonnes per day (“tpd”) in the first quarter of 2016, compared with an average of 6,203 tpd in the corresponding period of 2015. Minesite costs per tonne4 were approximately C$103 in the first quarter of 2016, lower than the C$104 per tonne experienced in the first quarter of 2015. The decreased costs in the 2016 period were primarily due to strong performance from the underground mine resulting in higher throughput levels in the processing facility.
LaRonde’s total cash costs per ounce on a by-product basis were $529 in the first quarter of 2016 on payable production of 75,337 ounces of gold. This compares with the first quarter of 2015 when total cash costs per ounce on a by-product basis were $703 on production of 58,893 ounces of gold. The decrease in total cash costs per ounce in the 2016 period was largely due to higher production (due to higher throughput levels, higher gold grades from the lower mine area and improved recoveries from the CIP circuit).
During the first quarter of 2016, ramp development reached a depth of three kilometres which will allow access to the higher grade ore as mining continues into the deeper portions of the mine.
Studies are progressing to assess the potential to extend the mineral reserve base and carry out mining activities between the 311 and 371 levels at LaRonde. At present, the mineral reserve base extends to the 311 level, which is 3.1 kilometres below the surface. An infill drill program is continuing from the 311 to the 371 levels with a focus on the western portion of the deposit. Infill drilling will also be carried out on the eastern portion of the deposit as underground development extends into that area.
During the quarter, the Company continued with an internal scoping study to evaluate the potential to develop and mine Bousquet Zone 5 on the adjoining Bousquet property.
4 Minesite costs per tonne is a non-GAAP measure. For a reconciliation of this measure to production costs as reported in the financial statements, see “Reconciliation of Non-GAAP Financial Performance Measures — Reconciliation of Production Costs to Minesite Costs per Tonne by Mine” below. See also “Note Regarding Certain Measures of Performance”.
Previous property owners had partly exploited Bousquet Zone 5 by open pit and underground. The Company is evaluating the potential to initially mine Bousquet Zone 5 from a depth of 90 to 330 metres below surface using underground ramp access. The mining method is likely to be similar to that employed at Goldex and processing could utilize excess capacity from the Lapa circuit at LaRonde.
Dewatering of the old pit is underway and a certificate of authorization from the Quebec government to permit collection of a bulk sample is expected to be issued before the end of the second quarter of 2016. An internal technical study is expected to be completed by the end of 2016.
Canadian Malartic Mine — Record Quarterly Mill Performance During the Winter Season
In June 2014, Agnico Eagle and Yamana Gold Inc. (“Yamana”) acquired all of the issued and outstanding common shares of Osisko Mining Corporation (“Osisko”) and created the Canadian Malartic General Partnership (the “Partnership”) that now owns and operates the Canadian Malartic mine in northwestern Quebec through a joint management committee. Each of Agnico Eagle and Yamana has an indirect 50% ownership interest in the Partnership.
During the first quarter of 2016, the Canadian Malartic mill (on a 100% basis) processed an average of 52,314 tpd, compared with an average of 51,988 tpd in the corresponding period of 2015. This represents a record quarter during the winter season.
Minesite costs per tonne were approximately C$24 (C$21.26 excluding royalties) compared to the C$23 (C$20.16 excluding royalties) per tonne experienced in the first quarter of 2015. In the 2016 period costs were higher primarily due to lower capitalized stripping. The average stripping ratio in the first quarter of 2016 was 2.01 to 1.0.
For the first quarter of 2016, Agnico Eagle’s 50% share of production at the Canadian Malartic mine was 73,613 ounces of gold at total cash costs per ounce on a by-product basis of $557. This compares with the first quarter of 2015 when total cash costs per ounce on a by-product basis were $632 on production of 67,893 ounces of gold. Production was higher in the 2016 period primarily due to higher throughput levels and higher gold grades. Costs in the 2016 period were lower due to lower costs for fuel and explosives and favourable foreign exchange rates.
In February 2016, the Partnership announced that throughput levels for 2016 were forecast to be 53,000 tpd. Any increase in throughput above this 53,000 tpd level remains contingent upon updating the existing operating permits.
Permitting activities for the Barnat Extension and deviation of Highway 117 are continuing. Having received answers to two series of questions, in April 2016, the Ministry of Sustainable Development, Environment and the Fight Against Climate Change (Quebec) accepted the Environmental Impact Assessment (“EIA”) for the Barnat Extension as admissible. This was the trigger for the public hearings process to start and
the first step was the release of the EIA to the public. This will be followed with a public presentation of the project in May and subsequent public hearings in June.
During the quarter, drilling continued on the Odyssey North and South Zones and to date, 18 holes totaling 18,581 metres have been completed. Data from these holes are currently being compiled and integrated into the existing database. In 2016, approximately 60,000 metres of drilling has been proposed to infill and expand the known mineralized zones on the Odyssey property. The 2016 budget is C$8.0 million (on a 100% basis).
Update of Activities on the Canadian Malartic Corporation Exploration Projects
Canadian Malartic Corporation (“CMC”), a company in which each of Agnico Eagle and Yamana hold an indirect 50% interest, is exploring, among other things, a portfolio of properties in the Kirkland Lake area of Ontario and the Pandora property in the Abitibi region of Quebec.
In the Kirkland Lake area, target generation studies are ongoing on the Upper Canada, Upper Beaver and Amalgamated Kirkland properties. Additional exploration work may be carried out after the data review is completed.
Lapa — Optimization of Historical Mining Areas Leads to Increased Underground Tonnage
The 100% owned Lapa mine in northwestern Quebec achieved commercial production in May 2009.
The Lapa circuit, located at the LaRonde mill, processed an average of 1,763 tpd in the first quarter of 2016. This compares with an average of 1,690 tpd in the first quarter of 2015. The higher throughput in the 2016 period was due to the recovery of residual ore from old production areas in the mine and additional feed from stockpiles.
Minesite costs per tonne were C$121 in the first quarter of 2016, compared to the C$119 realized in the first quarter of 2015. Costs in the 2016 period were higher due to the processing of stockpiled ore compared to the same period in 2015.
Payable production in the first quarter of 2015 was 21,709 ounces of gold at total cash costs per ounce on a by-product basis of $668. This compares with the first quarter of 2015, when production was 25,920 ounces of gold at total cash costs per ounce on a by-product basis of $568. In the 2016 period, production was lower and costs were higher due to lower gold grades and recoveries, partially offset by favourable foreign exchange rates.
At Lapa, 2016 is the last full year of production based on the current life of mine plan. In the remainder of 2016, production is expected to exhibit a decline with the full year expected to total 60,000 ounces of gold, as per February 2016 guidance. Additional
exploration drilling in the Zulapa 7 Up and 7 East Zones is underway which, if successful, could potentially extend the mine life.
Goldex — Continued Strong Underground Performance Leads to Increased Mill Throughput in the First Quarter of 2016
The 100% owned Goldex mine in northwestern Quebec began operation in 2008 but mining operations in the original Goldex Extension Zone (“GEZ”) orebody were suspended in October 2011. In July 2012, the M and E satellite zones were approved for development. Mining operations at GEZ remain suspended. Mining operations on the M and E satellite zones commenced in September 2013.
The Goldex mill processed an average of 6,991 tpd in the first quarter of 2016. This compares with an average of 6,294 tpd in the first quarter of 2015. The higher throughput in the 2016 period was due to continued strong underground performance (mining and ore hoisting) compared to the 2015 period.
Minesite costs per tonne were approximately C$34 in the first quarter of 2016, the same as the C$34 per tonne experienced in the first quarter of 2015.
Payable gold production in the first quarter of 2016 was 32,340 ounces of gold at total cash costs per ounce on a by-product basis of $506. This compares with the first quarter of 2015, when production was 29,250 ounces of gold at total cash costs per ounce on a by-product basis of $541. The decrease in total cash costs in the 2016 period was largely a result of increased production (due to higher throughput levels and higher grades from the M zone) and favourable foreign exchange rates.
Development of the Deep 1 Zone remains on time and on budget. Work on the electrical substations commenced in March 2016 and the installation of the initial components of the underground conveyor system are underway.
In January 2014, Agnico Eagle acquired the Akasaba West gold-copper deposit from Alexandria Minerals Corporation. Located less than 30 kilometres from Goldex, the Akasaba West deposit could potentially create flexibility and synergies for the Company’s operations in the Abitibi region by using extra milling capacity at both Goldex and LaRonde, while reducing overall costs. The Akasaba West deposit currently hosts a mineral reserve of approximately 141,000 ounces of gold (4.8 million tonnes of ore grading 0.92 g/t gold and 0.52% copper).
Following the submission of the environmental assessment for the Akasaba West deposit to the provincial government in August and to the federal government in September 2015, questions were received from both sets of regulators. Responses to provincial government questions were submitted in February and responses to the Canadian Environmental Assessment Agency were submitted in March 2016. Supplementary questions are expected from both levels of government in the second quarter of 2016. If public hearings are required they would likely take place in the first quarter of 2017.
FINLAND AND SWEDEN
Agnico Eagle’s Kittila mine in Finland is the largest primary gold producer in Europe and hosts the Company’s largest mineral reserves. Exploration activities continue to expand the mineral resources and studies are underway to evaluate the potential to cost-effectively increase production.
Kittila — Underground Access Ramp to the Sisar Zone Now Underway
The 100% owned Kittila mine in northern Finland achieved commercial production in 2009.
The Kittila mill processed an average of 4,749 tpd in the first quarter of 2016, compared to 3,836 tpd in the first quarter of 2015. The higher throughput in the 2016 period is a reflection of the ongoing optimization of the overall mill capacity.
Minesite costs per tonne at Kittila were approximately €72 in the first quarter of 2016, compared to €77 in the first quarter of 2015. Minesite costs per tonne decreased in the first quarter of 2016 due to the increased throughput when compared with the 2015 period.
First quarter 2016 payable gold production at Kittila was 48,127 ounces at total cash costs per ounce on a by-product basis of $726. In the first quarter of 2015, the mine produced 44,654 ounces of gold at total cash costs per ounce on a by-product basis of $681. The higher production in the 2016 period is related to the increased mill capacity partially offset by lower than expected grades compared to the 2015 period. Total cash costs per ounce increased in the first quarter of 2016 primarily due to higher contractor costs which were partially offset by lower energy costs.
The Kittila mine and mill has shown potential to operate in excess of 4,000 tpd and efforts are ongoing to assess the optimal throughput rate. Studies are also underway to optimize underground mining rates and fully integrate the upper and lower Rimpi zones and the newly discovered Sisar Zone in a new Kittila mine plan. Unit costs are expected to improve once steady state operations are achieved.
Drilling is ongoing to infill and extend the mineralization in the Sisar Zone. Numerous holes have been completed and assay results are pending. In addition, underground ramp construction began in March to access the upper portion of the Sisar Zone, which is located approximately 200 metres from existing underground infrastructure.
Barsele Project — Drilling Extends the Central and Skirasen Zones and Suggests the Potential for a Goldex Type Deposit
In June 2015, Agnico Eagle acquired a 55% interest in the Barsele project in Vasterbotten County, northern Sweden from Orex Minerals (Orex Minerals subsequently transferred its interest in the project to Barsele Minerals Corp.). The Company can earn an additional 15% interest in the project through the completion of a pre-feasibility study.
The exploration program is being operated by Agnico Eagle. This is the first release of drill results on the property by Agnico Eagle since the acquisition of its interest in the 28,600-hectare property.
The Barsele project is located at the intersection of the western end of the Proterozoic “Skellefte Trend,” a prolific volcanogenic massive sulphide deposit belt with the “Gold Line” in northern Sweden. The Barsele property is known to contain intrusive-hosted gold mineralization (the Central, Avan and Skirasen zones) which appears to be similar to the Goldex deposit and gold-rich volcanogenic massive sulphide mineralization (the Norra Zone) which appears to be similar to the LaRonde deposit.
The Avan, Central and Skirasen zones extend over a strike length of 2.6 kilometres within a highly fractured granodiorite that ranges in width from 200 to 500 metres over a strike length of more than eight kilometres. Gold occurs as native metal and is generally associated with arsenopyrite, with low base metal content.
Drilling from October 2015 to early March 2016 (23 holes totalling 13,300 metres) focused on the Skirasen and Central zones.
Recent intercepts and drill hole coordinates from this program are set out below and the drill hole pierce points are also shown on the Barsele composite longitudinal section. All intercepts reported for the Barsele project show capped grades over estimated true widths, based on a preliminary geological interpretation that is being updated as new information becomes available with further drilling.
Recent exploration drill results from the Barsele project
|
Drill hole |
|
Location |
|
From |
|
To |
|
Depth of |
|
Estimated |
|
Gold grade |
|
Gold |
|
|
CNT15-007 |
|
Central Zone |
|
437.0 |
|
449.0 |
|
310 |
|
9.0 |
|
12.37 |
|
3.28 |
|
|
CNT15-009 |
|
Central Zone |
|
106.0 |
|
168.0 |
|
90 |
|
46.5 |
|
1.12 |
|
1.12 |
|
|
and |
|
|
|
383.0 |
|
432.0 |
|
300 |
|
36.8 |
|
1.15 |
|
1.15 |
|
|
CNT15-010 |
|
Central Zone |
|
223.0 |
|
252.0 |
|
230 |
|
21.8 |
|
1.59 |
|
1.59 |
|
|
and |
|
|
|
494.0 |
|
589.0 |
|
515 |
|
71.2 |
|
0.88 |
|
0.88 |
|
|
CNT15-013 |
|
Central Zone |
|
473.5 |
|
492.0 |
|
370 |
|
13.9 |
|
3.00 |
|
3.00 |
|
|
and |
|
|
|
519.2 |
|
526.0 |
|
400 |
|
5.1 |
|
5.02 |
|
5.02 |
|
|
CNT15-015 |
|
Central Zone |
|
23.0 |
|
34.0 |
|
20 |
|
8.2 |
|
8.06 |
|
6.74 |
|
|
CNT15-016 |
|
Skirasen Zone |
|
270.0 |
|
277.0 |
|
215 |
|
5.2 |
|
5.06 |
|
5.06 |
|
|
and |
|
|
|
339.0 |
|
451.0 |
|
310 |
|
84.0 |
|
2.07 |
|
2.01 |
|
|
CNT15-017 |
|
Central Zone |
|
623.0 |
|
632.0 |
|
540 |
|
6.8 |
|
1.72 |
|
1.72 |
|
|
SKI15-001 |
|
Skirasen Zone |
|
323.0 |
|
384.0 |
|
260 |
|
45.8 |
|
1.94 |
|
1.61 |
|
|
and |
|
|
|
405.0 |
|
434.0 |
|
310 |
|
21.8 |
|
1.42 |
|
1.42 |
|
|
SKI16-001 |
|
Skirasen Zone |
|
101.0 |
|
108.0 |
|
75 |
|
5.2 |
|
4.85 |
|
4.85 |
|
|
and |
|
|
|
120.0 |
|
140.0 |
|
95 |
|
15.0 |
|
3.92 |
|
3.23 |
|
|
and |
|
|
|
276.0 |
|
312.1 |
|
210 |
|
27.1 |
|
3.06 |
|
2.40 |
|
|
SKI16-005 |
|
Skirasen Zone |
|
193.0 |
|
213.0 |
|
170 |
|
15.0 |
|
1.19 |
|
1.19 |
|
|
and |
|
|
|
399.0 |
|
504.0 |
|
370 |
|
78.8 |
|
1.25 |
|
1.25 |
|
|
and |
|
|
|
593.0 |
|
609.0 |
|
485 |
|
12.0 |
|
1.86 |
|
1.86 |
|
*Holes at Barsele use a capping factor of 20 g/t gold.
Barsele project exploration drill collar coordinates of selected holes
|
|
|
Drill collar coordinates* |
| ||||||||||
|
Drill hole ID |
|
UTM North |
|
UTM East |
|
Elevation |
|
Azimuth |
|
Dip |
|
Length |
|
|
CNT15-007 |
|
7214686 |
|
618733 |
|
321 |
|
360 |
|
-53 |
|
725 |
|
|
CNT15-009 |
|
7214671 |
|
618829 |
|
317 |
|
360 |
|
-57 |
|
701 |
|
|
CNT15-010 |
|
7215040 |
|
618808 |
|
291 |
|
180 |
|
-70 |
|
655 |
|
|
CNT15-013 |
|
7214613 |
|
619033 |
|
306 |
|
333 |
|
-55 |
|
597 |
|
|
CNT15-015 |
|
7214601 |
|
619133 |
|
296 |
|
360 |
|
-52 |
|
523 |
|
|
CNT15-016 |
|
7214525 |
|
619127 |
|
302 |
|
360 |
|
-55 |
|
664 |
|
|
CNT15-017 |
|
7214895 |
|
618859 |
|
293 |
|
290 |
|
-60 |
|
902 |
|
|
SKI15-001 |
|
7214598 |
|
619125 |
|
296 |
|
040 |
|
-48 |
|
580 |
|
|
SKI16-001 |
|
7214515 |
|
619222 |
|
300 |
|
040 |
|
-50 |
|
557 |
|
|
SKI16-005 |
|
7214516 |
|
619221 |
|
300 |
|
360 |
|
-57 |
|
645 |
|
* Coordinate System Sweref 99
[Barsele Project - Composite Longitudinal Section]

Recent drilling has connected the Central Zone with the Skirasen Zone. The combined Central-Skirasen Zone has a strike length of approximately 1,400 metres, extends from surface to a depth of at least 540 metres and ranges in width from ten to 150 metres. Mineralization remains open at depth and along strike.
Results include hole CNT15-016 that intersected the Skirasen Zone with two intercepts: 5.06 g/t gold over 5.2 metres at 215 metres depth, and 2.01 g/t gold over 84.0 metres at
310 metres depth. Almost 300 metres away at the southeast extent of the zone, hole SKI16-001 intersected the zone with three intercepts: 4.85 g/t gold over 5.2 metres at 75 metres depth, 3.23 g/t gold over 15.0 metres at 95 metres depth and 2.40 g/t gold over 27.1 metres at 210 metres depth. The deepest intercept to date in the Skirasen Zone is hole SKI16-005 that intersected 1.86 g/t gold over 12.0 metres at 485 metres depth, as well as two shallower intercepts.
Recent drilling has extended the depth of the Central Zone to 540 metres. Highlights include hole CNT15-015 that intersected 6.74 g/t gold over 8.2 metres at 20 metres depth. Hole CNT15-013 intersected 3.00 g/t gold over 13.9 metres at 370 metres depth and 5.02 g/t gold over 5.1 metres at 400 metres depth. Hole CNT15-007 intersected 3.28 g/t gold over 9.0 metres at 310 metres depth.
In 2016, the Company plans to spend approximately $4.9 million on exploration to further evaluate the mineral potential of the property. This planned expenditure includes 19,000 metres of diamond drilling, a Titan-24 induced polarization geophysical survey, till sampling and hyperspectral core scanning. A basic environmental assessment will be done, as well as ongoing community relations programs to engage the various stakeholders in the region. Drilling is expected to resume in late April after spring breakup.
NUNAVUT REGION
Agnico Eagle has identified Nunavut as a politically attractive and stable jurisdiction with enormous geological potential. With the Company’s largest producing mine (Meadowbank), two significant development assets (Meliadine and Amaruq) and other exploration projects, Nunavut has the potential to be a strategic operating platform with the ability to generate strong production and cash flows over several decades.
Meadowbank — Reviewing Further Opportunities to Potentially Extend the Minelife Through Year-End 2018
The 100% owned Meadowbank mine in Nunavut, northern Canada, achieved commercial production in March 2010.
The Meadowbank mill processed an average of 10,390 tpd in the first quarter of 2016, compared to 11,006 tpd in the first quarter of 2015. Period-over-period mill throughput was lower due to replacement of belts on the conveyor system feeding the SAG mill, an unscheduled shutdown of the secondary crushing circuit for maintenance in February and larger portion of ore from the Vault pit which has a higher hardness factor.
Minesite costs per tonne were C$77 in the first quarter of 2016 compared to C$71 per tonne in the first quarter of 2015. The increase in costs per tonne was primarily due to lower throughput that resulted from the unscheduled shutdown.
Payable production in the first quarter of 2016 was 72,311 ounces of gold at total cash costs per ounce on a by-product basis of $788. This compares with the first quarter of 2015 when 88,523 ounces of gold were produced at total cash costs per ounce on a by-product basis of $655. The lower production and higher costs in the 2016 period compared to the 2015 period are primarily due to lower throughput levels and the processing of lower grade ore (down 14% period-over-period).
Studies are currently underway to investigate additional opportunities to extend production at Meadowbank through year-end 2018. Potential opportunities include the development of the Phaser pit, which is located to the southwest of the Vault pit, and an additional pushback to access additional ore in the E3 pit at the Portage deposit.
Amaruq Project — Exploration Access Road Construction and Permitting
The Company is actively exploring the Amaruq deposit (see below) with the goal of potentially developing the deposit as a satellite operation to Meadowbank.
On March 14, 2016, the Company received confirmation from the Department of Fisheries and Oceans that it was fully permitted to complete the construction of bridges, bridge abutments, embedded culverts and drainage culverts along the Amaruq Exploration Access Road. This concluded the permitting of the Amaruq Exploration Access Road and the Company now has all of the required permits, leases and authorizations to complete both the winter and summer construction of the road.
Construction of the Amaruq Exploration Access Road commenced in the first quarter of 2016. Road construction is ongoing with nine kilometres completed to date of the expected total length of 62 kilometres.
An application for an amendment to the Amaruq Exploration Type B Water License was submitted on March 31, 2016 to allow for the development of an exploration ramp and portal and the mining of a bulk sample. The permit approval process for the exploration ramp is expected to take approximately nine months.
In order to mine the Whale Tail deposit, amendments are needed to the Meadowbank Project Certificate and Type A water license. The amendments are expected to be submitted by the end of June 2016.
Amaruq Project — Improved Understanding of Whale Tail Ore Shoot and IVR Deposit
Agnico Eagle has a 100% interest in the Amaruq project. The large property consists of 116,717 hectares, located approximately 50 kilometres northwest of the Meadowbank mine. The most recent drill results from the Amaruq project were reported in the Company news release dated October 28, 2015. The inferred mineral resource estimate
as of December 31, 2015 is 3.3 million ounces gold (16.9 million tonnes grading 6.05 g/t gold).
The 2016 drill program began at the end of January. Drilling to the end of March has totalled 18,836 metres (84 holes) using up to eight rigs, part of an initial 75,000-metre drill program. The goals of the 2016 exploration program are to infill and expand the known mineral resource areas and to test other favourable targets with a focus on delineating a second source of open pit ore.
Selected drill results and hole coordinates are set out in the tables below. Drill hole collars are also shown on the Amaruq Project Local Geology Map. All intercepts reported for the Amaruq project show capped grades over estimated true widths, based on a preliminary geological interpretation that is being updated as new information becomes available with further drilling.
Recent exploration drill results from the Whale Tail (WT) deposit and the V Zone, Amaruq project
|
Drill hole |
|
Location |
|
From |
|
To |
|
Depth of |
|
Estimated |
|
Gold grade |
|
Gold |
|
|
AMQ16-560 |
|
IVR Zone |
|
276.7 |
|
283.5 |
|
230 |
|
6.3 |
|
38.3 |
|
6.2 |
|
|
including |
|
|
|
276.7 |
|
280.5 |
|
230 |
|
3.5 |
|
66.1 |
|
8.7 |
|
|
AMQ16-570 |
|
WT Shoot |
|
327.0 |
|
382.0 |
|
288 |
|
47.6 |
|
5.9 |
|
5.9 |
|
|
including |
|
|
|
327.0 |
|
333.1 |
|
267 |
|
4.3 |
|
8.1 |
|
8.1 |
|
|
and including |
|
|
|
354.0 |
|
378.0 |
|
297 |
|
20.8 |
|
9.3 |
|
9.3 |
|
|
AMQ16-601 |
|
WT Shoot |
|
289.0 |
|
326.1 |
|
252 |
|
32.0 |
|
8.8 |
|
8.8 |
|
|
including |
|
|
|
289.0 |
|
293.3 |
|
238 |
|
3.7 |
|
17.1 |
|
17.1 |
|
|
and including |
|
|
|
303.0 |
|
326.1 |
|
258 |
|
20.0 |
|
10.8 |
|
10.8 |
|
|
AMQ16-605 |
|
IVR Zone |
|
35.0 |
|
45.3 |
|
35 |
|
9.7 |
|
7.2 |
|
5.9 |
|
|
AMQ16-643 |
|
IVR Zone |
|
91.3 |
|
108.4 |
|
98 |
|
16.1 |
|
42.9 |
|
11.0 |
|
|
including |
|
|
|
92.0 |
|
97.5 |
|
94 |
|
5.2 |
|
36.4 |
|
21.6 |
|
|
AMQ16-654 |
|
IVR Zone |
|
65.5 |
|
78.0 |
|
69 |
|
12.1 |
|
22.7 |
|
4.1 |
|
|
including |
|
|
|
74.3 |
|
78.0 |
|
73 |
|
3.6 |
|
72.2 |
|
9.4 |
|
*Holes at Whale Tail deposit use a capping factor of 40 to 80 g/t gold. Holes at IVR Zone use a capping factor of 40 g/t gold.
Amaruq project exploration drill collar coordinates of selected holes
|
|
|
Drill collar coordinates* |
| ||||||||||
|
Drill hole ID |
|
UTM North |
|
UTM East |
|
Elevation |
|
Azimuth |
|
Dip |
|
Length |
|
|
AMQ16-560 |
|
7256055 |
|
607123 |
|
153 |
|
323 |
|
-55 |
|
318 |
|
|
AMQ16-570 |
|
7255683 |
|
606741 |
|
153 |
|
144 |
|
-56 |
|
410 |
|
|
AMQ16-601 |
|
7255544 |
|
606559 |
|
153 |
|
144 |
|
-55 |
|
360 |
|
|
AMQ16-605 |
|
7256151 |
|
606616 |
|
164 |
|
322 |
|
-60 |
|
246 |
|
|
AMQ16-643 |
|
7256320 |
|
606986 |
|
157 |
|
323 |
|
-80 |
|
249 |
|
|
AMQ16-654 |
|
7256320 |
|
606909 |
|
156 |
|
315 |
|
-75 |
|
144 |
|
* Coordinate System UTM Nad 83 zone 14
[Amaruq Project - Local Geology Map]
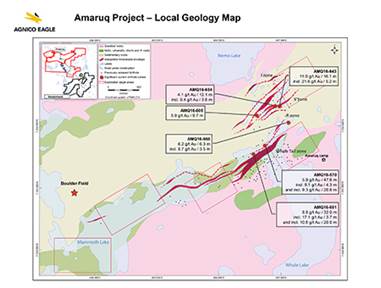
Two of the reported holes were drilled toward the southeast to increase the confidence in the true thickness and configuration of the Whale Tail ore shoot, which plunges about 30 degrees to the east from surface to at least 430 metres depth. The shoot appears to be thicker than previously interpreted in the Central area. Hole AMQ16-601 intersected 8.8 g/t gold over 32.0 metres, including 17.1 g/t gold over 3.7 metres at 238 metres depth and 10.8 g/t gold over 20.0 metres at 258 metres depth. Approximately 230 metres to the northeast, hole AMQ16-570 intersected 5.9 g/t gold over 47.6 metres, including 8.1 g/t gold over 4.3 metres at 267 metres depth and 9.3 g/t gold over 20.8 metres at 297 metres depth.
A grouping of three drill holes investigated the widest horizon in the IVR Zone, which continues to yield high grades. Hole AMQ16-643 intersected 11.0 g/t gold over 16.1 metres at 98 metres depth, including 21.6 g/t gold over 5.2 metres. Approximately 80 metres to the west, hole AMQ16-654 intersected 4.1 g/t gold over 12.1 metres at 69 metres depth, including 9.4 g/t gold over 3.6 metres. Approximately 340 metres farther to the southwest, hole AMQ16-605 intersected 5.9 g/t gold over 9.7 metres at 35 metres depth.
Hole AMQ16-560 was drilled in the area between the east end of Whale Tail and the southern part of IVR. The hole intersected what is believed to be the southernmost IVR Zone, and returned 6.2 g/t gold over 6.3 metres at 230 metres depth, including 8.7 g/t gold over 3.5 metres. This intersection has extended the depth of the IVR Zone by almost 100 metres, to 230 metres. Additional drilling is planned to further investigate the potential intersection of the IVR Zone and the Whale Tail deposit.
Drilling is ongoing with nine rigs on the property. An updated Amaruq mineral resource is expected in the second half of 2016.
Meliadine — Type A Water License Permit Expected by the End of the Second Quarter of 2016
The Meliadine project was acquired in July 2010 and is the Company’s largest advanced exploration/development project based on mineral reserves and mineral resources. The Company has a 100% interest in the 111,757 hectare property, which is linked to the town of Rankin Inlet in Nunavut by a 25 kilometre all-weather access road.
The capital budget for 2016 is $96 million, with activities focused on further underground development (approximately 3,700 metres), detailed engineering and procurement, construction of essential surface infrastructure and the acquisition of a used camp facility. The goal of the 2016 capital program is to ensure that the project remains on track for a potential 2020 production start-up, which is approximately a one year delay from previous expectations.
In the first quarter of 2016, approximately 1,103 metres of underground development was completed. Of this total, 442 metres of development were completed in March, making it the best month since the beginning of the project.
On April 15, 2016, the Nunavut Water Board issued the Meliadine Project Type A Water Licence to the Federal Minister of Indigenous and Northern Affairs Canada for approval. The standard approval timeframe for the minister is 45 days. Approval of the licence is therefore expected by the end of May 2016. The Type A Water Licence would allow for the construction and operation of the Meliadine project.
Internal studies are continuing to evaluate the potential to extract additional gold from the Tiriganiaq and Wesmeg/Normeg deposits, which could potentially extend the mine life, increase annual production and improve project economics and the after-tax internal rate of return. These studies are expected to be completed by the end of 2016.
The timing of future capital expenditures at the Meliadine project beyond 2016 and the determination of whether to build a mine at Meliadine are subject to approval by Agnico Eagle’s Board of Directors, which will be based on, among other things, prevailing market conditions and outcomes of the various plans being evaluated.
SOUTHERN BUSINESS OPERATING REVIEW
Agnico Eagle’s Southern Business operations are focused in Mexico. These operations have been the source of growing precious metals production (gold and silver), stable operating costs and strong free cash flow since 2009. In the first quarter of 2016, the Mexican operations had record quarterly silver production of approximately 752,000 ounces.
Pinos Altos — Shaft on Schedule for full Commissioning in the second quarter of 2016
The 100% owned Pinos Altos mine in northern Mexico achieved commercial production in November 2009.
The Pinos Altos mill processed 4,932 tpd in the first quarter of 2016 compared to 5,661 tpd processed in the first quarter of 2015. Mill throughput in the 2016 period was negatively affected by clay encountered in the Cerro Colorado underground ore and freezing weather conditions. During the first quarter of 2016, approximately 53,200 tonnes of ore were stacked on the leach pad at Pinos Altos, compared to 74,300 tonnes in the comparable 2015 period.
Minesite costs per tonne at Pinos Altos were $50 in the first quarter of 2016, higher than the $46 in the first quarter of 2015. The difference in minesite costs per tonne was largely attributable to lower thoughput levels and variations in the proportion of heap leach ore to milled ore and open pit ore to underground ore, currency variations and routine fluctuations in the waste to ore stripping ratio in the open pits.
Payable production in the first quarter of 2016 was 48,117 ounces of gold at total cash costs per ounce on a by-product basis of $343. This compares with production of 50,106 ounces of gold at total cash costs per ounce on a by-product basis of $357 in the first quarter of 2015. Lower production in 2016 is largely due to lower tonnage processed over the comparable period in 2015. The decrease in the year over year total cash costs per ounce is largely due to favourable foreign exchange rates compared to the prior year period.
The Pinos Altos shaft was commissioned for moving mine personnel and materials in the first quarter of 2016. The ore handling system is on schedule to be commissioned in the second quarter of 2016. When the shaft is fully commissioned, it will allow better matching of the mill capacity with the future mining capacity at Pinos Altos once the open pit mining operation begins to wind down as planned.
Creston Mascota Deposit at Pinos Altos — Exploration Commences on the Madrono Property Which Hosts Historical Gold-Silver Prospects
The Creston Mascota deposit at Pinos Altos has been operating as a satellite operation to the Pinos Altos mine since late 2010.
Approximately 516,200 tonnes of ore were stacked on the Creston Mascota leach pad during the first quarter of 2016, compared to approximately 527,000 tonnes stacked in the first quarter of 2015. In the 2016 period, fewer tonnes were stacked due to freezing weather conditions encountered in January. Minesite costs per tonne at Creston Mascota were $12 in the first quarter of 2016, compared to $11 in the first quarter of 2015. Costs in the 2016 period were slightly higher due to the freezing conditions encountered early in the quarter.
Payable gold production at Creston Mascota in the first quarter of 2016 was 11,551 ounces at total cash costs per ounce on a by-product basis of $460. This compares to 12,448 ounces of gold at total cash costs per ounce on a by-product basis of $444 during the first quarter of 2015. Production was lower in the 2016 period due to fewer tonnes stacked and lower grades compared to the 2015 period. Lower production in the 2016 period resulted in higher cash costs, which were partially offset by favourable foreign exchange rates compared to the 2015 period.
Rough earthworks are nearing completion on the Phase 4 heap leach pad at Creston Mascota. Installation of the clay under layer and synthetic liner is expected to commence in the second quarter of 2016.
During the first quarter of 2016, an agreement was signed that allows access to the 51-hectare Madrono property for exploration and mining. The Madrono property is located in an area with good access and infrastructure between Pinos Altos and Creston Mascota, includes at least three gold-silver veins: Madrono, Santa Martha and La Curva. Previous mining in this area included small-scale bonanza production from underground mine development on three levels in the 1930s. Mapping, surface sampling and exploration planning for Madrono is underway.
Exploration and infill drilling continues at the Bravo satellite target and around the Creston Mascota pit to increase the confidence in the block model and look for additional growth opportunities.
La India — Additional Ore Tonnes Encountered Outside the Block Model
The La India mine property in Sonora, Mexico, located approximately 70 kilometres from the Company’s Pinos Altos mine, was acquired in November 2011 through the purchase of Grayd Resources, which held a 56,000 hectare land position in the Mulatos Gold belt. Commissioning of the mine commenced ahead of schedule in the third quarter of 2013 and commercial production was declared as of February 1, 2014.
Approximately 1,396,300 tonnes of ore were stacked on the La India leach pad during the first quarter of 2016, compared to approximately 1,378,500 tonnes stacked in the first quarter of 2015. Minesite costs per tonne at La India were $8 in the first quarter of 2016, compared to $9 in the first quarter of 2015. Tonnes stacked in the 2016 period were higher due to the mining of additional lower grade ore tonnes previously identified as waste in the block model. Costs were lower in the 2016 period primarily due to lower fuel consumption and less waste mined.
Payable gold production at La India in the first quarter of 2016 was 28,231 ounces at total cash costs per ounce on a by-product basis of $360. Production in the first quarter of 2015 was 26,523 ounces of gold at total cash costs per ounce on a by-product basis of $418. Production was higher in the 2016 period due to higher tonnage stacked and faster percolation rates from the new lifts on the phase 2 heap leach pad. Total cash costs per ounce on a by-product basis in the 2016 period were favourably impacted by
higher production volumes (for both gold and silver) and favourable foreign exchange rates.
A land access agreement was signed in January 2016, allowing access for exploration and potential future mining on the El Realito claims. Surface sampling and target generation are underway at El Realito and favourable targets will then be drill-tested. Step-out drilling is also planned at the El Cochi and La India Este areas adjacent to the La India mine. An initial drill program is planned at the Kilometre 15 area which is located east and contiguous with the El Realito property.
El Barqueno - Recent Drill Program Expands Known Deposits and Tests Other Target Areas
Agnico Eagle acquired its 100% interest in the El Barqueno project in November 2014 with the acquisition of Cayden Resources Inc. The 32,840-hectare property is in the Guachinango gold-silver mining district of Jalisco State in west-central, Mexico, approximately 150 kilometres west of the state capital of Guadalajara. As of December 31, 2015, the El Barqueno project has an inferred mineral resource of 19.7 million tonnes grading 0.96 g/t gold and 5.78 g/t silver (containing 608,000 ounces of gold and 3.7 million ounces of silver) at the Azteca-Zapoteca, Angostura and Peña de Oro zones. This news release summarizes the results of exploration and in-fill drilling programs completed on the project to the end of March 2016.
The El Barqueno project contains a number of known mineralized zones and several prospects. From January through March 2016, 156 holes (27,523 metres) were drilled using 14 drill rigs in order to complete infill drilling on the Azteca-Zapoteca Zone and to explore for additional mineralized structures and extensions of the other known zones. The Azteca-Zapoteca infill work represents 90% of the drilling completed to date in 2016. There are currently six drill rigs operating on the project testing other targets including Zapote-Mixteca, San Diego, Olmeca, Huichol and Tarasca.
[El Barqueno Project — Local Geology Map]

Gold and silver grades of recent intercepts from the Azteca-Zapoteca and Angostura Zones are set out in the table below and the drill collars are located in the accompanying table as well as on the project geology map. All intercepts reported for the El Barqueno project show uncapped grades over estimated true widths, based on a preliminary geological interpretation that will be updated as new information becomes available with further drilling.
Selected recent exploration drill results from the El Barqueno project
|
Drill Hole |
|
Zone |
|
From |
|
To |
|
Depth of |
|
Estimated |
|
Gold grade |
|
Silver grade |
|
|
|
|
|
|
|
|
|
|
|
|
|
|
|
|
|
|
|
AZP16-212 |
|
Azteca-Zapoteca |
|
90.0 |
|
98.0 |
|
62 |
|
4.8 |
|
1.63 |
|
8.8 |
|
|
AZP16-219 |
|
Azteca-Zapoteca |
|
27.0 |
|
50.0 |
|
34 |
|
9.2 |
|
4.07 |
|
14.3 |
|
|
AZP16-243 |
|
Azteca-Zapoteca |
|
46.0 |
|
53.0 |
|
38 |
|
5.6 |
|
22.39 |
|
24.3 |
|
|
and |
|
|
|
63.0 |
|
71.0 |
|
52 |
|
6.4 |
|
1.07 |
|
2.9 |
|
|
AZP16-260 |
|
Azteca-Zapoteca |
|
89.0 |
|
118.0 |
|
89 |
|
14.5 |
|
1.16 |
|
6.8 |
|
|
AZP16-272 |
|
Azteca-Zapoteca |
|
166.0 |
|
176.0 |
|
136 |
|
4.0 |
|
1.07 |
|
3.2 |
|
|
AZP16-282 |
|
Azteca-Zapoteca |
|
43.0 |
|
49.0 |
|
40 |
|
4.0 |
|
1.96 |
|
3.8 |
|
|
AZP16-294 |
|
Azteca-Zapoteca |
|
41.0 |
|
49.0 |
|
42 |
|
6.4 |
|
1.66 |
|
3.2 |
|
|
AZP16-297 |
|
Azteca-Zapoteca |
|
45.0 |
|
53.0 |
|
49 |
|
7.9 |
|
4.40 |
|
11.3 |
|
|
AZP16-300 |
|
Azteca-Zapoteca |
|
13.0 |
|
22.0 |
|
12 |
|
7.2 |
|
6.93 |
|
12.2 |
|
|
AZP16-322 |
|
Azteca-Zapoteca |
|
130.0 |
|
145.0 |
|
134 |
|
12.0 |
|
7.31 |
|
53.1 |
|
|
BRQ15-239 |
|
Angostura |
|
153.0 |
|
162.0 |
|
161 |
|
8.3 |
|
0.33 |
|
83.4 |
|
|
BRQ15-245 |
|
Angostura |
|
164.0 |
|
176.0 |
|
140 |
|
10.9 |
|
1.52 |
|
19.1 |
|
|
BRQ15-285 |
|
Angostura |
|
316.0 |
|
322.0 |
|
192 |
|
5.5 |
|
0.69 |
|
24.4 |
|
|
BRQ15-288 |
|
Angostura |
|
188.0 |
|
199.0 |
|
172 |
|
9.7 |
|
1.28 |
|
11.8 |
|
* Cut-off grade of 0.4 g/t gold; only intervals longer than 2.8 metres estimated true width were included
El Barqueno project exploration drill hole collar coordinates
|
|
|
Drill Hole Collar Coordinates* |
| ||||||||||
|
Drill Hole ID |
|
UTM North |
|
UTM East |
|
Elevation |
|
Azimuth |
|
Dip |
|
Length |
|
|
AZP16-212 |
|
555141 |
|
2279906 |
|
1,274 |
|
155 |
|
-60 |
|
172 |
|
|
AZP16-219 |
|
554248 |
|
2279658 |
|
1,257 |
|
335 |
|
-50 |
|
219 |
|
|
AZP16-243 |
|
554725 |
|
2279768 |
|
1,288 |
|
155 |
|
-60 |
|
108 |
|
|
AZP16-260 |
|
554953 |
|
2279847 |
|
1,286 |
|
155 |
|
-80 |
|
146 |
|
|
AZP16-272 |
|
554155 |
|
2279566 |
|
1,278 |
|
335 |
|
-50 |
|
336 |
|
|
AZP16-282 |
|
554531 |
|
2279724 |
|
1,285 |
|
155 |
|
-65 |
|
110 |
|
|
AZP16-294 |
|
554883 |
|
2279898 |
|
1,288 |
|
335 |
|
-80 |
|
70 |
|
|
AZP16-297 |
|
554438 |
|
2279816 |
|
1,248 |
|
335 |
|
-50 |
|
70 |
|
|
AZP16-300 |
|
555163 |
|
2279871 |
|
1,254 |
|
155 |
|
-45 |
|
61 |
|
|
AZP16-322 |
|
554239 |
|
2279765 |
|
1,234 |
|
335 |
|
-50 |
|
171 |
|
|
BRQ15-239 |
|
553971 |
|
2280155 |
|
1,175 |
|
335 |
|
-50 |
|
276 |
|
|
BRQ-15-245 |
|
553880 |
|
2280173 |
|
1,241 |
|
335 |
|
-50 |
|
265 |
|
|
BRQ-15-285 |
|
554164 |
|
2280106 |
|
1,214 |
|
335 |
|
-50 |
|
452 |
|
|
BRQ-15-288 |
|
554026 |
|
2280126 |
|
1,172 |
|
335 |
|
-50 |
|
421 |
|
* Coordinate System UTM WGS84 13N Zone
Azteca-Zapoteca Zone
To date, the Azteca-Zapoteca Zone has been defined over more than 1.4 kilometres of strike length along a northeasterly direction and has been intersected as deep as 300 metres. The Zone remains open at depth and along strike to the southwest. More than half of the exploration drilling and all the infill drilling planned for this year is completed.
The steeply north-dipping Azteca structure and moderately south-dipping Zapoteca structure appear to coalesce at a depth of 100-150 metres below surface into a near-vertical structure with generally higher grades.
The current results show higher grades in the shallow areas around and beneath former pits that were mined in the 1980s. Examples include hole AZP16-243 that yielded 22.39 g/t gold and 24.3 g/t silver over 5.6 metres at 38 metres depth, as well as hole AZP16-300 that intersected 6.93 g/t gold and 12.2 g/t silver over 7.2 metres at 12 metres depth. The gold grade tends to become progressively lower at depth, such as hole AZP16-260 that intersected 1.16 g/t gold and 6.8 g/t silver over 14.5 metres at 89 metres depth and hole AZP16-272 that intersected 1.07 g/t gold and 3.2 g/t silver over 4.0 metres at 136
metres depth. An exception of a higher grade intercept at depth is hole AZP16-322 that intersected 7.31 g/t gold and 53.1 g/t silver over 12.0 metres at 134 metres depth. This could represent a feeder structure with depth potential, however, additional drilling will be required to evaluate the full extent of the mineralization.
Additional drilling is planned along strike to the southwest as well as in the footwall to the Zapoteca structure. The Company believes there is excellent potential for parallel mineralized structures between the Azteca-Zapoteca and Angostura mineral resource areas and two drills are currently testing this area as a follow-up to the recent detailed mapping and sampling completed in this area.
Angostura Zone
The Angostura Zone lies approximately 800 metres northwest of the Azteca-Zapoteca Zone. Angostura is defined over a strike length of more than 1,000 metres, and appears to plunge shallowly to the southwest. The structure is open along strike and at depth.
Recent results include hole BRQ15-245 that intersected 1.52 g/t gold and 19.1 g/t silver over 10.9 metres at 140 metres depth. Approximately 150 metres to the west, hole BRQ15-288 intersected 1.28 g/t gold and 11.8 g/t silver over 9.7 metres at 172 metres depth.
Drilling to date suggests Angostura could become part of a multi-pit operation along with a larger deposit at Azteca-Zapoteca. Additional drilling is planned along strike to the northeast and southwest searching for other potential shallowly-plunging shoots as well as testing the potential for parallel mineralized structures.
Additional Work
Drill permits have been received to test the northeastern strike extension as well as several mineralized areas identified from mapping to the north and east of the Peña de Oro Zone, in what is now referred to as the Peña Blanca area.
Approximately 25,000 metres of additional drilling is expected to be completed by the end of 2016 at the El Barqueno project, principally at the Azteca-Zapoteca, Angostura, Peña de Oro, Peña Blanca, Zapote-Mixteca, San Diego, Olmeca, Huichol and Tarasca prospects. Exploration expenditures in 2016 are expected to total approximately $16 million.
In addition to the drilling activities, studies are underway to evaluate potential development scenarios for the project. It is currently envisioned that the project’s gold-silver deposits could potentially be developed into a series of open pits utilizing heap leach processing, similar to the Creston Mascota deposit at Pinos Altos and the La India mines.
About Agnico Eagle
Agnico Eagle is a senior Canadian gold mining company that has produced precious metals since 1957. Its eight mines are located in Canada, Finland and Mexico, with exploration and development activities in each of these countries as well as in the United States and Sweden. The Company and its shareholders have full exposure to gold prices due to its long-standing policy of no forward gold sales. Agnico Eagle has declared a cash dividend every year since 1983.
Further Information
For further information regarding Agnico Eagle, contact Investor Relations at [email protected] or call (416) 947-1212.
Note Regarding Certain Measures of Performance
This news release discloses certain measures, including ‘‘total cash costs per ounce’’, “all-in sustaining costs per ounce”, ‘‘minesite costs per tonne’’ and “adjusted net income” that are not recognized measures under IFRS. These data may not be comparable to data reported by other gold producers. For a reconciliation of these measures to the most directly comparable financial information reported in the consolidated financial statements prepared in accordance with IFRS and for an explanation of how management uses these measures, other than adjusted net income, see “Reconciliation of Non-GAAP Financial Performance Measures” below. The total cash costs per ounce of gold produced is reported on both a by-product basis (deducting by-product metal revenues from production costs) and co-product basis (before by-product metal revenues). The total cash costs per ounce of gold produced on a by-product basis is calculated by adjusting production costs as recorded in the consolidated statements of income for by-product revenues, unsold concentrate inventory production costs, smelting, refining and marketing charges and other adjustments, and then dividing by the number of ounces of gold produced. The total cash costs per ounce of gold produced on a co-product basis is calculated in the same manner as the total cash costs per ounce of gold produced on a by-product basis except that no adjustment is made for by-product metal revenues. Accordingly, the calculation of total cash costs per ounce of gold produced on a co-product basis does not reflect a reduction in production costs or smelting, refining and marketing charges associated with the production and sale of by-product metals. The total cash costs per ounce of gold produced is intended to provide information about the cash-generating capabilities of the Company’s mining operations. Management also uses these measures to monitor the performance of the Company’s mining operations. As market prices for gold are quoted on a per ounce basis, using the total cash costs per ounce of gold produced on a by-product basis measure allows management to assess a mine’s cash-generating capabilities at various gold prices. All-in sustaining costs per ounce is used to show the full cost of gold production from current operations. The Company calculates all-in sustaining costs per ounce of gold produced on a by-product basis as the aggregate of total cash costs per ounce on a by-product basis, sustaining capital expenditures (including capitalized exploration), general and administrative expenses (including stock options) and reclamation expenses divided by the amount of
gold produced. The all-in sustaining costs per ounce of gold produced on a co-product basis is calculated in the same manner as the all-in sustaining costs per ounce of gold produced on a by-product basis, except that the total cash costs per ounce on a co-product basis is used, meaning no adjustment is made for by-product metal revenues. The Company’s methodology for calculating all-in sustaining costs per ounce may differ from to the methodology used by other producers that disclose all-in sustaining costs per ounce. The Company may change the methodology it uses to calculate all-in sustaining costs per ounce in the future, including in response to the adoption of formal industry guidance regarding this measure by the World Gold Council. Management is aware that these per ounce measures of performance can be affected by fluctuations in exchange rates and, in the case of total cash costs per ounce of gold produced on a by-product basis, by-product metal prices. Management compensates for these inherent limitations by using these measures in conjunction with minesite costs per tonne (discussed below) as well as other data prepared in accordance with IFRS.
Management also performs sensitivity analyses in order to quantify the effects of fluctuating exchange rates and metal prices. This news release also contains information as to estimated future total cash costs per ounce, all-in sustaining costs per ounce and minesite costs per tonne. The estimates are based upon the total cash costs per ounce, all-in sustaining costs per ounce and minesite costs per tonne that the Company expects to incur to mine gold at its mines and projects and, consistent with the reconciliation of these actual costs referred to above, do not include production costs attributable to accretion expense and other asset retirement costs, which will vary over time as each project is developed and mined. It is therefore not practicable to reconcile these forward-looking non-GAAP financial measures to the most comparable IFRS measure.
Forward-Looking Statements
The information in this news release has been prepared as at April 28, 2016. Certain statements contained in this news release constitute “forward-looking statements” within the meaning of the United States Private Securities Litigation Reform Act of 1995 and “forward-looking information” under the provisions of Canadian provincial securities laws and are referred to herein as “forward-looking statements”. When used in this news release, the words “anticipate”, “could”, “estimate”, “expect”, “forecast”, “planned”, “potential”, “will” and similar expressions are intended to identify forward-looking statements. Such statements include, without limitation: the Company’s forward-looking production guidance, including estimated ore grades, project timelines, drilling results, metal production, life of mine estimates, production, total cash costs per ounce, all-in sustaining costs per ounce, minesite costs per tonne and cash flows; the estimated timing and conclusions of technical reports and other studies; the methods by which ore will be extracted or processed; statements concerning expansion projects, recovery rates, mill throughput, optimization and projected exploration expenditures, including costs and other estimates upon which such projections are based; statements regarding timing and amounts of capital expenditures and other assumptions; estimates of future mineral reserves, mineral resources, mineral production, optimization efforts and sales; estimates of mine life; estimates of future mining costs, total cash costs per ounce, all-in sustaining costs per ounce, minesite costs per tonne and other expenses; estimates of
future capital expenditures and other cash needs, and expectations as to the funding thereof; statements as to the projected development of certain ore deposits, including estimates of exploration, development and production and other capital costs and estimates of the timing of such exploration, development and production or decisions with respect to such exploration, development and production; estimates of mineral reserves and mineral resources, and statements and information regarding anticipated future exploration; the anticipated timing of events with respect to the Company’s mine sites and statements and information regarding the sufficiency of the Company’s cash resources and other statements and information regarding anticipated trends with respect to the Company’s operations, exploration and the funding thereof. Such statements and information reflect the Company’s views as at the date of this news release and are subject to certain risks, uncertainties and assumptions, and undue reliance should not be placed on such statements and information. Forward-looking statements are necessarily based upon a number of factors and assumptions that, while considered reasonable by Agnico Eagle as of the date of such statements, are inherently subject to significant business, economic and competitive uncertainties and contingencies. The material factors and assumptions used in the preparation of the forward looking statements contained herein, which may prove to be incorrect, include, but are not limited to, the assumptions set forth herein and in management’s discussion and analysis (“MD&A”) and the Company’s Annual Information Form (“AIF”) for the year ended December 31, 2015 filed with Canadian securities regulators and that are included in its Annual Report on Form 40-F for the year ended December 31, 2015 (“Form 40-F”) filed with the U.S. Securities and Exchange Commission (the “SEC”) as well as: that there are no significant disruptions affecting operations; that production, permitting, development and expansion at each of Agnico Eagle’s properties proceeds on a basis consistent with current expectations and plans; that the relevant metal prices, exchange rates and prices for key mining and construction supplies will be consistent with Agnico Eagle’s expectations; that Agnico Eagle’s current estimates of mineral reserves, mineral resources, mineral grades and metal recovery are accurate; that there are no material delays in the timing for completion of ongoing growth projects; that the Company’s current plans to optimize production are successful; and that there are no material variations in the current tax and regulatory environment. Many factors, known and unknown, could cause the actual results to be materially different from those expressed or implied by such forward looking statements. Such risks include, but are not limited to: the volatility of prices of gold and other metals; uncertainty of mineral reserves, mineral resources, mineral grades and mineral recovery estimates; uncertainty of future production, project development, capital expenditures and other costs; exchange rate fluctuations; financing of additional capital requirements; cost of exploration and development programs; mining risks; community protests; risks associated with foreign operations; governmental and environmental regulation; the volatility of the Company’s stock price; and risks associated with the Company’s currency, fuel and by-product metal derivative strategies. For a more detailed discussion of such risks and other factors that may affect the Company’s ability to achieve the expectations set forth in the forward-looking statements contained in this news release, see the AIF and MD&A filed on SEDAR at www.sedar.com and included in the Form 40-F filed on EDGAR at www.sec.gov, as well as the Company’s other filings with the Canadian securities regulators and the SEC. Other than as required by law, the
Company does not intend, and does not assume any obligation, to update these forward-looking statements.
Notes to Investors Regarding the Use of Mineral Resources
Cautionary Note to Investors Concerning Estimates of Measured and Indicated Mineral Resources
This news release uses the terms “measured mineral resources” and “indicated mineral resources”. Investors are advised that while those terms are recognized and required by Canadian regulations, the SEC does not recognize them. Investors are cautioned not to assume that any part or all of mineral deposits in these categories will ever be converted into mineral reserves.
Cautionary Note to Investors Concerning Estimates of Inferred Mineral Resources
This news release also uses the term “inferred mineral resources”. Investors are advised that while this term is recognized and required by Canadian regulations, the SEC does not recognize it. “Inferred mineral resources” have a great amount of uncertainty as to their existence, and great uncertainty as to their economic and legal feasibility. It cannot be assumed that all or any part of an inferred mineral resource will ever be upgraded to a higher category. Under Canadian rules, estimates of inferred mineral resources may not form the basis of feasibility or pre-feasibility studies, except in rare cases. Investors are cautioned not to assume that any part or all of an inferred mineral resource exists, or is economically or legally mineable.
Scientific and Technical Data
The scientific and technical information contained in this news release relating to Quebec operations has been approved by Christian Provencher, Eng., Vice-President, Canada; relating to Nunavut operations has been approved by Dominique Girard, Eng., Vice-President Technical Services and Nunavut Operations; relating to the Kittila operations has been approved by Francis Brunet, Eng., Corporate Director Mining; relating to Southern Business operations has been approved by Tim Haldane, P.Eng., Senior Vice-President, Operations — USA and Latin America; and relating to exploration has been approved by Alain Blackburn, Eng., Senior Vice-President, Exploration and Guy Gosselin, Eng., Vice-President, Exploration. Each of them is a “Qualified Person” for the purposes of National Instrument 43-101 Standards of Disclosure for Mineral Projects (‘‘NI 43-101’’).
The scientific and technical information relating to Agnico Eagle’s mineral reserves and mineral resources contained herein (other than the Canadian Malartic mine) has been approved by Daniel Doucet, Eng., Senior Corporate Director, Reserve Development; and relating to mineral reserves and mineral resources at the Canadian Malartic mine contained herein has been approved by Donald Gervais, P.Geo., Director of Technical Services at CMC. Each of them is a “Qualified Person” for the purposes of NI 43-101.
Cautionary Note To U.S. Investors - The SEC permits U.S. mining companies, in their filings with the SEC, to disclose only those mineral deposits that a company can economically and legally extract or produce. Agnico Eagle reports mineral reserve and mineral resource estimates in accordance with the Canadian Institute of Mining, Metallurgy and Petroleum Best Practice Guidelines for Exploration and for Estimation of Mineral Resources and Mineral Reserves, in accordance with NI 43-101. These standards are similar to those used by the SEC’s Industry Guide No. 7, as interpreted by Staff at the SEC (“Guide 7”). However, the definitions in NI 43-101 differ in certain respects from those under Guide 7. Accordingly, mineral reserve information contained herein may not be comparable to similar information disclosed by U.S. companies. Under the requirements of the SEC, mineralization may not be classified as a “reserve” unless the determination has been made that the mineralization could be economically and legally produced or extracted at the time the reserve determination is made. A “final” or “bankable” feasibility study is required to meet the requirements to designate mineral reserves under Industry Guide 7. Agnico Eagle uses certain terms in this news release, such as “measured”, “indicated”, “inferred”, and “resources” that the SEC guidelines strictly prohibit U.S. registered companies from including in their filings with the SEC.
In prior periods, mineral reserves and mineral resources for all properties were typically estimated using historic three-year average metals prices and foreign exchange rates in accordance with the SEC guidelines. These guidelines require the use of prices that reflect current economic conditions at the time of mineral reserve determination, which the Staff of the SEC has interpreted to mean historic three-year average prices. Given the current lower commodity price environment, Agnico Eagle has decided to use price assumptions that are below the three-year averages. The assumptions used for the mineral reserve and mineral resource estimates at all mines and advanced projects as of December 31, 2015 (other than the Canadian Malartic mine), reported by the Company on February 10, 2016, were $1,100 per ounce gold, $16.00 per ounce silver, $0.90 per pound zinc, $2.50 per pound copper, and US$/C$, Euro/US$ and US$/MXP exchange rates for all mines and projects other than the Lapa, Meadowbank and Creston Mascota mines and Santo Niño open pit at Pinos Altos of 1.16, 1.20 and 14.00, respectively. Due to shorter mine life, the assumptions used for the mineral reserve and mineral resource estimates at the shorter-life mines (the Lapa, Meadowbank and Creston Mascota mines and Santo Niño open pit) as of December 31, 2015, reported by the Company on February 10, 2016, included the same metal price assumptions, and US$/C$ and US$/MXP exchange rates of 1.30 and 16.00, respectively.
The assumptions used for the mineral reserve and mineral resource estimates at the Canadian Malartic mine as of December 31, 2015, reported by the Company on February 10, 2016, were $1,150 per ounce gold, a cut-off grade between 0.30 g/t and 0.33 g/t gold (depending on the deposit) and a US$/C$ exchange rate of 1.24.
NI 43-101 requires mining companies to disclose mineral reserves and mineral resources using the subcategories of “proven mineral reserves”, “probable mineral reserves”, “measured mineral resources”, “indicated mineral resources” and “inferred mineral resources”. Mineral resources that are not mineral reserves do not have demonstrated economic viability.
A mineral reserve is the economically mineable part of a measured and/or indicated mineral resource. It includes diluting materials and allowances for losses, which may occur when the material is mined or extracted and is defined by studies at pre-feasibility or feasibility level as appropriate that include application of modifying factors. Such studies demonstrate that, at the time of reporting, extraction could reasonably be justified.
Modifying factors are considerations used to convert mineral resources to mineral reserves. These include, but are not restricted to, mining, processing, metallurgical, infrastructure, economic, marketing, legal, environmental, social and governmental factors.
A proven mineral reserve is the economically mineable part of a measured mineral resource. A proven mineral reserve implies a high degree of confidence in the modifying factors. A probable mineral reserve is the economically mineable part of an indicated and, in some circumstances, a measured mineral resource. The confidence in the modifying factors applying to a probable mineral reserve is lower than that applying to a proven mineral reserve.
A mineral resource is a concentration or occurrence of solid material of economic interest in or on the Earth’s crust in such form, grade or quality and quantity that there are reasonable prospects for eventual economic extraction. The location, quantity, grade or quality, continuity and other geological characteristics of a mineral resource are known, estimated or interpreted from specific geological evidence and knowledge, including sampling.
A measured mineral resource is that part of a mineral resource for which quantity, grade or quality, densities, shape and physical characteristics are estimated with confidence sufficient to allow the application of modifying factors to support detailed mine planning and final evaluation of the economic viability of the deposit. Geological evidence is derived from detailed and reliable exploration, sampling and testing and is sufficient to confirm geological and grade or quality continuity between points of observation. An indicated mineral resource is that part of a mineral resource for which quantity, grade or quality, densities, shape and physical characteristics are estimated with sufficient confidence to allow the application of modifying factors in sufficient detail to support mine planning and evaluation of the economic viability of the deposit. Geological evidence is derived from adequately detailed and reliable exploration, sampling and testing and is sufficient to assume geological and grade or quality continuity between points of observation. An inferred mineral resource is that part of a mineral resource for which quantity and grade or quality are estimated on the basis of limited geological evidence and sampling. Geological evidence is sufficient to imply but not verify geological and grade or quality continuity.
Investors are cautioned not to assume that part or all of an inferred mineral resource exists, or is economically or legally mineable.
A feasibility study is a comprehensive technical and economic study of the selected development option for a mineral project that includes appropriately detailed
assessments of applicable modifying factors together with any other relevant operational factors and detailed financial analysis that are necessary to demonstrate, at the time of reporting, that extraction is reasonably justified (economically mineable). The results of the study may reasonably serve as the basis for a final decision by a proponent or financial institution to proceed with, or finance, the development of the project. The confidence level of the study will be higher than that of a pre-feasibility study.
AGNICO EAGLE MINES LIMITED
SUMMARY OF OPERATIONS KEY PERFORMANCE INDICATORS
(thousands of United States dollars, except where noted)
(Unaudited)
|
|
|
Three Months Ended |
| ||||
|
|
|
March 31, |
| ||||
|
|
|
2016 |
|
2015 |
| ||
|
Operating margin(i) by mine: |
|
|
|
|
| ||
|
Northern Business |
|
|
|
|
| ||
|
LaRonde mine |
|
$ |
48,055 |
|
$ |
30,015 |
|
|
Lapa mine |
|
10,806 |
|
14,687 |
| ||
|
Goldex mine |
|
22,184 |
|
19,253 |
| ||
|
Meadowbank mine |
|
33,329 |
|
46,577 |
| ||
|
Canadian Malartic mine(ii) |
|
41,740 |
|
34,718 |
| ||
|
Kittila mine |
|
24,086 |
|
27,415 |
| ||
|
Southern Business |
|
|
|
|
| ||
|
Pinos Altos mine |
|
35,820 |
|
34,652 |
| ||
|
Creston Mascota deposit at Pinos Altos |
|
8,989 |
|
8,409 |
| ||
|
La India mine |
|
21,549 |
|
20,590 |
| ||
|
Total operating margin(i) |
|
246,558 |
|
236,316 |
| ||
|
Amortization of property, plant and mine development |
|
145,631 |
|
135,897 |
| ||
|
Exploration, corporate and other |
|
73,730 |
|
43,706 |
| ||
|
Income before income and mining taxes |
|
27,197 |
|
56,713 |
| ||
|
Income and mining taxes (recovery) expense |
|
(591 |
) |
27,970 |
| ||
|
Net income for the period |
|
$ |
27,788 |
|
$ |
28,743 |
|
|
Net income per share — basic (US$) |
|
$ |
0.13 |
|
$ |
0.13 |
|
|
Net income per share — diluted (US$) |
|
$ |
0.13 |
|
$ |
0.13 |
|
|
Cash flows: |
|
|
|
|
| ||
|
Cash provided by operating activities |
|
$ |
145,704 |
|
$ |
143,455 |
|
|
Cash used in investing activities |
|
$ |
(107,595 |
) |
$ |
(53,892 |
) |
|
Cash used in financing activities |
|
$ |
(1,588 |
) |
$ |
(123,182 |
) |
|
Realized prices (US$): |
|
|
|
|
| ||
|
Gold (per ounce) |
|
$ |
1,192 |
|
$ |
1,202 |
|
|
Silver (per ounce) |
|
$ |
15.09 |
|
$ |
17.02 |
|
|
Zinc (per tonne) |
|
$ |
1,540 |
|
$ |
2,072 |
|
|
Copper (per tonne) |
|
$ |
4,297 |
|
$ |
5,056 |
|
|
Payable production(iii): |
|
|
|
|
| ||
|
Gold (ounces): |
|
|
|
|
| ||
|
Northern Business |
|
|
|
|
| ||
|
LaRonde mine |
|
75,337 |
|
58,893 |
| ||
|
Lapa mine |
|
21,709 |
|
25,920 |
| ||
|
Goldex mine |
|
32,340 |
|
29,250 |
| ||
|
Meadowbank mine |
|
72,311 |
|
88,523 |
| ||
|
Canadian Malartic mine(ii) |
|
73,613 |
|
67,893 |
| ||
|
Kittila mine |
|
48,127 |
|
44,654 |
| ||
|
Southern Business |
|
|
|
|
| ||
|
Pinos Altos mine |
|
48,117 |
|
50,106 |
| ||
|
Creston Mascota deposit at Pinos Altos |
|
11,551 |
|
12,448 |
| ||
|
La India mine |
|
28,231 |
|
26,523 |
| ||
|
Total gold (ounces) |
|
411,336 |
|
404,210 |
| ||
|
Silver (thousands of ounces): |
|
|
|
|
| ||
|
Northern Business |
|
|
|
|
| ||
|
LaRonde mine |
|
247 |
|
198 |
| ||
|
Lapa mine |
|
3 |
|
1 |
| ||
|
Meadowbank mine |
|
43 |
|
96 |
| ||
|
Canadian Malartic mine(ii) |
|
77 |
|
72 |
| ||
|
Kittila mine |
|
3 |
|
2 |
| ||
|
Southern Business |
|
|
|
|
| ||
|
Pinos Altos mine |
|
587 |
|
562 |
| ||
|
Creston Mascota deposit at Pinos Altos |
|
48 |
|
32 |
| ||
|
La India mine |
|
117 |
|
69 |
| ||
|
Total silver (thousands of ounces) |
|
1,125 |
|
1,032 |
| ||
|
Zinc (tonnes) |
|
614 |
|
936 |
| ||
|
Copper (tonnes) |
|
1,154 |
|
1,167 |
| ||
|
Payable metal sold: |
|
|
|
|
| ||
|
Gold (ounces): |
|
|
|
|
| ||
|
Northern Business |
|
|
|
|
| ||
|
LaRonde mine |
|
75,257 |
|
60,943 |
| ||
|
Lapa mine |
|
19,836 |
|
23,497 |
| ||
|
Goldex mine |
|
31,955 |
|
27,907 |
| ||
|
Meadowbank mine |
|
71,589 |
|
84,780 |
| ||
|
Canadian Malartic mine(ii)(iv) |
|
65,085 |
|
59,261 |
| ||
|
Kittila mine |
|
50,725 |
|
48,982 |
| ||
|
Southern Business |
|
|
|
|
| ||
|
Pinos Altos mine |
|
43,224 |
|
41,433 |
| ||
|
Creston Mascota deposit at Pinos Altos |
|
11,845 |
|
11,399 |
| ||
|
La India mine |
|
26,165 |
|
26,898 |
| ||
|
Total gold (ounces) |
|
395,681 |
|
385,100 |
| ||
|
Silver (thousands of ounces): |
|
|
|
|
| ||
|
Northern Business |
|
|
|
|
| ||
|
LaRonde mine |
|
232 |
|
205 |
| ||
|
Lapa mine |
|
1 |
|
— |
| ||
|
Meadowbank mine |
|
43 |
|
98 |
| ||
|
Canadian Malartic mine(ii)(iv) |
|
73 |
|
54 |
| ||
|
Kittila mine |
|
3 |
|
2 |
| ||
|
Southern Business |
|
|
|
|
| ||
|
Pinos Altos mine |
|
530 |
|
446 |
| ||
|
Creston Mascota deposit at Pinos Altos |
|
48 |
|
20 |
| ||
|
La India mine |
|
86 |
|
63 |
| ||
|
Total silver (thousands of ounces): |
|
1,016 |
|
888 |
| ||
|
Zinc (tonnes) |
|
605 |
|
1,264 |
| ||
|
Copper (tonnes) |
|
1,156 |
|
1,160 |
| ||
|
|
|
|
|
|
| ||
|
Total cash costs per ounce of gold produced - co-product basis (US$)(v): |
|
|
|
|
| ||
|
Northern Business |
|
|
|
|
| ||
|
LaRonde mine |
|
$ |
670 |
|
$ |
892 |
|
|
Lapa mine |
|
668 |
|
568 |
| ||
|
Goldex mine |
|
506 |
|
542 |
| ||
|
Meadowbank mine |
|
797 |
|
674 |
| ||
|
Canadian Malartic mine(ii) |
|
572 |
|
649 |
| ||
|
Kittila mine |
|
727 |
|
682 |
| ||
|
Southern Business |
|
|
|
|
| ||
|
Pinos Altos mine |
|
530 |
|
548 |
| ||
|
Creston Mascota deposit at Pinos Altos |
|
527 |
|
488 |
| ||
|
La India mine |
|
424 |
|
461 |
| ||
|
Weighted average total cash costs per ounce of gold produced |
|
$ |
631 |
|
$ |
651 |
|
|
|
|
|
|
|
| ||
|
Total cash costs per ounce of gold produced - by-product basis (US$)(v): |
|
|
|
|
| ||
|
Northern Business |
|
|
|
|
| ||
|
LaRonde mine |
|
$ |
529 |
|
$ |
703 |
|
|
Lapa mine |
|
668 |
|
568 |
| ||
|
Goldex mine |
|
506 |
|
541 |
| ||
|
Meadowbank mine |
|
788 |
|
655 |
| ||
|
Canadian Malartic mine(ii) |
|
557 |
|
632 |
| ||
|
Kittila mine |
|
726 |
|
681 |
| ||
|
Southern Business |
|
|
|
|
| ||
|
Pinos Altos mine |
|
343 |
|
357 |
| ||
|
Creston Mascota deposit at Pinos Altos |
|
460 |
|
444 |
| ||
|
La India mine |
|
360 |
|
418 |
| ||
|
Weighted average total cash costs per ounce of gold produced |
|
$ |
573 |
|
$ |
588 |
|
Notes:
|
(i) |
|
Operating margin is calculated as revenues from mining operations less production costs. |
|
|
|
|
|
(ii) |
|
On June 16, 2014, Agnico Eagle and Yamana jointly acquired 100.0% of Osisko by way of a statutory plan of arrangement (the “Arrangement”). As a result of the Arrangement, Agnico Eagle and Yamana each indirectly own 50.0% of CMC and the Partnership, which now holds the Canadian Malartic mine. The information set out in this table reflects the Company’s 50.0% interest in the Canadian Malartic mine. |
|
(iii) |
|
Payable production (a non-GAAP non-financial performance measure) is the quantity of mineral produced during a period contained in products that are or will be sold by the Company, whether such products are sold during the period or held as inventories at the end of the period. |
|
|
|
|
|
(iv) |
|
The Canadian Malartic mine’s payable metal sold excludes the 5.0% net smelter royalty transferred to Osisko Gold Royalties Ltd., pursuant to the Arrangement. |
|
|
|
|
|
(v) |
|
Total cash costs per ounce of gold produced is not a recognized measure under IFRS and this data may not be comparable to data reported by other gold producers. Total cash costs per ounce of gold produced is reported on both a by-product basis (deducting by-product metal revenues from production costs) and co-product basis (before by-product metal revenues). Total cash costs per ounce of gold produced on a by-product basis is calculated by adjusting production costs as recorded in the interim condensed consolidated statements of income for by-product metal revenues, unsold concentrate inventory production costs, smelting, refining and marketing charges and other adjustments, and then dividing by the number of ounces of gold produced. Total cash costs per ounce of gold produced on a co-product basis is calculated in the same manner as total cash costs per ounce of gold produced on a by-product basis except that no adjustment for by-product metal revenues is made. The calculation of total cash costs per ounce of gold produced on a co-product basis does not reflect a reduction in production costs or smelting, refining and marketing charges associated with the production and sale of by-product metals. The Company believes that these generally accepted industry measures provide a realistic indication of operating performance and provide useful comparison points between periods. Total cash costs per ounce of gold produced is intended to provide information about the cash generating capabilities of the Company’s mining operations. Management also uses these measures to monitor the performance of the Company’s mining operations. As market prices for gold are quoted on a per ounce basis, using the total cash costs per ounce of gold produced on a by-product basis measure allows management to assess a mine’s cash generating capabilities at various gold prices. Management is aware that these per ounce measures of performance can be affected by fluctuations in exchange rates and, in the case of total cash costs of gold produced on a by-product basis, by-product metal prices. Management compensates for these inherent limitations by using these measures in conjunction with minesite costs per tonne as well as other data prepared in accordance with IFRS. Management also performs sensitivity analyses in order to quantify the effects of fluctuating metal prices and exchange rates. |
AGNICO EAGLE MINES LIMITED
CONSOLIDATED BALANCE SHEETS
(thousands of United States dollars, except share amounts, IFRS basis)
(Unaudited)
|
|
|
As at |
|
As at |
| ||
|
|
|
2016 |
|
2015 |
| ||
|
|
|
|
|
|
| ||
|
ASSETS |
|
|
|
|
| ||
|
Current assets: |
|
|
|
|
| ||
|
Cash and cash equivalents |
|
$ |
162,746 |
|
$ |
124,150 |
|
|
Short-term investments |
|
5,209 |
|
7,444 |
| ||
|
Restricted cash |
|
675 |
|
685 |
| ||
|
Trade receivables |
|
5,641 |
|
7,714 |
| ||
|
Inventories |
|
435,447 |
|
461,976 |
| ||
|
Income taxes recoverable |
|
4,878 |
|
817 |
| ||
|
Available-for-sale securities |
|
66,350 |
|
31,863 |
| ||
|
Fair value of derivative financial instruments |
|
4,520 |
|
87 |
| ||
|
Other current assets |
|
186,850 |
|
194,689 |
| ||
|
Total current assets |
|
872,316 |
|
829,425 |
| ||
|
Non-current assets: |
|
|
|
|
| ||
|
Restricted cash |
|
791 |
|
741 |
| ||
|
Goodwill |
|
696,809 |
|
696,809 |
| ||
|
Property, plant and mine development |
|
5,069,152 |
|
5,088,967 |
| ||
|
Other assets |
|
77,496 |
|
67,238 |
| ||
|
Total assets |
|
$ |
6,716,564 |
|
$ |
6,683,180 |
|
|
LIABILITIES AND EQUITY |
|
|
|
|
| ||
|
Current liabilities: |
|
|
|
|
| ||
|
Accounts payable and accrued liabilities |
|
$ |
202,158 |
|
$ |
243,786 |
|
|
Reclamation provision |
|
6,795 |
|
6,245 |
| ||
|
Interest payable |
|
22,107 |
|
14,526 |
| ||
|
Income taxes payable |
|
5,189 |
|
14,852 |
| ||
|
Finance lease obligations |
|
8,567 |
|
9,589 |
| ||
|
Current portion of long-term debt |
|
15,419 |
|
14,451 |
| ||
|
Fair value of derivative financial instruments |
|
1,709 |
|
8,073 |
| ||
|
Total current liabilities |
|
261,944 |
|
311,522 |
| ||
|
Non-current liabilities: |
|
|
|
|
| ||
|
Long-term debt |
|
1,064,750 |
|
1,118,187 |
| ||
|
Reclamation provision |
|
311,069 |
|
276,299 |
| ||
|
Deferred income and mining tax liabilities |
|
789,437 |
|
802,114 |
| ||
|
Other liabilities |
|
34,250 |
|
34,038 |
| ||
|
Total liabilities |
|
2,461,450 |
|
2,542,160 |
| ||
|
EQUITY |
|
|
|
|
| ||
|
Common shares: |
|
|
|
|
| ||
|
Outstanding - 221,281,167 common shares issued, less 802,915 shares held in trust |
|
4,799,138 |
|
4,707,940 |
| ||
|
Stock options |
|
203,582 |
|
216,232 |
| ||
|
Contributed surplus |
|
37,254 |
|
37,254 |
| ||
|
Deficit |
|
(813,517 |
) |
(823,734 |
) | ||
|
Accumulated other comprehensive income |
|
28,657 |
|
3,328 |
| ||
|
Total equity |
|
4,255,114 |
|
4,141,020 |
| ||
|
Total liabilities and equity |
|
$ |
6,716,564 |
|
$ |
6,683,180 |
|
AGNICO EAGLE MINES LIMITED
CONSOLIDATED STATEMENTS OF INCOME
(thousands of United States dollars, except per share amounts, IFRS basis)
(Unaudited)
|
|
|
Three Months Ended |
| ||||
|
|
|
2016 |
|
2015 |
| ||
|
|
|
|
|
|
| ||
|
REVENUES |
|
|
|
|
| ||
|
Revenues from mining operations |
|
$ |
490,531 |
|
$ |
483,596 |
|
|
|
|
|
|
|
| ||
|
COSTS, EXPENSES AND OTHER INCOME |
|
|
|
|
| ||
|
Production (i) |
|
243,973 |
|
247,280 |
| ||
|
Exploration and corporate development |
|
28,385 |
|
16,651 |
| ||
|
Amortization of property, plant and mine development |
|
145,631 |
|
135,897 |
| ||
|
General and administrative |
|
24,823 |
|
25,221 |
| ||
|
Impairment loss on available-for-sale securities |
|
— |
|
685 |
| ||
|
Finance costs |
|
17,801 |
|
19,712 |
| ||
|
(Gain) loss on derivative financial instruments |
|
(9,621 |
) |
8,576 |
| ||
|
Gain on sale of available-for-sale securities |
|
(119 |
) |
(21,049 |
) | ||
|
Environmental remediation |
|
5,093 |
|
429 |
| ||
|
Foreign currency translation loss (gain) |
|
6,770 |
|
(11,690 |
) | ||
|
Other expenses |
|
598 |
|
5,171 |
| ||
|
Income before income and mining taxes |
|
27,197 |
|
56,713 |
| ||
|
Income and mining taxes (recovery) expense |
|
(591 |
) |
27,970 |
| ||
|
Net income for the period |
|
$ |
27,788 |
|
$ |
28,743 |
|
|
|
|
|
|
|
| ||
|
Net income per share - basic |
|
$ |
0.13 |
|
$ |
0.13 |
|
|
Net income per share - diluted |
|
$ |
0.13 |
|
$ |
0.13 |
|
|
|
|
|
|
|
| ||
|
Weighted average number of common shares outstanding (in thousands): |
|
|
|
|
| ||
|
Basic |
|
219,681 |
|
214,566 |
| ||
|
Diluted |
|
221,906 |
|
215,692 |
| ||
Note:
(i) Exclusive of amortization, which is shown separately.
AGNICO EAGLE MINES LIMITED
CONSOLIDATED STATEMENTS OF CASH FLOWS
(thousands of United States dollars, IFRS basis)
(Unaudited)
|
|
|
Three Months Ended |
| ||||
|
|
|
2016 |
|
2015 |
| ||
|
|
|
|
|
|
| ||
|
OPERATING ACTIVITIES |
|
|
|
|
| ||
|
Net income for the period |
|
$ |
27,788 |
|
$ |
28,743 |
|
|
Add (deduct) items not affecting cash: |
|
|
|
|
| ||
|
Amortization of property, plant and mine development |
|
145,631 |
|
135,897 |
| ||
|
Deferred income and mining taxes |
|
(16,986 |
) |
19,300 |
| ||
|
Gain on sale of available-for-sale securities |
|
(119 |
) |
(21,049 |
) | ||
|
Stock-based compensation |
|
9,786 |
|
11,718 |
| ||
|
Impairment loss on available-for-sale securities |
|
— |
|
685 |
| ||
|
Foreign currency translation loss (gain) |
|
6,770 |
|
(11,690 |
) | ||
|
Other |
|
(4,159 |
) |
13,536 |
| ||
|
Adjustment for settlement of reclamation provision |
|
(1,232 |
) |
(302 |
) | ||
|
Changes in non-cash working capital balances: |
|
|
|
|
| ||
|
Trade receivables |
|
2,073 |
|
(1,484 |
) | ||
|
Income taxes |
|
(13,724 |
) |
(24,063 |
) | ||
|
Inventories |
|
24,611 |
|
10,412 |
| ||
|
Other current assets |
|
4,020 |
|
(4,837 |
) | ||
|
Accounts payable and accrued liabilities |
|
(46,336 |
) |
(20,582 |
) | ||
|
Interest payable |
|
7,581 |
|
7,171 |
| ||
|
Cash provided by operating activities |
|
145,704 |
|
143,455 |
| ||
|
|
|
|
|
|
| ||
|
INVESTING ACTIVITIES |
|
|
|
|
| ||
|
Additions to property, plant and mine development |
|
(100,694 |
) |
(82,887 |
) | ||
|
Acquisitions, net of cash and cash equivalents acquired |
|
— |
|
(7,000 |
) | ||
|
Net sales (purchases) of short-term investments |
|
2,235 |
|
(101 |
) | ||
|
Net proceeds from sale of available-for-sale securities and other investments |
|
299 |
|
37,668 |
| ||
|
Purchase of available-for-sale securities and other investments |
|
(9,445 |
) |
(5,275 |
) | ||
|
Decrease in restricted cash |
|
10 |
|
3,703 |
| ||
|
Cash used in investing activities |
|
(107,595 |
) |
(53,892 |
) | ||
|
|
|
|
|
|
| ||
|
FINANCING ACTIVITIES |
|
|
|
|
| ||
|
Dividends paid |
|
(14,846 |
) |
(14,775 |
) | ||
|
Repayment of finance lease obligations |
|
(2,514 |
) |
(8,405 |
) | ||
|
Proceeds from long-term debt |
|
75,000 |
|
— |
| ||
|
Repayment of long-term debt |
|
(130,000 |
) |
(100,000 |
) | ||
|
Repurchase of common shares for stock-based compensation plans |
|
(14,895 |
) |
(10,642 |
) | ||
|
Proceeds on exercise of stock options |
|
64,424 |
|
8,223 |
| ||
|
Common shares issued |
|
21,243 |
|
2,417 |
| ||
|
Cash used in financing activities |
|
(1,588 |
) |
(123,182 |
) | ||
|
Effect of exchange rate changes on cash and cash equivalents |
|
2,075 |
|
(5,912 |
) | ||
|
Net increase (decrease) in cash and cash equivalents during the period |
|
38,596 |
|
(39,531 |
) | ||
|
Cash and cash equivalents, beginning of period |
|
124,150 |
|
177,537 |
| ||
|
Cash and cash equivalents, end of period |
|
$ |
162,746 |
|
$ |
138,006 |
|
|
|
|
|
|
|
| ||
|
SUPPLEMENTAL CASH FLOW INFORMATION |
|
|
|
|
| ||
|
Interest paid |
|
$ |
8,880 |
|
$ |
11,081 |
|
|
|
|
|
|
|
| ||
|
Income and mining taxes paid |
|
$ |
53,317 |
|
$ |
37,947 |
|
AGNICO EAGLE MINES LIMITED
RECONCILIATION OF NON-GAAP FINANCIAL PERFORMANCE MEASURES
(thousands of United States dollars, except where noted)
(Unaudited)
Total Production Costs by Mine
|
|
|
Three Months Ended |
|
Three Months Ended |
| ||
|
(thousands of United States dollars) |
|
March 31, 2016 |
|
March 31, 2015 |
| ||
|
|
|
|
|
|
| ||
|
LaRonde mine |
|
$ |
45,854 |
|
$ |
45,865 |
|
|
Lapa mine |
|
12,784 |
|
13,985 |
| ||
|
Goldex mine |
|
15,732 |
|
14,866 |
| ||
|
Meadowbank mine |
|
52,210 |
|
57,096 |
| ||
|
Canadian Malartic mine(i) |
|
40,814 |
|
41,186 |
| ||
|
Kittila mine |
|
36,027 |
|
31,999 |
| ||
|
Pinos Altos mine |
|
23,856 |
|
24,212 |
| ||
|
Creston Mascota deposit at Pinos Altos |
|
5,781 |
|
5,606 |
| ||
|
La India mine |
|
10,915 |
|
12,465 |
| ||
|
Production costs per the interim condensed consolidated statements of income |
|
$ |
243,973 |
|
$ |
247,280 |
|
Reconciliation of Production Costs to Total Cash Costs per Ounce of Gold Produced(ii) by Mine and Reconciliation of Production Costs to Minesite Costs per Tonne(iii) by Mine
LaRonde Mine - Total Cash Costs per Ounce of Gold Produced(ii)
|
|
|
Three Months Ended |
|
Three Months Ended |
| ||
|
(thousands of United States dollars, except as noted) |
|
March 31, 2016 |
|
March 31, 2015 |
| ||
|
Production costs |
|
$ |
45,854 |
|
$ |
45,865 |
|
|
Adjustments: |
|
|
|
|
| ||
|
Inventory and other adjustments(iv) |
|
4,619 |
|
6,678 |
| ||
|
Cash operating costs (co-product basis) |
|
$ |
50,473 |
|
$ |
52,543 |
|
|
By-product metal revenues |
|
(10,646 |
) |
(11,134 |
) | ||
|
Cash operating costs (by-product basis) |
|
$ |
39,827 |
|
$ |
41,409 |
|
|
Gold production (ounces) |
|
75,337 |
|
58,893 |
| ||
|
Total cash costs per ounce of gold produced ($ per ounce)(ii): |
|
|
|
|
| ||
|
Co-product basis |
|
$ |
670 |
|
$ |
892 |
|
|
By-product basis |
|
$ |
529 |
|
$ |
703 |
|
LaRonde Mine - Minesite Costs per Tonne(iii)
|
|
|
Three Months Ended |
|
Three Months Ended |
| ||||
|
(thousands of United States dollars, except as noted) |
|
March 31, 2016 |
|
March 31, 2015 |
| ||||
|
Production costs |
|
$ |
45,854 |
|
$ |
45,865 |
| ||
|
Inventory and other adjustments(v) |
|
(2,357 |
) |
866 |
| ||||
|
Minesite operating costs |
|
$ |
43,497 |
|
$ |
46,731 |
| ||
|
Minesite operating costs (thousands of C$) |
|
C$ |
59,228 |
|
C$ |
57,789 |
| ||
|
Tonnes of ore milled (thousands of tonnes) |
|
577 |
|
558 |
| ||||
|
Minesite costs per tonne (C$)(iii) |
|
C$ |
103 |
|
C$ |
104 |
| ||
Lapa Mine - Total Cash Costs per Ounce of Gold Produced(ii)
|
|
|
Three Months Ended |
|
Three Months Ended |
| ||
|
(thousands of United States dollars, except as noted) |
|
March 31, 2016 |
|
March 31, 2015 |
| ||
|
Production costs |
|
$ |
12,784 |
|
$ |
13,985 |
|
|
Adjustments: |
|
|
|
|
| ||
|
Inventory and other adjustments(iv) |
|
1,727 |
|
749 |
| ||
|
Cash operating costs (co-product basis) |
|
$ |
14,511 |
|
$ |
14,734 |
|
|
By-product metal revenues |
|
(13 |
) |
(17 |
) | ||
|
Cash operating costs (by-product basis) |
|
$ |
14,498 |
|
$ |
14,717 |
|
|
Gold production (ounces) |
|
21,709 |
|
25,920 |
| ||
|
Total cash costs per ounce of gold produced ($ per ounce)(ii): |
|
|
|
|
| ||
|
Co-product basis |
|
$ |
668 |
|
$ |
568 |
|
|
By-product basis |
|
$ |
668 |
|
$ |
568 |
|
Lapa Mine - Minesite Costs per Tonne(iii)
|
|
|
Three Months Ended |
|
Three Months Ended |
| ||||
|
(thousands of United States dollars, except as noted) |
|
March 31, 2016 |
|
March 31, 2015 |
| ||||
|
Production costs |
|
$ |
12,784 |
|
$ |
13,985 |
| ||
|
Inventory and other adjustments(v) |
|
1,559 |
|
548 |
| ||||
|
Minesite operating costs |
|
$ |
14,343 |
|
$ |
14,533 |
| ||
|
Minesite operating costs (thousands of C$) |
|
C$ |
19,481 |
|
C$ |
18,077 |
| ||
|
Tonnes of ore milled (thousands of tonnes) |
|
161 |
|
152 |
| ||||
|
Minesite costs per tonne (C$)(iii) |
|
C$ |
121 |
|
C$ |
119 |
| ||
Goldex Mine - Total Cash Costs per Ounce of Gold Produced(ii)
|
|
|
Three Months Ended |
|
Three Months Ended |
| ||
|
(thousands of United States dollars, except as noted) |
|
March 31, 2016 |
|
March 31, 2015 |
| ||
|
Production costs |
|
$ |
15,732 |
|
$ |
14,866 |
|
|
Adjustments: |
|
|
|
|
| ||
|
Inventory and other adjustments(iv) |
|
624 |
|
973 |
| ||
|
Cash operating costs (co-product basis) |
|
$ |
16,356 |
|
$ |
15,839 |
|
|
By-product metal revenues |
|
(6 |
) |
(7 |
) | ||
|
Cash operating costs (by-product basis) |
|
$ |
16,350 |
|
$ |
15,832 |
|
|
Gold production (ounces) |
|
32,340 |
|
29,250 |
| ||
|
Total cash costs per ounce of gold produced ($ per ounce)(ii): |
|
|
|
|
| ||
|
Co-product basis |
|
$ |
506 |
|
$ |
542 |
|
|
By-product basis |
|
$ |
506 |
|
$ |
541 |
|
Goldex Mine - Minesite Costs per Tonne(iii)
|
|
|
Three Months Ended |
|
Three Months Ended |
| ||||
|
(thousands of United States dollars, except as noted) |
|
March 31, 2016 |
|
March 31, 2015 |
| ||||
|
Production costs |
|
$ |
15,732 |
|
$ |
14,866 |
| ||
|
Inventory and other adjustments(v) |
|
351 |
|
761 |
| ||||
|
Minesite operating costs |
|
$ |
16,083 |
|
$ |
15,627 |
| ||
|
Minesite operating costs (thousands of C$) |
|
C$ |
21,706 |
|
C$ |
19,317 |
| ||
|
Tonnes of ore milled (thousands of tonnes) |
|
636 |
|
566 |
| ||||
|
Minesite costs per tonne (C$)(iii) |
|
C$ |
34 |
|
C$ |
34 |
| ||
Meadowbank Mine - Total Cash Costs per Ounce of Gold Produced(ii)
|
|
|
Three Months Ended |
|
Three Months Ended |
| ||
|
(thousands of United States dollars, except as noted) |
|
March 31, 2016 |
|
March 31, 2015 |
| ||
|
Production costs |
|
$ |
52,210 |
|
$ |
57,096 |
|
|
Adjustments: |
|
|
|
|
| ||
|
Inventory and other adjustments(iv) |
|
5,446 |
|
2,541 |
| ||
|
Cash operating costs (co-product basis) |
|
$ |
57,656 |
|
$ |
59,637 |
|
|
By-product metal revenues |
|
(659 |
) |
(1,689 |
) | ||
|
Cash operating costs (by-product basis) |
|
$ |
56,997 |
|
$ |
57,948 |
|
|
Gold production (ounces) |
|
72,311 |
|
88,523 |
| ||
|
Total cash costs per ounce of gold produced ($ per ounce)(ii): |
|
|
|
|
| ||
|
Co-product basis |
|
$ |
797 |
|
$ |
674 |
|
|
By-product basis |
|
$ |
788 |
|
$ |
655 |
|
Meadowbank Mine - Minesite Costs per Tonne(iii)
|
|
|
Three Months Ended |
|
Three Months Ended |
| ||||
|
(thousands of United States dollars, except as noted) |
|
March 31, 2016 |
|
March 31, 2015 |
| ||||
|
Production costs |
|
$ |
52,210 |
|
$ |
57,096 |
| ||
|
Inventory and other adjustments(v) |
|
2,758 |
|
1,694 |
| ||||
|
Minesite operating costs |
|
$ |
54,968 |
|
$ |
58,790 |
| ||
|
Minesite operating costs (thousands of C$) |
|
C$ |
73,058 |
|
C$ |
70,627 |
| ||
|
Tonnes of ore milled (thousands of tonnes) |
|
946 |
|
990 |
| ||||
|
Minesite costs per tonne (C$)(iii) |
|
C$ |
77 |
|
C$ |
71 |
| ||
Canadian Malartic Mine - Total Cash Costs per Ounce of Gold Produced(i)(ii)
|
|
|
Three Months Ended |
|
Three Months Ended |
| ||
|
(thousands of United States dollars, except as noted) |
|
March 31, 2016 |
|
March 31, 2015 |
| ||
|
Production costs |
|
$ |
40,814 |
|
$ |
41,186 |
|
|
Adjustments: |
|
|
|
|
| ||
|
Inventory and other adjustments(iv) |
|
1,309 |
|
2,851 |
| ||
|
Cash operating costs (co-product basis) |
|
$ |
42,123 |
|
$ |
44,037 |
|
|
By-product metal revenues |
|
(1,095 |
) |
(1,142 |
) | ||
|
Cash operating costs (by-product basis) |
|
$ |
41,028 |
|
$ |
42,895 |
|
|
Gold production (ounces) |
|
73,613 |
|
67,893 |
| ||
|
Total cash costs per ounce of gold produced ($ per ounce)(ii): |
|
|
|
|
| ||
|
Co-product basis |
|
$ |
572 |
|
$ |
649 |
|
|
By-product basis |
|
$ |
557 |
|
$ |
632 |
|
Canadian Malartic Mine - Minesite Costs per Tonne(i)(iii)
|
|
|
Three Months Ended |
|
Three Months Ended |
| ||||
|
(thousands of United States dollars, except as noted) |
|
March 31, 2016 |
|
March 31, 2015 |
| ||||
|
Production costs |
|
$ |
40,814 |
|
$ |
41,186 |
| ||
|
Inventory and other adjustments(v) |
|
1,076 |
|
2,605 |
| ||||
|
Minesite operating costs |
|
$ |
41,890 |
|
$ |
43,791 |
| ||
|
Minesite operating costs (thousands of C$) |
|
C$ |
57,545 |
|
C$ |
54,320 |
| ||
|
Tonnes of ore milled (thousands of tonnes) |
|
2,380 |
|
2,339 |
| ||||
|
Minesite costs per tonne (C$)(iii) |
|
C$ |
24 |
|
C$ |
23 |
| ||
Kittila Mine - Total Cash Costs per Ounce of Gold Produced(ii)
|
|
|
Three Months Ended |
|
Three Months Ended |
| ||
|
(thousands of United States dollars, except as noted) |
|
March 31, 2016 |
|
March 31, 2015 |
| ||
|
Production costs |
|
$ |
36,027 |
|
$ |
31,999 |
|
|
Adjustments: |
|
|
|
|
| ||
|
Inventory and other adjustments(iv) |
|
(1,024 |
) |
(1,543 |
) | ||
|
Cash operating costs (co-product basis) |
|
$ |
35,003 |
|
$ |
30,456 |
|
|
By-product metal revenues |
|
(47 |
) |
(35 |
) | ||
|
Cash operating costs (by-product basis) |
|
$ |
34,956 |
|
$ |
30,421 |
|
|
Gold production (ounces) |
|
48,127 |
|
44,654 |
| ||
|
Total cash costs per ounce of gold produced ($ per ounce)(ii): |
|
|
|
|
| ||
|
Co-product basis |
|
$ |
727 |
|
$ |
682 |
|
|
By-product basis |
|
$ |
726 |
|
$ |
681 |
|
Kittila Mine - Minesite Costs per Tonne(iii)
|
|
|
Three Months Ended |
|
Three Months Ended |
| ||
|
(thousands of United States dollars, except as noted) |
|
March 31, 2016 |
|
March 31, 2015 |
| ||
|
Production costs |
|
$ |
36,027 |
|
$ |
31,999 |
|
|
Inventory and other adjustments(v) |
|
(1,197 |
) |
(1,659 |
) | ||
|
Minesite operating costs |
|
$ |
34,830 |
|
$ |
30,340 |
|
|
Minesite operating costs (thousands of €) |
|
€ |
31,109 |
|
€ |
26,714 |
|
|
Tonnes of ore milled (thousands of tonnes) |
|
432 |
|
345 |
| ||
|
Minesite costs per tonne (€)(iii) |
|
€ |
72 |
|
€ |
77 |
|
Pinos Altos Mine - Total Cash Costs per Ounce of Gold Produced(ii)
|
|
|
Three Months Ended |
|
Three Months Ended |
| ||
|
(thousands of United States dollars, except as noted) |
|
March 31, 2016 |
|
March 31, 2015 |
| ||
|
Production costs |
|
$ |
23,856 |
|
$ |
24,212 |
|
|
Adjustments: |
|
|
|
|
| ||
|
Inventory and other adjustments(iv) |
|
1,635 |
|
3,244 |
| ||
|
Cash operating costs (co-product basis) |
|
$ |
25,491 |
|
$ |
27,456 |
|
|
By-product metal revenues |
|
(8,972 |
) |
(9,579 |
) | ||
|
Cash operating costs (by-product basis) |
|
$ |
16,519 |
|
$ |
17,877 |
|
|
Gold production (ounces) |
|
48,117 |
|
50,106 |
| ||
|
Total cash costs per ounce of gold produced ($ per ounce)(ii): |
|
|
|
|
| ||
|
Co-product basis |
|
$ |
530 |
|
$ |
548 |
|
|
By-product basis |
|
$ |
343 |
|
$ |
357 |
|
Pinos Altos Mine - Minesite Costs per Tonne(iii)
|
|
|
Three Months Ended |
|
Three Months Ended |
| ||
|
(thousands of United States dollars, except as noted) |
|
March 31, 2016 |
|
March 31, 2015 |
| ||
|
Production costs |
|
$ |
23,856 |
|
$ |
24,212 |
|
|
Inventory and other adjustments(v) |
|
1,296 |
|
2,681 |
| ||
|
Minesite operating costs |
|
$ |
25,152 |
|
$ |
26,893 |
|
|
Tonnes of ore processed (thousands of tonnes) |
|
502 |
|
584 |
| ||
|
Minesite costs per tonne (US$)(iii) |
|
$ |
50 |
|
$ |
46 |
|
Creston Mascota deposit at Pinos Altos - Total Cash Costs per Ounce of Gold Produced(ii)
|
|
|
Three Months Ended |
|
Three Months Ended |
| ||
|
(thousands of United States dollars, except as noted) |
|
March 31, 2016 |
|
March 31, 2015 |
| ||
|
Production costs |
|
$ |
5,781 |
|
$ |
5,606 |
|
|
Adjustments: |
|
|
|
|
| ||
|
Inventory and other adjustments(iv) |
|
310 |
|
467 |
| ||
|
Cash operating costs (co-product basis) |
|
$ |
6,091 |
|
$ |
6,073 |
|
|
By-product metal revenues |
|
(782 |
) |
(547 |
) | ||
|
Cash operating costs (by-product basis) |
|
$ |
5,309 |
|
$ |
5,526 |
|
|
Gold production (ounces) |
|
11,551 |
|
12,448 |
| ||
|
Total cash costs per ounce of gold produced ($ per ounce)(ii): |
|
|
|
|
| ||
|
Co-product basis |
|
$ |
527 |
|
$ |
488 |
|
|
By-product basis |
|
$ |
460 |
|
$ |
444 |
|
Creston Mascota deposit at Pinos Altos - Minesite Costs per Tonne(iii)
|
|
|
Three Months Ended |
|
Three Months Ended |
| ||
|
(thousands of United States dollars, except as noted) |
|
March 31, 2016 |
|
March 31, 2015 |
| ||
|
Production costs |
|
$ |
5,781 |
|
$ |
5,606 |
|
|
Inventory and other adjustments(v) |
|
195 |
|
399 |
| ||
|
Minesite operating costs |
|
$ |
5,976 |
|
$ |
6,005 |
|
|
Tonnes of ore processed (thousands of tonnes) |
|
516 |
|
527 |
| ||
|
Minesite costs per tonne (US$)(iii) |
|
$ |
12 |
|
$ |
11 |
|
La India Mine - Total Cash Costs per Ounce of Gold Produced(ii)
|
|
|
Three Months Ended |
|
Three Months Ended |
| ||
|
(thousands of United States dollars, except as noted) |
|
March 31, 2016 |
|
March 31, 2015 |
| ||
|
Production costs |
|
$ |
10,915 |
|
$ |
12,465 |
|
|
Adjustments: |
|
|
|
|
| ||
|
Inventory and other adjustments(iv) |
|
1,054 |
|
(245 |
) | ||
|
Cash operating costs (co-product basis) |
|
$ |
11,969 |
|
$ |
12,220 |
|
|
By-product metal revenues |
|
(1,796 |
) |
(1,132 |
) | ||
|
Cash operating costs (by-product basis) |
|
$ |
10,173 |
|
$ |
11,088 |
|
|
Gold production (ounces) |
|
28,231 |
|
26,523 |
| ||
|
Total cash costs per ounce of gold produced ($ per ounce)(ii): |
|
|
|
|
| ||
|
Co-product basis |
|
$ |
424 |
|
$ |
461 |
|
|
By-product basis |
|
$ |
360 |
|
$ |
418 |
|
La India Mine - Minesite Costs per Tonne(iii)
|
|
|
Three Months Ended |
|
Three Months Ended |
| ||
|
(thousands of United States dollars, except as noted) |
|
March 31, 2016 |
|
March 31, 2015 |
| ||
|
Production costs |
|
$ |
10,915 |
|
$ |
12,465 |
|
|
Inventory and other adjustments(v) |
|
819 |
|
(409 |
) | ||
|
Minesite operating costs |
|
$ |
11,734 |
|
$ |
12,056 |
|
|
Tonnes of ore processed (thousands of tonnes) |
|
1,396 |
|
1,378 |
| ||
|
Minesite costs per tonne (US$)(iii) |
|
$ |
8 |
|
$ |
9 |
|
Notes:
|
(i) |
On June 16, 2014, Agnico Eagle and Yamana jointly acquired 100.0% of Osisko by way of the Arrangement. As a result of the Arrangement, Agnico Eagle and Yamana each indirectly own 50.0% of CMC and the Partnership, which now holds the Canadian Malartic mine. The information set out in this table reflects the Company’s 50.0% interest in the Canadian Malartic mine. |
|
|
|
|
(ii) |
Total cash costs per ounce of gold produced is not a recognized measure under IFRS and this data may not be comparable to data reported by other gold producers. Total cash costs per ounce of gold produced is reported on both a by-product basis (deducting by-product metal revenues from production costs) and co-product basis (before by-product metal revenues). Total cash costs per ounce of gold produced on a by-product basis is calculated by adjusting production costs as recorded in the interim condensed consolidated statements of income for by-product metal revenues, unsold concentrate inventory production costs, smelting, refining and marketing charges and other adjustments, and then dividing by the number of ounces of gold produced. Total cash costs per ounce of gold produced on a co-product basis is calculated in the same manner as total cash costs per ounce of gold produced on a by-product basis except that no adjustment for by-product metal revenues is made. The calculation of total cash costs per ounce of gold produced on a co-product basis does not reflect a reduction in production costs or smelting, refining and marketing charges associated with the production and sale of by-product metals. The Company believes that these generally accepted industry measures provide a realistic indication of operating performance and provide useful comparison points between periods. Total cash costs per ounce of gold produced is intended to provide information about the cash generating capabilities of the Company’s mining operations. Management also uses these measures to monitor the performance of the Company’s mining operations. As market prices for gold are quoted on a per ounce basis, using the total cash costs per ounce of gold produced on a by-product basis measure allows management to assess a mine’s cash generating capabilities at various gold prices. Management is aware |
|
|
that these per ounce measures of performance can be affected by fluctuations in exchange rates and, in the case of total cash costs of gold produced on a by-product basis, by-product metal prices. Management compensates for these inherent limitations by using these measures in conjunction with minesite costs per tonne (discussed below) as well as other data prepared in accordance with IFRS. Management also performs sensitivity analyses in order to quantify the effects of fluctuating metal prices and exchange rates. |
|
|
|
|
(iii) |
Minesite costs per tonne is not a recognized measure under IFRS and this data may not be comparable to data reported by other gold producers. This measure is calculated by adjusting production costs as shown in the interim condensed consolidated statements of income for unsold concentrate inventory production costs, and then dividing by tonnes of ore milled. As the total cash costs per ounce of gold produced measure can be affected by fluctuations in by-product metal prices and exchange rates, management believes that the minesite costs per tonne measure provides additional information regarding the performance of mining operations, eliminating the impact of varying production levels. Management also uses this measure to determine the economic viability of mining blocks. As each mining block is evaluated based on the net realizable value of each tonne mined, in order to be economically viable the estimated revenue on a per tonne basis must be in excess of the minesite costs per tonne. Management is aware that this per tonne measure of performance can be impacted by fluctuations in processing levels and compensates for this inherent limitation by using this measure in conjunction with production costs prepared in accordance with IFRS. |
|
|
|
|
(iv) |
Under the Company’s revenue recognition policy, revenue is recognized on concentrates when legal title and risk is transferred. As total cash costs per ounce of gold produced are calculated on a production basis, an inventory adjustment is made to reflect the sales margin on the portion of concentrate production not yet recognized as revenue. Other adjustments include the addition of smelting, refining and marketing charges to production costs. |
|
|
|
|
(v) |
This inventory and other adjustment reflects production costs associated with unsold concentrates. |
Reconciliation of Production Costs to All-in Sustaining Costs per Ounce of Gold Produced
|
|
|
Three Months Ended |
|
Three Months Ended |
| ||
|
(United States dollars per ounce of gold produced, except where noted) |
|
March 31, 2016 |
|
March 31, 2015 |
| ||
|
Production costs per the interim condensed consolidated statements of income (thousands of United States dollars) |
|
$ |
243,973 |
|
$ |
247,280 |
|
|
Gold production (ounces) |
|
411,336 |
|
404,210 |
| ||
|
Production costs per ounce of gold production |
|
$ |
593 |
|
$ |
612 |
|
|
Adjustments: |
|
|
|
|
| ||
|
Inventory and other adjustments(i) |
|
38 |
|
39 |
| ||
|
Total cash costs per ounce of gold produced (co-product basis)(ii) |
|
$ |
631 |
|
$ |
651 |
|
|
By-product metal revenues |
|
(58 |
) |
(63 |
) | ||
|
Total cash costs per ounce of gold produced (by-product basis)(ii) |
|
$ |
573 |
|
$ |
588 |
|
|
Adjustments: |
|
|
|
|
| ||
|
Sustaining capital expenditures (including capitalized exploration) |
|
161 |
|
150 |
| ||
|
General and administrative expenses (including stock options) |
|
60 |
|
63 |
| ||
|
Non-cash reclamation provision and other |
|
3 |
|
3 |
| ||
|
All-in sustaining costs per ounce of gold produced (by-product basis) |
|
$ |
797 |
|
$ |
804 |
|
|
By-product metal revenues |
|
58 |
|
63 |
| ||
|
All-in sustaining costs per ounce of gold produced (co-product basis) |
|
$ |
855 |
|
$ |
867 |
|
Notes:
(i) Under the Company’s revenue recognition policy, revenue is recognized on concentrates when legal title and risk is transferred. As total cash costs per ounce of gold produced are calculated on a production basis, this inventory adjustment reflects the sales margin on the portion of concentrate production not yet recognized as revenue.
(ii) Total cash costs per ounce of gold produced is not a recognized measure under IFRS and this data may not be comparable to data reported by other gold producers. Total cash costs per ounce of gold produced is reported on both a by-product basis (deducting by-product metal revenues from production costs) and co-product basis (before by-product metal revenues). Total cash costs per ounce of gold produced on a by-product basis is calculated by adjusting production costs as recorded in the interim condensed consolidated statements of income for by-product metal revenues, unsold concentrate inventory production costs, smelting, refining and marketing charges and other adjustments, and then dividing by the number of ounces of gold produced. Total cash costs per ounce of gold produced on a co-product basis is calculated in the same manner as total cash costs per ounce of gold produced on a by-product basis except that no adjustment for by-product metal revenues is made. Accordingly, the calculation of total cash costs per ounce of gold produced on a co-product basis does not reflect a reduction in production costs or smelting, refining and marketing charges associated with the production and sale of by-product metals. The Company believes that these generally accepted industry measures provide a realistic indication of operating performance and provide useful comparison points between periods. Total cash costs per ounce of gold produced is intended to provide information about the cash generating capabilities of the Company’s mining operations. Management also uses these measures to monitor the performance of the Company’s mining operations. As market prices for gold are quoted on a per ounce basis, using the total cash costs per ounce of gold produced on a by-product basis measure allows management to assess a mine’s cash generating capabilities at various gold prices. Management is aware that these per ounce measures of performance can be affected by fluctuations in exchange rates and, in the case of total cash costs of gold produced on a by-product basis, by-product metal prices. Management compensates for these inherent limitations by using these measures in conjunction with minesite costs per tonne as well as other data prepared in accordance with IFRS. Management also performs sensitivity analyses in order to quantify the effects of fluctuating metal prices and exchange rates.
Serious News for Serious Traders! Try StreetInsider.com Premium Free!
You May Also Be Interested In
- Agnico-Eagle Mines Ltd. (AEM:CN) (AEM) PT Raised to Cdn$104 at Stifel Canada
- New Jersey Natural Gas to Reduce Fleet Emissions with Neste MY Renewable Diesel
- AEVEX Aerospace to Debut Atlas Loitering Munition at 2024 Army Aviation Mission Solutions Summit
Create E-mail Alert Related Categories
SEC FilingsSign up for StreetInsider Free!
Receive full access to all new and archived articles, unlimited portfolio tracking, e-mail alerts, custom newswires and RSS feeds - and more!
