

Form 8-K OMNICOM GROUP INC. For: Apr 19
 Tweet
Tweet Share
ShareUNITED STATES
SECURITIES AND EXCHANGE COMMISSION
Washington, DC 20549
FORM 8-K
Current Report
PURSUANT TO SECTION 13 OR 15(d) OF THE
SECURITIES EXCHANGE ACT OF 1934
Date of Report (Date of earliest event reported): April 19, 2016
OMNICOM GROUP INC.
(Exact Name of Registrant as Specified in its Charter)
|
New York (State or other jurisdiction |
1-10551 (Commission |
13-1514814 (IRS Employer |
|
437 Madison Avenue, New York, NY (Address of principal executive offices) |
10022 (Zip Code) |
Registrant’s telephone number, including area code: (212) 415-3600
Not Applicable
(Former name or former address, if changed since last report)
Check the appropriate box below if the Form 8-K filing is intended to simultaneously satisfy the filing obligation of the registrant under any of the following provisions (see General Instruction A.2. below):
| ¨ | Written communications pursuant to Rule 425 under the Securities Act (17 CFR 230.425) |
| ¨ | Soliciting material pursuant to Rule 14a-12 under the Exchange Act (17 CFR 240.14a-12) |
| ¨ | Pre-commencement communications pursuant to Rule 14d-2(b) under the Exchange Act (17 CFR 240.14d-2(b)) |
| ¨ | Pre-commencement communications pursuant to Rule 13e-4(c) under the Exchange Act (17 CFR 240.13e-4(c)) |
Item 2.02 Results of Operations and Financial Condition.
On April 19, 2016, Omnicom Group Inc. (“Omnicom” or the “Company”) published an earnings release reporting its financial results for the three months ended March 31, 2016. A copy of the earnings release is attached as Exhibit 99.1 hereto and is incorporated by reference herein. Following the publication of the earnings release, Omnicom hosted an earnings call in which its financial results were discussed. The investor presentation materials used for the call are attached as Exhibit 99.2 hereto and are incorporated by reference herein.
On April 19, 2016, Omnicom posted the materials attached as Exhibits 99.1 and 99.2 on its web site (www.omnicomgroup.com).
Certain statements in the exhibits to this Current Report on Form 8-K constitute forward-looking statements, including statements within the meaning of the Private Securities Litigation Reform Act of 1995. In addition, from time to time, the Company or its representatives have made, or may make, forward-looking statements, orally or in writing. These statements may discuss goals, intentions and expectations as to future plans, trends, events, results of operations or financial condition, or otherwise, based on current beliefs of the Company’s management as well as assumptions made by, and information currently available to, the Company’s management. Forward-looking statements may be accompanied by words such as “aim,” “anticipate,” “believe,” “plan,” “could,” “should,” “would,” “estimate,” “expect,” “forecast,” “future,” “guidance,” “intend,” “may,” “will,” “possible,” “potential,” “predict,” “project” or similar words, phrases or expressions. These forward-looking statements are subject to various risks and uncertainties, many of which are outside the Company’s control. Therefore, you should not place undue reliance on such statements. Factors that could cause actual results to differ materially from those in the forward-looking statements include: international, national or local economic conditions that could adversely affect the Company or its clients; losses on media purchases and production costs incurred on behalf of clients; reductions in client spending, a slowdown in client payments and a deterioration in the credit markets; ability to attract new clients and retain existing clients in the manner anticipated; changes in client advertising, marketing and corporate communications requirements; failure to manage potential conflicts of interest between or among clients; unanticipated changes relating to competitive factors in the advertising, marketing and corporate communications industries; ability to hire and retain key personnel; currency exchange rate fluctuations; reliance on information technology systems; changes in legislation or governmental regulations affecting the Company or its clients; risks associated with assumptions the Company makes in connection with its critical accounting estimates and legal proceedings; and the Company’s international operations, which are subject to the risks of currency repatriation restrictions, social or political conditions and regulatory environment. The foregoing list of factors is not exhaustive. You should carefully consider the foregoing factors and the other risks and uncertainties that may affect the Company’s business, including those described under “Risk Factors” in Omnicom's Annual Report on Form 10-K for the year ended December 31, 2015 and other documents filed from time to time with the SEC. Except as required under applicable law, the Company does not assume any obligation to update these forward-looking statements.
The foregoing information (including the exhibits hereto) is being furnished and shall not be deemed “filed” for purposes of Section 18 of the Securities Exchange Act of 1934, as amended, or otherwise subject to the liabilities of that section, nor shall it be deemed incorporated by reference in any filing under the Securities Act of 1933, as amended, except as expressly set forth by specific reference in such filing.
Item 9.01. Financial Statements and Exhibits.
(d) Exhibits.
|
Exhibit |
Description |
| 99.1 | Earnings release dated April 19, 2016. |
| 99.2 |
Investor presentation materials dated April 19, 2016.
|
SIGNATURES
Pursuant to the requirements of the Securities Exchange Act of 1934, the registrant has duly caused this report to be signed on its behalf by the undersigned hereunto duly authorized.
| Omnicom Group Inc. | |||
| By: | /s/ Andrew L. Castellaneta | ||
| Name: | Andrew L. Castellaneta | ||
| Title: | Senior Vice President, | ||
| Chief Accounting Officer | |||
Date: April 19, 2016
EXHIBIT INDEX
|
Exhibit |
Description |
| 99.1 | Earnings release dated April 19, 2016. |
| 99.2 |
Investor presentation materials dated April 19, 2016. |
Exhibit 99.1

FOR IMMEDIATE RELEASE
Omnicom Group Reports First Quarter 2016 Results
NEW YORK, April 19, 2016 - Omnicom Group Inc. (NYSE: OMC) today announced that its diluted net income per common share in the first quarter of 2016 increased seven cents, or 8.4%, to $0.90 per share versus $0.83 per share during the first quarter of 2015.
Omnicom’s worldwide revenue in the first quarter of 2016 increased 0.9% to $3,499.1 million from $3,469.2 million in the first quarter of 2015. The components of the change in revenue included an increase in revenue from organic growth of 3.8%, a decrease in revenue from acquisitions, net of dispositions of 0.1% and a decrease in revenue from the negative impact of foreign exchange rates of 2.8% when compared to 2015.
Across our regional markets, organic revenue in the first quarter of 2016 increased 4.5% in North America, 2.2% in the United Kingdom, 3.0% in the Euro Markets & Other Europe, 5.1% in Asia Pacific and 1.7% in Africa & the Middle East, while organic revenue decreased 7.8% in Latin America when compared to the same quarter of 2015.
The change in organic revenue in the first quarter of 2016 as compared to the first quarter of 2015 in our four fundamental disciplines was as follows: advertising increased 7.9%, CRM decreased 0.7%, public relations decreased 0.9% and specialty communications increased 2.2%.
For the first quarter of 2016, Omnicom’s earnings before interest, taxes and amortization of intangibles (“EBITA”), a non-GAAP financial measure, increased $15.4 million, or 3.8%, to $420.4 million from $405.0 million in the first quarter of 2015. Our EBITA margin increased to 12.0% for the first quarter of 2016 versus 11.7% in the first quarter of 2015.
Operating income in the first quarter of 2016 increased $14.4 million, or 3.8%, to $392.1 million from $377.7 million in the
437 Madison Avenue, New York, NY 10022 (212) 415-3600 Fax (212) 415-3530
Omnicom Group Inc.
first quarter of 2015. Our operating margin in the first quarter of 2016 increased to 11.2% versus 10.9% in the first quarter of 2015.
For the first quarter of 2016, our income tax rate was 32.8%, which was unchanged versus the income tax rate for the first quarter of 2015.
Net income for the first quarter of 2016 increased $9.3 million, or 4.4%, to $218.4 million from $209.1 million in the first quarter of 2015.
Omnicom Group Inc. (NYSE: OMC) (www.omnicomgroup.com) is a leading global marketing and corporate communications company. Omnicom’s branded networks and numerous specialty firms provide advertising, strategic media planning and buying, digital and interactive marketing, direct and promotional marketing, public relations and other specialty communications services to over 5,000 clients in more than 100 countries. Follow us on Twitter for the latest news.
For a live webcast and/or a replay of our first quarter earnings conference call, go to http://investor.omnicomgroup.com/investor-relations/news-events-and-filings.
Contacts
| Investor Relations: | Media: |
| Shub Mukherjee, 212-415-3011 | Joanne Trout, 212-415-3669 |
| [email protected] | [email protected] |
Page 2
Omnicom Group Inc.
Condensed Consolidated Statements of Income
Three Months Ended March 31
(Unaudited)
(Dollars in Millions, Except Per Share Data)
| 2016 | 2015 | |||||||
| Revenue | $ | 3,499.1 | $ | 3,469.2 | ||||
| Operating Expenses, excluding amortization of intangibles | 3,078.7 | 3,064.2 | ||||||
| EBITA (a) | 420.4 | 405.0 | ||||||
| Less: Amortization of Intangibles | 28.3 | 27.3 | ||||||
| Operating Income | 392.1 | 377.7 | ||||||
| Net Interest Expense | 40.1 | 34.2 | ||||||
| Income before income taxes | 352.0 | 343.5 | ||||||
| Income tax expense | 115.5 | 112.7 | ||||||
| Income (Loss) from equity method investments | (0.2 | ) | (1.0 | ) | ||||
| Net income | 236.3 | 229.8 | ||||||
| Less: Net income allocated to noncontrolling interests | 17.9 | 20.7 | ||||||
| Net income - Omnicom Group Inc. | 218.4 | 209.1 | ||||||
| Less: Net income allocated to participating securities | 1.5 | 2.8 | ||||||
| Net income available for common shares | $ | 216.9 | $ | 206.3 | ||||
| Net income per common share - Omnicom Group Inc. | ||||||||
| Basic | $ | 0.90 | $ | 0.84 | ||||
| Diluted | $ | 0.90 | $ | 0.83 | ||||
| Weighted average shares (in millions) | ||||||||
| Basic | 240.0 | 246.4 | ||||||
| Diluted | 241.1 | 247.4 | ||||||
| Dividend declared per common share | $ | 0.50 | $ | 0.50 |
| (a) | EBITA (defined as Earnings before interest, taxes and amortization of intangibles) is a non-GAAP measure. We use EBITA as an additional operating performance measure, which excludes the non-cash amortization expense of acquired intangible assets. We believe that EBITA is a useful measure to evaluate the performance of our businesses. Non-GAAP financial measures should not be considered in isolation from, or as a substitute for, financial information presented in compliance with U.S. GAAP. Non-GAAP financial measures reported by us may not be comparable to similarly titled amounts reported by other companies. |
Page 3
Exhibit 99.2

First Quarter 2016 Results April 19, 2016 Investor Presentation

2016 vs. 2015 P&L Summary – First Quarter 1 April 19, 2016 (a) EBITA is a non - GAAP financial measure. See page 22 for the definition of this measure and page 18 for the reconciliation of non - GAAP measures . 2016 2015 Revenue 3,499.1$ 3,469.2$ EBITA (a) 420.4 405.0 Margin % 12.0% 11.7% Amortization of Intangibles 28.3 27.3 Operating Income 392.1$ 377.7$ Margin % 11.2% 10.9% First Quarter

2016 vs. 2015 P&L Summary – First Quarter 2 April 19, 2016 2016 2015 Operating Income 392.1$ 377.7$ Net Interest Expense 40.1 34.2 Income Taxes 115.5 112.7 Tax Rate % 32.8% 32.8% Loss from Equity Method Investments (0.2) (1.0) Noncontrolling Interests 17.9 20.7 Net Income - Omnicom Group 218.4$ 209.1$ First Quarter

2016 vs. 2015 Earnings Per Share – First Quarter 3 April 19, 2016 2016 2015 Net Income - Omnicom Group 218.4$ 209.1$ Net Income allocated to Participating Securities (1.5) (2.8) Net Income available for common shares 216.9$ 206.3$ Diluted Shares (millions) 241.1 247.4 EPS - Diluted 0.90$ 0.83$ Dividend Declared per Share 0.50$ 0.50$ First Quarter

2016 Total Revenue Change 4 April 19, 2016 $ % ∆ Prior Period Revenue $ 3,469.2 Foreign Exchange (FX) Impact (a) (96.6) -2.8% Acquisition/Disposition Revenue (b) (4.2) -0.1% Organic Revenue (c) 130.7 3.8% Current Period Revenue $ 3,499.1 0.9% First Quarter (a) The FX Impact is calculated by translating the current period’s local currency revenue using the prior period average exchange rates to derive current period constant currency revenue. The FX impact is the difference between the current period revenue in U.S. Dollars and the current period constant currency revenue. (b) Acquisition/Disposition revenue is calculated by aggregating the prior period revenue of the acquired businesses, less the prior period revenue of any business that was disposed of in the current period . (c) Organic revenue is calculated by subtracting both the Acquisition/Disposition revenue and the FX impact from total revenue growth.
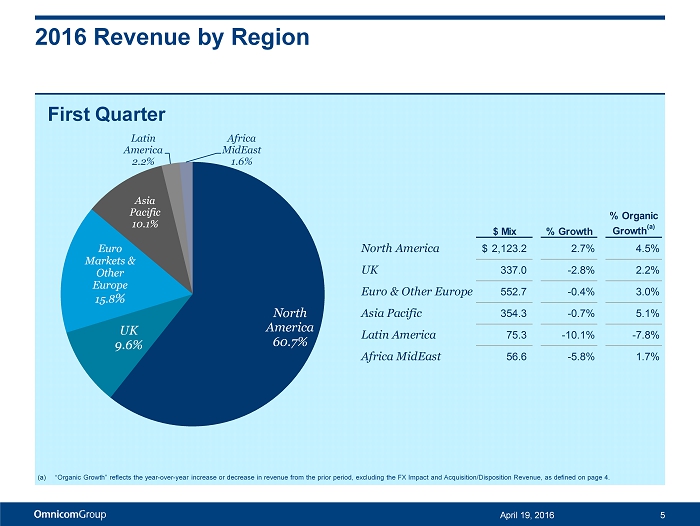
2016 Revenue by Region 5 First Quarter April 19, 2016 $ Mix % Growth % Organic Growth (a) North America 2,123.2$ 2.7% 4.5% UK 337.0 -2.8% 2.2% Euro & Other Europe 552.7 -0.4% 3.0% Asia Pacific 354.3 -0.7% 5.1% Latin America 75.3 -10.1% -7.8% Africa MidEast 56.6 -5.8% 1.7% (a) “Organic Growth” reflects the year - over - year increase or decrease in revenue from the prior period, excluding the FX Impact and Acquisition/Disposition Revenue, as defined on page 4. North America 60.7% UK 9.6% Euro Markets & Other Europe 15.8 % Asia Pacific 10.1% Latin America 2.2% Africa MidEast 1.6%

2016 Revenue by Discipline April 19, 2016 6 First Quarter $ Mix % Growth % Organic Growth (a) Advertising $ 1,803.1 4.0% 7.9% CRM 1,120.5 -3.2% -0.7% PR 318.8 -1.5% -0.9% Specialty 256.7 1.1% 2.2% (a) “Organic Growth” reflects the year - over - year increase or decrease in revenue from the prior period, excluding the FX Impact and Net Acquisitions revenue, as defined on page 4. Specialty 7.4% PR 9.1% CRM 32.0% Advertising 51.5%

Revenue by Industry April 19, 2016 7 Auto 8% Consumer Products 10% Financial Services 7% Food & Beverage 13% Other 23% Pharma & Health 12% Retail 6% Tech 10% Telcom 4% T&E 7% Auto 8% Consumer Products 9% Financial Services 7% Food & Beverage 13% Other 25% Pharma & Health 11% Retail 7% Tech 9% Telcom 5% T&E 6% First Quarter – 2016 First Quarter – 2015
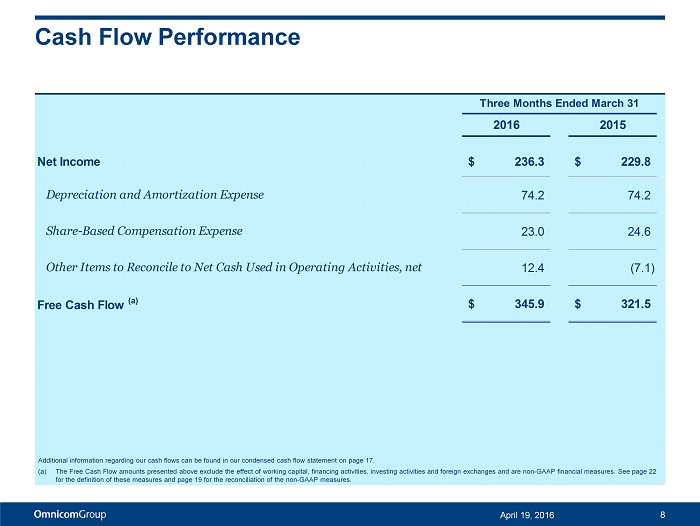
Cash Flow Performance 8 April 19, 2016 2016 2015 Net Income 236.3$ 229.8$ Depreciation and Amortization Expense 74.2 74.2 Share-Based Compensation Expense 23.0 24.6 Other Items to Reconcile to Net Cash Used in Operating Activities, net 12.4 (7.1) Free Cash Flow (a) 345.9$ 321.5$ Three Months Ended March 31 Additional information regarding our cash flows can be found in our condensed cash flow statement on page 17. (a) The Free Cash Flow amounts presented above exclude the effect of working capital, financing activities, investing activities and foreign exchanges and are non - GAAP financial measures. See page 22 for the definition of these measures and page 19 for the reconciliation of the non - GAAP measures.
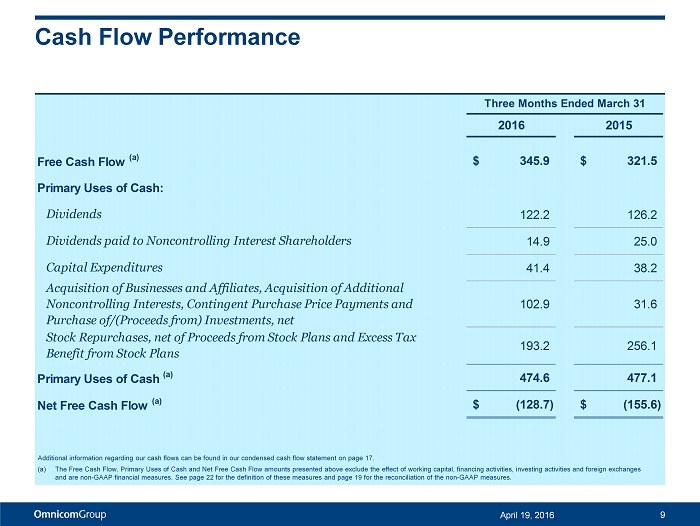
Cash Flow Performance 9 April 19, 2016 2016 2015 Free Cash Flow (a) 345.9$ 321.5$ Primary Uses of Cash: Dividends 122.2 126.2 Dividends paid to Noncontrolling Interest Shareholders 14.9 25.0 Capital Expenditures 41.4 38.2 Acquisition of Businesses and Affiliates, Acquisition of Additional Noncontrolling Interests, Contingent Purchase Price Payments and Purchase of/(Proceeds from) Investments, net 102.9 31.6 Stock Repurchases, net of Proceeds from Stock Plans and Excess Tax Benefit from Stock Plans 193.2 256.1 Primary Uses of Cash (a) 474.6 477.1 Net Free Cash Flow (a) (128.7)$ (155.6)$ Three Months Ended March 31 Additional information regarding our cash flows can be found in our condensed cash flow statement on page 17. (a) The Free Cash Flow, Primary Uses of Cash and Net Free Cash Flow amounts presented above exclude the effect of working capital, financing activities, investing activities and foreign exchang es and are non - GAAP financial measures. See page 22 for the definition of these measures and page 19 for the reconciliation of the non - GAAP measures.

Current Credit Picture 10 April 19, 2016 (a) EBITDA is a non - GAAP financial measure. See page 22 for the definition of this measure and page 18 for the reconciliation of no n - GAAP measures. (b) Net Debt is a non - GAAP financial measure. See page 22 for the definition of this measure. (c) On April 6, 2016, the Company issued $1.4 billion principal amount of 3.60% Senior Notes due April 15, 2026, with an effective interest rate of 4.05% per annum. A portion of the net proceeds were used to retire our outstanding $1 billion 5.9% Senior Notes, which had an effective interest rate of 5.25%, when they matured on April 15, 2016. See pages 14 and 15 for additional information on our Senior Notes. 2016 2015 EBITDA (a) $ 2,225.6 $ 2,236.8 Gross Interest Expense 187.8 173.1 EBITDA / Gross Interest Expense 11.9 x 12.9 x Total Debt / EBITDA 2.1 x 2.1 x Net Debt (b) / EBITDA 1.3 x 1.4 x Debt Bank Loans (Due Less Than 1 Year) $ 39 $ 10 CP & Borrowings Issued Under Revolver - - Convertible Notes - - Senior Notes (c) 4,500 4,500 Other Debt 113 74 Total Debt $ 4,652 $ 4,584 Cash and Short Term Investments 1,750 1,532 Net Debt (b) $ 2,902 $ 3,052 Twelve Months Ended March 31

Historical Returns 11 April 19, 2016 Return on Invested Capital (ROIC) (a) : Twelve Months Ended March 31, 2016 19.3% Twelve Months Ended March 31, 2015 18.9% Return on Equity (b) : 15 Twelve Months Ended March 31, 2016 46.3% Twelve Months Ended March 31, 2015 36.3% (a) Return on Invested Capital is After Tax Reported Operating Income (a non - GAAP measure – see page 22 for the definition of this m easure and page 19 for the reconciliation of non - GAAP measures) divided by the average of Invested Capital at the beginning and the end of the period (book value of all long - term liabilities and short - term interest bearing debt plus shareholders’ equity less cash, cash equivalents and short term investments). On December 31, 2015, we retrospectively adopted ASU 2015 - 03 and ASU 2015 - 17. The ROIC ratio presented for 2015 has been calculated as if we had adopted the two ASUs for the periods impacting the calculation . (b) Return on Equity is Reported Net Income for the given period divided by the average of shareholders’ equity at the beginning and end of the period.

Net Cash Returned to Shareholders through Dividends and Share Repurchases 12 April 19, 2016 0.6 0.7 1.0 1.2 1.6 2.0 2.4 2.9 3.0 2.6 2.6 3.8 4.5 5.4 5.9 7.0 7.7 7.9 $0.9 $1.8 $2.8 $3.6 $4.5 $5.4 $6.4 $7.4 $8.5 $9.6 $9.8 111% 92% 106% 106% 110% 107% 110% 110% 111% $- $2.0 $4.0 $6.0 $8.0 $10.0 $12.0 2006 2007 2008 2009 2010 2011 2012 2013 2014 2015 Q1 2016 Cumulative Cost of Net Shares Repurchased - Payments for repurchases of common stock less proceeds from stock plans. Cumulative Dividends Paid Cumulative Net Income - Omnicom Group Inc. % of Cumulative Net Income Returned to Shareholders - Cumulative Dividends Paid plus Cumulative Cost of Net Shares Repurchased divided by Cumulative Net Income. 120% 142% From 2006 through March 31, 2016, Omnicom distributed over 110% of Net Income to shareholders through Dividends and Share Repurchases . $ In Billions

Supplemental Financial Information April 19, 2016 13

Omnicom Debt Structure Bank Loans $39 2024 Senior Notes $750 2022 Senior Notes $1,250 2020 Senior Notes $1,000 2019 Senior Notes $500 2016 Senior Notes $1,000 14 April 19, 2016 The above chart sets forth Omnicom’s debt outstanding at March 31, 2016. The amounts reflected above for the 2016, 2019, 2020, 2022 and 2024 Senior Notes represent the principal amount of these notes at maturity on April 15, 2016, July 15, 2019, August 15, 2020, May 1, 2022 and November 1, 2024, respectively. On April 6, 2016, the Company issued $1.4 billion principal amount of 3.60% Senior Notes due April 15, 2026, with an effectiv e i nterest rate of 4.05% per annum. A portion of the net proceeds were used to retire our outstanding $1 billion 5.9% Senior Notes, which had an effective interest rate of 5.25%, when they matured on Ap ril 15, 2016.

Omnicom Debt Maturity Profile 15 April 19, 2016 The above chart sets forth Omnicom’s debt maturity profile at March 31, 2016. On April 6, 2016, the Company issued $1.4 billion principal amount of 3.60% Senior Notes due April 15, 2026, wit h an effective interest rate of 4.05% per annum. A portion of the net proceeds were used to retire our outstanding $1 billion 5.9% Senior Notes, which had an effec tiv e interest rate of 5.25%, when they matured on April 15, 2016. Other borrowings at March 31, 2016 include short - term borrowings of $39 million which are due in less than one year. For purposes of this presentation we have included these borrowings as outstandi ng through July 31, 2020, the date of expiration of our five - year credit facility. $0 $250 $500 $750 $1,000 $1,250 2016 Senior Notes Other Borrowings 2019 Senior Notes 2022 Senior Notes 2020 Senior Notes 2024 Senior Notes

2016 Acquisition Related Expenditures 16 April 19, 2016 (a) Includes acquisitions of a majority interest in agencies resulting in their consolidation, including additional interest in e xis ting affiliate agencies resulting in majority ownership. (b) Includes the acquisition of additional equity interests in already consolidated subsidiary agencies which are recorded to Equ ity – Noncontrolling Interest. (c) Includes additional consideration paid for acquisitions completed in prior periods. (d) Total Acquisition Expenditures figure is net of cash acquired. Year to Date Acquisition of Businesses and Affiliates (a) 86.6$ Acquisition of Additional Noncontrolling Interests (b) 19.8 Contingent Purchase Price Payments (c) 8.2 Total Acquisition Expenditures (d) 114.6$
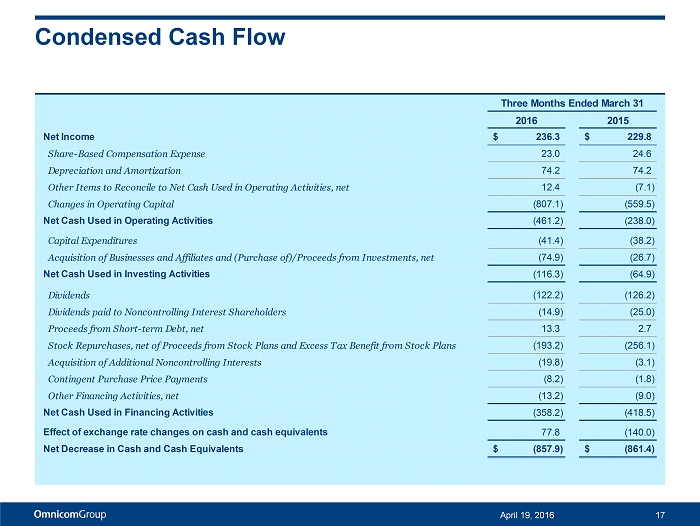
Condensed Cash Flow 17 April 19, 2016 2016 2015 Net Income 236.3$ 229.8$ Share-Based Compensation Expense 23.0 24.6 Depreciation and Amortization 74.2 74.2 Other Items to Reconcile to Net Cash Used in Operating Activities, net 12.4 (7.1) Changes in Operating Capital (807.1) (559.5) Net Cash Used in Operating Activities (461.2) (238.0) Capital Expenditures (41.4) (38.2) Acquisition of Businesses and Affiliates and (Purchase of)/Proceeds from Investments, net (74.9) (26.7) Net Cash Used in Investing Activities (116.3) (64.9) Dividends (122.2) (126.2) Dividends paid to Noncontrolling Interest Shareholders (14.9) (25.0) Proceeds from Short-term Debt, net 13.3 2.7 Stock Repurchases, net of Proceeds from Stock Plans and Excess Tax Benefit from Stock Plans (193.2) (256.1) Acquisition of Additional Noncontrolling Interests (19.8) (3.1) Contingent Purchase Price Payments (8.2) (1.8) Other Financing Activities, net (13.2) (9.0) Net Cash Used in Financing Activities (358.2) (418.5) Effect of exchange rate changes on cash and cash equivalents 77.8 (140.0) Net Decrease in Cash and Cash Equivalents (857.9)$ (861.4)$ Three Months Ended March 31

Reconciliation of Non - GAAP Measures 18 April 19, 2016 The above reconciles EBITDA and EBITA to the GAAP financial measures for the periods presented. See page 22 for the definitio n o f these measures. EBITDA and EBITA are non - GAAP financial measures within the meaning of applicable SEC rules and regulations. Our credit facilit y defines EBITDA as earnings before deducting interest expense, income taxes, depreciation and amortization. Our credit facility uses EBITDA to measure our compliance with covenants, such as inte res t coverage and leverage ratios, as presented on page 10 of this presentation. 2016 2015 2016 2015 Revenue $ 3,499.1 $ 3,469.2 $ 15,164.3 $ 15,284.8 Operating Expenses, excluding Depreciation and Amortization 3,032.8 3,017.3 12,938.7 13,048.0 EBITDA 466.3 451.9 2,225.6 2,236.8 Depreciation 45.9 46.9 180.9 187.7 EBITA 420.4 405.0 2,044.7 2,049.1 Amortization of Intangibles 28.3 27.3 110.2 110.1 Operating Income 392.1 377.7 1,934.5 1,939.0 Net Interest Expense 40.1 34.2 147.4 129.3 Income Before Income Taxes 352.0 343.5 1,787.1 1,809.7 Taxes 115.5 112.7 586.4 589.5 (Loss) / Income from Equity Method Investments (0.2) (1.0) 9.1 14.6 Net Income 236.3 229.8 1,209.8 1,234.8 Less: Net Income Attributed to Noncontrolling Interests 17.9 20.7 106.6 127.2 Net Income - Omnicom Group $ 218.4 $ 209.1 $ 1,103.2 $ 1,107.6 Twelve Months Ended March 31Three Months Ended March 31

Reconciliation of Non - GAAP Measures April 19, 2016 19 2016 2015 Net Free Cash Flow (a) (128.7)$ (155.6)$ Cash Flow items excluded from Net Free Cash Flow: Changes in Operating Capital (807.1) (559.5) Proceeds from Short-term Debt, net 13.3 2.7 Other Financing Activities, net (13.2) (9.0) Effect of exchange rate changes on cash and cash equivalents 77.8 (140.0) Net Decrease in Cash and Cash Equivalents (857.9)$ (861.4)$ Three Months Ended March 31 2016 2015 Reported Operating Income 1,934.5$ 1,939.0$ Effective Tax Rate for the applicable period 32.8% 32.6% Income Taxes on Reported Operating Income 634.5 632.1 After Tax Reported Operating Income (b) 1,300.0$ 1,306.9$ Twelve Months Ended March 31 Additional information regarding our cash flows can be found in our condensed cash flow statement on page 17. (a) The Net Free Cash Flow amounts presented above exclude the effect of working capital, financing activities, investing activities and foreign exchang es and are non - GAAP financial measures. See page 22 for the definition of this measure. (b) After Tax Reported Operating Income, defined as reported operating income less income taxes calculated using the effective ta x r ate for the applicable period. Management uses after tax operating income as a measure of after tax operating performance as it excludes the after tax effects of financing and investing activi tie s on results of operations.
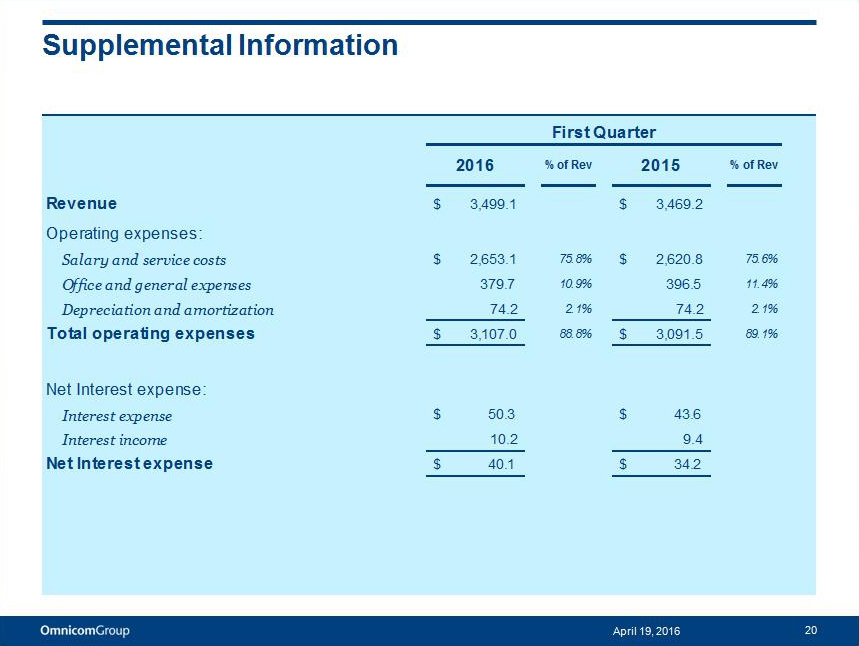
Supplemental Information 20 April 19, 2016 2016 % of Rev 2015 % of Rev Revenue $ 3,499.1 $ 3,469.2 Operating expenses: Salary and service costs $ 2,653.1 75.8% $ 2,620.8 75.5% Office and general expenses 379.7 10.9% 396.5 11.4% Depreciation and amortization 74.2 2.1% 74.2 2.1% Total operating expenses $ 3,107.0 88.8% $ 3,091.5 89.1% Net Interest expense: Interest expense $ 50.3 $ 43.6 Interest income 10.2 9.4 Net Interest expense $ 40.1 $ 34.2 First Quarter
First Quarter Acquisition April 19, 2016 21 DDB Worldwide purchased a controlling interest in Grupo ABC. Grupo ABC is one of Brazil’s largest marketing and communications groups, with a versatile group of agencies providing advertising , CRM, public relations consultancy, promotion, events and digital marketing services to its portfolio of global and local clients. Grupo ABC is headquartered in São Paulo, Brazil.
The preceding materials have been prepared for use in the April 19, 2016 conference call on Omnicom’s results of operations f or the period ended March 31, 2016. The call will be archived on the Internet at http://investor.omnicomgroup.com/investor - relations/news - events - and - filings / . Forward - Looking Statements Certain statements in this presentation constitute forward - looking statements, including statements within the meaning of the Pr ivate Securities Litigation Reform Act of 1995. In addition, from time to time, the Company or its representatives have made, or may make, forward - looking statements, orally or in writing. These stateme nts may discuss goals, intentions and expectations as to future plans, trends, events, results of operations or financial condition, or otherwise, based on current beliefs of the Company’s managem ent as well as assumptions made by, and information currently available to, the Company’s management. Forward - looking statements may be accompanied by words such as “aim,” “anticipate,” “believe,” “plan,” “could,” “should,” “would,” “estimate,” “expect,” “forecast,” “future,” “guidance,” “intend,” “may,” “will,” “possible,” “potential,” “predict,” “project” or similar words, phrases or expressions. The se forward - looking statements are subject to various risks and uncertainties, many of which are outside the Company’s control. Therefore, you should not place undue reliance on such statements. Factors that c oul d cause actual results to differ materially from those in the forward - looking statements include: international, national or local economic conditions that could adversely affect the Company or i ts clients; losses on media purchases and production costs incurred on behalf of clients; reductions in client spending, a slowdown in client payments and a deterioration in the credit markets; ability t o a ttract new clients and retain existing clients in the manner anticipated; changes in client advertising, marketing and corporate communications requirements; failure to manage potential conflicts of interest be tween or among clients; unanticipated changes relating to competitive factors in the advertising, marketing and corporate communications industries; ability to hire and retain key personnel; curr enc y exchange rate fluctuations; reliance on information technology systems; changes in legislation or governmental regulations affecting the Company or its clients; risks associated with assumptions th e C ompany makes in connection with its critical accounting estimates and legal proceedings; and the Company’s international operations, which are subject to the risks of currency repatriation restri cti ons, social or political conditions and regulatory environment. The foregoing list of factors is not exhaustive. You should carefully consider the foregoing factors and the other risks and uncertainties tha t may affect the Company’s business, including those described in the “Risk Factors” in Omnicom’s Annual Report on Form 10 - K for the year ended December 31, 2015. Except as required under applicable law, the Company does not assume any obligation to update these forward - looking statements. Non - GAAP Financial Measures We present financial measures determined in accordance with generally accepted accounting principles in the United States (“G AAP ”) and adjustments to the GAAP presentation (“Non - GAAP”), which we believe are meaningful for understanding our performance. Non - GAAP financial measures should not be considered in isolation f rom, or as a substitute for, financial information presented in compliance with GAAP. Non - GAAP financial measures as reported by us may not be comparable to similarly titled amounts reported b y other companies. We provide a reconciliation of non - GAAP measures to the comparable GAAP measures on pages 18 and 19. The Non - GAAP measures used in this presentation include the following: Net Free Cash Flow, defined as Free Cash Flow (defined below) less the Primary Uses of Cash (defined below). Net Free Cash Fl ow is one of the metrics used by us to assess our sources and uses of cash and was derived from our consolidated statements of cash flows. We believe that this presentation is meaningful for unde rst anding our primary sources and primary uses of that cash flow. Free Cash Flow, defined as net income plus depreciation, amortization, share based compensation expense plus/(less) other non - cash it ems to reconcile to net cash provided by operating activities. Primary Uses of Cash, defined as dividends to common shareholders, dividends paid to non - controlling interest shareholders, capital expe nditures, cash paid on acquisitions, payments for additional interest in controlled subsidiaries and stock repurchases, net of the proceeds and excess tax benefit from our stock plans, and excludes cha nges in operating capital and other investing and financing activities, including commercial paper issuances and redemptions used to fund working capital changes. EBITDA, defined as operating income before interest, taxes, depreciation and amortization. We believe EBITDA is meaningful be cau se the financial covenants in our credit facilities are based on EBITDA. EBITA, defined as operating income before interest, taxes and amortization. We use EBITA as an additional operating performan ce measure, which excludes non - cash acquisition - related amortization expense, because we believe that EBITA is a useful measure to evaluate the performance of our businesses. Net Debt, defined as total debt less cash, cash equivalents and short - term investments. We believe net debt, together with the c omparable GAAP measures, reflects one of the metrics used by us to assess our cash management. After Tax Reported Operating Income, defined as reported operating income less income taxes calculated using the effective ta x r ate for the applicable period. Management uses after tax operating income as a measure of after tax operating performance as it excludes the after tax effects of financing and investing activi tie s on results of operations. Other Information All dollar amounts are in millions except for per share amounts and figures shown on page 3 and the net cash returned to shareholders figures on page 12. The information contained in this document has not been audited, although some data has been derived from Omnicom’s historical financial statements, including its audit ed financial statements. In addition, industry, operational and other non - financial data contained in this document have been derived from sources that we believe to be reliable, but we have not inde pen dently verified such information, and we do not, nor does any other person, assume responsibility for the accuracy or completeness of that information. Certain amounts in prior periods have bee n r eclassified to conform to our current presentation. The inclusion of information in this presentation does not mean that such information is material or that disclosure of such inf ormation is required. Disclosure April 19, 2016 22
Serious News for Serious Traders! Try StreetInsider.com Premium Free!
You May Also Be Interested In
- Wells Fargo Upgrades Omnicom Group (OMC) to Overweight
- Omnicom Group (OMC) PT Raised to $93 at MoffettNathanson
- Omnicom Group (OMC) PT Raised to $88 at BofA Securities
Create E-mail Alert Related Categories
SEC FilingsSign up for StreetInsider Free!
Receive full access to all new and archived articles, unlimited portfolio tracking, e-mail alerts, custom newswires and RSS feeds - and more!
