

Form 8-K MDC PARTNERS INC For: Feb 18
 Tweet
Tweet Share
Share
UNITED STATES
SECURITIES AND EXCHANGE COMMISSION
WASHINGTON, D.C. 20549
FORM 8-K
Current Report Pursuant to Section 13 or
15(d)
of the Securities Exchange Act of 1934
Date of Report (Date Earliest Event reported) — February 18, 2016 (February 18, 2016)
MDC PARTNERS INC.
(Exact name of registrant as specified in its charter)
| Canada (Jurisdiction of Incorporation) |
001-13718 (Commission File Number) |
98-0364441 (IRS Employer Identification No.) |
745 Fifth Avenue, 19th Floor,
New York, NY 10151
(Address of principal executive offices and zip code)
(646) 429-1800
(Registrant’s Telephone Number)
Check the appropriate box below if the Form 8−K filing is intended to simultaneously satisfy the filing obligation of the registrant under any of the following provisions:
| ¨ | Written communications pursuant to Rule 425 under the Securities Act (17 CFR 230.425) |
| ¨ | Soliciting material pursuant to Rule 14a−12 under the Exchange Act (17 CFR 240.14a−12) |
| ¨ | Pre−commencement communications pursuant to Rule 14d−2(b) under the Exchange Act (17 CFR 240.14d−2(b)) |
| ¨ | Pre−commencement communications pursuant to Rule 13e−4(c) under the Exchange Act (17 CFR 240.13e− 4(c)) |
Item 2.02 Results of Operations and Financial Condition.
On February 18, 2016, MDC Partners Inc. (the “Company”) issued an earnings release reporting its financial results for the three and twelve months ended December 31, 2015. A copy of this earnings release and related investor presentation materials are furnished hereto as Exhibit 99.1 and Exhibit 99.2.
The Company has posted the materials furnished as Exhibit 99.2 on its web site (www.mdc-partners.com). The information found on, or otherwise accessible through, the Company’s website is not incorporated into, and does not form a part of, this Current Report on Form 8-K. The foregoing information (including the exhibits hereto) is being furnished under “Item 2.02 - Results of Operations and Financial Condition.” Such information (including the exhibits hereto) shall not be deemed “filed” for purposes of Section 18 of the Securities Exchange Act of 1934, as amended, nor shall it be deemed incorporated by reference in any filing under the Securities Act of 1933, as amended, except as shall be expressly set forth by specific reference in such filing.
The foregoing information and the exhibits hereto contain forward-looking statements within the meaning of the federal securities laws. These statements are based on present expectations, and are subject to the limitations listed therein and in the Company's other SEC reports, including that actual events or results may differ materially from those in the forward-looking statements. The Company does not undertake any duty to update these forward looking statements, except as required by law.
Item 5.02 Departure of Directors or Principal Officers; Election of Directors; Appointment of Principal Officers.
On February 18, 2016, the Company’s Board of Directors voted to appoint Larry Kramer and Anne Marie O’Donovan as new directors to the Board of Directors, effective as of March 1, 2016. On February 18, 2016, the Company issued a press release announcing the appointment of Mr. Kramer and Ms. O’Donovan as new directors. A copy of the press release is attached as Exhibit 99.4 hereto.
Mr. Kramer and Ms. O’ Donovan will each join the Company’s Board as an independent director, effective as of March 1, 2016. It is expected that each of Mr. Kramer and Ms. O’Donovan will stand for re-election at the Company’s 2016 annual meeting of stockholders. There is no arrangement or understanding between Mr. Kramer or Ms. O’Donovan, and any other person pursuant to which they were each appointed as a director of the Company.
In connection with their respective service on the Board of Directors and consistent with the compensation arrangements for non-employee directors, each of Mr. Kramer and Ms. O’Donovan will receive an annual cash retainer of $60,000 for their service on the Board of Directors, together with meeting fees. In addition, each of Mr. Kramer and Ms. O’Donovan will be granted a restricted stock award of 5,000 Class A shares pursuant to the Company’s 2011 Stock Incentive Plan.
2
Item 7.01 Regulation FD Disclosure.
On February 18, 2016, the Company issued a press release announcing that its Board of Directors has declared a cash dividend of $0.21 per share on all of its outstanding Class A shares and Class B shares. The quarterly dividend will be payable on or about March 18, 2016, to shareholders of record at the close of business on March 4, 2016.
Item 8.01. Other Events.
SEC Investigation Update
The Company has continued to cooperate fully with the SEC in connection with its ongoing review of historical goodwill and related accounting matters. Specifically, the Company engaged an outside accounting firm to review and assess the Company’s historical goodwill accounting. The Company believes that its historical goodwill impairment and related accounting analysis is appropriate and has been applied in accordance with GAAP in all material respects.
Item 9.01. Financial Statements and Exhibits.
(d) Exhibits.
| 99.1 | Press release dated February 18, 2016, relating to the Company’s earnings for the three and twelve months ended December 31, 2015. |
| 99.2 | Investor presentation materials, dated February 18, 2016. |
| 99.3 | Press Release dated February 18, 2016, relating to the announcement of the Company’s dividend. |
| 99.4 | Press Release dated February 18, 2016, relating to the announcement of the appointment of Larry Kramer and Anne Marie O’Donovan to the Company’s Board of Directors. |
3
Signatures
Pursuant to the requirements of the Securities Exchange Act of 1934, the Company has duly caused this report to be signed by the undersigned hereunto duly authorized.
| Date: February 18, 2016 | MDC Partners Inc. | ||
| By: | /s/ Matthew Speiser | ||
| Matthew Speiser Assistant General Counsel | |||
4
Exhibit 99.1

PRESS RELEASE FOR IMMEDIATE ISSUE
| FOR: | MDC Partners Inc. | CONTACT: | Matt Chesler, CFA |
| 745 Fifth Avenue, 19th Floor | VP, Investor Relations | ||
| New York, NY 10151 | 646-412-6877 | ||
| [email protected] |
MDC
PARTNERS INC. REPORTS RESULTS FOR THE
THREE AND TWELVE MONTHS ENDED DECEMBER 31, 2015
FULL YEAR 2015 ORGANIC REVENUE GROWTH OF 7.1%, ADJUSTED EBITDA GROWTH OF 10.2%, AND ADJUSTED EBITDA AVAILABLE FOR GENERAL CAPITAL PURPOSES GROWTH OF 14.8%
QUARTERLY DIVIDEND OF $0.21 PER SHARE DECLARED
FOURTH QUARTER HIGHLIGHTS:
| · | Revenue increased to $359.0 million from $339.9 million, an increase of 5.6% |
| · | Net loss attributable to MDC Partners of ($26.2) million versus ($26.8) million in the same period last year |
| · | Organic revenue increased 7.2%, after a roughly 230 basis points reduction from significantly lower billable pass-through costs |
| · | Adjusted EBITDA increased to $65.6 million from $51.8 million, an increase of 26.6% (see Schedules 2 and 3) |
| · | Adjusted EBITDA margin of 18.3% versus 15.2% in the same period last year (see Schedules 2 and 3) |
| · | Adjusted EBITDA Available for General Capital Purposes increased to $44.5 million from $31.1 million, an increase of 42.9% (see Schedule 6) |
| · | Net New Business wins totaled $27.4 million |
| · | Declared cash dividend of $0.21 per share |
FULL YEAR HIGHLIGHTS:
| · | Revenue increased to $1.33 billion from $1.22 billion, an increase of 8.4% |
| · | Net loss attributable to MDC Partners of ($37.4) million versus ($24.1) million in the same period last year |
| · | Organic revenue increased 7.1%, after a roughly 190 basis points reduction from significantly lower billable pass-through costs |
| · | Adjusted EBITDA increased to $197.7 million versus $179.4 million, an increase of 10.2% (see Schedules 4 and 5) |
| · | Adjusted EBITDA margin of 14.9% versus 14.7% in the same period last year (see Schedules 4 and 5) |
| · | Adjusted EBITDA Available for General Capital Purposes increased to $113.4 million from $98.8 million, an increase of 14.8% (see Schedule 6) |
| · | Net New Business wins totaled $116.7 million |
| Page 1 |
New York, NY, February 18, 2016 (NASDAQ: MDCA) – MDC Partners Inc. (“MDC Partners” or the “Company”) today announced financial results for the three and twelve months ended December 31, 2015.
Scott Kauffman, Chairman and Chief Executive Officer of MDC Partners, said, “Thanks to the dedication and hard work of our team, 2015 was a very strong year for our company. We posted 7.1% organic revenue growth, 10.2% Adjusted EBITDA growth, 14.9% Adjusted EBITDA margins and robust cash generation. Our results are proof that our business model continues to be unique in the market, and that our partners are delivering some of the most inventive and effective work for their clients. Our outlook for the year ahead is bullish. We have an active pipeline of new business and we are executing well on our plans to extend our international reach, to build our differentiated and modern media buying and planning platform, and to augment our capabilities through deliberate and strategic M&A. The future of MDC Partners has never been brighter.”
Guidance for 2016 is established as follows:
| Implied | ||||||
| 2015 | 2016 | Year over Year | ||||
| Actuals | Guidance | Change | ||||
| Revenue | $1.326 billion | $1.410 - $1.440 billion | +6.3% to +8.6% | |||
| Adjusted EBITDA | $197.7 million | $225 - $235 million | +13.8% to +18.9% | |||
| Implied Adjusted EBITDA Margin | 14.9% | 15.8% to 16.4% | +90 to +150 basis points | |||
| Adjusted EBITDA Available for General Capital Purposes |
$113.4 million | $135 - $145 million | +19.0% to +27.9% |
For the twelve month period ended December 31, 2015, consolidated revenue was $1.33 billion, an increase of 8.4% compared to $1.22 billion in the twelve months ended December 31, 2014. Adjusted EBITDA for the twelve months ended December 31, 2015 was $197.7 million, an increase of 10.2% compared to $179.4 million in the same period of 2014. Net loss attributable to MDC Partners in the twelve months ended December 31, 2015 was ($37.4) million compared to ($24.1) million in the same period of 2014. Diluted loss per share from continuing operations attributable to MDC Partners common shareholders for the twelve months ended December 31, 2015 was ($0.62) compared to ($0.06) in the same period of 2014. Adjusted EBITDA Available for General Capital Purposes was $113.4 million in the twelve months ended December 31, 2015, an increase of 14.8% compared to $98.8 million in the same period of 2014.
Consolidated revenue for the fourth quarter of 2015 was $359.0 million, an increase of 5.6%, compared to $339.9 million in the fourth quarter of 2014. Adjusted EBITDA for the fourth quarter of 2015 was $65.6 million, an increase of 26.6% compared to $51.8 million in the fourth quarter of 2014. Net loss attributable to MDC Partners in the fourth quarter was ($26.2) million compared to ($26.8) million in the fourth quarter of 2014. Diluted loss per share from continuing operations attributable to MDC Partners common shareholders for the fourth quarter of 2015 was ($0.52) compared to ($0.17) per share in the fourth quarter of 2014. Adjusted EBITDA Available for General Capital Purposes was $44.5 million in the fourth quarter of 2015, an increase of 42.9% compared to $31.1 million in the fourth quarter of 2014.
| Page 2 |
David Doft, CFO of MDC Partners, said, “We are pleased with our performance in 2015 and are in a position to post robust financial and operating results going forward. In 2015, organic revenue grew 7.1% despite a 190 basis reduction from significantly lower billable pass-through cost. Importantly, new business activity is solid, giving us good visibility into future prospects. More specifically, for 2016 we expect revenue to increase 6.3% to 8.6% and Adjusted EBITDA to increase 13.8% to 18.9%, which implies well over 100 basis points of margin expansion. In addition, the strong cash generation that we saw in the fourth quarter provides a solid foundation as we focus on strengthening the balance sheet and achieving our leverage target goal of 2.5 times or below.”
MDC Partners Announces $0.21 per Share Quarterly Cash Dividend
MDC Partners today also announced that its Board of Directors has declared a cash dividend of $0.21 per share on all of its outstanding Class A shares and Class B shares. The quarterly dividend will be payable on or about March 18, 2016, to shareholders of record at the close of business on March 04, 2016.
Conference Call
Management will host a conference call on Thursday, February 18, 2016, at 4:30 p.m. (ET) to discuss results. Access the conference call by dialing 1-412-902-4266 or toll free 1-888-346-6216. An investor presentation has been posted on our website www.mdc-partners.com and may be referred to during the conference call.
A recording of the conference call will be available one hour after the call until 12:00 a.m. (ET), February 26, 2016, by dialing 1-412-317-0088 or toll free 1-877-344-7529 (passcode 10080858), or by visiting our website at www.mdc-partners.com.
About MDC Partners Inc.
MDC Partners is one of the fastest-growing and most influential marketing and communications networks in the world. Its 50+ advertising, public relations, branding, digital, social and event marketing agencies are responsible for some of the most memorable and engaging campaigns for the world’s most respected brands. As "The Place Where Great Talent Lives," MDC Partners is known for its unique partnership model, empowering the most entrepreneurial and innovative talent to drive competitive advantage and business growth for clients. By leveraging technology, data analytics, insights, and strategic consulting solutions, MDC Partners drives measurable results and optimizes return on marketing investment for over 1,700 clients worldwide. For more information about MDC Partners and its partner firms, visit our website at www.mdc-partners.com and follow us on Twitter at http://www.twitter.com/mdcpartners.
Non-GAAP Financial Measures
In addition to its reported results, MDC Partners has included in this earnings release certain financial results that the Securities and Exchange Commission defines as "non-GAAP financial measures." Management believes that such non-GAAP financial measures, when read in conjunction with the Company's reported results, can provide useful supplemental information for investors analyzing period to period comparisons of the Company's results. These non-GAAP financial measures relate to: (1) presenting Adjusted EBITDA and EBITDA margin (as defined) for the three and twelve months ended December 31, 2015, and 2014; and (2) presenting Adjusted EBITDA Available for General Capital Purposes (as defined) for the three and twelve months ended December 31, 2015, and 2014. Included in this earnings release are tables reconciling MDC Partners’ reported results to arrive at these non-GAAP financial measures.
| Page 3 |
This press release contains forward-looking statements. The Company’s representatives may also make forward-looking statements orally from time to time. Statements in this press release that are not historical facts, including statements about the Company’s beliefs and expectations, earnings guidance, recent business and economic trends, potential acquisitions, and estimates of amounts for redeemable noncontrolling interests and deferred acquisition consideration, constitute forward-looking statements. These statements are based on current plans, estimates and projections, and are subject to change based on a number of factors, including those outlined in this section. Forward-looking statements speak only as of the date they are made, and the Company undertakes no obligation to update publicly any of them in light of new information or future events, if any.
Forward-looking statements involve inherent risks and uncertainties. A number of important factors could cause actual results to differ materially from those contained in any forward-looking statements. Such risk factors include, but are not limited to, the following:
| · | risks associated with the SEC’s ongoing investigation and the related class action litigation claims; |
| · | risks associated with severe effects of international, national and regional economic downturn; |
| · | the Company’s ability to attract new clients and retain existing clients; |
| · | the spending patterns and financial success of the Company’s clients; |
| · | the Company’s ability to retain and attract key employees; |
| · | the Company’s ability to remain in compliance with its debt agreements and the Company’s ability to finance its contingent payment obligations when due and payable, including but not limited to those relating to redeemable noncontrolling interests and deferred acquisition consideration; |
| · | the successful completion and integration of acquisitions which complement and expand the Company’s business capabilities; and |
| · | foreign currency fluctuations. |
The Company’s business strategy includes ongoing efforts to engage in acquisitions of ownership interests in entities in the marketing communications services industry. The Company intends to finance these acquisitions by using available cash from operations, from borrowings under its credit facility and through incurrence of bridge or other debt financing, any of which may increase the Company’s leverage ratios, or by issuing equity, which may have a dilutive impact on existing shareholders proportionate ownership. At any given time the Company may be engaged in a number of discussions that may result in one or more acquisitions. These opportunities require confidentiality and may involve negotiations that require quick responses by the Company. Although there is uncertainty that any of these discussions will result in definitive agreements or the completion of any transactions, the announcement of any such transaction may lead to increased volatility in the trading price of the Company’s securities.
Investors should carefully consider these risk factors and the additional risk factors outlined in more detail in the Annual Report on Form 10-K under the caption “Risk Factors” and in the Company’s other SEC filings.
| Page 4 |
SCHEDULE 1
MDC PARTNERS INC.
UNAUDITED CONSOLIDATED STATEMENTS OF OPERATIONS
(US$ in 000s, except share and per share amounts)
| Three Months Ended December 31, | Twelve Months Ended December 31, | |||||||||||||||
| 2015 | 2014 | 2015 | 2014 | |||||||||||||
| Revenue | $ | 359,013 | $ | 339,911 | $ | 1,326,256 | $ | 1,223,512 | ||||||||
| Operating Expenses: | ||||||||||||||||
| Cost of services sold | 231,330 | 222,626 | 879,716 | 798,518 | ||||||||||||
| Office and general expenses | 116,038 | 76,486 | 322,207 | 290,073 | ||||||||||||
| Depreciation and amortization | 12,830 | 15,089 | 52,223 | 47,172 | ||||||||||||
| 360,198 | 314,201 | 1,254,146 | 1,135,763 | |||||||||||||
| Operating profit (loss) | (1,185 | ) | 25,710 | 72,110 | 87,749 | |||||||||||
| Other Income (Expense): | ||||||||||||||||
| Other, net | (2,775 | ) | (9,145 | ) | (32,090 | ) | (17,793 | ) | ||||||||
| Interest expense and finance charges | (14,881 | ) | (14,602 | ) | (57,903 | ) | (55,265 | ) | ||||||||
| Interest income | 129 | 131 | 467 | 418 | ||||||||||||
| Income (loss) from continuing operations before income taxes and equity in earnings of non-consolidated affiliates | (18,712 | ) | 2,094 | (17,416 | ) | 15,109 | ||||||||||
| Income tax expense | 6,230 | 9,658 | 5,664 | 12,422 | ||||||||||||
| Income (loss) from continuing operations before equity in earnings of non-consolidated affiliates | (24,942 | ) | (7,564 | ) | (23,080 | ) | 2,687 | |||||||||
| Equity in earnings of non-consolidated affiliates | 431 | 1,183 | 1,058 | 1,406 | ||||||||||||
| Income (loss) from continuing operations | (24,511 | ) | (6,381 | ) | (22,022 | ) | 4,093 | |||||||||
| Loss from discontinued operations attributable to MDC Partners Inc., net of taxes | - | (18,284 | ) | (6,281 | ) | (21,260 | ) | |||||||||
| Net loss | (24,511 | ) | (24,665 | ) | (28,303 | ) | (17,167 | ) | ||||||||
| Net income attributable to the noncontrolling interests | (1,711 | ) | (2,094 | ) | (9,054 | ) | (6,890 | ) | ||||||||
| Net loss attributable to MDC Partners Inc. | $ | (26,222 | ) | $ | (26,759 | ) | $ | (37,357 | ) | $ | (24,057 | ) | ||||
| Loss Per Common Share: | ||||||||||||||||
| Basic and Diluted: | ||||||||||||||||
| Loss from continuing operations attributable to MDC Partners Inc. common shareholders | $ | (0.52 | ) | $ | (0.17 | ) | $ | (0.62 | ) | $ | (0.06 | ) | ||||
| Discontinued operations attributable to MDC Partners Inc. common shareholders | - | (0.37 | ) | (0.13 | ) | (0.43 | ) | |||||||||
| Net loss attributable to MDC Partners Inc. common shareholders | $ | (0.52 | ) | $ | (0.54 | ) | $ | (0.75 | ) | $ | (0.49 | ) | ||||
| Weighted Average Number of Common Shares Outstanding: | ||||||||||||||||
| Basic and Diluted | 49,968,165 | 49,683,864 | 49,875,282 | 49,545,350 | ||||||||||||
| Page 5 |
SCHEDULE 2
MDC PARTNERS INC.
UNAUDITED RECONCILIATION OF NET INCOME (LOSS) TO ADJUSTED EBITDA
(US$ in 000s, except percentages)
For the Three Months Ended December 31, 2015
| Advertising and | ||||||||||||
| Communications | Corporate | Total | ||||||||||
| Revenue | $ | 359,013 | $ | - | $ | 359,013 | ||||||
| Net loss attributable to MDC Partners Inc. | $ | (26,222 | ) | |||||||||
| Adjustments to reconcile to Operating profit (loss): | ||||||||||||
| Net income attributable to the noncontrolling interests | 1,711 | |||||||||||
| Equity in earnings of non-consolidated affiliates | (431 | ) | ||||||||||
| Income tax expense | 6,230 | |||||||||||
| Interest expense and finance charges, net | 14,752 | |||||||||||
| Other, net | 2,775 | |||||||||||
| Operating profit (loss) | $ | 13,478 | $ | (14,663 | ) | $ | (1,185 | ) | ||||
| margin | 3.8 | % | -0.3 | % | ||||||||
| Additional adjustments to reconcile to Adjusted EBITDA: | ||||||||||||
| Depreciation and amortization | 12,292 | 538 | 12,830 | |||||||||
| Stock-based compensation | 4,033 | 738 | 4,771 | |||||||||
| Acquisition deal costs | 58 | 411 | 469 | |||||||||
| Deferred acquisition consideration adjustments | 41,913 | - | 41,913 | |||||||||
| Distributions from non-consolidated affiliates *** | 102 | 7,122 | 7,224 | |||||||||
| Other items, net ** | - | (468 | ) | (468 | ) | |||||||
| Adjusted EBITDA * | $ | 71,876 | $ | (6,322 | ) | $ | 65,554 | |||||
| margin | 20.0 | % | 18.3 | % | ||||||||
| * | Adjusted EBITDA is a non-GAAP measure, but as shown above it represents operating profit (loss) plus depreciation and amortization, stock-based compensation, acquisition deal costs, deferred acquisition consideration adjustments, distributions from non-consolidated affiliates, and other items. |
| ** | Other items includes (i) one-time gains related to the former CEO's repayment to the Company for certain perquisites and expenses ($0.8 million), and (ii) legal fees and related expenses, net of insurance proceeds, relating to the ongoing SEC investigation ($0.3 million). |
| *** | Distributions from non-consolidated affiliates includes cash received for profit distributions as well as proceeds from the sale of non-consolidated affiliates. |
| Page 6 |
SCHEDULE 3
MDC PARTNERS INC.
UNAUDITED RECONCILIATION OF NET INCOME (LOSS) TO ADJUSTED EBITDA
(US$ in 000s, except percentages)
For the Three Months Ended December 31, 2014
| Advertising and | ||||||||||||
| Communications | Corporate | Total | ||||||||||
| Revenue | $ | 339,911 | $ | - | $ | 339,911 | ||||||
| Net loss attributable to MDC Partners Inc. | $ | (26,759 | ) | |||||||||
| Adjustments to reconcile to Operating profit (loss): | ||||||||||||
| Net income attributable to the noncontrolling interests | 2,094 | |||||||||||
| Loss from discontinued operations attributable to MDC Partners Inc., net of taxes | 18,284 | |||||||||||
| Equity in earnings of non-consolidated affiliates | (1,183 | ) | ||||||||||
| Income tax expense | 9,658 | |||||||||||
| Interest expense and finance charges, net | 14,471 | |||||||||||
| Other, net | 9,145 | |||||||||||
| Operating profit (loss) | $ | 44,119 | $ | (18,409 | ) | $ | 25,710 | |||||
| margin | 13.0 | % | 7.6 | % | ||||||||
| Additional adjustments to reconcile to Adjusted EBITDA: | ||||||||||||
| Depreciation and amortization | 14,659 | 430 | 15,089 | |||||||||
| Stock-based compensation | 4,096 | 1,367 | 5,463 | |||||||||
| Acquisition deal costs | 1,096 | 1,325 | 2,421 | |||||||||
| Deferred acquisition consideration adjustments | 1,751 | - | 1,751 | |||||||||
| Distributions from non-consolidated affiliates ** | 616 | 720 | 1,336 | |||||||||
| Adjusted EBITDA * | $ | 66,337 | $ | (14,567 | ) | $ | 51,770 | |||||
| margin | 19.5 | % | 15.2 | % | ||||||||
| * | Adjusted EBITDA is a non-GAAP measure, but as shown above it represents operating profit (loss) plus depreciation and amortization, stock-based compensation, acquisition deal costs, deferred acquisition consideration adjustments, and distributions from non-consolidated affiliates. |
| ** | Distributions from non-consolidated affiliates includes cash received for profit distributions. |
| Page 7 |
SCHEDULE 4
MDC PARTNERS INC.
UNAUDITED RECONCILIATION OF NET INCOME (LOSS) TO ADJUSTED EBITDA
(US$ in 000s, except percentages)
For the Twelve Months Ended December 31, 2015
| Advertising and | ||||||||||||
| Communications | Corporate | Total | ||||||||||
| Revenue | $ | 1,326,256 | $ | - | $ | 1,326,256 | ||||||
| Net loss attributable to MDC Partners Inc. | $ | (37,357 | ) | |||||||||
| Adjustments to reconcile to Operating profit (loss): | ||||||||||||
| Net income attributable to the noncontrolling interests | 9,054 | |||||||||||
| Loss from discontinued operations attributable to MDC Partners Inc., net of taxes | 6,281 | |||||||||||
| Equity in earnings of non-consolidated affiliates | (1,058 | ) | ||||||||||
| Income tax expense | 5,664 | |||||||||||
| Interest expense and finance charges, net | 57,436 | |||||||||||
| Other, net | 32,090 | |||||||||||
| Operating profit (loss) | $ | 137,282 | $ | (65,172 | ) | $ | 72,110 | |||||
| margin | 10.4 | % | 5.4 | % | ||||||||
| Additional adjustments to reconcile to Adjusted EBITDA: | ||||||||||||
| Depreciation and amortization | 50,449 | 1,774 | 52,223 | |||||||||
| Stock-based compensation | 15,056 | 2,740 | 17,796 | |||||||||
| Acquisition deal costs | 704 | 2,208 | 2,912 | |||||||||
| Deferred acquisition consideration adjustments | 36,347 | - | 36,347 | |||||||||
| Distributions from non-consolidated affiliates *** | 679 | 7,272 | 7,951 | |||||||||
| Other items, net ** | - | 8,327 | 8,327 | |||||||||
| Adjusted EBITDA * | $ | 240,517 | $ | (42,851 | ) | $ | 197,666 | |||||
| margin | 18.1 | % | 14.9 | % | ||||||||
| * | Adjusted EBITDA is a non-GAAP measure, but as shown above it represents operating profit (loss) plus depreciation and amortization, stock-based compensation, acquisition deal costs, deferred acquisition consideration adjustments, distributions from non-consolidated affiliates, and other items. |
| ** | Other items includes (i) one-time gains related to the former CEO's repayment to the Company for certain perquisites and expenses ($11.3 million), (ii) legal fees and related expenses, net of insurance proceeds, relating to the ongoing SEC investigation ($12.7 million), (iii) one-time charge for the balance of prior cash bonus award amounts paid to the former CEO and CAO that will not be recovered ($5.8 million), and (iv) write-off of certain assets related to the CEO and CAO termination ($1.1 million). |
| *** | Distributions from non-consolidated affiliates includes cash received for profit distributions as well as proceeds from the sale of non-consolidated affiliates. |
| Page 8 |
SCHEDULE 5
MDC PARTNERS INC.
UNAUDITED RECONCILIATION OF NET INCOME (LOSS) TO ADJUSTED EBITDA
(US$ in 000s, except percentages)
For the Twelve Months Ended December 31, 2014
| Advertising and | ||||||||||||
| Communications | Corporate | Total | ||||||||||
| Revenue | $ | 1,223,512 | $ | - | $ | 1,223,512 | ||||||
| Net loss attributable to MDC Partners Inc. | $ | (24,057 | ) | |||||||||
| Adjustments to reconcile to Operating profit (loss): | ||||||||||||
| Net income attributable to the noncontrolling interests | 6,890 | |||||||||||
| Loss from discontinued operations attributable to MDC Partners Inc., net of taxes | 21,260 | |||||||||||
| Equity in earnings of non-consolidated affiliates | (1,406 | ) | ||||||||||
| Income tax expense | 12,422 | |||||||||||
| Interest expense and finance charges, net | 54,847 | |||||||||||
| Other, net | 17,793 | |||||||||||
| Operating profit (loss) | $ | 155,826 | $ | (68,077 | ) | $ | 87,749 | |||||
| margin | 12.7 | % | 7.2 | % | ||||||||
| Additional adjustments to reconcile to Adjusted EBITDA: | ||||||||||||
| Depreciation and amortization | 45,387 | 1,785 | 47,172 | |||||||||
| Stock-based compensation | 12,033 | 5,663 | 17,696 | |||||||||
| Acquisition deal costs | 3,502 | 2,632 | 6,134 | |||||||||
| Deferred acquisition consideration adjustments | 16,467 | - | 16,467 | |||||||||
| Distributions from non-consolidated affiliates ** | 937 | 3,201 | 4,138 | |||||||||
| Adjusted EBITDA * | $ | 234,152 | $ | (54,796 | ) | $ | 179,356 | |||||
| margin | 19.1 | % | 14.7 | % | ||||||||
| * | Adjusted EBITDA is a non-GAAP measure, but as shown above it represents operating profit (loss) plus depreciation and amortization, stock-based compensation, acquisition deal costs, deferred acquisition consideration adjustments and distributions from non-consolidated affiliates. |
| ** | Distributions from non-consolidated affiliates includes cash received for profit distributions. |
| Page 9 |
SCHEDULE 6
MDC PARTNERS INC.
UNAUDITED ADJUSTED EBITDA AVAILABLE FOR GENERAL CAPITAL PURPOSES
(US$ in 000s)
| Three Months Ended December 31, | Twelve Months Ended December 31, | |||||||||||||||
| 2015 | 2014 | 2015 | 2014 | |||||||||||||
| Adjusted EBITDA (1) | $ | 65,554 | $ | 51,770 | $ | 197,666 | $ | 179,356 | ||||||||
| Net income attributable to noncontrolling interests | (1,711 | ) | (2,094 | ) | (9,054 | ) | (6,890 | ) | ||||||||
| Capital expenditures, net (2) | (5,105 | ) | (4,999 | ) | (21,119 | ) | (23,078 | ) | ||||||||
| Cash taxes | (487 | ) | (72 | ) | (1,887 | ) | (431 | ) | ||||||||
| Cash interest, net & other (3) | (13,776 | ) | (13,485 | ) | (52,199 | ) | (50,128 | ) | ||||||||
| Adjusted EBITDA Available for General Capital Purposes (4) | $ | 44,475 | $ | 31,120 | $ | 113,407 | $ | 98,829 | ||||||||
(1) Adjusted EBITDA is a non GAAP measure. See schedules 2 through 5 for a reconciliation of Net income (loss) to Adjusted EBITDA.
(2) Capital expenditures, net represents capital expenditures net of landlord reimbursements.
(3) Cash interest, net & other represents the quarterly accrual of cash interest under our Senior Notes.
(4) Adjusted EBITDA Available for General Capital Purposes is a non-GAAP measure, and represents funds available for repayment of debt, acquisitions, deferred acquisition consideration, dividends, and other general corporate initiatives.
| Page 10 |
SCHEDULE 7
MDC PARTNERS INC.
UNAUDITED CONSOLIDATED BALANCE SHEETS
(US$ in 000s)
| December 31, | December 31, | |||||||
| 2015 | 2014 | |||||||
| Assets | ||||||||
| Current Assets: | ||||||||
| Cash and cash equivalents | $ | 61,458 | $ | 113,348 | ||||
| Cash held in trusts | 5,122 | 6,419 | ||||||
| Accounts receivable, net | 361,044 | 355,295 | ||||||
| Expenditures billable to clients | 44,012 | 40,202 | ||||||
| Other current assets | 37,109 | 36,978 | ||||||
| Total Current Assets | 508,745 | 552,242 | ||||||
| Fixed assets, net | 63,557 | 60,240 | ||||||
| Investment in non-consolidated affiliates | 6,263 | 6,110 | ||||||
| Goodwill | 870,301 | 851,373 | ||||||
| Other intangible assets, net | 72,382 | 86,121 | ||||||
| Deferred tax assets | 15,367 | 18,758 | ||||||
| Other assets | 53,635 | 74,046 | ||||||
| Total Assets | $ | 1,590,250 | $ | 1,648,890 | ||||
| Liabilities, Redeemable Noncontrolling Interests and Shareholders' Deficit Current Liabilities: | ||||||||
| Accounts payable | $ | 359,568 | $ | 316,285 | ||||
| Trust liability | 5,122 | 6,419 | ||||||
| Accruals and other liabilities | 297,964 | 264,854 | ||||||
| Advance billings | 119,100 | 142,608 | ||||||
| Current portion of long-term debt | 470 | 534 | ||||||
| Current portion of deferred acquisition consideration | 130,400 | 90,804 | ||||||
| Total Current Liabilities | 912,624 | 821,504 | ||||||
| Long-term debt, less current portion | 741,038 | 742,593 | ||||||
| Long-term portion of deferred acquisition consideration | 216,704 | 114,564 | ||||||
| Other liabilities | 44,905 | 45,861 | ||||||
| Deferred tax liabilities | 92,581 | 77,997 | ||||||
| Total Liabilities | 2,007,852 | 1,802,519 | ||||||
| Redeemable Noncontrolling Interests | 69,471 | 194,951 | ||||||
| Shareholders' Deficit | ||||||||
| Common shares | 269,842 | 265,818 | ||||||
| Charges in excess of capital | (315,261 | ) | (209,668 | ) | ||||
| Accumulated deficit | (526,990 | ) | (489,633 | ) | ||||
| Accumulated other comprehensive income (loss) | 6,257 | (7,752 | ) | |||||
| MDC Partners Inc. Shareholders' Deficit | (566,152 | ) | (441,235 | ) | ||||
| Noncontrolling Interests | 79,079 | 92,655 | ||||||
| Total Shareholders' Deficit | (487,073 | ) | (348,580 | ) | ||||
| Total Liabilities, Redeemable Noncontrolling Interests and Shareholders' Deficit | $ | 1,590,250 | $ | 1,648,890 | ||||
| Page 11 |
SCHEDULE 8
MDC PARTNERS INC.
UNAUDITED SUMMARY CASH FLOW DATA
(US$ in 000s)
| Twelve Months Ended December 31, | ||||||||
| 2015 | 2014 | |||||||
| Cash flows provided by continuing operating activities | $ | 164,147 | $ | 129,350 | ||||
| Discontinued operations | (1,342 | ) | (1,827 | ) | ||||
| Net cash provided by operating activities | 162,805 | 127,523 | ||||||
| Cash flows used in continuing investing activities | (46,994 | ) | (97,578 | ) | ||||
| Discontinued operations | 17,101 | (2,108 | ) | |||||
| Net cash used in investing activities | (29,893 | ) | (99,686 | ) | ||||
| Cash flows used in continuing financing activities | (189,980 | ) | (15,388 | ) | ||||
| Discontinued operations | (40 | ) | (40 | ) | ||||
| Net cash used in financing activities | (190,020 | ) | (15,428 | ) | ||||
| Effect of exchange rate changes on cash and cash equivalents | 5,218 | (1,068 | ) | |||||
| Net increase (decrease) in cash and cash equivalents | $ | (51,890 | ) | $ | 11,341 | |||
| Page 12 |
Exhibit 99.2

February 18, 2016 Management Presentation Fourth Quarter & Full Year 2015 Results
2 FORWARD LOOKING STATEMENTS & OTHER INFORMATION This presentation, including our “ 2016 Financial Outlook”, contains forward - looking statements . The Company’s representatives may also make forward - looking statements orally from time to time . Statements in this presentation that are not historical facts, including statements about the Company’s beliefs and expectations, earnings guidance, recent business and economic trends, potential acquisitions, and estimates of amounts for redeemable noncontrolling interests and deferred acquisition consideration, constitute forward - looking statements . These statements are based on current plans, estimates and projections, and are subject to change based on a number of factors, including those outlined below . Forward - looking statements speak only as of the date they are made, and the Company undertakes no obligation to update publicly any of them in light of new information or future events, if any . Forward - looking statements involve inherent risks and uncertainties . A number of important factors could cause actual results to differ materially from those contained in any forward - looking statements . Such risk factors include, but are not limited to, the following : • risks associated with the SEC’s ongoing investigation and the related class action litigation claims ; • risks associated with severe effects of international, national and regional economic downturn ; • the Company’s ability to attract new clients and retain existing clients; • the spending patterns and financial success of the Company’s clients; • the Company’s ability to remain in compliance with its debt agreements and the Company’s ability to finance its contingent pa yme nt obligations when due and payable, including but not limited to those relating to redeemable noncontrolling interests and deferred acquisition consideration; • the successful completion and integration of acquisitions which compliment and expand the Company’s business capabilities; an d • foreign currency fluctuations. The Company’s business strategy includes ongoing efforts to engage in acquisitions of ownership interests in entities in the marketing communications services industry . The Company intends to finance these acquisitions by using available cash from operations and through incurrence of bridge or other debt financing, either of which may increase the Company’s leverage ratios, or by issuing equity, which may have a dilutive impact on existing shareholders proportionate ownership . At any given time the Company may be engaged in a number of discussions that may result in one or more acquisitions . These opportunities require confidentiality and may involve negotiations that require quick responses by the Company . Although there is uncertainty that any of these discussions will result in definitive agreements or the completion of any transactions, the announcement of any such transaction may lead to increased volatility in the trading price of the Company’s securities . Investors should carefully consider these risk factors and the additional risk factors outlined in more detail in the Annual Report on Form 10 - K under the caption “Risk Factors” and in the Company’s other SEC filings .
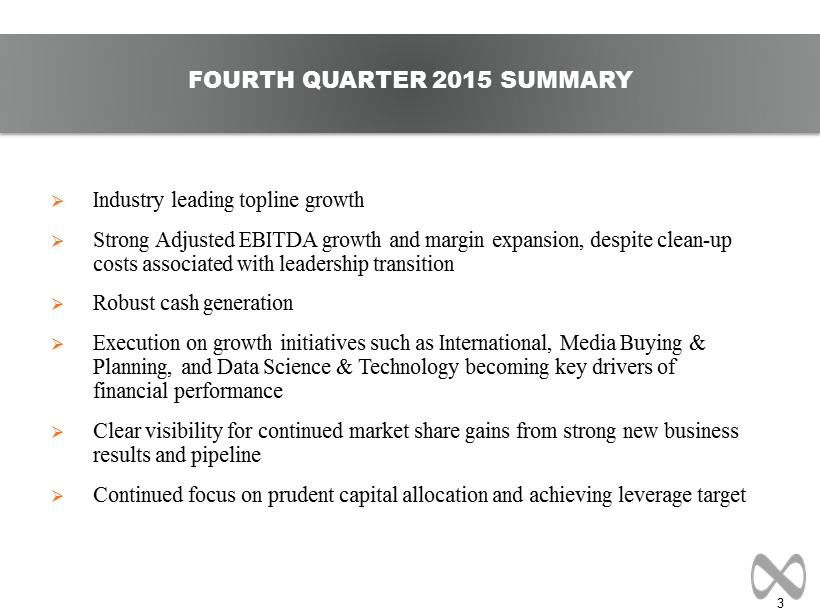
3 FOURTH QUARTER 2015 SUMMARY » Industry leading topline growth » Strong Adjusted EBITDA growth and margin expansion, despite clean - up costs associated with leadership transition » Robust cash generation » Execution on growth initiatives such as International, Media Buying & Planning, and Data Science & Technology becoming key drivers of financial performance » Clear visibility for continued market share gains from strong new business results and pipeline » Continued focus on prudent capital allocation and achieving leverage target

4 » Organic revenue growth of 7.2%, after a roughly 230 basis points reduction from significantly lower billable pass - through costs » Revenue increased 5.6% to $359.0 million from $339.9 million » Net loss attributable to MDC Partners of ($26.2) million versus ($26.8) million a year ago » Adjusted EBITDA increased 26.6% to $65.6 million from $51.8 million » Adjusted EBITDA margin at 18.3% versus 15.2% a year ago » Net new business wins of $27.4 million » Adjusted EBITDA Available for General Capital Purposes increased 42.9% to $44.5 million from $31.1 million » Declared cash dividend of $0.21 per share FOURTH QUARTER 2015 FINANCIAL HIGHLIGHTS
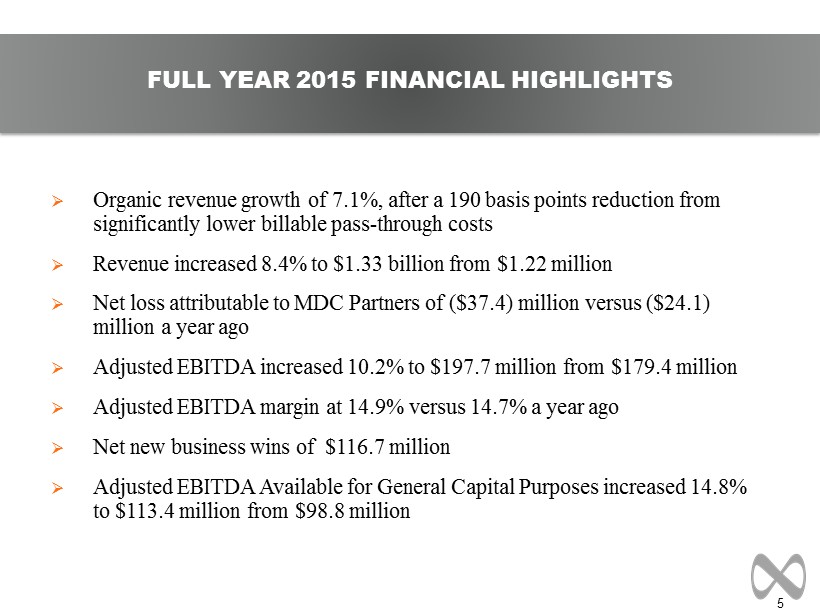
5 » Organic revenue growth of 7.1%, after a 190 basis points reduction from significantly lower billable pass - through costs » Revenue increased 8.4% to $1.33 billion from $1.22 million » Net loss attributable to MDC Partners of ($37.4) million versus ($24.1) million a year ago » Adjusted EBITDA increased 10.2% to $ 197.7 million from $179.4 million » Adjusted EBITDA margin at 14.9% versus 14.7% a year ago » Net new business wins of $116.7 million » Adjusted EBITDA Available for General Capital Purposes increased 14.8% to $113.4 million from $98.8 million FULL YEAR 2015 FINANCIAL HIGHLIGHTS
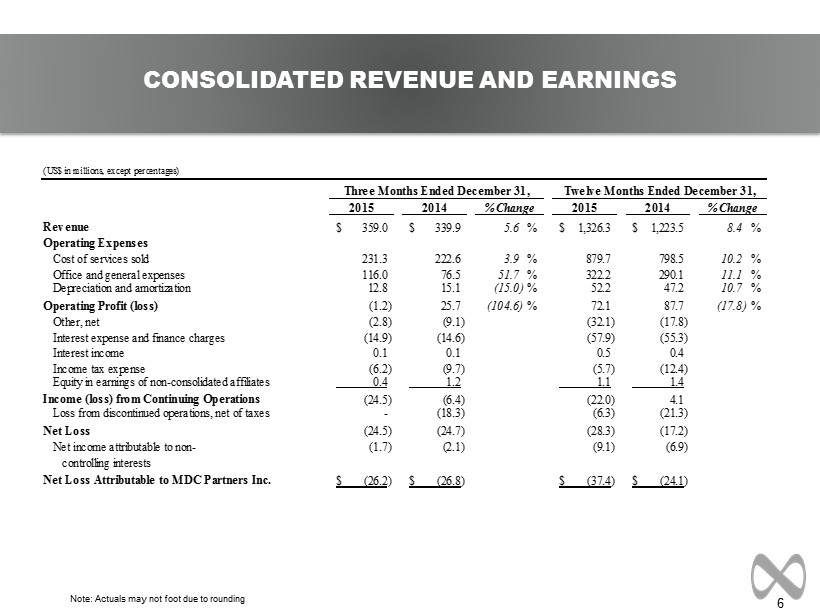
6 Note: Actuals may not foot due to rounding CONSOLIDATED REVENUE AND EARNINGS (US$ in millions, except percentages) 2015 2014 2015 2014 Revenue 359.0$ 339.9$ 5.6 % 1,326.3$ 1,223.5$ 8.4 % Operating Expenses Cost of services sold 231.3 222.6 3.9 % 879.7 798.5 10.2 % Office and general expenses 116.0 76.5 51.7 % 322.2 290.1 11.1 % Depreciation and amortization 12.8 15.1 (15.0) % 52.2 47.2 10.7 % Operating Profit (loss) (1.2) 25.7 (104.6) % 72.1 87.7 (17.8) % Other, net (2.8) (9.1) (32.1) (17.8) Interest expense and finance charges (14.9) (14.6) (57.9) (55.3) Interest income 0.1 0.1 0.5 0.4 Income tax expense (6.2) (9.7) (5.7) (12.4) Equity in earnings of non-consolidated affiliates 0.4 1.2 1.1 1.4 Income (loss) from Continuing Operations (24.5) (6.4) (22.0) 4.1 Loss from discontinued operations, net of taxes - (18.3) (6.3) (21.3) Net Loss (24.5) (24.7) (28.3) (17.2) Net income attributable to non- (1.7) (2.1) (9.1) (6.9) controlling interests Net Loss Attributable to MDC Partners Inc. (26.2)$ (26.8)$ (37.4)$ (24.1)$ % Change Three Months Ended December 31, Twelve Months Ended December 31, % Change
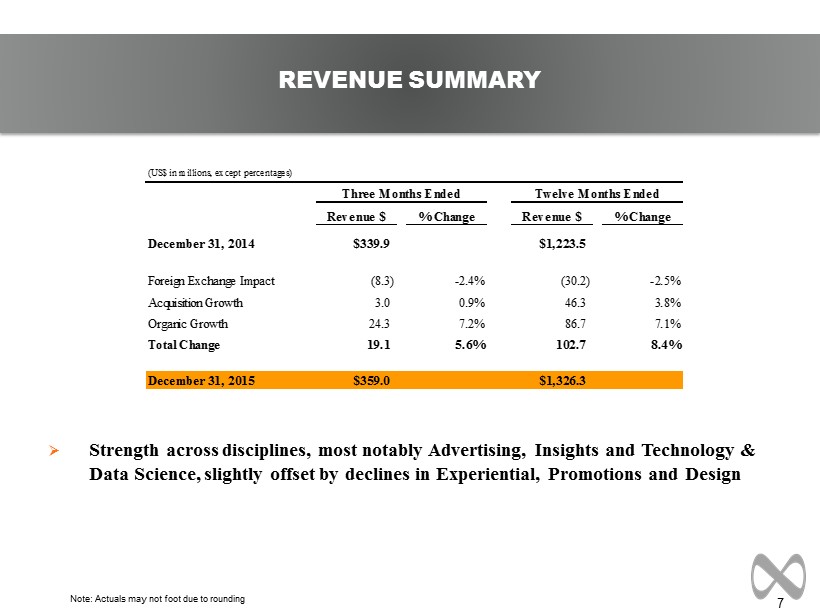
7 » Strength across disciplines, most notably Advertising, Insights and Technology & Data Science, slightly offset by declines in Experiential, Promotions and Design REVENUE SUMMARY Note: Actuals may not foot due to rounding (US$ in millions, except percentages) Revenue $ % Change Revenue $ % Change December 31, 2014 $339.9 $1,223.5 Foreign Exchange Impact (8.3) -2.4% (30.2) -2.5% Acquisition Growth 3.0 0.9% 46.3 3.8% Organic Growth 24.3 7.2% 86.7 7.1% Total Change 19.1 5.6% 102.7 8.4% December 31, 2015 $359.0 $1,326.3 Three Months Ended Twelve Months Ended

8 REVENUE BY GEOGRAPHY Note: Actuals may not foot due to rounding » Organic growth of +7.2% for Q4 and 7.1% for 2015; negatively impacted by 230 and 190 basis points, respectively, from a decline in billable pass - through costs » International organic growth of 39.9% in Q4 and 31.9% for the full year » US business strength led by Creative and Media, partially offset by Canada declines due to a difficult economy and the exit of Target from the country (US$ in millions, except percentages) % Total % Organic % Total % Organic Revenue $ Growth Growth Revenue $ Growth Growth United States $291.1 6.9% 5.9% $1,085.0 9.2% 6.4% Canada 34.2 -19.3% -4.3% 129.0 -14.2% -1.4% North America 325.4 3.4% 4.5% 1,214.1 6.1% 5.4% Other 33.6 33.9% 39.9% 112.2 40.8% 31.9% Total $359.0 5.6% 7.2% $1,326.3 8.4% 7.1% Three Months Ended December 31, Twelve Months Ended December 31,
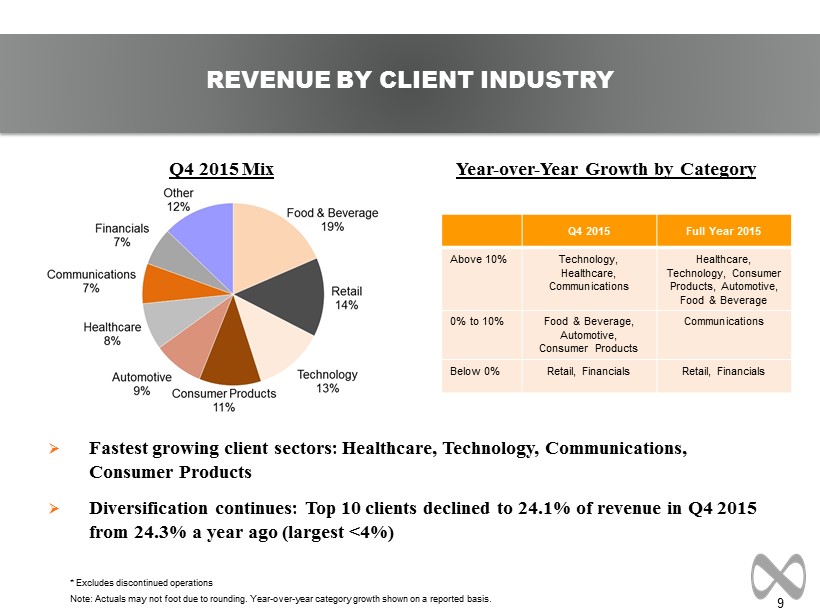
9 Q4 2015 Mix Year - over - Year Growth by Category » Fastest growing client sectors: Healthcare, Technology, Communications, Consumer Products » Diversification continues: Top 10 clients declined to 24.1% of revenue in Q4 2015 from 24.3% a year ago (largest <4%) REVENUE BY CLIENT INDUSTRY * Excludes discontinued operations Note : Actuals may not foot due to rounding. Year - over - year category growth shown on a reported basis. Q4 2015 Full Year 2015 Above 10% Technology, Healthcare, Communications Healthcare, Technology, Consumer Products, Automotive, Food & Beverage 0% to 10% Food & Beverage, Automotive, Consumer Products Communications Below 0% Retail, Financials Retail, Financials

10 ORGANIC GROWTH HIGHLIGHTS SUSTAINED MARKET SHARE GAINS Notes: (1) MDC organic growth excludes Accent (sold in Q2 2015) in all periods. (2) Peers include Omnicom, IPG, WPP, Havas and Publicis , with consensus estimates for WPP and Havas for Q4 since neither has yet reported the quarter.

11 Note: Actuals may not foot due to rounding » Adjusted EBITDA growth and margin expansion, as expected, despite clean - up costs associated with the leadership transition » In accordance with accounting standards, we re - evaluated our segment reporting due to a change in our CEO and adopted a single operating/reporting segment ADJUSTED EBITDA (1) Distributions from non - consolidated affiliates includes cash received for profit distributions as well as proceeds from the sale of non - consolidated affiliates. (2) Other items includes ( i ) one - time gains related to the former CEO's repayment to the Company for certain perquisites and expenses ($0.8 million and $11 .3 million for the three and twelve months ended December 31, 2015, respectively); (ii) legal fees and related expenses, net of insurance proceeds, relating to the ongoing SEC investigation ($0.3 million and $12.7 million for the three and twelve months ended December 31, 2015, respectively); (iii) o ne - time charge for the balance of prior cash bonus award amounts paid to the former CEO and CAO that will not be recovered ($5.8 million for the twelve months ended Dec ember 31, 2015 ) ; and (iv) write - off of certain assets related to the CEO and CAO termination ($1.1 million for the twelve months ended December 31, 2015 ). (3) Adjusted EBITDA is a non GAAP measure. See schedules 2 through 5 of the Q4 2015 press release for a reconciliation of Net lo ss to Adjusted EBITDA . (US$ in millions, except percentages) 2015 2014 2015 2014 Advertising and Communications 71.9 66.3 8.3 % 240.5 234.2 2.7 % Corporate Group (13.0) (15.3) (15.1) % (58.5) (58.0) 0.8 % Distributions from Non-consolidated Affiliates (1) 7.1 0.7 889.2 % 7.3 3.2 127.2 % Other Items, net (2) (0.5) 0.0 NM % 8.3 0.0 NM % Adjusted EBITDA (3) 65.6$ 51.8$ 26.6 % 197.7$ 179.4$ 10.2 % margin 18.3% 15.2% 14.9% 14.7% % Change Three Months Ended December 31, Twelve Months Ended December 31, % Change

12 Note: Actuals may not foot due to rounding ADJUSTED EBITDA AVAILABLE FOR GENERAL CAPITAL PURPOSES (1) Adjusted EBITDA is a non GAAP measure. See schedules 2 through 5 of the Q4 2015 press release for a reconciliation of Net loss to Adjusted EBITDA. (2) Capital Expenditures, net represents capital expenditures net of landlord reimbursements . (3) Cash Interest, net & Other represents the quarterly accrual of cash interest under our Senior Notes . (4) Adjusted EBITDA Available for General Capital Purposes is a non - GAAP measure, and represents funds available for repayment of de bt, acquisitions, deferred acquisition consideration, dividends, and other general corporate initiatives. (US$ in millions) 2015 2014 2015 2014 Adjusted EBITDA (1) $65.6 $51.8 $197.7 $179.4 Net Income Attibutable to the Noncontrolling Interests (1.7) (2.1) (9.1) (6.9) Capital Expenditures, net (2) (5.1) (5.0) (21.1) (23.1) Cash Taxes (0.5) (0.1) (1.9) (0.4) Cash Interest, net & Other (3) (13.8) (13.5) (52.2) (50.1) Adjusted EBITDA Available for General Capital Purposes (4) $44.5 $31.1 $113.4 $98.8 Three Months Ended December 31, Twelve Months Ended December 31,

13 AVAILABLE LIQUIDITY* * Subject to available borrowings under the Credit Facility. (US$ in millions) December 31, 2015 December 31, 2014 Commitment Under Facility $325.0 $325.0 Drawn 0.0 0.0 Undrawn Letters of Credit 5.0 4.8 Undrawn Commitments Under Facility $320.0 $320.2 Total Cash & Cash Equivalents 61.5 113.3 Liquidity $381.5 $433.5
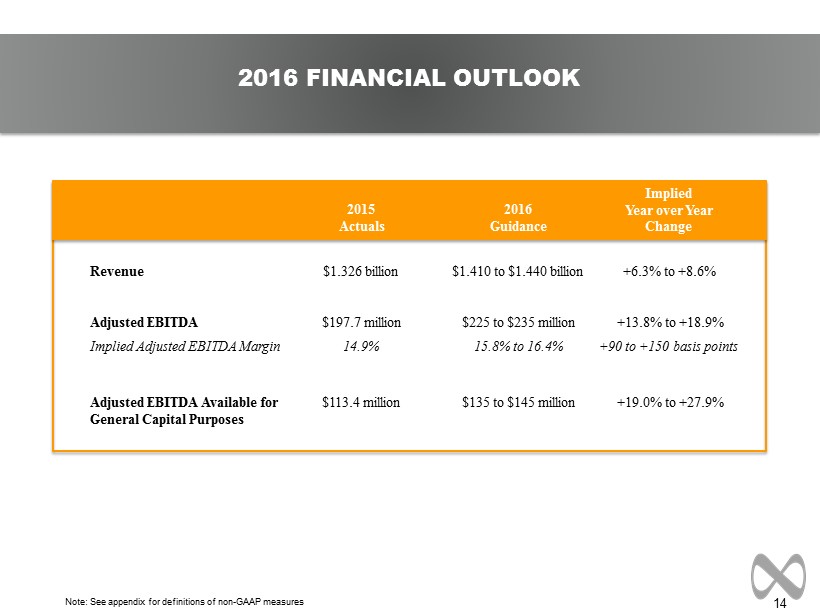
14 2016 FINANCIAL OUTLOOK Note: See appendix for definitions of non - GAAP measures Revenue Adjusted EBITDA Adjusted EBITDA Available for General Capital Purposes Implied Adjusted EBITDA Margin $1.326 billion $197.7 million $113.4 million 14.9% $1.410 to $1.440 billion $225 to $235 million $135 to $145 million 15.8% to 16.4% +6.3% to +8.6% +13.8% to +18.9% +19.0% to +27.9% +90 to +150 basis points 2015 Actuals Implied Year over Year Change 2016 Guidance

15 APPENDIX

16 TEMPORAL PUT OBLIGATIONS AND IMPACT ON EBITDA (1) This amount is in addition to $48.9 million of ( i ) options to purchase only exercisable upon termination not within the control of the Company, or death, and (ii) the excess of the initial redemption value recorded in Redeemable Noncontrolling Interests over the amount the Company would be required to pay to the holders should the Company acquire the remaining ownership interests. Incremental (US$ in millions) Cash Stock Total Income in Period 2016 2.5 0.0 2.5 1.1 2017 1.8 0.0 1.8 0.0 2018 3.3 0.1 3.4 2.4 2019 1.9 0.0 1.9 0.0 Thereafter 8.4 0.0 8.4 1.8 Total $17.9 $0.1 $18.0(1) $5.3 Effective Multiple 3.4x Estimated Put Impact at December 31, 2015 Payment Consideration

17 Note: Actuals may not foot due to rounding SUMMARY OF CASH FLOW Note: Actuals may not foot due to rounding (US$ in millions) 2015 2014 Cash flows provided by continuing operating activities $164.1 $129.4 Discontinued operations (1.3) (1.8) Net cash provided by operating activities $162.8 $127.5 Cash flows used in continuing investing activities ($47.0) ($97.6) Discontinued operations 17.1 (2.1) Net cash used in investing activities ($29.9) ($99.7) Cash flows used in continuing financing activities ($190.0) ($15.4) Discontinued operations (0.0) (0.0) Net cash used in financing activities ($190.0) ($15.4) Effect of exchange rate changes on cash and cash equivalents $5.2 ($1.1) Net increase (decrease) in cash and cash equivalents ($51.9) $11.3 Twelve Months Ended December 31,

18 Note: Actuals may not foot due to rounding REVENUE TRENDING SCHEDULE (US$ in thousands, except percentages) Q1-14 Q2-14 Q3-14 Q4-14 FY 2014 Q1-15 Q2-15 Q3-15 Q4-15 FY 2015 Revenue United States $228,833 $243,128 $249,128 $272,385 $993,474 $252,018 $271,375 $270,512 $291,146 $1,085,051 Canada 30,913 39,028 38,052 42,397 150,390 29,825 35,432 29,559 34,222 129,038 North America 259,746 282,156 287,180 314,782 1,143,864 281,843 306,807 300,071 325,368 1,214,089 Other 15,108 17,200 22,211 25,129 79,648 20,379 29,799 28,344 33,645 112,167 Total $274,854 $299,356 $309,391 $339,911 $1,223,512 $302,222 $336,606 $328,415 $359,013 $1,326,256 % of Revenue United States 83.3% 81.2% 80.5% 80.1% 81.2% 83.4% 80.6% 82.4% 81.1% 81.8% Canada 11.2% 13.0% 12.3% 12.5% 12.3% 9.9% 10.5% 9.0% 9.5% 9.7% North America 94.5% 94.3% 92.8% 92.6% 93.5% 93.3% 91.1% 91.4% 90.6% 91.5% Other 5.5% 5.7% 7.2% 7.4% 6.5% 6.7% 8.9% 8.6% 9.4% 8.5% Total 100.0% 100.0% 100.0% 100.0% 100.0% 100.0% 100.0% 100.0% 100.0% 100.0% Total Growth % United States 14.6% 12.6% 13.6% 15.6% 14.1% 10.1% 11.6% 8.6% 6.9% 9.2% Canada -3.6% 15.0% 12.3% 18.6% 10.9% -3.5% -9.2% -22.3% -19.3% -14.2% North America 12.1% 12.9% 13.4% 16.0% 13.7% 8.5% 8.7% 4.5% 3.4% 6.1% Other 33.5% 33.8% 55.8% 40.4% 41.4% 34.9% 73.3% 27.6% 33.9% 40.8% Total 13.1% 13.9% 15.7% 17.5% 15.2% 10.0% 12.4% 6.1% 5.6% 8.4% Organic Growth % United States 12.0% 9.5% 7.7% 10.5% 9.9% 6.9% 6.6% 6.1% 5.9% 6.4% Canada -2.2% 3.5% 14.0% 22.1% 9.7% 3.2% 2.1% -5.5% -4.3% -1.4% North America 10.0% 8.7% 8.5% 12.1% 9.9% 6.5% 6.0% 4.6% 4.5% 5.4% Other 29.0% 27.8% 37.4% 19.5% 27.8% 23.7% 45.5% 20.0% 39.9% 31.9% Total 10.9% 9.6% 10.1% 12.5% 10.8% 7.4% 8.3% 5.7% 7.2% 7.1% 2014 2015

19 Note: Actuals may not foot due to rounding DEFINITION OF NON - GAAP MEASURES Adjusted EBITDA: Adjusted EBITDA is a non - GAAP measure, that represents operating profit plus depreciation and amortization, stock - based compensation, acquisition deal costs, deferred acquisition consideration adjustments, distributions from non - consolidated affiliates and other non - recurring items. Organic Growth: Organic revenue growth is a non - GAAP measure that refers to growth in revenues from sources other than acquisitions or foreign exchange impacts. Adjusted EBITDA Available for General Capital Purposes: Adjusted EBITDA Available for General Capital Purposes is a non - GAAP measure, and represents funds available for repayment of debt, acquisitions, deferred acquisition consideration, dividends, and other general corporate initiatives . Net Bank Debt or Net Debt: Debt due pertaining to the revolving credit facility plus debt pertaining to the Senior Notes less total cash and cash equivalents. Note: A reconciliation of Non - GAAP to US GAAP reported results has been provided by the Company in the tables included in the earnings release issued on February 18, 2016.

MDC Partners Innovation Center 745 Fifth Avenue, Floor 19 New York, NY 10151 646 - 429 - 1800 www.mdc - partners.com
Exhibit 99.3

PRESS RELEASE FOR IMMEDIATE ISSUE
| FOR: | MDC Partners Inc. | CONTACT: | Matt Chesler, CFA | |
| 745 Fifth Avenue, 19th Floor | VP, Investor Relations | |||
| New York, NY 10151 | 646-412-6877 | |||
| [email protected] | ||||
MDC Partners Declares Quarterly Dividend of $0.21 Per Share
New York, NY, February 18, 2016 (NASDAQ: MDCA) – MDC Partners Inc. ("MDC Partners" or the "Company") today announced that its Board of Directors has declared a cash dividend of $0.21 per share on all of its outstanding Class A shares and Class B shares. The quarterly dividend will be payable on or about March 18, 2016 to shareholders of record at the close of business on March 4, 2016.
About MDC Partners Inc.
MDC Partners is one of the fastest-growing and most influential marketing and communications networks in the world. Its 50+ advertising, public relations, branding, digital, social and event marketing agencies are responsible for some of the most memorable and engaging campaigns for the world’s most respected brands. As "The Place Where Great Talent Lives," MDC Partners is known for its unique partnership model, empowering the most entrepreneurial and innovative talent to drive competitive advantage and business growth for clients. By leveraging technology, data analytics, insights, and strategic consulting solutions, MDC Partners drives measurable results and optimizes return on marketing investment for over 1,500 clients worldwide.
For more information about MDC Partners and its partner firms, visit www.mdc-partners.com and follow us on Twitter: http://www.twitter.com/mdcpartners.
This press release contains forward-looking statements within the meaning of section 27A of the Securities Act of 1933 and Section 21E of the Securities Exchange Act of 1934. These forward-looking statements involve risks and uncertainties which may cause the actual results or objectives to be materially different from those expressed or implied by such forward-looking statements. Such risk factors include, among other things, the Company’s financial performance; risks associated with the SEC’s ongoing investigation of the Company; risks associated with the effects of economic downturns; ability to attract and retain key clients; ongoing compliance with debt agreements and the Company’s ability to satisfy contingent payment obligations when due; and other risk factors set forth in the Company’s Form 10-K for its fiscal year ended December 31, 2015 and subsequent SEC filings.
###
Exhibit 99.4
PRESS RELEASE FOR IMMEDIATE ISSUE
| FOR: | MDC Partners Inc. | CONTACT: | Matt Chesler, CFA | |
| 745 5th Avenue, 19th Floor | Vice President, Investor Relations | |||
| New York, NY 10151 | 646-412-6877 | |||
| [email protected] | ||||
MDC Partners Appoints Larry Kramer and Anne Marie O’Donovan to Board of Directors
Addition of Two High Caliber Directors Enhances Expertise and Independence of MDC Board
New York, NY, February 18, 2016 (NASDAQ: MDCA) – MDC Partners Inc. announced today that Larry Kramer and Anne Marie O’Donovan have been elected to its Board of Directors, effective March 1, 2016. Kramer was the founder, Chairman and CEO of MarketWatch Inc., past President and Publisher of USA Today, and presently serves as Chairman of the board of TheStreet, Inc. and on the Board of Gannett. O’Donovan is the past Executive Vice President of Scotiabank and a longtime partner at Ernst & Young, and presently serves on the board of Indigo Books and Music. With these additions, MDC has enhanced the expertise and independence of its board, demonstrating its ongoing commitment to the highest standards of corporate governance.
“We are thrilled to have bolstered our board with the addition of these two talented and experienced independent directors,” said Scott Kauffman, Chairman & CEO of MDC Partners. “Larry has been one of the pioneers in digital media since the dawn of the internet, with decades of leadership experience as an executive and board member of private and public companies, and will be a great strategic advisor to MDC. Anne Marie is one of Canada’s most accomplished executives, and brings an excellent track record of experience in financial services, governance and risk management. I look forward to continuing to build on these important steps with additional director appointments in the months ahead.”
Kramer brings to the MDC Board of Directors unmatched experience in building consumer media brands that leverage emerging digital technology and in helping established media properties navigate the shifting consumer landscape. In founding and running MarketWatch Inc. through its IPO in 1990 and later sale to Dow Jones in 2005, Kramer built a leading financial media brand that endures to this day. He then became the first president of CBS Digital Media, where he created a new Digital Media division encompassing all new media operations for the network, including online, interactive and wireless initiatives. While at the helm of USA Today, Kramer helped drive the newspaper into the digital era by modernizing its content and distribution model. He has also proven to be a valuable advisor to a diverse range of consumer-oriented media and technology companies.
“MDC Partners represents the best, brightest and most creative minds in the industry helping a world-class roster of clients tell their stories across virtually every form of media and every possible platform. This is a great company with terrific leadership and a supportive and enthusiastic board that I'm honored to join. For my part, I get to be part of a progressive company as it navigates the dramatically changing world of media,” said Kramer.
O’Donovan is an experienced strategic senior executive, public company board member, and CPA, with over 30 years of Canadian and global financial services industry expertise. She brings in-depth knowledge in the areas of executive leadership, risk management, regulatory, governance, financial management, technology, operations and internal audit. Most recently she served as Executive Vice President and Chief Administrative Officer for Global Banking and Markets of Scotiabank, a leading financial services provider that operates in over 55 countries with 89,000 employees worldwide, and prior to that had a long, distinguished career at Ernst & Young as Partner.
“I'm very excited to be joining the MDC Board at this point in the company's evolution. I see tremendous strength in the MDC partnership model. The combination of the experienced MDC executive leadership team, the incredible creative storytellers across the MDC partner agencies, and a unique culture of entrepreneurialism represents a powerful platform for future growth,” said O’Donovan.
About MDC Partners Inc.
MDC Partners is one of the fastest-growing and most influential marketing and communications networks in the world. Its 50+ advertising, public relations, branding, digital, social and event marketing agencies are responsible for some of the most memorable and engaging campaigns for the world’s most respected brands. As "The Place Where Great Talent Lives," MDC Partners is known for its unique partnership model, empowering the most entrepreneurial and innovative talent to drive competitive advantage and business growth for clients. By leveraging technology, data analytics, insights, and strategic consulting solutions, MDC Partners drives measurable results and optimizes return on marketing investment for over 1,700 clients worldwide.
For more information about MDC Partners and its partner firms, visit www.mdc-partners.com and follow us on Twitter: http://www.twitter.com/mdcpartners.
###
Serious News for Serious Traders! Try StreetInsider.com Premium Free!
You May Also Be Interested In
- BALYO Announces Its Sales for the 1st Quarter of 2024 at €5.2 Million
- Rising Malaria Threat: International SOS Shares Advice on How to Keep Your Workforce Healthy
- Oxford Park Income Fund, Inc. Provides March Net Asset Value Update
Create E-mail Alert Related Categories
SEC FilingsSign up for StreetInsider Free!
Receive full access to all new and archived articles, unlimited portfolio tracking, e-mail alerts, custom newswires and RSS feeds - and more!
