

Form 6-K IAMGOLD CORP For: Feb 17
 Tweet
Tweet Share
ShareFORM 6-K
UNITED STATES
SECURITIES AND EXCHANGE COMMISSION
Washington, D.C. 20549
Report of Foreign Private Issuer
Pursuant to Rule 13a-16 or 15d-16
of the Securities Exchange Act of 1934
Date: February 17, 2016
Commission File Number 001-31528
IAMGOLD Corporation
(Translation of registrant’s name into English)
401 Bay Street Suite 3200, PO Box 153
Toronto, Ontario, Canada M5H 2Y4
Tel: (416) 360-4710
(Address of principal executive offices)
Indicate by check mark whether the registrant files or will file annual reports under cover Form 20-F or Form 40-F.
Form 20-F ¨ Form 40-F x
Indicate by check mark if the registrant is submitting the Form 6-K in paper as permitted by Regulation S-T Rule 101(b)(1):
Note: Regulation S-T Rule 101(b)(1) only permits the submission in paper of a Form 6-K if submitted solely to provide an attached annual report to security holders.
Indicate by check mark if the registrant is submitting the Form 6-K in paper as permitted by Regulation S-T Rule 101(b)(7):
Note: Regulation S-T Rule 101(b)(7) only permits the submission in paper of a Form 6-K if submitted to furnish a report or other document that the registrant foreign private issuer must furnish and make public under the laws of the jurisdiction in which the registrant is incorporated, domiciled or legally organized (the registrant’s “home country”), or under the rules of the home country exchange on which the registrant’s securities are traded, as long as the report or other document is not a press release, is not required to be and has not been distributed to the registrant’s security holders, and, if discussing a material event, has already been the subject of a Form 6-K submission or other Commission filing on EDGAR.
Indicate by check mark whether by furnishing the information contained in this Form, the registrant is also thereby furnishing the information to the Commission pursuant to Rule 12g3-2(b) under the Securities Exchange Act of 1934.
Yes ¨ No x
If “Yes” is marked, indicate below the file number assigned to the registrant in connection with Rule 12g3-2(b): 82-
Description of Exhibit
| Exhibit |
Description of Exhibit | |
| 99.1 | Technical Report on the Essakane Gold Mine, Sahel Region, Burkina Faso dated February 17, 2016 | |
-2-
Signatures
Pursuant to the requirements of the Securities Exchange Act of 1934, the registrant has duly caused this report to be signed on its behalf by the undersigned, thereunto duly authorized.
| IAMGOLD CORPORATION | ||||||||
| Date: February 17, 2016 | By: | /s/ Tim Bradburn |
||||||
| Vice President, Legal and Corporate Secretary | ||||||||
-3-
Exhibit 99.1

IAMGOLD CORPORATION
TECHNICAL REPORT ON THE
ESSAKANE GOLD MINE,
SAHEL REGION, BURKINA FASO
NI 43-101 Report
Qualified Persons:
Lise Chénard, ing.
Réjean Sirois, P.Eng.
Louis-Pierre Gignac, M.Sc.A., ing.
Jérôme Girard, ing., P.Eng.
Philippe Gauthier, ing.
Gilles Ferlatte, ing.
Bruno Lemelin, Ph.D., ing., P.Eng.
February 17, 2016
Effective Date: December 31, 2015
IAMGOLD Corporation 401 Bay Street, Suite 3200, Toronto, Ontario M5H 2Y4 I T +1 416-360-4710 I www.iamgold.com

TABLE OF CONTENTS
| PAGE | ||||
| 1 SUMMARY |
1-1 | |||
| Executive Summary |
1-1 | |||
| Economic Analysis |
1-5 | |||
| Technical Summary |
1-5 | |||
| 2 INTRODUCTION |
2-1 | |||
| 3 RELIANCE ON OTHER EXPERTS |
3-1 | |||
| 4 PROPERTY DESCRIPTION AND LOCATION |
4-1 | |||
| Mining Permit |
4-1 | |||
| Exploration Permits |
4-5 | |||
| Surface Rights |
4-8 | |||
| Permitting Requirements and Status of Permits |
4-8 | |||
| Discussion |
4-9 | |||
| 5 ACCESSIBILITY, CLIMATE, LOCAL RESOURCES, INFRASTRUCTURE AND PHYSIOGRAPHY |
5-1 | |||
| 6 HISTORY |
6-1 | |||
| Ownership, Exploration and Development History |
6-1 | |||
| Historical Mineral Resource Estimates |
6-5 | |||
| Past Production |
6-5 | |||
| 7 GEOLOGICAL SETTING AND MINERALIZATION |
7-1 | |||
| Regional Geology |
7-1 | |||
| Local Geology |
7-5 | |||
| Property Geology |
7-8 | |||
| Mineralization |
7-10 | |||
| Weathering |
7-18 | |||
| Gold Mineralogy |
7-21 | |||
| Structural Controls on Mineralization |
7-21 | |||
| 8 DEPOSIT TYPES |
8-1 | |||
| 9 EXPLORATION |
9-1 | |||
| 10 DRILLING |
10-1 | |||
| Diamond Drilling |
10-3 | |||
| Reverse Circulation Drilling |
10-5 | |||
| Logging |
10-10 | |||
| 11 SAMPLE PREPARATION, ANALYSES AND SECURITY |
11-1 | |||
| Sample Preparation and Analysis |
11-1 | |||
| Sample Security |
11-4 | |||
| Quality Assurance and Quality Control |
11-5 | |||
| 12 DATA VERIFICATION |
12-1 | |||
| IAMGOLD Corporation - Essakane Gold Mine Technical Report NI 43-101 – February 17, 2016 |
Page i |
| 13 MINERAL PROCESSING AND METALLURGICAL TESTING |
13-1 | |||
| 14 MINERAL RESOURCE ESTIMATE |
14-1 | |||
| Summary |
14-1 | |||
| EMZ Deposit |
14-2 | |||
| Falagountou Deposits |
14-41 | |||
| Constrained Mineral Resources |
14-69 | |||
| Sensitivity to Gold Price |
14-79 | |||
| Comparison to Previous Models |
14-82 | |||
| 15 MINERAL RESERVE ESTIMATE |
15-1 | |||
| Summary |
15-1 | |||
| Resource Models |
15-1 | |||
| Dilution and Mining Losses |
15-2 | |||
| Extraction |
15-2 | |||
| Cut-off Grade |
15-2 | |||
| Mineral Reserve Estimates |
15-5 | |||
| 16 MINING METHODS |
16-1 | |||
| Dewatering |
16-3 | |||
| Mine Design |
16-4 | |||
| Five-Year Plan |
16-5 | |||
| 17 RECOVERY METHODS |
17-1 | |||
| 18 PROJECT INFRASTRUCTURE |
18-1 | |||
| 19 MARKET STUDIES AND CONTRACTS |
19-1 | |||
| Markets |
19-1 | |||
| Contracts |
19-1 | |||
| 20 ENVIRONMENTAL STUDIES, PERMITTING, AND SOCIAL OR COMMUNITY IMPACT |
20-1 | |||
| Environmental and Social Studies |
20-1 | |||
| Essakane Gold Mine Expansion Permitting |
20-1 | |||
| Social and Community Assessment |
20-3 | |||
| Waste and Tailing Disposal, Site Monitoring, and Water Management |
20-4 | |||
| Mine Closure Requirements and Costs |
20-7 | |||
| 21 CAPITAL AND OPERATING COSTS |
21-1 | |||
| Capital Costs |
21-1 | |||
| Operating Costs |
21-6 | |||
| 22 ECONOMIC ANALYSIS |
22-1 | |||
| 23 ADJACENT PROPERTIES |
23-1 | |||
| 24 OTHER RELEVANT DATA AND INFORMATION |
24-1 | |||
| 25 INTERPRETATION AND CONCLUSIONS |
25-1 | |||
| 26 RECOMMENDATIONS |
26-1 | |||
| 27 REFERENCES |
27-1 | |||
| IAMGOLD Corporation - Essakane Gold Mine Technical Report NI 43-101 – February 17, 2016 |
Page ii |
| 28 DATE AND SIGNATURE PAGE |
28-1 | |||
| 29 CERTIFICATE OF QUALIFIED PERSON |
29-1 | |||
LIST OF TABLES
| PAGE | ||||
| Table 1-1 Summary of Mineral Resources – December 31, 2015 |
1-2 | |||
| Table 1-2 Mineral Reserves – December 31, 2015 |
1-2 | |||
| Table 1-3 LOM and Five Year Plan Operating Costs |
1-15 | |||
| Table 4-1 Essakane Mining Permit Boundary Coordinates |
4-2 | |||
| Table 4-2 Exploration Permit Details |
4-6 | |||
| Table 4-3 Exploration Permit Coordinates |
4-7 | |||
| Table 4-4 Environmental and Mining Permit Requirements and Status |
4-9 | |||
| Table 6-1 Historical Mineral Resource Estimates |
6-5 | |||
| Table 6-2 CEMOB Heap Leach Plant Production 1992-1999 |
6-6 | |||
| Table 6-3 Essakane Mine and Mill Production 2010-2015 |
6-6 | |||
| Table 7-1 Gold Grade Distribution According to Vein Sets |
7-17 | |||
| Table 10-1 Essakane Drilling Programs 1995 to 2015 |
10-3 | |||
| Table 11-1 DD Preparation and Assaying Protocol |
11-2 | |||
| Table 11-2 RC Preparation and Assaying Protocol |
11-3 | |||
| Table 11-3 List of Certified Reference Materials |
11-5 | |||
| Table 11-4 List of Local Blanks |
11-6 | |||
| Table 13-1 Comminution Parameter Summary |
13-2 | |||
| Table 13-2 Recoveries per Rock Type |
13-5 | |||
| Table 14-1 Summary of Mineral Resources – December 31, 2015 |
14-2 | |||
| Table 14-2 Content of the Resource Database |
14-3 | |||
| Table 14-3 New Drill Hole Data |
14-5 | |||
| Table 14-4 Surfaces and Solids Used for the Mineral Resource Estimate |
14-8 | |||
| Table 14-5 Brown Index of Soil and Rock Strength |
14-10 | |||
| Table 14-6 Statistics of the Assays Grouped by Domain |
14-17 | |||
| Table 14-7 Statistics of the 5 m Composites by Domain |
14-18 | |||
| Table 14-8 Student’s and Mann-Whitney Matrix Test Results |
14-20 | |||
| Table 14-9 Excluded Density Measurements |
14-21 | |||
| Table 14-10 Statistics of the Density Measurements by Domain |
14-22 | |||
| Table 14-11 Semi-Variogram Profiles Used for EMZ and North Satellite’s Domains |
14-24 | |||
| Table 14-12 EMZ Block Model Parameters |
14-25 | |||
| Table 14-13 Final Block Model Attributes |
14-25 | |||
| Table 14-14 Rock Codes Found in the Rock Type Attribute |
14-27 | |||
| Table 14-15 Default Density Values Used in the Block Model |
14-28 | |||
| Table 14-16 Interpolation Details for the Density Estimation |
14-29 | |||
| Table 14-17 Soft and Hard Boundaries Used for the Density Interpolation |
14-29 | |||
| Table 14-18 List of Rock Codes Treated by the Interpolation Profiles and Associated Variography Profiles – EMZ & North Satellite | 14-30 | |||
| Table 14-19 Description of the Grade Interpolation Passes – EMZ and North Satellite |
14-31 | |||
| Table 14-20 Grade Interpolation - EMZ South |
14-32 | |||
| Table 14-21 Anisotropy Search Ellipse - EMZ South |
14-32 | |||
| Table 14-22 Comparison of Kriged Blocks and Mean Composite Grades |
14-37 | |||
| IAMGOLD Corporation - Essakane Gold Mine Technical Report NI 43-101 – February 17, 2016 |
Page iii |
| Table 14-23 Types of Holes Used for the Resource Estimate |
14-43 | |||
| Table 14-24 Rock Code Description |
14-46 | |||
| Table 14-25 Summary of the Manipulations Executed to Create the Weathering Solids |
14-47 | |||
| Table 14-26 Rock Codes and Average Thickness - Falagountou West Deposit |
14-49 | |||
| Table 14-27 Rock Codes and Average Thickness - Falagountou East Deposit |
14-50 | |||
| Table 14-28 Statistics of Au Assays by Mineralized Zone - Falagountou West and East Deposits |
14-52 | |||
| Table 14-29 Gold Capping Values |
14-54 | |||
| Table 14-30 Statistics of Composites by Mineralized Zone - Falagountou West and East Deposits |
14-55 | |||
| Table 14-31 Statistics of Specific Gravity Samples |
14-55 | |||
| Table 14-32 Variogram Models for Gold Capped Composites - Falagountou West and East Deposits |
14-56 | |||
| Table 14-33 Block Models Settings |
14-57 | |||
| Table 14-34 List of Attributes Found in the Block Models |
14-57 | |||
| Table 14-35 Background Density Values Used in the Model |
14-58 | |||
| Table 14-36 Density Interpolation Parameters |
14-58 | |||
| Table 14-37 Basic Statistics of Block Model Density by Weathering Profile |
14-59 | |||
| Table 14-38 Interpolation Profile Settings |
14-60 | |||
| Table 14-39 Search Ellipse Names - Falagountou West Deposit |
14-61 | |||
| Table 14-40 Search Ellipsoid Settings - Falagountou West Deposit |
14-61 | |||
| Table 14-41 Search Ellipsoid Settings - Falagountou East Deposit |
14-61 | |||
| Table 14-42 High Grade Transition Values Used in the Search Ellipse Profiles - Falagountou West Deposit | 14-62 | |||
| Table 14-43 Average Composite versus Block Grades - Falagountou West Deposit |
14-65 | |||
| Table 14-44 Average Composite versus Block Grades - Falagountou East Deposit |
14-66 | |||
| Table 14-45 Comparison of ID3 versus OK Interpolations - Falagountou West Deposit |
14-67 | |||
| Table 14-46 Comparison of ID3 versus OK Interpolations - Falagountou East Deposit |
14-67 | |||
| Table 14-47 Stockpile Status as of December 31, 2015 |
14-72 | |||
| Table 14-48 Essakane Gold Mine December 31, 2015 Consolidated Mineral Resources |
14-75 | |||
| Table 14-49 Constrained Mineral Resource Sensitivity to Selected Cut-off Grades |
14-76 | |||
| Table 14-50 Indicated Mineral Resource Sensitivity - Falagountou West and East Deposits Combined | 14-78 | |||
| Table 14-51 EMZ and Falagountou Deposits Cut-off Grades for Varying Gold Prices |
14-82 | |||
| Table 14-52 Comparison of Mineral Resources as of December 31, 2015 to Mineral Resources as of December 31, 2014 | 14-84 | |||
| Table 14-53 Constrained Mineral Resource Comparison - Falagountou Deposits (West and East Combined) | 14-86 | |||
| Table 15-1 Mineral Reserves – December 31, 2015 |
15-1 | |||
| Table 15-2 Pit Optimization Economic Assumptions |
15-3 | |||
| Table 15-3 Summary of 2015 COGs at US$1,200/oz |
15-4 | |||
| Table 15-4 Summary of EMZ Pit Optimization Parameters & COG |
15-4 | |||
| Table 15-5 Summary of Falagountou Pit Optimization Parameters and COG |
15-5 | |||
| Table 15-6 Essakane Gold Mine December 31, 2015 Consolidated Mineral Reserves |
15-7 | |||
| Table 15-7 Mineral Reserve Evolution |
15-9 | |||
| Table 15-8 Essakane Gold Mine Mineral Reserve Gains and Losses (from December 31, 2014 to December 31, 2015) | 15-10 | |||
| Table 16-1 Essakane Gold Mine Historical Production |
16-1 | |||
| Table 16-2 Current Primary Mine Equipment Fleet |
16-3 | |||
| Table 16-3 EMZ Pit Design Parameters |
16-4 |
| IAMGOLD Corporation - Essakane Gold Mine Technical Report NI 43-101 – February 17, 2016 |
Page iv |
| Table 16-4 Falagountou Pit Design Parameters |
16-4 | |||
| Table 16-5 Essakane Gold Mine Five-Year Mine Plan |
16-5 | |||
| Table 17-1 Mill Production Since Commissioning in July 2010 |
17-3 | |||
| Table 17-2 2015 Actual Mill Production |
17-4 | |||
| Table 17-3 2014 and 2015 Actual Milling Summary Compared to Mine Plan |
17-5 | |||
| Table 19-1 Material Contracts More than C$5 Million/Year at the Essakane Gold Mine |
19-1 | |||
| Table 21-1 Major Equipment Purchase Schedule |
21-5 |
LIST OF FIGURES
| PAGE | ||||
| Figure 4-1 Location Map |
4-3 | |||
| Figure 4-2 Essakane Mining and Exploration Permits |
4-4 | |||
| Figure 5-1 Mine Infrastructure |
5-3 | |||
| Figure 6-1 Ownership History |
6-4 | |||
| Figure 7-1 Location of Oudalan-Gorouol Greenstone Belt within West African Craton |
7-3 | |||
| Figure 7-2 Regional Geological Setting |
7-4 | |||
| Figure 7-3 Property Geological Setting |
7-6 | |||
| Figure 7-4 Local Geological Map of the Oudalan-Gorouol Greenstone Belt |
7-7 | |||
| Figure 7-5 Property Geology |
7-9 | |||
| Figure 7-6 Geological Map of the EMZ Deposit Level 240 |
7-11 | |||
| Figure 7-7 EMZ Deposit Cross-Section (51,750N) |
7-12 | |||
| Figure 7-8 Quartz Vein Orientations (from Pit Mapping) |
7-13 | |||
| Figure 7-9 Vein Displacements Along Minor Thrusts (West Wall EMZ Deposit) |
7-15 | |||
| Figure 7-10 CDF of Vein Sets Au Grade |
7-17 | |||
| Figure 7-11 Total Magnetic Map of Falagountou Area |
7-20 | |||
| Figure 9-1 Essakane Structural Interpretation Map |
9-3 | |||
| Figure 10-1 EMZ Deposit Drill Plan as of 2015 Year End |
10-6 | |||
| Figure 10-2 EMZ Deposit - Typical Cross Section (51,600N) |
10-7 | |||
| Figure 10-3 Falagountou Deposit Drill Plan as of 2015 Year End |
10-8 | |||
| Figure 10-4 Falagountou West Deposit - Typical Cross Section |
10-9 | |||
| Figure 11-1 Standard OXJ95 Plot |
11-7 | |||
| Figure 11-2 Blank GRT01 Plot |
11-7 | |||
| Figure 11-3 Field Duplicate Vs. Original Scatterplot |
11-8 | |||
| Figure 11-4 Log-Log Duplicate Plot |
11-8 | |||
| Figure 11-5 Hard Plot vs. Rank Percentile |
11-9 | |||
| Figure 14-1 Plan Views Showing the Location of All Drill Hole Collars and the New Drill Holes |
14-4 | |||
| Figure 14-2 Plan View Showing the Three Area Limits |
14-6 | |||
| Figure 14-3 Section 52,275N – EMZ Weathering Surfaces |
14-11 | |||
| Figure 14-4 Isometric View – EMZ Lithological Model |
14-12 | |||
| Figure 14-5 Section 51,825N – EMZ Lithological Model |
14-12 | |||
| Figure 14-6 Isometric View – EMZ and North Satellite Litho-structural Model |
14-13 | |||
| Figure 14-7 Section 52,675N – North Satellite Zone Litho-structural Model |
14-14 | |||
| Figure 14-8 Isometric View –EMZ South Mineralization Envelopes |
14-15 | |||
| Figure 14-9 Section 49,350N – EMZ South Mineralization Envelopes |
14-15 | |||
| Figure 14-10 Section 51,000N – Example of Domain Coding |
14-16 | |||
| Figure 14-11 Swath Plot for Indicated Resources - EMZ and North Satellite |
14-39 | |||
| IAMGOLD Corporation - Essakane Gold Mine Technical Report NI 43-101 – February 17, 2016 |
Page v |
| Figure 14-12 Swath Plot for Inferred Resources - EMZ and North Satellite |
14-40 | |||
| Figure 14-13 Plan View of the Drill Holes |
14-42 | |||
| Figure 14-14 Drill Hole Grid Spacing for Falagountou West and East Deposits |
14-44 | |||
| Figure 14-15 Intrusive Solid - Falagountou West Deposit |
14-45 | |||
| Figure 14-16 Illustration of Weathering Solids Creation Techniques |
14-48 | |||
| Figure 14-17 Mineralization Zones - Falagountou West Deposit |
14-50 | |||
| Figure 14-18 Mineralization Zones - Falagountou East Deposit |
14-51 | |||
| Figure 14-19 Histograms and Cumulative Probability Plots for Zones 250 and 255 |
14-53 | |||
| Figure 14-20 Resource Categories - Falagountou West Deposit |
14-63 | |||
| Figure 14-21 Resource Categories - Falagountou East Deposit |
14-64 | |||
| Figure 14-22 Swath Plot of Indicated Resources - Falagountou West |
14-68 | |||
| Figure 14-23 Swath Plot of Indicated Resources - Falagountou East |
14-69 | |||
| Figure 14-24 Isometric View of EMZ Deposit Gold Grade Distribution Inside US$1,500/oz Whittle Pit Shell | 14-71 | |||
| Figure 14-25 Isometric View of EMZ Deposit Resource Classification inside US$1,500/oz Whittle Pit Shell | 14-71 | |||
| Figure 14-26 Constrained Mineral Resources: (A) Gold Grades and (B) Resource Categories - Falagountou West Deposit | 14-73 | |||
| Figure 14-27 Constrained Mineral Resources: (A) Gold Grades and (B) Resource Categories - Falagountou East Deposit | 14-74 | |||
| Figure 14-28 Indicated and Inferred Mineral Resource Grade-Tonnage Curves for Selected Cut-off Grades | 14-77 | |||
| Figure 14-29 Grade - Tonnage Curves of Constrained Indicated Mineral Resource Estimate for Selected Gold Cut-off Grades | 14-79 | |||
| Figure 14-30 EMZ and Falagountou Deposits Indicated and Inferred Mineral Resource Sensitivity to Gold Prices (Sap+Trans+Rock) | 14-80 | |||
| Figure 14-31 EMZ Deposit Indicated and Inferred Mineral Resources Sensitivity to Gold Price |
14-81 | |||
| Figure 14-32 Mineral Resource Sensitivity to Gold Price - Falagountou Deposits |
14-82 | |||
| Figure 14-33 EMZ and Falagountou Waterfall Graph Showing Evolution of the Mineral Resource through 2015 | 14-88 | |||
| Figure 14-34 EMZ Waterfall Graph Showing Evolution of the Mineral Resource through 2015 |
14-89 | |||
| Figure 14-35 Falagountou Waterfall Graph Showing Evolution of the Mineral Resource through 2015 |
14-90 | |||
| Figure 15-1 Essakane Gold Mine Mineral Reserves Waterfall Graph – December 31, 2013 to December 31, 2015 | 15-8 | |||
| Figure 16-1 Five-Year Mining Production by Phase |
16-6 | |||
| Figure 17-1 Mineral Processing Flow Sheet |
17-2 | |||
| Figure 17-2 Historical Evolution of Recoveries and Head Grades |
17-4 | |||
| Figure 18-1 Site Layout |
18-5 | |||
| Figure 21-1 LOM Capital Expenditures |
21-2 | |||
| Figure 21-2 Capitalized Waste Stripping per Phase |
21-4 | |||
| Figure 21-3 Mining Equipment Capital (Included in Mine Sustaining Capital) |
21-5 | |||
| Figure 21-4 Top Five Mining Cost Categories |
21-6 | |||
| Figure 21-5 Top Five Milling Cost Categories |
21-7 | |||
| Figure 21-6 Top Five G&A Cost Categories |
21-8 | |||
| Figure 21-7 Operating Cost Metrics |
21-8 |
| IAMGOLD Corporation - Essakane Gold Mine Technical Report NI 43-101 – February 17, 2016 |
Page vi |
1 SUMMARY
EXECUTIVE SUMMARY
IAMGOLD Corporation (IAMGOLD) has prepared a Technical Report for the Essakane Gold Mine, located in the Sahel region of Burkina Faso. The purpose of this Technical Report is to support the disclosure of the December 31, 2015 Essakane Gold Mine Mineral Resources and Mineral Reserves estimate.
The Essakane Gold Mine consists of one mining permit (the Essakane Mining Permit), which contains the Essakane main zone deposit (EMZ deposit) and the Falagountou deposit, and seven exploration permits (the Essakane Exploration Permits), all located on contiguous ground. In April 2008, the Essakane Mining Permit was granted to Essakane S.A., a Burkinabé company created for the purpose of developing and operating the Essakane Gold Mine. IAMGOLD owns a 90% interest in Essakane S.A., while the Government of Burkina Faso has a 10% free-carried interest.
The Essakane Gold Mine has been in operation since July 2010. Mining is carried out using a conventional drill, blast, load, and haul surface mining method with an owner fleet. The annual mining rate was 48.7 million tonnes (Mt) in 2015 with a stripping ratio of 3.24, including 11.52 Mt of ore at an average grade of 1.14 g/t Au, for a total of 426,000 oz of gold.
Essakane ore is processed using two stages of crushing, semi-autogenous grinding, ball mill grinding, pebble crusher grinding (SABC), gravity concentration, and a carbon-in-leach (CIL) gold plant.
The Mineral Resource estimate at December 31, 2015 for the Essakane Gold Mine is summarized in Table 1-1 and is reported on a 100% basis. The Mineral Resource estimate was prepared by G Mining Services Inc. (GMSI) and is inclusive of Mineral Reserves.
| IAMGOLD Corporation - Essakane Gold Mine Technical Report NI 43-101 – February 17, 2016 |
Page 1-1 |
TABLE 1-1 SUMMARY OF MINERAL RESOURCES – DECEMBER 31, 2015
| Category | Tonnage (000 t) |
Grade (g/t Au) |
Contained Metal (000 oz Au) | |||
| Measured |
- | - | - | |||
| Indicated |
137,753 | 1.13 | 5,024 | |||
| Total Measured + Indicated |
137,753 | 1.13 | 5,024 | |||
| Inferred |
18,548 | 1.07 | 637 | |||
Notes:
| 1. | CIM definitions were followed for Mineral Resources. |
| 2. | Mineral Resources are estimated at a cut-off grade which varies between 0.35 and 0.48 g/t Au depending on material type and pit. |
| 3. | Mineral Resources are estimated using an average long-term gold price of US$1,500 per ounce. |
| 4. | A minimum mining width of 10 m was used for Falagountou and 20 m for Essakane. |
| 5. | Bulk density is variable by rock type. |
| 6. | Mineral Resources are inclusive of Mineral Reserves. |
| 7. | Mineral Resources that are not Mineral Reserves do not have demonstrated economic viability. |
| 8. | Numbers may not add due to rounding. |
The Mineral Reserve estimate at December 31, 2015 for Essakane S.A. is summarized in Table 1-2 and is reported on a 100% basis. The Mineral Reserve estimate was prepared by GMSI.
TABLE 1-2 MINERAL RESERVES – DECEMBER 31, 2015
| Category | Tonnage (000 t) |
Grade (g/t Au) |
Contained Metal (000 oz Au) | |||
| Proven |
- | - | - | |||
| Probable |
96,463 | 1.10 | 3,414 | |||
| Total |
1.10 | 3,414 |
Notes:
| 1. | CIM definitions were followed for Mineral Reserves. |
| 2. | Mineral Reserves are estimated at a cut-off grade which varies between 0.44 and 0.60 g/t Au depending on material type and pit. |
| 3. | Mineral Reserves are estimated using an average long-term gold price of US$1,200 per ounce. |
| 4. | A minimum mining width of 10 m was used for Falagountou and 20 m for Essakane. |
| 5. | Bulk density is variable by rock type. |
| 6. | Numbers may not add due to rounding. |
CONCLUSIONS
| ● | Mineral Resources and Mineral Reserves have been prepared in accordance with Canadian Institute of Mining, Metallurgy and Petroleum (CIM) Definition Standards for Mineral Resources and Mineral Reserves dated May 10, 2014 (CIM definitions). |
| ● | Work completed to date by the geological staff is appropriate. |
| IAMGOLD Corporation - Essakane Gold Mine Technical Report NI 43-101 – February 17, 2016 |
Page 1-2 |
| ● | The geological model employed by Essakane S.A. geologists is reasonably well understood and is well supported by field observations in both outcrop and drill intersections. |
| ● | The resource model has been prepared using appropriate methodology and assumptions. These parameters include: |
o Treatment of high assays
o Compositing length
o Search parameters
o Bulk density
o Cut-off grade
o Classification
| ● | The block model has been validated using a reasonable level of rigor consistent with common industry practice. |
| ● | In the opinion of GMSI, the resource evaluation reported herein is a reasonable representation of the Mineral Resources delineated at the Essakane Gold Mine as of December 31, 2015. |
| ● | The current drill spacing in the EMZ deposit is judged adequate to develop a reasonable model of the mineralization distribution and to quantify its volume and quality with a good level of confidence in all three areas of the project. |
| ● | Based on visual verification, the models (Rock Type, Density, and Au Grade) were found to be globally representative of the known geological and structural controls of mineralization of the Essakane deposit. |
| ● | Statistical analysis demonstrates that the block model provides a reasonable estimate of the Mineral Resources of the EMZ deposit. |
| ● | Validation of the block model using different interpolation methods indicated that tonnages, grades, and gold contents are similar. |
| ● | Swath plots for Indicated and Inferred Mineral Resources by vertical sections for the EMZ and North Satellite areas indicate that peaks and lows in gold content generally match peaks and lows in composite frequency; no bias was found in the resource estimate in this regard. |
| ● | GMSI reviewed the information stored in the Falagountou database and found it to be in good standing. |
| ● | Drill hole spacing on the Falagountou East and West deposits is judged adequate to develop a reasonable model of the mineralization distribution and to quantify its volume and quality with an acceptable level of confidence. |
| ● | The Inverse Distance Cubed (ID3) based Mineral Resource estimate for the Falagountou East and West deposits was found to be a good representation of the drill hole composites. |
| IAMGOLD Corporation - Essakane Gold Mine Technical Report NI 43-101 – February 17, 2016 |
Page 1-3 |
| ● | Swath plots for Indicated and Inferred Mineral Resources by vertical sections for the Falagountou East and West deposits indicate that peaks and lows in gold content generally match peaks and lows in composite frequency; no bias was found in the resource estimate in this regard. |
| ● | GMSI concluded that the few composites added to the domains of the EMZ area would not yield significant change to the previous Essakane S.A. Student’s and Mann-Whitney test results and the previous observations are still applicable to this set of composites. |
| ● | Sampling and assaying have been carried out following standard industry quality assurance/quality control (QA/QC) practices. These practices include, but are not limited to, sampling, assaying, chain of custody of the samples, sample storage, use of third-party laboratories, standards, blanks, and duplicates. |
| ● | The mine design and Mineral Reserve estimate have been completed to a level appropriate for feasibility studies. |
| ● | The economic assumptions and methodology used for estimation of the Mineral Reserves are appropriate. |
| ● | The Mineral Reserve estimate is consistent with the CIM definitions and is suitable for public reporting. As such, the Mineral Reserves are based on Measured and Indicated Mineral Resources, and do not include any Inferred Mineral Resources. |
| ● | Current production statistics indicated that the process flow sheet is adequate and suitable for processing the Essakane Gold Mine ore types. |
| ● | No outstanding technical issues were identified for environment and permitting. |
RECOMMENDATIONS
| ● | The litho-structural model of the EMZ deposits should be updated for the next resource estimate in order to reflect new geological observations. |
| ● | GMSI suggests waiting for robust reconciliation data before making any important modifications to the Falagountou deposit block model. |
| ● | GMSI is of the opinion that the ID3 interpolation method for the Falagountou deposit is a better global estimator compared to the OK technique, given the globally higher grades. |
| ● | A recent metallurgical study indicated a risk for significantly lower gold recovery related to the amount of graphitic ore present in future mining zones, according to the life of mine (LOM). Essakane S.A. has undertaken a mitigation plan that needs to be completed. Additionally, a geometallurgy survey, which is currently ongoing, will help determine where the graphitic ore originates and serve as a basis for better ore mixing prior to the plant feed. |
| IAMGOLD Corporation - Essakane Gold Mine Technical Report NI 43-101 – February 17, 2016 |
Page 1-4 |
ECONOMIC ANALYSIS
This section is not required as the Essakane Gold Mine is currently in production and there is no material expansion of current production.
TECHNICAL SUMMARY
PROPERTY DESCRIPTION AND LOCATION
The Essakane Gold Mine straddles the boundary of the Oudalan and Seno provinces in the Sahel region of Burkina Faso and is approximately 330 km northeast of the capital, Ouagadougou. The property’s latitude and longitude are 14o 23’ N and 0o 04’ E.
The mining and exploration permits comprising the Essakane Gold Mine are subject to Burkina Faso’s 2003 Mining Code no 31-2003/AN, dated May 8, 2003 (the Burkina Faso Mining Law). The Essakane Gold Mine consists of one mining permit (the Essakane Mining Permit), which contains the EMZ deposit and the Falagountou deposit, and seven exploration permits (the Essakane Exploration Permits), all located on contiguous ground.
LAND TENURE
In April 2008, the Essakane Mining Permit was granted to Essakane S.A., a Burkinabé company created for the purpose of developing and operating the Essakane Gold Mine. The mining permit is valid for a period of 20 years and is renewable every five years until Mineral Reserves have been depleted.
According to the Mining Law of Burkina Faso, a mining convention must be negotiated between the mining permit owner and the Government before operations can start. The mining convention describes the Governmental commitments, operational tax regime, and obligations of the company to Burkina Faso. The mining convention between Essakane S.A. and the Government of Burkina Faso was signed on July 14, 2008.
IAMGOLD owns a 90% interest in Essakane S.A., while the Government of Burkina Faso has a 10% free-carried interest. In addition, the Government of Burkina Faso receives a 3% royalty on the revenues from mineral production if the gold price is below US$1,000/oz, 4% if the gold price is between US$1,000/oz and US$1,300/oz, and 5% if the gold price is greater
| IAMGOLD Corporation - Essakane Gold Mine Technical Report NI 43-101 – February 17, 2016 |
Page 1-5 |
than or equal to US$1,300/oz. The Government also collects various taxes and duties on the imports of fuels, supplies, equipment, and outside services, as specified by the Burkina Faso Mining Law.
The Essakane Mining Permit is surrounded by the Essakane Exploration Permits, which currently cover a total area of 1,260.59 km2. The Essakane Exploration Permits are presently in good standing and Essakane S.A. has been issued with Certificate #1587/2007 (Issue date 04/10/2007) by Mr. Seydou Balama at the Office Notarial in Ouagadougou.
Surface rights in the area of the Essakane Mining Permit belong to the State of Burkina Faso. Utilization of the surface rights is granted by the Essakane Mining Permit under condition that the current users are properly compensated. All the taxes relating to Essakane S.A.’s Mining Rights have been paid to date and the concession is in good standing.
IAMGOLD is not aware of any environmental liabilities on the property. IAMGOLD has all required permits to conduct the proposed work on the property. IAMGOLD is not aware of any other significant factors and risks that may affect access, title, or the right or ability to perform the proposed work program on the property.
HISTORY
The EMZ deposit has been an active artisanal mining site since 1985. At its peak, up to 15,000 artisanal miners worked at the EMZ deposit.
In 1991, the Essakane Mining Exploration Permit was granted to Compagnie d’Exploitation des Mines d’Or du Burkina (CEMOB). In 1992, CEMOB constructed a heap leach facility which produced 18,000 oz of gold in 1993 but averaged between 3,000 oz and 5,000 oz of gold per year thereafter. Due to low gold prices and operational problems, CEMOB went into liquidation at the end of 1996 and Coronation International Mining Corporation (CIMC) secured title. In July 2000, six new Essakane licences were granted to CIMC. CIMC carried out an exploration program and drilling of oxide resources. In 2002, CIMC merged with Orezone Resources Inc. (Orezone Resources) and Orezone Resources became 90% owner of Essakane S.A. Orezone Resources was the operator of the mine until Gold Fields Essakane (BVI) Limited (GF BVI) assumed management responsibilities in January 2006.
| IAMGOLD Corporation - Essakane Gold Mine Technical Report NI 43-101 – February 17, 2016 |
Page 1-6 |
In April 2007, Orezone Resources, Orezone Inc., Orezone Essakane Limited, GF BVI, Gold Fields Orogen Holding (BVI) Limited, and Essakane (BVI) Limited (Essakane BVI) entered into a member’s agreement and eventually formed a joint venture. GF BVI earned a 60% interest in Essakane (BVI) after the Essakane Definitive Feasibility Study (DFS) was completed in September 2007.
In October 2007, Orezone Resources entered into an agreement with GF BVI to acquire its 60% interest in the Essakane Gold Mine. On November 26, 2007, Orezone Resources became the operator and owner of a 100% interest in the Essakane Gold Mine, subject to the interest of the Government of Burkina Faso.
In April 2008, the Essakane Mining Permit was granted over an area of 100.2 km2 containing the EMZ deposit and the Falagountou deposit. An updated FS (the UFS) was completed on June 3, 2008 and readdressed to IAMGOLD in 2009 after IAMGOLD acquired Orezone Resources and the Essakane Gold Mine was transferred to IAMGOLD Essakane S.A. Commercial production started on July 16, 2010.
GEOLOGY AND MINERALIZATION
The geological setting of northeast Burkina Faso consists predominantly of Precambrian rocks of the Oudalan-Gorouol greenstone belt which forms part of the Paleoproterozoic Baoulé-Mossi domain of the West African Craton and hosts numerous gold deposits including Essakane, Gossey, Korizena, and Falagountou.
The Oudalan-Gorouol greenstone belt is bounded and/or crosscut by several major north-northeast to northeast trending shear zones including the crustal-scale steeply-east-dipping Markoye Shear Zone. The Markoye Shear Zone is located through the western portion of the belt and trends north-northeast and separates Paleoproterozoic rocks on the east from older granite-gneiss terranes to the west.
Recent structural investigations in the northern part of the belt suggested that the Markoye Shear Zone has been affected by at least D1 and D2 phases of tectonic reactivation associated with two phases of regional deformation. Gold deposits are most often related to transcurrent D2 shear zones and faults as these discontinuities have served as the main conduct of mineralized fluids. Gold is either disseminated or concentrated in quartz veins.
| IAMGOLD Corporation - Essakane Gold Mine Technical Report NI 43-101 – February 17, 2016 |
Page 1-7 |
As with other Precambrian orogeny, the early fabrics were modified by the regional-scale transcurrent shear zones D2, which acted as pathways during the gold mineralization events.
The Essakane Gold Mine, comprising the EMZ and Falagountou deposits, lies in an outlier of folded sedimentary Birimian rocks, which are intruded in places by intermediate and mafic sills. The sediments in the district have been subdivided on the basis of lithology into deep-water turbidites (the Birimian) and coarse clastic basin margin sequences (the Tarkwaian). The Birimian and Tarkwaian rocks are bounded to the west by the major north-northeast trending Markoye Fault and to the south by the Dori batholith. Gold prospects on the permits occur exclusively in Birimian rocks and are generally associated with quartz veining on the margins of mafic and intermediate sills.
The EMZ deposit is an anticlinal fold with flexural slips between layers and is westward thrusting along weakness planes parallel to bedding, with minor displacement. The vein arrays occur in the east limb, fold hinge (or fold axis), and west limb litho-structural domains. The geology and economic potential of the EMZ deposit is dominated by the persistent east limb main arenite. Mineralization has been confirmed to over 550 m vertically below surface, however, the full depth extent in the fold hinge and east limb is still unknown.
The EMZ deposit is a greenstone hosted orogenic gold deposit. Specifically, it is a quartz-carbonate stockwork vein deposit hosted by a folded turbidite succession of arenite and argillite. Gold occurs as free particles within the veins and is also intergrown with arsenopyrite +/- tourmaline on vein margins or in the host rocks. The gold particles occur without sulphides in the weathered saprolite. The gold is free-milling in all associations.
Due to the intense artisanal mining (orpaillage) activity, no detailed geological mapping has been carried out over the Falagountou deposit. Observations from visits within orpailleur workings indicate that gold is located in smoky quartz veins injected in a sequence of fine to medium detrital sediments, similar to those found at the EMZ deposit that have been intruded and metamorphosed by shallow dioritic dykes.
EXPLORATION STATUS
The Essakane Gold Mine has been explored since the 1990s by geochemistry sampling, mapping, trenching, Aster/Landsat image analysis and interpretation, geophysical surveys,
| IAMGOLD Corporation - Essakane Gold Mine Technical Report NI 43-101 – February 17, 2016 |
Page 1-8 |
and drilling. Exploration efforts on the Essakane Gold Mine were initially focused on identifying the potential of the entire area of the mine. In the mid-1990s, a widely spaced drilling program was carried out on the EMZ deposit followed by infill drilling.
Orezone Resources started resource definition drilling at the EMZ deposit in February 2003. Orezone Resources and GF BVI drilled 20,364 m of oriented HQ diameter core between September 2005 and June 2006 for the project development and the 2007 FS program.
Reverse circulation (RC) and diamond drilling (DD) drilling has been conducted by Essakane S.A.’s Resource Development Group since January 2010. Up to December 31, 2014, a total of 1,071 RC holes (137,852 m) and 675 DD holes (207,847 m) had been drilled within the EMZ and Falagountou pits.
Essakane S.A.’s drilling objectives include infill drilling to upgrade Inferred Mineral Resources, expand the resource inventory, to gain a better understanding of the geology and controls of mineralization to advance geological modelling, and improve the quality of assay samples.
At the EMZ deposit, most DD holes targeted Inferred Mineral Resources below the EMZ pit and along the deposit’s northern, southern, and down-dip extensions.
DD results were positive on the EMZ deposit with continuity of mineralization demonstrated at depth along the east limb of the deposit in the northern sector of the pit, as well as in the southeast end of the pit. EMZ deposit mineralization is oriented north-northwest. The DD results were incorporated into the updated resource model as reported at December 31, 2014.
An infill RC and DD program conducted at the Falagountou deposit, since the Essakane Gold Mine Mineral Resource estimate of December 31, 2014, confirmed lateral continuity of mineralization oriented mostly north-south as well as an extension down-dip, which remained open. Drilling also identified a second mineralized structure, located 250 m west of the main zone. A total of 165 RC and DD holes, for a total of approximately 15,000 m, were drilled and results were incorporated into the April 1, 2015 Mineral Resource estimate for the Essakane Gold Mine (press release dated April 23, 2015). In March 2015, an exploration
| IAMGOLD Corporation - Essakane Gold Mine Technical Report NI 43-101 – February 17, 2016 |
Page 1-9 |
drilling program was designed to test for further extensions of the Falagountou deposit. Positive results were reported, which have been incorporated into the current Mineral Resource estimate.
MINERAL RESOURCES
Following the request of Essakane S.A., G Mining Services Inc. (GMSI) has prepared a Mineral Resource estimate for the Essakane Gold Mine (Essakane and Falagountou deposits). The mandate given to GMSI consisted of verifying the database content, updating previous wireframes with the latest information available, updating the Essakane and Falagountou deposit block models, validating the block models, and reporting the resource estimates according to NI 43-101 guidelines.
The resource estimation methodologies, results, and validations are presented in this section.
The Mineral Resource estimate was prepared in accordance with CIM Definition Standards for Mineral Resources and Mineral Reserves adopted May 10, 2014 (CIM definitions) and is reported in accordance with the NI 43-101 guidelines. Classification, or assigning a level of confidence to Mineral Resources, has been undertaken with strict adherence to CIM definitions. In the opinion of GMSI, the resource evaluation reported herein is a reasonable representation of the Mineral Resources delineated at the Essakane Gold Mine as of December 31, 2015.
The Mineral Resource estimate at December 31, 2015 for the Essakane Gold Mine is summarized in Table 1-1 and is reported on a 100% basis. The Mineral Resource estimate is inclusive of Mineral Reserves.
MINERAL RESERVES
The Mineral Reserve estimate at December 31, 2015 for Essakane S.A. is summarized in Table 1-2 and is reported on a 100% basis. The Mineral Reserve estimate was prepared by GMSI.
| IAMGOLD Corporation - Essakane Gold Mine Technical Report NI 43-101 – February 17, 2016 |
Page 1-10 |
GMSI is not aware of any known mining, metallurgical, infrastructure, permitting, or other relevant factors that could materially affect the Mineral Reserve estimate.
The mine design and Mineral Reserve estimate have been completed to a level appropriate for feasibility studies. The Mineral Reserve estimate stated herein is consistent with CIM definitions and is suitable for public reporting. As such, the Mineral Reserves are based on Measured and Indicated Mineral Resources, and do not include any Inferred Mineral Resources.
MINING METHOD
Mining is carried out using a conventional drill, blast, load, and haul surface mining method with an owner fleet. The annual mining rate was 48.9 Mt in 2015 with a stripping ratio of 3.24 including 11.52 Mt of ore at an average grade of 1.14 g/t Au for a total of 426 koz of gold.
The weathered zones will be sequentially mined until fully depleted, after which mining will be exclusively in hard rock. Current pit geometry consists of five metre benches in upper lateritic layers, and 10 m benches in hard rock.
Grade control is accomplished by RC drilling and sampling of the mineralized zone on a 10 m x 10 m pattern, or tighter as required. For sterile sections of the pit, the grid may be widened out based on the nature of the contacts and/or other geological occurrences.
A fleet of 11 drill rigs are used for the 150 mm (six inch) production blast holes with two additional 223 mm (nine inch) drill rigs commissioned in 2015 for production in hard rock. The quantity of hard rock material to be mined (i.e. transition and rock) is increasing and will continue to do so for the remainder of the mine life.
All blasting activities on site are executed by an explosives supplier. Holes are loaded with bulk explosive matrix and initiated with non-electric detonators.
Grade movement during blasting is a critical issue at Essakane. For this reason, blast movement monitors (BMMs) are systematically used when blasting mineralized areas in order to measure vertical and horizontal displacement which allows for the adjustment of the post blast ore packets.
| IAMGOLD Corporation - Essakane Gold Mine Technical Report NI 43-101 – February 17, 2016 |
Page 1-11 |
The mine loading fleet currently consists of four RH-120 shovels, two CAT 993K wheel loaders, one CAT 992K wheel loader, and a CAT 390 excavator. At the time of writing this report, a second CAT 390 excavator was in the process of being commissioned. The mine’s hauling fleet currently consists of 26 CAT 785C and five CAT 777F mining trucks.
Mine haul roads are 20 m to 30 m wide and are constructed by the mining department to support the mine haul trucks.
Waste material is being stored in the waste dumps located east of the Main pit.
Other mining infrastructure includes a mine office complex (mine offices, change houses, and canteens), equipment workshop, with overhead cranes integrated with the main warehouse, and external wash bays, blasting and explosives compound including magazines, diesel storage and dispensing facility, and a drill core storage facility.
MINERAL PROCESSING
Essakane ore is processed using two stages of crushing, semi-autogenous grinding, ball mill grinding, SABC, gravity concentration, and a CIL gold plant. The UFS proposed a process plant throughput rate of 7.5 Mtpa. During construction, some debottlenecking improvements were made to the design, resulting in a revised nameplate capacity of 9.0 Mtpa based on processing 100% saprolite ore. Due to further operational improvements, plant throughput has increased beyond the constructed design capacity.
Fresh rock mill feed has gradually increased from 2012 onwards. To maintain gold production levels, with increasing proportions of hard rock in the mill feed, an expansion was completed in 2014. The objective was to double the hard rock processing capacity from 5.4 Mtpa on a 100% hard rock basis to 10.8 Mtpa. The expansion consisted of the addition of a secondary crushing circuit and a second process line (grinding, gravity concentration, and leach) in the mill.
The process plant expansion was commissioned in February 2014, and effectively doubled the hard rock processing capacity.
| IAMGOLD Corporation - Essakane Gold Mine Technical Report NI 43-101 – February 17, 2016 |
Page 1-12 |
A detoxification plant was also installed in 2014, upstream to the tailings pond. The detoxification plant is undergoing optimization and will be used as required following the new tailings deposition plan.
PROJECT INFRASTRUCTURE
General services are an essential component to the success of the mine operation. Due to the remoteness and complex logistics of the mine coupled with the limited services available in Burkina Faso, the scope and extent of the general services department required to support production is very substantial. The current manpower is approximately 2,250 workers, excluding contractors.
The initial mine infrastructure and support facilities constructed between 2009 and July 2010 have been modified and/or adapted for the expansion phase which was carried out from 2012 to 2014. Modifications have been made to the mine truck shop and warehouse, site and mine roads, communication system and IT, fuel oil storage, exploration building, mine camp, assay and metallurgical laboratories and mill office, river deviation, power generation and distribution, administration buildings, and potable water and treatment facilities.
MARKET STUDIES AND CONTRACTS
Gold is the principal commodity at the Essakane Gold Mine and is freely traded at prices that are widely known, so that prospects for sale of any production are virtually assured. All gold produced by IAMGOLD is in the form of doré bars, which is then shipped to a refiner who refined the doré into bullion. The bullion is then sold directly on the open market to gold trading institutions at prevailing market prices.
The Essakane Gold Mine has signed contracts which are directly linked to the operations. Contracts are negotiated by going out for tenders on an annual or bi-annual basis.
ENVIRONMENTAL STUDIES, PERMITTING, AND SOCIAL OR COMMUNITY IMPACT
In 2007, prior to the beginning of construction work, an Environmental and Social Impact Assessment (ESIA) was conducted by Knight Piesold Consulting and submitted to the
| IAMGOLD Corporation - Essakane Gold Mine Technical Report NI 43-101 – February 17, 2016 |
Page 1-13 |
Government of Burkina Faso. The ESIA included an Environmental and Social Management Plan (ESMP) for the project. The ESIA was completed following a public consultation with key stakeholders, as prescribed under Burkinabé law. In 2008, and following the changes made during construction, an addendum to the ESIA (2008 addendum) was submitted to the authorities of Burkina Faso. A mining permit over an area of 100.2 km² was approved by Burkinabé authorities in late 2007.
In order to increase the annual gold production, IAMGOLD initiated a mine expansion FS in 2011. As part of the mine expansion work in 2012 and 2013, a new addendum to the ESIA and the 2008 addendum was prepared in February 2012 (the February 2012 addendum). The February 2012 addendum covers the expansion phase of the main pit and mill infrastructures, a new satellite pit east of the mine, and the Gorouol River diversion. It includes an updated ESMP incorporating the necessary adjustments to the initial ESMP to include the expansion changes and to consolidate, in one document, all social and environmental commitments of IAMGOLD. An Environmental Impact Assessment (EIA) was conducted for the river diversion. The February 2012 addendum was approved in 2013.
IAMGOLD Essakane S.A. implemented two resettlement plans consistent with Burkinabé laws and best practices recommended by international organizations (World Bank). The first plan started in 2008 (13,000 individuals and 2,981 households affected) and the second plan started in 2012 (3,208 individuals and 555 households affected).
As part of the community investment plan, socio-educational infrastructures are being built (wells, medical centres, schools, etc.). Programs to fight malaria and HIV/AIDS, and increase road safety awareness, were developed for the benefit of neighbouring populations. Rural development activities (agriculture, animal husbandry, etc.) are primarily undertaken as part of the livelihood restoration program and through the community investment program. Since 2014, a community investment program has been financing community projects through communal development plans.
A program for environmental monitoring (groundwater quality, fauna, and dam stability inspection) and progressive rehabilitation of the tailings site is in place, at and around, the tailings site. This program encompasses water quality monitoring, air quality, soil, biodiversity (fauna and flora), noise, vibration, weather, and follow-up and assessment of the
| IAMGOLD Corporation - Essakane Gold Mine Technical Report NI 43-101 – February 17, 2016 |
Page 1-14 |
community investment program (health, education, potable water access, agriculture, animal husbandry, etc.).
A conceptual rehabilitation and closure plan (PRF) was developed in 2007 and reviewed with the expansion work. Closure costs are estimated at US$62.7M. Closure costs are updated annually or whenever the mining development plan is amended. A progressive mining rehabilitation process commenced in 2011, shortly after the start of production.
A closure plan Prefeasibility Study will be conducted three years prior to mine closure. A closure plan FS must be conducted two years prior to the closure of the mine and must be approved by the relevant authorities.
CAPITAL AND OPERATING COST ESTIMATES
The capital cost requirement over the LOM includes resource development costs; capitalized waste stripping; sustaining capital; mine equipment additions and replacements; equipment overhaul costs; equipment capital spares; and closure and remediation costs.
A total of US$420.6 million of capital is planned to be spent over the remaining LOM, which equates to US$4.19/t milled or $127/oz of Au.
The mine operating costs are estimated on the basis of the physical quantities of the mine plan, realistic equipment productivity assumptions, overall equipment efficiencies, and updated consumable prices. Average operating costs over the LOM and over the Five Year Plan (2016 to 2020) are shown in Table 1-3.
TABLE 1-3 LOM AND FIVE YEAR PLAN OPERATING COSTS
| Area | LOM Average | Five Year Plan (2016-2020) | ||
| Mining (US$/t mined) |
2.97 | 2.70 | ||
| Processing (US$/t milled) |
13.30 | 13.38 | ||
| G&A (US$/t milled) |
3.55 | 3.55 |
The average total cash cost per ounce is US$788/oz Au while the all-in sustaining cost (AISC) averages US$948/oz Au over the LOM.
| IAMGOLD Corporation - Essakane Gold Mine Technical Report NI 43-101 – February 17, 2016 |
Page 1-15 |
2 INTRODUCTION
IAMGOLD Corporation (IAMGOLD) has prepared a Technical Report for the Essakane Gold Mine, located in the Sahel Region of Burkina Faso. The purpose of this Technical Report is to support the disclosure of the December 31, 2015 Essakane Gold Mine Mineral Resources and Mineral Reserves estimate.
IAMGOLD is a mid-tier mining company with four operating gold mines and several exploration properties on three continents. IAMGOLD, through its wholly-owned subsidiary Essakane S.A., owns 90% of the Essakane Gold Mine in West Africa, with the Government of Burkina Faso holding the remaining 10%. The mine has been in operation since July 2010.
SOURCES OF INFORMATION
This Technical Report was prepared by IAMGOLD, Essakane S.A., and G Mining Services Inc. (GMSI) personnel. The dates of personal inspections of the Essakane Gold Mine by the Qualified Persons (QPs) are provided in Section 29 of this Technical Report.
The QPs and their responsibilities for this Technical Report are listed in Section 29 Certificate of Qualified Person.
The documentation reviewed, and other sources of information, are listed at the end of this report in Section 27 References.
| IAMGOLD Corporation - Essakane Gold Mine Technical Report NI 43-101 – February 17, 2016 |
Page 2-1 |
LIST OF ABBREVIATIONS
Units of measurement used in this report conform to the metric system. All currency in this report is US dollars (US$) unless otherwise noted.
| A | annum | kWh | kilowatt-hour | |||||
| A | ampere | L | litre | |||||
| bbl | barrels | lb | pound | |||||
| btu | British thermal units | L/s | litres per second | |||||
| °C | degree Celsius | m | metre | |||||
| C$ | Canadian dollars | M | mega (million); molar | |||||
| cal | calorie | m2 | square metre | |||||
| cfm | cubic feet per minute | m3 | cubic metre | |||||
| cm | centimetre | µ | micron | |||||
| cm2 | square centimetre | MASL | metres above sea level | |||||
| d | day | µg | microgram | |||||
| dia | diameter | m3/h | cubic metres per hour | |||||
| dmt | dry metric tonne | mi | mile | |||||
| dwt | dead-weight ton | min | minute | |||||
| °F | degree Fahrenheit | µm | micrometre | |||||
| ft | foot | mm | millimetre | |||||
| ft2 | square foot | mph | miles per hour | |||||
| ft3 | cubic foot | MVA | megavolt-amperes | |||||
| ft/s | foot per second | MW | megawatt | |||||
| g | gram | MWh | megawatt-hour | |||||
| G | giga (billion) | oz | Troy ounce (31.1035g) | |||||
| Gal | Imperial gallon | oz/st, opt | ounce per short ton | |||||
| g/L | gram per litre | ppb | part per billion | |||||
| Gpm | Imperial gallons per minute | ppm | part per million | |||||
| g/t | gram per tonne | psia | pound per square inch absolute | |||||
| gr/ft3 | grain per cubic foot | psig | pound per square inch gauge | |||||
| gr/m3 | grain per cubic metre | RL | relative elevation | |||||
| ha | hectare | s | second | |||||
| hp | horsepower | st | short ton | |||||
| hr | hour | stpa | short ton per year | |||||
| Hz | hertz | stpd | short ton per day | |||||
| in. | inch | t | metric tonne | |||||
| in2 | square inch | tpa | metric tonne per year | |||||
| J | joule | tpd | metric tonne per day | |||||
| k | kilo (thousand) | US$ | United States dollar | |||||
| kcal | kilocalorie | USg | United States gallon | |||||
| kg | kilogram | USgpm | US gallon per minute | |||||
| km | kilometre | V | volt | |||||
| km2 | square kilometre | W | watt | |||||
| km/h | kilometre per hour | wmt | wet metric tonne | |||||
| kPa | kilopascal | wt% | weight percent | |||||
| kVA | kilovolt-amperes | yd3 | cubic yard | |||||
| kW | kilowatt | yr | year |
| IAMGOLD Corporation - Essakane Gold Mine Technical Report NI 43-101 – February 17, 2016 |
Page 2-2 |
3 RELIANCE ON OTHER EXPERTS
This report has been prepared by IAMGOLD. For the purpose of this report, IAMGOLD QPs have relied on in-house non-QP personnel for property ownership information.
| IAMGOLD Corporation - Essakane Gold Mine Technical Report NI 43-101 – February 17, 2016 |
Page 3-1 |
4 PROPERTY DESCRIPTION AND LOCATION
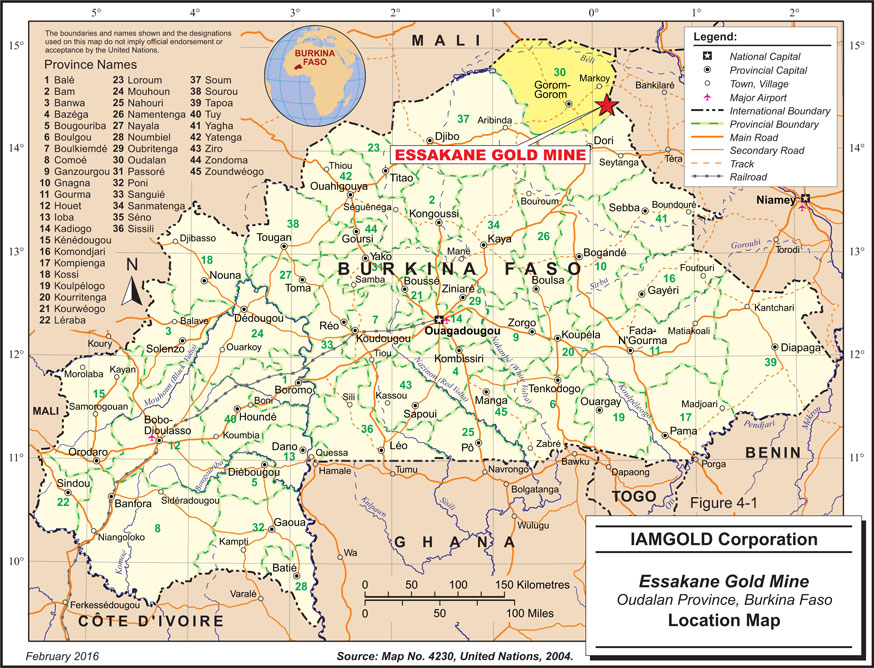
The Essakane Gold Mine straddles the boundary of the Oudalan and Seno provinces in the Sahel region of Burkina Faso and is approximately 330 km northeast of the capital, Ouagadougou. It is situated approximately 42 km east of the nearest large town and the provincial capital of Oudalan, Gorom-Gorom, and near the village of Falagountou to the east (Figure 4-1). The property’s latitude and longitude are 14o 23’ N and 0o 04’ E.
The Essakane Gold Mine consists of one mining permit (the Essakane Mining Permit), which contains the Essakane main zone deposit (EMZ deposit) and the Falagountou deposit, and seven exploration permits (the Essakane Exploration Permits), all located on contiguous ground.
MINING PERMIT
The mining and exploration permits comprising the Essakane Gold Mine are subject to Burkina Faso’s 2003 Mining Code No. 31–2003/AN, dated May 8, 2003 (the Burkina Faso Mining Law).
In April 2008, following the filing by Orezone Resources Inc. (Orezone Resources) of the 2007 Essakane Definitive Feasibility Study (DFS), an Environmental and Socio-economic Impact Assessment (ESIA), and the obtaining of the Essakane Environmental Permit, the Government of Burkina Faso granted to Essakane S.A. the Essakane Mining Permit over an area of 100.2 km2 containing the EMZ deposit and the Falagountou deposit. The Essakane Mining Permit is valid for a period of 20 years and is renewable every five years until mining reserves have been depleted.
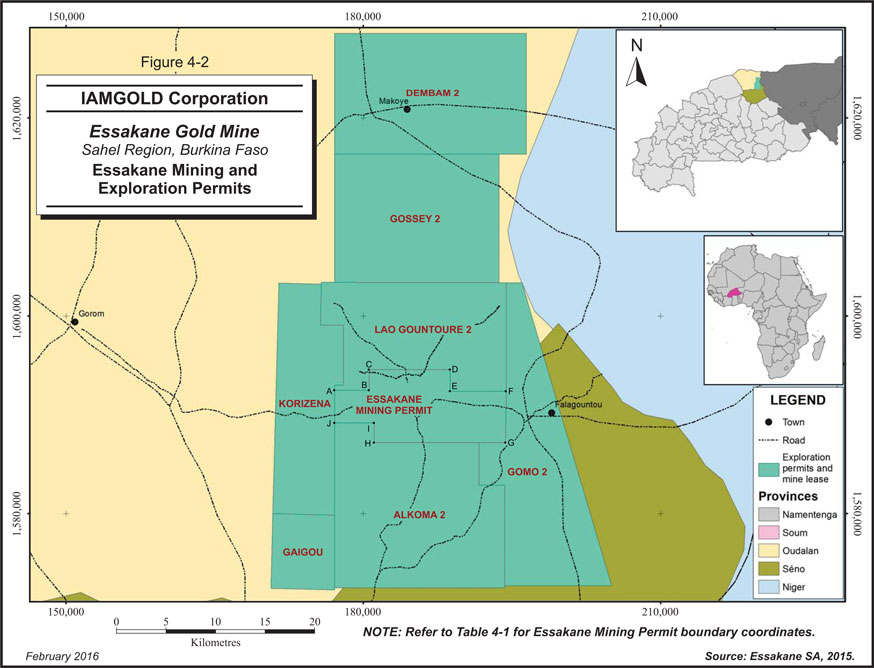
The Essakane Mining Permit’s perimeter is defined by UTM coordinates of the corner posts as listed in Table 4-1 and the permits limit is shown in Figure 4-2.
| IAMGOLD Corporation - Essakane Gold Mine Technical Report NI 43-101 – February 17, 2016 |
Page 4-1 |
TABLE 4-1 ESSAKANE MINING PERMIT BOUNDARY COORDINATES
| Points | Datum | X | Y | |||
| A |
Adindan BF | 177,115 | 1,592,488 | |||
| B |
Adindan BF | 180,607 | 1,592,488 | |||
| C |
Adindan BF | 180,607 | 1,594,564 | |||
| D |
Adindan BF | 188,770 | 1,594,564 | |||
| E |
Adindan BF | 188,770 | 1,592,379 | |||
| F |
Adindan BF | 194,430 | 1,592,379 | |||
| G |
Adindan BF | 194,367 | 1,587,187 | |||
| H |
Adindan BF | 181,104 | 1,587,187 | |||
| I |
Adindan BF | 181,104 | 1,589,186 | |||
| J |
Adindan BF | 177,115 | 1,589,186 |
According to the Mining Law of Burkina Faso, a mining convention must be negotiated between the mining permit owner and the Government before operations can start. The mining convention describes the Governmental commitments, operational tax regime, and obligations of the company to Burkina Faso. Once executed, the mining convention cannot be changed without the mutual agreement of both parties. If tax law changes are promulgated, the mining company can choose to adopt them (if deemed more advantageous) or stay with the current terms of the mining convention. The mining convention between Essakane S.A. and the Government of Burkina Faso was signed on July 14, 2008.
The new Burkina Faso Mining Code was approved by the transitional government and came into effect on June 16, 2015, however, an application decree is required for the Mining Code to be operational. IAMGOLD does not expect a material impact of the new Mining Code on Essakane S.A., as it has fiscal stability clauses in its existing mining convention.
Essakane S.A is a Burkinabé company created for the purpose of developing and operating the Essakane Gold Mine. IAMGOLD owns a 90% interest in Essakane S.A., while the Government of Burkina Faso has a 10% free-carried interest. In addition, the Government of Burkina Faso receives a 3% royalty on the revenues from mineral production if the gold price is below US$1,000/oz, 4% if the gold price is between US$1,000/oz and US$1,300/oz, and 5% if the gold price is greater than or equal to US$1,300/oz. The Government also collects various taxes and duties on the imports of fuels, supplies, equipment, and outside services, as specified by the Burkina Faso Mining Law.
| IAMGOLD Corporation - Essakane Gold Mine Technical Report NI 43-101 – February 17, 2016 |
Page 4-2 |
4-3
4-4
EXPLORATION PERMITS
The Essakane Mining Permit is surrounded by the Essakane Exploration Permits, which currently cover a total area of 1,260.59 km2.
The Burkina Faso Mining Law gives the exploration permit holder the exclusive right to explore for the minerals requested on the surface and subsurface within the boundaries of the exploration permit. Exploration permits are guaranteed by the Law and its associated arrêtés (decrees) provided that the permit holder complies with reporting requirements and annual exploration expenditures totalling 270,000 francs CFA per km2 or about $650/km2.
The exploration permit also gives the holder the exclusive right, at any time, to convert the exploration permit into a mining permit, in accordance with the law. Each mining permit application requires a separate Feasibility Study (FS), however, there are precedents in Burkina Faso for variations to this rule (e.g., Etruscan’s Youga project).
Exploration permits are valid for a period of three years from date of issue and may be renewed for two more consecutive terms of three years each for a total of nine years; however, on the second renewal, at least 25% of the original area must be relinquished.
The Essakane Exploration Permits have been granted by the Minister of Mines, Quarries, and Energy (MMCE) as an arrêté under Burkina Faso’s 2003 Mining Code (Code Minier, No. 31–2003/AN dated May 8, 2003). Five of the seven Essakane Exploration Permits were granted by the Minister in November 2009 for an initial three-year term ending in November 2012, and were approved for renewal by the Minister for the first three-year term on December 18, 2012. The request for a second renewal was submitted to the Minister on August 18, 2015. For three exploration permits (Dembam 2, Gomo 2, and Alkoma 2), 25% of the initial surface area will be relinquished, whereas for two (Gossey 2 and Lao Gountouré 2), a special request was submitted to the Minister to keep the original surface area.
The sixth Essakane Exploration Permit (Korizena permit) was approved for renewal for a second three-year term on December 18, 2012, and 25% of the original surface area covered by that permit was relinquished. An application for a new permit on the relinquished area was subsequently filed and approved by the Minister on May 6, 2013. On August 18,
| IAMGOLD Corporation - Essakane Gold Mine Technical Report NI 43-101 – February 17, 2016 |
Page 4-5 |
2015, a request for extending the actual surface area of the Korizena permit for another three year period was submitted to the Minister.
The seventh permit (Gaigou permit) was granted on May 6, 2013 by Ministerial Decree 2013/000076/MME/SG/DGMGC.
At the completion of the renewal process, the total surface area will be 1,092.87 km2.
The exploration permits are presently in good standing and Essakane S.A. has been issued with Certificate #1587/2007 (Issue date 04/10/2007) by Mr. Seydou BALAMA at the Office Notarial in Ouagadougou.
The arrêté numbers and expiry dates are listed in Table 4-2, and the exploration permit coordinates (projection Clark 1880; Adindan BF) are listed in Table 4-3.
TABLE 4-2 EXPLORATION PERMIT DETAILS
| Permit Name | Arrêté Granted | Date Granted | Status | Surface area (km²) |
Arrêté Renewed | Renewal Date | Expiry Date | |||||||
| ALKOMA 2 | 09/262/MCE/SG/ DGMGC |
24/11/2009 | First renewal | 249.00 | 2012/000319/MCE/ SG/DGMG |
18/12/2012 | 24/11/2018 | |||||||
| DEMBAM 2 | 09/263/MCE/SG/ DGMGC |
24/11/2009 | First renewal | 231.16 | 2012/000320/MCE/ SG/DGMG |
18/12/2012 | 24/11/2018 | |||||||
| GAIGOU | 2013/000076/MME /SG/DGMGC |
06/05/2013 | Granted | 48.05 | Not applicable | Not applicable | 06/05/2021 | |||||||
| GOMO 2 | 09/261/MCE/SG/ DGMGC |
24/11/2009 | First renewal | 201.00 | 2012/000315/MCE/ SG/DGMG |
18/12/2012 | 24/11/2018 | |||||||
| GOSSEY 2 | 09/260/MCE/SG/ DGMGC |
24/11/2009 | First renewal | 215.00 | 2012/000316/MCE/ SG/DGMG |
18/12/2012 | 24/11/2018 | |||||||
| KORIZENA | 06/135/MCE/SG/ DGMGC |
21/11/2006 | Second renewal | 144.18 | 2012/000318/MCE/ SG/DGMG |
18/12/2012 | 21/11/2015* | |||||||
| LAO GOUNTOURÉ 2 |
09/264/MCE/SG/ DGMGC |
24/11/2009 | First renewal | 172.20 | 2012/000318/MCE/ SG/DGMG |
18/12/2012 | 24/11/2018 | |||||||
| 7 PERMITS | 1,260.59 |
Note.* A renewal application submitted in 2015 for a three-year extension.
| IAMGOLD Corporation - Essakane Gold Mine Technical Report NI 43-101 – February 17, 2016 |
Page 4-6 |
TABLE 4-3 EXPLORATION PERMIT COORDINATES
| Permit Name | Points | Datum | Zone | X | Y | Surface area (km²) | ||||||
| ALKOMA 2 |
A | Adindan BF | 31 N | 177115 | 1589186 | 249 | ||||||
| B | Adindan BF | 31 N | 181104 | 1589186 | ||||||||
| C | Adindan BF | 31 N | 181104 | 1587187 | ||||||||
| D | Adindan BF | 31 N | 191703 | 1587187 | ||||||||
| E | Adindan BF | 31 N | 191703 | 1582874 | ||||||||
| F | Adindan BF | 31 N | 194292 | 1582874 | ||||||||
| G | Adindan BF | 31 N | 194292 | 1572515 | ||||||||
| H | Adindan BF | 31 N | 177115 | 1572515 | ||||||||
| DEMBAM 2 |
A | Adindan BF | 31 N | 177117 | 1628550 | 231.16 | ||||||
| B | Adindan BF | 31 N | 196476 | 1628549 | ||||||||
| C | Adindan BF | 31 N | 196477 | 1616328 | ||||||||
| D | Adindan BF | 31 N | 177117 | 1616328 | ||||||||
| GAIGOU |
A | Adindan BF | 30 N | 818309 | 1579870 | 48.05 | ||||||
| B | Adindan BF | 31 N | 177115 | 1579870 | ||||||||
| C | Adindan BF | 31 N | 177115 | 1572302 | ||||||||
| D | Adindan BF | 30 N | 818309 | 1572302 | ||||||||
| GOMO2 |
A | Adindan BF | 31 N | 194407 | 1603335 | 201 | ||||||
| B | Adindan BF | 31 N | 196002 | 1603361 | ||||||||
| C | Adindan BF | 31 N | 205082 | 1572711 | ||||||||
| D | Adindan BF | 31 N | 194292 | 1572711 | ||||||||
| E | Adindan BF | 31 N | 194292 | 1582875 | ||||||||
| F | Adindan BF | 31 N | 191673 | 1582874 | ||||||||
| G | Adindan BF | 31 N | 191267 | 1587187 | ||||||||
| H | Adindan BF | 31 N | 194367 | 1587187 | ||||||||
| I | Adindan BF | 31 N | 194340 | 1592379 | ||||||||
| GOSSEY 2 |
A | Adindan BF | 31 N | 177117 | 1616328 | 215 | ||||||
| B | Adindan BF | 31 N | 193700 | 1616328 | ||||||||
| C | Adindan BF | 31 N | 193694 | 1603366 | ||||||||
| D | Adindan BF | 31 N | 177117 | 1603385 | ||||||||
| KORIZENA |
A | Adindan BF | 30 N | 818309 | 1603171 | 144.18 | ||||||
| B | Adindan BF | 30 N | 822612 | 1603171 | ||||||||
| C | Adindan BF | 30 N | 822612 | 1599070 | ||||||||
| D | Adindan BF | 31 N | 178012 | 1599070 | ||||||||
| E | Adindan BF | 31 N | 178012 | 1593001 | ||||||||
| F | Adindan BF | 31 N | 177115 | 1593001 | ||||||||
| G | Adindan BF | 31 N | 177115 | 1579870 | ||||||||
| H | Adindan BF | 30 N | 818309 | 1579870 | ||||||||
| LAO GOUNTOURÉ 2 |
A | Adindan BF | 31 N | 822589 | 1599261 | 172.2 | ||||||
| B | Adindan BF | 31 N | 194407 | 1603335 | ||||||||
| C | Adindan BF | 31 N | 194430 | 1592379 | ||||||||
| D | Adindan BF | 31 N | 188770 | 1592379 | ||||||||
| E | Adindan BF | 31 N | 188770 | 1594564 | ||||||||
| F | Adindan BF | 31 N | 180607 | 1594564 |
| IAMGOLD Corporation - Essakane Gold Mine Technical Report NI 43-101 – February 17, 2016 |
Page 4-7 |
| Permit Name | Points | Datum | Zone | X | Y | Surface area (km²) | ||||||
| G | Adindan BF | 31 N | 180607 | 1592488 | ||||||||
| H | Adindan BF | 31 N | 177115 | 1592488 | ||||||||
| I | Adindan BF | 31 N | 177108 | 1593215 | ||||||||
| J | Adindan BF | 31 N | 178005 | 1593215 | ||||||||
| K | Adindan BF | 31 N | 178005 | 1599284 | ||||||||
| L | Adindan BF | 31 N | 822588 | 1603363 | ||||||||
| 7 PERMITS |
1,260.59 |
On April 2013, the International Court approved changes to the border between Burkina Faso and Niger. The new border intersects the northernmost exploration permit (Dembam 2) on the southeast corner reducing the original permit area from 237 km2 to 231.16 km2. The total Essakane Exploration Permits area is now 1,260.59 km2.
SURFACE RIGHTS
Surface rights in the area of the Essakane Mining Permit belong to the State of Burkina Faso. Utilization of the surface rights is granted by the Essakane Mining Permit under condition that the current users are properly compensated. All the taxes relating to Essakane S.A.’s Mining Rights have been paid to date and the concession is in good standing.
PERMITTING REQUIREMENTS AND STATUS OF PERMITS
Table 4-4 provides a description of the environmental and mining permits required at the Essakane Gold Mine and their respective status.
| IAMGOLD Corporation - Essakane Gold Mine Technical Report NI 43-101 – February 17, 2016 |
Page 4-8 |
TABLE 4-4 ENVIRONMENTAL AND MINING PERMIT REQUIREMENTS AND STATUS
| Legal references | Requirements | Status | ||
| Order No. 2001-342 on the scope, content and procedure of the Environmental Impact Study Statement |
ESIA (2007)
|
Completed | ||
| Resettlement Plan 2007
|
Completed | |||
| Public consultation (2007)
|
Completed | |||
| Environmental feasibility Ministerial order (2007)
|
Completed | |||
| Addendum (2008)
|
Completed | |||
| Addendum 2012
|
Completed | |||
| Resettlement Plan 2012
|
Completed | |||
| Public consultation (2013)
|
Completed | |||
| COTEVE meeting
|
Completed | |||
| Environmental feasibility Ministerial order (2014) | Completed | |||
| Order No. 2007-845/PRES/PM/MCE/MEF of December 26, 2007 implementing the management of a Mining Environment Preservation and Rehabilitation Fund. | Mining Environment Preservation and Rehabilitation Fund | Completed | ||
| Law No. 31/-2003/AN implementing the Mining Code in Burkina Faso | Mining permit (2008)
|
Completed | ||
| Rehabilitation and closing
|
Ongoing | |||
| Environmental discharge | Ongoing | |||
DISCUSSION
Other than the royalty on the revenues from mineral production to the Government of Burkina Faso, IAMGOLD is not aware of any royalties, back-in rights, payments, or other agreements and encumbrances to which the property is subject.
IAMGOLD is not aware of any environmental liabilities on the property. IAMGOLD has all required permits to conduct the proposed work on the property. IAMGOLD is not aware of any other significant factors and risks that may affect access, title, or the right or ability to perform the proposed work program on the property.
| IAMGOLD Corporation - Essakane Gold Mine Technical Report NI 43-101 – February 17, 2016 |
Page 4-9 |
5 ACCESSIBILITY, CLIMATE, LOCAL RESOURCES, INFRASTRUCTURE AND PHYSIOGRAPHY
TOPOGRAPHY, ELEVATION AND VEGETATION
The Essakane Gold Mine area, specifically the area surrounding the EMZ deposit, is characterized by relatively flat terrain sloping gently towards the Gorouol River to the north of the EMZ deposit. The average elevation over the mine site is 250 MASL. Vegetation consists mostly of light scrub and seasonal grasses. Deforestation has been significant, particularly in the area surrounding the original village of Essakane.
ACCESS AND PROXIMITY TO POPULATION CENTRES
Access from the capital city of Ouagadougou is by a 263 km paved road to the town of Dori, and then approximately 63 km by a laterite road to Essakane. Access via the town of Gorom-Gorom, located 42 km to the west, is also possible. Within the Essakane Exploration Permits, access is via local tracks and paths, which are suitable for two-wheel drive vehicles in the dry season, however four-wheel drive vehicles and trucks are required in the wet season. There is no operating railroad. An airstrip has been built on packed laterite within the fenced perimeter of the mine and daily flights are made between the mine and Ouagadougou using an aircraft owned and operated by Essakane S.A.
There are no major commercial activities in the Essakane Gold Mine area and economic activity is confined to subsistence farming and artisanal mining.
CLIMATE AND LENGTH OF OPERATING SEASON
The Essakane property is located in the northeast of Burkina Faso and the climate is typically Sahelian. Temperature ranges from 10º C to 50º C with annual pan evaporation rates of 3,000 mm/yr. The mean annual rainfall is 503 mm with an estimated 100 yr maximum of 143 mm in a 24 hr period.
| IAMGOLD Corporation - Essakane Gold Mine Technical Report NI 43-101 – February 17, 2016 |
Page 5-1 |
A wet season occurs between late May and September, and the mean annual runoff in the Gorouol River is conservatively estimated to be 91 M m3/yr. Rainfall is sporadic or absent during the rest of the year. Weather conditions have so far had minimal impact on mining operations, however, proper planning is required to ensure an adequate water supply during the dry season.
SURFACE AREA AND PHYSICAL RESOURCES
The Essakane Mining Permit covers an area of 100.2 km2 and has ample surface area for mining operations. Figure 5-1 shows the location of the EMZ and the Falagountou deposits, process plant, the tailings storage facility, and the waste dumps.
Electricity to the EMZ deposit is provided by on-site diesel generators. A 26 MW power plant, fueled with heavy fuel oil, was built for the production phase. An additional 31 MW of capacity was added in 2013 to power the expanded milling circuit. Satellite communication is available at the mine. The main sources of water are the Gorouol River during the rainy season and well fields around the Essakane pit and near the Gorouol River. Water is pumped from wells (boreholes) in sufficient quantities for exploration drilling and the mining camp.
Essakane S.A. initiated local training programs for artisans. Unskilled labour was sourced locally with skilled labour drawn from Burkina Faso at large. Some 90-150 expatriates from North America and Europe were required in the initial years of production, however, that number decreased as local Burkinabé workers acquired the expertise and experience to replace the expatriate employees.
| IAMGOLD Corporation - Essakane Gold Mine Technical Report NI 43-101 – February 17, 2016 |
Page 5-2 |
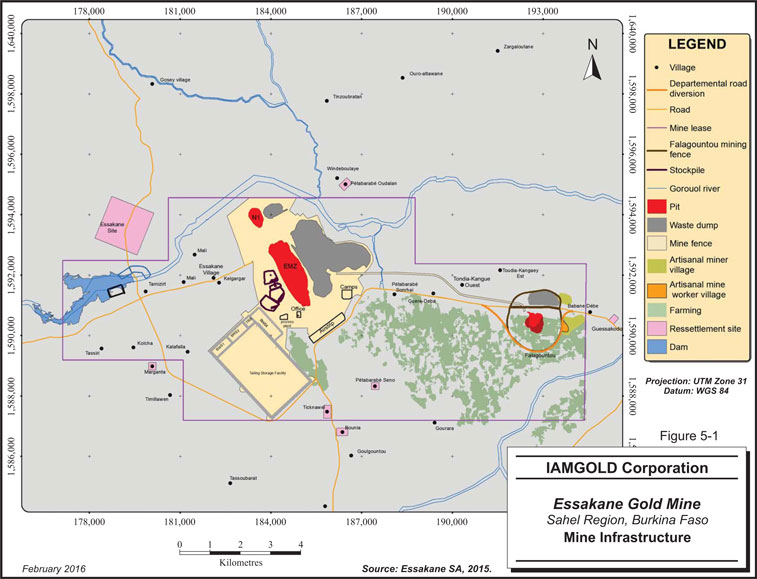
5-3
6 HISTORY
OWNERSHIP, EXPLORATION AND DEVELOPMENT HISTORY
The EMZ deposit has been an active artisanal mining site since 1985. At its peak, up to 15,000 artisanal miners worked at the EMZ deposit.
The Bureau des Mines et de la Géologie du Burkina (BUMIGEB) undertook regional mapping and geochemical programs and arranged and financed a program of heap leach testwork between 1989 and 1991. Compagnie d’Exploitation des Mines d’Or du Burkina (CEMOB) was granted the Essakane Mining Exploration Permit in 1991. The permit covered most of the area which is now included within the Essakane Mining Permit (excluding the Gomo permit).
CEMOB constructed a heap leach facility in 1992 and produced 18,000 ounces of gold in 1993, however, it averaged between 3,000 and 5,000 ounces of gold per year thereafter. Serious efforts were also made to leach saprolite from the EMZ deposit, however, based on verbal accounts, leaching failed due to high cement consumption and solution blinding in the heaps.
BHP Minerals International Exploration Inc. (BHP) assisted CEMOB and explored the area from 1993 to 1996 under a proposed joint venture earn-in agreement. BHP excavated and sampled 26 trenches (4,903 m) along the EMZ deposit. Scout reverse circulation (RC) drilling was completed (including on the Falagountou and Gossey prospects), followed by RC drilling (7,404 m of vertical holes on a 100 m by 50 m grid) and a few diamond drill (DD) holes (1,462 m) in the main area of artisanal mining on the EMZ deposit.
Low gold prices and operational problems caused CEMOB to go into liquidation at the end of 1996 and BHP decided to withdraw from the project.
Upon CEMOB going into liquidation in 1996, Coronation International Mining Corporation (CIMC) secured title and in July 2000, six new Essakane licences were granted to CIMC.
| IAMGOLD Corporation - Essakane Gold Mine Technical Report NI 43-101 – February 17, 2016 |
Page 6-1 |
In September 2000, CIMC entered into an option agreement with Ranger Minerals (Ranger) pursuant to which Ranger undertook an exploration program, focusing on intensive rotary air blast (RAB) and RC drilling of an oxide resource between October 2000 and June 2001. RAB drilling (12,867 m) was used to locate drill targets at Essakane North, Essakane South, Falagountou, and Gossey. Follow-up RC drilling at the EMZ deposit, amounting to 22,393 m, was completed along with 1,070 m of diamond drilling on twins and extensions. Ranger mapped and sampled veins in the BHP trenches. In 2001, Ranger withdrew from the joint venture.
In 2002, CIMC merged with Orezone Resources Inc. (Orezone Resources). Orezone Resources became 90% owner of Essakane S.A.
Gold Fields Orogen Holding (BVI) Ltd (Orogen), formerly known as Orogen Holdings (BVI) Limited, a subsidiary of GFL Mining Services Limited, entered into an Option Agreement with Orezone Resources in July 2002. Orezone Resources was the operator of the mine until Gold Fields Essakane (BVI) Limited (GF BVI) assumed management responsibilities in January 2006.
In 2006, GF BVI carried out an exploration program on the deposit which focused on the quality of gold assays, geological modelling, and mineral resource estimation.
In April 2007, Orezone Resources, Orezone Inc., Orezone Essakane Limited, GF BVI, Orogen, and Essakane (BVI) Limited (Essakane BVI) entered into a members agreement and eventually formed a joint venture.
GF BVI earned a 50% interest in Essakane (BVI) by spending the requisite $8 million on exploration. GF BVI increased its ownership to 60% in the Essakane Gold Mine by gaining a further 10% interest in Essakane (BVI) after Essakane (BVI) completed the Essakane DFS on September 11, 2007.
In October 2007, Orezone Resources entered into an agreement with GF BVI to acquire its 60% interest in the Essakane Gold Mine. On November 26, 2007, Orezone Resources became the operator and owner of a 100% interest in the Essakane Gold Mine, subject to the interest of the Burkina Faso government.
| IAMGOLD Corporation - Essakane Gold Mine Technical Report NI 43-101 – February 17, 2016 |
Page 6-2 |
In April 2008, after obtaining the Environmental Permit, and concluding a MOA with the local population, the Essakane Mining Permit was granted, which resulted in the transfer of the mine to Essakane S.A., a Burkinabé anonymous company, created for the purpose of owning and operating the Essakane Gold Mine. An updated FS (the UFS) was completed on June 3, 2008.
In 2009, IAMGOLD acquired Orezone Resources and the Essakane Gold Mine was transferred to IAMGOLD Essakane S.A. The June 3, 2008 UFS was readdressed to IAMGOLD. Commercial production started on July 16, 2010.
The ownership history is summarized in Figure 6-1.
| IAMGOLD Corporation - Essakane Gold Mine Technical Report NI 43-101 – February 17, 2016 |
Page 6-3 |
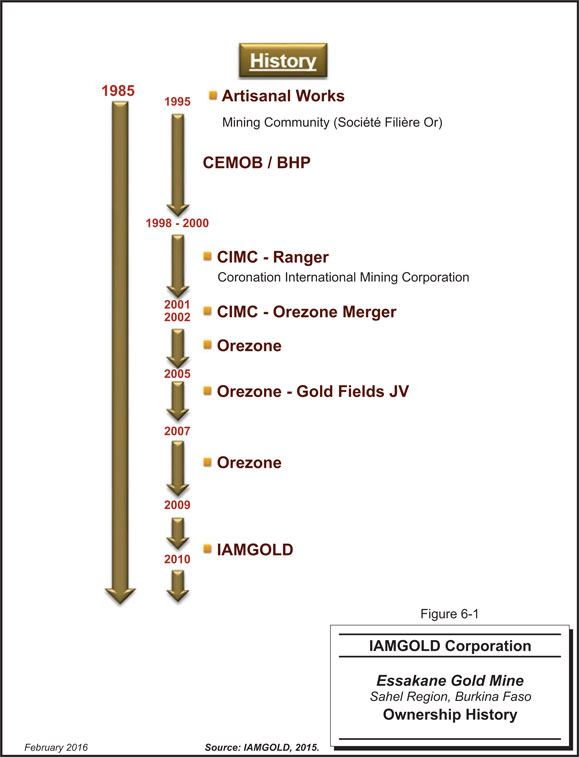
6-4
HISTORICAL MINERAL RESOURCE ESTIMATES
Orezone Resources completed two JORC Mineral Resource estimates; the first was prepared by SRK (Cardiff) in 2004 and the second, by RSG Global (Perth) in 2006. Table 6-1 shows the historical Mineral Resources estimates. SRK recognized that these tonnages were overstated by 15% due to incorrect allocation of densities to the weathering domains. In addition, some uncertainties were noticed about the quality of the historical assay data and poor quality assurance/quality control (QA/QC).
TABLE 6-1 HISTORICAL MINERAL RESOURCE ESTIMATES
| Company | Cut-Off Grade (1 g/t Au) |
Tonnes (000) |
Grade (g/t Au) |
Gold (000 oz) | ||||
| SRK (Cardiff) 2004 |
Indicated | 30.5 | 2.0 | 1,910 | ||||
| Inferred | 4.4 | 2.0 | 290 | |||||
| RSG Global (Perth) 2006 |
Indicated | 19.6 | 2.3 | 1,470 | ||||
| Inferred | 15.3 | 2.3 | 1,190 |
IAMGOLD is not treating these historical Mineral Resource estimates as current and they were superseded by the previous Mineral Resource estimate prepared for the UFS filed by IAMGOLD in March 2009, upon acquisition of the mine.
PAST PRODUCTION
From 1992 to 1999, heap leach processing of gravity rejects from the artisanal winnowing and washings was carried out by CEMOB. CEMOB placed a total of 1.01 Mt of material on the heap leach pad at an average grade of 1.9 g/t Au and achieved 73% recovery during its ownership.
Table 6-2 shows CEMOB’s heap leach plant production from 1992 to 1999 and Table 6-3 shows Essakane S.A.’s mill production from 2010 to 2015. It is estimated that a total of 2.5 million ounces of gold has been produced since 1992.
Artisanal gold production continues until the present, however, no reliable gold production statistics are available on the artisanal workings.
| IAMGOLD Corporation - Essakane Gold Mine Technical Report NI 43-101 – February 17, 2016 |
Page 6-5 |
TABLE 6-2 CEMOB HEAP LEACH PLANT PRODUCTION 1992-1999
| Year | Tonnes (000) |
Grade (g/t Au) |
Gold Ounces | |||
| 1992 |
42 | 4.5 | 5,915 | |||
| 1993 |
116 | 5.1 | 18,388 | |||
| 1994 |
157 | 1.7 | 8,304 | |||
| 1995 |
148 | 1.5 | 6,923 | |||
| 1996 |
257 | 1.0 | 7,918 | |||
| 1997 |
165 | 0.8 | 4,321 | |||
| 1998 |
72 | 1.4 | 3,145 | |||
| 1999 |
50 | 2.0 | 3,151 | |||
| Total |
1,007 | 1.9 | 58,065 |
TABLE 6-3 ESSAKANE MINE AND MILL PRODUCTION 2010-2015
| Year | Tonnes Mined (000 t) |
Grade Mined (g/t Au) |
Tonnes Milled (000 t) |
Grade Milled (g/t Au) |
Ounces Produced (000) | |||||
| 2010 |
10,097 | 1.05 | 2,973 | 1.49 | 136 | |||||
| 2011 |
10,110 | 1.08 | 7,977 | 1.53 | 375 | |||||
| 2012 |
9,562 | 1.04 | 10,762 | 1.10 | 350 | |||||
| 2013 |
11,869 | 0.84 | 10,613 | 0.89 | 277 | |||||
| 2014 |
12,580 | 0.98 | 11,897 | 1.06 | 369 | |||||
| 2015 |
11,518 | 1.14 | 11,716 | 1.23 | 426 | |||||
| Total |
65,736 | 1.02 | 55,938 | 1.16 | 1,933 |
| IAMGOLD Corporation - Essakane Gold Mine Technical Report NI 43-101 – February 17, 2016 |
Page 6-6 |
7 GEOLOGICAL SETTING AND MINERALIZATION
REGIONAL GEOLOGY
The geological setting of northeast Burkina Faso consists predominantly of Precambrian rocks of the Oudalan-Gorouol greenstone belt (Figure 7-1) which forms part of the Paleoproterozoic Baoulé-Mossi domain of the West African Craton and hosts numerous gold deposits including Essakane, Gossey, Korizena, and Falagountou (Nkuna, 2009).
The Oudalan-Gorouol greenstone belt is bounded by intrusive granitic rocks belonging to the plutonic belt (Tshibubudze et al., 2010). Along its western edge, granitic–gneissic rocks are exposed in local tectonic thrust slices. The Birimian sedimentary and volcano-sedimentary sequences in the belt are dominated by meta-volcanoclastic, greywacke, meta-conglomerate, siltstone and shale, carbonate (dolomite), and volcanic unit pillowed basalts (Tshibubudze et al., 2009) (Figure 7-2).
The Oudalan-Gorouol greenstone belt is bounded and/or crosscut by several major north-northeast to northeast trending shear zones including the crustal-scale steeply-east-dipping Markoye Shear Zone, the Tin Takanet-Bellekcire Shear Zone, the Dori Shear Zone, and the Kargouna Shear Zone, etc. The Markoye Shear Zone located through the western portion of the belt trends north-northeast and separates Paleoproterozoic rocks on the east from older granite-gneiss terranes to the west (Tshibubudze et al., 2009).
Recent structural investigations in the northern part of the belt suggested that the Markoye Shear Zone has been affected by at least two phases of tectonic reactivation associated with two phases of regional deformation (Tshibubudze et al., 2009). The first deformation (D1) involved a northeast-southwest directed compression and resulted in the formation of north-northwest to northwest trending folds and thrusts during dextral-reverse displacement on the Markoye Shear Zone. This deformation predates the Eburnean Orogeny and is termed the Tangean Event dated at ca. 2170 Ma to 2130 Ma (Hein, 2009). The second deformation (D2) involved a period of northwest-southeast crustal shortening and sinistral-reverse displacement on the Markoye Shear Zone and is correlated to the ca. 2.0 Ga Eburnean
| IAMGOLD Corporation - Essakane Gold Mine Technical Report NI 43-101 – February 17, 2016 |
Page 7-1 |
Orogeny (Feybesse et al., 2006). D2 is characterized by northeast trending regional folds and a pervasive northeast trending foliation. D1 structures are compatible with pure-shear dominated transpression, while the D2 deformation is characterized by a switch to the strike-slip dominated east-west to west-northwest oriented transpressional regime (Tshibubudze et al., 2009; 2010) (Figure 7-4).
Gold mineralization is generally hosted in the hanging-wall of northeast trending faults and/or northwest trending folds in meta-siltstone, sandstone, and shale sequences and can be classified as orogenic gold deposits under the sub-class of “intrusion-related” due to their proximity to plutonic masses (Nkuna, 2009). Gold deposits are most often related to transcurrent D2 shear zones and faults as these discontinuities have served as the main conduct of mineralized fluids. Gold is either disseminated or concentrated in quartz veins (Beziat et al., 2008). As with other Precambrian orogeny, the early fabrics were modified by the regional-scale transcurrent shear zones D2, which acted as pathways during the gold mineralization events (Nkuna, 2009).
| IAMGOLD Corporation - Essakane Gold Mine Technical Report NI 43-101 – February 17, 2016 |
Page 7-2 |
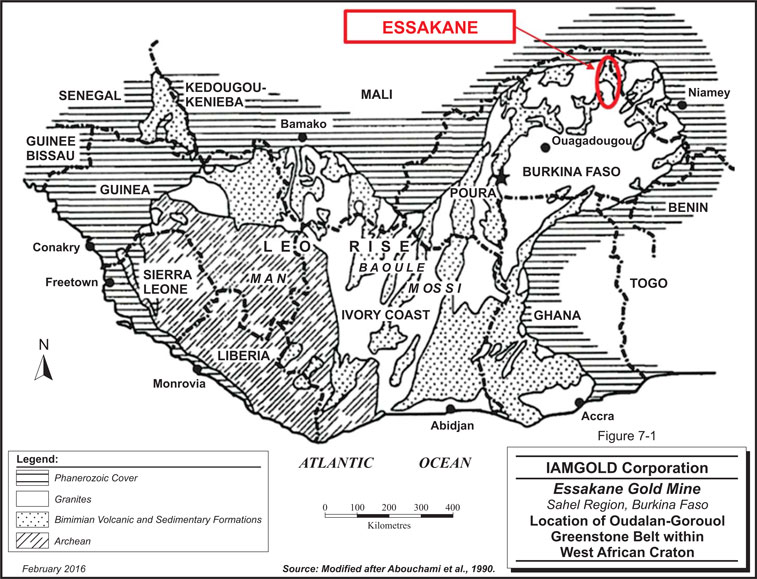
7-3
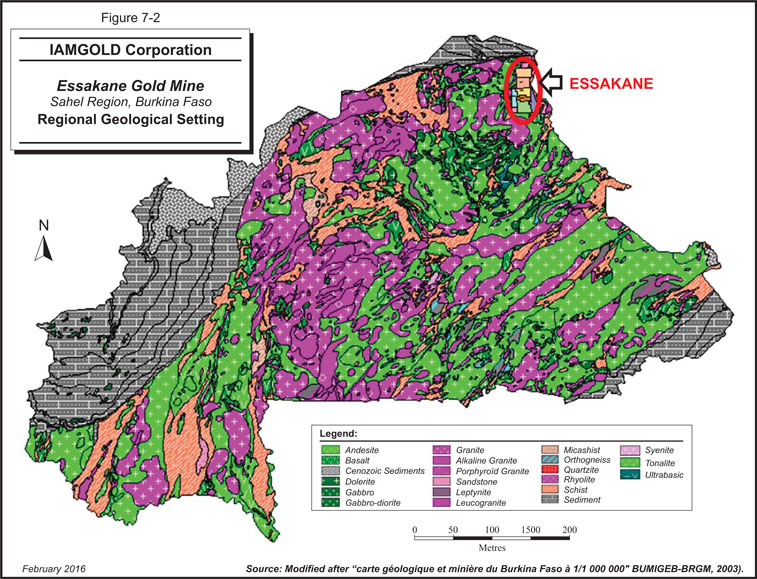
7-4
LOCAL GEOLOGY
The Essakane Gold Mine lies in an outlier of folded sedimentary Birimian rocks, which are intruded in places by intermediate and mafic sills. The sediments in the district have been subdivided on the basis of lithology into deep-water turbidites (the Birimian) and coarse clastic basin margin sequences (the Tarkwaian). The Birimian rocks consist of wackes, arenites and mudrocks (argillites), pebbly arenites, and minor tuffs, which have been metamorphosed to lower greenschist facies. Arenite is the dominant lithology. Intermediate intrusives occurring as sills are common and appear to predate all gold mineralization in the district. The Tarkwaian rocks are typically sandstones with thin intercalated bands of matrix-supported, polymictic conglomerates, however, are unlike the type of lithologies found in Ghana. In particular, the conglomerate matrices are not enriched in heavy minerals nor do they show the alteration mineral assemblages of Tarkwa and Iduapriem mines. Figure 7-3 shows the boundaries of the updated exploration permits comprising the property and the EMZ deposit current study area (highlighted in red) in context with the local geology. The bold red shape within the red perimeter is the crest line of the surface mine shell on the EMZ deposit.
The Birimian and Tarkwaian rocks are bounded to the west by the major north-northeast trending Markoye Fault and to the south by the Dori batholith. The Markoye Fault is thought to be a left-lateral wrench fault that was an active basin margin fault at the time of deposition of the sediments. Other regional faults in the district appear to trend northeast and west-northwest. Mesozoic age dolerite dykes are generally found in the latter. Fold axes within the Birimian rocks trend northwest and north except in the south where units are re-folded adjacent to the batholith (Figure 7-4).
| IAMGOLD Corporation - Essakane Gold Mine Technical Report NI 43-101 – February 17, 2016 |
Page 7-5 |
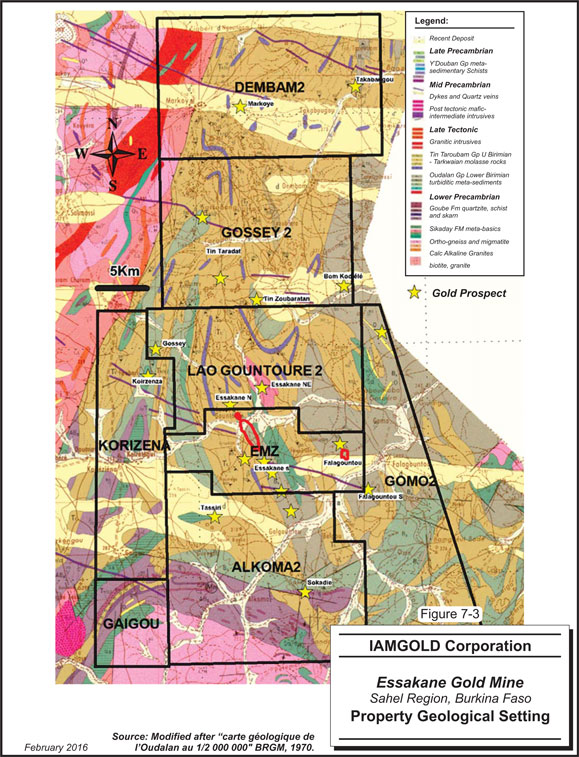
7-6
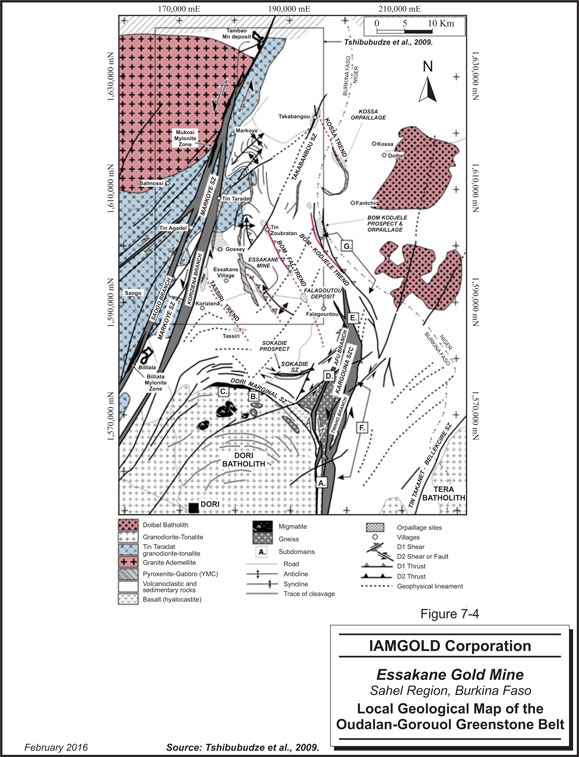
7-7
PROPERTY GEOLOGY
The Essakane Gold Mine occurs in the Paleoproterozoic Oudalan-Gorouol greenstone belt in northeast Burkina Faso. The stratigraphy can be subdivided into a succession of lower-greenschist facies meta-sediments (argillites, arenites, and volcaniclastics), conglomerate, and subordinate felsic volcanics, and an overlying Tarkwaian-like succession comprising siliciclastic meta-sediments and conglomerate. Each succession contains intercalated mafic intrusive units that collectively comprise up to 40% of the total stratigraphic section.
Gold prospects on the permits (shown as yellow stars in Figures 7-3 and 7-5) occur exclusively in Birimian rocks and are generally associated with quartz veining on the margins of mafic and intermediate sills. Exceptions are the EMZ deposit and the Sokadie prospects (the latter on the Alkoma 2 permit). The EMZ deposit is characterized by quartz veining in a folded turbidite succession of arenite and argillite. At the Sokadie prospect, the veins occur in a sheared volcaniclastic unit between un-deformed andesite and metasediments. As a general rule, gold occurs with quartz veining on the contacts of rock units with contrasted competency and as filling of brittle fractures in folded sediments.
The region preserves evidence for at least two regional deformational events. D1 structural elements such as the Essakane host anticline are refolded by a series of north-northeast trending F2 folds. Later localized deformation occurs near the margin of a calc-alkaline batholith in the south of the mine area. The Markoye Fault trends north-northeast through the western portion of the mine area and separates the Paleoproterozoic rocks from an older granite-gneiss terrane to the west.
| IAMGOLD Corporation - Essakane Gold Mine Technical Report NI 43-101 – February 17, 2016 |
Page 7-8 |

7-9
MINERALIZATION
EMZ DEPOSIT MINERALIZATION
The EMZ deposit is a greenstone hosted orogenic gold deposit. Specifically, it is a quartz-carbonate stockwork vein deposit hosted by a folded turbidite succession of arenite and argillite (Figure 7-6).
The laminated sedimentary units are part of turbidite sequences. The regular laminated unit is composed of very regular alternating sandstone, siltstone, and grey-black argillite. The lateral extension of this unit is limited. The irregular laminated unit is thicker than the regular bed and is mainly composed of an argillite unit (more than 65% of the whole rock). This irregular laminated unit is also made of an alternating sequence of sandstone, siltstone, and poorly sorted argillite.
Gold occurs as free particles within the veins and is also intergrown with arsenopyrite +/- tourmaline on vein margins or in the host rocks. Disseminated arsenopyrite in the host rock rapidly decreases away from the veins and is strongly associated with the gold mineralization. The same relationship is seen away from lithological contacts, which generally show higher densities of bedding-parallel veining. Oriented diamond core drilling shows that significant concentrations of gold with arsenopyrite can be found in the arenite-argillite lithological contacts in association with quartz veining or in veinlets of massive arsenopyrite. Deeper below the main arenite unit, significant concentrations of gold are found in association with coarse arsenopyrite in the argillitic unit. The gold particles occur without sulphides in the weathered saprolite. The gold is free-milling in all associations.
A cross-section through the EMZ deposit model is shown in Figure 7-7. The model is based on the latest mine geology mapping and interpretation from extensive oriented diamond core drilling. It has been confirmed that the EMZ deposit is an anticlinal fold with flexural slips between layers and is westward thrusting along weakness planes parallel to bedding, with minor displacement.
The quartz veins fill brittle extension and shear deformation structures caused by the folding with at least three distinct sets of veins (Figure 7-8) and two phases of quartz veining and gold mineralization.
| IAMGOLD Corporation - Essakane Gold Mine Technical Report NI 43-101 – February 17, 2016 |
Page 7-10 |
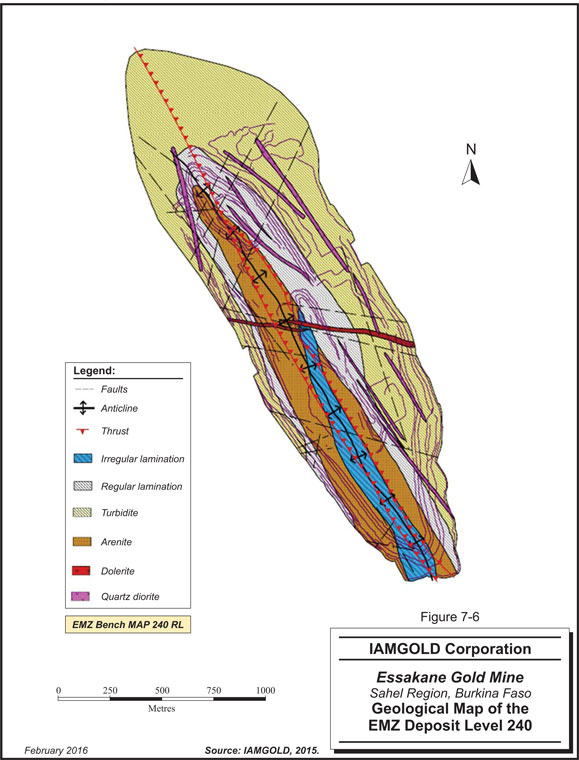
7-11
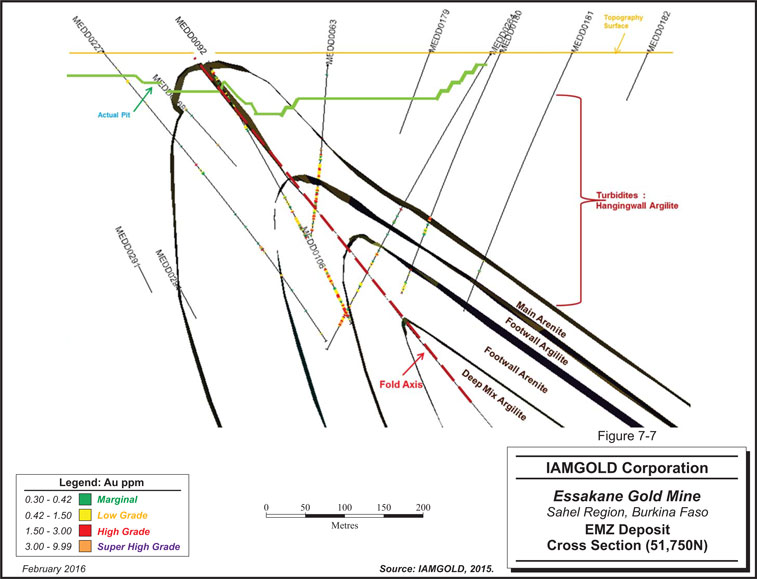
7-12
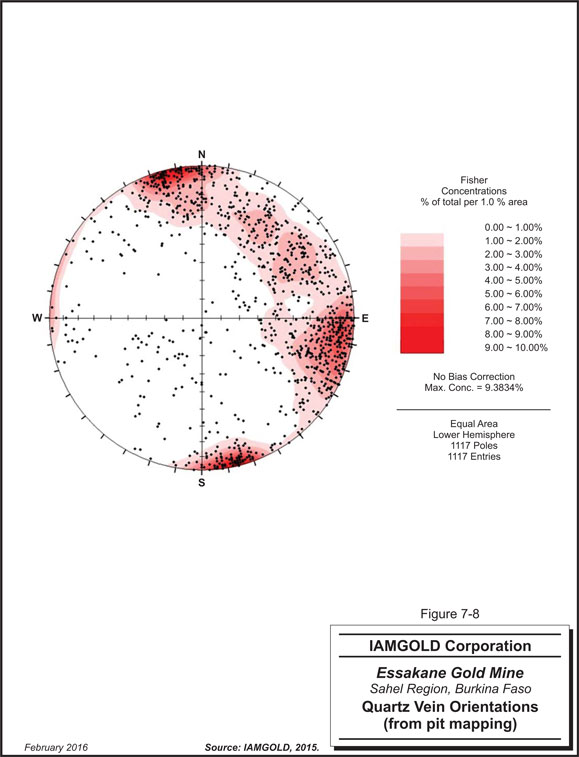
7-13
The vein arrays in the EMZ deposit are complex and consist of the following:
| ● | Early bedding parallel laminated quartz veins caused by flexural slip and showing ptygmatic folding; |
| ● | Late, steep extensional quartz veins as vein filling in extension and shear joints formed by the folding; |
| ● | Axial-planar pressure solution cleavage (with pressure solution seams normal and parallel to bedding). All veins may be displaced by two sets of late opposing thrusts as shown in Figure 7-9. |
The vein arrays occur in the east limb, fold hinge (or fold axis), and west limb litho-structural domains. The geology and economic potential of the EMZ deposit is dominated by the persistent east limb main arenite. The top contact of the east limb domain is a sharp, sheared contact with no significant gold mineralization above it. The shearing appears to be parallel to bedding, however, some loss of vertical succession has occurred. The main arenite below this contact is the lower coarse grained part of a Bouma cycle. The locus of bedding parallel deformation and alteration is within the east limb main arenite. Graphitic argillite occurs immediately above the contact. The deformation shifts into the hangingwall argillite unit to the north of the EMZ deposit.
Mineralization has been confirmed to over 550 m vertically below surface, however, the full depth extent in the fold hinge and east limb is still unknown. The geometry of the fold hinge zone is an anticlinal flexure that is easily recognized in the pit and oriented drill cores. The fold closure is sharp and sometimes truncated by thrusts and the transition from east limb to west limb takes place over a few metres. The position of the fold axis is often marked by a breccia in the arenite unit. The fold hinge zone in the argillite unit is marked by tight kink structures and sheath folds with rapid transitions from east dipping footwall rocks to near-vertical west limb beds below the fold axial plane.
Hydrothermal alteration and meteoric weathering are pervasive through the east limb main arenite. It is generally associated with quartz veining and gold mineralization in deformed main arenite. The alteration assemblage is sericite > carbonate > silica ± albite ± arsenopyrite ± pyrite. Disseminated tourmaline and rutile are found in accessory amounts. The main alteration minerals tend to occur in clearly defined veins and stringers.
| IAMGOLD Corporation - Essakane Gold Mine Technical Report NI 43-101 – February 17, 2016 |
Page 7-14 |
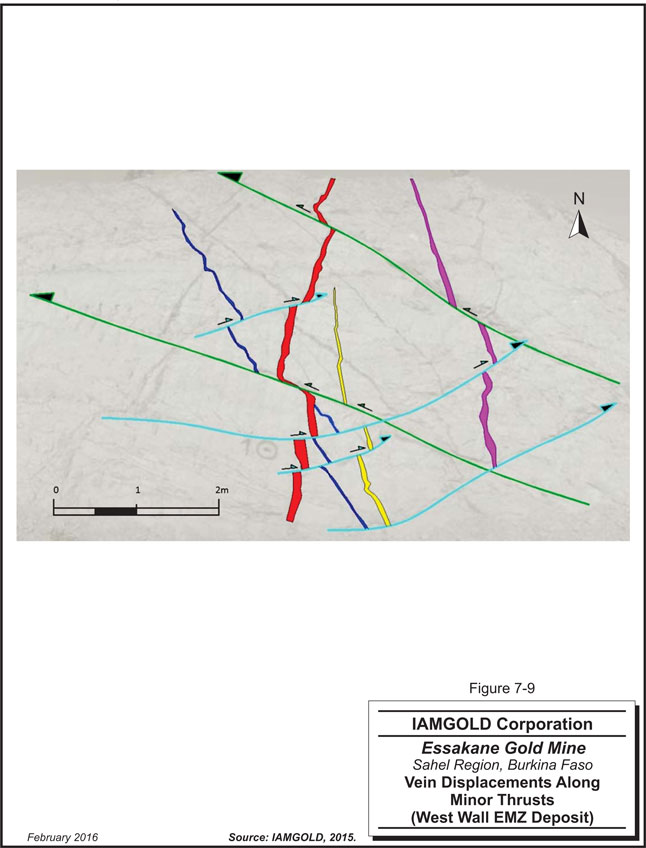
7-15
Arsenopyrite and pyrite occur within and adjacent to quartz veins as well as disseminated throughout areas of wallrock alteration. Traces of chalcopyrite, pyrrhotite, galena, and hematite occur with arsenopyrite. Minor amounts of tourmaline with rutile are found in the main arenite and in interbedded arenite stringers in the footwall argillite. Remobilised graphite can be found associated with tourmaline.
The fine-grained argillites can be strongly enriched in tourmaline and have also been subjected to quartz, carbonate, sericite, and quartz alteration. Fine needles of rutile are generally associated with the tourmaline. Sulphide mineralization preferentially occurs in the coarser arenaceous layers.
The EMZ deposit is characterized by multiple quartz and quartz-carbonate vein sets and stringers. Arsenopyrite and pyrite tend to be late and concentrated near the margins of the veins or in late cross-cutting stringers. The paragenetic sequence of veining is thought to be as follows:
| ● | Early quartz-carbonate-albite-(sericite) veins. |
| ● | Quartz veins with tourmaline and pyrite containing gold. |
| ● | Diffuse quartz-albite-carbonate veins with arsenopyrite. |
| ● | Later tourmaline-rutile-arsenopyrite stringers with gold. |
| ● | Late skeletal pyrite and carbonate-quartz-pyrite stringers. |
Except for vein sets located in the turbidite-hosted Birimian sills, all recorded vein sets are mineralized. The east-west and north-south vein sets both appear to show higher average gold grades than the other vein sets (Table 7-1), however, they are also more variable, with a higher proportion of the lower values also appearing in the same vein sets. Tests done in December 2010, over three areas inside the pit with oriented grade control drilling, have demonstrated that the grade difference between holes oriented 242° (old pattern) and 120° (new pattern that should intersect more of both sets) can be as high as 9%.
| IAMGOLD Corporation - Essakane Gold Mine Technical Report NI 43-101 – February 17, 2016 |
Page 7-16 |
TABLE 7-1 GOLD GRADE DISTRIBUTION ACCORDING TO VEIN SETS
| Vein set | No. of veins |
% | No. of samples |
% | Avg (g/t) |
£ 1g/t | 1g/t <x £ 5g/t |
£ 5g/t | 5g/t <x £ 10g/t |
> 10g/t | >20g/t | |||||||||||||||||||||||||||||||||
| 70°-90° |
225 | 25 | % | 106 | 25 | % | 6.43 | 30 | % | 17 | % | 26 | % | 17 | % | 29 | % | 35 | % | |||||||||||||||||||||||||
| 250°-270° |
126 | 14 | % | 67 | 16 | % | 5.75 | 20 | % | 12 | % | 17 | % | 14 | % | 13 | % | 14 | % | |||||||||||||||||||||||||
| 120°-160° |
209 | 24 | % | 91 | 22 | % | 5.34 | 19 | % | 24 | % | 21 | % | 40 | % | 17 | % | 14 | % | |||||||||||||||||||||||||
| 180°-210° |
326 | 37 | % | 152 | 37 | % | 7.23 | 31 | % | 46 | % | 36 | % | 29 | % | 42 | % | 38 | % | |||||||||||||||||||||||||
| Total |
886 | 100 | % | 416 | 100 | % | 6.38 | 198 | 99 | 297 | 42 | 77 | 37 | |||||||||||||||||||||||||||||||
Figure 7-10 shows, as cumulative distribution functions (CDFs), the proportion of samples that have returned values below a series of cut-offs for each family of veins, which shows how the vein sets compare with each other. The four sets can be split in two groups based on the CDF in the lower grade cut-offs: a higher proportion of low grade and lower variability in sets 70° to 90° and 250° to 270° as opposed to the other two sets. The higher variability and proportion of high grade lies within the 120° to 160° and 180° to 210° sets as demonstrated by the steeper CDF slopes overall, particularly above the 10 g/t Au cut-off. Updated compilations of vein sets in 2013 have confirmed the conclusions of the 2010 study.
FIGURE 7-10 CDF OF VEIN SETS AU GRADE
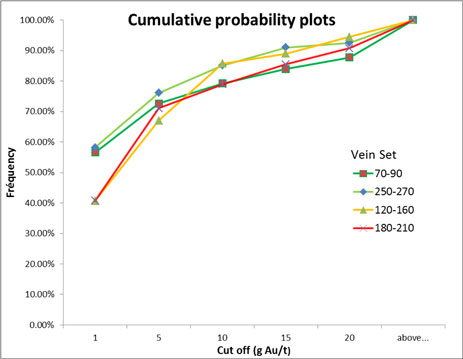
| IAMGOLD Corporation - Essakane Gold Mine Technical Report NI 43-101 – February 17, 2016 |
Page 7-17 |
FALAGOUNTOU DEPOSIT MINERALIZATION
Due to the intense artisanal mining (“orpaillage”) activity, no detailed geological mapping has been carried out over the Falagountou deposit. Observations, from visits within orpailleur workings, indicate that gold is located in smoky quartz veins injected in a sequence of fine to medium detrital sediments, similar to those found at the EMZ deposit that have been intruded and metamorphosed by shallow dioritic dykes.
Drill cutting and core observations have confirmed that the gold mineralization is structurally controlled, hosted in sheared and brecciated zones in the hanging-wall contacts between sedimentary and intrusive rocks along a north-northwest to north trend. Gold is associated with quartz veins and is found disseminated into the wallrock, as well. There is a strong spatial relationship between the gold mineralization structures and the swarm of intrusive dykes that intrude the sedimentary sequence, suggesting that part of the fluid responsible for the gold deposition may have been exsolved from the dioritic magma during its emplacement. The alteration assemblage encountered is silica-calcite-chlorite. Pyrite and arsenopyrite are the main sulfide minerals observed to date, both in sedimentary rocks and the dioritic dykes.
Most of the artisanal mining activity is located at the contacts between sedimentary and intrusive rocks. Airborne magnetic surveys suggest that other intrusive rocks are located to the south-west of the small scale artisanal miner pits and recent drilling results indicate that the western edge hosts gold mineralization (red dashed line shown in Figure 7-11).
WEATHERING
Weathering of arenite and argillite by meteoric processes has produced a consistent, however, very uneven weathering profile. The ability of drill core to absorb water and the rate of absorption was used from January 2006 to define the base of upper and lower saprolite (transition zone). This method was replaced by the use of Brown’s hardness scale in early 2010 to better define the three main weathering profiles (saprolite, transition, and fresh rock) at the Essakane Gold Mine.
Very little of the primary lithology can be recognized in the clay-rich saprolite near surface. The base of upper saprolite is easily recognized in drill core, particularly after the core is
| IAMGOLD Corporation - Essakane Gold Mine Technical Report NI 43-101 – February 17, 2016 |
Page 7-18 |
allowed to dry in the sun and the clay fraction disaggregates. In general, this is a fairly sharp contact and mining equipment is able to dig this material without difficulty. Compared to the EMZ deposit, the saprolitic layer at the Falagountou deposit is much thinner, sometimes less than a few metres. The base of transition (or top of Fresh) is gradational and the contact is placed at the Brown’s value of R3 (that is, the rock can be peeled by a pocket knife with difficulty; shallow indentations made by firm blow with point of geological hammer). Oxidation of sulphides on vein margins and joints can extend into fresh rocks for some distance below this position.
| IAMGOLD Corporation - Essakane Gold Mine Technical Report NI 43-101 – February 17, 2016 |
Page 7-19 |
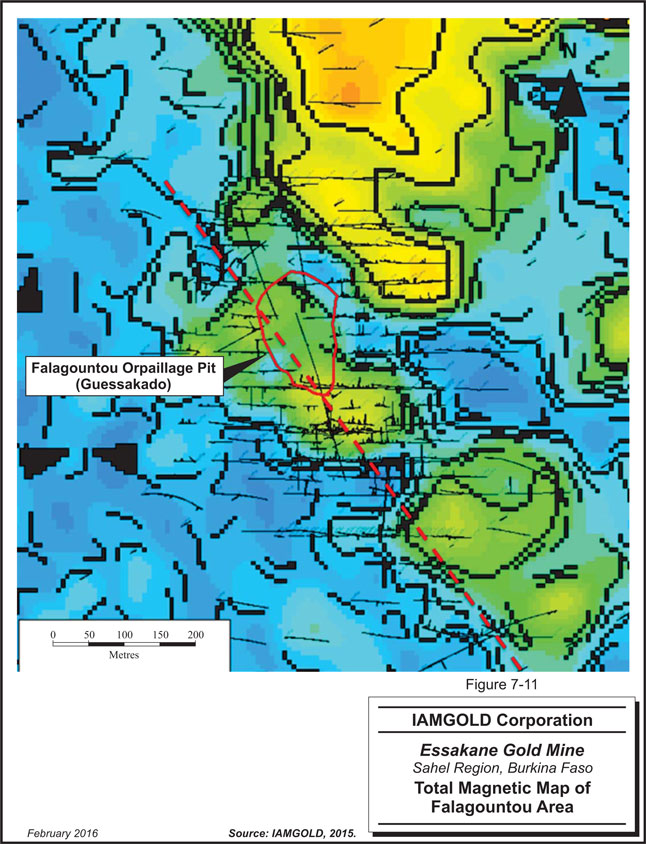
7-20
GOLD MINERALOGY
The EMZ deposit is a coarse gold deposit. The rule-of-thumb definition for coarse gold is when particles are larger than 100 microns in diameter. Significant amounts of gold report to the +106 microns oversize despite the fine grind. Fifty per cent of the gold fraction is coarser than 106 microns in samples assaying >5 g Au/t with a strong maximum between 60% and 80% in high grade samples. In lower grade samples, the proportion of gold coarser than 100 microns can vary from 5% to 80%. Strong heterogeneity would account for the sampling problems and imprecision in assaying the EMZ deposit samples. These observations have been mitigated by using a large sample (7kg) for preparation and the use of the LeachWELL analysis method.
Visible gold particles have been recorded during core logging within and on the margins of quartz veins, intergrown with coarse arsenopyrite, and as isolated grains in the host rock. The usual associations are:
| ● | gold particles in white, extensional, quartz-carbonate veins |
| ● | on fractures or peripheral to late carbonate which has developed along quartz grain boundaries |
| ● | associated with clusters of arsenopyrite grains. Mineralogical testwork shows that the gold occurs: |
| o | on sulphide grain boundaries, |
| o | as small filamental grains concentrated along fractures within the sulphide, or as coarse flakes >100 microns in size and wholly occluded by the sulphide, and |
| o | interstitial to concentrations of tourmaline and arsenopyrite in the host rocks. |
STRUCTURAL CONTROLS ON MINERALIZATION
The main structural features of the EMZ deposit are:
| ● | The lithologies are folded into a west-verging anticline; |
| ● | There are competency contrasts between arenite and argillite, and flexural slip along bedding planes in a pervasive deformation style throughout the deposit; |
| ● | Early bedding-parallel, grey laminated quartz veins are related to flexural slip; |
| ● | Syn-deformational, steep extensional quartz veins with visible gold occur in the fold hinge and east limb domains; |
| IAMGOLD Corporation - Essakane Gold Mine Technical Report NI 43-101 – February 17, 2016 |
Page 7-21 |
| ● | Axial-planar pressure solution seams are developed in the fold hinge. |
Mine mapping and oriented core drilling have demonstrated that continuity of mineralization within the fold hinge domain is caused by conjugate vein sets. These vein sets have been repeatedly sealed and reactivated during a deformation history that saw a 40° clockwise rotation of the stress fields. Away from the hinge, dissemination of mineralization along flexural slips and lithological contacts are the more prevalent mechanisms of emplacement.
Pressure solution veining appears to be more common in the footwall argillite and provides grade continuity down the fold axis. The lengths of individual veins are usually short and only a few veins longer than 10 m are exposed in the pit. The vein density (number of veins in a given volume) is the most important factor to delineate favourable gold concentration. This pattern of mineralization extends into the east limb main arenite, with steep north-south veins supplemented by a lower frequency of east-west and 140° veins.
Grade continuity is best developed along the following lithological contacts:
| ● | Upper part of the east limb main arenite; |
| ● | The arenite-argillite contact at the base of the main arenite; |
| ● | The gradational contacts between the footwall argillite and footwall arenite units; |
| ● | The arsenopyrite-rich layers in the deep argillite. |
Continuity of mineralization in the steep west limb is poor. The mineralization is usually low grade due to the frequency of white, late-stage extensional quartz veins with visible gold, however, there are a few east-west extensional veins crosscutting the west limb which have been worked by the artisanal miners. Gold dissemination into the wallrock is rare and gold is largely confined to the early stage, bedding parallel and conjugate veins sets.
| IAMGOLD Corporation - Essakane Gold Mine Technical Report NI 43-101 – February 17, 2016 |
Page 7-22 |
8 DEPOSIT TYPES
The EMZ deposit is a greenstone hosted orogenic gold deposit. Specifically, it is a quartz-carbonate stockwork vein deposit hosted by a folded turbidite succession of arenite and argillite. The original structural interpretation and gold settings have been confirmed by mining.
The Falagountou deposit is a porphyry intrusive-hosted, orogenic style, gold deposit. Gold is commonly located within smoky quartz veins injected along the contact of the dioritic dyke and a sequence of fine-to-medium-grained detrital sediments. Gold is also disseminated into the rock. At both Guessakado (Falagountou’s orpailleur pit area) and the Falagountou Southeast Zone, vein occurrence is prevalent at the contact of the intrusion and sedimentary rocks.
| IAMGOLD Corporation - Essakane Gold Mine Technical Report NI 43-101 – February 17, 2016 |
Page 8-1 |
9 EXPLORATION
The Essakane Gold Mine has been explored since the 1990s by geochemistry sampling, mapping, trenching, Aster/Landsat image analysis and interpretation, geophysical surveys, and drilling. Exploration prior to IAMGOLD’s ownership is described in Section 6 of this Technical Report.
TRENCHING
In the early 1990s, CEMOB excavated five trenches for a total of 705 m. Then BHP and Orezone Resources undertook a trenching campaign. A total of 4,903 m of trenching has been completed to date.
GEOPHYSICS
A total of 30,407 line-km were flown over the Essakane Exploration Permits and the Essakane Mining Permit by South African contractor Xcalibur Airborne Geophysics between November 26, 2009 and February 10, 2010. Total and vertical gradient magnetics along with U/K/Th radiometrics were recorded. Two induced polarization (IP) lines were surveyed by Sagax Geophysics in 2010: one immediately north of the EMZ deposit and the other immediately south.
GEOCHEMICAL SAMPLING AND REGOLITH MAPPING
Geochemical sampling conducted by Orezone Resources was successful in locating potential targets for follow-up pitting and drilling. Samples were generally assayed for gold and arsenic and many exploration targets were identified by this method, some of which have been subsequently tested.
A regolith map was completed during the soil sampling process. Outcrop is limited and there is an extensive cover sequence of residual soils and transported material. The southern permits are characterized by a higher proportion of outcrop.
| IAMGOLD Corporation - Essakane Gold Mine Technical Report NI 43-101 – February 17, 2016 |
Page 9-1 |
SATELLITE IMAGERY INTERPRETATION
An interpretation of structural geology derived from Aster image and Airmag data has been carried out by the Orezone Resources exploration team. A number of fold axial traces observed have a spatial relationship with the main gold mineralization. These observations suggest that a significant proportion of the gold occurrences on the permits are associated with this folding event (Figure 9-1).
| IAMGOLD Corporation - Essakane Gold Mine Technical Report NI 43-101 – February 17, 2016 |
Page 9-2 |
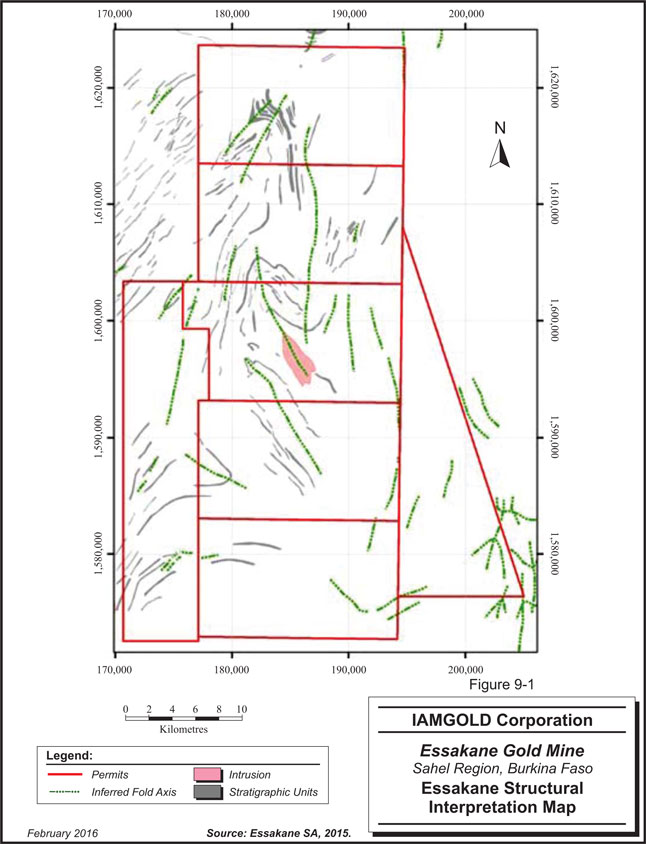
9-3
10 DRILLING
Exploration efforts on the Essakane Gold Mine were initially focused on identifying the potential of the entire area of the mine. In the mid-1990s, BHP undertook a widely spaced drilling program on the EMZ deposit that has been narrowed subsequently by Ranger.
Orezone Resources started resource definition drilling at the EMZ deposit in February 2003. At the end of 2004, vertical RC drilling was performed on a nominal grid of 50 m x 25 m. The RC holes were drilled to the water table and sampled at one metre intervals. RC drilling was preferred over DD as it allowed increasing the sample size and thus offset the coarse gold sampling issue.
In its early programs, Orezone Resources drilled a few HQ (63.5 mm) diameter DD tails of RC holes which had been stopped in the main arenite or in gold mineralization, in order to test for grade continuity at depth. Some of these tails returned significant gold assays in the footwall argillite. Systematic drilling of DD tails was started in May 2005 to evaluate the footwall units. IAMGOLD has continued using this drilling method over most of the EMZ deposit area to a vertical depth of 400 m.
Orezone Resources and GF BVI drilled 20,364 m of oriented HQ diameter core between September 2005 and June 2006 for the project development and FS program.
RC and DD drilling has been conducted by Essakane S.A.’s Resource Development Group since January 2010. Up to December 31, 2014, a total of 1,071 RC holes (137,852 m) and 675 DD holes (207,847 m) had been drilled within the EMZ and Falagountou pits.
Essakane S.A.’s drilling objectives include infill drilling to upgrade Inferred Mineral Resources, expand the resource inventory, to gain a better understanding of the geology and controls of mineralization to advance geological modelling, and to improve the quality of assay samples.
At the EMZ deposit, most DD holes targeted Inferred Mineral Resources below the EMZ pit and along the deposit’s northern, southern, and down-dip extensions.
| IAMGOLD Corporation - Essakane Gold Mine Technical Report NI 43-101 – February 17, 2016 |
Page 10-1 |
DD results were positive on the EMZ deposit with continuity of mineralization demonstrated at depth along the east limb of the deposit in the northern sector of the pit, as well as in the southeast end of the pit. EMZ deposit mineralization is oriented north-northwest. The DD results were incorporated into the updated resource model as reported at December 31, 2014.
An infill RC and DD program conducted at the Falagountou deposit, since the Essakane Mineral Resource estimate of December 31, 2014, confirmed lateral continuity of mineralization oriented mostly north-south as well as an extension down-dip, which remained open. Drilling also identified a second mineralized structure, located 250 m west of the main zone.
A total of 165 RC and DD holes for a total of approximately 15,000 m were drilled and results were incorporated into the April 1, 2015 Mineral Resource estimate for the Essakane Mine (press release dated April 23, 2015). In March 2015, an exploration drilling program was designed to test for further extensions of the Falagountou deposit. Positives results were reported, which have been incorporated into the current Mineral Resource estimate.
The drilling programs are based on the targets and metreage proposed by the geology department during budget preparation. The drill programs are generally derived from the corporate objectives set earlier in terms of resource/reserve renewal and types of ore feed to mill. These translate into yearly drilling plans made up of individual hole information that are created and saved in GEOVIA GEMS mine modelling software (temporary hole-id, collar location, length, azimuth, and plunge).
Collar locations are then checked in the field by the senior technician to ensure that there is sufficient space for the drilling pad and a nearby water decant basin for DD holes that will collect the run-off water and drill cuttings.
The DD and RC drill holes as of December 31, 2015 are summarized in Table 10-1.
| IAMGOLD Corporation - Essakane Gold Mine Technical Report NI 43-101 – February 17, 2016 |
Page 10-2 |
TABLE 10-1 ESSAKANE DRILLING PROGRAMS 1995 TO 2015
| Year | DD | RC | RCD | Total | ||||||||||||||
| Company | Metres | No. Holes |
Metres | No. Holes |
Metres | No. Holes |
Metres | No. Holes | ||||||||||
| 1995 | BHP | 1,462 | 8 | 7,404 | 120 | - | - | 8,866 | 128 | |||||||||
| 2000 | Ranger | 69 | 1 | 3,952 | 52 | 222 | 2 | 4,243 | 55 | |||||||||
| 2001 | Ranger | 113 | 1 | 17,380 | 179 | 1,728 | 11 | 19,221 | 191 | |||||||||
| 2002 | Orezone | - | - | - | - | - | - | - | - | |||||||||
| 2003 | Orezone | 288 | 2 | 9,406 | 137 | 724 | 6 | 10,418 | 145 | |||||||||
| 2004 | Orezone | 819 | 4 | 14,510 | 160 | 8,818 | 48 | 24,147 | 212 | |||||||||
| 2005 | Orezone | 12,358 | 62 | 45,817 | 455 | 29,980 | 184 | 88,155 | 701 | |||||||||
| 2006 | GF BVI | 13,099 | 74 | 8,167 | 80 | 16,675 | 73 | 37,941 | 227 | |||||||||
| 2007 | Orezone | 3,264 | 30 | 1,043 | 17 | - | - | 4,307 | 47 | |||||||||
| 2008 | IAMGOLD | 10,967 | 69 | 2,822 | 38 | - | - | 13,789 | 107 | |||||||||
| 2009 | IAMGOLD | 10,978 | 57 | 12,413 | 93 | - | - | 23,391 | 150 | |||||||||
| 2010 | IAMGOLD | 38,071 | 142 | 32,220 | 230 | 1,032 | 3 | 71,323 | 375 | |||||||||
| 2011 | IAMGOLD | 63,673 | 187 | 23,273 | 182 | - | - | 86,946 | 369 | |||||||||
| 2012 | IAMGOLD | 49,942 | 118 | 38,663 | 295 | - | - | 88,605 | 413 | |||||||||
| 2013 | IAMGOLD | 23,010 | 76 | 29,438 | 217 | - | - | 52,448 | 293 | |||||||||
| 2014 | IAMGOLD | 33,149 | 152 | 14,258 | 147 | - | - | 47,407 | 299 | |||||||||
| 2015 | IAMGOLD | 5,484 | 22 | 15,170 | 101 | 3,756 | 16 | 24,410 | 139 | |||||||||
| Total | 266,746 | 1,005 | 275,936 | 2,503 | 62,935 | 343 | 605,615 | 3,851 | ||||||||||
Note:
| 1. | Hole type RCD means the holes were pre-collared with RC then completed by DD. |
DIAMOND DRILLING
Since 2007, Essakane S.A. has contracted Boart Longyear Drilling Services for all its resource development DD. Starting in 2014, contract drilling was carried out by Major Drilling International.
HQ-size core (63.5 mm) is drilled ten metres past the saprolite horizon and then reduced to NQ core (diameter 47.6mm). The geologist may request that the hole be drilled HQ over a longer distance if hole deviation is an issue. Hexagonal core barrels and extended shells are often used to further reduce deviation. Core orientation is carried out using a downhole spear with wireline attachment. Drill core is placed in angle iron racks at the drill site and oriented by an Essakane S.A. technician. A continuous top node line is drawn along the length of the core in black indelible ink. The start and end depths of the drilled interval are written on the core along with the metre marks. Geotechnical information such as rock quality designation (RQD) is also recorded. The core is then packed into metal core trays at the drill
| IAMGOLD Corporation - Essakane Gold Mine Technical Report NI 43-101 – February 17, 2016 |
Page 10-3 |
site and transported to a dedicated logging facility within the secure mine perimeter. Wooden blocks are used to mark the start and end of drill runs. The borehole number, tray number, and from-to depths of the drilled interval are written on the core tray.
Efforts to properly core drill from surface through the upper saprolite often failed over the EMZ deposit due to loss of drilling fluid, caving of holes, or the washout of saprolite by entrained quartz fragments plugging the bit. All holes on the EMZ deposit are cased with either hard PVC plastic or steel tubing which have to be pulled after downhole tests have been taken.
Due to the high ground and air temperature (> 35°C), the core is always dry when it is brought to the core shack. The core is logged by Essakane S.A. geologists with information recorded onto standard log sheets. After logging, each core tray is photographed on a jig that ensures the same picture quality. Previously, if the hole was located inside the Measured, Indicated, and Inferred (MII) Whittle shell, the entire core was bagged and sampled. Elsewhere, the core was cut in half by diamond saw and the one metre sample was placed in a plastic sample bag and brought to the mine-site laboratory managed by Essakane S.A. In 2013, the selection procedure was changed and one hole in five was split for archiving purposes. Exceptionally well mineralized holes were also kept. In 2014, the core was cut in half by diamond saw and a 1.0 m sample in HQ-size core and a 1.5 m sample in NQ-size core was placed in a plastic sample bag and submitted to the mine-site laboratory managed by Essakane S.A.
A shipping form listing all the samples that are ready to be analyzed is filled out and sent to the laboratory with a copy kept at the Resource Development office.
Downhole surveying is carried out by one of Essakane S.A.s two VisionR instruments or by the drilling contractor’s Reflex EZ-Shot. Survey results are checked by Essakane S.A. technicians. Survey readings are taken at downhole depths of three metres below the casing or at 12 m (whichever is the shallowest), and every 25 m thereafter. Since 2013, downhole surveys have been carried out using the drilling contractor’s GYRO downhole survey tool that performs readings every five metres.
| IAMGOLD Corporation - Essakane Gold Mine Technical Report NI 43-101 – February 17, 2016 |
Page 10-4 |
Drill hole collar positions are initially determined by a handheld global positioning system (GPS) on local grid lines by the Essakane S.A. geotechnicians. After drilling, the collar position is picked up by the surveying department using a differential global positioning system (DGPS). Away from mine workings, the collar positions are preserved by plastic pipe with written hole identifiers.
REVERSE CIRCULATION DRILLING
For RC drilling, a track-mounted Cat-Max rig is used with an attached cyclone unit that collects all the coarse (>50 microns) material over five metre runs starting at the collar. A 7 kg sample split is collected at the cyclone’s underflow using 50/50 single-stage riffle dividers. A 100 g sub-sample is taken from the split by the geologist for logging purposes and the rest of the sample is tagged and bagged before being sent to a secure sorting area near the core shack facility.
A shipping form listing all the samples that are ready to be analyzed is filled out and sent to the laboratory with a copy kept at the Resource Development office.
Downhole surveying is carried out in a similar manner as with the DD holes, except via a portable winch installed on the drill. Downhole survey readings are taken at downhole depths of three metres below the casing or at 12 m (whichever is the shallowest) and every 50 m thereafter. Collar locations are picked up by the surveying department using a DGPS.
Figure 10-1 shows the drill hole plan as of December 31, 2015 for the EMZ deposit. Figure 10-2 shows a typical cross section of the drilling on the EMZ deposit. Figure 10-3 shows the drill hole plan as of December 31, 2015 for the Falagountou deposit. Figure 10-4 shows a typical cross section of the drilling on the Falagountou West deposit.
| IAMGOLD Corporation - Essakane Gold Mine Technical Report NI 43-101 – February 17, 2016 |
Page 10-5 |
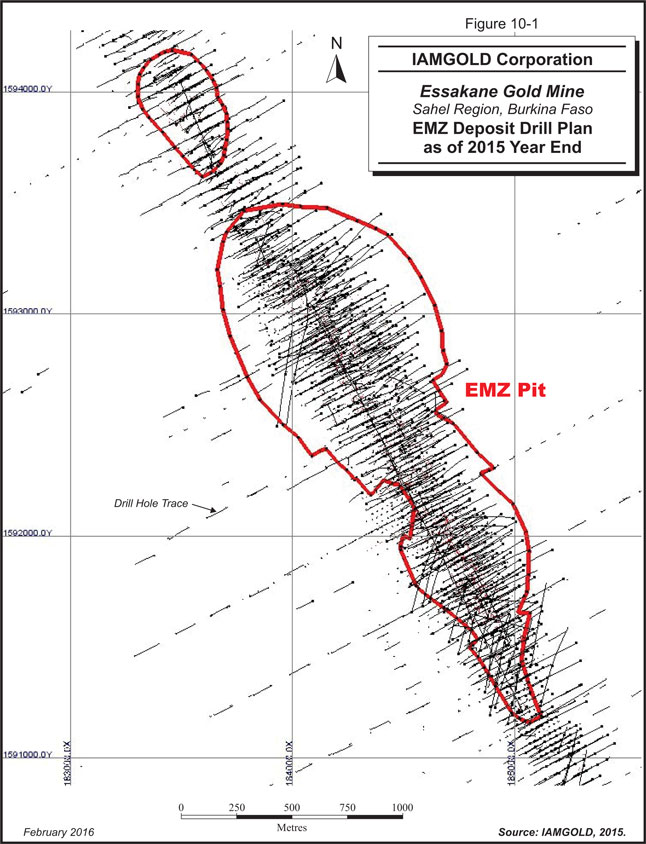
10-6
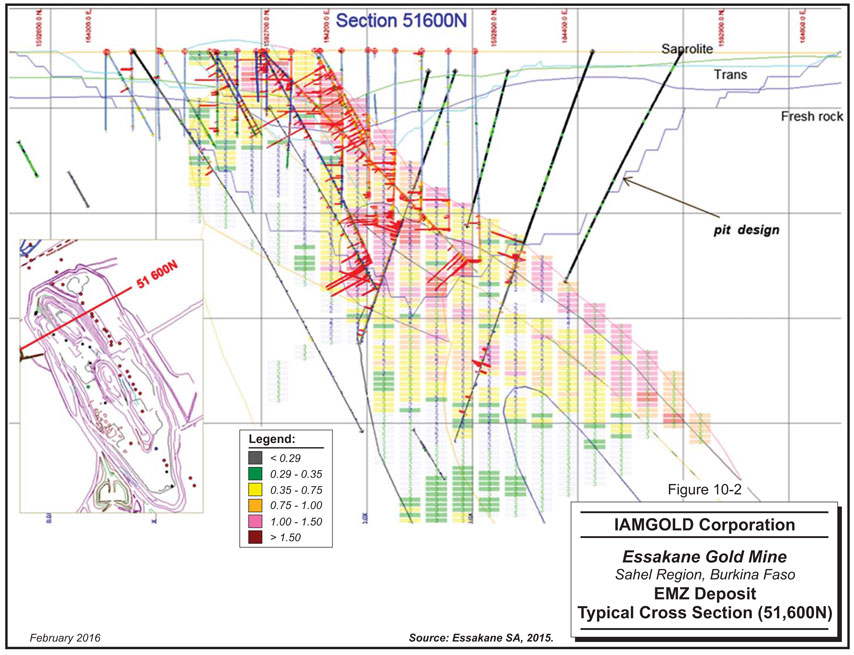
10-7
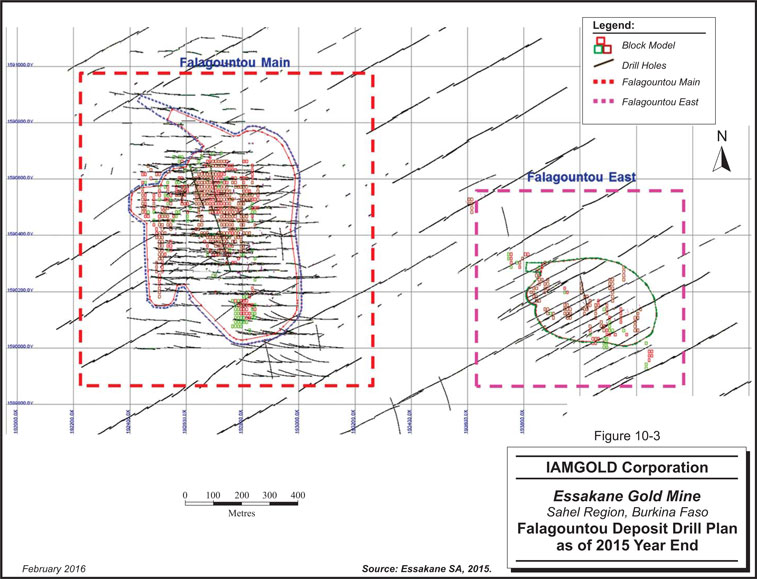
10-8
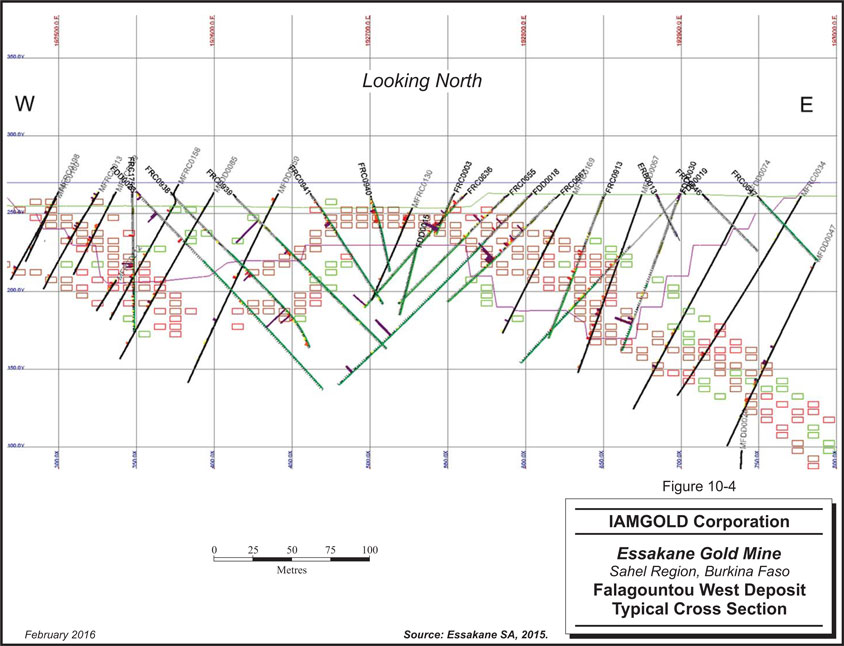
10-9
LOGGING
Data capture for both DD and RC hole information has been formalized by procedures that detail the steps that must be taken to create consistent logs. The name and purpose of each description field along with their allowable codes and abbreviations are listed in each procedure. Data is entered directly into a laptop utilizing Maxwell GeoServices Pty Ltd’s (Maxwell GeoServices) LogChief software and then transferred into the Central Database.
Data validation is completed by the geologist after the data entry stage and by the database geologist after the data has been transferred into Maxwell GeoServices’ DataShed (DataShed) SQL database which constitutes Essakane S.A.’s central data repository for all grade control and resource development drilling information.
The log is transferred into the GEMS modelling database only after it has been duly validated in DataShed and all the assays have been received and checked.
| IAMGOLD Corporation - Essakane Gold Mine Technical Report NI 43-101 – February 17, 2016 |
Page 10-10 |
11 SAMPLE PREPARATION, ANALYSES AND SECURITY
SAMPLE PREPARATION AND ANALYSIS
The sample preparation protocol currently used by Essakane S.A. was developed by GF BVI in conjunction with Snowden Engineering Inc. (Snowden) in 2006 (Gignac, 2008). The aim of the protocol is to reduce the Grouping and Segregation Error (GSE) and Fundamental Sampling Error (FSE) in a coarse gold environment.
Orezone Resources used cyanide-saturated 2 kg bulk leach extractable gold (BLEG) analysis to improve assay reproducibility. A poor reproducibility was demonstrated with the fire assay method. In addition, fire assay of the BLEG residues showed an average leach of 97%. It was subsequently determined that rolling for an additional 24 hours with fresh cyanide resulted in higher BLEG solution grades. BLEG analyses were conducted by the following laboratories: SGS Tarkwa Ghana, SGS Essakane, and TransWorld Ghana (now Intertek Minerals Limited, Tarkwa Minerals Laboratory Branch). SGS’s laboratories are accredited, however, IAMGOLD does not have any information regarding the accreditation status of TransWorld Ghana laboratory.
In January 2006, GF BV replaced Orezone Resources’ 2 kg BLEG bottle roll process with LeachWELL rapid cyanide leach on 1 kg sub-samples (the LWL69M method).
Since the acquisition of Essakane S.A. by IAMGOLD in 2009, all assays have been carried out at the mine site laboratory using the LeachWELL method on 1 kg samples followed with fire assay of the tails when the grade is higher than 5 g/t Au.
Most of the drill holes are sampled at one metre intervals. Core is sawed in two and one half sent for assaying when the hole is either outside the MII pit shell or selected by the geologist. Otherwise the entire length is crushed and pulverized. The entire sample is crushed to 95% passing 2 mm in a Terminator or Boyd crusher. It is then split in 12 parts in a rotary splitter and a 1.2 kg sub-sample is pulverized to 95% passing 105 microns with LM-5 or with LM-2 mills. A 1,000 g sub-sample is assayed by LeachWELL rapid cyanide leach over 12 hours
| IAMGOLD Corporation - Essakane Gold Mine Technical Report NI 43-101 – February 17, 2016 |
Page 11-1 |
with an atomic absorption (AA) finish. Initially, 10% of assays that returned over 0.3 ppm had their solid residues re-assayed using fire assay. This percentage has been raised to 20% in 2014. It is noted that all Keegor mills have been replaced with LM-5 mills, however, they are still available during rush periods.
All crushing and pulverizing rejects are returned to and stored at the Resource Development facility where 20% are later selected for check assaying at a commercial laboratory in Ouagadougou using the same protocol. Check samples are selected on the basis of the presence of arsenopyrite mineralization regardless of the original grade. It was found that choosing the check samples based on the mine laboratory assay results alone resulted in a selection bias (i.e., over a long term, check samples, on average, returned lower values than the mine laboratory’s results). The sampling protocols for DD samples are shown in Table 11-1.
TABLE 11-1 DD PREPARATION AND ASSAYING PROTOCOL
| Step | Description | |
| 1. Reception | • Dry (6h @ 105°C). • Weigh and note. | |
| 2. Crushing and pulverization | • Crush entire sample in jaw crusher down to 95% -2 mm. | |
| 3. Sieving | • Test particle size at a frequency of 5% when prompted by the LIMS. | |
| 4. Division | • Divide by RSD and combine enough pots for a 1 kg sub-sample. Pots must be opposite as much as possible. • Use the second set of alternating pots when a duplicate has been requested by the LIMS. • Time required to obtain final splits must not be less than two minutes. • Return rejects to the Resource Development storage facility. | |
| 5. Mill washing with quartz | • The LM2 and LM5 must be cleaned with blank quartz (or construction aggregate used by Camp Maintenance) after each pulverization. | |
| 6. LeachWELL 1,000g | Assay 1,000 g sample (note exact weight): • Leaching period NaCN: 12 hours AAS finish • Report weight of sample in grams and results in ppm | |
| 7. Fire Assay | • Fire assay all solid residues that returned > 0.3 ppm in original assay. | |
Since 2010, RC drilling has been carried out using 140 mm (5.5 in.) diameter holes with 5 m sample intervals down to a depth of 150 m or until the water table is intersected. The 7 kg
| IAMGOLD Corporation - Essakane Gold Mine Technical Report NI 43-101 – February 17, 2016 |
Page 11-2 |
field split is dried and pulverized to 95% passing 500 microns in Keegor mills. Occasionally, when the sample is comprised of coarse particles, crushing is performed through a Terminator or Boyd Crusher prior to the pulverization stage. The sample is split in a rotary divider until two sub-samples weighing 1 kg each are obtained. One sub-sample is pulverized to 95% passing 500 microns and 1,000 g sample is assayed by LeachWELL rapid cyanide leach. Similar to the DD samples, 10% solid residues are re-assayed using fire assay whenever the LeachWELL result exceeds 0.3 ppm Au.
Approximately 20% of the crushed RC pulps are sent to ALS CHEMEX and SGS in Ouagadougou, for check assaying.
In 2014, revisions were made to the preparation protocols in order to address concerns raised by the Agoratek sampling consultant. The main concerns addressed were the mass of RC samples and the pulverization size. On the initial protocol the RC sample mass submitted to pulverization was 1.2 kg. Also pulp duplicate are send to the external laboratory instead of coarse duplicate. The quantity of water and the rolling time have been revised as well.
The revisions included changing the pulverization size from P90 of 75 microns to P95 of 500 microns for RC samples (to avoid flattening of coarse gold) and matching preparation and assaying protocols of the primary (mine) laboratory and the check laboratory, particularly concerning the amount of water used in the LeachWELL leaching stage and the time the bottles were rolled.
Sampling protocols for RC samples are shown in Table 11-2.
TABLE 11-2 RC PREPARATION AND ASSAYING PROTOCOL
| Step | Description | |
| 1. Reception | • Dry (6h @ 105°C). • Weight and note. | |
| 2. Crushing (occasionally) and Pulverization |
• Pulverize entire 7 kg sample in Keegor mills to 95% passing 500 microns. | |
| 3. Sieve analysis | • Test particle size at a frequency of 5% when prompted by the LIMS. | |
| 4. Division | • Divide by RSD and combine enough pots for a 1 kg sub-sample. Pots must be opposite as much as | |
| IAMGOLD Corporation - Essakane Gold Mine Technical Report NI 43-101 – February 17, 2016 |
Page 11-3 |
| Step | Description | |
| possible. | ||
| • Use the second set of alternating pots when a duplicate has been requested by the LIMS. • Time required to obtain final splits must not be less than two minutes. • Return rejects to the Resource Development storage facility. | ||
| 5. Mill washing with quartz | • The LM2 and LM5 must be cleaned with blank quartz (or construction aggregate used by Camp Maintenance) after each pulverization. | |
| 6. LeachWELL 1,000g | Assay 1,000 g sample (note exact weight): • Leaching period NaCN: 12 hours AAS finish • Report weight of sample in grams and results in ppm | |
| 7. Fire Assay | • Fire assay all solid residues that returned > 0.3 ppm in original assay. | |
SAMPLE SECURITY
Following IAMGOLD acquisition of Orezone Resources and Essakane Gold Mine in 2009, all drill samples were collected under direct supervision of the Project staff from the drill rig and remained within the custody of the staff up to the moment the samples were delivered to the mine site laboratory.
Samples, including duplicates, were delivered from the drill rig to a secure storage area within the fenced Essakane core facility. Then blanks and certified reference materials were inserted. Chain of custody procedures consisted of filling out sample submittal forms that are sent to the laboratory with sample shipments to make certain that all samples were received by the laboratory. Sample security has relied upon the fact that the samples are always attended or locked in appropriate sample storage areas prior to dispatch to the sample preparation facility.
In the QP’s opinion, the sample preparation, analysis, and security procedures at the Essakane Gold Mine are adequate for use in the estimation of Mineral Resources.
| IAMGOLD Corporation - Essakane Gold Mine Technical Report NI 43-101 – February 17, 2016 |
Page 11-4 |
QUALITY ASSURANCE AND QUALITY CONTROL
Essakane S.A. is using a quality assurance/quality control (QA/QC) system which involves insertion of Certified Reference Materials (CRMs) supplied by Rocklabs Limited and locally sourced blanks.
The CRMs were selected based on the range of gold grades and type of material to be submitted to Laboratory (oxide or sulphide sample). A list of CRMs used in the assay program since 2010 is provided in Table 11-3. The underlined standards are those currently in use.
TABLE 11-3 LIST OF CERTIFIED REFERENCE MATERIALS
| OXIDE MATERIAL TYPE | SULPHIDE MATERIAL TYPE | |||||
| CRM | Estimated Value (Au g/t) |
CRM | Estimated Value (Au g/t) | |||
| OXA71 |
0.084 | SE44 | 0.606 | |||
| OXC109 |
0.201 | SE58 | 0.608 | |||
| OXC72 |
0.205 | SG56 | 1.027 | |||
| OXD108 |
0.414 | SH41 | 1.344 | |||
| OXD73 |
0.416 | SH69 | 1.346 | |||
| OXD87 |
0.417 | SH65 | 1.348 | |||
| OXE106 |
0.606 | SH55 | 1.375 | |||
| OXF105 |
0.800 | SI54 | 1.780 | |||
| OXF85 |
0.805 | SI64 | 1.780 | |||
| OXF65 |
0.805 | HISILK2 | 3.474 | |||
| OXH97 |
1.278 | SK62 | 4.075 | |||
| OXi96 |
1.802 | SK78 | 4.134 | |||
| OXi67 |
1.817 | SL77 | 5.181 | |||
| OXJ95 |
2.337 | SL51 | 5.909 | |||
| OXJ68 |
2.342 | SL61 | 5.931 | |||
| OXK79 |
3.532 | SN60 | 8.595 | |||
| SN50 | 8.685 | |||||
| SN74 | 8.891 | |||||
| HISILP1 | 12.050 | |||||
| SP59 | 18.120 | |||||
Standards (100 g weight) are inserted at a rate of one standard per 20 samples. Results for every batch of CRMs, reported by the assay laboratory, are assessed by IAMGOLD’s database manager prior to upload of any assay data into the SQL database. The average of the CRM results for each batch is reported to the laboratory manager in a qualitative way by
| IAMGOLD Corporation - Essakane Gold Mine Technical Report NI 43-101 – February 17, 2016 |
Page 11-5 |
e-mail (trends showing over or underestimation; evidence for poor instrumental drift corrections; differences occurring at operator shift changes, etc.). Records of these assessments are stored in the Essakane S.A. database.
Blanks consist of coarse granite sourced from the west of Burkina Faso (Table 11-4). They are inserted at a rate of one blank per 20 samples, mostly within the expected mineralized interval. Formerly, barren quartz was used as blank material. One kilogram bags of granite blank material are inserted into the sample stream and prepared in the same way as any other RC or DD sample.
TABLE 11-4 LIST OF LOCAL BLANKS
| Material Type | Blank | Estimated Value (Au g/t) | Origin | |||
| GRANITE |
GRT01 | 0.0005 | WEST/BURKINA |
The field duplicates insertion rate is 1 per 20 samples and 20% of pulps are selected for external laboratory checking.
The failure criteria are as follows:
| ● | The standard is considered to have failed when it is outside ±3 standard deviations. |
| ● | Blanks are considered to have failed when the assay grade is greater than ten times the detection limit (D.L =0.001 g/t Au). |
| ● | Duplicate precision has been recommended after the construction of a ranked Half Absolute Relative (HARD) graph (Figure 11-5). |
From the deviation (HARD) plot, it has been determined that a precision interval between +/- 20% to +/- 40% for 90% of the material varying from pulp to coarse reject (Long.1998) be targeted.
In the QP’s opinion, the QA/QC program as designed and implemented by Essakane S.A. is adequate and the assay results within the database are suitable for use in a Mineral Resource estimate.
Figures 11-1 through 11-5 illustrate the QA/QC graphs used by IAMGOLD team and the previous company.
| IAMGOLD Corporation - Essakane Gold Mine Technical Report NI 43-101 – February 17, 2016 |
Page 11-6 |
FIGURE 11-1 STANDARD OXJ95 PLOT
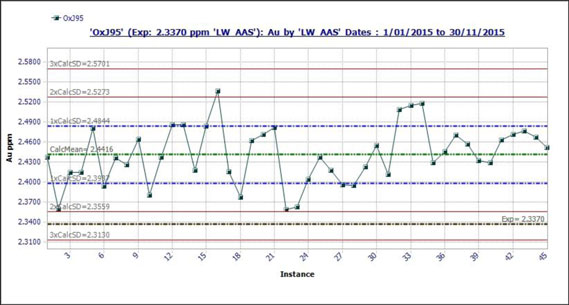
FIGURE 11-2 BLANK GRT01 PLOT
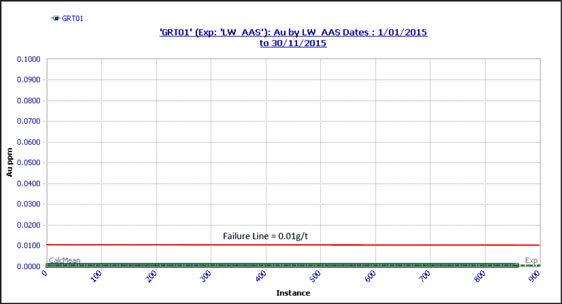
| IAMGOLD Corporation - Essakane Gold Mine Technical Report NI 43-101 – February 17, 2016 |
Page 11-7 |
FIGURE 11-3 FIELD DUPLICATE VS. ORIGINAL SCATTERPLOT
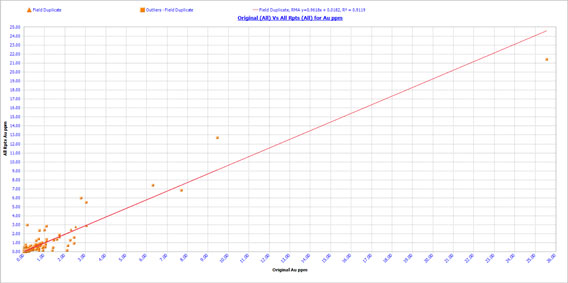
FIGURE 11-4 LOG-LOG DUPLICATE PLOT
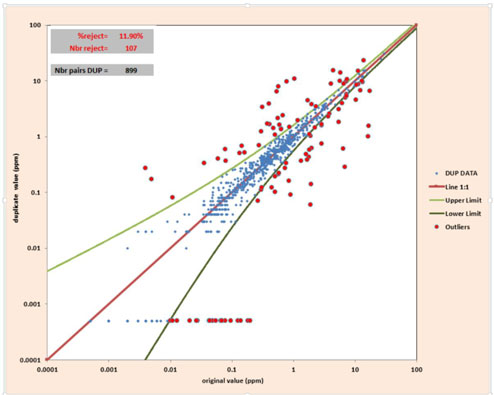
| IAMGOLD Corporation - Essakane Gold Mine Technical Report NI 43-101 – February 17, 2016 |
Page 11-8 |
FIGURE 11-5 HARD PLOT VS. RANK PERCENTILE
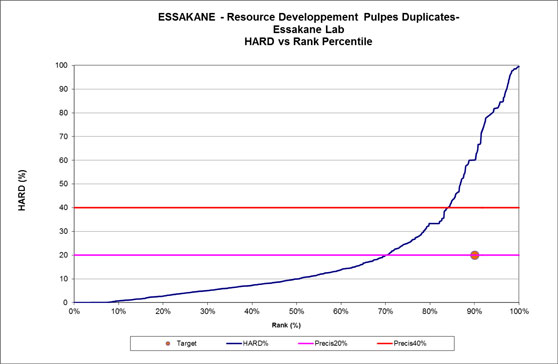
| IAMGOLD Corporation - Essakane Gold Mine Technical Report NI 43-101 – February 17, 2016 |
Page 11-9 |
12 DATA VERIFICATION
Different procedures have been put in place to collect information depending on the exploration method used. In general, field collection of data is entered on paper forms at the drill site and is then transcribed into Excel worksheets at the exploration office (one worksheet per hole).
Since 2013, field data has been entered directly into a laptop using Maxwell GeoServices’ LogChief geological database software and thereafter synchronized and transferred into the Central Database. This procedure is also followed for logging core and RC chips at the exploration office.
Data validation is carried out by the project or database geologist only after all data entry for the hole has been completed. Another set of data validation (such as invalid from and to, out of range, or invalid type values) is run on the data once it has been imported into DataShed. A separate set of validation steps is followed for the assay data after it is imported into DataShed. All paper copies of logs and assay certificates in PDF and Excel format are archived for future reference.
Prior to any resource estimation work, 20% of the content of the database is validated. Holes are randomly selected and the following fields are inspected for possible discrepancies: survey, assays, and lithology. Azimuth and dips are investigated for possible errors. The length fields of drill holes in the “Header” tab versus the final survey measurements are verified. A crosscheck of all samples of the selected drill holes is carried out between laboratory certificates and assay values in the GEOVIA GEMS database to make sure that all gold assay intervals match the laboratory certificates. Investigations are carried out on the lithological information as well.
The QP is of the opinion that the database verification procedures for Essakane S.A. comply with industry standards and are adequate for the purposes of Mineral Resource estimation.
| IAMGOLD Corporation - Essakane Gold Mine Technical Report NI 43-101 – February 17, 2016 |
Page 12-1 |
13 MINERAL PROCESSING AND
METALLURGICAL TESTING
Testwork programs have been carried out on Essakane’s major ore types by numerous international metallurgical laboratories since 1990. Testwork undertaken between 1990 and 2007 was reported in a DFS document by GRD Minproc (Pty) Ltd (2007). This was reviewed, summarized, and reported in the UFS document by GMSI (2009). Since then, testwork has been performed to refine the process design parameters for the 2014 plant expansion and to assess the amenability of Falagountou ore to the Essakane extraction method.
METALLURGICAL TESTWORK FROM 1990 TO 2007
It was determined, in the early stages of development of Essakane, that heap leaching would not be economically viable due to poor recoveries with fresh ore and uneconomic quantities of cement required for agglomeration of the clay-rich saprolite. Therefore, a conventional crushing, milling, gravity concentration, and carbon-in-leach (CIL) gold plant is required at Essakane.
Comminution test results on fresh ore dictated the design of the grinding circuit. Comminution parameters determined from the testwork and used for design purposes are summarized in Table 13-1.
| IAMGOLD Corporation - Essakane Gold Mine Technical Report NI 43-101 – February 17, 2016 |
Page 13-1 |
TABLE 13-1 COMMINUTION PARAMETER SUMMARY
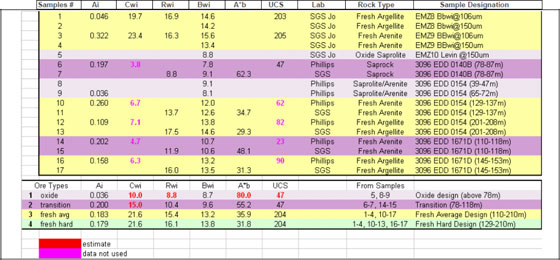
Extensive leaching tests were conducted on the various ore types. A common characteristic of Essakane ore is slow leaching kinetics if whole ore is subjected to cyanidation without removing the coarse gold particles in a gravity concentrate. While leaching is still on-going after 50 hours, if coarse gold is present in the ore feed, leach extraction reaches a plateau after less than 20 hours if gravity gold is removed prior to the leaching stage.
Gravity concentration testwork was included in the programs by SGS (Johannesburg) 2004 and 2005, Kappes Cassiday & Associates 2005 and 2006, and McClelland Laboratories 2006 and 2007. Gold recovered in the rougher concentrate varied from 40% to 90%, which is relatively high for gold deposits.
Gravity concentration was considered necessary for the Essakane plant, even though this would place an additional burden on security. This rationale was based on the following factors:
| ● | Due to the high nugget nature of coarse gold, gravity concentration would assist in reducing gold lock-up in the mills. |
| ● | Early removal of free gold particles would reduce the tendency for the particles to be flattened in the mill and to have impurities hammered into the gold surface with continued circulation via cyclone underflow. |
| ● | Coatings, which might inhibit cyanidation, can develop on gold particles undergoing prolonged recirculation in milling circuits. |
| IAMGOLD Corporation - Essakane Gold Mine Technical Report NI 43-101 – February 17, 2016 |
Page 13-2 |
| ● | Larger gold particles, if not removed before entering the CIL circuit, may not have sufficient residence time to dissolve completely, thereby reducing overall recovery. |
| ● | The lower head grade in the CIL feed would reduce final solution losses. |
| ● | The ability to intensively cyanide certain gold-bearing heavier minerals such as pyrite or arsenopyrite can potentially increase overall gold recovery. |
Optimization studies, focussed on grind size and recovery versus operating costs, concluded that the economical optimum grind size for hard rock was P80 minus 125 microns. The presence of activated carbon during leaching showed improved leaching kinetics and ultimately recoveries. This observation led to the use of a CIL circuit as opposed to a Leach-CIP circuit.
RECENT METALLURGICAL TESTWORK
As part of the plant expansion, additional metallurgical testwork and ore characterization was carried out at SGS Lakefield Research Ltd (SGS) during 2011. Comminution testwork was done on fresh PQ drill core samples. The samples were found to be harder than those used for the initial plant design. Several gravity tests were done on the ore and confirmed a predicted gravity gold recovery of 45%. Leach test were done on the gravity tails and the run of mine ore. The results showed that a combined (gravity and leach) recovery of 92% should be expected with a 36 hour leach time. The estimated consumptions are 0.4 kg/t for cyanide and 0.6 kg/t for lime after the planned leach time of 36 hours. Static settling tests included flocculent screening, feed percent solids optimization, and flocculent dosage optimization. A non-ionic flocculent was determined to be the best suited for this operation with a feed dilution between 10% to 15% and a flocculent dosage of 40 g/t. Rheology testwork was done on simulated underflow samples. All of the samples demonstrated Bingham plastic rheology behaviors. The samples at a higher pH gave similar or slightly higher shear stress values.
Metallurgical testing on drill core and samples from the Essakane CIL circuit was carried out by SGS in June 2015 to further characterize the Essakane deposit, with an emphasis on hard rock behavior. The metallurgical tests included gravity separation, CIL tests, preg-robbing validation tests, whole ore leach tests, intensive leach tests, and diagnostic leach
| IAMGOLD Corporation - Essakane Gold Mine Technical Report NI 43-101 – February 17, 2016 |
Page 13-3 |
tests, as well as investigating the effects of grind size and the effects of surfactants on preg-robbing. The test program concluded that:
| ● | The gravity component of the mill is essential to maximize gold recovery and optimize the operation of the downstream CIL circuit. An average gravity recovery of 60% was achieved at laboratory level. This is similar to the average value of 59% obtained in previous studies performed by SGS. |
| ● | The addition of carbon to the CIL circuit is needed to minimize the effects of preg-robbing carbonaceous material. |
| ● | Gold extraction increases with grind fineness, however, with the increased grind fineness, more carbonaceous preg robbing material is liberated and can prevent any observable increase in recovery. |
| ● | The use of surfactants or blinding agents at the supplier’s recommended dosage did not improve gold recovery. |
| ● | Diagnostic leaching of CIL tails showed that only 10% of gold in the tailings is free milling, with the remainder being locked up in dolomite and labile sulphides or associated with sulphides, graphite, and silicates. |
The June 2015 SGS study indicated a risk for significantly lower recovery related to the amount of graphitic ore present in future mining zones, according to the life of mine (LOM). Essakane S.A. has initiated studies on the following inititiatives to mitigate this issue:
| ● | Oxygen addition to CIL: will reduce the preg-robbing effects of the ore, with a potential to decrease cyanide consumption, increase recovery, and increase leaching kinetic. |
| ● | Intensive Leach Process to treat gravity concentrate: will increase gold recovery from current shaking table. |
| ● | Transforming the current leach tanks in CIL tanks: will decrease the preg-robbing effect that occurs in the leach tank prior to contact with carbon. |
| ● | Optimization of the carbon profile in the CIL: will lead to better management of the gold inventory in the CIL and prevent preg-robbing. |
A geometallurgy survey, which is currently ongoing, will help determine where the graphitic ore originates and serve as a basis for better ore mixing prior to the plant feed.
Metallurgical testing on representative samples from the Falagountou deposit was completed in May 2014 by SGS. The metallurgical tests included assaying, mineralogy, gravity separation, and CIL testwork. The test program concluded that:
| IAMGOLD Corporation - Essakane Gold Mine Technical Report NI 43-101 – February 17, 2016 |
Page 13-4 |
| ● | Graphite content was low in all samples, as most carbon was associated with carbonate material. |
| ● | Sulphur grade was low in the saprolite and transition samples, and slightly higher in the hard rock samples. |
| ● | The hard rock samples were categorized as soft based on the Bond ball mill work index (BWI), and had excellent recoveries when treated in a gravity separation CIL circuit. |
GOLD RECOVERIES
The average recoveries used per rock type from the Falagountou and Essakane pits are summarized in Table 13-2, and are based on SGS testwork, as described previously.
TABLE 13-2 RECOVERIES PER ROCK TYPE
| Essakane Pit | Falagountou Pit | |||
| Rock Type | Recovery (%) | Recovery (%) | ||
| Saprolite |
95.0 | 95.5 | ||
| Transition |
92.8 | 93.5 | ||
| Hard Rock |
91.9 | 92.0 |
| IAMGOLD Corporation - Essakane Gold Mine Technical Report NI 43-101 – February 17, 2016 |
Page 13-5 |
14 MINERAL RESOURCE ESTIMATE
SUMMARY
Following the request of Essakane S.A., GMSI has prepared a Mineral Resource estimate for the Essakane Gold Mine (EMZ and Falagountou deposits). The mandate given to GMSI consisted of verifying the database content, updating previous wireframes with the latest information available, updating the EMZ and Falagountou deposit block models, validating the block models, and reporting the resource estimates according to NI 43-101 guidelines.
The resource estimation methodologies, results, and validations are presented in this section.
The Mineral Resource estimate was prepared in accordance with CIM Definition Standards for Mineral Resources and Mineral Reserves adopted May 10, 2014 (CIM definitions) and is reported in accordance with the NI 43-101 guidelines. Classification, or assigning a level of confidence to Mineral Resources, has been undertaken with strict adherence to CIM definitions. In the opinion of GMSI, the resource evaluation reported herein is a reasonable representation of the Mineral Resources delineated at the Essakane Gold Mine as of December 31, 2015.
The Mineral Resource estimate at December 31, 2015 for the Essakane Gold Mine is summarized in Table 14-1 and is reported on a 100% basis. The Mineral Resource estimate is inclusive of Mineral Reserves.
| IAMGOLD Corporation - Essakane Gold Mine Technical Report NI 43-101 – February 17, 2016 |
Page 14-1 |
TABLE 14-1 SUMMARY OF MINERAL RESOURCES – DECEMBER 31, 2015
| Category | Tonnage (000 t) |
Grade (g/t Au) |
Contained Metal (000 oz Au) | |||
| Measured |
- | - | - | |||
| Indicated |
137,753 | 1.13 | 5,024 | |||
| Total Measured + Indicated |
137,753 | 1.13 | 5,024 | |||
| Inferred |
18,548 | 1.07 | 637 |
Notes:
| 1. | CIM definitions were followed for Mineral Resources. |
| 2. | Mineral Resources are estimated at a cut-off grade which varies between 0.35 and 0.48 g/t Au depending on material type and pit. |
| 3. | Mineral Resources are estimated using an average long-term gold price of US$1,500 per ounce. |
| 4. | A minimum mining width of 10 m was used for Falagountou and 20 m for EMZ. |
| 5. | Bulk density is variable by rock type. |
| 6. | Mineral Resources are inclusive of Mineral Reserves. |
| 7. | Mineral Resources that are not Mineral Reserves do not have demonstrated economic viability. |
| 8. | Numbers may not add due to rounding. |
GMSI is not aware of any known environmental, permitting, legal, title, taxation, socio-economic, marketing, political, or other relevant factors that could materially affect the Mineral Resource estimate.
EMZ DEPOSIT
DATA
On September 26, 2015, Essakane S.A. provided GMSI with a GEOVIA GEMS Access project of the EMZ deposit. The resource database included in the GEMS project contained 3,582 holes of different types. The resource estimation used the results of three types of holes: 1) DD, 2) RC and, 3) holes starting in RC and ending in DD (RCD), for a total of 2,883 holes and 483,727 m drilled.
Table 14-2 details the series of holes by type and year of drilling. Note that because Air Core (AC) and Reverse Air Blast (RAB) sampling is more subject to segregation bias, their assay results have not been used in the estimate.
| IAMGOLD Corporation - Essakane Gold Mine Technical Report NI 43-101 – February 17, 2016 |
Page 14-2 |
TABLE 14-2 CONTENT OF THE RESOURCE DATABASE
| Hole Type | Year | Series | No. of Holes | Metres Drilled | ||||
| DDH | 2015 | MEDD0464 -MEDD0475 | 12 | 3,757 | ||||
| 2014 | MEDD0403 - MEDD463 | 61 | 19,096 | |||||
| 2013 | MEDD0327 - MEDD0402 | 76 | 23,010 | |||||
| 2012 | MEDD0235 - MEDD0326 | 92 | 44,055 | |||||
| EDD0376 - EDD0379 | 4 | 900 | ||||||
| HSDD0001 - HSD0010 | 10 | 1,547 | ||||||
| 2011 | MEDD0105 - MEDD0234 | 130 | 52,372 | |||||
| EDD0345 - EDD0375 | 31 | 5,521 | ||||||
| 2010 | MEDD0001 - MEDD0104 | 102 | 26,251 | |||||
| EDD0029 - EDD00344 | 40 | 11,819 | ||||||
| 2009 | EDD0248 - EDD00304 | 57 | 10,978 | |||||
| Before 2009 | EDD0001 - EDD00247 | 220 | 37,867 | |||||
| RC | 2015 | MERC0307 - MERC0346 | 24 | 4,276 | ||||
| 2014 | MERC0274 - MERC0306 | 31 | 4,123 | |||||
| 2013 | MERC0146 - MERC0273 | 128 | 18,199 | |||||
| 2012 | MERC0101 - MERC0145 | 35 | 4,492 | |||||
| ERC2003 - ERC2078 | 75 | 10,006 | ||||||
| 2011 | ERC1904 - ERC2002 | 89 | 10,536 | |||||
| 2010 | MERC0001 - MERC0099 | 96 | 12,437 | |||||
| ERC1824 - ERC1918 | 89 | 13,041 | ||||||
| 2009 | ERC1786 - ERC1823 | 38 | 4,388 | |||||
| Before 2009 | ERC0001 - ERC2005 | 1,100 | 101,944 | |||||
| RCD | 2015 | MERC0324D - MERC0342D | 16 | 3,756 | ||||
| 2014 | MERC0297D | 1 | 401 | |||||
| 2010 | MERC0048D - MERC0050D | 3 | 1,032 | |||||
| Before 2009 | ERC0120D - ERC1692D | 323 | 57,922 | |||||
| Total | 2,883 | 483,727 |
The current resource estimate includes a series of new holes which are listed in Table 14-3 and shown in Figure 14-1 (on the right side). A total of 60 holes (DD, RC and RCD) for 13,938 m drilled at the end of 2014 and in 2015 were added to the EMZ resource database. These new holes were not available at the time of the preparation of the previous resource estimate reported in December 2014. Figure 14-1 shows the location of all the drill holes available in the database for the current resource estimate (on the left side).
| IAMGOLD Corporation - Essakane Gold Mine Technical Report NI 43-101 – February 17, 2016 |
Page 14-3 |
FIGURE 14-1 PLAN VIEWS SHOWING THE LOCATION OF ALL DRILL HOLE
COLLARS (LEFT) AND THE NEW DRILL HOLES (RIGHT)
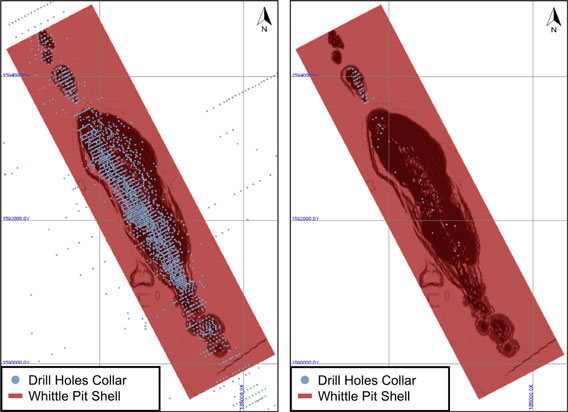
| IAMGOLD Corporation - Essakane Gold Mine Technical Report NI 43-101 – February 17, 2016 |
Page 14-4 |
TABLE 14-3 NEW DRILL HOLE DATA
| Hole Type | Year | Series | Number of Holes | Metres Drilled | |||||||||||||
| DDH |
2015 | MEDD0464-MEDD475 | 12 | 3,757 | |||||||||||||
| 2014 | MEDD0443-MEDD463 | 22 | 5,565 | ||||||||||||||
| RC |
2015 | MERC0307-MER0346 | 24 | 4,276 | |||||||||||||
| 2014 | MERC0305-MER0306 | 2 | 340 | ||||||||||||||
| RCD |
2015 | MERC0324D-MERC0342D | 16 | 3,756 | |||||||||||||
| Total |
60 | 13,938 | |||||||||||||||
ASSAYS
The September 2015 assay database, used in the current resource update, consists of 386,368 records including 336,503 assay results above gold limit detection with an average sample length of 1.13 m, representing 372,470 assayed metres. Some 76% of the sampled intervals are 1 m long while 23% are 1.5 m in length. The remaining 1% of the sampled intervals range from 0.2 m to 7.5 m.
Gold grades vary from 0.0 g/t Au to 430.0 g/t Au with an average of 0.45 g/t Au.
Note that in the EMZ deposit, a total of 187 holes are not assayed and this includes abandoned holes, holes invalidated by the qualified person due to failed QA/QC protocols, unsampled holes when the property changed hands, and holes excluded for other reasons. Even though the assay results from these holes have not been retained for estimation purposes, some valuable information such as lithological, structural, or density data was used for modelling.
DRILL HOLE SPACING
The drill hole spacing is variable depending on which area of the project drilling is carried out. Three areas of resource development were defined within the EMZ deposit (Figure 14-2):
| 1. | North Satellite |
| 2. | EMZ |
| 3. | EMZ South |
| IAMGOLD Corporation - Essakane Gold Mine Technical Report NI 43-101 – February 17, 2016 |
Page 14-5 |
FIGURE 14-2 PLAN VIEW SHOWING THE THREE AREA LIMITS
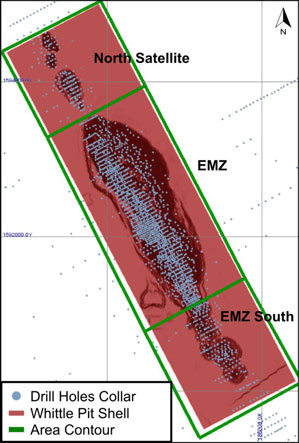
| IAMGOLD Corporation - Essakane Gold Mine Technical Report NI 43-101 – February 17, 2016 |
Page 14-6 |
In the North Satellite area, the drill spacing is generally 50 m by 50 m and locally 25 m. The EMZ area is more densely drilled with a 25 m by 25 m spacing on the western limb of the fold and a wider spacing of 50 m by 50 m on the eastern limb. The EMZ South area is currently drilled on a 50 m by 50 m grid spacing.
The current drill spacing in the EMZ deposit is judged adequate to develop a reasonable model of the mineralization distribution and to quantify its volume and quality with a good level of confidence in all three areas of the project.
MODELLING
The modelling work was performed by Essakane S.A. personnel. GMSI verified the wireframes and updated them as required with the latest information available as of September 26, 2015. The modelling was carried out using GEOVIA GEMS 6.7.
Table 14-4 lists the surfaces and solids that were available or created for the use of the current resource estimate. The source and/or procedure of creation of the Weathering, Litho-Structural, and Topography elements are treated in detail in the following sub-sections.
| IAMGOLD Corporation - Essakane Gold Mine Technical Report NI 43-101 – February 17, 2016 |
Page 14-7 |
TABLE 14-4 SURFACES AND SOLIDS USED FOR THE MINERAL RESOURCE ESTIMATE
| Count | Domain Code | Description | Fold Detail | Area | Order of Precedence | Triangulation name | ||||||
| 1 |
- | Topography | - | - | - | Topo Orig 2009 | ||||||
| 2 |
101 | Saprolite Lower Limit | - | - | - | SapSolid/101/RES16Offic | ||||||
| 3 |
102 | Transition Lower Limit | - | - | - | TransSolid/102/RES16Offic | ||||||
| 4 |
103 | Fresh Rock | - | - | - | RockSolid/102/RES16Offic | ||||||
| 5 |
220 | Arenite | West Flank | EMZ -North Satellite | 3 | 220/RES16Offic | ||||||
| 6 |
240 | Arenite | East Flank | EMZ -North Satellite | 4 | 240/RES16Offic | ||||||
| 7 |
310 | Argillite | West Flank | EMZ -North Satellite | 5 | 310/RES16Offic | ||||||
| 8 |
340 | Argillite | East Flank | EMZ -North Satellite | 6 | 340/RES16Offic | ||||||
| 9 |
410 | Arenite | West Flank | EMZ -North Satellite | 7 | 410/RES16Offic | ||||||
| 10 |
440 | Arenite | East Flank | EMZ -North Satellite | 8 | 440/RES16Offic | ||||||
| 11 |
510 | Argillite | West Flank | EMZ | 9 | 510/RES16Offic | ||||||
| 12 |
540 | Argillite | East Flank | EMZ | 10 | 540/RES16Offic | ||||||
| 13 |
620 | Argillite | West Flank | EMZ -North Satellite | 11 | 620/RES16Offic | ||||||
| 14 |
640 | Argillite | East Flank | EMZ -North Satellite | 12 | 640/RES16Offic | ||||||
| 15 |
710 | Argillite | West Flank | North Satellite | 17 | 710/RES16Offic | ||||||
| 16 |
720 | Argillite | Fold Hinge | North Satellite | 15 | 720/RES16Offic | ||||||
| 17 |
730 | Argillite | East Flank | North Satellite | 16 | 730/RES16Offic | ||||||
| 18 |
731 | Argillite | East Flank | North Satellite | 16 | 731/RES16Offic | ||||||
| 19 |
810 | Dolerite | - | EMZ | 1 | 810/RES16Offic | ||||||
| 20 |
820 | Intermediate Intrusive | - | EMZ | 2 | 820/RES16Offic | ||||||
| 21 |
910 | Arenite | - | North Satellite | 13 | 910/RES16Offic | ||||||
| 22 |
920 | Arenite | - | North Satellite | 14 | 920/RES16Offic | ||||||
| 23 |
8111 | Ore Envelope | - | EMZ South | 30 | 8111/RES16Offic/EMZ South | ||||||
| 24 |
8222 | Ore Envelope | - | EMZ South | 31 | 8222/RES16Offic/EMZ South | ||||||
| 25 |
8333 | Ore Envelope | - | EMZ South | 32 | 8333/RES16Offic/EMZ South |
| IAMGOLD Corporation - Essakane Gold Mine Technical Report NI 43-101 – February 17, 2016 |
Page 14-8 |
WEATHERING PROFILE MODELLING
Two surfaces of weathering were used in this resource estimate, the saprolite and the transition surfaces. They represent the bottom limit of the corresponding weathering zone.
The surfaces previously used for the December 31, 2014 resource estimate were updated with the new hole information based firstly on the density measurements, where available, and by placing the limits midway between density values showing a change in the weathering zone. Where no density measurements were available or where interpretations were conflicting, the hardness information from the drill log, defined by the Brown Index, was used for weathering modelling. The hardness codes are categorized into Saprolite (S1, S2, S3, and S4), Transition (S5, S6, R0 and R1), and Fresh Rock (R2, R3, R4, R5 and R6) as presented in Table 14-5. An example of the modelled surfaces is shown in Figure 14-3.
The portions of the surfaces that had no new hole information remained unchanged. Previously, only the weathering information from the drill log was used for the modelling of the profiles. Again, where conflicting interpretations between campaigns occurred, the Brown Index definition was used for the weathering limits.
| IAMGOLD Corporation - Essakane Gold Mine Technical Report NI 43-101 – February 17, 2016 |
Page 14-9 |
TABLE 14-5 BROWN INDEX OF SOIL AND ROCK STRENGTH
| Essakane S.A. | Grade | Description | Identification | Approximate Range of UCS (MPa) | ||||
| Saprolite Upper Saprolite (WSU) |
S1 | Very Soft | Easily penetrated several inches by fist. | < 0.025 | ||||
| S2 | Soft | Easily penetrated several inches by thumb. | 0.025 – 0.05 | |||||
| S3 | Firm | Can be penetrated several inches by thumb with moderate effort. | 0.05 – 0.10 | |||||
| S4 | Stiff | Readily indented by thumb but penetrated only with great effort. | 0.10 – 0.25 | |||||
| Transition Lower Saprolite (WSL) Saprock (WSR1), (WSR2) | S5 | Very Stiff | Readily indented by thumb nail. | 0.25 – 0.50 | ||||
| S6 | Hard | Indented with difficulty by thumb nail. | > 0.50 | |||||
| R0 | Extremely weak rock |
Indented by thumb nail. | 0.50 – 1.0 | |||||
| R1 | Very weak rock |
Crumbles under firm blow with point of geological hammer. | 1.0 – 5.0 | |||||
| Rock Saprock |
R2 | Weak rock | Can be peeled by a pocket knife. | 5.0 – 25 | ||||
| R3 | Medium strong rock |
Can be peeled by a pocket knife with difficulty; shallow indentations made by firm blow with point of geological hammer. | 25 – 50 | |||||
| R4 | Strong rock | Cannot be scraped or peeled with a pocket knife, specimen can be fractured with a single firm blow of geological hammer. | 50 – 100 | |||||
| R5 | Very strong rock |
Specimen requires more than one blow of geological hammer to fracture it. | 100 – 250 | |||||
| R6 | Extremely strong rock |
Specimen requires many blows of geological hammer to fracture it. Specimen can only be chipped with geological hammer. | > 250 |
Note:
| 1. | UCS: Uniaxial Compressive Strength |
| IAMGOLD Corporation - Essakane Gold Mine Technical Report NI 43-101 – February 17, 2016 |
Page 14-10 |
FIGURE 14-3 SECTION 52,275N – EMZ WEATHERING SURFACES
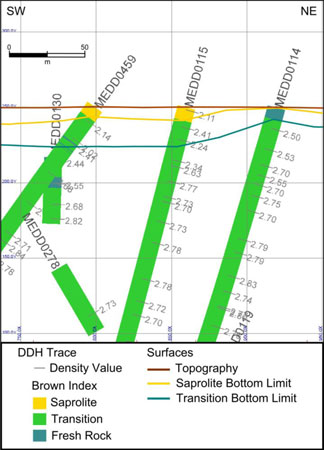
LITHO-STRUCTURAL MODELLING
The geological wireframes modelled for the EMZ deposit included the structural and lithological elements available in the database.
The structural model of the EMZ deposit includes thrust faults, with their associated displacements, and the recumbent nature of the fold. The lithological model comprised units of arenite and argillite. Each unit was digitized as an individual layer juxtaposed one above the other. The units were divided into two parts, relating to the anticlinal fold axis, and identified as West or East flank units. These units, as illustrated on Figures 14-4 and 14-5, determined the main litho-structural domains.
Additionally, a series of mafic and intermediate intrusives (dykes) were also modelled, some of the intrusives cross cut the lithologies and/or the anticlinal fold, while others are sub
| IAMGOLD Corporation - Essakane Gold Mine Technical Report NI 43-101 – February 17, 2016 |
Page 14-11 |
parallel to the strike of the fold. The dykes are not necessarily mineralized; however, they are not totally exempt of mineralization. Some mineralization was observed at the contact of the dykes.
FIGURE 14-4 ISOMETRIC VIEW – EMZ LITHOLOGICAL MODEL
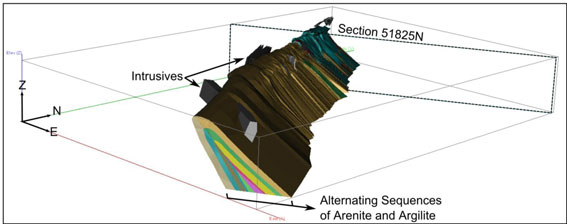
FIGURE 14-5 SECTION 51,825N – EMZ LITHOLOGICAL MODEL
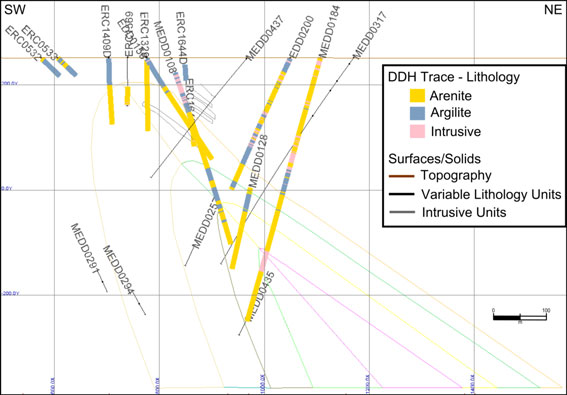
| IAMGOLD Corporation - Essakane Gold Mine Technical Report NI 43-101 – February 17, 2016 |
Page 14-12 |
Following the EMZ deposit litho-structural model, the North Satellite area was modelled as the continuation of the northern extension of the EMZ deposit, an anticlinal folded sedimentary sequence gently plunging to the north. GMSI created additional domains (710, 720, and 730) to include mineralization outlined by recent drill holes results. These domains were modelled in a slightly different manner than the domains from the EMZ deposit; instead of beds being divided into two flanks, the argillite bed that was added to the model was separated into three parts, the West flank, the East flank, and the fold hinge. The superior portion of the fold seemed to enclose a cluster of mineralized intervals separated from the flanks by a fault. The three domains were treated as hard boundaries as they act as the superior mineralization shell limit. Figures 14-6 and 14-7 illustrate the lithological model constructed in the North Satellite zone.
During a site visit in November 2015, it was brought to GMSI’s attention that field work observations outlined that the fold axis was vertical in the North Satellite area. The litho-structural model will be updated for the next resource estimate in order to reflect these new observations.
FIGURE 14-6 ISOMETRIC VIEW – EMZ AND NORTH SATELLITE LITHO-
STRUCTURAL MODEL
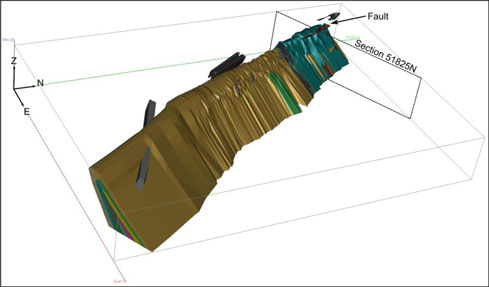
| IAMGOLD Corporation - Essakane Gold Mine Technical Report NI 43-101 – February 17, 2016 |
Page 14-13 |
FIGURE 14-7 SECTION 52,675N – NORTH SATELLITE ZONE LITHO-STRUCTURAL MODEL
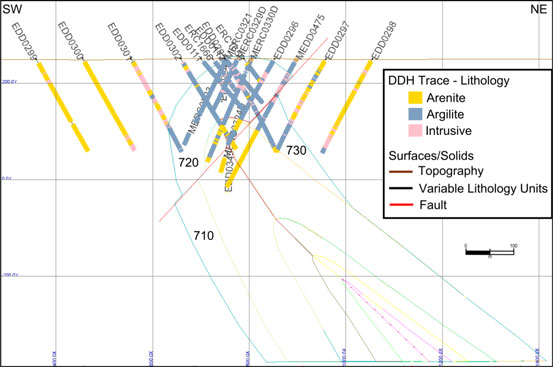
For the southern extension of the EMZ deposit, three sub-parallel envelopes, grouping mineralized intercepts in the area, were constructed by Essakane personnel. The domains in EMZ South follow the orientation and dip of the axial plan of the EMZ fold and are illustrated in Figures 14-8 and 14-9.
| IAMGOLD Corporation - Essakane Gold Mine Technical Report NI 43-101 – February 17, 2016 |
Page 14-14 |
FIGURE 14-8 ISOMETRIC VIEW –EMZ SOUTH MINERALIZATION ENVELOPES
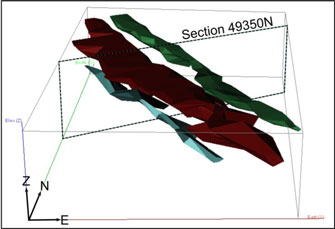
FIGURE 14-9 SECTION 49,350N – EMZ SOUTH MINERALIZATION ENVELOPES
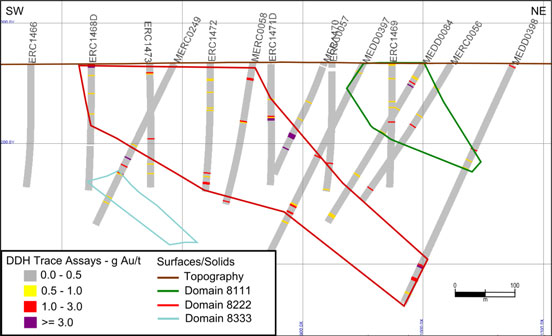
| IAMGOLD Corporation - Essakane Gold Mine Technical Report NI 43-101 – February 17, 2016 |
Page 14-15 |
SURFACE TOPOGRAPHY
A topographic surface was provided to GMSI for the resource estimation for the Essakane Gold Mine. The surface (pre-mining) named “Topo_2009” was used to code all blocks above it as “Air” in the block model.
STATISTICAL ANALYSIS
STATISTICS OF THE UNCAPPED ASSAYS
GMSI based its statistical analysis on Essakane S.A.’s study carried out for the previous model. The statistical analysis carried out by Essakane S.A. using Statistica software, was verified by GMSI using GSLIB geostatistical software. The analysis was done by domain.
The lithological and weathering codes were extracted from drill hole and solid intersections and later combined in the assay database to build the domain codes as illustrated in Figure 14-10.
FIGURE 14-10 SECTION 51,000N – EXAMPLE OF DOMAIN CODING
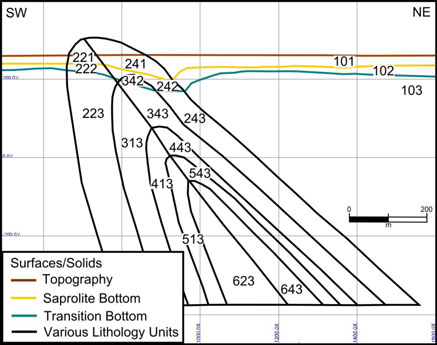
Table 14-6 presents the statistics of the uncapped gold assays of each individual domain and the chosen capping value.
| IAMGOLD Corporation - Essakane Gold Mine Technical Report NI 43-101 – February 17, 2016 |
Page 14-16 |
TABLE 14-6 STATISTICS OF THE ASSAYS GROUPED BY DOMAIN
| Domain Code |
Number | Statistics of Uncapped Assays | Capping Level (g/t Au) |
Number Capped | ||||||||||
| Mean | Max | STD(1) | CoV(2) | |||||||||||
| (g/t Au) | (g/t Au) | |||||||||||||
| 221 |
4,086 | 0.47 | 42.30 | 3.44 | 1.61 | 15.0 | 11 | |||||||
| 222 |
3,921 | 0.44 | 47.33 | 1.82 | 4.13 | 15.0 | 9 | |||||||
| 223 |
25,573 | 0.20 | 119.80 | 1.68 | 8.26 | 25.0 | 11 | |||||||
| 241 |
23,100 | 1.13 | 341.27 | 5.52 | 4.88 | 30.0 | 81 | |||||||
| 242 |
14,387 | 1.10 | 336.16 | 5.25 | 4.78 | 30.0 | 42 | |||||||
| 243 |
39,398 | 1.02 | 430.00 | 5.60 | 5.52 | 45.0 | 82 | |||||||
| 311 |
506 | 0.13 | 8.44 | 0.49 | 3.62 | 0.6 | 18 | |||||||
| 312 |
634 | 0.10 | 4.53 | 0.28 | 2.95 | - | 0 | |||||||
| 313 |
20,707 | 0.46 | 109.00 | 2.98 | 6.55 | 30.0 | 43 | |||||||
| 341 |
1,768 | 0.28 | 51.90 | 1.76 | 6.35 | 3.0 | 24 | |||||||
| 342 |
2,585 | 0.27 | 63.21 | 1.57 | 5.74 | 3.0 | 30 | |||||||
| 343 |
34,697 | 0.58 | 188.00 | 3.30 | 5.65 | 45.0 | 40 | |||||||
| 413 |
8,865 | 0.39 | 91.90 | 2.46 | 6.37 | 30.0 | 10 | |||||||
| 443 |
9,442 | 0.83 | 220.00 | 5.49 | 6.58 | 30.0 | 42 | |||||||
| 513 |
2,252 | 0.94 | 100.00 | 5.15 | 5.49 | 20.0 | 26 | |||||||
| 543 |
1,726 | 0.52 | 100.00 | 3.95 | 7.62 | 30.0 | 4 | |||||||
| 623 |
2,809 | 0.37 | 100.00 | 3.20 | 8.58 | 30.0 | 4 | |||||||
| 643 |
1,432 | 0.28 | 40.71 | 1.28 | 4.62 | 10.0 | 1 | |||||||
| 712 |
16 | 0.37 | 0.97 | 0.33 | 0.90 | - | 0 | |||||||
| 713 |
1,819 | 0.25 | 29.44 | 1.51 | 6.05 | 5.0 | 17 | |||||||
| 721 |
238 | 0.37 | 9.85 | 0.94 | 2.55 | 2.0 | 6 | |||||||
| 722 |
1,868 | 0.39 | 17.86 | 1.01 | 2.57 | 5.0 | 16 | |||||||
| 723 |
12,401 | 0.36 | 96.98 | 2.01 | 5.59 | 20.0 | 17 | |||||||
| 731 |
30 | 0.20 | 3.99 | 0.76 | 3.80 | - | 0 | |||||||
| 732 |
513 | 0.10 | 7.34 | 0.60 | 6.15 | 1.0 | 8 | |||||||
| 733 |
4,931 | 0.07 | 21.30 | 0.49 | 7.35 | 5.0 | 9 | |||||||
| 811 |
233 | 0.24 | 10.20 | 0.91 | 3.81 | 2.0 | 7 | |||||||
| 812 |
259 | 0.18 | 16.74 | 1.09 | 6.22 | 2.0 | 4 | |||||||
| 813 |
535 | 0.13 | 18.82 | 1.07 | 8.13 | 1.0 | 7 | |||||||
| 821 |
233 | 1.42 | 86.97 | 6.68 | 4.72 | 6.0 | 6 | |||||||
| 822 |
298 | 0.82 | 25.67 | 2.20 | 2.68 | 3.0 | 17 | |||||||
| 823 |
1,964 | 0.73 | 387.00 | 9.62 | 13.11 | 20.0 | 7 | |||||||
| 911 |
4 | 2.25 | 7.03 | 2.87 | 1.28 | - | - | |||||||
| 912 |
87 | 1.75 | 32.80 | 4.48 | 2.55 | 15.0 | 3 | |||||||
| 913 |
112 | 1.02 | 29.60 | 3.15 | 3.07 | 5.0 | 3 | |||||||
| 922 |
158 | 1.47 | 47.40 | 4.86 | 3.30 | 15.0 | 4 | |||||||
| 923 |
167 | 1.09 | 85.38 | 6.62 | 6.09 | 7.5 | 1 | |||||||
| 8111 |
2,842 | 0.31 | 19.70 | 0.83 | 2.70 | 9.0 | 4 | |||||||
| 8222 |
9,529 | 0.33 | 149.00 | 2.66 | 7.98 | 30.0 | 9 | |||||||
| 8333 |
498 | 0.29 | 17.20 | 1.07 | 3.74 | 5.0 | 4 | |||||||
| Notes: 1. STD - Standard Deviation 2. CoV - Coefficient of Variation | ||||||||||||||
| IAMGOLD Corporation - Essakane Gold Mine Technical Report NI 43-101 – February 17, 2016 |
Page 14-17 |
Essakane S.A. observed, through their statistical analysis, that typically, the data displayed extreme skewness and high coefficients of variation separated by uninformed grade ranges. The assay outliers were examined on both log-probability plots and histograms. Grade capping was applied to restrict the influence of outliers in the composites used for grade interpolation. Capping levels for each domain were initially selected to separate outliers and were later adjusted to better match the production results. GMSI used log-probability plots and histograms to determine capping grade levels for new domains within the North Satellite and EMZ South deposits.
COMPOSITING
The drill hole database coded within each interpreted domain was composited to achieve a uniform sample support. Taking into account the current bench heights of the mining operation (5 m to 10 m benches), the variance of the assay population, and the drill hole spacing, it was decided to composite the data with a regular 5 m run length (down hole) within the limits of each interpreted domain using the capped value of the assay samples. Composites of less than one metre were excluded from the composite database.
STATISTICS OF THE 5 M COMPOSITES
Descriptive statistics of the 5 m composites were generated and grouped by domain. The grade datasets for the various estimation domains are characterized by a generally high coefficient of variation (mostly between 1.5 and 2.5), which is common for this type of gold deposit. Table 14-7 shows the 5 m composite statistics by individual domains.
TABLE 14-7 STATISTICS OF THE 5 M COMPOSITES BY DOMAIN
| Domain Code | Number | Mean (g/t Au) |
Max (g/t Au)) |
STD(1) (g/t Au) |
CoV(2) | |||||
| 221 | 880 | 0.43 | 9.08 | 0.76 | 1.78 | |||||
| 222 | 815 | 0.41 | 7.98 | 0.74 | 1.80 | |||||
| 223 | 5,842 | 0.20 | 11.62 | 0.60 | 3.04 | |||||
| 241 | 5,047 | 0.97 | 21.28 | 1.52 | 1.56 | |||||
| 242 | 3,041 | 0.96 | 13.07 | 1.41 | 1.47 | |||||
| 243 | 9,524 | 0.90 | 27.46 | 1.90 | 2.10 | |||||
| 311 | 119 | 0.08 | 0.47 | 0.10 | 1.20 | |||||
| 312 | 147 | 0.10 | 1.01 | 0.16 | 1.63 | |||||
| 313 | 5,095 | 0.45 | 20.71 | 1.39 | 3.06 | |||||
| 341 | 404 | 0.19 | 2.30 | 0.32 | 1.68 | |||||
| 342 | 554 | 0.20 | 2.39 | 0.29 | 1.47 | |||||
| 343 | 8,067 | 0.55 | 45.00 | 1.53 | 2.76 | |||||
| 413 | 2,524 | 0.37 | 14.69 | 0.96 | 2.63 |
| IAMGOLD Corporation - Essakane Gold Mine Technical Report NI 43-101 – February 17, 2016 |
Page 14-18 |
| Domain Code | Number | Mean (g/t Au) |
Max (g/t Au)) |
STD(1) (g/t Au) |
CoV(2) | |||||
| 443 | 2,593 | 0.67 | 25.15 | 1.77 | 2.63 | |||||
| 513 | 595 | 0.81 | 19.72 | 1.99 | 2.47 | |||||
| 543 | 484 | 0.46 | 9.68 | 1.22 | 2.63 | |||||
| 623 | 749 | 0.35 | 11.99 | 1.06 | 3.04 | |||||
| 643 | 414 | 0.28 | 4.37 | 0.49 | 1.74 | |||||
| 712 | 6 | 1.13 | 2.75 | 0.88 | 0.78 | |||||
| 713 | 392 | 0.21 | 3.16 | 0.48 | 2.30 | |||||
| 721 | 54 | 0.26 | 1.05 | 0.25 | 0.95 | |||||
| 722 | 424 | 0.35 | 3.94 | 0.47 | 1.36 | |||||
| 723 | 2,669 | 0.34 | 15.68 | 0.83 | 2.46 | |||||
| 731 | 7 | 0.18 | 1.12 | 0.39 | 2.15 | |||||
| 732 | 100 | 0.12 | 5.53 | 0.58 | 4.69 | |||||
| 733 | 1,042 | 0.08 | 2.91 | 0.25 | 3.18 | |||||
| 811 | 50 | 0.09 | 1.06 | 0.19 | 2.16 | |||||
| 812 | 54 | 0.10 | 0.80 | 0.16 | 1.62 | |||||
| 813 | 127 | 0.05 | 0.70 | 0.11 | 2.02 | |||||
| 821 | 55 | 0.77 | 2.74 | 0.76 | 0.99 | |||||
| 822 | 67 | 0.56 | 2.27 | 0.57 | 1.01 | |||||
| 823 | 500 | 0.48 | 14.55 | 1.32 | 2.78 | |||||
| 912 | 23 | 1.43 | 5.13 | 1.54 | 1.08 | |||||
| 913 | 28 | 0.74 | 2.25 | 0.68 | 0.91 | |||||
| 922 | 36 | 1.07 | 5.41 | 1.51 | 1.41 | |||||
| 923 | 39 | 0.58 | 2.37 | 0.61 | 1.06 | |||||
| 8111 | 689 | 0.31 | 4.14 | 0.47 | 1.51 | |||||
| 8222 | 2,287 | 0.28 | 10.82 | 0.72 | 2.53 | |||||
| 8333 | 131 | 0.25 | 3.77 | 0.49 | 1.94 |
| Notes: 1. STD - Standard Deviation 2. CoV - Coefficient of Variation | ||||||||||
Student’s and Mann-Whitney tests were performed by Essakane personnel on the different domains of composites to study the statistical similarity (Yes or No) between two populations mean grade. Domains of similar properties will, for example, be treated as soft boundaries during grade interpolation or be combined for variography studies. Following the Student’s and Mann-Whitney test results, as presented in Table 14-8, some domains were defined as statistically similar and thus combined for later block modelling operations.
The Student’s and Mann-Whitney tests performed by Essakane personnel were carried out on a set of composites prepared prior to the current Technical Report and do not include the composites from the domain series 710, 720, and 730 of the North Satellite area and those of EMZ South, 8111, 8222, and 8333. GMSI did not review the Student’s and Mann-Whitney test results, however, GMSI did compare the basic statistics of the two set of composites by
| IAMGOLD Corporation - Essakane Gold Mine Technical Report NI 43-101 – February 17, 2016 |
Page 14-19 |
domain. GMSI concluded that the few composites added to the domains of the EMZ main area would not yield significant change to the previous Essakane S.A. Student’s and Mann-Whitney test results and the previous observations are still applicable to this set of composites.
TABLE 14-8 STUDENT’S AND MANN-WHITNEY MATRIX TEST RESULTS

Example:
Y/N Student’s test agrees with the two populations mean grade similarity while Mann-Whitney test does not
DENSITY DATA
The density database contained 26,040 measurements taken from DD and RCD holes. Some outliers were removed from the GEMS density database. The excluded values, listed in Table 14-9 were generally too low with regards to neighbouring values or weathering profile.
| IAMGOLD Corporation - Essakane Gold Mine Technical Report NI 43-101 – February 17, 2016 |
Page 14-20 |
TABLE 14-9 EXCLUDED DENSITY MEASUREMENTS
| Hole ID | Depth (m) |
Density (t/m3) |
||||||
| EDD0126 | 204.10 | 2.20 | ||||||
| EDD0126 | 205.70 | 2.21 | ||||||
| EDD0128 | 201.35 | 4.84 | ||||||
| EDD0179 | 119.50 | 4.04 | ||||||
| EDD0186 | 142.10 | 2.15 | ||||||
| EDD0187 | 82.60 | 1.27 | ||||||
| EDD0187 | 163.00 | 1.38 | ||||||
| EDD0188 | 183.70 | 1.35 | ||||||
| EDD0189 | 118.10 | 1.79 | ||||||
| EDD0190 | 178.10 | 2.24 | ||||||
| EDD0191 | 219.95 | 1.09 | ||||||
| EDD0192 | 177.50 | 1.33 | ||||||
| EDD0193 | 147.50 | 1.33 | ||||||
| EDD0196 | 272.30 | 1.96 | ||||||
| EDD0237 | 398.30 | 1.92 | ||||||
| ERC1354D | 176.40 | 2.18 | ||||||
| ERC1622D | 223.85 | 2.23 | ||||||
| ERC1624D | 297.80 | 2.43 | ||||||
| ERC1625D | 290.00 | 2.27 | ||||||
| ERC1633D | 219.75 | 2.03 | ||||||
| MEDD0165 | Entire hole | Too low | ||||||
| MEDD0172 | 173.85 | 1.46 | ||||||
| MEDD0176 | 326.00 | 2.33 |
From the density database, a total of 21,524 measurements, including values between 1.5 t/m3 and 4.0 t/m3 within the resource domains, were extracted for statistical studies. The statistics of the density measurements are presented in Table 14-10. The median value of each domain was used as the default value in the block model, except for the domains that had less than 30 density measurements. These domains were attributed a density corresponding to the median of their weathering group. For example, domain 311, which contained seven density measurements, was assigned a bulk density corresponding to the median of the saprolite group at 1.9 t/m3.
| IAMGOLD Corporation - Essakane Gold Mine Technical Report NI 43-101 – February 17, 2016 |
Page 14-21 |
TABLE 14-10 STATISTICS OF THE DENSITY MEASUREMENTS BY DOMAIN
| Weathering | Domain Code |
Number | Min (t/m3) |
Max (t/m3) |
Average (t/m3) |
Median (t/m3) |
Density Used in (t/m3) | |||||||
| Saprolite |
101 | 751 | 1.50 | 3.36 | 1.98 | 1.94 | 1.9 | |||||||
| 221 | 59 | 1.53 | 2.71 | 2.07 | 2.06 | 2.1 | ||||||||
| 241 | 655 | 1.51 | 2.89 | 1.86 | 1.83 | 1.8 | ||||||||
| 311 | 7 | 1.63 | 2.23 | 1.89 | 1.83 | 1.9 | ||||||||
| 341 | 54 | 1.51 | 2.79 | 1.88 | 1.84 | 1.8 | ||||||||
| 721 | 18 | 1.74 | 2.12 | 1.94 | 1.94 | 1.9 | ||||||||
| 731 | 3 | 1.94 | 2.17 | 2.02 | 1.95 | 1.9 | ||||||||
| 811 | 8 | 1.72 | 2.32 | 1.93 | 1.87 | 1.9 | ||||||||
| 821 | 15 | 1.57 | 2.07 | 1.80 | 1.81 | 1.9 | ||||||||
| All | 1,570 | 1.50 | 3.36 | 1.93 | 1.89 | - | ||||||||
| Transition |
102 | 1,030 | 1.50 | 3.17 | 2.19 | 2.17 | 2.2 | |||||||
| 222 | 80 | 1.59 | 2.82 | 2.42 | 2.49 | 2.5 | ||||||||
| 242 | 763 | 1.53 | 3.24 | 2.33 | 2.36 | 2.4 | ||||||||
| 312 | 16 | 1.98 | 2.76 | 2.33 | 2.30 | 2.3 | ||||||||
| 342 | 107 | 1.62 | 2.84 | 2.33 | 2.35 | 2.4 | ||||||||
| 722 | 113 | 1.63 | 2.49 | 2.04 | 2.04 | 2.0 | ||||||||
| 732 | 28 | 1.99 | 2.53 | 2.28 | 2.27 | 2.3 | ||||||||
| 812 | 10 | 2.14 | 2.89 | 2.43 | 2.36 | 2.3 | ||||||||
| 822 | 16 | 1.57 | 2.77 | 2.41 | 2.61 | 2.3 | ||||||||
| All | 2,163 | 1.50 | 3.24 | 2.25 | 2.25 | - | ||||||||
| Fresh Rock |
103 | 4,089 | 1.50 | 3.70 | 2.65 | 2.73 | 2.7 | |||||||
| 223 | 1,220 | 2.02 | 3.33 | 2.73 | 2.74 | 2.7 | ||||||||
| 243 | 4,355 | 1.54 | 3.68 | 2.71 | 2.73 | 2.7 | ||||||||
| 313 | 1,431 | 1.96 | 3.36 | 2.79 | 2.80 | 2.8 | ||||||||
| 343 | 3,414 | 1.60 | 3.85 | 2.77 | 2.79 | 2.8 | ||||||||
| 413 | 532 | 2.15 | 3.39 | 2.77 | 2.76 | 2.8 | ||||||||
| 443 | 933 | 1.96 | 3.75 | 2.78 | 2.77 | 2.8 | ||||||||
| 513 | 108 | 2.48 | 2.94 | 2.81 | 2.82 | 2.8 | ||||||||
| 543 | 131 | 2.36 | 3.03 | 2.79 | 2.80 | 2.8 | ||||||||
| 623 | 171 | 2.51 | 2.96 | 2.78 | 2.79 | 2.8 | ||||||||
| 643 | 107 | 2.41 | 2.93 | 2.76 | 2.77 | 2.8 | ||||||||
| 713 | 55 | 2.02 | 2.92 | 2.71 | 2.79 | 2.8 | ||||||||
| 723 | 537 | 1.69 | 3.03 | 2.52 | 2.57 | 2.6 | ||||||||
| 733 | 310 | 1.73 | 3.58 | 2.68 | 2.74 | 2.7 | ||||||||
| 813 | 82 | 2.44 | 3.05 | 2.83 | 2.81 | 2.8 | ||||||||
| 823 | 316 | 1.96 | 3.11 | 2.74 | 2.76 | 2.8 | ||||||||
| All | 17,791 | 1.50 | 3.85 | 2.72 | 2.76 | - |
| IAMGOLD Corporation - Essakane Gold Mine Technical Report NI 43-101 – February 17, 2016 |
Page 14-22 |
VARIOGRAPHY
The variography study was largely done by Essakane S.A. personnel. GMSI analyzed the composites of the North Satellite domains 710, 720, and 730. Domains from EMZ South were not included in the variography study.
Mapping has highlighted at least three vein sets at the EMZ deposit. All vein orientations are mineralized and carry gold. Gold occurs as free particles within the veins and it is also inter-grown with arsenopyrite, either on vein margins, or in the host rocks. Disseminated arsenopyrite and gold mineralization rapidly decrease away from the veins.
An isotropic search was used for grade interpolation since the EMZ deposit holds three main sets of veins within its litho-structural domains. Downhole and omni-directional correlograms of five metre composite grades were developed in Sage 2001 (Isaaks & Co) in order to determine the nugget effect (closed space variability) and the proportion of total variance and ranges along the X, Y, and Z directions. All of the correlograms modelled by Essakane S.A. comprised a nugget effect component and two exponential structures representing the larger scale spatial variability of the datasets. The North Satellite domains were studied by GMSI and were modelled with a nugget effect component and two spherical structures.
The correlogram p(h) is the traditional covariance (C (h)) standardized by the respective tail and head standard deviations:

This has the advantage of normalizing the sills of all measures of spatial variability to one.
The components of the modelled correlograms are summarized in Table 14-11. Generally, the nugget effect is between 50% and 65% of the total variance although it is lower in the 700 and 800 domain series. The high nugget effect implies large variability within short distances.
| IAMGOLD Corporation - Essakane Gold Mine Technical Report NI 43-101 – February 17, 2016 |
Page 14-23 |
TABLE 14-11 SEMI-VARIOGRAM PROFILES USED FOR EMZ AND NORTH SATELLITE’S DOMAINS
| Profile Name |
Domain Code | Model Type |
Nugget | 1st Structure | 2nd Structure | Anisotropy Rotation | ||||||||||||||||
| Sill | Range 1 /2 /3 (m) | Sill | Range 1 /2 /3 (m) | Rotation | Angle 1 |
Angle 2 |
Angle 3 | |||||||||||||||
| 221A223 |
221, 222, 223 | Exponential | 0.620 | 0.225 | 15 / 15 / 15 | 0.105 | 190 / 100 /400 | ZYZ | -130 | -20 | 80 | |||||||||||
| 241A243 |
241, 242, 243 | 0.500 | 0.393 | 10 / 5 / 24 | 0.057 | 75 / 220 / 24 | 30 | 20 | -5 | |||||||||||||
| 311A313 |
311, 312, 313 | 0.450 | 0.180 | 8/8/8 | 0.370 | 70 / 70 / 70 | 0 | 0 | 0 | |||||||||||||
| 341A343 |
341, 342, 343 | 0.620 | 0.255 | 15 / 10 / 30 | 0.075 | 25 / 285 / 160 | 30 | 0 | -3 | |||||||||||||
| 413 |
413 | 0.650 | 0.204 | 20 / 20 / 20 | 0.116 | 50 / 50 / 50 | -90 | 0 | 0 | |||||||||||||
| 443 |
443 | 0.700 | 0.211 | 105 / 11 / 37.5 | 0.089 | 50 / 150 / 400 | -35 | -44 | 31 | |||||||||||||
| 513 |
513 | 0.750 | 0.250 | 200 / 200 /200 | - | - | 0 | 0 | 0 | |||||||||||||
| 543 |
543 | 0.700 | 0.300 | 50 / 50 / 50 | - | - | 0 | 0 | 0 | |||||||||||||
| 623-643 |
623, 643 | 0.700 | 0.300 | 30 / 30 / 30 | - | - | 0 | 0 | 0 | |||||||||||||
| 710 |
712, 713 | Spherical | 0.142 | 0.426 | 25 / 10 / 75 | 0.432 | 120 / 10 / 100 | ZXZ | 104 | 25 | -20 | |||||||||||
| 720 |
721, 722, 723 | 0.522 | 0.388 | 35 / 35 / 35 | 0.091 | 75 / 75 / 75 | 0 | 0 | 0 | |||||||||||||
| 730 |
731, 732, 733 | 0.214 | 0.348 | 25 / 10 / 100 | 0.438 | 200 / 15 / 160 | 104 | 25 | -20 | |||||||||||||
| 821A823 |
821, 822, 823 | Exponential | 0.350 | 0.350 | 12 / 12 / 12 | 0.300 | 80 / 80 / 80 | ZYZ | 0 | 0 | 0 | |||||||||||
| 911A913 |
912, 913, 922, 923 | 0.700 | 0.300 | 30 / 30 / 30 | - | - | 0 | 0 | 0 | |||||||||||||
| IAMGOLD Corporation - Essakane Gold Mine Technical Report NI 43-101 – February 17, 2016 |
Page 14-24 |
BLOCK MODELLING
BLOCK MODEL PARAMETERS
A single block model was constructed for the EMZ deposit, including South EMZ, EMZ, and North Satellite areas. The block model covers an area large enough to manage the open pit developments and waste dumps. The block model was developed using GEOVIA GEMS version 6.7.0.
The choice of block dimensions (20 m x 20 m x 5 m) is based on the existing drilling pattern (25 m x 25 m or 25 m x 50 m in some areas), mine planning considerations (5 m to 10 m benches), current material selectivity, and the characteristics of the assay population. Table 14-12 presents the location and dimension settings of the block model.
TABLE 14-12 EMZ BLOCK MODEL PARAMETERS
| Block Model Name |
Orientation | Origin(1) (m) |
Number of Columns, Rows, Levels |
Block Size (m) |
Rotation(2) | |||||
| RES16Offic2 |
East | 185,251.2011 | 67 | 20 | 27.622 | |||||
| North | 1,589,508.892 | 275 | 20 | |||||||
| Elevation | 275 | 95 | 5 | |||||||
Notes:
| 1. | In GEMS, the origin point stands at the South West corner and highest level of the block model |
| 2. | For a positive value, the direction of rotation is counter clockwise around the elevation axis (Z) |
A series of block model attributes were created during the block modelling estimation and incorporated into the block model project. The attributes containing the final results are presented in Table 14-13.
TABLE 14-13 FINAL BLOCK MODEL ATTRIBUTES
| Attribute Name | Description | |
| Rock | Rock codes of combined lithology and weathering (Refer to Table) | |
| Weathering | Weathering rock codes: (101) Saprolite, (102) Transition, (103) Fresh Rock | |
| Density | Density assigned to the block | |
| Au | Interpolated gold grades | |
| Categ | Resource Category: (1) Measured, (2) Indicated, (3) Inferred | |
| Elevation | Surface Elevation Grids | |
| IAMGOLD Corporation - Essakane Gold Mine Technical Report NI 43-101 – February 17, 2016 |
Page 14-25 |
ROCK TYPE MODELS
The Weathering attribute was coded from the Saprolite, Transition, and Fresh Rock wireframes, and constituted a simple rock type attribute to be used in cases where a more detailed rock description is not required. A block was coded with a weathering rock code if 50% of its volume was located inside the weathering wireframe.
The Weathering attribute was used as a background code for the Rock Type attribute. Then the wireframe constraints (weathering and litho-structural domains), presented previously, were used to codify the Rock Type attribute. A block from EMZ or North Satellite was assigned a domain rock code if its volume was a least 33.3% inside this domain. The percent threshold used for the domains of EMZ South (8111, 8222, and 8333) is set at 0.01% since the wireframes modelled by Essakane S.A. are more generous. In the situation where a block is located in multiple domains, in the fold hinge for example where many domains meet, the highest percentage of volume (above the limit) prevails, unless precedence applies.
An order of priority, defined as precedence in GEMS, was set to all domains. The majority of the domains in the EMZ and North Satellite areas were modelled as juxtaposed (no overlaps) wireframes, except for domain 710, which overlapped all domains in the North Satellite area and domains representing dykes and rock codes of series 810 and 820. The rock codes attributed from the litho-structural domains were, afterward, adjusted (for EMZ and North Satellite areas only) with the corresponding weathering code. The adjustments were made on the last digit of the code as follows: 1 for Saprolite, 2 for Transition, and 3 for Fresh Rock. The domain 220, for example, yielded rock codes 221 for Saprolite, 222 for Transition, and 223 for Fresh Rock. Details of the rock codes present in the Rock Type attribute are listed in Table 14-14.
In both attributes Weathering and Rock Type, the blocks located 99.9% above the pre-mining topography surface were defined as “Air” and coded 0.
| IAMGOLD Corporation - Essakane Gold Mine Technical Report NI 43-101 – February 17, 2016 |
Page 14-26 |
TABLE 14-14 ROCK CODES FOUND IN THE ROCK TYPE ATTRIBUTE
| Domain Code | Description | Precedence | Rock Codes | |||||||
| Saprolite | Transition | Fresh Rock | ||||||||
| 103 |
Host Rock | Background | 101 | 102 | 103 | |||||
| 220 |
Arenite | 3 | 221 | 222 | 223 | |||||
| 240 |
Arenite | 4 | 241 | 242 | 243 | |||||
| 310 |
Argillite | 5 | 311 | 312 | 313 | |||||
| 340 |
Argillite | 6 | 341 | 342 | 343 | |||||
| 410 |
Arenite | 7 | - | - | 413 | |||||
| 440 |
Arenite | 8 | - | - | 443 | |||||
| 510 |
Argillite | 9 | - | - | 513 | |||||
| 540 |
Argillite | 10 | - | - | 543 | |||||
| 620 |
Argillite | 11 | - | - | 623 | |||||
| 640 |
Argillite | 12 | - | - | 643 | |||||
| 710 |
Argillite | 17 | - | 712 | 713 | |||||
| 720 |
Argillite | 15 | 721 | 722 | 723 | |||||
| 730 |
Argillite | 16 | 731 | 732 | 733 | |||||
| 810 |
Dolerite | 1 | 811 | 812 | 813 | |||||
| 820 |
Intermediate Intrusive | 2 | 821 | 822 | 823 | |||||
| 910 |
Arenite | 13 | 911 | 912 | 913 | |||||
| 920 |
Arenite | 14 | - | 922 | 923 | |||||
| 8111 |
Ore Envelope | 1 | 8111 | |||||||
| 8222 |
Ore Envelope | 2 | 8222 | |||||||
| 8333 |
Ore Envelope | 3 | 8333 | |||||||
DENSITY MODEL
Default values determined from the median values, as presented previously, were first set into each domain. Table 14-15 lists the background densities used in the block model.
| IAMGOLD Corporation - Essakane Gold Mine Technical Report NI 43-101 – February 17, 2016 |
Page 14-27 |
TABLE 14-15 DEFAULT DENSITY VALUES USED IN THE BLOCK MODEL
| Saprolite | Transition | Fresh Rock | ||||||||
| Rock Code | Density | Rock Code | Density | Rock Code | Density | |||||
| 101 |
1.9 | 102 | 2.3 | 103 | 2.8 | |||||
| 221 |
2.1 | 222 | 2.5 | 223 | 2.7 | |||||
| 241 |
1.8 | 242 | 2.4 | 243 | 2.7 | |||||
| 311 |
1.9 | 312 | 2.3 | 313 | 2.8 | |||||
| 341 |
1.8 | 342 | 2.4 | 343 | 2.8 | |||||
| 411 |
NE | 412 | NE | 413 | 2.8 | |||||
| 441 |
NE | 442 | NE | 443 | 2.8 | |||||
| 511 |
NE | 512 | NE | 513 | 2.8 | |||||
| 541 |
NE | 542 | NE | 543 | 2.8 | |||||
| 621 |
NE | 622 | NE | 623 | 2.8 | |||||
| 641 |
NE | 642 | NE | 643 | 2.8 | |||||
| 711 |
NE | 712 | 2.3 | 713 | 2.8 | |||||
| 721 |
1.9 | 722 | 1.8 | 723 | 2.6 | |||||
| 731 |
1.9 | 732 | 2.3 | 733 | 2.7 | |||||
| 811 |
1.9 | 812 | 2.3 | 813 | 2.8 | |||||
| 821 |
1.9 | 822 | 2.3 | 823 | 2.8 | |||||
| 911 |
1.9 | 912 | 2.3 | 913 | 2.8 | |||||
| 921 |
NE | 922 | 2.3 | 923 | 2.8 | |||||
| Note: 1. NE - Non Existent rock codes in the block model |
A density interpolation was carried out using an Inverse Distance Cubed interpolator in combination with flat search ellipses with dimensions of 50 m x 50 m x 25m (X, Y, Z). The details of the density interpolation are described in Table 14-16 and 14-17. The results, where estimated, overwrote the background density values previously entered.
Note that for the EMZ South area, the densities were not attributed in function of the ore envelopes. These densities follow the continuation of the EMZ litho-structural model using the median background values and interpolated densities, as explained in the present section.
| IAMGOLD Corporation - Essakane Gold Mine Technical Report NI 43-101 – February 17, 2016 |
Page 14-28 |
TABLE 14-16 INTERPOLATION DETAILS FOR THE DENSITY ESTIMATION
| Block Model Parameters | Description | |
| Data Source | Density Measurements > 1.5 and < 4.0 t/m3 from DD & RCD Hole Types | |
| Interpolation Method | ID3 | |
| Minimum/Maximum Sample | 4/30 | |
| Maximum Sample per Hole | No maximum defined | |
| Boundary Type | Soft & Hard Boundaries | |
| Number of Iterations | 1 | |
| Search Ellipses (X, Y, Z) | 50m x 50m x 25m | |
| High Grade Transition Limit | Not used | |
TABLE 14-17 SOFT AND HARD BOUNDARIES USED FOR THE DENSITY INTERPOLATION
| Target Rock Code | Restricting Rock Codes | |||||||||||||||||
| 101 | 101 | 221 | 241 | 311 | 341 | 711 | 731 | 721 | ||||||||||
| 102 | 102 | 222 | 242 | 732 | 712 | 722 | ||||||||||||
| 103 | 103 | 243 | 623 | 813 | 823 | 643 | 733 | 713 | 723 | |||||||||
| 221 | 101 | 221 | 241 | 311 | 341 | |||||||||||||
| 222 | 222 | 102 | ||||||||||||||||
| 223 | 223 | 323 | ||||||||||||||||
| 241 | 101 | 221 | 241 | 311 | 341 | 621 | ||||||||||||
| 242 | 242 | 312 | 812 | 822 | ||||||||||||||
| 243 | 103 | 243 | 623 | 813 | 823 | 643 | ||||||||||||
| 311 | 101 | 221 | 141 | 311 | 341 | |||||||||||||
| 312 | 312 | 242 | 812 | 822 | ||||||||||||||
| 313 | 313 | 343 | ||||||||||||||||
| 341 | 101 | 221 | 241 | 311 | 341 | |||||||||||||
| 342 | 342 | 242 | 312 | 812 | 822 | |||||||||||||
| 343 | 313 | 343 | ||||||||||||||||
| 413 | 413 | 443 | 513 | 543 | ||||||||||||||
| 443 | 413 | 443 | 513 | 543 | 333 | |||||||||||||
| 513 | 413 | 443 | 513 | 543 | ||||||||||||||
| 543 | 413 | 443 | 513 | 543 | ||||||||||||||
| 623 | 103 | 243 | 623 | 813 | 823 | 643 | ||||||||||||
| 643 | 103 | 243 | 643 | 623 | 813 | 823 | ||||||||||||
| 712 | 712 | 722 | 732 | 222 | 242 | 312 | 342 | 102 | ||||||||||
| 713 | 713 | 723 | 733 | 223 | 243 | 313 | 343 | 103 | ||||||||||
| 721 | 711 | 721 | 731 | 221 | 241 | 311 | 341 | 101 | ||||||||||
| 722 | 712 | 722 | 732 | 222 | 242 | 312 | 342 | 102 | ||||||||||
| 723 | 713 | 723 | 733 | 223 | 243 | 313 | 343 | 103 | ||||||||||
| 731 | 711 | 721 | 731 | 221 | 241 | 311 | 341 | 101 | ||||||||||
| 732 | 712 | 722 | 732 | 222 | 242 | 342 | 312 | 102 | ||||||||||
| IAMGOLD Corporation - Essakane Gold Mine Technical Report NI 43-101 – February 17, 2016 |
Page 14-29 |
| Target Rock Code | Restricting Rock Codes | |||||||||||||||||
| 733 | 713 | 723 | 733 | 223 | 243 | 343 | 313 | 103 | ||||||||||
| 811 | 101 | 811 | 821 | 241 | ||||||||||||||
| 812 | 812 | 102 | 822 | 242 | ||||||||||||||
| 813 | 103 | 813 | 823 | 243 | ||||||||||||||
| 821 | 101 | 811 | 821 | 241 | 641 | |||||||||||||
| 822 | 822 | 812 | 102 | 242 | 642 | |||||||||||||
| 823 | 823 | 813 | 103 | 243 | 643 | |||||||||||||
GRADE ESTIMATION METHODOLOGY
Grade estimation in the EMZ and North Satellite areas was done using Ordinary Kriging (OK) and 5 m composites tagged by domain codes. The blocks are interpolated by domains (Target Rock Code) from composites coded within this domain only (hard boundary) or with other specified domains (soft boundary). The nature of the boundaries (soft or hard) between domains is detailed by restrictive rock codes presented in Table 14-18 and is largely derived from the statistical relation between composites’ domain populations.
TABLE 14-18 LIST OF ROCK CODES TREATED BY THE INTERPOLATION
PROFILES AND ASSOCIATED VARIOGRAPHY PROFILES – EMZ & NORTH SATELLITE
| Interpolation Profile Name |
Variography Profile Name |
Target Rock Code |
Restrictive Rock Codes | |||||||||
| M_AREN |
221A223 | 221 | 221 | 222 | 311 | |||||||
| 222 | 221 | 222 | ||||||||||
| 223 | 223 | |||||||||||
| 241A243 | 241 | 241 | 242 | |||||||||
| 242 | 241 | 242 | ||||||||||
| 243 | 243 | |||||||||||
| 443 | 443 | 443 | ||||||||||
| L_ARGIL |
311A313 | 311 | 312 | 341 | 221 | |||||||
| 312 | 312 | 313 | 342 | 311 | ||||||||
| 313 | 312 | 313 | ||||||||||
| 341A343 | 341 | 341 | 342 | 311 | ||||||||
| 342 | 341 | 342 | 312 | |||||||||
| 343 | 343 | |||||||||||
| D&ARG |
413 | 413 | 413 | 513 | ||||||||
| 513 | 513 | 513 | 543 | 623 | ||||||||
| 543 | 543 | 543 | 643 | 513 | ||||||||
| 623-643 | 623 | 623 | 643 | 513 | ||||||||
| 643 | 643 | 623 | 513 | 543 | ||||||||
| IAMGOLD Corporation - Essakane Gold Mine Technical Report NI 43-101 – February 17, 2016 |
Page 14-30 |
| Interpolation Profile Name |
Variography Profile Name |
Target Rock Code |
Restrictive Rock Codes | |||||||||
| NORD |
710 | 712 | 711 | 712 | 713 | |||||||
| 713 | 711 | 712 | 713 | |||||||||
| 720 | 721 | 721 | 722 | 723 | ||||||||
| 722 | 722 | 721 | 723 | |||||||||
| 723 | 721 | 722 | 723 | |||||||||
| 730 | 731 | 731 | 732 | 733 | ||||||||
| 732 | 731 | 732 | 733 | |||||||||
| 733 | 731 | 732 | 733 | |||||||||
| 821A823 | 821 | 821 | 822 | 823 | ||||||||
| 822 | 821 | 822 | 823 | |||||||||
| 823 | 821 | 822 | 823 | |||||||||
| 911A913 | 911 | 911 | 912 | 913 | ||||||||
| 912 | 911 | 912 | 913 | |||||||||
| 913 | 911 | 912 | 913 | |||||||||
| 922 | 921 | 922 | 923 | |||||||||
| 923 | 921 | 922 | 923 | |||||||||
Grade estimation in the EMZ and North Satellite areas was carried out through two cumulative search passes as described below:
| • | First pass: minimum of seven and maximum of 30 composites collected within a sphere (isotropic search) of 40 m radius, which is less than the range identified by variography studies (generally about two thirds of the range). A maximum of three composites per drill hole was allowed for any block estimate. |
| • | Second pass: minimum of one and maximum of 30 composites collected within a sphere (isotropic search) of 100 m radius to better fill the domains. To reduce smearing, composites grading above 5 g/t Au are included in the estimate only if they make it within a search sphere of half the original size (50 m radius). A maximum of three composites per drill hole was allowed for any block estimate. The second pass interpolated only blocks that were not interpolated in the first pass. |
TABLE 14-19 DESCRIPTION OF THE GRADE INTERPOLATION PASSES – EMZ
AND NORTH SATELLITE
| Composites | Profile Name |
Rotation | Range | High Grade Transition Limit | ||||||||||||||||||||||||
| Grade (g/t Au) |
Range | |||||||||||||||||||||||||||
| Pass | Min | Max | Max Per Hole |
Z | Y | Z | X (m) |
Y (m) |
Z (m) |
X (m) |
Y (m) |
Z (m) | ||||||||||||||||
| 1st | 7 | 30 | 3 | PASS1 | 0 | 0 | 0 | 40 | 40 | 40 | - | |||||||||||||||||
| 2nd | 1 | 30 | 3 | PASS2 | 0 | 0 | 0 | 100 | 100 | 100 | 5 | 50 | 50 | 50 | ||||||||||||||
For the EMZ South area, the grade was estimated with an anisotropic Inverse Distance Power 12 interpolator. The choice of high power is to mimic a Nearest Neighbour
| IAMGOLD Corporation - Essakane Gold Mine Technical Report NI 43-101 – February 17, 2016 |
Page 14-31 |
interpolation. Blocks were interpolated by domains using 5 m long composites coded within the domains. The limits of the domains in the EMZ South area were qualified as hard boundary, meaning that the composites of a specific domain were used uniquely for the interpolation of that domain. Tables 14-20 and 14-21 present the interpolation components used for the EMZ South area single grade interpolation pass, which is also described below:
| • | Single pass: minimum of two and maximum of 25 composites collected within an anisotropic search ellipse of 75 m x 50 m x 10 m (X, Y, Z). A maximum of one composite per drill hole was allowed for any block estimate. |
TABLE 14-20 GRADE INTERPOLATION - EMZ SOUTH
| Composites | ||||||||
| Interpolation Method | Min | Max | Max Per Hole | Target Rock Codes | ||||
| Inverse Distance Power 12 |
2 | 25 | 1 | 8111, 8222, 8333 | ||||
TABLE 14-21 ANISOTROPY SEARCH ELLIPSE - EMZ SOUTH
| Search Type | Rotation | Range | ||||||||||
| Z | Y | Z | X (m) |
Y (m) |
Z (m) | |||||||
| Anisotropic |
0 | 45 | 90 | 75 | 50 | 10 | ||||||
CLASSIFICATION AND RESOURCE REPORTING
The CIM Definition Standards on Mineral Resources and Mineral Reserves, prepared by the CIM Standing Committee on Resource Definition and adopted by the CIM council on May 10, 2014, provide standards for the classification of Mineral Resources and Mineral Reserves estimates into various categories. The category to which a resource or reserve estimate is assigned depends on the level of confidence in the geological information available on the mineral deposit, the quality and quantity of data available, the level of detail of the technical and economic information which has been generated about the deposit, and the interpretation of that data and information. Under CIM Definition Standards:
An “Inferred Mineral Resource” is that part of a Mineral Resource for which quantity and grade or quality can be estimated on the basis of geological evidence and limited sampling and reasonably assumed, but not verified, geological or grade continuity. The estimate is based on limited information and sampling gathered through appropriate techniques from locations such as outcrops, trenches, pits, workings and drill holes.
| IAMGOLD Corporation - Essakane Gold Mine Technical Report NI 43-101 – February 17, 2016 |
Page 14-32 |
An “Indicated Mineral Resource” is that part of a Mineral Resource for which quantity, grade or quality, densities, shape, and physical characteristics can be estimated with a level of confidence sufficient to allow appropriate application of technical and economic parameters, to support mine planning and evaluation of the economic viability of the deposit. The estimate is based on detailed and reliable exploration and testing information gathered through appropriate techniques from locations such as outcrops, trenches, pits, workings and drill holes that are spaced closely enough for geological and grade continuity to be reasonably assumed.
A “Measured Mineral Resource” is that part of a Mineral Resource for which quantity, grade or quality, densities, shape, and physical characteristics are so well established that they can be estimated with confidence sufficient to allow the appropriate application of technical and economic parameters, to support production planning and evaluation of the economic viability of the deposit. The estimate is based on detailed and reliable exploration, sampling and testing information gathered through appropriate techniques from locations such as outcrops, trenches, pits, workings and drill holes that are spaced closely enough to confirm both geological and grade continuity.
In addition, the resource classification is based on the robustness of the various data sources available, including:
| • | Quality and reliability of drilling and sampling data |
| • | Distance between sample points (drilling density) |
| • | Confidence in the geological interpretation |
| • | Continuity of the geological structures and the continuity of the grade within these structures |
| • | Variogram models and their related ranges (first and second structures) |
| • | Statistics of the data population |
| • | Quality of assay data |
| • | Tonnage factor |
Based on these criteria, the resources have been classified according to a data search used to estimate each block. Additionally, all resource blocks must show reasonable prospects for
| IAMGOLD Corporation - Essakane Gold Mine Technical Report NI 43-101 – February 17, 2016 |
Page 14-33 |
eventual economic extraction. In the case of the EMZ deposit, the resource blocks were contained within a pit shell based on the mining costs, the metallurgical parameters and, the financial parameters used for the latest LOM plan.
Measured Mineral Resources were previously defined by blocks located within 10 m of at least three holes, including grade control RC (GC) holes. However, the volume defined is so close to current work faces that they are fully depleted by the effective date of this report. Consequently no Measured Mineral Resources were defined.
Indicated Mineral Resources encompassed all blocks in the EMZ and North Satellite areas estimated in the first estimation pass using composites from a minimum of three different drill holes within domains of soft and hard boundaries inside a search sphere of 40 m of radius.
Inferred Mineral Resources corresponded to 1) the blocks of the EMZ and North Satellite areas estimated in the second pass for which composites from a minimum of one drill hole were interpolated within a search sphere of 100 m radius inside domains of soft and hard boundaries, and to 2) the blocks of the EMZ South area estimated in a single pass using composites from at least two drill holes and within an anisotropic search ellipse of ranges 75 m x 50 m x 10 m (X, Y, Z).
Additionally, for the EMZ area only, changes in the resource classification were made based on the comparison to the December 31, 2014 block model, which resource classification could not be reproduced by GMSI. Some of the previously marked indicated blocks are now identified as inferred in the December 31, 2015 model in areas where no changes should take place. Because GMSI recognizes the indicated nature of those blocks, a number of selected blocks resulting from the second interpolation pass and located within the $1,500/oz Whittle pit shell were categorized as Indicated Mineral Resources instead of Inferred Mineral Resources.
BLOCK MODEL VALIDATION
Multiple validations were completed on the EMZ deposit block model. The process included visual checks, statistical validation, comparison of estimations issued from different interpolation methods, swath plots, and comparisons with previously validated models.
| IAMGOLD Corporation - Essakane Gold Mine Technical Report NI 43-101 – February 17, 2016 |
Page 14-34 |
VISUAL VALIDATION
The visual checks consisted of visualizing slices of the block model (section and plan views) with domain wireframes, composites, and drill hole information. The data source was visually compared with the different model attributes (rock type, density, and gold grades) throughout the deposit.
It was found that due to the juxtaposed wireframes modelling and the choice of updating rock type blocks using a minimum percentage of 33.3% inside wireframes, some blocks inside the fold structure were left blank. The unfilled blocks that were expected to receive a rock code were corrected by removing, for these blocks only, the minimum re-assign percentage limit. This way, the blank blocks were coded with the highest proportion of the wireframe in which they were located.
Also, it was observed that the method used to assign rock codes to blocks favoured the outer bed of the fold structure. More blocks are being coded on the exterior shell of the fold. The minimum percent of 33.3% cannot truly apply to the blocks within the interior beds of the folded structure as they will all generally be coded during the process.
The visual verification of the grade attribute outlined that the wireframes occasionally obstruct the distribution of the grade. The litho-structural wireframes are representative of the geological model but might not be the most accurate mineralization model system. The actual folded shell structure appeared to adequately constrain the mineralization. However, within the shell, the modelled bedding sometimes divides what seems to be a continuous mineralized interval in a way that is not necessarily concordant with the soft or hard boundaries restrictions. The grade distribution was locally influenced by this aspect of the modelling.
Visually, the models (Rock Type, Density, and Au Grade) were found to be globally representative of the known geological and structural controls of mineralization of the EMZ deposit.
STATISTICAL VALIDATION
A statistical comparison between composites used in the interpolation and interpolated block grades was performed to evaluate if samples used in the estimation are well represented in the block model. Table 14-22 summarizes the comparison of statistics between the mean
| IAMGOLD Corporation - Essakane Gold Mine Technical Report NI 43-101 – February 17, 2016 |
Page 14-35 |
grade of composites that fall within a block and the interpolated grade of that block. A successful grade interpolation protocol will result in block grade estimates that demonstrate a minimum amount of bias.
A total of 37,461 blocks containing composites were identified within the block model. The average grade of the composites that fall within these blocks is 0.59 g/t Au and the average kriged grade for the same selection of blocks is equally 0.59 g/t Au showing that, overall, there is no significant bias between the grade of the composites and the estimated grade. This statistical analysis demonstrates that the block model provides a reasonable estimate of the Mineral Resources of the EMZ deposit.
| IAMGOLD Corporation - Essakane Gold Mine Technical Report NI 43-101 – February 17, 2016 |
Page 14-36 |
TABLE 14-22 COMPARISON OF KRIGED BLOCKS AND MEAN COMPOSITE GRADES
| Area | Domain Code |
Rock Description |
Number of Blocks With Composites |
Kriged Blocks Average Grade g/t Au |
Composites Average Grade g/t Au |
Difference Kriging/Composites | ||||||
| EMZ | 220 | Arenite | 5,423 | 0.25 | 0.25 | 0% | ||||||
| 240 | Arenite | 11,711 | 0.96 | 0.94 | 2% | |||||||
| 310 | Argillite | 3,487 | 0.52 | 0.52 | 0% | |||||||
| 340 | Argillite | 5,680 | 0.58 | 0.58 | 0% | |||||||
| 410 | Arenite | 1,727 | 0.38 | 0.35 | 7% | |||||||
| 440 | Arenite | 1,915 | 0.70 | 0.74 | -5% | |||||||
| 510 | Argillite | 463 | 0.68 | 0.80 | -15% | |||||||
| 540 | Argillite | 408 | 0.47 | 0.48 | -3% | |||||||
| 620 | Argillite | 525 | 0.34 | 0.35 | -2% | |||||||
| 640 | Argillite | 324 | 0.31 | 0.32 | -4% | |||||||
| 820 | Intrusive | 223 | 0.43 | 0.43 | 0% | |||||||
| North Satellite |
710 | Argillite | 337 | 0.18 | 0.23 | -22% | ||||||
| 720 | Argillite | 2,115 | 0.32 | 0.33 | -3% | |||||||
| 730 | Argillite | 918 | 0.09 | 0.14 | -37% | |||||||
| 910 | Arenite | 17 | 1.00 | 0.94 | 7% | |||||||
| 920 | Arenite | 39 | 0.79 | 0.68 | 16% | |||||||
| EMZ South |
8111 | Ore Envelope | 439 | 0.33 | 0.31 | 6% | ||||||
| 8222 | Ore Envelope | 1,614 | 0.29 | 0.31 | -8% | |||||||
| 8333 | Ore Envelope | 96 | 0.24 | 0.24 | 2% | |||||||
| Total | 37,461 | 0.59 | 0.59 | 0% |
| IAMGOLD Corporation - Essakane Gold Mine Technical Report NI 43-101 – February 17, 2016 |
Page 14-37 |
VALIDATION USING DIFFERENT INTERPOLATION METHODS
The validation of the block model was also done using Inverse Distance Squared (ID2) interpolation to compare with the OK estimate of the EMZ and North Satellite area. The same set of composites, search spheres, and settings were used and only the interpolation technique differed. The results were compared visually. Tonnages, grades, and gold contents are similar.
SWATH PLOTS
Swath plots were generated to assess the correlation between composites used in the interpolation and the total gold content estimated in the blocks. Swath plots were produced in southwest-northeast vertical sections, with 50 m spacing. This validation method works as a visual means to identify possible bias in the interpolation (e.g. a section with a significantly high gold content based on a low population of composites). In general, gold contained in each vertical section should correlate well with the amount of composites used in the interpolation.
Figures 14-11 and 14-12 illustrate swath plots for Indicated and Inferred Mineral Resources by vertical sections for the EMZ and North Satellite areas. Gold content is constrained below the mining surface as of December 31, 2015 and inside the US$1,500/oz Whittle pit shell optimized on Indicated and Inferred Mineral Resources. Peaks and lows in gold content generally match peaks and lows in composite frequency; no bias was found in the resource estimate in this regard.
| IAMGOLD Corporation - Essakane Gold Mine Technical Report NI 43-101 – February 17, 2016 |
Page 14-38 |
FIGURE 14-11 SWATH PLOT FOR INDICATED RESOURCES - EMZ AND NORTH SATELLITE
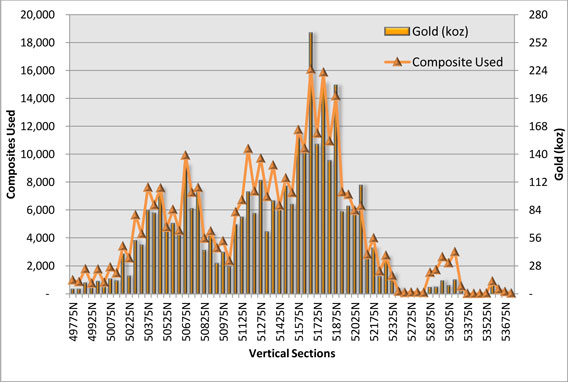
| IAMGOLD Corporation - Essakane Gold Mine Technical Report NI 43-101 – February 17, 2016 |
Page 14-39 |
FIGURE 14-12 SWATH PLOT FOR INFERRED RESOURCES - EMZ AND NORTH SATELLITE
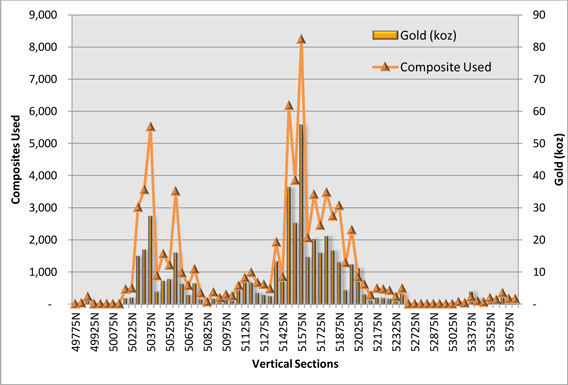
| IAMGOLD Corporation - Essakane Gold Mine Technical Report NI 43-101 – February 17, 2016 |
Page 14-40 |
FALAGOUNTOU DEPOSITS
DATA
The GEMS database was acquired by GMSI while at the Essakane Gold Mine site in February 2015 and an update to this database was received by GMSI via secured file transfer on September 26, 2015. The current resource estimates on the Falagountou West and Falagountou East deposits are updates of GMSI April 2015 models. New drilling is limited to the Falagountou West deposit as shown in Figure 14-13. The database includes geotechnical and lithology logging information as well as gold assay and density sample results of the holes drilled on the Falagountou project, which includes the West and East areas. The current Falagountou deposit resource estimate is derived exclusively from this database. GMSI reviewed the information stored in the database and found it to be in good standing.
The GEMS project holds 1,191 holes of different types covering the Falagountou deposits and exploration areas around these deposits. The ore zone modelling and resource estimation used three types of drill holes (DD, RC, and RCD) for a total of 968 holes and 121,887 m drilled. Table 14-23 details the series of holes by type and year of drilling. Note that because AC and RAB sampling is more subject to segregation bias, their results are not used in the estimate process. They were used to guide geological and ore zone modelling, however, no vertex snapping was done on these types of hole.
| IAMGOLD Corporation - Essakane Gold Mine Technical Report NI 43-101 – February 17, 2016 |
Page 14-41 |
FIGURE 14-13 PLAN VIEW OF THE DRILL HOLES
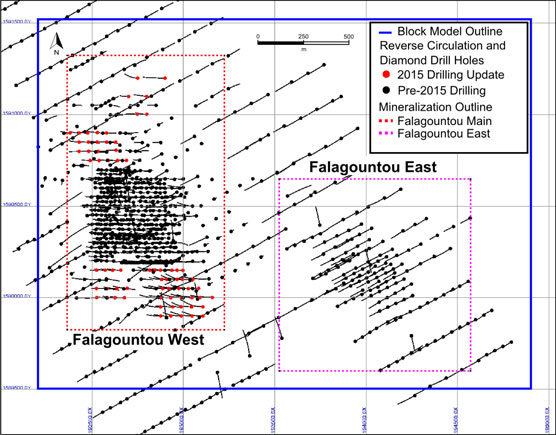
| IAMGOLD Corporation - Essakane Gold Mine Technical Report NI 43-101 – February 17, 2016 |
Page 14-42 |
TABLE 14-23 TYPES OF HOLES USED FOR THE RESOURCE ESTIMATE
| Hole Type |
Year | Series | Number of Holes |
Metres Drilled | ||||
| DDH |
2015 | MFDD0103 - MFDD112 | 10 | 13,652 | ||||
| 2014 | MFDD0013 - MFDD0102 | 90 | 1,727 | |||||
| 2012 | MFDD0001 - MFDD0012 | 12 | 3,440 | |||||
| 2011 | FDD0043 - FDD0068 | 26 | 5,780 | |||||
| 2008 | FDD0025 - FDD0042 | 18 | 2368 | |||||
| 2006 | FDD0016 - FDD0024 | 9 | 1,384 | |||||
| 2004 | FDD0012 - FDD0015 | 4 | 819 | |||||
| RC |
2015 | MFRC0245 - MFRC0320 | 77 | 10,894 | ||||
| 2014 | MFRC0131 - MFRC0244 | 116 | 10,135 | |||||
| 2013 | MFRC0042 - MFRC0130 | 89 | 11,239 | |||||
| 2012 | MFRC0001 - MFRC0041 | 41 | 3,769 | |||||
| FRC1908 - FRC0251 | 144 | 20,396 | ||||||
| 2011 | FRC1817 - FRC1907 | 91 | 12,497 | |||||
| 2010 | FRC1772 - FRC1816 | 45 | 6,742 | |||||
| 2008 | FRC1734 - FRC1771 | 38 | 2,822 | |||||
| 2006 | FRC1704 - FRC1730 | 27 | 3,405 | |||||
| FRC1732 - FRC1733 | 2 | 325 | ||||||
| 2004 | FRC0568 - FRC0571 | 4 | 300 | |||||
| FRC0635 - FRC0670 | 36 | 3,228 | ||||||
| FRC0780 - FRC0800 | 21 | 1,493 | ||||||
| FRC0901 - FRC0946 | 46 | 3,861 | ||||||
| 2003 | FRC0428 - FRC0429 | 2 | 215 | |||||
| FRC0467 - FRC0469 | 3 | 208 | ||||||
| FRC0478 - FRC0490 | 13 | 825 | ||||||
| 1995 | FRC0001 - FRC0003 | 3 | 139 | |||||
| RCD |
2006 | FRC1731D | 1 | 225 | ||||
| Total |
968 | 121,887 |
DRILL HOLE SPACING
The drill spacing covering the Falagountou West deposit illustrates a pattern, on vertical sections, between 15 m to 50 m. Drilling is mostly located along east-west sections with 25 m spacings in the centre of the deposit, and up to 50 m spacings on the northern and southern fringes where the 2015 drilling update took place. The vertical sections are perpendicular to mineralized horizons with a strike oriented along an approximate north-south axis.
Drill spacing on the Falagountou East deposit presents a sparser grid spacing compared to the Falagountou West deposit. Drill holes are spaced from 50 m to 75 m on sections. The
| IAMGOLD Corporation - Essakane Gold Mine Technical Report NI 43-101 – February 17, 2016 |
Page 14-43 |
25 m to 200 m spaced sections are oriented at 060° and are perpendicular to mineralization, which strikes along a 150°-330° axis.
Drill hole spacings on the Falagountou East and West deposits are judged adequate to develop a reasonable model of the mineralization distribution and to quantify its volume and quality with an acceptable level of confidence. A cross-section example of both areas is presented in Figure 14-14.
FIGURE 14-14 DRILL HOLE GRID SPACING FOR FALAGOUNTOU WEST AND EAST DEPOSITS
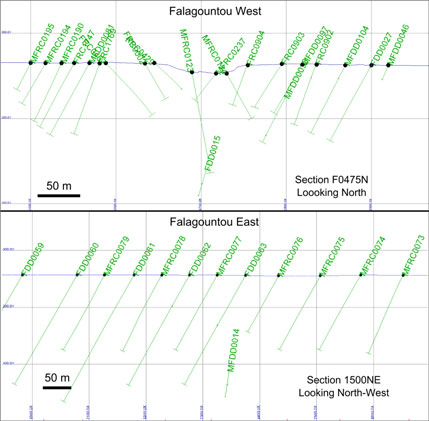
MODELLING
Numerous 2D and 3D modelling elements such as lithology, weathering, and mineralization solids were generated for the purpose of the current resource estimate using GEOVIA GEMS version 6.7.2.
| IAMGOLD Corporation - Essakane Gold Mine Technical Report NI 43-101 – February 17, 2016 |
Page 14-44 |
LITHOLOGY SOLIDS
For the Falagountou West deposit, two intrusive solids were designed from the lithological information found in the database. On each section, the intrusive rock contour was drawn and from this series of contour lines, the Main intrusive and Satellite intrusive solids were generated (Figure 14-15). The folded contact between intrusive and sedimentary rocks guided the shape of the mineralization zones. The 2015 drilling update allowed the rock model to be refined, as well as to extend the solid modelling. Rock codes utilized in the geological model are presented in Table 14-24.
FIGURE 14-15 INTRUSIVE SOLID - FALAGOUNTOU WEST DEPOSIT
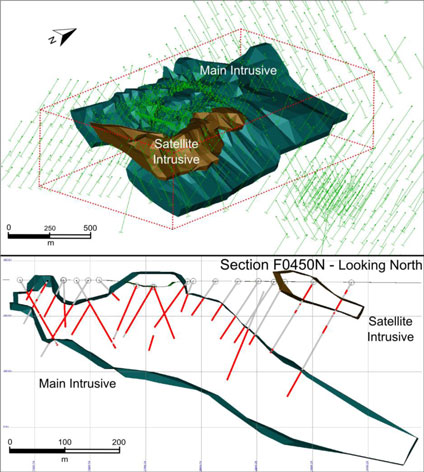
| IAMGOLD Corporation - Essakane Gold Mine Technical Report NI 43-101 – February 17, 2016 |
Page 14-45 |
TABLE 14-24 ROCK CODE DESCRIPTION
| Rock Code | Description | |
| 5 |
Air | |
| 9 |
Overburden | |
| 1000 |
Sediments | |
| 2000 |
Main Intrusive | |
| 2100 |
Satellite Intrusive |
WEATHERING WIREFRAMES
For each DD, RC, and RCD hole in the database encompassed inside the Falagountou West and East deposits, points were created to mark the beginning and the end of the following weathering layers: regolith, saprolite, transition, and fresh rock. The weathering intervals were defined using the following information, in order of priority: density measurements, then hardness observations. The saprolite layer was limited to density measurements below 2.00 t/m3, while the transition layers were limited to density values between 2.00 and 2.55 t/m3. Where no density measurements were available, as with RC holes, the weathering contacts were determined from the hardness information. Brown’s rock strength classification, used to categorize the association between hardness and weathering, was presented previously in Table 14-5. Based on the relationships between density measurements and hardness information, GMSI has reclassified the S5-hardness in saprolite rather than transition.
The points defining the regolith bottom limit were created from the lithology information. A point was placed at the collar of the hole if the regolith interval was lacking. Regolith intervals were later merged with the saprolite layer.
Where necessary, the intervals of weathering were divided into sub layers to accommodate the density variation through the weathering type. The saprolite was kept as one single bed (Saprolite 1) as the layer is relatively thin and density values have little variation. The transition intervals were divided into three equal length sub layers: Transition 1, Transition 2, and Transition 3. The rock was separated into two beds: Rock 1 and Rock 2. The limit between Rock 1 and Rock 2 was established at 20 m below the bottom limit of the Transition 3 (or contact between Transition and Rock) sublayer.
| IAMGOLD Corporation - Essakane Gold Mine Technical Report NI 43-101 – February 17, 2016 |
Page 14-46 |
The weathering surfaces were created from their specific set of points except for Rock 1 surface, which was generated by copying the Transition 3 surface down 20 m and the Rock 2 bottom surface which is a flat surface located below the deepest hole.
As a last step, solids were constructed from the surfaces. Table 14-25 and Figure 14-16 summarizes the procedure of the construction of the weathering solids.
TABLE 14-25 SUMMARY OF THE MANIPULATIONS EXECUTED TO CREATE
THE WEATHERING SOLIDS
| Weathering Layer |
Density Measurements Limits (t/m3) |
Code | Hardness Category |
Creation Method | ||||
| Regolith | - | 6000 | - | Points from Lithology g Surface g Solid | ||||
| Saprolite 1 | 0 to 2.00 | 6000 | S1, S2, S3, S4, S5 |
Points from Density and/or Hardness g Surface g Solid | ||||
| Transition 1 | 2.00 to 2.55 | 6100 | S6, R0, R1 |
Points resulting from Transition interval division g Surface g Solid | ||||
| Transition 2 | 6200 | Points resulting from Transition interval division g Surface g Solid | ||||||
| Transition 3 | 6300 | Points from Density and/or Hardness g Surface g Solid | ||||||
| Rock 1 | > 2.55 | 6400 | R2, R3, R4, R5, R6 |
Transition 3 Surface copied down 20 m g Solid | ||||
| Rock 2 | 6500 | Flat Surface at Elevation -700 m g Solid |
| IAMGOLD Corporation - Essakane Gold Mine Technical Report NI 43-101 – February 17, 2016 |
Page 14-47 |
FIGURE 14-16 ILLUSTRATION OF WEATHERING SOLIDS CREATION TECHNIQUES
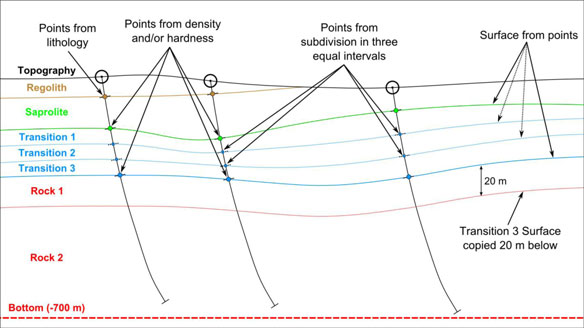
MINERALIZATION ZONES
The mineralization zones were designed based on the structure of the geology and on the gold assay results. Gold assay grades above 0.5 g/t Au were included in the zones and gold grades below 0.5 g/t Au were preferably left outside of the zones. The minimum thickness of the zones was modeled at approximately three metres. Only the DD holes and the RC holes were used for the modelling of the zones. The zones were drawn on each section, smoothed, revised for consistency through sections, and linked together by tie lines to create solids. All previous mineralization zones have been revised and updated in order to be used in the current resource estimate.
More specifically, in the Falagountou West deposit, the folded contact between the sedimentary and intrusive rocks served as a guideline for drawing the mineralization units. A total of eleven mineralized envelopes were modeled. On average, the zones are 3 m to 9 m thick (see Table 14-26). Figure 14-17 illustrates all zones in the Falagountou West deposit. The 2015 drilling update extended the great majority of the mineralization zones towards the south and also provided enough information to add a small new zone (245).
| IAMGOLD Corporation - Essakane Gold Mine Technical Report NI 43-101 – February 17, 2016 |
Page 14-48 |
In the Falagountou East deposit, the mineralization envelopes were designed to follow the structure of the sedimentary beds. A series of 26 parallel sheet-like zones dipping 25 degrees towards 060° were modelled. The average thickness of the zones is approximately 6 m (see Table 14-27). Each zone was identified with a unique rock code number from 310 to 335 inclusively and are displayed in Figure 14-18.
In both Falagountou deposits, the mineralization 3D envelopes were used as hard boundaries to constrain the interpolation of the gold grades.
TABLE 14-26 ROCK CODES AND AVERAGE THICKNESS - FALAGOUNTOU WEST DEPOSIT
| Zone | Average Thickness (m) | |
| 220 |
3.64 | |
| 230 |
3.87 | |
| 240 |
4.55 | |
| 245 |
5.79 | |
| 250 |
5.95 | |
| 255 |
8.56 | |
| 260 |
5.14 | |
| 270 |
6.20 | |
| 275 |
3.37 | |
| 280 |
3.39 | |
| 290 |
3.63 |
| IAMGOLD Corporation - Essakane Gold Mine Technical Report NI 43-101 – February 17, 2016 |
Page 14-49 |
FIGURE 14-17 MINERALIZATION ZONES - FALAGOUNTOU WEST DEPOSIT
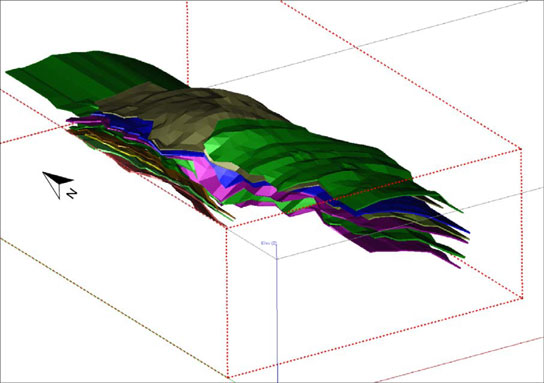
TABLE 14-27 ROCK CODES AND AVERAGE THICKNESS - FALAGOUNTOU EAST DEPOSIT
| Zone | Average Thickness (m) |
Zone | Average Thickness (m) | |||
| 310 | 4.17 | 323 | 7.23 | |||
| 311 | 3.92 | 324 | 7.51 | |||
| 312 | 3.11 | 325 | 5.52 | |||
| 313 | 6.38 | 326 | 4.35 | |||
| 314 | 5.86 | 327 | 8.27 | |||
| 315 | 8.09 | 328 | 5.00 | |||
| 316 | 11.25 | 329 | 4.83 | |||
| 317 | 7.87 | 330 | 7.00 | |||
| 318 | 3.02 | 331 | 5.06 | |||
| 319 | 5.27 | 332 | 5.02 | |||
| 320 | 3.88 | 333 | 8.50 | |||
| 321 | 4.64 | 334 | 10.83 | |||
| 322 | 1.52 | 335 | 4.37 |
| IAMGOLD Corporation - Essakane Gold Mine Technical Report NI 43-101 – February 17, 2016 |
Page 14-50 |
FIGURE 14-18 MINERALIZATION ZONES - FALAGOUNTOU EAST DEPOSIT
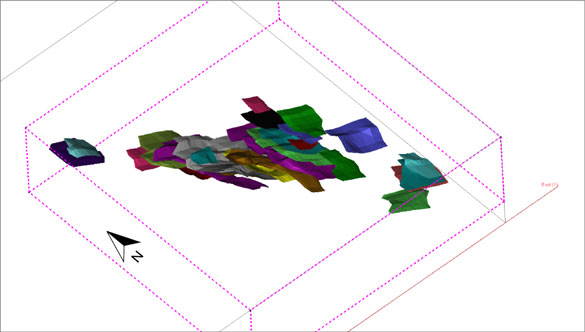
TOPOGRAPHY SURFACE
A topographic surface was provided to GMSI for the resource estimation of the Falagountou deposit. The surface named Topo Clip 27Aout12 covers most of the block model area apart for a small portion in the northeast, where no drilling is present. Blocks from the model were updated using this surface. GMSI also imported the Status Mined Surface as of December 31, 2015 for the Falagountou West deposit and used that surface to evaluate the resource remaining as at December 31, 2015.
STATISTICAL ANALYSIS
STATISTICS OF THE RAW-ASSAYS
Statistics of the raw Au assays were computed using GSLIB, a geostatistical program. Statistics were studied for assays grouped by mineralization domains for the Falagountou West deposit (Table 14-28) and as a single collection of zone for the Falagountou East deposit (at the end of Table 14-38).
Of the 11 zones of the Falagountou West deposit and based on raw assays contained within them, three zones can be labelled as “high-grade”, with mean gold grades ranging from 1.20 to 1.77 g/t Au (Zones 250, 255 and 270). Only two zones, 230 and 260, have mean gold
| IAMGOLD Corporation - Essakane Gold Mine Technical Report NI 43-101 – February 17, 2016 |
Page 14-51 |
grades close to the modelling cut-off grade of 0.50 g/t Au. The frequency histograms and the cumulative probability plot curves (see Figure 14-19 for graphs of zones 250 and 255) show that most of the zones display a near log-normal distribution. Upon further examination of statistical populations, two populations can be interpreted with a break around 0.50 g/t Au for most of the zones. The Falagountou East deposit encompasses many smaller zones compared to the Falagountou West deposit, with an average gold grade of 1.48 g/t Au.
TABLE 14-28 STATISTICS OF AU ASSAYS BY MINERALIZED ZONE - FALAGOUNTOU WEST AND EAST DEPOSITS
| Zone | # of Assays |
Gold Raw Assays (g/t Au) | CoV | Average Thickness (m) | ||||||||||||
| Min | Max | Average | Median | Standard Deviation |
||||||||||||
| 220 |
272 | 0.01 | 21.4 | 0.61 | 0.05 | 1.79 | 2.94 | 3.64 | ||||||||
| 230 |
596 | 0.01 | 21.9 | 0.47 | 0.06 | 1.46 | 3.08 | 3.87 | ||||||||
| 240 |
1,053 | 0.01 | 28.8 | 0.76 | 0.17 | 2.06 | 2.71 | 4.55 | ||||||||
| 245 |
160 | 0.01 | 21.0 | 0.84 | 0.18 | 2.14 | 2.55 | 5.79 | ||||||||
| 250 |
1,765 | 0.01 | 94.8 | 1.20 | 0.39 | 3.80 | 3.17 | 5.95 | ||||||||
| 255 |
3,377 | 0.01 | 97.2 | 1.77 | 0.65 | 4.26 | 2.40 | 8.56 | ||||||||
| 260 |
1,076 | 0.01 | 27.7 | 0.57 | 0.08 | 1.49 | 2.61 | 5.14 | ||||||||
| 270 |
607 | 0.01 | 37.2 | 1.76 | 0.63 | 3.59 | 2.04 | 6.20 | ||||||||
| 275 |
150 | 0.01 | 27.2 | 0.95 | 0.24 | 2.68 | 2.82 | 3.37 | ||||||||
| 280 |
244 | 0.01 | 25.1 | 0.78 | 0.11 | 2.42 | 3.08 | 3.39 | ||||||||
| 290 |
201 | 0.01 | 16.9 | 1.00 | 0.44 | 1.86 | 1.86 | 3.63 | ||||||||
| Falagountou East 310 - 335 |
1,685 | 0.01 | 100.0 | 1.48 | 0.30 | 4.82 | 3.27 | 6.42 | ||||||||
| IAMGOLD Corporation - Essakane Gold Mine Technical Report NI 43-101 – February 17, 2016 |
Page 14-52 |
FIGURE 14-19 HISTOGRAMS AND CUMULATIVE PROBABILITY PLOTS FOR
ZONES 250 AND 255
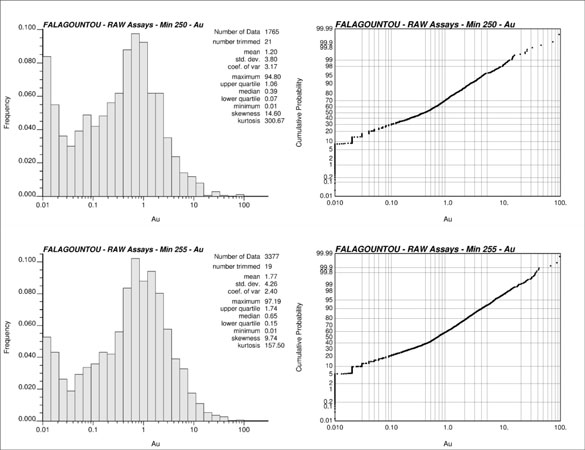
Based on the study of the effect of high grade values on the mean and standard deviation, and from probability and histogram plots, GMSI applied various capping limits depending on the mineralized zone for the Falagountou West deposit and as a single population for the Falagountou East deposit. Table 14-29 tabulates the capping levels used on the raw-assays. Capping values for the Falagountou West deposit range from 6.0 to 40.0 g/t Au and all domains at the Falagountou East deposit were capped at 30.0 g/t Au.
| IAMGOLD Corporation - Essakane Gold Mine Technical Report NI 43-101 – February 17, 2016 |
Page 14-53 |
TABLE 14-29 GOLD CAPPING VALUES
| Zone | Capping (g/t Au) |
No. of Assays Capped |
Metal Capped | |||
| 220 |
6.0 | 3 | 16% | |||
| 230 |
6.0 | 8 | 11% | |||
| 240 |
10.0 | 9 | 9% | |||
| 245 |
10.0 | 2 | 9% | |||
| 250 |
20.0 | 8 | 9% | |||
| 255 |
40.0 | 5 | 3% | |||
| 260 |
10.0 | 4 | 5% | |||
| 270 |
15.0 | 10 | 7% | |||
| 275 |
10.0 | 2 | 14% | |||
| 280 |
10.0 | 3 | 16% | |||
| 290 |
10.0 | 2 | 3% | |||
| Falagountou East 310 to 335 |
30.0 | 4 | 7% |
COMPOSITING
The capped raw assays were composited into 2.5 m run lengths (down-hole) within each domain coded in the drill hole database. Each composite was coded using the domain’s code from the corresponding domain, as well as the appropriate weathering profile code. Composites measuring less than 0.5 m in length were removed from the database (e.g. composites created at the end of a domain).
STATISTICS OF THE COMPOSITES
A statistical analysis was undertaken to describe the characteristics of the gold grades within each of the mineralized zones, and to assess the need for limiting the influence of very high grade assays during interpolation. The statistics of the 2.5 m composites, within the mineralized domains of the Falagountou West deposit, are summarized in Table 14-30. Statistics of composites for the Falagountou East deposit were grouped in a single population and are summarized at the end of Table 14-30.
| IAMGOLD Corporation - Essakane Gold Mine Technical Report NI 43-101 – February 17, 2016 |
Page 14-54 |
TABLE 14-30 STATISTICS OF COMPOSITES BY MINERALIZED ZONE - FALAGOUNTOU WEST AND EAST DEPOSITS
| Zone | # of Composites |
Gold Composites (g/t Au) | CoV | |||||||||||
| Min | Max | Average | Median | Standard Deviation |
||||||||||
| 220 |
159 | 0.01 | 6.00 | 0.45 | 0.14 | 0.79 | 1.77 | |||||||
| 230 |
360 | 0.01 | 5.00 | 0.38 | 0.09 | 0.74 | 1.95 | |||||||
| 240 |
606 | 0.01 | 10.0 | 0.63 | 0.28 | 1.07 | 1.68 | |||||||
| 245 |
87 | 0.01 | 4.66 | 0.63 | 0.29 | 0.93 | 1.48 | |||||||
| 250 |
923 | 0.01 | 20.0 | 1.06 | 0.50 | 1.83 | 1.73 | |||||||
| 255 |
1,653 | 0.01 | 24.7 | 1.63 | 0.83 | 2.48 | 1.52 | |||||||
| 260 |
555 | 0.01 | 6.24 | 0.51 | 0.16 | 0.86 | 1.67 | |||||||
| 270 |
247 | 0.05 | 12.1 | 1.79 | 0.99 | 2.12 | 1.18 | |||||||
| 275 |
61 | 0.05 | 6.33 | 1.05 | 0.58 | 1.38 | 1.31 | |||||||
| 280 |
128 | 0.01 | 5.05 | 0.62 | 0.19 | 1.02 | 1.66 | |||||||
| 290 |
81 | 0.06 | 9.30 | 1.20 | 0.75 | 1.45 | 1.21 | |||||||
| Falagountou East 310 to 335 |
847 | 0.01 | 22.5 | 1.33 | 0.50 | 2.46 | 1.85 | |||||||
DENSITY DATA
The database includes specific gravity measurements for 5,210 samples. Table 14-31 summarizes the basics statistics used to establish the density model. To avoid the influence of outliers, the median value was judged as a good representation of background values for these weathering horizons.
TABLE 14-31 STATISTICS OF SPECIFIC GRAVITY SAMPLES
| Weathering Profile |
Code | Number of Measurements |
Median (t/m3) |
Average (t/m3) | ||||
| Saprolite |
6000 | 115 | 1.87 | 1.87 | ||||
| Trans-1 |
6100 | 109 | 2.08 | 2.12 | ||||
| Trans-2 |
6200 | 112 | 2.29 | 2.27 | ||||
| Trans-3 |
6300 | 144 | 2.38 | 2.35 | ||||
| Rock-1 |
6400 | 638 | 2.69 | 2.67 | ||||
| Rock-2 |
6500 | 4,092 | 2.74 | 2.74 |
VARIOGRAPHY
Grade variography was generated in preparation for the estimation of gold grades with OK and to assess the spatial dependence of samples. The variography was based on the 2.5 m down-hole composite for all data and for all mineralization zones in the Falagountou West deposit and into one single group of samples for the Falagountou East deposit. Sage 2001® geostatistical software was used to perform the analysis.
| IAMGOLD Corporation - Essakane Gold Mine Technical Report NI 43-101 – February 17, 2016 |
Page 14-55 |
For the Falagountou West deposit, considering the geometry of the mineralized zones, a series of correlograms were generated from the capped gold grades every 30 degrees azimuth and at a single flat dip and for each of the zones. The optimal anisotropy directions were determined through regression by Sage 2001®. The minimum number of composite pairs required for variography was 10. The variography model included a nugget effect and two spherical structures. All zones were grouped together to generate a global model. The global variogram model results are summarized in Table 14-32.
For the Falagountou East deposit, a series of correlograms was generated from the capped gold grades every 30 degrees azimuth and at 30 degrees dip increments. The optimal anisotropy directions were determined through regression by Sage 2001®. The minimum number of composite pairs required for variography was 10. The variography model included a nugget effect and two spherical structures. The global variogram model results are summarized in Table 14-32.
TABLE 14-32 VARIOGRAM MODELS FOR GOLD CAPPED COMPOSITES - FALAGOUNTOU WEST AND EAST DEPOSITS
| Deposit | Semi- Profile |
Ranges of Influence (m) | ||||||||||||||||||||||||
| 1st Structure | 2nd Structure | Rotation | ||||||||||||||||||||||||
| Name | Nugget | X | Y | Z | Sill | X | Y | Z | Sill | Z | Y | Z | ||||||||||||||
| Falagountou West |
OK2015 | 0.65 | 20 | 20 | 10 | 0.25 | 125 | 125 | 25 | 0.10 | 0 | 0 | 0 | |||||||||||||
| Falagountou East |
EAST2015 | 0.855 | 35 | 20 | 10 | 0.105 | 125 | 125 | 25 | 0.040 | 0 | 35 | 0 | |||||||||||||
BLOCK MODELLING
Two block models were constructed containing both the Falagountou West and Falagountou East deposits. The block models cover an area large enough to manage pit optimizations and associated pit slopes. The block models were built using GEOVIA GEMS version 6.7.2.
BLOCK MODEL PARAMETERS
The drilling pattern, the thickness of the zones, and the open pit mine planning consideration guided the choice of block dimensions. The block model parameters are summarized in Table 14-33.
| IAMGOLD Corporation - Essakane Gold Mine Technical Report NI 43-101 – February 17, 2016 |
Page 14-56 |
TABLE 14-33 BLOCK MODELS SETTINGS
| Axis | Origin and Rotation | Block Size | Number of Blocks | |||||
| (m) | (m) | |||||||
| X | 192,200 | 10 | 270 | Columns | ||||
| Y | 1,589,500 | 15 | 135 | Rows | ||||
| Z | 350 | 5 | 70 | Level | ||||
| Rotation | 0 | |||||||
Additionally, a series of attributes, required during the block model development, were incorporated into the block model project. Table 14-34 presents the list of attributes found in the block model projects FALA_Dec2015 and EAST_Dec2015 in the standard folder.
TABLE 14-34 LIST OF ATTRIBUTES FOUND IN THE BLOCK MODELS
| Folder Name |
Model Name | Description | ||
| Standard | Alt Type | Weathering profile coding (saprolite, transition, rock) | ||
| Min Type | Domain coding (mineralized zones) | |||
| Rock Type | Geological coding (intrusive, sedimentary, overburden) | |||
| Density | Specific gravity | |||
| AuCapFINAL | Inverse Distance Cubed gold grades (g/t) | |||
| AuCap ID2 | Inverse Distance Squared gold grades (g/t) | |||
| AuCap OK | Ordinary Kriging gold grades (g/t) | |||
| AuCap NN | Inverse Distance power 20 gold grades (g/t) | |||
| Pass | Interpolation pass (AuCapFINAL) | |||
| CATEG | Resource categorization | |||
| KRIGVAR | Ordinary Kriging variance (AuCap OK) | |||
ROCK TYPE MODEL
The rock type model, or domain coding, relied on the rock coding associated with the multiple wireframes for the Falagountou West and East deposits which were designed based on the structure of the geology and on the gold assay results and acted as hard boundaries.
DENSITY MODEL
In conjunction with the weathering profiles discussed earlier and density statistics, the density was populated in the block model in a two-step manner.
First, all specific gravity samples were assigned a weathering code depending on their 3D location within the weathering solids. Secondly, blocks in the model were assigned a
| IAMGOLD Corporation - Essakane Gold Mine Technical Report NI 43-101 – February 17, 2016 |
Page 14-57 |
background value related to their weathering profile and equal to the median density value, as tabulated in Table 14-35. Since all new drilling occurred in the Falagountou West deposit, background values from the March 2015 resource estimate were kept the same for the Falagountou East deposit; only the weathering surfaces underwent minor changes. Once all blocks in the model were set a background value, an interpolation profile was set up to estimate the block densities in the vicinity of the density measurements. The results were stored in a separate attribute. Parameters used in this single interpolation run are summarized in Table 14-36. The final density value is obtained by the combination of these two density calculation techniques, with a higher precedence to those values estimated by interpolation.
TABLE 14-35 BACKGROUND DENSITY VALUES USED IN THE MODEL
| Weathering Profile |
Code | Density (t/m3) | ||||
| Falagountou West |
Falagountou East | |||||
| Saprolite |
6000 | 1.87 | 1.86 | |||
| Trans-1 |
6100 | 2.08 | 2.03 | |||
| Trans-2 |
6200 | 2.29 | 2.25 | |||
| Trans-3 |
6300 | 2.38 | 2.36 | |||
| Rock-1 |
6400 | 2.69 | 2.68 | |||
| Rock-2 |
6500 | 2.74 | 2.74 | |||
TABLE 14-36 DENSITY INTERPOLATION PARAMETERS
| Parameter | Interpolation Method | |
| Calculation Method |
Inverse Distance Squared | |
| Point-Area Workspace |
Dens/DENS_Oct2015 | |
| Search Ellipse |
25 m x 25 m x 5 m | |
| Target Rock Codes |
6000 to 6500 inclusively | |
| Minimum Number of Samples |
1 | |
| Maximum Number of Samples |
12 | |
| Outliers excluded |
Below 1.0 and above 5.0 t/m3 |
A summary of basic statistics of block model density values for all weathering profiles is displayed in Table 14-37. All Transition-1 material was transferred in the saprolite weathering profile based on field observations. All blocks with 99% of their volume above the topography surface were coded as “Air”, with a density of 0.0 t/m3.
| IAMGOLD Corporation - Essakane Gold Mine Technical Report NI 43-101 – February 17, 2016 |
Page 14-58 |
TABLE 14-37 BASIC STATISTICS OF BLOCK MODEL DENSITY BY
WEATHERING PROFILE
| Weathering Profile |
Specific Gravity | |||||||||||||||
| Code | Minimum (t/m3) |
Maximum (t/m3) |
Average (t/m3) |
|||||||||||||
| Regolith/Saprolite |
6000-6100 | 1.43 | 2.89 | 1.96 | ||||||||||||
| Transition |
6200-6300 | 1.43 | 2.89 | 2.34 | ||||||||||||
| Rock |
6400-6500 | 1.73 | 3.00 | 2.74 | ||||||||||||
GRADE ESTIMATION METHODOLOGY
The final interpolation method selected for the Falagountou deposits is Inverse Distance Cubed (ID3). Ordinary Kriging (OK), Inverse Distance Squared (ID2), and Nearest Neighbour (NN or ID20) methods were also tested to compare with the ID3 method. The ID3 method was judged to be the most suitable to replicate composite grades throughout the Falagountou West and Falagountou East deposits.
Grade estimates were generated using the 2.5 m composites. Mineralized domains were considered as hard boundaries through each interpolation step. A block being interpolated used only composites from within its corresponding domain. Geovia® GEMS 6.7.2 software was used for the estimate.
The sample search approach used to estimate the blocks for the Falagountou West and Falagountou East deposits is summarized below:
| ● | First Pass: A minimum of seven and a maximum of 30 composites within the search ellipse ranges. A maximum of three composites per hole could be used for any block estimate. |
| ● | Second Pass: A minimum of three and a maximum of 30 composites within the search ellipse ranges. A maximum of two composites per hole could be used for any block estimate. Only blocks which were not estimated during the first pass could be estimated during the second pass. |
| ● | Third Pass: A minimum of one and a maximum of 30 composites within the search ellipse ranges. A maximum of two composites per hole could be used for any block estimate. Only blocks which were not estimated during the first and second pass could be estimated during the third pass. |
For the first, second, and third passes, restrictions on the search ellipse ranges were applied on very high grade composites to limit their influence. This measure is judged to be prudent since the continuity of the higher grade values, within the domains, is still to be confirmed.
| IAMGOLD Corporation - Essakane Gold Mine Technical Report NI 43-101 – February 17, 2016 |
Page 14-59 |
This limit, or high grade threshold, ensures that the higher grade composites are only selected within the ranges of the half search ellipse before being used for the interpolation estimation. For the Falagountou East deposit, only X and Y ranges were reduced to half distance, keeping the Z ranges the same in order to be consistent with the more flat and uniform shape of mineralized zones. The high grade thresholds were chosen based on the statistical analysis of the 2.5 m composites presented earlier.
The various profiles of interpolation and search ellipses for gold composites utilized in the estimation of the resources are tabulated in Tables 14-38 to 14-40 for the Falagountou West deposit and in Tables 14-38 and 14-41 for the Falagountou East deposit. The high grade thresholds affecting the ranges of the search ellipsoid are presented by domains in Table 14-42 (Falagountou West deposit only). A single high grade transition value of 15 g/t Au was used for all domains of the Falagountou East deposit.
TABLE 14-38 INTERPOLATION PROFILE SETTINGS
| Deposit | Profile |
Sample |
Target Rock Code |
Ellipses Name | ||||||||||||
| Pass | Min | Max | Max per Hole | |||||||||||||
| WEST |
AUCAP_P1 | 1 | 7 | 30 | 3 | See List of Rock Codes |
See Table Naming of Search Ellipse Profiles (Table 14-39) | |||||||||
| AUCAP_P2 | 2 | 3 | 30 | 2 | ||||||||||||
| AUCAP_P2 | 3 | 1 | 30 | 2 | ||||||||||||
| EAST |
AUEAST_1 | 1 | 7 | 30 | 3 | 310 to 335 |
EAST_1 | |||||||||
| AUEAST_2 | 2 | 3 | 30 | 2 | EAST_2 | |||||||||||
| AUEAST_3 | 3 | 1 | 30 | 2 | EAST_3 | |||||||||||
| IAMGOLD Corporation - Essakane Gold Mine Technical Report NI 43-101 – February 17, 2016 |
Page 14-60 |
TABLE 14-39 SEARCH ELLIPSE NAMES - FALAGOUNTOU WEST DEPOSIT
| Rock Codes |
Ellipse Profile | |||||
| Pass 1 | Pass 2 | Pass 3 | ||||
| 220 | 220_1 | 220_2 | 220_3 | |||
| 230 | 230_1 | 230_2 | 230_3 | |||
| 240 | 240_1 | 240_2 | 240_3 | |||
| 245 | 245_1 | 245_2 | 245_3 | |||
| 250 | 250_1 | 250_2 | 240_3 | |||
| 255 | 255_1 | 255_2 | 255_3 | |||
| 260 | 260_1 | 260_2 | 260_3 | |||
| 270 | 270_1 | 270_2 | 270_3 | |||
| 275 | 275_1 | 275_2 | 275_3 | |||
| 280 | 280_1 | 280_2 | 280_3 | |||
| 290 | OMNI_1 | OMNI_2 | OMNI_3 | |||
TABLE 14-40 SEARCH ELLIPSOID SETTINGS - FALAGOUNTOU WEST DEPOSIT
| Ellipse Profile Name(2) |
Pass |
Rotation | Anisotropy Range (m) | High Grade Range (m)(1) | ||||||||||||||||
| Z | X | Z | X | Y | Z | X | Y | Z | ||||||||||||
| ###_1 |
1 | 0 | 0 | 0 | 25 | 25 | 25 | 12.5 | 12.5 | 12.5 | ||||||||||
| ###_2 |
2 | 50 | 50 | 50 | 25 | 25 | 25 | |||||||||||||
| ###_3 |
3 | 100 | 100 | 100 | 50 | 50 | 50 | |||||||||||||
Notes:
| 1. | Refer to Table 14-42 for High Grade Transition Limit |
| 2. | Refer to Table 14-39 for Profile Names |
TABLE 14-41 SEARCH ELLIPSOID SETTINGS - FALAGOUNTOU EAST DEPOSIT
| Ellipse Profile Name |
Rotation | Anisotropy Range (m) |
High Grade |
High Grade Range (m) | ||||||||||||||||||
| Pass | Z | X | Z | X | Y | Z | X | Y | Z | |||||||||||||
| EAST_1 |
1 | 0 | 35 | 0 | 25 | 25 | 10 | 15.0 | 12.5 | 12.5 | 10 | |||||||||||
| EAST_2 |
2 | 50 | 50 | 20 | 25 | 25 | 20 | |||||||||||||||
| EAST_3 |
3 | 100 | 100 | 30 | 50 | 50 | 30 | |||||||||||||||
| IAMGOLD Corporation - Essakane Gold Mine Technical Report NI 43-101 – February 17, 2016 |
Page 14-61 |
TABLE 14-42 HIGH GRADE TRANSITION VALUES USED IN THE SEARCH
ELLIPSE PROFILES - FALAGOUNTOU WEST DEPOSIT
| Rock Codes |
High Grade Transition (g/t Au) | |
| 220 | 2.00 | |
| 230 | 4.00 | |
| 240 | 5.50 | |
| 245 | 4.00 | |
| 250 | 8.00 | |
| 255 | 15.00 | |
| 260 | 6.00 | |
| 270 | 7.50 | |
| 275 | 6.00 | |
| 280 | 4.50 | |
| OMNI | - |
CLASSIFICATION AND RESOURCE REPORTING
The Mineral Resource estimate was classified in accordance with the CIM definitions (see “Classification and Resource Reporting” under “EMZ Deposit”).
In addition, the classification of interpolated blocks was undertaken by considering the following criteria:
| ● | Quality and reliability of drilling and sampling data. |
| ● | Distance between sample points (drilling density). |
| ● | Confidence in the geological interpretation. |
| ● | Continuity of the geologic structures and the continuity of the grade within these structures. |
| ● | Variogram models and their related ranges (first and second structures). |
| ● | Statistics of the data population. |
| ● | Quality of assay data. |
| ● | Tonnage factor |
The resources were classified according to the above mentioned criteria which also directed the choice of the search parameters for each interpolation pass during the block estimation.
| IAMGOLD Corporation - Essakane Gold Mine Technical Report NI 43-101 – February 17, 2016 |
Page 14-62 |
No Measured Mineral Resources are estimated in the Falagountou West and Falagountou East deposits. Indicated Mineral Resources are the blocks estimated from the first and second passes. Inferred Mineral Resources are the blocks estimated from the third pass.
Figure 14-20 shows how the Mineral Resource categories are distributed in the Falagountou West deposit. Indicated Mineral Resources are essentially concentrated in the centre of the mineralization domains and form the bulk of the unconfined mineralization, where the drill hole density is the highest. Inferred Mineral Resources are peripheral to Indicated Mineral Resources and are mainly limited to the eastern extremity of the mineralization domains at depth, where drilling density is the lowest.
FIGURE 14-20 RESOURCE CATEGORIES - FALAGOUNTOU WEST DEPOSIT
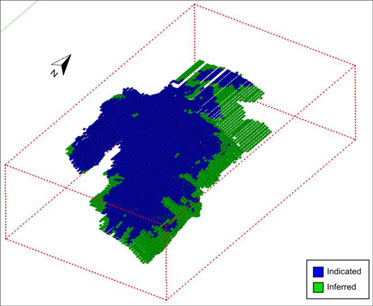
Figure 14-21 shows how the Mineral Resource categories are distributed in the Falagountou East deposit. Indicated Mineral Resources make up the great majority of interpolated blocks (approximately 80% of interpolated blocks). Inferred Mineral Resources are mostly limited to the edges of the mineralization domains, as well as to the north-western satellite zone near surface.
| IAMGOLD Corporation - Essakane Gold Mine Technical Report NI 43-101 – February 17, 2016 |
Page 14-63 |
FIGURE 14-21 RESOURCE CATEGORIES - FALAGOUNTOU EAST DEPOSIT

BLOCK MODEL VALIDATION
Validation was completed on both the Falagountou West and Falagountou East deposits block models. The validation process included visual checks, statistical validation of the model, comparison with models built from other interpolation methods, and swath plots.
VISUAL VALIDATION
The visual checks consisted of visualizing slices of the block model, mineralized zones, and drill hole database. The slicing was performed vertically on 25 m intervals and horizontally on 5 m intervals. The data source was visually compared with the different model attributes (rock type, weathering type, mineralization zone, density, and gold grades) throughout the strike length of the deposit. The mineralized domains, the weathering profile layers, and the rock types are well represented in their proper attribute model. The ID3 based Mineral Resource estimate was found to be a good representation of the drill hole composites.
STATISTICAL VALIDATION
A statistical analysis between composites used in the interpolation and interpolated block grades was performed to evaluate if samples used in the estimation were well represented in the block model. Statistics were compiled for both the Falagountou West and Falagountou East deposits. Tables 14-43 and 14-44 summarize statistics between composite grades
| IAMGOLD Corporation - Essakane Gold Mine Technical Report NI 43-101 – February 17, 2016 |
Page 14-64 |
used in the interpolation process and grades of blocks interpolated for Falagountou West and Falagountou East deposits, in that order. Lower grades in the blocks of the models, compared to composites, are probably caused, in part, by the high grade transition applied to very high grade composites. Also, composites of lower grade in the periphery of mineralized zones may also influence a proportionally higher number of blocks, resulting in a lower global mean grade. This is partially demonstrated by a lower grade difference when comparing composite grades with grades from passes 1 and 2 only. Attempts were made to correct this potential bias. GMSI suggests waiting for robust reconciliation data before making any important modifications to the block model.
TABLE 14-43 AVERAGE COMPOSITE VERSUS BLOCK GRADES -
FALAGOUNTOU WEST DEPOSIT
| Zone | Number of Blocks |
Mean Composite Grade (g/t Au) |
Mean Block Grade (g/t Au) | |||
| 220 |
1,117 | 0.28 | 0.24 | |||
| 230 |
1,485 | 0.27 | 0.20 | |||
| 240 |
2,527 | 0.50 | 0.42 | |||
| 245 |
640 | 0.48 | 0.39 | |||
| 250 |
3,172 | 0.96 | 0.89 | |||
| 255 |
5,618 | 1.55 | 1.14 | |||
| 260 |
2,724 | 0.45 | 0.39 | |||
| 270 |
715 | 1.48 | 1.28 | |||
| 275 |
196 | 0.78 | 0.70 | |||
| 280 |
393 | 0.55 | 0.49 | |||
| 290 |
348 | 0.89 | 0.81 | |||
| Total |
18,935 | 0.93 | 0.72 |
| IAMGOLD Corporation - Essakane Gold Mine Technical Report NI 43-101 – February 17, 2016 |
Page 14-65 |
TABLE 14-44 AVERAGE COMPOSITE VERSUS BLOCK GRADES -
FALAGOUNTOU EAST DEPOSIT
| Zone | Number of Blocks |
Mean (g/t Au) |
Mean Block (g/t Au) |
Zone | Number of Blocks |
Mean (g/t Au) |
Mean Block (g/t Au) | |||||||
| 310 |
19 | 2.34 | 3.43 | 323 | 613 | 1.08 | 1.07 | |||||||
| 311 |
80 | 1.67 | 1.77 | 324 | 597 | 1.44 | 1.30 | |||||||
| 312 |
65 | 3.18 | 3.90 | 325 | 276 | 1.45 | 0.94 | |||||||
| 313 |
45 | 2.00 | 2.26 | 326 | 137 | 0.63 | 0.78 | |||||||
| 314 |
72 | 0.47 | 0.48 | 327 | 146 | 1.11 | 1.54 | |||||||
| 315 |
639 | 1.17 | 1.27 | 328 | 32 | 0.89 | 0.93 | |||||||
| 316 |
337 | 0.52 | 0.47 | 329 | 116 | 1.03 | 0.60 | |||||||
| 317 |
690 | 1.25 | 1.23 | 330 | 104 | 0.80 | 0.98 | |||||||
| 318 |
33 | 0.60 | 0.67 | 331 | 339 | 0.39 | 0.37 | |||||||
| 319 |
348 | 1.67 | 1.41 | 332 | 342 | 0.43 | 0.36 | |||||||
| 320 |
47 | 0.79 | 0.94 | 333 | 111 | 4.32 | 3.98 | |||||||
| 321 |
165 | 1.08 | 0.98 | 334 | 198 | 1.22 | 1.32 | |||||||
| 322 |
17 | 0.38 | 0.31 | 335 | 72 | 0.27 | 0.25 | |||||||
| Total |
5,640 | 1.16 | 1.12 |
VALIDATION USING DIFFERENT INTERPOLATION METHODS
The validation of the block model was also done using different interpolation methods: OK, ID2, and NN (or ID20). The same set of composites, search ellipses, and settings were used for the different interpolations and only the estimation method differed. Tables 14-45 and 14-46 present the results of confined resources with the OK interpolator as a comparison for the Falagountou West and Falagountou East deposits, respectively. While the ID3 method interpolates higher grades, the OK method yields more tonnage for a combined Measured, Indicated, and Inferred Mineral Resource difference of 6% of gold ounces in favour of the inverse distance technique. GMSI is of the opinion that the ID3 interpolation method is a better global estimator compared to the OK technique, given the globally higher grades.
| IAMGOLD Corporation - Essakane Gold Mine Technical Report NI 43-101 – February 17, 2016 |
Page 14-66 |
TABLE 14-45 COMPARISON OF ID3 VERSUS OK INTERPOLATIONS -
FALAGOUNTOU WEST DEPOSIT
| Weathering Zone |
Resource Category |
Au Cut- off Grade (g/t) |
Inverse Distance Cubed | Ordinary Kriging | ||||||||||||
| Tonnage (kt)
|
Au Grade (g/t) |
Gold (koz)
|
Tonnage (kt) |
Au Grade (g/t) |
Gold (koz)
| |||||||||||
| Saprolite |
Indicated Inferred |
0.39 | 107 | 1.46 | 5 | 111 | 1.29 | 5 | ||||||||
| 0 | 0.00 | 0 | 0 | 0.00 | 0 | |||||||||||
| Transition |
Indicated Inferred |
0.43 | 885 | 1.24 | 35 | 969 | 1.11 | 34 | ||||||||
| 14 | 0.64 | 0 | 14 | 0.82 | 0 | |||||||||||
| Rock |
Indicated Inferred |
0.48 | 9,995 | 1.61 | 517 | 10,505 | 1.44 | 485 | ||||||||
| 100 | 1.06 | 3 | 74 | 0.82 | 2 | |||||||||||
TABLE 14-46 COMPARISON OF ID3 VERSUS OK INTERPOLATIONS -
FALAGOUNTOU EAST DEPOSIT
| Weathering Zone |
Resource Category |
Au Cut- off Grade (g/t) |
Inverse Distance Cubed | Ordinary Kriging | ||||||||||||
| Tonnage (kt)
|
Au Grade (g/t) |
Gold (koz)
|
Tonnage (kt) |
Au Grade (g/t) |
Gold (koz)
| |||||||||||
| Saprolite |
Indicated Inferred |
0.39 | 285 | 2.00 | 18 | 297 | 1.90 | 18 | ||||||||
| 63 | 2.51 | 5 | 83 | 1.82 | 5 | |||||||||||
| Transition |
Indicated Inferred |
0.43 | 599 | 1.74 | 33 | 667 | 1.61 | 34 | ||||||||
| 107 | 3.48 | 12 | 114 | 2.90 | 11 | |||||||||||
| Rock |
Indicated Inferred |
0.48 | 3,420 | 1.68 | 185 | 3,913 | 1.45 | 183 | ||||||||
| 374 | 2.84 | 34 | 408 | 2.83 | 37 | |||||||||||
SWATH PLOTS
Swath plots were generated to assess the correlation between composites used in the interpolation of each block versus the total gold content estimated in the blocks. Swath plots were produced in vertical sections. This validation method works as a visual means to identify possible bias in the interpolation (e.g., a section with a significantly high gold content based on a low population of composites). In general, gold contained in each vertical section should correlate well with the amount of composite used in the interpolation.
Figures 14-22 and 14-23 illustrate swath plots for Indicated Mineral Resources by vertical sections for the Falagountou West and Falagountou East deposits, respectively (Inferred Mineral Resources being marginal). Swath plots were created by grouping saprolite, transition, and rock weathering profiles. Gold content is constrained by a Whittle shell and cut-off grades were applied accordingly. Peaks and lows in gold content generally match
| IAMGOLD Corporation - Essakane Gold Mine Technical Report NI 43-101 – February 17, 2016 |
Page 14-67 |
peaks and lows in composite frequency; no bias was found in the resource estimate in this regard.
FIGURE 14-22 SWATH PLOT OF INDICATED RESOURCES - FALAGOUNTOU
WEST
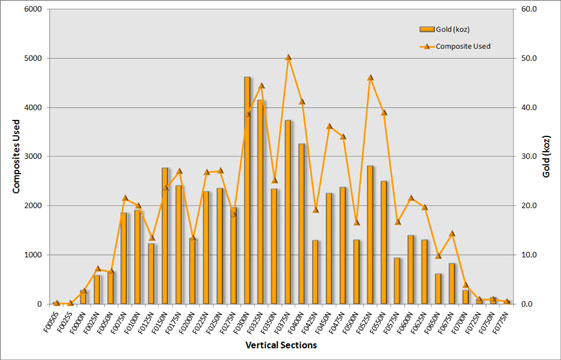
| IAMGOLD Corporation - Essakane Gold Mine Technical Report NI 43-101 – February 17, 2016 |
Page 14-68 |
FIGURE 14-23 SWATH PLOT OF INDICATED RESOURCES - FALAGOUNTOU
EAST
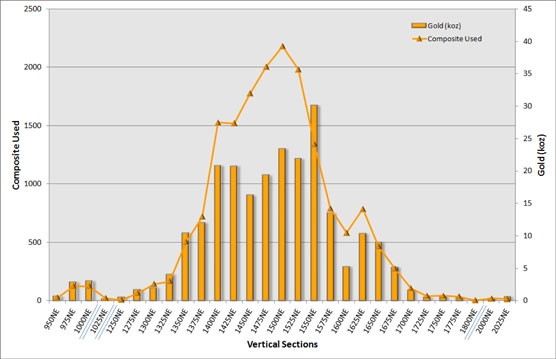
CONSTRAINED MINERAL RESOURCES
To establish a Mineral Resource estimate, an open pit development scenario is the most suitable due to the geology/geometry, tonnage, and grade of both the EMZ and Falagountou deposits. The deposit models were imported into Whittle to determine optimal pit shells based on the Lerchs-Grossmann algorithm. The method works on a block model of the orebody, and progressively constructs lists of related blocks that should, or should not, be mined. The method uses the values of the blocks to define a pit outline that has the highest possible economic value, subject to the required pit slopes defined as structure arcs in the software.
For resource reporting, all blocks classified as Indicated and Inferred were utilized in the pit optimization process.
| IAMGOLD Corporation - Essakane Gold Mine Technical Report NI 43-101 – February 17, 2016 |
Page 14-69 |
This analysis requires several input parameters such as slope constraints, gold prices, process recoveries, and operating costs. A cut-off grade for each weathering type of mineralized rocks (saprolite, transition, and rock) was determined in this process.
OPTIMIZATION PARAMETERS
Conceptual mining parameters used to calculate block values in Whittle for the EMZ and Falagountou deposits are presented in Section 15.
OPEN PIT CONSTRAINED MINERAL RESOURCES
The compilation of the Mineral Resource was carried out with the Status Mined Surfaces as of December 31, 2015 for the EMZ and Falagountou West deposits. The available topography surface (Topo/Clip/27Aout12) at the time of the current report was only used for the Falagountou East deposit.
The EMZ deposit open pit Indicated Mineral Resources are estimated to total of 122.5 Mt at an average grade of 1.07 g/t Au, totalling 4,230 koz of gold, including 263 koz of gold stored in stockpiles. The EMZ deposit open pit Inferred Mineral Resources are estimated to a total of 17.9 Mt at an average grade of 1.01 g/t Au, totalling 582 koz.
Gold grade distribution and resource categorization for the EMZ deposit are illustrated respectively in Figures 14-24 and 14-25.
| IAMGOLD Corporation - Essakane Gold Mine Technical Report NI 43-101 – February 17, 2016 |
Page 14-70 |
FIGURE 14-24 ISOMETRIC VIEW OF EMZ DEPOSIT GOLD GRADE
DISTRIBUTION INSIDE US$1,500/OZ WHITTLE PIT SHELL

FIGURE 14-25 ISOMETRIC VIEW OF EMZ DEPOSIT RESOURCE
CLASSIFICATION INSIDE US$1,500/OZ WHITTLE PIT SHELL
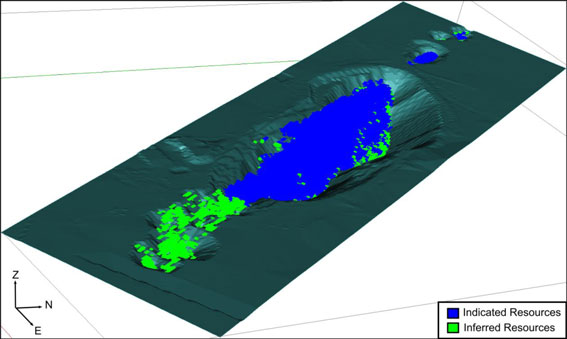
| IAMGOLD Corporation - Essakane Gold Mine Technical Report NI 43-101 – February 17, 2016 |
Page 14-71 |
The Falagountou West deposit open pit Indicated Mineral Resource is estimated to be 11.0 Mt at an average grade of 1.58 g/t Au, totalling 557 koz of gold. The Falagountou West deposit open pit Inferred Mineral Resource is estimated to be 114 kt at an average grade of 1.01 g/t Au, totalling 4 koz of gold. The Falagountou East deposit open pit Indicated Mineral Resource is estimated to be 4.3 Mt at an average grade of 1.71 g/t Au, totalling 237 koz of gold. The Falagountou East deposit open pit Inferred Mineral Resource is estimated to be 504 kt at an average grade of 2.33 g/t Au, totalling 38 koz of gold. Saprolite, transition, and fresh rock weathering profiles are combined in this resource estimate statement. Gold grade distribution and resource categorization are illustrated in Figures 14-26 and 14-27 for the Falagountou West and East deposits, respectively.
Total Indicated Mineral Resources at the Essakane Gold Mine are currently estimated to be 138 Mt grading 1.13 g/t Au, totalling 5,020 koz of gold, while Inferred Mineral Resources are estimated to be 18.5 Mt grading 1.07 g/t Au, totalling 64 koz of gold. IAMGOLD’s attributable Mineral Resources are 124 Mt totalling 4,520 koz of gold in Indicated Mineral Resources and 16.7 Mt totalling 570 koz of gold in Inferred Mineral Resources.
Table 14-47 shows the estimated stockpile status as of December 31, 2015.
TABLE 14-47 STOCKPILE STATUS AS OF DECEMBER 31, 2015
| Material Type | Stockpiles | Tonnage (kt) |
Grade (g/t Au) |
Ounces (koz) | ||||
| Saprolite |
- | - | - | - | ||||
| Transition |
Stock LG | 9,630 | 0.54 | 167 | ||||
| Fresh Rock |
Stock LG | 4,123 | 0.67 | 88 | ||||
| ROMpad East | 10 | 1.18 | 0 | |||||
| ROMpad West | 10 | 0.99 | 0 | |||||
| ROMpad 2 | 44 | 0.89 | 1 | |||||
| Primary Crusher A | 56 | 1.11 | 2 | |||||
| Primary Crusher B | 111 | 1.12 | 4 | |||||
| Total (Fresh Rock) | 4,354 | 0.69 | 96 | |||||
| Total Stockpiles |
13,984 | 0.58 | 263 |
Details of the resource estimate are given in Table 14-48. Resources are tabulated by deposit (EMZ and Falagountou), resource category (Indicated and Inferred), and weathering material type (saprolite, transition, and fresh rock).
| IAMGOLD Corporation - Essakane Gold Mine Technical Report NI 43-101 – February 17, 2016 |
Page 14-72 |
FIGURE 14-26 CONSTRAINED MINERAL RESOURCES: (A) GOLD GRADES
AND (B) RESOURCE CATEGORIES - FALAGOUNTOU WEST DEPOSIT

| IAMGOLD Corporation - Essakane Gold Mine Technical Report NI 43-101 – February 17, 2016 |
Page 14-73 |
FIGURE 14-27 CONSTRAINED MINERAL RESOURCES: (A) GOLD GRADES
AND (B) RESOURCE CATEGORIES - FALAGOUNTOU EAST DEPOSIT
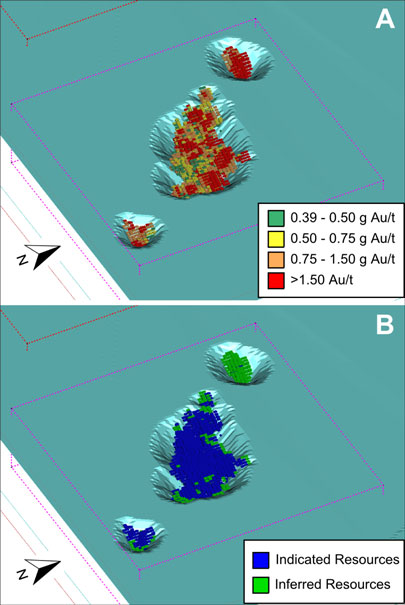
| IAMGOLD Corporation - Essakane Gold Mine Technical Report NI 43-101 – February 17, 2016 |
Page 14-74 |
TABLE 14-48 ESSAKANE GOLD MINE DECEMBER 31, 2015 CONSOLIDATED MINERAL RESOURCES
| Material Type | Saprolite | Transition | Fresh Rock | All Material | ||||||||||||||||||||||||||||||||||||||||||||
| kt | g/t Au |
koz Au | kt | g/t Au |
koz Au |
kt | g/t Au |
koz Au | kt | g/t Au |
koz Au | |||||||||||||||||||||||||||||||||||||
| Essakane Main Zone (EMZ) | ||||||||||||||||||||||||||||||||||||||||||||||||
| Cut-off |
0.35 g/t Au | 0.40 g/t Au | 0.45 g/t Au | |||||||||||||||||||||||||||||||||||||||||||||
| Measured |
0 | 0.00 | 0 | 0 | 0.00 | 0 | 0 | 0.00 | 0 | 0 | 0.00 | 0 | ||||||||||||||||||||||||||||||||||||
| Indicated |
2 | 0.48 | 0.03 | 961 | 0.80 | 25 | 107,516 | 1.14 | 3,943 | 108,479 | 1.14 | 3,968 | ||||||||||||||||||||||||||||||||||||
| EMZ M&I |
2 | 0.48 | 0.03 | 961 | 0.80 | 25 | 107,516 | 1.14 | 3,943 | 108,479 | 1.14 | 3,968 | ||||||||||||||||||||||||||||||||||||
| Total EMZ M&I Resources |
2 | 0.48 | 0.03 | 961 | 0.80 | 25 | 107,516 | 1.14 | 3,943 | 108,479 | 1.14 | 3,968 | ||||||||||||||||||||||||||||||||||||
| EMZ Inferred |
1,613 | 0.89 | 46 | 854 | 0.91 | 25 | 15,423 | 1.03 | 511 | 17,891 | 1.01 | 582 | ||||||||||||||||||||||||||||||||||||
|
|
Falagountou (FAL) |
| ||||||||||||||||||||||||||||||||||||||||||||||
| Cut-off |
0.39 g/t Au | 0.43 g/t Au | 0.48 g/t Au | |||||||||||||||||||||||||||||||||||||||||||||
| Measured |
0 | 0.00 | 0 | 0 | 0.00 | 0 | 0 | 0.00 | 00 | 0.00 | 0 | 0 | ||||||||||||||||||||||||||||||||||||
| Indicated |
392 | 1.86 | 23 | 1,484 | 1.44 | 69 | 13,415 | 1.63 | 702 | 15,290 | 1.61 | 794 | ||||||||||||||||||||||||||||||||||||
| Total FAL M&I Resources |
392 | 1.86 | 23 | 1,484 | 1.44 | 69 | 13,415 | 1.63 | 702 | 15,290 | 1.61 | 794 | ||||||||||||||||||||||||||||||||||||
| FAL Inferred |
63 | 2.51 | 5 | 121 | 3.15 | 12 | 473 | 2.46 | 38 | 657 | 2.60 | 55 | ||||||||||||||||||||||||||||||||||||
|
|
Consolidated Essakane Resources (EMZ & FAL) |
| ||||||||||||||||||||||||||||||||||||||||||||||
| Total M&I Resources |
394 | 1.85 | 23 | 12,074 | 0.67 | 260 | 125,285 | 1.18 | 4,741 | 137,753 | 1.13 | 5,024 | ||||||||||||||||||||||||||||||||||||
| Total Inferred Resources |
1,676 | 0.95 | 51 | 975 | 1.19 | 37 | 15,897 | 1.07 | 548 | 18,548 | 1.07 | 637 | ||||||||||||||||||||||||||||||||||||
| Attributable M&I Resources (90%) |
316 | 1.94 | 20 | 10,320 | 0.65 | 216 | 76,180 | 1.16 | 2,837 | 86,817 | 1.10 | 3,073 | ||||||||||||||||||||||||||||||||||||
| Attributable Inferred Resources (90%) |
1,509 | 0.95 | 46 | 877 | 1.19 | 34 | 14,307 | 1.07 | 494 | 16,693 | 1.07 | 573 | ||||||||||||||||||||||||||||||||||||
Notes:
| 1. | EMZ and Falagountou: Inside US$1,500/oz Whittle pit shells optimized on Measured, Indicated, and Inferred Mineral Resources |
| 2. | Includes Proven and Probable Mineral Reserves |
| 3. | M&I: Measured & Indicated |
| IAMGOLD Corporation - Essakane Gold Mine Technical Report NI 43-101 – February 17, 2016 |
Page 14-75 |
CONSTRAINED MINERAL RESOURCES SENSITIVITY TO CUT-OFF GRADES
EMZ DEPOSIT
The sensitivity analysis presents the constrained Mineral Resources combining saprolite, transition, and fresh rock material estimated in the EMZ deposit block model at a series of cut-off grades, varying between 0.20 g/t Au and 2.00 g/t Au. The cut-off grade of 0.40 g/t Au was replaced by the material cut-offs used to estimate the Official Mineral Resource as follows: 0.35 g/t Au for saprolite, 0.40 g/t Au for transition, and 0.45 g/t Au for fresh rock. The Mineral Resources, as detailed in Table 14-49, are constrained below the mining surface as of December 31, 2015 and inside the US$1,500/oz Whittle pit shell optimized on Indicated and Inferred Mineral Resources.
TABLE 14-49 CONSTRAINED MINERAL RESOURCE(1) SENSITIVITY TO
SELECTED CUT-OFF GRADES
| Cut-Off Grades (g/t Au) |
Indicated | Inferred | ||||||||||
| Tonnage (kt) |
Grade (g/t Au) |
Ounces (koz) |
Tonnage (kt) |
Grade (g/t Au) |
Ounces (koz) | |||||||
| >2.00 |
11,265 | 2.77 | 1,004 | 539 | 2.65 | 46 | ||||||
| >1.50 |
22,970 | 2.23 | 1,650 | 1,839 | 1.98 | 117 | ||||||
| >1.25 |
32,934 | 1.97 | 2,088 | 3,000 | 1.75 | 168 | ||||||
| >1.00 |
47,776 | 1.71 | 2,621 | 4,827 | 1.51 | 234 | ||||||
| >0.80 |
64,636 | 1.49 | 3,106 | 6,934 | 1.32 | 294 | ||||||
| >0.60 |
87,298 | 1.29 | 3,611 | 10,429 | 1.11 | 372 | ||||||
| Variable(2) |
108,479 | 1.14 | 3,968 | 14,232 | 0.95 | 436 | ||||||
| >0.20 |
146,716 | 0.92 | 4,363 | 24,392 | 0.69 | 538 | ||||||
Notes:
| 1. | Mineral Resources are constrained below the mining surface as of December 31, 2015 and inside the $1,500/oz Whittle pit shell optimized on Indicated and Inferred Mineral Resources |
| 2. | December 31, 2015 Mineral Resource Cut-off Grades: Saprolite 0.35 g/t Au; Transition 0.40 g/t Au; and Rock 0.45 g/t Au |
Figure 14-28 shows grade-tonnage curves for Indicated and Inferred Mineral Resources along the series of cut-off grades. The EMZ deposit block model does not show a significant degree of sensitivity to cut-off grades below 1.50 g/t Au in terms of gold grades, as the curves have a linear progression. Above 1.50 g/t Au cut-off, the slopes of the grade curves change more abruptly, which indicates higher sensitivity of the model in grades for Indicated and Inferred Mineral Resources. The tonnage curves of the Indicated and Inferred Mineral Resources are non-sensitive to cut-off grades. The apparent change of slope affecting the curves between 0.20 g/t Au and 0.60 g/t Au is due to having most of the Mineral Resources coming from the Rock material category and is also due to the use of the Mineral Resource
| IAMGOLD Corporation - Essakane Gold Mine Technical Report NI 43-101 – February 17, 2016 |
Page 14-76 |
cut-off grade of 0.45 g/t Au. The Inferred Mineral Resources, contained within the US$1,500/oz Whittle pit shell optimized for Indicated and Inferred Mineral Resources, are present in lesser tonnage amounts than the Indicated Mineral Resources, as represented by the corresponding tonnage curve.
FIGURE 14-28 INDICATED AND INFERRED MINERAL RESOURCE GRADE-
TONNAGE CURVES FOR SELECTED CUT-OFF GRADES
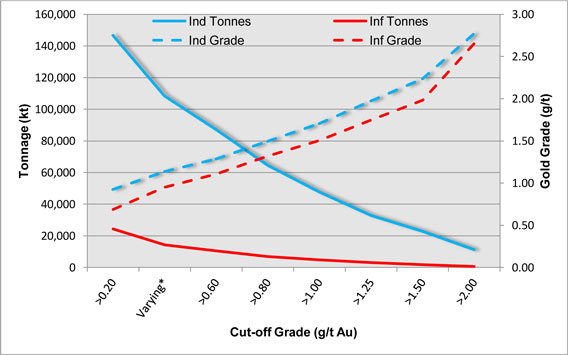
FALAGOUNTOU DEPOSITS
Table 14-50 summarizes the sensitivity of the constrained open pit Mineral Resources of the Falagountou deposits (West and East combined) for a series of selected gold cut-off grades. The sensitivity analysis uses gold cut-off grades between 0.20 g/t Au and 2.0 g/t Au. Figure 14-29 illustrates the grade-tonnage curves for the Indicated and Inferred Mineral Resources for the Falagountou deposits (West and East combined). The sensitivity table and graph are both a compilation of the saprolite, transition, and fresh rock weathering profiles. The Falagountou deposits do not show significant sensitivity to gold cut-off grades, expressed by relatively linear curves. The apparent kink in the indicated tonnage curve between 0.20 g/t Au and 0.60 g/t Au is caused by the different cut-off grades used for this interval; most of the
| IAMGOLD Corporation - Essakane Gold Mine Technical Report NI 43-101 – February 17, 2016 |
Page 14-77 |
tonnage in this case comes from the “fresh rock” profile with a gold cut-off grade of 0.48 g/t Au. Gold grade sensitivity is rather linear from 0.20 g/t Au to 1.5 g/t Au.
TABLE 14-50 INDICATED MINERAL RESOURCE SENSITIVITY -
FALAGOUNTOU WEST AND EAST DEPOSITS COMBINED
| Cut-off Grade (g/t Au) |
Indicated | Inferred | ||||||||||
| Tonnage (kt) |
Grade (g/t Au) |
Gold (koz) |
Tonnage (kt) |
Grade (g/t Au) |
Gold (koz) | |||||||
| >2.0 g/t |
3,702 | 3.38 | 402 | 260 | 5 | 40 | ||||||
| >1.5 g/t |
5,679 | 2.80 | 512 | 355 | 4 | 46 | ||||||
| >1.25 g/t |
7,230 | 2.50 | 581 | 410 | 4 | 48 | ||||||
| >1.00 g/t |
9,262 | 2.20 | 654 | 484 | 3 | 51 | ||||||
| >0.80 g/t |
11,315 | 1.96 | 713 | 546 | 3 | 52 | ||||||
| >0.60 g/t |
13,696 | 1.74 | 766 | 627 | 3 | 54 | ||||||
| Varying |
15,290 | 1.61 | 794 | 657 | 3 | 55 | ||||||
| >0.2 g/t |
18,791 | 1.38 | 831 | 750 | 2 | 56 | ||||||
Notes:
| 1. | Mineral Resources are constrained below the mining surface as of December 31, 2015 and inside the US$1,500/oz Whittle pit shell optimized on Indicated and Inferred Mineral Resources (Falagountou West and East deposits combined) |
| 2. | December 31, 2015 Mineral Resource Cut-Off Grades: Saprolite: 0.39 g/t Au, Transition: 0.43 g/t Au, and Fresh Rock: 0.48 g/t Au |
| IAMGOLD Corporation - Essakane Gold Mine Technical Report NI 43-101 – February 17, 2016 |
Page 14-78 |
FIGURE 14-29 GRADE - TONNAGE CURVES OF CONSTRAINED INDICATED
MINERAL RESOURCE ESTIMATE FOR SELECTED GOLD CUT-OFF GRADES
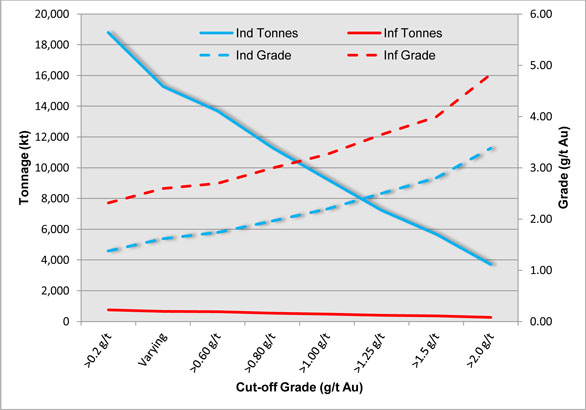
SENSITIVITY TO GOLD PRICE
ESSAKANE GOLD MINE (EMZ AND FALAGOUNTOU DEPOSITS)
Sensitivity to gold price for the EMZ and Falagountou deposits, combined, is illustrated in Figure 14-30 for gold prices varying between US$1,000/oz and US$1,700/oz. Cut-off grades were adjusted accordingly as tabulated in Table 14-51, per deposit.
| IAMGOLD Corporation - Essakane Gold Mine Technical Report NI 43-101 – February 17, 2016 |
Page 14-79 |
FIGURE 14-30 EMZ AND FALAGOUNTOU DEPOSITS INDICATED AND
INFERRED MINERAL RESOURCE SENSITIVITY TO GOLD PRICES
(SAP+TRANS+ROCK)
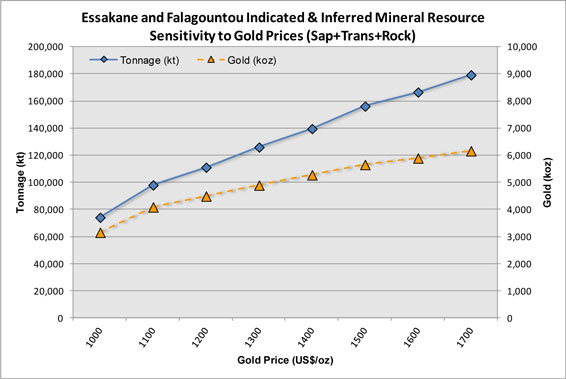
EMZ DEPOSIT
The sensitivity of the constrained Mineral Resources combining saprolite, transition, and fresh rock materials, estimated in the EMZ deposit block model at varying gold prices, is illustrated in Figure 14-31. All of the Mineral Resources are constrained below the mining surface as of December 31, 2015 and within the corresponding gold price Whittle pit shell and cut-offs. The stockpiles are also included in the sensitivity analysis.
A rapid increase in tonnage and gold content at lower gold prices is followed by a steady increase of resources between gold prices of US$1,100/oz and US$1,600/oz. A 25% increase in gold price going from US$1,200/oz to US$1,500/oz would result in an ore tonnage increase of +42% and a lower increase of +28% in ounces of gold. The higher sensitivity of tonnage compared to ounces, in a changing gold price environment, reflects the low grade nature of the deposit.
| IAMGOLD Corporation - Essakane Gold Mine Technical Report NI 43-101 – February 17, 2016 |
Page 14-80 |
FIGURE 14-31 EMZ DEPOSIT INDICATED AND INFERRED MINERAL
RESOURCES SENSITIVITY TO GOLD PRICE
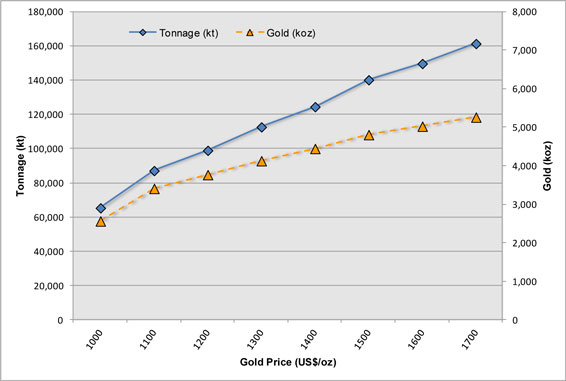
FALAGOUNTOU DEPOSITS
Sensitivity to gold price for the Falagountou deposits is illustrated in Figure 14-32 for prices varying between US$1,000/oz to US$1,700/oz. Mineral Resources were estimated inside Whittle pit shells drawn from fixed optimization parameters as described in Section 15, however, with varying gold prices. Cut-off grades were adjusted accordingly, as tabulated in Table 14-51. The Falagountou West and East deposits tonnage augmentation progressively decreases, except when passing from a US$1,300/oz to US$1,400/oz gold price assumption. When comparing US$1,200/oz and US$1,500/oz Whittle pit shells, increases of 32% in tonnage and 17% in gold content and a decrease of 11 % in grade are anticipated.
| IAMGOLD Corporation - Essakane Gold Mine Technical Report NI 43-101 – February 17, 2016 |
Page 14-81 |
FIGURE 14-32 MINERAL RESOURCE SENSITIVITY TO GOLD PRICE -
FALAGOUNTOU DEPOSITS

TABLE 14-51 EMZ AND FALAGOUNTOU DEPOSITS CUT-OFF GRADES FOR
VARYING GOLD PRICES
| Gold Price (US$/oz) |
EMZ Deposit Gold Cut-off Grades (g/t) |
Falagountou Deposit Gold Cut-off Grades (g/t) | ||||||||||
| Sap | Trans | F. Rock | Sap | Trans | F. Rock | |||||||
| 1,000 |
0.52 | 0.59 | 0.67 | 0.58 | 0.63 | 0.72 | ||||||
| 1,100 |
0.48 | 0.54 | 0.61 | 0.52 | 0.58 | 0.65 | ||||||
| 1,200 |
0.44 | 0.49 | 0.56 | 0.48 | 0.53 | 0.60 | ||||||
| 1,300 |
0.41 | 0.46 | 0.52 | 0.45 | 0.49 | 0.56 | ||||||
| 1,400 |
0.38 | 0.43 | 0.49 | 0.42 | 0.46 | 0.52 | ||||||
| 1,500 |
0.35 | 0.40 | 0.45 | 0.39 | 0.43 | 0.48 | ||||||
| 1,600 |
0.33 | 0.37 | 0.43 | 0.36 | 0.40 | 0.45 | ||||||
COMPARISON TO PREVIOUS MODELS
EMZ DEPOSIT
Table 14-52 compares the Indicated and Inferred Mineral Resource estimates of December 31, 2015 to those of December 31, 2014. As of December 31, 2014, the EMZ deposit
| IAMGOLD Corporation - Essakane Gold Mine Technical Report NI 43-101 – February 17, 2016 |
Page 14-82 |
Indicated Mineral Resources were estimated to total of 4,121 koz of gold and decreased by 153 koz of gold to a total estimate of 3,968 koz of gold as of December 31, 2015. Nevertheless, Inferred Mineral Resources gained a total of 141 koz of gold from 441 koz of gold in 2014 to 582 koz of gold in 2015.
The variations expressed as differences in tonnage, grade, and ounces in Table 14-52 are influenced by multiple factors, such as various changes in the block model, update of optimization parameters and costs, mining depletion, and stockpiles variations.
The block model modifications included the addition of drill hole results which led to an update of the modelling. Some litho-structural domains were added in the North Satellite area and new mineralization envelopes replaced the previously existing domains in South EMZ. Overall, the changes to the block model yielded some losses.
Other block modelling elements remained unchanged from the previous model: capping limits on assays, compositing style, variography, interpolation methodology, search ellipse ranges, and the use of soft and/or hard boundary domains. The density model was reviewed, however, the adjustments did not significantly affect the tonnages.
Also, when comparing to the December 31, 2014 block model, some changes in the resource classification arise from differences in some indicated blocks, now categorized as inferred in the December 31, 2015 model. This partly explains the gains in Inferred Mineral Resources compared to some losses in Indicated Mineral Resources. The reported classification procedure is the same for both models, 2014 and 2015, however, GMSI has not been able to reproduce the exact 2014 resource classification. Consequently, some previously indicated blocks are now categorized as inferred following the pass interpolation identification as explained earlier in Section 0.
The differences in the EMZ deposit Mineral Resources also account for losses due to the 2015 mining depletion, gains coming from the revision of the costs and optimisation parameters, and a positive stockpile variation.
| IAMGOLD Corporation - Essakane Gold Mine Technical Report NI 43-101 – February 17, 2016 |
Page 14-83 |
TABLE 14-52 COMPARISON OF MINERAL RESOURCES AS OF DECEMBER 31, 2015 TO MINERAL RESOURCES AS OF DECEMBER 31, 2014
| Material Type |
Saprolite | Transition | Fresh Rock | Total (All Materials) | ||||||||||||||||||||||
| Tonnes | Grade | Ounces | Tonnes | Grade | Ounces | Tonnes | Grade | Ounces | Tonnes | Grade | Ounces | |||||||||||||||
| (kt) | (g/t) | (koz) | (kt) | (g/t) | (koz) | (kt) | (g/t) | (koz) | (kt) | (g/t) | (koz) | |||||||||||||||
| Resources(1) December 31, 2014 |
Cut-offs(3) | 0.39 g/t Au | 0.46 g/t Au | 0.53 g/t Au | ||||||||||||||||||||||
| M&I | 518 | 0.59 | 10 | 1,568 | 0.91 | 46 | 101,256 | 1.25 | 4,065 | 103,342 | 1.24 | 4,121 | ||||||||||||||
| Stockpiles | 572 | 0.50 | 9 | 9,362 | 0.54 | 161 | 3,666 | 0.66 | 78 | 13,600 | 0.57 | 248 | ||||||||||||||
| Total | 1,090 | 0.54 | 19 | 10,930 | 0.59 | 207 | 104,922 | 1.23 | 4,143 | 116,942 | 1.16 | 4,369 | ||||||||||||||
| Inferred | 95 | 0.53 | 2 | 1 | 0.65 | - | 10,126 | 1.35 | 439 | 10,222 | 1.34 | 441 | ||||||||||||||
| Resources(2) December 31, 2015 |
Cut-offs(4) | 0.35 g/t Au | 0.40 g/t Au | 0.45 g/t Au | ||||||||||||||||||||||
| M&I | 2 | 0.48 | 0 | 961 | 0.80 | 25 | 107,516 | 1.14 | 3,943 | 108,479 | 1.14 | 3,968 | ||||||||||||||
| Stockpiles | - | - | - | 9,630 | 0.54 | 167 | 4,354 | 0.69 | 96 | 13,984 | 0.58 | 263 | ||||||||||||||
| Total | 2 | 0.48 | 0 | 10,591 | 0.56 | 191 | 111,870 | 1.12 | 4,039 | 122,463 | 1.07 | 4,230 | ||||||||||||||
| Inferred | 1,613 | 0.89 | 46 | 854 | 0.91 | 25 | 15,423 | 1.03 | 511 | 17,891 | 1.01 | 582 | ||||||||||||||
| Differences |
M&I | -516 | 0.60 | -10 | -607 | 1.10 | -21 | 6,260 | -0.61 | -122 | 5,137 | -0.93 | -153 | |||||||||||||
| Stockpiles | -572 | 0.49 | -9 | 268 | 0.65 | 6 | 688 | 0.83 | 18 | 384 | 1.21 | 15 | ||||||||||||||
| Total | -1,088 | 0.54 | -19 | -339 | 1.45 | -16 | 6,948 | -0.46 | -104 | 5,521 | -0.78 | -139 | ||||||||||||||
| Inferred | 1,518 | 0.91 | 44 | 853 | 0.91 | 25 | 5,297 | 0.42 | 72 | 7,669 | 0.57 | 141 | ||||||||||||||
Notes:
| 1. | Mineral Resources below mining surface as of December 31, 2014 and inside US$1,500/oz Whittle pit shell optimized on Measured, Indicated, and Inferred block model RES15Offic |
| 2. | Mineral Resources below mining surface as of December 31, 2015 and inside US$1,500/oz Whittle pit shell optimized on Measured, Indicated, and Inferred block model RES16Offic |
| 3. | Cut-off grades for December 31, 2014 Mineral Resources |
| 4. | Cut-off grades for December 31, 2015 Mineral Resources |
| 5. | M&I: Measured & Indicated |
| IAMGOLD Corporation - Essakane Gold Mine Technical Report NI 43-101 – February 17, 2016 |
Page 14-84 |
FALAGOUNTOU
This Falagountou deposit resource estimate is a major update from the December 31, 2014 model, since the mineralization zones were completely remodelled by GMSI in March 2015. A second update was completed in October 2015 by GMSI with new drilling south and north of the Falagountou West deposit. The March 2015 update is summarized in an internal report (GMSI, 2015), while the October 2015 update focussed on the Falagountou West deposit extensions and weathering profile update.
The Mineral Resource variations for the Falagountou deposits are summarized in Table 14-53. The most significant differences between the 2014 and 2015 end of year resource statements are highlighted in red. The most notable difference is the major increase of 9.12 Mt of Indicated Mineral Resource (or 213% increase) in the fresh rock material. It is noteworthy that the loss of 2.31 Mt in the fresh rock Inferred Mineral Resource classification predominantly comes from a resource transfer in the Indicated category. A series of parameters affected the Mineral Resource estimate, including:
| ● | Additional drilling: |
| ¡ | Completely remodelled mineralization zones, |
| ¡ | Mineralization zone extensions in the southern portion of the Falagountou West deposit, and to a lesser extent in the northern end, |
| ¡ | New small mineralization zone in the southern portion of the Falagountou West deposit (zone 245), |
| ● | Weathering profile adjustments (gains and/or losses), |
| ● | Density adjustments, with new measurements and new weathering profiles (tonnage gains in the Falagountou West deposit with globally slightly higher densities). |
Losses in the transition material category are largely caused by the transfer of the topmost transition interval to the saprolite material class.
Grades are also globally higher by 17% in the indicated category, largely caused by the changes in the interpolation methods.
| IAMGOLD Corporation - Essakane Gold Mine Technical Report NI 43-101 – February 17, 2016 |
Page 14-85 |
TABLE 14-53 CONSTRAINED MINERAL RESOURCE COMPARISON - FALAGOUNTOU DEPOSITS
(WEST AND EAST COMBINED)
| Laterite & Saprolite |
Transition |
Fresh Rock |
Total (All Material) | |||||||||||||||||||||||
| Tonnage | Grade | Gold | Tonnage | Grade | Gold | Tonnage | Grade | Gold | Tonnage | Grade | Gold | |||||||||||||||
| (kt) | (g/t) | (koz) | (kt) | (g/t) | (koz) | (kt) | (g/t) | (koz) | (kt) | (g/t) | (koz) | |||||||||||||||
| Cutoffs | 0.43 g/t Au | 0.49 g/t Au | 0.56 g/t Au | |||||||||||||||||||||||
|
December 31 2014 |
M&I | 182 | 1.31 | 8 | 3,017 | 1.21 | 117 | 4,291 | 1.51 | 208 | 7,490 | 1.38 | 333 | |||||||||||||
|
(Fala West+East) |
Inferred | 515 | 1.00 | 17 | 1,313 | 1.26 | 53 | 2,779 | 1.32 | 118 | 4,607 | 1.27 | 188 | |||||||||||||
| Cutoffs | 0.39 g/t Au | 0.43 g/t Au | 0.48 g/t Au | |||||||||||||||||||||||
|
December 31 2015 |
M&I | 392 | 1.86 | 23 | 1,484 | 1.44 | 69 | 13,415 | 1.63 | 702 | 15,290 | 1.61 | 794 | |||||||||||||
|
(Fala West+East) |
Inferred | 63 | 2.51 | 5 | 121 | 3.15 | 12 | 473 | 2.46 | 38 | 657 | 2.60 | 55 | |||||||||||||
|
Difference |
M&I | 210 | 0.55 | 15 | -1,533 | 0.23 | -48 | 9,124 | 0.12 | 494 | 7,800 | 0.23 | 461 | |||||||||||||
| Inferred | -452 | 1.51 | -12 | -1,192 | 1.89 | -41 | -2,306 | 1.14 | -80 | -3,950 | 1.33 | -133 | ||||||||||||||
Notes:
| 1. | Mineral Resources as disclosed in official December 31, 2014 year-end Mineral Resource statement |
| 2. | Mineral Resources below mining surface as of December 31, 2015 and inside US$1,500/oz Whittle pit shell optimized on Measured, Indicated, and Inferred block models Fala_Dec15 and East_Dec15 |
| 3. | Cut-offs for December 31, 2014 Mineral Resources |
| 4. | Cut-offs for December 31, 2015 Mineral Resources |
| IAMGOLD Corporation - Essakane Gold Mine Technical Report NI 43-101 – February 17, 2016 |
Page 14-86 |
ESSAKANE GOLD MINE RESOURCE VARIATION THROUGH 2015
Factors leading to yearly changes of the Mineral Resources are presented in Figure 14-33 as a waterfall graph. Most of the changes to the Mineral Resources that took place during 2015 can be summarize by the following:
| ● | Changes to costs, and consequently to optimization parameters, cut-off grades, and Whittle pit shells. New parameters can be viewed in Section 15. Major changes from the December 31, 2014 estimate include: |
| ¡ | More than 20% decrease in diesel and heavy fuel oil (HFO) prices, |
| ¡ | 25% decrease in power costs, |
| ¡ | Processing costs decrease: 15% in fresh rock and 10% in saprolite, |
| ¡ | More than 50% decrease in sustaining capital costs, |
| ¡ | Note that gold price assumptions for Mineral Resources remained the same at US$1,500/oz, |
| ● | Changes to model: while the modelling update at the EMZ deposit yielded a minor loss of resources, the remodelling and new drilling at the Falagountou deposit are responsible for most of the 64% increase in the Falagountou deposit’s gold content compared to the December 31, 2014 resource statement. More details on changes to the model are presented in earlier in Section 0. |
| ● | Depletion: mining at the EMZ deposit (91% of the total mined material) and Falagountou West deposit (9% of the total mined material). |
| ● | Stockpiles variation: The stockpiles estimated as of December 31, 2015 include the following piles: low grade stockpiles of transition and rock material, ROM pads (East, West and pad 2), and Primary Crushers A & B. The stockpiles estimated as of December 31, 2014 did not include the material from the Primary Crushers. |
To estimate the changes to the model, GMSI created a temporary Whittle pit shell using December 31, 2014 economic parameters, based on the latest block model. Mineral Resources estimated from the December 31, 2015 block model and inside the temporary Whittle pit shell, using the same cut-off grades as in the 2014 official resource are then compared to the official 2014 resource statement to evaluate the changes associated with geological modelling (drilling and interpretation). Considering these changes are independent, changes to costs were deducted from the missing gain.
For reference, waterfall graphs for the EMZ and Falagountou (West and East combined) deposits are presented in Figures 14-34 and 14-35.
| IAMGOLD Corporation - Essakane Gold Mine Technical Report NI 43-101 – February 17, 2016 |
Page 14-87 |
FIGURE 14-33 EMZ AND FALAGOUNTOU WATERFALL GRAPH SHOWING EVOLUTION OF THE MINERAL RESOURCE THROUGH 2015
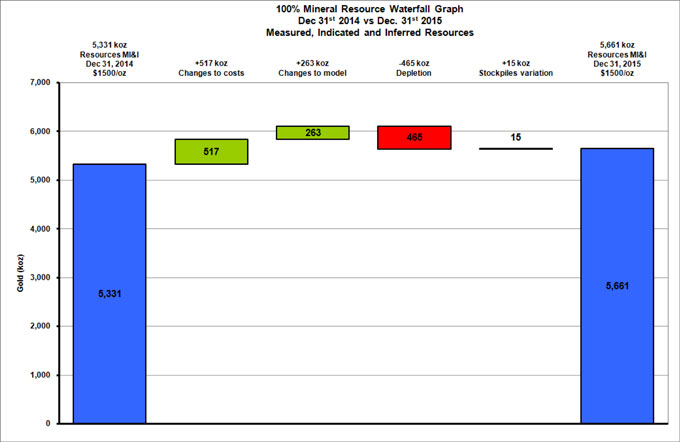
| IAMGOLD Corporation - Essakane Gold Mine Technical Report NI 43-101 – February 17, 2016 |
Page 14-88 |
FIGURE 14-34 EMZ WATERFALL GRAPH SHOWING EVOLUTION OF THE MINERAL RESOURCE THROUGH 2015
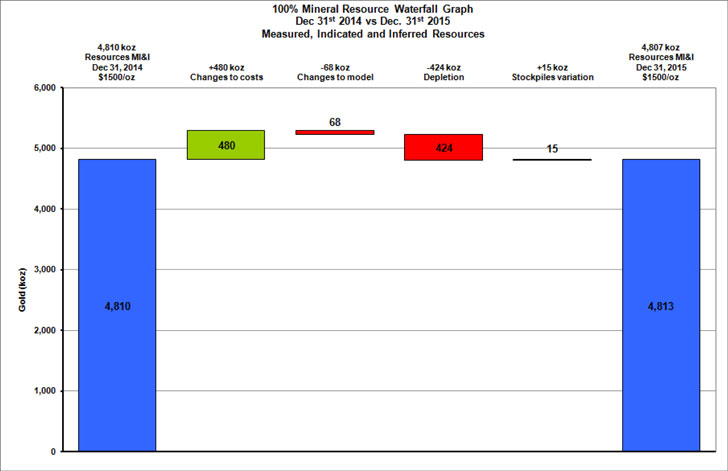
| IAMGOLD Corporation - Essakane Gold Mine Technical Report NI 43-101 – February 17, 2016 |
Page 14-89 |
FIGURE 14-35 FALAGOUNTOU WATERFALL GRAPH SHOWING EVOLUTION OF THE MINERAL RESOURCE THROUGH 2015
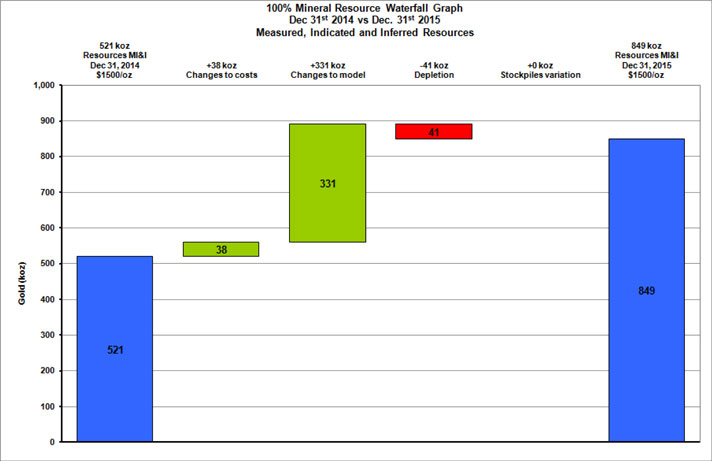
| IAMGOLD Corporation - Essakane Gold Mine Technical Report NI 43-101 – February 17, 2016 |
Page 14-90 |
15 MINERAL RESERVE ESTIMATE
SUMMARY
The Mineral Reserve estimate at December 31, 2015 for Essakane S.A. is summarized in Table 15-1 and is reported on a 100% basis. The Mineral Reserve estimate was prepared by GMSI.
TABLE 15-1 MINERAL RESERVES – DECEMBER 31, 2015
| Category | Tonnage (000 t) |
Grade (g/t Au) |
Contained Metal (000 oz Au) | |||
| Proven |
- | - | - | |||
| Probable |
96,463 | 1.10 | 3,414 | |||
| Total |
1.10 | 3,414 |
Notes:
| 1. | CIM definitions were followed for Mineral Reserves. |
| 2. | Mineral Reserves are estimated at a cut-off grade which varies between 0.44 and 0.60 g/t Au depending on material type and pit. |
| 3. | Mineral Reserves are estimated using an average long-term gold price of US$1,200 per ounce. |
| 4. | A minimum mining width of 10 m was used for Falagountou and 20 m for EMZ. |
| 5. | Bulk density is variable by rock type. |
| 6. | Numbers may not add due to rounding. |
GMSI is not aware of any known mining, metallurgical, infrastructure, permitting, or other relevant factors that could materially affect the Mineral Reserve estimate.
The mine design and Mineral Reserve estimate have been completed to a level appropriate for feasibility studies. The Mineral Reserve estimate stated herein is consistent with the CIM definitions and is suitable for public reporting. As such, the Mineral Reserves are based on Measured and Indicated Mineral Resources, and do not include any Inferred Mineral Resources.
RESOURCE MODELS
The December 31, 2015 Mineral Reserve estimate is based on separate updated resource models at year-end 2015 for the EMZ, Falagountou East, and Falagountou West deposits. The resource models were updated by GMSI in GEMS format.
| IAMGOLD Corporation - Essakane Gold Mine Technical Report NI 43-101 – February 17, 2016 |
Page 15-1 |
Mining activity is ongoing in the EMZ Pit and was initiated in Falagountou West in 2015. As such, December 31, 2015 status maps provided by Essakane S.A.’s engineering and survey department were used to deplete the in-pit Mineral Reserves.
DILUTION AND MINING LOSSES
The Mineral Reserve estimate and cut-off grades include a mining dilution provision of 8% for saprolite and 10% for transition and fresh rock material. The lower dilution for saprolite is due to the fact that limited blasting does not displace the ore zones compared to that required for transition and fresh rock. The dilution tonnage is estimated at zero grade.
EXTRACTION
The ore extraction rate or mining recovery is assumed to be 100%.
CUT-OFF GRADE
Metal prices used for Mineral Reserves are based on consensus, long term forecasts from banks, financial institutions, and other sources. For resources, metal prices used are slightly higher than those for reserves.
IAMGOLD uses a consistent reserve and resource gold price assumption for all of its sites. The reserve gold price assumption for estimating Mineral Reserves at year-end 2015 is US$1,200/oz. The reserve gold price utilized to estimate year-end 2014 Mineral Reserves was US$1,300/oz. Other economic parameter assumptions utilized to estimate costs and revenues such as fuel price, exchange rates, and royalty rates are summarized in Table 15-2.
| IAMGOLD Corporation - Essakane Gold Mine Technical Report NI 43-101 – February 17, 2016 |
Page 15-2 |
TABLE 15-2 PIT OPTIMIZATION ECONOMIC ASSUMPTIONS
| Economic Parameters | Unit | Value | ||
| Gold price (P) |
US$/oz | 1,200 | ||
| Long term oil price |
US$/bbl | 75 | ||
| CFA exchange rate |
CFA/USD | 570 | ||
| Transport & refining cost |
US$/oz | 3.04 | ||
| Site diesel price |
US$/L | 1.19 | ||
| Site HFO price |
US$/L | 0.78 | ||
| Power cost |
US$/kWh | 0.1943 | ||
| Royalty (3-5%) |
US$/oz | 48.00 | ||
| Cost of selling (Cs) |
US$/oz | 51.04 | ||
| Discount rate |
% | 6.00 | ||
The pit optimization parameters were consolidated by the mine engineering department with inputs provided by other departments to calculate the marginal cut-off grades (COG). The COG calculations are estimated on the basis of a long-term sustainable mill throughput of 12 Mtpa.
The metallurgical recovery assumptions for the EMZ deposit are 95.5% for saprolite, 92.5% for transition, and 91.5% for fresh rock. The metallurgical recovery assumptions for Falagountou are 1% higher for transition and fresh rock.
The mine operating cost inputs for pit optimization are derived from current mining costs and productivities. The cost estimates were estimated on the basis of a diesel fuel price of $1.19/L. The reference mining costs at surface (260 m elevation) are estimated at $2.29/t for saprolite waste, $2.58/t for transition waste, and $2.78/t for waste rock. These costs are approximately $0.07/t to $0.10/t more for mineralized material due to the added reverse circulation drilling cost. The mine operating cost includes mine sustaining capital and capital maintenance items, which total $0.51/t.
The Falagountou pit optimization parameters are the same as those for the EMZ pit, with the exception of ore haulage costs which are added to the ore based cost as the process plant is located a distance of 11 km from the pit. For rock, this represents an additional cost of $1.28/t and is slightly higher for transition and saprolite due to lower densities.
| IAMGOLD Corporation - Essakane Gold Mine Technical Report NI 43-101 – February 17, 2016 |
Page 15-3 |
The 2015 COGs by pit are summarized in Table 15-3 with the details for EMZ and Falagountou presented in Tables 15-4 and 15-5, respectively.
TABLE 15-3 SUMMARY OF 2015 COGS AT US$1,200/OZ
| COG by Pit | Saprolite | Transition | Rock | |||
| EMZ (g/t Au) |
0.44 | 0.49 | 0.56 | |||
| Falagountou (g/t Au) |
0.48 | 0.53 | 0.60 |
TABLE 15-4 SUMMARY OF EMZ PIT OPTIMIZATION PARAMETERS & COG
| Ore Based Cost & COG by Deposit | EMZ Pit | |||||||||||||||||||||||
| Rock type |
Saprolite | Transition | Rock | |||||||||||||||||||||
| Metallurgical recovery (rFGO) |
% | 95.5% | 92.5% | 91.5% | ||||||||||||||||||||
| Processing rate |
Mtpa | 12.00 | 12.00 | 12.00 | ||||||||||||||||||||
| Avg. power consumption (grinding) |
kWh/t | 6.0 | 10.0 | 17.5 | ||||||||||||||||||||
| Avg. power consumption (fix) |
kWh/t | 9.5 | 9.5 | 9.5 | ||||||||||||||||||||
| Total fixed processing costs |
MUS$/yr | 47.44 | 47.44 | 47.44 | ||||||||||||||||||||
| Processing fixed cost |
US$/t treated | 3.95 | 3.95 | 3.95 | ||||||||||||||||||||
| Liners & grinding media |
US$/t treated | 0.72 | 0.88 | 0.96 | ||||||||||||||||||||
| Reagents |
US$/t treated | 2.03 | 2.11 | 2.54 | ||||||||||||||||||||
| Power |
US$/t treated | 3.01 | 3.79 | 5.25 | ||||||||||||||||||||
| Total processing cost (Cp) |
US$/t treated | 9.72 | 10.74 | 12.70 | ||||||||||||||||||||
| Mining dilution (d) |
% | 8.0% | 10.0% | 10.0% | ||||||||||||||||||||
| Ore premium mining cost (Com) |
US$/t treated | 0.00 | 0.00 | 0.00 | ||||||||||||||||||||
| Ore Feed |
US$/t treated | 0.00 | 0.00 | 0.00 | ||||||||||||||||||||
| Total fixed G&A costs |
MUS$/yr | 44.90 | 44.90 | 44.90 | ||||||||||||||||||||
| G&A cost (Ca) |
US$/t treated | 3.74 | 3.74 | 3.74 | ||||||||||||||||||||
| Rehabilitation (Cmc) |
US$/t treated | 0.37 | 0.37 | 0.37 | ||||||||||||||||||||
| Stay-in-business capital (Csibc) |
US$/t treated | 0.45 | 0.45 | 0.45 | ||||||||||||||||||||
| Total Ore Based Cost |
US$/t treated | 14.28 | 15.29 | 17.25 | ||||||||||||||||||||
| Full Grade Ore in-situ COG |
g/t Au | 0.44 | 0.49 | 0.56 | ||||||||||||||||||||
| Reference Mining Cost by Deposit |
EMZ Pit | |||||||||||||||||||||||
| Rock type |
Saprolite | Transition | Rock | |||||||||||||||||||||
| Material |
Ore | Waste | Ore | Waste | Ore | Waste | ||||||||||||||||||
| Total Reference Mining Cost |
US$/t mined | 2.37 | 2.29 | 2.65 | 2.58 | 2.88 | 2.78 | |||||||||||||||||
| Reference elevation |
RL | 260 RL | ||||||||||||||||||||||
| Incremental bench cost |
US$/t per vert. m | 0.0031 | ||||||||||||||||||||||
| IAMGOLD Corporation - Essakane Gold Mine Technical Report NI 43-101 – February 17, 2016 |
Page 15-4 |
TABLE 15-5 SUMMARY OF FALAGOUNTOU PIT OPTIMIZATION PARAMETERS AND COG
| Ore Based Cost & COG by Deposit | Falagountou Pit | |||||||||||||||
| Rock type |
Saprolite | Transition | Rock | |||||||||||||
| Metallurgical recovery (rFGO) |
% | 95.5% | 93.5% | 92.5% | ||||||||||||
| Processing rate |
Mtpa | 12.00 | 12.00 | 12.00 | ||||||||||||
| Avg. power consumption (grinding) |
kWh/t | 6.0 | 10.0 | 17.5 | ||||||||||||
| Avg. power consumption (fix) |
kWh/t | 9.5 | 9.5 | 9.5 | ||||||||||||
| Total fixed processing costs |
MUS$/yr | 47.44 | 47.44 | 47.44 | ||||||||||||
| Processing fixed cost |
US$/t treated | 3.95 | 3.95 | 3.95 | ||||||||||||
| Liners & grinding media |
US$/t treated | 0.72 | 0.88 | 0.96 | ||||||||||||
| Reagents |
US$/t treated | 2.03 | 2.11 | 2.54 | ||||||||||||
| Power |
US$/t treated | 3.01 | 3.79 | 5.25 | ||||||||||||
| Total processing cost (Cp) |
US$/t treated | 9.72 | 10.74 | 12.70 | ||||||||||||
| Mining dilution (d) |
% | 8.0% | 10.0% | 10.0% | ||||||||||||
| Ore premium mining cost (Com) |
US$/t treated | 1.38 | 1.31 | 1.28 | ||||||||||||
| Ore Feed |
US$/t treated | 0.00 | 0.00 | 0.00 | ||||||||||||
| Total fixed G&A costs |
MUS$/yr | 44.90 | 44.90 | 44.90 | ||||||||||||
| G&A cost (Ca) |
US$/t treated | 3.74 | 3.74 | 3.74 | ||||||||||||
| Rehabilitation (Cmc) |
US$/t treated | 0.37 | 0.37 | 0.37 | ||||||||||||
| Stay-in-business capital (Csibc) |
US$/t treated | 0.45 | 0.45 | 0.45 | ||||||||||||
| Total Ore Based Cost |
US$/t treated | 15.66 | 16.60 | 18.54 | ||||||||||||
| Full Grade Ore in-situ COG |
g/t Au | 0.48 | 0.53 | 0.60 | ||||||||||||
| Reference Mining Cost by Deposit |
Falagountou Pits | |||||||||||||||
| Rock type |
Saprolite | Transition | Rock | |||||||||||||
| Material |
Ore | Waste | Ore | Waste | Ore | Waste | ||||||||||
| Total Reference Mining Cost |
US$/t mined | 2.41 | 2.70 | 2.92 | ||||||||||||
| Reference elevation |
RL | 260 RL | ||||||||||||||
| Incremental bench cost |
US$/t per vert. m | 0.0031 | ||||||||||||||
MINERAL RESERVE ESTIMATES
The December 31, 2015 consolidated EMZ and Falagountou Mineral Reserves are presented in Table 15-6. No Proven Mineral Reserves have been defined, given the short range generated around the grade control.
As of December 31, 2015 there were 87.2 Mt of Probable Mineral Reserves defined in the EMZ pit design and within stockpiles, at an average grade of 1.04 g/t Au totalling 2,921 koz
| IAMGOLD Corporation - Essakane Gold Mine Technical Report NI 43-101 – February 17, 2016 |
Page 15-5 |
of gold. To this total, the Falagountou pit adds 9.2 Mt of Probable Mineral Reserves at an average grade of 1.66 g/t Au for 493 koz of gold.
The EMZ pit contains 182 Mt of waste and the Falagountou pit contains 36.4 Mt of waste giving a total project stripping ratio of 2.65. At year-end 2015, the consolidated Mineral Reserves are currently estimated to be 96.5 Mt at a grade of 1.10 g/t Au for a total of 3,414 koz of gold (in-situ).
IAMGOLD’s 90% attributable Mineral Reserves total 86.8 Mt of ore and 3,073 koz of gold. Approximately 12% of the Mineral Reserve consists of transition (saprock) and the remainder (88%) is rock, with practically no saprolite remaining.
| IAMGOLD Corporation - Essakane Gold Mine Technical Report NI 43-101 – February 17, 2016 |
Page 15-6 |
TABLE 15-6 ESSAKANE DECEMBER 31, 2015 CONSOLIDATED MINERAL RESERVES
| Laterite & Saprolite | Transition | Fresh Rock | All Material | |||||||||||||||||||||||||||||||||||||||||||||
| 000 t | g/t Au |
000 oz Au |
000 t | g/t Au |
000 oz Au |
000 t | g/t Au |
000 oz Au |
000 t | g/t Au |
000 oz Au |
|||||||||||||||||||||||||||||||||||||
| Essakane Main Zone (EMZ) | ||||||||||||||||||||||||||||||||||||||||||||||||
| Cut-off(1) |
0.44 g/t Au | 0.49 g/t Au | 0.56 g/t Au | |||||||||||||||||||||||||||||||||||||||||||||
| Proven(2) |
0 | 0.00 | 0 | 0 | 0.00 | 0 | 0 | 0.00 | 0 | 0 | 0.00 | 0 | ||||||||||||||||||||||||||||||||||||
| Probable(2) |
2 | 0.45 | 0.03 | 545 | 0.70 | 12 | 72,708 | 1.13 | 2,646 | 73,255 | 1.13 | 2,658 | ||||||||||||||||||||||||||||||||||||
| EMZ Proven & Probable |
2 | 0.45 | 0.03 | 545 | 0.70 | 12 | 72,708 | 1.13 | 2,646 | 73,255 | 1.13 | 2,658 | ||||||||||||||||||||||||||||||||||||
| Stockpiles |
0 | 0.00 | 0 | 9,630 | 0.54 | 167 | 4,354 | 0.69 | 96 | 13,984 | 0.58 | 263 | ||||||||||||||||||||||||||||||||||||
| Total EMZ Reserves |
2 | 0.45 | 0.03 | 10,175 | 0.55 | 179 | 77,062 | 1.11 | 2,742 | 87,239 | 1.04 | 2,921 | ||||||||||||||||||||||||||||||||||||
| Falagountou (FAL) | ||||||||||||||||||||||||||||||||||||||||||||||||
| Cut-off(1) |
0.48 g/t Au | 0.53 g/t Au | 0.60 g/t Au | |||||||||||||||||||||||||||||||||||||||||||||
| Proven(2) |
0 | 0.00 | 0 | 0 | 0.00 | 0 | 0 | 0.00 | 00 | 0.00 | 0 | 0 | ||||||||||||||||||||||||||||||||||||
| Probable(2) |
349 | 1.95 | 22 | 1,292 | 1.46 | 61 | 7,583 | 1.69 | 411 | 9,224 | 1.66 | 493 | ||||||||||||||||||||||||||||||||||||
| Total FAL Reserves |
349 | 1.95 | 22 | 1,292 | 1.46 | 61 | 7,583 | 1.68 | 411 | 9,224 | 1.66 | 493 | ||||||||||||||||||||||||||||||||||||
| Consolidated Essakane Reserves (EMZ & FAL) | ||||||||||||||||||||||||||||||||||||||||||||||||
| Total Reserves |
351 | 1.94 | 22 | 11,467 | 0.65 | 240 | 84,645 | 1.16 | 3,153 | 96,463 | 1.10 | 3,414 | ||||||||||||||||||||||||||||||||||||
| Attributable Reserves |
316 | 1.94 | 20 | 10,320 | 0.65 | 216 | 76,180 | 1.16 | 2,837 | 86,817 | 1.10 | 3,073 | ||||||||||||||||||||||||||||||||||||
| % of Total Reserves |
0.4% | 11.9% | 87.7% | 100% | ||||||||||||||||||||||||||||||||||||||||||||
| Waste (incl. non-reserve material) |
218,495 | |||||||||||||||||||||||||||||||||||||||||||||||
| Strip Ratio |
2.65 | |||||||||||||||||||||||||||||||||||||||||||||||
Notes:
| 1. | Cut-offs based on Leached Au |
| 2. | EMZ & FAL: US$1,200/oz Au cut-offs inside US$1,200/oz Pit Design |
| IAMGOLD Corporation - Essakane Gold Mine Technical Report NI 43-101 – February 17, 2016 |
Page 15-7 |
FIGURE 15-1 ESSAKANE MINERAL RESERVES WATERFALL GRAPH – DECEMBER 31, 2013 TO DECEMBER 31, 2015
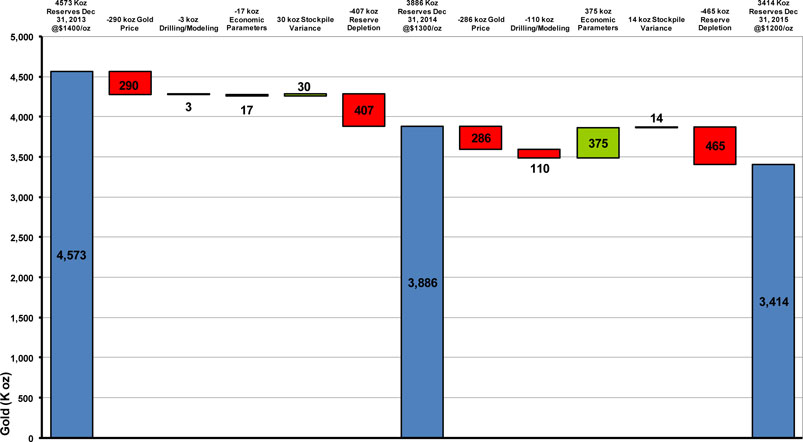
| IAMGOLD Corporation - Essakane Gold Mine Technical Report NI 43-101 – February 17, 2016 |
Page 15-8 |
Figure 15-1 is a waterfall graph depicting the change in the total ounces of gold contained within the Mineral Reserves from December 31, 2013 through to December 31, 2015. From December 31, 2013 to December 31, 2014, the contained gold ounces decreased by 687 koz mainly due to a decrease in the gold price from US$1,400/oz to US$1,300/oz as seen in Table 15-7 as well as by reserve depletion through mining. From December 31, 2014 to December 31, 2015, the contained gold ounces decreased by 472 koz, again mainly due to a decrease in the gold price from US$1,300/oz to US$1,200/oz as seen in Table 15-7 as well as by reserve depletion through mining. During this period, a total of 375 koz of gold were added to the Mineral Reserves through revisions to the economic parameters.
TABLE 15-7 MINERAL RESERVE EVOLUTION
| Year | Gold Price (US$/oz) |
Tonnes (000) |
Grade (g/t Au) |
Ounces Au (000)
| ||||
| Dec. 31/15 |
1,200 | 96,463 | 1.10 | 3,414 | ||||
| Dec. 31/14 |
1,300 | 108,821 | 1.11 | 3,886 | ||||
| Dec. 31/13 |
1,400 | 126,806 | 1.12 | 4,573 | ||||
| Dec. 31/12 |
1,500 | 114,377 | 1.00 | 3,659 | ||||
| Dec. 31/11 |
1,200 | 109,245 | 1.10 | 3,858 | ||||
| Dec. 31/10 |
1,000 & 850* | 107,465 | 1.29 | 4,461 | ||||
| Dec. 31/09 |
850 | 92,911 | 1.44 | 4,301 | ||||
| Mar/09 |
600 | 58,122 | 1.67 | 3,121 | ||||
| May/07 |
650 | 46,413 | 1.78 | 2,649 |
Note:* Falagountou @ $850/oz (Jan 2008 pit design)
Table 15-8 shows the Mineral Reserve gains and losses from December 31, 2014 to December 31, 2015 by ore type. As fresh rock constitutes 88% of the Mineral Reserves, the majority of the reduction in tonnes and gold ounces is found in this category.
| IAMGOLD Corporation - Essakane Gold Mine Technical Report NI 43-101 – February 17, 2016 |
Page 15-9 |
TABLE 15-8 ESSAKANE GOLD MINE MINERAL RESERVE GAINS AND LOSSES (FROM DECEMBER 31, 2014 TO DECEMBER 31, 2015)
|
Mineral Reserve Gain (Loss) |
Laterite & Saprolite | Transition | Fresh Rock | All Material | ||||||||||||
| 000 t | 000 oz Au | 000 t | 000 oz Au | 000 t | 000 oz Au | 000 t | 000 oz Au | |||||||||
| Dec 31, 2015 |
351 | 21.9 | 11,467 | 240 | 84,645 | 3,153 | 96,463 | 3,414 | ||||||||
| Dec 31, 2014 |
819 | 18.9 | 13,791 | 312 | 94,211 | 3,555 | 108,821 | 3,886 | ||||||||
| Gain (Losses) |
(468) | 3.0 | (2,325) | (73) | (9,566) | (402) | (12,358) | (472) | ||||||||
| IMG Attributable Gain (Loss) |
(421) | 2.7 | (2,092) | (65) | (8,609) | (362) | (11,123) | (425) | ||||||||
| IAMGOLD Corporation - Essakane Gold Mine Technical Report NI 43-101 – February 17, 2016 |
Page 15-10 |
16 MINING METHODS
Mining is carried out using a conventional drill, blast, load, and haul surface mining method with an owner fleet. The annual mining rate was 48.9 Mt in 2015 with a stripping ratio of 3.24 including 11.52 Mt of ore at an average grade of 1.14 g/t Au for a total of 426 koz of gold.
Table 16-1 details past production, up to 2015, at the Essakane Gold Mine.
TABLE 16-1 ESSAKANE GOLD MINE HISTORICAL PRODUCTION
| 2010 | 2011 | 2012 | 2013 | 2014 | 2015 | |||||||||||||||||||
| Ore Mined (000 t) |
10,097 | 10,110 | 9,562 | 11,869 | 12,580 | 11,519 | ||||||||||||||||||
| Waste Mined (000 t) |
11,876 | 15,268 | 1,689 | 30,006 | 32,677 | 35,690 | ||||||||||||||||||
| Marginal Mined (000 t) |
957 | 1,788 | 25,103 | 3,257 | 1,440 | 1,679 | ||||||||||||||||||
| Total Mined (000 t) |
22,930 | 27,17 | 36,353 | 45,133 | 46,698 | 48,887 | ||||||||||||||||||
| Strip Ratio |
1.27 | 1.69 | 2.80 | 2.80 | 2.71 | 3.24 | ||||||||||||||||||
| Mined Ore Grade(g/t) |
1.05 | 1.08 | 1.04 | 0.84 | 0.98 | 1.14 | ||||||||||||||||||
| Ore Milled (000 t) |
2,973 | 7,977 | 10,762 | 10,613 | 11,897 | 11,716 | ||||||||||||||||||
| Mill Grade (g/t) |
1.49 | 1.53 | 1.10 | 0.89 | 1.06 | 1.23 | ||||||||||||||||||
| Recovery (%) |
95.7% | 95.4% | 91.9% | 91.7% | 90.7% | 91.7% | ||||||||||||||||||
| Gold Produced (000 oz) |
136 | 376 | 350 | 277 | 369 | 426 | ||||||||||||||||||
| RC Drilling (000 m) |
100 | 209 | 167 | 227 | 195 | 148 | ||||||||||||||||||
| Production Drilling (000 m) |
12 | 257 | 541 | 806 | 724 | 944 | ||||||||||||||||||
| Pre-split Drilling (000 m) |
- | - | 4 | 32 | 21 | 41 | ||||||||||||||||||
| Tonnes Blasted (000 t) |
690 | 12,937 | 24,818 | 43,989 | 37,292 | 42,218 | ||||||||||||||||||
| Explosives (000 kg) |
53 | 2,405 | 5,813 | 12,606 | 11,958 | 13,740 | ||||||||||||||||||
| Powder Factor (kg/t) |
0.12 | 0.19 | 0.23 | 0.29 | 0.32 | 0.33 | ||||||||||||||||||
The weathered zones will be sequentially mined until fully depleted, after which mining will be exclusively in hard rock. Current pit geometry consists of five metre benches in the upper lateritic layers, and 10 m benches in hard rock.
Grade control is accomplished by RC drilling and sampling of the mineralized zone on a 10 m x 10 m pattern, or tighter as required. For sterile sections of the pit, the grid may be widened out based on the nature of the contacts and/or other geological occurrences.
| IAMGOLD Corporation - Essakane Gold Mine Technical Report NI 43-101 – February 17, 2016 |
Page 16-1 |
A fleet of 11 drill rigs are used for the 150 mm (six inch) production blast holes with two additional 223 mm (nine inch) drill rigs, commissioned in 2015, for production in hard rock. The quantity of hard rock material to be mined (i.e. transition and rock) is increasing and will continue to do so for the remainder of the mine life.
All blasting activities on site are executed by an explosives supplier. Holes are loaded with bulk explosive matrix and initiated with non-electric detonators.
Grade movement during blasting is a critical issue at the mine. For this reason, blast movement monitors (BMMs) are systematically used when blasting mineralized areas in order to measure vertical and horizontal displacement which allows for the adjustment of the post blast ore packets.
The mine loading fleet currently consists of four RH-120 shovels, two CAT 993K wheel loaders, one CAT 992K wheel loader, and a CAT 390 excavator. At the time of writing this report, a second CAT 390 excavator was in the process of being commissioned. The mine’s hauling fleet currently consists of 26 CAT 785C and five CAT 777F mining trucks.
Mine haul roads are 20 m to 30 m wide and are constructed by the mining department to support the mine haul trucks.
A list of Essakane S.A.’s primary mine production equipment fleet is shown in Table 16-2.
| IAMGOLD Corporation - Essakane Gold Mine Technical Report NI 43-101 – February 17, 2016 |
Page 16-2 |
TABLE 16-2 CURRENT PRIMARY MINE EQUIPMENT FLEET
| Type | Model | Number | ||
| Shovel |
O&K Terex RH120 | 4 | ||
| Excavator |
Caterpillar 390 | 1* | ||
| Caterpillar 349 | 5 | |||
| Loader |
Caterpillar 993K | 2 | ||
| Caterpillar 992K | 1 | |||
| Truck |
Caterpillar 785C | 26 | ||
| Caterpillar 777F | 5 | |||
| Drilling |
Atlas Copco ROCL8 | 4 | ||
| Atlas Copco PV-235 | 2 | |||
| Sandvik DK45 | 7 | |||
| Dozer |
Bulldozer D9R | 7 | ||
| Wheeldozer 824 | 2 | |||
| Grader |
Grader Cat 16M | 5 | ||
| Auxiliary |
Caterpillar 966H | 1 |
Note.* As of the date of this report, a second CAT 390 excavator was in commissioning on site.
Essakane S.A.’s ancillary equipment includes fuel and water trucks, mobile light plants, and service trucks.
Waste material is being stored in the waste dumps located east of the Main pit. Various ore stockpiles, sorted per type (saprolite, transition, or rock) and grade (marginal, low, and high grade), are located to the west of the mine, just north of the primary crusher. Water runoff from the ore stockpiles and waste dumps is collected in ditches and diverted to catchment basins where the runoff is pumped to one of the bulk water storage reservoirs near the tailings storage facility.
Other mining infrastructure includes a mine office complex (mine offices, change houses, and canteens), equipment workshop, with overhead cranes integrated with the main warehouse, and external wash bays, blasting and explosives compound including magazines, diesel storage and dispensing facility, and a drill core storage facility.
DEWATERING
Continuous pit groundwater monitoring is carried out, and includes seven vibrating wire piezometers for pit slope depressurization measurements.
| IAMGOLD Corporation - Essakane Gold Mine Technical Report NI 43-101 – February 17, 2016 |
Page 16-3 |
In the pit, sumps excavated below the active mining level are used as required to control rainfall runoff during the rainy season, as well as groundwater seepage.
MINE DESIGN
Piteau Association Engineering Ltd (Piteau) was initially responsible for Essakane S.A.’s geotechnical design studies and wall stability analyses. In August 2014, SRK was mandated to carry out a third party review of the pit slope design, and has since provided overall pit slope design and recommendations for EMZ and Falagountou pits. A Leica Geomos deformation monitoring instrument is used at Essakane for wall stability monitoring. The EMZ and Falagountou pit design parameters to ensure slope stability are detailed in Table 16-3 and 16-4, respectively.
TABLE 16-3 EMZ PIT DESIGN PARAMETERS
| Parameter | Unit | Sap | Trans | Rock | ||||||||||
| Sector (rock only) | East 1* | East 2 | West | |||||||||||
| Bench height |
m | 10 | 10 | 10 | 10 | 10 | ||||||||
| Berm width |
m | 7.5 | 9.6 | 8 | 8 | 7.5 | ||||||||
| Bench face angle |
° | 50 | 65 | 90 | 90 | 90 | ||||||||
| Geotech berm width |
m | 20 | 20 | 20 | 20 | 20 | ||||||||
| Maximum stack height |
m | NA | NA | 120/150 | 120 | |||||||||
| Inter ramp angle |
° | 32 | 35 | 51 | 51 | 53 | ||||||||
| Ramp width |
m | 30 | 30 | 30 | 30 | 30 | ||||||||
| Ramp gradient |
° | 8 | 10 | 10 | 10 | 10 | ||||||||
Stack heights in East Sectors 1 and 2 differ based on the location of the Argillic Zone in East wall.
TABLE 16-4 FALAGOUNTOU PIT DESIGN PARAMETERS
| Parameter | Unit | Sap | Trans | Rock | ||||||||||||
| Sector (rock only) | West | North East | South | |||||||||||||
| Bench height |
m | 10 | 10 | 10 | 10 | 10 | ||||||||||
| Berm width |
m | 11.5 | 7.5-11.5 | 12 | 7.5 | 8.5 | ||||||||||
| Bench face angle |
° | 65 | 65 | 90 | 90 | 90 | ||||||||||
| Geotech berm width |
m | 15 | 15 | 15 | 15 | 15 | ||||||||||
| Inter ramp angle |
° | 32 | 32-39 | 40 | 53 | 50 | ||||||||||
| Ramp width |
m | 30 | 30 | 30 | 30 | 30 | ||||||||||
| Ramp gradient |
° | 8 | 10 | 10 | 10 | 10 | ||||||||||
| IAMGOLD Corporation - Essakane Gold Mine Technical Report NI 43-101 – February 17, 2016 |
Page 16-4 |
It should be noted that for both pits, pit slope parameters are continuously being optimized as mining progresses.
FIVE-YEAR PLAN
Although the Life-of-Mine (LOM) extends until 2023 in terms of mining from which 82.4 million tonnes of ore grading 1.19 g/t Au will be extracted, the following five-year plan provides a detailed breakdown in the mining activities through to 2020.
The five-year mine plan provides a stable gold production above 400 koz through 2020. Starting in 2019, the mining rate declines as a result of the decreasing strip ratio and narrower benches, which is, however, compensated by re-handling and milling low grade stockpiles until the end of the mine life.
Table 16-5 details Essakane S.A.’s Five-Year Mine Plan to 2020.
TABLE 16-5 ESSAKANE GOLD MINE FIVE-YEAR MINE PLAN
| 2016 | 2017 | 2018 | 2019 | 2020 | ||||||||||||||||
| Ore Mined (000 t) |
13,298 | 12,290 | 10,164 | 14,765 | 11,953 | |||||||||||||||
| Waste Mined (000 t) |
36,149 | 37,406 | 39,703 | 33,396 | 28,614 | |||||||||||||||
| Marginal Mined (000 t) |
1,666 | 1,378 | 1,338 | 2,179 | 1,983 | |||||||||||||||
| Total Mined (000 t) |
51,113 | 51,075 | 51,205 | 50,340 | 42,550 | |||||||||||||||
| Strip Ratio |
2.84 | 3.16 | 4.04 | 2.41 | 2.56 | |||||||||||||||
| Mined Ore Grade(g/t) |
1.13 | 1.16 | 1.23 | 1.05 | 1.27 | |||||||||||||||
| Ore Milled (000 t) |
12,000 | 12,000 | 12,500 | 12,500 | 12,250 | |||||||||||||||
| Mill Grade (g/t) |
1.16 | 1.17 | 1.10 | 1.11 | 1.19 | |||||||||||||||
| Recovery (%) |
92.0% | 92.6% | 92.9% | 92.7% | 92.6% | |||||||||||||||
| Gold Produced (000 oz) |
412 | 417 | 411 | 413 | 433 | |||||||||||||||
| RC Drilling (000 m) |
89 | 84 | 77 | 91 | 75 | |||||||||||||||
| Production Drilling (000 m) |
9 | 734 | 547 | 560 | 473 | |||||||||||||||
| Pre-split Drilling (000 m) |
86 | 153 | 116 | 104 | 88 | |||||||||||||||
| Tonnes Blasted (000 t) |
49,976 | 50,638 | 50,561 | 50,280 | 42,550 | |||||||||||||||
| Explosives (000 kg) |
18,396 | 18,936 | 18,522 | 19,077 | 16,325 | |||||||||||||||
| Powder Factor (kg/t) |
0.37 | 0.37 | 0.37 | 0.38 | 0.38 | |||||||||||||||
| IAMGOLD Corporation - Essakane Gold Mine Technical Report NI 43-101 – February 17, 2016 |
Page 16-5 |
Mining in 2016 and 2017 is concentrated in EMZ phases PH1, PH2, and PH3, with some stripping activities in the upper benches of phases PH4 and PH5. For the Falagountou deposit, mining in 2016 and 2017 is concentrated in the West pit. In 2018, Falagountou East is initiated as Falagountou West is nearing completion. Mining at Falagountou is completed by 2020. In 2018, activities at EMZ are concentrated in phases PH2, PH3, and PH4, with some stripping activities in the upper benches of phase PH5. Essakane’s fifth and final phase is initiated in 2017 and becomes the majority of material to be moved after 2020.
Figure 16-1 shows the mining production by phase over the five-year mine plan.
FIGURE 16-1 FIVE-YEAR MINING PRODUCTION BY PHASE
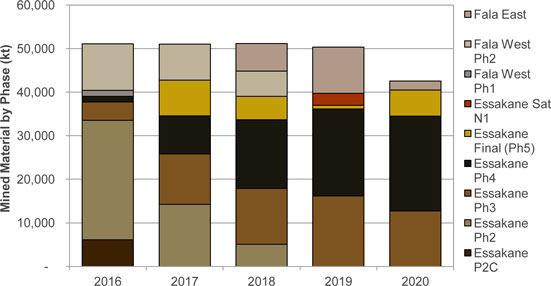
The mining schedule and rate has been established to feed the mill to capacity while respecting annual mining rate constraints, phase dropdown rates, and minimizing truck peak requirements.
| IAMGOLD Corporation - Essakane Gold Mine Technical Report NI 43-101 – February 17, 2016 |
Page 16-6 |
17 RECOVERY METHODS
Ore is processed using two stages of crushing, semi-autogenous grinding, ball mill grinding, pebble crusher grinding (SABC), gravity concentration, and a carbon-in-leach (CIL) gold plant. The UFS proposed a process plant throughput rate of 7.5 Mtpa. During construction, some debottlenecking improvements were made to the design, resulting in a revised nameplate capacity of 9.0 Mtpa based on processing 100% saprolite ore. Due to further operational improvements, plant throughput has increased beyond the constructed design capacity.
Fresh rock mill feed has gradually increased from 2012 onwards. To maintain gold production levels, with increasing proportions of hard rock in the mill feed, an expansion was completed in 2014. The objective was to double the hard rock processing capacity from 5.4 Mtpa on a 100% hard rock basis to 10.8 Mtpa.
The expansion consisted of the addition of a secondary crushing circuit and a second process line (grinding, gravity concentration, and leach) in the mill.
| ● | Secondary crusher of 1 MW; |
| ● | SAG mill of 7 MW; |
| ● | Ball mill of 7 MW; |
| ● | A pebble crusher on line A and line B; |
| ● | Two gravity concentrators; |
| ● | Eight CIL tanks. |
The process plant expansion was commissioned in February 2014, and effectively doubled the hard rock processing capacity.
A detoxification plant was also installed in 2014, upstream to the tailings pond. The detoxification plant is undergoing optimization and will be used as required following the new tailings deposition plan.
The expanded mineral processing flow sheet is shown in Figure 17-1.
| IAMGOLD Corporation - Essakane Gold Mine Technical Report NI 43-101 – February 17, 2016 |
Page 17-1 |
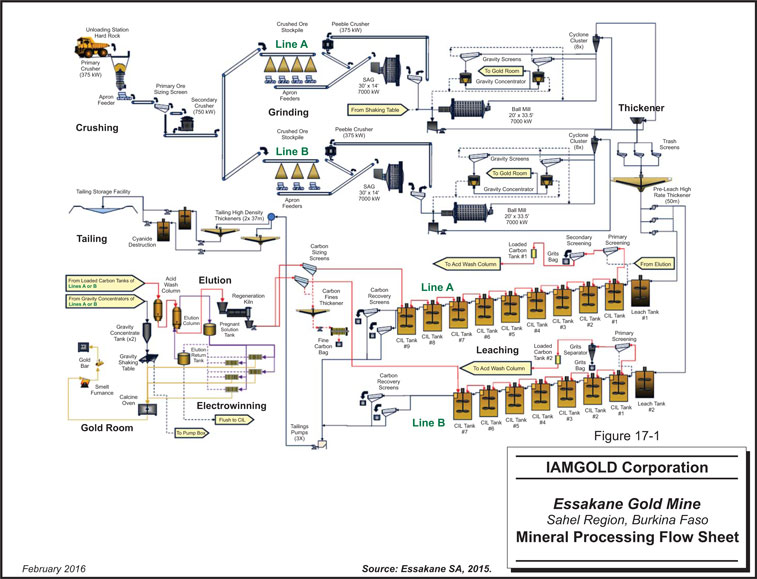
17-2
The ore coming from the mine is crushed in a gyratory crusher and in a cone crusher. The crushed ore is stockpiled either in a pile for Line A or Line B. The ore is reclaimed with apron feeders and feeds SAG mills on each line. The pebbles from the SAG mills are diverted to their respective pebble crusher in closed circuit. The ore passing through the SAG mill discharge screen feeds a pack of cyclones. Cyclone underflow returns to the ball mill. Cyclone overflow is sent to the pre-leach thickener. A portion of cyclone underflow goes to the gravity concentrators (two on each Line).
The thickened ore feeds two parallel lines consisting of one leach tank followed by CIL tanks. Once loaded with gold, the carbon is screened, acid washed, and eluted. The pregnant solution is sent to the gold room for electrowinning, drying, and finally, smelting into doré bars.
Eluted carbon is regenerated in a kiln and reused in the CIL circuit. Carbon fines generated from the circuit are recovered in bags for further gold recovery.
The gravity concentrate feeds a shaking table. The concentrate obtained from the table is then dried and smelted. Installation of an Intensive Leach Process to treat gravity concentrate is underway. It will increase gold recovery from current shaking table.
Plant tails are thickened and can be detoxified, if required. Tails are stored in a tailings pond and water is recovered to the plant.
TABLE 17-1 MILL PRODUCTION SINCE COMMISSIONING IN JULY 2010
| 2010 | 2011 | 2012 | 2013 | 2014 | 2015 | |||||||||||||||||||||
| Throughput |
000 t | 2,973 | 7,977 | 10,762 | 10,613 | 11,897 | 11,716 | |||||||||||||||||||
| Head Grade |
g/t | 1.49 | 1.53 | 1.10 | 0.89 | 1.06 | 1.23 | |||||||||||||||||||
| Recovery |
% | 95.75% | 95.43% | 91.94% | 91.68% | 90.69% | 91.66% | |||||||||||||||||||
| Gold Production |
000 oz | 136 | 375 | 350 | 277 | 369 | 426 | |||||||||||||||||||
Figure 17-2 summarizes the yearly average recovery by gravity, recovery for the mill, and the head grade.
| IAMGOLD Corporation - Essakane Gold Mine Technical Report NI 43-101 – February 17, 2016 |
Page 17-3 |
FIGURE 17-2 HISTORICAL EVOLUTION OF RECOVERIES AND HEAD GRADES
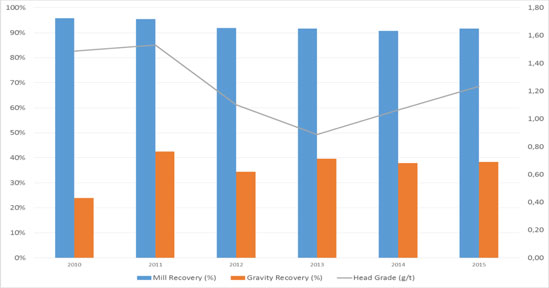
Table 17-2 summarizes the 2015 mill production.
TABLE 17-2 2015 ACTUAL MILL PRODUCTION
| Month | Tonnes (000 t) |
Head grade (g/t Au) |
Recovery (%) |
Gold Prod. (000 oz) | ||||||||
| Jan |
Actual | 858 | 1.29 | 91.1% | 32 | |||||||
| Feb |
Actual | 710 | 1.37 | 91.2% | 28 | |||||||
| Mar |
Actual | 958 | 1.33 | 91.7% | 38 | |||||||
| Apr |
Actual | 821 | 1.27 | 91.4% | 31 | |||||||
| May |
Actual | 866 | 1.28 | 91.1% | 32 | |||||||
| Jun |
Actual | 1,076 | 1.13 | 91.4% | 36 | |||||||
| Jul |
Actual | 1,160 | 1.24 | 91.3% | 42 | |||||||
| Aug |
Actual | 1,160 | 1.26 | 90.8% | 37 | |||||||
| Sep |
Actual | 1,135 | 1.19 | 91.5% | 40 | |||||||
| Oct |
Actual | 1,090 | 1.26 | 92.6% | 41 | |||||||
| Nov |
Actual | 1,011 | 1.18 | 93.1% | 36 | |||||||
| Dec |
Actual | 1,031 | 1.10 | 92.7% | 34 | |||||||
| Total |
Actual | 11,716 | 1.23 | 91.7% | 426 | |||||||
Table 17-3 summarizes the actual ore tonnes milled and recovery achieved for 2014 and 2015 compared with the mine plan tonnage and recovery. In 2014, the total ore tonnes milled was lower compared to the mine plan, however, the mill head grade was higher. The actual ratio of saprolite, transition, and hard rock ore differed in 2014 from the mine plan and
| IAMGOLD Corporation - Essakane Gold Mine Technical Report NI 43-101 – February 17, 2016 |
Page 17-4 |
consequently, the recovery was lower than planned. In 2015, total tonnage treated was higher than the mine plan due to the higher than target percentage of saprolite in the mill feed. The recovery and head grade for 2015 were in line with the mine plan.
TABLE 17-3 2014 AND 2015 ACTUAL MILLING SUMMARY COMPARED TO
MINE PLAN
| 2014 | 2015 | |||||||
| Mine Plan | Actual | Mine Plan | Actual | |||||
| Ore Milled (000 t) |
13,000 | 11,897 | 11,208 | 11,716 | ||||
| Saprolite |
26.9% | 25.2% | 1.6% | 18.0% | ||||
| Transition |
4.2% | 22.4% | 7.5% | 16.0% | ||||
| Hard Rock |
68.9% | 52.4% | 91.0% | 65.9% | ||||
| Mill Grade (g/t) |
0.95 | 1.06 | 1.23 | 1.23 | ||||
| Recovery |
92.3% | 90.7% | 91.6% | 91.7% | ||||
| IAMGOLD Corporation - Essakane Gold Mine Technical Report NI 43-101 – February 17, 2016 |
Page 17-5 |
18 PROJECT INFRASTRUCTURE
General services are an essential component to the success of the mine operation. Due to the remoteness and complex logistics of the mine coupled with the limited services available in Burkina Faso, the scope and extent of the general services department required to support production is very substantial. The current manpower is approximately 2,250 workers, excluding contractors.
Mine infrastructure consists of a mine office complex (mine offices, change houses, and canteens), equipment workshop with overhead cranes integrated to the main warehouse and external wash down bays, blasting and explosives compound including magazines, diesel storage and dispensing facility, and a drill core storage facility.
The mine village was built from prefabricated structures and this village was initially used as the construction camp. The site has a satellite communications system. Two office complexes are located in the mine plant area, one to service mine operations and maintenance and the other reserved for construction management and administrative services. The main warehouse is attached to the mine maintenance shops and includes a sizeable storage yard.
The initial mine infrastructure and support facilities constructed between 2009 and July 2010 have been modified and/or adapted for the expansion phase which was carried out from 2012 to 2014. The following summarizes the modifications carried out to the main infrastructure during the expansion phase. Figure 18-1 shows the general site layout.
MINE TRUCK SHOP AND WAREHOUSE
The existing mine truck shop and warehouse was extensively expanded to accommodate the increased maintenance requirements for the additional mobile mining equipment required for the expansion.
| IAMGOLD Corporation - Essakane Gold Mine Technical Report NI 43-101 – February 17, 2016 |
Page 18-1 |
SITE AND MINE ROADS
The EMZ central waste dump, located east of the pit, will cover a segment of the access road leading to the village of Petabarabe Oudalan. A new 2.2 km long road has been constructed in order to link the village to the existing road near the crossing of the Gorouol River.
A new 8.8 km fenced haulage road was built in 2015 between the Falagountou pit and the crusher ROM pad to accommodate the mine truck traffic. This road crosses the regional road from Falagountou and then stays north of this road, maintaining a distance of 500 m from any dwellings located near the regional road and does not impact any arable land.
COMMUNICATION SYSTEM AND IT
All the network communication and IT related hardware are linked to the existing systems at the mine. A VSAT system is installed to allow for the transfer of large files and to provide Internet connectivity for employees. Network and cable television access are available in the mine village.
FUEL OIL STORAGE
Fuel oil storage capacity was extended to four 500 m3 light fuel oil (LFO) tanks. The LFO storage area as well as the existing containment area were extended, as well as pumping installations.
EXPLORATION BUILDING
A new exploration building, including office space, logging, warehouse, and sampling area was added to the existing infrastructure to accommodate the resource development and exploration groups.
MINE CAMP
Specific upgrades associated with the mine camp and offices were carried out to accommodate the mine expansion:
| • | The kitchen was enlarged to better accommodate the mine expansion and food preparation. |
| • | A recreation building was added, including a full size multifunction gymnasium and workout rooms. |
| IAMGOLD Corporation - Essakane Gold Mine Technical Report NI 43-101 – February 17, 2016 |
Page 18-2 |
| • | Sewage capacities were installed and are sufficient to handle waste from the mine village and the mill area. |
| • | Two existing potable/fire water tanks are supplying the mining camp with a 220 gpm pump and five hydrants and fire cabinets. |
RIVER DEVIATION
In order to expand the EMZ pit to the north, a 5 km deviation of the Gorouol River was undertaken and effectively protected the EMZ pit during seasonal rains.
POWER GENERATION AND DISTRIBUTION
The current power plant was developed in two phases between 2010 and 2014. During the period between 2010 and 2014, temporary six megawatt (MW) LFO generators from SDMO Industries were installed to supplement power to the original plant. At present, these units are not utilized and remain installed on site. These units can be dismantled and used for other fit-for-purpose applications, and provide flexibility if required to supplement power.
The first phase has five generators (Wärtsilä 12V32 units each of 5,256 kW based on 35 degree Celsius) for a total installed power of 26,280 kW. During the second phase six additional units were installed in order to supply 25,000 kVA of additional power required under the expansion scenario, bringing the total units installed to 11, which includes 2 spares (1 for maintenance, 1 for emergency spare).
Additional fuel storage capacity and fuel treatment capacity, as well as day storage capacity, were built accordingly. The actual power plant can provide energy up to a production of 12 M tons of hard rock per year. There is also a spare space in the existing power plant for one more 12V32 generator which is not foreseen as a need at this point in time.
The power distribution has been upgraded based on the existing configuration in order to supply the mill expansion. Four new electrical rooms were installed to supply energy to the new grinding circuit, the pebble crusher, the new screening, and crushing circuits.
ASSAY AND METALLURGICAL LABORATORIES AND MILL OFFICE
The metallurgy and mill office buildings were rebuilt per the original design before demolishing the existing structure to make way for expansion mills. The metallurgy building
| IAMGOLD Corporation - Essakane Gold Mine Technical Report NI 43-101 – February 17, 2016 |
Page 18-3 |
consists of two main sections: the metallurgical lab and fire analysis area, and the fire assay furnace area. The mill office building includes office space, men’s and women’s washrooms, and a dining room.
ADMINISTRATION BUILDING
All administration offices are modular-type structures placed on concrete floor slabs with adequate sanitary and air conditioning facilities. The administration building features the following division: reception, boardroom, kitchen, offices, and map room.
POTABLE WATER AND TREATMENT FACILITIES
Water is extracted from underground using borehole pumps feeding into a buried HDPE ring main which, in turn, feeds into a potable water storage tank located within the plant boundary.
The water is filtered and chlorinated prior to entry into the tank which will be specially lined to ensure that the water is then acceptable for human consumption. In order to handle waste from the additional construction camps and influx of workers, two new 100 m3/day sewage facilities were installed beside the existing facility, one at the mine village and the other at the mill area.
An upgrade of the potable and fire water distribution system was tied-in to the existing distribution lines to supply water to the extension of the camp.
BULK WATER STORAGE AND PUMPING
As there is no continuous access to fresh water for the processing plant, Bulk Water Storage (BWS) basins were constructed. During the rainy season these BWS structures are recharged to store water in sufficient quantity to secure supply to the plant and for dust control in the mining areas. The recharging point, Off Channel Reservoir (OCR), with a surge capacity installed adjacent to the Gorouol River at 5.4 km from BWS is the source for the water. A dam installed on the Gorouol River raises the water during the rainy season to overflow into the OCR. When sufficient volumes are available in the OCR, pumping, using two pipelines permits the transfer of the water to the BWS basins. There are three BWS basins containing 1.87 M m3, 1.54 M m3, and 2.60 M m3 for a total of 6.01 M m3 of water.
| IAMGOLD Corporation - Essakane Gold Mine Technical Report NI 43-101 – February 17, 2016 |
Page 18-4 |
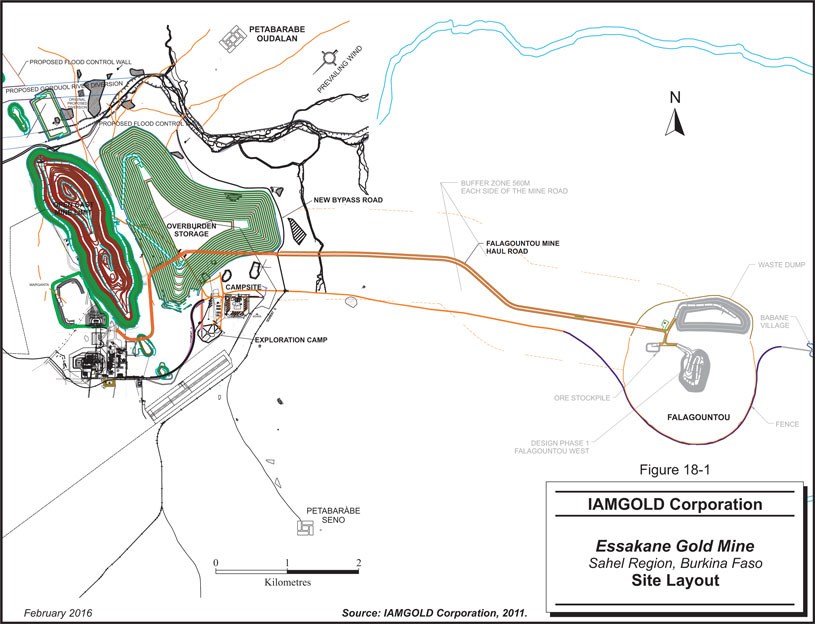
18-5
19 MARKET STUDIES AND CONTRACTS
MARKETS
Gold is the principal commodity at the Essakane Gold Mine and is freely traded at prices that are widely known, so that prospects for sale of any production are virtually assured. All gold produced by IAMGOLD is in the form of doré bars, which is then shipped to a refiner who refined the doré into bullion. The bullion is then sold directly on the open market to gold trading institutions at prevailing market prices.
CONTRACTS
The Essakane Gold Mine has signed contracts which are directly linked to the operations. Contracts are negotiated by going out for tenders on an annual or bi-annual basis. Contracts with values higher than $5 M per year are listed in Table 19-1
TABLE 19-1 MATERIAL CONTRACTS MORE THAN $5 MILLION/YEAR AT
THE ESSAKANE GOLD MINE
| Product/Service | Supplier | Annual Value US$ (000) | ||
| Fuel |
Vivo Energy | 58,000 | ||
| HFO |
Oryx | 33,000 | ||
| HFO |
Vivo Energy | 33,000 | ||
| Sodium Cyanide |
Samsung | 15,000 | ||
| Explosives |
Maxam | 24,000 | ||
| Cat Parts |
J.A. Delmas | 12,000 | ||
| Grinding Media |
Lucchini | 7,300 | ||
| Lubricants |
Vivo Energy | 5,000 | ||
| Quicklime |
Carmeuse, | 5,750 | ||
| Other Reagents |
Brenntag,Nowata | 5,200 | ||
| Mechanical Parts |
Atlas Copco | 5,000 |
| IAMGOLD Corporation - Essakane Gold Mine Technical Report NI 43-101 – February 17, 2016 |
Page 19-1 |
20 ENVIRONMENTAL STUDIES, PERMITTING,
AND SOCIAL OR COMMUNITY IMPACT
ENVIRONMENTAL AND SOCIAL STUDIES
Prior to the construction of a project likely to impact the environment, the Environmental Code (Law No. 006-2013/AN of April 2, 2013) of Burkina Faso stipulates the requirement for an Environmental Impact Statement (EIS), or an Environmental and Social Impact Assessment (ESIA), including public enquiry and a mitigation and/or an enhancement plan of negative or positive impacts. This requirement is supported by the associated Environmental Decree (Decree No. 2001-342/PRES/PM/MEE) which outlines the scope, content, and administrative procedure of the ESIA.
Prior to the beginning of construction work, an ESIA was conducted by Knight Piesold Consulting and submitted to the Government of Burkina Faso on August 8, 2007. This study included an Environmental and Social Management Plan (ESMP) for the project. The ESIA was completed following a public consultation, from October 3 to November 2, 2007 with key stakeholders, as prescribed under Burkinabé law. In 2008, and following the changes made during construction, an addendum to the ESIA (2008 addendum) was submitted to the Burkina Faso authorities. There was no change at that time to the ESMP as a result of this addendum.
Following this process, on November 30, 2007, the Essakane Gold Mine was approved by the Burkina Faso authorities (Order No. 2007-083/MECV/CAB) and the mining permit over a 100.2 km² area (Order No. 2008-203/PRES/PM/MCE/MEF/MECV) was granted to IAMGOLD Essakane S.A.
ESSAKANE GOLD MINE EXPANSION PERMITTING
In order to increase the annual gold production, a mine expansion FS (the 2011 FS) was initiated in 2011 by IAMGOLD’s Project and Construction department in collaboration with the Essakane Gold Mine personnel and a certain number of consulting experts.
| IAMGOLD Corporation - Essakane Gold Mine Technical Report NI 43-101 – February 17, 2016 |
Page 20-1 |
The expansion project consisted of increasing the total ore and waste mining capacity from 32 Mtpa to 56.5 Mtpa to feed the plant. Additionally, the project focused on increasing the overall processing capacity from 9.0 Mtpa to 10.8 Mtpa by duplicating the grinding and leaching circuits, in order to adjust to increasingly harder rock and maintain throughput. The LOM would also be extended to 2025. Based on conclusive studies, amendments to the mining plan took place from February 2012 to June 2014.
As part of the mine expansion work (from February 2012 to June 2013), a new addendum to the ESIA and the 2008 addendum was prepared in February 2012 (the February 2012 addendum). The February 2012 addendum covers the expansion phase of the main pit and mill infrastructure, a new satellite pit east of the mine, and the Gorouol river diversion. The ESIA and 2008 addendum already covered an important part of the impacts related to the expansion, including the river diversion.
The February 2012 addendum, which is an appendix to the ESIA approved in 2007, was prepared to analyze the environmental and social impacts of the mine expansion project. It includes, in Chapter 6, an updated ESMP incorporating the necessary adjustments to the initial ESMP to include the expansion changes and to consolidate, in one document, all of IAMGOLD’s social and environmental commitments. An environmental impact assessment was conducted for the river diversion.
These documents were validated on December 5 and 6, 2013 by the Comité Technique d’Evaluation Environnementale (COTEVE- Environmental Assessment Technical Committee), a body created by the Government of Burkina Faso and comprised of experts from various professional communities (Non-Government Organizations (NGO), general population, administration, researchers, universities, and institutes). Following the COTEVE meeting, a second public consultation took place from April 17 to May 5, 2013 in the communes of Gorom-Gorom (Oudalan Province) and Falagountou (Seno Province). IAMGOLD Essakane S.A.’s gold mining plan amendment was subsequently approved by Order No. 2014-170/MEDD/CAB.
COMMUNITY RESETTLEMENT PLANS
IAMGOLD Essakane S.A. implemented two resettlement plans consistent with Burkinabé laws and best practices recommended by international organizations (World Bank). The first
| IAMGOLD Corporation - Essakane Gold Mine Technical Report NI 43-101 – February 17, 2016 |
Page 20-2 |
plan started in 2008 (13,000 individuals and 2,981 households affected) and the second plan started in 2012 (3,208 individuals and 555 households affected). In both instances, a consultation process was carried out through the implementation of an Advisory Committee that included representatives from the affected villages and hamlets (High Commissioners, mayors and prefects, and technical service representatives) and representatives from three NGOs (The Organization for Community Capacity Building for Development (ORCADE), Burkinabé Movement on Human and Peoples’ Rights (MBDHP), and the League for the Defence of Justice and Liberty (LIDEJEL)).
In both instances, memorandums of understanding were signed and resettlement follow-up committees (CSR) comprising key representatives of affected villages and administrative authorities were created. The CSR committees meet every month to follow up on the progress of the two Resettlement Action Plans (RAPs).
For the negotiation of the second resettlement plan, approximately 500 meetings (formal and informal) took place between June 2012 and December 2013, which led to a consensual framework (12 agreements) through what was qualified by all as a participatory and transparent approach.
Additionally, in both instances, public consultations were carried out by the Ministry of Environment.
SOCIAL AND COMMUNITY ASSESSMENT
To minimize the mine’s impact on communities and the environment, an ESMP was developed.
As part of the two population resettlement plans (2008 and 2012), Essakane Consultation Committees were implemented to negotiate with the affected populations in order to reach agreements as part of the memorandums of understanding. Resettlement Monitoring Committees were introduced to ensure full enforcement of the agreements.
As part of the community engagement plan, a Communication Committee, information centres, and a community visit program were implemented.
| IAMGOLD Corporation - Essakane Gold Mine Technical Report NI 43-101 – February 17, 2016 |
Page 20-3 |
Accordingly, community information and consultation programs, community visits from mine representatives and management, and participation in concerted action frameworks at a regional and provincial level were planned and implemented. Additionally, grievance management mechanisms (grievance reception and processing) to ensure upward and downward communication were defined and implemented.
The Communication Committee of the Essakane Gold Mine (CCME) is made up of representatives from the population, the administration, and the mine (over a hundred participants) who meet each quarter to review concerns of the communities and the completion status on community investments and engagement.
As part of the community investment plan, socio-educational infrastructures are being built (wells, medical centres, schools, etc.). Programs to fight malaria and HIV/AIDS, and increase road safety awareness, were developed for the benefit of neighbouring populations.
Rural development activities (agriculture, animal husbandry, etc.) are primarily undertaken as part of the livelihood restoration program. Since 2014, a community investment program has been financing community projects through communal development plans.
A program of village forests, tree nurseries, and school tree copses has also been developed to promote environmental protection.
The Community Management Program (PMC) encompasses all engagement actions and community development projects of the Community Relation Development Department (DRDC). Key performance indicators of the PMC are reviewed on a quarterly basis.
WASTE AND TAILING DISPOSAL, SITE MONITORING, AND WATER MANAGEMENT
WASTE ROCK DISPOSAL
Storage areas for waste rock have been planned and designed to reduce haulage distances between pit ramp exits and storage areas. These areas were selected following consultation with neighbouring populations in order to minimize the impact on these populations
| IAMGOLD Corporation - Essakane Gold Mine Technical Report NI 43-101 – February 17, 2016 |
Page 20-4 |
(proximity to houses, cemeteries and other archaeological sites, etc.). Finally, the areas were selected to minimize the impact on water resources.
The 2011 FS included the following storage approach:
| • | For the EMZ pit: two waste dumps - the main dump is east of the pit (footprint of approximately 320 ha, height of 104 m, capacity of 380 Mt), the second dump is north of the main pit (footprint of approximately 24 ha, height of 17 m, capacity of 5.2 Mt). |
| • | For the Falagountou pit: one waste rock dump near (north side) the Falagountou pit (footprint of approximately 55 ha, height of 37 m, capacity of 29.6 Mt). |
The plan originating from the 2011 FS will vary since future storage will differ in terms of quantity or even potentially in terms of footprint.
Geochemical and acidogenic studies have demonstrated that the waste is non-acid generating, however, based on the precautionary principle, a runoff water quality monitoring program is in place. Pipes were installed around the main waste dump to collect runoff water and direct it to the ponds.
Supplemental geophysical and geochemical studies will be conducted to potentially revise the final waste deposition.
Progressive rehabilitation of the waste dumps commenced in 2011.
TAILINGS DISPOSAL
The mine tailings site was designed by Golder Associates. The site footprint is 480 ha, delimited by 10 m high x 10 m wide dams with a storage capacity of 124 Mt. To ensure the infrastructure’s stability, daily, monthly, and yearly inspections are carried out. Geochemical studies have shown that tailings are non-acid generating.
A program for environmental monitoring (ground water quality, fauna, and dam stability inspection) and progressive rehabilitation of the tailings site is in place, at and around, the tailings site.
| IAMGOLD Corporation - Essakane Gold Mine Technical Report NI 43-101 – February 17, 2016 |
Page 20-5 |
A tailings site steering committee meets on a regular basis to review the operational monitoring of the tailings site and to provide guidance to improve environmental performance.
SITE MONITORING
A comprehensive monitoring program is in place (at all stages of the life-of-mine) at the site as well as in the neighbouring villages. This program encompasses water quality monitoring (potable water, ground water, domestic waste water, surface water, and community well water), air quality (dust and greenhouse gas emission), soil, biodiversity (fauna and flora), noise, vibration, weather, and follow-up and assessment of the community investment program (health, education, potable water access, agriculture, animal husbandry, etc.).
WATER MANAGEMENT
Potentially contaminated waters from the plant and the washing station (plant) are collected and recycled (zero off-site emission). Runoff water from waste dumps and accumulated water at the pit are collected in ponds and is then used for dust suppression in the mine operating zone.
Tailings are thickened to a density of 60% solids before they are discharged into the tailings site. Water recovered from thickeners, and accumulated water in the tailings site, is reused in the process plant. For domestic waste water processing, an activated sludge method is used at four water treatment plants.
For potable water, to supply the mining camp, three wells were drilled outside the site. Due to the relatively high hardness of the well water, a reverse osmosis treatment plant was installed. All other domestic water is only treated by chlorination.
For industrial water needs, part of the water (40%) is recycled from tailings thickening. Water from the Gorouol River is used to supplement recycled water. A threshold was raised from the Gorouol river bed by 1.5 m creating a reservoir. The water flows by gravity from the river into a buffer reservoir from which water is pumped in storage basins (the mine uses about 8% of the annual river flow). Hydraulic design is based on 100-year floods. A water quality monitoring program (surface water, ground water, industrial water, potable water, and
| IAMGOLD Corporation - Essakane Gold Mine Technical Report NI 43-101 – February 17, 2016 |
Page 20-6 |
domestic waste water) is in place. Additionally, the quantity of water resources is monitored (river flow, water table level, and water meters, etc.). The dykes of the dam and the ponds are inspected regularly (on a daily, monthly, and yearly basis).
MINE CLOSURE REQUIREMENTS AND COSTS
A conceptual rehabilitation and closure plan (PRF) was developed in 2007 and reviewed with the expansion work. Closure costs are estimated at US$62.7M. Closure costs are updated annually, or whenever the mining development plan is amended. In addition, IAMGOLD Essakane S.A. opened an account with the Bank of African (BOA) in which funds are put in escrow as part of the Mining Environment Preservation and Rehabilitation Fund (Order No. 2007-845/PRES/PM/MCE/MEF of December 26, 2007). Notwithstanding this fund, a progressive mining rehabilitation process commenced in 2011, shortly after the start of production.
A closure plan Prefeasibility Study (Closure PFS) will be conducted three years prior to mine closure. This step will involve a complete review of the plan to validate the base information and to verify the status of progressive rehabilitation. At that time, consultations with stakeholders will be organized in order to identify their concerns and interests. The Closure PFS will include a risk analysis and will define the closure and monitoring activities. The Closure PFS should take approximately one year to complete.
A closure plan FS (Closure FS) must be conducted two years prior to the closure of the mine and must be approved by the relevant authorities. Following stakeholder consultation, the Closure FS will define the terms and conditions of all rehabilitation activities, including planning, costs, objectives, objective criteria, environmental monitoring, reporting, and site restoration conditions.
| IAMGOLD Corporation - Essakane Gold Mine Technical Report NI 43-101 – February 17, 2016 |
Page 20-7 |
21 CAPITAL AND OPERATING COSTS
CAPITAL COSTS
The capital cost requirement over the LOM includes the following:
| • | Resource development costs; |
| • | Capitalized waste stripping; |
| • | Sustaining capital expenditures (for mill and site in general); |
| • | Mine equipment additions and replacements; |
| • | Equipment overhaul costs; |
| • | Equipment capital spares (CSPARES); |
| • | Closure and remediation costs. |
A total of $420.6M of capital is planned to be spent over the remaining LOM, which equates to $4.19/t milled or $127/oz of Au.
Capitalized waste stripping (cash portion) is the largest capital cost estimated at $188M, representing 45% of the LOM remaining capital expenditure. Figure 21-1 shows the distribution of capital over the LOM.
| IAMGOLD Corporation - Essakane Gold Mine Technical Report NI 43-101 – February 17, 2016 |
Page 21-1 |
FIGURE 21-1 LOM CAPITAL EXPENDITURES
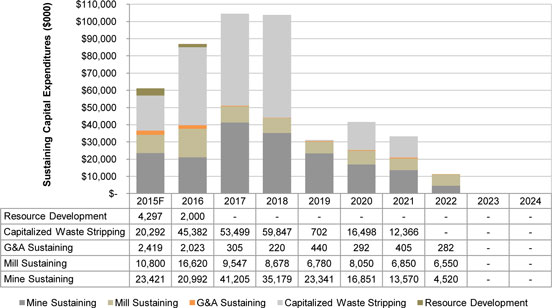
Capital cost estimate breakdowns and explanations are provided below.
RESOURCE DEVELOPMENT
For 2016, a resource development budget of $2.0M has been allocated to continue drilling prospective Inferred Mineral Resources at the Falagountou and EMZ deposits, with no additional funds allocated beyond that. The manpower levels are also forecasted accordingly. Exploration or resource development is treated as a discretionary expense which is renewable every six months. The intent of this measure is to ensure that capital is allocated with caution by progressively advancing strategic development zones. Although capital has not been officially allocated, it is planned that the resource development exploration for Q3 and Q4 of 2016 will focus on the Falagountou East deposit infill drilling program to convert Inferred Mineral Resources into Indicated Mineral Resources, in addition to pursuing efforts at the EMZ South deposit, based on results.
| IAMGOLD Corporation - Essakane Gold Mine Technical Report NI 43-101 – February 17, 2016 |
Page 21-2 |
CAPITAL WASTE STRIPPING
Capitalized waste stripping (CWS), or deferred stripping, is an accounting practice used to capitalize the cost of stripping waste to access future ore for future economic benefits. The definition of deferred stripping and the method of calculating these costs are outlined in IFRIC 20 by the International Accounting Standards Board (IASB).
As of 2016, the entire mine can be divided into nine distinct mining components, as presented in Figure 16-1:
| • | EMZ Phases PH1 to PH5, |
| • | Satellite North 1, |
| • | Falagountou West Phases 1 and 2, and |
| • | Falagountou East. |
Each of these components (i.e., pit or phase) is treated separately when calculating the CWS. The strip ratio over the life of the phase (LOPSR) is determined by dividing the quantity of waste by the quantity of ore for the entirety of the phase, including past mining.
The mining of waste can be considered as a deferred cost if:
| • | The strip ratio for the period exceeds the LOPSR; whereby the waste that exceeds that of the LOPSR is capitalized; |
| • | The stripping does not occur within one year of the end of the life of the phase, which is the case for Satellite North 1. |
The CWS associated tonnages are illustrated in Figure 21-2 as of 2016. Most of the mined waste will be capitalized between 2016 and 2018. Since most of the waste will be completely stripped by 2019, overall waste tonnage costs greatly decrease until 2022, where the CWS will be nil.
| IAMGOLD Corporation - Essakane Gold Mine Technical Report NI 43-101 – February 17, 2016 |
Page 21-3 |
FIGURE 21-2 CAPITALIZED WASTE STRIPPING PER PHASE
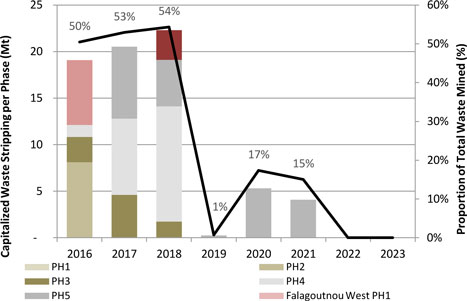
MINE EQUIPMENT CAPITAL EXPENDITURES (LIFE-OF-FLEET)
As part of the mine sustaining capital, a life-of-fleet model has been prepared to track equipment hours and schedule equipment replacements based on useful life assumptions. The major equipment purchase schedule including replacements and additions is presented in Table 21-1.
As of 2016, major equipment purchases require $74.9M of capital, major equipment overhauls require $9.6M, and support equipment purchases require $8.6M, for a total of $93.1M excluding capital spares. The mine equipment capital expenditure profile as of 2016 is presented in Figure 21-3.
| IAMGOLD Corporation - Essakane Gold Mine Technical Report NI 43-101 – February 17, 2016 |
Page 21-4 |
TABLE 21-1 MAJOR EQUIPMENT PURCHASE SCHEDULE
| Equipment Model | Equip. Life (hrs) |
Total Units |
2016 | 2017 | 2018 | 2019 | 2020 | 2021 | 2022- 2024 | |||||||||
| CAT 785 |
75,000 | 3 | - | - | 2 | 1 | - | - | - | |||||||||
| CAT 777 |
75,000 | 1 | - | - | - | - | - | - | - | |||||||||
| CAT 777 WT |
85,000 | 1 | - | 1 | - | - | - | - | - | |||||||||
| CAT 777 Tow Haul |
85,000 | - | - | 1 | - | - | - | - | - | |||||||||
| Tow Haul |
85,000 | 1 | 1 | - | - | - | - | - | - | |||||||||
| CAT 993 |
40,000 | 3 | 1 | 1 | 1 | - | - | - | - | |||||||||
| CAT 390 |
25,000 | 1 | - | 1 | - | - | - | - | - | |||||||||
| CAT 349 |
15,000 | 9 | 1 | 3 | 1 | 3 | 1 | - | - | |||||||||
| CAT 345 w Hammer |
15,000 | 1 | 1 | - | - | - | - | 1 | - | |||||||||
| RH120 |
40,000 | 3 | - | 1 | 1 | 1 | - | - | - | |||||||||
| CAT 16M |
25,000 | 6 | - | 2 | 1 | 1 | 1 | 1 | - | |||||||||
| CAT D9 |
50,000 | 4 | - | 2 | 1 | 1 | - | - | - | |||||||||
| CAT 824 to 844 |
40,000 | 4 | - | 2 | 1 | - | 1 | - | - | |||||||||
| Atlas ROC L8 |
30,000 | 3 | - | 1 | - | 1 | 1 | - | - | |||||||||
| Atlas PV 235 |
30,000 | 4 | - | 2 | 2 | - | - | - | - |
FIGURE 21-3 MINING EQUIPMENT CAPITAL (INCLUDED IN MINE SUSTAINING CAPITAL)
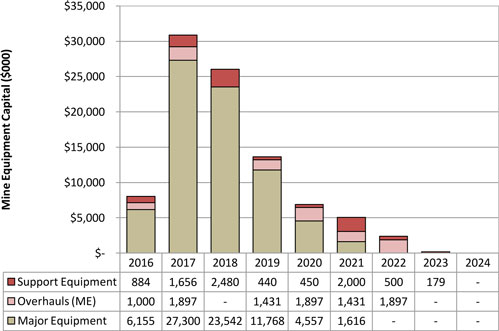
| IAMGOLD Corporation - Essakane Gold Mine Technical Report NI 43-101 – February 17, 2016 |
Page 21-5 |
CLOSURE AND RECLAMATION COSTS
A provision of $62.7M is planned for the closure of Essakane Gold Mine. This feature needs to be thoroughly re-evaluated with the inclusion of termination costs, salvage values, and social programs in the next LOM supported by an updated closure plan.
OPERATING COSTS
The mine operating costs are estimated on the basis of the physical quantities of the mine plan, realistic equipment productivity assumptions, overall equipment efficiencies, and updated consumable prices.
Average mine operating costs over the LOM (2015 included) are estimated at $2.97/t mined and average $2.70/t mined over the next five years. The LOM schedule manages to keep the mining cost around the average throughout the years by carefully selecting waste storage locations, thus minimizing haulage distances. An increase in mining cost is observed for the last two years, as all mining activities occur at greater depth. Fuel represents $0.87/t mined and 0.71 L/t mined over the LOM, which represents 30% of the mine operating cost. The top five mining cost accounts are shown on Figure 21-4.
FIGURE 21-4 TOP FIVE MINING COST CATEGORIES
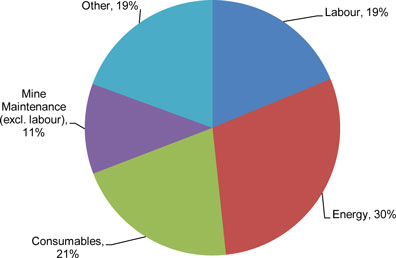
| IAMGOLD Corporation - Essakane Gold Mine Technical Report NI 43-101 – February 17, 2016 |
Page 21-6 |
The average LOM milling cost is estimated to be $13.30/t milled and an average of $13.38/t milled over the next five years. The decrease in milling cost is mainly related to the increasing throughput until the operation reaches a steady state of 12 Mt in 2016. HFO related to power generation is the primary cost and represents 36% of the mill operating cost at $4.75/t milled, followed by maintenance (12%, $1.54/t milled) and cyanide (11%, $1.50/t milled). The top five milling cost categories are presented in Figure 21-5.
FIGURE 21-5 TOP FIVE MILLING COST CATEGORIES
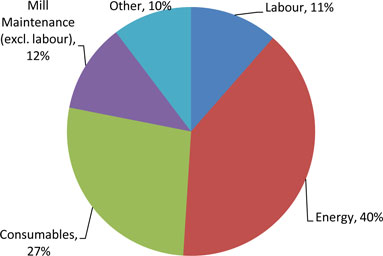
The average LOM G&A cost is $3.55/t milled and assumes processing at a steady rate of 12 Mtpa from 2016. A high proportion of the G&A costs are fixed costs and are difficult to compress should the milling rate decrease. The top five G&A costs for the five year plan represent 64% of the G&A costs, and are detailed as follows: hourly salaries (34%), taxes and permits (9%), insurance (7%), local food (7%), and supervision salaries (7%). The top five G&A cost accounts are shown on Figure 21-7.
| IAMGOLD Corporation - Essakane Gold Mine Technical Report NI 43-101 – February 17, 2016 |
Page 21-7 |
FIGURE 21-6 TOP FIVE G&A COST CATEGORIES
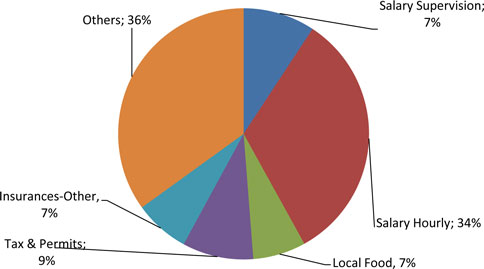
The operating cost metrics per ounce of gold produced are presented in Figure 21-7. The average total cash cost per ounce is $788/oz Au while the all-in sustaining cost (AISC) averages $948/oz Au over the LOM.
FIGURE 21-7 OPERATING COST METRICS
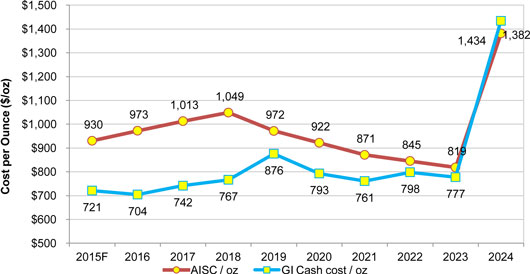
| IAMGOLD Corporation - Essakane Gold Mine Technical Report NI 43-101 – February 17, 2016 |
Page 21-8 |
Note that AISC measures do not have any standardized meaning prescribed by International Financial Reporting Standards (IFRS) and differ from measures determined in accordance with IFRS. AISC is intended to provide additional information and should not be considered in isolation or as a substitute for measures of performance prepared in accordance with IFRS. This measure is not necessarily indicative of net earnings or cash flow from operating activities as determined under IFRS.
| IAMGOLD Corporation - Essakane Gold Mine Technical Report NI 43-101 – February 17, 2016 |
Page 21-9 |
22 ECONOMIC ANALYSIS
This section is not required as the Essakane Gold Mine is currently in production and there is no material expansion of current production.
| IAMGOLD Corporation - Essakane Gold Mine Technical Report NI 43-101 – February 17, 2016 |
Page 22-1 |
23 ADJACENT PROPERTIES
Eurasian Natural Resources Corporation PLC (ENRC, formerly Central African Mining and Exploration Company (CAMEC), Burkina Sarl, and Etablissements Sawadogo Mahamadi et Freres (ESMAF) own the Yedebere, Yevelde, and Falagountou III exploration licences located west and east of the Essakane Exploration Permits. There is no relevant information from these adjacent properties available for disclosure in this report.
| IAMGOLD Corporation - Essakane Gold Mine Technical Report NI 43-101 – February 17, 2016 |
Page 23-1 |
24 OTHER RELEVANT DATA AND
INFORMATION
No additional information or explanation is necessary to make this Technical Report understandable and not misleading.
| IAMGOLD Corporation - Essakane Gold Mine Technical Report NI 43-101 – February 17, 2016 |
Page 24-1 |
25 INTERPRETATION AND CONCLUSIONS
IAMGOLD has the following conclusions and observations:
| ● | Mineral Resources and Mineral Reserves have been prepared in accordance with the CIM definitions. |
| ● | Work completed to date by the geological staff is appropriate. |
| ● | The geological model employed by Essakane S.A. geologists is reasonably well understood and is well supported by field observations in both outcrop and drill intersections. |
| ● | The resource model has been prepared using appropriate methodology and assumptions. These parameters include: |
| ¡ | Treatment of high assays |
| ¡ | Compositing length |
| ¡ | Search parameters |
| ¡ | Bulk density |
| ¡ | Cut-off grade |
| ¡ | Classification |
| ● | The block model has been validated using a reasonable level of rigor consistent with common industry practice. |
| ● | In the opinion of GMSI, the resource evaluation reported herein is a reasonable representation of the Mineral Resources delineated at the Essakane Gold Mine as of December 31, 2015. |
| ● | The current drill spacing in the EMZ deposit is judged adequate to develop a reasonable model of the mineralization distribution and to quantify its volume and quality with a good level of confidence in all three areas of the project. |
| ● | Based on visual verification, the models (Rock Type, Density, and Au Grade) were found to be globally representative of the known geological and structural controls of mineralization of the EMZ deposit. |
| ● | Statistical analysis demonstrates that the block model provides a reasonable estimate of the Mineral Resources of the EMZ deposit. |
| ● | Validation of the block model using different interpolation methods indicated that tonnages, grades, and gold contents are similar. |
| ● | Swath plots for Indicated and Inferred Mineral Resources by vertical sections for the EMZ and North Satellite areas indicate that peaks and lows in gold content generally match peaks and lows in composite frequency; no bias was found in the resource estimate in this regard. |
| IAMGOLD Corporation - Essakane Gold Mine Technical Report NI 43-101 – February 17, 2016 |
Page 25-1 |
| ● | GMSI reviewed the information stored in the Falagountou database and found it to be in good standing. |
| ● | Drill hole spacing on the Falagountou East and West deposits is judged adequate to develop a reasonable model of the mineralization distribution and to quantify its volume and quality with an acceptable level of confidence. |
| ● | The ID3 based Mineral Resource estimate for the Falagountou East and West deposits was found to be a good representation of the drill hole composites. |
| ● | Swath plots for Indicated and Inferred Mineral Resources by vertical sections for the Falagountou East and West deposits indicate that peaks and lows in gold content generally match peaks and lows in composite frequency; no bias was found in the resource estimate in this regard. |
| ● | GMSI concluded that the few composites added to the domains of the EMZ main area would not yield significant change to the previous Essakane S.A. Student’s and Mann-Whitney test results and the previous observations are still applicable to this set of composites. |
| ● | Sampling and assaying have been carried out following standard industry QA/QC practices. These practices include, but are not limited to, sampling, assaying, chain of custody of the samples, sample storage, use of third-party laboratories, standards, blanks, and duplicates. |
| ● | The mine design and Mineral Reserve estimate have been completed to a level appropriate for feasibility studies. |
| ● | The economic assumptions and methodology used for estimation of the Mineral Reserves are appropriate. |
| ● | The Mineral Reserve estimate is consistent with the CIM definitions and is suitable for public reporting. As such, the Mineral Reserves are based on Measured and Indicated Mineral Resources, and do not include any Inferred Mineral Resources. |
| ● | Current production statistics indicated that the process flow sheet is adequate and suitable for processing the Essakane Gold Mine ore types. |
| ● | No outstanding technical issues were identified for environment and permitting. |
| IAMGOLD Corporation - Essakane Gold Mine Technical Report NI 43-101 – February 17, 2016 |
Page 25-2 |
26 RECOMMENDATIONS
IAMGOLD has the following recommendations:
| ● | The litho-structural model of the EMZ deposits should be updated for the next resource estimate in order to reflect new geological observations. |
| ● | GMSI suggests waiting for robust reconciliation data before making any important modifications to the Falagountou deposit block model. |
| ● | GMSI is of the opinion that the ID3 interpolation method for the Falagountou deposit is a better global estimator compared to the OK technique, given the globally higher grades. |
| ● | A recent metallurgical study indicated a risk for significantly lower gold recovery related to the amount of graphitic ore present in future mining zones, according to the LOM. Essakane S.A. has undertaken a mitigation plan that needs to be completed. Additionally, a geometallurgy survey, which is currently ongoing, will help determine where the graphitic ore originates and serve as a basis for better ore mixing prior to the plant feed. |
| IAMGOLD Corporation - Essakane Gold Mine Technical Report NI 43-101 – February 17, 2016 |
Page 26-1 |
27 REFERENCES
Abouchami, W., Boher, M., Michard, A., Albare`de, F., 1990. A major 2.1 Ga old event of mafic magmatism in West Africa: an early stage of crustal accretion. J. Geophys. Res. 95, 17605–17629.
Beziat, D., Dubois, M., Debat, P., Nikiema, S., Salvi, S., Tollon, F., 2008. Gold metallogeny in the Birimian craton of Burkina Faso (West Africa). J. Afr. Earth Sci. 50, pp. 215–233.
Boher, M., Abouchami, W., Michard, A., Albare`de, F., Arndt, T.N., 1992. Crustal growth in West Africa at 2.1 Ga. J. Geophys. Res. 97, pp. 345–369.
Clouston, F., Gignac, L-P., 2014. Mineral Reserve and Resource report on behalf of Iamgold Essakane SA.
Egal, E., Thieblemont, D., Lahondere, D., Guerrot, C., Costea, C. A., Iliescu, D., Delor, C., Goujou, J. C., Lafon, J. M., Tegyey, M., Diaby, S. And Kolie, P., 2002. Late Eburnean granitization and tectonics along the western and northwestern margin of the Archean Kenema-Man Domain (Guinea, West African Craton), Precambrian Research, v.117, pp. 57-84.
Etude de faisabilité du projet d’expansion de la mine d’Essakane – Janvier 2012 (Internal document).
Feybesse, J.L., Billa, M., Guerrot, C., Duguey, E., Lescuyer, J.L., Milesi, J.P., Bouchot, V., 2006. The Paleoproterozoic Ghanaian province: Geodynamic model and ore controls, including regional stress modelling. Precamb. Res. 149, (3-4), pp. 149-196.
Feybesse J.L. and J.P. Milési., 1994. The Archaean/Proterozoic contact zone in West Africa: a mountain belt of decollement thrusting and folding on a continental margin related to 2.1 Ga convergence of Archaean cratons? In Special volume: Proterozoic paleomagnetism and paleogeography, Onstott, Precambrian Research (October), 69(1-4), pp. 199-227.
G Mining Services Inc., 2009. Updated Feasibility Study – Essakane Gold Project Burkina Faso, March 2009, 193 p.
Gignac L. & Al, 2008. Updated Feasibility Study-Essakane Gold Project. Burkina Faso prepared by G Mining Services Inc. on behalf of Orezone Resources Inc.
Golder Associates Ltd., 2008. Technical Specification for the Construction of the Tailings Storage Facility and Water Retention Structures Essakane SA Burkina Faso, West Africa, December 2008.
GRD Minproc (Pty) Ltd, 2007. Essakane Gold Project DFS Report, 86 p.
Kappes Cassiday & Associates, 2006. Essakane Project—Report of Metallurgical Test Work, February 2006, 10 p.
| IAMGOLD Corporation - Essakane Gold Mine Technical Report NI 43-101 – February 17, 2016 |
Page 27-1 |
Lahondere, D., Thieblemont, D., Tegyey, M., Guerrot, C. And Diabate, B., 2002. First evidence of early Birimian (2.21 Ga) volcanic activity in Upper Guinea: the volcanic and associated rocks of the Niani suite, Journal of African Earth Sciences, v. 35, pp. 417-431.
Long, S.D., 1998. Practical Quality Control Procedures in Mineral Inventory Estimation. Explor.Mining.Geol.7 (1-2), pp. 117-127.
McClelland Laboratories, 2007. Report on Gravity/Cyanidation Optimization Testing – Essakane Ore Samples, MLI Job No.3096, March 2007, 54 p.
Milési J-P., Ledru P., Feybesse J-L., Dommanget A. and Marcoux E., 1989. Les minéralisations aurifères de l’Afrique de l’Ouest: leurs relations avec l’évolution lithostructurale au Prétorozoique inférieur. Chronique de la recherche minière, No 497, BRGM, B.P. 6009, 45060, Orléans Cédex2, France.
Nkuna, B., 2009. Ore genesis of the Essakane, Falagountou and Sokadie Au Deposits: Oudalan-Gorouol Greenstone Belt (OGGB), Burkina Faso, West African Craton (WAC). Unpublished Honours Thesis, Johannesburg, 60 p. University of the Witwatersrand,
Piteau Associates Geotechnical and Hydrogeological Consultants, Phase 2 Expansion Feasibility Study, August 2011, Draft Report
Piteau Associates Geotechnical and Hydrogeological Consultants, Essakane Phase 2 Vertical Batter Design Considerations, February 1st 2013, Draft Report
Piteau Associates Geotechnical and Hydrogeological Consultants, Essakane Project-Phase 3 Interramp Pit Slope Design Update, March 7th 2014, Draft Report
Piteau Associates Geotechnical and Hydrogeological Consultants, Essakane Project-Summary of 2013 Geotechnical Drilling and Data Collection Program, October 17th 2013, Draft Report
RSG Global, 2006 Essakane Project: QA/QC Review. Report prepared by RSG Global on behalf of Gold Fields Burkina Faso SARL. 45 p. plus Appendices.
SGS Canada, 2015. An Investigation into the Characterization of Samples from the Essakane Deposit, Project 13647-001, June 2015, 184 p.
SGS Canada, 2014. An Investigation into the Characterization of Five Samples from the Falagountou Deposit, Project 14330-001, May 2014, 53 p.
SGS Canada, 2011. An Investigation of Gold Recovery from a Series of Essakane Project Samples, Project 11465-002, July 2011, 87 p.
SGS Johannesburg, 2005. Laboratory Testwork to Evaluate the Recovery of Gold from Ore Sources Originating from the Essakane Deposit in Burkina Faso, MET05/M61, July 2005, 68 p.
SRK Consulting, Essakane Pit: Geotechnical Slope Designs, Fresh Rock, June 26 2015, Draft report.
| IAMGOLD Corporation - Essakane Gold Mine Technical Report NI 43-101 – February 17, 2016 |
Page 27-2 |
SRK Consulting, Falagountou Pit: Slope Designs and implementation requirements, September 19, 2015, Draft report.
Tshibubudze, A., 2007. Relative Timing of Structural Events: The Markoye Fault and its Association to Gold Mineralization. Unpublished Honors Thesis, University of the Witwatersrand, Johannesburg, 78 p.
Tshibubudze, A., Hein, K.A.A., Marquis, P., 2009. The Markoye shear zone in NE Burkina Faso. Journal of African Earth Sciences 55, pp. 245–256.
Tshibubudze, A., Hein, K.A.A., 2010. Tectonic evolution of the Oudalan-Gorouol greenstone belt in northeast Burkina Faso and Niger, West African craton. Geophysical Research Abstracts 12, EGU2010-708 (2010 EGU General Assembly 2010, ISSN of eISSN: 1607–7962).
| IAMGOLD Corporation - Essakane Gold Mine Technical Report NI 43-101 – February 17, 2016 |
Page 27-3 |
28 DATE AND SIGNATURE PAGE
This report titled “Technical Report on the Essakane Gold Mine, Sahel Region, Burkina Faso (effective December 31, 2015)” and dated February 17, 2016 was prepared and signed by the following authors:
| (Signed & Sealed) “Lise Chénard” | ||
| Dated at Longueuil, QC |
Lise Chénard, ing. | |
| February 17, 2016 |
Director Mining Geology | |
| IAMGOLD Corporation | ||
| (Signed & Sealed) “Réjean Sirois” | ||
| Dated at Brossard, QC |
Réjean Sirois, P.Eng. | |
| February 17, 2016 |
Vice President Geology and Resources | |
| G Mining Services Inc. | ||
| (Signed & Sealed) “Louis-Pierre Gignac” | ||
| Dated at Brossard, QC |
Louis-Pierre Gignac, M.Sc.A., ing. | |
| February 17, 2016 |
Vice President Mining Engineering | |
| G Mining Services Inc. | ||
| (Signed & Sealed) “Jérôme Girard” | ||
| Dated at Longueuil, QC |
Jérôme Girard, ing., P. Eng. | |
| February 17, 2016 |
Manager of Metallurgy | |
| IAMGOLD Corporation | ||
| (Signed & Sealed) “Philippe Gaultier” | ||
| Dated at Longueuil, QC |
Philippe Gaultier, ing. | |
| February 17, 2016 |
Director of Projects Development | |
| IAMGOLD Corporation | ||
| (Signed & Sealed) “Gilles Ferlatte” | ||
| Dated at Essakane SA, Burkina Faso |
Gilles Ferlatte, ing. | |
| February 17, 2016 |
Vice-President and General Manager | |
| IAMGOLD Essakane SA | ||
| (Signed & Sealed) “Bruno Lemelin” | ||
| Dated at Essakane SA, Burkina Faso |
Bruno Lemelin, Ph.D., ing., P.Eng | |
| February 17, 2016 |
Operations Manager | |
| IAMGOLD Essakane SA | ||
| IAMGOLD Corporation - Essakane Gold Mine Technical Report NI 43-101 – February 17, 2016 |
Page 28-1 |
29 CERTIFICATE OF QUALIFIED PERSON
LISE CHÉNARD
I, Lise Chénard, ing., as an author of this report entitled “Technical Report on the Essakane Gold Mine, Sahel Region, Burkina Faso effective December 31, 2015” dated February 17, 2016, do hereby certify that:
| 1. | I am the Director Mining Geology with IAMGOLD Corporation,1111, St. Charles Street West, Longueuil, QC, Canada, J4K 5G4; |
| 2. | I am a graduate of Laval University, Quebec; in 1980 with a BSc. A. in Geological Engineering. |
| 3. | I am registered as a Geological Engineer in the Province of Quebec (OIQ #034896). I have practised for a total of 35 years as a geological engineer since my graduation, in mine geology, advanced projects and consulting. I have completed, supervised, and revised numerous resource estimates for gold, base metals, and rare earth which correspond to my relevant experience for the purpose of the Technical Report. |
| 4. | I have read the definition of “qualified person” set out in National Instrument 43-101 (NI 43-101) and certify that by reason of my education, affiliation with a professional association (as defined in NI 43-101) and past relevant work experience, I fulfill the requirements to be a “qualified person” for the purposes of NI 43-101. |
| 5. | I have visited the Essakane Gold Mine multiple times since 2013, most recently on September 29, 2015. |
| 6. | I am responsible for Sections 1 to 11, 19, and 23 to 27 of the Technical Report. |
| 7. | I have been working for IAMGOLD since 2013 as Director Mining Geology. I am a full–time employee of IAMGOLD Corporation, Canada and I own shares of IAMGOLD Corporation. |
| 8. | I am not independent of IAMGOLD Corporation as set out in Section 1.5 of NI 43-101, as per NI 43-101 s.8.1(2)(f), as I am a full-time employee. |
| 9. | I have read NI 43-101, and the part of the Technical Report for which I am responsible has been prepared in compliance with NI 43-101 and Form 43-101F1. |
| IAMGOLD Corporation - Essakane Gold Mine Technical Report NI 43-101 – February 17, 2016 |
Page 29-1 |
| 10. | At the effective date of the Technical Report, to the best of my knowledge, information, and belief, Sections 1 to 11, 19, and 23 to 27 of the Technical Report for which I am responsible contain all scientific and technical information that is required to be disclosed to make the Technical Report not misleading. |
Dated this 17th day of February, 2016
(Signed & Sealed) “Lise Chénard”
Lise Chénard, ing. (OIQ #034896)
Director, Mining Geology
IAMGOLD Corporation
| IAMGOLD Corporation - Essakane Gold Mine Technical Report NI 43-101 – February 17, 2016 |
Page 29-2 |
RÉJEAN SIROIS
I, Réjean Sirois, P.Eng., as an author of this report entitled “Technical Report on the Essakane Gold Mine, Sahel Region, Burkina Faso effective December 31, 2015” dated February 17, 2016, do hereby certify that:
| 1. | I am a Geological Engineer acting as Vice President Geology and Resources for G Mining Services Inc with an office at 7900 Taschereau Blvd, Building D, Suite 200, Brossard, Quebec, Canada J4X 1C2. |
| 2. | I am a graduate of l’Université du Québec à Chicoutimi with a B.Sc. (Geological Engineering) in 1983. |
| 3. | I am a Professional Engineer registered with the “Ordre des ingénieurs du Québec” (OIQ #38754). I have worked as a geological engineer for a total of 30 years since my graduation. My relevant experience for the purpose of the Technical Report is: |
| ● | I have been involved with the Essakane Gold Mine since the acquisition of Orezone by IAMGOLD in 2009. |
| ● | I have practised my profession continuously since 1985 and have extensive experience in estimating mineral resources for all kinds of deposits located in South and North America as well as in Southern and West Africa. |
| 4. | I have read the definition of “qualified person” set out in National Instrument 43-101 (NI 43-101) and certify that by reason of my education, affiliation with a professional association (as defined in NI 43-101) and past relevant work experience, I fulfill the requirements to be a “qualified person” for the purposes of NI 43-101. |
| 5. | I visited the Essakane Gold Mine and the Falagountou deposits on February 11-12, 2015 and November 10-17, 2015. |
| 6. | I am responsible for Sections 12 and 14 of the Technical Report. |
| 7. | I am independent of IAMGOLD Corporation as set out in Section 1.5 of NI43-101, as per NI 43-101 s.8.1(2)(f). |
| 8. | I have prior involvement with the property that is the subject of the Technical Report since I was an Employee of IAMGOLD between 1987 and 2012 and the resources and reserves of the Essakane mine was under my responsibilities as former Manager of Mining Geology between 2008 and 2012. |
| 9. | I have read NI 43-101, and the part of the Technical Report for which I am responsible has been prepared in compliance with NI 43-101 and Form 43-101F1. |
| IAMGOLD Corporation - Essakane Gold Mine Technical Report NI 43-101 – February 17, 2016 |
Page 29-3 |
| 10. | At the effective date of the Technical Report, to the best of my knowledge, information, and belief, Sections 12 and 14 of the Technical Report for which I am responsible contain all scientific and technical information that is required to be disclosed to make the Technical Report not misleading. |
Dated this 17th day of February, 2016
(Signed & Sealed) “Réjean Sirois”
Réjean Sirois, P.Eng. (OIQ-Licence: 38754)
Vice President Geology and Resources
G Mining Services Inc.
| IAMGOLD Corporation - Essakane Gold Mine Technical Report NI 43-101 – February 17, 2016 |
Page 29-4 |
LOUIS-PIERRE GIGNAC
I, Louis-Pierre Gignac, M.Sc.A, ing., as an author of this report entitled “Technical Report on the Essakane Gold Mine, Sahel Region, Burkina Faso effective December 31, 2015” dated February 17, 2016, do hereby certify that:
| 1. | I am the Vice President Mining Engineering with G Mining Services Inc, 7900 Taschereau Blvd, Building D, Suite 200, Brossard, QC, Canada, J4X 1C2; |
| 2. | I am a graduate of Mc Gill University, Montreal, with a Bachelor of Mining Engineering in 1999, and a Master in Applied Science in Industrial Engineering from École Polytechnique de Montréal in 2002. |
| 3. | I am a Professional Engineer registered with the Ordre des Ingénieurs du Québec (OIQ #132995) and CIM member and holder of a CFA charter. I have worked as a mining engineer continuously since 2002. My relevant experience for the purpose of the Technical Report is: |
| ● | I have been involved with the Essakane Project since 2007 and co-author of the June 2008 Updated Feasibility Study |
| ● | I was responsible for the mining engineering for internal Feasibility Report for Essakane Expansion to 10.8 Mtpa |
| 4. | I have read the definition of “qualified person” set out in National Instrument 43-101 (NI 43-101) and certify that by reason of my education, affiliation with a professional association (as defined in NI 43-101) and past relevant work experience, I fulfill the requirements to be a “qualified person” for the purposes of NI 43-101. |
| 5. | I visited the Essakane Gold Mine most recently on August 2, 2015. |
| 6. | I am responsible for Sections 15 and 16 of the Technical Report. |
| 7. | I have been working for G Mining Services Inc. since 2007. |
| 8. | I am independent of IAMGOLD Corporation as set out in Section 1.5 of NI43-101, as per NI 43-101 s.8.1(2)(f). |
| 9. | I have read NI 43-101, and the part of the Technical Report for which I am responsible has been prepared in compliance with NI 43-101 and Form 43-101F1. |
| 10. | At the effective date of the Technical Report, to the best of my knowledge, information, and belief, Sections 15 and 16 of the Technical Report for which I am responsible contain all scientific and technical information that is required to be disclosed to make the Technical Report not misleading. |
Dated this 17th day of February, 2016
(Signed & Sealed) “Louis-Pierre Gignac”
Louis-Pierre Gignac, M.Sc.A., ing. (OIQ #132995)
Vice-President Mining Engineering
G Mining Services Inc.
| IAMGOLD Corporation - Essakane Gold Mine Technical Report NI 43-101 – February 17, 2016 |
Page 29-5 |
JÉRÔME GIRARD
I, Jérôme Girard, ing., P. Eng., as an author of this report entitled “Technical Report on the Essakane Gold Mine, Sahel Region, Burkina Faso effective December 31, 2015” dated February 17, 2016, do hereby certify that:
| 1. | I am the Manager of Metallurgy with IAMGOLD Corporation,1111, St. Charles Street West, Longueuil, QC, Canada, J4K 5G4; |
| 2. | I am a graduate of Laval University, Quebec; in 1995 with a BSc. Eng. Materials and Metallurgy; |
| 3. | I am registered as a Metallurgical Engineer in the Province of Quebec (OIQ #116471) and Ontario (PEO # 100160489). I have worked as a metallurgical engineer in mineral processing for a total of 20 years since my graduation. My relevant experience for the purpose of the Technical Report is: |
| ● | Essakane Comminution circuit audit (June 2015) |
| ● | Characterization of samples from the Essakane deposit (June 9, 2015) |
| 4. | I have read the definition of “qualified person” set out in National Instrument 43-101 (NI 43-101) and certify that by reason of my education, affiliation with a professional association (as defined in NI 43-101) and past relevant work experience, I fulfill the requirements to be a “qualified person” for the purposes of NI 43-101. |
| 5. | I visited the Essakane Gold Mine most recently in June and August 2015. |
| 6. | I am responsible for Sections 13 and 17 of the Technical Report. |
| 7. | As a Manager, Metallurgy since 2012, I am a full-time employee of IAMGOLD Corporation, Canada and I own shares of IAMGOLD Corporation. |
| 8. | I am not independent of IAMGOLD Corporation as set out in Section 1.5 of NI 43-101, as per NI 43-101 s.8.1(2)(f), as I am a full-time employee. |
| 9. | I have read NI 43-101, and the part of the Technical Report for which I am responsible has been prepared in compliance with NI 43-101 and Form 43-101F1. |
| 10. | At the effective date of the Technical Report, to the best of my knowledge, information, and belief, Sections 13 and 17 of the Technical Report for which I am responsible contain all scientific and technical information that is required to be disclosed to make the Technical Report not misleading. |
Dated this 17th day of February, 2016
(Signed & Sealed) “Jérôme Girard”
Jérôme Girard, ing., P. Eng. (OIQ # 116471) (PEO # 100160489)
Manager, Metallurgy
IAMGOLD Corporation
| IAMGOLD Corporation - Essakane Gold Mine Technical Report NI 43-101 – February 17, 2016 |
Page 29-6 |
PHILIPPE GAULTIER
I, Philippe Gaultier, ing., as an author of this report entitled “Technical Report on the Essakane Gold Mine, Sahel Region, Burkina Faso effective December 31, 2015” dated February 17, 2016, do hereby certify that:
| 1. | I am the Director of Projects Development with IAMGOLD Corporation,1111, St. Charles Street West, Longueuil, QC, Canada, J4K 5G4; |
| 2. | I am a graduate of University of Manitoba, Manitoba; in 1988 with a BSc. Mechanical Engineering and University of Toronto, Ontario (MASc Mechanical Engineering) |
| 3. | I am registered as a Mechanical Engineer in the Province of Quebec (OIQ #130381). I have worked as a mechanical engineer for a total of twenty eight years since my graduation. My relevant experience for the purpose of the Technical Report is: |
| ● | Infrastructure and Plant Engineering for internal Feasibility Report for Essakane Expansion to 10.8 Mtpa |
| ● | General Manager of Construction of Essakane Expansion in 2013 |
| 4. | I have read the definition of “qualified person” set out in National Instrument 43-101 (NI 43-101) and certify that by reason of my education, affiliation with a professional association (as defined in NI 43-101) and past relevant work experience, I fulfill the requirements to be a “qualified person” for the purposes of NI 43-101. |
| 5. | I visited the Essakane Gold Mine most recently on August 26, 2015. |
| 6. | I am responsible for Section 18 of the Technical Report. |
| 7. | I have been working for IAMGOLD Corporation since 2008. As a Director Development Projects, since 2014, I am a full-time employee of IAMGOLD Corporation, Canada and I own shares of IAMGOLD Corporation. |
| 8. | I am not independent of IAMGOLD Corporation as set out in Section 1.5 of NI 43-101, as per NI 43-101 s.8.1(2)(f), as I am a full-time employee. |
| 9. | I have read NI 43-101, and the part of the Technical Report for which I am responsible has been prepared in compliance with NI 43-101 and Form 43-101F1. |
| 10. | At the effective date of the Technical Report, to the best of my knowledge, information, and belief, Section 18 in the Technical Report for which I am responsible contains all scientific and technical information that is required to be disclosed to make the Technical Report not misleading. |
Dated this 17th day of February, 2016
(Signed & Sealed) “Philippe Gaultier”
Philippe Gaultier, M.A.Sc., ing. (OIQ #130381)
Director of Project Development
IAMGOLD Corporation
| IAMGOLD Corporation - Essakane Gold Mine Technical Report NI 43-101 – February 17, 2016 |
Page 29-7 |
GILLES FERLATTE
I, Gilles Ferlatte, ing., as an author of this report entitled “Technical Report on the Essakane Gold Mine, Sahel Region, Burkina Faso effective December 31, 2015” dated February 17, 2016, do hereby certify that:
| 1. | I am the Vice-President and General Manager of IAMGOLD Essakane SA, Burkina Faso, 146, rue 13.49, quartier Zogona, 09 BP 11 Ouagadougou 09. |
| 2. | I am a graduate of Laval University, Quebec (B. Eng. Mining) in 1991. |
| 3. | I am registered as a Mining Engineer in the Province of Quebec (OIQ #108692) and I am a member of the Canadian Institute of Mining and Metallurgy. |
| 4. | I have practised my profession of mining engineer continuously for the last 24 years in the fields of base metals, niobium, and gold. My relevant experience for the purpose of the Technical Report is my position of Vice-President and General Manager since January 2014. |
| 5. | I have read the definition of “qualified person” set out in National Instrument 43-101 (NI 43-101) and certify that by reason of my education, affiliation with a professional association (as defined in NI 43-101) and past relevant work experience, I fulfill the requirements to be a “qualified person” for the purposes of NI 43-101. |
| 6. | I am responsible for Section 20 of the Technical Report. |
| 7. | I have been working for IAMGOLD Corporation since 2011. As Vice-President and General Manager of IAMGOLD Essakane SA since 2014, I am a full-time employee IAMGOLD Essakane SA, Burkina Faso and I own shares of IAMGOLD Corporation. |
| 8. | I am not independent of IAMGOLD Corporation as set out in Section 1.5 of NI 43-101, as per NI 43-101 s.8.1(2)(f), as I am a full-time employee. |
| 9. | I have read NI 43-101, and the part of the Technical Report for which I am responsible has been prepared in compliance with NI 43-101 and Form 43-101F1. |
| 10. | At the effective date of the Technical Report, to the best of my knowledge, information, and belief, Section 20 of the Technical Report for which I am responsible contains all scientific and technical information that is required to be disclosed to make the Technical Report not misleading. |
Dated this 17th day of February, 2016
(Signed & Sealed) “Gilles Ferlatte”
Gilles Ferlatte, ing. (OIQ # 108692)
Vice-President and General Manager
IAMGOLD Essakane SA
| IAMGOLD Corporation - Essakane Gold Mine Technical Report NI 43-101 – February 17, 2016 |
Page 29-8 |
BRUNO LEMELIN
I, Bruno Lemelin, Ph.D., ing., P.Eng. as an author of this report entitled “Technical Report on the Essakane Gold Mine, Sahel Region, Burkina Faso effective December 31, 2015” dated February 17, 2016, do hereby certify that;
| 1. | I am the Operations Manager of IAMGOLD Essakane SA, Burkina Faso, 146, rue 13.49, quartier Zogona, 09 BP 11 Ouagadougou 09. |
| 2. | I am a graduate of Laval University, Quebec (B. Eng. Mining) in 1998. |
| 3. | I am registered as a Mining Engineer in the Province of Quebec (OIQ #123831) and in the Province of Ontario (PEO# 100056873). |
| 4. | I have practised my profession of mining engineer continuously for the last 14 years in the fields of base metals and gold. My relevant experience for the purpose of the Technical Report is my position of Operations Manager since April 2014. |
| 5. | I have read the definition of “qualified person” set out in National Instrument 43-101 (NI 43-101) and certify that by reason of my education, affiliation with a professional association (as defined in NI 43-101) and past relevant work experience, I fulfill the requirements to be a “qualified person” for the purposes of NI 43-101. |
| 6. | I am responsible for Sections 21 and 22 of the Technical Report. |
| 7. | I have been working for IAMGOLD Corporation since 2014. As Operations Manager of IAMGOLD Essakane SA since 2014, I am a full-time employee IAMGOLD Essakane SA, Burkina Faso and I own shares of IAMGOLD Corporation. |
| 8. | I am not independent of IAMGOLD Corporation as set out in Section 1.5 of NI 43-101, as per NI 43-101 s.8.1(2)(f), as I am a full-time employee. |
| 9. | I have read NI 43-101, and the part of the Technical Report for which I am responsible has been prepared in compliance with NI 43-101 and Form 43-101F1. |
| 10. | At the effective date of the Technical Report, to the best of my knowledge, information, and belief, Sections 21 and 22 of the Technical Report for which I am responsible contain all scientific and technical information that is required to be disclosed to make the Technical Report not misleading. |
Dated this 17th day of February, 2016
(Signed & Sealed) “Bruno Lemelin”
Bruno Lemelin, Ph.D., ing., P.Eng. (OIQ # 123831)
Operations Manager
IAMGOLD Essakane SA
| IAMGOLD Corporation - Essakane Gold Mine Technical Report NI 43-101 – February 17, 2016 |
Page 29-9 |
Serious News for Serious Traders! Try StreetInsider.com Premium Free!
You May Also Be Interested In
- Orezone Intersects 18.41 g/t Gold Over 8.00m and 22.17 g/t Gold Over 4.00m in Ongoing Exploration
- IAMGOLD (IAG) PT Raised to $3.75 at Scotiabank
- IAMGOLD Corp (IMG:CN) (IAG) PT Raised to Cdn$6.50 at National Bank Financial
Create E-mail Alert Related Categories
SEC FilingsSign up for StreetInsider Free!
Receive full access to all new and archived articles, unlimited portfolio tracking, e-mail alerts, custom newswires and RSS feeds - and more!
