

Form 8-K Monster Beverage Corp For: Jan 12
 Tweet
Tweet Share
Share
UNITED STATES
SECURITIES AND EXCHANGE COMMISSION
Washington, D.C. 20549
FORM 8-K
CURRENT REPORT
Pursuant to Section 13 or 15(d) of the
Securities Exchange Act of 1934
Date of Report (Date of earliest event reported): January 12, 2016
Monster Beverage Corporation
(Exact name of registrant as specified in its charter)
Delaware
(State or other jurisdiction of incorporation)
|
0-18761 |
|
39-1679918 |
|
(Commission File Number) |
|
(IRS Employer Identification No.) |
1 Monster Way
Corona, California 92879
(Address of principal executive offices and zip code)
(951) 739 - 6200
(Registrant’s telephone number, including area code)
N/A
(Former name or former address, if changed since last report)
Check the appropriate box below if the Form 8-K filing is intended to simultaneously satisfy the filing obligation of the registrant under any of the following provisions:
o Written communications pursuant to Rule 425 under the Securities Act (17 CFR 230.425)
o Soliciting material pursuant to Rule 14a-12 under the Exchange Act (17 CFR 240.14a-12)
o Pre-commencement communications pursuant to Rule 14d-2(b) under the Exchange Act (17 CFR 240.14d-2(b))
o Pre-commencement communications pursuant to Rule 13e-4(c) under the Exchange Act (17 CFR 240.13e-4(c))
Item 7.01. Regulation FD Disclosure.
On January 12, 2016, Rodney C. Sacks, Chairman and Chief Executive Officer, and Hilton H. Schlosberg, Vice Chairman, President and Chief Financial Officer, of Monster Beverage Corporation (the “Company”) will host an investor meeting to provide an update on the Company’s business and operations at the Nasdaq Marketsite.
The Company’s presentation will be open to all interested parties as a live webcast at approximately 4:45 p.m. Eastern Time on the “Events & Presentation” section of the Company’s website at www.monsterbevcorp.com. A copy of the slides that will be used in the meeting is furnished as Exhibit 99.1 hereto.
Item 9.01. Financial Statements and Exhibits.
(d) Exhibits
The following exhibit is furnished herewith:
Exhibit 99.1 Presentation slides.
SIGNATURES
Pursuant to the requirements of the Securities Exchange Act of 1934, the registrant has duly caused this report to be signed on its behalf by the undersigned hereunto duly authorized.
|
|
Monster Beverage Corporation |
|
|
|
|
|
|
|
Date: January 12, 2016 |
/s/ Hilton H. Schlosberg |
|
|
Hilton H. Schlosberg |
|
|
Vice Chairman of the Board of Directors, |
|
|
President and Chief Financial Officer |
Exhibit 99.1
[LOGO]

Certain statements made in this presentation may constitute “forward-looking statements” within the meaning of the U.S. federal securities laws, as amended, regarding the expectations of management with respect to Monster Beverage Corporation's (the "Company's") future operating results and other future events including revenues and profitability. The Company cautions that these statements are based on management’s current knowledge and expectations and are subject to certain risks and uncertainties, many of which are outside of the control of the Company, that could cause actual results and events to differ materially from the statements made herein. Such risks and uncertainties include, but are not limited to, the following: our ability to recognize benefits from The Coca-Cola Company transactions; unanticipated litigation concerning the Company’s products; changes in consumer preferences; changes in demand due to both domestic and international economic conditions; activities and strategies of competitors, including the introduction of new products and competitive pricing and/or marketing of similar products; actual performance of the parties under the new distribution agreements; potential disruptions arising out of the transition of certain territories to new distributors; changes in sales levels by existing distributors; unanticipated costs incurred in connection with the termination of existing distribution agreements or the transition to new distributors; changes in the price and/or availability of raw materials; other supply issues, including the availability of products and/or suitable production facilities; product distribution and placement decisions by retailers; changes in governmental regulation; the imposition of new and/or increased excise and/or sales or other taxes on our products; criticism of energy drinks and/or the energy drink market generally; our ability to satisfy all criteria set forth in any U.S. model energy drink guidelines; the impact of proposals to limit or restrict the sale of energy drinks to minors and/or persons below a specified age and/or restrict the venues and/or the size of containers in which energy drinks can be sold; political, legislative or other governmental actions or events, including the outcome of any state attorney general and/or government or quasi-government agency inquiries, in one or more regions in which we operate. For a more detailed discussion of these and other risks that could affect our operating results, see the Company’s reports filed with the Securities and Exchange Commission, including the Company's most recent annual report on Form 10-K filed March 2, 2015 and subsequently filed quarterly reports on Form 10-Q. The Company’s actual results could differ materially from those contained in the forward-looking statements. The Company assumes no obligation to update any forward-looking statements, whether as a result of new information, future events or otherwise. Safe Harbor Statement
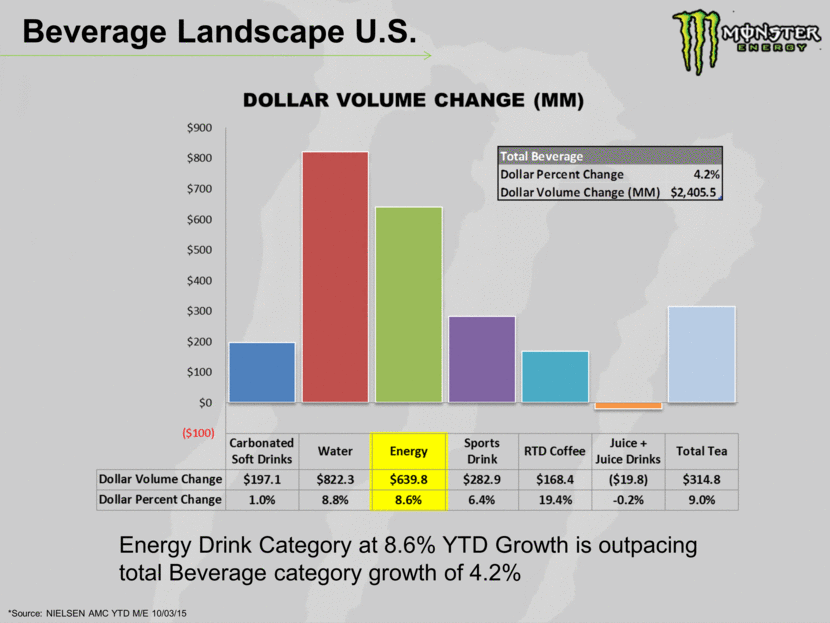
Beverage Landscape U.S. *Source: NIELSEN AMC YTD M/E 10/03/15 Energy Drink Category at 8.6% YTD Growth is outpacing total Beverage category growth of 4.2%
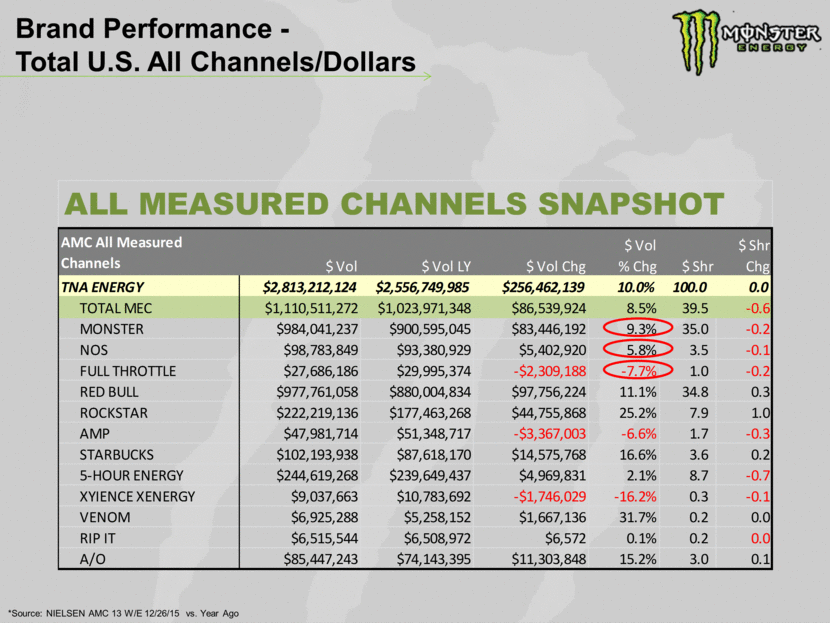
Brand Performance - Total U.S. All Channels/Dollars *Source: NIELSEN AMC 13 W/E 12/26/15 vs. Year Ago ALL MEASURED CHANNELS SNAPSHOT AMC All Measured Channels $ Vol $ Vol LY $ Vol Chg $ Vol % Chg $ Shr $ Shr Chg TNA ENERGY $2,813,212,124 $2,556,749,985 $256,462,139 10.0% 100.0 0.0 TOTAL MEC $1,110,511,272 $1,023,971,348 $86,539,924 8.5% 39.5 -0.6 MONSTER $984,041,237 $900,595,045 $83,446,192 9.3% 35.0 -0.2 NOS $98,783,849 $93,380,929 $5,402,920 5.8% 3.5 -0.1 FULL THROTTLE $27,686,186 $29,995,374 -$2,309,188 -7.7% 1.0 -0.2 RED BULL $977,761,058 $880,004,834 $97,756,224 11.1% 34.8 0.3 ROCKSTAR $222,219,136 $177,463,268 $44,755,868 25.2% 7.9 1.0 AMP $47,981,714 $51,348,717 -$3,367,003 -6.6% 1.7 -0.3 STARBUCKS $102,193,938 $87,618,170 $14,575,768 16.6% 3.6 0.2 5-HOUR ENERGY $244,619,268 $239,649,437 $4,969,831 2.1% 8.7 -0.7 XYIENCE XENERGY $9,037,663 $10,783,692 -$1,746,029 -16.2% 0.3 -0.1 VENOM $6,925,288 $5,258,152 $1,667,136 31.7% 0.2 0.0 RIP IT $6,515,544 $6,508,972 $6,572 0.1% 0.2 0.0 A/O $85,447,243 $74,143,395 $11,303,848 15.2% 3.0 0.1
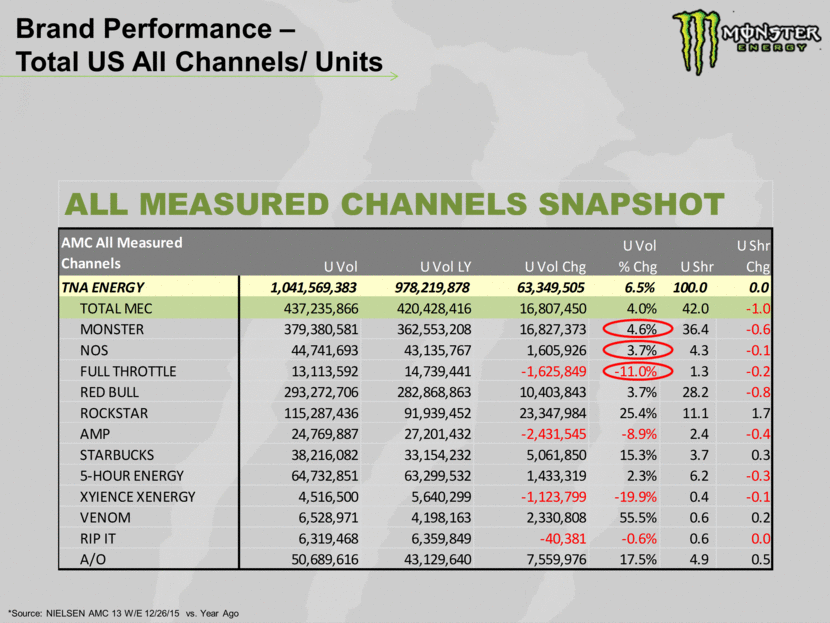
Brand Performance – Total US All Channels/ Units *Source: NIELSEN AMC 13 W/E 12/26/15 vs. Year Ago ALL MEASURED CHANNELS SNAPSHOT AMC All Measured Channels U Vol U Vol LY U Vol Chg U Vol % Chg U Shr U Shr Chg TNA ENERGY 1,041,569,383 978,219,878 63,349,505 6.5% 100.0 0.0 TOTAL MEC 437,235,866 420,428,416 16,807,450 4.0% 42.0 -1.0 MONSTER 379,380,581 362,553,208 16,827,373 4.6% 36.4 -0.6 NOS 44,741,693 43,135,767 1,605,926 3.7% 4.3 -0.1 FULL THROTTLE 13,113,592 14,739,441 -1,625,849 -11.0% 1.3 -0.2 RED BULL 293,272,706 282,868,863 10,403,843 3.7% 28.2 -0.8 ROCKSTAR 115,287,436 91,939,452 23,347,984 25.4% 11.1 1.7 AMP 24,769,887 27,201,432 -2,431,545 -8.9% 2.4 -0.4 STARBUCKS 38,216,082 33,154,232 5,061,850 15.3% 3.7 0.3 5-HOUR ENERGY 64,732,851 63,299,532 1,433,319 2.3% 6.2 -0.3 XYIENCE XENERGY 4,516,500 5,640,299 -1,123,799 -19.9% 0.4 -0.1 VENOM 6,528,971 4,198,163 2,330,808 55.5% 0.6 0.2 RIP IT 6,319,468 6,359,849 -40,381 -0.6% 0.6 0.0 A/O 50,689,616 43,129,640 7,559,976 17.5% 4.9 0.5
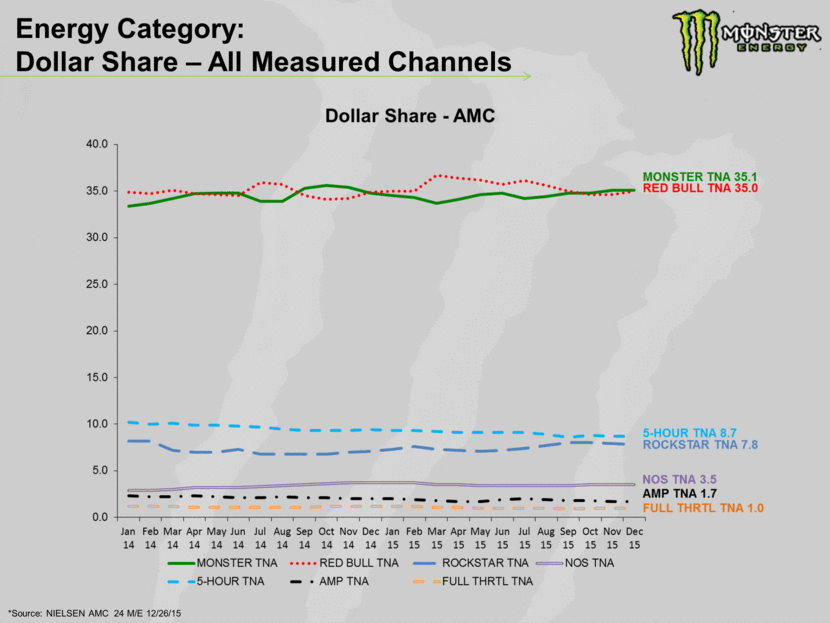
Energy Category: Dollar Share – All Measured Channels *Source: NIELSEN AMC 24 M/E 12/26/15
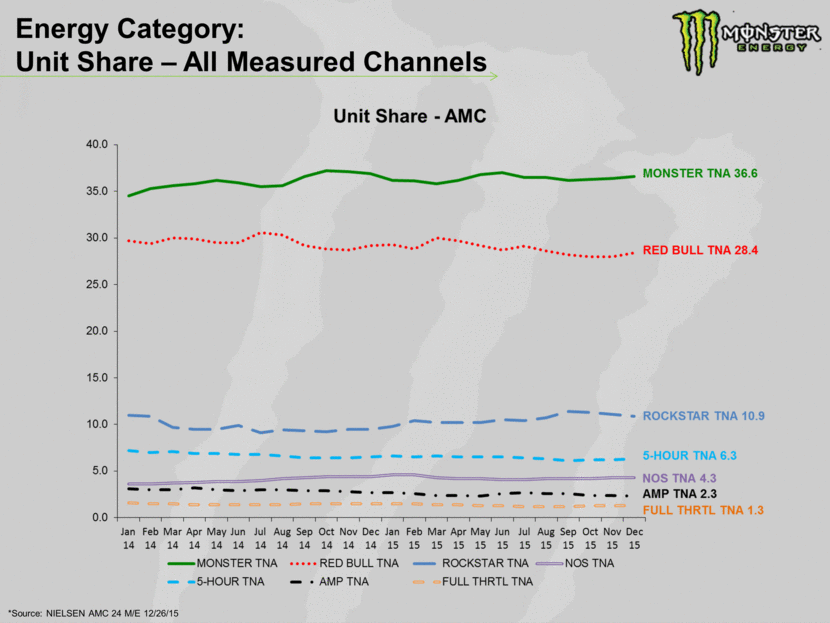
Energy Category: Unit Share – All Measured Channels *Source: NIELSEN AMC 24 M/E 12/26/15
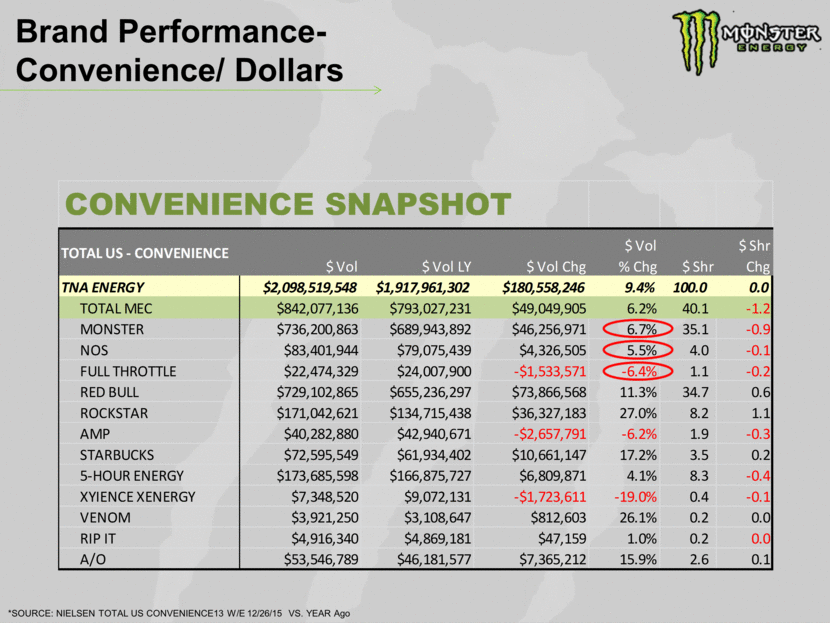
Brand Performance- Convenience/ Dollars *SOURCE: NIELSEN TOTAL US CONVENIENCE13 W/E 12/26/15 VS. YEAR Ago CONVENIENCE SNAPSHOT TOTAL US - CONVENIENCE $ Vol $ Vol LY $ Vol Chg $ Vol % Chg $ Shr $ Shr Chg TNA ENERGY $2,098,519,548 $1,917,961,302 $180,558,246 9.4% 100.0 0.0 TOTAL MEC $842,077,136 $793,027,231 $49,049,905 6.2% 40.1 -1.2 MONSTER $736,200,863 $689,943,892 $46,256,971 6.7% 35.1 -0.9 NOS $83,401,944 $79,075,439 $4,326,505 5.5% 4.0 -0.1 FULL THROTTLE $22,474,329 $24,007,900 -$1,533,571 -6.4% 1.1 -0.2 RED BULL $729,102,865 $655,236,297 $73,866,568 11.3% 34.7 0.6 ROCKSTAR $171,042,621 $134,715,438 $36,327,183 27.0% 8.2 1.1 AMP $40,282,880 $42,940,671 -$2,657,791 -6.2% 1.9 -0.3 STARBUCKS $72,595,549 $61,934,402 $10,661,147 17.2% 3.5 0.2 5-HOUR ENERGY $173,685,598 $166,875,727 $6,809,871 4.1% 8.3 -0.4 XYIENCE XENERGY $7,348,520 $9,072,131 -$1,723,611 -19.0% 0.4 -0.1 VENOM $3,921,250 $3,108,647 $812,603 26.1% 0.2 0.0 RIP IT $4,916,340 $4,869,181 $47,159 1.0% 0.2 0.0 A/O $53,546,789 $46,181,577 $7,365,212 15.9% 2.6 0.1
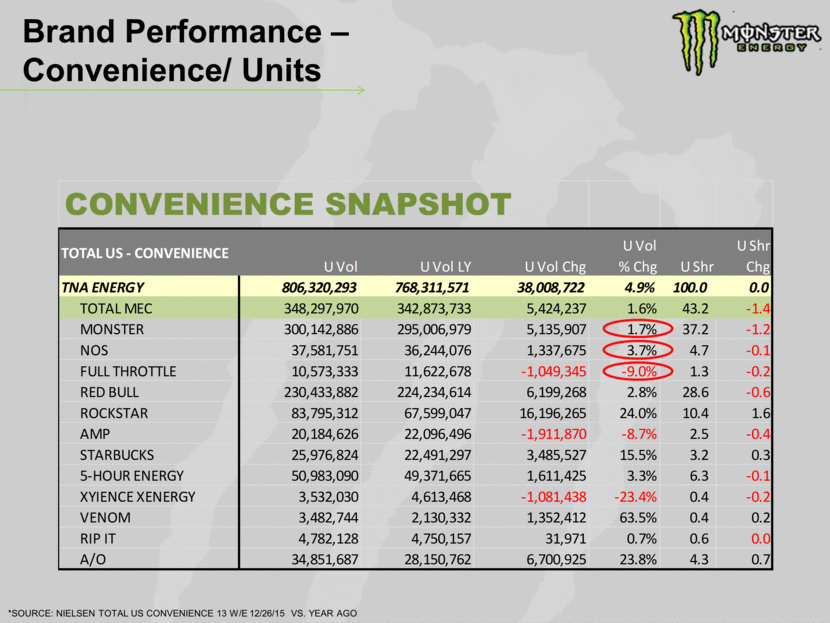
Brand Performance – Convenience/ Units *SOURCE: NIELSEN TOTAL US CONVENIENCE 13 W/E 12/26/15 VS. YEAR AGO CONVENIENCE SNAPSHOT TOTAL US - CONVENIENCE U Vol U Vol LY U Vol Chg U Vol % Chg U Shr U Shr Chg TNA ENERGY 806,320,293 768,311,571 38,008,722 4.9% 100.0 0.0 TOTAL MEC 348,297,970 342,873,733 5,424,237 1.6% 43.2 -1.4 MONSTER 300,142,886 295,006,979 5,135,907 1.7% 37.2 -1.2 NOS 37,581,751 36,244,076 1,337,675 3.7% 4.7 -0.1 FULL THROTTLE 10,573,333 11,622,678 -1,049,345 -9.0% 1.3 -0.2 RED BULL 230,433,882 224,234,614 6,199,268 2.8% 28.6 -0.6 ROCKSTAR 83,795,312 67,599,047 16,196,265 24.0% 10.4 1.6 AMP 20,184,626 22,096,496 -1,911,870 -8.7% 2.5 -0.4 STARBUCKS 25,976,824 22,491,297 3,485,527 15.5% 3.2 0.3 5-HOUR ENERGY 50,983,090 49,371,665 1,611,425 3.3% 6.3 -0.1 XYIENCE XENERGY 3,532,030 4,613,468 -1,081,438 -23.4% 0.4 -0.2 VENOM 3,482,744 2,130,332 1,352,412 63.5% 0.4 0.2 RIP IT 4,782,128 4,750,157 31,971 0.7% 0.6 0.0 A/O 34,851,687 28,150,762 6,700,925 23.8% 4.3 0.7
Energy Category: Dollar Share - Convenience *SOURCE: NIELSEN TOTAL US CONVENIENCE 24 M/E 12/26/15
Energy Category: Unit Share - Convenience *SOURCE: NIELSEN TOTAL US CONVENIENCE 24 M/E 12/26/15
North America Distributor Map As of January 11, 2016
Distribution of at least one MEC brand following KO Transaction As of January 11, 2016
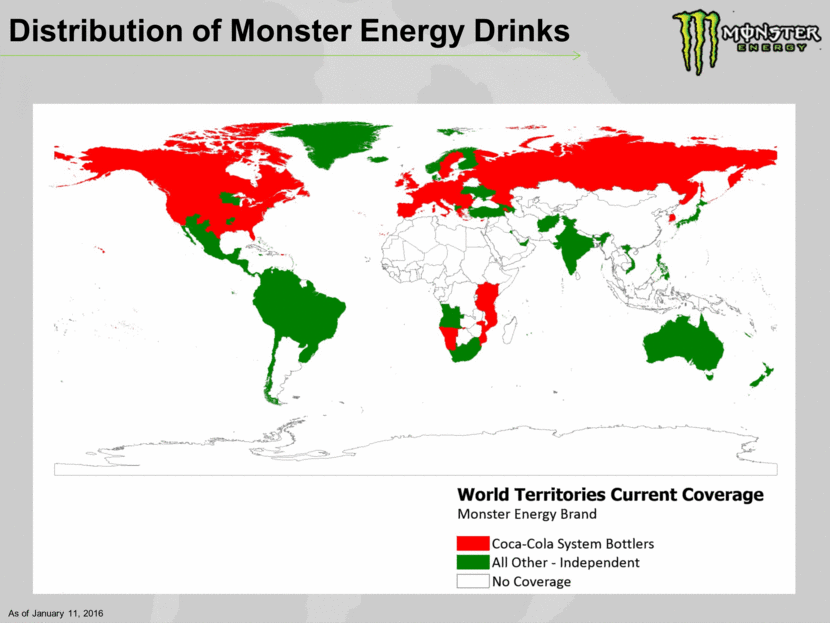
Distribution of Monster Energy Drinks As of January 11, 2016
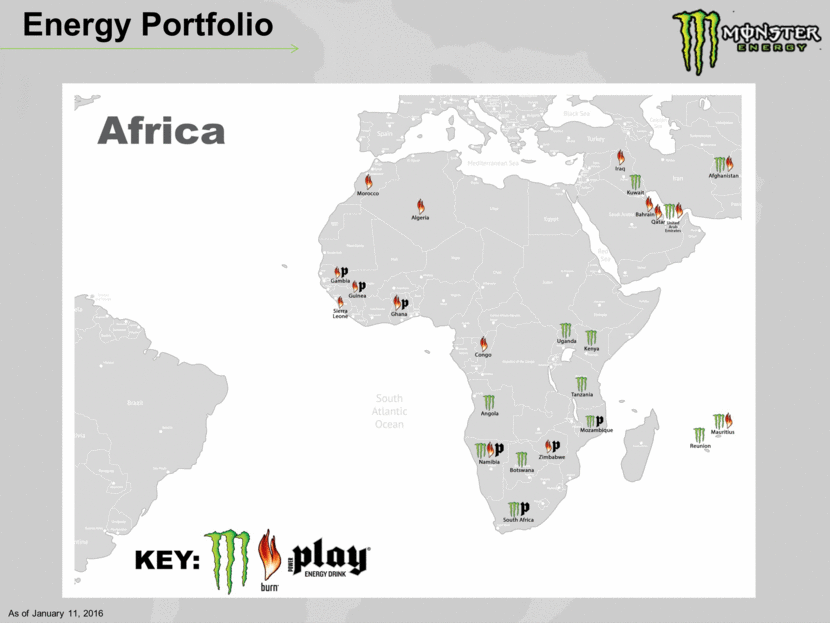
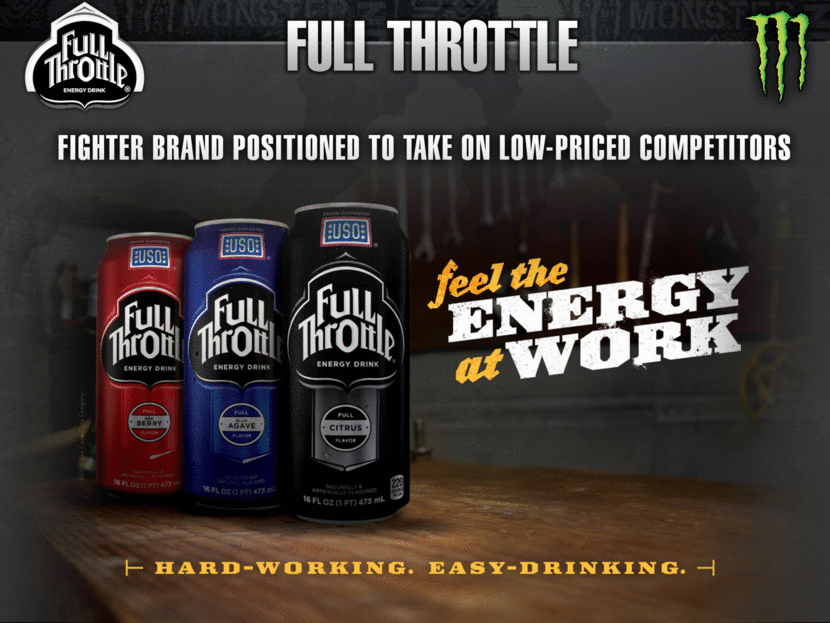
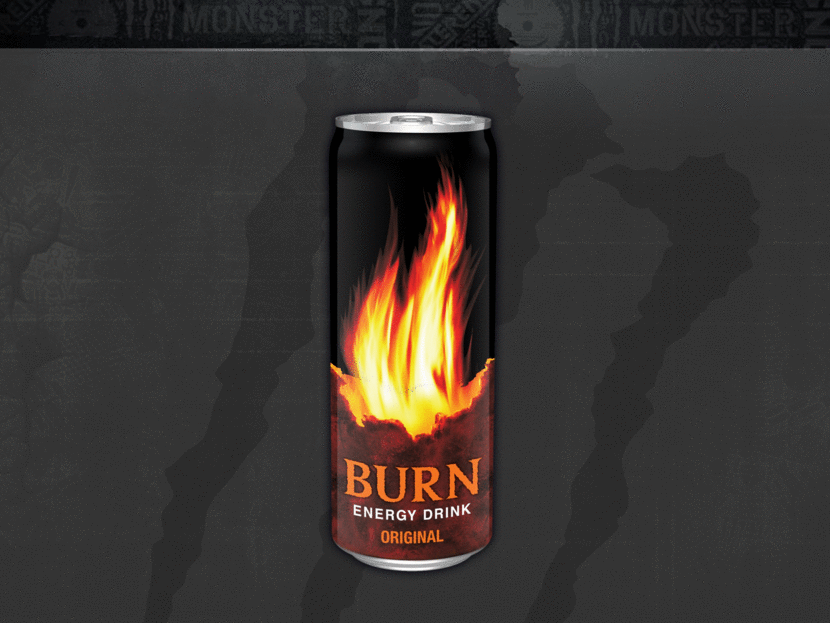
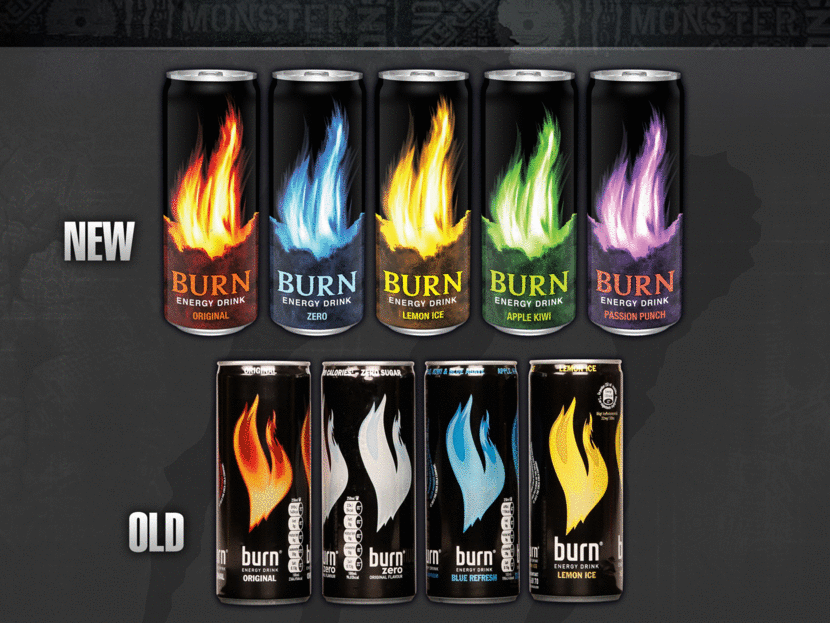
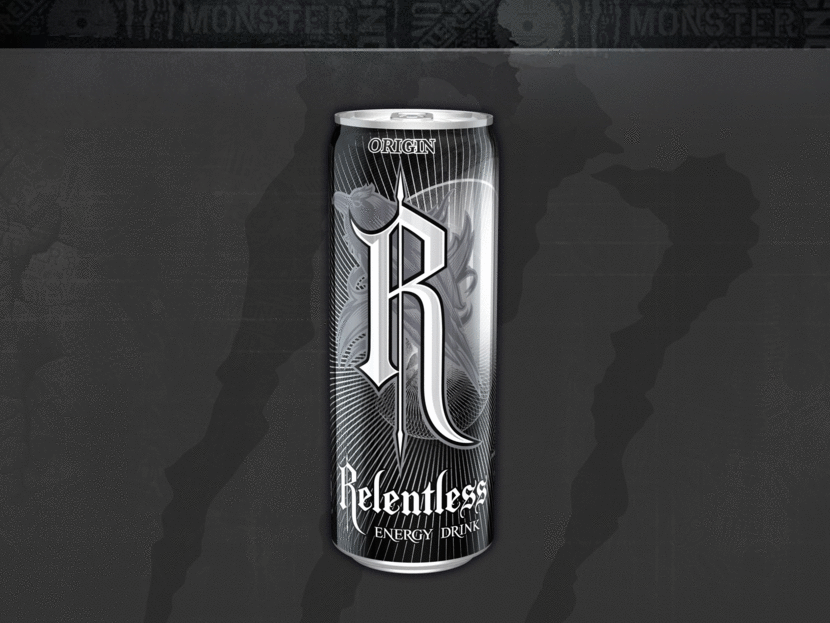
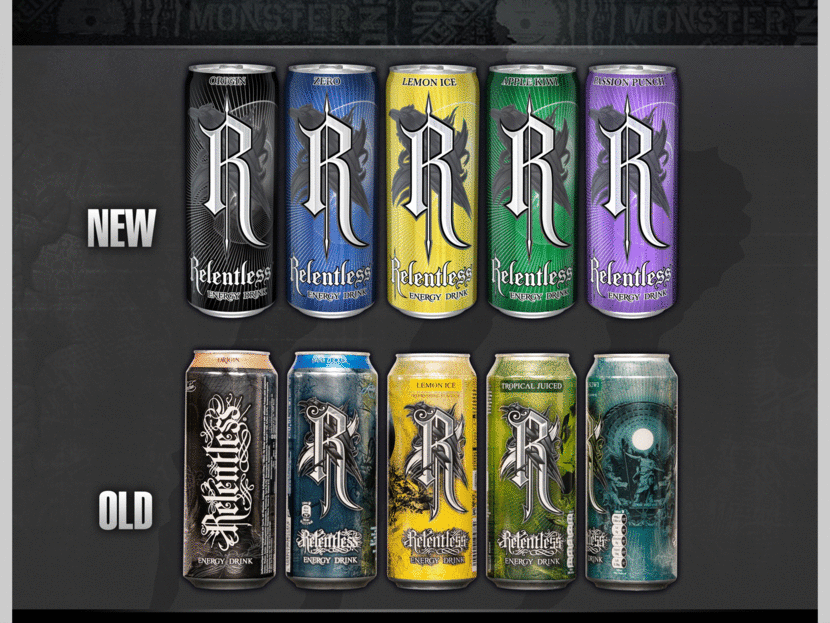
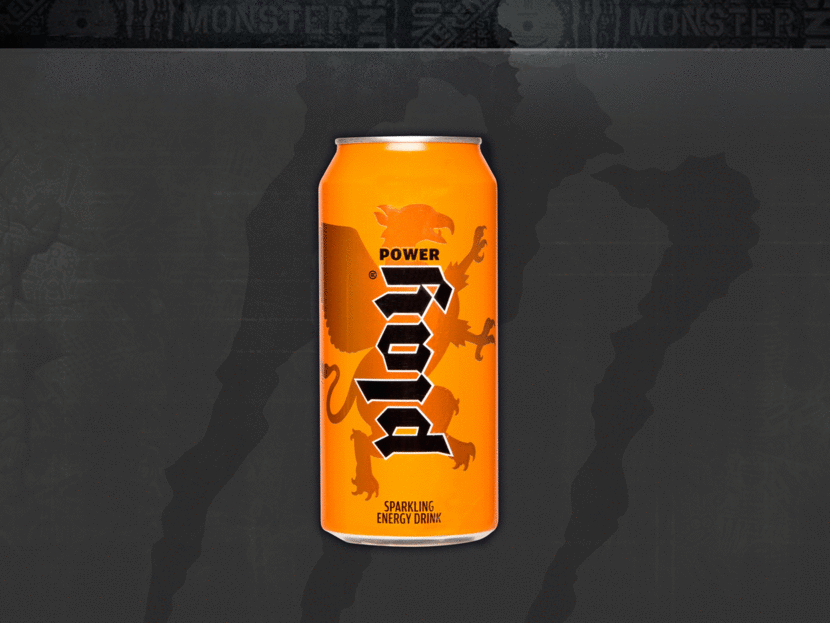
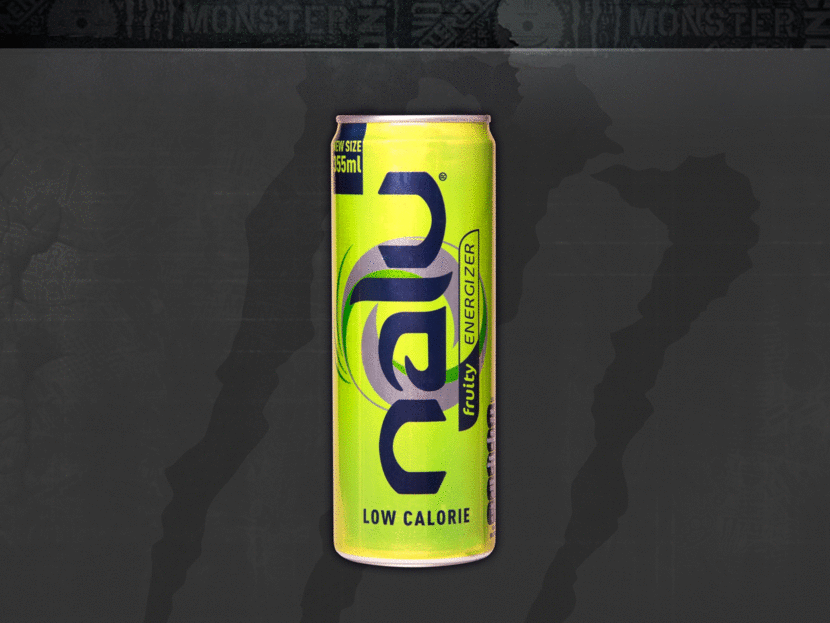
Energy Portfolio As of January 11, 2016
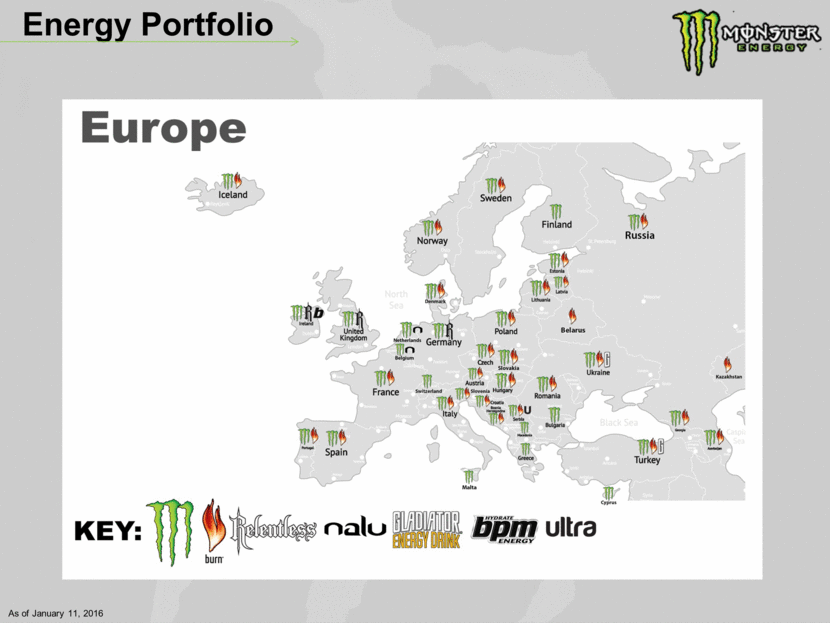
Energy Portfolio As of January 11, 2016
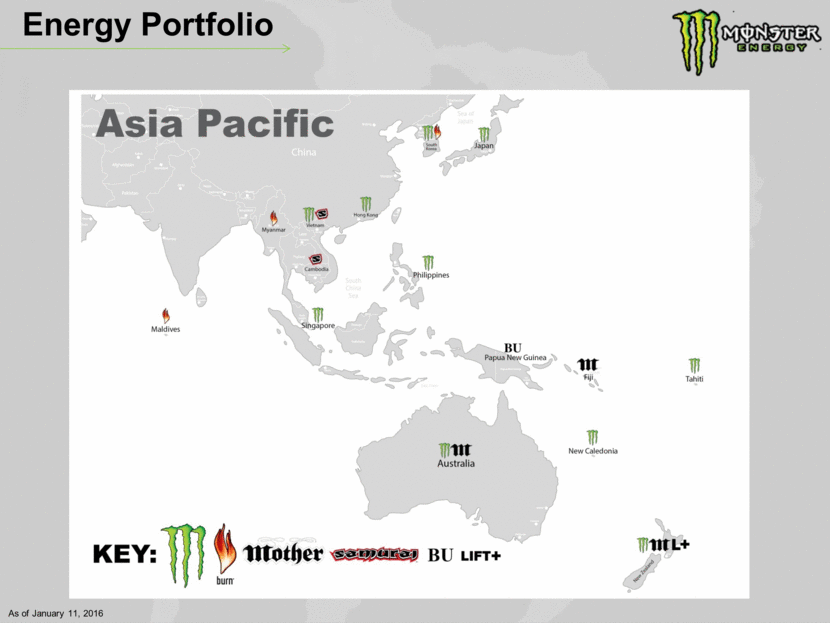
Energy Portfolio As of January 11, 2016
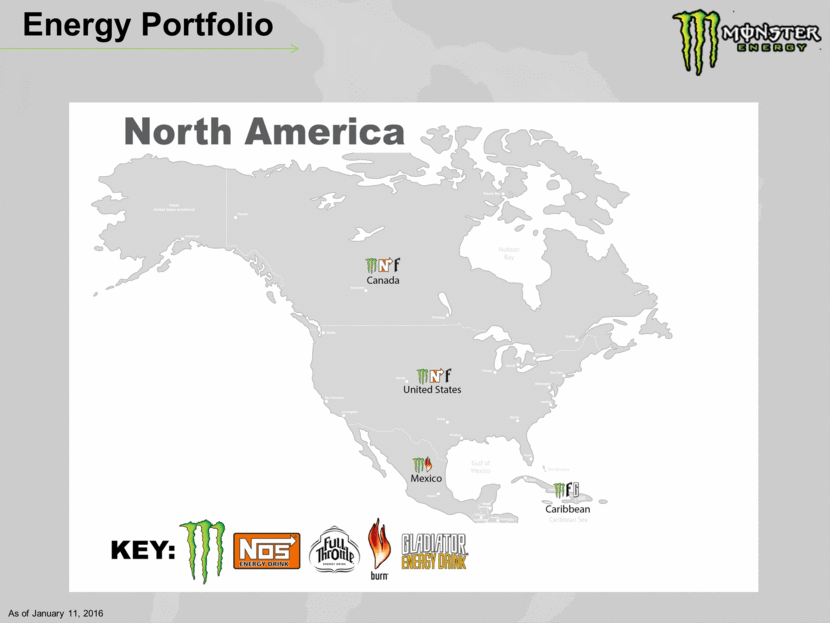
Energy Portfolio As of January 11, 2016

Energy Portfolio As of January 11, 2016
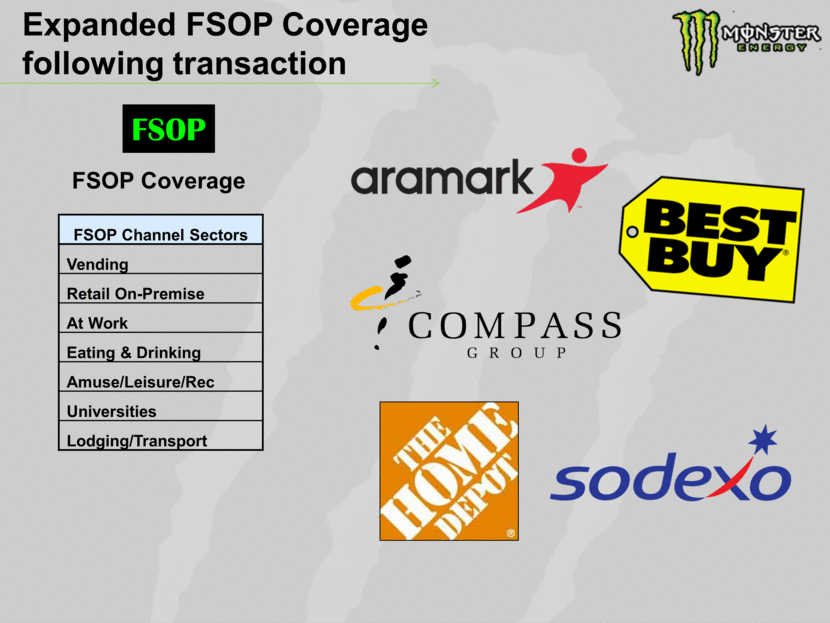
FSOP FSOP Coverage Expanded FSOP Coverage following transaction FSOP Channel Sectors Vending Retail On-Premise At Work Eating & Drinking Amuse/Leisure/Rec Universities Lodging/Transport
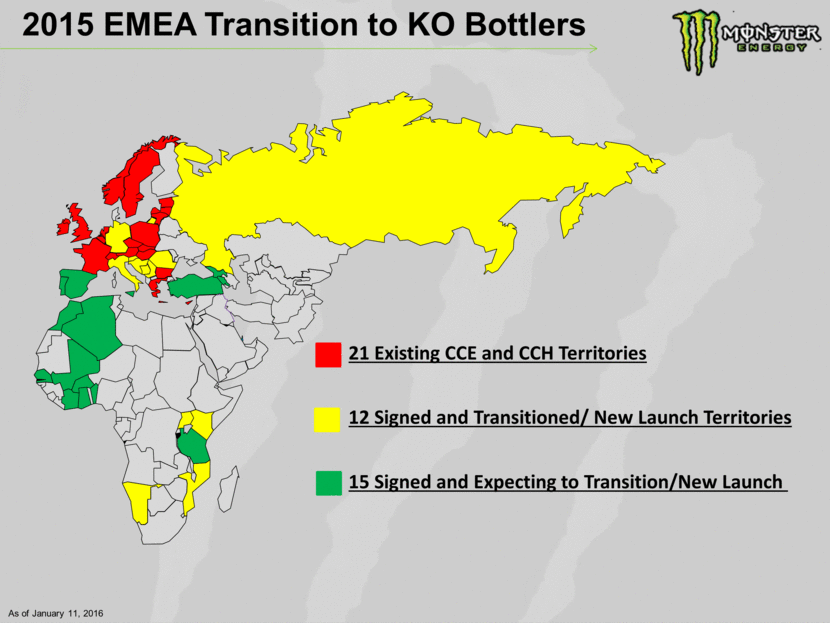
2015 EMEA Transition to KO Bottlers As of January 11, 2016 21 Existing CCE and CCH Territories 12 Signed and Transitioned/ New Launch Territories 15 Signed and Expecting to Transition/New Launch i
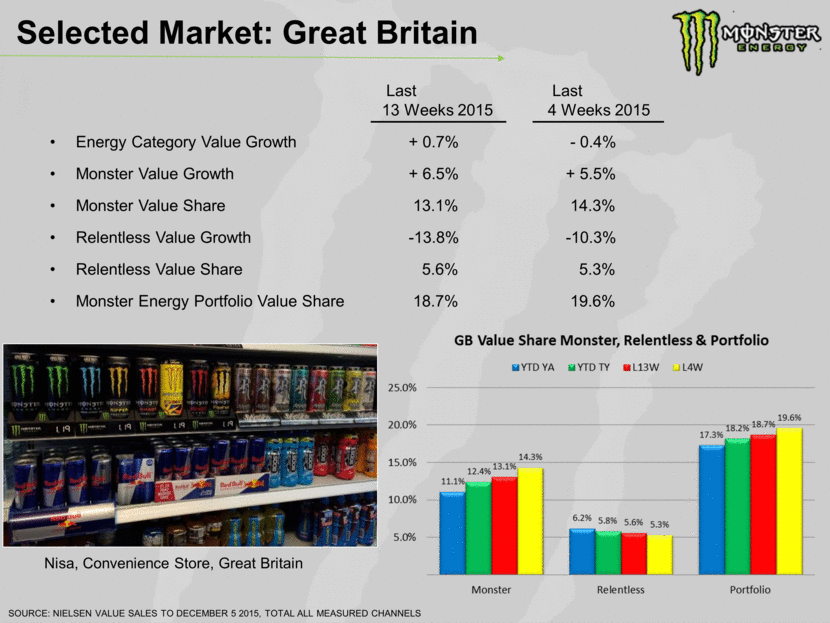
Selected Market: Great Britain Last Last 13 Weeks 2015 4 Weeks 2015 Energy Category Value Growth + 0.7% - 0.4% Monster Value Growth + 6.5% + 5.5% Monster Value Share 13.1% 14.3% Relentless Value Growth -13.8% -10.3% Relentless Value Share 5.6% 5.3% Monster Energy Portfolio Value Share 18.7% 19.6% Nisa, Convenience Store, Great Britain SOURCE: NIELSEN VALUE SALES TO DECEMBER 5 2015, TOTAL ALL MEASURED CHANNELS
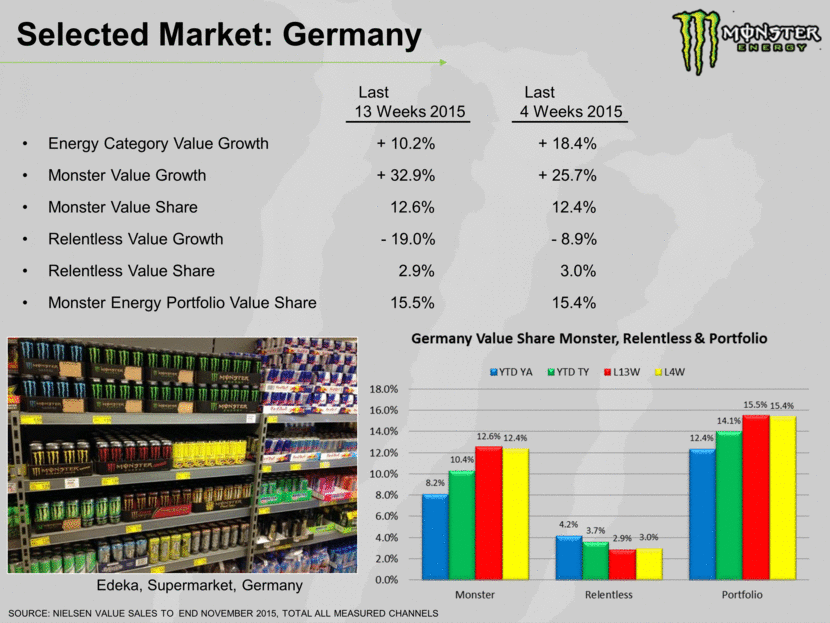
Selected Market: Germany Last Last 13 Weeks 2015 4 Weeks 2015 Energy Category Value Growth + 10.2% + 18.4% Monster Value Growth + 32.9% + 25.7% Monster Value Share 12.6% 12.4% Relentless Value Growth - 19.0% - 8.9% Relentless Value Share 2.9% 3.0% Monster Energy Portfolio Value Share 15.5% 15.4% Edeka, Supermarket, Germany SOURCE: NIELSEN VALUE SALES TO END NOVEMBER 2015, TOTAL ALL MEASURED CHANNELS
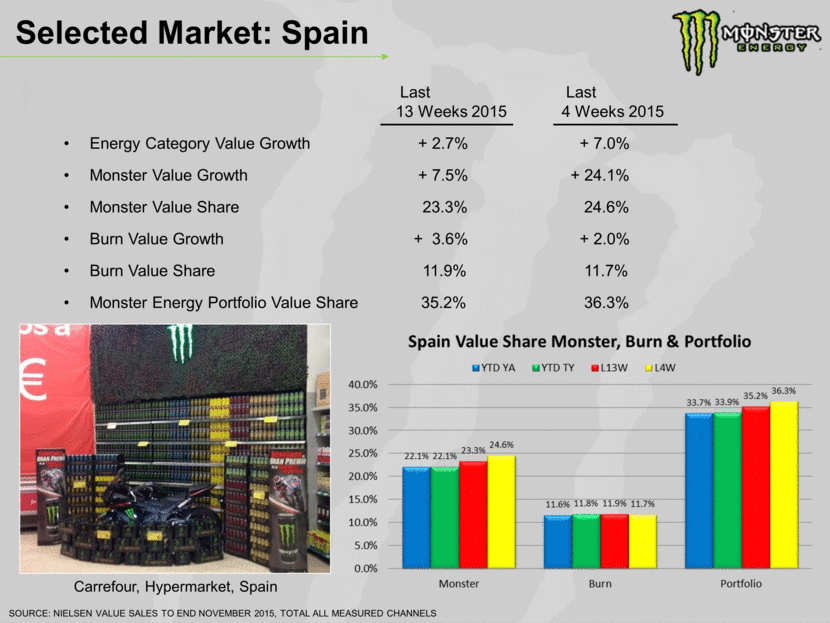
Selected Market: Spain SOURCE: NIELSEN VALUE SALES TO END NOVEMBER 2015, TOTAL ALL MEASURED CHANNELS Last Last 13 Weeks 2015 4 Weeks 2015 Energy Category Value Growth + 2.7% + 7.0% Monster Value Growth + 7.5% + 24.1% Monster Value Share 23.3% 24.6% Burn Value Growth + 3.6% + 2.0% Burn Value Share 11.9% 11.7% Monster Energy Portfolio Value Share 35.2% 36.3% Carrefour, Hypermarket, Spain
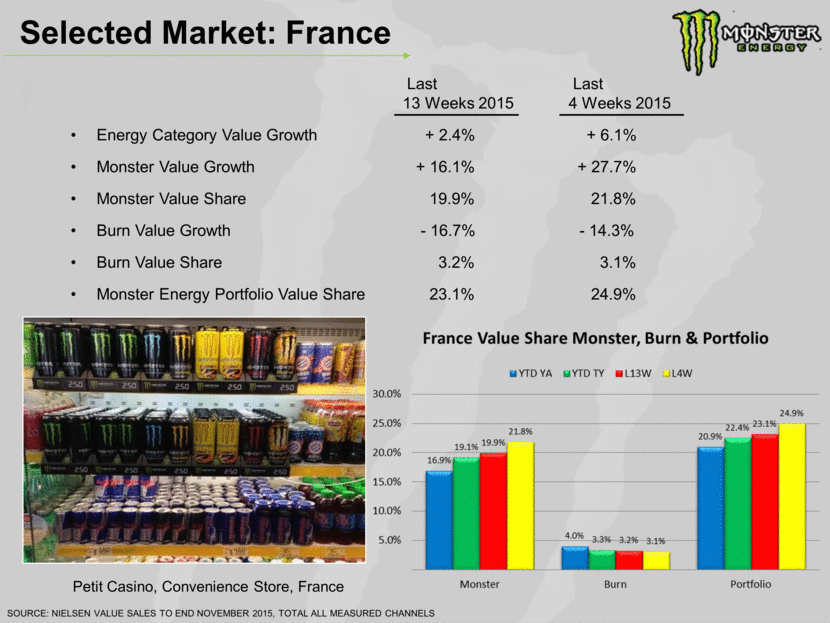
Selected Market: France SOURCE: NIELSEN VALUE SALES TO END NOVEMBER 2015, TOTAL ALL MEASURED CHANNELS Last Last 13 Weeks 2015 4 Weeks 2015 Energy Category Value Growth + 2.4% + 6.1% Monster Value Growth + 16.1% + 27.7% Monster Value Share 19.9% 21.8% Burn Value Growth - 16.7% - 14.3% Burn Value Share 3.2% 3.1% Monster Energy Portfolio Value Share 23.1% 24.9% Petit Casino, Convenience Store, France
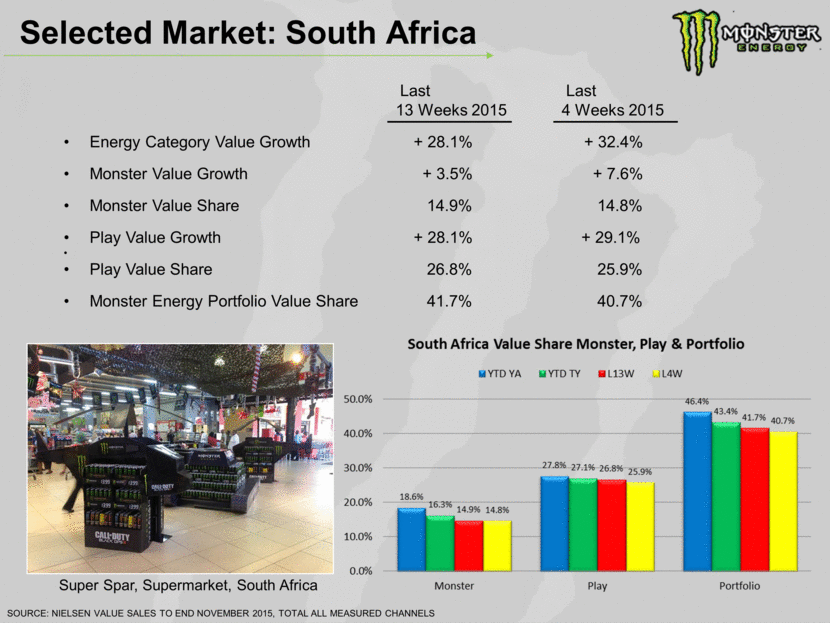
Selected Market: South Africa SOURCE: NIELSEN VALUE SALES TO END NOVEMBER 2015, TOTAL ALL MEASURED CHANNELS Last Last 13 Weeks 2015 4 Weeks 2015 Energy Category Value Growth + 28.1% + 32.4% Monster Value Growth + 3.5% + 7.6% Monster Value Share 14.9% 14.8% Play Value Growth + 28.1% + 29.1% Play Value Share 26.8% 25.9% Monster Energy Portfolio Value Share 41.7% 40.7% Super Spar, Supermarket, South Africa
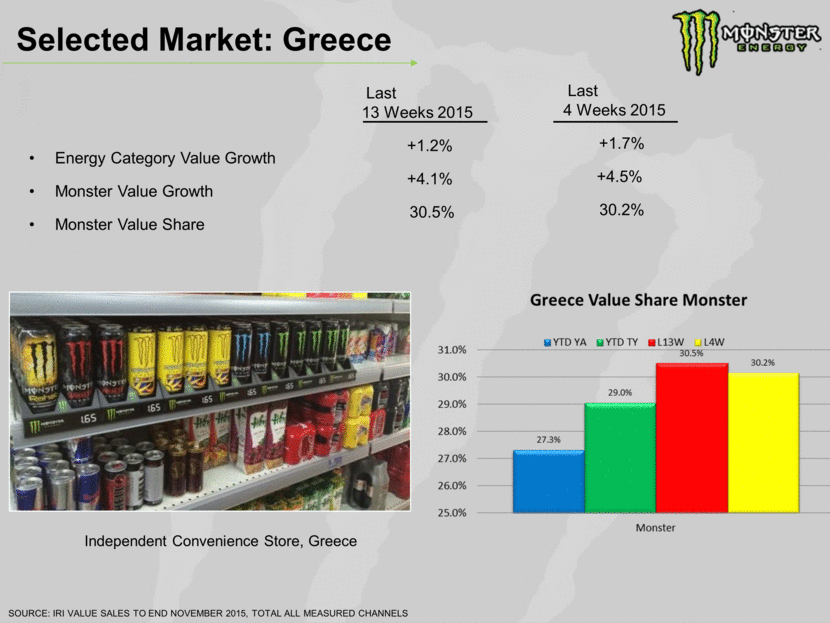
Selected Market: Greece Energy Category Value Growth Monster Value Growth Monster Value Share SOURCE: IRI VALUE SALES TO END NOVEMBER 2015, TOTAL ALL MEASURED CHANNELS Last 13 Weeks 2015 +1.2% +4.1% 30.5% Last 4 Weeks 2015 +1.7% +4.5% 30.2% Independent Convenience Store, Greece
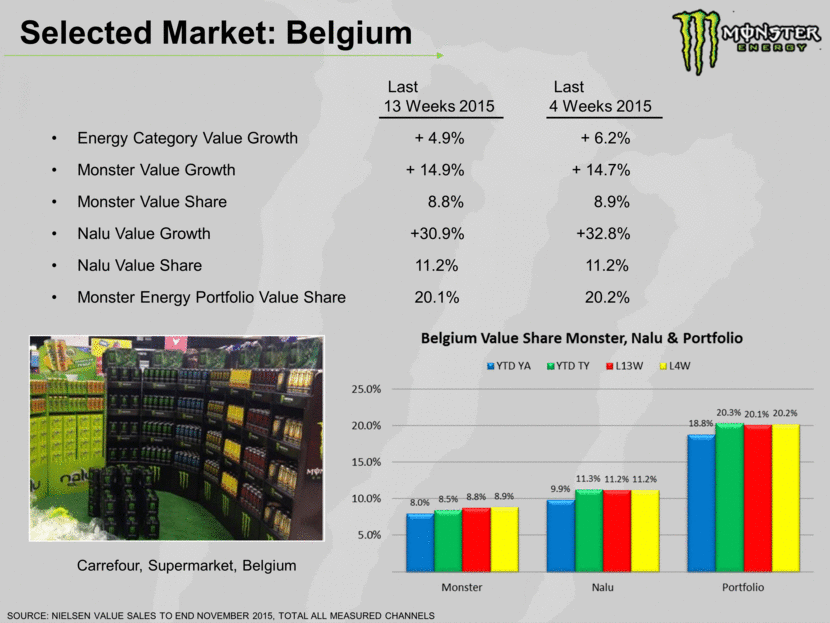
Selected Market: Belgium Last Last 13 Weeks 2015 4 Weeks 2015 Energy Category Value Growth + 4.9% + 6.2% Monster Value Growth + 14.9% + 14.7% Monster Value Share 8.8% 8.9% Nalu Value Growth +30.9% +32.8% Nalu Value Share 11.2% 11.2% Monster Energy Portfolio Value Share 20.1% 20.2% Carrefour, Supermarket, Belgium SOURCE: NIELSEN VALUE SALES TO END NOVEMBER 2015, TOTAL ALL MEASURED CHANNELS
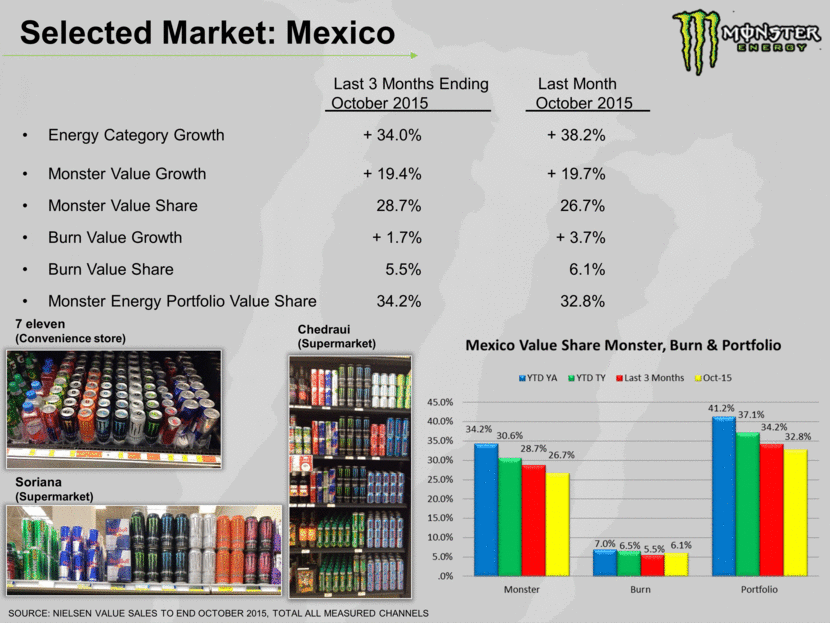
Selected Market: Mexico Last 3 Months Ending Last Month October 2015 October 2015 Energy Category Growth + 34.0% + 38.2% Monster Value Growth + 19.4% + 19.7% Monster Value Share 28.7% 26.7% Burn Value Growth + 1.7% + 3.7% Burn Value Share 5.5% 6.1% Monster Energy Portfolio Value Share 34.2% 32.8% 7 eleven (Convenience store) Chedraui (Supermarket) Soriana (Supermarket) SOURCE: NIELSEN VALUE SALES TO END OCTOBER 2015, TOTAL ALL MEASURED CHANNELS
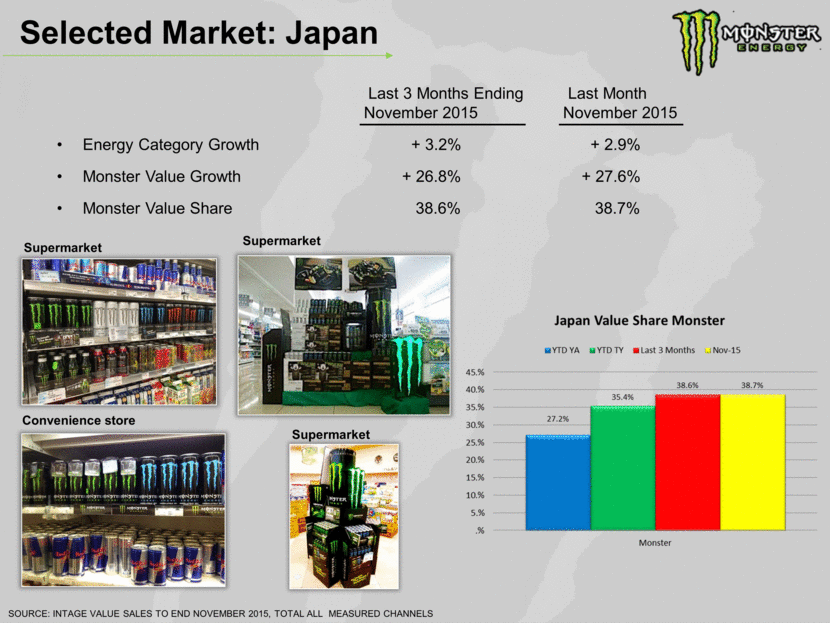
Selected Market: Japan Supermarket Convenience store Supermarket Supermarket SOURCE: INTAGE VALUE SALES TO END NOVEMBER 2015, TOTAL ALL MEASURED CHANNELS Last 3 Months Ending Last Month November 2015 November 2015 Energy Category Growth + 3.2% + 2.9% Monster Value Growth + 26.8% + 27.6% Monster Value Share 38.6% 38.7%
Selected Market: Chile Last 3 Months Ending Last Month November 2015 November 2015 Energy Category Growth + 15.0% + 14.2% Monster Value Growth + 74.9% + 70.1% Monster Value Share 18.5% 19.3% Burn Value Growth + 7.8% + 6.2% Burn Value Share 2.2% 2.2% Monster Energy Portfolio Value Share 20.7% 21.5% Kamadi (Supermarket) Jumbo (Hypermarket) Santa Isabel (Supermarket) SOURCE: NIELSEN VALUE SALES TO END NOVEMBER 2015, TOTAL ALL MEASURED CHANNELS Jumbo (Hypermarket)

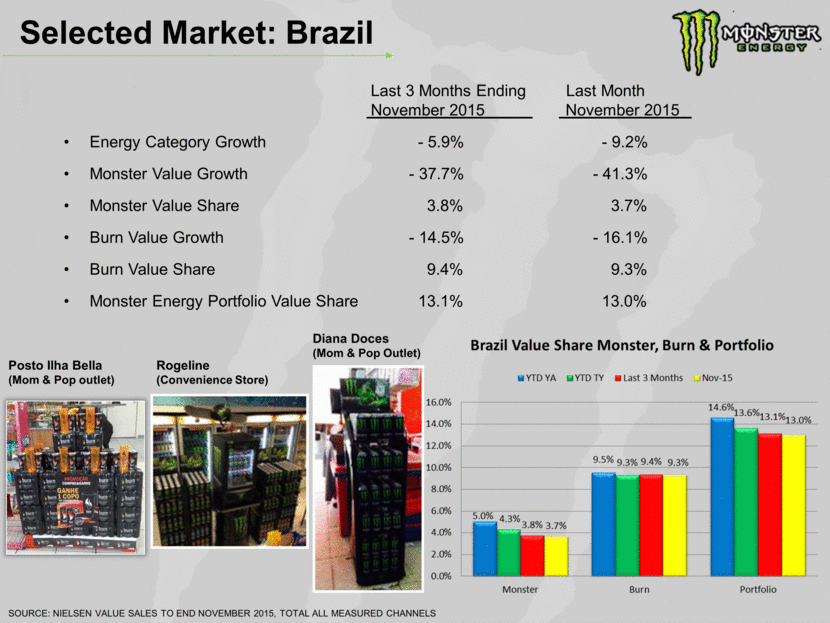
Selected Market: Brazil Last 3 Months Ending Last Month November 2015 November 2015 Energy Category Growth - 5.9% - 9.2% Monster Value Growth - 37.7% - 41.3% Monster Value Share 3.8% 3.7% Burn Value Growth - 14.5% - 16.1% Burn Value Share 9.4% 9.3% Monster Energy Portfolio Value Share 13.1% 13.0% Posto Ilha Bella (Mom & Pop outlet) Rogeline (Convenience Store) Diana Doces (Mom & Pop Outlet) SOURCE: NIELSEN VALUE SALES TO END NOVEMBER 2015, TOTAL ALL MEASURED CHANNELS
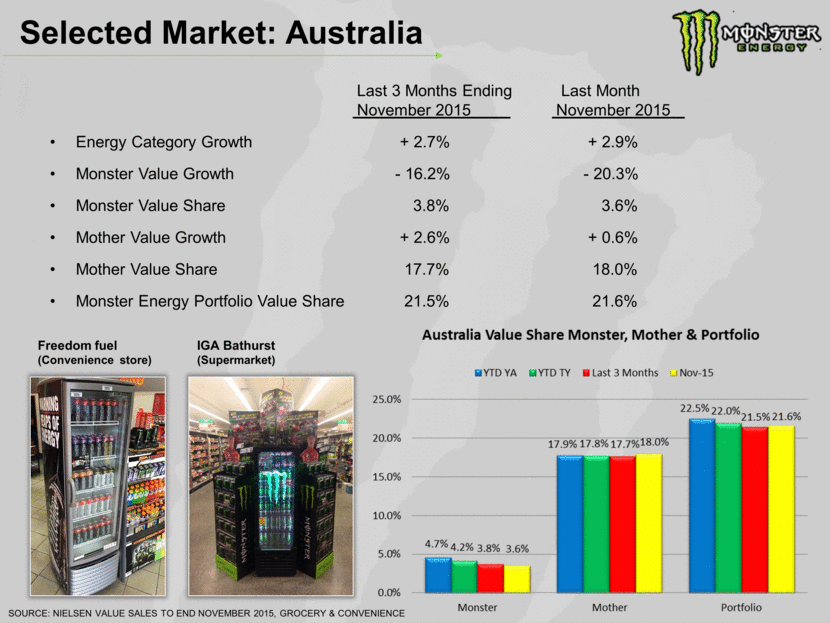
Selected Market: Australia Last 3 Months Ending Last Month November 2015 November 2015 Energy Category Growth + 2.7% + 2.9% Monster Value Growth - 16.2% - 20.3% Monster Value Share 3.8% 3.6% Mother Value Growth + 2.6% + 0.6% Mother Value Share 17.7% 18.0% Monster Energy Portfolio Value Share 21.5% 21.6% Freedom fuel (Convenience store) IGA Bathurst (Supermarket) SOURCE: NIELSEN VALUE SALES TO END NOVEMBER 2015, GROCERY & CONVENIENCE
[LOGO]

[LOGO]

Source: Scarborough Research 2013, Based on Adults 18+, “Fan”=Any Interest

[LOGO]

[LOGO]
[LOGO]

Source: iMedia Connection, July 2, 2015

Source: ADWEEK July 7, 2015

[LOGO]
[LOGO]

[LOGO]
[LOGO]
[LOGO]
[LOGO]

[LOGO]

[LOGO]
[LOGO]
[LOGO]

[LOGO]
[LOGO]

[LOGO]
[LOGO]

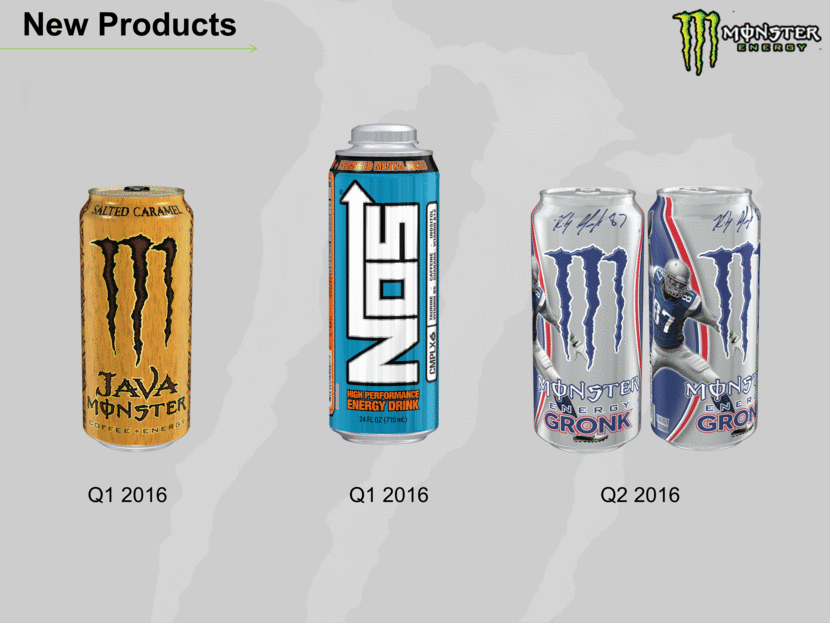
Q1 2016 Q2 2016 New Products Q1 2016
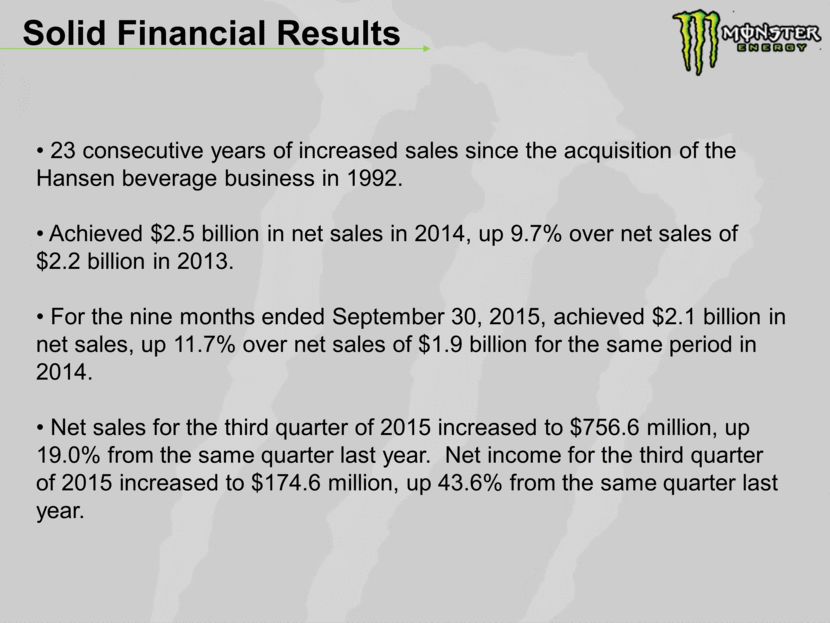
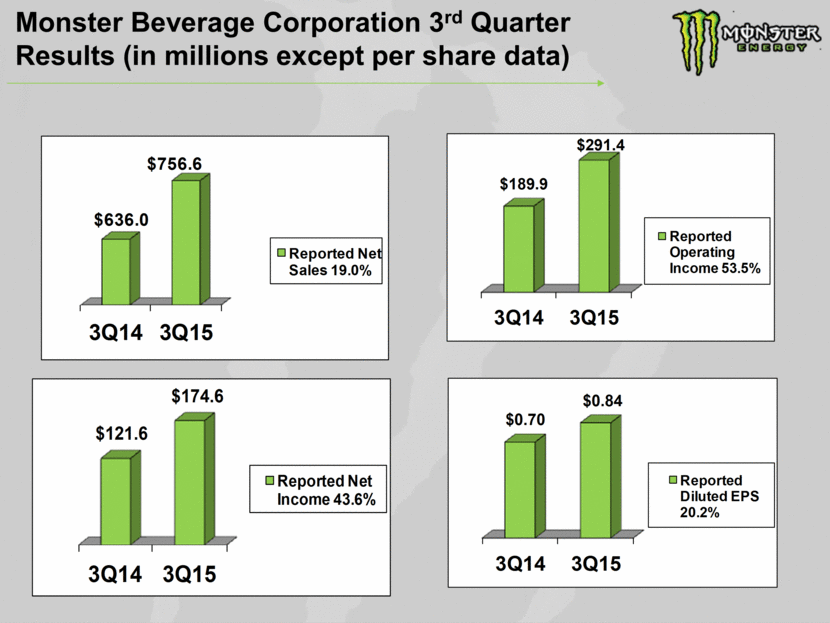
Solid Financial Results 23 consecutive years of increased sales since the acquisition of the Hansen beverage business in 1992. Achieved $2.5 billion in net sales in 2014, up 9.7% over net sales of $2.2 billion in 2013. For the nine months ended September 30, 2015, achieved $2.1 billion in net sales, up 11.7% over net sales of $1.9 billion for the same period in 2014. Net sales for the third quarter of 2015 increased to $756.6 million, up 19.0% from the same quarter last year. Net income for the third quarter of 2015 increased to $174.6 million, up 43.6% from the same quarter last year.
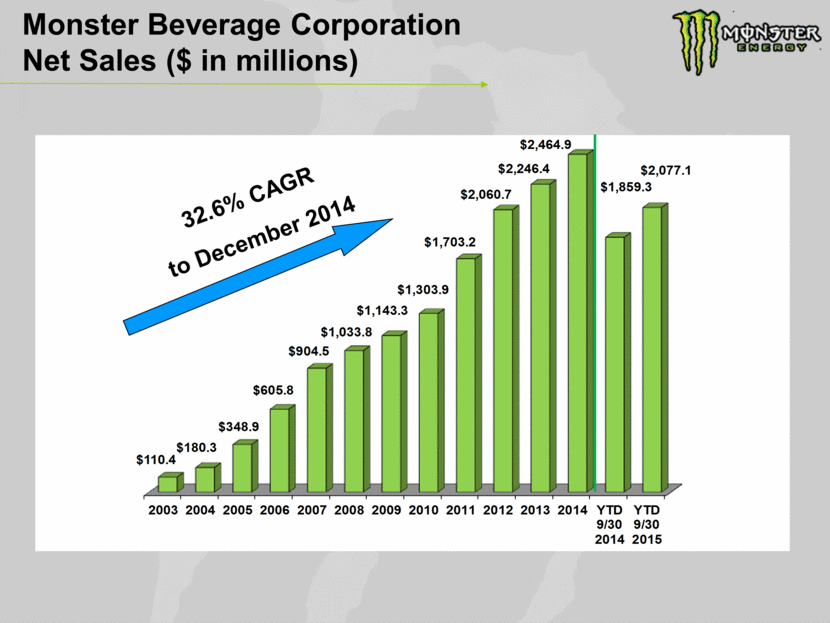
Monster Beverage Corporation Net Sales ($ in millions) 32.6% CAGR to December 2014 2003 2004 2005 2006 2007 2008 2009 2010 2011 2012 2013 2014 YTD 9/30 2014 YTD 9/30 2015 $110.4 $180.3 $348.9 $605.8 $904.5 $1,033.8 $1,143.3 $1,303.9 $1,703.2 $2,060.7 $2,246.4 $2,464.9 $1,859.3 $2,077.1
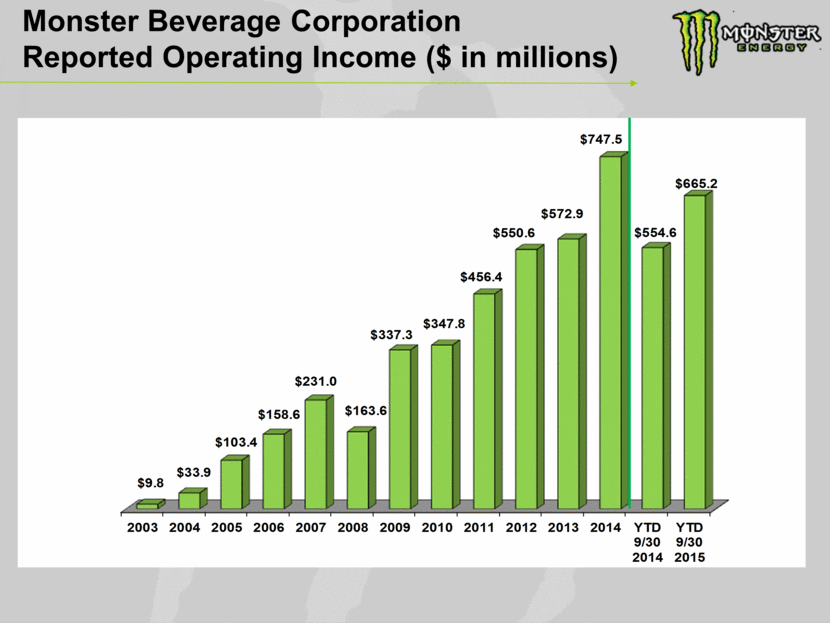
Monster Beverage Corporation Reported Operating Income ($ in millions) 2003 2004 2005 2006 2007 2008 2009 2010 2011 2012 2013 2014 YTD 9/30 2014 YTD 9/30 2015 $9.8 $33.9 $103.4 $158.6 $231.0 $163.6 $337.3 $347.8 $456.4 $550.6 $572.9 $747.5 $554.6 $665.2
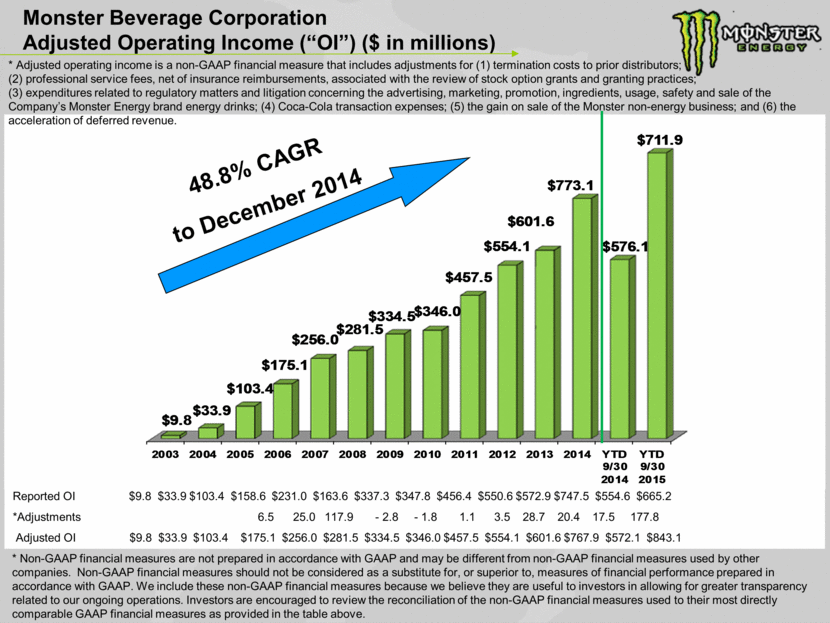
Monster Beverage Corporation Adjusted Operating Income (“OI”) ($ in millions) Reported OI $9.8 $33.9 $103.4 $158.6 $231.0 $163.6 $337.3 $347.8 $456.4 $550.6 $572.9 $747.5 $554.6 $665.2 *Adjustments 6.5 25.0 117.9 - 2.8 - 1.8 1.1 3.5 28.7 20.4 17.5 177.8 Adjusted OI $9.8 $33.9 $103.4 $175.1 $256.0 $281.5 $334.5 $346.0 $457.5 $554.1 $601.6 $767.9 $572.1 $843.1 48.8% CAGR to December 2014 * Adjusted operating income is a non-GAAP financial measure that includes adjustments for (1) termination costs to prior distributors; (2) professional service fees, net of insurance reimbursements, associated with the review of stock option grants and granting practices; (3) expenditures related to regulatory matters and litigation concerning the advertising, marketing, promotion, ingredients, usage, safety and sale of the Company’s Monster Energy brand energy drinks; (4) Coca-Cola transaction expenses; (5) the gain on sale of the Monster non-energy business; and (6) the acceleration of deferred revenue. * Non-GAAP financial measures are not prepared in accordance with GAAP and may be different from non-GAAP financial measures used by other companies. Non-GAAP financial measures should not be considered as a substitute for, or superior to, measures of financial performance prepared in accordance with GAAP. We include these non-GAAP financial measures because we believe they are useful to investors in allowing for greater transparency related to our ongoing operations. Investors are encouraged to review the reconciliation of the non-GAAP financial measures used to their most directly comparable GAAP financial measures as provided in the table above. 2003 2004 2005 2006 2007 2008 2009 2010 2011 2012 2013 2014 YTD 9/30 2014 YTD 9/30 2015 $9.8 $33.9 $103.4 $175.1 $256.0 $281.5 $334.5 $346.0 $457.5 $554.1 $601.6 $773.1 $576.1 $711.9
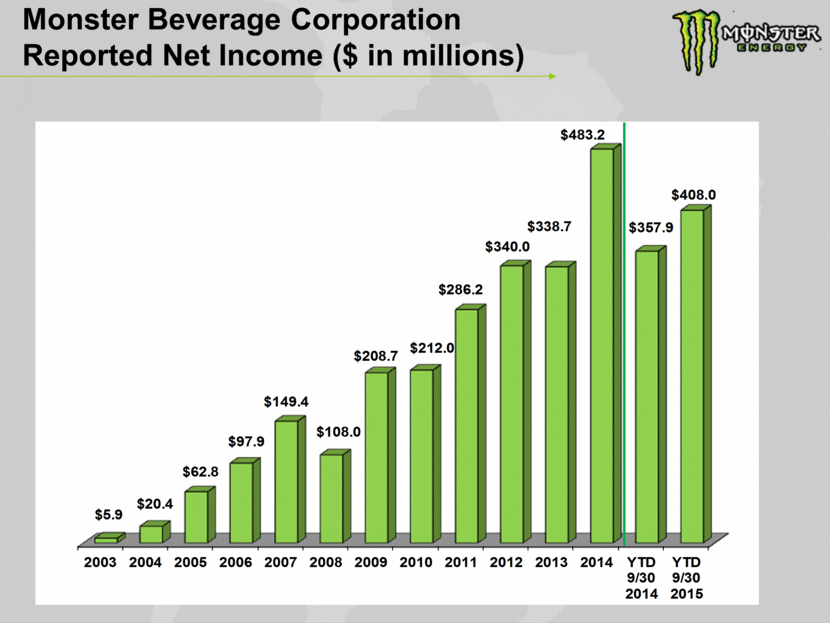
Monster Beverage Corporation Reported Net Income ($ in millions) 2003 2004 2005 2006 2007 2008 2009 2010 2011 2012 2013 2014 YTD 9/30 2014 YTD 9/30 2015 $5.9 $20.4 $62.8 $97.9 $149.4 $108.0 $208.7 $212.0 $286.2 $340.0 $338.7 $483.2 $357.9 $408.0
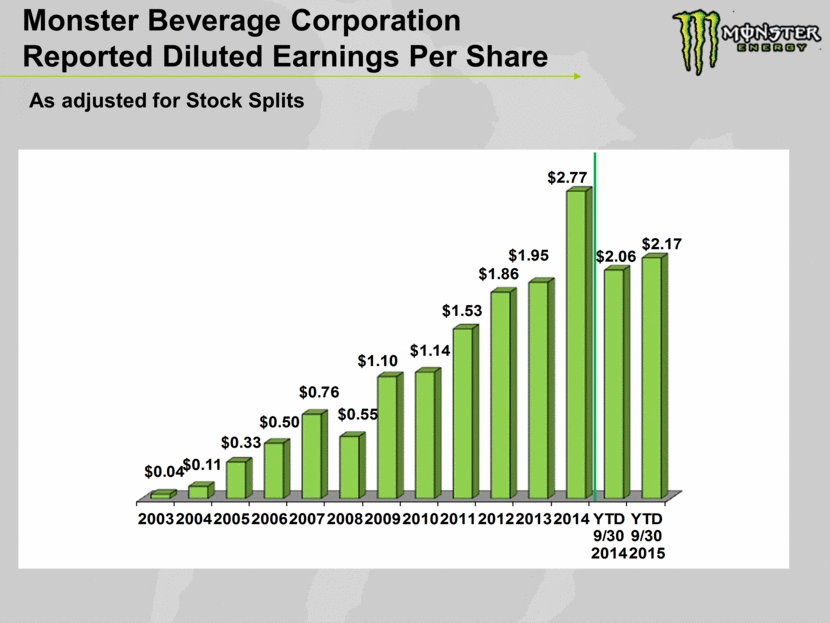
Monster Beverage Corporation Reported Diluted Earnings Per Share As adjusted for Stock Splits 2003 2004 2005 2006 2007 2008 2009 2010 2011 2012 2013 2014 YTD 9/30 2014 YTD 9/30 2015 $0.04 $0.11 $0.33 $0.50 $0.76 $0.55 $1.10 $1.14 $1.53 $1.86 $1.95 $2.77 $2.06 $2.17
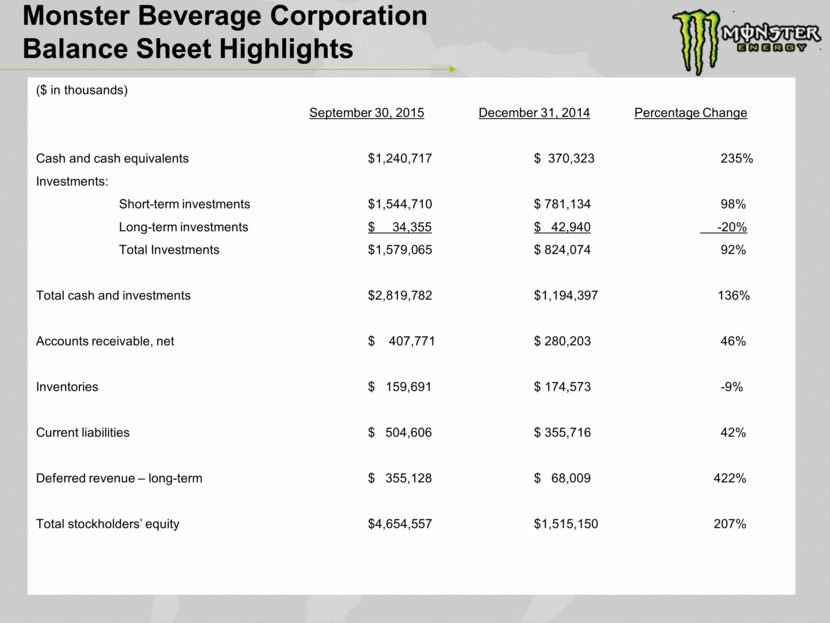
Monster Beverage Corporation Balance Sheet Highlights ($ in thousands) September 30, 2015 December 31, 2014 Percentage Change Cash and cash equivalents $1,240,717 $ 370,323 235% Investments: Short-term investments $1,544,710 $ 781,134 98% Long-term investments $ 34,355 $ 42,940 -20% Total Investments $1,579,065 $ 824,074 92% Total cash and investments $2,819,782 $1,194,397 136% Accounts receivable, net $ 407,771 $ 280,203 46% Inventories $ 159,691 $ 174,573 -9% Current liabilities $ 504,606 $ 355,716 42% Deferred revenue – long-term $ 355,128 $ 68,009 422% Total stockholders’ equity $4,654,557 $1,515,150 207%
Monster Beverage Corporation 3rd Quarter Results (in millions except per share data) 3Q14 3Q15 $636.0 $756.6 Reported Net Sales 19.0% 3Q14 3Q15 $121.6 $174.6 Reported Net Income 43.6% 3Q14 3Q15 $189.9 $291.4 Reported Operating Income 53.5% 3Q14 3Q15 $0.70 $0.84 Reported Diluted EPS 20.2%
[LOGO]
Serious News for Serious Traders! Try StreetInsider.com Premium Free!
You May Also Be Interested In
- JPMorgan Downgrades Monster Beverage (MNST) to Neutral, 'Cost Pressures and Weaker Low-end Consumer'
- ROSEN, A HIGHLY RECOGNIZED LAW FIRM, Encourages Globe Life Inc. Investors to Inquire About Securities Class Action Investigation – GL
- Kidoz Inc. Announces 2023 Total Revenue of $13,326,824
Create E-mail Alert Related Categories
SEC FilingsSign up for StreetInsider Free!
Receive full access to all new and archived articles, unlimited portfolio tracking, e-mail alerts, custom newswires and RSS feeds - and more!
