

Form 8-K NAVISTAR INTERNATIONAL For: Dec 17
 Tweet
Tweet Share
Share
UNITED STATES
SECURITIES AND EXCHANGE COMMISSION
Washington, D.C. 20549
FORM 8-K
CURRENT REPORT
Pursuant to Section 13 or 15(d) of the
Securities Exchange Act of 1934
Date of Report (Date of earliest event reported): December 17, 2015

NAVISTAR INTERNATIONAL CORPORATION
(Exact name of registrant as specified in its charter)
| Delaware | 1-9618 | 36-3359573 | ||
| (State or other jurisdiction of incorporation or organization) |
(Commission File No.) |
(I.R.S. Employer Identification No.) |
| 2701 Navistar Drive Lisle, Illinois |
60532 | |
| (Address of principal executive offices) | (Zip Code) |
Registrant’s telephone number, including area code (331) 332-5000
(Former name or former address, if changed since last report.)
Check the appropriate box below if the Form 8-K filing is intended to simultaneously satisfy the filing obligation of the registrant under any of the following provisions:
| ¨ | Written communications pursuant to Rule 425 under the Securities Act (17 CFR 230.425) |
| ¨ | Soliciting material pursuant to Rule 14a-12 under the Exchange Act (17 CFR 240.14a-12) |
| ¨ | Pre-commencement communications pursuant to Rule 14d-2(b) under the Exchange Act (17 CFR 240.14d-2(b)) |
| ¨ | Pre-commencement communications pursuant to Rule 13e-4(c) under the Exchange Act (17 CFR 240.13e-4(c)) |
| ITEM 2.02 | RESULTS OF OPERATIONS AND FINANCIAL CONDITION |
In accordance with General Instruction B.2. to Form 8-K, the following information shall not be deemed “filed” for purposes of Section 18 of the Securities Exchange Act of 1934, as amended, nor shall it be deemed incorporated by reference in any filing under the Securities Act of 1933, as amended, except as shall be expressly set forth by specific reference in such a filing.
The information regarding the results of operations and financial condition of Navistar International Corporation (the “Company”) responsive to this Item 2.02, and contained in Exhibit 99.1 filed herewith, is incorporated into this Item 2.02 by reference.
| ITEM 7.01 | REGULATION FD DISCLOSURE |
In accordance with General Instruction B.2. to Form 8-K, the following information shall not be deemed “filed” for purposes of Section 18 of the Securities Exchange Act of 1934, as amended, nor shall it be deemed incorporated by reference in any filing under the Securities Act of 1933, as amended, except as shall be expressly set forth by specific reference in such a filing.
On December 17, 2015, the Company filed its Annual Report on Form 10-K for the period ended October 31, 2015 with the Securities and Exchange Commission. The Company’s press release announcing the filing is attached as Exhibit 99.1 to this Current Report and is incorporated by reference herein.
The Company, which is one of the largest combined commercial truck, school bus and mid-range diesel engine producers, will present via live web cast its fiscal 2015 fourth quarter financial results on Thursday, December 17th. A live web cast is scheduled at approximately 9:00 AM Eastern. Speakers on the web cast will include: Troy Clarke, President and Chief Executive Officer; Walter Borst, Executive Vice President and Chief Financial Officer; and other company leaders. A copy of the slides containing financial and operating information to be used as part of the web cast are attached as Exhibit 99.2 to this Current Report and are incorporated by reference herein.
The web cast can be accessed through a link on the investor relations page of Company’s web site at http://www.navistar.com/navistar/investors/webcasts. Investors are advised to log on to the website at least 15 minutes prior to the start of the web cast to allow sufficient time for downloading any necessary software. The web cast will be available for replay at the same address approximately three hours following its conclusion, and will remain available for a period of at least 12 months.
Navistar International Corporation (NYSE: NAV) is a holding company whose subsidiaries and affiliates produce International® brand commercial and military trucks, proprietary diesel engines, and IC Bus™ brand school and commercial buses. The Company also provides truck and diesel engine service parts. Another affiliate offers financing services. Additional information is available at www.Navistar.com.
| ITEM 9.01. | FINANCIAL STATEMENTS AND EXHIBITS |
(d) Exhibits.
The following documents are filed herewith:
| Exhibit No. |
Description | |
| 99.1 | Press Release. | |
| 99.2 | Slide Presentation for Fourth Quarter 2015 Financial Results Web Cast to be held on December 17, 2015. | |
Forward Looking Statements
Information provided and statements contained in this report that are not purely historical are forward-looking statements within the meaning of Section 27A of the Securities Act of 1933, as amended, Section 21E of the Securities Exchange Act of 1934, as amended, and the Private Securities Litigation Reform Act of 1995. Such forward-looking statements only speak as of the date of this report and the Company assumes no obligation to update the information included in this report. Such forward-looking statements include information concerning our possible or assumed future results of operations, including descriptions of our business strategy. These statements often include words such as “believe,” “expect,” “anticipate,” “intend,” “plan,” “estimate,” or similar expressions. These statements are not guarantees of performance or results and they involve risks, uncertainties, and assumptions. For a further description of these factors, see the risk factors set forth in our filings with the Securities and Exchange Commission, including our annual report on Form 10-K for the fiscal year ended October 31, 2015. Although we believe that these forward-looking statements are based on reasonable assumptions, there are many factors that could affect our actual financial results or results of operations and could cause actual results to differ materially from those in the forward-looking statements. All future written and oral forward-looking statements by us or persons acting on our behalf are expressly qualified in their entirety by the cautionary statements contained or referred to above. Except for our ongoing obligations to disclose material information as required by the federal securities laws, we do not have any obligations or intention to release publicly any revisions to any forward-looking statements to reflect events or circumstances in the future or to reflect the occurrence of unanticipated events.
SIGNATURE
Pursuant to the requirements of the Securities Exchange Act of 1934, the registrant has duly caused this report to be signed on its behalf by the undersigned hereunto duly authorized.
| NAVISTAR INTERNATIONAL CORPORATION (Registrant) | ||
| By: | /S/ WALTER G. BORST | |
| Name: | Walter G. Borst | |
| Title: | Executive Vice President and Chief Financial Officer | |
Dated: December 17, 2015
EXHIBIT INDEX
| Exhibit No. |
Description | |
| 99.1 | Press Release. | |
| 99.2 | Slide Presentation for Fourth Quarter 2015 Financial Results Web Cast to be held on December 17, 2015. | |
Exhibit 99.1

| Media contact: | Jim Spangler, 331-332-5833 | |
| Investor contact: | Kevin Sadowski, 331-332-2406 | |
| Web site: | www.Navistar.com/newsroom |
NAVISTAR REPORTS FOURTH QUARTER RESULTS
| • | Reports net loss of $50 million, or 61 cents per share, on revenues of $2.5 billion |
| • | Generates $209 million of adjusted EBITDA (8.4% adjusted EBITDA margin) in the quarter |
| • | Finishes year with more than $300 million in operational cost savings |
| • | Ends year with more than $1 billion in manufacturing cash |
| • | FY 2016 Full-Year Guidance: $600 - $700 million adjusted EBITDA |
LISLE, Ill. — December 17, 2015 — Navistar International Corporation (NYSE: NAV) today announced a fourth quarter 2015 net loss of $50 million, or $0.61 per diluted share, compared to a fourth quarter 2014 net loss of $72 million, or $0.88 per diluted share. Revenues in the quarter were $2.5 billion.
Fourth quarter 2015 EBITDA was $86 million versus EBITDA of $66 million in the same period one year ago. This year’s fourth quarter included $69 million in restructuring-related and impairment charges; $40 million in pre-existing warranty adjustments; and $14 million in debt refinancing fees and costs. As a result, adjusted fourth quarter 2015 EBITDA was $209 million, equating to a fourth quarter adjusted EBITDA margin of 8.4 percent.
Revenues in the quarter declined 17 percent compared to fourth quarter 2014. Higher Class 6/7 medium and bus chargeouts in the company’s Core (U.S. and Canada) market were more than offset by reduced volumes in the company’s export and global operations, lower Class 8 truck chargeouts in its Core market, and Navistar’s exit earlier this year from the Blue Diamond Truck joint venture.
“We delivered on our adjusted EBITDA end-of year run rate target of 8 percent or better, thanks to a favorable mix of truck sales and record parts profitability in our core North America market in the fourth quarter,” said Troy A. Clarke, Navistar president and chief executive officer. “We also benefited from our continued focus on cost management across our operations, marked by a $74 million improvement in structural costs in the quarter.”
Navistar finished the fourth quarter 2015 with $1.01 billion in manufacturing cash, cash equivalents and marketable securities.
During the quarter, the company announced a long-term agreement with General Motors Co. (GM) to develop and assemble medium-duty, conventional cab Class 4/5 commercial vehicles, allowing Navistar to strengthen its product lineup. The trucks, which are scheduled to go into production in 2018 and will be built at Navistar’s Springfield, Ohio plant, will be jointly developed using Navistar’s expertise in commercial vehicles and manufacturing capabilities, and GM’s commercial components and engines.
As for full-year 2015 results, Navistar reported a net loss of $184 million, or $2.25 per diluted share, versus a net loss of $619 million, or $7.60 per diluted share, for fiscal year 2014. Fiscal year 2015 adjusted EBITDA was $494 million versus $306 million adjusted EBITDA for 2014. Revenue for fiscal year 2015 was $10.1 billion, compared to $10.8 billion in fiscal year 2014.
Chargeouts in the company’s Core North America market increased by 3,500 units, or 6-percent, in 2015, reflecting an 18-percent increase in Class 6/7 medium trucks, a 10- percent increase in school buses, and a 7-percent increase in Class 8 severe service, partially offset by a 4-percent decline in Class 8 heavy truck. Total market share for Class 6-8 and bus for the year was 16 percent. Operationally, the company reduced its total costs by more than $300 million in 2015, including $114 million in structural cost reductions, with the remainder coming from reduced material and logistics spending and lower manufacturing costs.
“For the third consecutive year, we generated around $200 million in adjusted EBITDA improvement, and we expect this improvement trend to continue in 2016,” Clarke said. “We are building the best products we’ve ever built, and we are winning back customers. We have identified and begun implementing actions to further lower our material spend and structural costs, while driving greater efficiencies in our manufacturing operations. As a result, we expect to build on our 2015 progress, and our goal is to achieve profitability and be free cash flow positive in 2016.”
The company provided the following guidance:
| • | Forecasts retail deliveries of Class 6-8 trucks and buses in the United States and Canada will be in the range of 350,000 units to 380,000 units for fiscal year 2016. |
| • | Full-year 2016 revenues to be between $9.5 - $10.0 billion. |
| • | Full-year 2016 adjusted EBITDA of $600 - $700 million. |
Summary of Financial Results:
| (Unaudited) | Years Ended October 31, |
|||||||||||||||
| Quarters Ended October 31, |
||||||||||||||||
| (in millions, except per share data) | 2015 | 2014 | 2015 | 2014 | ||||||||||||
| Sales and revenues, net |
$ | 2,488 | $ | 3,008 | $ | 10,140 | $ | 10,806 | ||||||||
| Segment Results: |
||||||||||||||||
| Truck |
$ | (36 | ) | $ | (40 | ) | $ | (141 | ) | $ | (380 | ) | ||||
| Parts |
163 | 150 | 592 | 528 | ||||||||||||
| Global Operations |
(27 | ) | (56 | ) | (67 | ) | (274 | ) | ||||||||
| Financial Services |
26 | 26 | 98 | 97 | ||||||||||||
| Loss from continuing operations, net of tax(A) |
$ | (51 | ) | $ | (72 | ) | $ | (187 | ) | $ | (622 | ) | ||||
| Net loss(A) |
(50 | ) | (72 | ) | (184 | ) | (619 | ) | ||||||||
| Diluted loss per share from continuing operations(A) |
$ | (0.62 | ) | $ | (0.88 | ) | $ | (2.29 | ) | $ | (7.64 | ) | ||||
| Diluted loss per share(A) |
$ | (0.61 | ) | $ | (0.88 | ) | $ | (2.25 | ) | $ | (7.60 | ) | ||||
| (A) | Amounts attributable to Navistar International Corporation. |
Truck Segment — For the fourth quarter 2015, the Truck segment recorded a loss of $36 million, compared with a year-ago fourth quarter loss of $40 million. This year’s fourth quarter results also reflect $26 million in
2
restructuring charges, primarily related to reduction-in-force initiatives initiated at the end of the quarter, as well as $40 million in pre-existing warranty charges, while last year’s results included $27 million in restructuring related charges and $11 million in pre-existing warranty benefits. The year-over-year improvement was driven by cost management activities, favorable mix in its Core market, and improved margins, which more than offset the lower chargeouts in its Core market.
For the fiscal year 2015, the Truck segment recorded a loss of $141 million, compared with a fiscal year 2014 loss of $380 million. The year-over-year improvement was primarily driven by a favorable shift in product mix in Core market, improved margins and lower structural costs, partially offset by an increase in used truck reserves and higher accelerated depreciation charges related to the company’s exit of the foundry business.
Parts Segment — For the fourth quarter 2015, the Parts segment recorded record profits of $163 million, compared to a year-ago fourth quarter profit of $150 million. The increase was primarily due to stronger margins in its Core commercial markets.
For the fiscal year 2015, the Parts segment recorded record profits of $592 million, compared to a fiscal year 2014 profit of $528 million. The 12-percent increase was primarily driven by higher revenues, margin improvements in its commercial markets and cost-reduction initiatives, partially offset by the performance decline in its Blue Diamond Parts business due to the decrease of serviceable units in operation.
Global Operations Segment — For the fourth quarter 2015, the Global Operations segment recorded a loss of $27 million, compared to a year-ago fourth quarter loss of $56 million. The year-over-year improvement was primarily driven by ongoing actions to lower the company’s cost structure in its South American engine business, to offset the impact of the ongoing downturn in Brazil’s economy.
For the 2015 fiscal year, the Global Operations segment recorded a loss of $67 million compared to a year-ago fiscal year loss of $274 million. Excluding the impact of the prior year impairments of $149 million and current year restructuring costs increase of $16 million, the Global Operations segment improved year-over-year performance by $74 million, primarily due to lower year-over-year manufacturing and structural costs.
Financial Services Segment — For the fourth quarter 2015, the Financial Services segment recorded a profit of $26 million, equal to fourth quarter 2014 profit of $26 million.
For the fiscal year 2015, the Financial Services segment recorded a profit of $98 million, comparable to a fiscal year 2014 profit of $97 million, as an increase in revenue and a decrease in the provision for loan losses were offset by lower interest income from intercompany loans.
About Navistar
Navistar International Corporation (NYSE: NAV) is a holding company whose subsidiaries and affiliates produce International® brand commercial and military trucks, proprietary diesel engines, and IC Bus™ brand school and commercial buses. An affiliate also provides truck and diesel engine service parts. Another affiliate offers financing services. Additional information is available at www.Navistar.com.
3
Forward-Looking Statement
Information provided and statements contained in this report that are not purely historical are forward-looking statements within the meaning of Section 27A of the Securities Act of 1933, as amended, Section 21E of the Securities Exchange Act of 1934, as amended, and the Private Securities Litigation Reform Act of 1995. Such forward-looking statements only speak as of the date of this report and the company assumes no obligation to update the information included in this report. Such forward-looking statements include information concerning our possible or assumed future results of operations, including descriptions of our business strategy. These statements often include words such as “believe,” “expect,” “anticipate,” “intend,” “plan,” “estimate,” or similar expressions. These statements are not guarantees of performance or results and they involve risks, uncertainties, and assumptions. For a further description of these factors, see the risk factors set forth in our filings with the Securities and Exchange Commission, including our annual report on Form 10-K for the fiscal year ended October 31, 2015. Although we believe that these forward-looking statements are based on reasonable assumptions, there are many factors that could affect our actual financial results or results of operations and could cause actual results to differ materially from those in the forward-looking statements. All future written and oral forward-looking statements by us or persons acting on our behalf are expressly qualified in their entirety by the cautionary statements contained or referred to above. Except for our ongoing obligations to disclose material information as required by the federal securities laws, we do not have any obligations or intention to release publicly any revisions to any forward-looking statements to reflect events or circumstances in the future or to reflect the occurrence of unanticipated events.
# # #
4
Navistar International Corporation and Subsidiaries
Consolidated Statements of Operations
| (Unaudited) | ||||||||||||||||
| Quarters Ended October 31, |
Years Ended October 31, |
|||||||||||||||
| (in millions, except per share data) | 2015 | 2014 | 2015 | 2014 | ||||||||||||
| Sales and revenues |
||||||||||||||||
| Sales of manufactured products, net |
$ | 2,451 | $ | 2,970 | $ | 9,995 | $ | 10,653 | ||||||||
| Finance revenues |
37 | 38 | 145 | 153 | ||||||||||||
|
|
|
|
|
|
|
|
|
|||||||||
| Sales and revenues, net |
2,488 | 3,008 | 10,140 | 10,806 | ||||||||||||
|
|
|
|
|
|
|
|
|
|||||||||
| Costs and expenses |
||||||||||||||||
| Costs of products sold |
2,093 | 2,635 | 8,670 | 9,534 | ||||||||||||
| Restructuring charges |
54 | 15 | 76 | 42 | ||||||||||||
| Asset impairment charges |
15 | 10 | 30 | 183 | ||||||||||||
| Selling, general and administrative expenses |
204 | 262 | 908 | 979 | ||||||||||||
| Engineering and product development costs |
62 | 78 | 288 | 331 | ||||||||||||
| Interest expense |
80 | 80 | 307 | 314 | ||||||||||||
| Other (income) expense, net |
7 | (7 | ) | (30 | ) | (12 | ) | |||||||||
|
|
|
|
|
|
|
|
|
|||||||||
| Total costs and expenses |
2,515 | 3,073 | 10,249 | 11,371 | ||||||||||||
| Equity in income of non-consolidated affiliates |
— | 4 | 6 | 9 | ||||||||||||
|
|
|
|
|
|
|
|
|
|||||||||
| Loss from continuing operations before income taxes |
(27 | ) | (61 | ) | (103 | ) | (556 | ) | ||||||||
| Income tax expense |
(14 | ) | (1 | ) | (51 | ) | (26 | ) | ||||||||
|
|
|
|
|
|
|
|
|
|||||||||
| Loss from continuing operations |
(41 | ) | (62 | ) | (154 | ) | (582 | ) | ||||||||
| Income from discontinued operations, net of tax |
1 | — | 3 | 3 | ||||||||||||
|
|
|
|
|
|
|
|
|
|||||||||
| Net loss |
(40 | ) | (62 | ) | (151 | ) | (579 | ) | ||||||||
| Less: Net income attributable to non-controlling interests |
10 | 10 | 33 | 40 | ||||||||||||
|
|
|
|
|
|
|
|
|
|||||||||
| Net loss attributable to Navistar International Corporation |
$ | (50 | ) | $ | (72 | ) | $ | (184 | ) | $ | (619 | ) | ||||
|
|
|
|
|
|
|
|
|
|||||||||
| Amounts attributable to Navistar International Corporation common shareholders: |
||||||||||||||||
| Loss from continuing operations, net of tax |
$ | (51 | ) | $ | (72 | ) | $ | (187 | ) | $ | (622 | ) | ||||
| Income from discontinued operations, net of tax |
1 | — | 3 | 3 | ||||||||||||
|
|
|
|
|
|
|
|
|
|||||||||
| Net loss |
$ | (50 | ) | $ | (72 | ) | $ | (184 | ) | $ | (619 | ) | ||||
|
|
|
|
|
|
|
|
|
|||||||||
| Earnings (loss) per share: |
||||||||||||||||
| Basic: |
||||||||||||||||
| Continuing operations |
$ | (0.62 | ) | $ | (0.88 | ) | $ | (2.29 | ) | $ | (7.64 | ) | ||||
| Discontinued operations |
0.01 | — | 0.04 | 0.04 | ||||||||||||
|
|
|
|
|
|
|
|
|
|||||||||
| $ | (0.61 | ) | $ | (0.88 | ) | $ | (2.25 | ) | $ | (7.60 | ) | |||||
|
|
|
|
|
|
|
|
|
|||||||||
| Diluted: |
||||||||||||||||
| Continuing operations |
$ | (0.62 | ) | $ | (0.88 | ) | $ | (2.29 | ) | $ | (7.64 | ) | ||||
| Discontinued operations |
0.01 | — | 0.04 | 0.04 | ||||||||||||
|
|
|
|
|
|
|
|
|
|||||||||
| $ | (0.61 | ) | $ | (0.88 | ) | $ | (2.25 | ) | $ | (7.60 | ) | |||||
|
|
|
|
|
|
|
|
|
|||||||||
| Weighted average shares outstanding: |
||||||||||||||||
| Basic |
81.6 | 81.5 | 81.6 | 81.4 | ||||||||||||
| Diluted |
81.6 | 81.5 | 81.6 | 81.4 | ||||||||||||
5
Navistar International Corporation and Subsidiaries
Consolidated Balance Sheets
| (in millions, except per share data) | October 31, 2015 |
October 31, 2014 |
||||||
| ASSETS |
||||||||
| Current assets |
||||||||
| Cash and cash equivalents |
$ | 912 | $ | 497 | ||||
| Restricted cash and cash equivalents |
— | 40 | ||||||
| Marketable securities |
159 | 605 | ||||||
| Trade and other receivables, net |
429 | 553 | ||||||
| Finance receivables, net |
1,779 | 1,758 | ||||||
| Inventories |
1,135 | 1,319 | ||||||
| Deferred taxes, net |
36 | 55 | ||||||
| Other current assets |
172 | 186 | ||||||
|
|
|
|
|
|||||
| Total current assets |
4,622 | 5,013 | ||||||
| Restricted cash |
121 | 131 | ||||||
| Trade and other receivables, net |
13 | 25 | ||||||
| Finance receivables, net |
216 | 280 | ||||||
| Investments in non-consolidated affiliates |
66 | 73 | ||||||
| Property and equipment, net |
1,345 | 1,562 | ||||||
| Goodwill |
38 | 38 | ||||||
| Intangible assets, net |
57 | 90 | ||||||
| Deferred taxes, net |
128 | 145 | ||||||
| Other noncurrent assets |
86 | 86 | ||||||
|
|
|
|
|
|||||
| Total assets |
$ | 6,692 | $ | 7,443 | ||||
|
|
|
|
|
|||||
| LIABILITIES and STOCKHOLDERS’ DEFICIT |
||||||||
| Liabilities |
||||||||
| Current liabilities |
||||||||
| Notes payable and current maturities of long-term debt |
$ | 1,110 | $ | 1,295 | ||||
| Accounts payable |
1,301 | 1,564 | ||||||
| Other current liabilities |
1,377 | 1,372 | ||||||
|
|
|
|
|
|||||
| Total current liabilities |
3,788 | 4,231 | ||||||
| Long-term debt |
4,188 | 3,929 | ||||||
| Postretirement benefits liabilities |
2,995 | 2,862 | ||||||
| Deferred taxes, net |
14 | 14 | ||||||
| Other noncurrent liabilities |
867 | 1,025 | ||||||
|
|
|
|
|
|||||
| Total liabilities |
11,852 | 12,061 | ||||||
| Redeemable equity securities |
— | 2 | ||||||
| Stockholders’ deficit |
||||||||
| Series D convertible junior preference stock |
2 | 3 | ||||||
| Common stock (86.8 shares issued, and $0.10 par value per share and 220 shares authorized, all at both dates) |
9 | 9 | ||||||
| Additional paid-in capital |
2,499 | 2,500 | ||||||
| Accumulated deficit |
(4,866 | ) | (4,682 | ) | ||||
| Accumulated other comprehensive loss |
(2,601 | ) | (2,263 | ) | ||||
| Common stock held in treasury, at cost (5.3 and 5.4 shares, respectively) |
(210 | ) | (221 | ) | ||||
|
|
|
|
|
|||||
| Total stockholders’ deficit attributable to Navistar International Corporation |
(5,167 | ) | (4,654 | ) | ||||
| Stockholders’ equity attributable to non-controlling interests |
7 | 34 | ||||||
|
|
|
|
|
|||||
| Total stockholders’ deficit |
(5,160 | ) | (4,620 | ) | ||||
|
|
|
|
|
|||||
| Total liabilities and stockholders’ deficit |
$ | 6,692 | $ | 7,443 | ||||
|
|
|
|
|
|||||
6
Navistar International Corporation and Subsidiaries
Condensed Consolidated Statements of Cash Flows
| Years Ended October 31, |
||||||||
| (in millions) | 2015 | 2014 | ||||||
| Cash flows from operating activities |
||||||||
| Net loss |
$ | (151 | ) | $ | (579 | ) | ||
| Adjustments to reconcile net loss to net cash provided by (used in) operating activities: |
||||||||
| Depreciation and amortization |
205 | 227 | ||||||
| Depreciation of equipment leased to others |
76 | 105 | ||||||
| Deferred taxes, including change in valuation allowance |
(18 | ) | (15 | ) | ||||
| Asset impairment charges |
30 | 183 | ||||||
| Amortization of debt issuance costs and discount |
37 | 49 | ||||||
| Stock-based compensation |
10 | 16 | ||||||
| Provision for doubtful accounts, net of recoveries |
(9 | ) | 20 | |||||
| Equity in income of non-consolidated affiliates, net of dividends |
6 | 3 | ||||||
| Write-off of debt issuance cost and discount |
4 | 1 | ||||||
| Other non-cash operating activities |
(35 | ) | (41 | ) | ||||
| Changes in other assets and liabilities, exclusive of the effects of businesses disposed: |
||||||||
| Trade and other receivables |
103 | 55 | ||||||
| Finance receivables |
(58 | ) | (33 | ) | ||||
| Inventories |
131 | (129 | ) | |||||
| Accounts payable |
(208 | ) | 84 | |||||
| Other assets and liabilities |
(77 | ) | (282 | ) | ||||
|
|
|
|
|
|||||
| Net cash provided by (used in) operating activities |
46 | (336 | ) | |||||
|
|
|
|
|
|||||
| Cash flows from investing activities |
||||||||
| Purchases of marketable securities |
(887 | ) | (1,812 | ) | ||||
| Sales of marketable securities |
1,247 | 1,576 | ||||||
| Maturities of marketable securities |
86 | 461 | ||||||
| Net change in restricted cash and cash equivalents |
42 | (80 | ) | |||||
| Capital expenditures |
(115 | ) | (88 | ) | ||||
| Purchases of equipment leased to others |
(83 | ) | (189 | ) | ||||
| Proceeds from sales of property and equipment |
22 | 43 | ||||||
| Investments in non-consolidated affiliates |
1 | — | ||||||
| Proceeds from sales of affiliates |
7 | 14 | ||||||
| Business acquisitions, net of cash received |
(4 | ) | — | |||||
|
|
|
|
|
|||||
| Net cash provided by (used in) investing activities |
316 | (75 | ) | |||||
|
|
|
|
|
|||||
| Cash flows from financing activities |
||||||||
| Proceeds from issuance of securitized debt |
549 | 82 | ||||||
| Principal payments on securitized debt |
(501 | ) | (126 | ) | ||||
| Net change in secured revolving credit facilities |
(22 | ) | 173 | |||||
| Proceeds from issuance of non-securitized debt |
1,212 | 663 | ||||||
| Principal payments on non-securitized debt |
(990 | ) | (862 | ) | ||||
| Net increase in notes and debt outstanding under revolving credit facilities |
(106 | ) | 255 | |||||
| Principal payments under financing arrangements and capital lease obligations |
(2 | ) | (20 | ) | ||||
| Debt issuance costs |
(25 | ) | (15 | ) | ||||
| Proceeds from financed lease obligations |
33 | 60 | ||||||
| Proceeds from exercise of stock options |
1 | 19 | ||||||
| Dividends paid by subsidiaries to non-controlling interest |
(36 | ) | (50 | ) | ||||
| Other financing activities |
(15 | ) | — | |||||
|
|
|
|
|
|||||
| Net cash provided by financing activities |
98 | 179 | ||||||
|
|
|
|
|
|||||
| Effect of exchange rate changes on cash and cash equivalents |
(45 | ) | (26 | ) | ||||
|
|
|
|
|
|||||
| Increase (decrease) in cash and cash equivalents |
415 | (258 | ) | |||||
| Cash and cash equivalents at beginning of the year |
497 | 755 | ||||||
|
|
|
|
|
|||||
| Cash and cash equivalents at end of the year |
$ | 912 | $ | 497 | ||||
|
|
|
|
|
|||||
7
Navistar International Corporation and Subsidiaries
Segment Reporting
(Unaudited)
We define segment profit (loss) as net income (loss) from continuing operations attributable to Navistar International Corporation excluding income tax benefit (expense). The following tables present selected financial information for our reporting segments:
| (in millions) | Truck | Parts | Global Operations |
Financial Services(A) |
Corporate and Eliminations |
Total | ||||||||||||||||||
| Three Months Ended October 31, 2015 |
||||||||||||||||||||||||
| External sales and revenues, net |
$ | 1,706 | $ | 640 | $ | 102 | $ | 37 | $ | 3 | $ | 2,488 | ||||||||||||
| Intersegment sales and revenues |
37 | 9 | 13 | 21 | (80 | ) | — | |||||||||||||||||
|
|
|
|
|
|
|
|
|
|
|
|
|
|||||||||||||
| Total sales and revenues, net |
$ | 1,743 | $ | 649 | $ | 115 | $ | 58 | $ | (77 | ) | $ | 2,488 | |||||||||||
|
|
|
|
|
|
|
|
|
|
|
|
|
|||||||||||||
| Income (loss) from continuing operations attributable to NIC, net of tax |
$ | (36 | ) | $ | 163 | $ | (27 | ) | $ | 26 | $ | (177 | ) | $ | (51 | ) | ||||||||
| Income tax expense |
— | — | — | — | (14 | ) | (14 | ) | ||||||||||||||||
|
|
|
|
|
|
|
|
|
|
|
|
|
|||||||||||||
| Segment profit (loss) |
$ | (36 | ) | $ | 163 | $ | (27 | ) | $ | 26 | $ | (163 | ) | $ | (37 | ) | ||||||||
|
|
|
|
|
|
|
|
|
|
|
|
|
|||||||||||||
| Depreciation and amortization |
$ | 34 | $ | 3 | $ | 5 | $ | 14 | $ | 4 | $ | 60 | ||||||||||||
| Interest expense |
— | — | — | 17 | 63 | 80 | ||||||||||||||||||
| Equity in income (loss) of non-consolidated affiliates |
1 | 1 | (2 | ) | — | — | — | |||||||||||||||||
| Capital expenditures(B) |
34 | 2 | — | 2 | 5 | 43 | ||||||||||||||||||
| (in millions) | Truck | Parts | Global Operations |
Financial Services(A) |
Corporate and Eliminations |
Total | ||||||||||||||||||
| Three Months Ended October 31, 2014 |
||||||||||||||||||||||||
| External sales and revenues, net |
$ | 2,079 | $ | 676 | $ | 215 | $ | 38 | $ | — | $ | 3,008 | ||||||||||||
| Intersegment sales and revenues |
52 | 15 | 9 | 22 | (98 | ) | — | |||||||||||||||||
|
|
|
|
|
|
|
|
|
|
|
|
|
|||||||||||||
| Total sales and revenues, net |
$ | 2,131 | $ | 691 | $ | 224 | $ | 60 | $ | (98 | ) | $ | 3,008 | |||||||||||
|
|
|
|
|
|
|
|
|
|
|
|
|
|||||||||||||
| Income (loss) from continuing operations attributable to NIC, net of tax |
$ | (40 | ) | $ | 150 | $ | (56 | ) | $ | 26 | $ | (152 | ) | $ | (72 | ) | ||||||||
| Income tax expense |
— | — | — | — | (1 | ) | (1 | ) | ||||||||||||||||
|
|
|
|
|
|
|
|
|
|
|
|
|
|||||||||||||
| Segment profit (loss) |
$ | (40 | ) | $ | 150 | $ | (56 | ) | $ | 26 | $ | (151 | ) | $ | (71 | ) | ||||||||
|
|
|
|
|
|
|
|
|
|
|
|
|
|||||||||||||
| Depreciation and amortization |
$ | 45 | $ | 3 | $ | 7 | $ | 13 | $ | 8 | $ | 76 | ||||||||||||
| Interest expense |
— | — | — | 19 | 61 | 80 | ||||||||||||||||||
| Equity in income (loss) of non-consolidated affiliates |
2 | 1 | 1 | — | — | 4 | ||||||||||||||||||
| Capital expenditures(B) |
23 | 1 | 2 | — | 5 | 31 | ||||||||||||||||||
8
| (in millions) | Truck | Parts | Global Operations |
Financial Services(A) |
Corporate and Eliminations |
Total | ||||||||||||||||||
| Year Ended October 31, 2015 |
||||||||||||||||||||||||
| External sales and revenues, net |
$ | 7,055 | $ | 2,475 | $ | 455 | $ | 145 | $ | 10 | $ | 10,140 | ||||||||||||
| Intersegment sales and revenues |
158 | 38 | 51 | 96 | (343 | ) | — | |||||||||||||||||
|
|
|
|
|
|
|
|
|
|
|
|
|
|||||||||||||
| Total sales and revenues, net |
$ | 7,213 | $ | 2,513 | $ | 506 | $ | 241 | $ | (333 | ) | $ | 10,140 | |||||||||||
|
|
|
|
|
|
|
|
|
|
|
|
|
|||||||||||||
| Income (loss) from continuing operations attributable to NIC, net of tax |
$ | (141 | ) | $ | 592 | $ | (67 | ) | $ | 98 | $ | (669 | ) | $ | (187 | ) | ||||||||
| Income tax expense |
— | — | — | — | (51 | ) | (51 | ) | ||||||||||||||||
|
|
|
|
|
|
|
|
|
|
|
|
|
|||||||||||||
| Segment profit (loss) |
$ | (141 | ) | $ | 592 | $ | (67 | ) | $ | 98 | $ | (618 | ) | $ | (136 | ) | ||||||||
|
|
|
|
|
|
|
|
|
|
|
|
|
|||||||||||||
| Depreciation and amortization |
$ | 173 | $ | 14 | $ | 23 | $ | 51 | $ | 20 | $ | 281 | ||||||||||||
| Interest expense |
— | — | — | 74 | 233 | 307 | ||||||||||||||||||
| Equity in income (loss) of non-consolidated affiliates |
5 | 4 | (3 | ) | — | — | 6 | |||||||||||||||||
| Capital expenditures(B) |
92 | 3 | 4 | 4 | 12 | 115 | ||||||||||||||||||
| (in millions) | Truck | Parts | Global Operations |
Financial Services(A) |
Corporate and Eliminations |
Total | ||||||||||||||||||
| Year Ended October 31, 2014 |
||||||||||||||||||||||||
| External sales and revenues, net |
$ | 7,255 | $ | 2,493 | $ | 905 | $ | 153 | $ | — | $ | 10,806 | ||||||||||||
| Intersegment sales and revenues |
218 | 58 | 35 | 79 | (390 | ) | — | |||||||||||||||||
|
|
|
|
|
|
|
|
|
|
|
|
|
|||||||||||||
| Total sales and revenues, net |
$ | 7,473 | $ | 2,551 | $ | 940 | $ | 232 | $ | (390 | ) | $ | 10,806 | |||||||||||
|
|
|
|
|
|
|
|
|
|
|
|
|
|||||||||||||
| Income (loss) from continuing operations attributable to NIC, net of tax |
$ | (380 | ) | $ | 528 | $ | (274 | ) | $ | 97 | $ | (593 | ) | $ | (622 | ) | ||||||||
| Income tax expense |
— | — | — | — | (26 | ) | (26 | ) | ||||||||||||||||
|
|
|
|
|
|
|
|
|
|
|
|
|
|||||||||||||
| Segment profit (loss) |
$ | (380 | ) | $ | 528 | $ | (274 | ) | $ | 97 | $ | (567 | ) | $ | (596 | ) | ||||||||
|
|
|
|
|
|
|
|
|
|
|
|
|
|||||||||||||
| Depreciation and amortization |
$ | 216 | $ | 15 | $ | 28 | $ | 46 | $ | 27 | $ | 332 | ||||||||||||
| Interest expense |
— | — | — | 71 | 243 | 314 | ||||||||||||||||||
| Equity in income (loss) of non-consolidated affiliates |
5 | 4 | — | — | — | 9 | ||||||||||||||||||
| Capital expenditures(B) |
65 | 6 | 8 | 1 | 8 | 88 | ||||||||||||||||||
| (in millions) | Truck | Parts | Global Operations |
Financial Services |
Corporate and Eliminations |
Total | ||||||||||||||||||
| Segment assets, as of: |
||||||||||||||||||||||||
| October 31, 2015 |
$ | 1,876 | $ | 641 | $ | 409 | $ | 2,455 | $ | 1,311 | $ | 6,692 | ||||||||||||
| October 31, 2014(C) |
2,245 | 672 | 657 | 2,582 | 1,287 | 7,443 | ||||||||||||||||||
| (A) | Total sales and revenues in the Financial Services segment include interest revenues of $40 million and $175 million for the three months and year ended October 31, 2015, respectively and $44 million and $170 million for the three months and year ended October 31, 2014, respectively. |
| (B) | Exclusive of purchases of equipment leased to others. |
| (C) | During the third quarter of 2015, it was determined that multiemployer plan accounting should have been applied in recording postretirement benefits related to our Financial Services segment, which provides that assets and liabilities of a plan are recorded only on the parent company and that periodic contributions to the plan made by the participating subsidiary are charged to expense for the purposes of the subsidiary’s financial statements. As a result, we have reclassified $16 million of deferred tax assets between Financial Services and Corporate and Eliminations related to the postretirement benefits reclassified between NIC and Non-Guarantor Subsidiaries. This reclassification did not impact consolidated segment assets for the year-ended October 31, 2014. |
9
SEC Regulation G Non-GAAP Reconciliation
The financial measures presented below are unaudited and not in accordance with, or an alternative for, financial measures presented in accordance with U.S. generally accepted accounting principles (“GAAP”). The non-GAAP financial information presented herein should be considered supplemental to, and not as a substitute for, or superior to, financial measures calculated in accordance with GAAP and are reconciled to the most appropriate GAAP number below.
Earnings (loss) Before Interest, Income Taxes, Depreciation, and Amortization (“EBITDA”):
We define EBITDA as our consolidated net income (loss) from continuing operations attributable to Navistar International Corporation, net of tax, plus manufacturing interest expense, income taxes, and depreciation and amortization. We believe EBITDA provides meaningful information to the performance of our business and therefore we use it to supplement our GAAP reporting. We have chosen to provide this supplemental information to investors, analysts and other interested parties to enable them to perform additional analyses of operating results.
Adjusted EBITDA:
We believe that adjusted EBITDA, which excludes certain identified items that we do not consider to be part of our ongoing business, improves the comparability of year to year results, and is representative of our underlying performance. Management uses this information to assess and measure the performance of our operating segments. We have chosen to provide this supplemental information to investors, analysts and other interested parties to enable them to perform additional analyses of operating results, to illustrate the results of operations giving effect to the non-GAAP adjustments shown in the below reconciliations, and to provide an additional measure of performance.
Adjusted EBITDA margin:
We define Adjusted EBITDA margin as a percentage of the Company’s consolidated sales and revenues. We have chosen to provide this supplemental information to investors, analysts and other interested parties to enable them to perform additional analyses of operating results, to illustrate the results of operations giving effect to the non-GAAP adjustments shown in the below reconciliations, and to provide an additional measure of performance.
Manufacturing Cash, Cash Equivalents, and Marketable Securities:
Manufacturing cash, cash equivalents, and marketable securities represents the Company’s consolidated cash, cash equivalents, and marketable securities excluding cash, cash equivalents, and marketable securities of our financial services operations. We include marketable securities with our cash and cash equivalents when assessing our liquidity position as our investments are highly liquid in nature. We have chosen to provide this supplemental information to investors, analysts and other interested parties to enable them to perform additional analyses of our ability to meet our operating requirements, capital expenditures, equity investments, and financial obligations.
Structural costs consists of Selling, general and administrative expenses and Engineering and product development costs.
EBITDA reconciliation:
| (in millions) | Three Months Ended October 31, |
Years Ended October 31, |
||||||||||||||||||||||
| 2015 | 2014 | 2015 | 2014 | 2013 | 2012 | |||||||||||||||||||
| Loss from continuing operations attributable to NIC, net of tax |
$ | (51 | ) | $ | (72 | ) | $ | (187 | ) | $ | (622 | ) | $ | (857 | ) | $ | (2,939 | ) | ||||||
| Plus: |
||||||||||||||||||||||||
| Depreciation and amortization expense |
60 | 76 | 281 | 332 | 417 | 323 | ||||||||||||||||||
| Manufacturing interest expense(A) |
63 | 61 | 233 | 243 | 251 | 171 | ||||||||||||||||||
| Less: |
||||||||||||||||||||||||
| Income tax benefit (expense) |
(14 | ) | (1 | ) | (51 | ) | (26 | ) | 171 | (1,780 | ) | |||||||||||||
|
|
|
|
|
|
|
|
|
|
|
|
|
|||||||||||||
| EBITDA |
$ | 86 | $ | 66 | $ | 378 | $ | (21 | ) | $ | (360 | ) | $ | (665 | ) | |||||||||
|
|
|
|
|
|
|
|
|
|
|
|
|
|||||||||||||
| (A) | Manufacturing interest expense is the net interest expense primarily generated for borrowings that support the manufacturing and corporate operations, adjusted to eliminate intercompany interest expense with our Financial Services segment. The following table reconciles Manufacturing interest expense to the consolidated interest expense: |
10
| Three Months Ended October 31, |
Years Ended October 31, |
|||||||||||||||||||||||
| 2015 | 2014 | 2015 | 2014 | 2013 | 2012 | |||||||||||||||||||
| (in millions) | ||||||||||||||||||||||||
| Interest expense |
$ | 80 | $ | 80 | $ | 307 | $ | 314 | $ | 321 | $ | 259 | ||||||||||||
| Less: Financial services interest expense |
17 | 19 | 74 | 71 | 70 | 88 | ||||||||||||||||||
|
|
|
|
|
|
|
|
|
|
|
|
|
|||||||||||||
| Manufacturing interest expense |
$ | 63 | $ | 61 | $ | 233 | $ | 243 | $ | 251 | $ | 171 | ||||||||||||
|
|
|
|
|
|
|
|
|
|
|
|
|
|||||||||||||
Adjusted EBITDA reconciliation:
| Three Months Ended October 31, |
Years Ended October 31, |
|||||||||||||||||||||||
| (in millions) | 2015 | 2014 | 2015 | 2014 | 2013 | 2012 | ||||||||||||||||||
| EBITDA (reconciled above) |
$ | 86 | $ | 66 | $ | 378 | $ | (21 | ) | $ | (360 | ) | $ | (665 | ) | |||||||||
| Less significant items of: |
||||||||||||||||||||||||
| Adjustments to pre-existing warranties(A) |
40 | (10 | ) | 4 | 55 | 404 | 404 | |||||||||||||||||
| Brazil reporting unit impairment charges(B) |
7 | — | 10 | 149 | — | — | ||||||||||||||||||
| Brazil truck business actions(C) |
— | 29 | 6 | 29 | — | — | ||||||||||||||||||
| North America asset impairment charges(D) |
8 | — | 20 | 24 | 97 | 16 | ||||||||||||||||||
| Restructuring of North American manufacturing operations(E) |
— | 27 | — | 41 | — | 7 | ||||||||||||||||||
| Cost reduction and other strategic initiatives(F) |
54 | 4 | 72 | 17 | 9 | 73 | ||||||||||||||||||
| Debt refinancing charges(G) |
14 | — | 14 | 12 | 13 | 8 | ||||||||||||||||||
| Gain on settlement(H) |
— | — | (10 | ) | — | — | — | |||||||||||||||||
| Mahindra Joint Venture divestiture(I) |
(26 | ) | — | |||||||||||||||||||||
| Legal settlement(J) |
(35 | ) | — | |||||||||||||||||||||
| Engineering integration costs(K) |
— | 66 | ||||||||||||||||||||||
|
|
|
|
|
|
|
|
|
|
|
|
|
|||||||||||||
| Total adjustments |
123 | 50 | 116 | 327 | 462 | 574 | ||||||||||||||||||
|
|
|
|
|
|
|
|
|
|
|
|
|
|||||||||||||
| Adjusted EBITDA |
$ | 209 | $ | 116 | $ | 494 | $ | 306 | $ | 102 | $ | (91 | ) | |||||||||||
|
|
|
|
|
|
|
|
|
|
|
|
|
|||||||||||||
| Adjusted EBITDA margin |
8.4 | % | 3.9 | % | 4.9 | % | 2.8 | % | 3.7 | % | (2.8 | )% | ||||||||||||
| (A) | Adjustments to pre-existing warranties reflect changes in our estimate of warranty costs for products sold in prior periods. |
| (B) | In the fourth quarter of 2015, the Company recognized a total non-cash charge of $7 million for the impairment of certain intangible and long-lived assets in the Brazil truck asset group. In the third quarter of 2015, we determined that $3 million of trademark asset carrying value was impaired. In the second quarter of 2014, we recognized a non-cash charge of $149 million for the impairment of certain intangible assets of our Brazilian engine reporting unit, including the entire $142 million balance of goodwill and $7 million of trademark. |
| (C) | In the second quarter of 2015 our Global Operations segment recorded $6 million in inventory charges to right size the Brazil Truck business. In the fourth quarter of 2014, the Global Operations segment recorded approximately $29 million in charges, primarily related to inventory, to right size the Brazil Truck business. |
| (D) | During the third and fourth quarters of 2015, certain long-lived assets were determined to be impaired, resulting in a charge of $3 million and $4 million, respectively. In the first quarter of 2015, the Truck segment recorded $7 million of asset impairment charges relating to certain operating leases. In 2014, the Truck segment recorded impairment charges related to certain amortizing intangible assets and long-lived assets which were determined to be fully impaired. In the first quarter of 2014, the Truck segment recognized asset impairment charges of $18 million. |
| (E) | In the fourth quarter of 2014 the Truck segment recorded $27 million of charges related to our anticipated exit from our Indianapolis, Indiana foundry facility and certain assets in our Waukesha, Wisconsin foundry operations. The charges included $13 million of restructuring charges, $7 million of fixed asset impairment charges and $7 million of charges for inventory reserves. In the third quarter of 2014, the Truck segment recorded $14 million of charges related to the 2011 closure of its Chatham, Ontario plant, based on a ruling received from the Financial Services Tribunal in Ontario, Canada. |
| (F) | In 2015, we had $72 million of cost reduction and other strategic initiatives primarily consisting of restructuring charges in the third and fourth quarters. In the fourth quarter of 2015, we incurred restructuring charges of $54 million related to cost reduction actions, including the Company’s offering of the VSP to the majority of our U.S.-based non-represented salaried employees and the impacts of an involuntary reduction-in-force in the U.S. and Brazil. In the third quarter of 2015, we incurred restructuring charges of $13 million related to cost reduction actions, including a reduction-in-force in the U.S. and Brazil. In 2014, the Company recorded restructuring charges related to cost reduction actions that included a reduction-in-force in the U.S and Brazil. |
| (G) | In the fourth quarter of 2015, we recorded $14 million of third party fees and unamortized debt issuance costs associated with the refinancing of our Amended Term Loan Credit Facility with a new Senior Secured Term Loan Credit Facility. In the second quarter of 2014, we recorded $12 million of unamortized debt issuance costs and other charges associated with the repurchase of our 2014 Convertible Notes. In the second quarter of 2013, we recorded $6 million of unamortized debt issuance costs and other charges associated with the sale of additional Senior Notes. In 2012, we recorded $8 million of unamortized debt issuance costs and other charges associated with our Senior Notes and Amended and Restated Asset-Based Credit Facility. |
| (H) | In the second quarter of 2015, the Global Operations segment recognized a $10 million net gain related to a settlement of a customer dispute. The $10 million net gain for the settlement included restructuring charges of $4 million. |
| (I) | In the second quarter of 2013, the Company sold its stake in the Mahindra Joint Ventures to Mahindra and the Global Operations segment recognized a gain of $26 million. |
| (J) | In the first quarter of 2013, as a result of the legal settlement with Deloitte and Touche LLP, the Company recognized a gain and received cash proceeds of $35 million. |
| (K) | Engineering integrated costs related to the consolidation of our truck and engine engineering operations, as well as the relocation of our world headquarters. In 2012, the charges included restructuring charges of $23 million and other related costs of $43 million, primarily in our Truck segment. |
11
Manufacturing segment cash and cash equivalents and marketable securities reconciliation:
| As of October 31, 2015 | ||||||||||||
| (in millions) | Manufacturing Operations |
Financial Services Operations |
Consolidated Balance Sheet |
|||||||||
| Assets |
||||||||||||
| Cash and cash equivalents |
$ | 877 | $ | 35 | $ | 912 | ||||||
| Marketable securities |
136 | 23 | 159 | |||||||||
|
|
|
|
|
|
|
|||||||
| Total Cash and cash equivalents and Marketable securities |
$ | 1,013 | $ | 58 | $ | 1,071 | ||||||
|
|
|
|
|
|
|
|||||||
12
 Q4 2015 EARNINGS PRESENTATION DECEMBER 17, 2015 Exhibit 99.2 International ® is a registered trademark of , Inc. |
 2 NYSE: NAV Q4 2015 Earnings – 12/17/2015 Safe Harbor Statement and Other Cautionary Notes Information provided and statements contained in this presentation that are not purely historical are
forward-looking statements
within
the
meaning
of
Section
27A
of
the
Securities
Act
of
1933,
as
amended,
Section
21E
of
the
Securities
Exchange
Act
of
1934, as amended, and the Private Securities Litigation
Reform Act of 1995. Such forward-looking statements only speak as of the date of this presentation and the Company assumes no obligation to update the information included in this
presentation. Such forward-looking
statements include information concerning our possible or assumed future results of operations, including descriptions of our business strategy. These statements often include words such as “believe,”
“expect,” “anticipate,”
“intend,” “plan,”
“estimate,” or similar expressions. These statements are not guarantees of performance or results and they involve risks, uncertainties, and assumptions. For a further description of these factors, see the risk factors
set forth in our filings with the
Securities and Exchange Commission, including our annual report on Form 10-K for the year ended October 31, 2015. Although we believe that these forward-looking statements are based on reasonable assumptions, there are many
factors that could affect our actual
financial results or results of operations and could cause actual results to differ materially from those in the forward-looking statements. All future written and oral forward-looking statements by us
or persons acting on our behalf are
expressly qualified in their entirety by the cautionary statements contained or referred to above. Except for our ongoing obligations to disclose material information as required by the federal securities laws, we do not have
any obligations or intention to release
publicly any revisions to any forward-looking statements to reflect events or circumstances in the future or to reflect the occurrence of unanticipated events.
The financial information herein contains audited and
unaudited information and has been prepared by management in good faith and based on data currently available to the Company.
Certain non-GAAP measures are used in this
presentation to assist the reader in understanding our core manufacturing business. We believe this information is useful and relevant to assess and measure the performance of our core manufacturing
business as it illustrates manufacturing
performance. It also excludes financial services and other items that may not be related to the core manufacturing business or underlying results. Management often uses this information to assess and
measure the underlying performance of our
operating segments. We have chosen to
provide this supplemental information to investors, analysts, and other interested parties to enable them to perform additional analyses of operating results. The
non-GAAP numbers are reconciled to the
most appropriate GAAP number in the appendix of this presentation. |
 3 NYSE: NAV Q4 2015 Earnings – 12/17/2015 Agenda Overview Troy Clarke Financial Results Walter Borst Summary Troy Clarke |
 NYSE: NAV 4 TH QUARTER 2015 RESULTS Troy Clarke, President & CEO |
 5 NYSE: NAV Q4 2015 Earnings – 12/17/2015 • Grew volumes and market share • Delivered record parts profitability • Generated over $300 million
in cost savings
• Achieved 8.4% adjusted
EBITDA margin in Q4
2015 Summary
Note:
This slide contains non-GAAP information; please
see the REG G in appendix for a detailed
reconciliation. |
 NYSE: NAV FINANCIAL RESULTS Walter Borst, Executive Vice President & CFO |
 7 NYSE: NAV Q4 2015 Earnings – 12/17/2015 Financial Summary Note: This slide contains non-GAAP information; please see the
REG G in appendix for a detailed reconciliation.
(A) Includes U.S. and Canada
School bus and Class 6-8 truck.
(B) Amounts attributable to Navistar
International Corporation. $ in millions,
except per share and units Core
Chargeouts (A)
15,800
Sales and Revenues
$2,488
Adjusted EBITDA
$209
Income
(Loss)
from
Continuing
Operations,
Net
of
Tax
(B)
($51)
Diluted
Income
(Loss)
Per
Share
from
Continuing
Operations
(B)
($0.62)
Quarter Ended
October 31, 2015 |
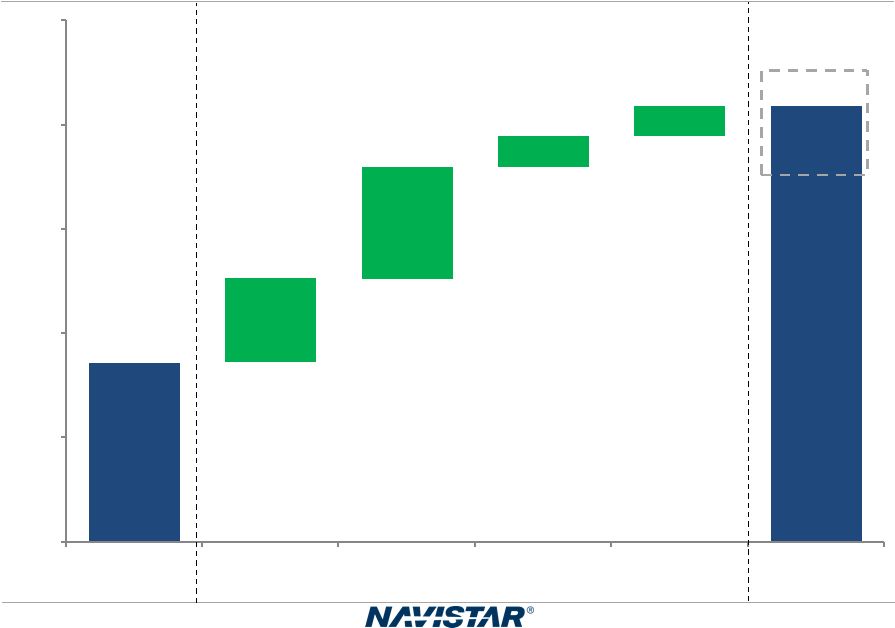 8 NYSE: NAV Q4 2015 Earnings – 12/17/2015 $86 $209 $40 $54 $15 $14 $- $50 $100 $150 $200 $250 Q4 2015 Pre-existing
warranty Actual EBITDA
adjustment
Restructuring
charges
Asset impairment
charges
Debt refinancing
and charges
Q4
2015 Adjusted EBITDA* Q4 2015 Adjusted EBITDA Within Guidance $ in millions Note: This slide contains non-GAAP information; please see the
REG G in appendix for a detailed reconciliation.
* Excludes pre-existing warranty and
one-time items. Q4
Guidance:
$175-$225 |
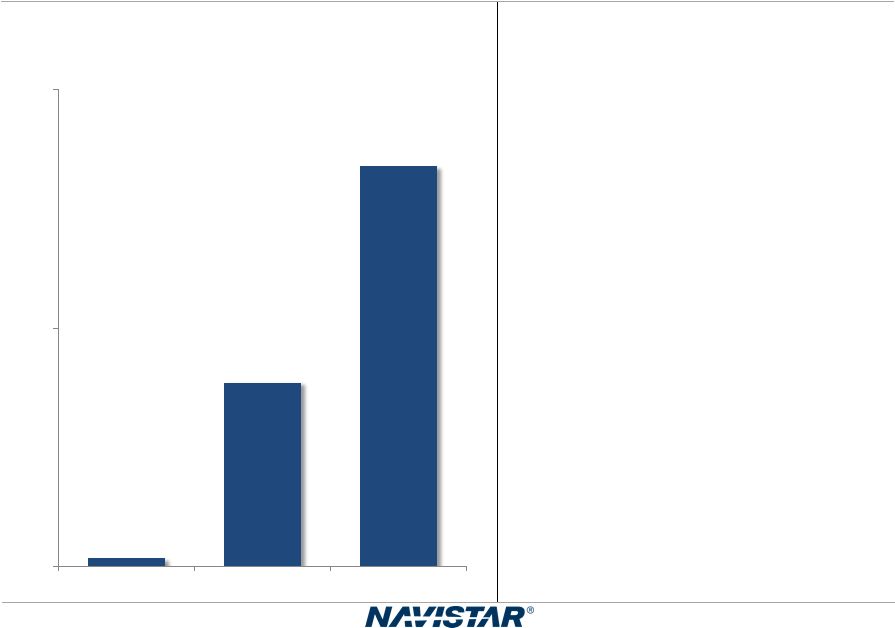 9 NYSE: NAV Q4 2015 Earnings – 12/17/2015 Note: This slide contains non-GAAP information; please see the
REG G in appendix for a detailed reconciliation.
•
Q4 2015 adjusted
EBITDA margin
doubled year-over-year
• EBITDA growth driven by increased product margins and improved core business Adjusted EBITDA Margin Achieved Adjusted EBITDA Margin Goal 0.2% 3.9% 8.4% 0% 5% 10% 4Q13 4Q14 4Q15 |
 10 NYSE: NAV Q4 2015 Earnings – 12/17/2015 Q4 2015 Segment Results $ in millions Beginning in the first quarter of 2015, the Company realigned its reporting
segments. The segment results have been restated to
reflect this change. Truck
($36)
($40)
Parts
$163
$150
Global Operations
($27)
($56)
Financial Services
$26
$26
Segment Profit:
2015
2014
Quarters
Ended October 31 |
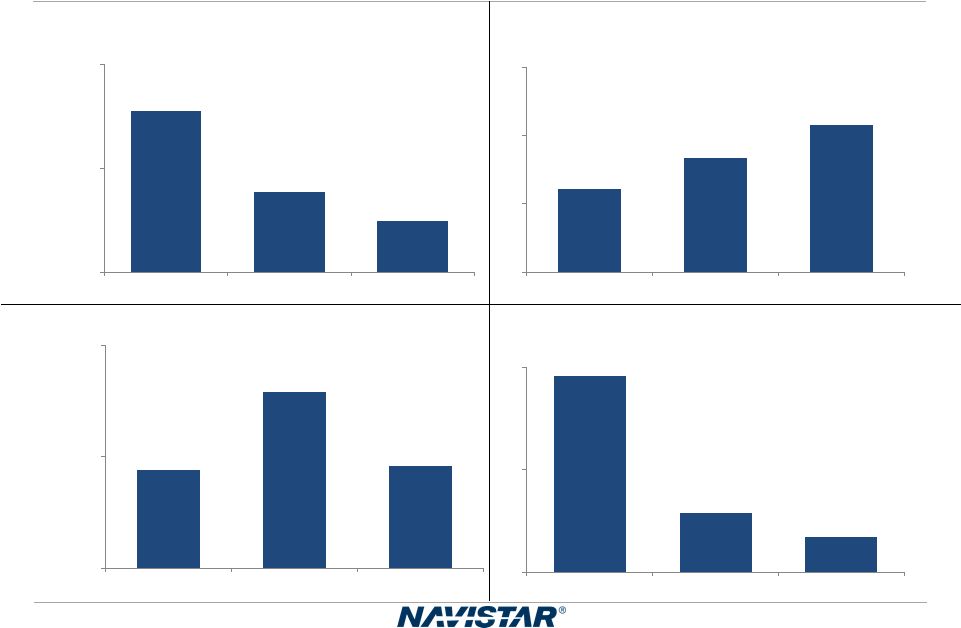 11 NYSE: NAV Q4 2015 Earnings – 12/17/2015 Delivering on Cost Reduction Actions 0% 1% 2% 3% 2013 2014 2015 Material Costs Savings
% Manufacturing Revenue $- $50 $100 2013 2014 2015 Manufacturing Cost Savings $ in millions $1,000 $1,400 $1,800 2013 2014 2015 Structural Costs $ in millions 2% 5% 8% 2013 2014 2015 Warranty Expense
% Manufacturing Revenue |
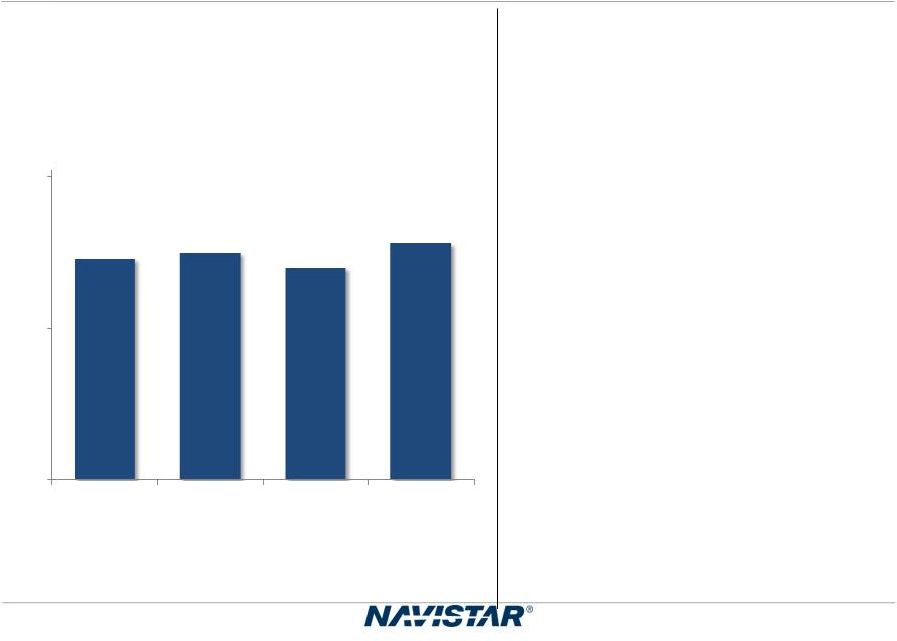 12 NYSE: NAV Q4 2015 Earnings – 12/17/2015 Used Truck Update • Q4 ending gross inventory balance of $390 million • Export sales slowed Gross Used Truck Inventory $ in millions $365 $375 $350 $390 $0 $250 $500 Q1
2015
Q2
2015
Q3
2015
Q4
2015 |
 13 Q4 2015 Earnings – 12/17/2015 Q4 2015 Manufacturing Cash Within Guidance $ in millions Note: This slide contains non-GAAP information; please see the
REG G in appendix for a detailed reconciliation.
Guidance
(A)
Actual
Q3 2015 Manufacturing
Cash Balance
(B)
$775
$775
Consolidated Adjusted EBITDA
(C)
$175 –
$225
$209
Capex/Cash Interest/Pension & OPEB
Funding ($169) –
($159)
($155)
Change in Net
Working Capital/Debt and
Warranty/Other
(D)
$169 –
$209
$184
Q4 2015 Manufacturing Cash Balance
(B)
$950-1,050
$1,013
(A)
Guidance as provided on 9/2/2015.
(B)
Cash balance includes marketable securities.
(C)
Excluding one-time items and pre-existing
warranty. (D)
Reflects repayment of $91 million of the NFC
intercompany loan. |
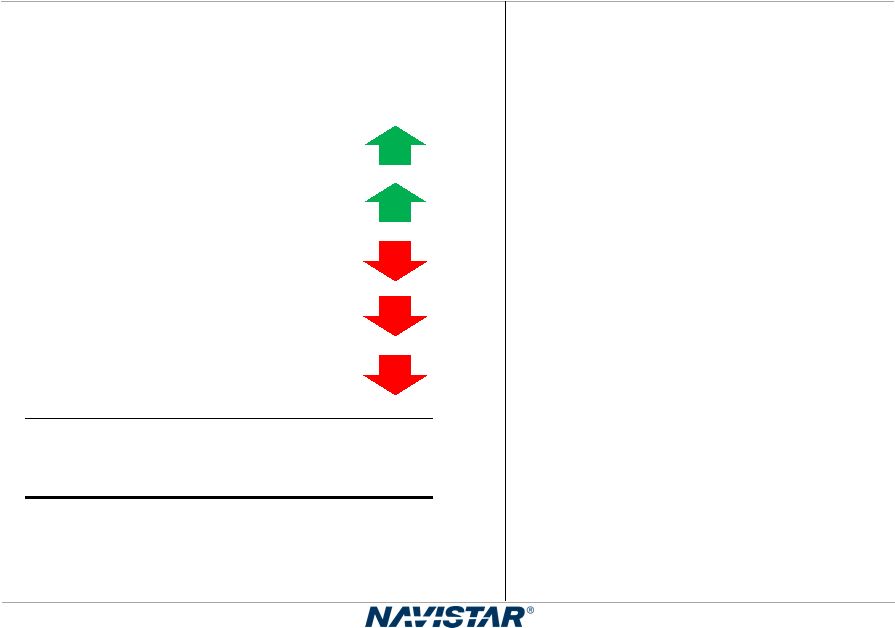 14 Q4 2015 Earnings – 12/17/2015 2016 Revenue Expectations*
Market
Share
Class 6/7 Industry
Class
8 Industry
Global Operations
Blue Diamond Truck/
Foundries
(A)
Consolidated Revenue
$9,500
–
10,000
Stable Revenue Despite Declining Class 8
Industry * Arrow
denotes comparison to 2015. (A)
Businesses exited during 2015. •
Class 6-8 truck and bus
industry of 350,000 to
380,000 units
• Market share growth • Negative economic conditions expected
in Brazil
• Terminated Blue Diamond Truck JV and exited foundry operations $ in millions |
 15 NYSE: NAV Q4 2015 Earnings – 12/17/2015 Expect Additional Cost Savings in 2016 • Material cost reductions • Manufacturing efficiencies • Structural cost improvements • Restructure Brazilian operations Expect over $200 million of savings in 2016 |
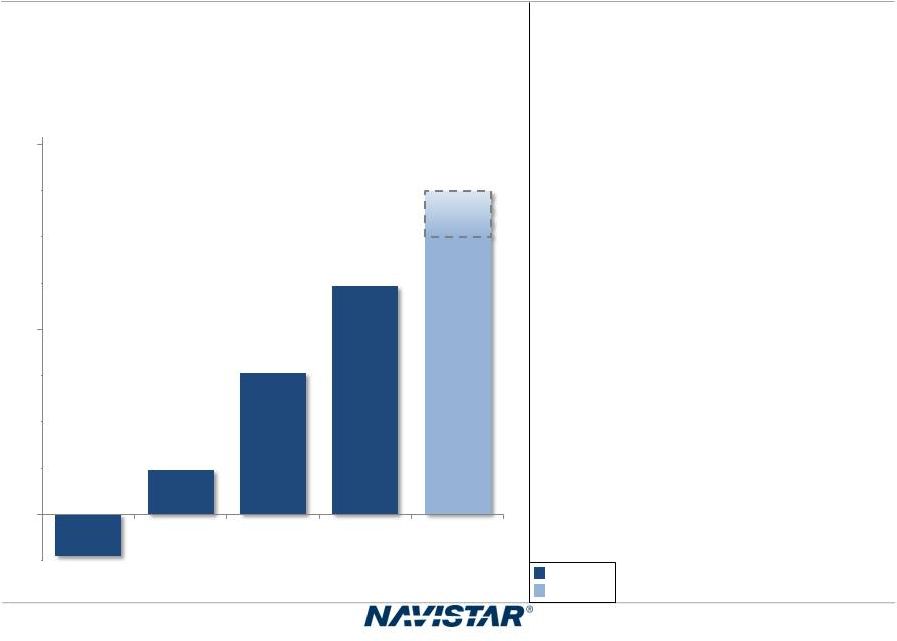 16 NYSE: NAV Q4 2015 Earnings – 12/17/2015 Expect EBITDA Growth in 2016 • ~$200 million of annual EBITDA improvement over the past 3 years • Margin improvements and product mix driving EBITDA growth • Core North America truck and parts businesses improve Adjusted EBITDA Actual Forecast Note: This slide contains non-GAAP information; please see the
REG G in appendix for a detailed reconciliation.
$ in millions
($91)
$102
$306
$494
$0
$400
$800
2012
2013
2014
2015
2016
$600–
700 |
 17 NYSE: NAV Q4 2015 Earnings – 12/17/2015 • Pension cash contributions greater than expense by ~$50 million
• Capital expenditures of ~$125 million • Manufacturing interest expense of ~$240 million • Cash taxes of ~$35 million • Warranty spend greater than expense by ~$150 million
• Used truck inventory flat Expect Positive Manufacturing Free Cash Flow in 2016 |
 18 NYSE: NAV Q4 2015 Earnings – 12/17/2015 2015 Accomplishments: • Achieved ~$200 million of annual EBITDA improvement
• Increased core North America truck and parts sales
• Delivered over $300 million of cost savings • Ended the year with over $1 billion of manufacturing cash
2016:
• EBITDA improvement • Positive free cash flow Summary |
 NYSE: NAV SUMMARY Troy Clarke, President & CEO |
 20 NYSE: NAV Q4 2015 Earnings – 12/17/2015 • Grow volumes and market share • Launch new products • Grow parts profit • Drive uptime improvements Building on Our Progress |
 21 NYSE: NAV Q4 2015 Earnings – 12/17/2015 2016 Expectations • Continue to reduce costs • Invest in key growth areas • Return to profitability • Generate positive free cash flow |
 NYSE: NAV APPENDIX |
 23 NYSE: NAV Q4 2015 Earnings – 12/17/2015 Navistar Financial Corporation Highlights • Financial Services Segment profit of $98 million for 2015, $26 million for Q4
• U.S. financing availability of $323 million as of October 31, 2015 • Financial Services Debt/Equity Leverage of 3.3:1 • BMO Financial Group completed the purchase of GE Capital’s Transporation
finance business, which includes the Navistar Capital
program assets Retail Notes
Bank Facility
Dealer Floor Plan
• $747 million facility, matures in December 2016 – Funding for retail notes, wholesale notes, retail accounts, and dealer open accounts • On balance sheet • NFSC wholesale trust as of October 2015 – $875 million funding facility – Variable portion matures Oct. 2016 – Term portions mature Oct. 2016 and Jun. 2017 • On balance sheet • Program management retained • Broad product offering • Ability to support large fleets • Access to less expensive capital C A P I T A L Funded by BMO Financial Group |
 24 NYSE: NAV Q4 2015 Earnings – 12/17/2015 Retail Market Share in Commercial Vehicle Segments
Class 6/7
Medium-Duty
Retail Market Share:
Q4 2015: 19%
Q4 2014: 19%
Class 8
Severe Service
Retail Market Share:
Q4 2015: 15%
Q4 2014: 14%
Class 8
Heavy
Retail Market Share:
Q4 2015: 11%
Q4 2014: 15%
Combined Class 8
Retail Market Share:
Q4 2015: 12% / Q4 2014: 15%
2015
2014
2013
Core Markets (U.S. and Canada)
School
buses......................................................................................................... 38 % 35 % 37 % Class 6 and 7 medium
trucks............................................................................... 23 % 21 % 24 % Class 8 heavy
trucks............................................................................................. 11 % 14 % 12 % Class 8 severe service
trucks................................................................................ 15 % 16 % 22 % Total Core Markets.....................................................................................
16
%
17
%
18
%
Combined class 8
trucks...................................................................................... 12 % 14 % 15 % |
 25 NYSE: NAV Q4 2015 Earnings – 12/17/2015 Worldwide Truck Chargeouts We define chargeouts as trucks that have been invoiced to customers. The units held in dealer inventory represent
the principal difference between retail
deliveries and chargeouts. This table summarizes our
approximate worldwide chargeouts from our continuing operations. We define our Core markets to include U.S. and Canada School bus and Class 6 through 8 medium and heavy truck. Our Core markets include CAT- branded units sold to Caterpillar under our North America supply agreement.
(A)
Other
markets
primarily
consist
of
Export
Truck
and
Mexico
and
also
includes
chargeouts
related
to
BDT
of
3,400
units
during
the
three
months
ended
October
31,
2014,
and
6,000
and
11,000
units
during
the
fiscal
years
2015
and
2014.
There
were
no
third
party
chargeouts
related
to
BDT
during the three months ended October 31,
2015. Three Months Ended
October 31,
%
Change
Years Ended
October 31,
%
Change
(in units)
2015
2014
Change
2015
2014
Change
Core Markets (U.S. and Canada)
School buses .......................................
3,400
3,100
300
10 %
11,900
10,800
1,100
10 %
Class 6 and 7 medium trucks...............
4,300
3,800
500
13 %
18,800
16,000
2,800
18 %
Class 8 heavy trucks ...........................
5,900
7,400
(1,500)
(20)%
25,000
26,000
(1,000)
(4)%
Class 8 severe service trucks
................ 2,200
2,500
(300
)
(12)%
9,300
8,700
600
7 %
Total Core Markets............................... 15,800 16,800 (1,000) (6)% 65,000 61,500 3,500 6 % Non "core" military ...........................
—
—
—
—
%
100
100
—
—
%
Other markets
(A)
................................
4,100
8,600
(4,500
)
(52)%
19,400
28,400
(9,000)
(32)%
Total worldwide unit............................. 19,900 25,400 (5,500 ) (22)% 84,500 90,000 (5,500) (6)% Combined class 8 trucks..................... 8,100 9,900 (1,800 ) (18)% 34,300 34,700 (400) (1)% |
 26 NYSE: NAV Q4 2015 Earnings – 12/17/2015 Worldwide Engine Shipments Three Months Ended October 31, % Change Years Ended October 31, % Change (in units) 2015 2014 Change 2015 2014 Change OEM sales-South America.................. 15,100 23,400 (8,300) (35)% 53,800 89,100 (35,300) (40)% Intercompany sales..............................
11,400
7,500
3,900
52 %
31,600
37,900
(6,300)
(17)%
Other OEM sales.................................
1,900
3,200
(1,300)
(41)%
9,200
11,700
(2,500)
(21)%
Total
sales.....................................
28,400
34,100
(5,700)
(17)%
94,600
138,700
(44,100)
(32)% |
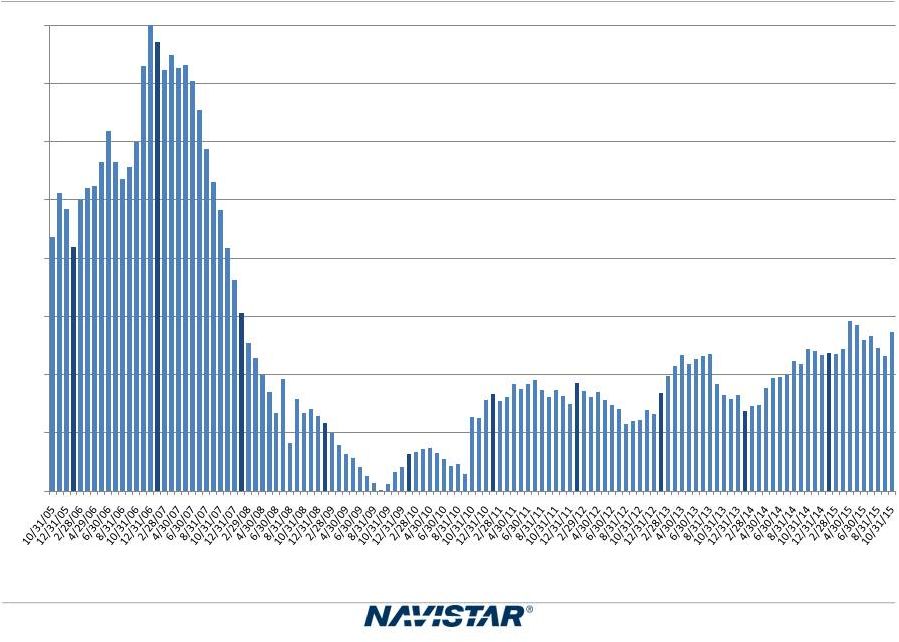 27 NYSE: NAV Q4 2015 Earnings – 12/17/2015 U.S. and Canada Dealer Stock Inventory* *Includes U.S. and Canada Class 4-8 and school bus inventory, but does not include U.S. IC Bus.
3,000 4,000 5,000 6,000 7,000 8,000 9,000 10,000 11,000 |
 28 NYSE: NAV Q4 2015 Earnings – 12/17/2015 Frequently Asked Questions Q1: What is included in Corporate and Eliminations? A: The primary drivers of Corporate and Eliminations are Corporate SG&A, pension and OPEB expense (excluding
amounts allocated to the segments), annual
incentive, manufacturing interest expense, and the elimination of intercompany sales and profit between segments. Q2: What is included in your equity in loss of non-consolidated affiliates?
A:
Equity in loss of non-consolidated affiliates is
derived from our ownership interests in partially-owned affiliates that are not consolidated. Q3: What is your net income attributable to non-controlling interests?
A:
Net income attributable to non-controlling interests
is the result of the consolidation of subsidiaries in which we do not own 100%, and is primarily comprised of Ford's non-controlling interest in our Blue Diamond Parts joint
venture. Q4:
What are your expected 2015 and beyond pension funding
requirements? A:
Future contributions are dependent upon a number of
factors, principally the changes in values of plan assets, changes in interest rates and the impact of any funding relief currently under consideration. We contributed $113 million and $164
million in 2015 and 2014, respectively, to
our U.S. and Canadian post-retirement pension plans (the "Plans") to meet regulatory minimum funding requirements. In 2016, we expect to contribute approximately $100 million to meet the minimum required
contributions for all plans. We currently
expect that from 2017 through 2019, the Company will be required to contribute $100 million to $200 million per year to the Plans, depending on asset performance and discount rates. |
 29 NYSE: NAV Q4 2015 Earnings – 12/17/2015 Frequently Asked Questions Q5: What is your expectation for future cash tax payments?
A:
Our cash tax payments are expected to remain low in 2016
and will gradually increase as we utilize available net operating losses (NOLs) and tax credits in future years. Q6: What is the current balance of net operating losses as compared to other deferred tax assets?
A:
Q7:
How does your FY 2015 and 2016 Class 8 industry outlook
compare to ACT Research? A:
Reconciliation to ACT - Retail Sales
ACT*
CY to FY adjustment
Total (ACT comparable Class 8 to Navistar)
Navistar Industry Retail Deliveries Combined Class 8
Trucks 250,000
280,000
240,000
270,000
Navistar difference from ACT
(36,903)
(6,903)
(13,824)
16,176
*Source: ACT N.A. Commercial Vehicle Outlook -
December 2015 -12.9%
-2.4%
-5.4%
6.4%
U.S. and Canadian Class 8 Truck Sales
2016
244,500
9,324
253,824
2015
288,000
(1,097)
286,903
As of October 31, 2015 the Company has deferred tax
assets for U.S. federal NOLs valued at $840 million, state NOLs valued at $145 million, and foreign NOLs valued at $176 million, for a total undiscounted cash value of $1.2 billion. In
addition to NOLs, the Company has deferred
tax assets for accumulated tax credits of $266 million and other deferred tax assets of $2.0 billion resulting in net deferred tax assets before valuation allowances of approximately $3.5 billion. Of this amount,
$3.3 billion is subject to a valuation
allowance at the end of FY2015. |
 30 NYSE: NAV Q4 2015 Earnings – 12/17/2015 Frequently Asked Questions Q8: What is your manufacturing interest expense for Fiscal Year 2016?
A:
Annual manufacturing interest for 2016 is forecasted to
be ~$240. For reference, interest expense was $233 million and $243 million for FY 2015 and 2014, respectively. Q9: What should we assume for capital expenditures in Fiscal Year 2016?
A:
Annual Capital expenditures for 2016 is forecasted to be
~$125. In comparison, capital expenditures were $115 million and $88 million for FY 2015 and 2014, respectively. |
 31 NYSE: NAV Q4 2015 Earnings – 12/17/2015 Outstanding Debt Balances October 31, October 31, (in millions) 2015 2014 Manufacturing operations Senior Secured Term Loan Credit Facility, as amended, due 2020, net of unamortized discount of
$17 and $3,
respectively…….…………………………………………..……………………………
$
1,023
$
694
8.25% Senior Notes, due 2021, net of unamortized
discount of $18 and $20, respectively………… 1,182 1,180 4.50% Senior Subordinated Convertible Notes, due 2018, net of unamortized discount of $14 and
$19,
respectively……………………………………………………………………………………...
186
181
4.75% Senior Subordinated Convertible Notes, due 2019,
net of unamortized discount of $32 and
$40,
respectively…………………………………………………………………………..………….
379
371
Debt of majority-owned
dealerships…………………………………………………………………. 28 30 Financing arrangements and capital lease
obligations………………………………………………. 49 54 Loan Agreement related to 6.5% Tax Exempt Bonds, due
2040…………………………….……… 225 225 Promissory
Note……………………………………………………………………………...………
—
10
Financed lease
obligations……………………………………………………………………………
111
184
Other…………………….......................……………………………………………………………..
15
29
Total Manufacturing operations
debt……………………………………………………………... 3,198 2,958 Less: Current Portion……………………………………………………………………………........
103
100
Net long-term Manufacturing operations
debt…………………………………………………..... $ 3,095 $ 2,858 October 31, October 31, (in millions) 2015 2014 Financial Services operations Asset-backed debt issued by consolidated SPEs, at fixed and variable rates, due serially through
2018…………………………………………………………………………………………………..
$
870
$
914
Bank revolvers, at fixed and variable rates, due dates
from 2016 through 2020……………………. 1,063 1,242 Commercial paper, at variable rates, program matures in
2017……………………………………... 86 74 Borrowings secured by operating and finance leases, at various rates, due serially through 2020….
81
36
Total Financial Services operations debt
………………………………………………………… 2,100 2,266 Less: Current portion
………………………………………………………………………………...
1,007
1,195
Net long-term Financial Services operations
debt………………………………………………... $ 1,093 $ 1,071 |
 32 NYSE: NAV Q4 2015 Earnings – 12/17/2015 SEC Regulation G Non-GAAP Reconciliation SEC Regulation G Non-GAAP Reconciliation The financial measures presented below are unaudited and not in accordance with, or an alternative for, financial
measures presented in accordance with U.S.
generally accepted accounting principles
("GAAP"). The non-GAAP financial information presented herein should be considered supplemental to, and not as a substitute for, or superior to, financial measures calculated in accordance with GAAP and are reconciled to the most appropriate GAAP number below Earnings (loss) Before Interest, Income Taxes, Depreciation, and Amortization (“EBITDA”):
We define EBITDA as our consolidated net income (loss)
from continuing operations attributable to Navistar International Corporation, net of tax, plus manufacturing interest expense, income taxes, and depreciation and amortization. We believe EBITDA provides
meaningful information to the performance of our business and therefore we use it to supplement our GAAP reporting. We have chosen to provide this supplemental information to investors, analysts and other interested parties to enable them to perform additional analyses of operating results..
Adjusted EBITDA:
We believe that adjusted EBITDA, which excludes certain
identified items that we do not consider to be part of our ongoing business, improves the comparability of year to year results, and is representative of our underlying performance. Management uses this information to
assess and measure the performance of our
operating segments. We have chosen to provide this
supplemental information to investors, analysts and other interested parties to enable them to perform additional analyses of operating results, to illustrate the results of operations giving effect to the
non-GAAP adjustments shown in the below reconciliations, and to provide an additional measure of performance. Adjusted EBITDA margin: We define Adjusted EBITDA margin as a percentage of the Company's consolidated sales and revenues. We have chosen
to provide this supplemental information
to investors, analysts and other interested parties to
enable them to perform additional analyses of operating results, to illustrate the results of operations giving effect to the non-GAAP adjustments shown in the below reconciliations, and to provide an additional
measure of performance. Manufacturing Cash,
Cash Equivalents, and Marketable Securities:
Manufacturing
cash,
cash
equivalents,
and
marketable
securities
represents
the
Company’s
consolidated
cash,
cash
equivalents,
and
marketable
securities
excluding cash, cash equivalents, and marketable
securities of our financial services operations. We include marketable securities with our cash and cash equivalents when assessing our liquidity position as our investments are highly liquid in nature. We have chosen to provide this supplemental information to investors, analysts and other interested parties to enable them to perform additional analyses of our ability to
meet our operating requirements, capital
expenditures, equity investments, and financial
obligations. Structural costs consists of Selling, general and administrative expenses and Engineering and product development costs. Free Cash Flow consists of Net cash from operating activities and Capital Expenditures. |
 33 NYSE: NAV Q4 2015 Earnings – 12/17/2015 SEC Regulation G Non-GAAP Reconciliations Manufacturing segment cash and cash equivalents and marketable securities reconciliation:
(in millions)
Manufacturing Operations:
Cash and cash
equivalents……………………………………………………… $ 877 $ 507 Marketable
securities…………………………………………………………… Manufacturing Cash and cash equivalents and Marketable securities……….. $ 1,013 $ 775 Financial Services Operations: Cash and cash
equivalents……………………………………………………… $ 35 $ 40 Marketable
securities…………………………………………………………… Financial Services Cash and cash equivalents and Marketable securities…… $ 58 $ 65 Consolidated Balance Sheet: Cash and cash
equivalents……………………………………………………… $ 912 $ 547 Marketable
securities…………………………………………………………… Consolidated Cash and cash equivalents and Marketable securities………… $ 1,071 $ 840 23 159 October 31, 2015 136 293 25 268 July 31, 2015 |
 34 NYSE: NAV Q4 2015 Earnings – 12/17/2015 SEC Regulation G Non-GAAP Reconciliations Earnings (loss) before interest, taxes, depreciation, and amortization ("EBITDA")
reconciliation
______________________
(A)
Manufacturing interest expense is the net interest
expense primarily generated for borrowings that support the manufacturing and corporate operations, adjusted to eliminate intercompany interest expense with our Financial Services segment. The following
table reconciles Manufacturing interest
expense to the consolidated interest expense: ______________________ * For more detail on the items noted, please see the footnotes on slide 35.
(in millions)
Loss from continuing operations attributable to NIC, net
of tax……… $
(51)
$
(72)
$
(153)
Plus:
Depreciation and amortization
expense…………………………… 60 76 87 Manufacturing interest expense (A) ………………………………
63
61
63
Less:
Income tax benefit
(expense)……………………………………… (14) (1) 224 EBITDA ………………………………………………………………
$
86
$
66
$
(227)
2013
Quarters Ended October 31
2015
2014
(in millions)
Interest expense
…………………………………………………… $ 80 $ 80 $ 81 Less: Financial services interest expense
………………………… 17 19 18 Manufacturing interest expense
……………………..…………… $ 63 $ 61 $ 63 2014 2013 Quarters Ended October 31 2015 (in millions) EBITDA (reconciled above)
…......…………………………………… 86 $ 66 $ (227) Less significant items of: Adjustments to pre-existing warranties (A) ……………………….
40
(10)
152
Cost reduction and other strategic charges
(B)
54
4
—
Asset impairment charges
(C)
………...……………………………
15
—
80
Debt refinancing charges
(D)
14
—
—
Brazil truck business actions
(E)
…….....…………………………
—
29
—
Restructuring of North America manufacturing
operations (F)
…..
—
27
—
Total
adjustments……………………………………………………… 123 50 232 Adjusted EBITDA …......………………………………………….....
$
209
$
116
$
5
Adjusted EBITDA Margin
…......…………………………………..... 8.4% 3.9% 0.2% 2013 Quarters Ended October 31 2015 2014 ………...……………………………
|
 35 NYSE: NAV Q4 2015 Earnings – 12/17/2015 Significant Items Included Within Our Results Quarter Ended October 31 (in millions) Expense (income): 2015 2014 Adjustments to pre-existing warranties (A) …………………………………………………………………….
$
40
(10)
Restructuring charges and other strategic initiatives
(B)
……………………………………………………
54
31
Asset impairment charges
(C)
………………………………………………………………………………….
15
—
Debt refinancing
charges
(D)
………………………………………………………………….
14
—
Accelerated depreciation
……………………………………………………………………………………..
—
2
Brazil truck business actions
(E)
……………………………………………………………………………
—
29
Brazilian tax adjustments
(F)
……………………………………………………………………………….
—
(16)
______________________
(A)
Adjustments to pre-existing warranties reflect
changes in our estimate of warranty costs for products sold in prior periods. Such adjustments typically occur when claims experience deviates from historic and expected trends. Our warranty liability is generally affected by
component failure rates, repair costs, and the timing of failures. Future events and circumstances related to these factors could materially change our estimates and require
adjustments to our liability.
In addition, new
product launches require a greater use of judgment in
developing estimates until historical experience becomes available. (B) In the fourth quarter of 2015, we incurred restructuring charges of $54 million related to cost reduction actions, including the Company's offering of the VSP to the majority of our U.S.-based non-represented salaried employees and the impacts of an involuntary
reduction-in-force in the U.S. and Brazil. In the fourth quarter of 2014, the Company recorded restructuring charges related to cost reduction actions that included a
reduction-in-force in the U.S and
Brazil. In the same period the
Truck
segment
recorded
$27
million
of
charges
related
to
our
anticipated
exit
from
our
Indianapolis,
Indiana
foundry
facility
and
certain
assets
in
our
Waukesha,
Wisconsin
foundry
operations.
The
charges
included
$13
million
of
restructuring
charges,
$7
million
of
fixed
asset
impairment
charges
and
$7
million
of
charges
for
inventory reserves.
(C)
In the fourth quarter of 2015, the Company recognized a
total non-cash charge of $7 million for the impairment of certain intangible and long-lived assets in the Brazil truck asset group. As a result of the continued operating losses and idled production in the asset group, we
tested the indefinite-lived intangible and long-lived assets for potential impairment. As a result, we determined that $4 million of intangible assets and $3 million of
certain long-lived assets were impaired. Also in the fourth quarter of 2015, the Company concluded it had a triggering event related to certain long-lived assets in the
Truck segment. As a result, certain long-lived assets were determined to be impaired, resulting in a charge of $4 million.
(D)
In the fourth quarter of 2015, we recorded $14 million
of third party fees and unamortized debt issuance costs associated with the refinancing of our Amended Term Loan Credit Facility with a new Senior Secured Term Loan Credit Facility in August 2015.
(E)
In the fourth quarter of 2014, the Global Operations
segment recorded approximately $29 million in charges, primarily related to inventory, to right size the Brazil Truck business. (F) In the fourth quarter of 2014, we recorded an offsetting benefit of $16 million to reflect a tax law change in
Brazil that allowed utilization of a portion of the net operating loss carryforwards to satisfy other taxes. |
 36 NYSE: NAV Q4 2015 Earnings – 12/17/2015 SEC Regulation G Non-GAAP Reconciliations Earnings (loss) before interest, taxes, depreciation, and amortization ("EBITDA")
reconciliation
______________________
(A)
Manufacturing interest expense is the net interest
expense primarily generated for borrowings that support the manufacturing and corporate operations, adjusted to eliminate intercompany interest expense with our Financial Services segment. The following
table reconciles Manufacturing interest
expense to the consolidated interest expense:
(in millions)
Interest expense
…………………………………………………… $ 307 $ 314 $ 321 $ 259 Less: Financial services interest expense
………………………… 74 71 70 88 Manufacturing interest expense
……………………..…………… $ 233 $ 243 $ 251 $ 171 2014 2012 Years Ended October 31 2013 2015 (in millions) Loss from continuing operations attributable to NIC, net of tax…………
$
(187)
$
(622)
$
(857)
$
(2,939)
Plus:
Depreciation and amortization
expense……………………………….. 281 332 417 323 Manufacturing interest expense (A) ………………………………….….
233
243
251
171
Less:
Income tax benefit
(expense)………………………………………… (51) (26) 171 (1,780) EBITDA ……………………………………………………………………
$
378
$
(21)
$
(360)
$
(665)
2012
Years Ended October 31
2013
2015
2014
(in millions)
EBITDA (reconciled above) …......…………………………………
$
378
$
(21)
$
(360)
$
(665)
Less significant items of:
Debt refinancing charges
(G)
………………………………………..
14
12
13
8
Brazil truck business actions
(D)
…….....…………………………
6
29
—
—
Mahindra Joint Venture divestiture
(I)
…….....……………………..
—
—
(26)
—
Legal settlement
(J)
…….....…………………………………………
—
—
(35)
—
Engineering integration costs
(K)
……....…………………………..
—
—
—
66
Total adjustments
…………………………………………………… 116 327 462 574 Adjusted EBITDA …......…………………………………………….
$
494
$
306
$
102
$
(91)
2012
Years Ended October 31,
2013
2015
2014
Cost reduction and other strategic
initiatives (A)
………………….
72
17
9
73
Restructuring of North American manufacturing
operations (F)
…..
—
41
—
7
Adjustments to pre-existing warranties
(C)
……………………….
4
55
404
404
Brazil reporting unit impairment charges
(B)
…….…………………
10
149
—
—
North America asset
impairment charges
(E)
……………………....
20
24
97
16
Gain on settlement
(H)
…….....………………………………………
(10)
—
—
— |
 37 NYSE: NAV Q4 2015 Earnings – 12/17/2015 SEC Regulation G Non-GAAP Reconciliations Earnings (loss) before interest, taxes, depreciation, and amortization ("EBITDA")
reconciliation (A) In 2015, we had $72 million of cost reduction and other strategic initiatives primarily consisting of
restructuring charges in the third and fourth quarters. In the fourth quarter of 2015, we incurred restructuring charges of $54 million related to cost reduction actions, including the Company's offering of the VSP to the
majority of our U.S.-based non-represented salaried employees and the impacts of an involuntary reduction-in-force in the U.S. and Brazil. In the third quarter of 2015, we incurred restructuring charges
of $13 million related to cost reduction actions, including a reduction-in-force in the U.S. and Brazil. In 2014, the Company recorded restructuring charges related to cost reduction actions that included a
reduction-in-force in the U.S and Brazil. In 2013, the Company leveraged efficiencies identified through redesigning our organizational structure and implemented new cost-reduction initiatives, including an
enterprise-wide reduction-in-force. As a result of these actions, the Company recognized restructuring charges of $25 million in the year ended October 31, 2013. These charges were partially offset by a gain of $16
million recognized in the Truck segment in the first quarter of 2013, as a result of the divestiture of Bison. In the fourth quarter of 2012, the Company announced actions to control spending across the Company with
targeted reductions of certain costs. As a result of these actions, the Company recognized restructuring charges of $73 million in the quarter and year ended October 31, 2012.
(B)
In the fourth quarter of 2015, the
Company recognized a total non-cash charge of $7 million for the impairment of certain intangible and long-lived assets in the Brazil truck asset group. In the third quarter of
2015, we determined that $3 million of trademark asset
carrying value was impaired. In the second quarter of 2014, we recognized a non-cash charge of $149 million for the impairment of certain intangible assets of our Brazilian engine reporting unit, including the entire $142 million balance of goodwill and $7
million of trademark. (C) Adjustments to pre-existing warranties reflect changes in our estimate of warranty costs for products sold in
prior periods. Such adjustments typically occur when claims experience deviates from historic and expected trends. Our warranty liability is generally affected by component failure rates, repair costs, and the
timing of failures. Future events and circumstances related to these factors could materially change our estimates and require adjustments to our liability. In addition, new product launches require a greater use of
judgment in developing estimates until historical experience becomes available. (D)
In the second quarter of 2015 our Global Operations
segment recorded $6 million in inventory charges to right size the Brazil Truck business. In the fourth quarter of 2014, the Global Operations segment recorded approximately $29 million in charges, primarily related to inventory, to right size the Brazil Truck
business. (E) During the third and fourth quarters of 2015, certain long-lived assets were determined to be impaired,
resulting in a charge of $3 million and $4 million, respectively. In the first quarter of 2015, the Truck segment recorded $7 million of asset impairment charges relating to certain operating leases. In 2014, the Truck
segment recorded impairment charges related to certain amortizing intangible assets and long- lived assets which were determined to be fully impaired. In the first quarter of 2014, the Truck segment
recognized asset impairment charges of $18 million. In 2013, the Truck segment recognized asset impairment charges consisting of $77 million related to the impairment of the Truck segment's entire goodwill
balance, which was recorded in the fourth quarter of 2013, and $19 million which were primarily the result of our ongoing evaluation of our portfolio of assets to validate their strategic and financial fit,
which led to the discontinuation of certain engineering programs related to products that were determined to be outside of our core operations or not performing to our expectations. In the first quarter of 2012, the
Parts segment recognized asset impairment charges of $10 million that resulted from the decision to idle the WCC business. (F)
In the fourth quarter of 2014 the Truck segment recorded
$27 million of charges related to our anticipated exit from our Indianapolis, Indiana foundry facility and certain assets in our Waukesha, Wisconsin foundry operations. The charges included $13 million of restructuring charges, $7 million of fixed asset
impairment charges and $7 million of charges for inventory reserves. In the third quarter of 2014, the Truck segment recorded $14 million of charges related to the 2011 closure of its Chatham, Ontario plant, based on
a ruling received from the Financial Services Tribunal in Ontario Canada. (G)
In the fourth quarter of 2015, we recorded $14 million
of third party fees and unamortized debt issuance costs associated with the refinancing of our Amended Term Loan Credit Facility with a new Senior Secured Term Loan Credit Facility. In the second quarter of 2014, we recorded $12 million of unamortized
debt issuance costs and other charges associated with the repurchase of our 2014 Convertible Notes. In the second quarter of 2013, we recorded $13 million of unamortized debt issuance costs and other charges
associated with the sale of additional Senior Notes and the refinancing of the Term Loan. In 2012, we recorded $8 million of unamortized debt issuance costs and other charges associated with our Senior Notes and
Amended and Restated Asset-Based Credit Facility. (H)
In the second quarter of 2015, the Global Operations
segment recognized a $10 million net gain related to a settlement of a customer dispute. The $10 million net gain for the settlement included restructuring charges of $4 million. (I)
In the second quarter of 2013, the Company sold its
stake in the Mahindra Joint Ventures to Mahindra and the Global Operations segment recognized a gain of $26 million. (J)
In the first quarter of 2013, as a result of the legal
settlement with Deloitte and Touche LLP, the Company recognized a gain and received cash proceeds of $35 million. (K)
Engineering integrated costs related to the
consolidation of our truck and engine engineering operations, as well as the relocation of our world headquarters. In 2012, the charges included restructuring charges of $23 million and other related costs of $43 million, primarily in our Truck segment.
______________________
|
 38 NYSE: NAV Q4 2015 Earnings – 12/17/2015 Significant Items Included Within Our Results ______________________ (A) In 2015, we had $72 million of cost reduction and other strategic initiatives primarily consisting of
restructuring charges in the third and fourth quarters. In the fourth quarter of 2015, we incurred restructuring charges of $54 million related to cost reduction actions, including the Company's
offering of the VSP to the majority of our
U.S.-based non- represented
salaried employees and the impacts of an involuntary reduction-in-force in the U.S. and Brazil. In the third quarter of 2015, we incurred restructuring charges of $13
million related to cost reduction actions, including a
reduction-in-force in the U.S. and Brazil. In 2014, the Company recorded restructuring charges related to cost reduction actions that included a reduction-in-force in the U.S and Brazil. In 2013, the Company leveraged
efficiencies identified through redesigning our organizational structure and implemented new cost-reduction initiatives, including an enterprise-wide reduction-in-force. As a
result of these actions, the Company recognized restructuring charges of $25 million in the year ended October 31, 2013. These charges were partially offset by a gain of $16 million
recognized in the Truck segment in the
first quarter of 2013, as a result of the
divestiture of Bison. In the fourth quarter of 2012, the Company announced actions to control spending across the Company with targeted reductions of certain costs. As a
result of these actions, the Company recognized
restructuring charges of $73 million in the quarter and year ended October 31, 2012. (B) In the fourth quarter of 2015, the Company recognized a total non-cash charge of $7 million for the impairment
of certain intangible and long-lived assets in the Brazil truck asset group. In the third quarter of 2015, we determined that $3 million of trademark asset carrying value was
impaired. In the second quarter of 2014, we recognized a non-cash charge of $149 million for the impairment of certain intangible assets of our Brazilian engine reporting unit, including
the entire $142 million balance of goodwill and $7 million of trademark. Notes continue on Slide 39. Years Ended October 31, (in millions) 2015 2014 2013 2012 Expense (income): Cost reduction and other strategic initiatives (A) ................................ 72 17 9 73 Brazil reporting unit impairment charges (B) ..................................... 7 149 — — Adjustments to pre-existing warranties (C) ........................................ 1 55 404 404 Brazil truck business actions (D) ..........................................................
6
29
—
—
North America asset impairment charges
(E)
......................................
20
24
97
16
Restructuring of North American manufacturing
operations (F)
......
—
41
—
7
Debt restructuring charges
(G)
............................................................
14
12
13
8
Gain on settlement
(H)
........................................................................
(10)
—
—
—
Mahindra Joint Venture divestiture
(I)
............................................
—
—
(26)
—
Legal settlement
(J)
............................................................................
—
—
(35)
—
Accelerated depreciation
(K)
................................................................
25
9
41
—
Brazilian tax adjustments
(L)
................................................................
—
13
—
—
Intraperiod tax allocation
(M)
................................................................
—
—
(220)
—
Engineering integration costs
(N)
..........................................................
—
—
—
66
Net impact of income tax valuation
allowances
(O)
..............................
—
—
—
1,785
|
 39 NYSE: NAV Q4 2015 Earnings – 12/17/2015 Significant Items Included Within Our Results (C)
Adjustments to pre-existing warranties reflect
changes in our estimate of warranty costs for products sold in prior periods. Such adjustments typically occur when claims experience deviates from historic and expected trends. Our warranty liability is generally affected by component failure
rates, repair costs, and the timing of failures. Future events and circumstances related to these factors could materially change our estimates and require adjustments to our
liability. In addition, new product launches require a greater use of judgment in developing estimates until historical experience becomes available.
(D)
In the second quarter of 2015 our
Global Operations segment recorded $6 million in inventory charges to right size the Brazil Truck business. In the fourth quarter of 2014, the Global Operations segment recorded approximately $29 million in charges, primarily related to inventory, to right size
the Brazil Truck business. (E) During the third and fourth quarters of 2015, certain long-lived assets were determined to be impaired,
resulting in a charge of $3 million and $4 million, respectively. In the first quarter of 2015, the Truck segment recorded $7 million of asset impairment charges relating to certain operating leases.
In 2014, the Truck segment recorded impairment charges related to certain amortizing intangible assets and long-lived assets which were determined to be fully impaired.
In the first quarter of 2014, the Truck segment recognized asset impairment charges of $18 million. In 2013, the Truck segment recognized asset impairment charges consisting of $77 million
related to the impairment of the Truck segment's entire goodwill balance, which was recorded in the fourth quarter of 2013, and $19 million which were primarily the result of our
ongoing evaluation of our portfolio of assets to validate their strategic and financial fit, which led to the discontinuation of certain engineering programs related to products that were
determined to be outside of our core operations or not performing to our expectations. In the first quarter of 2012, the Parts segment recognized asset impairment charges of $10 million
that resulted from the decision to idle the WCC business. (F)
In the fourth quarter of 2014 the Truck segment recorded
$27 million of charges related to our anticipated exit from our Indianapolis, Indiana foundry facility and certain assets in our Waukesha, Wisconsin foundry operations. The charges included $13 million of restructuring charges, $7 million of
fixed asset impairment charges and $7 million of charges for inventory reserves. In the third quarter of 2014, the Truck segment recorded $14 million of charges related to the
2011 closure of its Chatham, Ontario plant, based on a ruling received from the Financial Services Tribunal in Ontario Canada. In the fourth quarter of 2012, the Truck segment recorded
$4 million of charges related to the planned closure of the Garland, Texas plant for personnel costs related to employee terminations and related benefits.
(G)
In the fourth quarter of 2015, we
recorded $14 million of third party fees and unamortized debt issuance costs associated with the refinancing of our Amended Term Loan Credit Facility with a new Senior Secured Term Loan Credit Facility. In the second quarter of 2014, we recorded $12 million
of unamortized debt issuance costs and other charges associated with the repurchase of our 2014 Convertible Notes. In the second quarter of 2013, we recorded $13 million of unamortized
debt issuance costs and other charges associated with the sale of additional Senior Notes and the refinancing of the Term Loan. In 2012, we recorded $8 million of unamortized
debt issuance costs and other charges associated with our Senior Notes and Amended and Restated Asset-Based Credit Facility.
(H)
In the second quarter of 2015, the
Global Operations segment recognized a $10 million net gain related to a settlement of a customer dispute. The $10 million net gain for the settlement included restructuring charges of $4 million. (I)
In the second quarter of 2013, the Company sold its
stake in the Mahindra Joint Ventures to Mahindra and the Global Operations segment recognized a gain of $26 million. (J)
In the first quarter of 2013, as a result of the legal
settlement with Deloitte and Touche LLP, the Company recognized a gain and received cash proceeds of $35 million. (K)
In 2015, the Truck segment recognized charges if $28
million for the acceleration of depreciation of certain assets related to the foundry facilities. In 2014, the Truck segment recognized accelerated depreciation related to our Huntsville facility and in 2013 we recognized accelerated
depreciation related to the discontinuation of certain engine programs and the closure of our Garland facility. (L)
During the second quarter of 2014, we recorded an income
tax expense of $29 million to establish the valuation allowance for Brazil deferred tax assets. In the fourth quarter of 2014, we recorded an offsetting benefit of $16 million to reflect a tax law change in Brazil that allowed utilization of
a portion of the net operating loss carryforwards to satisfy other taxes. (M)
In the fourth quarter of 2013, the Company met the
criteria necessary to apply the exception within the intraperiod tax allocation rules, since it incurred a loss from continuing operations and income was recognized in both Total other comprehensive income (loss) and Additional paid in
capital. As a result, an income tax benefit of $220 million was recorded in Income tax benefit (expense) related to continuing operations and an offsetting tax expense of $212 million an
$8 million in Total other comprehensive income (loss) and Additional paid in capital, respectively. (N)
Engineering integrated costs related to the
consolidation of our truck and engine engineering operations, as well as the relocation of our world headquarters. In 2012, the charges included restructuring charges of $23 million and other related costs of $43 million, primarily in our Truck
segment. (O) During the three months ended October 31, 2012, we recognized an income tax benefit of $1.476 billion from the
release of a portion of our income tax allocation on our U.S. deferred tax assets, as well as an income tax expense of $233 million relating to the reversal of income tax benefits
recorded during the first nine months of 2012. For the year ended October 31, 2012, we also recognized an income tax benefit of $189 million from the release of a significant portion of our
valuation allowance on our Canadian deferred tax assets in the second quarter of 2012. |
Serious News for Serious Traders! Try StreetInsider.com Premium Free!
You May Also Be Interested In
- COHEN & STEERS REPORTS RESULTS FOR FIRST QUARTER 2024
- Discover Financial Services Reports First Quarter 2024 Net Income of $308 Million or $1.10 Per Diluted Share
- Jazz Pharmaceuticals to Report 2024 First Quarter Financial Results on May 1, 2024
Create E-mail Alert Related Categories
SEC FilingsSign up for StreetInsider Free!
Receive full access to all new and archived articles, unlimited portfolio tracking, e-mail alerts, custom newswires and RSS feeds - and more!
