Form 8-K REGIONS FINANCIAL CORP For: Nov 19
UNITED STATES
SECURITIES AND EXCHANGE COMMISSION
Washington, DC 20549
FORM 8-K
CURRENT REPORT
PURSUANT TO SECTION 13 OR 15(d) OF THE
SECURITIES EXCHANGE ACT OF 1934
Date of Report (Date of earliest event reported): November 19, 2015
REGIONS FINANCIAL CORPORATION
(Exact name of registrant as specified in its charter)
DELAWARE | 001-34034 | 63-0589368 | ||
(State or other jurisdiction of incorporation) | (Commission File Number) | (IRS Employer Identification No.) | ||
1900 FIFTH AVENUE NORTH
BIRMINGHAM, ALABAMA 35203
(Address, including zip code, of principal executive office)
Registrant’s telephone number, including area code: (800) 734-4667
Check the appropriate box below if the Form 8-K filing is intended to simultaneously satisfy the filing obligation of the registrant under any of the following provisions:
¨ | Written communication pursuant to Rule 425 under the Securities Act (17 CFR 230.425) |
¨ | Soliciting material pursuant to Rule 14a-12 under the Exchange Act (17 CFR 240.14a-12) |
¨ | Pre-commencement communications pursuant to Rule 14d-2(b) under the Exchange Act (17 CFR 240.14d-2(b)) |
¨ | Pre-commencement communications pursuant to Rule 13e-4(c) under the Exchange Act (17 CFR 240.13e-4(c)) |
Item 7.01 Regulation FD Disclosure.
On Thursday, November 19, 2015, Regions Financial Corporation ("Regions") held an Investor Day Conference in New York City during which senior executives reviewed and discussed Regions' business strategies. A related 8-K filing and a press release previously announcing the Conference was filed prior to the event.
Regions issued a press release today summarizing key information that was shared at the Conference. A copy of the press release is attached hereto as Exhibit 99.1 and incorporated into this Item 7.01 by reference herein. In addition, a copy of the slides furnished at, and posted on Regions' website in connection with the Conference are attached hereto as Exhibit 99.2.
In accordance with general instruction B.2 of Form 8-K, the following information is furnished and shall not be deemed filed for purposes of Section 18 of the Securities Exchange Act of 1934, as amended. Furthermore, the information contained in Exhibits 99.1 and 99.2 shall not be deemed to be incorporated by reference into the filings of Regions under the Securities Act of 1933, as amended, regardless of any general incorporation language contained in such filing, unless otherwise expressly stated in such filing.
Item 9.01 Financial Statements and Exhibits.
(d) Exhibits. The exhibits listed in the exhibit index are furnished pursuant to Regulation FD as part of this Current Report on Form 8-K and shall not be deemed filed for purposes of Section 18 of the Securities Exchange Act of 1934, as amended.
Exhibit Index
Exhibit No. Exhibit
99.1 Press Release dated November 19, 2015
99.2 Investor Day Conference slides of November 19, 2015
Cautionary Statements Regarding Forward-Looking Statements
This Current Report on Form 8-K (including the Exhibits hereto) contains forward-looking statements within the meaning of the Private Securities Litigation Reform Act of 1995. These statements are based on the current beliefs and expectations of Regions management and are subject to significant risks and uncertainties. Regions cautions readers that any forward-looking information is not a guarantee of future performance and that actual results could differ materially from those contained in the forward-looking information due to a number of factors, including those listed from time to time in reports that Regions files with the Securities and Exchange Commission, including, but not limited to, the Annual Report on Form 10-K for the year ended December 31, 2014, which has been filed with the Securities and Exchange Commission and is available on Regions' website (http://ir.regions.com) and on the Securities and Exchange Commission's website (www.sec.gov). Regions does not undertake to update the forward-looking statements to reflect the impact of circumstances or events that may arise after the date of the forward-looking statements.
SIGNATURES
Pursuant to the requirements of the Securities Exchange Act of 1934, the registrant has duly caused this report to be signed on its behalf by the undersigned hereunto duly authorized.
REGIONS FINANCIAL CORPORATION
By: /s/ Fournier J. Gale, III
Name: Fournier J. Gale, III
Title: Senior Executive Vice President,
General Counsel and Corporate
Secretary
Date: November 19, 2015
Exhibit 99.1

Media Contact: Investor Relations Contact:
Evelyn Mitchell List Underwood or Dana Nolan
205-264-4551 205-581-7890
Regions Financial Reviews Strategic Priorities and Sets Financial Targets at 2015 Investor Day
BIRMINGHAM, Ala. - November 19, 2015 - Regions Financial Corporation (NYSE: RF) today reviewed the Company’s strategy to build sustainable franchise value and strengthen financial performance. During an investor day conference in New York, senior executives discussed Regions’ business model and outlined steps the Company will take over the next three years to grow and diversify revenue, manage expenses and effectively deploy capital. Specifically, the Company detailed plans to restructure its expense base to become more efficient and invest in its revenue-producing businesses.
“Regions has a solid foundation that is built on the strength of our team, our markets, our culture and our ability to execute,” said Grayson Hall, chairman, president and CEO. “Operating more efficiently and implementing smart expense controls to fund revenue-producing businesses will accelerate our performance and drive growth and improved profitability in a challenging economy.”
The Company provided guidance on 2016 expectations and discussed long-term financial targets.
2016 Expectations:
• | Average Loan growth 3-5 percent |
• | Average Deposit growth 2-4 percent |
• | Net interest income up 2-4 percenti |
• | Adjusted non-interest income up 4-6 percent |
• | Adjusted expenses flat to up modestly: efficiency ratio under 63 percent |
• | Operating leverage of 2-4 percenti |
• | Net charge-offs 25-35 bps |
Long-Term Financial Targets:
• | Earnings Per Share (EPS): Deliver EPS compounded annual growth rate (CAGR) of 12-15 percent. |
• | Efficiency Ratio: Achieve an efficiency ratio under 60 percent by eliminating $300 million in expenses over the next three years to fund revenue-producing businesses while keeping expenses flat to slightly up. |
• | Return on Average Tangible Common Equity (ROATCE): Improve ROATCE to 12-14 percent. |
A replay of the video webcast and presentation materials referenced during the event are available at http://ir.regions.com.
About Regions Financial Corporation
Regions Financial Corporation (NYSE: RF), with $125 billion in assets, is a member of the S&P 500 Index and is one of the nation’s largest full-service providers of consumer and commercial banking, wealth management, mortgage, and insurance products and services. Regions serves customers in 16 states across the South, Midwest and Texas, and through its subsidiary, Regions Bank, operates approximately 1,630 banking offices and 2,000 ATMs. Additional information about Regions and its full line of products and services can be found at www.regions.com.
(i)Interest rate scenarios include a flat yield curve and market forward interest rates as of 11.6.15. Expectations assume the low end of the range under flat yield curve and the higher end of the range for market forward interest rates.
Note: 2016 non-interest income reflects the impact from posting order change of approximately $10M-$15M per quarter.
Forward-Looking Statements
This release may include forward-looking statements as defined in the Private Securities Litigation Reform Act of 1995. The terms “Regions,” the “Company,” “we,” “us” and “our” mean Regions Financial Corporation, a Delaware corporation, and its subsidiaries when or where appropriate. The words “anticipates,” “intends,” “plans,” “seeks,” “believes,” “estimates,” “expects,” “targets,” “projects,” “outlook,” “forecast,” “will,” “may,” “could,” “should,” “can,” and similar expressions often signify forward-looking statements. Forward-looking statements are not based on historical information, but rather are related to future operations, strategies, financial results or other developments. Forward-looking statements are based on management’s current expectations as well as certain assumptions and estimates made by, and information available to, management at the time the statements are made. Those statements are based on general assumptions and are subject to various risks, and because they also relate to the future they are likewise subject to inherent uncertainties and other factors that may cause actual results to differ materially from the views, beliefs and projections expressed in such statements. Therefore, we caution you against relying on any of these forward-looking statements. These risks, uncertainties and other factors include, but are not limited to, those described below:
• | Current and future economic and market conditions in the United States generally or in the communities we serve, including the effects of declines in property values, unemployment rates and potential reductions of economic growth, which may adversely affect our lending and other businesses and our financial results and conditions. |
• | Possible changes in trade, monetary and fiscal policies of, and other activities undertaken by, governments, agencies, central banks and similar organizations, which could have a material adverse effect on our earnings. |
• | The effects of a possible downgrade in the U.S. government’s sovereign credit rating or outlook, which could result in risks to us and general economic conditions that we are not able to predict. |
• | Possible changes in market interest rates or capital markets could adversely affect our revenue and expense, the value of assets and obligations, and the availability and cost of capital and liquidity. |
• | Any impairment of our goodwill or other intangibles, or any adjustment of valuation allowances on our deferred tax assets due to adverse changes in the economic environment, declining operations of the reporting unit, or other factors. |
• | Possible changes in the creditworthiness of customers and the possible impairment of the collectability of loans. |
• | Changes in the speed of loan prepayments, loan origination and sale volumes, charge-offs, loan loss provisions or actual loan losses where our allowance for loan losses may not be adequate to cover our eventual losses. |
• | Possible acceleration of prepayments on mortgage-backed securities due to low interest rates, and the related acceleration of premium amortization on those securities. |
• | Our ability to effectively compete with other financial services companies, some of whom possess greater financial resources than we do and are subject to different regulatory standards than we are. |
• | Loss of customer checking and savings account deposits as customers pursue other, higher-yield investments, which could increase our funding costs. |
• | Our inability to develop and gain acceptance from current and prospective customers for new products and services in a timely manner could have a negative impact on our revenue. |
• | Changes in laws and regulations affecting our businesses, such as the Dodd-Frank Act and other legislation and regulations relating to bank products and services, as well as changes in the enforcement and interpretation of such laws and regulations by applicable governmental and self-regulatory agencies, which could require us to change certain business practices, increase compliance risk, reduce our revenue, impose additional costs on us, or otherwise negatively affect our businesses. |
• | Our ability to obtain no regulatory objection (as part of the comprehensive capital analysis and review ("CCAR") process or otherwise) to take certain capital actions, including paying dividends and any plans to increase common stock dividends, repurchase common stock under current or future programs, or redeem preferred stock or other regulatory capital instruments, may impact our ability to return capital to stockholders and market perceptions of us. |
• | Our ability to comply with applicable capital and liquidity requirements (including the Basel III capital standards), including our ability to generate capital internally or raise capital on favorable terms, and if we fail to meet requirements, our financial condition could be negatively impacted. |
• | The costs, including possibly incurring fines, penalties, or other negative effects (including reputational harm) of any adverse judicial, administrative, or arbitral rulings or proceedings, regulatory enforcement actions, or other legal actions to which we or any of our subsidiaries are a party, and which may adversely affect our results. |
• | Our ability to manage fluctuations in the value of assets and liabilities and off-balance sheet exposure so as to maintain sufficient capital and liquidity to support our business. |
• | Possible changes in consumer and business spending and saving habits and the related effect on our ability to increase assets and to attract deposits, which could adversely affect our net income. |
• | Any inaccurate or incomplete information provided to us by our customers or counterparties. |
• | Inability of our framework to manage risks associated with our business such as credit risk and operational risk, including third-party vendors and other service providers, which could, among other things, result in a breach of operating or security systems as a result of a cyber attack or similar act. |
• | The inability of our internal disclosure controls and procedures to prevent, detect or mitigate any material errors or fraudulent acts. |
• | The effects of geopolitical instability, including wars, conflicts and terrorist attacks and the potential impact, directly or indirectly on our businesses. |
• | The effects of man-made and natural disasters, including fires, floods, droughts, tornadoes, hurricanes, and environmental damage, which may negatively affect our operations and/or our loan portfolios and increase our cost of conducting business. |
• | Our inability to keep pace with technological changes could result in losing business to competitors. |
• | Our ability to identify and address cyber-security risks such as data security breaches, "denial of service" attacks, "hacking" and identity theft, a failure of which could disrupt our business and result in the disclosure of and/or misuse or misappropriation of confidential or proprietary information; increased costs; losses; or adverse effects to our reputation. |
• | Possible downgrades in our credit ratings or outlook could increase the costs of funding from capital markets. |
• | The effects of problems encountered by other financial institutions that adversely affect us or the banking industry generally could require us to change certain business practices, reduce our revenue, impose additional costs on us, or otherwise negatively affect our businesses. |
• | The effects of the failure of any component of our business infrastructure provided by a third party could disrupt our businesses; result in the disclosure of and/or misuse of confidential information or proprietary information; increase our costs; negatively affect our reputation; and cause losses. |
• | Our ability to receive dividends from our subsidiaries could affect our liquidity and ability to pay dividends to stockholders. |
• | Changes in accounting policies or procedures as may be required by the Financial Accounting Standards Board or other regulatory agencies could materially affect how we report our financial results. |
• | The effects of any damage to our reputation resulting from developments related to any of the items identified above. |
You should not place undue reliance on any forward-looking statements, which speak only as of the date made. Factors or events that could cause our actual results to differ may emerge from time to time, and it is not possible to predict all of them. We assume no obligation to update or revise any forward-looking statements that are made from time to time, either as a result of future developments, new information or otherwise, except as may be required by law.
See also the reports filed with the Securities and Exchange Commission, including the discussion under the “Risk Factors” section of Regions’ Annual Report on Form 10-K for the year ended December 31, 2014 as filed with the Securities and Exchange Commission and available on its website at www.sec.gov.
###

® Investor Day 2015 2015 Investor Day November 19, 2015 ® Exhibit 99.2

® Investor Day 2015 Today’s Agenda 2 Topic Speaker Welcome and Overview of Company & Strategy Grayson Hall Regional Banking Group John Owen Corporate Banking Group John Turner Enterprise Risk Management & Credit Outlook Matt Lusco & Barb Godin Financial Overview and Expectations David Turner Final Q&A Session Grayson Hall Lunch

® Investor Day 2015 Forward‐looking statements 3 This presentation may include forward-looking statements, as defined in the Private Securities Litigation Reform Act of 1995, which reflect Regions’ current views with respect to future events and financial performance. Forward-looking statements are not based on historical information, but rather are related to future operations, strategies, financial results or other developments. Forward-looking statements are based on management’s expectations as well as certain assumptions and estimates made by, and information available to, management at the time the statements are made. Those statements are based on general assumptions and are subject to various risks, uncertainties and other factors that may cause actual results to differ materially from the views, beliefs and projections expressed in such statements. These risks, uncertainties and other factors include, but are not limited to, those described below: • Current and future economic and market conditions in the United States generally or in the communities we serve, including the effects of declines in property values, unemployment rates and potential reductions of economic growth, which may adversely affect our lending and other businesses and our financial results and conditions. • Possible changes in trade, monetary and fiscal policies of, and other activities undertaken by, governments, agencies, central banks and similar organizations, which could have a material adverse effect on our earnings. • The effects of a possible downgrade in the U.S. government’s sovereign credit rating or outlook, which could result in risks to us and general economic conditions that we are not able to predict. • Possible changes in market interest rates or capital markets could adversely affect our revenue and expense, the value of assets and obligations, and the availability and cost of capital and liquidity. • Any impairment of our goodwill or other intangibles, or any adjustment of valuation allowances on our deferred tax assets due to adverse changes in the economic environment, declining operations of the reporting unit, or other factors. • Possible changes in the creditworthiness of customers and the possible impairment of the collectability of loans. • Changes in the speed of loan prepayments, loan origination and sale volumes, charge-offs, loan loss provisions or actual loan losses where our allowance for loan losses may not be adequate to cover our eventual losses. • Possible acceleration of prepayments on mortgage-backed securities due to low interest rates, and the related acceleration of premium amortization on those securities. • Our ability to effectively compete with other financial services companies, some of whom possess greater financial resources than we do and are subject to different regulatory standards than we are. • Loss of customer checking and savings account deposits as customers pursue other, higher-yield investments, which could increase our funding costs. • Our inability to develop and gain acceptance from current and prospective customers for new products and services in a timely manner could have a negative impact on our revenue. • Changes in laws and regulations affecting our businesses, such as the Dodd-Frank Act and other legislation and regulations relating to bank products and services, as well as changes in the enforcement and interpretation of such laws and regulations by applicable governmental and self-regulatory agencies, which could require us to change certain business practices, increase compliance risk, reduce our revenue, impose additional costs on us, or otherwise negatively affect our businesses. • Our ability to obtain no regulatory objection (as part of the comprehensive capital analysis and review ("CCAR") process or otherwise) to take certain capital actions, including paying dividends and any plans to increase common stock dividends, repurchase common stock under current or future programs, or redeem preferred stock or other regulatory capital instruments, may impact our ability to return capital to stockholders and market perceptions of us. • Our ability to comply with applicable capital and liquidity requirements (including the finalized Basel III capital standards), including our ability to generate capital internally or raise capital on favorable terms, and if we fail to meet requirements, our financial condition could be negatively impacted. • The costs, including possibly incurring fines, penalties, or other negative effects (including reputational harm) of any adverse judicial, administrative, or arbitral rulings or proceedings, regulatory enforcement actions, or other legal actions to which we or any of our subsidiaries are a party, and which may adversely affect our results.
® Investor Day 2015 4 • Our ability to manage fluctuations in the value of assets and liabilities and off-balance sheet exposure so as to maintain sufficient capital and liquidity to support our business. • Possible changes in consumer and business spending and saving habits and the related effect on our ability to increase assets and to attract deposits, which could adversely affect our net income. • Any inaccurate or incomplete information provided to us by our customers or counterparties. • Inability of our framework to manage risks associated with our business such as credit risk and operational risk, including third-party vendors and other service providers, which could, among other things, result in a breach of operating or security systems as a result of a cyber attack or similar act. • The inability of our internal disclosure controls and procedures to prevent, detect or mitigate any material errors or fraudulent acts. • The effects of geopolitical instability, including wars, conflicts and terrorist attacks and the potential impact, directly or indirectly on our businesses. • The effects of man-made and natural disasters, including fires, floods, droughts, tornadoes, hurricanes, and environmental damage, which may negatively affect our operations and/or our loan portfolios and increase our cost of conducting business. • Our inability to keep pace with technological changes could result in losing business to competitors. • Our ability to identify and address cyber-security risks such as data security breaches, "denial of service" attacks, "hacking" and identity theft, a failure of which could disrupt our business and result in the disclosure of and/or misuse or misappropriation of confidential or proprietary information; increased costs; losses; or adverse effects to our reputation. • Possible downgrades in our credit ratings or outlook could increase the costs of funding from capital markets. • The effects of problems encountered by other financial institutions that adversely affect us or the banking industry generally could require us to change certain business practices, reduce our revenue, impose additional costs on us, or otherwise negatively affect our businesses. • The effects of the failure of any component of our business infrastructure provided by a third party could disrupt our businesses; result in the disclosure of and/or misuse of confidential information or proprietary information; increase our costs; negatively affect our reputation; and cause losses. • Our ability to receive dividends from our subsidiaries could affect our liquidity and ability to pay dividends to stockholders. • Changes in accounting policies or procedures as may be required by the Financial Accounting Standards Board or other regulatory agencies could materially affect how we report our financial results. • The effects of any damage to our reputation resulting from developments related to any of the items identified above. Forward‐looking statements continued The foregoing list of factors is not exhaustive. For discussion of these and other factors that may cause actual results to differ from expectations, look under the captions “Forward-Looking Statements” and “Risk Factors" of Regions' Annual Report on Form 10-K for the year ended December 31, 2014, as filed with the Securities and Exchange Commission. The words “anticipates,” “intends,” “plans,” “seeks,” “believes,” “estimates,” “expects,” “targets,” “projects,” “outlook,” “forecast,” “will,” “may,” “could,” “should,” “can,” and similar expressions often signify forward-looking statements. You should not place undue reliance on any forward-looking statements, which speak only as of the date made. We assume no obligation to update or revise any forward-looking statements that are made from time to time.
® Investor Day 2015 2015 Investor Day Building Sustainable Franchise Value Grayson Hall November 19, 2015 ®
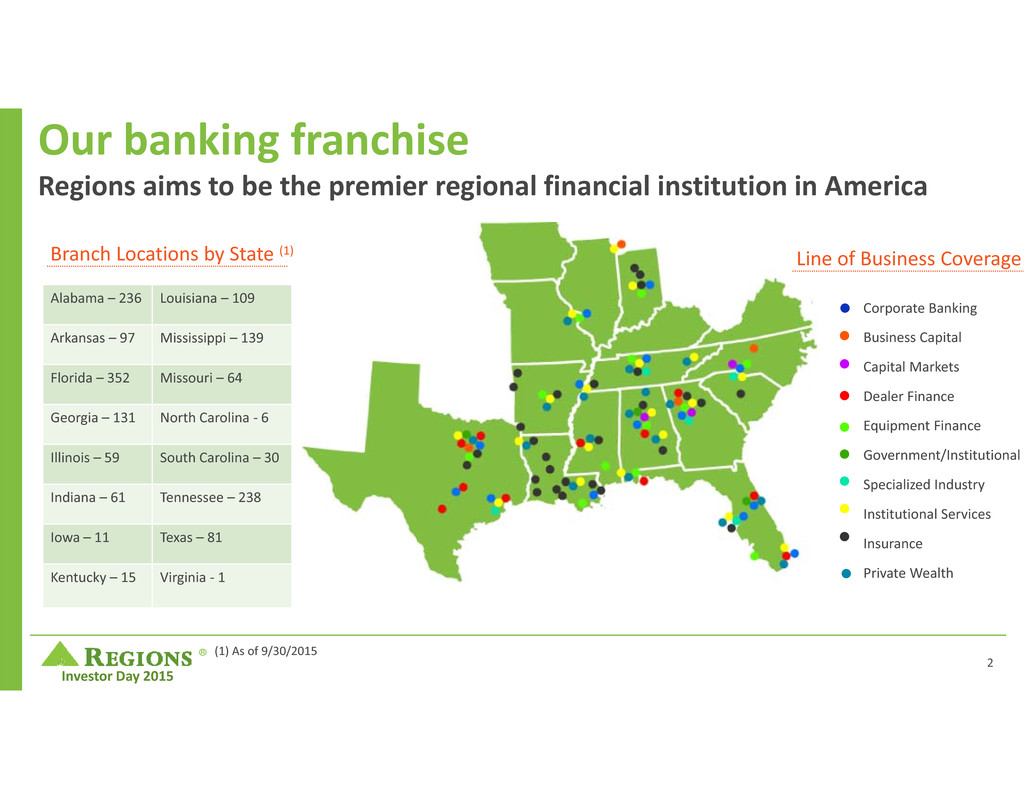
® Investor Day 2015 Our banking franchise Regions aims to be the premier regional financial institution in America Corporate Banking Business Capital Capital Markets Dealer Finance Equipment Finance Government/Institutional Specialized Industry Institutional Services Insurance Private Wealth • • • • • • • • • (1) As of 9/30/2015 Alabama – 236 Louisiana – 109 Arkansas – 97 Mississippi – 139 Florida – 352 Missouri – 64 Georgia – 131 North Carolina ‐ 6 Illinois – 59 South Carolina – 30 Indiana – 61 Tennessee – 238 Iowa – 11 Texas – 81 Kentucky – 15 Virginia ‐ 1 • Line of Business CoverageBranch Locations by State (1) 2
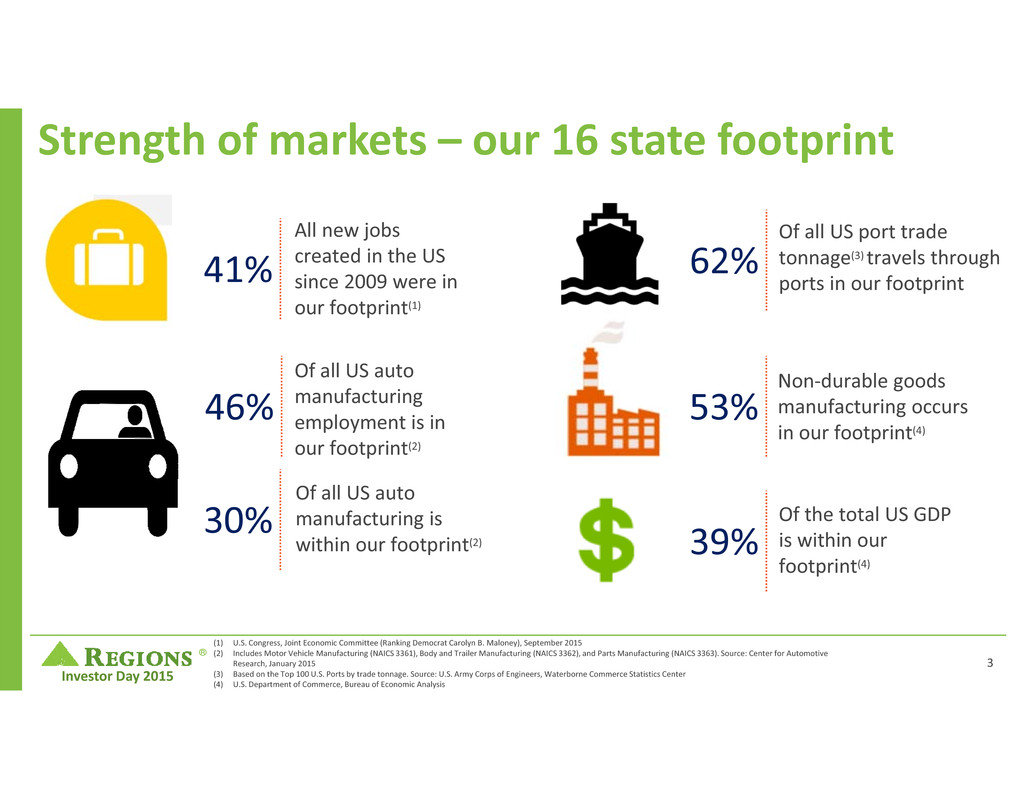
® Investor Day 2015 Strength of markets – our 16 state footprint Of all US auto manufacturing is within our footprint(2) 30% Of all US auto manufacturing employment is in our footprint(2) 46% All new jobs created in the US since 2009 were in our footprint(1) 41% Of the total US GDP is within our footprint(4) 39% Non‐durable goods manufacturing occurs in our footprint(4) 53% Of all US port trade tonnage(3) travels through ports in our footprint 62% (1) U.S. Congress, Joint Economic Committee (Ranking Democrat Carolyn B. Maloney), September 2015 (2) Includes Motor Vehicle Manufacturing (NAICS 3361), Body and Trailer Manufacturing (NAICS 3362), and Parts Manufacturing (NAICS 3363). Source: Center for Automotive Research, January 2015 (3) Based on the Top 100 U.S. Ports by trade tonnage. Source: U.S. Army Corps of Engineers, Waterborne Commerce Statistics Center (4) U.S. Department of Commerce, Bureau of Economic Analysis 3

® Investor Day 2015 Strength of markets Core markets provide a sound deposit franchise Regions Branches Regions Insurance Group 79% 79% of total deposits are in these six states AL – MS – FL LA – TN – AR Ranked 3rd or better in 14 of our Top 25 MSAs TOP 3 Source: SNL Financial as of 6/30/2015 FDIC summary 4

® Investor Day 2015 Strength of markets Priority markets provide opportunities for growth Top MSAs Deposits Market Rank ’15‐’20 Population Growth Birmingham, AL $10.9 1 Nashville, TN $6.9 2 Tampa, FL $5.8 4 Memphis, TN $4.4 2 Miami, FL $4.2 12 Atlanta, GA $3.6 6 Jackson, MS $3.1 2 St. Louis, MO $2.8 4 New Orleans, LA $2.6 5 Mobile, AL $2.4 1 Source: SNL Financial 1.0% 4.8% 0.9% 1.5% 5.9% 6.4% 2.1% 5.3% 6.5% 1.9% National Average: 3.5% 5
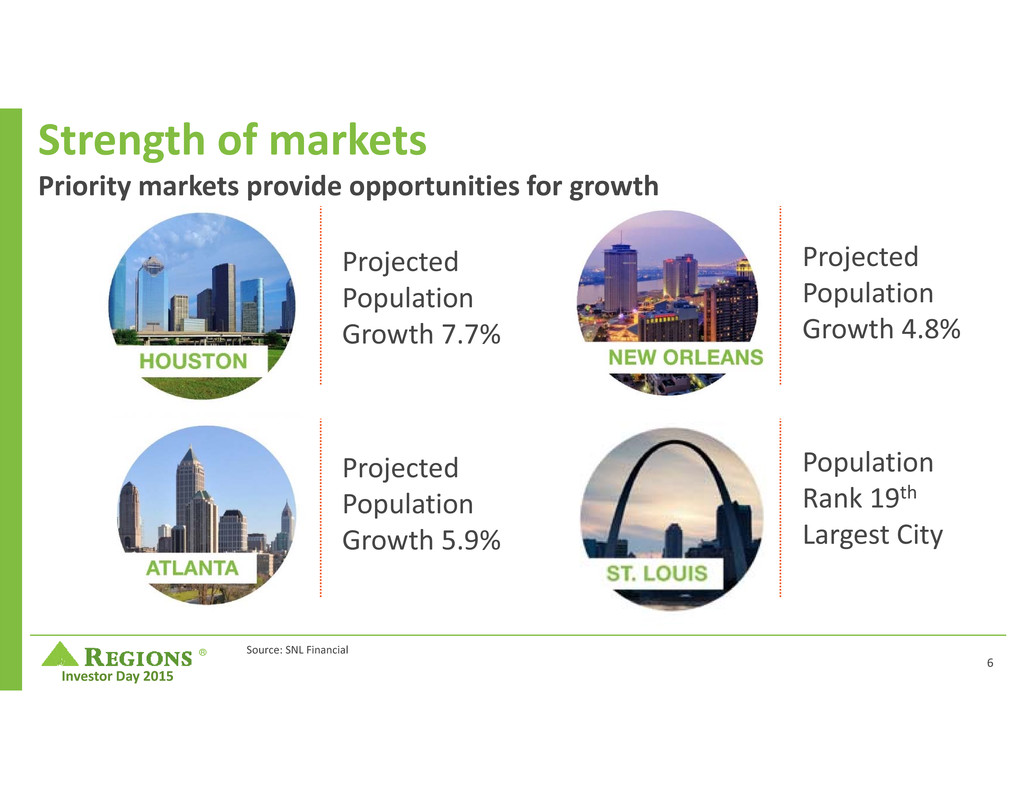
® Investor Day 2015 Strength of markets Priority markets provide opportunities for growth Population Rank 19th Largest City Projected Population Growth 7.7% Projected Population Growth 4.8% Projected Population Growth 5.9% Source: SNL Financial 6

® Investor Day 2015 Business mix (1) Income mix based on YTD results through 3Q2015. Excludes corporate treasury and other corporate support segments. Consumer & Business Banking 47% Wealth 7% Corporate Banking 46% Corporate Banking Income Mix by Business(1) Consumer & Business Banking Private Wealth Management Institutional Services Wealth Retail Banking Mortgage & Consumer Lending Indirect Lending Credit Card Regions Now Banking ® Branch Small Business Business Banking Corporate Banking Commercial Banking Real Estate Banking Specialized Industries Regions Business Capital Capital Markets Treasury Management Regions Insurance Regions Investment Services 7

® Investor Day 2015 Focus on the Customer Build the Best Team Manage Performance Strengthen Financial Performance Enhance Risk Management Our priorities 5 strategic priorities that provide direction for decisions 8

® Investor Day 2015 Focus on the Customer Build the Best Team Manage Performance Strengthen Financial Performance Enhance Risk Management Our priorities 5 strategic priorities that provide direction for decisions 9
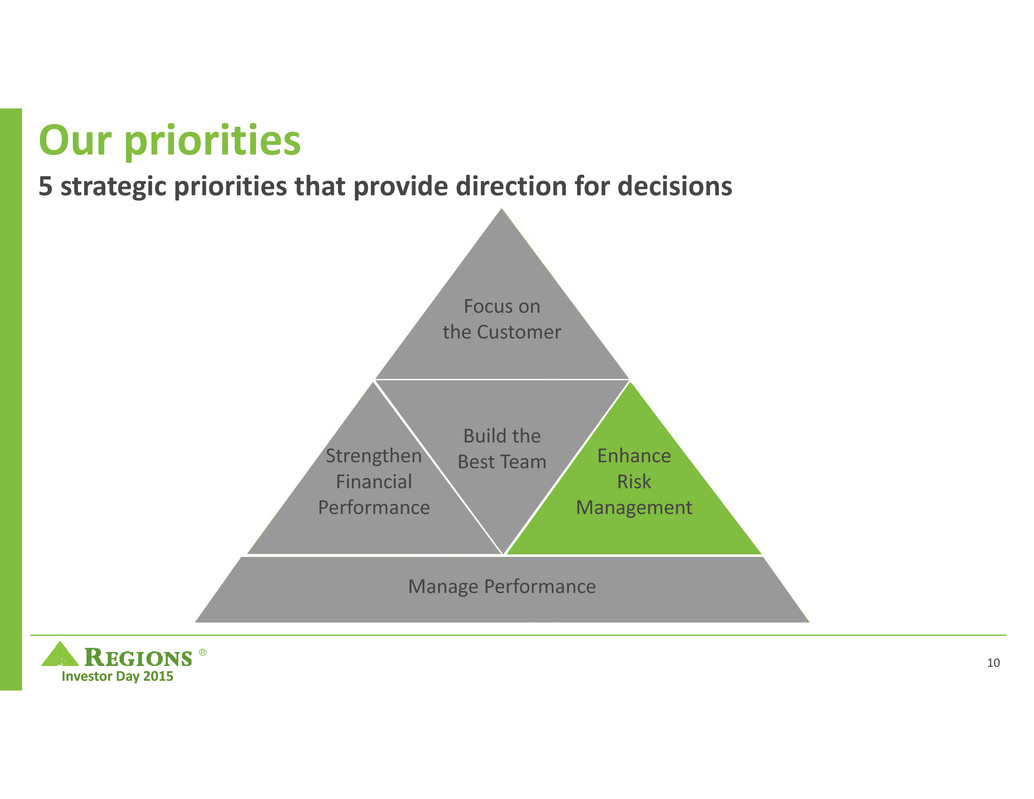
® Investor Day 2015 Focus on the Customer Build the Best Team Manage Performance Strengthen Financial Performance Enhance Risk Management Our priorities 5 strategic priorities that provide direction for decisions 10
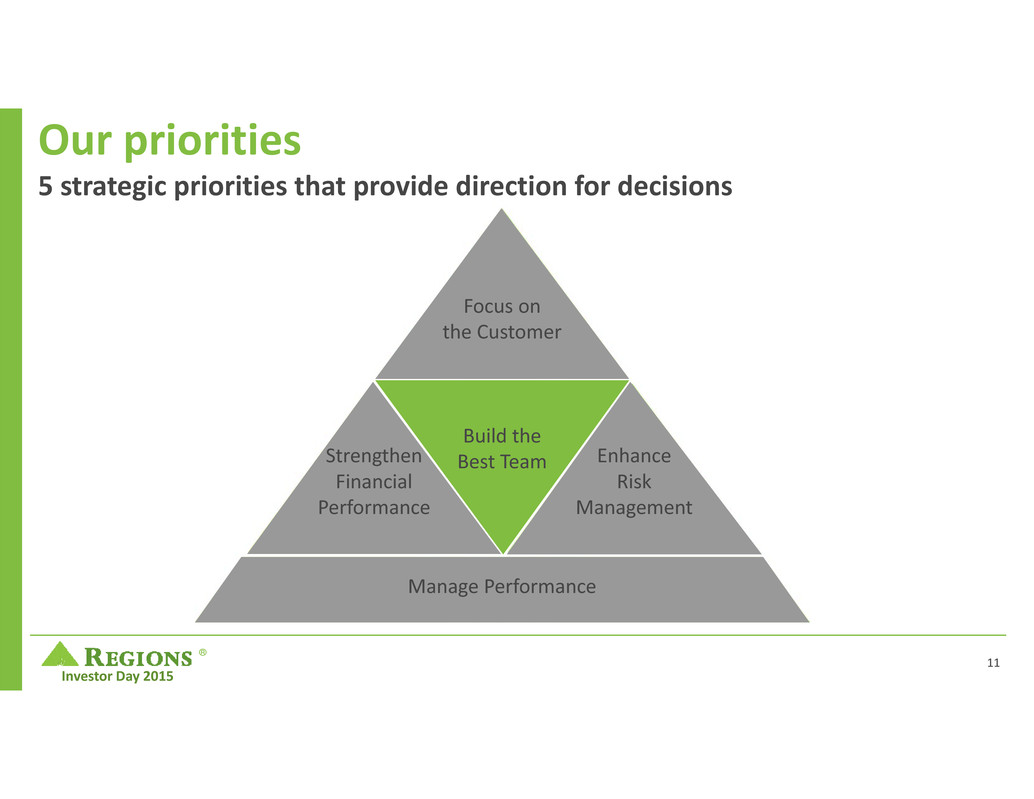
® Investor Day 2015 Focus on the Customer Build the Best Team Manage Performance Strengthen Financial Performance Enhance Risk Management Our priorities 5 strategic priorities that provide direction for decisions 11

® Investor Day 2015 Focus on the Customer Build the Best Team Manage Performance Strengthen Financial Performance Enhance Risk Management Our priorities 5 strategic priorities that provide direction for decisions 12

® Investor Day 2015 Focus on the Customer Build the Best Team Manage Performance Strengthen Financial Performance Enhance Risk Management Our priorities 5 strategic priorities that provide direction for decisions 13

® Investor Day 2015 A solid foundation Strength of Markets Strength of Team Strength of Culture Strength of Execution Improving associate engagement Attracting, retaining and developing talent One Team – One Regions Strong foundation of mission and values SM is delivering deeper relationships Connectivity between Risk Management and all areas of the bank De‐risked the balance sheet Diversified revenue with new products/services Grew loans, deposits and households SM 14

® Investor Day 2015 Strength of culture Basic values, beliefs & mission reflect our culture Regions' mission is to achieve superior economic value for our shareholders over time by making life better for our customers, our associates and our communities and creating shared value as we help them meet their financial goals and aspirations. Most Reputable Bank in the U.S. (2015) Ranked #1 among all measured banks based on the 2015 American Customer Satisfaction Index Retail Banking Study Top 40 Places to Work (2015) 15
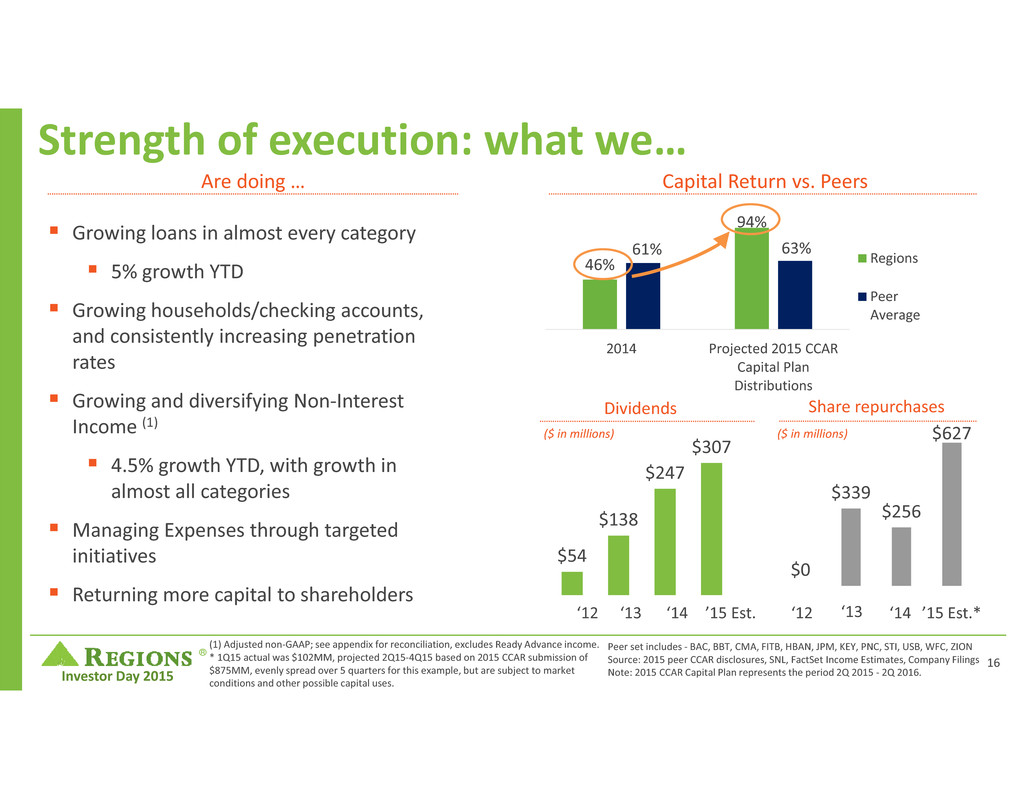
® Investor Day 2015 Capital Return vs. Peers $54 $138 $247 $307 Strength of execution: what we… Are doing … Growing loans in almost every category 5% growth YTD Growing households/checking accounts, and consistently increasing penetration rates Growing and diversifying Non‐Interest Income (1) 4.5% growth YTD, with growth in almost all categories Managing Expenses through targeted initiatives Returning more capital to shareholders 46% 94% 61% 63% 2014 Projected 2015 CCAR Capital Plan Distributions Regions Peer Average Dividends ($ in millions) Share repurchases $0 $339 $256 $627 ‘12 ‘13 ($ in millions) ‘14 ’15 Est. ‘12 ‘13 ‘14 ’15 Est.* Peer set includes ‐ BAC, BBT, CMA, FITB, HBAN, JPM, KEY, PNC, STI, USB, WFC, ZION Source: 2015 peer CCAR disclosures, SNL, FactSet Income Estimates, Company Filings Note: 2015 CCAR Capital Plan represents the period 2Q 2015 ‐ 2Q 2016. (1) Adjusted non‐GAAP; see appendix for reconciliation, excludes Ready Advance income. * 1Q15 actual was $102MM, projected 2Q15‐4Q15 based on 2015 CCAR submission of $875MM, evenly spread over 5 quarters for this example, but are subject to market conditions and other possible capital uses. 16

® Investor Day 2015 Strategic initiatives – strengthen financial performance Effectively Deploy Capital Grow and Diversify Revenue Disciplined Expense Management Three pillars of execution 17

® Investor Day 2015 ®

® Investor Day 2015 2015 Investor Day Regional Banking Group John Owen November 19, 2015 ®
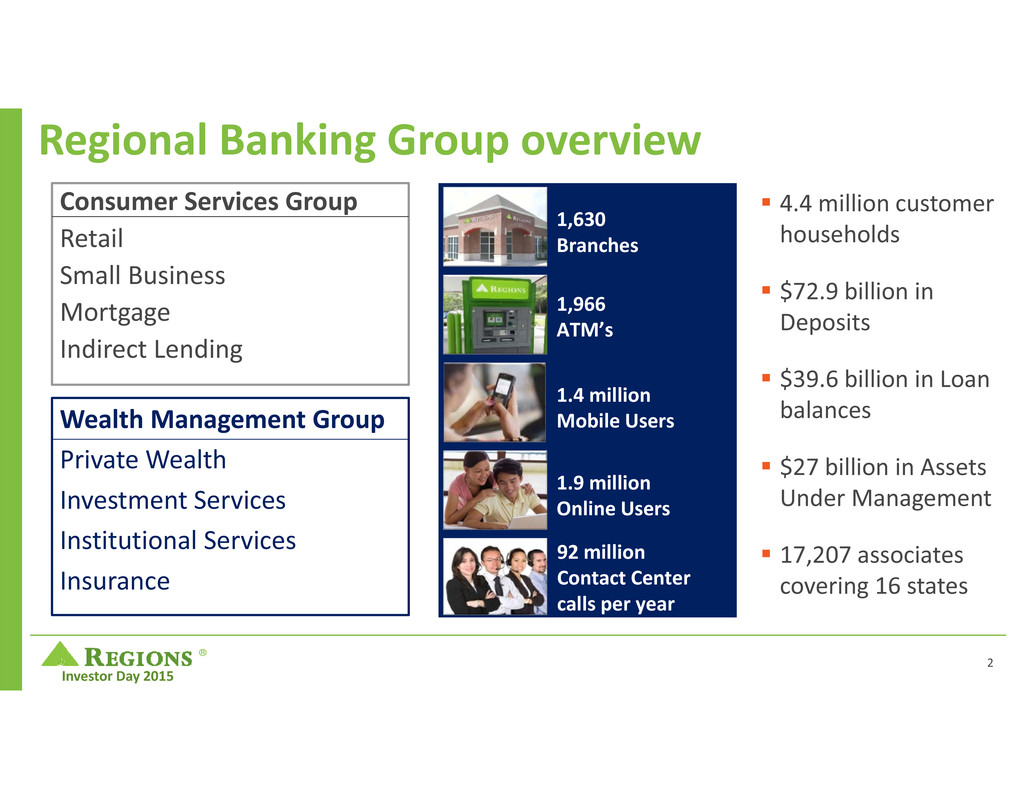
® Investor Day 2015 Regional Banking Group overview Consumer Services Group Retail Small Business Mortgage Indirect Lending Wealth Management Group Private Wealth Investment Services Institutional Services Insurance 1,630 Branches 1,966 ATM’s 1.4 million Mobile Users 1.9 million Online Users 92 million Contact Center calls per year 4.4 million customer households $72.9 billion in Deposits $39.6 billion in Loan balances $27 billion in Assets Under Management 17,207 associates covering 16 states 2

® Investor Day 2015 Checking Accounts • 2% ‐ 3% Credit Cards • 9% ‐ 10% Debit Cards • 2% ‐ 3% Regions Now Banking® • 6% ‐ 7% Wealth Management Quality Households Regional Banking Group 2015 highlights Deposits • 2% ‐ 3% Consumer Loans • 3% ‐ 4% Assets Under Management • 1% ‐ 2% Regions360SM Relationships • 2% ‐ 4% Wealth Management Non‐ Interest Income • 10% ‐ 12%• 2% ‐ 4% Growing the Business 3
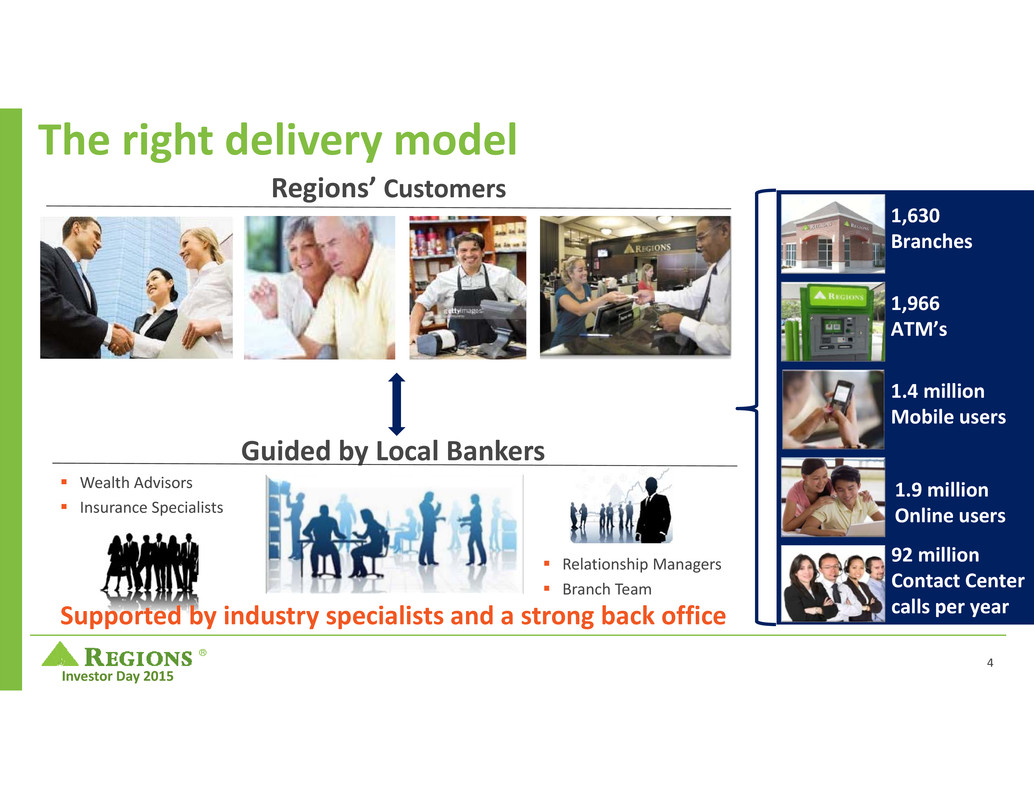
® Investor Day 2015 The right delivery model Regions’ Customers Guided by Local Bankers Supported by industry specialists and a strong back office Relationship Managers Branch Team Wealth Advisors Insurance Specialists 1,630 Branches 1,966 ATM’s 1.4 million Mobile users 1.9 million Online users 92 million Contact Center calls per year 4

® Investor Day 2015 Consumer Services delivering steady organic growth – focused on the fundamentals Remain focused on organic growth Deepen customer relationships through strategy Continue investments in our distribution network Innovate and launch initiatives that meet customer needs SM Grow and Diversify Revenue Effectively Deploy Capital Disciplined Expense Management 5
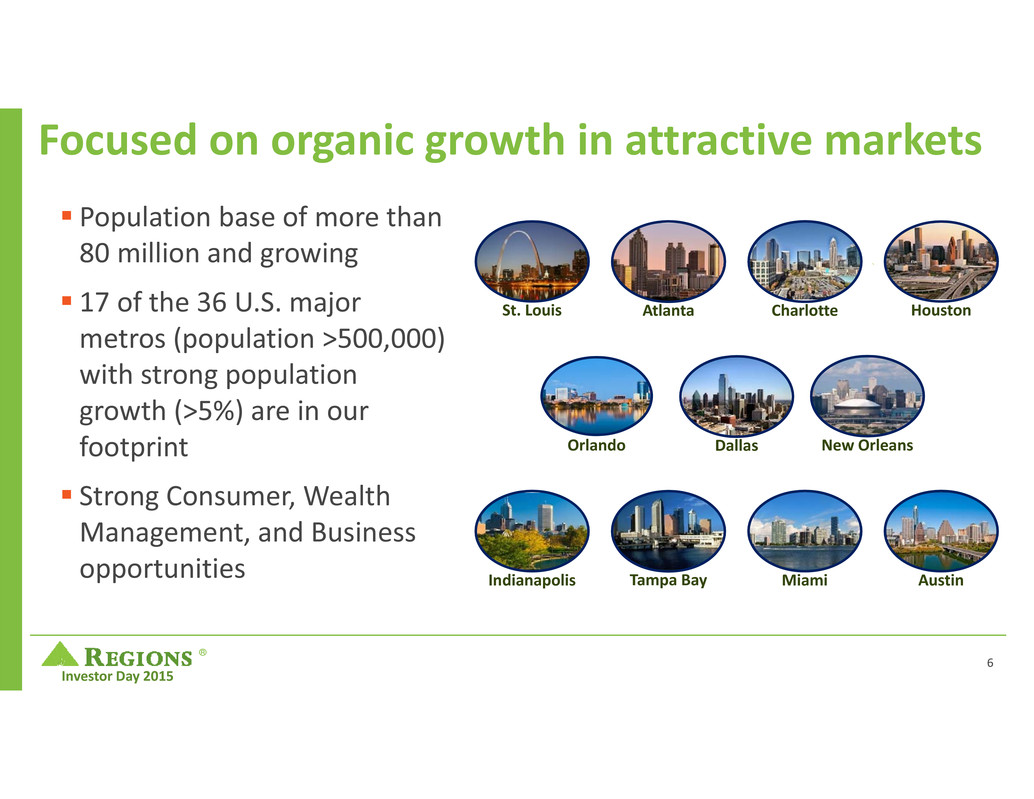
® Investor Day 2015 Focused on organic growth in attractive markets St. Louis HoustonAtlanta Charlotte Indianapolis AustinMiamiTampa Bay Orlando Dallas New Orleans Population base of more than 80 million and growing 17 of the 36 U.S. major metros (population >500,000) with strong population growth (>5%) are in our footprint Strong Consumer, Wealth Management, and Business opportunities 6
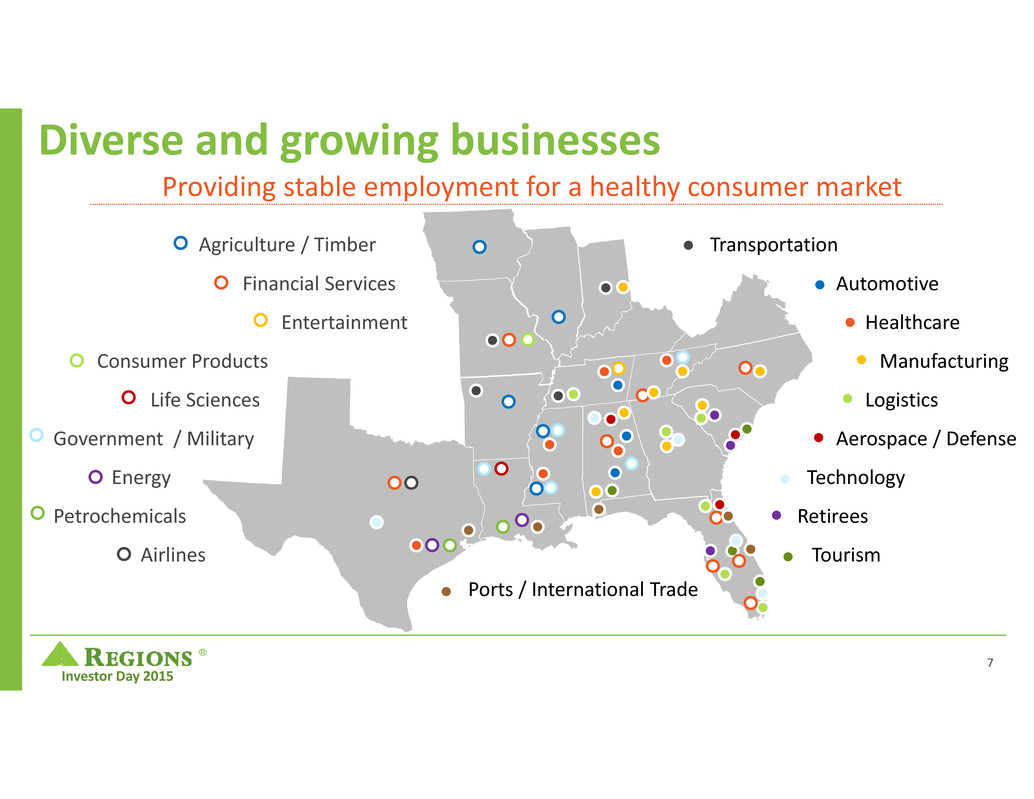
® Investor Day 2015 Diverse and growing businesses Ports / International Trade Transportation Automotive Healthcare Manufacturing Logistics Aerospace / Defense Technology Retirees Tourism Agriculture / Timber Financial Services Entertainment Consumer Products Life Sciences Government / Military Energy Petrochemicals Airlines Providing stable employment for a healthy consumer market 7
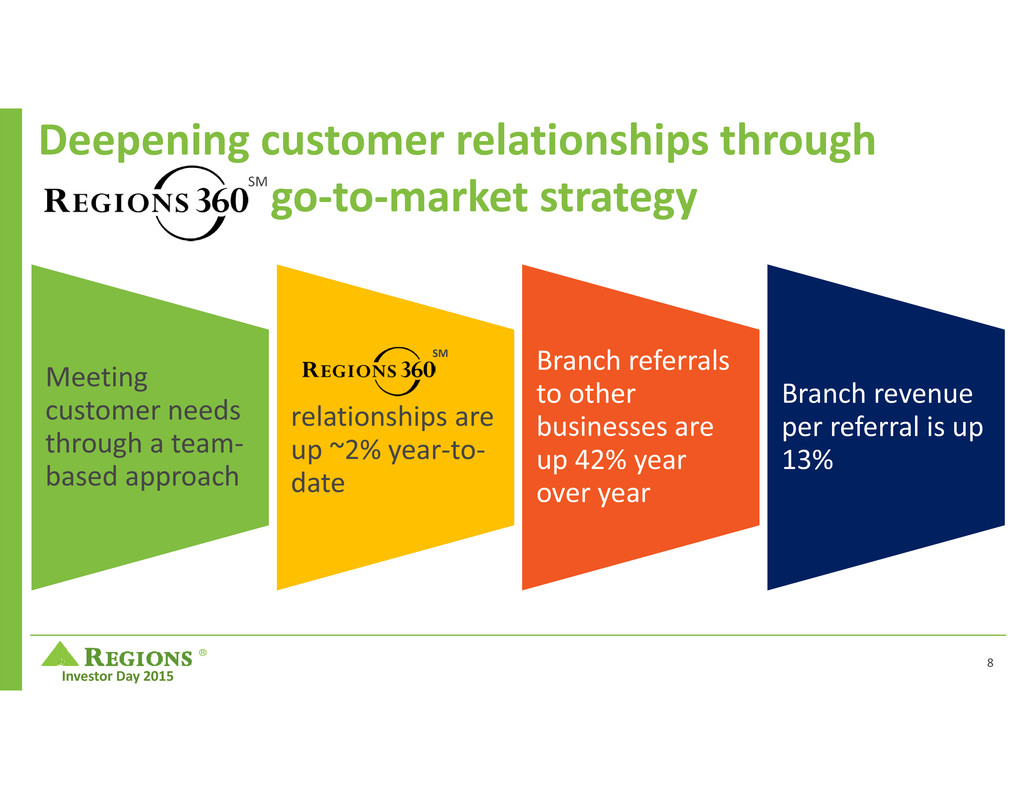
® Investor Day 2015 Deepening customer relationships through go‐to‐market strategy Meeting customer needs through a team‐ based approach relationships are up ~2% year‐to‐ date Branch referrals to other businesses are up 42% year over year Branch revenue per referral is up 13% SM SM 8

® Investor Day 2015 Continue investments in our distribution network Continue investments in mobile and online Building five branches in 2015 and three in 2016 Continue deployment of Universal Banker Branch consolidations will continue in 2016 and 2017 9

® Investor Day 2015 Track record of launching new and innovative solutions to meet customer needs Launched Regions Now Banking®2012 Grew customer base to 500,000 Re‐entered Indirect Auto Prudent loan growth reaching $3.9 billion2010 Launched Remote Deposit Capture Deliver funds availability options to the customer Growing more than 5,000 active cards per month in 2015 Purchased Credit Card book of business2011 Initiative Impact Launched Financial Consultant initiative Grew brokerage assets from zero to $2 billion 2013 10

® Investor Day 2015 Track record of launching new and innovative solutions to meet customer needs Launched saving secured loans for loans under $2,000 Added 45,000 new loan customers Launched Regions Streamline of Credit for loans under $2,000 Added 40,000 new loan customers Launched pilot branch formats Test and Learn approach to meet customer needs with more automation and less square footage 2014 Launched point‐of‐sale partnership focused on home improvement industry Forecasting loan balances of $364 million in 20152015 Execute growth plans for previously launched initiatives Pilot and test consumer online lending Grow and diversify revenue through additional point‐of‐sale loan partnerships2016 ‐ 2018 Initiative Impact SM 11
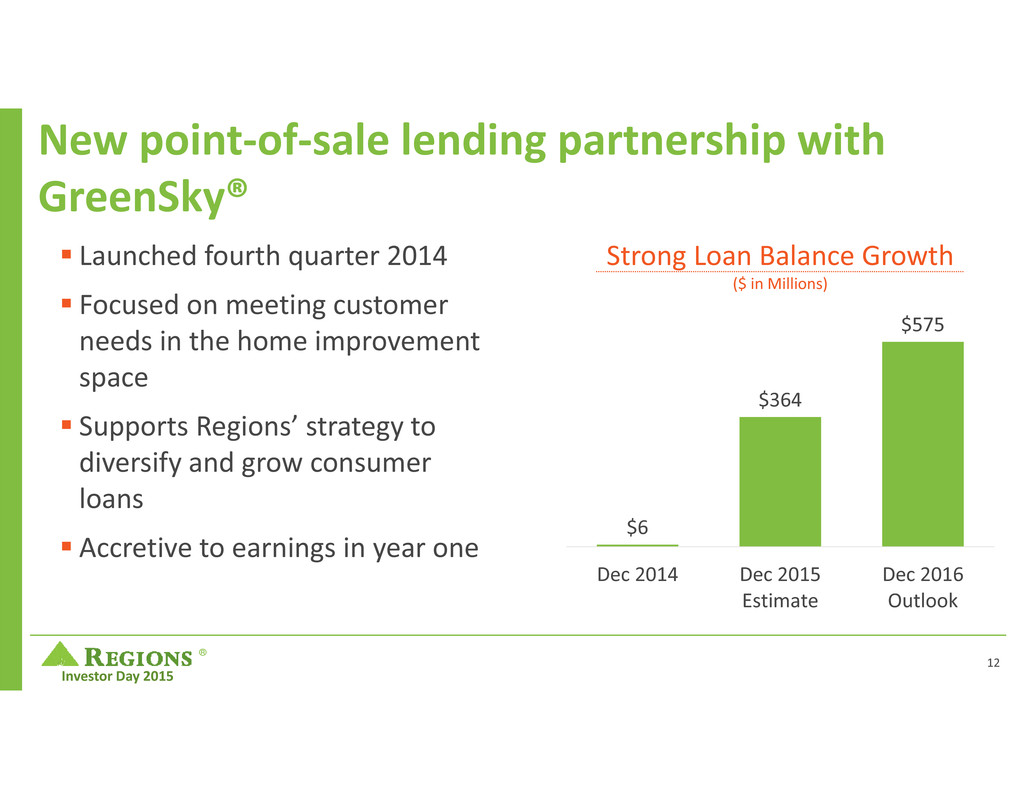
® Investor Day 2015 New point‐of‐sale lending partnership with GreenSky® Launched fourth quarter 2014 Focused on meeting customer needs in the home improvement space Supports Regions’ strategy to diversify and grow consumer loans Accretive to earnings in year one $6 $364 $575 Dec 2014 Dec 2015 Estimate Dec 2016 Outlook Strong Loan Balance Growth ($ in Millions) 12

® Investor Day 2015 Growing Indirect Auto in a prudent manner Focused strategy on aligning with large preferred dealer groups 50% of production is from preferred dealer groups Loss rates for preferred dealers are significantly lower No subprime; no leases with Regions’ dealer partners $1.6 $4.0 $4.6 Dec 2010 Dec 2015 Estimate Dec 2016 Outlook Strong Loan Balance Growth ($ in Billions) 13

® Investor Day 2015 Business Banking Three pillars of execution Remain focused on organic growth Deepen customer relationships through strategy Expand online credit delivery channel through partnerships with alternative lenders Continue expansion of Small Business Administration (SBA) product offerings SMGrow and Diversify Revenue Effectively Deploy Capital Disciplined Expense Management 14

® Investor Day 2015 Business Banking delivering strong deposit growth while loan demand remains weak Strong deposit growth – balances up more than 8% year‐to‐date Growing Business Banking relationships – up 7% year‐to‐date Growing relationships – up 6% year‐to‐date Growing SBA lending, 2015 loan production up 13% year‐over‐year Launched partnership with Fundation – online small business lender The number of small businesses has declined 18% since 2008 Small business formation remains weak Loan demand remains weak Rapid growth of non‐bank online small business lenders Key Wins Challenges SM TM 15

® Investor Day 2015 Business Banking continues a slow recovery Dallas / Fort Worth Houston Austin San Antonio Birmingham Miami Orlando St. Louis FL Panhandle Atlanta Memphis Clearwater / St. Pete Nashville South AL Tampa Baton Rouge Dallas / Fort Worth Knoxville Jacksonville Strong Deposit Growth ‐ Low demand for Credit Loan Growth Opportunity Markets Core Business Banking Markets Raleigh Baton Rouge Northeast AR Charlotte Little Rock Ft. Myers Strong Deposit Growth Markets Birmingham Miami St. Louis Ft. Lauderdale Atlanta Orlando Nashville Clearwater / St. Pete Baton Rouge Tampa New Orleans 16
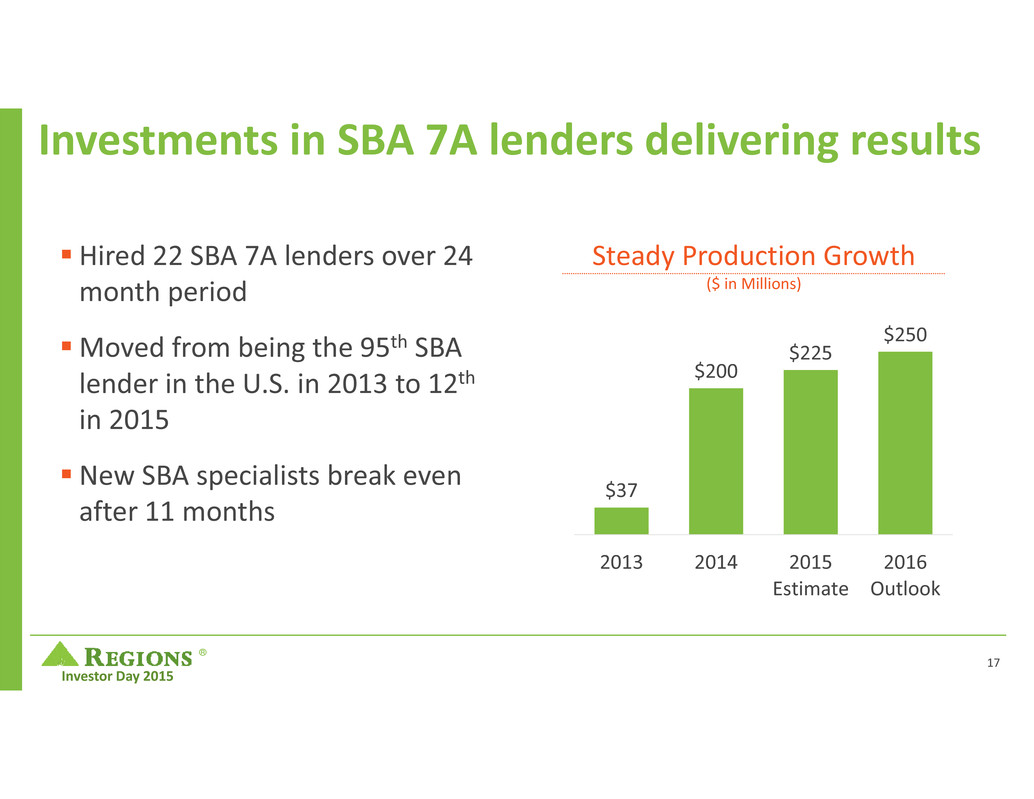
® Investor Day 2015 Investments in SBA 7A lenders delivering results Hired 22 SBA 7A lenders over 24 month period Moved from being the 95th SBA lender in the U.S. in 2013 to 12th in 2015 New SBA specialists break even after 11 months Steady Production Growth ($ in Millions) $37 $200 $225 $250 2013 2014 2015 Estimate 2016 Outlook 17

® Investor Day 2015 New online lending partnership with Fundation Launched September 2015 Focused on meeting small business customer needs by providing an online delivery channel for loans Supports Regions’ Test and Learn strategy TM 18

® Investor Day 2015 Wealth Management Group Three pillars of execution Remain focused on organic growth Deepen customer relationships through strategy Grow Assets Under Management Make bolt‐on acquisitions and lift‐ outs Grow and Diversify Revenue Effectively Deploy Capital Disciplined Expense Management SM 19

® Investor Day 2015 Wealth Management strategy delivering revenue growth Developed a talented team focused on client needs Built out our Investment Services team Continue investments in Insurance lift‐outs and acquisitions Fiduciary standard of care in Private Wealth Growing Non‐Interest Income ($ in Millions) $367 $411 $458 2014 Actual 2015 Estimate 2016 Outlook 20

® Investor Day 2015 Investments in Financial Consultants delivering results Fee Income ($ in Millions) $7.7 $19.3 $30.6 $38.0 2013 Actual 2014 Actual 2015 Estimate 2016 Outlook Hired, trained and on‐boarded 225 Financial Consultants over three years Financial Consultants breakeven at nine months Brokerage assets have grown from $0 to $2 billion Targeting customers with $500,000 or less to invest 21
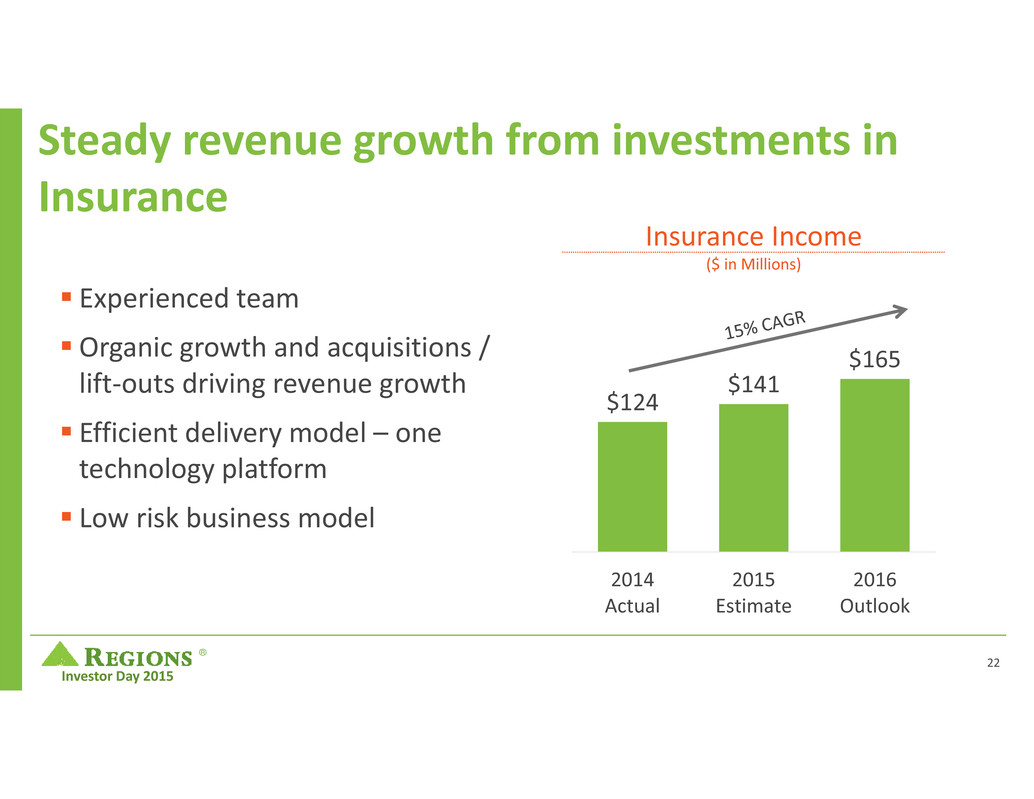
® Investor Day 2015 Steady revenue growth from investments in Insurance Experienced team Organic growth and acquisitions / lift‐outs driving revenue growth Efficient delivery model – one technology platform Low risk business model Insurance Income ($ in Millions) $124 $141 $165 2014 Actual 2015 Estimate 2016 Outlook 22
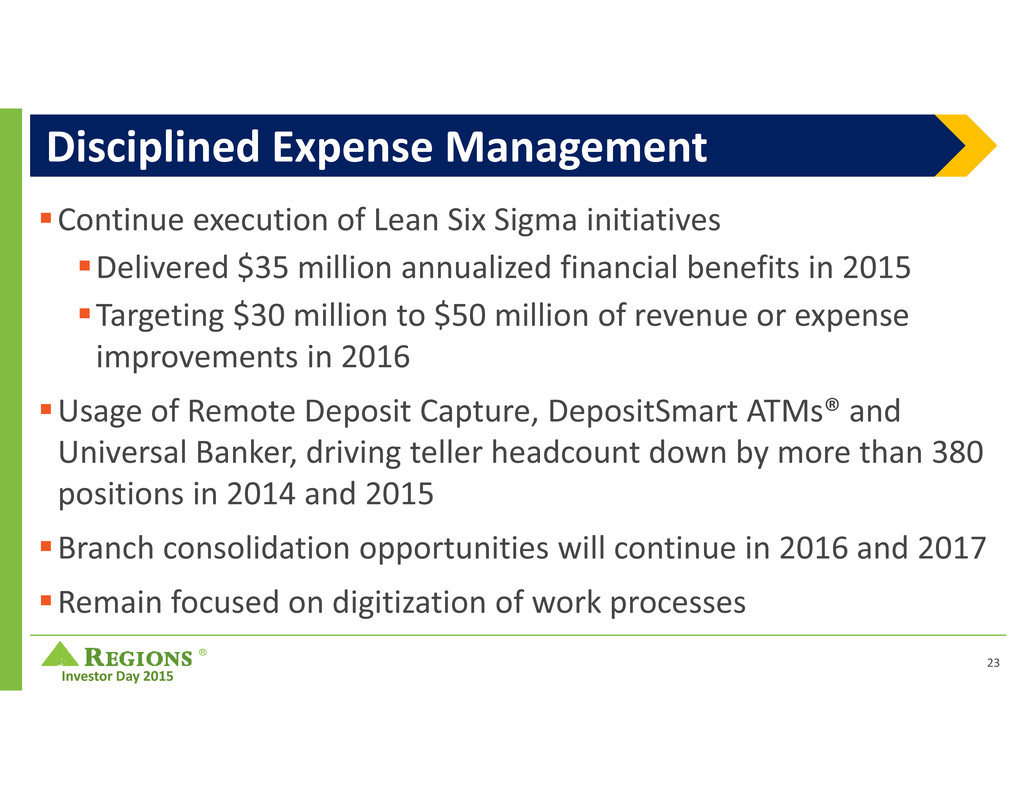
® Investor Day 2015 Continue execution of Lean Six Sigma initiatives Delivered $35 million annualized financial benefits in 2015 Targeting $30 million to $50 million of revenue or expense improvements in 2016 Usage of Remote Deposit Capture, DepositSmart ATMs® and Universal Banker, driving teller headcount down by more than 380 positions in 2014 and 2015 Branch consolidation opportunities will continue in 2016 and 2017 Remain focused on digitization of work processes Disciplined Expense Management 23

® Investor Day 2015 Investing in people & products Cumulative 3‐Year Financial Impact of Initiatives 2015 2016 2017 2018 Revenue Pre‐Tax Income 24 Expenses

® Investor Day 2015 Regional Banking Group Positive Operating Leverage of 2% ‐ 3% Revenue growth of 2% ‐ 4% (CAGR) 2016 – 2018 Growth Outlook – Annual Growth Targets Customer accounts 2% ‐ 4% accounts 2% ‐ 4% Deposits 2% ‐ 4% Loans 3% ‐ 5% Assets Under Management 5% ‐ 7% Wealth Management Non‐Interest 10% ‐ 12% Income SM 25

® Investor Day 2015 ®
® Investor Day 2015 2015 Investor Day Corporate Banking Group John Turner November 19, 2015

® Investor Day 2015 Strategic initiatives – strengthen financial performance Effectively Deploy Capital Grow and Diversify Revenue Disciplined Expense Management Three pillars of execution 2

® Investor Day 2015 17,207 1,196 5,549 58% 42% 73% 27% 78% 22% 80% 20% Loans Revenue Pre‐Tax Pre‐Provision IncomeHeadcount Deposits Non‐Interest Income The Corporate Banking Group Notes: 1. All figures above are based on 2015 YTD financials, unless otherwise noted. 2. All figures, except Headcount, exclude Treasury, Corporate Support and discontinued operations. 3. The Regional Banking Group represents the combination of the consumer bank and wealth management reportable segments presented in the Company’s 3Q15 Form 10‐Q filed with the SEC. Regional Banking Group Other Corporate Banking Group 50% 50% 3

® Investor Day 2015 Corporate Banking Group structure Businesses Clients1,3 Loans2 Deposits2 Revenue2 Relationship Managers3 Commercial Banking $20MM–$250MM sales 2,051 $15.9B $13.3B $472MM 99 Corporate Banking $250MM–$2B sales 766 $12.2B $3.5B $340MM 20 Real Estate Banking 651 $10.1B $2.0B $252MM 39 TOTAL4 3,468 $39.9B $19.8B $1.14B 158 1. Client count excludes those relationships with less than $25,000 of trailing annual revenue. 2. Average balances and revenue is YTD as of Q3 2015. 3. Client and RM count as of Q3 2015. 4. Total Corporate Banking Group contains Loans, Deposits and Revenue that are not included in the three businesses. 4

® Investor Day 2015 Corporate Banking business model Healthcare Energy & Natural Resources Technology & Defense Restaurant Transportation Financial Services Asset Based Lending Lender Finance Retail Trade A/R Securitization Capital Markets Treasury Management Equipment Finance Wealth Management Market Based Local Bankers Commercial Banking Corporate Banking Real Estate Banking Regions Business Capital Specialized Industries Product Partners Government & Institutional Banking 5

® Investor Day 2015 Opportunities & initiatives Opportunity Initiative Underpenetrated in some markets and business segments Continue to recruit, retain and develop bankers who provide quality ideas and solutions Too many of our relationships are single‐service Improve execution on our needs‐based sales approach and expand relationships Low returns characteristic of some client relationships and portfolios Employ a data‐driven approach to allocating capital and other resources Our revenue mix is too heavily weighted toward net interest income Continue to build out our Capital Markets and Treasury Management product capabilities 6
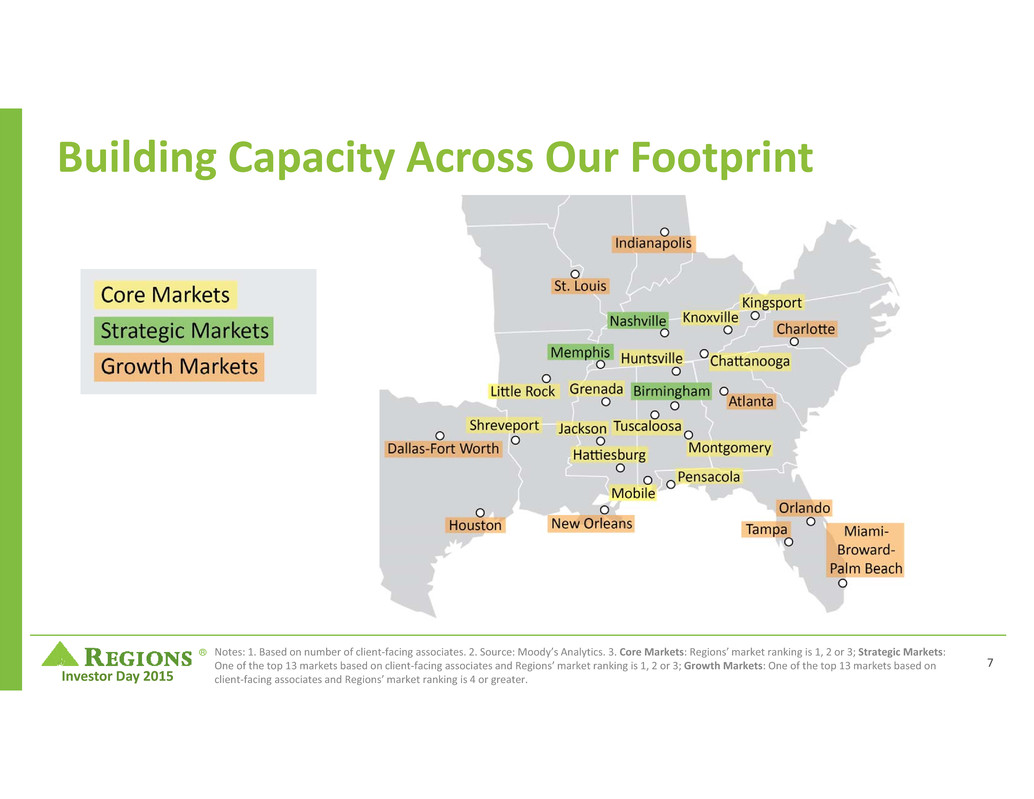
® Investor Day 2015 Notes: 1. Based on number of client‐facing associates. 2. Source: Moody’s Analytics. 3. Core Markets: Regions’ market ranking is 1, 2 or 3; Strategic Markets: One of the top 13 markets based on client‐facing associates and Regions’ market ranking is 1, 2 or 3; Growth Markets: One of the top 13 markets based on client‐facing associates and Regions’ market ranking is 4 or greater. Building Capacity Across Our Footprint 7

® Investor Day 2015 Our local relationship managers collaborate with Specialized Industries, Regions Business Capital and product partners to deliver the whole bank to the client, meeting clients’ needs and helping them achieve their financial and operational objectives impact in Corporate Banking Group SM 8

® Investor Day 2015 Impact in Corporate Banking Group SM Relationships that are shared between our C&I bankers and our Specialized Industries or RBC bankers generate 134% more revenue than our core C&I relationships 134% more revenue In our core Commercial Middle Market business, relationships generate, on average, 3.3 times more revenue as other relationships SM 3.3x more revenue Even when adjusting for the larger size of these relationships, shared relationships generate 73% more revenue than our core C&I relationships 73% more revenue 9
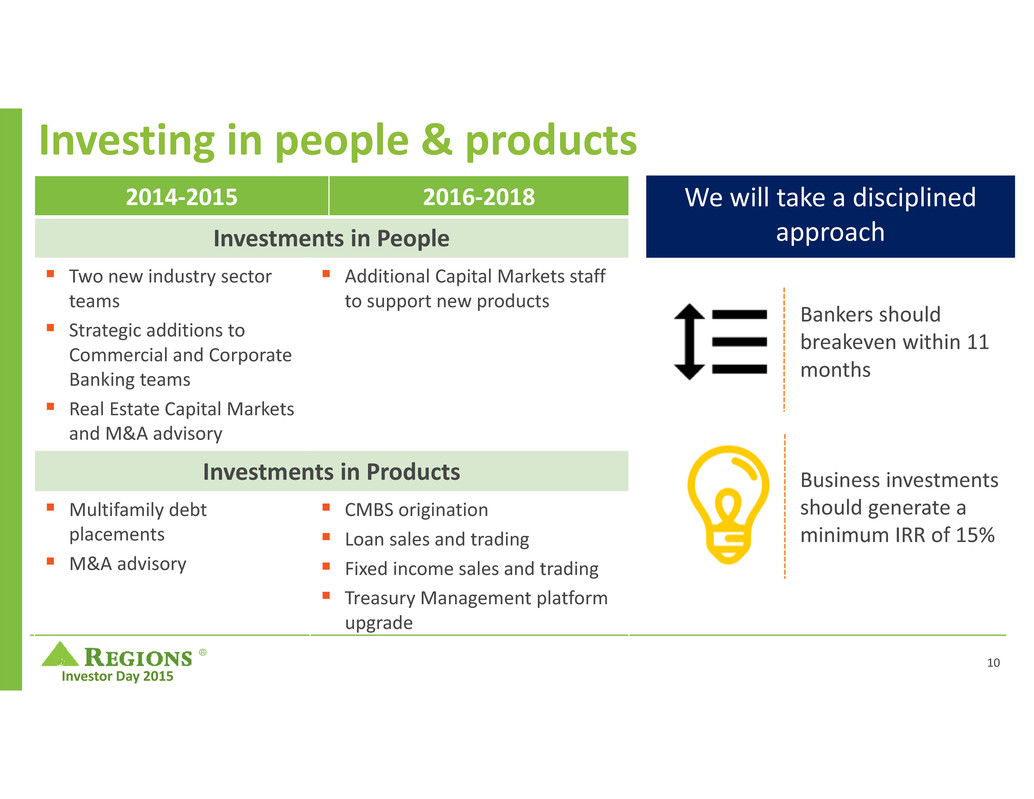
® Investor Day 2015 Investing in people & products 2014‐2015 2016‐2018 Investments in People Two new industry sector teams Strategic additions to Commercial and Corporate Banking teams Real Estate Capital Markets and M&A advisory Additional Capital Markets staff to support new products Investments in Products Multifamily debt placements M&A advisory CMBS origination Loan sales and trading Fixed income sales and trading Treasury Management platform upgrade Bankers should breakeven within 11 months Business investments should generate a minimum IRR of 15% We will take a disciplined approach 10
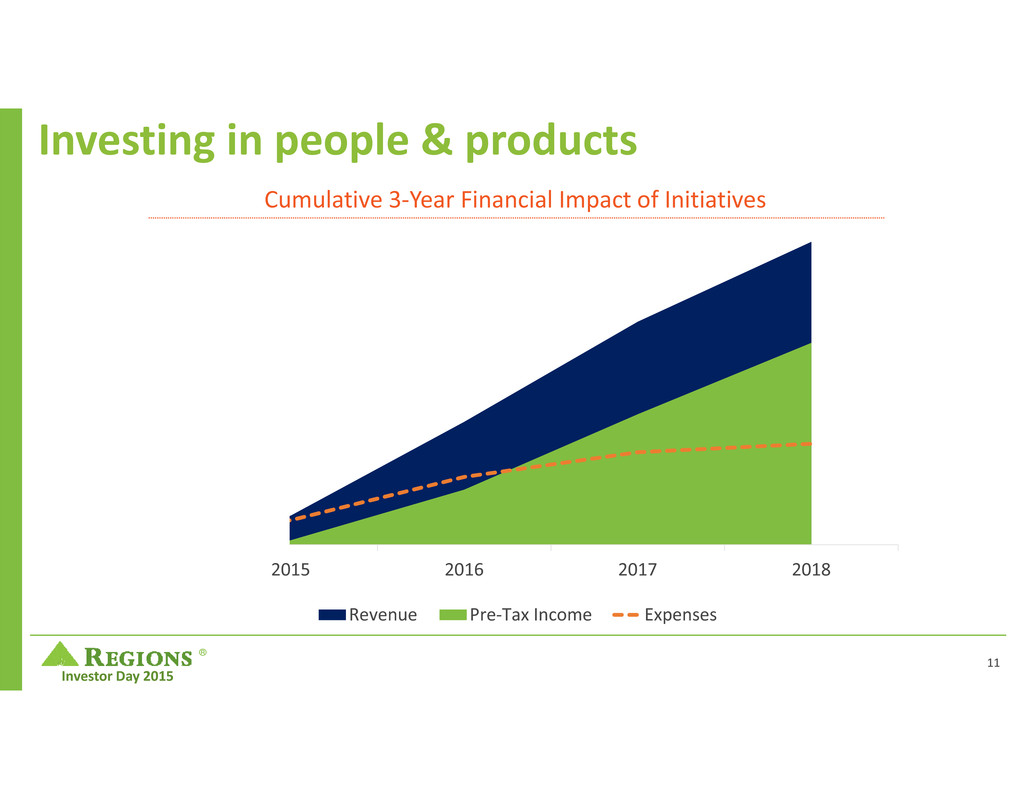
® Investor Day 2015 2014 2015 2016 2017 2018 Revenue Pre‐Tax Income Expenses Investing in people & products Cumulative 3‐Year Financial Impact of Initiatives 11
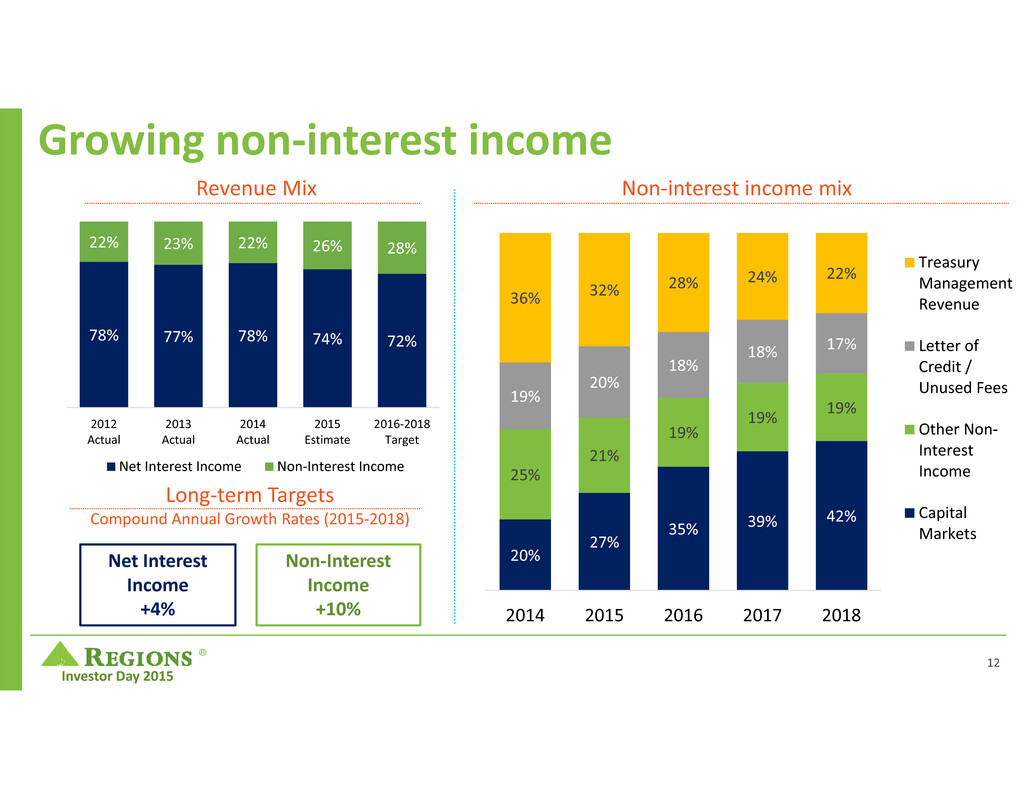
® Investor Day 2015 Growing non‐interest income 20% 27% 35% 39% 42% 25% 21% 19% 19% 19% 19% 20% 18% 18% 17% 36% 32% 28% 24% 22% 2014 2015 2016 2017 2018 Treasury Management Revenue Letter of Credit / Unused Fees Other Non‐ Interest Income Capital Markets Non‐interest income mix 78% 77% 78% 74% 72% 22% 23% 22% 26% 28% 2012 Actual 2013 Actual 2014 Actual 2015 Estimate 2016‐2018 Target Net Interest Income Non‐Interest Income Net Interest Income +4% Non‐Interest Income +10% Long‐term Targets Compound Annual Growth Rates (2015‐2018) Revenue Mix 12

® Investor Day 2015 Growing our leadership role in loan syndications Source: Thompson Reuters; includes both left and right leads $1 $2 $4 $5 $6 $8 $10 12 18 39 56 68 87 107 $‐ $2 $4 $6 $8 $10 $12 0 25 50 75 100 125 150 D e a l V o l u m e ( $ i n B i l l i o n s ) D e a l C o u n t Lead Arranger Deal Volume Lead Arranger Deal Count Achieving a lead role materially expands the fee income from a relationship. Impact: Our average trailing annual revenue from left lead relationships is 2.6 times greater than our revenue from other shared national credits Our risk‐adjusted return on capital for left lead relationships is roughly twice the value for other shared national credits Loan Syndications 13

® Investor Day 2015 Corporate Banking Group targets Objectives 2016‐18 Target Key Initiatives Grow Loans 4% – 6% › Strategic adds to staff in Corporate Banking Grow Deposits 2% – 4% › Improved use of Customer Relationship Management tools Grow Non‐Interest Income 8% – 12% › New Capital Markets product capabilities Manage Profitability (RAROC) 15% – 18% › Data‐driven capital allocation approach › Develop new SNC relationships into full banking relationships Manage Client Satisfaction Top quartile scores › Continued recruitment, retention and development of top‐tier bankers Targets for loan growth, deposit growth and non‐interest income growth are annual, rather than cumulative, growth targets. 14

® Investor Day 2015 2016‐18 strategic priorities Recruit, retain, motivate, and coach bankers who will differentiate Regions by the quality of advice, guidance, and expertise they provide. Use data and analytics to allocate capital and other resources. Continue to develop a relationship‐ focused and needs‐based sales culture, executing on our model. Continue to build out product capabilities in Treasury Management and Capital Markets to drive non‐interest income growth. SM SM 15
® Investor Day 2015 ®

® Investor Day 2015 2015 Investor Day Risk Management & Credit Matt Lusco Barb Godin November 19, 2015 ®

® Investor Day 2015 Focus on the Customer Build the Best Team Manage Performance Strengthen Financial Performance Enhance Risk Management Our priorities 5 strategic priorities that provide direction for decisions 2
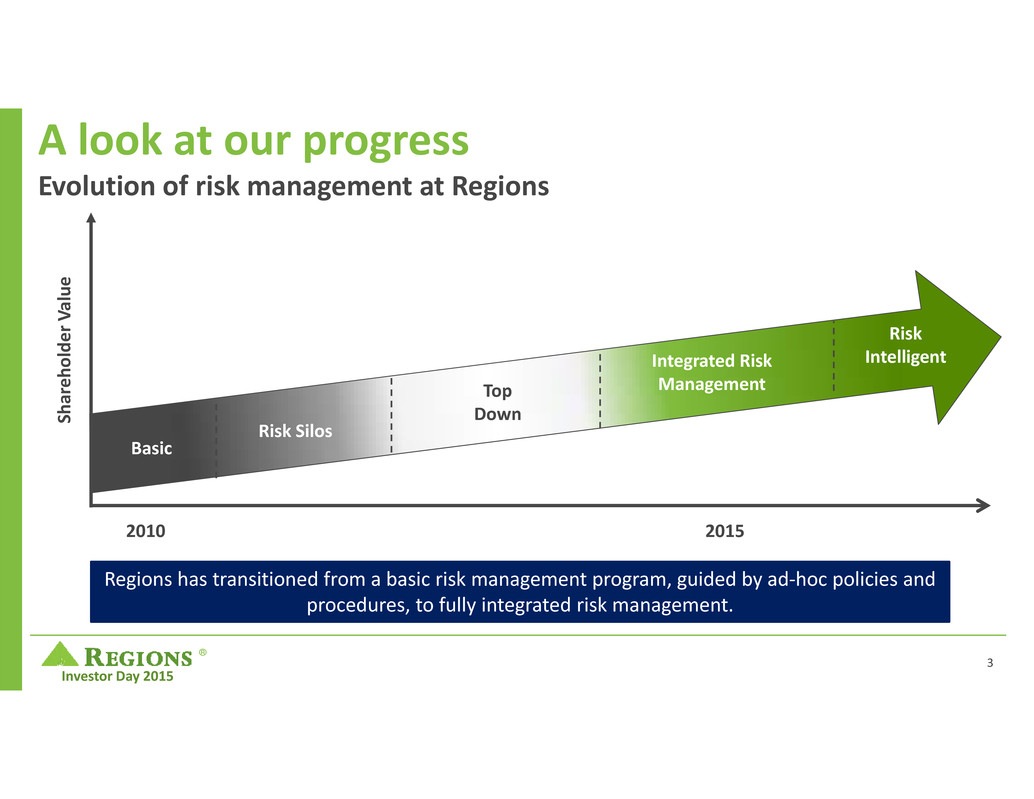
® Investor Day 2015 A look at our progress Evolution of risk management at Regions 2015 Basic Risk Silos Top Down Integrated Risk Management Risk Intelligent S h a r e h o l d e r V a l u e 2010 Regions has transitioned from a basic risk management program, guided by ad‐hoc policies and procedures, to fully integrated risk management. 3

® Investor Day 2015 Enhancing risk culture at Regions A strategic priority Regions is committed to continuous improvement and the sustainability of our mission. Continuing to enhance Regions’ risk culture Needs‐based selling Deepen existing relationships Ensure transparency and better credit performance Build the Best Bank Business Strategy Risk Appetite Financial Results Ensuring Regions’ business strategy is aligned with its appetite for risk SM 4

® Investor Day 2015 Risk Ownership & Awareness (ROA) Initiatives ROA Communications & Outreach Campaign Business Risk Committees Risk and Control Self‐Assessment (RCSA) Refresh IT Risk Framework Enhancements 5

® Investor Day 2015 Risk Management Framework Sound Risk Appetite Risk Appetite Understood across the Company Risk concentrations Risk reward evaluation Financial Strength Alignment with Strategy Overall Risk Capacity 6
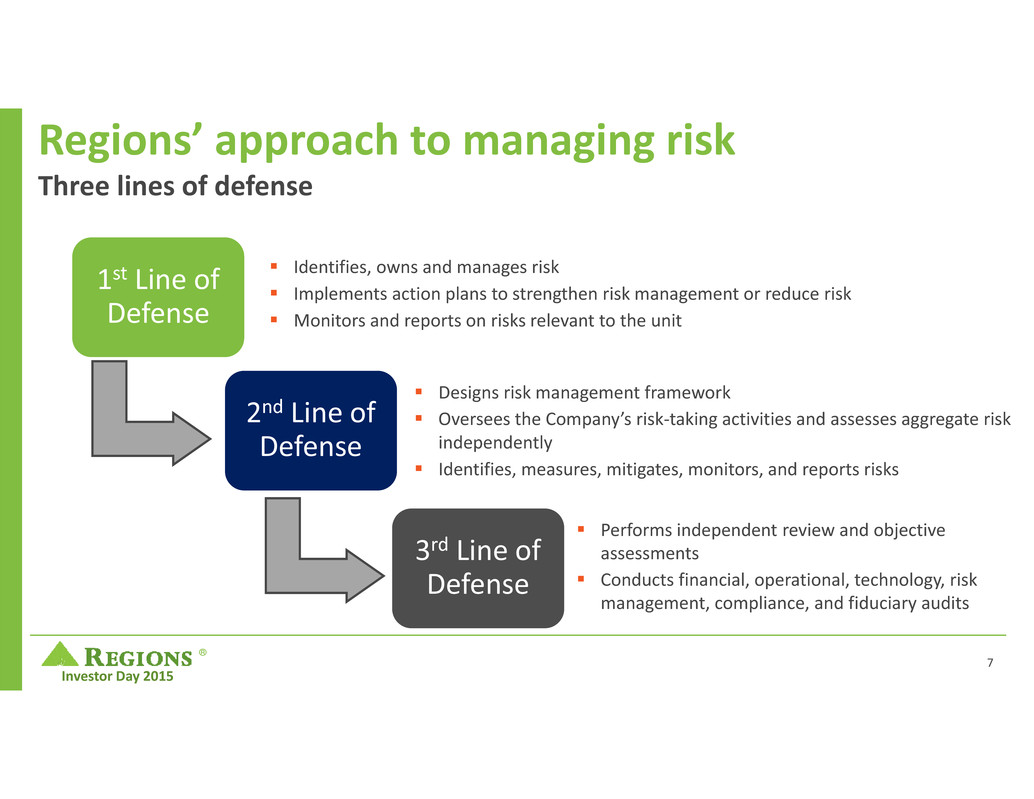
® Investor Day 2015 Regions’ approach to managing risk Three lines of defense 1st Line of Defense Identifies, owns and manages risk Implements action plans to strengthen risk management or reduce risk Monitors and reports on risks relevant to the unit 2nd Line of Defense 3rd Line of Defense Performs independent review and objective assessments Conducts financial, operational, technology, risk management, compliance, and fiduciary audits Designs risk management framework Oversees the Company’s risk‐taking activities and assesses aggregate risk independently Identifies, measures, mitigates, monitors, and reports risks 7

® Investor Day 2015 Regions’ approach to managing risk A sound risk management framework Committees & Working Groups Policies & Procedures Risk Reporting Responsible Risk GovernanceSustainable Risk Processes 8

® Investor Day 2015 From de‐risking to recovery 0.00% 0.50% 1.00% 1.50% 2.00% 2.50% 3.00% 3.50% 4.00% 4Q09 4Q10 4Q11 4Q12 4Q13* 4Q14 Net Charge‐Offs % of Loans 3Q15 9 *4Q13 included $151 million in Net Charge-Offs related to RFM TDR loan transfer to HFS, including these charges net charge-offs were 1.46%. Net Charge-Offs as presented excluding these charges would have been 0.67%.

® Investor Day 2015 Steady credit quality improvement $70,000 $75,000 $80,000 $85,000 $90,000 $95,000 $‐ $500 $1,000 $1,500 $2,000 $2,500 $3,000 $3,500 $4,000 4Q09 4Q10 4Q11 4Q12 4Q13 4Q14 Non‐performing Loans Total Loans Criticized and Total Loans ($ in millions) $70,000 $75,000 $80,000 $85,000 $90,000 $95,000 $2,000 $4,000 $6,000 $8,000 $10,000 $12,000 $14,000 $16,000 4Q09 4Q10 4Q11 4Q12 4Q13 4Q14 Criticized Loans Total Loans Non‐Performing and Total Loans ($ in millions) 3Q15 3Q15 10

® Investor Day 2015 5 pillars of credit culture Everybody Owns Credit Risk Committed to continuous improvement Asset Quality is Derived from People Quality Associates are accountable for decisions Diversification is key 11

® Investor Day 2015 Diversity in the loan portfolio Loan Balances at September 30, 2015 ($ in billions) Investor Real Estate, 8% Residential First Mortgage, 16% Indirect ‐ Vehicles, 5% Home Equity, 14% All Other Consumer, 3% All Other Commercial, 24% Energy*, 4% Commercial Real Estate Related, 8% Manufacturing, 5% Financial Services, 5% Healthcare, 5% Wholesale, 3% $81 B * Energy includes both direct and indirect exposure including any amounts from Investor Real Estate. Loan Balances at December 31, 2009 ($ in billions) Investor Real Estate, 24% Residential First Mortgage, 17% Indirect ‐ Vehicles, 3%Home Equity, 17% All Other Consumer, 1% All Other Commercial, 18% Energy*, 1% Commercial Real Estate Related, 5% Manufacturing, 4% Financial Services, 3% Healthcare, 4% Wholesale, 3% $91 B 12

® Investor Day 2015 Energy overview Majority of balances consist of approximately 40 Exploration & Production and less than 40 Oilfield Services (“OFS”) customers. Losses since 2008 are $11 million Only 4% or $3.3B of bank‐wide loan balances 78% of balances headquartered in four states TX – LA – MS – AL 78% 4% Energy E&P OFS $11 MM The company has been involved with energy lending for more than 40 years 40 Years 13
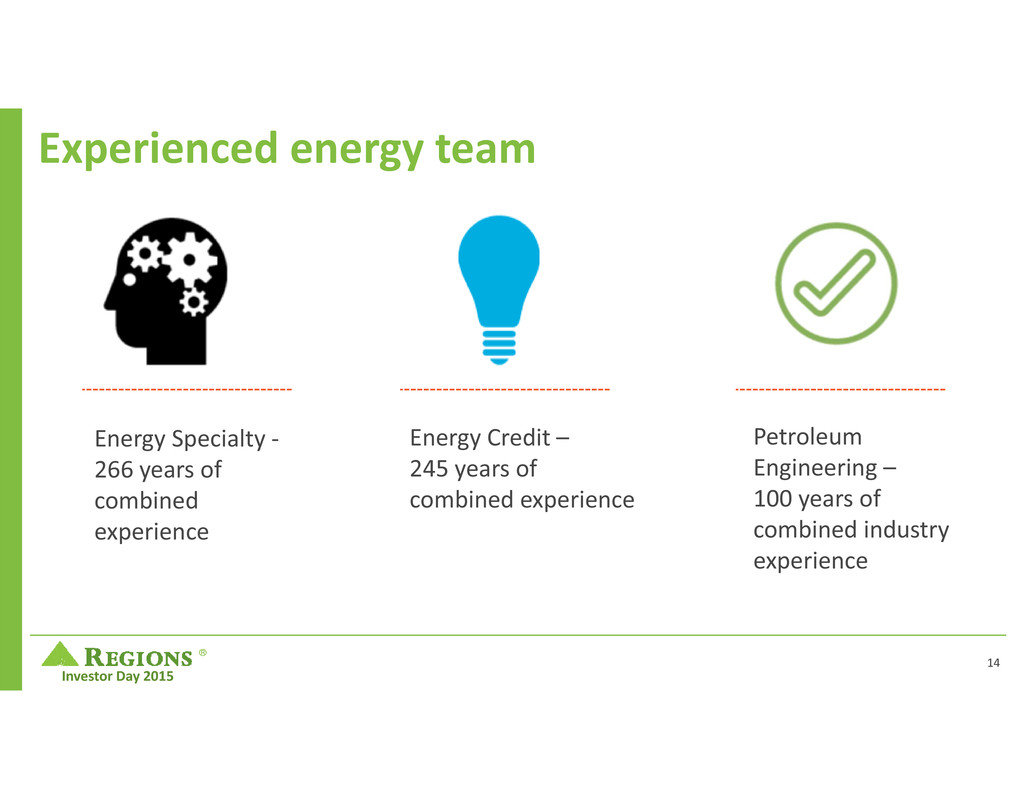
® Investor Day 2015 Experienced energy team Energy Credit – 245 years of combined experience Petroleum Engineering – 100 years of combined industry experience Energy Specialty ‐ 266 years of combined experience 14
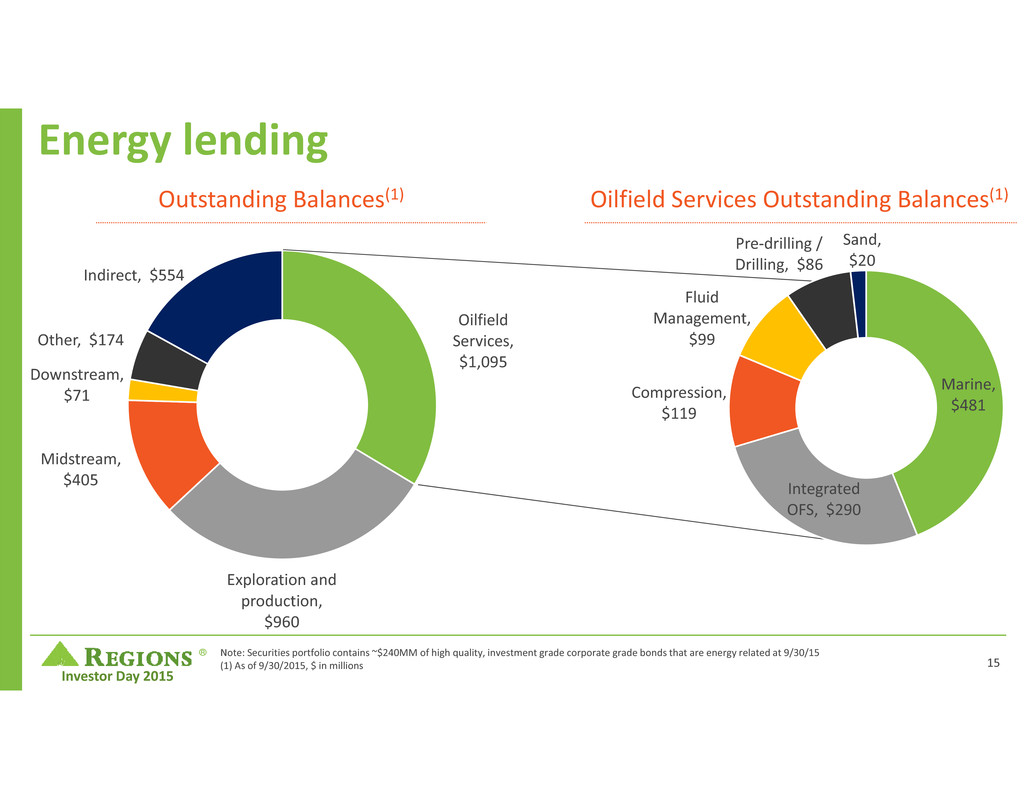
® Investor Day 2015 Oilfield Services, $1,095 Exploration and production, $960 Midstream, $405 Downstream, $71 Other, $174 Indirect, $554 Energy lending Note: Securities portfolio contains ~$240MM of high quality, investment grade corporate grade bonds that are energy related at 9/30/15 (1) As of 9/30/2015, $ in millions Outstanding Balances(1) Marine, $481 Integrated OFS, $290 Compression, $119 Fluid Management, $99 Pre‐drilling / Drilling, $86 Sand, $20 Oilfield Services Outstanding Balances(1) 15

® Investor Day 2015 Oil field services credit servicing Monthly review of all credits Swat Team review industry issues and tear sheets Renewals or new credits require CCO approval 16

® Investor Day 2015 E&P energy credit servicing The majority of E&P capital expenditures are discretionary This led to a 20‐40% reduction in lease operating expenses in this price down‐cycle Price Deck is redetermined quarterly, or more frequently as conditions dictate Regions Energy team re‐evaluates its portfolio monthly Upstream E&P clients are subject to mandatory semi‐annual borrowing base redetermination s 17

® Investor Day 2015 Credit quality outlook Long‐term 75‐100 bps Long‐term 120‐140 bps Long‐term 25‐35 bps 3Q15 Actual 30 bps Net charge‐offs Non‐performing loans Allowance to total loans 3Q15 Actual 97 bps 3Q15 Actual 138 bps 18

® Investor Day 2015 ®

® Investor Day 2015 2015 Investor Day Financial Overview David Turner November 19, 2015 ®

® Investor Day 2015 Focus on the Customer Build the Best Team Manage Performance Strengthen Financial Performance Enhance Risk Management Our Priorities 5 Strategic priorities that provide direction for decisions 2

® Investor Day 2015 Strategic initiatives – strengthen financial performance Effectively Deploy Capital Disciplined organic growth Return appropriate capital to shareholders Use strategic investments to leverage our infrastructure and enhance revenue diversification Disciplined Expense Management Generate positive operating leverage Continuously focus on efficiency and effectiveness Define, develop and execute Six Sigma initiatives Make prudent investments with appropriate returns Three pillars of execution Grow and Diversify Revenue Leverage SM to grow customers and households and deepen existing relationships Prudently grow non‐interest income Balance growth across geographies and businesses 3

® Investor Day 2015 Total Revenue 63% 37% Net Interest Income Non Interest Income Grow and Diversify Revenue Total Revenue(1) Mix – 2015 YTD $3.9B (1) Adjusted non‐GAAP; see appendix for reconciliation 4

® Investor Day 2015 Favorable asset sensitivity position Positioned to win in any rate environment Loan Mix(1) 59% 41% Variable Fixed (1) As of 3Q15 (2) See appendix for additional detail Naturally asset‐sensitive balance sheet Primarily core deposit funded 59% of loans have variable rates Asset sensitive under a range of deposit stress scenarios(2) Net interest income increases even in a flat rate environment, commensurate with loan growth 5

® Investor Day 2015 Unique deposit base Favorable projected deposit beta 57% 35% 8% Interest Bearing Checking, Money Market & Savings Non‐Interest Bearing Checking Time (1) Average balances as of 3Q15 (2) Betas measure deposit rate changes relative to market rate changes. Note: Peers include BBT, FITB, PNC, STI, WFC, ZION $97.2B 48% 50% 52% 54% 56% 58% 60% 62% 64% 66% RF Historical Peer #1 Peer #2 Peer #3 Peer #4 Peer #5 RF ‐ Base Case Peer #6 Deposit Mix(1) Historical Peer Betas(2) 2Q04 – 2Q07 Peer Average 6
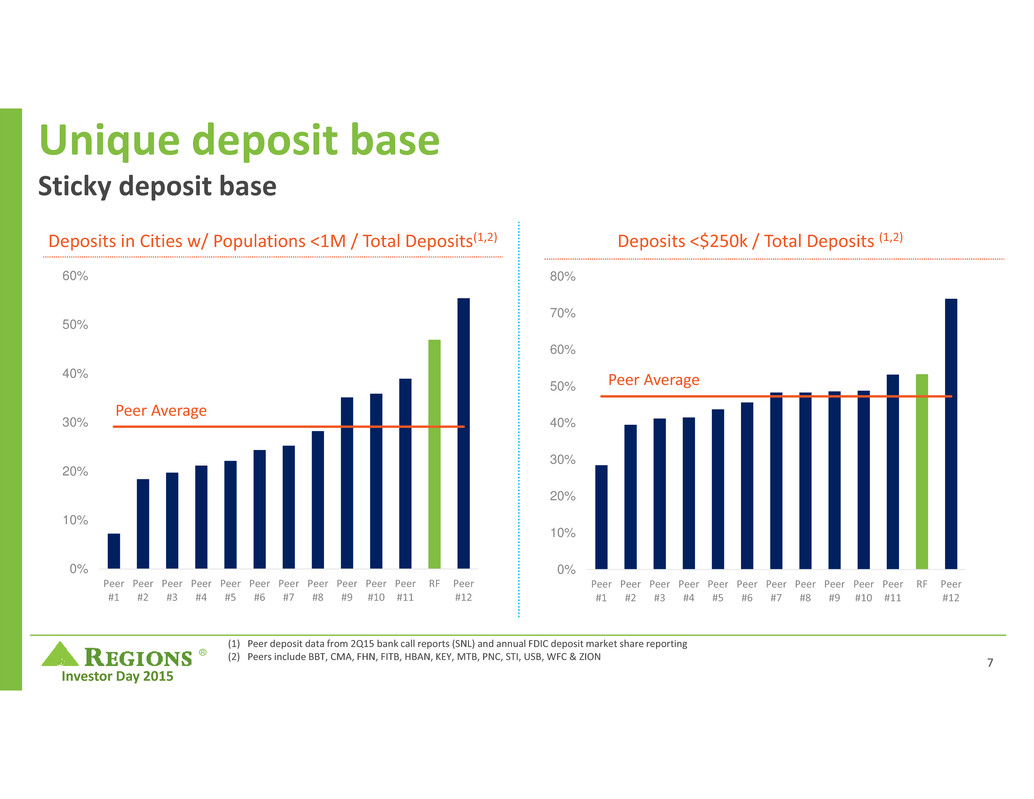
® Investor Day 2015 Unique deposit base Sticky deposit base 0% 10% 20% 30% 40% 50% 60% 70% 80% Peer #1 Peer #2 Peer #3 Peer #4 Peer #5 Peer #6 Peer #7 Peer #8 Peer #9 Peer #10 Peer #11 RF Peer #12 Deposits <$250k / Total Deposits (1,2) Peer Average 0% 10% 20% 30% 40% 50% 60% Peer #1 Peer #2 Peer #3 Peer #4 Peer #5 Peer #6 Peer #7 Peer #8 Peer #9 Peer #10 Peer #11 RF Peer #12 Deposits in Cities w/ Populations <1M / Total Deposits(1,2) Peer Average (1) Peer deposit data from 2Q15 bank call reports (SNL) and annual FDIC deposit market share reporting (2) Peers include BBT, CMA, FHN, FITB, HBAN, KEY, MTB, PNC, STI, USB, WFC & ZION 7

® Investor Day 2015 Non‐interest income 34% 21% 19% 9% 5% 12% Service charges Wealth Management Income Card and ATM fees Mortgage Income Capital Markets Other $1.4B Non‐Interest Income(1) Mix – 2015 YTD (1) Adjusted non‐GAAP; see appendix for reconciliation Grow and Diversify Revenue Summary of Non‐Interest Income Initiatives Year‐to‐date Growth in checking accounts and households Increased credit card penetration 110bps Expanded Capital Markets capabilities Expanded Treasury Management capabilities Acquired Insurance agencies Hired Financial Services Consultants 8
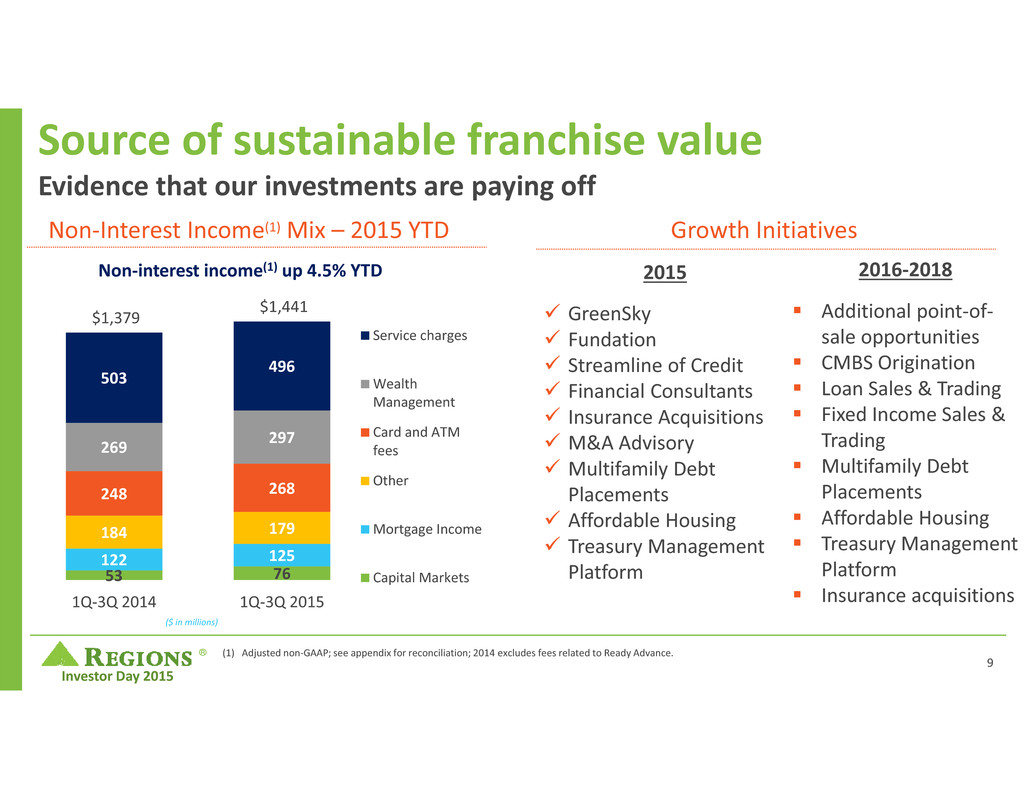
® Investor Day 2015 Source of sustainable franchise value Evidence that our investments are paying off Non‐Interest Income(1) Mix – 2015 YTD 2015 GreenSky Fundation Streamline of Credit Financial Consultants Insurance Acquisitions M&A Advisory Multifamily Debt Placements Affordable Housing Treasury Management Platform 2016‐2018 Additional point‐of‐ sale opportunities CMBS Origination Loan Sales & Trading Fixed Income Sales & Trading Multifamily Debt Placements Affordable Housing Treasury Management Platform Insurance acquisitions Growth Initiatives Non‐interest income(1) up 4.5% YTD 53 76 122 125 184 179 248 268 269 297 503 496 $1,379 $1,441 1Q‐3Q 2014 1Q‐3Q 2015 Service charges Wealth Management Card and ATM fees Other Mortgage Income Capital Markets ($ in millions) (1) Adjusted non‐GAAP; see appendix for reconciliation; 2014 excludes fees related to Ready Advance. 9

® Investor Day 2015 $3,666 $3,532 $3,471 $3,432 $3,358 $2,593 2010 2011 2012 2013 2014 2015 YTD Expenses (1) Adjusted non‐GAAP; see appendix for reconciliation Full Year Expenses(1) Disciplined Expense Management 54% 10% 9% 4% 3% 3% 3% 14% Salaries and Benefits Occupancy FF&E Outside Services Professional & Legal FDIC Marketing Other Total Expense(1) Mix ‐ 2015 YTD 10 ($ in millions)
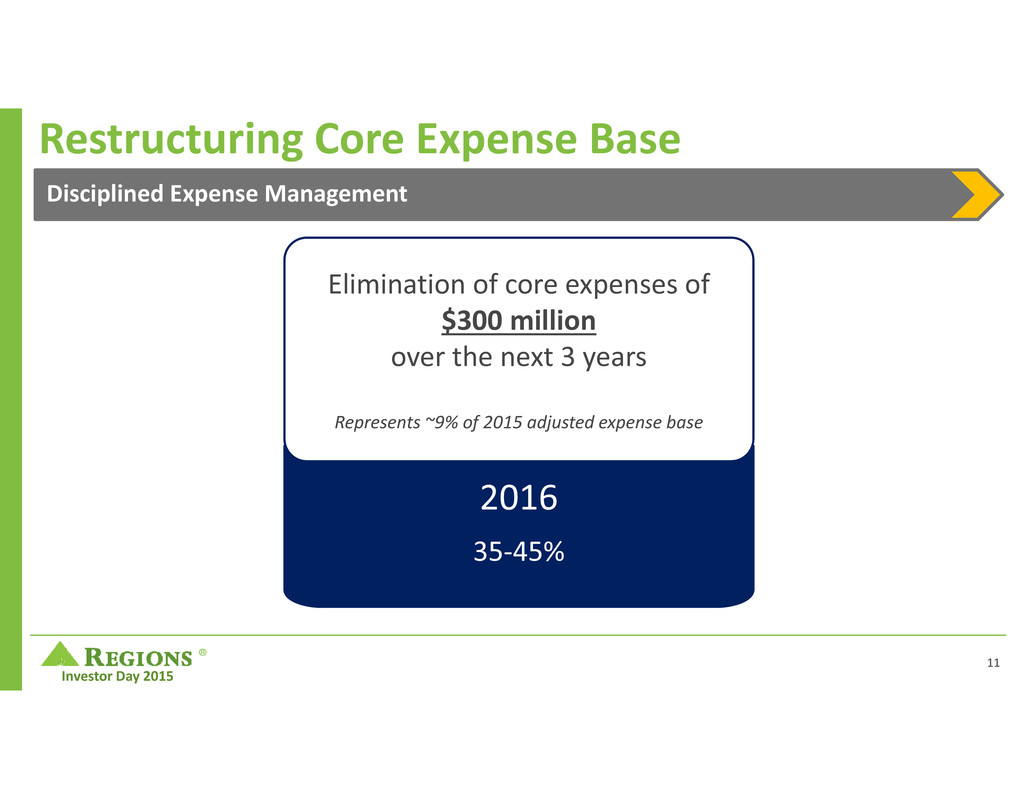
® Investor Day 2015 2016 35‐45% Elimination of core expenses of $300 million over the next 3 years Represents ~9% of 2015 adjusted expense base Restructuring Core Expense Base Disciplined Expense Management 11

® Investor Day 2015 Disciplined Expense Management Committed to improve efficiencies Hiring restrictions for non‐customer facing positions started Oct 2015 Streamlining and automating processes to reduce personnel needs Partially through staffing reductions and through attrition Evaluate staffing models, spans and layers throughout the Company Ensure incentives align to the execution of this plan Leverage technology to reduce dependency on labor 60‐65% Operational Efficiencies Branch reconfiguration and continued consolidations: 100‐150 branches Targeted reduction in total occupancy of 1 million square feet or ~10% 10 ‐ 15% Branch and Real Estate Optimization Reduce third‐party spend Curtail discretionary expenditures 25 ‐ 30% Third‐Party, Discretionary and Other 12

® Investor Day 2015 Strength of our capital position Industry leading common equity level 9.4% 9.6% 9.7% 10.0% 10.1% 10.1% 10.5% 10.6% 10.6% 10.7% 10.9% 11.0% 12.2% Peer #1 Peer #2 Peer #3 Peer #4 Peer #5 Peer #6 Peer #7 Peer #8 Peer #9 Peer #10 Peer #11 Regions Peer #12 Source: SNL Financial Peers include: BBT, CMA, FHN, FITB, HBAN, KEY, MTB, PNC, STI, USB, WFC & ZION Basel III Common equity Tier 1 – 3Q15 Long‐term Capital Target 8.5 ‐ 9.5% 13

® Investor Day 2015 Capital Priorities Effectively Deploy Capital Strategic InvestmentsDividends Share RepurchasesOrganic Growth 14
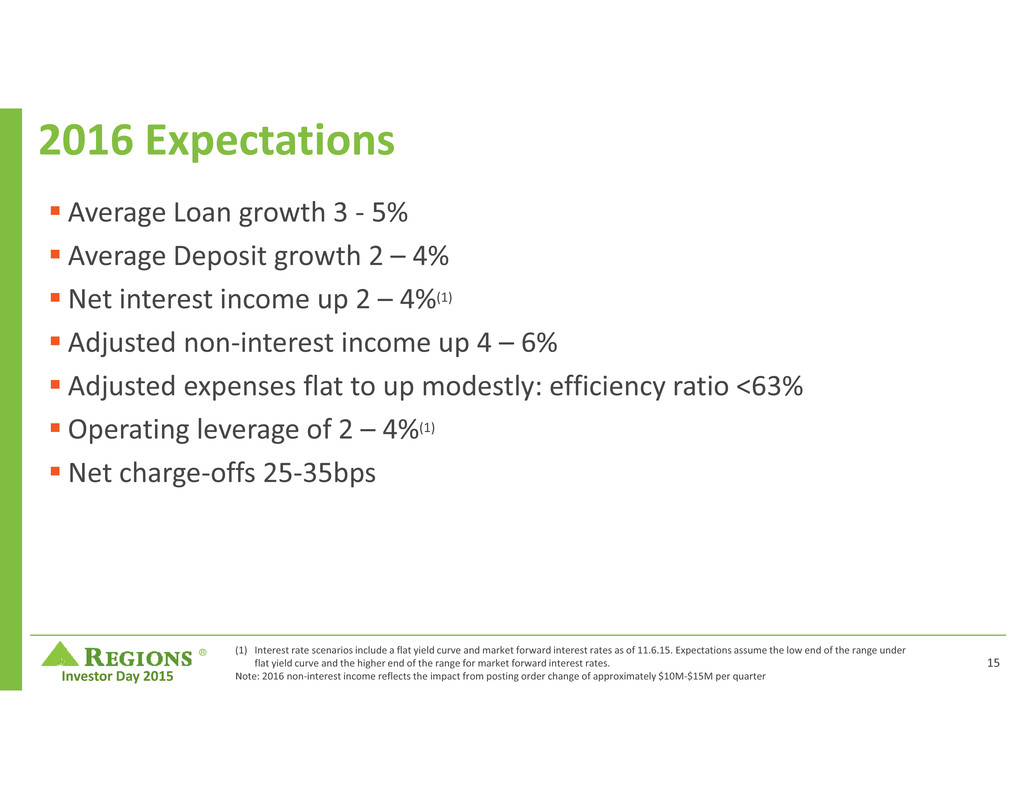
® Investor Day 2015 2016 Expectations Average Loan growth 3 ‐ 5% Average Deposit growth 2 – 4% Net interest income up 2 – 4%(1) Adjusted non‐interest income up 4 – 6% Adjusted expenses flat to up modestly: efficiency ratio <63% Operating leverage of 2 – 4%(1) Net charge‐offs 25‐35bps (1) Interest rate scenarios include a flat yield curve and market forward interest rates as of 11.6.15. Expectations assume the low end of the range under flat yield curve and the higher end of the range for market forward interest rates. Note: 2016 non‐interest income reflects the impact from posting order change of approximately $10M‐$15M per quarter 15

® Investor Day 2015 Why Regions? – Building sustainable franchise value Effectively Deploy Capital Grow and Diversify Revenue Disciplined Expense Management Adjusted EPS growth of 12‐15% (CAGR) Adjusted efficiency ratio of <60% Adjusted ROATCE 12‐14% Three pillars of execution Long‐term expected results How we will deliver Leverage our strengths Team Culture Execution Markets Investing in growth initiatives Expense eliminations Grow earnings Leverage capital Return capital 16

® Investor Day 2015 ®

® Investor Day 2015 Appendix
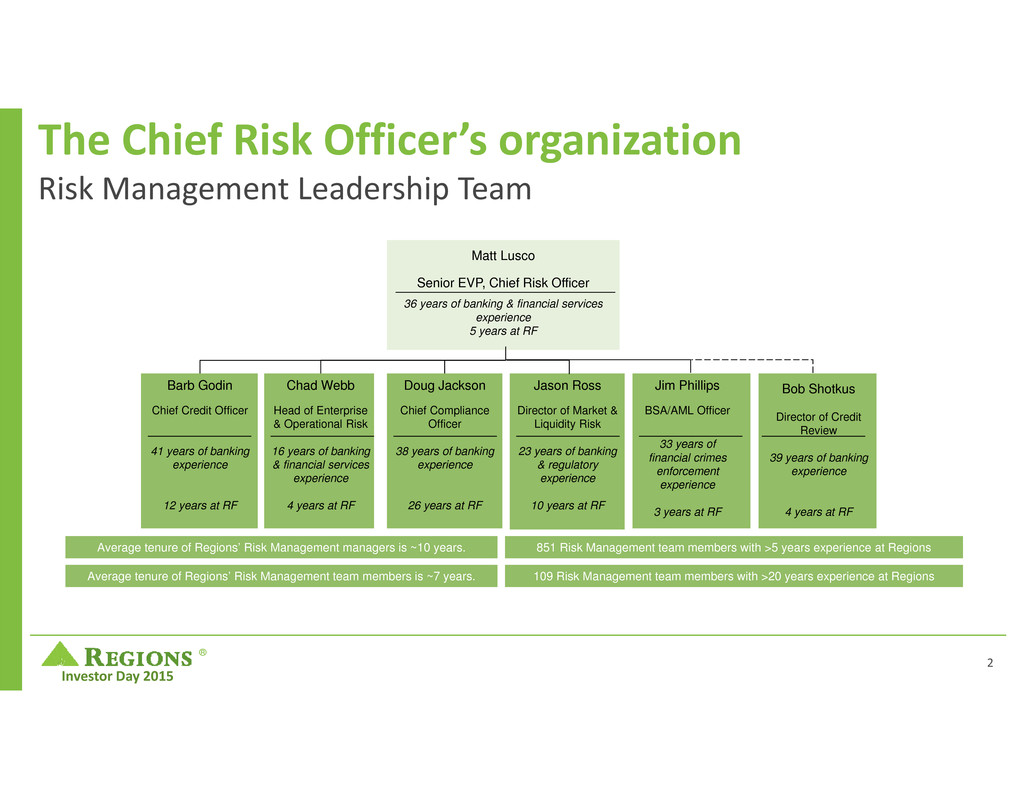
® Investor Day 2015 The Chief Risk Officer’s organization Risk Management Leadership Team Matt Lusco Senior EVP, Chief Risk Officer 36 years of banking & financial services experience 5 years at RF Chad Webb Head of Enterprise & Operational Risk 16 years of banking & financial services experience 4 years at RF Doug Jackson Chief Compliance Officer 38 years of banking experience 26 years at RF Jason Ross Director of Market & Liquidity Risk 23 years of banking & regulatory experience 10 years at RF Jim Phillips BSA/AML Officer 33 years of financial crimes enforcement experience 3 years at RF Bob Shotkus Director of Credit Review 39 years of banking experience 4 years at RF Barb Godin Chief Credit Officer 41 years of banking experience 12 years at RF Average tenure of Regions’ Risk Management managers is ~10 years. Average tenure of Regions’ Risk Management team members is ~7 years. 851 Risk Management team members with >5 years experience at Regions 109 Risk Management team members with >20 years experience at Regions 2
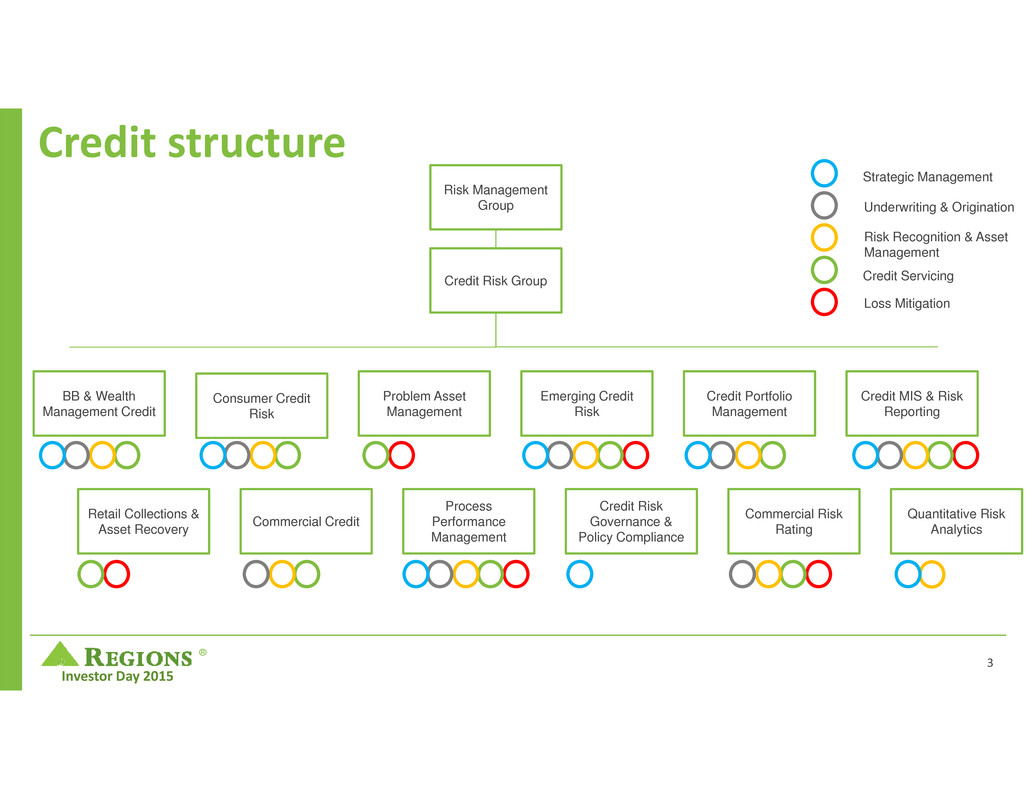
® Investor Day 2015 Credit structure Risk Management Group Credit Risk Group Consumer Credit Risk BB & Wealth Management Credit Problem Asset Management Emerging Credit Risk Credit Portfolio Management Credit MIS & Risk Reporting Commercial CreditRetail Collections & Asset Recovery Process Performance Management Credit Risk Governance & Policy Compliance Commercial Risk Rating Quantitative Risk Analytics Strategic Management Underwriting & Origination Risk Recognition & Asset Management Credit Servicing Loss Mitigation 3

® Investor Day 2015 Future Net Income of Total Proved Reserves Discounted Future Net Income of Total Proved Reserves at 9% Risk Adjusted Discounted Future Net Income of Total Proved Reserves Risk Adjusted Discounted Future Net Income of Total Proved Reserves After Advance Rate Total Lending Value Borrowing Base Conservative borrowing base methodology ‐ energy 53% Under the Base Case, the Total Lending Value will typically cover the determined Borrowing Base by ~1.5x Under the Sensitivity Case the Total Lending Value will typically cover the determined Borrowing Base by ~1.0x Base Sensitivity 100% 80% 4
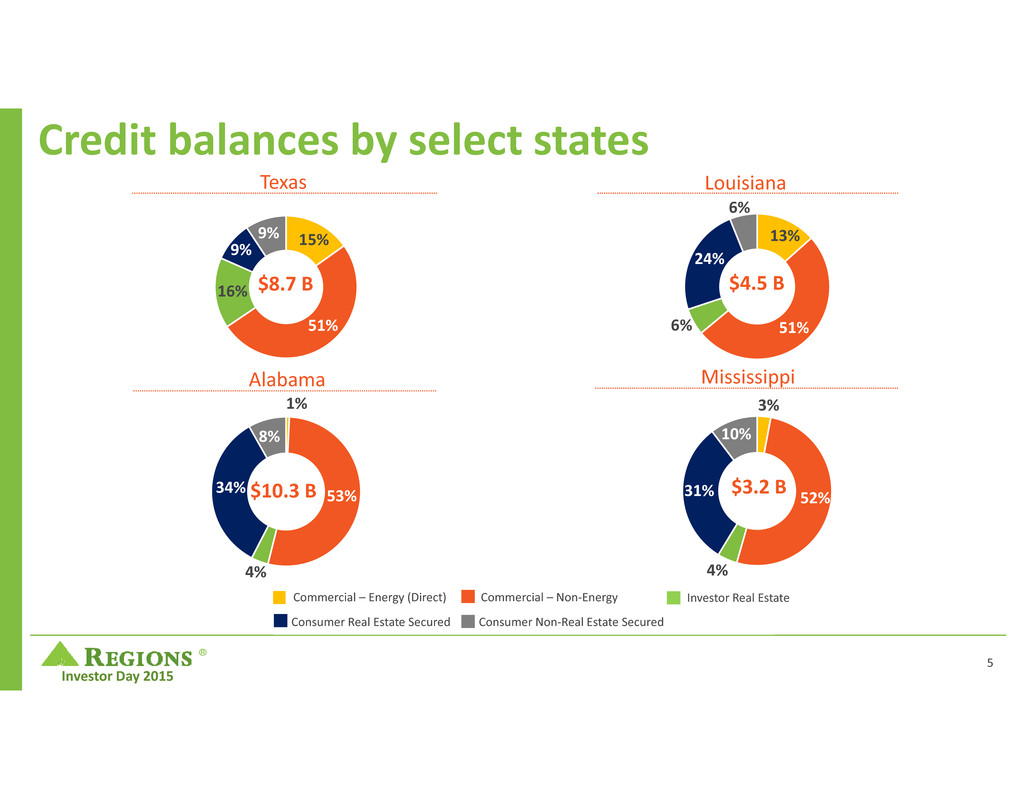
® Investor Day 2015 3% 52% 4% 31% 10% $3.2 B 15% 51% 16% 9% 9% $8.7 B 13% 51%6% 24% 6% $4.5 B Credit balances by select states 1% 53% 4% 34% 8% $10.3 B Alabama LouisianaTexas Mississippi Commercial – Energy (Direct) Consumer Real Estate Secured Commercial – Non‐Energy Consumer Non‐Real Estate Secured Investor Real Estate 5

® Investor Day 2015 Risk Management ‐ Investing in Success We have invested significantly in the following areas: Capital and Strategic Planning Enhanced loss forecasting and capital planning processes and the integration into business planning and strategy Investment in 2014 to build out enhanced governance and controls framework, operational loss modeling capabilities Model Risk Management & Validation Effective model development and implementation along with strong model validation practices Centralized Model Development team of 25; consists of 12 holding Ph.D. designation Model Validation team of 26; includes 14 holding Ph.D. designation Risk Management Systems and Infrastructure Fully Integrated Enterprise Risk Management Framework and Risk Appetite Framework Credit Portfolio Management & Enterprise Risk Analytics Reducing outsized concentrations; portfolio shaping strategies; risk/return analysis to maximize capital utilization and shareholder value 6

® Investor Day 2015 Additional Investments include: Risk Ownership & Awareness Investment in ROA and ongoing risk culture initiatives Enhanced and fully‐deployed Risk & Control Self Assessment (RCSA) program Compliance Management Program, including BSA/AML/OFAC Compliance & Operations Headcount growth of 160 positions in BSA/AML/OFAC Compliance & Operations and Compliance & Regulatory Risk Management Investment in third‐party resources to build out 2nd Line of Defense testing, Third‐Party Compliance, Privacy/UDAAP, and Enhanced Due Diligence compliance functions Cyber Security Investments in technology and governance strengthening cyber defense Team of 12 IT/Cyber security specialists within Risk Management and an investment in third‐party program evaluations and consultation Data Quality Enhanced data capture and data quality, with a focus on risk data Named Chief Data Officer Risk Management ‐ Investing in Success 7
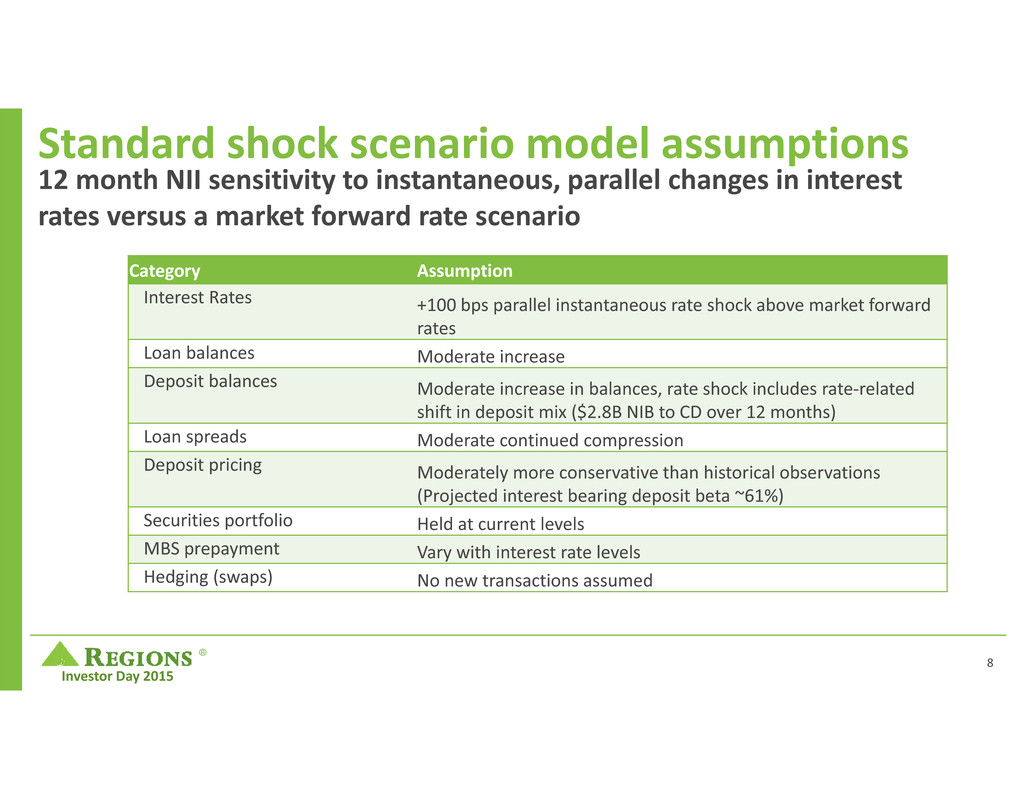
® Investor Day 2015 Standard shock scenario model assumptions 12 month NII sensitivity to instantaneous, parallel changes in interest rates versus a market forward rate scenario Category Assumption Interest Rates +100 bps parallel instantaneous rate shock above market forward rates Loan balances Moderate increase Deposit balances Moderate increase in balances, rate shock includes rate‐related shift in deposit mix ($2.8B NIB to CD over 12 months) Loan spreads Moderate continued compression Deposit pricing Moderately more conservative than historical observations (Projected interest bearing deposit beta ~61%) Securities portfolio Held at current levels MBS prepayment Vary with interest rate levels Hedging (swaps) No new transactions assumed 8

® Investor Day 2015 Asset sensitivity analysis(1) (1) As of 3Q15 (2) 12 month NII sensitivity to instantaneous, parallel changes in interest rates versus a market forward rate scenario. (3) Assumes reinvestment into wholesale funding $143 $67 ( $34 ) ( $20 ) ( $22 ) Standard Shock Scenario +100bps⁽²⁾ Increased Interest Bearing Deposit Beta (5%) Additional Decline in Deposit Balances ($3B)⁽³⁾ Additional Deposit Remixing ($3B, all‐in $6B) Adjusted Standard Shock Scenario 9

® Investor Day 2015 Securities Portfolio Gov't/ Agency, 87% IG Corporate Bonds, 7% Private AAA CMBS, 6% Securities Portfolio Mix Effective Duration 3.03 3.42 4.08 4.36 4.4 4.33 ‐50 Flat +100 +200 +300 +400 The securities portfolio is comprised of high quality assets that serve to provide adequate liquidity, preserve and protect capital, generate favorable returns, and manage interest rate risk exposure. Management has long been focused on maintaining a portfolio which performs well under a host of interest rate scenarios. Given favorable liquidity position of the organization, no wholesale changes are expected in the securities portfolio. Note: As of 3Q15 10

® Investor Day 2015 Solid liquidity and funding mix 70% 75% 80% 85% 90% 95% 0.0% 5.0% 10.0% 15.0% 20.0% L o a n s / D e p o s i t s Funded Debt / Avg. Earnings Assets Relatively low reliance on wholesale funding, driven by large, stable core deposit base Low loan to deposit ratio (83%) and low funded debt/earning assets (5.6%) which provides greater flexibility to fund future loan growth Well positioned to be LCR compliant in a cost effective manner Liquidity position vs. peers(1)(2) (1) Peer deposit data from 3Q15 SNL and earnings supplements (2) Peers include BBT, CMA, FHN, FITB, HBAN, KEY, MTB, PNC, STI, USB, WFC & ZION 11
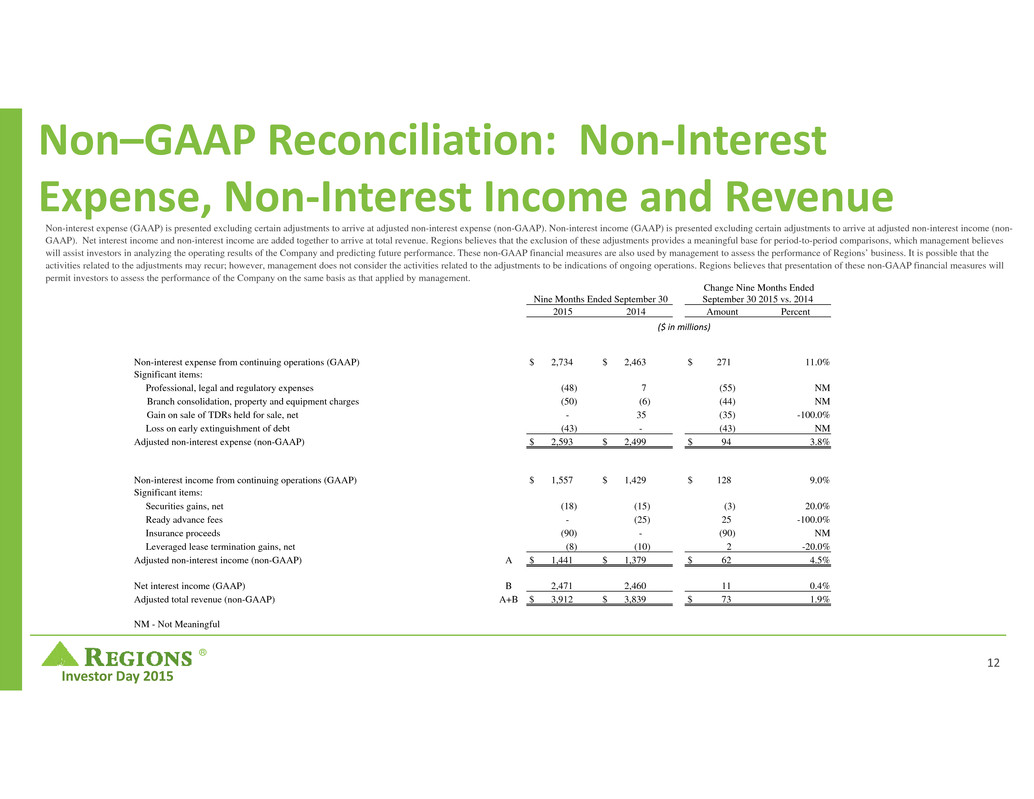
® Investor Day 2015 Non–GAAP Reconciliation: Non‐Interest Expense, Non‐Interest Income and Revenue Non-interest expense (GAAP) is presented excluding certain adjustments to arrive at adjusted non-interest expense (non-GAAP). Non-interest income (GAAP) is presented excluding certain adjustments to arrive at adjusted non-interest income (non- GAAP). Net interest income and non-interest income are added together to arrive at total revenue. Regions believes that the exclusion of these adjustments provides a meaningful base for period-to-period comparisons, which management believes will assist investors in analyzing the operating results of the Company and predicting future performance. These non-GAAP financial measures are also used by management to assess the performance of Regions’ business. It is possible that the activities related to the adjustments may recur; however, management does not consider the activities related to the adjustments to be indications of ongoing operations. Regions believes that presentation of these non-GAAP financial measures will permit investors to assess the performance of the Company on the same basis as that applied by management. Nine Months Ended September 30 Change Nine Months Ended September 30 2015 vs. 2014 2015 2014 Amount Percent Non-interest expense from continuing operations (GAAP) $ 2,734 $ 2,463 $ 271 11.0% Significant items: Professional, legal and regulatory expenses (48) 7 (55) NM Branch consolidation, property and equipment charges (50) (6) (44) NM Gain on sale of TDRs held for sale, net - 35 (35) -100.0% Loss on early extinguishment of debt (43) - (43) NM Adjusted non-interest expense (non-GAAP) $ 2,593 $ 2,499 $ 94 3.8% Non-interest income from continuing operations (GAAP) $ 1,557 $ 1,429 $ 128 9.0% Significant items: Securities gains, net (18) (15) (3) 20.0% Ready advance fees - (25) 25 -100.0% Insurance proceeds (90) - (90) NM Leveraged lease termination gains, net (8) (10) 2 -20.0% Adjusted non-interest income (non-GAAP) A $ 1,441 $ 1,379 $ 62 4.5% Net interest income (GAAP) B 2,471 2,460 11 0.4% Adjusted total revenue (non-GAAP) A+B $ 3,912 $ 3,839 $ 73 1.9% NM - Not Meaningful 12 ($ in millions)

® Investor Day 2015 Non–GAAP Reconciliation: Non‐Interest Expense Non-interest expense (GAAP) is presented excluding certain adjustments to arrive at adjusted non-interest expense (non-GAAP). Regions believes that the exclusion of these adjustments provides a meaningful base for period-to-period comparisons, which management believes will assist investors in analyzing the operating results of the Company and predicting future performance. These non-GAAP financial measures are also used by management to assess the performance of Regions’ business. It is possible that the activities related to the adjustments may recur; however, management does not consider the activities related to the adjustments to be indications of ongoing operations. Regions believes that presentation of these non-GAAP financial measures will permit investors to assess the performance of the Company on the same basis as that applied by management Nine Months Ended Year Ended December 31 Sept 30 2010 2011 2012 2013 2014 2015 Non-interest expense from continuing operations (GAAP) $ 3,859 $ 3,862 $ 3,526 $ 3,556 $ 3,432 $ 2,734 Significant items: Professional, legal and regulatory expenses (75) - - (58) (93) (48) Branch consolidation, property and equipment charges (8) (75) - (5) (16) (50) Gain on sale of TDRs held for sale, net - - - - 35 - Loss on early extinguishment of debt (108) - (11) (61) - (43) Goodwill impairment - (253) - - - - Securities impairment, net (2) (2) (2) - - - REIT investment early termination costs - - (42) - - - Adjusted non-interest expense (non-GAAP) $ 3,666 $ 3,532 $ 3,471 $ 3,432 $ 3,358 $ 2,593 13 ($ in millions)
Serious News for Serious Traders! Try StreetInsider.com Premium Free!
You May Also Be Interested In
- Regions Financial (RF) PT Lowered to $20 at Truist Securities
- Ur-Energy Provides 2024 Q1 Operations and 2024 Production Guidance Updates
- AERWINS Technologies Announces Additional Staff Determination
Create E-mail Alert Related Categories
SEC FilingsSign up for StreetInsider Free!
Receive full access to all new and archived articles, unlimited portfolio tracking, e-mail alerts, custom newswires and RSS feeds - and more!


 Tweet
Tweet Share
Share