

Form 8-K BALTIMORE GAS & ELECTRIC For: Nov 09 Filed by: EXELON GENERATION CO LLC
 Tweet
Tweet Share
Share
UNITED STATES
SECURITIES AND EXCHANGE COMMISSION
Washington, DC 20549
FORM 8-K
CURRENT REPORT
Pursuant to Section 13 or 15(d)
of the Securities Exchange Act of 1934
November 9, 2015
Date of Report (Date of earliest event reported)
| Commission File Number |
Exact Name of Registrant as Specified in Its Charter; State of Incorporation; Address of Principal Executive Offices; and Telephone Number |
IRS Employer | ||
| 1-16169 |
EXELON CORPORATION (a Pennsylvania corporation) 10 South Dearborn Street P.O. Box 805379 Chicago, Illinois 60680-5379 (800) 483-3220 |
23-2990190 | ||
| 333-85496 |
EXELON GENERATION COMPANY, LLC (a Pennsylvania limited liability company) 300 Exelon Way Kennett Square, Pennsylvania 19348-2473 (610) 765-5959 |
23-3064219 | ||
| 1-1839 |
COMMONWEALTH EDISON COMPANY (an Illinois corporation) 440 South LaSalle Street Chicago, Illinois 60605-1028 (312) 394-4321 |
36-0938600 | ||
| 000-16844 |
PECO ENERGY COMPANY (a Pennsylvania corporation) P.O. Box 8699 2301 Market Street Philadelphia, Pennsylvania 19101-8699 (215) 841-4000 |
23-0970240 | ||
| 1-1910 |
BALTIMORE GAS AND ELECTRIC COMPANY (a Maryland corporation) 2 Center Plaza 110 West Fayette Street Baltimore, Maryland 21201 (410) 234-5000 |
52-0280210 | ||
Check the appropriate box below if the Form 8-K filing is intended to simultaneously satisfy the filing obligation of the registrant under any of the following provisions:
| ¨ | Written communications pursuant to Rule 425 under the Securities Act (17 CFR 230.425) |
| ¨ | Soliciting material pursuant to Rule 14a-12 under the Exchange Act (17 CFR 240.14a-12) |
| ¨ | Pre-commencement communications pursuant to Rule 14d-2(b) under the Exchange Act (17 CFR 240.14d-2(b)) |
| ¨ | Pre-commencement communications pursuant to Rule 13e-4(c) under the Exchange Act (17 CFR 240.13e-4(c)) |
Section 7 – Regulation FD
Item 7.01. Regulation FD Disclosure.
On November 8-11, 2015, Exelon Corporation (Exelon) will participate in the Edison Electric Institute Financial Conference. Attached as Exhibit 99.1 to this Current Report on Form 8-K are the presentation slides and handouts to be used at the conference.
Section 9 – Financial Statements and Exhibits
Item 9.01. Financial Statements and Exhibits.
| (d) | Exhibits. |
| Exhibit |
Description | |
| 99.1 | Presentation slides and handouts | |
* * * * *
This combined Form 8-K is being furnished separately by Exelon, Exelon Generation Company, LLC, Commonwealth Edison Company, PECO Energy Company, and Baltimore Gas and Electric Company (Registrants). Information contained herein relating to any individual Registrant has been furnished by such Registrant on its own behalf. No Registrant makes any representation as to information relating to any other Registrant.
This Current Report includes forward-looking statements within the meaning of the Private Securities Litigation Reform Act of 1995 that are subject to risks and uncertainties. The factors that could cause actual results to differ materially from these forward-looking statements include those discussed herein as well as those discussed in (1) Exelon’s 2014 Annual Report on Form 10-K in (a) ITEM 1A. Risk Factors, (b) ITEM 7. Management’s Discussion and Analysis of Financial Condition and Results of Operations and (c) ITEM 8. Financial Statements and Supplementary Data: Note 22; (2) Exelon’s Third Quarter 2015 Quarterly Report on Form 10-Q in (a) Part II, Other Information, ITEM 1A. Risk Factors; (b) Part 1, Financial Information, ITEM 2. Management’s Discussion and Analysis of Financial Condition and Results of Operations and (c) Part I, Financial Information, ITEM 1. Financial Statements: Note 19; and (3) other factors discussed in filings with the Securities and Exchange Commission by the Registrants. Readers are cautioned not to place undue reliance on these forward-looking statements, which apply only as of the date of this Current Report. None of the Registrants undertakes any obligation to publicly release any revision to its forward-looking statements to reflect events or circumstances after the date of this Current Report.
SIGNATURES
Pursuant to the requirements of the Securities Exchange Act of 1934, each Registrant has duly caused this report to be signed on its behalf by the undersigned hereunto duly authorized.
| EXELON CORPORATION |
| /s/ Jonathan W. Thayer |
| Jonathan W. Thayer |
| Senior Executive Vice President and Chief Financial Officer |
| Exelon Corporation |
| EXELON GENERATION COMPANY, LLC |
| /s/ Bryan P. Wright |
| Bryan P. Wright |
| Senior Vice President and Chief Financial Officer Exelon Generation Company, LLC |
| COMMONWEALTH EDISON COMPANY |
| /s/ Joseph R. Trpik, Jr. |
| Joseph R. Trpik, Jr. |
| Senior Vice President, Chief Financial Officer and Treasurer |
| Commonwealth Edison Company |
| PECO ENERGY COMPANY |
| /s/ Phillip S. Barnett |
| Phillip S. Barnett |
| Senior Vice President, Chief Financial Officer and |
| Treasurer |
| PECO Energy Company |
| BALTIMORE GAS AND ELECTRIC COMPANY |
| /s/ David M. Vahos |
| David M. Vahos |
| Vice President, Chief Financial Officer and Treasurer |
| Baltimore Gas and Electric Company |
November 9, 2015
EXHIBIT INDEX
| Exhibit |
Description | |
| 99.1 | Presentation slides and handouts | |
 Edison Electric Institute Financial Conference November 8–11, 2015 Exhibit 99.1 |
 1 2015 EEI Financial Conference Cautionary Statements Regarding Forward-Looking Information
This presentation contains certain forward-looking statements
within the meaning of the Private Securities
Litigation Reform Act of 1995, that are subject to risks and uncertainties. The factors that could cause actual results to differ materially from the
forward-looking statements made by Exelon Corporation,
Commonwealth Edison Company, PECO Energy Company,
Baltimore Gas and Electric Company and Exelon
Generation Company, LLC (Registrants) include those factors
discussed herein, as well as the items discussed
in (1) Exelon’s 2014 Annual Report on Form 10-K in (a) ITEM 1A. Risk Factors, (b) ITEM 7. Management’s Discussion and Analysis of Financial
Condition and Results of Operations and (c) ITEM 8. Financial
Statements and Supplementary Data: Note 22; (2)
Exelon’s Third Quarter 2015 Quarterly Report on
Form 10-Q in (a) Part II, Other Information, ITEM 1A. Risk
Factors; (b) Part 1, Financial Information, ITEM
2. Management’s Discussion and Analysis of Financial Condition and Results of Operations and (c) Part I, Financial Information, ITEM 1. Financial
Statements: Note 19; and (3) other factors discussed in filings
with the SEC by the Registrants. Readers are
cautioned not to place undue reliance on these forward- looking statements, which apply only as of the date of this presentation. None of the
Registrants undertakes any obligation to publicly release any
revision to its forward- looking statements to
reflect events or circumstances after the date of this presentation. |
 2 2015 EEI Financial Conference 2015: An Exceptional Year of Performance Our utilities are performing at their best levels, our generation business is world class and our
Constellation
business
maximizes
its
value.
We
will
deliver
earnings
between
$2.40
-
$2.60
(1)
per share.
• On track to invest $3.7 billion this year to
make the grid smarter, more reliable, and more resilient
• Exceeding $1 billion in net income this year at Exelon Utilities
• Constructive regulatory environments across our jurisdictions
–
PECO rate case settlement
–
ComEd formula rate
–
Recent BGE unanimous rate case settlement
• Industry leading operational excellence – 1 st Quartile SAIFI performance – 1 st Quartile CAIDI performance at ComEd and PECO, 2 nd Quartile at BGE – 1 st Quartile Customer Satisfaction – Top Decile Gas Odor Response • Successful generation to load matching strategy
is protecting earnings •
Active role in policy development to deliver Capacity
Performance construct •
#1
Provider
of
retail
electricity,
serving
34
TWhs
more
than
our
nearest
competitor
• Top 10 marketer of natural gas • World Class Operator – 2015 Nuclear capacity factor through 3Q: 93.8% – 2015 Power dispatch match through 3Q: 98.7% – 2015 Renewables energy capture 3Q: 95.6% (1) Represents adjusted (non-GAAP) operating earnings. Refer to slide 31 for a list of adjustments from GAAP EPS to
adjusted (non-GAAP) operating earnings |
 3 2015 EEI Financial Conference Looking Ahead • The Exelon Strategy • Addressing Key Immediate Issues 1) Capital Allocation 2) Pepco Holdings Acquisition 3) Extending Clinton One Year 4) Cost Management Initiative • The Foundation for Exelon’s Growth |
 The Exelon Strategy |
 5 2015 EEI Financial Conference Our Key Objectives Employ our integrated model to deliver stable
growth, sustainable earnings and an attractive dividend • Stable Growth – Grow our regulated and contracted businesses and optimize our existing generation portfolio • Sustainable Earnings – Utilities, contracted assets, and balanced generation to load strategy profits are an engine for predictable earnings
and our generation business positions us to capture market
upside •
Attractive Dividend
–
Dividend will be covered by the utilities, insulated
from the earnings volatility of the generation
business |
 6 2015 EEI Financial Conference How We Will Meet Our Objectives We will produce stable earnings growth of 3-5% per year
from 2015 to 2018 (1)
• Investing more than $18 billion in Exelon’s current utilities through 2020 to modernize the grid and
better serve our customers ($11 billion from
2016-2018) We will sustain earnings growth while also preserving the benefit of market upside
through:
• Ensuring operating excellence across every business • Shifting our earnings mix to be more regulated through investments in Exelon’s utilities and the
acquisition of Pepco Holdings (Expect earnings to be ~60%
regulated in 2018) •
Effectively managing our costs
• Growing the amount of contracted assets in our Exelon Generation portfolio
• Maximizing the value of our generation fleet and customer base through our proven generation to
load matching strategy
• Hedging our generation in a manner that preserves upside from our fundamental price view
We will continue to deliver an attractive dividend of $1.24 per share (2) • Targeting dividend funding entirely from regulated utilities
• Our business mix protects our dividend regardless of changing phases of the commodities cycle
(1)
Growth target is a net income compounded annual growth rate
(CAGR), assumes September 30, 2015 market prices, and does not include our fundamental market view of prices (2) Dividends are subject to declaration by the Exelon Board of Directors |
 7 2015 EEI Financial Conference We Are Well Down the Path of Delivering on Our Key Objectives
2011
(Pre-CEG Merger)
• 25,544 MW (Total Capacity) • 67% Nuclear • 151 TWh Generation • 5.4M Electric Customers • 0.5M Gas Customers • $791M Net Income (1) • $13B Rate Base • 6,054 Miles of Transmission Lines 2011 Earnings (1) • 29% Utilities • 71% Generation World Class Generator Top Performing Utilities Preeminent Competitive Energy Company Transforming the Business Mix 2014 (Post-CEG Merger) • 32,753 MW (Total Capacity) • 59% Nuclear (3) • 205 TWh Generation • 6.7M Electric Customers • 1.2M Gas Customers • $962M Net Income (1) • $20B Rate Base • 7,435 Miles of Transmission Lines 2014 Earnings (1) • 47% Utilities • 53% Generation 2018 (Post-PHI Merger) • 34,800 MW (Total Capacity) • 56% Nuclear (3) • 206 TWh Generation • 8.6M Electric Customers • 1.3M Gas Customers • $1.5B-1.7B Net Income (1,2) • $38B Rate Base • ~12,000 Miles of Transmission Lines • 48 States, DC, & Canada • ~210 TWh/yr • 6-8 Bcf of Gas 2018 Earnings (1,4) • ~60% Utilities • ~40% Generation (1) Represents adjusted (non-GAAP) operating earnings. Refer to slide 31 for a list of adjustments from GAAP EPS to adjusted (non-GAAP) operating earnings.
(2)
Includes after-tax interest expense of (~$150M) for debt
held at Corporate related to utility investment
(3)
Includes CENG at ownership; does not assume put
exercised (4)
Based on September 30, 2015 market prices
• 4 States • ~59 TWh/yr • <1 Bcf of Gas per day • 48 States, DC & Canada • ~155 TWh/yr • 4-6 Bcf of Gas per day |
 Addressing Key Immediate Issues 1) Capital Allocation 2) Pepco Holdings Acquisition 3) Extending Clinton One Year 4) Cost Management Initiative |
 Capital Allocation |
 10 2015 EEI Financial Conference Delivering Value to Shareholders Through a Principled Capital
Allocation Policy
• Every capital decision is made to maximize value to our customers and shareholders • We are harvesting free cash flow from Exelon Generation to:
–
First, invest in utilities where we can earn an appropriate return,
–
Invest in contracted assets where we can meet return thresholds, and/or
–
Return capital to shareholders by retiring debt, repurchasing our shares, or increasing our dividend if required investment returns are not met
• We are committed to maintaining an attractive dividend • Our strong balance sheet underpins our capital allocation policy |
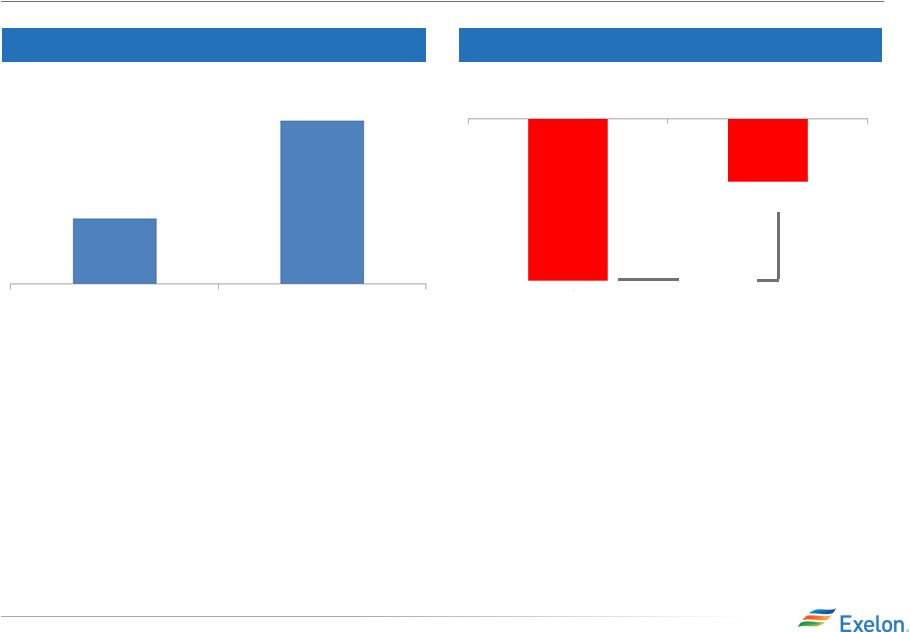
 11 2015 EEI Financial Conference Redeploying Exelon Generation’s Free Cash Flow to Maximize Shareholder
Value
2016-2018 Exelon Generation Free Cash Flow
(1,2,3)
and Planned Growth Investment ($M)
~$2,700
~$4,150
Committed Contracted
Generation Growth CapEx
Available for Investing in
Utilities, Contracted Assets
or Returning Capital to
Shareholders
($750)
Committed Non-Contracted
Generation Growth CapEx
($700)
Cumulative ExGen
FCF 2016-18
If investments do not meet our thresholds, we will return
capital to shareholders (1) Free Cash Flow = Adjusted Cash Flow from Operations less Base CapEx and Nuclear Fuel. Free Cash Flow is midpoint of
a range based on September 30, 2015 market prices. Adjusted Cash Flow From Operations (non-GAAP) primarily includes net cash flows from operating activities and net cash flows
from investing activities excluding capital expenditures. Reconciliation of Free Cash Flow to GAAP can be found on slide 32. (2)
Does not include an extension of bonus depreciation. A two
year extension of bonus depreciation would add ~$200 million of Free Cash Flow
(3) Does not include impacts of PHI, which would decrease Free Cash Flow by (~$100M)
|
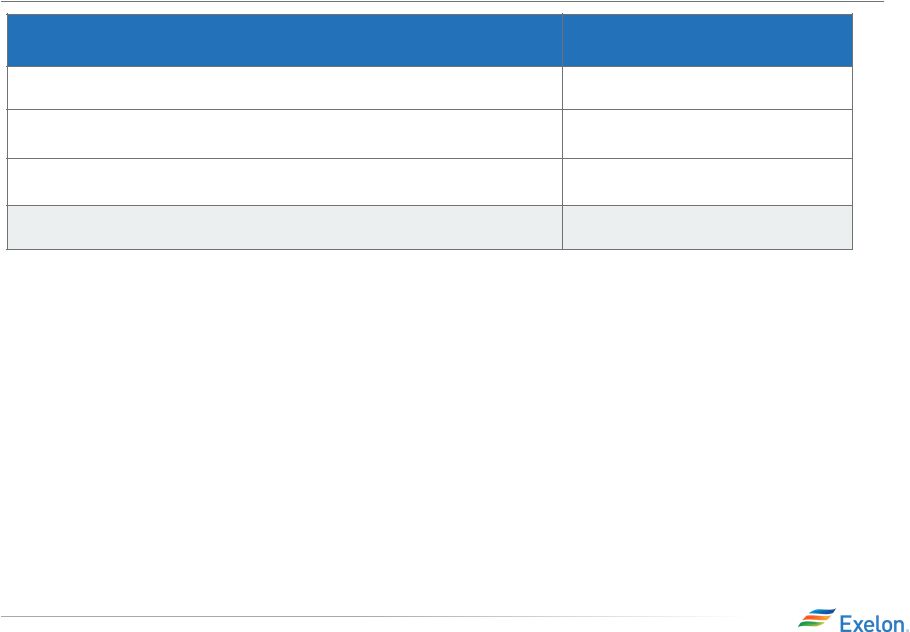
 12 2015 EEI Financial Conference Capital Allocation — Disciplined Commitment to Growth We will prioritize investment in assets that minimize earnings volatility and support
stable earnings growth
Note: Including PHI would increase combined rate base by
$10 billion in 2018; Exelon Utilities 2016-2018 capital investment is $11 billion for existing Exelon utilities ($15 billion including PHI); Exelon Generation 2016-2018 investment opportunities total $1.6
billion No incremental equity issuance needed to
fund investment Exelon Utilities
Exelon Generation
• Investing in utility infrastructure to benefit our customers by making the grid smarter, more reliable, and more resilient - $18 billion from 2016 to 2020 (existing Exelon Utilities) - $25 billion from 2016 to 2020 (including PHI) • Targeting long-term ROE of 10% • Growing existing rate base from $22 billion in 2015 to $28 billion in 2018 • Earnings CAGR of 7-9% from 2015-2018 • Going forward, we will invest in assets with contracted cash flows - We are reviewing development opportunities that may result in investment of $2.8 billion from 2016 through 2020 - Approximately half of any growth investment will be funded through structured financing • Projects must earn attractive return ( 10% ROE) |
 Pepco Holdings Acquisition |
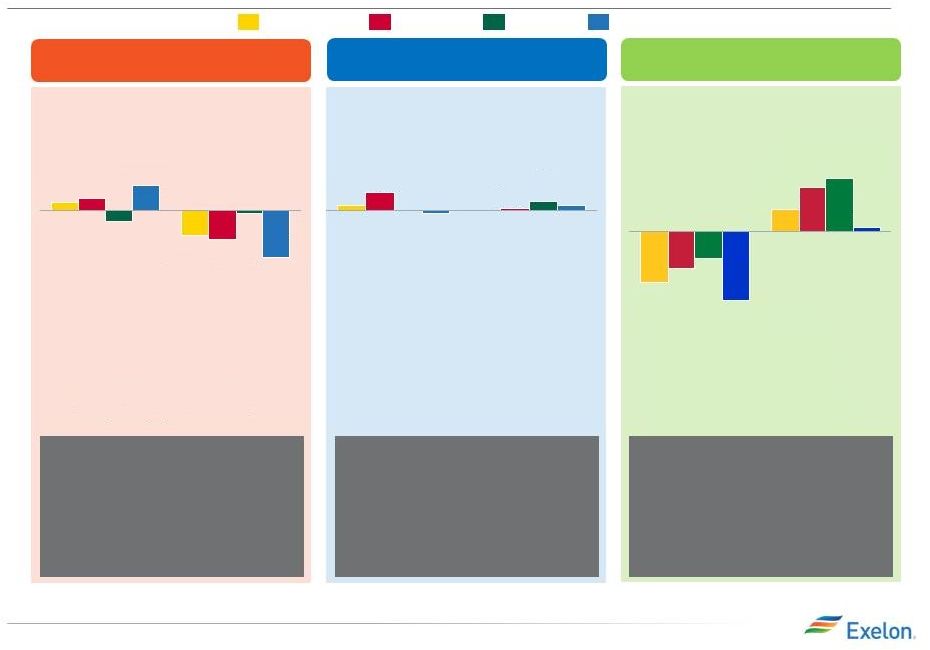
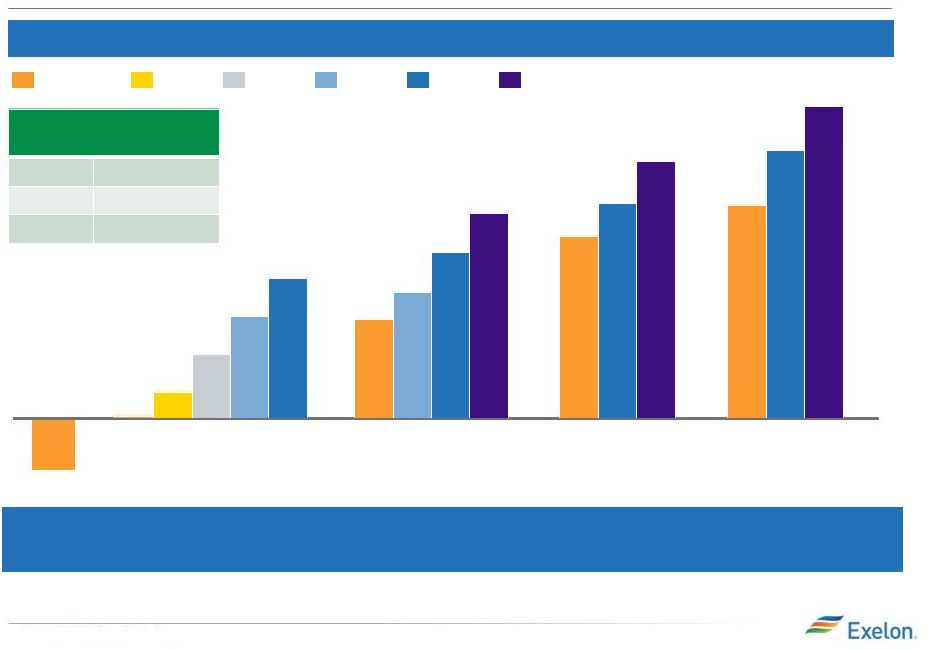 14 2015 EEI Financial Conference Projected Earnings Accretion at Various Earned ROE Levels
(1,2,3)
PHI Acquisition Increases Sustainability of Earnings
Growth Operational improvements should drive
enhanced regulatory outcomes, positively
impacting EPS
$0.06
$0.10
$0.13
2017
$0.02
~$0.00
9% ROE
8% ROE
7% ROE
6% ROE
10% ROE
Base Plan
(1)
~$0.10
$0.12
2018
$0.16
$0.20
~$0.18
2019
$0.21
$0.25
$0.29
$0.25
2020
~$0.20
(~$0.05)
2016
Q3 2015 Guidance
PHI Accretion
2017
~$0.00
2018
$0.07 to $0.12
2019
$0.15 to $0.20
(1)
Base Plan accretion figures represent midpoint of updated
guidance range from Q3 2015 earnings call and reflect current PHI business plan (2) Chart above illustrates accretion at various weighted average distribution earned ROEs for PHI
(3)
Accretion is measured against Exelon standalone plan, which
excludes the impact of PHI acquisition debt and equity Note: Represents adjusted (non-GAAP) operating earnings. Refer to slide 31 for a list of adjustments from GAAP
EPS to adjusted (non-GAAP) operating earnings |
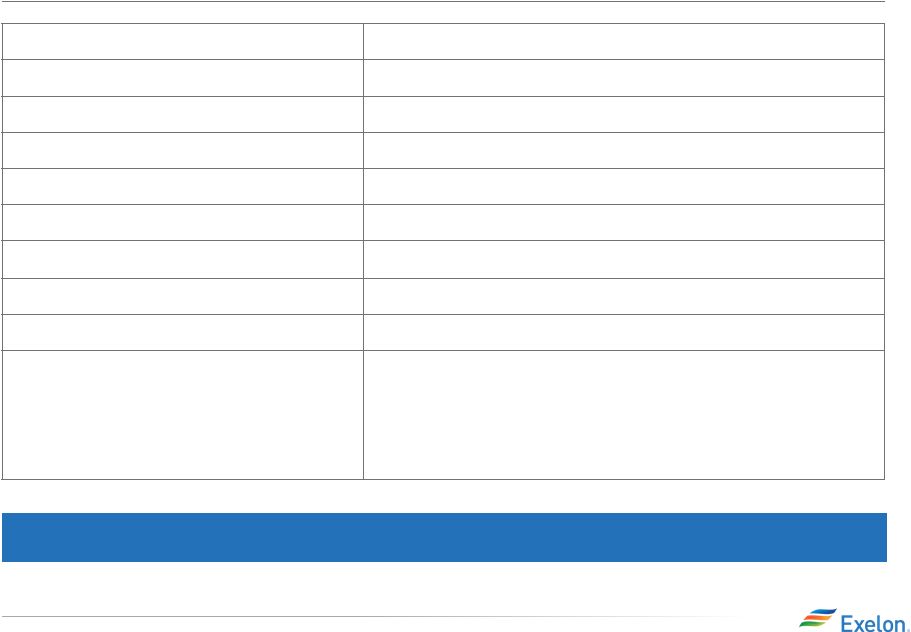
 15 2015 EEI Financial Conference BGE: A Proven Track Record of Enhancing Utility Value
• Increased reliability by 10% per year and customer satisfaction by 3% per year • Increased ROE by more than 250 basis points from 2011 to 2015 and grew net income 15% annually over same period • Continued system investments in reliability and safety necessitate continued rate cases for capital recovery Delivering value to our customers and regulators by improving reliability while providing
investors with predictable cost recovery and earnings
growth 2015E
2014
2013
2012
2011
Operating Net Income
Operating ROE
SAIFI and Customer Satisfaction Index
Operating ROE (%) and Net Income ($M)
0%
2%
4%
6%
8%
10%
0
50
100
150
200
250
300
1.2
1.0
0.9
0.8
0.8
6.8
7.2
7.7
7.6
7.7
5.0
5.5
6.0
6.5
7.0
7.5
8.0
0.0
0.4
0.8
1.2
1.6
2011
2012
2013
2014
2015E
SAIFI (2.5 Beta)
Customer Satisfaction Index
Note: 2012 ROE and Net Income normalized by excluding
one-time $112M rate credit as part of EXC-CEG merger. Operating net income represents adjusted (non-GAAP) operating earnings. Refer to slide 31 for a list of adjustments from GAAP EPS to adjusted
(non-GAAP) operating earnings |
 Extending Clinton One Year |
 17 2015 EEI Financial Conference We Will Continue to Operate Clinton for Another Year What has changed in 2015? • Recent upward movement in MISO capacity prices -- $150/MWd in MISO 2015 auction and Illinois Power Authority Zone 4 procurement auction
• Fleet capacity revenue uplift due to Capacity Performance of $1.4B, beyond our
expectations; MISO will now consider similar market
reforms •
EPA’s Clean Power Plan finalized. Development of
Illinois compliance program in 2016, could
facilitate significant upside from implementation •
Legislative engagement on Illinois Low Carbon Portfolio
Standard. Resolution of budget crisis should
facilitate legislative consideration in 2016 •
Improved operating efficiency and agile nuclear fuel procurement
strategy •
Over the last 2 years Clinton has deferred approximately $100M
of strategic capital, minimizing the cost of
maintaining the optionality at Clinton •
Significant potential NiHub
upside in the out-years not yet reflected in illiquid
forward markets
“If we do not see a path to sustain profitability for these
units . . . we will be forced to retire
them.” -- Chris Crane, July 31, 2014 |
 18 2015 EEI Financial Conference More Progress Necessary for Clinton to Operate Beyond 2017
1)
MISO Reforms:
• MISO is committed to evaluate Zone 4 market design • Illinois Commerce Commission is holding workshops to examine
potential fixes to address Zone 4
• Reforms must provide strong revenues like the PJM reforms
effectuated
2)
Areas of Additional Progress Needed:
• Passage of Low Carbon Portfolio Standard • Illinois implementation of EPA’s Clean Power Plan must fully recognize
the value of Clinton |
 Cost Management Initiative |
 20 2015 EEI Financial Conference The Sustainability and Growth of Our Earnings Will be Supported by an Aggressive Cost Management Program • Exelon has launched a cost management program across to provide
sustainable improvement to the Company’s earnings
trajectory •
• Estimated EPS benefit of $0.13 to $0.18 (1,2) • An additional $50 million of nuclear fuel
savings already reflected in hedge
disclosures
• Savings to begin in 2016 and will be fully realized in 2018 (1) Based on projected 2018 share count of 965M shares, which assumes PHI merger closes
(2)
Represents adjusted (non-GAAP) operating earnings.
Refer to slide 31 for a list of adjustments from GAAP EPS to adjusted (non-GAAP) operating earnings The initiative will achieve $300-$350 million of annual cost savings at
Exelon Generation and Corporate |
 Financial Data |
 The Foundation for Exelon’s Growth |
 23 2015 EEI Financial Conference 2015 Operating Earnings Guidance 2015 Initial Guidance $2.25 - $2.55 (1) $1.15 - $1.35 $0.45 - $0.55 $0.35 - $0.45 $0.20 - $0.30 ExGen ComEd PECO BGE 2015 Revised Guidance (Disclosed on Q3 2015 Earnings Call) $2.40 - $2.60 (1) $1.35 - $1.45 $0.45 - $0.55 $0.35 - $0.45 $0.25 - $0.35 ~($0.10) ExGen PECO ComEd BGE HoldCo (1) Earnings guidance for OpCos may not add up to consolidated EPS guidance. Represents adjusted (non-GAAP) operating earnings. Refer to slide
31 for a list of adjustments from GAAP EPS to
adjusted (non-GAAP) operating earnings
. |
 24 2015 EEI Financial Conference Exelon Utilities ($M) Exelon Generation($M) (1) 2018E 3,575 2017E 3,800 2016E 3,950 2015E 3,700 Smart Grid/Smart Meter Gas Delivery Electric Transmission Electric Distribution 2016E 3,025 2015E 3,675 1,950 2017E 2018E 100 2,575 Base Nuclear Fuel Committed Growth Our Capital Plan Drives Stable Earnings Growth 475 350 300 400 400 450 825 975 650 550 2,100 2,225 2,500 2,400 175 250 1,225 1,100 925 950 1,300 1,225 1,000 900 1,150 700 650 Note: Numbers rounded to nearest $25M (1) Figures reflect cash CapEx and CENG fleet at 100%; 2014 EEI presentation showed CENG fleet at ownership; Does not include
potential pipeline of contracted generation growth
mentioned on slides 11 and 12 |
 25 2015 EEI Financial Conference Exelon’s Existing Utilities Drive Stable Earnings Growth
$1,400
$1,250
$1,450
$1,350
$1,300
$1,200
$1,150
$1,100
$1,050
$1,000
$0
$1,425
2018
2017
2015
$1,250
$1,150
2016
$1,350
$1,275
$1,200
$1,000
Projected average earnings growth of ~7-9% per year from
2015-2018 $1,100
Note: Does not include PHI net income and represents
adjusted (non-GAAP) operating earnings. Refer to slide 31 for a list of adjustments from GAAP EPS to adjusted (non-GAAP) operating earnings. Does not include an extension of bonus depreciation. Impact of a 2-year bonus depreciation
extension for 2015 and 2016 would be ~($10M) in 2015 and ~($25M) a year in 2016- 2018. Excludes after-tax interest expense held at Corporate for debt associated with existing utility
investment, which is (~$25M) a year. |
 26 2015 EEI Financial Conference Continued Focus on Our Balance Sheet Our strong balance sheet supports our disciplined commitment to growth
Exelon Consolidated
(1)
FFO/Debt
Exelon Consolidated FFO/Debt
S&P Threshold
(2)
Solid investment grade credit ratings are a financial
priority (1)
Metrics include PHI financing. Because of ring-fencing,
S&P deconsolidates BGE's and PHI’s financial profile from Exelon and analyzes them solely as equity investments (2) Exelon Consolidated threshold of 18% is based on the S&P Exelon Corp Summary Report published on August 5,
2015 (3)
Current senior unsecured ratings as of 11/3/2015 for Exelon,
Exelon Generation and BGE and senior secured ratings for ComEd and PECO (4) All ratings are “Stable” outlook, except for at Fitch, which has ComEd on “Positive” and Exelon on
“Ratings Watch Negative,” and Moody’s, which has ComEd on “Positive” outlook 20% 20% 20% 15% 16% 17% 18% 19% 20% 21% 2016 2017 2018 Current Ratings (3,4) ExCorp ComEd PECO BGE ExGen Recent Commentary Moody’s Baa2 A2 Aa3 A3 Baa2 “Exelon maintains a strong consolidated financial profile…which
should produce steady
ratios of cash flow to debt in the low 20% range which, when
combined with adequate liquidity reserves and a
growing focus on regulated investment opportunities, positions Exelon firmly within its current rating category.” Moody’s Issuer Comment, June 11, 2015
S&P
BBB-
A-
A-
A-
BBB
“ExGen
generates
a
significant
portion
of
earnings
from
its
retail
operations.
Through
retail
and wholesale channels, ExGen now provides nearly 5% of total
U.S. power demand, and enjoys regional diversity.
The company's generation units are well positioned to grow where capacity available for competitive supply has room to grow. We expect these incremental
revenue streams to make the consolidated Exelon somewhat more
resilient to commodity prices.” S&P
Summary Analysis; March 9, 2015 Fitch
BBB+
A-
A
A-
BBB
“The majority of capital
investment is allocated to EXC’s three utility subsidiaries, which should provide a more stable earnings base.“ Fitch Full Ratings Report; October 15, 2015
“Exgen’s
financial position has stabilized in recent years, and remains
solidly within the investment-grade category.
” Fitch Full Ratings Report; September 11, 2015 |
 27 2015 EEI Financial Conference Exelon-PHI Debt Maturity Profile (1) 2023 800 2021 2022 1,425 900 2020 3,650 2019 950 25 2018 1,600 2017 2,925 25 75 2016 1,575 100 2015 PHI Regulated EXC Regulated PHI Holdco ExCorp ExGen As of 10/31/15 ($M) Debt Exchange Underway on Exelon Corp Notes due 2025, 2035 and 2045
(1)
ExCorp debt includes acquisition debt, including $1,150M
mandatory convertible units remarketing in 2017; ExGen debt includes legacy CEG debt; Excludes securitized debt and non-recourse debt
|
 28 2015 EEI Financial Conference EPS Sensitivities (1) Based on September 30, 2015 market conditions and hedged position. Gas price sensitivities are based on an assumed
gas-power relationship derived from an internal model that is updated periodically. Power prices sensitivities are derived by adjusting the power price assumption while keeping all
other price inputs constant. Due to correlation of the various assumptions, the EPS impact calculated by aggregating individual sensitivities may not be equal to the EPS impact
calculated when correlations between the various assumptions are also considered. Represents adjusted (non-GAAP) operating earnings. Refer to slide 31 for a list of adjustments from
GAAP EPS to adjusted (non-GAAP) operating earnings (2) Assumes 2018/2019 auction cleared volumes (3) Share count used to calculated EPS impact assumes PHI transaction closes
2015
2016
2017
2018
Fully Open
Henry Hub Natural Gas
+$1/MMBtu
($0.00)
$0.08
$0.31
$0.46
$0.56
-$1/MMBtu
$0.01
($0.08)
($0.30)
($0.46)
($0.55)
NiHub ATC Energy Price
+$5/MWh
($0.00)
$0.07
$0.19
$0.28
$0.31
-$5/MWh
$0.00
($0.07)
($0.19)
($0.28)
($0.31)
PJM-W ATC Energy Price
+$5/MWh
($0.00)
$0.03
$0.09
$0.16
$0.19
-$5/MWh
$0.00
($0.03)
($0.09)
($0.16)
($0.19)
PJM Capacity Market
(2)
+$10/MW-day
$0.04
-$10/MW-day
($0.04)
30 Year Treasury Rate
+50 basis points
$0.02
$0.03
$0.03
-50 basis points
($0.02)
($0.03)
($0.03)
Share Count
(3)
(millions)
893
927
947
965 |
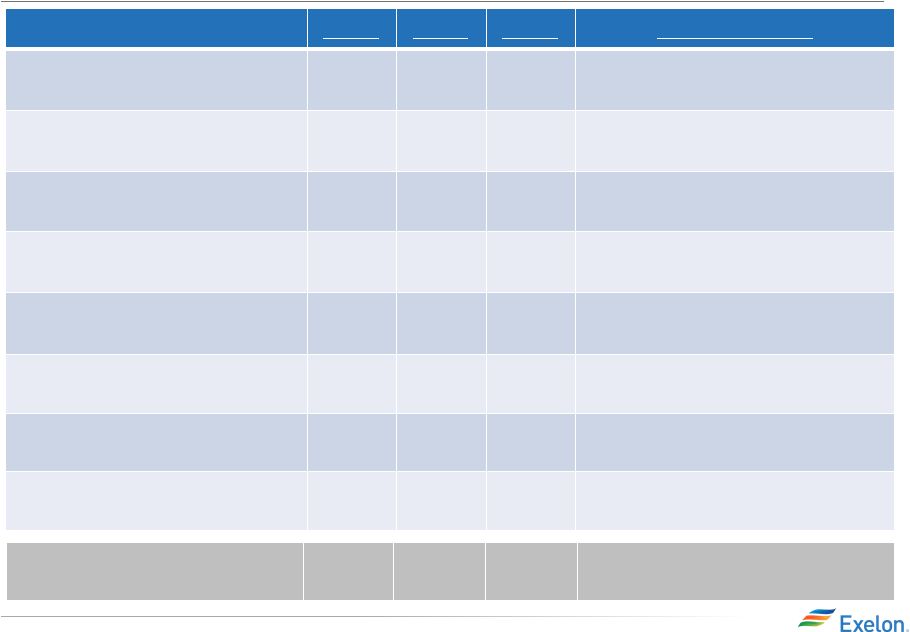 29 2015 EEI Financial Conference Modeling Combined Exelon & Pepco Holdings Pro Forma EPS
2016
2017
2018
Source of Data
Exelon
Utilities Net Income
($M)
$1,175
$1,275
$1,350
Model using midpoint of Net
Income
guidance
from slide
25
Exelon
Generation Net Income
($M)
$X,XXX
$X,XXX
$X,XXX
Model using Gross Margin disclosure
from slide 45
Corporate Net Income
($M)
($25)
($25)
($25)
Model using interest
expense
information in note on slide 25
Exelon Standalone Net Income
($M)
$X,XXX
$X,XXX
$X,XXX
Standalone Share Count
(millions)
877
881
886
Approximate share
count when PHI
equity issuance is excluded
Standalone EPS
$X.XX
$X.XX
$X.XX
Take
Exelon standalone Net Income and
divide by standalone share count
PHI Accretion
Guidance
($0.05)
$0.00
$0.10
Midpoint
of Q3 2015 guidance for PHI
accretion from slide 14
Pro
Forma EPS
$X.XX
$X.XX
$X.XX
Take Exelon
standalone Net Income and
add PHI accretion
Pro
Forma
Share Count
(millions)
927
947
965
From slide 28 |
 30 2015 EEI Financial Conference • Exelon’s pension funding and investment strategies have continued to drive improvements
in the overall funded status of Exelon’s pension
plans •
Given the continued improvements in the funded status of the
Exelon Corporation Retirement Program (ECRP),
traditional defined benefit plan (87% funded at October 31, 2015), and its positive exposure to an improving rate environment; Exelon is evaluating
opportunities to optimize our pension contribution strategy
going forward •
Exelon’s standard Pension/OPEB assumptions and
sensitivities will be provided as part of Q4 2015
earnings disclosures Pension and OPEB
Update Pension Funded Status: %
Funded (1)
Pension Unfunded Status ($B)
Note: October 2015 numbers are preliminary estimates and
are subject to change $500M
(1) Assets as a % of PBO Liability
December
31,
2014
October 31, 2015
$3.4B
$2.9B
December
31,
2014
October 31, 2015
81%
84% |
 31 2015 EEI Financial Conference GAAP to Operating Adjustments • Exelon’s 2015 adjusted (non-GAAP) operating earnings excludes the earnings effects of the following:
–
Mark-to-market adjustments from economic hedging
activities –
Unrealized losses from NDT fund investments to the extent not
offset by contractual accounting as described in
the notes to the consolidated financial statements
–
Certain
costs
incurred
associated
with
the
Integrys
and
pending
Pepco
Holdings,
Inc.
acquisitions
–
Mark-to-market adjustments from forward-starting
interest rate swaps related to anticipated financing for the pending PHI acquisition – Non-cash amortization of intangible assets, net, related to commodity contracts recorded at fair value at
the
date
of
acquisition
of
Integrys
in
2014
–
Non-cash benefit pursuant to the annual update of the
Generation nuclear decommissioning obligation
related to the non-regulatory units
–
Impairment of investment in long-term generating
leases –
Favorable settlement of certain income tax positions on
Constellation’s pre-acquisition tax returns
–
Generation’s non-controlling interest related to CENG
exclusion items –
Other unusual items |
 32 2015 EEI Financial Conference Free Cash Flow GAAP to Non-GAAP Reconciliation 2016-2018 ExGen Free Cash Flow Calculation ($M) 2016-2018 Estimate Adjusted Cash from Operations (1) $10,250 Non-Growth Capital Expenditures ($2,975) Nuclear Fuel Capital Expenditures ($3,125) Free Cash Flow before Growth CapEx and Dividend $4,150 (1) Adjusted Cash Flow From Operations (non-GAAP) primarily includes net cash flows from operating activities and net cash
flows from investing activities excluding capital expenditures |
 Exelon Utilities |
 34 2015 EEI Financial Conference Operations Metric At CEG Merger (2012) Post CEG Merger (2015) BGE PECO ComEd BGE PECO ComEd Electric Operations OSHA Recordable Rate OSHA Severity Rate 2.5 Beta SAIFI (Outage Frequency) 2.5 Beta CAIDI (Outage Duration) Customer Operations Customer Satisfaction Service Level % of Calls Answered in <30 sec Abandon Rate Gas Operations Percent of Calls Responded to in <1 Hour No Gas Operations No Gas Operations
3rd Party Damages per 1000 Gas
Locates
Overall Rank
Electric Utility Panel of 24
Utilities
23
rd
2
nd
2
nd
2
nd
2
nd
2
nd
Operational Excellence Drives Value for Customers,
Communities, and Shareholders
Q1 Q2 Q3 Q4 Performance Quartiles Exelon Utilities has identified and transferred best practices at each of its utilities to
improve operating performance in areas such as:
• System Performance • Emergency Preparedness • Corrective and Preventive Maintenance |
 35 2015 EEI Financial Conference 2018E 950 2017E 875 2016E 825 2015E 700 2018E 725 75 2017E 725 75 2016E 700 2015E 600 75 2018E 1,900 2017E 2,200 2016E 2,425 2015E 2,425 Exelon Utilities: Capital Plan Smart Grid/Smart Meter (1) Gas Delivery Electric Transmission Electric Distribution ($ in millions) (1)
Smart Meter/Smart Grid CapEx net of proceeds from U.S.
Department of Energy (DOE) grant; For BGE, includes CapEx from Smart Energy Savers program of ~$10M per year
125
175
175
175
175
225
225
250
575
625
375
300
100
175
225
225
200
1,450
1,475
1,625
1,475
350
400
475
475
300
350
400
475
125
200
325
400
50
25
50
25
25
25 |
 36 2015 EEI Financial Conference Exelon Utilities: Rate Base (1,4) and ROE Targets 2015E Long-Term Target Equity Ratio 52% ~50-53% Earned ROE 9-10% 10% 2015E Long-Term Target Equity Ratio ~46% ~50-53% (2) Earned ROE ~8% Based on 30-yr US Treasury (3) ($ in billions) (1) ComEd, PECO and BGE rate base represents end-of-year. Numbers may not add due to rounding
(2)
Equity component for distribution rates will be the actual
capital structure adjusted for goodwill
(3)
Earned ROE will reflect the weighted average of 11.5% allowed
transmission ROE and distribution ROE resulting from 30-year Treasury plus 580 basis points for each calendar year (4) Rate base does not include extension of bonus depreciation
2015E
Long-Term Target
Equity Ratio
54%
~50-53%
Earned ROE
11-12%
10%
1.5
1.7
1.5
1.6
8.0
8.9
9.8
10.5
3.9
4.2
4.4
4.7
3.1
3.2
3.4
3.6
2.8
3.2
3.6
3.7
0.8
0.9
0.9
1.0
1.0
1.1
1.4
1.2
1.4
1.3
2018E
6.4
2017E
5.9
2016E
5.3
0.7
2015E
5.0
0.6
2018E
7.3
2017E
6.9
2016E
6.5
6.0
2015E
2018E
14.2
2017E
13.4
12.1
2016E
2015E
10.8
Gas
Transmission
Distribution |
 37 2015 EEI Financial Conference BGE 2015 load growth is greater than 2014, attributed to improving economic conditions and moderate customer growth, partially offset by energy efficiency. Exelon Utilities Load 2015E 2014 PECO 2015 load growth is flat to 2014, driven by slowly improving economic conditions coupled with solid residential customer growth, offset by energy efficiency. (0.6%) 2015E 2014 Philadelphia GMP 1.8% Philadelphia Unemployment 5.2% Baltimore GMP 2.3% Baltimore Unemployment 5.5% 2015E (0.1%) 2014 Large C&I Residential Small C&I All Customers ComEd 2015 load growth is lower than 2014 (impacts of energy efficiency partially offset by slowly improving economy) with Residential and Large C&I trending downward. Chicago GMP 2.1% Chicago Unemployment 5.4% 0.0% 0.1% 0.1% 0.5% 0.2% 0.0% 0.1% (0.1%) (1.6%) (1.2%) 0.5% 1.0% (0.8%) 1.2% 0.1% (0.7%) 0.2% (0.8%) 0.3% (0.3%) (1.3%) 0.7% Notes: Data is weather normalized. Source of economic outlook data is IHS (September 2015). Assumes 2015 GDP
of 2.5% and U.S. unemployment of 5.1%. ComEd has the ROE collar as part of the distribution formula rate and BGE is decoupled which mitigates the load risk. QTD
and YTD actual data can be found in earnings release tables. BGE amounts have been adjusted for prior quarter true-ups.
|
 38 2015 EEI Financial Conference ComEd April 2015 Distribution Formula Rate Docket # 15-0287 Filing Year 2014 Calendar Year Actual Costs and 2015 Projected Net Plant Additions are used to set the rates for calendar year 2016. Rates currently in effect (docket 14-0312) for calendar year 2015 were based on 2013 actual costs and 2014
projected net plant additions
Reconciliation Year
Reconciles
Revenue
Requirement
reflected
in
rates
during
2014
to
2014
Actual
Costs
Incurred.
Revenue
requirement
for
2014
is
based
on
docket
13-0318
(2012
actual
costs
and
2013
projected
net
plant
additions)
approved
in
December
2013 and reflects the impacts of PA 98-0015
(SB9) Common Equity Ratio
~ 46%
for
both
the
filing
and
reconciliation
year
ROE
9.14%
for the filing year (2014
30-yr
Treasury Yield of 3.34% + 580 basis point risk premium) and 9.09% for the reconciliation year (2014 30-yr Treasury Yield of 3.34% + 580 basis point risk premium – 5 basis points performance metrics penalty). For 2015 and 2016, the actual allowed ROE reflected in net income will ultimately be based on the
average of the 30-year Treasury Yield during the respective
years plus 580 basis point spread, absent any metric penalties Requested Rate of Return ~ 7% for both the filing and reconciliation years Rate Base (1) $8,277 million – Filing year (represents projected year-end rate base using 2014 actual plus 2015 projected capital additions). 2015 and 2016 earnings will reflect 2015 and 2016 year-end rate base
respectively. $7,082 million -
Reconciliation year (represents
year-end rate base for 2014)
Revenue Requirement
Decrease
(1)
$55M decrease ($145M decrease due to the 2014 reconciliation offset by a $90M increase related to the filing year).
The 2014 reconciliation impact on net
income was recorded in 2014 as a regulatory asset.
Timeline
• 04/15/15 Filing Date • 240 Day Proceeding • ICC order expected to be issued by December 11, 2015 The 2015 distribution formula rate filing establishes the net revenue requirement used to set the rates that will take effect in January 2016 after the Illinois Commerce Commission's (ICC’s) review. There are two components to the annual distribution formula rate
filing: •
Filing Year: Based on prior year costs (2014) and current
year (2015) projected plant additions. •
Annual Reconciliation: For the prior calendar year (2014), this
amount reconciles the revenue requirement reflected in rates during the prior year (2014) in effect to the actual costs for that year. The annual reconciliation impacts cash flow in the following year (2016) but the earnings impact has been recorded in the prior year (2014) as a regulatory asset.
Given the retroactive ratemaking provision in the Energy
Infrastructure Modernization Act legislation, ComEd net income during the year will be based on actual costs with a regulatory asset/liability recorded to reflect any under/over recovery
reflected in rates. Revenue Requirement in
rate filings impacts cash flow Note:
Disallowance of any items in the 2015 distribution formula rate filing could impact 2015 earnings in the form of a regulatory asset adjustment
(1)
Amounts represent ComEd’s position filed in surrebuttal
testimony on August 20, 2015 |
 39 2015 EEI Financial Conference PECO Electric Distribution Rate Case & Proposed Settlement
Docket #
R-2015-2468981
Test Year
2016 Calendar Year
Requested
Revenue Requirement
$190M
Requested
Common Equity Ratio
(1)
53.36%
Requested Rate of Return
ROE: 10.95%; ROR:
8.19%
Proposed Rate Base
$4.1B
Proposed
Revenue
Requirement
Settlement
Increase
$127M
Authorized Returns
(2)
N/A
System Average Increase as % of overall bill
2.9%
Timeline
• 3/27/15 – PECO filed electric distribution rate case with PaPUC • 9/10/15 Settlement filed with all intervening parties
• 10/28/15 – ALJ issued Recommended Decision that settlement be approved • December 2015 – PUC Decision • Increased rates effective on January 1, 2016 The proposed Revenue Requirement increase of $127M represents 67% of the
Company’s original proposal
(1)
Reflects PECO’s expected capital structure as of
12/31/2016 (2)
Due to the “black box” nature of the settlement,
Authorized Return was not agreed upon by the parties in determining the ultimate revenue requirement increase |
 40 2015 EEI Financial Conference PECO Electric LTIIP - System 2020 • PECO filed its Electric Long Term Infrastructure Improvement Plan (“LTIIP”) along with its
associated recovery mechanism the Distribution System Improvement
Charge (“DSIC”) on March 27, 2015
(with Electric Distribution Rate Case) o
LTIIP includes $275 million in incremental capital spending
from 2016-2020 focusing on the following
areas: Cable Replacement
Storm Hardening Programs
Substation replacement and upgrades
o DSIC mechanism will allow recovery of eligible LTIIP spend between rate cases if the
electric distribution ROE falls below the DSIC ROE established
by PaPUC. The current Electric DSIC ROE is
10.0%. o
Approved on 10/22/15
• PECO also proposed the concept of constructing one or more pilot microgrid projects as part of a future LTIIP update ($50-$100M). The objective is to evaluate and test emerging
microgrid
technologies that could enhance reliability and resiliency by
replacing obsolete infrastructure as an
alternative to traditional solutions. LTIIP
guarantees at least 10% ROE on capital improvements made on behalf of PECO customers |
 41 2015 EEI Financial Conference PHI Capital Plan and Rate Base 675 700 725 700 350 350 350 375 275 325 325 275 2018E 1,350 2017E 1,400 2016E 1,375 2015E (2) 1,300 Pepco DPL ACE 4.0 4.4 4.8 5.1 2.4 2.5 2.7 3.0 1.7 1.9 2.2 2.1 10.2 2018E 2017E 9.6 2016E 8.8 2015E 8.1 (1) Source: PHI Third Quarter Earnings Materials 10/31/14 (2) Denotes year end rate base (3) CapEx numbers rounded to nearest $25M; totals might not add due to rounding
Capital Expenditures ($M)
(1,3)
Rate Base ($B)
(1,2) |
 42 2015 EEI Financial Conference Settlement Party testimony (Oct 30) Non- settling party testimony (Nov 17) Public Interest Hearings (Dec 2-4) Initial Briefs Due
(Dec 11)
Reply Briefs
Due
(Dec 18)
Expected
PSC Order
(Q1 2016)
Pepco Holdings: DCPSC Procedural Timeline
|
 Exelon Generation |
 44 2015 EEI Financial Conference 15 11 6 12 17 14 17 18 48 75 25 97 Our Generation to Load Strategy Delivers Sustainable Earnings
in Volatile Markets
• Since the Constellation merger, we have improved our generation to load match through growing our customer load business,
both organically and through disciplined
acquisitions like Integrys •
This strategy and hedging with a fundamentals driven approach
has meaningfully benefitted earnings over the last two years
• High volatility: We captured higher prices for our generation during periods of extreme weather while managing our load obligations. During periods of high volatility, generation availability is of utmost importance. During the polar vortex of 2014, our 2
GW of peaking capability created
significant
value
in
the
energy
and
ancillary
markets.
During
the
polar
vortex,
we
made
~$100
million
(3)
• Low volatility: During periods of low volatility, we captured higher margins as we realized a lower cost to serve our customers
and we optimized the value of our dispatchable fleet through load sales. This year alone, we have made ~$250 million as result of lower cost to serve load • Generation to Load match also provides us with an important channel to market for our hedging activities which is
important in times of low liquidity and in places
where there is not an active market (1)
Owned
and
contracted
generation
capacity
converted
from
MW
to
MWh
assuming
100%
capacity
factor
(CF)
for
all
technology
types,
except
for
renewable
capacity
which
is
shown
at
estimated
CF
(2)
Expected generation and load shown in the chart above will not
tie out with load volume and ExGen disclosures; Load shown above does not include indexed products and generation reflects a net owned and contracted position; Estimates as of 9/30/2015 (3) Excludes the impact of plant outages, primarily at Calvert Cliffs prior to us operating the plant
2012 Generation Load Match (TWh)
(1,2)
116
118
Midwest
14
New England
Canada
South/West/
26
New York
43
Mid-Atlantic
30
ERCOT
Intermediate
Baseload
Peaking
Renewables
Expected Generation
Expected Load
Generation Capacity:
8
14
8
9
20
13
13
17
64
63
38
97
38
95
18
10
111
25
2016 Generation Load Match (TWh)
(1,2)
Midwest
New England
Canada
South/West/
New York
Mid-Atlantic
ERCOT |
 45 2015 EEI Financial Conference Exelon Generation – Optimizing the Portfolio and Positioning it for Market Upside (1) Gross margin categories rounded to nearest $50M (2) Total Gross Margin (Non-GAAP) is defined as operating revenues less purchased power and fuel
expense, excluding revenue related to decommissioning, gross
receipts tax, Exelon Nuclear Partners, operating
services agreement with Fort Calhoun and variable interest entities. Total Gross Margin is also net of direct cost of sales for certain Constellation businesses
(3)
Excludes EDF’s equity ownership share of the CENG Joint
Venture (4)
Mark-to-Market of Hedges assumes mid-point of hedge
percentages •
Capacity Performance added approximately $1B in gross margin over the 2016 to 2018 period • Timing of hedge decisions creates value • Positioning portfolio to reflect our fundamental views – currently carrying a larger open position in 2017 and 2018 • Intra-year hedging flexibility to take advantage of volatility
• Using cross-commodity spreads in NiHub: 7-10% of the portfolio in 2017 is in
cross-commodity hedges and
3-6% in 2018 Gross Margin Category ($M) (1) 2015 2016 2017 2018 Open Gross Margin(including South, West, & Canada hedged
GM)
(3)
$5,150
$5,650
$5,800
$6,100
Mark-to-Market of Hedges
(3,4)
$2,200
$1,200
$750
$250
Power New Business / To Go
$50
$500
$800
$1,000
Non-Power Margins Executed
$400
$200
$100
$50
Non-Power New Business / To Go
$50
$250
$350
$450
Total Gross Margin
(2)
$7,850
$7,800
$7,800
$7,850 |
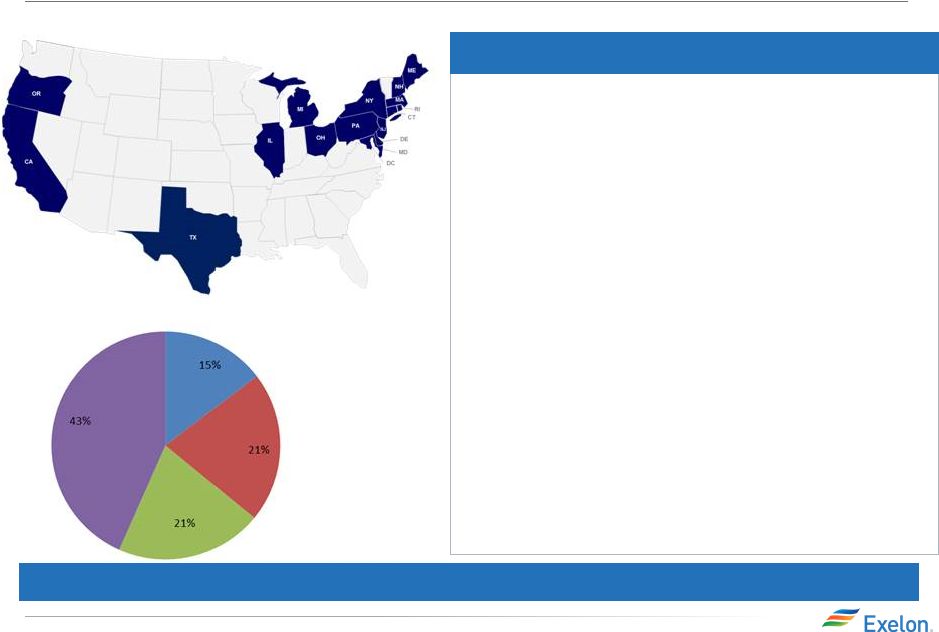 46 2015 EEI Financial Conference Electric Load Serving Business: Market Landscape Total U.S. Power Market 2015 (3,725 TWh load) (1)
Eligible Non-
Switched
Eligible
Switched
Muni/Co-Op Market
Other
Ineligible
Constellation Active Retail Electric Markets
Improved competitive landscape observed across many
markets •
Conditions have improved in many markets as impacts of the
Polar Vortex have played out
• Some suppliers have taken steps to reduce exposure to weather-
sensitive customer loads following the Polar
Vortex Retail transactions and new entrant
activity down in 2015 •
M&A, exits and divestiture activity down from 2014
levels •
Fewer new entrants have entered the market in 2015
Competitive retail market expected to grow modestly over the
next five years (2015-2019)
• C&I switched market to grow by about 8% • Residential switched market to grow by about 7% Market Landscape (1) (1) Sources are EIA, DNV GL, and internal estimates Existing suppliers continue to expand market footprint and
product portfolio
• Several existing suppliers have expanded into new states
• Energy efficiency and distributed energy among most popular for
cross-selling opportunities
Constellation is the #1 Provider of Retail Electricity in the
United States |
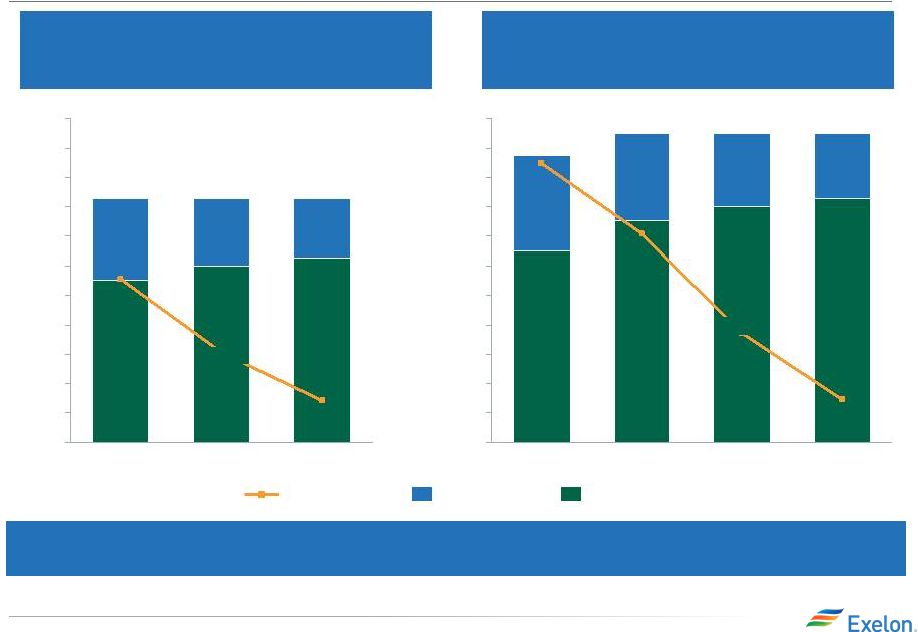 47 2015 EEI Financial Conference Our Electric Load Serving Business Provides Sustainable Earnings and Stable Earnings Growth 70-80% 20-30% 2016E 165 70-80% 20-30% 2015E 165 60-70% 30-40% 2017E 165 2018E 210 75-85% 15-25% 2017E 70-80% 20-30% 2015E 195 65-75% 25-35% 210 75-85% 15-25% 2016E 210 Retail Load (2) Total Contracted Wholesale Load 2015 EEI Commercial Load Projections (1) 2015 – 2018 TWh 2014 EEI Commercial Load Projections (1,3) 2015 – 2017 TWh (1) Numbers and percentages are rounded to the nearest 5 (2) Index load expected to be 25% to 35% of total forecasted retail load
(3)
Excludes Integrys
acquisition completed in November 2014
Our growing load business provides a channel to market
that reduces the reliance on lower margin over-
the-counter products
0
20
40
60
80
100
120
140
160
180
200
220
0
20
40
60
80
100
120
140
160
180
200
220 |
 48 2015 EEI Financial Conference Our NiHub Strategy Recognizes the Lack of Liquidity and Disconnect Between our Fundamental View of Prices Incremental coal retirements will lead to continued volatility and higher dispatch costs, creating
$2-$3/MWh of power price
upside in NiHub
in 2017-2018
Forward market heat rates expanded again through
2015 •
Our portfolio is positioned to take advantage of
expected volatility and power price upside
• 2017-2018 average upside of $2-$3/MWh • Power exposure in NiHub above purely ratable: • 17-20% behind ratable in 2017 • 13-15% behind ratable in 2018 • The increased reliance on natural gas as coal plants retire
has impacted prices
• Our PJM forecast includes 20+GW of new CCGTs, full compliance with state renewables requirements and essentially flat load growth, in addition to coal retirements
0 5 10 15 20 25 30 35 2012-2014 2015 2016 PJM/MISO Coal Retirements PJM & MISO Annual Coal Retirements PJM & MISO Cumulative Coal Retirements 26 27 28 29 30 31 32 2017 2018 Nihub ATC Prices ($/MWh) Nihub Forecast (09/30) Nihub Market (09/30) 8.0 8.5 9.0 9.5 10.0 10.5 11.0 2016_NiHub_HR 2017_NiHub_HR 2018_NiHub_HR |
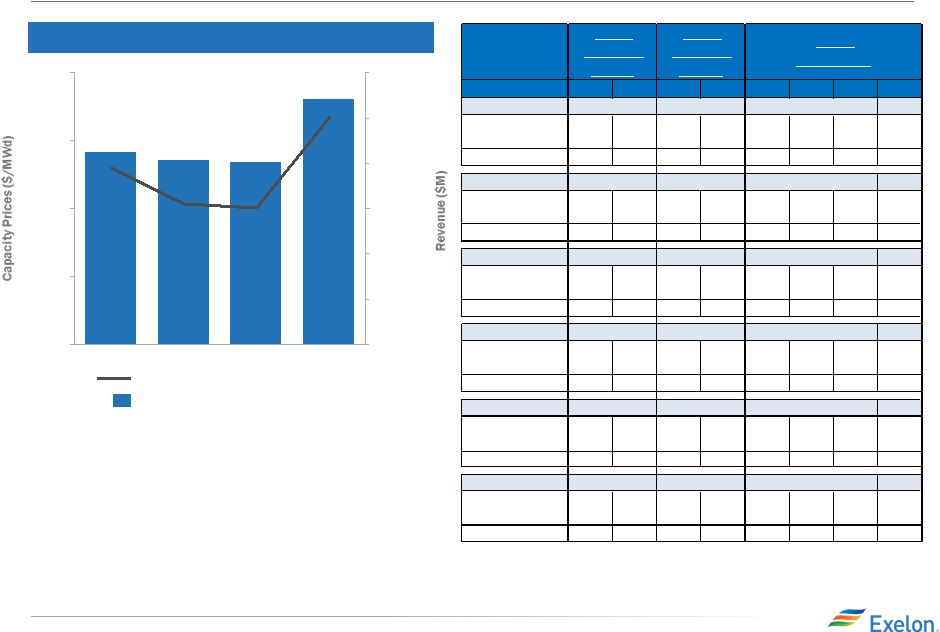 49 2015 EEI Financial Conference Capacity Markets: PJM $142 $136 $135 $181 $1,400 $1,300 $1,200 $1,100 $1,000 $900 $800 $200 $150 $100 $50 $0 2018 2017 2016 2015 Exelon Fleet Weighted Price ($/MWd) Revenue ($M) PJM Capacity Revenues (1,2,3) (1) Revenues reflect capacity cleared in Base, CP transitional & incremental auctions and are for calendar
years (2) Revenues reflect owned and contracted
generation (3) Reflects 50.01% ownership at
CENG (4) Volumes at ownership.
Rounded. Cleared Volumes
(MWs)
(4)
CP
Price
CP
Price
CP
Price
Base
Price
ComEd
Fossil/Other
-
$134.00
-
$151.50
-
$215.00
25
$200.21
Nuclear
9,950
$134.00
9,975
$151.50
8,625
$215.00
-
$200.21
Total
9,950
$134.00
9,975
$151.50
8,625
$215.00
25
$200.21
EMAAC
Fossil/Other
25
$134.00
850
$151.50
2,075
$225.42
1,050
$210.63
Nuclear
3,950
$134.00
4,950
$151.50
4,325
$225.42
-
$210.63
Total
3,975
$134.00
5,800
$151.50
6,400
$225.42
1,050
$210.63
SWMAAC
Fossil/Other
-
$134.00
-
$151.50
-
$164.77
-
$149.98
Nuclear
425
$134.00
825
$151.50
850
$164.77
-
$149.98
Total
425
$134.00
825
$151.50
850
$164.77
-
$149.98
BGE
Fossil/Other
75
$134.00
150
$151.50
300
$164.77
425
$149.98
Nuclear
-
$134.00
-
$151.50
-
$164.77
-
$149.98
Total
75
$134.00
150
$151.50
300
$164.77
425
$149.98
Rest of MAAC/RTO
Fossil/Other
-
$134.00
-
$151.50
265
$164.77
50
$149.98
Nuclear
775
$134.00
800
$151.50
-
$164.77
-
$149.98
Total
775
$134.00
800
$151.50
265
$164.77
50
$149.98
GRAND TOTAL
Fossil/Other
100
1,000
2,640
1,550
Nuclear
15,100
16,550
13,800
-
Total
15,200
17,550
16,440
1,550
16/17
Transition
Auction
17/18
Transition
Auction
18/19
Base Auction |
 50 2015 EEI Financial Conference Capacity Markets: ISO-NE, NYISO, MISO (1) ISO-NE: ISO New England; NEMA: Northeastern Massachusetts and Boston; SEMA: Southeastern Massachusetts
(2)
NYISO: New York Independent System Operator
(3)
Represents offered capacity at ownership
(4)
AMIL: Ameren Illinois AMIL capacity price represents PRA auction
clearing price for Zone 4 in $/MWd
2015/2016
2016/2017
2017/2018
2018/2019
ISO-NE
(1)
NEMA
Capacity
(3)
(MW)
2,100
2,100
2,100
2,100
Price ($/MWd)
$104
$222
$500
$318
SEMA
Capacity
(3)
(MW)
35
35
35
230
Price ($/MWd)
$104
$105
$234
$557
NYISO
(2)
Capacity
(3)
(MW)
1,100
1,100
1,100
1,100
MISO
Zone 4
Capacity
(3)
(MW)
1,100
1,100
1,100
1,100
Price ($/MWd)
(4)
$150 |
 51 2015 EEI Financial Conference Natural Gas Marketing Platform Active Natural Gas Markets Supply ~4-6 Bcf per day delivered in competitive markets growing to 6-8 Bcf by 2018 Transportation Active shipper on more than 45 interstate pipelines on a daily basis
Trading
Active
participant
in
all
major
supply
basins,
markets,
and
trading
points
in
North
America
Volume Management
Schedule, nominate and balance behind more than 120
LDCs Gas Generation
Gas Toll
Owned gas storage
contracts
Major office locations |
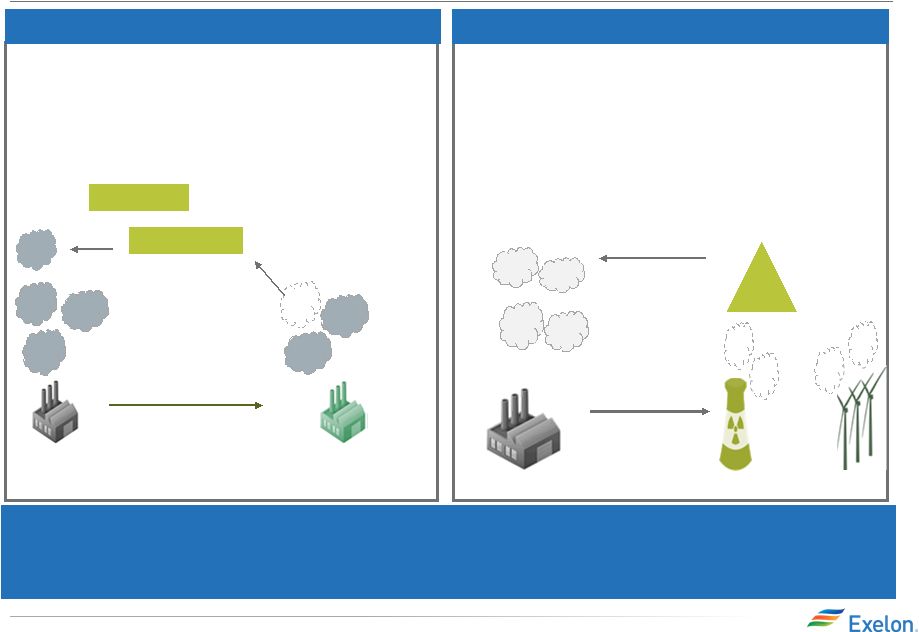 52 2015 EEI Financial Conference • States distribute allowances equal to the number of CO2 emissions allowed • At the end of each compliance period, affected electric generating units (EGUs) must surrender allowances equal to
their emissions
• States may allow affected EGUs to buy or sell allowances
with other parties
One
=
one
ton
of
CO2
emissions
allowance
allowance
State Mass Goal
$
A facility that produces more
emissions than it has allowances may
purchase allowances from another
facility that has extra allowances
State Rate Standard: 1,000 lb/MWh
Rate
Standard
$
ERC
Rate
Standard
or
Emissions Rate: 0 lb/MWh
Emissions Rate: 2,000 lb/MWh
• Emission rate credits (ERCs) are created when incremental
nuclear or incremental renewables generate
electricity •
Emitting generators must purchase sufficient ERCs to
reduce their emission rate to the target level
EPA Clean Power Plan: Compliance
Pathways Mass Budget
Emissions Rate
Exelon recommends that states adopt mass-based plans that
include both existing and new units because that is
the best way to level the playing field and ensure that clean
resources like nuclear receive value for the carbon- free, always-on electricity that Exelon provides. It is also the best way to minimize overall costs to consumers
and preserve electric reliability while achieving
verifiable carbon reductions |
 53 2015 EEI Financial Conference Exelon Nuclear Fleet Overview (including CENG and Salem) Plant Location Type/ Containment Net Generation Capacity (MW) (5) License Extension Status / License Expiration (1) Ownership Spent Fuel Storage/ Date to lose full core discharge capacity (2) Braidwood, IL (Units 1 and 2) PWR Concrete/Steel Lined 2,389 Filed application in May 2013 (decision expected in early 2016)/ 2026, 2027 100% Dry Cask Byron, IL (Units 1 and 2) PWR Concrete/Steel Lined 2,347 Filed application in May 2013 (decision expected in 2015)/ 2024, 2026 100% Dry Cask Clinton, IL (Unit 1) BWR Concrete/Steel Lined / Mark III 1,069 2026 100% Dry Cask (2016) Dresden, IL (Units 2 and 3) BWR Steel Vessel / Mark I 1,845 Renewed / 2029, 2031 100% Dry Cask LaSalle, IL (Units 1 and 2) BWR Concrete/Steel Lined / Mark II 2,320 Filed application December 2014 (decision expected 2017)/2022, 2023 100% Dry Cask Quad Cities, IL (Units 1 and 2) BWR Steel Vessel / Mark I 1,403 Renewed / 2032 75% Exelon, 25% Mid- American Holdings Dry Cask Limerick, PA (Units 1 and 2) BWR Concrete/Steel Lined / Mark II 2,317 Renewed / 2044, 2049 100% Dry Cask Oyster Creek, NJ (Unit 1) BWR Steel Vessel / Mark I 625 Renewed / 2029(3) 100% Dry Cask Peach Bottom, PA (Units 2 and 3) BWR Steel Vessel / Mark I 1,221 Renewed / 2033, 2034 50% Exelon, 50% PSEG Dry Cask TMI, PA (Unit 1) PWR Concrete/Steel Lined 837 Renewed / 2034 100% 2023 Salem, NJ (Units 1 and 2) PWR Concrete/Steel Lined 1,005 Renewed / 2036, 2040 42.6% Exelon, 57.4% PSEG Dry Cask Calvert Cliffs, MD (Units 1and 2) PWR Concrete/Steel Lined 878 Renewed / 2034, 2036 100% CENG(4) Dry Cask R.E. Ginna, NY (Unit 1) PWR Concrete/Steel Lined 288 Renewed / 2029 100% CENG(4) Dry Cask Nine Mile Point, NY (Units 1 and 2) BWR Steel Vessel / Mark I Concrete/Steel Vessel/ Mark II 838 Renewed / 2029, 2046 100% CENG (4) / 82% CENG (4) , 18% Long Island Power Authority Dry Cask (1) Operating license renewal process takes approximately 4-5 years from commencement until completion of NRC review (2) The date for loss of full core reserve identifies when the on-site storage pool will no longer have sufficient space to
receive a full complement of fuel from the reactor core; Dry cask storage will be in operation at those sites prior to losing full core discharge capacity in their on-site storage pools (3) On December 8, 2010, Exelon announced that it will permanently cease generation operations at Oyster Creek by December 31,
2019; Oyster Creek’s current NRC license expires in 2029 (4) Exelon Generation has a 50.01% ownership interest in CENG. EDF has a 49.99% ownership interest in CENG. (5) Net generation capacity is stated at proportionate ownership share. Based on 2015 projected full year |
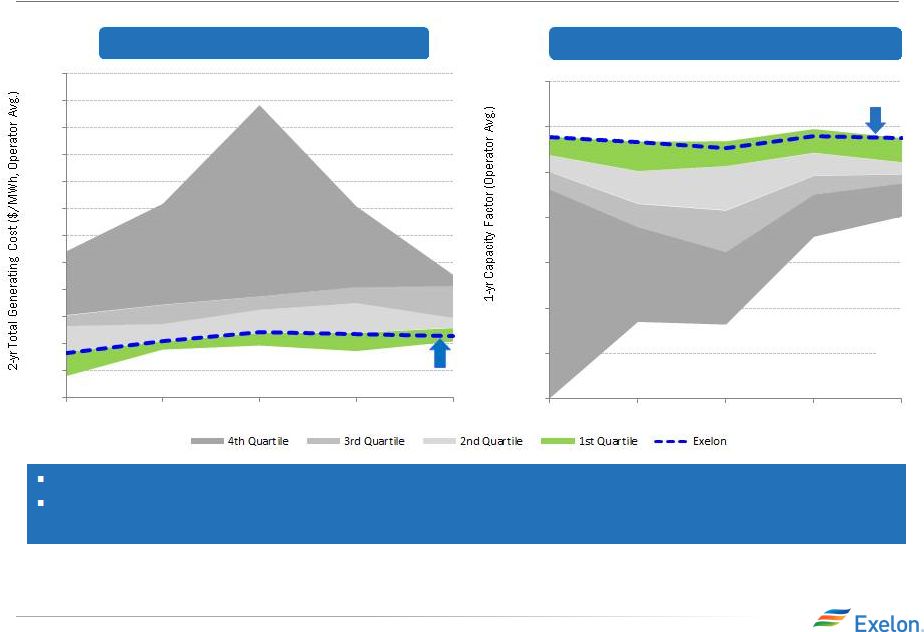 54 2015 EEI Financial Conference World Class Nuclear Operator (1) 31% 14% 1,208 1,169 1,104 Nuclear Total Generating Cost ($/MWh) (2) Capacity Factor (%) (3) Exelon is consistently one of the lowest-cost and most efficient producers of electricity in the nation
Over the next five years, Exelon Nuclear projects a negative
cost CAGR, while maintaining strong generation
performance $31.37
2014 Exelon Exelon 20 25 30 35 40 45 50 55 60 65 70 75 80 2010 2011 2012 2013 2014 65% 70% 75% 80% 85% 90% 95% 100% 2010 2011 2012 2013 2014 (1) 2010 – 2013 Exelon fleet averages exclude Salem, Ft. Calhoun, and CENG; 2014 Exelon fleet averages exclude Salem and
Ft. Calhoun (2) Total Generating Cost is defined as cost to produce one MWh of energy, including fuel, materials, labor, contracting,
capital expenditures, insurance and the majority of
overhead expenses including benefit costs associated with labor
but excludes property taxes, unit contingent costs and risks, costs due to unknown future regulatory changes, and suspended DOE nuclear waste storage fee (effective May 2014) (3) Source: Platts Nuclear News, Nuclear Energy Institute and Energy Information Administration (Department of Energy)
|
 55 2015 EEI Financial Conference Net nuclear generation data at ownership excluding Salem for all years
CENG excluded in years 2007–2014 but included in 2015 and
beyond 2016 and 2018 include Clinton Refueling Only
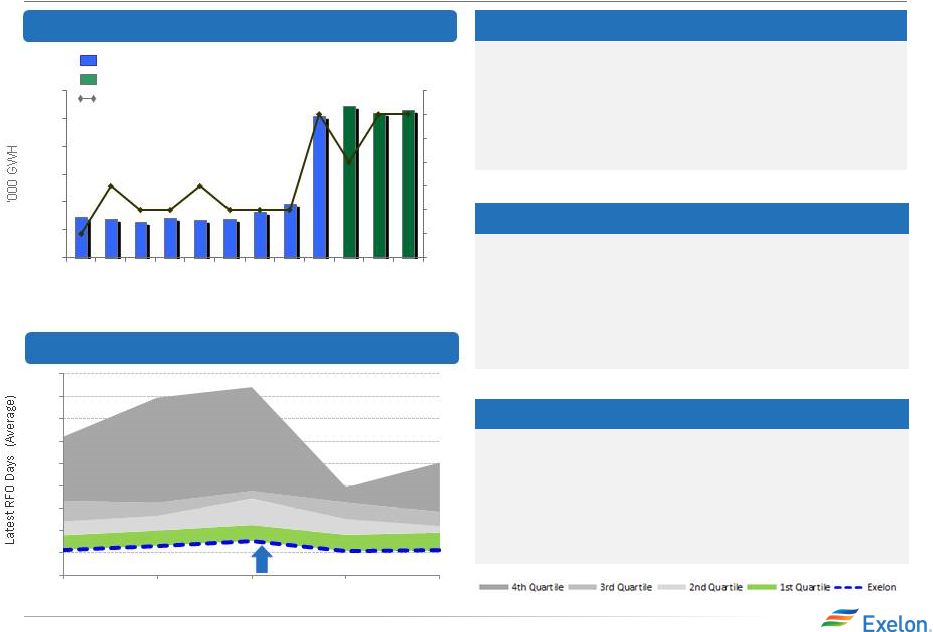
outage of shortened duration Nuclear Output and
Refueling Outages Fleet Average Refueling Outage
Duration (Days) 31%
36%
14%
14%
Nuclear Output
1,208
1,169
1,104
Nuclear Refueling Cycle
• All Exelon-owned units are on a 24 month cycle except for Braidwood U1/U2, Byron U1/U2, Ginna, and Salem U1/U2, which are on 18 month cycles • Starting in 2015 Clinton is on annual cycles Actual / Forecast Target # of Refueling Outages 2015 Refueling Outage Impact • 14 planned refueling outages, including 1 at Salem • 7 spring refueling outages and 6 fall refueling outages • 1 Salem fall refueling outage 2016 Refueling Outage Impact • 12 planned refueling outages, including 1 at Salem • 7 spring refueling outages and 4 fall refueling outages • 1 Salem spring refueling outage 2010-2013 Exelon fleet averages exclude Salem and CENG. 2014 Exelon fleet average excludes Salem
7 8 9 10 11 12 13 14 125 130 135 140 145 150 155 2007 2008 2009 2010 2011 2012 2013 2014 2015 2016 2017 2018 15 25 35 45 55 65 75 85 95 105 2010 2011 2012 2013 2014 Exelon |
 56 2015 EEI Financial Conference Nuclear Fuel Costs (1) Projected Exelon Uranium Demand (2) Components of Fuel Expense in 2015 2015 – 2020: 100% hedged in volume 2 1 0 11 10 9 8 7 6 5 4 3 2020E 2019E 2018E 2017E 2016E 2015E Enrichment 32% Tax/Interest 2% Conversion 4% Uranium 46% Fabrication 16% Projected Exelon Average Uranium Cost vs. Mar Projected Total Nuclear Fuel Spend (3) 0 200 400 600 800 1,000 1,200 2020E 887 2019E 949 2018E 953 2017E 964 2016E 975 2015E 971 Nuclear Fuel Capex Nuclear Fuel Expense (Amortization) Over the last year, Exelon has reduced capital requirements for nuclear fuel by ~$265M (2015 to 2019)
(1)
All charts exclude Salem (2)
Includes 100% of requirements (3)
CENG included at ownership. Including Salem and 100% of CENG
total cash capital expenditures are $1.3B, $1.2B, $1.0B, $0.9B, $0.9B, and $0.9B for 2015 - 2020
|
 57 2015 EEI Financial Conference Constellation Energy Nuclear Group (CENG) Operating Service
Agreement Terms
• Nuclear Operating services agreement • Integrated CENG and their 3 plants into Exelon Nuclear with transfer of operating licenses
• Loan to CENG and distributions to EDF/Exelon Generation • CENG $400M special distribution paid to EDF on April 1, 2014
• Exelon Generation made $400M loan to CENG at 5.25% annual interest rate to fund special distribution to
EDF (As of September 30, 2015, the loan balance, including
interest, was $296M) •
Exelon Generation receives priority payment from CENG’s
available cash flows until loan is fully repaid •
Exelon Generation also entitled to receive aggregate preferred
distributions of $400M plus a return of 8.5% per
annum from April 1, 2014 (No amounts have been paid on this special distribution) • Option for EDF to sell its 49.99% interest in CENG to Exelon Generation
• Exercisable from January 2016 to June 2022 • Process and timeline allows for possible negotiated agreement on price
• If no negotiated agreement on price, price is determined by arbitration process to determine fair market
value
• Arbitration process could take up to 10 months or longer before binding decision is made on price
• Price would be adjusted for EDF share of remaining loan balance and special distribution to Exelon
Generation
• Regulatory approvals could take several months but might run concurrently with arbitration process
• Exelon has limited rights to defer closing up to 6 months |
 58 2015 EEI Financial Conference Exelon Fossil Generation Fleet Overview (1) 100%, unless otherwise indicated (2) Fossil/Hydro Capacity values shown represent summer ratings as of September 2015. Net Generation Capacity (MW) is
stated at proportionate ownership share
(3)
Includes Perryman 2 (51MW), which will retire on in Q1
2016. Includes Perryman 6 (110MW) that went COD in June 2015 (4) Includes Riverside 4 (74MW), which is scheduled for retirement in May 2016
Station
Location
Number
of
Units
Primary Fuel
Type
Percent
Owned
(1)
Net Generation
Capacity (MW)
(2)
Notch Cliff
Baltimore, MD
8
Gas
118
Pennsbury
Morrisville, PA
2
Landfill Gas
6
Perryman
(3)
Belcamp, MD
6
Oil/Gas
463
Philadelphia Road
Baltimore, MD
4
Oil
61
Richmond
Philadelphia, PA
2
Oil
98
Riverside
(4)
Baltimore, MD
3
Oil/Gas
113
Salem
Lower Alloways
Creek Twp, NJ
1
Oil
42.59
16
Schuylkill
Philadelphia, PA
2
Oil
30
Southwark
Philadelphia, PA
4
Oil
52
Westport
Baltimore, MD
1
Gas
116
Southeast Chicago
Chicago, IL
8
Gas
296
Framingham
Framingham, MA
3
Oil
33
Medway
West Medway, MA
3
Oil/Gas
117
Mystic 7
Charlestown, MA
1
Oil/Gas
575
Mystic 8, 9
Charlestown, MA
2
Gas
1418
Mystic Jet
Charlestown, MA
1
Oil
9
New Boston
South Boston, MA
1
Oil
16
Wyman
Yarmouth, ME
1
Oil
5.9
36
Grand Prairie
Alberta, Canada
1
Gas
75
Hillabee
Alexander City, AL
1
Gas
722
Sunnyside
Sunnyside, UT
1
Waste Coal
50
26
Station
Location
Number
of
Units
Primary Fuel
Type
Percent
Owned
(1)
Net Generation
Capacity (MW)
(2)
Colorado Bend
Wharton, TX
6
Gas
498
Handley 3
Fort Worth, TX
1
Gas
395
Handley 4, 5
Fort Worth, TX
2
Gas
870
LaPorte
Laporte, TX
4
Gas
152
Mountain Creek 6, 7
Dallas, TX
2
Gas
240
Mountain Creek 8
Dallas, TX
1
Gas
565
Wolf Hollow 1, 2, 3
Granbury, TX
3
Gas
704
Chester
Chester, PA
3
Oil
39
Conowingo
Darlington, MD
11
Hydro
572
Croydon
West Bristol, PA
8
Oil
391
Delaware
Philadelphia, PA
4
Oil
56
Eddystone
Eddystone, PA
4
Oil
60
Eddystone
3, 4
Eddystone, PA
2
Oil/Gas
760
Fairless Hills
Fairless Hills, PA
2
Landfill Gas
60
Falls
Morrisville, PA
3
Oil
51
Gould Street
Baltimore, MD
1
Gas
97
Handsome Lake
Kennerdell, PA
5
Gas
268
Moser
Lower
PottsgroveTwp., PA
3
Oil
51
Muddy Run
Drumore, PA
8
Hydro
1070 |
 59 2015 EEI Financial Conference Summer Texas Heat Brings Return of Volatility to ERCOT Demand is Growing • Summer 2015 was hot; record load pushed summer 2015 spot power prices up and led summer forwards higher • Average demand in ERCOT has risen 2-3% in 2015 from 2014 • Reserve margins reserve were as much as 10% lower than projected, falling below 4 GW in August Exelon captured ~$20M of value from this summer’s volatility and our new CCGTs will
be well positioned to replicate this success
Generation assets will be valuable going forward
• Wind generation is forecasted to grow from 13 GW today to nearly 20 GW by 2020, which will increase volatility of the ERCOT dispatch stack • New gas generation development has slowed – with 600MW of peakers in 2016 and Exelon CCGTs in 2017 the only visible gas additions through 2018 • The Public Utilities Commission of Texas has requested that ERCOT examine the Operating Reserve Demand Curve ERCOT Weather: July-September ERCOT Scarcity Indicators: July-September |
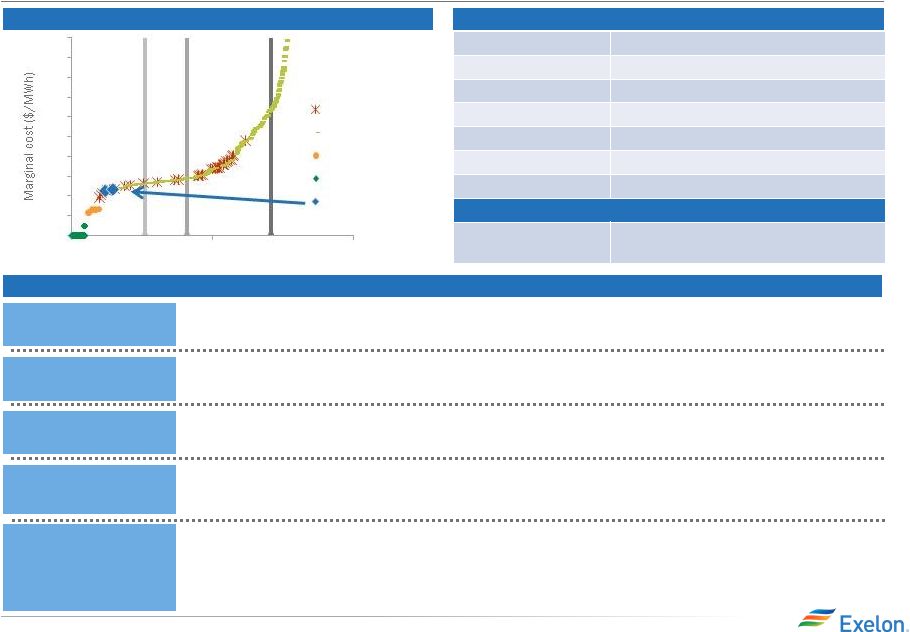 60 2015 EEI Financial Conference Texas CCGTs: Unique Opportunity to Grow in ERCOT Key Facts Sites Wharton County and Granbury, TX Total Capacity ~2,200MW Construction Cost $1,475M (~$700/kW); $700M remaining Heat Rate ~6,500 mmBtu/MWh EPC / OEMs Zachry / GE and Alstom Cooling System Air Cooled Commercial Operation By Summer 2017 Expected Economics ROE > 12% ERCOT Dispatch Key Messages • Two of the cleanest, most efficient Combined Cycle Gas Turbines (CCGT) in the nation
• Simplified design provides for easier construction and maintenance, making these units among the most
predictable and least costly to operate and maintain in the
industry •
Plants use air cooling which mitigates water constraint
issues •
Ramp rate of 100 MW/minute can respond quickly to depressed
wind or unexpected outages (market ramp rate ~50
MW/minute) •
Capacity factor will average 75-85%
• Demand continues to grow at more than 1% per year, which results in the need for roughly 700MW of
incremental capacity every year and potential for real-time
prices to go to $9,000/MWh •
New units should see sustainably high spark spreads and
returns, especially if natural gas prices recover •
Potential for coal units in the state to add costly controls or
shutdown could further boost returns as the
Mercury & Air Toxics (MATS) and Regional Haze rules take
effect Efficient
Cost Effective
Environmental
Versatile
Constructive
Market
0
10
20
30
40
50
60
70
80
90
100
0
50,000
100,000
Capacity at peak (MW)
Coal
Gas
Uranium
Renewables
Exelon New Build |
 61 2015 EEI Financial Conference Exelon Renewable Generation Fleet Overview Station Location Number of Units Primary Fuel Type Percent Owned (1) Net Generation Capacity (MW) (2) AgriWind Bureau Co., IL 4 Wind 99 8 Beebe 1A & 1B Gratiot, MI 55 Wind 131 Blue Breezes/Moore Blue Earth, MN 2 Wind 3 Cisco Jackson Co., MN 4 Wind 99 8 Cowell Pipestone Co., MN 1 Wind 99 2 CP Windfarm Faribault Co., MN 2 Wind 4 Ewington Jackson Co., MN 10 Wind 99 21 EXC City Solar Cook Co., IL 1 Solar 8 Harvest I & II Huron Co., MI 65 Wind 112 Marshall Lyon Co., MN 9 Wind 99 19 Michigan Wind I Bingham Township, MI 46 Wind 69 Michigan Wind II Minden City, MI 50 Wind 90 Norgaard Lincoln Co., MN 7 Wind 99 9 Wolf Nobles Co., MN 5 Wind 99 6 Bluegrass Ridge Gentry Co., MO 27 Wind 57 Conception Nodaway Co., MO 24 Wind 50 Cow Branch Atchinson Co., MO 24 Wind 50 Greensburg Kiowa Co., KS 10 Wind 13 Loess Hills Atchinson Co., MO 4 Wind 5 Shooting Star Kiowa Co., KS 65 Wind 104 Station Location Number of Units Primary Fuel Type Percent Owned (1) Net Generation Capacity (MW) (2) EXC Wind 1,2,3,4 Hansford Co., TX 62 Wind 110 EXC Wind 5,6 Sherman Co., TX 16 Wind 20 EXC Wind 7,8,9,10,11 Moore Co., TX 40 Wind 50 High Plains Moore Co., TX 8 Wind 99.5 10 Whitetail Webb, TX 57 Wind 91 Conowingo Hartfort Co., MD 11 Hydroelectric 572 Criterion Oakland, MD 28 Wind 70 Fairless Falls Twp, PA 2 Landfill Gas 60 Fourmile Garrett Co., MD 16 Wind 40 Muddy Run Lancaster Co., PA 8 Hydro 1,070 Pennsbury Falls Twp, PA 2 Landfill Gas 6 Antelope Valley Solar Ranch LA Country., CA 1 Solar 242 Cassia Twin Falls Co., ID 14 Wind 29 Echo I Umatilla Co., OR 21 Wind 99 35 Echo II Morrow Co., OR 10 Wind 20 Echo III Morrow Co., OR 6 Wind 99 10 High Mesa Twin Fall Co., ID 19 Wind 40 Mountain Home Elsmore Co., ID 20 Wind 42 Threemile Canyon Morrow Co., OR 6 Wind 10 Tuana Springs Twin Fall Co., ID 8 Wind 17 Wildcat Lea, NM 13 Wind 27 (1) 100%, unless otherwise indicated (2) Fossil/Hydro Capacity values shown represent summer ratings as of September 2015. Net Generation Capacity (MW) is
stated at proportionate ownership share
(3)
Constellation Solar is an operation that constructs, owns, and
operates solar facilities at various customer locations. |
 62 2015 EEI Financial Conference Exelon Generation Disclosures September 30, 2015 |
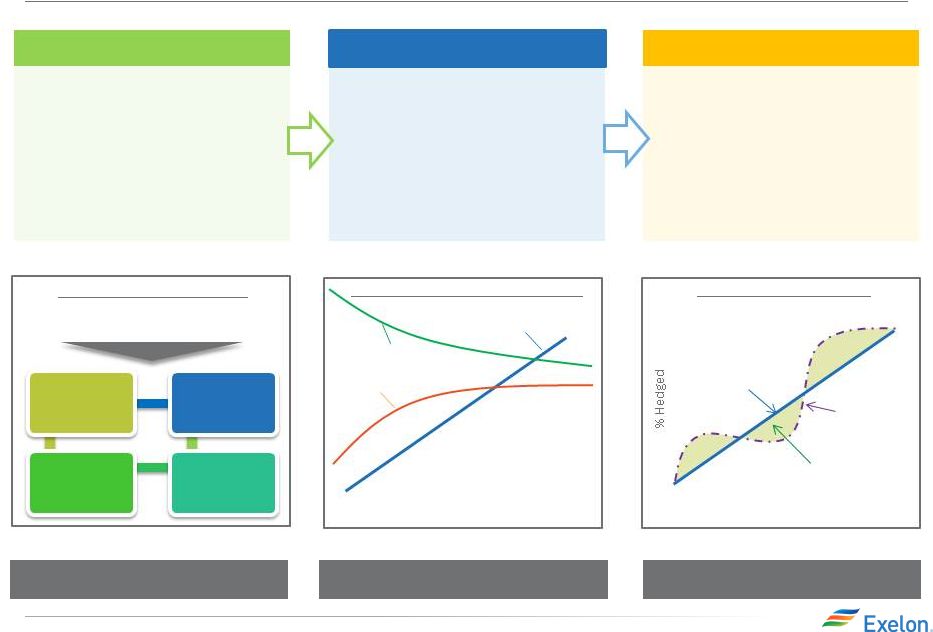 63 2015 EEI Financial Conference Portfolio Management Strategy Protect Balance Sheet Ensure Earnings Stability Create Value Strategic Policy Alignment •Aligns hedging program with financial policies and financial outlook •Establish minimum hedge targets to meet financial objectives of the company (dividend, credit rating) •Hedge enough commodity risk to meet future cash requirements under a stress scenario Three-Year Ratable Hedging •Ensure stability in near-term cash flows and earnings •Disciplined approach to hedging •Tenor aligns with customer preferences and market liquidity •Multiple channels to market that allow us to maximize margins •Large open position in outer years to benefit from price upside Bull / Bear Program •Ability to exercise fundamental market views to create value within the ratable framework •Modified timing of hedges versus purely ratable •Cross-commodity hedging (heat rate positions, options, etc.) •Delivery locations, regional and zonal spread relationships Exercising Market Views Purely ratable Actual hedge % Market views on timing, product allocation and regional spreads reflected in actual hedge % High End of Profit Low End of Profit % Hedged Open Generation with LT Contracts Portfolio Management & Optimization Portfolio Management Over Time Align Hedging & Financials Establishing Minimum Hedge Targets Credit Rating Credit Rating Capital & Operating Expenditure Capital & Operating Expenditure Dividend Dividend Capital Structure Capital Structure |
 64 2015 EEI Financial Conference Margins move from new business to MtM of hedges over the course of the year as sales are executed (5) Components of Gross Margin Categories Open Gross Margin •Generation Gross Margin at current market prices, including capacity and ancillary revenues, nuclear fuel amortization and fossils fuels expense •Exploration and Production (4) •Power Purchase Agreement (PPA) Costs and Revenues •Provided at a consolidated level for all regions (includes hedged gross margin for South, West and Canada (1) ) MtM of Hedges (2) •Mark-to-Market (MtM) of power, capacity and ancillary hedges, including cross commodity, retail and wholesale load transactions •Provided directly at a consolidated level for five major regions. Provided indirectly for each of the five major regions via Effective Realized Energy Price (EREP), reference price, hedge %, expected generation “Power” New Business •Retail, Wholesale planned electric sales •Portfolio Management new business •Mid marketing new business “Non Power” Executed •Retail, Wholesale executed gas sales •Energy Efficiency (4) •BGE Home (4) •Distributed Solar “Non Power” New Business •Retail, Wholesale planned gas sales •Energy Efficiency (4) •BGE Home (4) •Distributed Solar •Portfolio Management / origination fuels new business •Proprietary trading (3) Margins move from “Non power new business” to
“Non power executed” over the course of the
year Gross margin linked to power production and
sales Gross margin from
other business activities
(1) Hedged gross margins for South, West & Canada region
will be included with Open Gross Margin, and no expected generation, hedge %, EREP or reference prices provided for this region
(2) MtM of hedges provided directly for the five larger regions;
MtM of hedges is not provided directly at the regional level but can be easily estimated using EREP, reference price and hedged MWh
(3) Proprietary trading gross margins will generally remain
within “Non Power” New Business category and only move to “Non Power” Executed category upon management discretion
(4) Gross margin for these businesses are net of direct
“cost of sales” (5) Margins for South, West & Canada regions and optimization of fuel and PPA activities captured in Open Gross Margin |
 65 2015 EEI Financial Conference ExGen Disclosures (1) Gross margin categories rounded to nearest $50M
(2)
Total Gross Margin (Non-GAAP) is defined as operating
revenues less purchased power and fuel expense,
excluding revenue related to decommissioning, gross receipts tax, Exelon Nuclear Partners, operating services agreement with Fort Calhoun and variable
interest entities. Total Gross Margin is also net of direct cost
of sales for certain Constellation businesses.
(3)
Excludes EDF’s equity ownership share of the CENG Joint
Venture (4)
Mark-to-Market of Hedges assumes mid-point of hedge
percentages (5)
Based on September 30, 2015 market conditions
Gross Margin Category ($M)
(1)
2015
2016
2017
2018
Open Gross Margin
(including South, West & Canada hedged
GM)
(3)
$5,150
$5,650
$5,800
$6,100
Mark-to-Market of Hedges
(3,4)
$2,200
$1,200
$750
$250
Power New Business / To Go
$50
$500
$800
$1,000
Non-Power Margins Executed
$400
$200
$100
$50
Non-Power New Business / To Go
$50
$250
$350
$450
Total
Gross
Margin
(2)
$7,850
$7,800
$7,800
$7,850
Reference Prices
(5)
2015
2016
2017
2018
Henry Hub Natural Gas ($/MMbtu)
$2.75
$2.80
$2.99
$3.05
Midwest: NiHub ATC prices ($/MWh)
$28.80
$29.58
$28.95
$28.57
Mid-Atlantic: PJM-W ATC prices ($/MWh)
$37.05
$36.82
$35.36
$33.99
ERCOT-N ATC Spark Spread ($/MWh)
HSC Gas, 7.2HR, $2.50 VOM
$3.12
$4.62
$4.47
$3.83
New York: NY Zone A ($/MWh)
$33.55
$33.52
$33.22
$32.70
New England: Mass Hub ATC Spark Spread
($/MWh)
ALQN Gas, 7.5HR, $0.50 VOM
$5.57
$9.33
$10.73
$11.84 |
 66 2015 EEI Financial Conference ExGen Disclosures (1) Expected generation is the volume of energy that best represents our commodity position in energy markets from owned or contracted for capacity based upon a simulated dispatch model that makes assumptions regarding future market conditions, which are calibrated to market quotes for power, fuel, load following products, and
options. Expected generation assumes 12 refueling outages in 2016, 15 in 2017, and 14 in 2018 at Exelon-operated nuclear plants, and Salem. Expected generation assumes capacity factors of 94.1%, 93.3% and 93.7% in 2016, 2017 and 2018 respectively at Exelon-operated nuclear plants, at ownership. These estimates of expected generation in 2016, 2017 and 2018 do not represent guidance or a forecast of future
results as Exelon has not completed its planning or optimization processes for those years (2) Excludes EDF’s equity ownership share of CENG Joint Venture
(3)
Percent
of
expected
generation
hedged
is
the
amount
of
equivalent
sales
divided
by
expected
generation.
Includes
all
hedging
products,
such
as
wholesale
and
retail
sales
of
power,
options
and
swaps
(4)
Effective
realized
energy
price
is
representative
of
an
all-in
hedged
price,
on
a
per
MWh
basis,
at
which
expected
generation
has
been
hedged.
It
is
developed
by
considering
the
energy
revenues
and
costs
associated
with our hedges and by considering the fossil fuel that has been
purchased to lock in margin. It excludes uranium costs and RPM capacity revenue, but includes the mark-to-market value of capacity contracted at prices other than RPM clearing prices including our load obligations. It can be compared with the reference prices used to calculate open gross margin in order to determine the mark-to-market value of Exelon Generation's energy hedges (5) Spark spreads shown for ERCOT and New England Generation and Hedges 2015 2016 2017 2018 Exp. Gen (GWh) (1) 186,700 199,400 205,300 206,200 Midwest 96,600 97,300 95,700 96,200 Mid-Atlantic (2) 61,700 63,100 61,200 60,500 ERCOT 11,600 17,200 26,400 31,100 New York (2) 9,300 9,300 9,200 9,100 New England 7,500 12,500 12,800 9,300 % of Expected Generation Hedged (3) 97%-100% 81%-84% 51%-54% 20%-23% Midwest 97%-100% 79%-82% 45%-48% 15%-18% Mid-Atlantic (2) 95%-98% 84%-87% 57%-60% 26%-29% ERCOT 99%-102% 86%-89% 65%-68% 25%-28% New York (2) 94%-97% 72%-75% 46%-49% 30%-33% New England 115%-118% 81%-84% 37%-40% 11%-14% Effective Realized Energy Price ($/MWh) (4) Midwest $36.00 $34.50 $34.50 $34.50 Mid-Atlantic (2) $51.50 $47.00 $45.50 $45.00 ERCOT (5) $23.50 $11.00 $7.50 $2.50 New York (2) $47.50 $45.50 $42.00 $35.00 New England (5) $42.00 $20.00 $18.00 $11.00 |
 67 2015 EEI Financial Conference ExGen Hedged Gross Margin Sensitivities Gross Margin Sensitivities (With Existing Hedges) (1) 2015 2016 2017 2018 Henry Hub Natural Gas ($/Mmbtu) + $1/Mmbtu - $110 $445 $690 - $1/Mmbtu $20 $(115) $(430) $(680) NiHub ATC Energy Price + $5/MWh - $100 $275 $410 - $5/MWh - $(95) $(275) $(410) PJM-W ATC Energy Price + $5/MWh - $45 $130 $235 - $5/MWh - $(40) $(125) $(230) NYPP Zone A ATC Energy Price + $5/MWh - $10 $25 $30 - $5/MWh - $(10) $(25) $(30) Nuclear Capacity Factor +/- 1% +/- $10 +/- $40 +/- $40 +/- $40 (1) Based on September 30, 2015 market conditions and hedged position; Gas price sensitivities are based on an assumed
gas-power relationship derived from an internal model that is updated periodically; Power prices sensitivities are derived by adjusting the power price assumption while keeping all
other prices inputs constant; Due to correlation of the various assumptions, the hedged gross margin impact calculated by aggregating individual sensitivities may not be equal to the
hedged gross margin impact calculated when correlations between the various assumptions are also considered; Sensitivities based on commodity exposure which includes open
generation and all committed transactions; Excludes EDF’s equity share of CENG Joint Venture |
 68 2015 EEI Financial Conference ExGen Hedged Gross Margin Upside/Risk 5,000 5,500 6,000 6,500 7,000 7,500 8,000 8,500 9,000 9,500 10,000 10,500 11,000 2015 2016 2017 2018 $10,200 $6,150 $7,900 $7,800 $8,250 $7,350 $6,900 $9,050 (1)
Represents an approximate range of expected gross margin, taking
into account hedges in place, between the 5th and 95th percent confidence levels assuming all unhedged supply is sold into the spot market; Approximate gross margin ranges are based upon an internal simulation model and are subject to
change based upon market inputs, future transactions and potential modeling changes; These ranges of approximate gross margin in 2016, 2017 and 2018 do not represent earnings
guidance or a forecast of future results as Exelon has not completed its planning or optimization processes for those years; The price distributions that generate this range are
calibrated to market quotes for power, fuel, load following products, and options as of September 30, 2015 (2)
Gross Margin Upside/Risk based on commodity exposure which
includes open generation and all committed transactions (3)
Gross Margin (Non-GAAP) is defined as operating revenues
less purchased power and fuel expense, excluding revenue related to decommissioning, gross receipts tax, Exelon Nuclear Partners, operating services agreement with Fort Calhoun and variable interest entities. Total Gross Margin is also net of
direct cost of sales for certain Constellation businesses. Excludes EDF’s equity ownership share of the CENG Joint Venture |
 69 2015 EEI Financial Conference Illustrative Example of Modeling Exelon
Generation 2016 Gross Margin (1) Mark-to-market rounded to the nearest $5 million (2) Total Gross Margin (Non-GAAP) is defined as operating revenues less purchased power and fuel expense, excluding
revenue related to decommissioning, gross receipts tax, Exelon Nuclear Partners operating services agreement with Fort Calhoun and variable interest entities. Total Gross Margin is also net of
direct cost of sales for certain Constellation businesses Row Item Midwest Mid-Atlantic ERCOT New York New England South, West & Canada (A) Start with fleet-wide open gross margin (B) Expected Generation (TWh) 97.3 63.1 17.2 9.3 12.5 (C) Hedge % (assuming mid-point of range) 80.5% 85.5% 87.5% 73.5% 82.5% (D=B*C) Hedged Volume (TWh) 78.3 54.0 15.1 6.8 10.3 (E) Effective Realized Energy Price ($/MWh) $34.50 $47.00 $11.00 $45.50 $20.00 (F) Reference Price ($/MWh) $29.58 $36.82 $4.62 $33.52 $9.33 (G=E-F) Difference ($/MWh) $4.92 $10.18 $6.38 $11.98 $10.67 (H=D*G) Mark-to-market value of hedges ($ million)
(1)
$385
$550
$95
$80
$110
(I=A+H)
Hedged Gross Margin ($ million)
(J)
Power New Business / To Go ($ million)
(K)
Non-Power Margins Executed ($ million)
(L)
Non-Power New Business / To Go ($ million)
(N=I+J+K+L)
Total Gross Margin
(2)
$200
$250
$7,800 million
$5.65 billion
$6,850
$500 |
Serious News for Serious Traders! Try StreetInsider.com Premium Free!
You May Also Be Interested In
- Exelon Corp. (EXC) May 38 calls and June 39 calls active
- Ensino a distância estimula inclusão indígena, mas qualidade é desafio
- Loop Energy Provides Update to Previously Announced Merger Transaction
Create E-mail Alert Related Categories
SEC FilingsSign up for StreetInsider Free!
Receive full access to all new and archived articles, unlimited portfolio tracking, e-mail alerts, custom newswires and RSS feeds - and more!
