

Form 8-K Approach Resources Inc For: Nov 04
 Tweet
Tweet Share
Share
UNITED STATES
SECURITIES AND EXCHANGE COMMISSION
Washington, D.C. 20549
FORM 8-K
CURRENT REPORT
Pursuant to Section 13 OR 15(d)
of The Securities Exchange Act of 1934
Date of Report (Date of earliest event reported) November 4, 2015
APPROACH RESOURCES INC.
(Exact name of registrant as specified in its charter)
| Delaware | 001-33801 | 51-0424817 | ||
| (State or other jurisdiction of incorporation) |
(Commission File Number) |
(IRS Employer Identification No.) |
| One Ridgmar Centre 6500 West Freeway, Suite 800 Fort Worth, Texas |
76116 | |
| (Address of principal executive offices) | (Zip Code) |
(817) 989-9000
(Registrant’s telephone number, including area code)
Not Applicable
(Former name or former address, if changed since last report.)
Check the appropriate box below if the Form 8-K filing is intended to simultaneously satisfy the filing obligation of the registrant under any of the following provisions (see General Instruction A.2. below):
| ¨ | Written communications pursuant to Rule 425 under the Securities Act (17 CFR 230.425) |
| ¨ | Soliciting material pursuant to Rule 14a-12 under the Exchange Act (17 CFR 240.14a-12) |
| ¨ | Pre-commencement communications pursuant to Rule 14d-2(b) under the Exchange Act (17 CFR 240.14d-2(b)) |
| ¨ | Pre-commencement communications pursuant to Rule 13e-4(c) under the Exchange Act (17 CFR 240.13e-4(c)) |
| Item 2.02 | Results of Operations and Financial Condition. |
On November 4, 2015, the Company issued a press release announcing financial and operational results for the three and nine months ended September 30, 2015 (the “Earnings Release”). The Earnings Release contains certain non-GAAP financial information. The reconciliation of such non-GAAP financial information to GAAP financial measures is included in the Earnings Release and in the “Investor Relations – Non-GAAP Financials” section of the Company’s website at www.approachresources.com. A copy of the Earnings Release is furnished herewith as Exhibit 99.1.
| Item 7.01 | Regulation FD Disclosure. |
On November 4, 2015, the Company issued the Earnings Release discussed above in Item 2.02 of this current report on Form 8-K. The Earnings Release contains certain non-GAAP financial information. The reconciliation of such non-GAAP financial information to GAAP financial measures is included in the Earnings Release and in the “Investor Relations – Non-GAAP Financials” section of the Company’s website at www.approachresources.com. A copy of the Earnings Release is furnished herewith as Exhibit 99.1.
On November 4, 2015, the Company posted a new presentation titled “Approach Resources Inc. – Third Quarter 2015 Results” under the “Investor Relations – Presentations” section of the Company’s website, www.approachresources.com. For the benefit of all investors, the presentation is attached hereto as Exhibit 99.2.
| Item 9.01 | Financial Statements and Exhibits. |
| (d) | Exhibits. |
| Exhibit |
Description | |
| 99.1 | Earnings Release dated November 4, 2015. | |
| 99.2 | Corporate presentation titled, “Approach Resources Inc. – Third Quarter 2015 Results.” | |
In accordance with General Instruction B.2 of Form 8-K, the information in Items 2.02 and 7.01, including the attached Exhibits 99.1 and 99.2, shall not be deemed “filed” for purposes of Section 18 of the Securities Exchange Act of 1934, as amended (the “Exchange Act”), or otherwise subject to the liabilities of that section, nor shall it be deemed incorporated by reference into any registration statement or other filing under the Securities Act of 1933, as amended, or the Exchange Act, except as otherwise expressly stated in such filing.
| 2 |
SIGNATURES
Pursuant to the requirements of the Securities Exchange Act of 1934, the registrant has duly caused this report to be signed on its behalf by the undersigned hereunto duly authorized.
| APPROACH RESOURCES INC. | ||
| By: | /s/ J. Curtis Henderson | |
| J. Curtis Henderson | ||
| Chief Administrative Officer and Corporate Secretary | ||
Date: November 5, 2015
| 3 |
EXHIBIT INDEX
| Exhibit |
Description | |
| 99.1 | Earnings Release dated November 4, 2015. | |
| 99.2 | Corporate presentation titled, “Approach Resources Inc. – Third Quarter 2015 Results.” | |
| 4 |
Exhibit 99.1

Approach Resources Inc.
Reports Third Quarter 2015 Results
Fort Worth, Texas, November 4, 2015 – Approach Resources Inc. (NASDAQ: AREX) today reported results for third quarter 2015. Highlights for third quarter 2015 include:
| • | Record quarterly production of 1,525 MBoe, or 16.6 MBoe/d, a 17% increase over the prior-year quarter and a 10% increase over second quarter 2015 |
| • | EBITDAX was $30.7 million, or $0.76 per diluted share |
| • | Revenues totaled $33.9 million. Including realized hedge gains, revenues were $46.7 million |
| • | Per-unit cash operating expenses decreased 18% from the prior-year quarter, and 5% from second quarter 2015, to $10.45 per Boe |
| • | Adjusted net loss was $5.9 million, or $0.14 per diluted share |
| • | Average IP for wells completed since last update was 931 Boe/d (65% oil and 84% liquids) |
Adjusted net (loss) income, EBITDAX and cash operating expenses are non-GAAP measures. See “Supplemental Non-GAAP Measures” below for our definitions and reconciliations of adjusted net (loss) income and EBITDAX to net (loss) income and cash operating expenses to operating expenses.
Management Comment
J. Ross Craft, Approach’s Chairman, CEO and President, commented, “In the third quarter, our team was able to deliver another record quarterly production rate for the Company and strong well results. The slowdown in activity has provided an opportunity for us to fine-tune our completion design. We are encouraged by the early production data from third quarter wells completed using tighter frac stage spacing, higher proppant concentration and modified sand concentration mix. Improved well performance combined with the lower D&C costs should allow us to further enhance rates of return on our Wolfcamp horizontal program.
Additionally, we continued to streamline our business structure by implementing a number of initiatives. We expect to realize annual G&A and LOE savings of between $5.0 and $7.0 million beginning in 2016. Given the sustained uncertain commodity price outlook, we remain focused on reducing costs and making financially responsible capital allocation decisions as we preserve the strength of our balance sheet and liquidity.”
Third Quarter 2015 Results
Production for third quarter 2015 totaled 1,525 MBoe (16.6 MBoe/d), compared to production of 1,306 MBoe (14.2 MBoe/d) in third quarter 2014, a 17% increase. Oil production for the third quarter was 490 MBbls (5.3 MBbls/d). Production for third quarter 2015 was 64% liquids and 36% natural gas.
Adjusted net loss (non-GAAP) for third quarter 2015 was $5.9 million, or $0.14 per diluted share, compared to adjusted net income (non-GAAP) of $10.5 million, or $0.27 per diluted share, for third quarter 2014. EBITDAX (non-GAAP) for third quarter 2015 was $30.7 million, or $0.76 per diluted share, compared to $50.7 million, or $1.29 per diluted share, for third quarter 2014. See “Supplemental Non-GAAP Financial and Other Measures” below for our definitions and reconciliations of adjusted net (loss) income and EBITDAX to net (loss) income.
|
INVESTOR CONTACT |
APPROACH RESOURCES INC. | |
| Sergei Krylov | One Ridgmar Centre | |
| Executive Vice President & Chief Financial Officer | 6500 West Freeway, Suite 800 | |
| [email protected] | Fort Worth, Texas 76116 | |
| 817.989.9000 | www.approachresources.com |
Lease operating expense showed sustained improvement, averaging $5.04 per Boe for third quarter 2015. This represents a 14% decrease from the prior-year quarter. Production and ad valorem taxes averaged $1.77 per Boe, or 8.0% of oil, NGL and gas sales. Exploration costs for the quarter were $1.28 per Boe, including $1.7 million, or $1.12 per Boe, related to one-time rig termination fees. Cash general and administrative expense averaged $3.65 per Boe, a 17% decline compared to the prior-year quarter. Non-cash general and administrative expense averaged $1.12 per Boe, a 26% decline from third quarter 2014. Depletion, depreciation and amortization expense averaged $20.47 per Boe, and interest expense totaled $6.5 million.
The Company incurred a non-cash impairment charge of $220.2 million during the third quarter of 2015 due to the significant decline in commodity prices. The reduction in carrying value was primarily attributable to the Company’s legacy vertical gas assets in Ozona Northeast.
Operations Update
During third quarter 2015, we drilled four horizontal wells, completed five horizontal wells, and at September 30, 2015, we had four horizontal wells waiting on completion. The average initial production (IP) rate for all wells completed since our last report was 931 Boe/d (65% oil and 84% liquids) with an average lateral length of 6,600 feet.
Capital expenditures incurred during third quarter 2015 totaled $19.8 million, and included $17.9 million for drilling and completion activities and $1.9 million for infrastructure projects and equipment. Management has begun the 2016 budgeting process, and we plan to release further detail in early 2016.
Liquidity Update
At September 30, 2015, we had a $1 billion revolving credit facility with a $450 million borrowing base and $278 million of outstanding borrowings. The Company recently announced the completion of its scheduled semiannual borrowing base redetermination, which resulted in the lender commitments and borrowing base being set at $450 million. At September 30, 2015, our liquidity was approximately $172 million. See “Supplemental Non-GAAP Financial and Other Measures” below for our definition and calculation of liquidity.
|
2 |
Commodity Derivatives Update
We enter into commodity derivatives positions to reduce the risk of commodity price fluctuations. The table below is a summary of our current derivatives positions.
| Commodity and Period |
Contract Type |
Volume Transacted |
Contract Price | |||
| Crude Oil |
||||||
| October 2015 – December 2015 |
Collar | 1,600 Bbls/d | $84.00/Bbl - $91.00/Bbl | |||
| October 2015 – December 2015 |
Collar | 1,000 Bbls/d | $90.00/Bbl - $102.50/Bbl | |||
| October 2015 – December 2015 |
Three-Way Collar |
500 Bbls/d | $75.00/Bbl - $84.00/Bbl - $94.00/Bbl | |||
| October 2015 – December 2015 |
Three-Way Collar |
500 Bbls/d | $75.00/Bbl - $84.00/Bbl - $95.00/Bbl | |||
| October 2015 – December 2016 |
Swap | 750 Bbls/d | $62.52/Bbl | |||
| Natural Gas |
||||||
| October 2015 – December 2015 |
Swap | 200,000 MMBtu/month | $4.10/MMBtu | |||
| October 2015 – December 2015 |
Collar | 130,000 MMBtu/month | $4.00/MMBtu - $4.25/MMBtu | |||
| March 2016 – December 2016 |
Swap | 200,000 MMBtu/month | $2.93/MMBtu | |||
Conference Call Information and Summary Presentation
The Company will host a conference call on Thursday, November 5, 2015, at 10:00 a.m. Central Time (11:00 a.m. Eastern Time) to discuss financial and operational results for third quarter 2015. The conference call may be accessed via the Company’s website at www.approachresources.com or by phone:
Dial in: (877) 201-0168
Intl. dial in: (647) 788-4901
Passcode: Approach / 54939494
A replay of the call will be available on the Company’s website or by dialing (855) 859-2056 (passcode: 54939494).
In addition, a third quarter 2015 summary presentation is available on the Company’s website.
|
3 |
About Approach Resources
Approach Resources Inc. is an independent energy company focused on the exploration, development, production and acquisition of unconventional oil and gas reserves in the Midland Basin of the greater Permian Basin in West Texas. For more information about the Company, please visit www.approachresources.com. Please note that the Company routinely posts important information about the Company under the Investor Relations section of its website.
Forward-Looking and Cautionary Statements
This press release contains forward-looking statements within the meaning of Section 27A of the Securities Act of 1933 and Section 21E of the Securities Exchange Act of 1934. All statements, other than statements of historical facts, included in this press release that address activities, events or developments that the Company expects, believes or anticipates will or may occur in the future are forward-looking statements. Without limiting the generality of the foregoing, forward-looking statements contained in this press release specifically include expectations of anticipated financial and operating results. These statements are based on certain assumptions made by the Company based on management’s experience, perception of historical trends and technical analyses, current conditions, anticipated future developments and other factors believed to be appropriate and reasonable by management. When used in this press release, the words “will,” “potential,” “believe,” “estimate,” “intend,” “expect,” “may,” “should,” “anticipate,” “could,” “plan,” “predict,” “project,” “profile,” “model” or their negatives, other similar expressions or the statements that include those words, are intended to identify forward-looking statements, although not all forward-looking statements contain such identifying words. Such statements are subject to a number of assumptions, risks and uncertainties, many of which are beyond the control of the Company, which may cause actual results to differ materially from those implied or expressed by the forward-looking statements. Further information on such assumptions, risks and uncertainties is available in the Company’s Securities and Exchange Commission (“SEC”) filings. The Company’s SEC filings are available on the Company’s website at www.approachresources.com. Any forward-looking statement speaks only as of the date on which such statement is made and the Company undertakes no obligation to correct or update any forward-looking statement, whether as a result of new information, future events or otherwise, except as required by applicable law.
|
4 |
UNAUDITED RESULTS OF OPERATIONS
| Three Months Ended September 30, |
Nine Months Ended September 30, |
|||||||||||||||
| 2015 | 2014 | 2015 | 2014 | |||||||||||||
| Revenues (in thousands): |
||||||||||||||||
| Oil |
$ | 20,213 | $ | 47,194 | $ | 67,142 | $ | 140,509 | ||||||||
| NGLs |
5,311 | 11,628 | 16,067 | 33,486 | ||||||||||||
| Gas |
8,417 | 9,302 | 22,635 | 29,464 | ||||||||||||
|
|
|
|
|
|
|
|
|
|||||||||
| Total oil, NGL and gas sales |
33,941 | 68,124 | 105,844 | 203,459 | ||||||||||||
| Realized gain (loss) on commodity derivatives |
12,755 | (764 | ) | 37,937 | (5,423 | ) | ||||||||||
|
|
|
|
|
|
|
|
|
|||||||||
| Total oil, NGL and gas sales including derivative impact |
$ | 46,696 | $ | 67,360 | $ | 143,781 | $ | 198,036 | ||||||||
|
|
|
|
|
|
|
|
|
|||||||||
| Production: |
||||||||||||||||
| Oil (MBbls) |
490 | 507 | 1,483 | 1,482 | ||||||||||||
| NGLs (MBbls) |
488 | 392 | 1,266 | 1,057 | ||||||||||||
| Gas (MMcf) |
3,285 | 2,445 | 8,721 | 6,727 | ||||||||||||
|
|
|
|
|
|
|
|
|
|||||||||
| Total (MBoe) |
1,525 | 1,306 | 4,202 | 3,659 | ||||||||||||
| Total (MBoe/d) |
16.6 | 14.2 | 15.4 | 13.4 | ||||||||||||
| Average prices: |
||||||||||||||||
| Oil (per Bbl) |
$ | 41.27 | $ | 93.14 | $ | 45.28 | $ | 94.84 | ||||||||
| NGLs (per Bbl) |
10.89 | 29.70 | 12.69 | 31.69 | ||||||||||||
| Gas (per Mcf) |
2.56 | 3.80 | 2.60 | 4.38 | ||||||||||||
|
|
|
|
|
|
|
|
|
|||||||||
| Total (per Boe) |
$ | 22.26 | $ | 52.17 | $ | 25.19 | $ | 55.60 | ||||||||
| Realized gain (loss) on commodity derivatives (per Boe) |
8.36 | (0.58 | ) | 9.03 | (1.49 | ) | ||||||||||
|
|
|
|
|
|
|
|
|
|||||||||
| Total including derivative impact (per Boe) |
$ | 30.62 | $ | 51.59 | $ | 34.22 | $ | 54.11 | ||||||||
| Costs and expenses (per Boe): |
||||||||||||||||
| Lease operating |
$ | 5.04 | $ | 5.87 | $ | 5.17 | $ | 6.41 | ||||||||
| Production and ad valorem taxes |
1.77 | 2.55 | 2.02 | 3.40 | ||||||||||||
| Exploration |
1.28 | 0.68 | 1.00 | 0.98 | ||||||||||||
| General and administrative(1) |
4.77 | 5.88 | 5.45 | 6.45 | ||||||||||||
| Depletion, depreciation and amortization |
20.47 | 19.88 | 20.50 | 21.35 | ||||||||||||
| (1) Below is a summary of general and administrative expense: |
||||||||||||||||
| General and administrative – cash component |
$ | 3.65 | $ | 4.37 | $ | 4.02 | $ | 4.89 | ||||||||
| General and administrative – noncash component (share-based compensation) |
1.12 | 1.51 | 1.43 | 1.56 | ||||||||||||
|
5 |
APPROACH RESOURCES INC. AND SUBSIDIARIES
UNAUDITED CONSOLIDATED STATEMENTS OF OPERATIONS
(In thousands, except shares and per-share amounts)
| Three Months Ended | Nine Months Ended | |||||||||||||||
| September 30, | September 30, | |||||||||||||||
| 2015 | 2014 | 2015 | 2014 | |||||||||||||
| REVENUES: |
||||||||||||||||
| Oil, NGL and gas sales |
$ | 33,941 | $ | 68,124 | $ | 105,844 | $ | 203,459 | ||||||||
| EXPENSES: |
||||||||||||||||
| Lease operating |
7,681 | 7,665 | 21,744 | 23,462 | ||||||||||||
| Production and ad valorem taxes |
2,700 | 3,335 | 8,502 | 12,429 | ||||||||||||
| Exploration |
1,956 | 891 | 4,211 | 3,595 | ||||||||||||
| General and administrative |
7,270 | 7,675 | 22,882 | 23,612 | ||||||||||||
| Termination costs |
1,436 | — | 1,436 | — | ||||||||||||
| Impairment of oil and gas properties |
220,197 | — | 220,197 | — | ||||||||||||
| Depletion, depreciation and amortization |
31,222 | 25,959 | 86,146 | 78,138 | ||||||||||||
|
|
|
|
|
|
|
|
|
|||||||||
| Total expenses |
272,462 | 45,525 | 365,118 | 141,236 | ||||||||||||
|
|
|
|
|
|
|
|
|
|||||||||
| OPERATING (LOSS) INCOME |
(238,521 | ) | 22,599 | (259,274 | ) | 62,223 | ||||||||||
| OTHER: |
||||||||||||||||
| Interest expense, net |
(6,465 | ) | (5,442 | ) | (18,630 | ) | (15,936 | ) | ||||||||
| Gain on debt extinguishment |
1,483 | — | 1,483 | — | ||||||||||||
| Equity in losses of investee |
— | — | — | (186 | ) | |||||||||||
| Realized gain (loss) on commodity derivatives |
12,755 | (764 | ) | 37,937 | (5,423 | ) | ||||||||||
| Unrealized gain (loss) on commodity derivatives |
296 | 18,810 | (22,929 | ) | 5,206 | |||||||||||
| Other expense |
(91 | ) | — | (53 | ) | (109 | ) | |||||||||
|
|
|
|
|
|
|
|
|
|||||||||
| (LOSS) INCOME BEFORE INCOME TAX (BENEFIT) PROVISION |
(230,543 | ) | 35,203 | (261,466 | ) | 45,775 | ||||||||||
| INCOME TAX (BENEFIT) PROVISION: |
(81,756 | ) | 12,756 | (93,121 | ) | 16,590 | ||||||||||
|
|
|
|
|
|
|
|
|
|||||||||
| NET (LOSS) INCOME |
$ | (148,787 | ) | $ | 22,447 | $ | (168,345 | ) | $ | 29,185 | ||||||
|
|
|
|
|
|
|
|
|
|||||||||
| (LOSS) EARNINGS PER SHARE: |
||||||||||||||||
| Basic |
$ | (3.67 | ) | $ | 0.57 | $ | (4.16 | ) | $ | 0.74 | ||||||
|
|
|
|
|
|
|
|
|
|||||||||
| Diluted |
$ | (3.67 | ) | $ | 0.57 | $ | (4.16 | ) | $ | 0.74 | ||||||
|
|
|
|
|
|
|
|
|
|||||||||
| WEIGHTED AVERAGE SHARES OUTSTANDING: |
||||||||||||||||
| Basic |
40,541,420 | 39,363,441 | 40,419,187 | 39,325,552 | ||||||||||||
| Diluted |
40,541,420 | 39,379,779 | 40,419,187 | 39,340,961 | ||||||||||||
|
6 |
UNAUDITED SELECTED FINANCIAL DATA
| Unaudited Consolidated Balance Sheet Data |
September 30, | December 31, | ||||||
| (in thousands) | 2015 | 2014 | ||||||
| Cash and cash equivalents |
$ | 319 | $ | 432 | ||||
| Other current assets |
32,233 | 60,647 | ||||||
| Property and equipment, net, successful efforts method |
1,175,455 | 1,331,659 | ||||||
| Other assets |
821 | — | ||||||
|
|
|
|
|
|||||
| Total assets |
$ | 1,208,828 | $ | 1,392,738 | ||||
|
|
|
|
|
|||||
| Current liabilities |
$ | 45,195 | $ | 106,852 | ||||
| Long-term debt(1) |
515,593 | 391,311 | ||||||
| Other long-term liabilities |
36,163 | 120,248 | ||||||
| Stockholders’ equity |
611,877 | 774,327 | ||||||
|
|
|
|
|
|||||
| Total liabilities and stockholders’ equity |
$ | 1,208,828 | $ | 1,392,738 | ||||
|
|
|
|
|
|||||
| (1) | Long-term debt is net of debt issuance costs of $7.4 million and $8.7 million as of September 30, 2015 and December 31, 2014, respectively. |
Supplemental Non-GAAP Financial and Other Measures
This release contains certain financial measures that are non-GAAP measures. We have provided reconciliations below of the non-GAAP financial measures to the most directly comparable GAAP financial measures and on the Non-GAAP Financials page in the Investor Relations section of our website at www.approachresources.com.
Adjusted Net (Loss) Income
This release contains the non-GAAP financial measures adjusted net (loss) income and adjusted net (loss) income per diluted share, which excludes (1) unrealized (gain) loss on commodity derivatives, (2) rig termination fees, (3) impairment of oil and gas properties, (4) termination costs, (5) gain on debt extinguishment, and (6) related income tax effect. The amounts included in the calculation of adjusted net (loss) income and adjusted net (loss) income per diluted share below were computed in accordance with GAAP. We believe adjusted net (loss) income and adjusted net (loss) income per diluted share are useful to investors because they provide readers with a more meaningful measure of our profitability before recording certain items whose timing or amount cannot be reasonably determined. However, these measures are provided in addition to, and not as an alternative for, and should be read in conjunction with, the information contained in our financial statements prepared in accordance with GAAP (including the notes), included in our SEC filings and posted on our website.
The table below provides a reconciliation of adjusted net (loss) income and adjusted net (loss) income per diluted share to net (loss) income for the three and nine months ended September 30, 2015 and 2014 (in thousands, except per-share amounts).
|
7 |
| Three Months Ended September 30, |
Nine Months Ended September 30, |
|||||||||||||||
| 2015 | 2014 | 2015 | 2014 | |||||||||||||
| Net (loss) income |
$ | (148,787 | ) | $ | 22,447 | $ | (168,345 | ) | $ | 29,185 | ||||||
| Adjustments for certain items: |
||||||||||||||||
| Unrealized (gain) loss on commodity derivatives |
(296 | ) | (18,810 | ) | 22,929 | (5,206 | ) | |||||||||
| Rig termination fees |
1,701 | — | 2,199 | — | ||||||||||||
| Impairment of oil and gas properties |
220,197 | — | 220,197 | — | ||||||||||||
| Termination costs |
1,436 | — | 1,436 | — | ||||||||||||
| Gain on debt extinguishment |
(1,483 | ) | — | (1,483 | ) | — | ||||||||||
| Related income tax effect |
(78,623 | ) | 6,816 | (86,926 | ) | 1,886 | ||||||||||
|
|
|
|
|
|
|
|
|
|||||||||
| Adjusted net (loss) income |
$ | (5,855 | ) | $ | 10,453 | $ | (9,993 | ) | $ | 25,865 | ||||||
|
|
|
|
|
|
|
|
|
|||||||||
| Adjusted net (loss) income per diluted share |
$ | (0.14 | ) | $ | 0.27 | $ | (0.25 | ) | $ | 0.66 | ||||||
|
|
|
|
|
|
|
|
|
|||||||||
EBITDAX
We define EBITDAX as net (loss) income, plus (1) exploration expense, (2) depletion, depreciation and amortization expense, (3) share-based compensation expense, (4) impairment of oil and gas properties, (5) unrealized loss (gain) on commodity derivatives, (6) gain on debt extinguishment, (7) termination costs, (8) interest expense, net, and (9) income tax (benefit) provision. EBITDAX is not a measure of net income or cash flow as determined by GAAP. The amounts included in the calculation of EBITDAX were computed in accordance with GAAP. EBITDAX is presented herein and reconciled to the GAAP measure of net income because of its wide acceptance by the investment community as a financial indicator of a company’s ability to internally fund development and exploration activities. This measure is provided in addition to, and not as an alternative for, and should be read in conjunction with, the information contained in our financial statements prepared in accordance with GAAP (including the notes), included in our SEC filings and posted on our website.
The table below provides a reconciliation of EBITDAX and EBITDAX per diluted share to net (loss) income for the three and nine months ended September 30, 2015 and 2014 (in thousands, except per-share amounts).
| Three Months Ended September 30, |
Nine Months Ended September 30, |
|||||||||||||||
| 2015 | 2014 | 2015 | 2014 | |||||||||||||
| Net (loss) income |
$ | (148,787 | ) | $ | 22,447 | $ | (168,345 | ) | $ | 29,185 | ||||||
| Exploration |
1,956 | 891 | 4,211 | 3,595 | ||||||||||||
| Depletion, depreciation and amortization |
31,222 | 25,959 | 86,146 | 78,138 | ||||||||||||
| Share-based compensation |
1,708 | 1,965 | 6,000 | 5,726 | ||||||||||||
| Impairment of oil and gas properties |
220,197 | — | 220,197 | — | ||||||||||||
| Unrealized (gain) loss on commodity derivatives |
(296 | ) | (18,810 | ) | 22,929 | (5,206 | ) | |||||||||
| Gain on debt extinguishment |
(1,483 | ) | — | (1,483 | ) | — | ||||||||||
| Termination costs |
1,436 | — | 1,436 | — | ||||||||||||
| Interest expense, net |
6,465 | 5,442 | 18,630 | 15,936 | ||||||||||||
| Income tax (benefit) provision |
(81,756 | ) | 12,756 | (93,121 | ) | 16,590 | ||||||||||
|
|
|
|
|
|
|
|
|
|||||||||
| EBITDAX |
$ | 30,662 | $ | 50,650 | $ | 96,600 | $ | 143,964 | ||||||||
|
|
|
|
|
|
|
|
|
|||||||||
| EBITDAX per diluted share |
$ | 0.76 | $ | 1.29 | $ | 2.39 | $ | 3.66 | ||||||||
|
|
|
|
|
|
|
|
|
|||||||||
|
8 |
Cash Operating Expenses
We define cash operating expenses as operating expenses, excluding (1) exploration expense, (2) depletion, depreciation and amortization expense, (3) share-based compensation expense, (4) termination costs, and (5) impairment of oil and gas properties. Cash operating expenses is not a measure of operating expenses as determined by GAAP. The amounts included in the calculation of cash operating expenses were computed in accordance with GAAP. Cash operating expenses is presented herein and reconciled to the GAAP measure of operating expenses. We use cash operating expenses as an indicator of the Company’s ability to manage its operating expenses and cash flows. This measure is provided in addition to, and not as an alternative for, and should be read in conjunction with, the information contained in our financial statements prepared in accordance with GAAP (including the notes), included in our SEC filings and posted on our website.
The table below provides a reconciliation of cash operating expenses to operating expenses for the three and nine months ended September 30, 2015 and 2014 (in thousands, except per-Boe amounts).
| Three Months Ended September 30, |
Nine Months Ended September 30, |
|||||||||||||||
| 2015 | 2014 | 2015 | 2014 | |||||||||||||
| Operating expenses |
$ | 272,462 | $ | 45,525 | $ | 365,118 | $ | 141,236 | ||||||||
| Exploration |
(1,956 | ) | (891 | ) | (4,211 | ) | (3,595 | ) | ||||||||
| Depletion, depreciation and amortization |
(31,222 | ) | (25,959 | ) | (86,146 | ) | (78,138 | ) | ||||||||
| Share-based compensation |
(1,708 | ) | (1,965 | ) | (6,000 | ) | (5,726 | ) | ||||||||
| Termination costs |
(1,436 | ) | — | (1,436 | ) | — | ||||||||||
| Impairment of oil and gas properties |
(220,197 | ) | — | (220,197 | ) | — | ||||||||||
|
|
|
|
|
|
|
|
|
|||||||||
| Cash operating expenses |
$ | 15,943 | $ | 16,710 | $ | 47,128 | $ | 53,777 | ||||||||
|
|
|
|
|
|
|
|
|
|||||||||
| Cash operating expenses per Boe |
$ | 10.45 | $ | 12.79 | $ | 11.21 | $ | 14.70 | ||||||||
|
|
|
|
|
|
|
|
|
|||||||||
Liquidity
Liquidity is calculated by adding the net funds available under our revolving credit facility and cash and cash equivalents. We use liquidity as an indicator of the Company’s ability to fund development and exploration activities. However, this measurement has limitations. This measurement can vary from year-to-year for the Company and can vary among companies based on what is or is not included in the measurement on a company’s financial statements. This measurement is provided in addition to, and not as an alternative for, and should be read in conjunction with, the information contained in our financial statements prepared in accordance with GAAP (including the notes), included in our SEC filings and posted on our website.
The table below summarizes our liquidity at September 30, 2015 (in thousands).
| Liquidity at September 30, 2015 |
||||
| Borrowing base |
$ | 450,000 | ||
| Cash and cash equivalents |
319 | |||
| Senior secured credit facility – outstanding borrowings |
(278,000 | ) | ||
| Outstanding letters of credit |
(325 | ) | ||
|
|
|
|||
| Liquidity |
$ | 171,994 | ||
|
|
|
|||
|
9 |
 Third Quarter 2015 Results NOVEMBER 4, 2015 Exhibit 99.2 |
 Forward-looking statements 2 Cautionary statements regarding oil & gas quantities Third Quarter 2015 Results – November 2015 This presentation contains forward-looking statements within the meaning of Section 27A of the Securities Act of 1933 and Section 21E of the
Securities Exchange Act of 1934. All statements, other than statements of
historical facts, included in this presentation that address activities, events or developments that the Company expects, believes or anticipates will or may occur in the future are forward-looking statements. Without limiting the generality of the foregoing,
forward-looking statements contained in this presentation
specifically include the expectations of management regarding plans, strategies, objectives, anticipated financial and operating results of the Company, including as to the Company’s Wolfcamp shale resource play, estimated resource potential and recoverability of the oil and gas, estimated reserves and
drilling locations, capital expenditures, typical well results and well
profiles, type curve, and production and operating expenses guidance included in the presentation. These statements are based on certain assumptions made by the Company based on management's experience and technical analyses, current conditions, anticipated future developments and
other factors believed to be appropriate and believed to be reasonable by
management. When used in this presentation, the words “will,” “potential,” “believe,” “intend,” “expect,” “may,” “should,”
“anticipate,” “could,” “estimate,” “plan,”
“predict,” “project,” “target,” “profile,” “model” or their negatives, other similar expressions or the statements that include those words, are
intended to identify forward-looking statements, although not all
forward-looking statements contain such identifying words. Such statements are subject to a number of assumptions, risks and uncertainties, many of which are beyond the control of the Company, which may cause actual results to differ materially
from those implied or expressed by the forward-looking statements. In
particular, careful consideration should be given to the cautionary statements and risk factors described in the Company's most recent Annual Report on Form 10-K and Quarterly Reports on Form 10-Q. Any forward-looking statement speaks only as of the date on
which such statement is made and the Company undertakes no obligation to
correct or update any forward-looking statement, whether as a result of new information, future events or otherwise, except as required by applicable law. The Securities and Exchange Commission (“SEC”) permits oil and gas companies, in their filings with the SEC, to disclose only proved,
probable and possible reserves that meet the SEC’s definitions for
such terms, and price and cost sensitivities for such reserves, and prohibits disclosure of resources that do not constitute such reserves. The Company uses the terms “estimated ultimate recovery” or “EUR,” reserve or resource “potential,” and other descriptions of
volumes of reserves potentially recoverable through additional drilling
or recovery techniques that the SEC’s rules may prohibit the Company from including in filings with the SEC. These estimates are by their nature more speculative than estimates of proved, probable and possible reserves and accordingly are subject to substantially greater risk of being actually realized by the
Company. EUR estimates, identified drilling locations and resource potential estimates have not
been risked by the Company. Actual locations drilled and quantities that may be ultimately recovered from the Company’s interest may differ substantially from the Company’s estimates. There is no commitment by the
Company to drill all of the drilling locations that have been attributed
these quantities. Factors affecting ultimate recovery include the scope of the Company’s drilling project, which will be directly affected by the availability of capital, drilling and production costs, availability of drilling and completion services and equipment, drilling results, lease expirations,
regulatory approval and actual drilling results, as well as geological
and mechanical factors. Estimates of unproved reserves, type/decline curves, per well EUR and resource potential may change significantly as development of the Company’s oil and gas assets provides additional data. Type/decline curves, estimated EURs, resource potential, recovery factors and well costs represent Company estimates based on evaluation of
petrophysical analysis, core data and well logs, well performance
from limited drilling and recompletion results and seismic data, and have not been reviewed by independent engineers. These are presented as hypothetical recoveries if assumptions and estimates regarding recoverable hydrocarbons, recovery factors and costs prove correct. The Company
has limited production experience with this project, and accordingly,
such estimates may change significantly as results from more wells are evaluated. Estimates of resource potential and EURs do not constitute reserves, but constitute estimates of contingent resources which the SEC has determined are too speculative to include in SEC filings.
Unless otherwise noted, IRR estimates are before taxes and assume NYMEX
forward-curve oil and gas pricing and Company-generated EUR and decline curve estimates based on Company drilling and completion cost estimates that do not include land, seismic or G&A costs. |
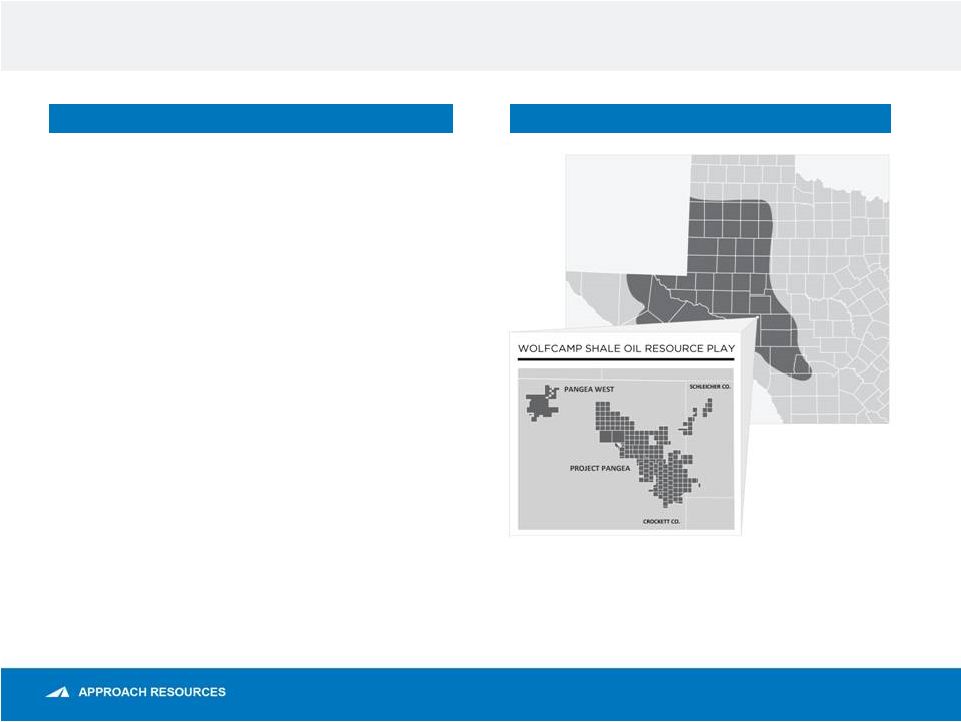 Company overview AREX OVERVIEW ASSET OVERVIEW Enterprise value $630MM High-quality reserve base 146 MMBoe proved reserves 66% Liquids, 38% oil $1.4 BN proved PV-10 Permian core operating area 142,000 gross (130,000 net) acres ~1+ BnBoe gross, unrisked resource potential ~2,000 Identified HZ drilling locations targeting Wolfcamp A/B/C Capital program focused on flexibility and returns - Aligned capital spending with cash flow - Cost reductions improving drilling IRRs - With limited land obligations and no service contracts, capital spending program is largely discretionary 3 Third Quarter 2015 Results – November 2015 Note: Proved reserves as of 12/31/2014 and acreage as of 9/30/2015. All Boe and Mcfe calculations are based on a 6 to 1 conversion ratio.
Enterprise value is equal to market capitalization using the closing
share price of $2.82 per share on 11/3/2015, plus net debt as of 9/30/2015. See “PV-10 (unaudited)” slide.
|
 3Q15 Key highlights 4 3Q15 HIGHLIGHTS • Drilled 4 and completed 5 HZ wells • Continued improvement on already best-in- class cost structure • Increased 3Q15 production 17% YoY to 16.6 MBoe/d • Reduced cash operating cost 18% YoY to $10.45/Boe • Reduced LOE 14% YoY to $5.04/Boe 3Q15 SUMMARY RESULTS Production (MBoe/d) 16.6 % Oil 32% % Total liquids 64% Average realized price ($/Boe) Average realized price, excluding commodity derivatives impact $ 22.26 Average realized price, including commodity derivatives impact 30.62 Costs and expenses ($/Boe) LOE $ 5.04 Production and ad valorem taxes 1.77 Exploration 1.28 General and administrative 4.77 G&A – cash component 3.65 G&A – noncash component 1.12 DD&A 20.47 Note: See “Cash operating expenses” slide. Third Quarter 2015 Results – November 2015 |
 3Q15 Operating highlights Maximizing Returns • LOE of $5.04/Boe, improved 14% YoY • Implemented further cost saving initiatives which should lower LOE and G&A by $5 -
$7MM annually starting FY2016
• 3Q15 Cash operating costs totaled $10.45/Boe, an 18% decrease compared to 3Q14
and a 5% improvement over 2Q15
Tracking Development Plan • Drilled 4 HZ wells and completed 5 HZ wells, with 4 wells currently waiting on completion • Wolfcamp B – 3 wells and Wolfcamp C – 2 wells • 3Q15 HZ Wolfcamp average IP 931 Boe/d (65% oil, 84% liquids) Delivering Production Growth • Record total quarterly production of 16.6 MBoe/d (up 10% QoQ) • Quarterly oil production of 5.3 MBbl/d 5 Note: See “Cash operating expenses” slide. Third Quarter 2015 Results – November 2015 OPERATING HIGHLIGHTS |
 3Q15 Financial highlights Preserving Cash Flow • Quarterly EBITDAX (non-GAAP) of $30.7 MM, or $0.76 per diluted share • Capital expenditures of $19.8 MM ($17.9 MM for D&C) • Remain well-hedged for the balance of 2015, added 2016 gas hedges Stable Financial Position • Liquidity of $172MM at September 30 th • Following recent Fall 2015 redetermination, lender commitments and borrowing base
set at $450 MM Continued Focus on Cutting Costs • Revenues (pre-hedge) of $33.9 MM, $46.7 MM with hedges • Adjusted net loss (non-GAAP) of $5.9 MM, or $0.14 per diluted share • Every per-unit cash cost metric has improved by double-digits since 3Q14
6 Third Quarter 2015 Results – November 2015 Note: See “Adjusted Net Income,” “EBITDAX,” and “Strong, Simple Balance Sheet” slides.
FINANCIAL HIGHLIGHTS |
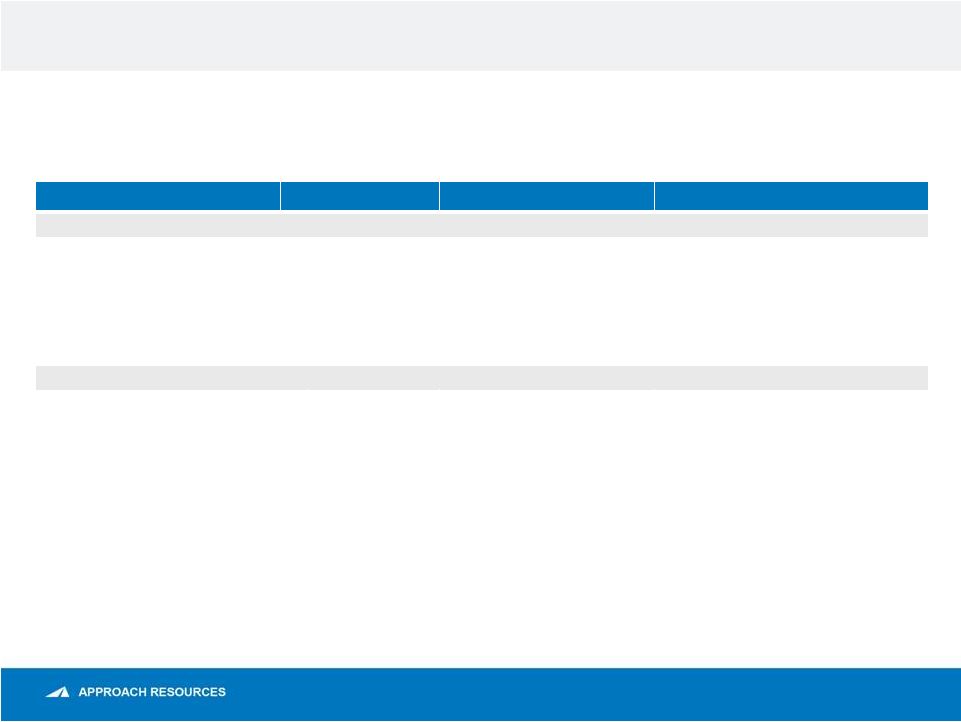
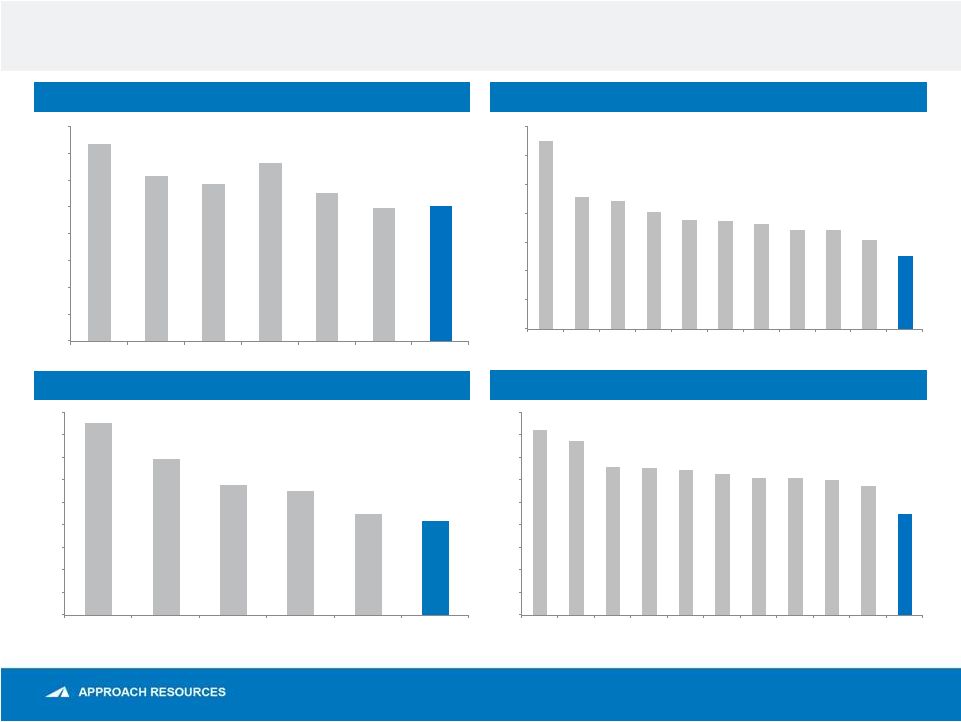 Lowest cost structure in the Permian Basin 7 $7.36 $6.18 $5.87 $6.65 $5.55 $4.97 $5.04 $0.00 $1.00 $2.00 $3.00 $4.00 $5.00 $6.00 $7.00 $8.00 1Q14 2Q14 3Q14 4Q14 1Q15 2Q15 3Q15 AREX LOE Historical Track Record ($/Boe) Permian Peer LOE ($/Boe) AREX D&C Historical Track Record ($ MM) Permian Peer D&C Cost ($ MM) $13.02 $9.12 $8.90 $8.12 $7.59 $7.51 $7.30 $6.90 $6.84 $6.18 $5.04 $0.0 $2.0 $4.0 $6.0 $8.0 $10.0 $12.0 $14.0 $8.6 $7.0 $5.8 $5.5 $4.5 $4.2 $0.0 $1.0 $2.0 $3.0 $4.0 $5.0 $6.0 $7.0 $8.0 $9.0 2011 2012 2013 2014 Current 3Q15 Best Well $8.3 $7.8 $6.6 $6.6 $6.5 $6.3 $6.1 $6.1 $6.0 $5.8 $4.5 $0.0 $1.0 $2.0 $3.0 $4.0 $5.0 $6.0 $7.0 $8.0 $9.0 Source: Company presentations and public filings, peer data as of 2Q15. Peers include CPE, CWEI, CXO, EGN, FANG, LPI, MTDR, PE, PXD, and RSPP. Third Quarter 2015 Results – November 2015 Peer 1 Peer 2 Peer 3 Peer 4 Peer 5 Peer 6 Peer 7 Peer 8 Peer 9 Peer 10 AREX Peer 1 Peer 2 Peer 3 Peer 4 Peer 5 Peer 6 Peer 7 Peer 8 Peer 9 Peer 10 AREX |
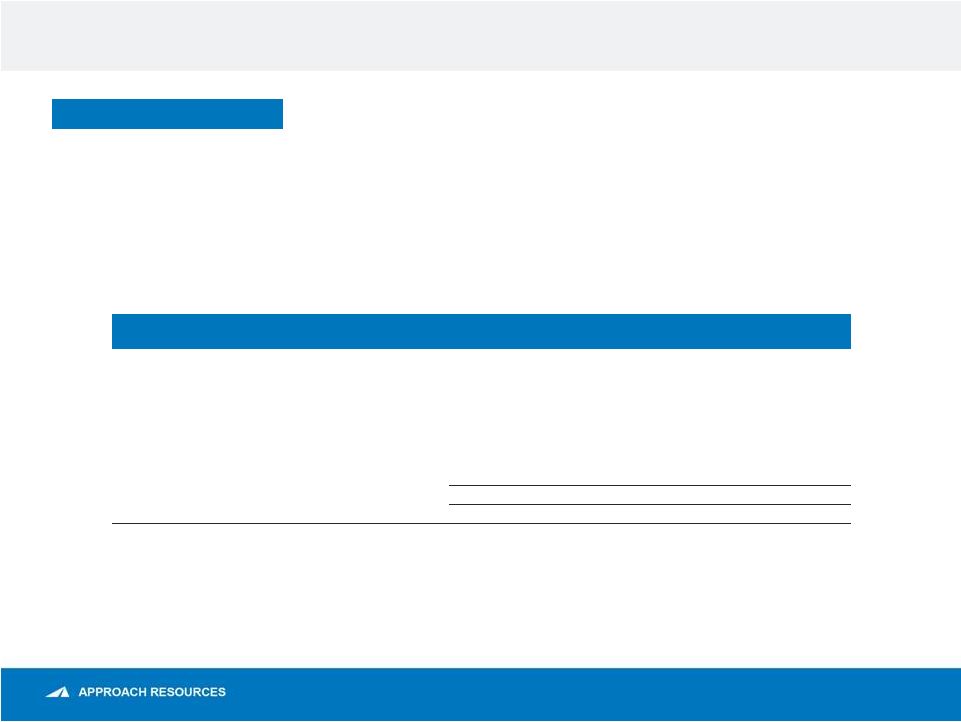
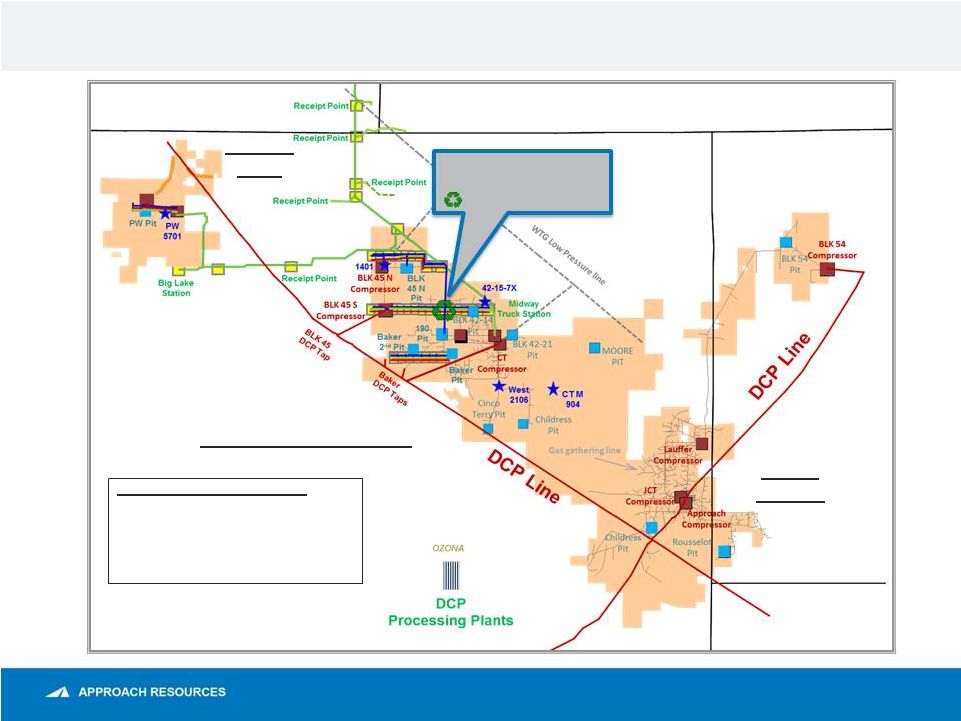 Established infrastructure in place is critical to low cost structure
8 Benefits of water recycling • Reduce D&C cost • Reduce LOE • Increase project profit margin • Minimize fresh water use, truck traffic and surface disturbance Pangea West North & Central Pangea South Pangea Schleicher Crockett Irion Reagan Sutton Recently completed water recycling facility 329,000 Bbl Capacity Third Quarter 2015 Results – November 2015 |
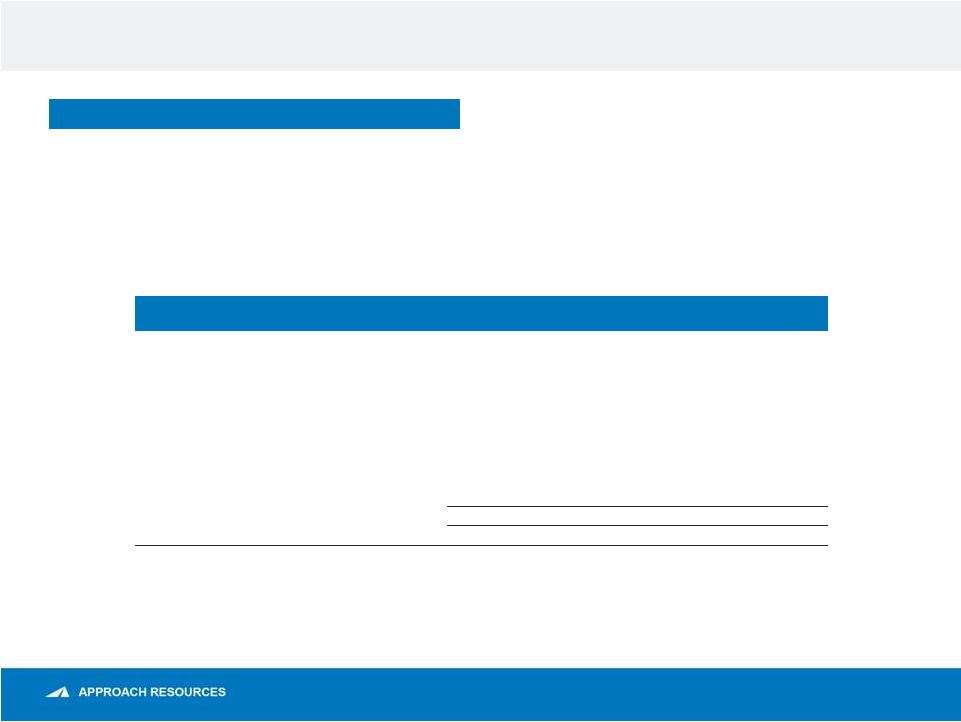
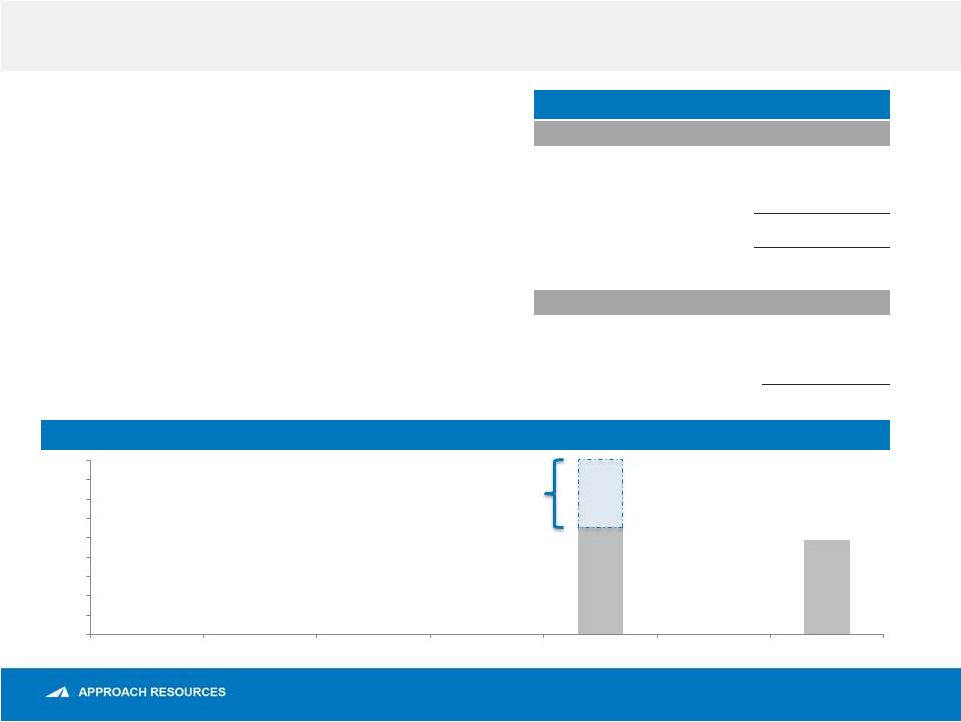 Strong, simple balance sheet 9 AREX Liquidity and Capitalization • Following the Fall 2015 redetermination, we had a $1 billion senior secured revolving credit facility in place, with aggregate lender commitments and borrowing base of $450 MM • Current liquidity of $172 MM is more than adequate given capital budget is aligned with cash flow • LTM EBITDAX / LTM Interest of 5.8x, well above minimum 2.5x covenant requirement • Current ratio of 4.2x, well above minimum 1.0x covenant requirement • No near-term debt maturities AREX Debt Maturity Schedule ($ MM) AREX Capitalization as of 9/30/2015 ($ MM) Cash $0.3 Credit Facility 275.6 7.0% Senior Notes due 2021 240.0 Total Long-Term Debt 1 $515.6 Shareholders’ Equity 611.9 Total Book Capitalization $1,127.5 AREX Liquidity as of 9/30/2015 Borrowing Base $450.0 Cash and Cash Equivalents 0.3 Borrowings under Credit Facility (278.0) Undrawn Letters of Credit (0.3) Liquidity $172.0 $172 MM undrawn borrowing capacity 7.0% Senior Notes 1. Long-term debt is net of debt issuance costs of $7.4 million as of September 30, 2015
Third Quarter 2015 Results – November 2015
$278.0 $245.0 $0.0 $50.0 $100.0 $150.0 $200.0 $250.0 $300.0 $350.0 $400.0 $450.0 2015 2016 2017 2018 2019 2020 2021 |
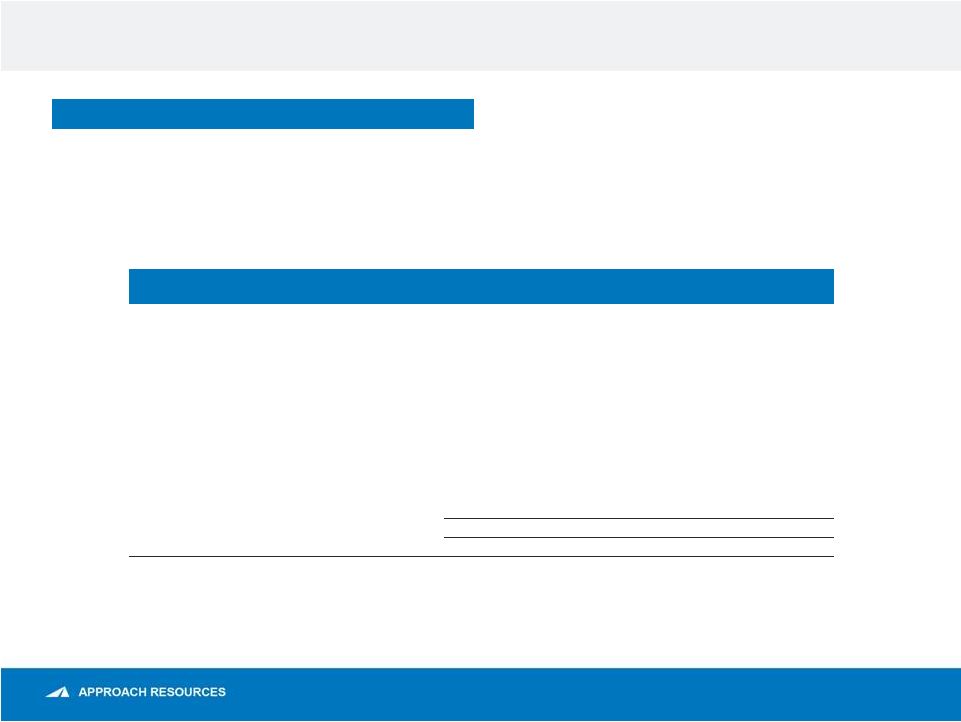
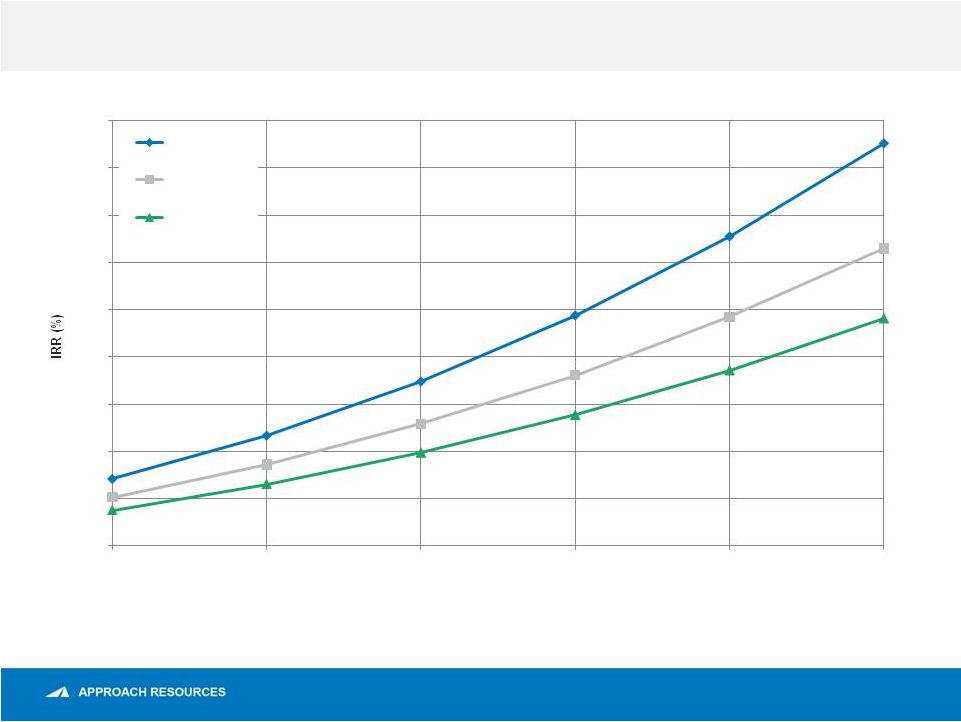 D&C Cost reductions will significantly improve profitability
10 Note: HZ Wolfcamp economics assume $4.00/Mcf realized natural gas price and NGL price based on 40% of realized oil price. Third Quarter 2015 Results – November 2015 0% 10% 20% 30% 40% 50% 60% 70% 80% 90% $40 $50 $60 $70 $80 $90 Realized Oil Price ($/Bbl) $3.5MM D&C $4.0MM D&C $4.5MM D&C |
 Current hedge position 11 Commodity & Period Contract Type Volume Contract Price Crude Oil October 2015 – December 2015 Collar 1,600 Bbls/d $84.00/Bbl - $91.00/Bbl October 2015 – December 2015 Collar 1,000 Bbls/d $90.00/Bbl - $102.50/Bbl October 2015 – December 2015 3-way Collar 500 Bbls/d $75.00/Bbl - $84.00/Bbl - $94.00/Bbl October 2015 – December 2015 3-way Collar 500 Bbls/d $75.00/Bbl - $84.00/Bbl - $95.00/Bbl October 2015 – December 2016 Swap 750 Bbls/d $62.52/Bbl Natural Gas October 2015 – December 2015 Swap 200,000 MMBtu/month $4.10/MMBtu October 2015 – December 2015 Collar 130,000 MMBtu/month $4.00/MMBtu - $4.25/MMBtu March 2016 – December 2016 Swap 200,000 MMBtu/month $2.93/MMBtu • Based on the midpoint of current 2015 guidance, approximately 88% of forecasted 4Q15 oil production and
34% of forecasted natural gas production are hedged at weighted average floor prices of
$74.78/Bbl and $4.06/MMBtu, respectively.
Third Quarter 2015 Results – November 2015
|
 Production and expense guidance 12 2015 Guidance Production Oil (MBbls) 1,900 – 1,975 NGLs (MBbls) 1,575 – 1,625 Natural Gas (MMcf) 11,550 – 11,700 Total (MBoe) 5,400 – 5,550 Operating costs and expenses (per Boe) Lease operating $5.50 - $6.50 Production and ad valorem taxes 7.50% of oil & gas revenues Cash general and administrative $3.75 - $4.25 Exploration (non-cash) $0.50 - $1.00 Depletion, depreciation and amortization $20.00 - $22.00 Capital expenditures (in millions) ~$150 Third Quarter 2015 Results – November 2015 |
 Appendix |
 Adjusted net (loss) income (unaudited) 14 (in thousands, except per-share amounts) Three Months Ended September 30, Nine Months Ended September 30, 2015 2014 2015 2014 Net (loss) income $ (148,787) $ 22,447 $ (168,345) $ 29,185 Adjustments for certain items: Unrealized (gain) loss on commodity derivatives (296) (18,810) 22,929 (5,206) Rig termination fees 1,701 - 2,199 - Impairment of oil and gas properties 220,197 - 220,197 - Termination costs 1,436 - 1,436 - Gain on debt extinguishment (1,483) - (1,483) - Related income tax effect (78,623) 6,816 (86,926) 1,886 Adjusted net (loss) income $ (5,855) $ 10,453 $ (9,993) $ 25,865 Adjusted net (loss) income per diluted share $ (0.14) $ 0.27 $ (0.25) $ 0.66 The amounts included in the calculation of adjusted net (loss) income and adjusted net (loss) income per diluted share below were computed in accordance with GAAP. We believe adjusted net income and adjusted net income per diluted share are useful to investors because they provide readers with a more meaningful measure of our profitability before recording certain items whose timing or amount cannot be reasonably determined. However, these measures are provided in addition to, and not as an alternative for, and should be read in conjunction with, the information contained in our financial statements prepared in accordance with GAAP (including the notes), included in our SEC filings and posted on our website. The following table provides a reconciliation of adjusted net (loss) income to net (loss) income for the three and nine months ended September 30, 2015 and 2014. ADJUSTED NET (LOSS) INCOME (UNAUDITED) Third Quarter 2015 Results – November 2015 |
 EBITDAX (unaudited) 15 EBITDAX (UNAUDITED) The amounts included in the calculation of EBITDAX were computed in accordance with GAAP. EBITDAX is not a measure of net income or cash flow as determined by GAAP. EBITDAX is presented herein and reconciled to the GAAP measure of net income because of its wide acceptance by the investment community as a financial indicator of a company's ability to internally fund development and exploration activities. This measure is provided in addition to, and not as an alternative for, and should be read in conjunction with, the information contained in our financial statements prepared in accordance with GAAP (including the notes), included in our SEC filings and posted on our website. The following table provides a reconciliation of EBITDAX to net (loss) income for the three and nine months ended September 30, 2015 and 2014. (in thousands, except per-share amounts) Three Months Ended September 30, Nine Months Ended September 30, 2015 2014 2015 2014 Net (loss) income $ (148,787) $ 22,447 $ (168,345) $ 29,185 Exploration 1,956 891 4,211 3,595 Depletion, depreciation and amortization 31,222 25,959 86,146 78,138 Share-based compensation 1,708 1,965 6,000 5,726 Impairment of oil and gas properties 220,197 - 220,197 - Unrealized (gain) loss on commodity derivatives (296) (18,810) 22,929 (5,206) Gain on debt extinguishment (1,483) - (1,483) - Termination costs 1,436 - 1,436 - Interest expense, net 6,465 5,442 18,630 15,936 Income tax (benefit) provision (81,756) 12,756 (93,121) 16,590 EBITDAX $ 30,662 $ 50,650 $ 96,600 $ 143,964 EBITDAX per diluted share $ 0.76 $ 1.29 $ 2.39 $ 3.66 Third Quarter 2015 Results – November 2015 |
 Cash operating expenses 16 Cash operating expenses We define cash operating expenses as operating expenses, excluding (1) exploration expense, (2) depletion, depreciation and amortization expense, (3) share-based compensation expense, (4) termination costs, and (5) impairment of oil and gas properties. Cash operating expenses is not a measure of operating expenses as determined by GAAP. The amounts included in the calculation of cash operating expenses were computed in accordance with GAAP. Cash operating expenses is presented herein and reconciled to the GAAP measure of operating expenses. We use cash operating expenses as an indicator of the Company’s ability to manage its operating expenses and cash flows. This measure is provided in addition to, and not as an alternative for, and should be read in conjunction with, the information contained in our financial statements prepared in accordance with GAAP (including the notes), included in our SEC filings and posted on our website. The following table provides a reconciliation of cash operating expenses to operating expenses for the three and nine months ended September 30, 2015 and 2014. (in thousands, except per-Boe amounts) Three Months Ended September 30, Nine Months Ended September 30, 2015 2014 2015 2014 Operating expenses $ 272,462 $ 45,525 $ 365,118 $ 141,236 Exploration (1,956) (891) (4,211) (3,595) Depletion, depreciation and amortization (31,222) (25,959) (86,146) (78,138) Share-based compensation (1,708) (1,965) (6,000) (5,726) Termination costs (1,436) - (1,436) - Impairment of oil and gas properties (220,197) - (220,197) - Cash operating expenses $ 15,943 $ 16,710 $ 47,128 $ 53,777 Cash operating expenses per Boe $ 10.45 $ 12.79 $ 11.21 $ 14.70 Third Quarter 2015 Results – November 2015 |
 F&D costs (unaudited) 17 F&D Cost reconciliation Cost summary (in thousands) Property acquisition costs Unproved properties $ 4,578 Proved properties - Exploration costs 3,831 Development costs 382,995 Total costs incurred $ 391,404 Reserves summary (MBoe) Balance – 12/31/2013 114,661 Extensions & discoveries 43,247 Production (1) (5,281) Revisions to previous estimates (6,379) Balance – 12/31/2014 146,248 F&D cost ($/Boe) All-in F&D cost $ 10.62 Drill-bit F&D cost 8.94 Reserve replacement ratio Drill-bit 819% (1) Production includes 1,390 MMcf related to field fuel. Third Quarter 2015 Results – November 2015 All-in finding and development (“F&D”) costs are
calculated by dividing the sum of property acquisition costs,
exploration costs and development costs for the year by the sum of
reserve extensions and discoveries, purchases of minerals in place and total revisions for the year. Drill-bit F&D costs are calculated by dividing
the sum of exploration costs and development costs for the year by
the total of reserve extensions and discoveries for the year.
We believe that providing F&D cost is useful to assist in an evaluation of how much it
costs the Company, on a per Boe basis, to add proved reserves. However, these
measures are provided in addition to, and not as an alternative for, and
should be read in conjunction with, the information contained in our
financial statements prepared in accordance with GAAP (including the
notes), included in our previous SEC filings and to be included in our
annual report on Form 10-K to be filed with the SEC on February 26,
2015. Due to various factors, including timing differences, F&D costs do not necessarily reflect precisely the costs associated with particular reserves. For example,
exploration costs may be recorded in periods before the periods in which related
increases in reserves are recorded, and development costs may be recorded
in periods after the periods in which related increases in reserves are
recorded. In addition, changes in commodity prices can affect the
magnitude of recorded increases (or decreases) in reserves independent of
the related costs of such increases. As a result of the above factors and various factors that could materially affect the
timing and amounts of future increases in reserves and the timing and
amounts of future costs, including factors disclosed in our filings with
the SEC, we cannot assure you that the Company’s future F&D
costs will not differ materially from those set forth above.
Further, the methods used by us to calculate F&D costs may differ significantly from methods used by other companies to compute similar measures. As a result, our
F&D costs may not be comparable to similar measures provided by other companies.
The following table reconciles our estimated F&D costs for 2014 to the information
required by paragraphs 11 and 21 of ASC 932-235. |
 PV-10 (unaudited) 18 (in millions) December 31, 2014 PV-10 $ 1,413 Less income taxes: Undiscounted future income taxes (1,267) 10% discount factor 910 Future discounted income taxes (357) Standardized measure of discounted future net cash flows $ 1,056 Third Quarter 2015 Results – November 2015 The present value of our proved reserves, discounted at 10% (“PV-10”), was estimated at $1.4 billion at December 31, 2014, and was
calculated based on the first-of-the-month, twelve-month
average prices for oil, NGLs and gas, of $94.56 per Bbl of oil, $31.50 per Bbl of NGLs and $4.55 per MMBtu of natural gas. PV-10 is our estimate of the present value of future net revenues from proved oil and gas reserves after deducting estimated production and
ad valorem taxes, future capital costs and operating expenses, but before
deducting any estimates of future income taxes. The estimated future net revenues are discounted at an annual rate of 10% to determine their “present value.” We believe PV-10 to be an important measure for evaluating the relative significance of our oil and gas properties
and that the presentation of the non-GAAP financial measure of
PV-10 provides useful information to investors because it is widely used by professional analysts and investors in evaluating oil and gas companies. Because there are many unique factors that can impact an individual company when estimating the amount of future income taxes to be paid, we believe the
use of a pre-tax measure is valuable for evaluating the Company. We
believe that PV-10 is a financial measure routinely used and calculated similarly by other companies in the oil and gas industry. The following table reconciles PV-10 to our standardized measure of discounted future net cash flows, the most directly comparable measure
calculated and presented in accordance with GAAP. PV-10 should
not be considered as an alternative to the standardized measure as computed under GAAP. |
 Contact information SERGEI KRYLOV Executive Vice President & Chief Financial Officer 817.989.9000 ir@approachresources.com www.approachresources.com |
Serious News for Serious Traders! Try StreetInsider.com Premium Free!
You May Also Be Interested In
- FEMSA Files 2023 SEC Annual Report
- Timberland Bancorp Reports Second Fiscal Quarter Net Income of $5.71 Million
- Flushing Financial Corporation Reports 1Q24 GAAP and Core EPS of $0.12 and $0.14, Respectively; Excellent Quality Driven by Low Risk Credit Profile
Create E-mail Alert Related Categories
SEC FilingsSign up for StreetInsider Free!
Receive full access to all new and archived articles, unlimited portfolio tracking, e-mail alerts, custom newswires and RSS feeds - and more!
