

Form 6-K CREDIT SUISSE GROUP AG For: Oct 22
 Tweet
Tweet Share
ShareUNITED STATES
SECURITIES AND EXCHANGE COMMISSION
Washington, D.C. 20549
______________
Form 6-K
______________
REPORT OF FOREIGN PRIVATE ISSUER PURSUANT TO RULE 13a-16 OR 15d-16
UNDER THE SECURITIES EXCHANGE ACT OF 1934
October 22, 2015
Commission File Number 001-15244
CREDIT SUISSE GROUP AG
(Translation of registrant’s name into English)
Paradeplatz 8, 8001 Zurich, Switzerland
(Address of principal executive office)
______________
Commission File Number 001-33434
CREDIT SUISSE AG
(Translation of registrant’s name into English)
Paradeplatz 8, 8001 Zurich, Switzerland
(Address of principal executive office)
______________
Indicate by check mark whether the registrant files or will file annual reports under cover of Form 20-F or Form 40-F.
|
Form 20-F ☒
|
Form 40-F ☐
|
Indicate by check mark if the registrant is submitting the Form 6-K in paper as permitted by Regulation S-T Rule 101(b)(1):
Note: Regulation S-T Rule 101(b)(1) only permits the submission in paper of a Form 6-K if submitted solely to provide an attached annual report to security holders.
Indicate by check mark if the registrant is submitting the Form 6-K in paper as permitted by Regulation S-T Rule 101(b)(7):
Note: Regulation S-T Rule 101(b)(7) only permits the submission in paper of a Form 6-K if submitted to furnish a report or other document that the registrant foreign private issuer must furnish and make public under the laws of the jurisdiction in which the registrant is incorporated, domiciled or legally organized (the registrant’s “home country”), or under the rules of the home country exchange on which the registrant’s securities are traded, as long as the report or other document is not a press release, is not required to be and has not been distributed to the registrant’s security holders, and, if discussing a material event, has already been the subject of a Form 6-K submission or other Commission filing on EDGAR.
This report on Form 6-K of Credit Suisse Group AG and Credit Suisse AG hereby incorporates by reference into the Registration Statement on Form F-3 (file no. 333-202913) and the Registration Statement on Form S-8 (file no. 333-101259) the following slides of the presentation “Overview of Financials and Capital” by David Mathers: Slide no. 10, Slide no. 32, Slide no. 38, Slide no. 42 and Slide no. 43.

October 22, 2015 Credit Suisse Strategy and ObjectivesTidjane Thiam

Disclaimer The 3Q15 financial information is subject to further review We have not finalized our 3Q15 Financial Report and our independent registered public accounting firm has not completed its review of the condensed consolidated financial statements (unaudited) for the period. Accordingly, the 3Q15 financial information contained in this presentation is subject to completion of quarter-end procedures, which may result in changes to that information. Certain reclassifications have been made to prior periods to conform to the current presentation.The re-segmented financial information is preliminary and subject to further review Unless otherwise noted, this presentation contains certain historical financial information that has been re-segmented to approximate what our results under our new structure would have been, had it been in place from January 1, 2014. Such information is preliminary in nature and subject to review, evaluation and refinement, has not been audited or reviewed by our independent public accountants and can be expected to change in certain respects before any final re-segmentation is published. In addition, “Illustrative”, “Ambition” and “Goal” presentations are not intended to be viewed as targets or projections, nor are they considered to be Key Performance Indicators. All such presentations are subject to a large number of inherent risks, assumptions and uncertainties, many of which are completely outside of our control. Accordingly, this information should not be relied on for any purpose. We may not achieve the benefits of our strategic initiatives We may not achieve all of the expected benefits of our strategic initiatives. Factors beyond our control, including but not limited to the market and economic conditions, changes in laws, rules or regulations and other challenges discussed in our public filings, could limit our ability to achieve some or all of the expected benefits of these initiatives. Cautionary statement regarding forward -looking statements This presentation contains forward-looking statements that involve inherent risks and uncertainties, and we might not be able to achieve the predictions, forecasts, projections and other outcomes we describe or imply in forward-looking statements. A number of important factors could cause results to differ materially from the plans, objectives, expectations, estimates and intentions we express in these forward-looking statements, including those we identify in "Risk Factors” in our Annual Report on Form 20-F for the fiscal year ended December 31, 2014 and in “Cautionary statement regarding forward-looking information" in our second quarter 2015 Financial Report filed with the US Securities and Exchange Commission, and in other public filings and press releases. We do not intend to update these forward-looking statements except as may be required by applicable law. Statement regarding capital, liquidity and leverage As of January 1, 2013, Basel 3 was implemented in Switzerland along with the Swiss “Too Big to Fail” legislation and regulations thereunder (in each case, subject to certain phase-in periods). As of January 1, 2015, the Bank for International Settlements (BIS) leverage ratio framework, as issued by the Basel Committee on Banking Supervision (BCBS), was implemented in Switzerland by FINMA. Our related disclosures are in accordance with our interpretation of such requirements, including relevant assumptions. Changes in the interpretation of these requirements in Switzerland or in any of our assumptions or estimates could result in different numbers from those shown in this presentation. Capital and ratio numbers for periods prior to 2013 are based on estimates, which are calculated as if the Basel 3 framework had been in place in Switzerland during such periods. Unless otherwise noted, leverage exposure is based on the BIS leverage ratio framework and consists of period-end balance sheet assets and prescribed regulatory adjustments. Leverage amounts for 4Q14, which are presented in order to show meaningful comparative information, are based on estimates which are calculated as if the BIS leverage ratio framework had been implemented in Switzerland at such time. Beginning in 2015, the Swiss leverage ratio is calculated as Swiss total capital, divided by period-end leverage exposure. The look-through BIS tier 1 leverage ratio and CET1 leverage ratio are calculated as look-through BIS tier 1 capital and CET1 capital, respectively, divided by end-period leverage exposure. Selling restrictions This document is not an offer to sell or a solicitation of offers to purchase or subscribe for securities of Credit Suisse Group AG. This document is not a prospectus within the meaning of article 652a of the Swiss Code of Obligations, nor is it a listing prospectus as defined in the listing rules of the SIX Swiss Exchange AG or any other exchange or regulated trading facility in Switzerland or a prospectus under any other applicable laws. Copies of this document may not be sent to jurisdictions, or distributed in or sent from jurisdictions, in which this is barred or prohibited by law. The information contained herein shall not constitute an offer to sell or the solicitation of an offer to buy, in any jurisdiction in which such offer or solicitation would be unlawful prior to registration, exemption from registration or qualification under the securities laws of any jurisdiction. A decision to invest in securities of Credit Suisse Group AG should be based exclusively on a written agreement with Credit Suisse Group AG or an offering and listing prospectus to be published by Credit Suisse Group AG for such purpose. This document and the information contained herein is not for publication or distribution into the United States of America and should not be distributed or otherwise transmitted into the United States or to U.S. persons (as defined in the U.S. Securities Act of 1933, as amended (the “Securities Act”)) or publications with a general circulation in the United States. This document does not constitute an offer or invitation to subscribe for or to purchase any securities in the United States of America. The securities referred to herein have not been and will not be registered under the Securities Act or the laws of any state and may not be offered or sold in the United States of America absent registration or an exemption from registration under Securities Act. There will be no public offering of the securities in the United States of America. The information contained herein does not constitute an offer of securities to the public in the United Kingdom. No prospectus offering securities to the public will be published in the United Kingdom. This document is only being distributed to and is only directed at (i) persons who are outside the United Kingdom or (ii) to investment professionals falling within article 19(5) of the Financial Services and Markets Act 2000 (Financial Promotion) Order 2005 (as amended, the “Order”) or (iii) high net worth entities, and other persons to whom it may lawfully be communicated, falling within article 49(2)(a) to (d) of the Order (all such persons together being referred to as “relevant persons”). The securities are only available to, and any invitation, offer or agreement to subscribe, purchase or otherwise acquire such securities will be engaged in only with, relevant persons. Any person who is not a relevant person should not act or rely on this document or any of its contents. 2 October 21, 2015

1) Subject to approval by EGM (EGM: Extraordinary General Meeting) 2) Until we reach our capital target however, we will recommend CHF 0.70 per share with a scrip alternative; we will discontinue the scrip once we have clarity on regulatory requirements and litigation risks. In any event, we will not continue with the scrip beyond 2017 3 Our strategy is to:Be a leading Private Bank and Wealth Manager with strong Investment Banking capabilities and……grow profitably and generate capital through the cycleWe are taking a number of management actions to improve our ability to generate capital internally, includingRight-sizing the Investment Bank, with significant reduction where returns do not exceed cost of capital;A disciplined capital allocation that combines stable capital consumption and improved business profitability;A reduction in our fixed costs;Transitioning non-core assets and implementing closures.To ensure the Group has the strong capital position required to support the implementation of its strategy, we are complementing these actions by raising external capital1) through the combination of a non-preemptive placing of CHF 1.36bn and a rights issue of CHF 4.70bn. Together these actions will result in a pro-forma CET1 ratio of 12.2% and a pro-forma CET1 leverage ratio of 3.6% based on YE2015 targetsAs the strategy is executed, we intend to generate approximately CHF 23-25bn of Operating Free Capital by 2020 of which we intend to distribute at least 40% to shareholders2)We intend to return excess capital to shareholders October 21, 2015

Our organization 4 Note: New management structure effective October 22, 2015 and will be the basis for our reporting in the fourth quarter of 2015 and the 2015 Annual Report, going forward Chief Executive OfficerTidjane Thiam Chief Operating OfficerPierre-Olivier Bouée Chief Finance OfficerDavid Mathers General CounselRomeo Cerutti Chief Risk OfficerJoachim Oechslin HR & CommsPeter Goerke Chief Compliance & Regulatory OfficerLara Warner Geographic structure will drive client focus and better align with regulationDecentralization will increase accountability and cost competitivenessMaintain global linkages for Investment Banking and TradingMaterial strengthening of controls and increase centralization of information Integrated private and investment bank for our APAC domiciled (U)HNW, corporate, and institutional clients Advisory and underwriting platforms covering the Americas and EMEA International Wealth ManagementIqbal Khan Swiss Universal BankThomas Gottstein AsiaPacificHelman Sitohang Investment Banking & Capital MarketsJim Amine Global MarketsTim O’Hara Sales & trading platforms covering the Americas and EMEA Universal bank for our Swiss domiciled private clients (retail, WM), commercial and institutional clients (excl. AM services) Global WM arm serving our non-Swiss and non-APAC domiciled (U)HNW clients, and Global AM business, including Swiss products and clients October 21, 2015

Profitable growth More than double PTI of Asia Pacific from CHF 0.9bn in 2014 to CHF 2.1bn in 2018Increase PTI in International Wealth Management from CHF 1.3bn in 2014 to CHF 2.1bn in 2018Grow PTI for the Swiss Universal Bank from CHF 1.6bn in 2014 to CHF 2.3bn in 2018Realize CHF 3.5bn in cost reduction by end-2018Invest CHF 1.5bn in growth initiativesLeading overall to an absolute reduction of our cost base by a net CHF 2bn1) to below CHF 19bn, with further potential efficiency gains post-2018 1) Based on 2015 cost base; Cost reduction program measured on constant FX rates and based on expense run rate excluding major litigation expenses in the SRU & restructuring costs, but including other costs to achieve savings.Note: 2018 figures illustrative; Under new structure, new management structure effective October 22, 2015; SRU=Strategic Resolution Unit 5 October 21, 2015

Improve our capital position 6 1 Internal capital generationRight-size the Investment BankReallocate capitalReduce fixed costsTransition non-core assets & implement closures Capital raising 2 October 21, 2015
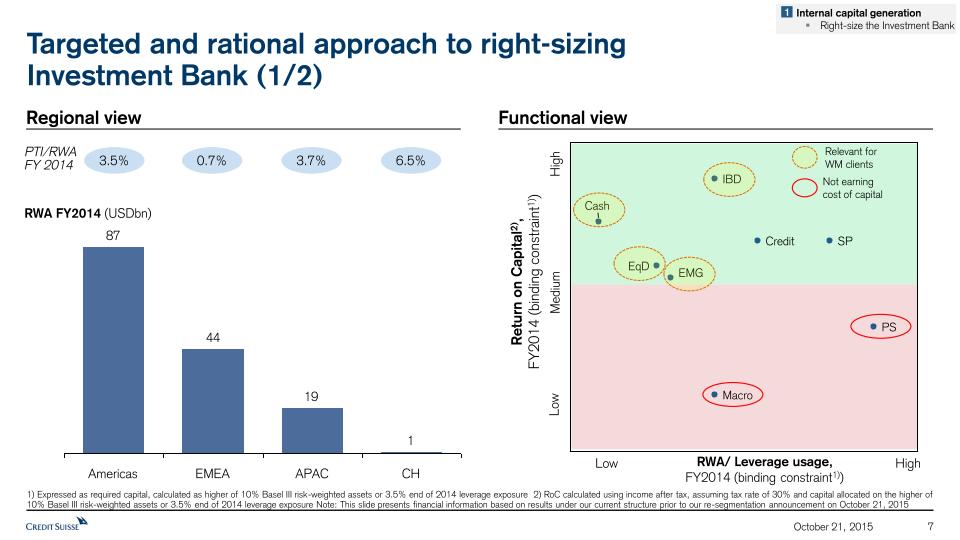
3.5% 0.7% 3.7% 6.5% PTI/RWAFY 2014 1) Expressed as required capital, calculated as higher of 10% Basel III risk-weighted assets or 3.5% end of 2014 leverage exposure 2) RoC calculated using income after tax, assuming tax rate of 30% and capital allocated on the higher of 10% Basel III risk-weighted assets or 3.5% end of 2014 leverage exposure Note: This slide presents financial information based on results under our current structure prior to our re-segmentation announcement on October 21, 2015 Regional view Functional view IBD PS EqD Cash EMG Credit SP Macro Low Medium High RWA/ Leverage usage,FY2014 (binding constraint1)) Low High Return on Capital2), FY2014 (binding constraint1)) Relevant for WM clients Targeted and rational approach to right-sizing Investment Bank (1/2) RWA FY2014 (USDbn) CH APAC EMEA Americas 7 Not earning cost of capital 1 Internal capital generationRight-size the Investment Bank October 21, 2015

Targeted and rational approach to right-sizing Investment Bank(2/2) -79% 20151) 2Q 2015 2Q 2015 -72% 20151) 1) Expected Note: APAC IB included; Strategic business only; This slide presents financial information based on results under our current structure prior to our re-segmentation announcement on October 21, 2015 8 AboveCoC Belowcost ofcapital(CoC) 2Q 2015 158 126 Prime (USD bn) Macro (USDbn) -25% 20151) 2Q 2015 -50% 20151) 2Q 2015 Leverage RWA Leverage RWA RWA down CHF 20bnLeverage down CHF 87bn RWA breakdown, in USDbn YE 2015 target 1 Internal capital generationRight-size the Investment Bank October 21, 2015

Investment Bank: targeted reduction of RWA and Leverage – current structure (incl. APAC) RWA, USDbn (current structure, strategic) 1) Expected 2) Expressed as required capital, calculated as either 10% of Basel III risk-weighted assets or 3.5% of leverage exposure Note: This slide presents financial information based on results under our current structure prior to our re-segmentation announcement on October 21, 2015, strategic only. BIS LVE for leverage exposure 9 Leverage, USDbn (current structure, strategic) YE20151) Below CoC 2Q 2015 158 Above CoC 118 491 Above CoC Below CoC 2Q 2015 YE20151) 635 -63% -16% -42% -13% RoC2) (%) ~19% ~15% ~13% ~10% 1 Internal capital generationRight-size the Investment Bank Includes APAC IB Includes APAC IB October 21, 2015

Planned RWA reduction at Investment Bank optimizes PTI/RWA arbitrage 10 PTI/RWA at YE2015 pro forma Index, (Pre-optimization=100) Maximumcapital release Current plan Pre-optimization Note: Excl. Asia and IBD CH. All numbers based on FYFC 2015 as of 30.09.2015; Source: Credit Suisse data Reduction in RWAvs Pre-optimizationUSD bn -40 -68 1 Internal capital generationRight-size the Investment Bank October 21, 2015

11 1) Expected 2) Illustrative 3) Pre-regulatory change; Post-regulatory change RWA would amount to USD 174bn of which USD 142bn is IB core 4) Strategic Resolution Unit Note: New management structure effective October 22, 2015 IBCM & GM core SRU RWA excl. Ops Risk4) IB (IBCM & GM) RWA and Leverage expected to remainstable after restructuring – new structure IB (IBCM & GM) RWAUSDbn (new structure, incl. SRU) IB (IBCM & GM) LeverageUSDbn (new structure, incl. SRU) IBCM & GM Core SRU4) 1 Internal capital generationRight-size the Investment Bank SRU Ops Risk RWA4) 20202)3) 134 7 20182) 136 YE20151) 154 20202) 430 35 20182) 436 YE20151) 554 Excludes APAC IB Excludes APAC IB October 21, 2015

Improving return on capital – Swiss Universal Bank 1) Expressed as required capital, calculated as higher of 10% Basel III risk-weighted assets or 3.5% end of year leverage exposure 2) Illustrative 3) Target 4) Any such IPO would involve the sale of a minority stake and would be subject to, among other things, all necessary approvals and would be intended to generate / raise additional capital for Credit Suisse AG or Credit Suisse (Schweiz) AG 5) Legal entity Credit Suisse (Schweiz) AG Note: New management structure effective October 22, 2015 12 PTI(CHF bn) RoC1)(%) 1.6 2.33) 2014 2018 Transparency and market disciplineAttractive, stable earnings stream to investorsValue of Swiss franchise highlightedIncentive alignment for management of Swiss Universal Bank5)Currency to take advantage of potential market consolidation IPO4) of Swiss Universal Bank5) expected to support the delivery of growth and profitability 1 Internal capital generationReallocate capital 13% 17%2) October 21, 2015

Improving return on capital and capital allocation 20184) 20153) 26% 27% 20184) 20153) 24% 33% 20184) 20153) 11% 19% APAC IWM Investment Bank (IBCM and GM) % of RWA allocated2) 11% 18% 37% 17% 17% 44% RoC1) 1) RoC calculated using income after tax, assuming tax rate of 30% and capital allocated on the higher of 10% Basel III risk-weighted assets or 3.5% average leverage exposure, based on 9M15 Annualized 2) Excluding Corporate Center and SRU 3) Expected 4) Illustrative Note: New management structure effective October 22, 2015; IBCM=Investment Banking and Capital Markets; GM=Global MarketsNote: Numbers not adding up due to rounding 1 Internal capital generationReallocate capital 13 20184) 20153) 13% 17% Swiss Universal Bank 28% 28% October 21, 2015

1) Expected; 2) Includes LE program, IT architecture simplification, other corporate center programs and realignment costsNote: Cost reduction program measured on constant FX rates and based on expense run rate excluding major litigation expenses in the SRU & restructuring costs, but including other costs to achieve savings; New management structure effective October 22, 2015 Reducing fixed costs while investing in growthIn CHFbn 14 2018cost base target 18.5-19.0 Invest in growth +1.5 Business exits & run-down of additional SRU portfolio -1.3 Workforce strategy, technology & London right-sizing -0.9 Wind-down of Corp. Center costs -0.1 Run-down of SRU portfolio(planned run-down of prior NSU) -0.3 Substantial completion of Corp. Center programs2) -0.9 2015cost base1) 20.5-21.0 CHF -1.2bnpreviously planned cost reduction CHF -2.3bnadditional cost reduction 1 Internal capital generationReduce fixed costs CHF +1.5bnInvestment in growth October 21, 2015

The Group is expected to deliver profitable growth … 15 Illustrative pre-tax income progression, CHFbn Return onTangible Equity C/I ratio1) 10% ~14% 9% 79% ~66% 81% ~+5pp ~(15)pp 2014 Illustrative 2018 9M15 1) Expected, excludes impact of FVoD and certain litigation provisions as disclosed in our Financial Report and assumes a tax rate of 30% for return on tangible equity 2) Includes Corporate Center Note: 2014 and 9M15 reflects Core results; New management structure effective October 22, 2015 ~9 – 10 Illustrative 2018 Strategic Resolution Unit (SRU) wind-down (revenue loss) -0.8 Gross cost savings Growth investment -1.5 Target growth to 2018 3.0-4.0 Full year 2015 pre-tax income1) 4.5 1.1 APAC Swiss Universal Bank Other divisions2) 9M15 Ann. October 21, 2015

… and return capital to shareholdersIllustrative 4Q2015 to 2020, in CHFbn 1) Capital impact from targeted IPO of Credit Suisse (Schweiz) AG as well as disposal of non-core assets, does not include material capital impact / benefit from cost savings and exposure reductions; any such IPO would involve the sale of a minority stake and would be subject to, among other things, all necessary approvals and would be intended to generate / raise additional capital for Credit Suisse AG or Credit Suisse (Schweiz) AG 2) Free Capital generated 3) Including impact on capital applying RWA floors at 60% 4) Net of costs and including relating threshold impact for deferred tax assets; subject to approval by EGM (EGM: Extraordinary General Meeting) 5) Until we reach our capital target however, we will recommend CHF 0.70 per share with a scrip alternative; we will discontinue the scrip once we have clarity on regulatory requirements and litigation risks. In any event, we will not continue with the scrip beyond 2017 Note: Under the free capital generation concept, capital is calculated using 10% to convert RWA into capital and 3.5% for leverage exposure due to the anticipated TBTF requirement of 3.5% CET1 leverage ratio and 10% CET1 requirement; New management structure effective October 22, 2015 IPO & disposals1) CapitalRaise Capital raise plus IPO & disposals Targeted Operating FCG2)4Q15 to ‘20 Free Capital Generated Business moves & Asset disposals Regulatory and Capital Requirements FCG after businessmoves ®. req. Cash dividends accrued5) NetFCG2) OtherIssuances 16 2-4 6.54) 9-11 23-25 33-35 (1) (7)3) 25-27 ~(11) 14-16 0.5 At least 40% of Operating Free Capital generated planned to be returned to shareholders October 21, 2015

Our 3Q15 results further emphasize the need for change Progress on capital “Look-through” Swiss Total Leverage ratio of 4.5%, of which BIS Tier 1 leverage ratio of 3.9% and CET1 leverage ratio of 2.8%“Look-through” CET1 capital slightly down QoQ to 10.2% Asia Pacific 48% year-to-date increase in overall pre-tax income to CHF 1,129mnWealth Management with YoY double-digit growth in NNA in 3Q15 and 9M159M15 Investment Banking revenues increase of 15%, driven by equities Reduce exposure to volatile IB and tilt towards stable, high-return businesses Build a strong capital position Accelerate growth by focusing on UHNWI in other EM APAC key opportunity Private Banking & Wealth Management Strategic pre-tax income of CHF 753mn with RoC of 20%, impacted by weaker client activity and adverse market conditionsStrong strategic NNA of CHF 17.3bn of which CHF 10.5bn from WMC with growth across all regions Strategic pre-tax income of USD 291mn significantly lower QoQ and YoY, primarily due to lower fixed income results driven by muted client activityReduction in leverage exposure to USD 615 bn; early achievement of USD 600-620 bn year-end target Investment Banking Implications for strategy Credit Suisse Group Group pre-tax income (excluding revenue impact from fair value on own debt) of CHF 238mn. Group Strategic pre-tax income for the quarter of CHF 826mn, a 49% decrease from 3Q149M15 return on equity of 9%, of which 11% for the Strategic business Drive capital allocation to high return businesses with cost discipline Note: This slide presents financial information based on results under our current structure prior to our re-segmentation announcement on October 21, 2015 17 October 21, 2015

18 A set of objectives to measure progress Key Metrics, in bn, in CHF unless otherwise specified 2018 target Capital SRU RWA wind-down (ex. OpRisk)Global Markets RWAGlobal Markets Leverage 421) USD ~83-85 (target)USD ~380 (target) 12USD ~83-85USD ~370 1) Number corresponds to the starting point of SRU as it is being established 2) Until we reach our capital target however, we will recommend CHF 0.70 per share with a scrip alternative; we will discontinue the scrip once we have clarity on regulatory requirements and litigation risks. In any event, we will not continue with the scrip beyond 2017 3) After regulatory recalibration in 2019 Note: All metrics on the side based on new organizational structure, new management structure effective October 22, 2015 APAC=Asia-Pacific IWM=International Wealth Management CHUB=Swiss Universal Bank 2014 2015 Profitable growth APAC PTIIWM PTICHUB PTIGroup Cost base 2.12.12.318.5-19.0 0.91.31.6 2018 target CHF 23bn to 25bn of Operating Free Capital generated (FCG) over 5 yearsAt least 40% of Operating FCG to be distributed to shareholders via dividends over the period2) CET1 capital ratio ~13% until 2018 and >11% thereafter3)CET1 leverage ratio above 3.5% October 21, 2015

19 Time (GMT) Topic Speaker 11.00 – 11.05 Welcome Urs Rohner, Chairman of the Board 11.05 – 12.00 Overview & Summary Tidjane Thiam, Chief Executive Officer 12.00 – 13.00 Financials & Capital (incl. 3Q15 results) David Mathers 13.00 – 14.00 Lunch 14.00 – 14.30 Swiss Universal Bank Thomas Gottstein 14.30 – 15.10 Asia Pacific Helman Sitohang 15.10 – 15.40 International Wealth Management Iqbal Khan 15.40 – 16.20 Coffee break 16.20 – 16.40 Global Markets Tim O’Hara 16.40 – 17.00 Investment Banking & Capital Markets Jim Amine 17.00 – 19.30 Q&A session All Agenda for the day October 21, 2015

Agenda for today Credit Suisse Strategy Capital position 1 2 20 October 21, 2015

Our ambition is to be a leading Private Bank and Wealth Manager with strong Investment Banking capabilities Capture the Wealth Management opportunity in Emerging Markets by accelerating growth in Asia Pacific and by replicating our successful model in other Emerging Markets APAC and other EM SwissUniversal Bank InvestmentBank Create a Swiss Universal Bank to expand our position with Swiss private, corporate and institutional clients and participate in domestic consolidation opportunities Right-size the Investment Bank to optimize its profitability and capital usage, reduce volatility of earnings and support Wealth Management customer needs 21 October 21, 2015

31 94 2019 2014 63 Global wealth is expected to continue growing Estimated global wealth development 2014-19, in CHFtr Source: BCG Global Wealth Report 2015. UHNW and HNW individual’s wealth, excl. pension and insurance HNWI=USD1-20mm wealth, UHNWI>USD20mm wealth 22 October 21, 2015

Emerging Markets expected to drive ~60% of wealth increaseby 2019 Estimated global wealth development 2014-19, in CHFtr Source: BCG Global Wealth Report 2015. UHNW and HNW individual’s wealth, excl. pension and insurance HNWI=USD1-20mm wealth, UHNWI>USD20mm wealth Note: Numbers not adding up due to rounding 2014 94 2019 31 63 Mature Markets EmergingMarkets 47% 53% 60% 40% 39% 61% 23 October 21, 2015
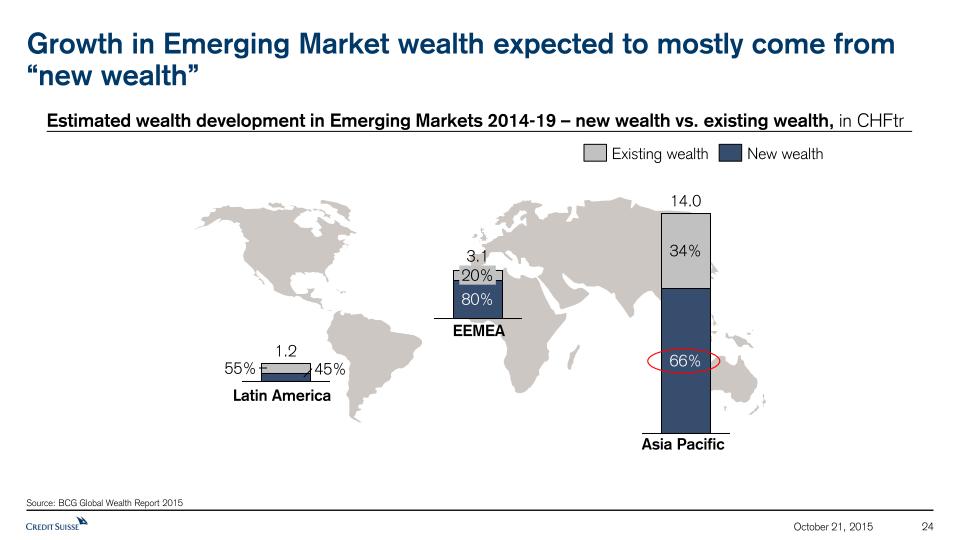
Growth in Emerging Market wealth expected to mostly come from “new wealth” Source: BCG Global Wealth Report 2015 Estimated wealth development in Emerging Markets 2014-19 – new wealth vs. existing wealth, in CHFtr 1.2 45% 55% Existing wealth New wealth Latin America 20% 3.1 80% EEMEA 34% 14.0 66% Asia Pacific 24 October 21, 2015

LatAm Asia1) EEMEA CS client focus 1) Ex-JapanSource: Credit Suisse Research Institute Note: Numbers not adding up due to rounding 4th 3% 3rd 11% 2nd 27% 1st 57% 5th+ 2% 14% 3rd 68% 1st 5th+ 9% 2nd 9% 0% 4th 1st 7% 3rd 16% 5th+ 12% 5% 2nd 4th 61% First generation entrepreneurs driving new wealth generation, not only in Asia but also in other Emerging Markets…Generational ownership 1st to 5th generation (in %) 25 October 21, 2015

… while ownership profile more balanced in Mature MarketsGenerational ownership 1st to 5th generation (in %) 14% 5th+ 3rd 16% 4th 8% 2nd 1st 27% 35% 13% 2nd 1st 5th+ 21% 31% 22% 14% 4th 3rd Western Europe U.S. Source: Credit Suisse Research Institute Note: Numbers not adding up due to rounding 26 October 21, 2015

In Mature Markets, the US is expected to remain the largest pool of wealth US, Japan, Western Europe estimated wealth in 2014 and 2019, in CHFtr WesternEurope 9 Japan 3 US 26 12 3 33 2014 2019 Largest national market: Germany ~CHF 1.4tr Largest national market: Germany ~CHF 2.3tr Source: BCG Global Wealth Report 2015. UHNW and HNW individual’s wealth, excl. pension and insurance 27 October 21, 2015
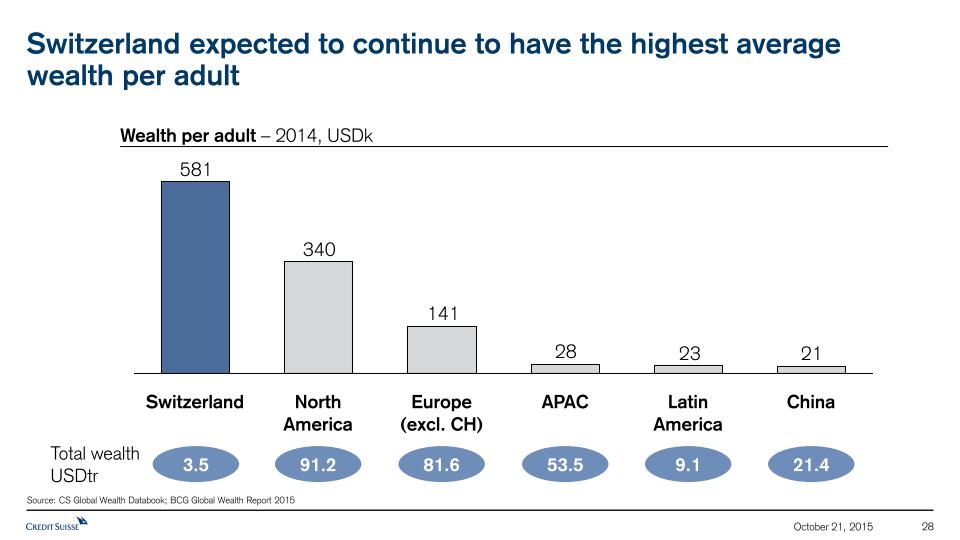
Switzerland expected to continue to have the highest average wealth per adult Source: CS Global Wealth Databook; BCG Global Wealth Report 2015 NorthAmerica Switzerland China LatinAmerica APAC Europe(excl. CH) Wealth per adult – 2014, USDk 3.5 91.2 81.6 53.5 9.1 21.4 Total wealthUSDtr 28 October 21, 2015

Despite slower growth, Mature Markets expected to remain important Source: BCG Global Wealth Report 2015. UHNW and HNW individual’s wealth, excl. pension and insurance HNWI=USD1-20mm wealth, UHNWI>USD20mm wealth Note: Numbers not adding up due to rounding 2019 45% 2017 81 57% 43% 2016 94 53% 47% 2018 87 55% 75 58% MatureMarkets 2015 70 59% 41% 2014 63 61% 39% 2013 54 66% 34% 2012 46 68% 32% Emerging Markets 42% Estimated global wealth in 2012-19, in CHFtr 29 October 21, 2015

The Wealth Management opportunity for Credit Suisse Significant growth in APAC and Other EM + Large pool of wealth in Mature Markets Most attractive long term opportunity for Wealth Management Switzerland – our home market – providing stability to earningsFocused approach in US & Western Europe given highly competitive environment Balanced approach 30 October 21, 2015

Connection with the WM business 1 Invest where direct support toWealth ManagementProtect business with indirect connectivity Targeted and rational approachApply three criteria to determine businesses to be right-sized Right-size the Investment Bank: our approach Profitability 3 Capital usage 2 Keep any business that delivers returns in excess of cost of capitalAvoid cliff effect when right-sizing Focus on real binding constraint – ‘worst of RWA or Leverage’ Improve capital productivity Right-sizing approach 31 October 21, 2015

Revenues generated by UHNW clients from using IB products and services UHNWI needs CS IB solutions CS IB Deal revenue mix1) Financing Investments Hedging Capital markets access Trading Share backed lending / Loan syndication Shares / Funds / Derivatives Interest rate, FX, Equity / Credit ECM / DCM / M&A deals AES / Prime Services for Private Clients 19% 33% 41% 100% 2% 1) Revenue mix of integrated bank revenues where WM clients used episodic IB solutions, based on current reporting structure Note: this slide presents financial information based on results under our current structure prior to our re-segmentation announcement on October 21, 2015 32 2014 October 21, 2015

PTI/RWAFY 2014 1) Expressed as required capital, calculated as higher of 10% Basel III risk-weighted assets or 3.5% end of 2014 leverage exposure 2) RoC calculated using income after tax, assuming tax rate of 30% and capital allocated on the higher of 10% Basel III risk-weighted assets or 3.5% end of 2014 leverage exposure Note: This slide presents financial information based on results under our current structure prior to our re-segmentation announcement on October 21, 2015, APAC IB included Regional view Functional view Strong IB franchise and returns with exception of EMEA region and Macro / Prime Services business RWA FY2014 (USDbn) 33 Americas CH APAC EMEA 3.5% 0.7% 3.7% 6.5% IBD PS EqD Cash EMG Credit SP Macro Low Medium RWA/ Leverage usage,FY2014 (binding constraint1)) Low High Return on Capital2), FY2014 (binding constraint1) Relevant for WM clients Not earning cost of capital High October 21, 2015

Investment Bank: Business profitability and capital allocation RoC1 FY2014 EQ FID IBD Capital FY20141 IBD Credit EQ Derivatives SecuritizedProducts Cash EMG Prime Macro FY2014 IB profitability and capital usage 1) RoC calculated using income after tax, assuming tax rate of 30% and capital allocated on the higher of 10% Basel III risk-weighted assets or 3.5% end of 2014 leverage exposure Note: This slide presents financial information based on results under our current structure prior to our re-segmentation announcement on October 21, 2015, APAC IB included; Represents “fully allocated” view, i.e., IB funding costs, operational risk and Corporate Bank costs have been allocated to individual IB businesses Avg. ~12.5% RoC1 34 October 21, 2015
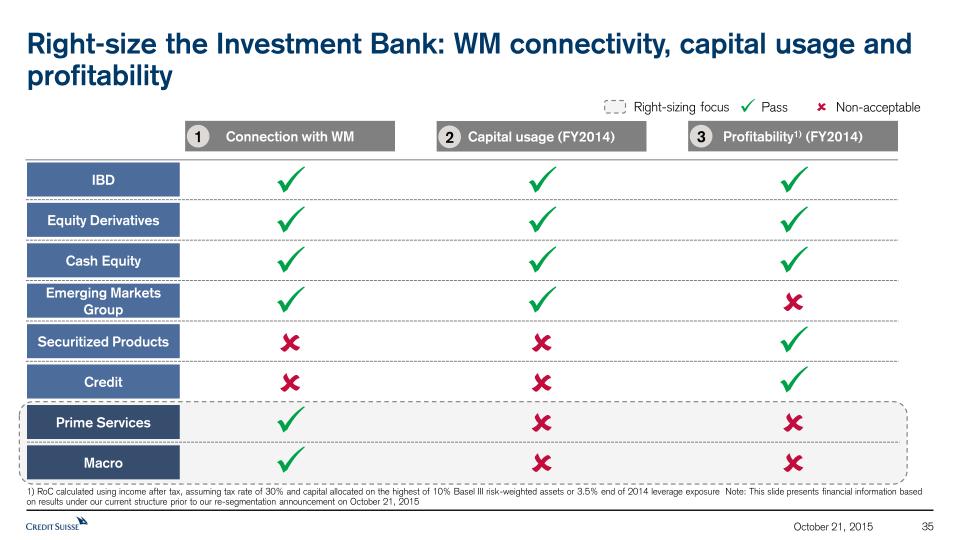
Right-size the Investment Bank: WM connectivity, capital usage and profitability Right-sizing focus 1) RoC calculated using income after tax, assuming tax rate of 30% and capital allocated on the highest of 10% Basel III risk-weighted assets or 3.5% end of 2014 leverage exposure Note: This slide presents financial information based on results under our current structure prior to our re-segmentation announcement on October 21, 2015 û û û û ü ü ü ü ü ü ü ü ü ü ü ü Connection with WM Capital usage (FY2014) Profitability1) (FY2014) IBD Equity Derivatives Cash Equity Securitized Products Credit Emerging Markets Group Prime Services Macro û û ü û û ü ü û Pass Non-acceptable û 1 2 3 35 ü û October 21, 2015

Macro Leverage, in USDbn 2Q15 3Q15 20151) Right-size the Investment Bank: Macro Macro RWA, in USDbn Largely exit in EMEA and APACMaintain core US -79% -72% 1) Expected Note: APAC IB included; Strategic business only; This slide presents financial information based on results under our current structure prior to our re-segmentation announcement on October 21, 2015 36 October 21, 2015
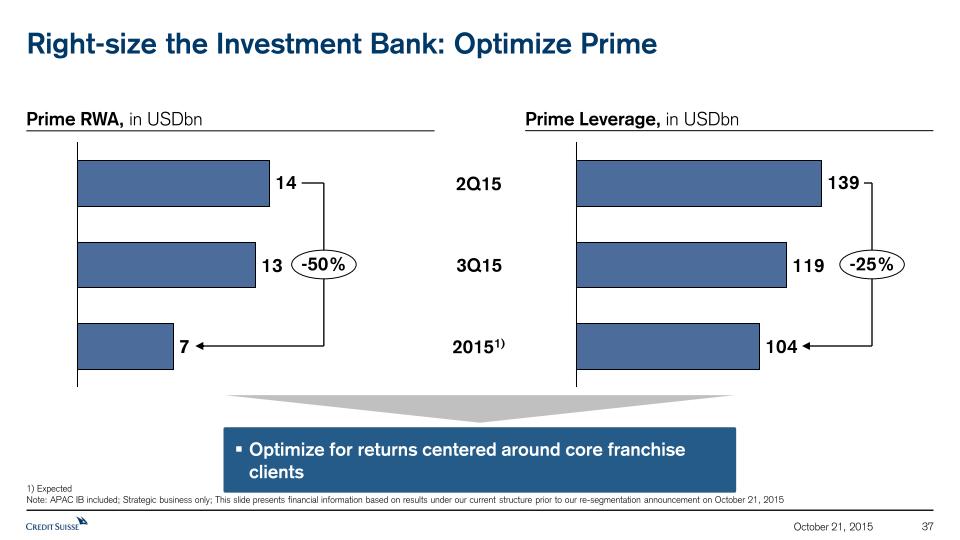
Right-size the Investment Bank: Optimize Prime 2Q15 -25% Optimize for returns centered around core franchise clients -50% Prime Leverage, in USDbn Prime RWA, in USDbn 3Q15 20151) 1) Expected Note: APAC IB included; Strategic business only; This slide presents financial information based on results under our current structure prior to our re-segmentation announcement on October 21, 2015 37 October 21, 2015

2014; USDtr 2030; USDtr CAGR 2014-2030 2.1 9.8 Corporate Bond Value 5.6 1.5 EquitiesCapitalization 9% 9% Corporate Bond Value 5.9 0.7 EquitiesCapitalization 18.9 2.7 12% 15% Corporate Bond Value 42.0 4.8 EquitiesCapitalization 82.4 8.5 15% 15% •% 1) Only Emerging Markets within APACSource: Credit Suisse Research Institute (Emerging Capital Markets: the road to 2030). Latin America EEMEA APAC1) Prime is important for the Equity franchise which is a core component of the Emerging Markets opportunity 38 October 21, 2015

Right-size the Investment Bank: Optimize Prime Investment Bank Monthly Net Revenue Volatility1), in USDbn 1) Source: Credit Suisse Internal DataNotes: APAC IB included; This slide presents financial information based on results under our current structure prior to our re-segmentation announcement on October 21, 2015 06 07 08 09 10 11 12 13 14 1H’15 2.0 1.2 0.8 0.4 0.0 -0.4 -0.8 -2.4 IBD Prime Services Equities Fixed Income 39 October 21, 2015

Right-size the Investment Bank: Optimize Prime 1) Leverage exposure data is spot period-end 2) 2012-14 RoA calculated using 5-quarter average leverage exposures, 2015 quarterly data is calculated using spot period-end leverage exposure 3) ExpectedNotes: SLR – Swiss Leverage Exposure; BIS – Bank for International Settlements; APAC IB included; This slide presents financial information based on results under our current structure prior to our re-segmentation announcement on October 21, 2015 PrimeRoA2)in bps 83 83 94 128 133 2014 SLR 4Q2015 BIS3) 2013 SLR 3Q2015 BIS 2012 SLR PrimeLeverageExposure1)in USDbn -47% Prime Leverage Exposure and Prime Return on Assets 40 October 21, 2015

Investment Bank: targeted reduction of RWA and Leverage RWA, USDbn 1) ExpectedNote: APAC IB included, This slide presents financial information based on results under our current structure prior to our re-segmentation announcement on Oct 21, 2015; Strategic IB business only; BIS LVE for leverage exposure 41 Leverage, USDbn YE 20151) Below CoC 2Q 2015 158 Above CoC 118 491 Above CoC Below CoC 2Q 2015 YE 20151) 635 -63% -16% -42% -13% October 21, 2015

Optimized Investment Bank expected to deliver returns above cost of capital RWA in CHFbn 1) IB new structure, i.e. excl. APAC IB and SRU positions (SRU – Strategic Resolution Unit) 2) 9M15 PTI annualized 3) RoC calculated using income after tax, assuming tax rate of 30% and capital allocated on the highest of 10% Basel III risk-weighted assets or 3.5% leverage exposure 4) Illustrative Note: New management structure effective October 22, 2015 Return on capital3) LE in CHFbn 10%2) 19% PTI in CHFbn 9M15 20184) 92 102 392 369 2.02) 3.5 New Structure: IBCM + Global Markets1) 42 October 21, 2015

APAC: Expected to double revenues – from CHF 3.3bn in 2014 to CHF 6.8bn in 2020Net revenues in CHFbn +13% 20202) 20182) 2014 Context Strategic Actions A leading Entrepreneurs’ Bank with sophisticated advisory solutionsTop equities and credit franchises with disciplined risk management Focus on billionaires, next generation and lower tier entrepreneursGrow credit via bespoke lending solutionsExpand RM base; drive RM productivity through digitalizationReplicate success of Integrated Bank approach in SEA1)Expand footprint in Greater China (China onshore, scaling up China offshore, Taiwan)Address Japan savings opportunity with integrated solutions RevenueCAGR 1) SEA=South-East Asia 2) Illustrative Note: New management structure effective October 22, 2015 43 October 21, 2015

APAC: Profitable growthPTI in CHFbn 44 >2x 20201) 2018Target 2014 Over the period of 2011 to 2014:RM growth +21% AuM growth +70% WMC APAC PTI 4x 1) IllustrativeNote: New management structure effective October 22, 2015 October 21, 2015

IWM: Replicate our success in Asia Pacific in other Emerging MarketsNet revenues in CHFbn +7% 20205) 20185) 2014 1) Euromoney Magazine Survey 2015 for 'Best Private Banking Services Overall‘. Ranking does not distinguish between on/off-shore 2) CEE=Central and Eastern Europe 3) MENA=Middle-East and North Africa 4) Lux=Luxembourg5) Illustrative Note: Includes Asset Management division; New management structure effective October 22, 2015 Context Strategic Actions Leading market positions1) in EM and DM:#1 in CEE2), #1 in MENA3), #2 in LatAm#3 position in Western Europe Create dedicated, fully accountable managerial platform for intl. UHNW clientsDouble lending volume by 2020 (15% p.a.)Grow RMs in EM by 5% p.a. Improve joint PB/IB coverageBuild out London, Lux4), CH as hubs and add new spokes / advisory offices in selected locationsDigitize service model for lower wealth bands: new offering focused on clients <5m AuM 45 RevenueCAGR October 21, 2015

IWM: Profitable growthPTI in CHFbn +13% 20201) 2018 Target 2014 Growth trajectory to benefit from finalization of regularizationTransition sub-scale platforms in Western Europe towards more profitable models CAGR 46 1) IllustrativeNote: New management structure effective October 22, 2015 October 21, 2015
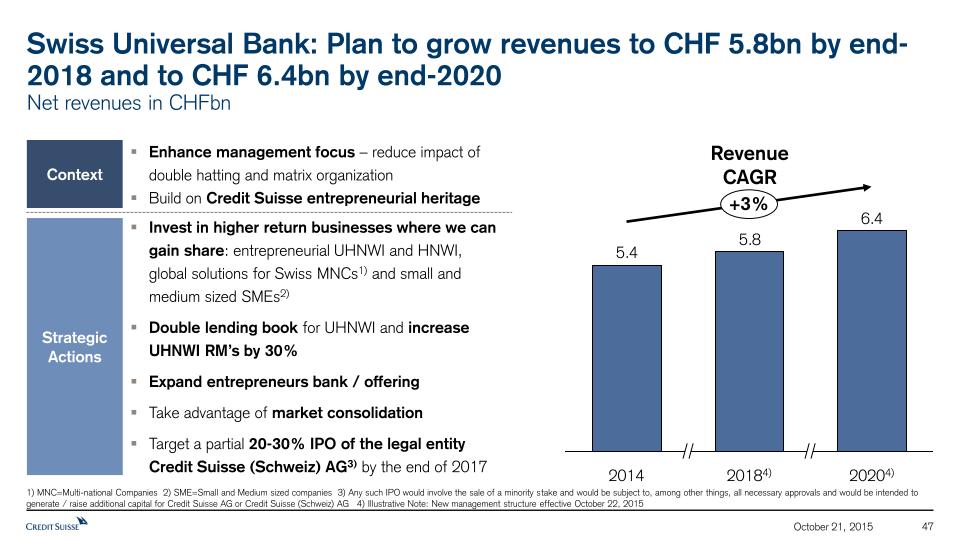
Swiss Universal Bank: Plan to grow revenues to CHF 5.8bn by end-2018 and to CHF 6.4bn by end-2020Net revenues in CHFbn 2014 20204) +3% 20184) Context Strategic Actions Enhance management focus – reduce impact of double hatting and matrix organizationBuild on Credit Suisse entrepreneurial heritage Invest in higher return businesses where we can gain share: entrepreneurial UHNWI and HNWI, global solutions for Swiss MNCs1) and small and medium sized SMEs2)Double lending book for UHNWI and increase UHNWI RM’s by 30%Expand entrepreneurs bank / offeringTake advantage of market consolidationTarget a partial 20-30% IPO of the legal entity Credit Suisse (Schweiz) AG3) by the end of 2017 1) MNC=Multi-national Companies 2) SME=Small and Medium sized companies 3) Any such IPO would involve the sale of a minority stake and would be subject to, among other things, all necessary approvals and would be intended to generate / raise additional capital for Credit Suisse AG or Credit Suisse (Schweiz) AG 4) Illustrative Note: New management structure effective October 22, 2015 47 RevenueCAGR October 21, 2015

Swiss Universal Bank: Profitable growthPTI in CHFbn +11% 20201) 2018 Target 2014 End-to-end accountability and responsibility over Swiss costs and investmentsIncreased cost efficiency through footprint optimization, automation and operational leverage CAGR 48 1) IllustrativeNote: New management structure effective October 22, 2015 October 21, 2015

The Group is expected to deliver profitable growth … 49 Illustrative pre-tax income progression, CHFbn Return onTangible Equity C/I ratio1) 10% ~14% 9% 79% ~66% 81% ~+5pp ~(15)pp 2014 Illustrative 2018 9M15 1) Expected, excludes impact of FVoD and certain litigation provisions as disclosed in our Financial Report and assumes a tax rate of 30% for return on tangible equity 2) Includes Corporate Center Note: 2014 and 9M15 reflects Core results; New management structure effective October 22, 2015 Gross cost savings -0.8 Strategic Resolution Unit (SRU) wind-down (revenue loss) Growth investment -1.5 Target growth to 2018 3.0-4.0 Full year 2015 pre-tax income1) 4.5 1.1 ~9 – 10 Illustrative 2018 APAC Swiss Universal Bank Other divisions2) 9M15 Ann. October 21, 2015

Agenda for today Credit Suisse Strategy Capital position 1 2 50 October 21, 2015

Our current capital position Source: company quarterly financial disclosure Our capital position has impacted our ability to deliver value for our stakeholders:Impacted strategic flexibilityRestricted ability to implement necessary restructuring measuresImpacted the amount of distributions available for shareholders CS vs. select peer’s CET 1 RWA ratios, Q2 2015 10.3% 10.4% 11.0% 11.1% 11.4% 11.4% 11.7% 12.5% 14.4% 51 October 21, 2015

Anticipated regulatory developments highlight need for capital buffer 52 2016 2017 2018 2019 2020 Recalibrated leverage ratio likely to be primary capital constraint until 2019, however… …RWA uplift resulting from capital floors above 60% will drive the binding constraint1) from the start of 2019 Final rules for advanced models expected by 2016 The impact of FRTB will primarily affect market risk assets in investment banking and is estimated at ~50bps2)Our initial estimate of the incremental impact of a floor against revised standard models is 25-100bps2) if the floor is set at 60%, and 100-250bps2) if the floor is set at 70%. The impact of a floor will affect both market and credit risks across both investment banking and private banking assets. These estimates are inherently uncertain given that implementation is expected several years in the future CS targeting ~13% CET1 capital ratio by the end of 2018 Leverage ratio recalibration RWA uplift TBTF rules effective from January 1st, 2019Implied minimum CET1 capital of CHF 35bn required, and minimum Tier 1 capital of CHF 50bn 1) The binding constraint is determined as the worse of 3.5% of leverage exposure and 10% of RWA due to the anticipated TBTF requirement of 3.5% CET 1 leverage ratio and 10% CET 1 requirement 2) Reflects post-mitigation estimates of current expectations Note: New management structure effective October 22, 2015; Future numbers expected / illustrative CET1 capital ratio targeted to remain at ~11% afterimplementation of rules Standardized Approach to counterparty Credit Risk rules effective from January 1st, 2017; minimal impact expected Final Swiss TBTF rules expected imminentlySwiss TBTF rules anticipated to require 5% Tier 1 leverage ratio, and 3.5% CET1 leverage ratio CS targeting 5-6% Tier 1 leverage ratio by end 2017, of which 3.5-4.0% is expected to be met through common equity October 21, 2015
Improve our capital position 53 1 Internal capital generationRight-size the Investment BankReallocate capitalReduce fixed costsTransition non-core assets & implement closures Capital raising 2 October 21, 2015

Evolution of Credit Suisse Group operating expenses, in CHFbn In spite of our efforts, our total cost base has not significantly decreased in absolute terms 2013 2011 2010 2012 2014 54 1 Internal capital generationReduce fixed costs Note: This slide presents financial information based on results under our current structure prior to our re-segmentation announcement on October 21, 2015 October 21, 2015

Shared Services workforce increased by 6,000 FTE from 2011 to 2014 as growth in offshoring was not fully reflected in headcount reduction in the main operating centers Workforce outside CoEs2) Evolution of the Shared Services1) workforce (Employees & Contractors), in FTE 1) Includes all ShS (IT, Finance, Ops, Risk, GC, CRES, TB&C and non-Core ShS) 2) Includes employees, contractors, and outsourced workforce; Centers of Excellences include India, Wroclaw and Raleigh Note: This slide presents financial information based on results under our current structure prior to our re-segmentation announcement on October 21, 2015 Workforce at CoEs2) 34,800 2011 33,600 +6% 2014 39,500 35,000 2013 2012 55 CAGR 1 Internal capital generationReduce fixed costs October 21, 2015

1) Expected; 2) Includes LE program, IT architecture simplification, other corporate center programs and realignment costsNote: Cost reduction program measured on constant FX rates and based on expense run rate excluding major litigation expenses in the SRU & restructuring costs, but including other costs to achieve savings; New management structure effective October 22, 2015 CHF 3.5bn in gross savings which, combined with the planned investments, is expected to lead to an absolute reduction in the cost base by a net CHF2bn to CHF19bn by end-2018 56 Invest in growth 18.5-19.0 2018cost base target +1.5 Business exits & run-down of additional SRU portfolio -1.3 -0.9 Workforce strategy, technology & London right-sizing -0.3 Run-down of SRU portfolio(planned run-down of prior NSU) -0.1 Wind-down of Corp. Center costs Substantial completion of Corp. Center programs2) -0.9 2015cost base1) 20.5-21.0 CHF -1.2bnpreviously planned cost reduction CHF -2.3bnadditional cost reduction 1 Internal capital generationReduce fixed costs CHF +1.5bninvestmentin growth Further cost savings intended beyond 2018 October 21, 2015
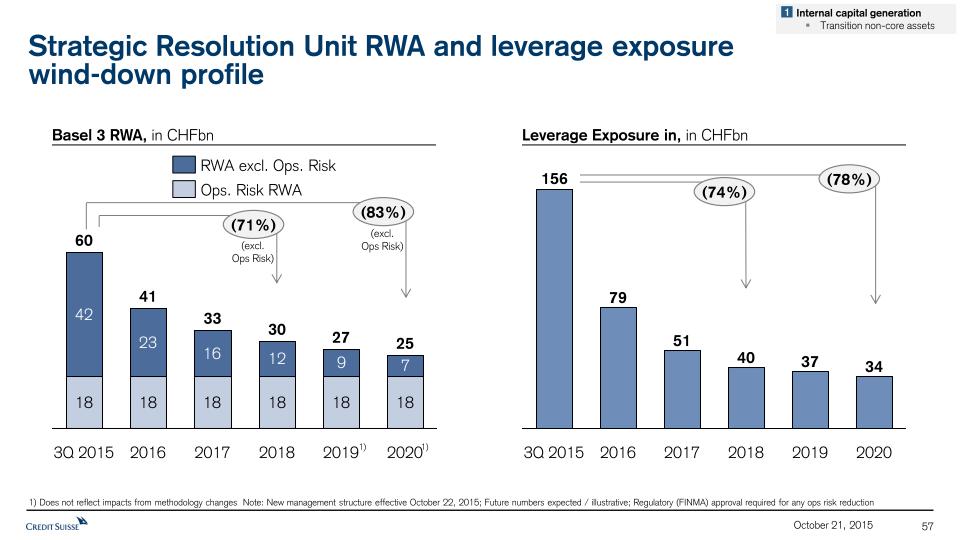
Basel 3 RWA, in CHFbn Leverage Exposure in, in CHFbn Strategic Resolution Unit RWA and leverage exposurewind-down profile 1) Does not reflect impacts from methodology changes Note: New management structure effective October 22, 2015; Future numbers expected / illustrative; Regulatory (FINMA) approval required for any ops risk reduction 1) 1) 57 3Q 2015 60 33 2016 41 25 2019 27 2018 30 2017 2020 Ops. Risk RWA RWA excl. Ops. Risk 2020 2019 2018 2017 2016 3Q 2015 (78%) (74%) (83%) (71%) (excl. Ops Risk) (excl. Ops Risk) 1 Internal capital generationTransition non-core assets October 21, 2015

Our current US Private Banking operation did not meet sufficient profitability and return criteria US Wealth Management market attractive, but requires appropriate business modelBrokerage model challenged as it requires scale and value accrues to brokers, not shareholders Decision taken to transition CS PB USNew coverage model focused on UHNWI to be introduced that integrates investment banking coverage and WM services Challenged CS PB US position despite improvements Cost / Income ratio (1H 2015) Assets under Management (USDtr, 1H2015) PB US Source: Company public disclosures 1) FYFC as of May 2015 Note: This slide presents financial information based on results under our current structure prior to our re-segmentation announcement on October 21, 2015 Bubble size reflects AuM WM Americas 58 Approx. average non-US CS IWM CIR1) 1 Internal capital generationTransition non-core assets October 21, 2015

Streamlining Western Europe Footprint This will help to adjust our service model to client proposition Consolidate Booking Centers Develop Hub and Spoke Model Move Towards Advisory Office Model This is expected to deliver CHF 50-60mn annual cost reduction from booking center consolidation alone This will be achieved without impacting client service 59 1 Internal capital generationImplement closures October 21, 2015

We intend to execute a partial IPO2) (20 to 30% stake) of the Swiss Universal Bank1) by end of 2017 Partial IPO of Swiss Universal Bank1) Attractive, stable earnings stream to Swiss and international investorsValue of Swiss franchise highlightedTransparency and market discipline to support the delivery of profit growthIncentive alignment for management of legal entity Swiss Universal Bank1)Currency to take advantage of potential consolidation in the Swiss Private Banking marketControl retained by Credit Suisse Group 1) Legal entity Credit Suisse (Schweiz) AG2) Any such IPO would involve the sale of a minority stake and would be subject to, among other things, all necessary approvals and would be intended to generate / raise additional capital for Credit Suisse AG or Credit Suisse (Schweiz) AG 60 1 Internal capital generationReallocate capital October 21, 2015

Improve our capital position 61 1 Internal capital generationRight-size the Investment BankReallocate capitalReduce fixed costsTransition non-core assets & implement closures Capital raising 2 October 21, 2015

We have announced a CHF 4.70bn rights issue supplemented by a CHF 1.36bn non-preemptive placing Announced a non-preemptive placing of CHF 1.36bn to institutional investorsFirmly underwritten rights issue of CHF 4.70bn Total capital raise of CHF 6.0bn1) 62 Size Timing EGM approval 19th November with rights trading thereafter 2 Capital raising 1) Net of expenses Note: Subject to approval by EGM (EGM: Extraordinary General Meeting) October 21, 2015

1) Capital impact from targeted IPO of Credit Suisse (Schweiz) AG as well as disposal of non-core assets, does not include material capital impact / benefit from cost savings and exposure reductions; any such IPO would involve the sale of a minority stake and would be subject to, among other things, all necessary approvals and would be intended to generate / raise additional capital for Credit Suisse AG or Credit Suisse (Schweiz) AG 2) Free Capital generated 3) Including impact on capital applying RWA floors at 60% 4) Net of costs and including relating threshold impact for deferred tax assets; subject to approval by EGM (EGM: Extraordinary General Meeting) 5) Until we reach our capital target however, we will recommend CHF 0.70 per share with a scrip alternative; we will discontinue the scrip once we have clarity on regulatory requirements and litigation risks. In any event, we will not continue with the scrip beyond 2017 Note: Under the free capital generation concept, capital is calculated using 10% to convert RWA into capital and 3.5% for leverage exposure due to the anticipated TBTF requirement of 3.5% CET1 leverage ratio and 10% CET1 requirement; New management structure effective October 22, 2015 IPO & disposals1) CapitalRaise Capital raise plus IPO & disposals Targeted Operating FCG2)4Q15 to ‘20 Free Capital Generated Business moves & Asset disposals Regulatory and Capital Requirements FCG after businessmoves ®. req. Cash dividends accrued5) NetFCG2) OtherIssuances 63 2-4 6.54) 9-11 23-25 33-35 (1) (7)3) 25-27 ~(11) 14-16 0.5 At least 40% of Operating Free Capital generated planned to be returned to shareholders Returning capital to our shareholdersIllustrative 4Q2015 to 2020, in CHFbn October 21, 2015

Profitable Growth Capture the Wealth Management opportunity in Emerging Markets by accelerating growth in Asia Pacific and by replicating our successful model in other Emerging MarketsCreate a Swiss Universal Bank to expand our position with Swiss private, corporate and institutional clients and participate in domestic consolidation opportunitiesRight-size the Investment Bank to optimize its profitability and capital usage, reduce volatility of earnings and support Wealth Management customer needs Our Strategy – Profitable growth and capital generation Capitalgeneration Deliver ~CHF 23-25bn in Operating Free Capital Generation from 4Q2015 to end-2020, with at least 40% planned to be returned through dividends to shareholders1) 1) Until we reach our capital target however, we will recommend CHF 0.70 per share with a scrip alternative; we will discontinue the scrip once we have clarity on regulatory requirements and litigation risks. In any event, we will not continue with the scrip beyond 2017 64 October 21, 2015
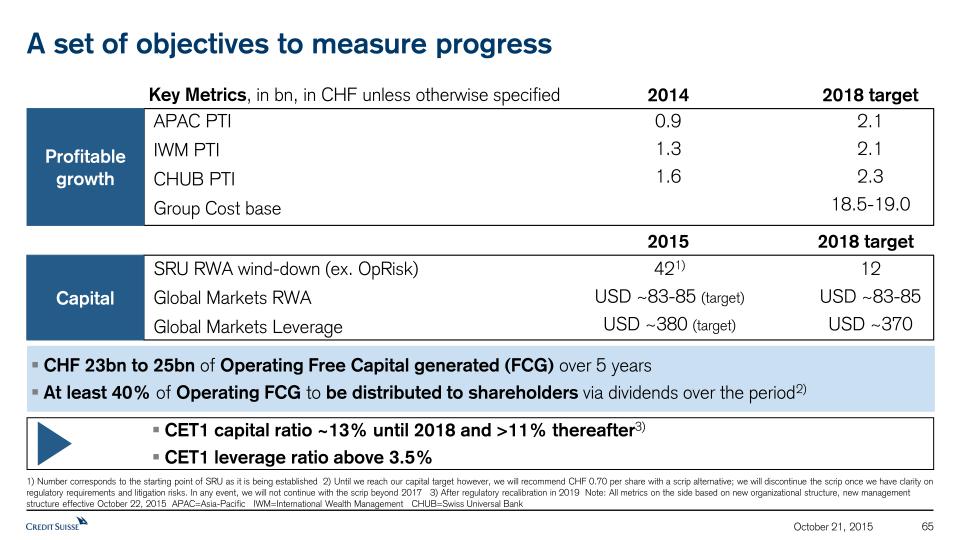
65 A set of objectives to measure progress Key Metrics, in bn, in CHF unless otherwise specified 2018 target Capital SRU RWA wind-down (ex. OpRisk)Global Markets RWAGlobal Markets Leverage 421) USD ~83-85 (target)USD ~380 (target) 12USD ~83-85USD ~370 1) Number corresponds to the starting point of SRU as it is being established 2) Until we reach our capital target however, we will recommend CHF 0.70 per share with a scrip alternative; we will discontinue the scrip once we have clarity on regulatory requirements and litigation risks. In any event, we will not continue with the scrip beyond 2017 3) After regulatory recalibration in 2019 Note: All metrics on the side based on new organizational structure, new management structure effective October 22, 2015 APAC=Asia-Pacific IWM=International Wealth Management CHUB=Swiss Universal Bank 2014 2015 Profitable growth APAC PTIIWM PTICHUB PTIGroup Cost base 2.12.12.318.5-19.0 0.91.31.6 2018 target CHF 23bn to 25bn of Operating Free Capital generated (FCG) over 5 yearsAt least 40% of Operating FCG to be distributed to shareholders via dividends over the period2) CET1 capital ratio ~13% until 2018 and >11% thereafter3)CET1 leverage ratio above 3.5% October 21, 2015

In summary 66 This strategy will:Create value for our chosen customersPosition the bank well to deal with an uncertain environmentGenerate capital and reward our shareholders October 21, 2015


Appendix 68 October 21, 2015

Targeted and rational approach to right-sizing IB RWA breakdown in USDbn 1) Credit complex includes SP and GCP 2) Sourced from Credit Suisse Leveraged Finance Strategy 3) From 2014YE exposures Note: APAC IB included 69 BelowCoC 2Q 2015 158 126 AboveCoC Securi-tized products & Credit products1) Lower volatility and concentration risk through reduction of exposures: RWA down by 5% at Q4 20153)Leverage down by 25% at Q4 20153) 2006 2007 2008 2009 2010 2011 2012 2013 2014 2015 US HYSpread2) Indication of market volatility Credit Suisse PTI in CP and SP October 21, 2015

October 21, 2015 Credit Suisse StrategyOverview of Financials and CapitalDavid Mathers

Disclaimer (1/2) October 21, 2015 2 The 3Q15 financial information is subject to further review We have not finalized our 3Q15 Financial Report and our independent registered public accounting firm has not completed its review of the condensed consolidated financial statements (unaudited) for the period. Accordingly, the 3Q15 financial information contained in this presentation is subject to completion of quarter-end procedures, which may result in changes to that information. Certain reclassifications have been made to prior periods to conform to the current presentation.The re-segmented financial information is preliminary and subject to further review This presentation contains certain historical financial information that has been re-segmented to approximate what our results under our new structure would have been, had it been in place from January 1, 2014 (“Re-segmented Basis”). Such information is preliminary in nature and subject to review, evaluation and refinement, has not been audited or reviewed by our independent public accountants and can be expected to change in certain respects before any final re-segmentation is published. In addition, “Illustrative”, “Ambition” and “Goal” presentations are not intended to be viewed as targets or projections, nor are they considered to be Key Performance Indicators. All such presentations are subject to a large number of inherent risks, assumptions and uncertainties, many of which are completely outside of our control. Accordingly, this information should not be relied on for any purpose. We may not achieve the benefits of our strategic initiatives We may not achieve all of the expected benefits of our strategic initiatives. Factors beyond our control, including but not limited to the market and economic conditions, changes in laws, rules or regulations and other challenges discussed in our public filings, could limit our ability to achieve some or all of the expected benefits of these initiatives. Cautionary statement regarding forward -looking statements This presentation contains forward-looking statements that involve inherent risks and uncertainties, and we might not be able to achieve the predictions, forecasts, projections and other outcomes we describe or imply in forward-looking statements. A number of important factors could cause results to differ materially from the plans, objectives, expectations, estimates and intentions we express in these forward-looking statements, including those we identify in "Risk Factors” in our Annual Report on Form 20-F for the fiscal year ended December 31, 2014 and in “Cautionary statement regarding forward-looking information" in our second quarter 2015 Financial Report filed with the US Securities and Exchange Commission, and in other public filings and press releases. We do not intend to update these forward-looking statements except as may be required by applicable law.

Disclaimer (2/2) October 21, 2015 3 Statement regarding capital, liquidity and leverage As of January 1, 2013, Basel 3 was implemented in Switzerland along with the Swiss “Too Big to Fail” legislation and regulations thereunder (in each case, subject to certain phase-in periods). As of January 1, 2015, the Bank for International Settlements (BIS) leverage ratio framework, as issued by the Basel Committee on Banking Supervision (BCBS), was implemented in Switzerland by FINMA. Our related disclosures are in accordance with our interpretation of such requirements, including relevant assumptions. Changes in the interpretation of these requirements in Switzerland or in any of our assumptions or estimates could result in different numbers from those shown in this presentation. Capital and ratio numbers for periods prior to 2013 are based on estimates, which are calculated as if the Basel 3 framework had been in place in Switzerland during such periods. Unless otherwise noted, leverage exposure is based on the BIS leverage ratio framework and consists of period-end balance sheet assets and prescribed regulatory adjustments. Leverage amounts for 4Q14, which are presented in order to show meaningful comparative information, are based on estimates which are calculated as if the BIS leverage ratio framework had been implemented in Switzerland at such time. Beginning in 2015, the Swiss leverage ratio is calculated as Swiss total capital, divided by period-end leverage exposure. The look-through BIS tier 1 leverage ratio and CET1 leverage ratio are calculated as look-through BIS tier 1 capital and CET1 capital, respectively, divided by end-period leverage exposure. Selling restrictions This document is not an offer to sell or a solicitation of offers to purchase or subscribe for securities of Credit Suisse Group AG. This document is not a prospectus within the meaning of article 652a of the Swiss Code of Obligations, nor is it a listing prospectus as defined in the listing rules of the SIX Swiss Exchange AG or any other exchange or regulated trading facility in Switzerland or a prospectus under any other applicable laws. Copies of this document may not be sent to jurisdictions, or distributed in or sent from jurisdictions, in which this is barred or prohibited by law. The information contained herein shall not constitute an offer to sell or the solicitation of an offer to buy, in any jurisdiction in which such offer or solicitation would be unlawful prior to registration, exemption from registration or qualification under the securities laws of any jurisdiction. A decision to invest in securities of Credit Suisse Group AG should be based exclusively on a written agreement with Credit Suisse Group AG or an offering and listing prospectus to be published by Credit Suisse Group AG for such purpose. This document and the information contained herein is not for publication or distribution into the United States of America and should not be distributed or otherwise transmitted into the United States or to U.S. persons (as defined in the U.S. Securities Act of 1933, as amended (the “Securities Act”)) or publications with a general circulation in the United States. This document does not constitute an offer or invitation to subscribe for or to purchase any securities in the United States of America. The securities referred to herein have not been and will not be registered under the Securities Act or the laws of any state and may not be offered or sold in the United States of America absent registration or an exemption from registration under Securities Act. There will be no public offering of the securities in the United States of America. The information contained herein does not constitute an offer of securities to the public in the United Kingdom. No prospectus offering securities to the public will be published in the United Kingdom. This document is only being distributed to and is only directed at (i) persons who are outside the United Kingdom or (ii) to investment professionals falling within article 19(5) of the Financial Services and Markets Act 2000 (Financial Promotion) Order 2005 (as amended, the “Order”) or (iii) high net worth entities, and other persons to whom it may lawfully be communicated, falling within article 49(2)(a) to (d) of the Order (all such persons together being referred to as “relevant persons”). The securities are only available to, and any invitation, offer or agreement to subscribe, purchase or otherwise acquire such securities will be engaged in only with, relevant persons. Any person who is not a relevant person should not act or rely on this document or any of its contents.

Overview of Financials and Capital October 21, 2015 4 3Q15 Financial results summary 1 Financial summary under current and new structures 2 Financial metrics for the Group and the new segments 3 Targets for Group capital usage and allocation 4 Free capital generation 5 Capital raise 6 Note: Unless otherwise noted, figures presented in the following section are based on results under our current structure prior to our re-segmentation announcement on October 21, 2015 ("Current Reporting Basis")

5 Clear alignment of strategic and financial goals Strategic goals Financial goals in CHF bn Increase the profitability of the stable and high return cash flows in Swiss home market Optimize resource allocation and focus on high-returning businesses with scale Increase resource allocation to APAC and other fee generative and growth areas Achieve CHF 2 bn1 of net cost reductions by end-2018, primarily related to fixed cost base Strengthen equity capital base with focus on maximizing free capital generation Swiss home market Optimize resource allocation Focus on growth areas and recurring fee generation Reduce fixed cost base Strengthen capital base Group operating cost base End-2018 capital ratio targets Swiss Universal Bank Pre-tax income APAC Pre-tax income Risk-weighted assets, ex. CC / ShS 3Q15CurrentStructure 133% ~13% 5 - 6% October 21, 2015 44% Strategic IB57% Strategic PB&WM38% Non-Strategic5% 3Q15 results Financial summary Financial targets Capital targets Free capital gen. 2 bn Capital raise Notes: This slide presents financial information on both a Current Reporting Basis and Re-segmentation Basis. CHUB = Swiss Universal Bank; IWM = International Wealth Management; GM = Global Markets; IBCM = Investment Banking and Capital Markets; APAC = Asia Pacific; SRU = Strategic Resolution Unit; CC = Corporate Center; ShS = Shared Services for this slide and the rest of the presentation 1 Cost reduction program measured on constant FX rates and based on expense run rate excluding major litigation expenses in the SRU & restructuring costs, but including other costs to achieve savings IBXX% SRU10% Swiss UB25% IWM16% APAC16% GM27% IBCM7% 20.5-21.0 18.5-19.0 2018ENewStructure

Key messages from Credit Suisse 3Q15 results October 21, 2015 6 3Q15 results Financial summary Financial targets Capital targets APAC3Q15 pre-tax income of CHF 256 mn 9M15 pre-tax income of CHF 1,129 mn with 48% YoY increase, benefitting from continued momentum of our One Bank franchise; 3Q15 pre-tax income of CHF 256 mnWealth Management Clients Asia Pacific with double-digit growth in net new assets in both 3Q15 and 9M159M15 Asia Pacific Investment Banking revenues increase of 15%, driven by robust equities results with 40% YoY revenue growth Progress on capital “Look-through” CET1 ratio of 10.2%, down from 10.3% at 2Q15, with RWA increases from model updates and methodology changes“Look-through” Swiss Total Leverage ratio of 4.5%, of which BIS Tier 1 Leverage ratio of 3.9% and CET1 Leverage ratio of 2.8% Free capital gen. Credit Suisse Group3Q15 pre-tax income of CHF 861 mn and return on equity of 7% Group pre-tax income (excluding revenue impact from fair value on own debt) of CHF 238 mn. The significant YoY and QoQ reduction in pre-tax income was driven by lower results in Investment Banking, primarily due to a challenging market environment and lower client activity. Group Strategic pre-tax income for the quarter of CHF 826 mn, a 49% decrease from 3Q149M15 return on equity of 9% (or 6% excluding revenue impact from fair value on own debt); 11% for the Strategic business Capital raise Note: Credit Suisse Group reflects Core results; 3Q15 and 9M15 results based on current reporting structure

Key messages from Credit Suisse 3Q15 results October 21, 2015 7 1 Adjusted for Swisscard deconsolidation. See slide 10 in 3Q15 earnings presentation for details 2 3Q15 results include the impact of the USD 133 mn settlement to resolve a lawsuit related to credit-default swaps Strategic pre-tax income of USD 291 mn significantly lower QoQ and YoY, primarily due to lower fixed income franchise results driven by significantly muted client activity amid challenging market conditions Reduction in leverage exposure to USD 615 bn; early achievement of USD 600-620 bn year-end targetHigher equity sales and trading performance as increased market volatility led to higher client activityUnderwriting and advisory revenues negatively impacted by slowdown in industry-wide issuance; continued share gains in M&A franchise Investment Banking3Q15 pre-tax income of CHF (125) mn2 Private Banking & Wealth Management3Q15 pre-tax income of CHF 647 mn and return on reg. capital of 16% Strategic pre-tax income of CHF 753 mn and Strategic return on regulatory capital of 20%, impacted by weaker client activity and adverse market conditionsWealth Management Clients with growth in net interest income and recurring commissions and fees1 since the beginning of 2015; 3Q15 pre-tax income impacted by lower transaction revenues; 9M15 net margin of 28 bps compared to 27 bps for 9M14 Corporate & Institutional Clients delivered solid net revenues with cost income ratio of 50% in 9M15; lower pre-tax income due to increased credit provisionsAsset Management with growth in fee-based revenues since the beginning of 2015; 3Q15 net revenues impacted by investment-related losses due to market conditionsStrong strategic net new assets of CHF 17.3 bn with contribution from all three businesses; Wealth Management Clients reported net new assets of CHF 10.5 bn with growth in all regions and good contribution from UHNWI client segment 3Q15 results Financial summary Financial targets Capital targets Free capital gen. Capital raise

Results Overview 8 Note: Total Reported reflects Core Results; FVoD denotes Fair Value on own Debt on this slide and throughout the rest of the presentation 1 Return on Equity for Strategic results calculated by dividing annualized Strategic net income by average Strategic shareholders' equity (derived by deducting 10% of Non-Strategic RWA from reported shareholders' equity) 2 Assumes assets managed across businesses relate to Strategic businesses only 3 Excludes revenue impact from FVoD of CHF 623 mn, CHF 228 mn, CHF 318 mn, CHF 995 mn and CHF 246 mn in 3Q15, 2Q15, 3Q14, 9M15 and 9M14, respectively, and pre-tax charge of CHF 1,618 mn relating to the settlements with US authorities regarding the US cross-border matters in 9M14, in Non-Strategic and total reported results in CHF mn 3Q15 2Q15 3Q14 9M15 9M14Net revenues 5,623 6,758 6,287 18,971 19,126Pre-tax income 826 1,812 1,622 4,460 5,341Cost / income ratio 84% 73% 73% 76% 72%Return on equity1 7% 14% 11% 11% 13%Net new assets2 in CHF bn 17.3 15.4 8.8 51.1 36.6 Net revenues 5,982 6,941 6,537 19,596 19,439Pre-tax income 861 1,646 1,301 4,045 2,331 Pre-tax income ex FVoD and settlement impact3 238 1,418 983 3,050 3,703Net income attributable to shareholders 779 1,051 1,025 2,884 1,184Diluted earnings per share in CHF 0.45 0.61 0.61 1.69 0.68Return on equity 7% 10% 10% 9% 4% Return on equity ex FVoD and settlement impact3 2% 8% 7% 6% 8% Net revenues 359 183 250 625 313Pre-tax income / (loss) 35 (166) (321) (415) (3,010) Pre-tax income / (loss) ex FVoD and settlement impact3 (588) (394) (639) (1,410) (1,638) Strategic Non-Strategic Total Reported 3Q15 results Financial summary Financial targets Capital targets Free capital gen. Capital raise October 21, 2015

Overview of Financials and Capital October 21, 2015 9 3Q15 Financial results summary 1 Financial summary under current and new structures 2 Financial metrics for the Group and the new segments 3 Targets for Group capital usage and allocation 4 Free capital generation 5 Capital raise 6 Note: Unless otherwise noted, figures presented in the following section are based on what our results under our new structure would have been, had it been in place January 1, 2014

October 21, 2015 10 Corporate Center Strategic Resolution Unit Separate division of the Group with clear accountability, governance and reporting, established to:Facilitate immediate right-sizing of Investment Banking and focus on rapid wind-down of non-core assets, including those within the current Non-Strategic unitsAchieve these objectives by taking over the exposures that do not fit with the parameters of the right-sized Investment Banking or strategic goals of other business divisionsProvide platform for restructuring of client centric and strategic but capital inefficient businesses Corporate Center will be presented inclusive of overall costs of shared services, providing transparency of the pre- and post-allocated view of these costsResidual Corporate Center financial results will primarily comprise the central corporate costs, the legal entity program and a modest amount of accounting asymmetry Restructuring of divisions Reflecting the new management structure, Credit Suisse’s financial reporting structure will be presented as six reporting segments, including a new Strategic Resolution Unit, with a much simplified Corporate Center Alignment of financial reporting to new management structure 3Q15 results Financial summary Financial targets Capital targets Free capital gen. Capital raise InternationalWealth Management Investment Banking and Capital Markets Swiss Universal Bank Corporate Center Strategic Resolution Unit Global Markets Asia Pacific Credit Suisse Core results New management structure effective October 22, 2015 and will be the basis for our reporting in the fourth quarter of 2015 and the 2015 Annual Report, and going forward

Overview of changes in structure – Private Banking & Wealth Mgmt. October 21, 2015 11 PTI: 1,378 mnRWA: 33 bnLev.: 74 bn PTI: (1,473) mnRWA: 11 bnLev.: 27 bn Full year 2014 in CHF PTI: 3,726 mnRWA: 102 bnLev.: 369 bn PTI: (1,638) mnRWA: 6 bnLev.: 11 bn 3Q15 results Financial summary Financial targets Capital targets Free capital gen. Capital raise PTI: 357 mnRWA: 7 bnLev.: 34 bn PTI: 1,826 mnRWA: 57 bnLev.: 245 bn Investment Banking Strategic Non-Strategic Private Banking & Wealth Management Strategic Non-Strategic Strategic Non-Strategic Corporate Center InternationalWealth Management Investment Banking and Capital Markets Corporate Center Asia Pacific Swiss Universal Bank Strategic Resolution Unit Global Markets PTI = Pre-tax income RWA = Risk-weighted Assets Lev. = Swiss Leverage Exposure

Overview of changes in structure – Investment Banking October 21, 2015 12 PTI: 2,795 mnRWA: 75 bnLev.: 479 bn PTI: 661 mnRWA: 14 bnLev.: 97 bn PTI: (2,231) mnRWA: 55 bnLev.: 166 bn 3Q15 results Financial summary Financial targets Capital targets Free capital gen. Capital raise PTI: 559 mnRWA: 16 bnLev.: 41 bn Investment Banking Strategic Non-Strategic Private Banking & Wealth Management Strategic Non-Strategic Strategic Non-Strategic Corporate Center PTI: 3,744 mnRWA: 150 bnLev.: 722 bn PTI: (1,914) mnRWA: 10 bnLev.: 64 bn InternationalWealth Management Investment Banking and Capital Markets Corporate Center Asia Pacific Swiss Universal Bank Global Markets Full year 2014 in CHF Strategic Resolution Unit PTI = Pre-tax income RWA = Risk-weighted Assets Lev. = Swiss Leverage Exposure PTI: 46 mnRWA: 1 bnLev.: 3 bn

Overview of changes in structure – Corporate Center October 21, 2015 13 InternationalWealth Management Investment Banking and Capital Markets Corporate Center Asia Pacific PTI: (105) mnRWA: -Lev.: - PTI: (419) mnRWA: -Lev.: - PTI: 44 mn1RWA: 16 bnLev.: 32 bn PTI: (251) mnRWA: -Lev.: - PTI: (78) mnRWA: -Lev.: - PTI: 167 mnRWA: -Lev.: - 3Q15 results Financial summary Financial targets Capital targets Free capital gen. Capital raise Swiss Universal Bank Strategic Resolution Unit Global Markets PTI: (44) mnRWA: -Lev.: - Investment Banking Strategic Non-Strategic Private Banking & Wealth Management Strategic Non-Strategic Strategic Non-Strategic Corporate Center PTI = Pre-tax income RWA = Risk-weighted Assets Lev. = Swiss Leverage Exposure 1 Includes impact from FVoD of CHF 543 mn Full year 2014 in CHF PTI: (680) mnRWA: 16 bnLev.: 32 bn PTI: (6) mn1RWA: -Lev.: -

Financial summary under new structure October 21, 2015 14 3Q15 results Financial summary Financial targets Capital targets Free capital gen. Capital raise SwissUniversal Bank Pre-tax Income/ (Loss) 2014 1.6 - o/w Non-Strat.litigations Basel 3 RWA LeverageExposure3 In CHF bn InternationalWM Global Markets Asia Pacific Strategic Resolution Unit Corporate Center Credit Suisse Group1 2014 1.3 - 2014 2.4 - 2014 0.9 - 2014 (3.1) (2.4) 2014 0.0 - 2014 3.6 (2.4) 13 “Worst of” RoC / RoE (%)2 58 33 75 22 66 16 284 248 74 479 131 194 32 1,198 27 10 14 4 Credit Suisse Core results 2014 13 Credit Suisse Core 6.8 - 219 1,005 1 The difference between Credit Suisse Core results (under current structure) and Credit Suisse Group results (under new structure) includes certain entities in which we had no significant economic interest in the unit 2 Division and Credit Suisse Core RoC (return on regulatory capital) is the worst of return on 10% of spot RWA and return on 3.5% of spot Swiss leverage exposure; assumes tax rate of 30% in 2014. RoE (return on equity) calculated for Credit Suisse Group 3 Swiss leverage exposure 0.5 (0.5) CC excl. FVoD FVoD Notes: On this slide and for the rest of the presentation, “worst of” return on capital / equity is based on capital calculated with the binding constraint determined by the worse of 3.5% of leverage exposure and 10% of RWA due to the anticipated TBTF requirement of 3.5% CET1 leverage ratio and 10% CET1 requirement IBCM 2014 0.5 - 16 41 23

Overview of Financials and Capital October 21, 2015 15 3Q15 Financial results summary 1 Financial summary under current and new structures 2 Financial metrics for the Group and the new segments 3 Targets for Group capital usage and allocation 4 Free capital generation 5 Capital raise 6 Note: Unless otherwise noted, figures presented in the following section are based on what our results under our new structure would have been, had it been in place January 1, 2014

16 Clear alignment of strategic and financial goals Strategic goals Financial goals in CHF bn Increase the profitability of the stable and high return cash flows in Swiss home market Optimize resource allocation and focus on high-returning businesses with scale Increase resource allocation to APAC and other fee generative and growth areas Achieve CHF 2 bn1 of net cost reductions by end-2018, primarily related to fixed cost base Strengthen equity capital base with focus on maximizing free capital generation Swiss home market Optimize resource allocation Focus on growth areas and recurring fee generation Reduce fixed cost base Strengthen capital base Group operating cost base End-2018 capital ratio targets Swiss Universal Bank Pre-tax income APAC Pre-tax income Risk-weighted assets, ex. CC / ShS 3Q15CurrentStructure 133% 5 - 6% October 21, 2015 44% Strategic IB57% Strategic PB&WM38% Non-Strategic5% 3Q15 results Financial summary Financial targets Capital targets Free capital gen. 2 bn Capital raise 1 Cost reduction program measured on constant FX rates and based on expense run rate excluding major litigation expenses in the SRU & restructuring costs, but including other costs to achieve savings IBXX% SRU10% CHUB25% IWM16% APAC16% GM27% IBCM7% ~13% 2018ENewStructure

October 21, 2015 17 CHF 2 bn net cost savings target expected to reduce absolute cost base to between CHF 18.5 and 19 bn by end-2018 3Q15 results Financial summary Financial targets Capital targets Free capital gen. Capital raise 2015 – 2020 Cost reduction program in CHF bn, year-end targets ~20.5 - 21.0 TargetCHF 3.5 bn of gross savings by end 2018 Further net savings targeted 2018+ 2015E 2018target 2020target Reduction of fixed cost base to a lower “break even point” to profitability and reduce earnings volatilityCHF 2.0 bn net savings target includes:CHF (3.5) bn of gross cost savingsPlanned CHF 1.5 bn of investments to facilitate divisional growth initiatives, of which 60% targeted for Asia Pacific and the remainder to our Swiss Universal Bank and International Wealth ManagementFurther net savings targeted beyond 2018, driven by efficiencies from IT digitalization and shared use of utilities GrossSavings GrowthInvestments Note: Cost reduction program measured on constant FX rates and based on expense run rate excluding major litigation expenses in the SRU & restructuring costs, but including other costs to achieve savings 2015E (1.3)bn: Business exits & run-down of SRU portfolio(0.9)bn: workforce strategy, technology & London right-sizing(0.1)bn: additional wind-down of Corporate Center costs+1.5bn: divisional growth investments (0.9)bn: substantial completion of Corp. Center programs (i.e., legal entity program, IT architecture simplification, etc.) (0.3)bn: run-down of SRU portfolio (planned run-down of prior Non-Strategic Unit) Previously PlannedCost Reductions TargetCHF 2.0 bn of net savings by end 2018

October 21, 2015 18 Restructuring our Bank 2.0 – 2.5 Estimated Restructuring Costs in CHF bn 0.6 0.6 0.1 Restructuring Costs: CHF 1.3 bn Workforce strategy, including Support Governance London Initiative Business exits and reductions 1.3 Restructuring costs progression in CHF bn 3Q15 results Financial summary Financial targets Capital targets Free capital gen. Capital raise Going forward a multi-wave restructuring program will be established Related restructuring costs will be provided in our quarterly disclosures and will be carried by the respective divisions 2016 - 2018 Infrastructure efficiency programs (e.g. Architecture Simp., Front to Back Program) 2016 2017 2018

October 21, 2015 19 Further expected impacts of implementing our strategy 3Q15 results Financial summary Financial targets Capital targets Free capital gen. Capital raise Further to the costs related to the restructuring program, Credit Suisse expects to incur additional non-recurring costs in the coming quarters. These are likely to be reflected over the next 18 months with 2016 earnings in particular be adversely impacted At end 3Q15, Credit Suisse carried CHF 8.7 bn of goodwill, of which CHF 6.3 bn is carried by the Investment Banking division. A significant strategic review and group re-segmentation is a triggering event for assessing whether there will be goodwill impairment. Our expectation is that goodwill currently carried by the Investment Banking division is likely to be impaired. Such an impairment would impact the Group, Global Markets as well as Investment Banking and Capital Markets divisional pre-tax income in 4Q15 but would not impact the CET1 ratios on a “look-through” basis or Return on Tangible Equity We will seek to redeem remaining capital instruments that were effective under Basel II but not under the subsequent regimes. This could result in additional negative pre-tax income impact of ~CHF 0.6 bn on redemption, but this is expected to be offset by savings in funding costs going forward. These impacts would be included in our Strategic Resolution Unit In addition to the CHF 1.3 bn of total restructuring charges from 2016 to 2018, additional Costs-to-Achieve (CtA) of CHF 0.7 bn to CHF 1.2 bn are expected to be incurred in the same period. The additional CtA relate to investments needed to drive permanent cost savings which do not meet the accounting definition of restructuringBoth restructuring costs and the additional CtA amounts will be allocated to the respective divisions Incremental Cost-to-Achieve Restructuring impact on goodwill Capital instrument redemption

October 21, 2015 20 3Q15 results Financial summary Financial targets Capital targets Free capital gen. Capital raise New strategy with growth and cost initiatives leading to illustrative return on tangible equity of ~14% and cost-income ratio of ~66% 9M15 Ann. Tangible equity: 9M15 – illustrative 2018 in CHF bn 351 ~504 Includes expected CHF 6 bn capital raise, CS Legal Entity Switzerland minority IPO3, other divestitures, and retained equity from various initiatives Illustrative pre-tax income progression in CHF bn Return onTangible Equity1 Cost/income ratio1 10% 14% 9% 79% 66% 81% ~+5pp ~(15)pp 2014 Illustrative 2018 9M15 4.5 (1.5) APAC ~9-10 Swiss Universal Bank ~3.0-4.0 IBCM = Investment Banking and Capital Markets 1 Excludes impact from FVoD and certain litigation items 2 Includes Corporate Center 3 Any such IPO would involve the sale of a minority stake and would be subject to, among other things, all necessary approvals and would be intended to generate / raise additional capital for Credit Suisse AG or Credit Suisse (Schweiz) AG 4 Refer to slide 35 for illustrative 2018 CET1 capital build IWM 1 (0.8) Impact of cost initiatives Impact of revenue & growth initiatives Other divisions2

October 21, 2015 21 3Q15 results Financial summary Financial targets Capital targets Free capital gen. Capital raise RWA Leverage Exposure Illustrative pre-tax income progression in CHF bn (in CHF bn) (in CHF bn) 2014 Retail HNWI/UHNWI Entrepreneurs, SMEs,Corporates Operating model optimization Target 2018E Initiatives 58 ~75 248 ~275 Expected further strengthening of home market through leveraging synergies and participating in consolidation Strengthened expected returns from growth plan in Swiss home base Return on Capital1 Cost/income ratio 13% 17% 68% 56% 2014 Illustrative 2018 ~+4pp ~(12)pp HNWI = High Net Worth Individuals; UHNWI = Ultra High Net Worth Individuals; SMEs = Small and medium enterprises 1 Worst of return on 10% of RWA and return on 3.5% of spot Swiss leverage exposure; assumes tax rate of 30% for all periods

October 21, 2015 22 3Q15 results Financial summary Financial targets Capital targets Free capital gen. Capital raise RWA Leverage Exposure Illustrative pre-tax income progression in CHF bn (in CHF bn) (in CHF bn) 2014 Target 2018E Initiatives 33 ~45 74 ~90 Benefitting from emerging markets outside Asia Pacific Emerging markets growth to further drive IWM returns expansion Return on Capital1 Cost/income ratio 27% 33% 73% 64% 2014 Illustrative 2018 ~+6pp ~(9)pp Lending initiative Hubs expansion Accelerated One Bank benefits Emerging markets expansion 1 Worst of return on 10% of RWA and return on 3.5% of spot Swiss leverage exposure; assumes tax rate of 30% for all periods

Continued investment in APAC expected to further drive profitable growth October 21, 2015 23 RWA Leverage Exposure Return on Capital1 Illustrative pre-tax income progression in CHF bn (in CHF bn) (in CHF bn) Cost/income ratio 2014 Client coverage and distribution Footprint/geography Product Operating model optimization Target 2018E 22 ~45 131 ~165 14% 27% 70% 60% Continued investment in growth to drive returns ~+13pp ~(10)pp 2014 Illustrative 2018 3Q15 results Financial summary Financial targets Capital targets Free capital gen. Capital raise 1 Worst of return on 10% of RWA and return on 3.5% of spot Swiss leverage exposure; assumes tax rate of 30% for all periods Initiatives

October 21, 2015 24 3Q15 results Financial summary Financial targets Capital targets Free capital gen. Capital raise Optimized Global Markets division expected to deliver returns well above cost of capital RWA Leverage Exposure Illustrative pre-tax income progression in USD bn 1 Worst of return on 10% of average RWA and return on 3.5% of average leverage exposure; assumes tax rate of 30% for all periods 2 Pre-tax income 9M15 annualized 3 Includes savings from programs and realignment expense previously reflected in the Corporate Center (in USD bn) (in USD bn) Full year 2015 pre-tax income2 Target 2018E 76 83 – 85 376 ~370 Global Markets to operate with a capital base close to current levels while still producing higher returns primarily from cost savings Net savings3 Growth Return on Capital1 Cost/income ratio 10% 16% 77% 67% 9M15 Illustrative 2018 ~+6pp ~(10)pp 2.9

October 21, 2015 25 3Q15 results Financial summary Capital targets Free capital gen. Capital raise Growth initiatives to improve both cost and return profiles for the new IBCM RWA Leverage Exposure Illustrative pre-tax income progression in USD bn 1 Worst of return on 10% of average RWA and return on 3.5% of average leverage exposure; assumes tax rate of 30% for all periods 2 Pre-tax income 9M15 annualized (in USD bn) (in USD bn) Full year 2015 pre-tax income2 Target 2018E 19 ~20 34 ~35 Leverage strength of the Sponsors franchise across all regions and products Return on Capital1 Cost/income ratio 5% 28% 92% 68% 9M15 Illustrative 2018 ~+23pp ~(24)pp 0.1 Financial targets Investment needed for growth (0.3) Growth +1.1 0.9

October 21, 2015 26 Strategic Resolution unit established to facilitate rapid wind-down and reduce drag on overall Group performance Illustrative pre-tax income progression in CHF mn 2014 pre-tax loss Fundingcosts Servicescosts Remaining pre-tax drag in 2018 Directcosts Business revenues and gains on sale RWA excl. op. risk Leverage Exposure1 (in CHF bn) 48 194 42 146 9M15 pre-tax loss (annualized) Funding costs expected to decrease by 2018 from the wind-down of legacy non-Basel III compliant capital and debt instruments The majority of cost savings expected to roll-off by end 2018 Direct costs expected to decline significantly, result of downsized headcount due to newly transferred and legacy business exits Reduction in SRU business revenues and gains on sale as a result of significant business exits over 2016-17 Includes fixed costs of ~500 -700 mn:~ 80 mn exit cost~160 mn funding costs~220 mn of service costs~230 mn of direct costExcludes litigation costs as currently not known 12 40 2014 2018 target 3Q15 68% decline in RWA excl. op. risk46% decline in RWA incl. op. risk 73% decline in Leverage RWA incl. op. risk 66 60 30 Revenue impact: - IB: 100 mn - PB&WM: 1,000 mnPre-tax impact: - IB: (370) mn - PB&WM: 165 mn Revenue impact: - IB: 110 mn - PB&WM: 980 mnPre-tax impact: - IB: (440) mn - PB&WM: 90 mn Impact of new transfers to SRU: 1 2014 Swiss Lev Exposure; 3Q15 and 2018 BIS Lev Exposure

Overview of Financials and Capital October 21, 2015 27 3Q15 Financial results summary 1 Financial summary under current and new structures 2 Financial metrics for the Group and the new segments 3 Targets for Group capital usage and allocation 4 Free capital generation 5 Capital raise 6 Note: Unless otherwise noted, figures presented in the following section are based on what our results under our new structure would have been, had it been in place January 1, 2014

October 21, 2015 28 Leverage reduction expected to accelerate with Strategic Resolution unit 3Q15 End 2015excl. SRU APAC GM + IBCM End 2018excl. SRU SRUImpact (19) 40 (87) Leverage in CHF bn, unless otherwise stated End 2015Target 127 40 +106 2016 to 2018 1,045 ~1,000 o/wPB&WM CHF 373IB USD 615 +59 -- +26 ~960 (127) ~873 3Q15 End 2015 target End 2018 Remainingreduction New Additions ‘16-’18 Wind-Down 2016 to 2018 Group Strategic Res. Unit ~1000 End 2018 Target End 2018 distribution CHUB + IWM 3Q15 results Financial summary Financial targets Capital targets Free capital gen. Capital raise End 2018 target IBXX% SRU4% Swiss UB29% IWM10% APAC18% GM36% IBCM4%

October 21, 2015 29 Substantial RWA to be reallocated to growth initiatives 3Q15 End 2015excl. SRU APAC GM + IBCM CHUB + IWM End 2018excl. SRU SRUImpact (3) 30 (27) ~315 End 2015Target o/wGM --IBCM +6 57 End 2018 Target 13 +47 2016 to 2018 End 2018 distribution 285 290 +24 +6 +22 ~285 (57) 233 3Q15 End 2015 target End 2018 Remaining reduction New Additions1 ‘16-’18 Wind-Down 2016 to 2018 Group End 2018 target RWA in CHF bn Strategic Res. Unit 3Q15 results Financial summary Financial targets Capital targets Free capital gen. Capital raise o/wPB&WM CHF 108IB USD 164 SRU10% Swiss UB25% IWM16% APAC16% GM27% IBCM7% 1 Includes operational risk

Anticipated regulatory developments highlight need for capital buffer October 21, 2015 30 2015 2016 2017 2018 2019 2020 Recalibrated leverage ratio likely to be primary capital constraint until 2019, however… CS targeting 5-6% Tier 1 leverage ratio by end 2017, of which 3.5-4.0% is expected to be met through common equity Leverage ratio recalibration TBTF rules effective from January 1st, 2019Implied minimum CET1 capital of CHF 35 bn required, and minimum Tier 1 capital of CHF 50 bn 1 The binding constraint is determined as the worse of 3.5% of leverage exposure and 10% of RWA due to the anticipated TBTF requirement of 3.5% CET 1 leverage ratio and 10% CET 1 requirement 2 Reflects post-mitigation estimates of current expectations Note: Under new structure, new management structure effective October 22, 2015; Future numbers expected / illustrative 3Q15 results Financial summary Financial targets Capital targets Free capital gen. Capital raise Final Swiss TBTF rules expected imminentlySwiss TBTF rules anticipated to require 5% Tier 1 leverage ratio, and 3.5% CET1 leverage ratio …RWA uplift resulting from capital floors above 60% will drive the binding constraint1 from the start of 2019 Final rules for advanced models expected by 2016 The impact of FRTB will primarily affect market risk assets in investment banking and is estimated at ~50bps2Our initial estimate of the incremental impact of a floor against revised standard models is 25 - 100bps2 if the floor is set at 60%, and 100 - 250bps2 if the floor is set at 70%. The impact of a floor will affect both market and credit risks across both investment banking and private banking assets. These estimates are inherently uncertain given that implementation is expected several years in the future Standardized Approach to counterparty Credit Risk rules effective from January 1st, 2017; minimal impact expected CS targeting ~13% CET1 ratio by the end of 2018 RWA uplift CET1 capital ratio targeted to remain at ~11% after implementation of rules
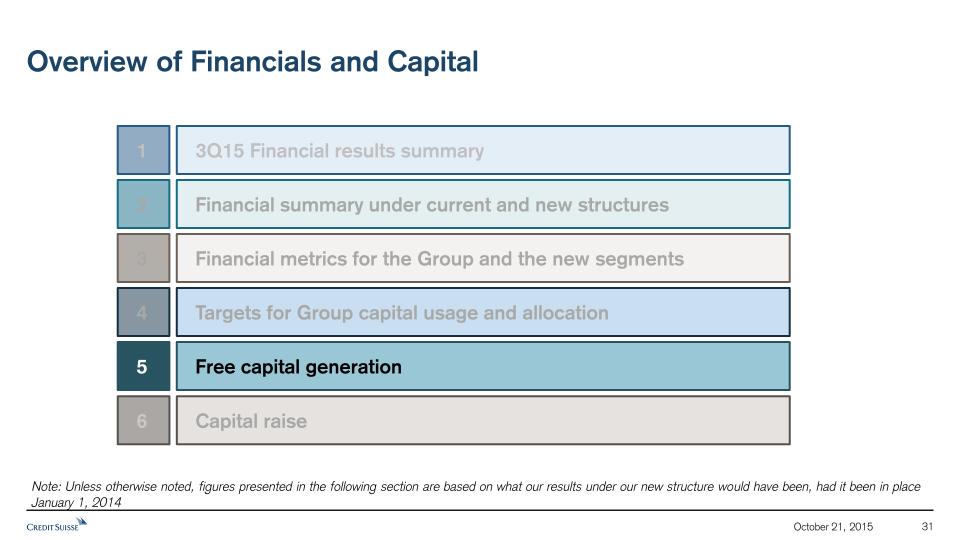
Overview of Financials and Capital October 21, 2015 31 3Q15 Financial results summary 1 Financial summary under current and new structures 2 Financial metrics for the Group and the new segments 3 Targets for Group capital usage and allocation 4 Free capital generation 5 Capital raise 6 Note: Unless otherwise noted, figures presented in the following section are based on what our results under our new structure would have been, had it been in place January 1, 2014

Introduction to Free Capital Generation October 21, 2015 32 Strategy is to focus on the generation of free capital, both to fund growth and generate returns for shareholders Profit based metrics such as pre-tax income, net income and return on equity suffer from weaknesses such as:Excludes items that affect capital generation such as Other Comprehensive Income, etc.Based on total tax charges, but increases in deferred tax assets can be irrelevant to capital generation even while benefitting net incomeIgnores increases in capital usage, i.e. can have a high net income but be capital consumptive Free capital generation metric focuses on:Components of shareholder’s equity that are capital relevant, i.e. which affect our capital base; specifically pre-tax income excluding FVoD net of cash taxes as well as Deferred Tax Asset threshold impacts, additional costs relating to share awards and net impact of defined benefit pension fundsGives a clear analysis of how much capital we generate from operating activities, separate from other activitiesAnd how this capital is reinvested We intend to use the Operating Free Capital Generation measure as a new KPI For the overall performance of Credit Suisse GroupTo guide our capital reallocationAs a target for dividendsAs a metric to measure divisional performance 3Q15 results Financial summary Financial targets Capital targets Free capital gen. Capital raise

October 21, 2015 33 Illustrative generation of free capital and CET1 capital in 4Q15 - 2018 3Q15 results Financial summary Financial targets Capital targets Free capital gen. Capital raise Operating free capital generated CS LE Switz.IPO2+2.0-4.0 Increased leverage ratio req. to 3.5% Other issuances+0.5 ~ 8.5 – 9.5 Other sources of capital+ ~9.0 – 11.0 Free capital generation Free cap. usage Note: Under the free capital generation concept, capital is calculated using 10% to convert RWA into capital and 3.5% for leverage exposure. Considerations for both RWA and leverage exposure movements are based on the constraining factor of capital calculation for the period. Business-related leverage moves and asset disposals Free capital generated ~ 18.5 – 19.5 CET1 gen. Increase in CET 1 ~ 14.0 – 15.0 Net free capital generated 1 Net of costs and including relating threshold impact for deferred tax assets 2 Includes other management actions. Any such IPO would involve the sale of a minority stake and would be subject to, among other things, all necessary approvals and would be intended to generate / raise additional capital for Credit Suisse AG or Credit Suisse (Schweiz) AG New KPI ~ 10.5 – 11.5 Illustrative 4Q15- 2018 free capital generation in CHF bn Capital raise+6.51 Cash dividends accrued ~(4.5) + ~1.7 ~(5.2)

October 21, 2015 34 Illustrative generation of free capital and CET1 capital in 2019 - 2020 3Q15 results Financial summary Financial targets Capital targets Free capital gen. Capital raise Note: Under the free capital generation concept, capital is calculated using 10% to convert RWA into capital and 3.5% for leverage exposure. Considerations for both RWA and leverage exposure movements are based on the constraining factor of capital calculation for the period Operating free capital generated Changes in regulatory and capital requirements Business related RWA moves Cash dividends accrued ~ 14.5 – 15.5 Free capital generated Free capital generated Free cap. usage Illustrative 2019-2020 free capital generation in CHF bn CET1 gen. Increase in CET 1 Net free capital generated applying 60% floor New KPI 40-45% % % usage of free capital generated Target cash dividend payout of >40% of operating free capital generated ~ 14.5 – 15.5 ~ 8.0 – 9.0 ~ 3.5 – 4.5 15-20% ~(6.5) ~(2.0)1applying 60% floor ~(2.5) 1 Includes negative impact of CHF (5) bn from changes in capital requirements and positive impact of CHF +3 bn from the change in constraining factor from leverage exposure to RWA
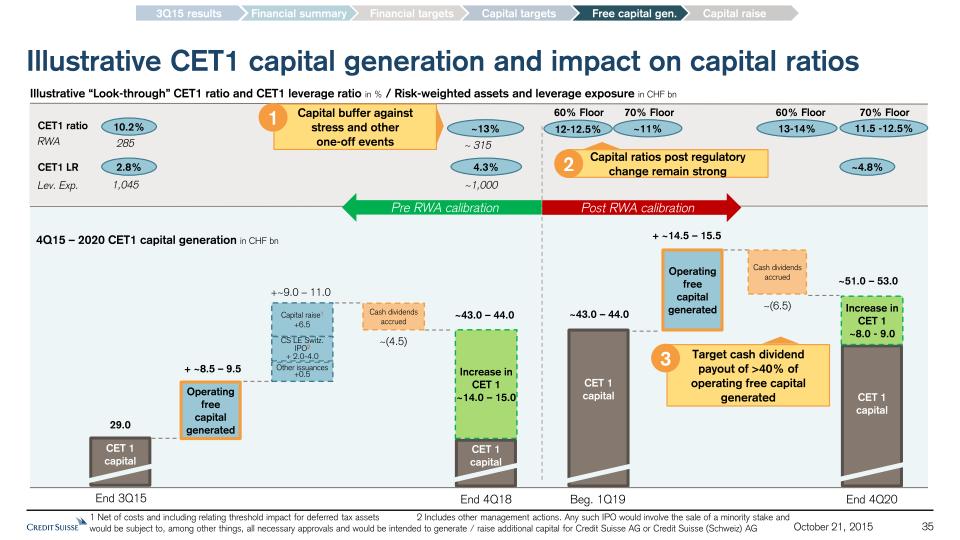
October 21, 2015 35 3Q15 results Financial summary Financial targets Capital targets Free capital gen. Capital raise CET 1capital 29.0 CET 1capital CET 1 capital Operating free capital generated Cash dividends accrued CET 1capital Operating free capital generated Cash dividends accrued + ~8.5 – 9.5 CET1 ratioRWACET1 LRLev. Exp. 10.2% 2.8% 285 1,045 ~13% 4.3% ~ 315 ~1,000 11.5 -12.5% ~4.8% End 3Q15 End 4Q18 Beg. 1Q19 End 4Q20 4Q15 – 2020 CET1 capital generation in CHF bn Post RWA calibration Pre RWA calibration Illustrative “Look-through” CET1 ratio and CET1 leverage ratio in % / Risk-weighted assets and leverage exposure in CHF bn Illustrative CET1 capital generation and impact on capital ratios Capital ratios post regulatory change remain strong 2 Increase in CET 1~14.0 – 15.0 Increase in CET 1 ~8.0 - 9.0 13-14% 60% Floor 70% Floor Capital buffer against stress and other one-off events 1 Target cash dividend payout of >40% of operating free capital generated 3 ~11% 12-12.5% 60% Floor 70% Floor ~43.0 – 44.0 ~43.0 – 44.0 + ~14.5 – 15.5 ~51.0 – 53.0 +~9.0 – 11.0 Capital raise1+6.5 CS LE Switz.IPO2+ 2.0-4.0 Other issuances+0.5 ~(4.5) ~(6.5) 1 Net of costs and including relating threshold impact for deferred tax assets 2 Includes other management actions. Any such IPO would involve the sale of a minority stake and would be subject to, among other things, all necessary approvals and would be intended to generate / raise additional capital for Credit Suisse AG or Credit Suisse (Schweiz) AG
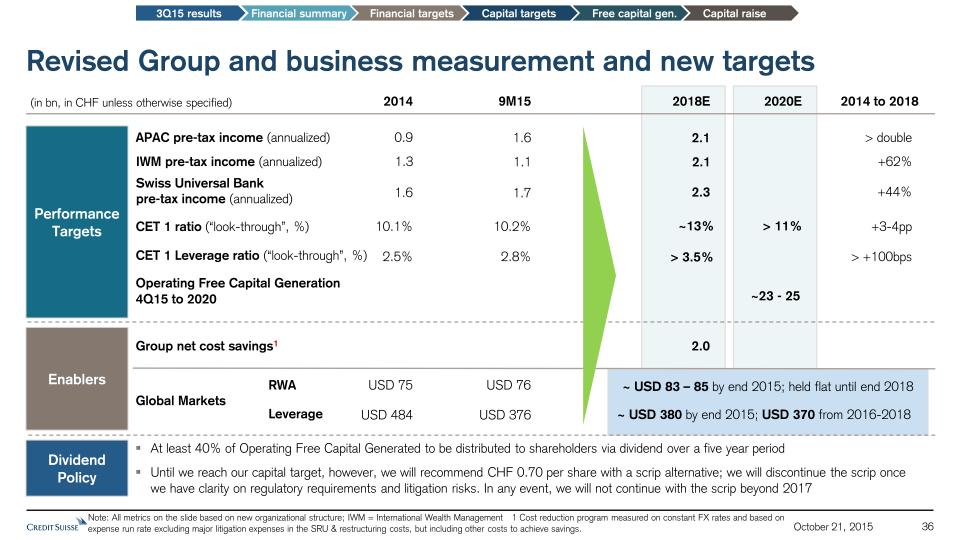
Revised Group and business measurement and new targets APAC pre-tax income (annualized) CET 1 ratio (“look-through”, %) CET 1 Leverage ratio (“look-through”, %) Operating Free Capital Generation4Q15 to 2020 2014 0.9 1.6 10.2% 2.8% Swiss Universal Bankpre-tax income (annualized) 1.6 1.7 Enablers Performance Targets Note: All metrics on the slide based on new organizational structure; IWM = International Wealth Management 1 Cost reduction program measured on constant FX rates and based on expense run rate excluding major litigation expenses in the SRU & restructuring costs, but including other costs to achieve savings. 2.1 2.3 ~13% 2018E > 3.5% Group net cost savings1 2.0 Global Markets USD 76 USD 376 9M15 ~ USD 83 – 85 by end 2015; held flat until end 2018 ~ USD 380 by end 2015; USD 370 from 2016-2018 (in bn, in CHF unless otherwise specified) USD 75 USD 484 2014 to 2018 > double +44% +3-4pp > +100bps 10.1% 2.5% ~23 - 25 2020E October 21, 2015 36 3Q15 results Financial summary Financial targets Capital targets Free capital gen. Capital raise Dividend Policy At least 40% of Operating Free Capital Generated to be distributed to shareholders via dividend over a five year periodUntil we reach our capital target, however, we will recommend CHF 0.70 per share with a scrip alternative; we will discontinue the scrip once we have clarity on regulatory requirements and litigation risks. In any event, we will not continue with the scrip beyond 2017 > 11% RWA Leverage IWM pre-tax income (annualized) 1.3 1.1 2.1 +62%
Overview of Financials and Capital October 21, 2015 37 3Q15 Financial results summary 1 Financial summary under current and new structures 2 Financial metrics for the Group and the new segments 3 Targets for Group capital usage and allocation 4 Free capital generation 5 Capital raise 6 Note: Unless otherwise noted, figures presented in the following section are based on what our results under our new structure would have been, had it been in place January 1, 2014

October 21, 2015 38 Capital raise and other management actions 3Q15 results Financial summary Financial targets Capital targets Free capital gen. Capital raise Capital Raise Other Management Actions The capital raise is expected to add CHF 5.9 bn net of costs to our shareholders’ equity and, due to the resulting higher threshold for deferred tax utilization, increases our CET1 position by CHF 6.5 bnCompared to our end-2015 targets for RWA and leverage, this equates to a pro forma CET1 ratio of 12.2 %, a CET1 leverage ratio of 3.6%, a Tier 1 leverage ratio 4.7% and a Total Swiss Capital leverage ratio of 5.4%. These ratios are calculated using 2015 year end target leverage exposure and RWACombined with the capital released by the SRU, the capital raise is expected to enable us to fund restructuring and other CtA expenses of CHF 2 bn to CHF 2.5 bn, while funding growth in APAC, IWM businesses and developing a buffer against future regulatory change and litigation risks We intend to target a minority interest IPO2 in our Credit Suisse Legal Entity Switzerland by the end of 2017 in order to support our strategic plans to expand this business organically and through consolidation in the Swiss marketCombined with other management actions, this could result in a further CHF 2 bn to CHF 4 bn of capital for the Group by the end of 2017Post finalization of the new RWA regime by 2018, this may lead to an excess of capital against our current targets; in this event, we would seek to return this excess to our shareholders CET 1 capital “Look-through” CET1 ratio CET1 leverage ratio Tier 1 leverage ratio 29.0 +6.5 35.5 10.2% 2.8% 3.9% 12.2% 3.6% 4.7% 3Q15Reported CapitalRaise1 3Q15 Illustrative 3 Illustrative impact of a capital raise in CHF bn 1 Including threshold impact for deferred tax assets 2 Any such IPO would involve the sale of a minority stake and would be subject to, among other things, all necessary approvals and would be intended to Total Swiss Capital leverage ratio 4.5% 5.4% generate / raise additional capital for Credit Suisse AG or Credit Suisse (Schweiz) AG 3 These ratios are calculated using 2015 year end target leverage exposure and RWA

October 21, 2015 39 Illustrative timeline for the capital raise Investor Day21 October Wednesday Extraordinary General Meeting19 November Thursday Ex-rights trading23 November Monday End of rightsexercise period03 December Thursday 3Q15 results Financial summary Financial targets Capital targets Free capital gen. Capital raise First trading dayof new shares04 December Friday End of rightstrading period01 December Tuesday 2015 Certain Key Terms Structure Firm underwritten rights issue and non pre-emptive placement with anchor investors1 Size of capital raise c.CHF 6 bn o/w Rights issue c.CHF 4.7 bn o/w Non-preemptive offering c.CHF 1.36 bn Number of shares to be issued c.319 mn Impact on conditional capital No impact expected on current outstanding contingent convertible capital 1 Subject to customary conditions, including approval by Extraordinary General Meeting

Appendix October 21, 2015 40

October 21, 2015 41 Financial summary under current structure Strategic Pre-tax Income/ (Loss) - o/w non-strategic litigations In CHF bn 3.7 Priv. Bank. & Wealth Manag. Non-Strat. Total 2.7 - (1.6) - (1.6) - (1.6) (0.3) 2.1 2.4 3.7 2.3 (1.9) (0.9) 1.8 1.4 (0.7) (0.5) 0.0 0.7 (0.7) 0.2 6.8 4.5 (3.6) (0.4) 3.2 4.0 2014 9M15 2014 9M15 2014 9M15 Strategic Investment Banking Non-Strat. Total 2014 9M15 2014 9M15 2014 9M15 Strategic Corporate Center Non-Strat. Total 2014 9M15 2014 9M15 2014 9M15 Strategic Credit Suisse Core Results Non-Strat. Total 1 2014 9M15 2014 9M15 2014 9M15 - - (0.8) (0.2) (0.8) (0.2) - - - - - - - - (2.4) (0.2) (2.4) (0.2) Basel 3 RWA Leverage RoC / RoE (%)2 102 104 6 4 108 108 150 152 10 8 160 161 16 16 16 16 268 272 16 13 284 285 365 369 5 4 370 373 690 565 58 37 748 601 32 71 32 71 1,087 1,004 63 40 1,150 1,045 29 23 15 20 17 13 8 8 12 11 4 9 1 The difference between Credit Suisse results (under current structure) and Credit Suisse Group results (under new structure) includes certain entities in which we had no significant economic interest in the unit2 Division RoC (return on regulatory capital) calculated using income after tax; assumes tax rate of 30%, and capital allocated based on the average of 10% of average Basel 3 risk-weighted assets and 2.4% of average leverage exposure (or 3.0% where specified) in 2014; in 9M15, the calculation is based on the average of 10% of average Basel 3 risk-weighted assets and 3.0% of average leverage exposure. RoE (return on equity) for core results calculated by dividing annualized core net income by average core shareholders' equity (derived by deducting 10% of Strategic Resolution Unit RWA from reported shareholders' equity) 26 23 14 20 15 13 7 8 RoC (@ 3.0% lev)

Financial summary under new structure October 21, 2015 42 SwissUniversal Bank Pre-tax Income/ (Loss) 2014 Ann. 9M15 1.6 1.7 - - o/w Non-Strat litigations Basel 3 RWA Leverage3 In CHF bn International WM Global Markets Asia Pacific Strategic Resolution Unit Corporate Center Credit Suisse Group1 2014 Ann. 9M15 1.3 1.1 - - 2014 Ann. 9M15 2.4 1.9 - - 2014 Ann. 9M15 0.9 1.6 - - 2014 Ann. 9M15 (3.1) (2.0) (2.4) (0.2) 2014 Ann. 9M15 0.0 1.0 - - 2014 Ann. 9M15 3.6 5.4 (2.4) (0.2) 13 “Worst of” RoC / RoE (%)2 58 61 33 32 75 74 22 24 66 60 16 16 284 285 248 244 74 79 479 368 131 104 194 146 32 71 1,198 1,045 27 24 10 14 4 Credit Suisse Core results 2014 Ann. 9M15 13 16 Credit Suisse Core 6.8 7.3 - - 219 225 1,005 899 14 10 30 9 CC excl. FVoD FVoD 0.5 (0.5) 1.3 (0.3) 1 The difference between Credit Suisse Core results (under current structure) and Credit Suisse Group results (under new structure) includes certain entities in which we had no significant economic interest in the unit 2 Division and Credit Suisse Core RoC (return on regulatory capital) is the worst of return on 10% of spot RWA and return on 3.5% of spot Swiss leverage exposure; assumes tax rate of 30% in 2014; and is the worst of return on 10% of spot RWA and return on 3.5% of spot leverage exposure; assumes tax rate of 30% in 9M15. RoE (return on equity) calculated for Credit Suisse Group . RoE (return on equity) calculated for Credit Suisse Group 3 Swiss leverage exposure IBCM 2014 Ann. 9M15 0.5 0.1 - - 16 18 41 34 23 5
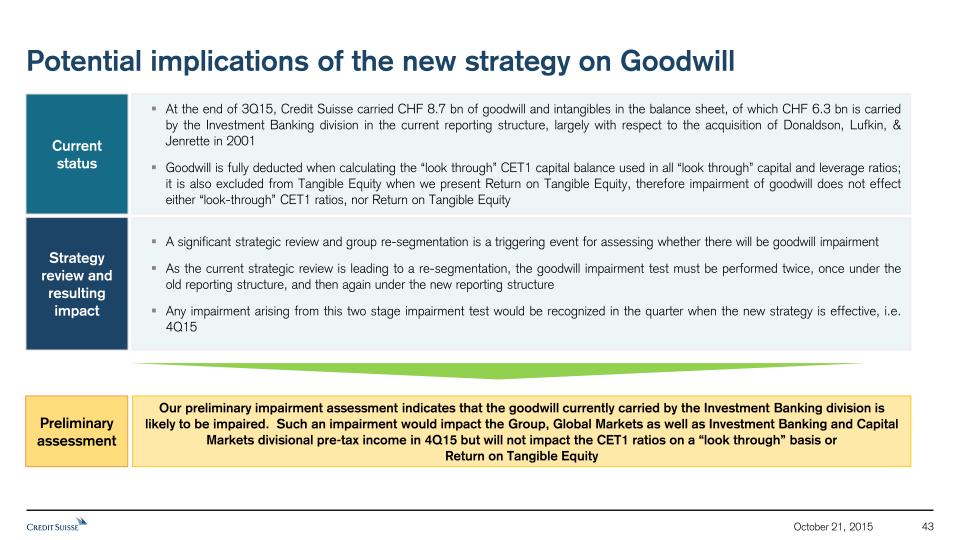
Potential implications of the new strategy on Goodwill October 21, 2015 43 At the end of 3Q15, Credit Suisse carried CHF 8.7 bn of goodwill and intangibles in the balance sheet, of which CHF 6.3 bn is carried by the Investment Banking division in the current reporting structure, largely with respect to the acquisition of Donaldson, Lufkin, & Jenrette in 2001Goodwill is fully deducted when calculating the “look through” CET1 capital balance used in all “look through” capital and leverage ratios; it is also excluded from Tangible Equity when we present Return on Tangible Equity, therefore impairment of goodwill does not effect either “look-through” CET1 ratios, nor Return on Tangible Equity Current status A significant strategic review and group re-segmentation is a triggering event for assessing whether there will be goodwill impairmentAs the current strategic review is leading to a re-segmentation, the goodwill impairment test must be performed twice, once under the old reporting structure, and then again under the new reporting structureAny impairment arising from this two stage impairment test would be recognized in the quarter when the new strategy is effective, i.e. 4Q15 Strategy review and resulting impact Our preliminary impairment assessment indicates that the goodwill currently carried by the Investment Banking division is likely to be impaired. Such an impairment would impact the Group, Global Markets as well as Investment Banking and Capital Markets divisional pre-tax income in 4Q15 but will not impact the CET1 ratios on a “look through” basis or Return on Tangible Equity Preliminary assessment
Credit Suisse StrategyOverview of CostsDavid Mathers

October 21, 2015 45 CHF 2 bn net cost savings target expected to reduce absolute cost base to between CHF 18.5 and 19 bn by end-2018 2015 – 2020 Cost reduction program in CHF bn, year-end targets ~20.5 - 21.0 TargetCHF 3.5 bn of gross savings by end 2018 Further net savings targeted 2018+ 2015E 2018target 2020target Reduction of fixed cost base to a lower “break even point” to profitability and reduce earnings volatilityCHF 2.0 bn net savings target includes:CHF (3.5) bn of gross cost savingsPlanned CHF 1.5 bn of investments to facilitate divisional growth initiatives, of which 60% targeted for Asia Pacific and the remainder to our Swiss Universal Bank and International Wealth ManagementFurther net savings targeted beyond 2018, driven by efficiencies from IT digitalization and shared use of utilities GrossSavings GrowthInvestments Note: Cost reduction program measured on constant FX rates and based on expense run rate excluding major litigation expenses in the SRU & restructuring costs, but including other costs to achieve savings 2015E (1.3)bn: Business exits & run-down of SRU portfolio(0.9)bn: workforce strategy, technology & London right-sizing(0.1)bn: additional wind-down of Corporate Center costs+1.5bn: divisional growth investments (0.9)bn: substantial completion of Corp. Center programs (i.e., legal entity program, IT architecture simplification, etc.) (0.3)bn: run-down of SRU portfolio (planned run-down of prior Non-Strategic Unit) Previously PlannedCost Reductions TargetCHF 2.0 bn of net savings by end 2018

October 21, 2015 46 CorporateCenter1 SharedServices Other Front Office and SRU Expenses 2018 CostSavings Cost SavingsPost-Reinvestment Reinvestment 1.0 0.9 1.6 3.5 2.0 Corp. CenterSubstantial completion of major programs including regulatory projects ServicesEfficiencies from workforce strategy and London right-sizing, etc. SRU & ExitsRun-down of SRU portfolio, business exits, and associated costs Notes: Cost reduction program measured in constant FX rates and based on expense run rate excluding major litigation expenses in the SRU & restructuring costs, but including other costs to achieve savings 1 Includes rundown of realignment costs Sources of cost savings Investments to facilitate divisional growth initiatives 2015 – 2018 Cost development in CHF bn Cost Savings (1.5) 1 2 3 Net savings target Efficiency measures expected to free up resources for use in growth initiatives

October 21, 2015 47 Corporate Center major program expenses and run-off profile in CHF bn CHF 1bn in savings expected from the wind-down of major programs in the Corporate Center Corporate Center expenses 1.6 0.6 (o/w 0.14 remaining in Corporate Center) (1.0) Proforma 2015 Reduction Target 2018 Legal Entity Programincluding recovery resolution plan 0.5 0.9 0.2 (0.5) Minimal < CHF 50 mn (0.4) (0.1) 0.1 Other Major Programs*(including other CtA required to improve structural environment & reduce costs) Residual Corporate Items 0.4* Legal Entity Program components1 2016 2017 2018 US IHC Switzerland Legal Entity Service Company Major Programs components1 2016 2017 2018 IT infrastructure efficiency Front-to-back optimization Driving further innovation 1 Shows major select components* Other Major Programs will no longer be reported within the Corporate Center and will be allocated to the divisions under the new reporting structure. Allocated to divisions under new structure 1

October 21, 2015 48 Material transformation of services expected over the coming years 2 SimplifyDuplication between front office embedded support and central services functionsRedesign of Front-to-Back service model using a zero-based approachTransform and streamline IT AlignSupply of services is planned to be effectively aligned to future value creation and to the demand of the divisionsDespite significant deployment over the last 5 years, there is still a high concentration of support functions in higher cost locations (e.g., London, Zurich and NYC) RestructureReduce surplus of real estate in high cost markets, particularly in the UKRationalize infrastructure and simplify application architecture InvestExponential digital / mobile adoptionIncreasing opportunities in data application and analyticsExpanding importance of APAC region Workforce Strategy London Rightsizing Efficiencies in technology 0.9 Savings by 2018 0.4 0.2 0.3 Efficiencies in technologyRationalizing use of applicationsRealizing cross-divisional savings together with improvements in client service and operational risk Workforce StrategyRationalization of service and support functions between embedded front office groups and central services functionsReassess alignment of services functionsFurther deployment of functions to our Centers of Excellence in Eastern Europe, Pune and Raleigh London RightsizingOptimize location strategy for UK businessConsolidate target London footprint in One Cabot Square headquarters, with selected off-shoring of staff who do not require UK presence Strategic Initiatives and expected savings in CHF bn
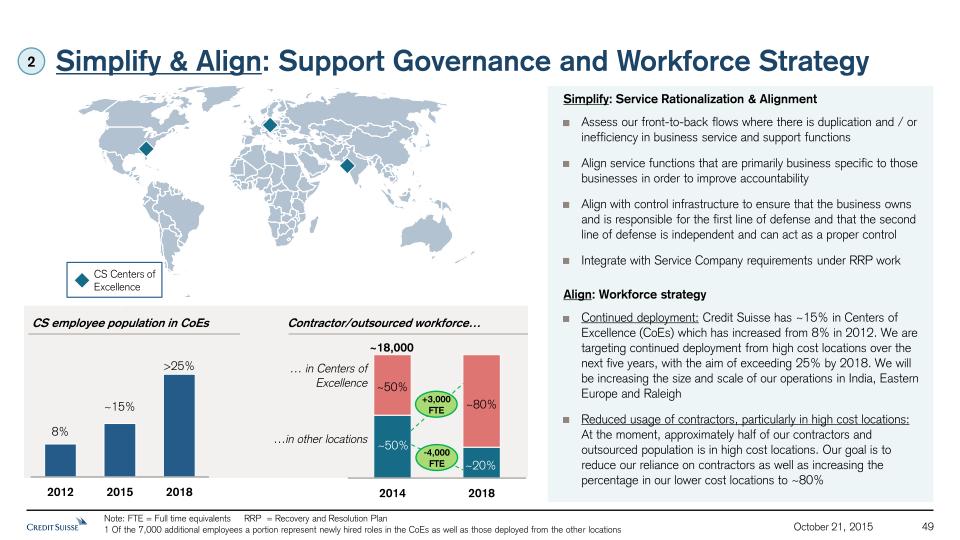
October 21, 2015 49 Simplify & Align: Support Governance and Workforce Strategy …in other locations … in Centers ofExcellence CS employee population in CoEs CS Centers of Excellence Contractor/outsourced workforce… +3,000 FTE ~18,000 -4,000 FTE Note: FTE = Full time equivalents RRP = Recovery and Resolution Plan1 Of the 7,000 additional employees a portion represent newly hired roles in the CoEs as well as those deployed from the other locations Simplify: Service Rationalization & AlignmentAssess our front-to-back flows where there is duplication and / or inefficiency in business service and support functionsAlign service functions that are primarily business specific to those businesses in order to improve accountabilityAlign with control infrastructure to ensure that the business owns and is responsible for the first line of defense and that the second line of defense is independent and can act as a proper controlIntegrate with Service Company requirements under RRP workAlign: Workforce strategyContinued deployment: Credit Suisse has ~15% in Centers of Excellence (CoEs) which has increased from 8% in 2012. We are targeting continued deployment from high cost locations over the next five years, with the aim of exceeding 25% by 2018. We will be increasing the size and scale of our operations in India, Eastern Europe and RaleighReduced usage of contractors, particularly in high cost locations: At the moment, approximately half of our contractors and outsourced population is in high cost locations. Our goal is to reduce our reliance on contractors as well as increasing the percentage in our lower cost locations to ~80% 2

October 21, 2015 50 Align: London rightsizing expected to deliver ~CHF 230mn in annual savings by 2020 A detailed review is underway to determine the most efficient London footprint given the changes to the front office mix and the location of businessesRightsizing expected to be done through:Consolidating target London footprint in One Cabot Square headquarters, releasing other key sites for sub-letting and minimizing potential cost/impairment charges across 2016-17Selected off-shoring of staff who do not require UK presence to existing CS offshore sites ~ 6,600 UK employees and contractors with ~60% in service and support functions Identify current London roles that require co-location with Front Office vs. those that could be located elsewhereFor roles not required in London, investigate alternative sourcing options including Off-shoring, Near-shoring5 office spaces with the total area of ~1.5 mn square feetCurrent footprint underutilized and presents opportunities for sub-letting and cost release Real Estate Reduction in force London current footprint Rightsizing plan Expected benefits London Rightsizing Costs vs. Savingsin CHF mn ~CHF 230 ~CHF 220 Optimize the location strategy for the UK Business – right resources in the right place to optimize for cost, skills and degree of co-location required Costs-to-achieve* Saves * Note, CHF 500mn of restructuring charges related to overall London strategy, of which CHF 170mn relates to rightsizing. CHF 170mn restructuring costs related to London Rightsizing Other Costs-to-Achieve 2

October 21, 2015 51 Restructure & Invest: Gaining efficiencies through technology Run-down of redundant infrastructure: converge technology platforms onto a smaller base of future proof applicationsThe reduction from ~7,500 to ~5,500 applications has both reduced operating costs and operational riskA further ~500 applications will be removed in the next stage of this program, with a further segment of applications put into ‘run-off’, including potential deployment to external providers to reduce costsContinue to implement a number of client focused straight through processing initiatives across the complete Front-to-Back landscapeInvesting in an infrastructure rationalization program to optimize the efficiency of infrastructure asset base to address up to 50% reduction of the legacy infrastructure and converge onto a market standard hybrid cloud based infrastructure Continue to monetize some leading edge functions as well as participate in emerging cross-industry utilities to improve standardization and gain greater scale efficiencies from processes which are essentially industry commoditiesLeveraging innovative technologies to solve enduring institutional challenges as well as crowdsourcing: Crowdsourcing Pilots are already being rolled out enterprise-wide to help drive the innovation agenda Credit Suisse has already achieved CHF 0.8 bn of savings across our IT landscape since 2011 Targeting a further CHF 0.6 bn savings by 2018 Continued focus on innovation: After successful launch of Digital Private Bank, continued identification of innovation opportunities through a global innovation lab strategy. Recent successful implementations include:Robotic automation using pattern recognition and AI technology to automate existing manual processesUnauthorized trading technology, helping managers and control functions to monitor trading more effectively and more efficientlySales analytics, improving the efficiency and effectiveness of sales force 2

October 21, 2015 52 2015 – 2018 Cost reduction program in CHF bn Strategic Resolution Unit rundown 0.6 0.5 1.6 0.5 Divestitures & SRU rundown expected to contribute to CHF 1.6 bn of savings Achieve CHF 0.6 bn of savings by 2018 from divestiture of US Private Banking Business and related operationsOther wind-down savings include costs associated with additional Western European PB businesses and Investment Banking businesses (i.e., legacy fixed income portfolio and additional activities identified as non-core) Rationalization of front office footprint and related infrastructure costs to align with reduction in resources needed for portfolio management 3 Note: Cost reduction program measured in constant FX rates and based on expense run rate excluding major litigation expenses in the SRU & restructuring costs, but including other costs to achieve savings

Credit Suisse StrategyOverview of Strategic Resolution UnitDavid Mathers

October 21, 2015 54 Non-Strategic Unit (NSU) Investment Banking Private Banking and Wealth Management Corporate Center Credit Suisse Group Stra-tegic IB IB NSU WMC, CIC, AM PB&WM NSU Stra-tegic CC CC NSU Swiss Univ.Bank Credit Suisse Group Int’lWM GlobalMarkets IBCM Corp.Ctr. Strategic Resolution Unit (SRU) Set up as a separate reporting segmentConsolidates remaining portfolios from existing non-strategic units plus transfers of additional exposures in order to immediately reposition and resize to our desired long-term core setupResponsible for unwinding positions included Concept of strategic and non-strategic results is retired Asia Pacific Strat.Resol. Unit Strategic Resolution Unit set up as evolution and expansion of non-strategic units
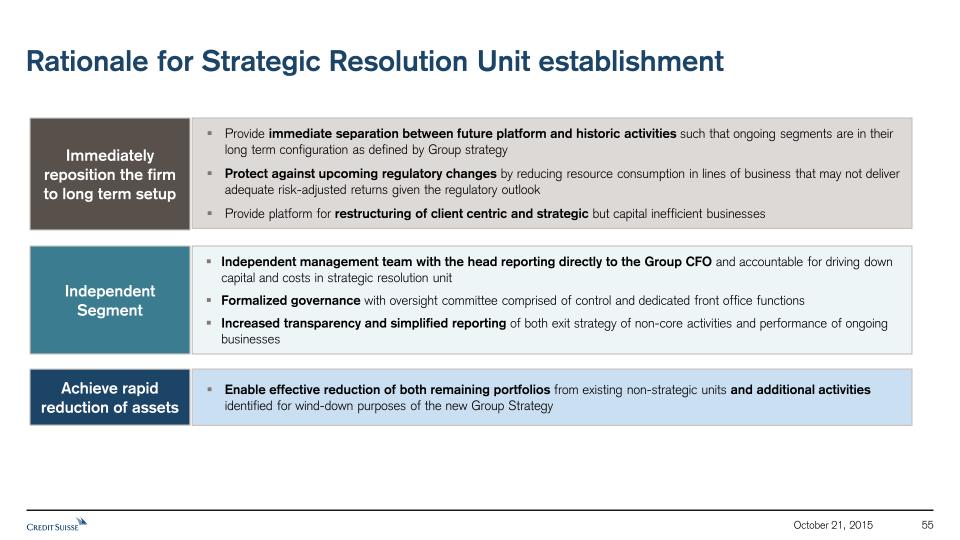
October 21, 2015 55 Independent Segment Independent management team with the head reporting directly to the Group CFO and accountable for driving down capital and costs in strategic resolution unitFormalized governance with oversight committee comprised of control and dedicated front office functions Increased transparency and simplified reporting of both exit strategy of non-core activities and performance of ongoing businesses Immediately reposition the firm to long term setup Provide immediate separation between future platform and historic activities such that ongoing segments are in their long term configuration as defined by Group strategyProtect against upcoming regulatory changes by reducing resource consumption in lines of business that may not deliver adequate risk-adjusted returns given the regulatory outlookProvide platform for restructuring of client centric and strategic but capital inefficient businesses Achieve rapid reduction of assets Enable effective reduction of both remaining portfolios from existing non-strategic units and additional activities identified for wind-down purposes of the new Group Strategy Rationale for Strategic Resolution Unit establishment

October 21, 2015 56 1 Included in Corporate Center and allocated to divisions 2 Excludes operational risk 9M15 Pre-tax income / (loss) in CHF mn Strategic Resolution Unit Legacy fixed income portfolio Legacy litigation provisionsLegacy funding costsOther Remaining IB NSU portfolio Restructuring of selected onshore businesses Legacy cross-border businessesRestructuring of former asset management divisionOther Remaining PB&WM NSU portfolio Movements in credit spreads on own liabilities1Realignment costs1Legacy funding costsReal estate salesOther Remaining Corporate Center NSU portfolio MacroCredit SPPrimeEMG Additional IB portfolio US private banking businessSelected Western European branches (e.g. Monaco, Gibraltar, Austria, and etc.) Additional PB&WM portfolio Certain entities in which we had no significant economic interest in the unit Other additional positions (415) NSU Add. CC1 SRU 3Q15 Basel 3 RWA in CHF bn 13 60 NSU2 Add. Op. Risk SRU 29 18 3Q15 Leverage in CHF bn 40 146 NSU Add. SRU 106 IB: 87% IB: 85% IB PBWM CC & Other SRU portfolio exposure primarily driven by IB related positions (85% RWA and 87% Leverage at the end of 9M15)Operational risk has been planned in the SRU to represent a fair allocation based on the SRU portfolio and establishes clear alignment of Op Risk with underlying activities in line with the new Group strategy Composition of Strategic Resolution Unit (263) (812) (1,491)
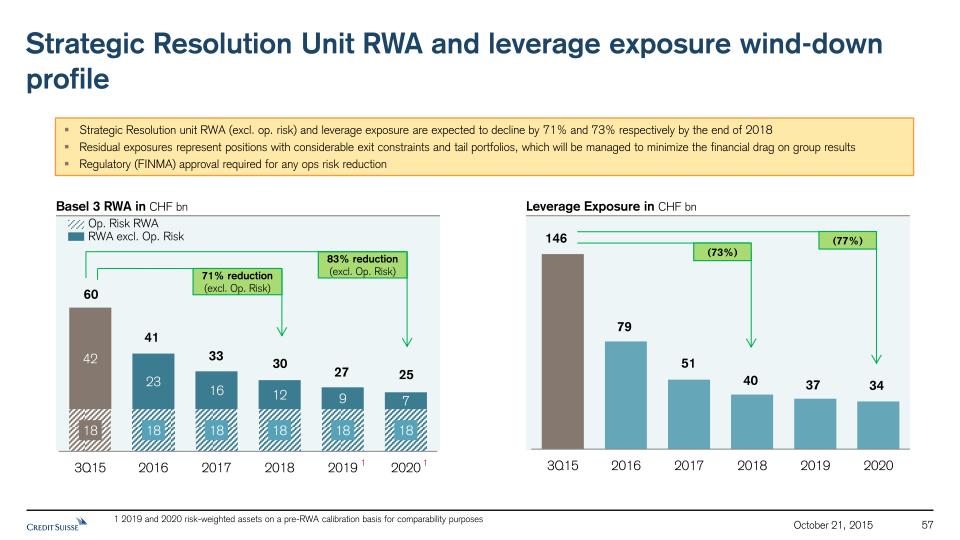
57 October 21, 2015 Basel 3 RWA in CHF bn Leverage Exposure in CHF bn RWA excl. Op. Risk Op. Risk RWA 60 41 33 30 27 25 146 79 51 40 37 34 (73%) 71% reduction (excl. Op. Risk) Strategic Resolution unit RWA (excl. op. risk) and leverage exposure are expected to decline by 71% and 73% respectively by the end of 2018Residual exposures represent positions with considerable exit constraints and tail portfolios, which will be managed to minimize the financial drag on group resultsRegulatory (FINMA) approval required for any ops risk reduction Strategic Resolution Unit RWA and leverage exposure wind-down profile 83% reduction (excl. Op. Risk) (77%) 1 1 1 2019 and 2020 risk-weighted assets on a pre-RWA calibration basis for comparability purposes
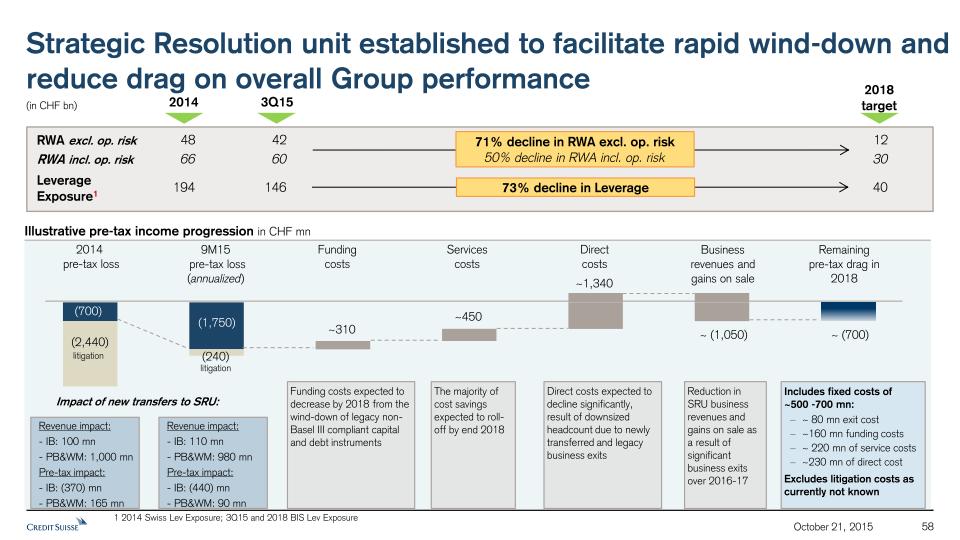
October 21, 2015 58 Strategic Resolution unit established to facilitate rapid wind-down and reduce drag on overall Group performance Illustrative pre-tax income progression in CHF mn 2014 pre-tax loss Fundingcosts Servicescosts Remaining pre-tax drag in 2018 Directcosts Business revenues and gains on sale RWA excl. op. risk Leverage Exposure1 (in CHF bn) 48 194 42 146 9M15 pre-tax loss (annualized) Funding costs expected to decrease by 2018 from the wind-down of legacy non-Basel III compliant capital and debt instruments The majority of cost savings expected to roll-off by end 2018 Direct costs expected to decline significantly, result of downsized headcount due to newly transferred and legacy business exits Reduction in SRU business revenues and gains on sale as a result of significant business exits over 2016-17 Includes fixed costs of ~500 -700 mn:~ 80 mn exit cost~160 mn funding costs~ 220 mn of service costs~230 mn of direct costExcludes litigation costs as currently not known 12 40 2014 2018 target 3Q15 71% decline in RWA excl. op. risk50% decline in RWA incl. op. risk 73% decline in Leverage RWA incl. op. risk 66 60 30 Revenue impact: - IB: 100 mn - PB&WM: 1,000 mnPre-tax impact: - IB: (370) mn - PB&WM: 165 mn Revenue impact: - IB: 110 mn - PB&WM: 980 mnPre-tax impact: - IB: (440) mn - PB&WM: 90 mn Impact of new transfers to SRU: 1 2014 Swiss Lev Exposure; 3Q15 and 2018 BIS Lev Exposure


October 21, 2015 Credit Suisse StrategySwiss Universal BankThomas Gottstein

Disclaimer The 3Q15 financial information is subject to further review We have not finalized our 3Q15 Financial Report and our independent registered public accounting firm has not completed its review of the condensed consolidated financial statements (unaudited) for the period. Accordingly, the 3Q15 financial information contained in this presentation is subject to completion of quarter-end procedures, which may result in changes to that information. Certain reclassifications have been made to prior periods to conform to the current presentation.The re-segmented financial information is preliminary and subject to further review Unless otherwise noted, this presentation contains certain historical financial information that has been re-segmented to approximate what our results under our new structure would have been, had it been in place from January 1, 2014. Such information is preliminary in nature and subject to review, evaluation and refinement, has not been audited or reviewed by our independent public accountants and can be expected to change in certain respects before any final re-segmentation is published. In addition, “Illustrative”, “Ambition” and “Goal” presentations are not intended to be viewed as targets or projections, nor are they considered to be Key Performance Indicators. All such presentations are subject to a large number of inherent risks, assumptions and uncertainties, many of which are completely outside of our control. Accordingly, this information should not be relied on for any purpose. We may not achieve the benefits of our strategic initiatives We may not achieve all of the expected benefits of our strategic initiatives. Factors beyond our control, including but not limited to the market and economic conditions, changes in laws, rules or regulations and other challenges discussed in our public filings, could limit our ability to achieve some or all of the expected benefits of these initiatives. Cautionary statement regarding forward -looking statements This presentation contains forward-looking statements that involve inherent risks and uncertainties, and we might not be able to achieve the predictions, forecasts, projections and other outcomes we describe or imply in forward-looking statements. A number of important factors could cause results to differ materially from the plans, objectives, expectations, estimates and intentions we express in these forward-looking statements, including those we identify in "Risk Factors” in our Annual Report on Form 20-F for the fiscal year ended December 31, 2014 and in “Cautionary statement regarding forward-looking information" in our second quarter 2015 Financial Report filed with the US Securities and Exchange Commission, and in other public filings and press releases. We do not intend to update these forward-looking statements except as may be required by applicable law. Statement regarding capital, liquidity and leverage As of January 1, 2013, Basel 3 was implemented in Switzerland along with the Swiss “Too Big to Fail” legislation and regulations thereunder (in each case, subject to certain phase-in periods). As of January 1, 2015, the Bank for International Settlements (BIS) leverage ratio framework, as issued by the Basel Committee on Banking Supervision (BCBS), was implemented in Switzerland by FINMA. Our related disclosures are in accordance with our interpretation of such requirements, including relevant assumptions. Changes in the interpretation of these requirements in Switzerland or in any of our assumptions or estimates could result in different numbers from those shown in this presentation. Capital and ratio numbers for periods prior to 2013 are based on estimates, which are calculated as if the Basel 3 framework had been in place in Switzerland during such periods. Unless otherwise noted, leverage exposure is based on the BIS leverage ratio framework and consists of period-end balance sheet assets and prescribed regulatory adjustments. Leverage amounts for 4Q14, which are presented in order to show meaningful comparative information, are based on estimates which are calculated as if the BIS leverage ratio framework had been implemented in Switzerland at such time. Beginning in 2015, the Swiss leverage ratio is calculated as Swiss total capital, divided by period-end leverage exposure. The look-through BIS tier 1 leverage ratio and CET1 leverage ratio are calculated as look-through BIS tier 1 capital and CET1 capital, respectively, divided by end-period leverage exposure. Selling restrictions This document is not an offer to sell or a solicitation of offers to purchase or subscribe for securities of Credit Suisse Group AG. This document is not a prospectus within the meaning of article 652a of the Swiss Code of Obligations, nor is it a listing prospectus as defined in the listing rules of the SIX Swiss Exchange AG or any other exchange or regulated trading facility in Switzerland or a prospectus under any other applicable laws. Copies of this document may not be sent to jurisdictions, or distributed in or sent from jurisdictions, in which this is barred or prohibited by law. The information contained herein shall not constitute an offer to sell or the solicitation of an offer to buy, in any jurisdiction in which such offer or solicitation would be unlawful prior to registration, exemption from registration or qualification under the securities laws of any jurisdiction. A decision to invest in securities of Credit Suisse Group AG should be based exclusively on a written agreement with Credit Suisse Group AG or an offering and listing prospectus to be published by Credit Suisse Group AG for such purpose. This document and the information contained herein is not for publication or distribution into the United States of America and should not be distributed or otherwise transmitted into the United States or to U.S. persons (as defined in the U.S. Securities Act of 1933, as amended (the “Securities Act”)) or publications with a general circulation in the United States. This document does not constitute an offer or invitation to subscribe for or to purchase any securities in the United States of America. The securities referred to herein have not been and will not be registered under the Securities Act or the laws of any state and may not be offered or sold in the United States of America absent registration or an exemption from registration under Securities Act. There will be no public offering of the securities in the United States of America. The information contained herein does not constitute an offer of securities to the public in the United Kingdom. No prospectus offering securities to the public will be published in the United Kingdom. This document is only being distributed to and is only directed at (i) persons who are outside the United Kingdom or (ii) to investment professionals falling within article 19(5) of the Financial Services and Markets Act 2000 (Financial Promotion) Order 2005 (as amended, the “Order”) or (iii) high net worth entities, and other persons to whom it may lawfully be communicated, falling within article 49(2)(a) to (d) of the Order (all such persons together being referred to as “relevant persons”). The securities are only available to, and any invitation, offer or agreement to subscribe, purchase or otherwise acquire such securities will be engaged in only with, relevant persons. Any person who is not a relevant person should not act or rely on this document or any of its contents. October 21, 2015

Swiss Universal Bank – Key messages Switzerland, our home market offers attractive growth opportunitiesWe can build on strong market positions across key businessesIn 2014, the business in scope of the Swiss Universal Bank as a whole contributed 24%1 of Group Core PTI Switzerland: Core to the Credit Suisse strategy Focus to simplify: Concentrate on Swiss-domiciled clientsEmpower to grow: Clearly defined initiatives across portfolio to achieve growth ambitionsDrive efficiency agenda: End-to-end accountability and increased automation to boost efficiencyInvest in brand: Further strengthening of brand and reputation in Switzerland Four strategic priorities Despite significant RWA increase due to regulatory changes…… we aim for a 17% post-tax return on regulatory capital3 by 2018, and …… a 10% earnings growth resulting in a PTI ambition of CHF 2.3 bn by 2018 Attractive returns and clear financial ambition Planning a partial 20-30% IPO of the Legal Entity Credit Suisse (Schweiz) AG by the end of 2017, market conditions permitting2Enhanced independence and accountability while remaining core part of a global bankAcquisition currency for Swiss consolidation opportunitiesExpected positive group capital impact of roughly CHF 2 to 4 bn including other management actions Planning a minority IPO (20 to 30%,by end 2017)2 1. Please refer to p. 7 for calculation basis 2. IPO of Legal entity Credit Suisse (Schweiz) AG. Any such IPO would be subject to, among other things, all necessary approvals and would be intended to generate / raise additional capital for Credit Suisse AG or Credit Suisse (Schweiz) AG. 3. Post-tax return on regulatory capital calculated using income after tax in CHF, assuming tax rate of 30%, and capital allocated on the highest of 10% of end 2014 Basel 3 risk-weighted assets and 3.5% of end 2014 leverage exposure October 21, 2015

Agenda The Swiss Universal Bank Winning at home: Four strategic priorities 1 2 Our financial ambition and conclusion 3 October 21, 2015
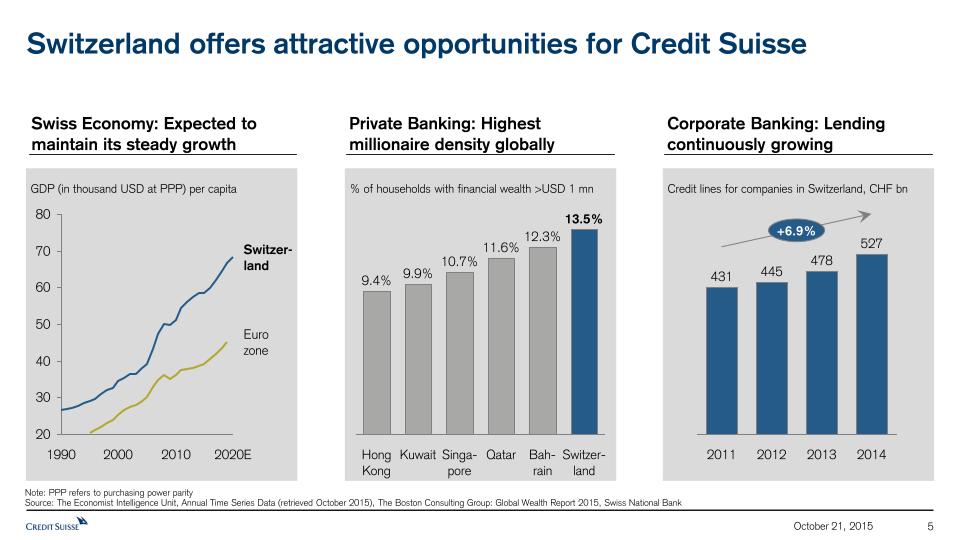
Switzerland offers attractive opportunities for Credit Suisse 50 80 70 60 40 30 20 Eurozone Switzer-land 2020E 2010 2000 1990 GDP (in thousand USD at PPP) per capita 12.3% Qatar 13.5% Bah-rain Switzer-land 11.6% Singa-pore 10.7% Kuwait 9.9% Hong Kong 9.4% % of households with financial wealth >USD 1 mn 527 +6.9% 2014 2013 478 2012 445 2011 431 Credit lines for companies in Switzerland, CHF bn Note: PPP refers to purchasing power paritySource: The Economist Intelligence Unit, Annual Time Series Data (retrieved October 2015), The Boston Consulting Group: Global Wealth Report 2015, Swiss National Bank Swiss Economy: Expected to maintain its steady growth Private Banking: Highest millionaire density globally Corporate Banking: Lending continuously growing October 21, 2015
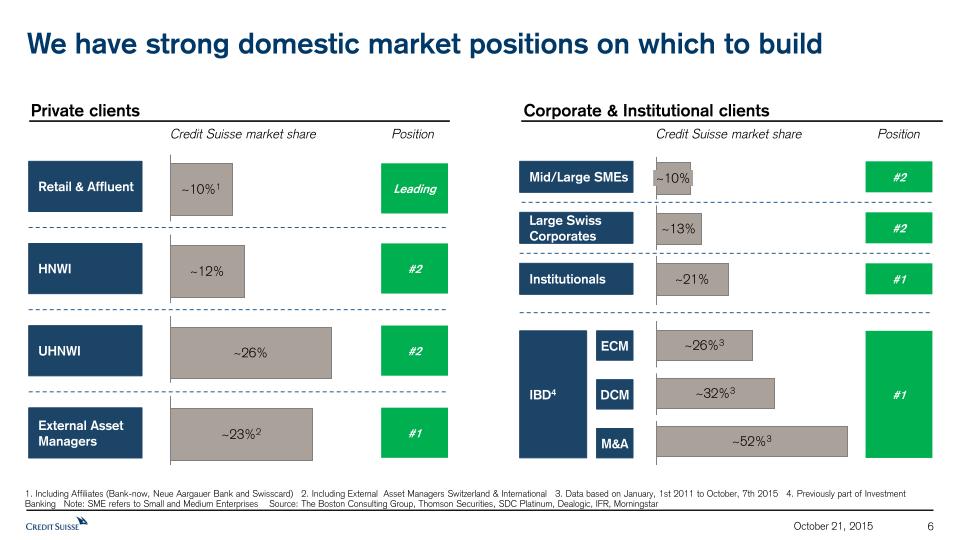
We have strong domestic market positions on which to build ~10%1 ~23%2 ~26% ~12% Mid/Large SMEs Large Swiss Corporates ECM IBD4 DCM M&A Retail & Affluent HNWI External Asset Managers UHNWI Institutionals ~21% ~13% ~10% ~32%3 ~26%3 ~52%3 1. Including Affiliates (Bank-now, Neue Aargauer Bank and Swisscard) 2. Including External Asset Managers Switzerland & International 3. Data based on January, 1st 2011 to October, 7th 2015 4. Previously part of Investment Banking Note: SME refers to Small and Medium Enterprises Source: The Boston Consulting Group, Thomson Securities, SDC Platinum, Dealogic, IFR, Morningstar Credit Suisse market share Leading #2 #2 #1 #2 #2 #1 #1 Position Credit Suisse market share Position Private clients Corporate & Institutional clients October 21, 2015

PTI (CHF bn), 2014 Credit Suisse Core Results(from continuing operations) 5.2 100% 76% 6.8 24% OtherCredit Suisse businesses1 1.6 Swiss Universal Bank2 0.6 0.2 1.0 23% 20% PTI (CHF bn) Post-tax returnon regulatory capital5 CHF -0.1 bn in PTI not allocated (previously reported in Corporate Center incl. Swisscard and project-related expenses). Wealth Management Clients Switzerland3 Corporate & Institutional Clients Switzerland4 Sales & Trading Services & Investment Banking Switzerland PTI, Swiss Universal Bank, 2014 The Swiss Universal Bank is the backbone for Credit Suisse building on a diversified portfolio Generated 24% of Group PTI Diversified portfolio of businesses Average = 13% 11% 1. Main components: Investment Banking outside Switzerland, Asset Management, Private Banking Americas, Private Banking Europe, Middle East & Africa, Private Banking Asia Pacific 2. Sum of components shown on the right 3. Includes Private & Wealth Management Clients Switzerland (includes Retail segment), Private Clients Switzerland & External Asset Managers Switzerland, Neue Aargauer Bank, Swisscard and Bank-now; excluding Sales and Trading Services Switzerland 4. Includes Small and Medium Enterprises (SME), Large Corporates, Institutional Clients & Asset Servicing, Financial Institutions, Commodity Trade Finance and Export Finance; excludes Aviation & Ship Finance (part of International Wealth Management) 5. Post-tax return on regulatory capital calculated using income after tax in CHF, assuming tax rate of 30%, and capital allocated on the highest of 10% of end 2014 Basel 3 risk-weighted assets and 3.5% of end 2014 leverage exposure Note: Numbers may not add up due to rounding October 21, 2015

Agenda The Swiss Universal Bank Winning at home: Four strategic priorities 1 2 Our financial ambition and conclusion 3 October 21, 2015

Four strategic priorities defined to win in our home market Invest in brand Further strengthening of brand and reputation in Switzerland Empower to grow Optimize portfolio towards segments with attractive return on capital and high franchise value Empower organization to focus on HNWI and capture synergies with mid/large SMEs by becoming the 'Bank for Entrepreneurs'; exploit growth opportunities in UHNWI Drive efficiency agenda End-to-end accountability and responsibility over Swiss costs and investments Increased cost efficiency through optimized footprint, automation and operational leverage Focus to simplify Build on existing strong market positions and ensure seamless transition of client coverage Significantly simplify set-up to focus on Swiss client needs October 21, 2015

Swiss Universal Bank plans to focus on Swiss-domiciled clients Swiss domiciled clients Swiss Universal Bank Non-Swiss domiciled clients International Wealth Management Asia Pacific Focus to simplify UHNWI; Premium & Entry HNWI UHNWI; Premium HNWI Entrepreneur clients Entrepreneur clients Institutional clients Institutional clients Private clients(Retail incl. Neue Aargauer Bank, Bank-now, Swisscard, Affluent, HNWI & UHNWI) Corporate & Entrepreneur clients Institutional clients Swiss booking platform for Swissand International Business Note: UHNWI = CHF > 50 mn AuM or total wealth; Premium HNWI > CHF 5 mn AuM; Entry HNWI > 1 M AuM October 21, 2015
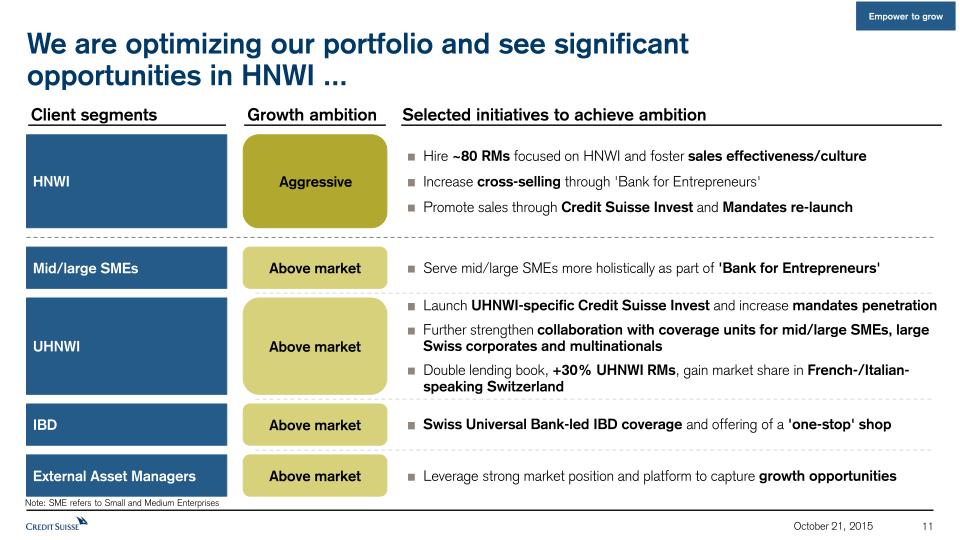
Empower to grow We are optimizing our portfolio and see significant opportunities in HNWI ... HNWI UHNWI External Asset Managers Mid/large SMEs IBD Aggressive Above market Above market Above market Above market Client segments Growth ambition Hire ~80 RMs focused on HNWI and foster sales effectiveness/cultureIncrease cross-selling through 'Bank for Entrepreneurs'Promote sales through Credit Suisse Invest and Mandates re-launch Launch UHNWI-specific Credit Suisse Invest and increase mandates penetrationFurther strengthen collaboration with coverage units for mid/large SMEs, large Swiss corporates and multinationalsDouble lending book, +30% UHNWI RMs, gain market share in French-/Italian-speaking Switzerland Leverage strong market position and platform to capture growth opportunities Serve mid/large SMEs more holistically as part of 'Bank for Entrepreneurs' Swiss Universal Bank-led IBD coverage and offering of a 'one-stop' shop Selected initiatives to achieve ambition Note: SME refers to Small and Medium Enterprises October 21, 2015

Empower to grow ... as well as improvement potential in Real Estate and Commodity Trade Finance Commodity Trade Finance Income-ProducingReal Estate Explore leverage ratio exposure reduction measuresFocus new business to franchise clients with significant cross-selling potential Affluent Retail Strengthen digital capabilities to enhance client self-service and free up RM capacityOptimize footprint by converting ~45 branches into advisory branches without tellerStreamline offering to low advice segments and provide bundled services Large Swiss Corporates Focus on increasing share of wallet (e.g. Corporate Finance) Institutionals(e.g. Pension Funds) Continue to comprehensively serve Institutionals building on 'One Bank' approach Optimize At market At market At market Client segments Growth ambition Selected initiatives to achieve ambition October 21, 2015

Background: Swiss Corporate partially owned by family members; run by a long-term CEO with close links to family Time How to capture cross-selling potential – Client example Focus on becoming the 'Bank for Entrepreneurs' Not captured Private Bankingrelationship to founder Lending, leasing and cash management for corporate & holding Private Banking service Corporate Banking/IBD service Asset Management service Cross-sellingpotential Fully captured Empower to grow Note: SME refers to Small and Medium Enterprises Liquidity event with founder Institutional Asset Management mandate for pension fund Secure corporate relationship & win new PB relationship with successor and other family members Significant number of corporate and SME relationships without link to private wealth:especially in mid/large SME and HNWIalso in Large Swiss Corporates and UHNWITargeting double penetration of Credit Suisse entrepreneur baseInitiatives to address opportunityCo-coverage of HNWI and SMEValue proposition catered to EntrepreneursSimplified collaboration through co-locationJoint acquisition of clients by cross-teamsCo-branding of client events as 'one' team Help with succession planning(e.g. IPO, MBO, MBI, M&A) October 21, 2015
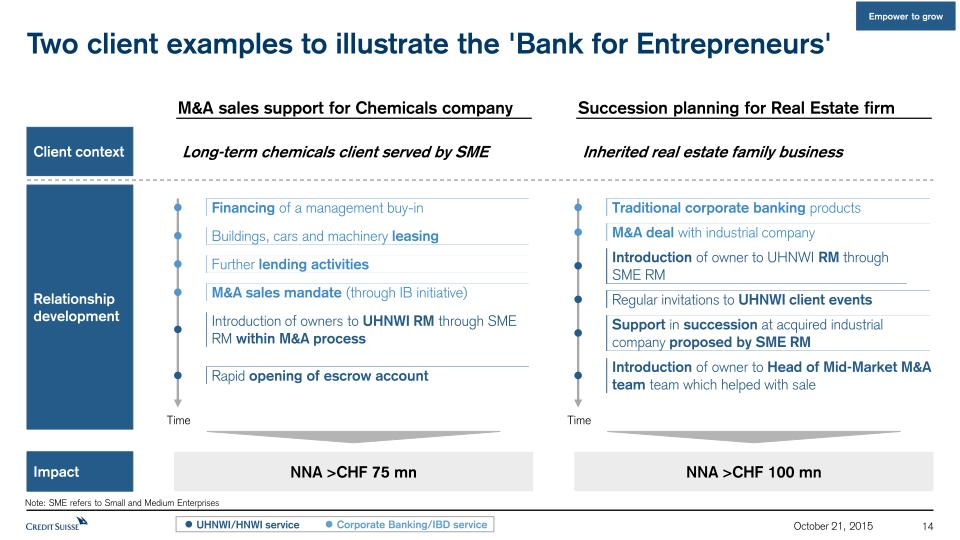
Two client examples to illustrate the 'Bank for Entrepreneurs' M&A sales support for Chemicals company Succession planning for Real Estate firm Long-term chemicals client served by SME NNA >CHF 75 mn Client context NNA >CHF 100 mn Inherited real estate family business Impact Relationship development Time Buildings, cars and machinery leasing Financing of a management buy-in UHNWI/HNWI service Corporate Banking/IBD service M&A sales mandate (through IB initiative) Further lending activities Introduction of owners to UHNWI RM through SME RM within M&A process Rapid opening of escrow account Time M&A deal with industrial company Traditional corporate banking products Introduction of owner to UHNWI RM through SME RM Introduction of owner to Head of Mid-Market M&A team team which helped with sale Regular invitations to UHNWI client events Support in succession at acquired industrial company proposed by SME RM Note: SME refers to Small and Medium Enterprises Empower to grow October 21, 2015

UHNWI: Increasing share of wallet in leading franchise AmbitionIncrease footprint+30% RMsDeeper penetration of Swiss-based Single Family Offices (SFOs)Increase mandate penetrationDouble lending book & deal related revenuesCloser collaboration between RMs and Corporate Banking/IBStrict implementation of target operating model Team approach with clear separation of duties Empower to grow low high Direct investments / brokeragePrivate mandatesCustody servicesStandard Lombard lending Private label fundsDirect trading accessGlobal custodyLending non-standard collateralSpecialty financingCorporate finance advice Hedge fund / private equityMulti-shore bankingPhilanthropy Premium mandatesAdvisory mandatesInvestment consultingEnhanced client reportingCash management degree of sophistication / complexity Traditional wealth management services Sophisticated solutions low Single Family Offices & UHNWI Entrepreneurs & Executives;Global Citizens Wealthy Individuals degree of institutionalization Pure Play Private Banks Regional Private Banks with limited additional capabilities high October 21, 2015

External Asset Managers:Credit Suisse well positioned to exploit consolidation opportunities ... ... Empower to grow Core capital requirementsReporting and administrative efforts (e.g. tax reporting)Large infrastructure / back-office investmentsOrganizational requirementsAbolition of retrocessions An industry-leading Credit Suisse External Asset Manager (EAM) franchiseDistinguishing dual coverage model with focus on investment adviceComplete EAM service offering supported by full service global wealth manager & investment bankCutting edge IT platform, acknowledged in the market place Strengthened transparency requirements Increasing number of regulations Continuing pressure on gross margins Increasingly sophisticated clients RevenuesCosts ✓ ✓ ✓ ✓ Market opportunity: Small banks under pressure – Increasingly becoming EAMs Credit Suisse well positioned to capture opportunity Merge Close Sell Become EAMs Partner/Outsource Possible reactions by banks: October 21, 2015

... by addressing the needs of small private banks in Switzerland ~90 private banks with ~CHF 230 bn AuM Significant opportunityThere are ~90 small private banks with less than CHF 15 bn of AuMThe ~90 small private banks have a cumulative ~CHF 230 bn of AuMSignificant opportunity for Credit Suisse:Provide external asset manager-related servicesActively participate in consolidation ~230 ~15 < 5 bn <15 bn ~90 <1 bn Note: Based on publicly available data Source: The Boston Consulting Group AuM (CHF) CumulativeAuM (CHF bn) Empower to grow Small private banks Small private banks (part of international group) ~40 Cumulative number of private banks ~70 ~90 October 21, 2015

End-to-end accountability for Swiss costs and investments … Drive efficiency agenda Today, significant costs are allocated from Shared ServicesGoing forward, end-to-end accountability and responsibility over costs incurred and investments made in Switzerland:Move Swiss-specific (or Swiss platform-related) Shared Services functions to Swiss Universal BankOwn budget, demand and prioritization for allocated Shared ServicesAllows faster decision making and priority setting Illustrative: Total costs Switzerland, 2014 Shared Services Cost Total Swiss costs 100% Direct cost Moving towards more direct cost accountability ~60% ~80% ~40% ~20% October 21, 2015
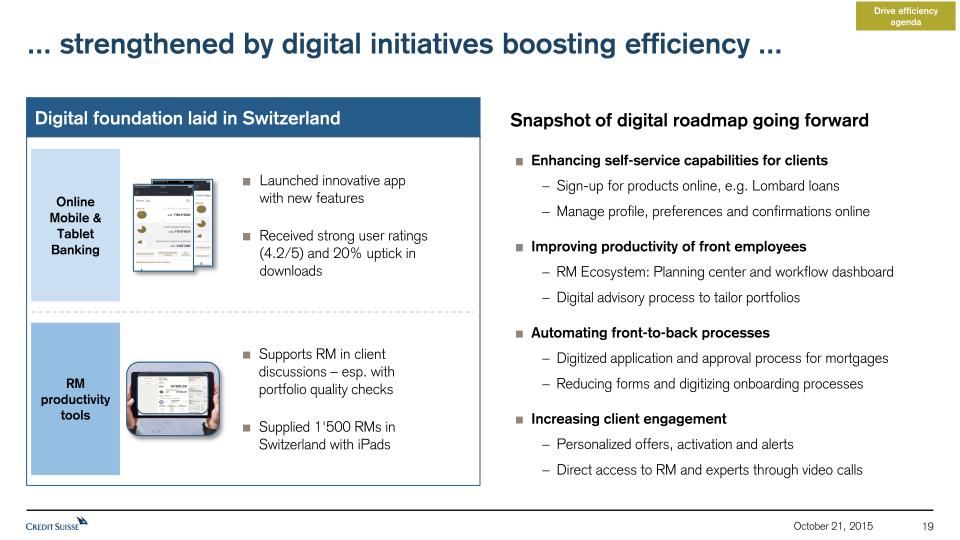
... strengthened by digital initiatives boosting efficiency ... Digital foundation laid in Switzerland Drive efficiency agenda Enhancing self-service capabilities for clientsSign-up for products online, e.g. Lombard loansManage profile, preferences and confirmations onlineImproving productivity of front employeesRM Ecosystem: Planning center and workflow dashboardDigital advisory process to tailor portfoliosAutomating front-to-back processesDigitized application and approval process for mortgagesReducing forms and digitizing onboarding processesIncreasing client engagementPersonalized offers, activation and alertsDirect access to RM and experts through video calls Snapshot of digital roadmap going forward Online Mobile & Tablet Banking Launched innovative app with new featuresReceived strong user ratings (4.2/5) and 20% uptick in downloads RMproductivitytools Supports RM in client discussions – esp. with portfolio quality checksSupplied 1'500 RMs in Switzerland with iPads October 21, 2015
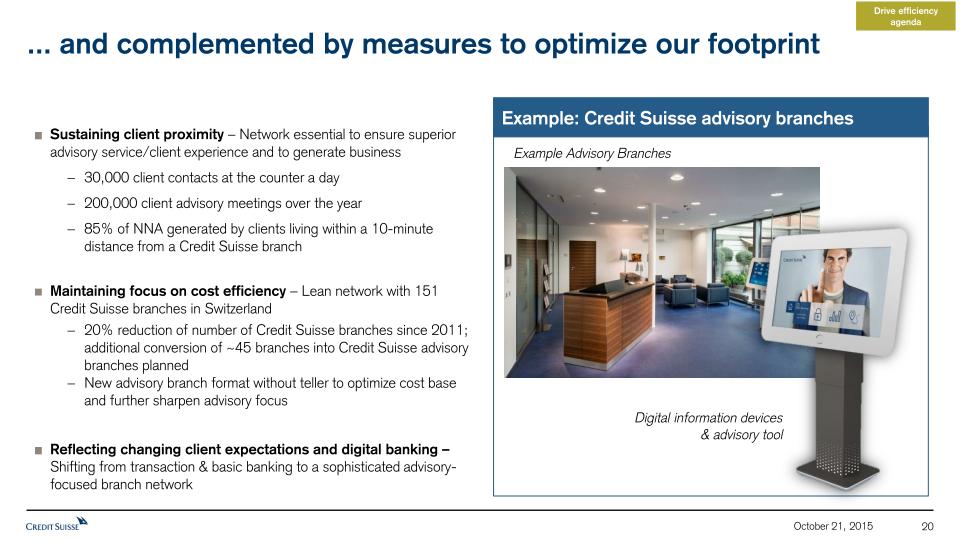
... and complemented by measures to optimize our footprint Drive efficiency agenda Sustaining client proximity – Network essential to ensure superior advisory service/client experience and to generate business30,000 client contacts at the counter a day 200,000 client advisory meetings over the year 85% of NNA generated by clients living within a 10-minute distance from a Credit Suisse branchMaintaining focus on cost efficiency – Lean network with 151 Credit Suisse branches in Switzerland20% reduction of number of Credit Suisse branches since 2011; additional conversion of ~45 branches into Credit Suisse advisory branches plannedNew advisory branch format without teller to optimize cost base and further sharpen advisory focusReflecting changing client expectations and digital banking –Shifting from transaction & basic banking to a sophisticated advisory-focused branch network Example: Credit Suisse advisory branches Example Advisory Branches Digital information devices& advisory tool October 21, 2015

Agenda The Swiss Universal Bank Winning at home: Four strategic priorities 1 2 Our financial ambition and conclusion 3 October 21, 2015
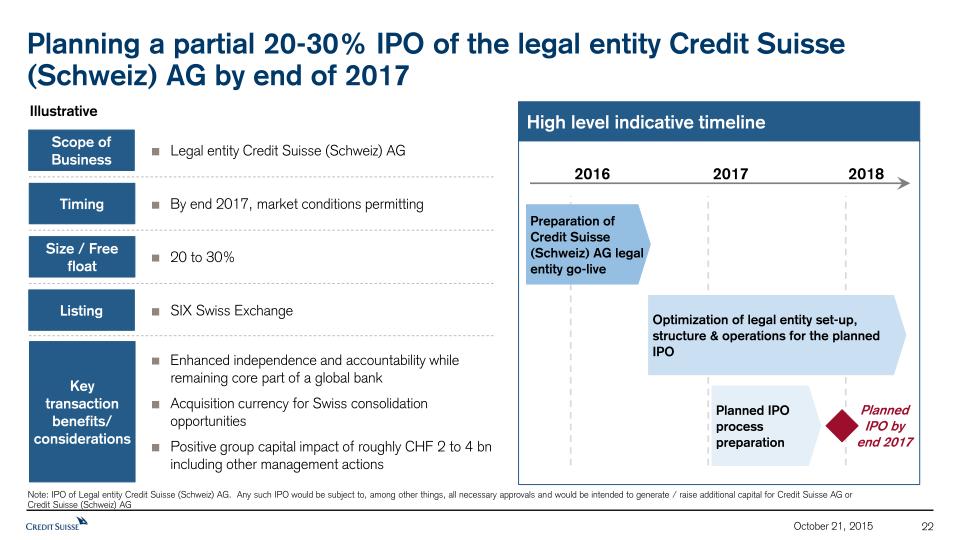
High level indicative timeline 2016 2017 2018 Note: IPO of Legal entity Credit Suisse (Schweiz) AG. Any such IPO would be subject to, among other things, all necessary approvals and would be intended to generate / raise additional capital for Credit Suisse AG or Credit Suisse (Schweiz) AG Optimization of legal entity set-up, structure & operations for the planned IPO Planned IPO process preparation Preparation of Credit Suisse (Schweiz) AG legal entity go-live PlannedIPO byend 2017 Planning a partial 20-30% IPO of the legal entity Credit Suisse (Schweiz) AG by end of 2017 Key transaction benefits/ considerations Enhanced independence and accountability while remaining core part of a global bankAcquisition currency for Swiss consolidation opportunitiesPositive group capital impact of roughly CHF 2 to 4 bn including other management actions Legal entity Credit Suisse (Schweiz) AG Scope of Business By end 2017, market conditions permitting Timing 20 to 30% Size / Free float SIX Swiss Exchange Listing Illustrative October 21, 2015

The Swiss Universal Bank is an operational leverage play ... 56% -12 pp Ambition 2018 2014 68% Expected 12pp decrease in C/I ratio... ... driven by operational leverage Expected increase in Revenues Expected decrease in Operating Expenseof which running costsof which non-recurring costs Expected increase in PTI Cost/Income-Ratio, in % + CHF 0.4 bn (+2% p.a.) + CHF 0.7 bn (+10% p.a.) – CHF 0.4 bn (–3% p.a.)– CHF 0.2 bn– CHF 0.2 bn 2014 – Ambition 2018 Note: Increase in PTI considers credit provisions (CHF 0.1 B) Illustrative October 21, 2015

... expected to deliver 10% annual PTI growth until 2018 10% CAGR in PTIto ~CHF 2.3 bnCost/Income ratio improvement from ~68% to ~56%From 13% to 17%post-taxreturn on regulatory capital1 Ambition 2018 Empower to grow Drive efficiency agenda Focus to simplify Invest in brand Note: CAGRs referring to 2014-2018 period1. Post-tax return on regulatory capital calculated using income after tax in CHF, assuming tax rate of 30%, and capital allocated on the highest of 10% of end 2014 Basel 3 risk-weighted assets and 3.5% of end 2014 leverage exposure October 21, 2015


October 21, 2015 Credit Suisse StrategyAsia PacificHelman Sitohang

Disclaimer (1/3) October 21, 2015 1 The 3Q15 financial information is subject to further review We have not finalized our 3Q15 Financial Report and our independent registered public accounting firm has not completed its review of the condensed consolidated financial statements (unaudited) for the period. Accordingly, the 3Q15 financial information contained in this presentation is subject to completion of quarter-end procedures, which may result in changes to that information. Certain reclassifications have been made to prior periods to conform to the current presentation.The re-segmented financial information is preliminary and subject to further review Unless otherwise noted, this presentation contains certain historical financial information that has been re-segmented to approximate what our results under our new structure would have been, had it been in place from January 1, 2014. Such information is preliminary in nature and subject to review, evaluation and refinement, has not been audited or reviewed by our independent public accountants and can be expected to change in certain respects before any final re-segmentation is published. In addition, “Illustrative”, “Ambition” and “Goal” presentations are not intended to be viewed as targets or projections, nor are they considered to be Key Performance Indicators. All such presentations are subject to a large number of inherent risks, assumptions and uncertainties, many of which are completely outside of our control. Accordingly, this information should not be relied on for any purpose.We may not achieve the benefits of our strategic initiatives We may not achieve all of the expected benefits of our strategic initiatives. Factors beyond our control, including but not limited to the market and economic conditions, changes in laws, rules or regulations and other challenges discussed in our public filings, could limit our ability to achieve some or all of the expected benefits of these initiatives. Cautionary statement regarding forward -looking statements This presentation contains forward-looking statements that involve inherent risks and uncertainties, and we might not be able to achieve the predictions, forecasts, projections and other outcomes we describe or imply in forward-looking statements. A number of important factors could cause results to differ materially from the plans, objectives, expectations, estimates and intentions we express in these forward-looking statements, including those we identify in "Risk Factors” in our Annual Report on Form 20-F for the fiscal year ended December 31, 2014 and in “Cautionary statement regarding forward-looking information" in our second quarter 2015 Financial Report filed with the US Securities and Exchange Commission, and in other public filings and press releases. We do not intend to update these forward-looking statements except as may be required by applicable law.

Disclaimer (2/3) October 21, 2015 2 Statement regarding capital, liquidity and leverage As of January 1, 2013, Basel 3 was implemented in Switzerland along with the Swiss “Too Big to Fail” legislation and regulations thereunder (in each case, subject to certain phase-in periods). As of January 1, 2015, the Bank for International Settlements (BIS) leverage ratio framework, as issued by the Basel Committee on Banking Supervision (BCBS), was implemented in Switzerland by FINMA. Our related disclosures are in accordance with our interpretation of such requirements, including relevant assumptions. Changes in the interpretation of these requirements in Switzerland or in any of our assumptions or estimates could result in different numbers from those shown in this presentation. Capital and ratio numbers for periods prior to 2013 are based on estimates, which are calculated as if the Basel 3 framework had been in place in Switzerland during such periods. Unless otherwise noted, leverage exposure is based on the BIS leverage ratio framework and consists of period-end balance sheet assets and prescribed regulatory adjustments. Leverage amounts for 4Q14, which are presented in order to show meaningful comparative information, are based on estimates which are calculated as if the BIS leverage ratio framework had been implemented in Switzerland at such time. Beginning in 2015, the Swiss leverage ratio is calculated as Swiss total capital, divided by period-end leverage exposure. The look-through BIS tier 1 leverage ratio and CET1 leverage ratio are calculated as look-through BIS tier 1 capital and CET1 capital, respectively, divided by end-period leverage exposure.

Disclaimer (3/3) October 21, 2015 3 Selling restrictions This document is not an offer to sell or a solicitation of offers to purchase or subscribe for securities of Credit Suisse Group AG. This document is not a prospectus within the meaning of article 652a of the Swiss Code of Obligations, nor is it a listing prospectus as defined in the listing rules of the SIX Swiss Exchange AG or any other exchange or regulated trading facility in Switzerland or a prospectus under any other applicable laws. Copies of this document may not be sent to jurisdictions, or distributed in or sent from jurisdictions, in which this is barred or prohibited by law. The information contained herein shall not constitute an offer to sell or the solicitation of an offer to buy, in any jurisdiction in which such offer or solicitation would be unlawful prior to registration, exemption from registration or qualification under the securities laws of any jurisdiction. A decision to invest in securities of Credit Suisse Group AG should be based exclusively on a written agreement with Credit Suisse Group AG or an offering and listing prospectus to be published by Credit Suisse Group AG for such purpose. This document and the information contained herein is not for publication or distribution into the United States of America and should not be distributed or otherwise transmitted into the United States or to U.S. persons (as defined in the U.S. Securities Act of 1933, as amended (the “Securities Act”)) or publications with a general circulation in the United States. This document does not constitute an offer or invitation to subscribe for or to purchase any securities in the United States of America. The securities referred to herein have not been and will not be registered under the Securities Act or the laws of any state and may not be offered or sold in the United States of America absent registration or an exemption from registration under Securities Act. There will be no public offering of the securities in the United States of America. The information contained herein does not constitute an offer of securities to the public in the United Kingdom. No prospectus offering securities to the public will be published in the United Kingdom. This document is only being distributed to and is only directed at (i) persons who are outside the United Kingdom or (ii) to investment professionals falling within article 19(5) of the Financial Services and Markets Act 2000 (Financial Promotion) Order 2005 (as amended, the “Order”) or (iii) high net worth entities, and other persons to whom it may lawfully be communicated, falling within article 49(2)(a) to (d) of the Order (all such persons together being referred to as “relevant persons”). The securities are only available to, and any invitation, offer or agreement to subscribe, purchase or otherwise acquire such securities will be engaged in only with, relevant persons. Any person who is not a relevant person should not act or rely on this document or any of its contents.
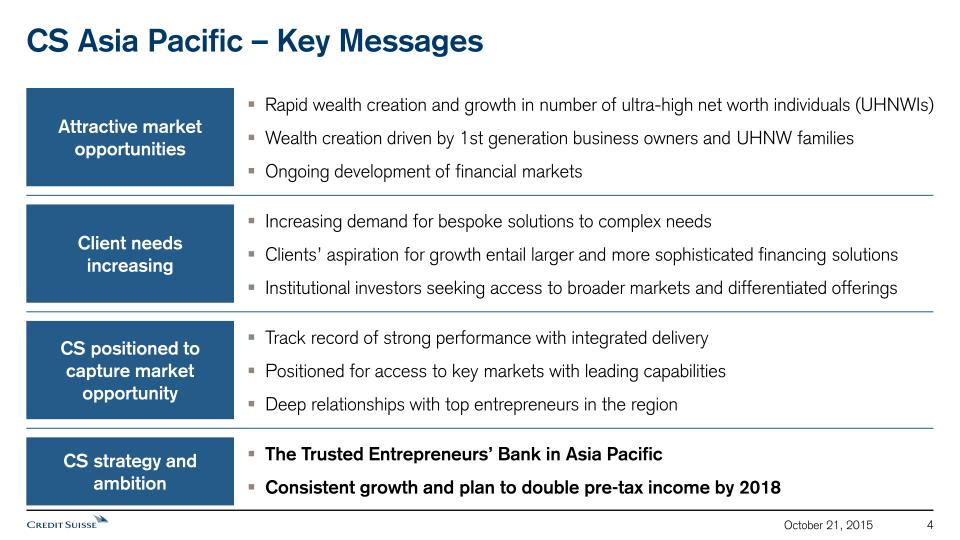
CS Asia Pacific – Key Messages Attractive market opportunities Rapid wealth creation and growth in number of ultra-high net worth individuals (UHNWIs)Wealth creation driven by 1st generation business owners and UHNW familiesOngoing development of financial markets Client needs increasing Increasing demand for bespoke solutions to complex needsClients’ aspiration for growth entail larger and more sophisticated financing solutionsInstitutional investors seeking access to broader markets and differentiated offerings CS positioned to capture market opportunity Track record of strong performance with integrated deliveryPositioned for access to key markets with leading capabilitiesDeep relationships with top entrepreneurs in the region CS strategy and ambition The Trusted Entrepreneurs’ Bank in Asia PacificConsistent growth and plan to double pre-tax income by 2018 October 21, 2015 4

Agenda APAC Market Opportunity 1 Growing the Trusted Entrepreneurs’ Bank 2 Ambition and Initiatives 3 October 21, 2015 5

Growth in APAC wealth market plays to our strengths Over USD 50m AuM for UHNWI business; includes both onshore and offshore; excludes life and pensionBased on CS internal data and peer annual reports 2014Source: BCG Wealth Pools 2015 October 21, 2015 6 APAC UHNWI AuM1) (USDtrn) Top 3 player2) in U/HNWI business with track record of profitable growth and attracting key talent CS 2018 Forecast 2014 3.1 5.8 CAGR +17% Opportunity Clients Strategy

Entrepreneurs driving APAC growth APAC corporates with >USD 50m market cap and at least 20% ownershipSource: CS Research Institute: The Family Business Model Report 2015 (left-hand side) and CS proprietary study (right-hand side) October 21, 2015 7 5th+ 2% 1st 3rd 4th 3% 11% 2nd 27% 57% New wealth driven by 1st generation entrepreneurs Listed market cap with family-related ownership1) Hong Kong 39% China 11% Singapore 47% Malaysia 48% 49% 49% 52% 54% 83% South Korea Thailand Philippines Taiwan India Indonesia 26% % of total market cap Historical trust and deep relationships with top entrepreneurs CS Generation Opportunity Clients Strategy

Financial markets’ deepening expected to underpin business growth and investor flows U.S., Canada, UK, Germany, and SwitzerlandSource: CS Research: Market Cap as of August 2015 to nominal GDP as of December 2014 October 21, 2015 8 Market Cap Free Float to GDP (%) Philippines Indonesia Thailand India HK + China Malaysia Korea Japan Australia Singapore Leading Equities and Structured Financing capabilities CS Average Select Mature Markets1) Opportunity Clients Strategy

Agenda APAC Market Opportunity 1 Growing the Trusted Entrepreneurs’ Bank 2 Ambition and Initiatives 3 October 21, 2015 9

Key client focus and CS delivery 10 Strong PB franchiseCS longevity, brand, trust, and full product suite in APAC (including Digital Private Banking access) Trusted PB & IBD advisory franchises with integrated delivery and multi-product solutionsThe Trusted Entrepreneurs’ Bank Leading Equities & Structured Financing capabilities with disciplined risk takingDifferentiated structuring expertise, track-record of product innovation and disciplined risk taking Opportunity Clients Strategy Target broad wallet opportunity resulting from connectivity across our businesses CS October 21, 2015 Entrepreneurs (UHNWIs /Corporates) Institutional Investors & Banks High Net Worth Individuals
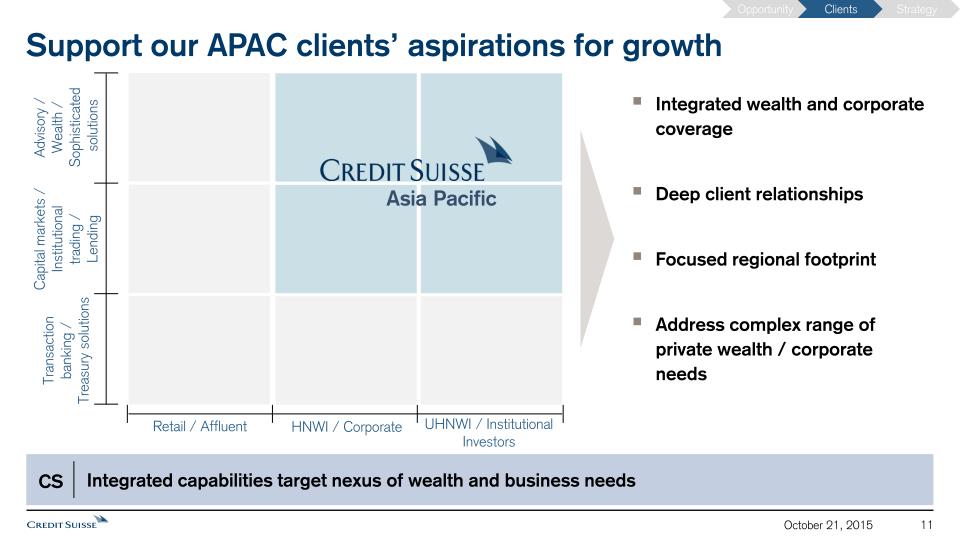
Support our APAC clients’ aspirations for growth 11 Retail / Affluent HNWI / Corporate UHNWI / Institutional Investors Advisory / Wealth / Sophisticated solutions Transaction banking / Treasury solutions Capital markets / Institutional trading / Lending Integrated wealth and corporate coverageDeep client relationshipsFocused regional footprintAddress complex range of private wealth / corporate needs Opportunity Clients Strategy Integrated capabilities target nexus of wealth and business needs Asia Pacific CS October 21, 2015

Sample UHNWIs Client Group Client Example: CS business built on extension of deep relationships via integrated delivery 12 Opportunity Clients Strategy Relationship through multiple generations has supported wealth growth and stabilityAdvisory and solutions have enabled growth in multiple business interests UHNWI Family Wealth Advisory Corporate Advisory Private Banking Services Capital Markets Solutions Bespoke Financing Investor Access CS 2012 2013 2014 85 95 110 Client Revenue (USD mn) CAGR+14% Global Connectivity Investment Ideas 84 93 110 2012 2013 2014 October 21, 2015

WHAT DIFFERENTIATES CREDIT SUISSE? 13 “Swiss-ness stands for high standards, precision and discretion” – Japan “One Bank platform differentiates CS from other banks” – China, India “Private Bank lending and distribution helps Investment Banking deals” – Hong Kong Our clients value CS’ platform, solutions and longevity Opportunity Clients Strategy “CS have shown that by understanding my personal needs and my business needs, they can develop solutions aligned with my long term goals ” – Singapore “CS is my partner, as my business and wealth have grown, so they have grown with me ” – South East Asia October 21, 2015
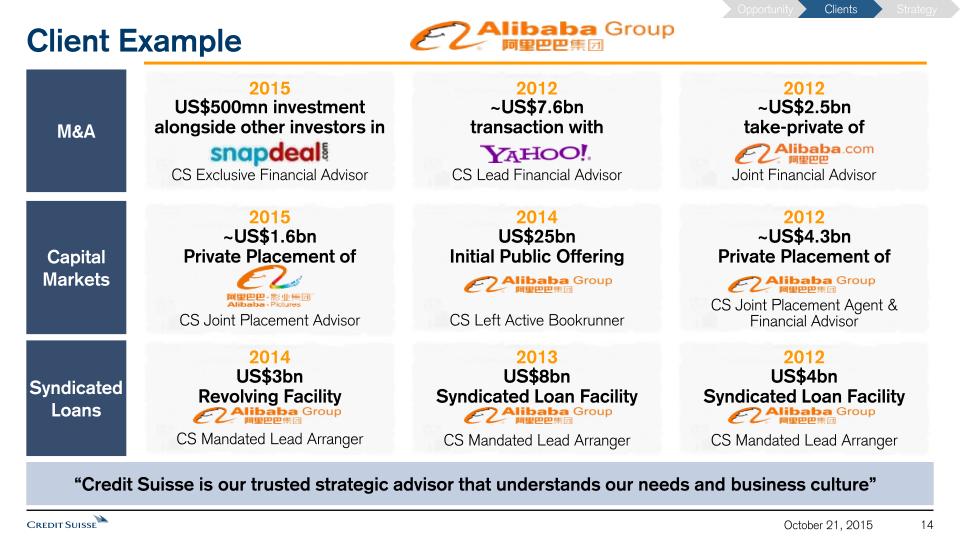
Client Example 14 Capital Markets Syndicated Loans M&A Opportunity Clients Strategy “Credit Suisse is our trusted strategic advisor that understands our needs and business culture” 2015 2012 2012 US$500mn investment alongside other investors in CS Exclusive Financial Advisor ~US$7.6bn transaction with CS Lead Financial Advisor ~US$2.5bn take-private of Joint Financial Advisor 2015 2012 2014 ~US$1.6bnPrivate Placement of CS Joint Placement Advisor US$25bn Initial Public Offering CS Left Active Bookrunner ~US$4.3bn Private Placement of CS Joint Placement Agent & Financial Advisor 2014 2012 2013 US$3bnRevolving Facility CS Mandated Lead Arranger US$8bnSyndicated Loan Facility CS Mandated Lead Arranger US$4bnSyndicated Loan Facility CS Mandated Lead Arranger October 21, 2015

Agenda APAC Market Opportunity 1 Growing the Trusted Entrepreneurs’ Bank 2 Ambition and Initiatives 3 15 October 21, 2015

Our Strategy accelerates growth in Asia Pacific region 1) RoC calculated using income after tax, assuming tax rate of 30% and capital allocated on the higher of 10% Basel III yearly average risk-weighted assets or 3.5% yearly average leverage exposure; 2) PB only, AM excluded 16 Track-record of Profitability (Pre-Tax Income) Continued Growth in U/HNWI NNA2) Focused strategy and increased investment targeted at key Entrepreneur & Investor clientsDifferentiated delivery with integrated coverage, solutions and financingConsistent culture of compliance and controls 1 3 2 >2x Opportunity Clients Strategy 2.1 1.2 0.9 0.8 ~25 October 21, 2015 444 492 ~800 524 2013 2014 9M15 Ambition2018 RMs CHFbn CHFbn ~20%+ 30% RoC1) >1.5x 2013 2014 9M15 Ambition2018

Grow stable revenue sources across broad portfolio Opportunity Clients Strategy Revenue Growth 2014 to Ambition 2018 17 Deepen existing client relationshipsExtend CS reach to next tier of wealth and target next generation large cap clientsProvide comprehensive support across clients’ financing needs, e.g. Personal, Business, Family OfficeDrive product innovation, e.g. Digital Private Bank, Real Estate Finance, Portfolio solutions, EQ structured funds InstitutionalInvestors Ambition2018 Entrepreneursand U/HNWI 2014 October 21, 2015

Grow profitability by extending successful model across APAC(1/3) 18 Deepen existing relationships Higher cross-sellClient Revenue / AuM Improved asset productionTotal AuM / RM Leading UHNWIs Sample All UHNWI clients LeadingSample All PBAPAC October 21, 2015 I Opportunity Clients Strategy
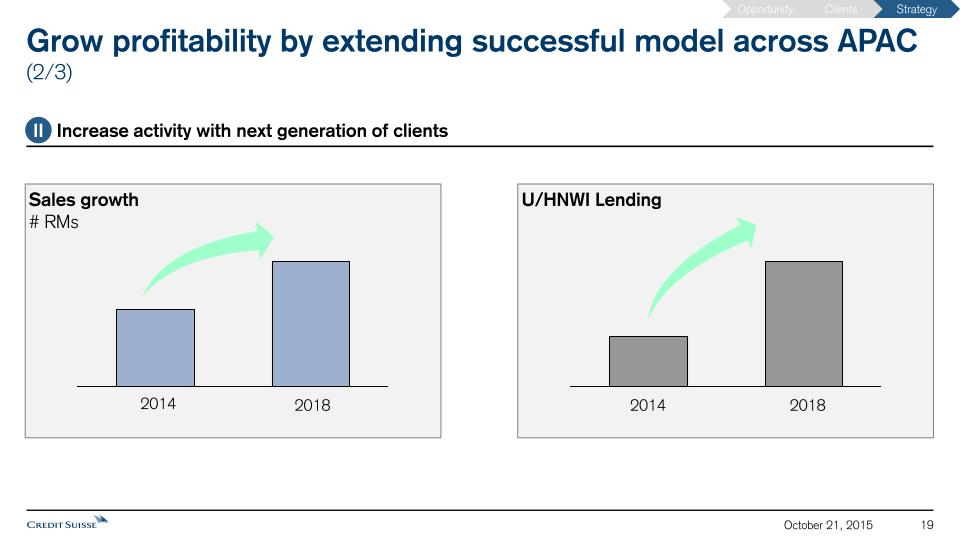
Grow profitability by extending successful model across APAC(2/3) 19 Increase activity with next generation of clients Sales growth# RMs U/HNWI Lending 2018 2014 2018 2014 October 21, 2015 II Opportunity Clients Strategy

Grow profitability by extending successful model across APAC(3/3) 20 October 21, 2015 Driving integrated delivery III Opportunity Clients Strategy Regional empowerment Product investment and bundlingPrioritize capabilitiesReduce duplication Execute closer to clientsImprove speed to marketStrong risk and controls Coverage driven by clientMerge teams for key accountsManage-out non-target clients

Targeted growth strategies across key markets 21 Pre-tax Income Revenues Ambition Current SEA Greater China Japan Korea Australia India Defend and grow leading franchiseDeepen penetration of bespoke solutions with existing entrepreneur clientsExpand to next tier of wealth and build pipeline of next generation mid-to-large cap clientsAccess frontier markets opportunity (VN, TH, MY) SEA Invest across Greater China marketsFocus on significant number of rising Entrepreneurs Build-out China platform and presence onshoreTap global and regional institutional investor flows G. China1) Target market specific strategyAccelerate U/HNWI and Entrepreneurs’ growth with new hires, digital PB, integrated delivery, and financing solutionsAugment flow trading capabilities (AUS, KO, IN)Grow structured solutions and Equities access products (JP, KO, IN) Rest of Asia2) 1) Greater China includes Hong Kong, China, and Taiwan2) Rest of Asia includes Japan, Australia, Korea, India October 21, 2015 Opportunity Clients Strategy

22 Ambition to double pre-tax income by 2018 Opportunity Clients Strategy Strong structural macro trends in APAC support growth and value creation for CS Market Oppor- tunity Client-centric model with proven track record that accelerates growth from a position of strength Strategy Integrated coverage and solutions a differentiator to helping clients achieve their goals Clients October 21, 2015 CS Asia Pacific - The Trusted Entrepreneurs' Bank


October 21, 2015 Credit Suisse Strategy International Wealth ManagementIqbal Khan

Disclaimer October 21, 2015 2 The 3Q15 financial information is subject to further review We have not finalized our 3Q15 Financial Report and our independent registered public accounting firm has not completed its review of the condensed consolidated financial statements (unaudited) for the period. Accordingly, the 3Q15 financial information contained in this presentation is subject to completion of quarter-end procedures, which may result in changes to that information. Certain reclassifications have been made to prior periods to conform to the current presentation.The re-segmented financial information is preliminary and subject to further review Unless otherwise noted, this presentation contains certain historical financial information that has been re-segmented to approximate what our results under our new structure would have been, had it been in place from January 1, 2014. Such information is preliminary in nature and subject to review, evaluation and refinement, has not been audited or reviewed by our independent public accountants and can be expected to change in certain respects before any final re-segmentation is published. In addition, “Illustrative”, “Ambition” and “Goal” presentations are not intended to be viewed as targets or projections, nor are they considered to be Key Performance Indicators. All such presentations are subject to a large number of inherent risks, assumptions and uncertainties, many of which are completely outside of our control. Accordingly, this information should not be relied on for any purpose. We may not achieve the benefits of our strategic initiatives We may not achieve all of the expected benefits of our strategic initiatives. Factors beyond our control, including but not limited to the market and economic conditions, changes in laws, rules or regulations and other challenges discussed in our public filings, could limit our ability to achieve some or all of the expected benefits of these initiatives. Cautionary statement regarding forward -looking statements This presentation contains forward-looking statements that involve inherent risks and uncertainties, and we might not be able to achieve the predictions, forecasts, projections and other outcomes we describe or imply in forward-looking statements. A number of important factors could cause results to differ materially from the plans, objectives, expectations, estimates and intentions we express in these forward-looking statements, including those we identify in "Risk Factors” in our Annual Report on Form 20-F for the fiscal year ended December 31, 2014 and in “Cautionary statement regarding forward-looking information" in our second quarter 2015 Financial Report filed with the US Securities and Exchange Commission, and in other public filings and press releases. We do not intend to update these forward-looking statements except as may be required by applicable law. Statement regarding capital, liquidity and leverage As of January 1, 2013, Basel 3 was implemented in Switzerland along with the Swiss “Too Big to Fail” legislation and regulations thereunder (in each case, subject to certain phase-in periods). As of January 1, 2015, the Bank for International Settlements (BIS) leverage ratio framework, as issued by the Basel Committee on Banking Supervision (BCBS), was implemented in Switzerland by FINMA. Our related disclosures are in accordance with our interpretation of such requirements, including relevant assumptions. Changes in the interpretation of these requirements in Switzerland or in any of our assumptions or estimates could result in different numbers from those shown in this presentation. Capital and ratio numbers for periods prior to 2013 are based on estimates, which are calculated as if the Basel 3 framework had been in place in Switzerland during such periods. Unless otherwise noted, leverage exposure is based on the BIS leverage ratio framework and consists of period-end balance sheet assets and prescribed regulatory adjustments. Leverage amounts for 4Q14, which are presented in order to show meaningful comparative information, are based on estimates which are calculated as if the BIS leverage ratio framework had been implemented in Switzerland at such time. Beginning in 2015, the Swiss leverage ratio is calculated as Swiss total capital, divided by period-end leverage exposure. The look-through BIS tier 1 leverage ratio and CET1 leverage ratio are calculated as look-through BIS tier 1 capital and CET1 capital, respectively, divided by end-period leverage exposure. Selling restrictions This document is not an offer to sell or a solicitation of offers to purchase or subscribe for securities of Credit Suisse Group AG. This document is not a prospectus within the meaning of article 652a of the Swiss Code of Obligations, nor is it a listing prospectus as defined in the listing rules of the SIX Swiss Exchange AG or any other exchange or regulated trading facility in Switzerland or a prospectus under any other applicable laws. Copies of this document may not be sent to jurisdictions, or distributed in or sent from jurisdictions, in which this is barred or prohibited by law. The information contained herein shall not constitute an offer to sell or the solicitation of an offer to buy, in any jurisdiction in which such offer or solicitation would be unlawful prior to registration, exemption from registration or qualification under the securities laws of any jurisdiction. A decision to invest in securities of Credit Suisse Group AG should be based exclusively on a written agreement with Credit Suisse Group AG or an offering and listing prospectus to be published by Credit Suisse Group AG for such purpose. This document and the information contained herein is not for publication or distribution into the United States of America and should not be distributed or otherwise transmitted into the United States or to U.S. persons (as defined in the U.S. Securities Act of 1933, as amended (the “Securities Act”)) or publications with a general circulation in the United States. This document does not constitute an offer or invitation to subscribe for or to purchase any securities in the United States of America. The securities referred to herein have not been and will not be registered under the Securities Act or the laws of any state and may not be offered or sold in the United States of America absent registration or an exemption from registration under Securities Act. There will be no public offering of the securities in the United States of America. The information contained herein does not constitute an offer of securities to the public in the United Kingdom. No prospectus offering securities to the public will be published in the United Kingdom. This document is only being distributed to and is only directed at (i) persons who are outside the United Kingdom or (ii) to investment professionals falling within article 19(5) of the Financial Services and Markets Act 2000 (Financial Promotion) Order 2005 (as amended, the “Order”) or (iii) high net worth entities, and other persons to whom it may lawfully be communicated, falling within article 49(2)(a) to (d) of the Order (all such persons together being referred to as “relevant persons”). The securities are only available to, and any invitation, offer or agreement to subscribe, purchase or otherwise acquire such securities will be engaged in only with, relevant persons. Any person who is not a relevant person should not act or rely on this document or any of its contents.

Agenda October 21, 2015 3 International Wealth Management Shifting gears: Strategic priorities for superior growth 1 2 Conclusion 3

International Wealth Management Division 1 All metrics on the slide based on new organizational structure 2 AuM data rounded to nearest 10bn and including double-count for assets managed across businesses, predominantly global Wealth Management clients (IWM, Swiss UB and Asia Pacific) 3 Economist Intelligence Unit 4 McKinsey Wealth Pools; Note: AuM = Assets under Management; RoRC = Return on Regulatory Capital, calculated as worst of return on 10% of RWA and return on 3.5% of spot Swiss leverage exposure, assuming tax rate of 30% for all periods; 'UHNWI' = CHF >50mn AuM or total wealth >250mn; Premium HNWI = CHF >5mn AuM; Entry HNWI = CHF >1m AuM October 21, 2015 4 UHNWI AuM share in Private Banking Net revenues Financials1 2014, CHF Private Banking320bn Assetmanagement 390bn2 Global relevance Global share of …… Population3 41%… Wealth4 42%… GDP3 42% Pre-tax income AuM 4.8 bn 57% Private Banking Asset Management 1.3 bn 38% 62% 63% 37% Clients Family officesExternal Asset ManagersInstitutional clients UHNWI and premium HNWI clientsEntrepreneursEntry level HNWI clients RoRC 27% 2014, CHF APAC 28trn North America CH 3% 42% 21% 34% International12trn
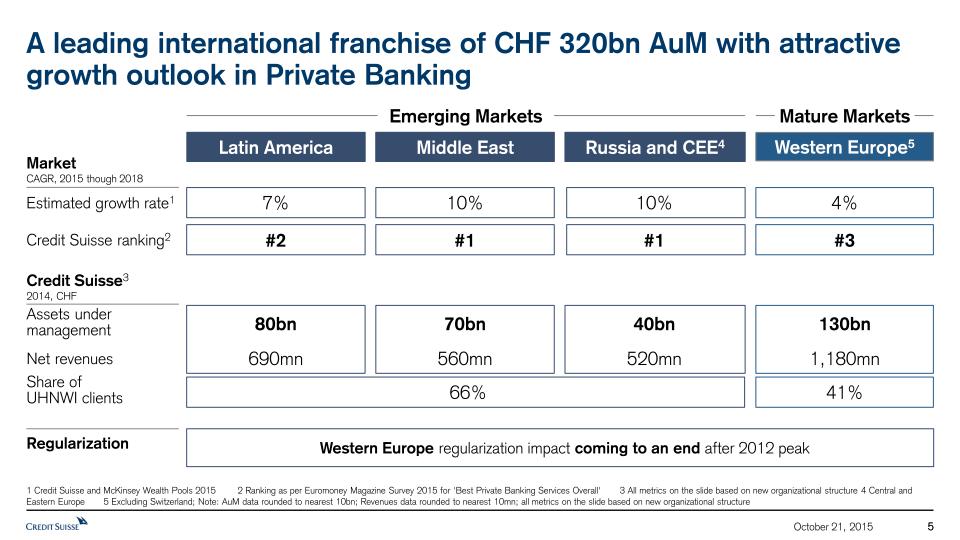
A leading international franchise of CHF 320bn AuM with attractive growth outlook in Private Banking 1 Credit Suisse and McKinsey Wealth Pools 2015 2 Ranking as per Euromoney Magazine Survey 2015 for 'Best Private Banking Services Overall' 3 All metrics on the slide based on new organizational structure 4 Central and Eastern Europe 5 Excluding Switzerland; Note: AuM data rounded to nearest 10bn; Revenues data rounded to nearest 10mn; all metrics on the slide based on new organizational structure 5 Latin America Middle East Russia and CEE4 Western Europe5 Emerging Markets Mature Markets Western Europe regularization impact coming to an end after 2012 peak Regularization Credit Suisse3 2014, CHF Net revenues Assets under management 690mn 560mn 520mn 1,180mn 80bn 70bn 40bn 130bn Share of UHNWI clients 66% 41% MarketCAGR, 2015 though 2018 Estimated growth rate1 7% 10% 10% 4% Credit Suisse ranking2 #2 #1 #1 #3 5 October 21, 2015

Western European regularization impact peaked in 2012Residual Western Europe cross-border outflows primarily relate to tax program in progress in ItalyAsset regularization and client mix shift adversely impacted recurring margin Outflows due to regularization in Western Europe close to finalization Regularization outflows in IWM1, CHF bn 9M15 2014 2013 2012 2011 1 Includes Non-Strategic unit. Outflows in 2011, 2012 and 2013 represent Western European cross-border outflows and outflows in 2014 and 9M15 represent outflows related to regularization across all regions; Note: IWM = International Wealth Management October 21, 2015 6

A leading Swiss and alternative franchises in Asset Management October 21, 2015 7 1 Distribution view 2 Wealth Management Clients 3 Towers Watson Survey 2014 4 Morningstar Swiss Fund Data 2014 5 See next page for references ; Note: AuM data rounded to nearest 10bn and including double-count for assets managed across businesses, predominantly global Wealth Management clients (IWM, Swiss UB and Asia Pacific); Revenues data rounded to nearest 10mn Key MetricsCHF, 2014 Hubs Market position Assets under Management Net Revenues 1,300mn 500mn Credit Suisse’s WMC1,2 Alternative Investments Traditional Investments Zurich, New York and Singapore Top 2 traditional Asset Manager in Switzerland3 Largest Institutional Fund Manger in Switzerland4 Top 5 alternative investments manager globally3Leading positions in some of the largest alternative asset classes5 130bn 260bn 21% 37%

October 21, 2015 8 ProprietaryInsurance Linked Strategies Top 26 Hedge FoFSecuritized Products CreditLeader3 Other Hedge Funds CommoditiesTop 54 130bn Product split, % of 2014 AuM Equities Multi-asset class solutions ICBC Joint Venture Index Solutions Premium mandatesPrivate mandatesInstitutional accessMulti-asset class solution funds 260bn FixedIncome Traditional InvestmentsTailored investment solutions for our clients Alternative InvestmentsCompetitive offerings across liquid and illiquid strategies Real EstateTop 35 3rd PartyYork CapitalVerdeQatar JV Product split, % of 2014 AuM Asset Manager with broad range of capabilities 1 Towers Watson Survey 2014; 2 Morningstar Swiss Fund Data 2014; 3 Leading non-investment grade credit franchise (eVestment data as of 6/30/2015 for CIG - Senior Floating Bank Loans); 4 Top 5 commodities asset manager (Towers Watson Survey 2014); 5 Top 3 European property fund manager (INREV/ANREV Fund Manager Survey 2014); 6 Top 2 insurance-linked asset manager globally (Trading Risk Top ILS Fund Managers 2015); Note: AuM data rounded to nearest 10bn and including double-count for assets managed across businesses, predominantly global Wealth Management clients (IWM, Swiss UB and Asia Pacific) Top 2 traditional Asset Manager in Switzerland1Largest institutional Fund Manager2

Agenda October 21, 2015 9 International Wealth Management Shifting gears: Strategic priorities for superior growth 1 2 Conclusion 3

October 21, 2015 10 Consistently deliver client value Further add value to clients' portfolios Address sophisticated client financing needs Client value Shifting gears: Strategic priorities for superior growth Client proximity Capture market share and wealth creation Enhance proximity Digitize experience for lower wealth band clients Client time Bring decision-making closer to point of adviceIncrease client face time Goals Actions Integrate coverage (PB, IBD and AM)Leverage our investment engine and build out Asset Management capabilitiesExpand multi-collateral lending Grow sales forceExpand ‘Hub and Spokes’ selectivelyIntroduce new service model Simplify and de-layer organizationInvest in technology and automation Note: PB, IBD and AM refer to general banking functions, defined as private banking, investment banking department and asset management
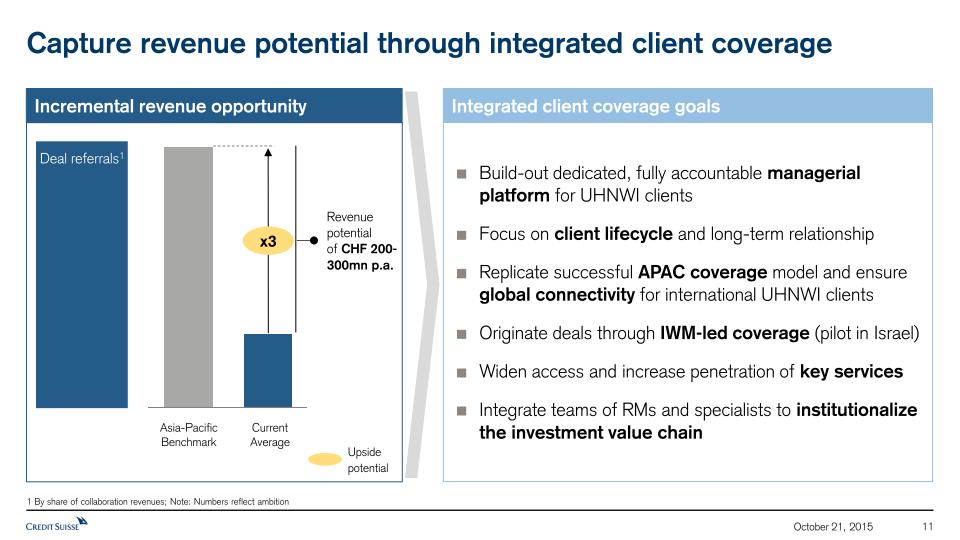
October 21, 2015 11 Capture revenue potential through integrated client coverage 1 By share of collaboration revenues; Note: Numbers reflect ambition Upside potential Incremental revenue opportunity Deal referrals1 Current Average Asia-Pacific Benchmark Revenue potential of CHF 200-300mn p.a. Build-out dedicated, fully accountable managerial platform for UHNWI clientsFocus on client lifecycle and long-term relationshipReplicate successful APAC coverage model and ensure global connectivity for international UHNWI clientsOriginate deals through IWM-led coverage (pilot in Israel)Widen access and increase penetration of key servicesIntegrate teams of RMs and specialists to institutionalize the investment value chain Integrated client coverage goals x3
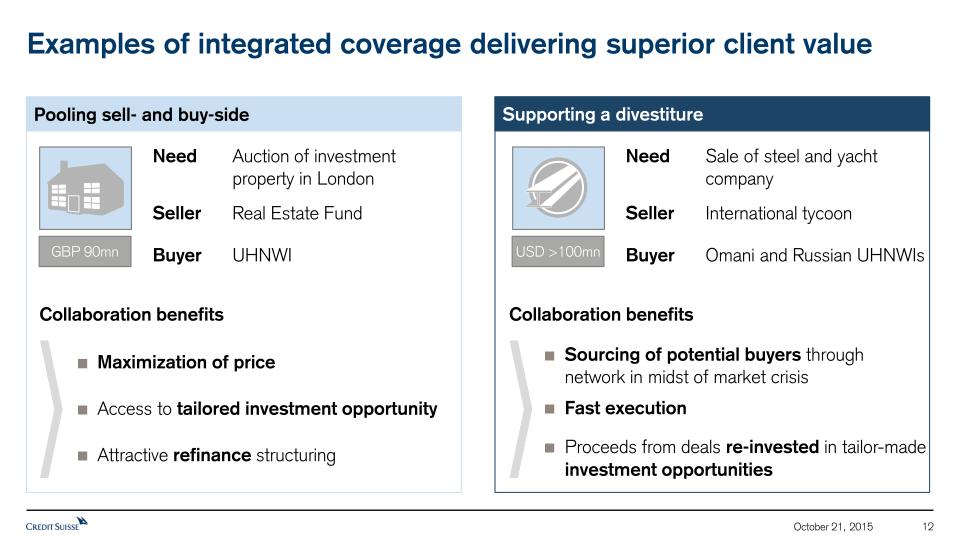
Examples of integrated coverage delivering superior client value October 21, 2015 12 Pooling sell- and buy-side Supporting a divestiture Maximization of priceAccess to tailored investment opportunity Attractive refinance structuring Collaboration benefits Collaboration benefits Seller Real Estate Fund Buyer UHNWI Need Auction of investment property in London GBP 90mn Seller International tycoon Buyer Omani and Russian UHNWIs Need Sale of steel and yacht company USD >100mn Sourcing of potential buyers through network in midst of market crisis Proceeds from deals re-invested in tailor-made investment opportunities Fast execution

October 21, 2015 13 Understand market Understand market Direct Investments Credit Suisse Invest(Advisory mandates) Proprietary Funds Discretionary Mandates(e.g. Institutional Access, Premium Mandates) Investment Advisory Risk profile Investment solutions tailored to client needs in key markets Investment Strategy and Research Investment Products Global macroeconomic viewRegional market expertiseStrategic Asset Allocation Understand client Understand market Deploy solutions Note: simplified view Add value to clients’ portfolios by leveraging our investment engine... Client specific advice Advisory process Wealthplanning

...and further build out Asset Management capabilities October 21, 2015 14 Strategic pillars Products Capture upside in product suite expansionFocus on delivering global institutional-quality solutions with strong investment performance Markets Leverage global reach (directly, through IWM, third-party, Joint Venture)Continue international build-out with focus on emerging markets People Attract top talent as boutique platform Encourage entrepreneurship and internal mobility Clients Serve Credit Suisse's clients as well as third-party distributorsFurther align offering and service to client needs Note: IWM = International Wealth Management

Capture upside by expanding product suite October 21, 2015 15 Note: Mandate penetration = AuM related to mandates / total AuM; numbers reflect ambition Mandate penetration opportunity Product Suite Expansion goals Expand multi-service connectivity platform to 3rd party banks, Family Offices, Private Label Funds and Asset Managers Provide expertise and scale for processing, product solutions, custody services and direct market access (e.g. pre-trade and limit checks) Alternatives Expand hedge funds range (e.g. Systematic Market Making Group)Widen Private Equity offering with funds in Fintech (e.g. NEXT)Offer liquid alternative products and managed futures (e.g. CS Eagle) Mandates Capitalize on Credit Suisse Invest success to launch similar solutions tailored to regionsRollout dedicated advisory offering for UHNWI (e.g. Signature Managed Accounts) Traditional Grow active Equities driven by HOLT, active Fixed Income driven by unconstrained and absolute returnOffer products tailored to individual client needs (e.g. thematic investments, protection features) B2B Upside potential CurrentAverage Penetration Ambition x1.5
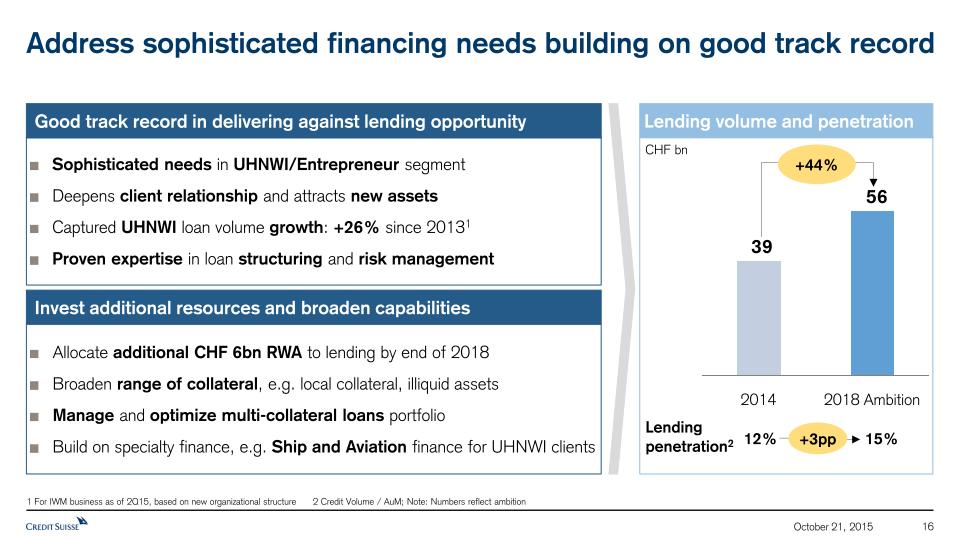
October 21, 2015 16 Address sophisticated financing needs building on good track record 1 For IWM business as of 2Q15, based on new organizational structure 2 Credit Volume / AuM; Note: Numbers reflect ambition Lending volume and penetration 2018 Ambition 2014 CHF bn Lendingpenetration2 12% 15% +44% +3pp Good track record in delivering against lending opportunity Sophisticated needs in UHNWI/Entrepreneur segmentDeepens client relationship and attracts new assetsCaptured UHNWI loan volume growth: +26% since 20131Proven expertise in loan structuring and risk management Invest additional resources and broaden capabilities Allocate additional CHF 6bn RWA to lending by end of 2018Broaden range of collateral, e.g. local collateral, illiquid assetsManage and optimize multi-collateral loans portfolioBuild on specialty finance, e.g. Ship and Aviation finance for UHNWI clients

Sample structured lending and specialty finance transactions October 21, 2015 17 Structured lending Solution to book share-backed loans for client on the local branch platform EUR 300mn 3yr loan facility against local stockBenefit: attracted substantial assets Need Single-stock lending, booked onshore Client High profile European UHNWI family Specialty financing Soft covenant provided (USD 6mn AuM)Deepened relationship: USD 200mn NNA after financing Low AuM and no ship finance relationship beforePost transaction, client brought USD 130mn NNAAdditional USD 90mn ship financing in pipeline Client Need Two private aircrafts financing Emerging market UHNWI family Client Need First private ship financing Emerging market UHNWI client Lending... ...against local collateral USD 30 mn USD 30 mn

Capture market share and wealth creation by growing sales force October 21, 2015 18 1 2011 and 2014 figures pro-forma restated for comparability purpose; headcount reduction between 2011-2014 includes impact of assets regularization and excludes divestitures 2 From targeted hires until 2018, assuming linear RM hiring 3 Total revenues in 2018 of new hires, assuming linear RM hiring and an average gross margin of ~80 bps; Note: RM = Relationship Manager; numbers reflect ambition Increase RM headcount by ~25% 2018 Ambition ~1’400 2014 ~1’1001 2011 1’4001 Relationship Manager (#) +300 RMs ~30bn Cumulative net new assets over 3 years2 ~230mn Revenues in 20183 Illustrative impact of new hires, CHF Mature Markets Emerging Markets Reduction until 2014 due to franchise repositioning (small markets exit, sale of Germany onshore and affluent network in Italy)Going forward, shifted focus on growth and RMs hiring in both UHNWI and Premium HNWI segmentMajority of hires (>200 RMs) planned in Emerging Markets Achieve increase throughBuild-out of existing successful strategic hiring teams Continuation of 'Grow your own' Extension to additional pools, e.g. professional services firmsRetention measure to lower attrition rate

Focus on key markets with strong growth and high ability to win October 21, 2015 19 Key markets 1 McKinsey Wealth Pools (BCG Global Wealth Report for Sub-Saharan Africa), rounded figures 2 Central and Eastern Europe 3 Euromoney Magazine Survey 2015 Wealth Pools1 Size’15 (bn) %UHNWI ‘15 Expected CAGR’15-’18 Market attractiveness and ability to win Russia & CEE2 Latin America Western Europe Sub-Saharan Africa Middle East Saudi ArabiaQatarUAE BrazilMexico Russia GermanyUnited KingdomSpain and Italy South AfricaNigeria 710270300 560510 480 1,1901,2801,200 300 30-35% 25-30% 40-45% 20-35% 40-50% 11%12%8% 6%7% 10% 2%4%2% 14% Leverage number one position in the market3Tap new opportunities, e.g. onshore Saudi Arabia Markets represent 60% of regional wealth pool Solid footprint in UHNWI and Premium HNWI Attractive growth outlook despite economic challengesLeading position in Brazil onshore Leverage number one position in the market3Opportunity to capture potential of wealth globalization S. Africa and Nigeria represent ~75% of regional wealthSignificant potential in core UHNWI segment

October 21, 2015 20 Western Europe Latin America Hubs Spokes Brazil Bahamas Mexico Venezuela Peru Panama Uruguay Chile Colombia CH Bahamas, US and CH as main hubs for Latin America Saudi Arabia Russia Bahrain Dubai Lebanon Turkey Israel Qatar Abu Dhabi Egypt South Africa CH UK UK, CH and SG as main hubs Three hubs Three hubs Set up new advisory offices, e.g.NetherlandsSweden Expand in growth markets, e.g.Brazil, with additional onshore locationsReposition US Latam booking center Expand footprint and explore new areasSaudi Arabia, with onshore expansionSub-Saharan Africa Middle East, Africa, Russia and CEE1 Italy CH Lux. UK Portugal Netherlands France Germany Spain Greece Sweden Three hubs Leverage 'Hub and Spokes' to enhance client proximity Technology investments geared to hubs; unprofitable booking centers to be transitioned Singapore US 1 Central and Eastern Europe

October 21, 2015 21 Digitize service model for lower wealth band clients New offering focused on clients with <5m AuM, providing full transaction and self-service capabilitiesAttractive client proposition, combining highly convenient delivery with distinctive international investment offerMulti-channel service (RM and digital) focusing on investment adviceDigitally enabled RM-client interactions (e.g. video chats) and Swiss-based advisory center to provide specialist adviceEnhanced productivity and efficiency, through combination of client activation and cost savings from automation 2.43 Selected illustrations of digital offering Note: RM = Relationship Manager

October 21, 2015 22 Simplify and de-layer the organization to enable faster decision-making and shorter time to market To Executive Board Clients Executive Board Clients Multi-layer organization with regional duplications Integrate regional and business management structures Distance from the client with multiple approval/review steps in business processes Allow faster decision-making and shorter time-to-market for clients Front-line with limited accountability over indirect cost base Increase front accountability over indirect cost base From Planned CHF ~200mn gross cost savings by end 2018 to contribute to overall growth investments of CHF ~0.6bn Note: Numbers reflect ambition

October 21, 2015 23 Increase client face time by investing in technology and automation Free-up RM time to spend with clients Ambition Average RM time allocation (indicative) Other tasks Client time Digital solutions to enhance RM productivity RM Workplace and Ecosystem Enhanced client book analytics 'Single place' with required tools, e.g. Planning Center, Workflow dashboardReduced administrative burden in day-to-day work and discussions with client Easy-to-use tools to run client book analysis to drive sales excellence Holistic view on overall relationship Note: Numbers reflect ambition; RM = Relationship Manager

Agenda October 21, 2015 24 International Wealth Management Shifting gears: Strategic priorities for superior growth 1 2 Conclusion 3

International Wealth Management – Key messages October 21, 2015 25 Ambition A leading Private Bank with strong growth outlook Attractive Asset Manager with broad product capabilities Three strategic priorities Deliverclient value Enhanceclient proximity Increaseclient time Aim to grow our revenues by 30%, increase PTI by >50% and raise return on regulatory capital from 27% to > 30% by end of 2018 Covers Emerging Markets (Latin America, Middle East, Russia and Central & Eastern Europe) as well as Western Europe1 Balanced portfolio with attractive growth outlook and strong market positions across all regionsIn 2014, managed CHF 320bn AuM, delivering CHF 3.0bn of revenues Top 5 Alternatives manager globally and Top 2 Traditional asset manager in Switzerland2Broad range of product capabilities providing tailored solutions to our own clients and third partiesIn 2014, managed CHF 390bn AuM, delivering CHF 1.8bn of revenues Integrate coverage of private banking, investment banking and asset management to deliver client value Leverage our investment engine to further add value to clients' portfoliosExpand multi-collateral lending to address sophisticated client financing needs Grow sales force to capture market share and wealth creationExpand 'Hub and Spokes model' to enhance footprintIntroduce a new service model to digitize the experience for lower wealth band clients Simplify and de-layer organization to bring decision-making closer to point of adviceInvest in technology and automation to increase client face time 1 Excluding Switzerland 2 Towers Watson Survey 2014; Note: All metrics on the slide based on new organizational structure; return on regulatory capital is calculated as worst of return on 10% of RWA and return on 3.5% of spot Swiss leverage exposure, assuming tax rate of 30% for all periods

International Wealth Management is shifting gears for growth October 21, 2015 26 Ambition by end of 2018 Note: Numbers reflect ambition; indicative growth rates; RoRC = Return on Regulatory Capital, calculated as worst of return on 10% of RWA and return on 3.5% of spot Swiss leverage exposure, assuming tax rate of 30% for all periods; All metrics on the slide based on new organizational structure Deliverclient value Enhance client proximity Increase client time Grow revenues Raise RoRC Increase pre-tax income 2014 2018 Ambition >50% +30% +6 p.p. CHF bn


October 21, 2015 Credit Suisse StrategyGlobal MarketsTim O’Hara

Disclaimer October 21, 2015 2 The 3Q15 financial information is subject to further review We have not finalized our 3Q15 Financial Report and our independent registered public accounting firm has not completed its review of the condensed consolidated financial statements (unaudited) for the period. Accordingly, the 3Q15 financial information contained in this presentation is subject to completion of quarter-end procedures, which may result in changes to that information. Certain reclassifications have been made to prior periods to conform to the current presentation.The re-segmented financial information is preliminary and subject to further review Unless otherwise noted, this presentation contains certain historical financial information that has been re-segmented to approximate what our results under our new structure would have been, had it been in place from January 1, 2014. Such information is preliminary in nature and subject to review, evaluation and refinement, has not been audited or reviewed by our independent public accountants and can be expected to change in certain respects before any final re-segmentation is published. In addition, “Illustrative”, “Ambition” and “Goal” presentations are not intended to be viewed as targets or projections, nor are they considered to be Key Performance Indicators. All such presentations are subject to a large number of inherent risks, assumptions and uncertainties, many of which are completely outside of our control. Accordingly, this information should not be relied on for any purpose. We may not achieve the benefits of our strategic initiatives We may not achieve all of the expected benefits of our strategic initiatives. Factors beyond our control, including but not limited to the market and economic conditions, changes in laws, rules or regulations and other challenges discussed in our public filings, could limit our ability to achieve some or all of the expected benefits of these initiatives. Cautionary statement regarding forward -looking statements This presentation contains forward-looking statements that involve inherent risks and uncertainties, and we might not be able to achieve the predictions, forecasts, projections and other outcomes we describe or imply in forward-looking statements. A number of important factors could cause results to differ materially from the plans, objectives, expectations, estimates and intentions we express in these forward-looking statements, including those we identify in "Risk Factors” in our Annual Report on Form 20-F for the fiscal year ended December 31, 2014 and in “Cautionary statement regarding forward-looking information" in our second quarter 2015 Financial Report filed with the US Securities and Exchange Commission, and in other public filings and press releases. We do not intend to update these forward-looking statements except as may be required by applicable law. Statement regarding capital, liquidity and leverage As of January 1, 2013, Basel 3 was implemented in Switzerland along with the Swiss “Too Big to Fail” legislation and regulations thereunder (in each case, subject to certain phase-in periods). As of January 1, 2015, the Bank for International Settlements (BIS) leverage ratio framework, as issued by the Basel Committee on Banking Supervision (BCBS), was implemented in Switzerland by FINMA. Our related disclosures are in accordance with our interpretation of such requirements, including relevant assumptions. Changes in the interpretation of these requirements in Switzerland or in any of our assumptions or estimates could result in different numbers from those shown in this presentation. Capital and ratio numbers for periods prior to 2013 are based on estimates, which are calculated as if the Basel 3 framework had been in place in Switzerland during such periods. Unless otherwise noted, leverage exposure is based on the BIS leverage ratio framework and consists of period-end balance sheet assets and prescribed regulatory adjustments. Leverage amounts for 4Q14, which are presented in order to show meaningful comparative information, are based on estimates which are calculated as if the BIS leverage ratio framework had been implemented in Switzerland at such time. Beginning in 2015, the Swiss leverage ratio is calculated as Swiss total capital, divided by period-end leverage exposure. The look-through BIS tier 1 leverage ratio and CET1 leverage ratio are calculated as look-through BIS tier 1 capital and CET1 capital, respectively, divided by end-period leverage exposure. Selling restrictions This document is not an offer to sell or a solicitation of offers to purchase or subscribe for securities of Credit Suisse Group AG. This document is not a prospectus within the meaning of article 652a of the Swiss Code of Obligations, nor is it a listing prospectus as defined in the listing rules of the SIX Swiss Exchange AG or any other exchange or regulated trading facility in Switzerland or a prospectus under any other applicable laws. Copies of this document may not be sent to jurisdictions, or distributed in or sent from jurisdictions, in which this is barred or prohibited by law. The information contained herein shall not constitute an offer to sell or the solicitation of an offer to buy, in any jurisdiction in which such offer or solicitation would be unlawful prior to registration, exemption from registration or qualification under the securities laws of any jurisdiction. A decision to invest in securities of Credit Suisse Group AG should be based exclusively on a written agreement with Credit Suisse Group AG or an offering and listing prospectus to be published by Credit Suisse Group AG for such purpose. This document and the information contained herein is not for publication or distribution into the United States of America and should not be distributed or otherwise transmitted into the United States or to U.S. persons (as defined in the U.S. Securities Act of 1933, as amended (the “Securities Act”)) or publications with a general circulation in the United States. This document does not constitute an offer or invitation to subscribe for or to purchase any securities in the United States of America. The securities referred to herein have not been and will not be registered under the Securities Act or the laws of any state and may not be offered or sold in the United States of America absent registration or an exemption from registration under Securities Act. There will be no public offering of the securities in the United States of America. The information contained herein does not constitute an offer of securities to the public in the United Kingdom. No prospectus offering securities to the public will be published in the United Kingdom. This document is only being distributed to and is only directed at (i) persons who are outside the United Kingdom or (ii) to investment professionals falling within article 19(5) of the Financial Services and Markets Act 2000 (Financial Promotion) Order 2005 (as amended, the “Order”) or (iii) high net worth entities, and other persons to whom it may lawfully be communicated, falling within article 49(2)(a) to (d) of the Order (all such persons together being referred to as “relevant persons”). The securities are only available to, and any invitation, offer or agreement to subscribe, purchase or otherwise acquire such securities will be engaged in only with, relevant persons. Any person who is not a relevant person should not act or rely on this document or any of its contents.
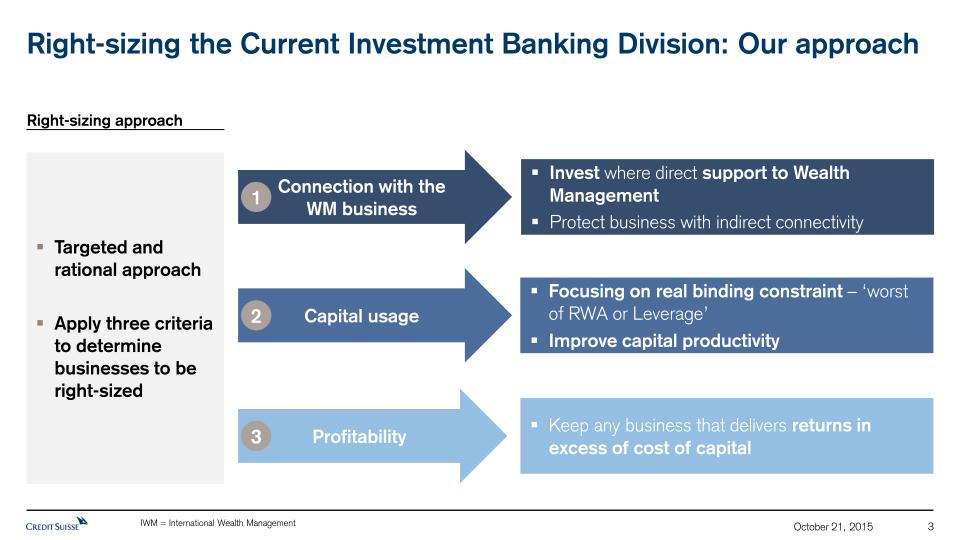
3 Connection with the WM business 1 Invest where direct support to Wealth ManagementProtect business with indirect connectivity Targeted and rational approachApply three criteria to determine businesses to be right-sized Profitability 3 Capital usage 2 Keep any business that delivers returns in excess of cost of capital Focusing on real binding constraint – ‘worst of RWA or Leverage’ Improve capital productivity Right-sizing approach Right-sizing the Current Investment Banking Division: Our approach IWM = International Wealth Management October 21, 2015
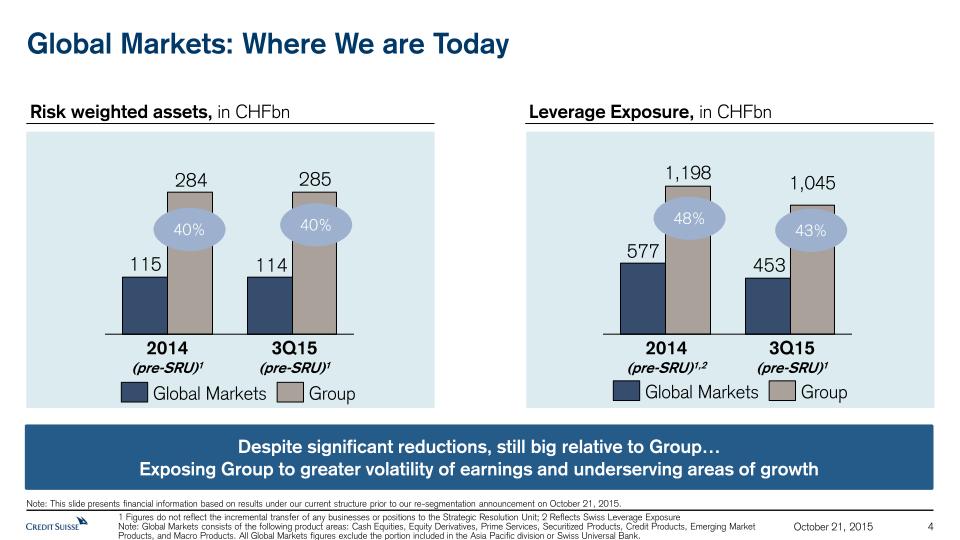
4 Global Markets: Where We are Today Leverage Exposure, in CHFbn Risk weighted assets, in CHFbn Despite significant reductions, still big relative to Group…Exposing Group to greater volatility of earnings and underserving areas of growth 3Q15 (pre-SRU)1 2014(pre-SRU)1 2014(pre-SRU)1,2 Group Global Markets Global Markets Group 40% 40% 48% 43% 1 Figures do not reflect the incremental transfer of any businesses or positions to the Strategic Resolution Unit; 2 Reflects Swiss Leverage Exposure Note: Global Markets consists of the following product areas: Cash Equities, Equity Derivatives, Prime Services, Securitized Products, Credit Products, Emerging Market Products, and Macro Products. All Global Markets figures exclude the portion included in the Asia Pacific division or Swiss Universal Bank. 3Q15 (pre-SRU)1 1,198 1,045 Note: This slide presents financial information based on results under our current structure prior to our re-segmentation announcement on October 21, 2015. October 21, 2015

Global Markets: Connectivity with the Group 5 Global Markets is an important differentiator to IWM clientsExecution and clearing services for flow productsStructured solutions and share backed lendingAccess to markets and geographies Strategic focus Product Connectivity to IWM Cash Equities Equity Derivatives Prime Services Securitized Products Credit Products Emerging Markets Macro Products High High Medium Low Medium High Medium Access to markets and geographies, new issue product Share backed lending, structured notes, retail products Investment grade, high yield & leveraged loan new issue product Structured financing Prime Services for UHNWI, Futures, Clearing Services Leading, highly profitable franchise Foreign exchange UHNWI = Ultra High Net Worth Individuals October 21, 2015

Global Markets: Competitive Standing & Ambition 6 Product CashEquities EquityDerivatives PrimeServices CreditProducts EmergingMarkets SecuritizedProducts MacroProducts Competitivestanding Competitive ambition #3 Top 3 #2 Top 3 #3 Top 3 #2 Top 3 Top 5 Top 3 #5 Top 3 >10 Niche Approach Strategic focus Invest Electronic trading and content delivery Key clients Inst Investors,Corporates Invest Partnership with IWM, virtual asset management products Corporates, Inst Investors, UHNWI Optimize Access products and attachment pointfor key clients Inst Investors Optimize Leading position with focus on synergieswith IWM Inst Investors,Corporates Optimize Traditional strength in leveraged finance and alignment with IBD Inst Investors, Corporates, Sponsors Optimize Traditional strength in emerging and frontier markets and alignment with IBD Inst Investors, Corporates, SWFs, UHNWI Scale back Capital light and electronic, risk facilitation capabilities Corporates, Inst Investors, SWFs Note: SWFs stands for Sovereign Wealth Funds. Competitive standing data is sourced as follows: Oliver Wyman 2014: Equity Derivatives and Prime Services. Coalition 1H2015 Global Revenue: Cash Equities, Securitized Products, Credit Products, Emerging Markets and Macro Products. October 21, 2015

7 Global Markets Cash Equities Equity Derivatives Prime Services Securitized Products Credit Products Emerging Markets Macro Products Resource Management (balance sheet, RWA, collateral, liquidity) Platform Content (Research, HOLT) Culture Creating a Profitable, Efficient, and Integrated Markets Business Clients October 21, 2015

Optimizing Resources in Macro and Prime 8 Scale back product offering and simplify operating platformLarge scale reduction in EuropeFocus resources (RWA and leverage) on Americas platformMaintain risk facilitation capabilities aligned to internal/key client requirements Maintain leading product capability while optimizing the balance sheet and focusing on key clientsContinue to re-price leverage Further enhance returns by investing technology to streamline platform Market structure and regulatory changes require us to run the businesses differently Niche player with focus on Americas Serve as attachment point for broader Global Markets franchise with goal of being top 3 with key clients Strategy Actions Prime Macro October 21, 2015

9 Prime’s Client Base a Key Driver for Revenue Growth 10.7% CAGR Source: McKinsey Global Asset Management Growth Cube Alternative Investments Global Assets Under Management, in USDtr October 21, 2015

Global Markets Outlook - Equities 10 Emerging vs. Developed Markets Equity Market Capitalization to GDP Ratio (%) Source: IMF, Credit Suisse Research EQ Markets’ 1yr Price Performance Post-Quantitative Easing Announcements USQE 3(9/12)1 JPN QQE (4/13)1 US QE 2 (11/10)1 EMU-ECB QE (3/15) Source: Thompson Reuters, Credit Suisse Research CSForecasts Emerging Markets Developed Markets UK QE 1 (3/09)1 USQE 1 (11/08)1 1 Dates represent month and year of QE announcement October 21, 2015

Global Markets Outlook - Credit 11 US Default Rates US High Yield Corporate Bond Issuance US high-yield spreads (lhs) US 12m trailing speculative default rates, 6m lag (rhs) Moody's mid-2016 default rate forecast Source: Thomson Reuters, Moody's Source: SIFMA Long-term High Yield Spreads US high-yield spreads, bps US high-yield spread, ex energy & utilities, % Average high-yield spread Average default rate and high-yield spread Source: Thomson Reuters USD bn % % % % % % % % % October 21, 2015

850 750 650 550 450 350 250 150 Credit Complex Performance Over-the-Cycle 12 Source: S&P Capital IQ Leveraged Commentary & Data, Thompson Reuters Leveraged Finance Primary Issuance vs. Default Rates & High Yield Spreads Credit and Securitized Products Revenue Volatility1 45 27 93 10 12 3 16 1 Volatility measured as monthly standard deviation. # of trading day losses USDbn bps Leveraged Finance Primary Issuance ($bn, rhs) High Yield Spreads (bps, lhs) Default Rates (bps, lhs) Standard Deviation October 21, 2015
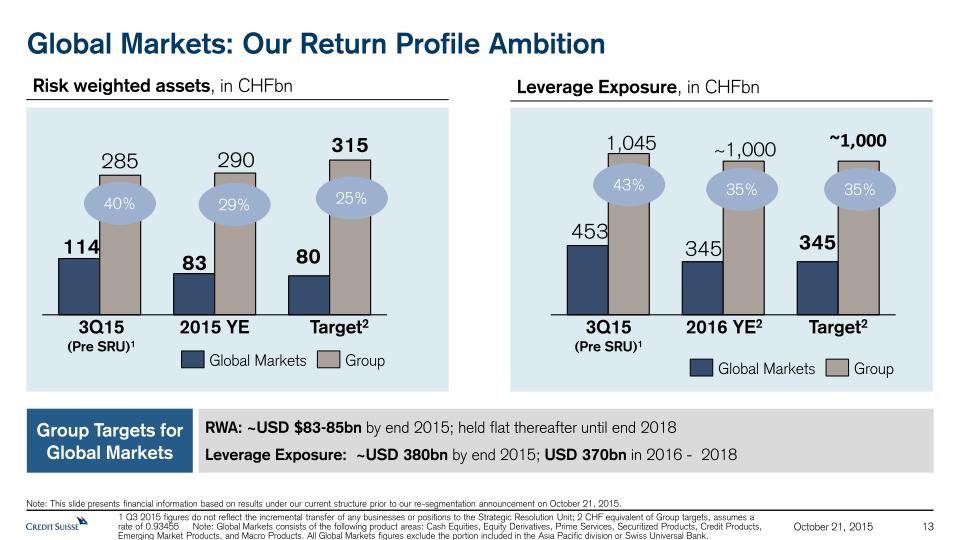
13 Leverage Exposure, in CHFbn Risk weighted assets, in CHFbn Target2 3Q15(Pre SRU)1 Group Global Markets 40% 25% Target2 Group Global Markets 43% 35% Global Markets: Our Return Profile Ambition 29% 2015 YE 35% 3Q15(Pre SRU)1 1 Q3 2015 figures do not reflect the incremental transfer of any businesses or positions to the Strategic Resolution Unit; 2 CHF equivalent of Group targets, assumes a rate of 0.93455 Note: Global Markets consists of the following product areas: Cash Equities, Equity Derivatives, Prime Services, Securitized Products, Credit Products, Emerging Market Products, and Macro Products. All Global Markets figures exclude the portion included in the Asia Pacific division or Swiss Universal Bank. 2016 YE2 Group Targets for Global Markets RWA: ~USD $83-85bn by end 2015; held flat thereafter until end 2018Leverage Exposure: ~USD 380bn by end 2015; USD 370bn in 2016 - 2018 Note: This slide presents financial information based on results under our current structure prior to our re-segmentation announcement on October 21, 2015. October 21, 2015

14 Our Ultimate Goal… CLIENTSBe the preeminent client-focused Global Markets Franchise SHAREHOLDERSBe the most profitable Global Markets franchise in the client business EMPLOYEESBe the Global Market Franchise where the best talent wants to be Drive superior returns and attain leading share with key clients Provide Market-leading Research, Distribution, Execution and Prime capabilities Attract and Retain the Best and Brightest Professionals Generate Resilient Pre Tax Income through all cycles Meet the Highest Legal, Ethical, Operational & Reputational Standards of Conduct October 21, 2015


October 21, 2015 Credit Suisse StrategyInvestment Banking & Capital MarketsJames L. Amine

Disclaimer October 21, 2015 2 The 3Q15 financial information is subject to further review We have not finalized our 3Q15 Financial Report and our independent registered public accounting firm has not completed its review of the condensed consolidated financial statements (unaudited) for the period. Accordingly, the 3Q15 financial information contained in this presentation is subject to completion of quarter-end procedures, which may result in changes to that information. Certain reclassifications have been made to prior periods to conform to the current presentation.The re-segmented financial information is preliminary and subject to further review Unless otherwise noted, this presentation contains certain historical financial information that has been re-segmented to approximate what our results under our new structure would have been, had it been in place from January 1, 2014. Such information is preliminary in nature and subject to review, evaluation and refinement, has not been audited or reviewed by our independent public accountants and can be expected to change in certain respects before any final re-segmentation is published. In addition, “Illustrative”, “Ambition” and “Goal” presentations are not intended to be viewed as targets or projections, nor are they considered to be Key Performance Indicators. All such presentations are subject to a large number of inherent risks, assumptions and uncertainties, many of which are completely outside of our control. Accordingly, this information should not be relied on for any purpose. We may not achieve the benefits of our strategic initiatives We may not achieve all of the expected benefits of our strategic initiatives. Factors beyond our control, including but not limited to the market and economic conditions, changes in laws, rules or regulations and other challenges discussed in our public filings, could limit our ability to achieve some or all of the expected benefits of these initiatives. Cautionary statement regarding forward -looking statements This presentation contains forward-looking statements that involve inherent risks and uncertainties, and we might not be able to achieve the predictions, forecasts, projections and other outcomes we describe or imply in forward-looking statements. A number of important factors could cause results to differ materially from the plans, objectives, expectations, estimates and intentions we express in these forward-looking statements, including those we identify in "Risk Factors” in our Annual Report on Form 20-F for the fiscal year ended December 31, 2014 and in “Cautionary statement regarding forward-looking information" in our second quarter 2015 Financial Report filed with the US Securities and Exchange Commission, and in other public filings and press releases. We do not intend to update these forward-looking statements except as may be required by applicable law. Statement regarding capital, liquidity and leverage As of January 1, 2013, Basel 3 was implemented in Switzerland along with the Swiss “Too Big to Fail” legislation and regulations thereunder (in each case, subject to certain phase-in periods). As of January 1, 2015, the Bank for International Settlements (BIS) leverage ratio framework, as issued by the Basel Committee on Banking Supervision (BCBS), was implemented in Switzerland by FINMA. Our related disclosures are in accordance with our interpretation of such requirements, including relevant assumptions. Changes in the interpretation of these requirements in Switzerland or in any of our assumptions or estimates could result in different numbers from those shown in this presentation. Capital and ratio numbers for periods prior to 2013 are based on estimates, which are calculated as if the Basel 3 framework had been in place in Switzerland during such periods. Unless otherwise noted, leverage exposure is based on the BIS leverage ratio framework and consists of period-end balance sheet assets and prescribed regulatory adjustments. Leverage amounts for 4Q14, which are presented in order to show meaningful comparative information, are based on estimates which are calculated as if the BIS leverage ratio framework had been implemented in Switzerland at such time. Beginning in 2015, the Swiss leverage ratio is calculated as Swiss total capital, divided by period-end leverage exposure. The look-through BIS tier 1 leverage ratio and CET1 leverage ratio are calculated as look-through BIS tier 1 capital and CET1 capital, respectively, divided by end-period leverage exposure. Selling restrictions This document is not an offer to sell or a solicitation of offers to purchase or subscribe for securities of Credit Suisse Group AG. This document is not a prospectus within the meaning of article 652a of the Swiss Code of Obligations, nor is it a listing prospectus as defined in the listing rules of the SIX Swiss Exchange AG or any other exchange or regulated trading facility in Switzerland or a prospectus under any other applicable laws. Copies of this document may not be sent to jurisdictions, or distributed in or sent from jurisdictions, in which this is barred or prohibited by law. The information contained herein shall not constitute an offer to sell or the solicitation of an offer to buy, in any jurisdiction in which such offer or solicitation would be unlawful prior to registration, exemption from registration or qualification under the securities laws of any jurisdiction. A decision to invest in securities of Credit Suisse Group AG should be based exclusively on a written agreement with Credit Suisse Group AG or an offering and listing prospectus to be published by Credit Suisse Group AG for such purpose. This document and the information contained herein is not for publication or distribution into the United States of America and should not be distributed or otherwise transmitted into the United States or to U.S. persons (as defined in the U.S. Securities Act of 1933, as amended (the “Securities Act”)) or publications with a general circulation in the United States. This document does not constitute an offer or invitation to subscribe for or to purchase any securities in the United States of America. The securities referred to herein have not been and will not be registered under the Securities Act or the laws of any state and may not be offered or sold in the United States of America absent registration or an exemption from registration under Securities Act. There will be no public offering of the securities in the United States of America. The information contained herein does not constitute an offer of securities to the public in the United Kingdom. No prospectus offering securities to the public will be published in the United Kingdom. This document is only being distributed to and is only directed at (i) persons who are outside the United Kingdom or (ii) to investment professionals falling within article 19(5) of the Financial Services and Markets Act 2000 (Financial Promotion) Order 2005 (as amended, the “Order”) or (iii) high net worth entities, and other persons to whom it may lawfully be communicated, falling within article 49(2)(a) to (d) of the Order (all such persons together being referred to as “relevant persons”). The securities are only available to, and any invitation, offer or agreement to subscribe, purchase or otherwise acquire such securities will be engaged in only with, relevant persons. Any person who is not a relevant person should not act or rely on this document or any of its contents.
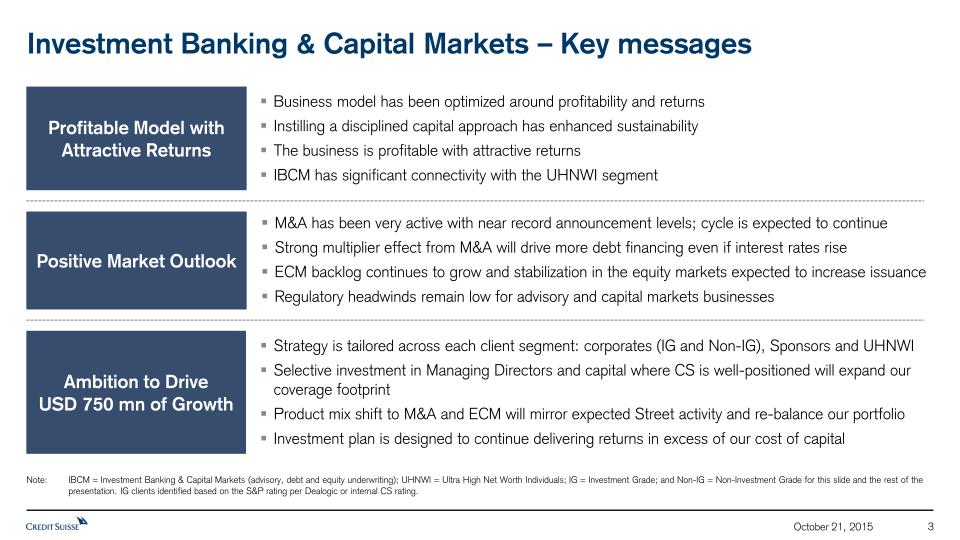
Investment Banking & Capital Markets – Key messages October 21, 2015 3 Business model has been optimized around profitability and returnsInstilling a disciplined capital approach has enhanced sustainabilityThe business is profitable with attractive returnsIBCM has significant connectivity with the UHNWI segment Profitable Model with Attractive Returns Positive Market Outlook Ambition to Drive USD 750 mn of Growth M&A has been very active with near record announcement levels; cycle is expected to continueStrong multiplier effect from M&A will drive more debt financing even if interest rates riseECM backlog continues to grow and stabilization in the equity markets expected to increase issuanceRegulatory headwinds remain low for advisory and capital markets businesses Strategy is tailored across each client segment: corporates (IG and Non-IG), Sponsors and UHNWISelective investment in Managing Directors and capital where CS is well-positioned will expand our coverage footprintProduct mix shift to M&A and ECM will mirror expected Street activity and re-balance our portfolioInvestment plan is designed to continue delivering returns in excess of our cost of capital Note: IBCM = Investment Banking & Capital Markets (advisory, debt and equity underwriting); UHNWI = Ultra High Net Worth Individuals; IG = Investment Grade; and Non-IG = Non-Investment Grade for this slide and the rest of the presentation. IG clients identified based on the S&P rating per Dealogic or internal CS rating.

Agenda October 21, 2015 4 IBCM markets and positioning Investing in IBCM 1 2 Our financial ambition and conclusion 3

IBCM has built a business model that delivers sustainable profitable growth October 21, 2015 5 IBCM snapshot (Americas and EMEA), in USD millions Source: Dealogic and CS internal reporting, where all numbers are shown pre- (Gross Revenues) and post- (Net Revenues and RoC) adjustments made for JV agreement with Securities for Americas and EMEA.Note: All data above excludes Switzerland. 2014 excludes Corporate Center charges. This slide presents financial information based on results under our current structure prior to our re-segmentation announcement on October 21, 2015. RoC (return on regulatory capital) calculated using income after tax, assuming tax rate of 30%, and capital allocated using worst of 10% of year-end Basel 3 risk-weighted assets or 3.5% of year-end leverage exposure, respectively. 2013 and 2014 calculated based on Swiss Leverage. Share of wallet = CS Dealogic fees / Street Dealogic fees for this slide and the rest of the presentation. Street fees and share of wallet based on IBCM addressable market in Americas and EMEA (ex. Swiss) only; excludes self- advised deals and non-core DCM products (investment grade loans, asset-backed and mortgage-backed securities, and govt. debt). PTIRoC (RWA)RoC (Leverage)Share of Wallet 44522%NA5.7% 71326%33%5.6% IBCM Gross Rev. IBCM Net Rev. 2012 2013 2014 (New Structure) 61827%30%5.3%

October 21, 2015 6 Global RoE vs. peers IBCM Global Capital Efficiency IBCM has industry-leading capital efficiency and returns… Source: BCG.Note: Capital efficiency calculation assumes loan commitments are 3 years; revenue is calculated as an average of fees for last 3 years (2012–2014). RoE calculation based on “standard approach.” 2014 Loan Book (USD bn) 75 120 125 65 230 165 270 220 280 2014 RoE 2014 Overall share of wallet IBCM revenue/loan book - %

…but revenue growth has lagged the market resulting in loss of share of wallet October 21, 2015 7 2012–2014 Global IBCM Fee CAGR Source: BCG. Note: Excludes asset-backed, mortgage-backed and undisclosed revenue for all peers. 2014 fees (USD mn) 4,808 4,080 5,575 3,794 3,496 3,140 4,547 3,567 2,075 4,670 2014 Share of Wallet 7.4% 6.3% 8.6% 5.9% 5.4% 4.8% 7.0% 5.5% 3.2% 7.2% Street CAGR: 9%

IBCM benefits from a favorable market outlook and limited regulatory headwinds October 21, 2015 8 Products M&A ECM Leveraged Finance Investment Grade Americas EMEA Regions Market outlook Regulatory impact * * * M&A related financing expected to increase in Lev Fin and Investment Grade markets Favorable market conditionsSignificant M&A activity expected to continueHigher ECM backlog expected to support increased issuanceLBO activity expected to accelerateInvestment grade outlook is stableEMEA benefits from positive fundamentalsAttractive business model driving high returnsHigh quality, consistent, fee-based revenue streamsDisciplined capital usage with high returnsExpect limited impact from evolving regulatory environment

October 21, 2015 9 Strong fundamentals for M&A are expected to drive overall fee pool Source: Oliver Wyman, Preqin.Note: As of Sept 2015 PE commitments have reached USD 487 bn. Unrealized portfolio value is based on total portfolio, including buyout and non-buyout; data as of Jun 2014. M&A revenue as a percentage of gross world product, 1993 - 2014 End of year corporate cash holdings (USD bn, 2007 – 2014E) OECD Business Confidence Index, Jan 2008 – Feb 2015, long run avg. = ~100 PE commitments and unrealized portfolio value (USD bn) M&A activity as a share of the world economy Business confidence levels in the US and Europe US corporate cash holdings Undrawn PE commitments and unrealized portfolio values

Agenda October 21, 2015 10 IBCM markets and positioning Investing in IBCM 1 2 Our financial ambition and conclusion 3

October 21, 2015 Client strategy is tailored to the specific market opportunity and CS positioning in each segment IBCM share of wallet by client segment (2012-2014) Street fee mix by client segment(2012-2014 ann. avg.) Source: Dealogic as of 7/1/15. Note: Street fees and share of wallet based on IBCM addressable market in Americas and EMEA only; excludes self-advised deals and non-core DCM products (investment grade loans, asset-backed and mortgage-backed securities, and govt. debt). Sponsors segment includes fees generated by Financial Sponsors and Sponsor portfolio companies. IG Corporates USD 13 bn Non-IG Corporates USD 26 bn SponsorsUSD 15 bn 11 Americas and EMEA only Americas and EMEA only 11

October 21, 2015 12 Selectively deploying additional coverage resources against IG and Non-IG clients is expected to increase impact of corporate coverage Expand Non-IG corporate footprint Improve IG corporate coverage CS Non-IG share of wallet(2012-2014) Non-IG fee pool(2012-2014) Source: Dealogic as of 7/1/15. Note: Street fees and share of wallet based on IBCM addressable market in Americas and EMEA only; excludes self-advised deals and non-core DCM products (investment grade loans, asset-backed and mortgage-backed securities, and govt. debt). Sponsors segment includes fees generated by Financial Sponsors and Sponsor portfolio companies. Covered clients are defined as clients that IBCM actively pursues business with and that pay >USD 5 mn per year in fees to the Street. Uncovered<USD 5 mn fees/yr. Covered Clients Uncovered>USD 5 mn fees/yr. IG corporates as a % of Street fees IG fee pool(2012-2014) Uncovered Covered Clients Americas and EMEA only Americas and EMEA only

October 21, 2015 13 The plan leverages IBCM’s strong Sponsors franchise across all regions and products… IBCM Sponsor share of wallet by product Strong covered share of wallet with Sponsors Americas EMEA Overall Covered 7.3% SoW 5.9% SoW 9.8% SoW USD 15 bnAnn. Avg. Street fees Source: Dealogic as of 7/1/15. Note: Street fees and share of wallet based on IBCM addressable market in Americas and EMEA only; excludes self-advised deals and non-core DCM products (investment grade loans, asset-backed and mortgage-backed securities, and govt. debt). Sponsors segment includes fees generated by Financial Sponsors and Sponsor portfolio companies. Covered clients are defined as clients that IBCM actively pursues business with and that pay >USD 5 mn per year in fees to the Street. (2012-2014) (2012-2014) Americas and EMEA only

…as well as our leadership position in Emerging Markets October 21, 2015 14 Source: Dealogic. Rankings and fee data based on 2012 - 2015YTD as of 10/15/15. Note: Street fees and Rank exclude China A-shares, domestic APAC debt issuance, self-advised fees and non-core DCM (e.g. IG loans and MBS/ABS).1 Global M&A and IPO Activity to Accelerate Until 2017-18, Baker & McKenzie, June 2015. Brazil#3 Colombia#2 Mexico #3 Russia#6 China#4 Indonesia#1 Singapore#3 India#10 Southeast Asia#1 Top 3 rank globally with leadership positions in the most attractive marketsM&A activity in the emerging markets is projected to grow dramatically, potentially by more than 50% by 20181

UHNWI as an additional IBCM client segment represents a meaningful untapped opportunity October 21, 2015 15 USThe US has six times2 the number of UHNWI than that of the next highest country, ChinaExisting co-coverage pilot in Technology and Oil & Gas sectors has been successfulNew initiative will target early life cycle entrepreneurs and billionaires in growth sectorsCoverage model leverages existing infrastructure:Dedicated coverage team with seasoned bankers and Relationship ManagersIBCM, share-based lending and alternative investment productsEMEAContinue to capitalize on established collaboration, particularly in the Middle East, Switzerland and Russia Source: Pitchbook, Forbes 2015 Billionaire list.Note: Street fees based on IBCM addressable market which excludes self-advised deals and non-core DCM products (investment grade loans, asset-backed and mortgage-backed securities, and govt. debt).1 Companies which meet IBCM size threshold of at least USD 5mn in annual average fees paid to the Street.2 Global Wealth Report 2015, Credit Suisse Research Institute, October 2015. Report defines UHNWI as individuals with wealth greater than USD 50 mn. Privately-held companies in the US with >USD 250 mn valuation # of Companies Companies affiliated with Forbes US billionaire list by industry1 Average Annual Street fees (in USD millions) 20 12 8 10 23 9 7 6 # Co.’s: 8 5
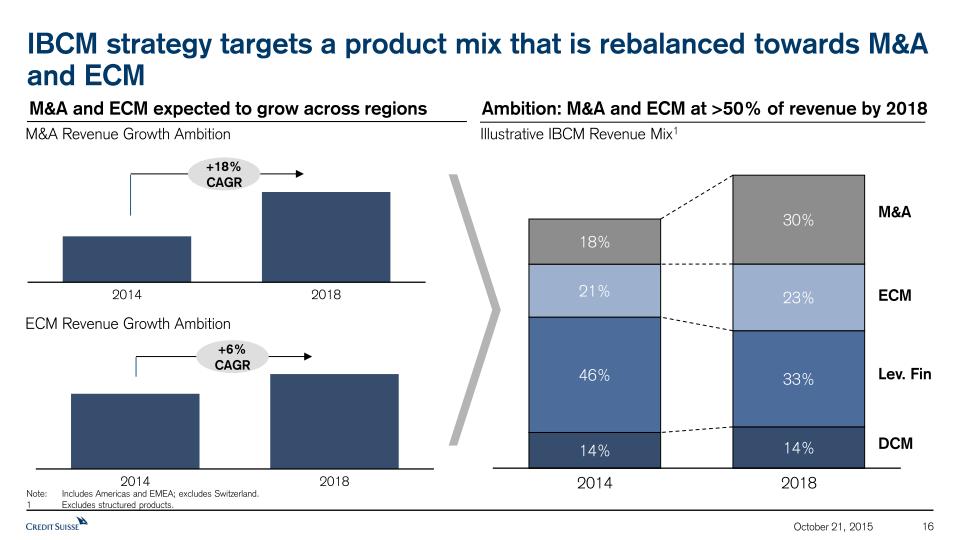
IBCM strategy targets a product mix that is rebalanced towards M&A and ECM October 21, 2015 16 Ambition: M&A and ECM at >50% of revenue by 2018 M&A and ECM expected to grow across regions Note: Includes Americas and EMEA; excludes Switzerland.1 Excludes structured products. ECM Lev. Fin DCM M&A M&A Revenue Growth Ambition Illustrative IBCM Revenue Mix1 ECM Revenue Growth Ambition +18% CAGR +6% CAGR

IBCM is expected to continue to generate returns in excess of cost of capital October 21, 2015 17 IBCM RoC (Leverage) Ambition Cost of Capital (10%) IBCM RoC (RWA) Ambition Note: Includes Americas and EMEA; excludes Switzerland. RoC (return on regulatory capital) calculated using income after tax, assuming tax rate of 30%, and capital allocated using worst of 10% of year-end Basel 3 risk-weighted assets or 3.5% of year-end leverage exposure, respectively. 2014 calculated based on Swiss Leverage. New Structure New Structure

Agenda October 21, 2015 18 IBCM markets and positioning Investing in IBCM 1 2 Our financial ambition and conclusion 3

Investing in IBCM October 21, 2015 19 UHNWI Clients 1 High connectivity with the UHNWI segment in the Americas and EMEAAbility to deliver banking products and investment opportunities to this sophisticated client base Profitability 3 Aim to deliver sustainable, profitable growth through a rebalanced product mixSeek to grow IG and Non-IG corporate coverage while building on strong track record in leveraged finance and sponsors Goal: Continue to deliver returns in excess of cost of capital Capital usage 2 Selectively use capital where CS is well positioned to benefit from the largest growth opportunitiesContinue to focus on capital efficiency and returnsLimited regulatory headwinds expected to continue

Goal: Drive USD 750 mn of incremental revenues in the Americas and EMEA while maintaining returns in excess of cost of capital October 21, 2015 20 Action Items:Align coverage strategy with the largest growth opportunities where CS is well-positionedExpand coverage footprint with Managing Director hires Selectively deploy additional capital against IG and Non-IG corporatesRebalance product mix towards M&A and ECMLaunch new initiative for Ultra High Net Worth Individuals Objectives:USD 750 million incremental revenue by 2018Returns in excess of our cost of capitalTop 5 share of walletBalanced product mix that drives sustainable, profitable growthTrusted partner to our largest clientsIncreased alignment and connectivity with UHNWI

SIGNATURES
Pursuant to the requirements of the Securities Exchange Act of 1934, the registrants have duly caused this report to be signed on their behalf by the undersigned, thereunto duly authorized.
|
CREDIT SUISSE GROUP AG and CREDIT SUISSE AG
|
||
|
(Registrants)
|
||
|
By:
|
/s/ Christian Schmid
|
|
|
Christian Schmid
|
||
|
Managing Director
|
||
| /s/ Claude Jehle | ||
| Claude Jehle | ||
| Date: October 22, 2015 | Director |
Serious News for Serious Traders! Try StreetInsider.com Premium Free!
You May Also Be Interested In
- UBS (UBS) Said To Plan More Than 100 Job Cuts In Investment Bank - Bloomberg
- Vistra Energy (VST) Announces Private Offerings of Senior Secured Notes and Senior Unsecured Notes
- Capstone Copper Provides MVDP Commissioning Update; First Quarter 2024 Results to be Released on May 2, 2024
Create E-mail Alert Related Categories
SEC FilingsRelated Entities
Credit SuisseSign up for StreetInsider Free!
Receive full access to all new and archived articles, unlimited portfolio tracking, e-mail alerts, custom newswires and RSS feeds - and more!
