

Form 8-K Apollo Commercial Real For: Jul 28
 Tweet
Tweet Share
Share
UNITED STATES
SECURITIES AND EXCHANGE COMMISSION
Washington, D.C. 20549
FORM 8-K
CURRENT REPORT
Pursuant to Section 13 or 15(d)
of The Securities Exchange Act of 1934
Date of Report (Date of earliest event reported): July 28, 2015
Apollo Commercial Real Estate Finance, Inc.
(Exact name of registrant as specified in its charter)
| Maryland | 001-34452 | 27-0467113 | ||
| (State or other jurisdiction of incorporation) |
(Commission File Number) |
(IRS Employer Identification No.) |
| c/o Apollo Global Management, LLC 9 West 57th Street, 43rd Floor New York, New York |
10019 | |
| (Address of principal executive offices) | (Zip Code) |
Registrant’s telephone number, including area code: (212) 515-3200
n/a
(Former name or former address, if changed since last report.)
Check the appropriate box below if the Form 8-K filing is intended to simultaneously satisfy the filing obligation of the registrant under any of the following provisions (see General Instruction A.2. below):
| ¨ | Written communications pursuant to Rule 425 under the Securities Act (17 CFR 230.425) |
| ¨ | Soliciting material pursuant to Rule 14a-12 under the Exchange Act (17 CFR 240.14a-12) |
| ¨ | Pre-commencement communications pursuant to Rule 14d-2(b) under the Exchange Act (17 CFR 240.14d-2(b)) |
| ¨ | Pre-commencement communications pursuant to Rule 13e-4(c) under the Exchange Act (17 CFR 240.13e-4(c)) |
| ITEM 2.02. | Results of Operations and Financial Condition. |
On July 28, 2015, Apollo Commercial Real Estate Finance, Inc. (the “Company”) issued an earnings release announcing its financial results for the quarter ended June 30, 2015. A copy of the earnings release is furnished as Exhibit 99.1 hereto and incorporated herein by reference.
On July 28, 2015, the Company posted supplemental financial information on the Investor Relations section of its website (www.apolloreit.com). A copy of the supplemental financial information is furnished as Exhibit 99.2 hereto and incorporated herein by reference.
The information in Item 2.02 of this Current Report, including Exhibits 99.1 and 99.2, is being furnished and shall not be deemed “filed” for purposes of Section 18 of the Securities Exchange Act of 1934, as amended, or otherwise subject to the liabilities of that Section. The information in this Current Report shall not be incorporated by reference into any registration statement or other document pursuant to the Securities Act of 1933, as amended, unless it is specifically incorporated by reference therein.
| ITEM 9.01. | Financial Statements and Exhibits. |
| (d) | Exhibits. |
| Exhibit No. |
Description | |
| 99.1 | Earnings Release dated July 28, 2015 | |
| 99.2 | Supplemental Financial Information for the quarter ended June 30, 2015 | |
SIGNATURES
Pursuant to the requirements of the Securities Exchange Act of 1934, the registrant has duly caused this report to be signed on its behalf by the undersigned hereunto duly authorized.
| Apollo Commercial Real Estate Finance, Inc. | ||
| By: | /s/ Stuart A. Rothstein | |
| Name: | Stuart A. Rothstein | |
| Title: | President and Chief Executive Officer | |
Date: July 28, 2015
Exhibit Index
| Exhibit No. |
Description | |
| 99.1 | Earnings Release dated July 28, 2015 | |
| 99.2 | Supplemental Financial Information for the quarter ended June 30, 2015 | |
Exhibit 99.1

| FOR IMMEDIATE RELEASE | NYSE:ARI |
| CONTACT: | Hilary Ginsberg |
| Investor Relations |
| (212) 822-0767 |
APOLLO COMMERCIAL REAL ESTATE FINANCE, INC. REPORTS
SECOND QUARTER 2015 FINANCIAL RESULTS AND
DECLARES A COMMON STOCK QUARTERLY DIVIDEND OF $0.44 PER SHARE
— 7.1% Increase in Operating Earnings Per Share of Common Stock —
New York, NY, July 28, 2015 – Apollo Commercial Real Estate Finance, Inc. (the “Company” or “ARI”) (NYSE: ARI) today reported financial results for the quarter ended June 30, 2015.
Second Quarter 2015 Highlights
| • | Reported Operating Earnings (a non-GAAP financial measure defined below) per diluted share of common stock of $0.45 for the quarter ended June 30, 2015, an increase of 7.1% as compared to Operating Earnings per diluted share of common stock of $0.42 for the quarter ended June 30, 2014; Reported Operating Earnings per diluted share of common stock of $0.89 for the six months ended June 30, 2015, an increase of 11.3% as compared to Operating Earnings per diluted share of common stock of $0.80 for the six months ended June 30, 2014. |
| • | Generated $32.8 million of net interest income during the quarter from the Company’s $2.1 billion commercial real estate debt portfolio, which had a levered weighted average underwritten internal rate of return (“IRR”) of approximately 14.6% at June 30, 2015; |
| • | Completed $446 million of commercial real estate first mortgage and mezzanine loan transactions during the quarter, $196 million of which were funded at closing and 94% of which were floating rate; |
| • | Funded $51 million for commercial real estate first mortgage and mezzanine loans during the quarter that were previously closed in 2014, bringing year-to-date fundings of previously closed loans to $91 million; |
| • | Entered into an amendment to the Company’s master repurchase agreement with JPMorgan Chase Bank, N.A. (the “JPMorgan Facility”) to increase the borrowing capacity to $400 million; and |
| • | Became a member, through a wholly owned subsidiary, of the Federal Home Loan Bank of Indianapolis. |
“The first half of 2015 has been very successful for ARI, as the Company has grown and diversified its investment portfolio, expanded its capital base and increased both Operating Earnings and dividends per share of common stock,” said Stuart Rothstein, Chief Executive Officer and President of the Company. “ARI has committed to over $550 million of transactions year-to-date. We believe the Company has efficiently managed capital raising with capital deployment activities, resulting in the growth to ARI’s Operating Earnings and dividend per share of common stock. Importantly, the credit quality of ARI’s portfolio remains stable and we believe the Company continues to be well positioned for a rate increase, given that 69% of the loans in ARI’s portfolio have floating interest rates.”
Second Quarter 2015 Operating Results
The Company reported Operating Earnings of $26.4 million, or $0.45 per diluted share of common stock, for the three months ended June 30, 2015, representing a per share increase of 7.1% as compared to Operating Earnings of $18.0 million, or $0.42 per diluted share of common stock, for the three months ended June 30, 2014. Net income available to common stockholders for the three months ended June 30, 2015 was $22.8 million, or $0.39 per diluted share of common stock, as compared to net income available to common stockholders of $22.1 million, or $0.51 per diluted share of common stock, for the three months ended June 30, 2014.
For the six months ended June 30, 2015, the Company reported Operating Earnings of $48.6 million, or $0.89 per diluted share of common stock, representing an 11.3% per share increase as compared to Operating Earnings of $32.0 million, or $0.80 per diluted share of common stock, for the six months ended June 30, 2014. Net income available to common stockholders for the six months ended June 30, 2015 was $46.5 million, or $0.85 per diluted share of common stock, as compared to net income available to common stockholders of $37.8 million, or $0.94 per diluted share of common stock, for the six months ended June 30, 2014.
Second Quarter 2015 Investment Activity
New Investments – During the second quarter, ARI completed the following commercial real estate first mortgage and mezzanine loan transactions:
| • | $47.3 million of first mortgage loans ($31.3 million of which were funded during the quarter), which were underwritten to generate a levered weighted average IRR of approximately 17%; |
| • | $398.8 million of subordinate loans ($165.0 million of which were funded during the quarter), which were underwritten to generate a weighted average IRR of approximately 15%; and |
| • | $51.5 million of fundings from previously closed loans. |
Loan Repayments – During the second quarter, ARI received full principal repayment from a first mortgage loan secured by a hotel in Silver Springs, Maryland totaling $24.5 million and full principal repayment from a mezzanine loan secured by a mixed use property located in Pittsburgh, Pennsylvania totaling $22.5 million.
Quarter End Commercial Real Estate Debt Portfolio Summary
The following table sets forth certain information regarding the Company’s commercial real estate debt portfolio at June 30, 2015 ($ amounts in thousands):
| Description |
Amortized Cost |
Weighted Average Yield |
Debt | Cost of Funds |
Equity at Cost(1) |
Current Weighted Average Underwritten IRR (2) |
Fully- Levered Weighted Average Underwritten IRR(2) |
|||||||||||||||||||||
| First mortgage loans |
$ | 704,040 | 8.4 | % | $ | 428,835 | 2.6 | % | $ | 275,205 | 18.0 | % | 18.0 | % | ||||||||||||||
| Subordinate loans(3)(4) |
894,926 | 12.0 | 15,613 | 3.7 | 847,968 | 13.4 | 13.4 | |||||||||||||||||||||
| CMBS |
511,412 | 6.6 | 433,904 | 3.4 | 107,635 | 16.2 | 16.2 | |||||||||||||||||||||
|
|
|
|
|
|
|
|
|
|
|
|
|
|
|
|||||||||||||||
| Total/Weighted Average |
$ | 2,110,378 | 9.5 | % | $ | 878,352 | 3.0 | % | $ | 1,230,808 | 14.6 | % | 14.6 | % | ||||||||||||||
|
|
|
|
|
|
|
|
|
|
|
|
|
|
|
|||||||||||||||
Please see chart footnotes at the end of the press release.
Loan-to-Value
At June 30, 2015, the Company’s commercial real estate loan portfolio, which includes CMBS, held-to-maturity, had a weighted average LTV of 62%. Within the commercial real estate loan portfolio, the first mortgage loans had a weighted average LTV of 61% and the subordinate loans (including CMBS, held-to-maturity) had a weighted average LTV of 64%.
Book Value
The Company’s book value per share of common stock at June 30, 2015 was $16.41. For purposes of GAAP accounting, the Company carries loans at amortized cost and its CMBS are marked to market. Management has estimated that the fair value of the Company’s loan portfolio at June 30, 2015 was approximately $11.6 million greater than the carrying value as of the same date.
Financing Activities
During the second quarter of 2015, ARI, through wholly owned subsidiaries, entered into an amendment to the JPMorgan Facility to increase the borrowing capacity to $400 million from $300 million. In addition, the Company, through a wholly owned subsidiary, became a member of the Federal Home Loan Bank of Indianapolis.
2
Subsequent Events
Funding of Previously Closed Loans – Subsequent to quarter end, ARI completed $21.7 million of fundings from previously closed loans.
Dividend – ARI’s Board of Directors declared a dividend of $0.44 per share of common stock, which is payable on October 15, 2015 to common stockholders of record on September 30, 2015.
Definition of Operating Earnings
Operating Earnings is a non-GAAP financial measure that is used by the Company to approximate cash available for distribution and is defined by the Company as net income available to common stockholders, computed in accordance with GAAP, adjusted for (i) equity-based compensation expense (a portion of which may become cash-based upon final vesting and settlement of awards should the holder elect net share settlement to satisfy income tax withholding); (ii) any unrealized gains or losses or other non-cash items included in net income available to common stockholders; (iii) unrealized income from unconsolidated joint ventures; (iv) foreign currency gains/(losses) and (v) the non-cash amortization expense related to the reclassification of a portion of the convertible senior notes to stockholders’ equity in accordance with GAAP.
Reconciliation of Operating Earnings to Net Income Available to Common Stockholders
The tables below reconcile Operating Earnings and Operating Earnings per share of common stock with net income available to common stockholders and net income available to common stockholders per share of common stock for the three and six month periods ended June 30, 2015 and June 30, 2014 ($ amounts in thousands, except share and per share data):
| Three Months Ended June 30, 2015 |
Earnings Per Share (Diluted) |
Three Months Ended June 30, 2014 |
Earnings Per Share (Diluted) |
|||||||||||||
| Operating Earnings: | ||||||||||||||||
| Net income available to common stockholders |
$ | 22,798 | $ | 0.39 | $ | 22,098 | $ | 0.51 | ||||||||
| Adjustments: |
||||||||||||||||
| Equity-based compensation expense |
821 | 0.01 | 362 | 0.01 | ||||||||||||
| Unrealized (gain)/loss on securities |
2,273 | 0.04 | (4,749 | ) | (0.11 | ) | ||||||||||
| Unrealized loss on derivative instruments |
3,197 | 0.06 | 1,093 | 0.03 | ||||||||||||
| Foreign currency gain |
(2,867 | ) | (0.05 | ) | (959 | ) | (0.02 | ) | ||||||||
| Amortization of convertible senior notes related to equity reclassification |
547 | 0.01 | 200 | — | ||||||||||||
| Income from unconsolidated joint venture |
(384 | ) | (0.01 | ) | — | — | ||||||||||
|
|
|
|
|
|
|
|
|
|||||||||
| Total adjustments: |
3,587 | 0.06 | (4,053 | ) | (0.09 | ) | ||||||||||
|
|
|
|
|
|
|
|
|
|||||||||
| Operating Earnings |
$ | 26,385 | $ | 0.45 | $ | 18,045 | $ | 0.42 | ||||||||
|
|
|
|
|
|
|
|
|
|||||||||
| Basic weighted average shares of common stock outstanding: |
58,429,155 | 42,888,747 | ||||||||||||||
| Diluted weighted average shares of common stock outstanding: |
59,022,217 | 43,009,354 | ||||||||||||||
3
| Six Months Ended June 30, 2015 |
Earnings Per Share (Diluted) |
Six Months Ended June 30, 2014 |
Earnings Per Share (Diluted) |
|||||||||||||
| Operating Earnings: |
||||||||||||||||
| Net income available to common stockholders |
$ | 46,449 | $ | 0.85 | $ | 37,819 | $ | 0.94 | ||||||||
| Adjustments: |
||||||||||||||||
| Equity-based compensation expense |
1,939 | 0.04 | 788 | 0.02 | ||||||||||||
| Unrealized gain on securities |
(1,136 | ) | (0.02 | ) | (6,934 | ) | (0.17 | ) | ||||||||
| Unrealized loss on derivative instruments |
6,241 | 0.11 | 1,093 | 0.03 | ||||||||||||
| Foreign currency gain |
(5,588 | ) | (0.10 | ) | (959 | ) | (0.02 | ) | ||||||||
| Amortization of convertible senior notes related to equity reclassification |
1,087 | 0.02 | 229 | — | ||||||||||||
| Income from unconsolidated joint venture |
(384 | ) | (0.01 | ) | — | — | ||||||||||
|
|
|
|
|
|
|
|
|
|||||||||
| Total adjustments: |
2,159 | $ | 0.04 | (5,783 | ) | (0.14 | ) | |||||||||
|
|
|
|
|
|
|
|
|
|||||||||
| Operating Earnings |
$ | 48,608 | $ | 0.89 | $ | 32,036 | $ | 0.80 | ||||||||
|
|
|
|
|
|
|
|
|
|||||||||
| Basic weighted average shares of common stock outstanding: |
54,020,978 | 40,021,722 | ||||||||||||||
| Diluted weighted average shares of common stock outstanding: |
54,621,401 | 40,236,109 | ||||||||||||||
Teleconference Details:
The Company will host a conference call to discuss its financial results on Wednesday, July 29, 2015 at 9:00 a.m. Eastern Time. Members of the public who are interested in participating in the Company’s second quarter 2015 earnings teleconference call should dial from the U.S., (877) 331-6553, or from outside the U.S., (760) 666-3769, shortly before 9:00 a.m. and reference the Apollo Commercial Real Estate Finance, Inc. Teleconference Call (number 77392821). Please note the teleconference call will be available for replay beginning at 2:00 p.m. on Wednesday, July 29, 2015, and ending at midnight on Wednesday, August 5, 2015. To access the replay, callers from the U.S. should dial (855) 859-2056 and callers from outside the U.S. should dial (404) 537-3406, and enter conference identification number 77392821.
Webcast:
The conference call will also be available on the Company’s website at www.apolloreit.com. To listen to a live broadcast, please go to the site at least 15 minutes prior to the scheduled start time in order to register, download and install any necessary audio software. A replay of the call will also be available for 30 days on the Company’s website.
Supplemental Information
The Company provides supplemental financial information to offer more transparency into its results and make its reporting more informative and easier to follow. The supplemental financial information is available in the investor relations section of the Company’s website at www.apolloreit.com.
About Apollo Commercial Real Estate Finance, Inc.
Apollo Commercial Real Estate Finance, Inc. (NYSE: ARI) is a real estate investment trust that primarily originates, acquires, invests in and manages performing commercial real estate mortgage loans, subordinate financings, CMBS and other commercial real estate-related debt investments. The Company is externally managed and advised by ACREFI Management, LLC, a Delaware limited liability company and an indirect subsidiary of Apollo Global Management, LLC, a leading global alternative investment manager with approximately $162.9 billion of assets under management at March 31, 2015.
Additional information can be found on the Company’s website at www.apolloreit.com.
4
Dividend Reinvestment Plan
The Company adopted a Direct Stock Purchase and Dividend Reinvestment Plan (the “Plan”). The Plan provides new investors and existing holders of the Company’s common stock with a convenient and economical method to purchase shares of its common stock. By participating in the Plan, participants may purchase additional shares of the Company’s common stock by reinvesting some or all of the cash dividends received on their shares of the Company’s common stock. In addition, the Plan permits participants to make optional cash investments of up to $10,000 per month, and, with the Company’s prior approval, optional cash investments in excess of $10,000 per month, for the purchase of additional shares of the Company’s common stock.
The Plan is administered by a division of Wells Fargo Bank, N.A. (“Wells”). Stockholders and other persons may obtain a copy of the Plan prospectus and an enrollment form by contacting Wells at (800) 468-9716 or (651) 450-4064, if outside the United States, or visiting Wells’ website at www.shareowneronline.com.
This communication does not constitute an offer to sell or the solicitation of an offer to buy securities.
Forward-Looking Statements
Certain statements contained in this press release constitute forward-looking statements as such term is defined in Section 27A of the Securities Act of 1933, as amended, and Section 21E of the Securities Exchange Act of 1934, as amended, and such statements are intended to be covered by the safe harbor provided by the same. Forward-looking statements are subject to substantial risks and uncertainties, many of which are difficult to predict and are generally beyond the Company’s control. These forward-looking statements include information about possible or assumed future results of the Company’s business, financial condition, liquidity, results of operations, plans and objectives. When used in this release, the words believe, expect, anticipate, estimate, plan, continue, intend, should, may or similar expressions, are intended to identify forward-looking statements. Statements regarding the following subjects, among others, may be forward-looking: the return on equity; the yield on investments; the ability to borrow to finance assets; the Company’s ability to deploy the proceeds of its capital raises or acquire its target assets; and risks associated with investing in real estate assets, including changes in business conditions and the general economy. For a further list and description of such risks and uncertainties, see the reports filed by the Company with the Securities and Exchange Commission. The forward-looking statements, and other risks, uncertainties and factors are based on the Company’s beliefs, assumptions and expectations of its future performance, taking into account all information currently available to the Company. Forward-looking statements are not predictions of future events. The Company disclaims any intention or obligation to update or revise any forward-looking statements, whether as a result of new information, future events or otherwise, except as required by law.
Footnotes
| (1) | CMBS includes $30,127 of restricted cash related to the Company’s repurchase facility with UBS AG. |
| (2) | The underwritten IRR for the investments shown in the above table and elsewhere in this press release reflect the returns underwritten by ACREFI Management, LLC, the Company’s external manager, calculated on a weighted average basis assuming no dispositions, early prepayments or defaults but assuming that extension options are exercised and that the cost of borrowings remains constant over the remaining term. With respect to certain loans, the underwritten IRR calculation assumes certain estimates with respect to the timing and magnitude of future fundings for the remaining commitments and associated loan repayments, and assumes no defaults. IRR is the annualized effective compounded return rate that accounts for the time-value of money and represents the rate of return on an investment over a holding period expressed as a percentage of the investment. It is the discount rate that makes the net present value of all cash outflows (the costs of investment) equal to the net present value of cash inflows (returns on investment). It is derived from the negative and positive cash flows resulting from or produced by each transaction (or for a transaction involving more than one investment, cash flows resulting from or produced by each of the investments), whether positive, such as investment returns, or negative, such as transaction expenses or other costs of investment, taking into account the dates on which such cash flows occurred or are expected to occur, and compounding interest accordingly. There can be no assurance that the actual IRRs will equal the underwritten IRRs shown in the table. See “Item 1A—Risk Factors—The Company may not achieve its underwritten internal rate of return on its investments which may lead to future returns that may be significantly lower than anticipated” included in the Company’s Annual Report on Form 10-K for the year ended December 31, 2014 for a discussion of some of the factors that could adversely impact the returns received by the Company from the investments shown in the table over time. |
| (3) | Subordinate loans include CMBS, held-to-maturity, which represents a loan the Company closed during May 2014 that was subsequently contributed to a securitization during August 2014. During May 2014, the Company closed a $155,000 floating-rate whole loan secured by the first mortgage and equity interests in an entity that owns a resort hotel in Aruba. During June 2014, the Company syndicated a $90,000 senior participation in the loan and retained a $65,000 junior participation. During August 2014, both the $90,000 senior participation and the Company’s $65,000 junior participation were contributed to a CMBS securitization. In exchange for contributing its $65,000 junior participation, the Company received a CMBS secured solely by the $65,000 junior participation. ARI presents the participation sold as both assets and non-recourse liabilities because the participation does not qualify as a sale according to GAAP. At June 30, 2015, ARI had one such participation sold with a carrying amount of $89,646. |
5
| (4) | Subordinate loans also are net of a participation sold during February 2015. The Company presents the participation sold as both assets and non-recourse liabilities because the participation does not qualify as a sale according to GAAP. At June 30, 2015, the Company had one such participation sold with a face amount of £20,000 and a carrying amount of $31,345. |
6
Apollo Commercial Real Estate Finance, Inc. and Consolidated Subsidiaries
Condensed Consolidated Balance Sheets
(in thousands—except share and per share data)
| June 30, 2015 | December 31, 2014 | |||||||
| (Unaudited) | ||||||||
| Assets: |
||||||||
| Cash |
$ | 48,848 | $ | 40,641 | ||||
| Restricted cash |
34,547 | 30,127 | ||||||
| Securities available-for-sale, at estimated fair value |
— | 17,105 | ||||||
| Securities, at estimated fair value |
518,851 | 522,730 | ||||||
| Securities, held-to-maturity |
154,391 | 154,283 | ||||||
| Commercial mortgage loans, held for investment |
704,040 | 458,520 | ||||||
| Subordinate loans, held for investment |
830,181 | 561,182 | ||||||
| Investment in unconsolidated joint venture |
20,021 | 37,016 | ||||||
| Derivative assets |
262 | 4,070 | ||||||
| Interest receivable |
12,817 | 10,829 | ||||||
| Deferred financing costs, net |
8,898 | 7,444 | ||||||
| Other assets |
582 | 1,200 | ||||||
|
|
|
|
|
|||||
| Total Assets |
$ | 2,333,438 | $ | 1,845,147 | ||||
|
|
|
|
|
|||||
| Liabilities and Stockholders’ Equity |
||||||||
| Liabilities: |
||||||||
| Borrowings under repurchase agreements |
$ | 878,352 | $ | 622,194 | ||||
| Convertible senior notes, net |
247,305 | 246,464 | ||||||
| Participations sold |
120,991 | 89,584 | ||||||
| Derivative liabilities |
2,109 | — | ||||||
| Accounts payable and accrued expenses |
8,253 | 7,578 | ||||||
| Payable to related party |
3,890 | 3,240 | ||||||
| Dividends payable |
27,694 | 21,018 | ||||||
|
|
|
|
|
|||||
| Total Liabilities |
1,288,594 | 990,078 | ||||||
| Stockholders’ Equity: |
||||||||
| Preferred stock, $0.01 par value, 50,000,000 shares authorized and 3,450,000 shares issued and outstanding in 2015 and 2014 ($86,250 aggregate liquidation preference) |
35 | 35 | ||||||
| Common stock, $0.01 par value, 450,000,000 shares authorized, 58,429,155 and 46,900,442 shares issued and outstanding in 2015 and 2014, respectively |
584 | 469 | ||||||
| Additional paid-in-capital |
1,062,857 | 868,035 | ||||||
| Retained earnings (accumulated deficit) |
(15,965 | ) | (10,485 | ) | ||||
| Accumulated other comprehensive loss |
(2,667 | ) | (2,985 | ) | ||||
|
|
|
|
|
|||||
| Total Stockholders’ Equity |
1,044,844 | 855,069 | ||||||
|
|
|
|
|
|||||
| Total Liabilities and Stockholders’ Equity |
$ | 2,333,438 | $ | 1,845,147 | ||||
|
|
|
|
|
|||||
7
Apollo Commercial Real Estate Finance, Inc. and Consolidated Subsidiaries
Condensed Consolidated Statement of Operations
(in thousands—except share and per share data)
| Three months ended June 30, |
Six months ended June 30, |
|||||||||||||||
| 2015 | 2014 | 2015 | 2014 | |||||||||||||
| Net interest income: |
||||||||||||||||
| Interest income from securities |
$ | 8,265 | $ | 4,366 | $ | 16,553 | $ | 6,785 | ||||||||
| Interest income from securities, held to maturity |
3,349 | — | 6,394 | — | ||||||||||||
| Interest income from commercial mortgage loans |
11,968 | 6,438 | 22,061 | 10,449 | ||||||||||||
| Interest income from subordinate loans |
21,152 | 18,238 | 39,762 | 32,968 | ||||||||||||
| Interest expense |
(11,917 | ) | (5,258 | ) | (23,399 | ) | (7,015 | ) | ||||||||
|
|
|
|
|
|
|
|
|
|||||||||
| Net interest income |
32,817 | 23,784 | 61,371 | 43,187 | ||||||||||||
| Operating expenses: |
||||||||||||||||
| General and administrative expenses (includes $821 and $1,939 of equity-based compensation in 2015 and $362 and $788 in 2014, respectively) |
(2,059 | ) | (1,479 | ) | (4,414 | ) | (2,921 | ) | ||||||||
| Management fees to related party |
(3,887 | ) | (2,966 | ) | (7,228 | ) | (5,531 | ) | ||||||||
|
|
|
|
|
|
|
|
|
|||||||||
| Total operating expenses |
(5,946 | ) | (4,445 | ) | (11,642 | ) | (8,452 | ) | ||||||||
| Income from unconsolidated joint venture |
384 | — | 384 | — | ||||||||||||
| Interest income from cash balances |
6 | 4 | 16 | 4 | ||||||||||||
| Realized loss on sale of securities |
— | — | (443 | ) | — | |||||||||||
| Unrealized gain/(loss) on securities |
(2,273 | ) | 4,749 | 1,136 | 6,934 | |||||||||||
| Foreign currency gain |
2,867 | 959 | 5,588 | 959 | ||||||||||||
| Loss on derivative instruments |
(3,197 | ) | (1,093 | ) | (6,241 | ) | (1,093 | ) | ||||||||
|
|
|
|
|
|
|
|
|
|||||||||
| Net income |
24,658 | 23,958 | 50,169 | 41,539 | ||||||||||||
|
|
|
|
|
|
|
|
|
|||||||||
| Preferred dividend |
(1,860 | ) | (1,860 | ) | (3,720 | ) | (3,720 | ) | ||||||||
|
|
|
|
|
|
|
|
|
|||||||||
| Net income available to common stockholders |
$ | 22,798 | $ | 22,098 | $ | 46,449 | $ | 37,819 | ||||||||
|
|
|
|
|
|
|
|
|
|||||||||
| Basic and diluted net income per share of common stock |
$ | 0.39 | $ | 0.51 | $ | 0.85 | $ | 0.94 | ||||||||
|
|
|
|
|
|
|
|
|
|||||||||
| Basic weighted average shares of common stock outstanding |
58,429,155 | 42,888,747 | 54,020,978 | 40,021,722 | ||||||||||||
|
|
|
|
|
|
|
|
|
|||||||||
| Diluted weighted average shares of common stock outstanding |
59,022,217 | 43,099,354 | 54,621,401 | 40,236,109 | ||||||||||||
|
|
|
|
|
|
|
|
|
|||||||||
| Dividend declared per share of common stock |
$ | 0.44 | $ | 0.40 | $ | 0.88 | $ | 0.80 | ||||||||
|
|
|
|
|
|
|
|
|
|||||||||
8
 Information is as of June 30, 2015, except as otherwise noted.
It should not be assumed that investments made in the
future will be profitable or will equal the performance of investments in this document. Supplemental Financial Information Package – Q2 2015 July 29, 2015 Exhibit 99.2 |
 Forward Looking Statements and Other Disclosures
1
This
presentation
may
contain
forward-looking
statements
that
are
within
the
meaning
of
Section
27A
of
the
Securities
Act
of
1933,
as
amended,
and
Section
21E
of
the
Securities
Exchange
Act
of
1934,
as
amended,
and
such
statements
are
intended
to
be
covered
by
the
safe
harbor
provided
by
the
same.
Forward-looking
statements
are
subject
to
substantial
risks
and
uncertainties,
many
of
which
are
difficult
to
predict
and
are
generally
beyond
management’s
control.
These
forward-
looking
statements
may
include
information
about
possible
or
assumed
future
results
of
Apollo
Commercial
Real
Estate
Finance,
Inc.’s
(“ARI”
or
the
“Company”)
business,
financial
condition,
liquidity,
results
of
operations,
plans
and
objectives.
When
used
in
this
presentation,
the
words
“believe,”
“expect,”
“anticipate,”
“estimate,”
“plan,”
“continue,”
“intend,”
“should,”
“may”
or
similar
expressions,
are
intended
to
identify
forward-looking
statements.
Statements
regarding
the
following
subjects,
among
others,
may
be
forward-looking:
ARI’s
business
and
investment
strategy;
ARI’s
operating
results;
ARI’s
ability
to
obtain
and
maintain
financing
arrangements;
the
return
on
equity,
the
yield
on
investments
and
risks
associated
with
investing
in
real
estate
assets;
and
changes
in
business
conditions
and
the
general
economy.
The
forward-looking
statements
are
based
on
management’s
beliefs,
assumptions
and
expectations
of
future
performance,
taking
into
account
all
information
currently
available
to
ARI.
Forward-looking
statements
are
not
predictions
of
future
events.
These
beliefs,
assumptions
and
expectations
can
change
as
a
result
of
many
possible
events
or
factors,
not
all
of
which
are
known
to
ARI.
Some
of
these
factors
are
described
under
“Risk
Factors,”
and
“Management’s
Discussion
and
Analysis
of
Financial
Condition
and
Results
of
Operations”
included
in
ARI’s
Annual
Report
on
Form
10-K
for
the
fiscal
year
ended
December
31,
2014
and
other
periodic
reports
filed
with
the
Securities
and
Exchange
Commission
(“SEC”),
which
are
accessible
on
the
SEC’s
website
at
www.sec.gov.
If
a
change
occurs,
ARI’s
business,
financial
condition,
liquidity
and
results
of
operations
may
vary
materially
from
those
expressed
in
ARI’s
forward-looking
statements.
Any
forward-looking
statement
speaks
only
as
of
the
date
on
which
it
is
made.
New
risks
and
uncertainties
arise
over
time,
and
it
is
not
possible
for
management
to
predict
those
events
or
how
they
may
affect
ARI.
Except
as
required
by
law,
ARI
is
not
obligated
to,
and
does
not
intend
to,
update
or
revise
any
forward-looking
statements,
whether
as
a
result
of
new
information,
future
events
or
otherwise.
This
presentation
contains
information
regarding
ARI’s
financial
results
that
is
calculated
and
presented
on
the
basis
of
methodologies
other
than
in
accordance
with
accounting
principles
generally
accepted
in
the
United
States
(“GAAP”),
including
Operating
Earnings
and
Operating
Earnings
per
share.
Please
refer
to
slide
3
for
a
definition
of
“Operating
Earnings”
and
the
reconciliation
of
“Operating
Earnings”
to
the
applicable
GAAP
financial
measure
set
forth
on
slide
18.
This
presentation
may
contain
statistics
and
other
data
that
in
some
cases
has
been
obtained
from
or
compiled
from
information
made
available
by
third-party
service
providers.
ARI
makes
no
representation
or
warranty,
expressed
or
implied,
with
respect
to
the
accuracy,
reasonableness
or
completeness
of
such
information.
Past
performance
is
not
indicative
nor
a
guarantee
of
future
returns.
Index
performance
and
yield
data
are
shown
for
illustrative
purposes
only
and
have
limitations
when
used
for
comparison
or
for
other
purposes
due
to,
among
other
matters,
volatility,
credit
or
other
factors
(such
as
number
and
types
of
securities).
Indices
are
unmanaged,
do
not
charge
any
fees
or
expenses,
assume
reinvestment
of
income
and
do
not
employ
special
investment
techniques
such
as
leveraging
or
short
selling.
No
such
index
is
indicative
of
the
future
results
of
any
investment
by
ARI. |
 ARI Q2 2015 Earnings Call 2 July 29, 2015 Stuart Rothstein Chief Executive Officer and President Scott Weiner Chief Investment Officer of the Manager Megan Gaul Chief Financial Officer, Treasurer and Secretary Hilary Ginsberg Investor Relations Manager |
 Financial Summary 3 ($ amounts in thousands, except per share data) Income Statement June 30, 2015 June 30, 2014 % Change June 30, 2015 June 30, 2014 % Change 44,734 $ 29,042 $
54.0%
84,770
$
50,202
$
68.9%
(11,917)
$
(5,258)
$
126.6%
(23,399)
$
(7,015)
$
233.6%
Net interest income
32,817
$
23,784
$
38.0%
61,371
$
43,187
$
42.1%
Operating earnings
(1)
26,385
$
18,045
$
46.2%
48,608
$
32,036
$
51.7%
0.45
$
0.42
$
7.1%
0.89
$
0.80
$
11.3%
59,022,217
43,009,354
37.2%
54,621,401
40,236,109
35.8%
Balance sheet
June 30, 2015
December 31, 2014
% Change
2,110,378
$
1,618,623
$
30.4%
1,230,808
$
1,026,556
$
19.9%
Common stockholders' equity
958,594
$
768,819
$
24.7%
86,250
$
86,250
$
-
878,352
$
622,194
$
41.2%
Convertible senior notes
247,305
$
246,464
$
0.3%
1.2x
1.2x
2.9x
2.8x
Three Months Ended
Six Months Ended
Interest income
Interest expense
Operating earnings per diluted share
(1)
Diluted weighted average shares of common
stock outstanding
Investments at amortized cost
(2)
Net equity in investments at cost
Preferred stockholders' equity
Debt to common equity
(3)
Outstanding repurchase agreement borrowings
Fixed charge coverage
(4)
(1)
Operating Earnings is a non-GAAP
financial measure that is used by the Company to approximate cash available for distribution and is defined by the Company as net income available to common stockholders, computed in accordance with GAAP, adjusted for (i)
equity-based compensation expense (a portion of
which may become cash-based upon final vesting and settlement of awards should the holder elect net share settlement to satisfy income tax withholding), (ii) any unrealized gains or losses or other non-cash items
included in net income, (iii) unrealized income from
unconsolidated joint venture; (iv) foreign currency gains/losses (v) the non-cash amortization expense related to the reclassification of a portion of the senior convertible notes to stockholders’ equity in accordance
with GAAP. Please see slide 18 for a reconciliation of
Operating Earnings and Operating Earnings per Share to GAAP Net Income and GAAP Net Income per share. (2)
Includes Commercial Mortgage-Backed Securities,
(“CMBS”) held-to-maturity, which are net of a participation sold during June 2014. ARI presents the participation sold as both assets and non-recourse liabilities because the participation does not qualify as a sale
according to GAAP. At June 30, 2015,
ARI had one such participation sold with a carrying amount of $89,646. Subordinate loans also are net of a participation sold in February 2015. At June 30, 2015, this participation sold had a face amount of £20,000 and a
carrying amount of $31,345. (3)
Debt to common equity is net of participations sold. (4)
Fixed charge coverage is EBITDA divided by interest
expense plus the preferred stock dividends. |
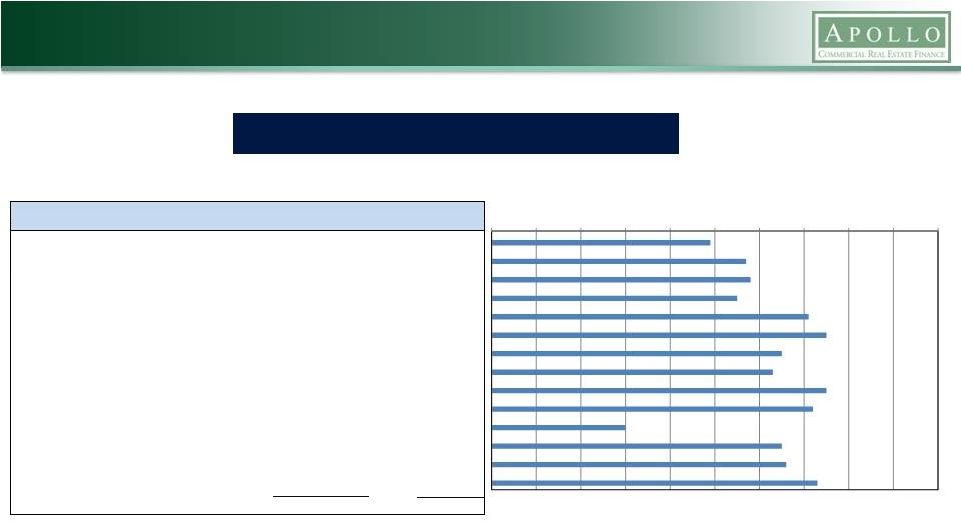
 $7,599 $11,187 $17,067 $19,403 $28,554 $9,683 $11,951 $17,233 $23,784 $32,817 $10,236 $13,236 $18,786 $26,570 $10,946 $12,303 $20,021 $27,049 $0 $15,000 $30,000 $45,000 $60,000 $75,000 $90,000 $105,000 2011 2012 2013 2014 2015 Historical Financial Overview 4 Operating Earnings ($000s) (1) Net Interest Income ($000s) Dividends per Share of Common Stock Operating Earnings per Share of Common Stock (1) $48,608 $61,371 $0.89 $0.88 $5,047 $8,796 $11,963 $13,991 $22,222 $7,086 $8,526 $11,721 $18,045 $26,385 $7,643 $9,218 $13,272 $20,768 $8,277 $7,376 $14,488 $21,179 $0 $15,000 $30,000 $45,000 $60,000 $75,000 $90,000 2011 2012 2013 2014 2015 $0.29 $0.42 $0.39 $0.37 $0.44 $0.40 $0.41 $0.31 $0.42 $0.45 $0.38 $0.44 $0.35 $0.44 $0.39 $0.27 $0.39 $0.45 $0.00 $0.40 $0.80 $1.20 $1.60 $2.00 2011 2012 2013 2014 2015 $0.40 $0.40 $0.40 $0.40 $0.44 $0.40 $0.40 $0.40 $0.40 $0.44 $0.40 $0.40 $0.40 $0.40 $0.40 $0.40 $0.40 $0.40 $0.00 $0.40 $0.80 $1.20 $1.60 $2.00 2011 2012 2013 2014 2015 Operating Earnings is a non-GAAP financial measure that is used by the Company to approximate cash available for distribution and is defined by the Company as net income available to common stockholders, computed in accordance with GAAP, adjusted for (i) equity-based compensation expense (a portion of which may become cash-based upon final vesting and settlement of awards should the holder elect net share settlement to satisfy income tax withholding), (ii) any unrealized gains or losses or other non-cash items included in net income, (iii) unrealized income from unconsolidated joint venture; (iv) foreign currency gains/(losses); and (v) the non-cash amortization expense related to the reclassification of a portion of the senior convertible notes to stockholders’equity in accordance with GAAP. Please see slide 18 for a reconciliation of Operating Earnings and Operating Earnings per Share to GAAP Net Income and GAAP Net Income per share. (1) |
 5 Q2 Financial Highlights Financial Results & Earnings Per Share Operating Earnings for the quarter ended June 30, 2015 of $26.4 million, or $0.45 per diluted share
of common stock, a 7.1% per share increase as compared
to Operating Earnings of $18.0 million, or
$0.42
per
diluted
share
of
common
stock
for
the
quarter
ended
June
30,
2014
(1)
–
Net interest income of $32.8 million
–
Total expenses of $5.9 million, comprised of management
fees of $3.9 million, G&A of $1.2 million and equity-based compensation of $0.8 million – Net income available to common stockholders for the quarter ended June 30, 2015 of $22.8 million, or $0.39
per diluted share of common
stock Dividends
Declared a dividend of $0.44 per share of common stock
for the quarter ending September 30, 2015
10.7% annualized dividend yield based on $16.40 closing
price on July 27, 2015 Declared a dividend
on the Company’s 8.625% Series A Cumulative Redeemable Perpetual Preferred Stock of $0.5391 per share for stockholders of record on June 30, 2015
Book Value
GAAP book value of $16.41 per share as of June 30,
2015 (1)
Operating
Earnings
is
a
non-GAAP
financial
measure
that
is
used
by
the
Company
to
approximate
cash
available
for
distribution
and
is
defined
by
the
Company
as
net
income
available
to
common
stockholders,
computed
in
accordance
with
GAAP,
adjusted
for
(i)
equity-based
compensation
expense
(a
portion
of
which
may
become
cash-based
upon
final
vesting
and
settlement
of
awards
should
the
holder
elect
net
share
settlement
to
satisfy
income
tax
withholding)
(ii)
any
unrealized
gains
or
losses
or
other
non-cash
items
included
in
net
income
(iii)
unrealized
income
from
unconsolidated
joint
venture;
(iv)
foreign
currency
gains/(losses);
and
(v)
the
non-cash
amortization
expense
related
to
the
reclassification
of
a
portion
of
the
senior
convertible
notes
to
stockholders’
equity
in
accordance
with
GAAP.
Please
see
slide
18
for
a
reconciliation
of
Operating
Earnings
and
Operating
Earnings
per
Share
to
GAAP
Net
Income
and
GAAP
Net
Income
per
share. |
 Q2 – New Investments and Funding 6 Summary of New Investments Quarter Ended 6/30/2015 6 Months Ended 6/30/2015 Number of Loans Closed 9 12 Capital Committed to New Loans ($ in thousands) $446,118 $553,321 Capital Deployed in New Loans ($ in thousands) $196,143 $296,617 Fixed Rate %/Floating Rate % (1) 6%/94% 8%/92% First Mortgage %/Subordinate Loan % (1) 11%/89% 15%/85% Weighted Average Loan-to-Value 54% 56% Weighted Average Levered IRR (2) 15% 15% Funding of Previously Closed Loans ($ in thousands) $51,483 $91,393 (1)
Based upon committed amount of loan. (2)
The Internal Rate of Return (“IRR”) for the investments shown in this
presentation reflect the returns underwritten by ACREFI Management, LLC, the Company’s external manager (the “Manager”), calculated on a weighted average basis assuming no
dispositions, early prepayments or defaults but assuming that extension options
are exercised and that the cost of borrowings remains constant over the remaining term. With respect to certain loans, the IRR calculation assumes certain estimates with respect to the timing and magnitude of future fundings for the remaining commitments and associated loan repayments, and assumes no
defaults. IRR is the annualized effective compounded return rate that accounts for the time-value of money and represents the rate of return on an investment over a holding period expressed as a percentage of the investment. It is the discount rate
that makes the net present value of all cash outflows (the costs of investment) equal to the net present value of cash inflows (returns on investment). It is derived from the negative and positive cash flows resulting from or produced by each
transaction (or for a transaction involving more than one investment, cash flows resulting from or produced by each of the investments), whether positive, such as investment returns, or negative, such as transaction expenses or other costs of investment, taking
into account the dates on which such cash flows occurred or are expected to occur, and compounding interest accordingly. There can be no assurance that the actual IRRs will equal the underwritten IRRs shown above. See “Item 1A—Risk
Factors—The Company may not achieve its underwritten internal rate of return on its investments which may lead to future returns that may be significantly lower than anticipated” included in the Company’s Annual Report on Form 10-K for the year
ended December 31, 2014 for a discussion of some of the factors that could adversely impact the returns received by the Company from the investments shown in the table over time. |
 7 Commercial Real Estate Debt Portfolio Overview Asset Type ($000s) Amortized Cost Borrowings Equity at Cost (1) Remaining Weighted Average Life (years) (2) Current Weighted Average Underwritten IRR (3) Fully-Levered Weighted Average Underwritten IRR (3)(4) First Mortgage Loans $ 704,040 $ 428,835
$ 275,205
3.1 Years
18.0%
18.0%
Subordinate
Loans
(5)(6)
894,926
15,613
847,968
3.7
13.4
13.4
CMBS
511,412
433,904
107,635
1.9
16.2
16.2
Investments at June 30, 2015
$ 2,110,378
$
878,352 $ 1,230,808
3.1 Years
14.6%
14.6%
(1)
CMBS includes $30.1 million of restricted cash related to
the Company’s master repurchase agreement with UBS AG (the “UBS Facility”).
(2) Remaining Weighted
Average Life assumes all extension options are exercised.
(3)
The underwritten IRR for the investments shown in this
table reflect the returns underwritten by the Manager, calculated on a weighted average basis assuming no dispositions, early prepayments or defaults but assuming that extension options
are exercised and that the cost of borrowings remains constant over the
remaining term. With respect to certain loans, the underwritten IRR calculation assumes certain estimates with respect to the timing and magnitude of future fundings for the remaining commitments and associated loan repayments, and assumes no defaults. IRR is the annualized effective compounded return rate
that accounts for the time-value of money and represents the rate of return on an investment over a holding period expressed as a percentage of the investment. It is the discount rate that makes the net present value of all cash outflows
(the costs of investment) equal to the net present value of cash inflows (returns on investment). It is derived from the negative and positive cash flows resulting from or produced by each transaction (or for a transaction involving more than one
investment, cash flows resulting from or produced by each of the investments), whether positive, such as investment returns, or negative, such as transaction expenses or other costs of investment, taking into account the dates on which such
cash flows occurred or are expected to occur, and compounding interest accordingly. There can be no assurance that the actual IRRs will equal the underwritten IRRs shown in the table. See “Item 1A—Risk Factors—The Company
may not achieve its underwritten internal rate of return on its investments which may lead to future returns that may be significantly lower than anticipated” included in the Company’s Annual Report on Form 10-K for the year ended December
31, 2014 for a discussion of some of the factors that could adversely impact the returns received by the Company from the investments shown in the table over time. (4)
Represents an underwritten levered weighted average IRR. The Company's
ability to achieve the underwritten levered weighted average IRR additionally depends upon the Company re-borrowing under the JPMorgan Facility or any replacement facility with similar terms with regard to its portfolio of first mortgage loans. Without such re-borrowing, the levered
weighted average underwritten IRR will be lower than the amount shown above, as indicated in the current weighted average underwritten IRR column. (5)
Subordinate loans include CMBS, held-to-maturity, which represents a
loan the Company closed during May 2014 that was subsequently contributed to a securitization during August 2014. During May 2014, the Company closed a $155,000 floating-rate whole loan secured by the first mortgage and equity interests in an entity that owns a resort hotel in Aruba. During
June 2014, the Company syndicated a $90,000 senior participation in the loan and retained a $65,000 junior participation. During August 2014, both the $90,000 senior participation and the Company's $65,000 junior participation were
contributed to a CMBS securitization. In exchange for contributing its $65,000 junior participation, the Company received a CMBS secured solely by the $65,000 junior participation. ARI presents the participation sold as both assets and
non-recourse liabilities because the participation does not qualify as a sale according to GAAP. At June 30, 2015, ARI had one such participation sold with a carrying amount of $89,646. (6)
Subordinate loans also are net of a participation sold during February
2015. The Company presents the participations sold as both assets and non-recourse liabilities because the participation does not qualify as a sale according to GAAP. At June
30, 2015, the Company had one such participation sold with a face amount of
£20,000 and a carrying amount of $31,345. |
 Commercial Real Estate Debt Portfolio Overview 8 Net Invested Equity at Amortized Cost Basis (1) Geographic Diversification by Net Equity Property Type by Net Equity (1) Subordinate loans include CMBS, held-to-maturity and are net of participations sold of $120,991. ARI presents the participations sold as both assets and non-recourse liabilities because the participation does not qualify as a sale according to GAAP. CMBS 9% First Mortgage Loans 22% Subordinate Loans 69% Securities 9% Residential - rental 13% Industrial 6% Hotel 18% Mixed Use 1% Office 3% Healthcare 8% Ski Resort 4% Retail 7% Residential - for sale 31% New York City 26% Northeast (excluding NYC) 4% Securities 9% Southeast 7% Mid-Atlantic 9% Midwest 13% West 13% Southwest 3% International 16% |
 Commercial Real Estate Loan Portfolio – Maturity and Type 9 Fully Extended Loan Maturities and Future Fundings (1)(2)(3)(4) (1) Based upon face amount of loans; Does not include CMBS, but does include CMBS, held-to-maturity. (2) Maturities reflect the fully funded amounts of the loans. (3) Subordinate loans include CMBS, held-to-maturity and are net of participations sold of $120,991. ARI presents the participations sold as both assets and non-recourse liabilities because the participation does not qualify as a sale according to GAAP. (4) Future funding dates are based upon the Manager’s projections and are subject to change. Loan Position and Rate Type (1)(3) 69% Floating Rate/31% Fixed Rate Senior Loan Fixed 9% Subordinate Loan Fixed 22% Subordinate Loan Floating 33% Senior Loan Floating 36% $112.6 $164.1 $294.5 $215.8 $536.4 $566.3 $50.0 $30.2 $32.0 $- $25.0 $222.7 $165.6 $56.1 $0 $100 $200 $300 $400 $500 $600 2015 2016 2017 2018 2019 2020 2021 2022 2023 2024 2025 Future funding commitment Fully extended maturity |
 Loan Portfolio – Loan Level LTV (Through Last Invested Dollar) 10 First Mortgage Loans Description ($ in thousands) Location Balance at 6/30/2015 Starting LTV Ending LTV First Mortgage - Destination homes Various 97,413 $
0%
49%
First Mortgage -
Retail
New York
85,770
$
0%
57%
First Mortgage -
Pre-development loan
New York
67,300
$
0%
58%
First
Mortgage
-
Retail
(1)
Ohio
67,000
$
0%
55%
First Mortgage -
Multifamily
North Dakota
56,542
$
0%
71%
First Mortgage -
Destination homes
New York/Hawaii
50,000
$
0%
75%
First
Mortgage
-
Condo
development
(2)
Maryland
50,000
$
0%
65%
First Mortgage -
Hotel portfolio
Various
45,400
$
0%
63%
First Mortgage -
Pre-development loan
Florida
45,000
$
0%
75%
First Mortgage -
Multifamily
New York
34,500
$
0%
72%
First
Mortgage
-
Condo
conversion
(3)
New York
34,190
$
0%
30%
First Mortgage -
Hotel
Pennsylvania
34,000
$
0%
65%
First
Mortgage
-
Condo
development
(4)
Maryland
26,000
$
0%
66%
First Mortgage -
Pre-development loan
Florida
16,800
$
0%
73%
Total/Weighted Average
709,915
$
61%
0%
10%
20%
30%
40%
50%
60%
70%
80%
90%
100%
(1)
LTV is based upon the fully committed loan amount of $165
million. (2)
LTV is based upon the fully committed loan amount of $80 million. (3)
This first mortgage loan is for the same property as the $30 million NYC
condo conversion mezzanine loan listed on page 11.
(4)
LTV is based upon the fully committed loan amount of $65.1
million. |
 11 Loan Portfolio – Loan Level LTV (Through Last Invested Dollar) Subordinate Financings Description ($ in thousands) Location Balance at 6/30/2015 Starting LTV Ending LTV Subordinate - Condo development (1) New York 81,602 $
32%
48%
Subordinate
-
Resort
hotel
(2)
Aruba
64,895
$
35%
60%
Subordinate
-
Condo
development
(3)
New York
64,595
$
50%
60%
Subordinate
-
Healthcare
portfolio
(4)
UK
54,100
$
51%
70%
Subordinate
-
Pre-development
loan
(5)
London
54,033
$
45%
78%
Subordinate -
Healthcare portfolio
Various
50,000
$
57%
62%
Subordinate -
Industrial portfolio
New York
45,000
$
61%
79%
Subordinate -
Pre-development loan
New York
44,000
$
48%
71%
Subordinate
-
Condo
development
(6)
New York
41,226
$
22%
42%
Subordinate -
Ski resort
California
40,000
$
36%
61%
Subordinate -
Hotel portfolio
Various
32,566
$
42%
48%
Subordinate -
Industrial portfolio
Various
32,000
$
65%
72%
Subordinate
-
Condo
conversion
(7)
New York
30,053
$
30%
57%
Subordinate -
Hotel
Arizona
25,000
$
46%
58%
Subordinate -
Hotel portfolio
Minnesota
24,334
$
56%
67%
Subordinate
-
Multifamily
(8)
Florida
22,000
$
66%
80%
Subordinate -
Hotel
Washington D.C.
20,000
$
61%
69%
Subordinate -
Hotel
New York
20,000
$
50%
61%
Subordinate -
Hotel
California
20,000
$
58%
74%
Subordinate
-
Multifamily/Condo/Hotel
(9)
Various
19,500
$
79%
90%
Preferred
Equity
-
Multifamily
(8)
Florida
15,500
$
80%
89%
Subordinate -
Ski resort
Montana
15,000
$
46%
59%
Subordinate -
Multifamily
New York
14,608
$
35%
47%
Subordinate -
Office
New York
14,000
$
61%
70%
Subordinate -
Office
Missouri
9,639
$
59%
69%
Subordinate -
Office
Michigan
8,782
$
41%
52%
Subordinate -
Mixed-use
North Carolina
6,525
$
62%
75%
Total/Weighted Average
868,958
$
64%
0%
10%
20%
30%
40%
50%
60%
70%
80%
90%
100%
(1)
LTV is based upon the fully funded
loan amount of $60 million plus PIK interest.
(2)
This is CMBS,
held-to-maturity and is net of a participation sold. ARI presents the participation sold as both assets and non-recourse liabilities because the participation does not qualify as a sale according to GAAP. At June 30, 2015,
this participation sold had a carrying amount of $89,646.
(3)
LTV is based upon the fully
committed loan amount of $105 million.
(4)
Based upon £34.4 face amount
converted to USD based upon the conversion rate on June 30, 2015, net of participation of $31,345.
(5)
Based upon £31.2 face amount plus PIK converted to
USD based upon the conversion rate on June 30, 2015.
(6)
LTV is based upon the fully funded
loan amount of $275 million. (7)
Loan is for the same property as the $34.1 million NYC
condo conversion first mortgage loan listed on page 10. LTV for the mezzanine loan is based upon the fully committed amount of $29.4 million plus PIK interest. (8)
Mezzanine loan and preferred equity are secured by the
same portfolio of properties. (9)
LTV is based upon the fully funded loan amount of $19.5
million. |
 12 CMBS Portfolio (1) Face Amortized Cost Remaining Weighted Average Life with Extensions (years) Estimated Fair Value Debt Net Equity at Cost (2) CMBS – Total $ 520,833
$
511,412 1.9 Years $
518,851
$
433,904
$
107,635 CUSIP Description 92978PAJ8 WBCMT 2006-C29 AJ 07388QAH2 BSCMS 2007-PW17 AJ 07401DAH4 BSCMS 2007PW18 AJ 46625YVZ3 JPMCC 2005-CB13 AJ 50180CAG5 LBUBS 2006-C7 AJ 60688CAJ5 MLCFC 2007-9 AJ 05947US25 BACM 2005-3 AJ 61756UAJ0 MSC 2007-1Q16 AJ 46629YAH2 JPMCC 2007-CB18AJ 173311QAE0 CGCMT 2007-C6 AJFX CUSIP Description 59025KAG7 MLMT 2007-C1 AM 22546BAH3 CSMC 2007-C5 AM 36159XAH3 GECMC 2007-C1 AM 46627QBC1 JMPCC 2006-CB15 AM 46631BAJ4 JPMCC 2007-LD11 AM 14986DAJ9 CD 2006-CD3 AJ 17311QBN9 CGCMT 2007-C6 AJ 17313KAK7 CGCMT 2008-C7 AJ 20047QAH8 COMM 2006-C7 AJ 61755YAK0 MSC 2007-IQ15 AJ (1)
Does not include CMBS, held-to-maturity.
(2)
Includes $30.1 million of restricted cash related to the
UBS Facility |
 Portfolio Metrics – Quarterly Migration Summary 13 (1)
Subordinate loans include CMBS, held-to-maturity
and are net of participations sold of $120,991. ARI presents the participations sold as both assets and non-recourse liabilities because the participation does not qualify as a sale according to GAAP.
(2)
The underwritten IRR for the investments shown in
this presentation reflect the returns underwritten by the Manager, calculated on a weighted average basis assuming no dispositions, early prepayments or defaults but assuming that extension options are exercised and that
the cost of borrowings remains constant over the
remaining term. With respect to certain loans, the underwritten IRR calculation assumes certain estimates with respect to the timing and magnitude of future fundings for the remaining commitments and associated loan
repayments, and assumes no defaults. IRR is the
annualized effective compounded return rate that accounts for the time-value of money and represents the rate of return on an investment over a holding period expressed as a percentage of the investment. It is the discount
rate that makes the net present value of all cash
outflows (the costs of investment) equal to the net present value of cash inflows (returns on investment). It is derived from the negative and positive cash flows resulting from or produced by each transaction (or for a
transaction involving more than one investment, cash
flows resulting from or produced by each of the investments), whether positive, such as investment returns, or negative, such as transaction expenses or other costs of investment, taking into account the dates on which
such cash flows occurred or are expected to occur, and
compounding interest accordingly. There can be no assurance that the actual IRRs will equal the underwritten IRRs shown in the table. See “Item 1A—Risk Factors—The Company may not achieve its underwritten
internal rate of return on its investments which may lead
to future returns that may be significantly lower than anticipated” included in the Company’s Annual Report on Form 10-K for the year ended December 31, 2014 for a discussion of some of the factors that could
adversely impact the returns received by the Company from
the investments shown in the table over time (3)
Does not include CMBS.
(4)
Includes $30.1 million of restricted cash related to the
UBS Facility. (5)
Includes $30.1 million of restricted cash related to the
UBS Facility and $26.5 million related to investments purchased not yet settled. (6)
Represents an underwritten levered weighted average
IRR. The Company's ability to achieve the underwritten levered weighted average IRR additionally depends upon the Company re-borrowing under the JPMorgan Facility or any replacement facility with similar terms
with regard to its portfolio of first mortgage
loans. Without such re-borrowing, the levered weighted average underwritten IRR will be lower than the amount shown above, as indicated in the current weighted average underwritten IRR column on slide 7. (7)
Net of participations
sold.
Portfolio Metrics ($ in thousands)
Q2 2015
Q1 2015
Q4 2014
Q3 2014
Q2 2014
(Investment balances represent amortized
cost) First Mortgage Loans
704,040
$
563,390
$
458,520
$
369,924
$
343,810
$
Subordinate Loans
(1)
894,926
736,838
625,881
650,084
659,045
CMBS
511,412
510,740
534,222
511,445
339,724
Total Investments
2,110,378
$
1,810,968
$
1,618,623
$
1,531,453
$
1,342,579
$
(Investment balances represent net equity, at
cost) First Mortgage Loans
275,205
$
421,862
$
290,396
$
247,202
$
197,112
$
Subordinate Loans
(1)
847,968
707,201
625,881
650,084
659,045
CMBS
107,635
(4)
106,963
(4)
110,279
(4)
99,988
(5)
70,325
(4)
Net Equity in Investments at Cost
1,230,808
$
1,236,026
$
1,026,556
$
997,274
$
926,482
$
Levered Weighted Average Underwritten
IRR (2)
14.6%
(6)
14.2%
(6)
13.4%
(6)
13.7%
(6)
13.9%
(6)
Weighted Average Duration
3.1 Years
3.0 Years
3.2 Years
3.0 Years
3.2 Years
Loan Portfolio Weighted Average Ending LTV
(3)
62.0%
62.0%
62.0%
58.0%
58.0%
Borrowings Under Repurchase Agreements
878,352
$
575,433
$
622,194
$
537,766
$
446,224
$
Convertible Senior Notes
247,305
$
246,881
$
246,464
$
246,054
$
139,362
$
Debt-to-Common Equity
1.2x
(7)
0.9x
(7)
1.2x
(7)
1.1x
(7)
0.8x
(7) |
 Financing Overview and Interest Rate Sensitivity
14
Facility ($000s)
Debt Balance
Weighted Average
Remaining
Maturity
(1)
Weighted
Average Rate
UBS Facility
$
133,899 3.2 Years 2.8% Deutsche Bank Facility 300,005 2.8 3.7 JPMorgan Facility 395,572 2.6 2.5 Goldman Sachs Loan 48,876 3.8 3.7 Total Borrowings at June 30, 2015 $
878,352 2.7 Years
3.7%
Variable Rate Investments & Liabilities
Variable Rate Liabilities
(1)
Assumes extension options on the UBS
Facility are exercised. (2)
Based upon the Company’s portfolio as of June 30,
2015, any such hypothetical impact on interest rates on the Company’s variable rate borrowings does not consider the effect of any change in overall economic activity that could occur in a rising interest rate
environment. Further, in the event of a change in
interest rates of that magnitude, the Company may take actions to further mitigate the Company’s exposure to such a change. However, due to the uncertainty of the specific actions that would be taken and their
possible effects, this analysis assumes no changes in the
Company’s financial structure. $1,202,245 $(485,903) $716,342 Variable Rate Assets Net Equity ARI anticipates a 0.5% increase in LIBOR results in approximately a $0.05 per diluted share of common stock increase in Operating Earnings annually (2) |
 15 Financials |
 16 Consolidated Balance Sheets (in thousands—except share and per share data)
June 30, 2015
December 31, 2014
Assets:
(Unaudited)
Cash
48,848
$
40,641
$
Restricted cash
34,547
30,127
Securities available-for-sale, at estimated fair
value -
17,105
Securities, at estimated fair value
518,851
522,730
Securities, held-to-maturity
154,391
154,283
Commercial mortgage loans, held for
investment 704,040
458,520
Subordinate loans, held for investment
830,181
561,182
Investment in unconsolidated joint venture
20,021
37,016
Derivative assets
262
4,070
Interest receivable
12,817
10,829
Deferred financing costs, net
8,898
7,444
Other assets
582
1,200
Total Assets
2,333,438
$
1,845,147
$
Liabilities and
Stockholders' Equity
Liabilities:
Borrowings under repurchase agreements
878,352
$
622,194
$
Convertible senior notes, net
247,305
246,464
Participations sold
120,991
89,584
Derivative liabilities
2,109
-
Accounts payable and accrued expenses
8,253
7,578
Payable to related party
3,890
3,240
Dividends payable
27,694
21,018
Total Liabilities
1,288,594
990,078
Stockholders' Equity:
Preferred stock, $0.01 par value, 50,000,000 shares
authorized and 3,450,000 shares issued and outstanding in 2015 and 2014 ($86,250 aggregate liquidation preference)
35
35
Common stock, $0.01 par value, 450,000,000 shares
authorized 58,429,155 and 46,900,442 shares issued and outstanding in 2015 and 2014, respectively 584 469 Additional paid-in-capital 1,062,857 868,035 Retained earnings (accumulated deficit) (15,965) (10,485) Accumulated other comprehensive loss (2,667) (2,985) Total Stockholders' Equity 1,044,844 855,069 Total Liabilities and Stockholders' Equity 2,333,438 $
1,845,147
$
|
 17 Consolidated Statements of Operations June 30, 2015 June 30, 2014 June 30, 2015 June 30, 2014 Net interest income: Interest income from securities 8,265 $
4,366
$
16,553
$
6,785
$
Interest income
from securities, held to maturity
3,349
-
6,394
-
Interest income from commercial mortgage
loans 11,968
6,438
22,061
10,449
Interest income from subordinate loans
21,152
18,238
39,762
32,968
Interest expense
(11,917)
(5,258)
(23,399)
(7,015)
Net interest income
32,817
23,784
61,371
43,187
Operating expenses:
General and administrative expenses (includes $821 and
$1,939 of equity-based compensation in
2015 and $362 and $788 in 2014,
respectively)
(2,059)
(1,479)
(4,414)
(2,921)
Management fees to related party
(3,887)
(2,966)
(7,228)
(5,531)
Total operating expenses
(5,946)
(4,445)
(11,642)
(8,452)
Income from unconsolidated joint venture
384
-
384
-
Interest income from cash balances
6
4
16
4
Realized loss on sale of securities
-
-
(443)
-
Unrealized gain on securities
(2,273)
4,749
1,136
6,934
Foreign currency gain
2,867
959
5,588
959
Loss on derivative instruments
(3,197)
(1,093)
(6,241)
(1,093)
Net income
24,658
$
23,958
$
50,169
$
41,539
$
Preferred dividends
(1,860)
(1,860)
(3,720)
(3,720)
Net income available to common stockholders
22,798
$
22,098
$
46,449
$
37,819
$
Basic and diluted net income per share of
common stock
0.39
$
0.51
$
0.85
$
0.94
$
Basic
weighted average shares of common stock outstanding 58,429,155 42,888,747 54,020,978 40,021,722 Diluted weighted average shares of common stock outstanding
59,022,217
43,099,354
54,621,401
40,236,109
Dividend declared per share of common stock
0.44
$
0.40
$
0.88
$
0.80
$
Three months
ended Six months ended
|
 18 Reconciliation of Operating Earnings to Net Income
June 30, 2015
Earnings Per Share
(Diluted)
June 30, 2014
Earnings Per Share
(Diluted)
Operating Earnings:
Net income available to common stockholders
46,449
$
0.85 $
37,819
$
0.94 $
Adjustments:
Equity-based compensation expense
1,939
0.04
788
0.02
Unrealized gain on securities
(1,136)
(0.02)
(6,934)
(0.17)
Unrealized loss on derivative instruments
6,241
0.11
1,093
0.03
Foreign currency gain
(5,588)
(0.10)
(959)
(0.02)
Amortization of convertible senior notes related to
equity reclassification 1,087
0.02
229
-
Income from unconsolidated joint venture
(384)
(0.01)
-
-
Total adjustments:
2,159
0.04
(5,783)
(0.14)
Operating Earnings
48,608
$
0.89 $
32,036
$
0.80 $
Basic weighted
average shares of common stock outstanding
54,020,978
40,021,722
Diluted weighted average shares of common stock
outstanding 54,621,401
40,236,109
Six Months Ended
June 30, 3025
Earnings Per Share
(Diluted)
June 30, 2014
Earnings Per Share
(Diluted)
Operating Earnings:
Net income available to common stockholders
22,798
$
0.39 $
$22,098
0.51
$
Adjustments: Equity-based compensation expense 821 0.01 362 0.01 Unrealized (gain)/loss on securities 2,273 0.04 (4,749) (0.11) Unrealized loss on derivative instruments 3,197 0.06 1,093 0.03 Foreign currency gain (2,867) (0.05) (959) (0.02) Amortization of convertible senior notes related to equity reclassification
547
0.01
200
-
Income from unconsolidated joint venture
(384)
(0.01)
-
-
Total adjustments:
3,587
0.06
(4,053)
(0.09)
Operating Earnings
26,385
$
0.45 $
18,045
$
0.42 $
Basic weighted
average shares of common stock outstanding
58,429,155
42,888,747
Diluted weighted average shares of common stock
outstanding 59,022,217
43,009,354
Three Months Ended |
 19 Financial Metrics – Quarterly Migration Summary Financial Metrics ($ in thousands, except per share data) Q2 2015 Q1 2015 Q4 2014 Q3 2014 Q2 2014 Net Interest Income 32,817 $
28,554
$
27,049
$
26,570
$
23,784
$
Management Fee
3,887
3,341
3,236
3,193
2,966
General and Administrative Costs
1,238
1,238
1,315
1,126
1,117
Non-Cash Stock Based Compensation
821
1,117
481
308
362
Net Income Available to Common Stockholders
22,798
$
23,653
$
20,182
$
17,299
$
22,098
$
GAAP Diluted EPS
0.39
$
0.47
$
0.43
$
0.37
$
0.51
$
Operating
Earnings (1)
26,385
$
22,222
$
21,179
$
20,768
$
18,045
$
Operating Diluted EPS
(1)
0.45
$
0.44
$
0.45
$
0.44
$
0.42
$
Distributions Declared
to Common Stockholders 0.44
$
0.44
$
0.40
$
0.40
$
0.40
$
GAAP Book Value per
Share of Common Stock 16.41
$
16.44
$
16.39
$
16.42
$
16.30
$
Total Stockholders'
Equity 1,044,844
$
1,046,482
$
855,069
$
855,686
$
849,998
$
Diluted weighted average shares of common
stock outstanding 59,022,217
50,171,687
47,085,617
47,068,929
43,099,354
Return on Common Equity Based on Operating
Earnings (2)
11.0%
10.9%
11.0%
10.8%
10.6%
(1)
Operating Earnings is a non-GAAP
financial measure that is used by the Company to approximate cash available for distribution and is defined by the Company as net income available to common stockholders, computed in accordance with GAAP, adjusted for (i) equity-based compensation expense (a portion of which may
become cash-based upon final vesting and settlement of awards should the holder elect net share settlement to satisfy income tax withholding) (ii) any unrealized gains or
losses or other non-cash items included in net income (iii) unrealized income from unconsolidated joint venture; (iv) foreign currency gains or losses; and (v) the non-cash amortization expense related to the reclassification of a portion of the
senior convertible notes to stockholders’ equity in accordance with GAAP. Please see slide 18 for a reconciliation of Operating Earnings and Operating Earnings per Share to GAAP net income and GAAP net income per share.
(2)
Return on common equity is
calculated as annualized Operating Earnings for the period as a percentage of average stockholders’ equity for the period. |
Serious News for Serious Traders! Try StreetInsider.com Premium Free!
You May Also Be Interested In
- 420 with CNW — Study Enumerates Therapeutic Effects, Quality of Life Benefits of Medical Cannabis
- Blackwell 3D Acquires Operating Dubai LLC, Inches Closer to Project Readiness
- Tenaris Announces 2024 First Quarter Results
Create E-mail Alert Related Categories
SEC FilingsSign up for StreetInsider Free!
Receive full access to all new and archived articles, unlimited portfolio tracking, e-mail alerts, custom newswires and RSS feeds - and more!
