

Form 8-K KCG Holdings, Inc. For: May 20
 Tweet
Tweet Share
Share
UNITED STATES
SECURITIES AND EXCHANGE COMMISSION
Washington, D.C. 20549
FORM 8-K
CURRENT REPORT
Pursuant to Section 13 or 15(d)
of the Securities Exchange Act of 1934
Date of Report (Date of earliest event reported): May 20, 2015
KCG HOLDINGS, INC.
(Exact name of registrant as specified in its charter)
| DELAWARE | 000-54991 | 38-3898306 | ||
| (State or other jurisdiction of incorporation) |
(Commission File Number) |
(IRS Employer Identification No.) |
545 Washington Boulevard, Jersey City, NJ 07310
(Address of principal executive offices) (Zip Code)
(201) 222-9400
(Registrant’s telephone number, including area code)
Check the appropriate box below if the Form 8-K filing is intended to simultaneously satisfy the filing obligation of the registrant under any of the following provisions (see General Instruction A.2. below):
| ¨ | Written communications pursuant to Rule 425 under the Securities Act (17 CFR 230.425) |
| ¨ | Soliciting material pursuant to Rule 14a-12 under the Exchange Act (17 CFR 240.14a-12) |
| ¨ | Pre-commencement communications pursuant to Rule 14d-2(b) under the Exchange Act (17 CFR 240.14d-2(b)) |
| ¨ | Pre-commencement communications pursuant to Rule 13e-4(c) under the Exchange Act (17 CFR 240.13e-4(c)) |
Item 7.01 Regulation FD Disclosure
Exhibit 99.1 is a copy of a slide presentation to be used by Daniel Coleman, Chief Executive Officer of KCG Holdings, Inc. (“KCG”), at the Barclays Americas Select Franchise Conference held on May 20, 2015. The presentation will be webcast live at http://cc.talkpoint.com/barc002/051915a_ae/?entity=20_UYBMW2P (as announced by a press release dated May 18, 2015). A replay of Mr. Coleman’s presentation will be archived at http://investors.kcg.com. Exhibit 99.1 is incorporated by reference under this Item 7.01. In accordance with general instruction B.2. of Form 8-K, the slides are being furnished pursuant to Item 7.01 and the information contained therein shall not be deemed “filed” for purposes of Section 18 of the Securities and Exchange Act of 1934.
Item 9.01 Financial Statements and Exhibits
(d)
Exhibit 99.1 – Slide Presentation for Barclays Americas Select Franchise Conference held on May 20, 2015.
Certain statements contained herein may constitute “forward-looking statements” within the meaning of the safe harbor provisions of the U.S. Private Securities Litigation Reform Act of 1995. Forward-looking statements are typically identified by words such as “believe,” “expect,” “anticipate,” “intend,” “target,” “estimate,” “continue,” “positions,” “prospects” or “potential,” by future conditional verbs such as “will,” “would,” “should,” “could” or “may,” or by variations of such words or by similar expressions. These “forward-looking statements” are not historical facts and are based on current expectations, estimates and projections about KCG’s industry, management’s beliefs and certain assumptions made by management, many of which, by their nature, are inherently uncertain and beyond our control. Any forward-looking statement contained herein speaks only as of the date on which it is made. Accordingly, readers are cautioned that any such forward-looking statements are not guarantees of future performance and are subject to certain risks, uncertainties and assumptions that are difficult to predict including, without limitation, risks associated with: (i) the strategic business combination (the “Mergers”) of Knight Capital Group, Inc. (“Knight”) and GETCO Holding Company, LLC (“GETCO”), including, among other things, (a) difficulties and delays in integrating the Knight and GETCO businesses or fully realizing cost savings and other benefits, (b) the inability to sustain revenue and earnings growth, and (c) customer and client reactions to the Mergers; (ii) the August 1, 2012 technology issue that resulted in Knight’s broker-dealer subsidiary sending numerous erroneous orders in NYSE-listed and NYSE Arca securities into the market and the impact to Knight’s business as well as actions taken in response thereto and consequences thereof; (iii) the sales of KCG’s reverse mortgage origination and securitization business, KCG’s futures commission merchant and KCG Hotspot; (iv) changes in market structure, legislative, regulatory or financial reporting rules, including the increased focus by regulators, the New York Attorney General, Congress and the media on market structure issues, and in particular, the scrutiny of high frequency trading, alternative trading systems, market fragmentation, colocation, access to market data feeds, and remuneration arrangements such as payment for order flow and exchange fee structures; (v) past or future changes to KCG’s organizational structure and management; (vi) KCG’s ability to develop competitive new products and services in a timely manner and the acceptance of such products and services by KCG’s customers and potential customers; (vii) KCG’s ability to keep up with technological changes; (viii) KCG’s ability to effectively identify and manage market risk, operational and technology risk, legal risk, liquidity risk, reputational risk, counterparty and credit risk, international risk, regulatory risk, and compliance risk; (ix) the cost and other effects of material contingencies, including litigation contingencies, and any adverse judicial, administrative or arbitral rulings or proceedings; (x) the effects of increased competition and KCG’s ability to maintain and expand market share; and (xi) the completion of the tender offer commenced by KCG on May 4, 2015. The list above is not exhaustive. Readers should carefully review the risks and uncertainties disclosed in KCG’s reports with the SEC, including, without limitation, those detailed under “Risk Factors” in KCG’s Annual Report on Form 10-K for the year-ended December 31, 2014, Quarterly Report on Form 10-Q for the quarter-ended March 31, 2015, and other reports or documents KCG files with, or furnishes to, the SEC from time to time.
SIGNATURE
Pursuant to the requirements of the Securities Exchange Act of 1934, the Registrant has duly caused this report to be signed on its behalf by the undersigned’s duly authorized signatory.
Dated: May 20, 2015
| KCG HOLDINGS, INC. | ||
| By: | /s/ John McCarthy | |
| Name: | John McCarthy | |
| Title: | General Counsel | |
EXHIBIT INDEX
| Exhibit No. |
Description | |
| 99.1 | Slide Presentation for Barclays Americas Select Franchise Conference held on May 20, 2015. |
 KCG Holdings, Inc. (NYSE: KCG)
Barclays Americas Select Franchise Conference, London
May 20, 2015
Exhibit 99.1 |
 Safe Harbor
Certain statements contained herein may constitute "forward-looking
statements" within the meaning of the safe harbor provisions of the U.S.
Private Securities Litigation Reform Act of 1995. Forward-looking statements
are typically identified by words such as "believe," "expect,"
"anticipate," "intend," "target," "estimate,"
"continue," "positions," "prospects" or "potential," by future conditional verbs such as "will," "would,"
"should,"
"could"
or
"may,"
or
by
variations
of
such
words
or
by
similar
expressions.
These
"forward-looking
statements"
are
not
historical
facts
and
are
based
on
current
expectations,
estimates
and
projections
about
KCG's
industry,
management's
beliefs
and
certain
assumptions
made
by
management, many of which, by their nature, are inherently uncertain and beyond
our control. Any forward-looking statement contained herein speaks
only as of the date on which it is made. Accordingly, readers are cautioned that any such forward-looking statements are not guarantees of
future performance and are subject to certain risks, uncertainties and
assumptions that are difficult to predict including, without limitation, risks
associated with: (i) the strategic business combination (the "Mergers")
of Knight Capital Group, Inc. ("Knight") and GETCO Holding Company,
LLC ("GETCO"), including, among other things, (a) difficulties and delays
in integrating the Knight and GETCO businesses or fully realizing cost
savings
and
other
benefits,
(b)
the
inability
to
sustain
revenue
and
earnings
growth,
and
(c)
customer
and
client
reactions
to
the
Mergers;
(ii)
the
August 1, 2012 technology issue that resulted in Knight's broker-dealer
subsidiary sending numerous erroneous orders in NYSE-listed and NYSE
Arca securities into the market and the impact to Knight's business as well as
actions taken in response thereto and consequences thereof; (iii) the
sales
of
KCG's
reverse
mortgage
origination
and
securitization
business,
KCG's
futures
commission
merchant
and
KCG
Hotspot;
(iv)
changes
in
market
structure,
legislative,
regulatory
or
financial
reporting
rules,
including
the
increased
focus
by
regulators,
the
New
York
Attorney
General,
Congress and the media on market structure issues, and in particular, the
scrutiny of high frequency trading, alternative trading systems, market
fragmentation, colocation, access to market data feeds, and remuneration
arrangements such as payment for order flow and exchange fee
structures;
(v)
past
or
future
changes
to
KCG’s
organizational
structure
and
management;
(vi)
KCG's
ability
to
develop
competitive
new
products
and services in a timely manner and the acceptance of such products and services
by KCG's customers and potential customers; (vii) KCG's ability to keep up
with technological changes; (viii) KCG's ability to effectively identify and manage market risk, operational and technology risk, legal
risk,
liquidity
risk,
reputational
risk,
counterparty
and
credit
risk,
international
risk,
regulatory
risk,
and
compliance
risk;
(ix)
the
cost
and
other
effects of material contingencies, including litigation contingencies, and any
adverse judicial, administrative or arbitral rulings or proceedings; (x)
the effects of increased competition and KCG's ability to maintain and expand
market share; and (xi) the completion of the tender offer commenced by KCG
on May 4, 2015. The list above is not exhaustive. Readers should carefully review the risks and uncertainties disclosed in
KCG's
reports
with
the
SEC,
including,
without
limitation,
those
detailed
under
"Risk
Factors"
in
KCG's
Annual
Report
on
Form
10-K
for
the
year-
ended December 31, 2014, Quarterly Report on Form 10-Q for the
quarter-ended March 31, 2015, and other reports or documents KCG files with,
or furnishes to, the SEC from time to time.
For additional disclosures, please see
https://www.kcg.com/legal/global-disclosures. |
 Investment Rationale
1.
A better model for the emerging competitive landscape –
agile, scalable,
pure-play, execution-only, non-bank
2.
A developer of advanced technologies driving the shift in trading from analog
to digital across asset classes
3.
Prospects for multiyear organic growth direct from core capabilities
4.
Strong cash flow generation and early record of capital return
5.
Long-term growth opportunities from the after effects of new regulations
instituted in response to the global financial crisis of 2008
1 |
 The KCG Model
Market
Making
Agency
Execution
Trading
Venues
KCG helps retail and institutional investors
efficiently buy and sell liquid financial assets
around the world.
Direct-to-client and non-client,
exchange-based market making
Agency-based trading
on behalf of clients
Agency-based trading between
principals to transactions
2
A leading, independent global securities firm
dedicated exclusively to trading
Developer of advanced technologies applicable to
market making, agency execution and trading
venues in multiple asset classes
Delivers consistent, high-quality trade executions
that drive trading performance for retail and
institutional investors
Contributes to better price discovery, deeper
liquidity, tighter spreads and lower costs for all
market participants |
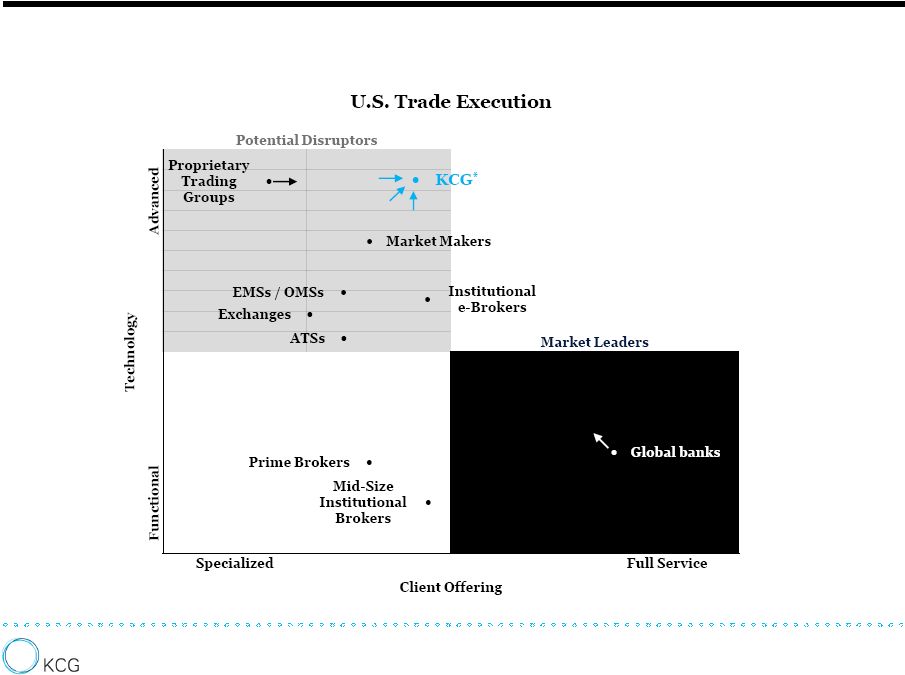 The Competitive Landscape
* KCG Holdings, Inc. was formed July 1, 2013 by the merger of GETCO Holding
Company, LLC and Knight Capital Group, Inc. 3
|
 Integration and Restructuring Activities
3Q13
4Q13
1Q14
2Q14
3Q14
4Q14
1Q15
2Q15
4
Closing of sale of
Urban Financial
(12/2)
Inception of share
repurchase
program
(5/2)
U.K. broker-dealer
consolidation
(7/1)
Debt refinancing into
$500 mn Sr Secured
Notes due in 2020 (3/13)
Full prepayment
of $535 mn first
lien credit facility
(4/15)
U.S. broker-dealer
consolidation
(1/2)
Appointment of
Steffen Parratt
as CFO (1/6)
Announcement
of modified
Dutch auction
tender offer
(5/1)
A 35% reduction in
headcount since the
merger close to 1,038
full-time employees
(3/31)
Appointment of Philip
Allison as CEO of KCG
Europe Ltd (9/22)
Realization of the estimated
merger-related cost synergies
of $110 mn on an annualized
run-rate basis (12/31)
Closing of sale of
KCG Futures
(12/1)
Appointment of
Charles Haldeman
as Non-Executive
Chairman of the
Board (10/30)
Consolidation of legacy
alternative trading
systems (8/4)
Reorganization of
KCG Europe Ltd
(10/28)
Closing of sale of
KCG Hotspot (3/13) |
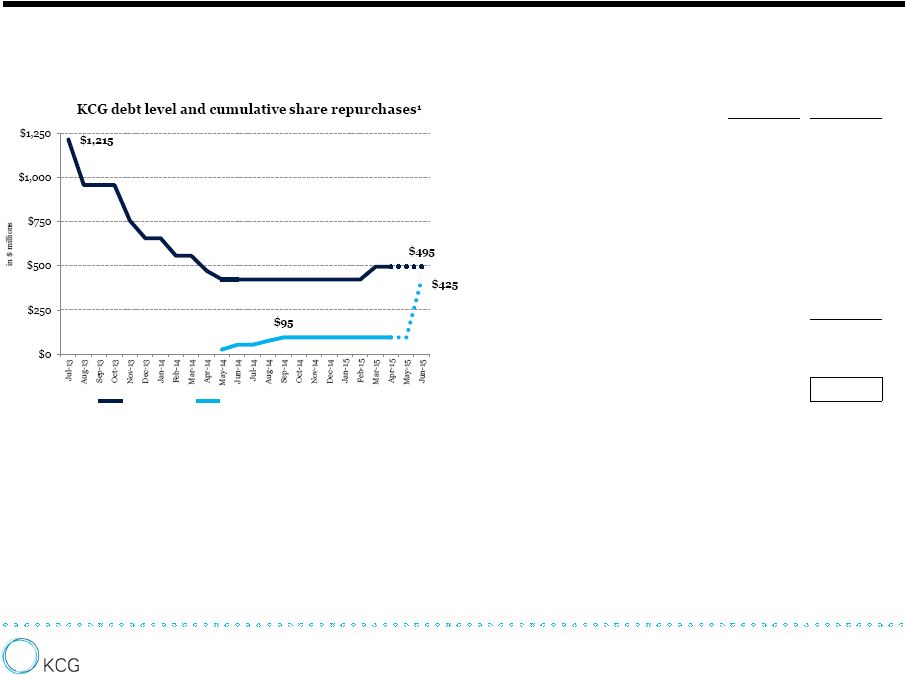 Cash Management: Deleveraging to Capital Return
Debt level
Cumulative share repurchases
Cash
(in $ millions)
Sources
Uses
Approximate cash and cash equivalents
at July 1, 2013²
$ 730
Asset sales³
304
Free
cash
flow
278
Debt
repayments
857
Funds
received
from
issuance
of
debt,
net
6
488
Distributions
from
investments,
net
58
Share
repurchases
8
95
Tender
Offer
330
Subtotal
575
Targeted liquidity pool of cash and highly-liquid
instruments
350
Approximate
remaining
cash
$ 225
NOTE: Totals may not add due to rounding
1
Debt level and share repurchases for May 2015 and June 2015 assume no principal
debt prepayments are made and the $330 million modified Dutch auction tender offer is fully subscribed
2
Represents the aggregate cash and cash equivalents held by GETCO Holding Company,
LLC and Knight Capital Group, Inc. at June 30, 2013; also factors in cash activity related to the Mergers on 7/1 including issuance of $535 million First
Lien Credit Facility, contribution of $55 million from GA offset
by payment to Knight shareholders of $720 million, funding of escrow account to
paydown Knight Convertibles of $375 million, payment of debt (and interest on debt) on GETCO's
books and fees on Merger-related debt issuances
3
Asset sales represent aggregate cash received to date from sales of Urban
Financial of America, KCG's futures commission merchant (FCM) and KCG Hotspot, less estimated taxes payable on the applicable gains and excluding all future
consideration
4
Free cash flow represents income from continuing operations less capital
expenditures plus non-cash items such as depreciation and amortization, stock-based compensation and non-GAAP adjustments included in Regulation G tables
5
Debt repayments represents total cash used to repay 8.25% $305 million Senior
Secured Notes plus its make-whole premium plus $535 million First Lien Credit Facility ($117
million of the paydown of this facility came from the Collateral
Account funded on 7/1; $117 million of KCG's cash was then used for the repayment
of the remaining principal outstanding of KCG's Convertible Notes 6
Funds received from issuance of debt, net represents issuance of 6.875% $500
million Senior Secured Notes, net of fees paid to third parties directly attributable to the debt issuance
7
Distributions from investments, net represents cash received as
returns on capital related to KCG's investments, net of additional investments
made 8
Represents share repurchases under the initial $150 million share repurchase
program authorized by the KCG Board of Directors on May 1, 2014 9
Represents the maximum amount available for share repurchases under the modified
Dutch auction tender offer announced in May 2015. 10
Targeted liquidity pool, as described in KCG's SEC filings within Item 3
‘Quantitative and Qualitative Disclosures About Market Risk’
11
Represents cash in excess of the targeted liquidity pool, a portion of which is
contained in Cash and cash equivalents and the remainder is used to fund
daily operations and contained elsewhere on the balance sheet including within Receivable from brokers, dealers and clearing organizations
5
5
7
9
11
4
10 |
 Consolidated Financials
6
Compensation and benefits
Communications and data processing
Depreciation and amortization
Debt interest expense
Professional fees
Occupancy and equipment rentals
Business development
Other
KCG balance sheet
As of March 31, 2015
(in $ millions)
Cash and cash equivalents
990.5
Debt³
799.8
Stockholders’
equity
1,783.3
-
-
-
Debt-to-tangible
equityratio
4
0.30
-
-
-
Bookvalue
per
share
5
$15.10
Tangible
book
value
per
share
5
$13.86
1
See addendum for a reconciliation of GAAP to non-GAAP financial results;
quarterly averages are derived from totals provided in the charts
2
Free cash flow represents income from continuing operations less capital
expenditures plus non-cash items such as depreciation and
amortization, stock-based compensation and non-GAAP adjustments
included in the Regulation G tables
3
Debt at March 31, 2015 included the 8.25% $305 million Senior Secured Notes,
which were redeemed subsequent to the quarter close using funds held in
escrow 4
Debt-to-tangible equity ratio at March 31, 2015 excludes the 8.25% $305
million Senior Secured Notes redeemed subsequent to the quarter close;
tangible equity is calculated by subtracting goodwill and intangible
assets from equity 5
Tangible book value is calculated by subtracting goodwill and intangible assets
from equity; based on shares outstanding of 118.1 million, including
restricted stock units (RSUs) Non-GAAP pre-tax income from
continuing operations Free cash flow from operating
income² |
 Prospects for Multiyear Organic Growth
7
Market
Making
Agency
Execution
Trading
Venues
Market Making:
Agency Execution:
Trading Venues:
Incremental market share gains in U.S. equities from
strategic clients and expanded capabilities,
Market making in fixed income, currencies and
commodities on a global basis,
Building out the client network in Europe
Expansion of algorithmic trading among U.S.
and European asset managers,
The continued growth of ETF assets under
management and trading volume,
The potential for unbundling
Expansion of the KCG BondPoint offering for
institutional clients
Industry consolidation among ATSs |
 |
 Regulation G Reconciliation of Non-GAAP
Financial Measures (Continuing Operations)
3 months ended March 31, 2015
Market Making
Global Execution
Services
Corporate and
Other
Consolidated
Reconciliation
of
GAAP
pre-tax
to
non-GAAP
pre-tax:
GAAP
income
(loss)
from
continuing
operations
before
income
taxes
$ 39,340
$ 381,058
$ (14,270)
$ 406,128
Gain
on
sale
of
KCG
Hotspot
-
(385,026)
-
(385,026)
Professional
fees
related
to
sale
of
KCG
Hotspot
-
6,736
-
6,736
Compensation
expense
related
to
sale
of
KCG
Hotspot
-
4,457
-
4,457
Lease
loss
accrual,
net
-
-
132
132
Non-GAAP
income
(loss)
from
continuing
operations
before
income
taxes
$ 39,340
$ 7,225
$ (14,138)
$ 32,427
9 |
 Regulation G Reconciliation of Non-GAAP
Financial Measures (Continuing Operations)
3 months ended December 31, 2014
Market Making
Global Execution
Services
Corporate and
Other
Consolidated
Reconciliation
of
GAAP
pre-tax
to
non-GAAP
pre-tax:
GAAP
income
(loss)
from
continuing
operations
before
income
taxes
$ 42,710
$ 9,968
$ (26,147)
$ 26,531
Gain
on
sale
of
FCM
-
(2,116)
-
(2,116)
Lease
loss
accrual,
net
-
-
6,117
6,117
Non-GAAP
income
(loss)
from
continuing
operations
before
income
taxes
$ 42,710
$ 7,852
$ (20,030)
$ 30,532
10 |
 3
months ended September 30, 2014 Market Making
Global Execution
Services
Corporate and
Other
Consolidated
Reconciliation
of
GAAP
pre-tax
to
non-GAAP
pre-tax:
GAAP
loss
from
continuing
operations
before
income
taxes
$ (8,033)
$ (1,664)
$ (5,538)
$ (15,235)
Net
gain
related
to
tradeMONSTER
combination
with
OptionsHouse
-
-
(15,105)
(15,105)
Compensation
related
to
reduction
in
workforce
and
other
employee
separations
2,786
3,577
4,158
10,521
Writedown
of
assets
and
lease
loss
accrual,
net
-
-
301
301
Non-GAAP
(loss)
income
from
continuing
operations
before
income
taxes
$ (5,247)
$ 1,913
$ (16,184)
$ (19,518)
Regulation G Reconciliation of Non-GAAP
Financial Measures (Continuing Operations)
11 |
 Regulation G Reconciliation of Non-GAAP
Financial Measures (Continuing Operations)
3 months ended June 30, 2014
Market Making
Global Execution
Services
Corporate and
Other
Consolidated
Reconciliation
of
GAAP
pre-tax
to
non-GAAP
pre-tax:
GAAP
income
(loss)
from
continuing
operations
before
income
taxes
$ 36,004
$ 736
$ (22,233)
$ 14,507
Writedown
of
capitalized
debt
costs
-
-
1,995
1,995
Compensation
related
to
reduction
in
workforce
383
1,886
800
3,069
Writedown
of
assets
and
lease
loss
accrual,
net
452
-
1,489
1,941
Non-GAAP
income
(loss)
from
continuing
operations
before
income
taxes
$ 36,839
$ 2,622
$ (17,949)
$ 21,512
12 |
 Regulation G Reconciliation of Non-GAAP
Financial Measures (Continuing Operations)
3 months ended March 31, 2014
Market Making
Global Execution
Services
Corporate and
Other
Consolidated
Reconciliation
of
GAAP
pre-tax
to
non-GAAP
pre-tax:
GAAP
income
(loss)
from
continuing
operations
before
income
taxes
$ 76,032
$ 2,016
$ (18,664)
$ 59,384
Writedown
of
capitalized
debt
costs
-
-
7,557
7,557
Income
resulting
from
the
merger
of
BATS
and
Direct
Edge,
net
-
-
(9,644)
(9,644)
Lease
loss
accrual,
net
359
-
(93)
266
Non-GAAP
income
(loss)
from
continuing
operations
before
income
taxes
$ 76,391
$ 2,016
$ (20,844)
$ 57,563
13 |
 Regulation G Reconciliation of Non-GAAP
Financial Measures (Continuing Operations)
3 months ended December 31, 2013
Market Making
Global Execution
Services
Corporate and
Other
Consolidated
Reconciliation
of
GAAP
pre-tax
to
non-GAAP
pre-tax:
GAAP
income
(loss)
from
continuing
operations
before
income
taxes
$ 47,951
$ (4,491)
$ (60,159)
$ (16,699)
Compensation
and
other
expenses
related
to
a
reduction
in
workforce
5,254
5,447
708
11,409
Professional
and
other
fees
related
to
Mergers
and
August
1st
technology
issue
-
-
2,785
2,785
Writedown
of
capitalized
debt
costs
-
-
13,209
13,209
Gain
on
strategic
asset
-
-
(1,359)
(1,359)
Writedown
of
assets
and
lease
loss
accrual
-
1,681
8,819
10,500
Non-GAAP
income
(loss)
from
continuing
operations
before
income
taxes
$ 53,205
$ 2,637
$ (35,997)
$ 19,845
14 |
 Regulation G Reconciliation of Non-GAAP
Financial Measures (Continuing Operations)
3 months ended September 30, 2013
Market Making
Global Execution
Services
Corporate and
Other
Consolidated
Reconciliation
of
GAAP
pre-tax
to
non-GAAP
pre-tax:
GAAP
income
(loss)
from
continuing
operations
before
income
taxes
$ 47,853
$ (16,354)
$ 89,874
$ 121,373
Gain
on
investment
in
Knight
Capital
Group,
Inc.
-
-
(127,972)
(127,972)
Compensation
and
other
expenses
related
to
reduction
in
workforce
2,309
15,132
-
17,441
Professional
and
other
fees
related
to
Mergers
and
August
1st
technology
issue
-
-
7,269
7,269
Writedown
of
assets
and
lease
loss
accrual,
net
108
-
828
936
Non-GAAP
income
(loss)
from
continuing
operations
before
income
taxes
$ 50,270
$ (1,222)
$ (30,001)
$ 19,047
15 |
 Regulation G Reconciliation of Non-GAAP
Financial Measures (Continuing Operations)
3 months ended March 31, 2015
GAAP
Adjustments for
non-GAAP presentation
KCG non-GAAP, normalized
expenses
Reconciliation of GAAP expenses to KCG non-GAAP,
normalized expenses:
Employee compensation and benefits
106,718
4,457
102,261
Communications and data processing
33,764
-
33,764
Depreciation and amortization
20,615
-
20,615
Debt interest expense
8,463
-
8,463
Professional fees
11,181
6,736
4,445
Occupancy and equipment rentals
7,340
-
7,340
Business development
1,857
-
1,857
Lease loss accrual, net
132
132
-
Other
7,808
-
7,808
Total expenses¹
$ 197,878
$ 11,325
$ 186,553
16
1
Total expenses exclude transaction-based expenses which fluctuate based on
market conditions and client activity. |
 3
months ended December 31, 2014 GAAP
Adjustments for
non-GAAP presentation
KCG non-GAAP, normalized
expenses
Reconciliation of GAAP expenses to KCG non-GAAP,
normalized expenses:
Employee compensation and benefits
116,214
-
116,214
Communications and data processing
36,945
-
36,945
Depreciation and amortization
21,224
-
21,224
Debt interest expense
7,721
-
7,721
Professional fees
5,695
-
5,695
Occupancy and equipment rentals
8,514
-
8,514
Business development
2,308
-
2,308
Lease loss accrual, net
6,117
6,117
-
Other
9,822
-
9,822
Total expenses¹
$ 214,561
$ 6,117
$ 208,444
Regulation G Reconciliation of Non-GAAP
Financial Measures (Continuing Operations)
17
1
Total expenses exclude transaction-based expenses which fluctuate based on
market conditions and client activity. |
 Regulation G Reconciliation of Non-GAAP
Financial Measures (Continuing Operations)
3 months ended September 30, 2014
GAAP
Adjustments for
non-GAAP presentation
KCG non-GAAP, normalized
expenses
Reconciliation of GAAP expenses to KCG non-GAAP,
normalized expenses:
Employee compensation and benefits
95,307
10,521
84,786
Communications and data processing
38,576
-
38,576
Depreciation and amortization
20,298
-
20,298
Debt interest expense
7,714
-
7,714
Professional fees
7,161
-
7,161
Occupancy and equipment rentals
7,672
-
7,672
Business development
3,163
-
3,163
Writedown of assets and lease loss accrual, net
301
301
-
Other
10,580
-
10,580
Total expenses¹
$ 190,772
$ 10,822
$ 179,950
18
1
Total expenses exclude transaction-based expenses which fluctuate based on
market conditions and client activity. |
 3
months ended June 30, 2014 GAAP
Adjustments for
non-GAAP presentation
KCG non-GAAP, normalized
expenses
Reconciliation of GAAP expenses to KCG non-GAAP,
normalized expenses:
Employee compensation and benefits
103,430
3,069
100,361
Communications and data processing
38,279
-
38,279
Depreciation and amortization
19,823
-
19,823
Debt interest expense
7,497
-
7,497
Professional fees
7,337
-
7,337
Occupancy and equipment rentals
8,235
-
8,235
Business development
2,609
-
2,609
Writedown of assets, lease loss accrual and capitalized debt costs
3,936
3,936
-
Other
10,767
-
10,767
Total expenses¹
$ 201,913
$ 7,005
$ 194,908
Regulation G Reconciliation of Non-GAAP
Financial Measures (Continuing Operations)
19
1
Total expenses exclude transaction-based expenses which fluctuate based on
market conditions and client activity. |
 3
months ended March 31, 2014 GAAP
Adjustments for
non-GAAP presentation
KCG non-GAAP, normalized
expenses
Reconciliation of GAAP expenses to KCG non-GAAP,
normalized expenses:
Employee compensation and benefits
122,319
-
122,319
Communications and data processing
36,796
-
36,796
Depreciation and amortization
20,103
-
20,103
Debt interest expense
9,524
-
9,524
Professional fees
5,402
-
5,402
Occupancy and equipment rentals
8,285
-
8,285
Business development
1,683
-
1,683
Lease loss accrual and writedown of capitalized debt costs
7,823
7,823
-
Other
8,643
-
8,643
Total expenses¹
$ 220,578
$ 7,823
$ 212,755
Regulation G Reconciliation of Non-GAAP
Financial Measures (Continuing Operations)
20
1
Total expenses exclude transaction-based expenses which fluctuate based on
market conditions and client activity. |
 3
months ended December 31, 2013 GAAP
Adjustments for
non-GAAP presentation
KCG non-GAAP, normalized
expenses
Reconciliation of GAAP expenses to KCG non-GAAP,
normalized expenses:
Employee compensation and benefits
112,209
11,409
100,800
Communications and data processing
37,512
-
37,512
Depreciation and amortization
19,566
-
19,566
Debt interest expense
12,943
-
12,943
Professional fees
7,734
2,491
5,243
Occupancy and equipment rentals
9,358
-
9,358
Business development
1,923
-
1,923
Lease loss accrual and writedown of capitalized debt costs
23,709
23,709
-
Other
13,066
294
12,772
Total expenses¹
$ 238,020
$ 37,903
$ 200,117
Regulation G Reconciliation of Non-GAAP
Financial Measures (Continuing Operations)
21
1
Total expenses exclude transaction-based expenses which fluctuate based on
market conditions and client activity. |
 3
months ended September 30, 2013 GAAP
Adjustments for
non-GAAP presentation
KCG non-GAAP, normalized
expenses
Reconciliation of GAAP expenses to KCG non-GAAP,
normalized expenses:
Employee compensation and benefits
129,631
17,441
112,190
Communications and data processing
44,046
-
44,046
Depreciation and amortization
20,091
-
20,091
Debt interest expense
19,350
2,982
16,368
Professional fees
9,077
4,087
4,990
Occupancy and equipment rentals
8,898
-
8,898
Business development
2,644
200
2,444
Writedown of assets and lease loss accrual, net
936
936
-
Other
11,318
-
11,318
Total expenses¹
$ 245,991
$ 25,647
$ 220,345
Regulation G Reconciliation of Non-GAAP
Financial Measures (Continuing Operations)
22
1
Total expenses exclude transaction-based expenses which fluctuate based on
market conditions and client activity. |
 |
Serious News for Serious Traders! Try StreetInsider.com Premium Free!
You May Also Be Interested In
- Trailbreaker Commences Drilling at the Liberty Copper Property, BC.
- Ocwen Financial Schedules Conference Call – First Quarter 2024 Results and Business Update
- Green Rise Foods Announces Director Options
Create E-mail Alert Related Categories
SEC FilingsSign up for StreetInsider Free!
Receive full access to all new and archived articles, unlimited portfolio tracking, e-mail alerts, custom newswires and RSS feeds - and more!
