

Form 6-K Arcos Dorados Holdings For: May 12
 Tweet
Tweet Share
ShareUNITED STATES
SECURITIES AND EXCHANGE COMMISSION
Washington, D.C. 20549
FORM 6-K
|
REPORT OF FOREIGN PRIVATE ISSUER PURSUANT TO RULE 13a-16 OR 15d-16 UNDER THE SECURITIES EXCHANGE ACT OF 1934
|
For the month of May, 2015
Commission File Number: 001-35129
Arcos Dorados Holdings Inc.
(Exact name of registrant as specified in its charter)
Roque Saenz Peña 432
B1636FFB Olivos, Buenos Aires, Argentina
(Address of principal executive office)
Indicate by check mark whether the registrant files or will file annual reports under cover of Form 20-F or Form 40-F:
|
Form 20-F
|
X
|
Form 40-F
|
Indicate by check mark if the registrant is submitting the Form 6-K in paper as permitted by Regulation S-T Rule 101(b)(1):
|
Yes
|
No
|
X
|
Indicate by check mark if the registrant is submitting the Form 6-K in paper as permitted by Regulation S-T Rule 101(b)(7):
|
Yes
|
No
|
X
|
ARCOS DORADOS HOLDINGS INC.
TABLE OF CONTENTS
|
ITEM
|
|
|
1.
|
Press Release dated May 12, 2015 entitled “Arcos Dorados Reports First Quarter 2015 Financial Results”
|
SIGNATURE
Pursuant to the requirements of the Securities Exchange Act of 1934, the registrant has duly caused this report to be signed on its behalf by the undersigned, thereunto duly authorized.
|
Arcos Dorados Holdings Inc.
|
|||||
|
By:
|
/s/ Juan David Bastidas
|
||||
|
Name:
|
Juan David Bastidas
|
||||
|
Title:
|
Chief Legal Counsel
|
||||
Date: May 12, 2015
Item 1

FOR IMMEDIATE RELEASE
ARCOS DORADOS REPORTS FIRST QUARTER 2015 FINANCIAL RESULTS
Achieved high single-digit growth in comparable sales in addition to Adjusted EBITDA margin expansion at the divisional level.
Buenos Aires, Argentina, May 12, 2015 – Arcos Dorados Holdings, Inc. (NYSE: ARCO) (“Arcos Dorados” or the “Company”), Latin America’s largest restaurant chain and the world’s largest McDonald’s franchisee, today reported unaudited results for the first quarter ended March 31, 2015.
First Quarter 2015 Key Results
|
|
•
|
Consolidated revenues were $775.1 million, a 15.3% decline versus the first quarter of 2014. On an organic basis and excluding Venezuela, consolidated revenues grew 6.8%.
|
|
|
•
|
Systemwide comparable sales increased by 9.4% year-over-year.
|
|
|
•
|
Adjusted EBITDA was $41.9 million, or 16.8% lower year-over-year. Organic Adjusted EBITDA excluding Venezuela, decreased by 5.2% versus the prior year quarter.
|
|
|
•
|
Net loss of $28.2 million, compared to a net loss of $20.6 million in the year-ago period, mainly due to lower operating results and higher foreign exchange losses.
|
“As our management team continues to be focused on and committed to better address Latin-American consumer needs, we are making the necessary tactical adjustments to navigate through the current environment. We will continue to serve the great food and offer the family-friendly environment that our customers love. While we expect headwinds to persist in the near term, we are confident that our three-year strategic plan will lead to enhanced long term shareholder value.”
“In the first quarter we made headway on some of the key elements of our strategy, particularly in delivering a high single-digit increase in comparable sales and improving our Adjusted EBITDA margins at the divisional level. With our focus on becoming leaner and more efficient, we expect to improve our performance and financial position, and be at the forefront of a cyclical recovery in Latin America’s growth”, said Woods Staton, Chairman and Chief Executive Officer of Arcos Dorados.
1
First Quarter 2015 Results
Consolidated
|
Figure 1. AD Holdings Inc Consolidated: Key Financial Results
(In millions of U.S. dollars, except as noted)
|
|||||||||||||||||||||||||||
|
1Q14
(a)
|
Special Items
(b)
|
Currency Translation
(c)
|
Organic Growth
(d)
|
1Q15
(a+b+c+d)
|
% As Reported
|
% Organic
|
|||||||||||||||||||||
|
Total Restaurants (Units)
|
2,069 | 2,119 | 2.4 | % | |||||||||||||||||||||||
|
Sales by Company-operated
Restaurants
|
878.1 | (221.0 | ) | 86.4 | 743.5 | -15.3 | % | 9.8 | % | ||||||||||||||||||
|
Revenues from franchised
restaurants
|
37.4 | (14.0 | ) | 8.2 | 31.6 | -15.6 | % | 21.8 | % | ||||||||||||||||||
|
Total Revenues
|
915.5 | (235.0 | ) | 94.5 | 775.1 | -15.3 | % | 10.3 | % | ||||||||||||||||||
|
Systemwide Comparable Sales
|
9.4 | % | |||||||||||||||||||||||||
|
Adjusted EBITDA
|
50.3 | (4.8 | ) | (20.0 | ) | 16.3 | 41.9 | -16.8 | % | 35.5 | % | ||||||||||||||||
|
Adjusted EBITDA Margin
|
5.5 | % | 5.4 | % | |||||||||||||||||||||||
|
Net income (loss) attributable
to AD
|
(20.6 | ) | (1.1 | ) | (11.2 | ) | 4.7 | (28.2 | ) | -36.9 | % | 88.8 | % | ||||||||||||||
|
No. of shares outstanding
(thousands)
|
209,867 | 210,216 | |||||||||||||||||||||||||
|
EPS (US$/Share)
|
(0.10 | ) | (0.13 | ) | |||||||||||||||||||||||
(1Q15 = 1Q14 + Special items + Currency translation + Organic growth). Please refer to “Definitions” section for further detail.
The 15.3% decline in Arcos Dorados’ first quarter as reported revenues resulted from the use of a weaker official exchange rate to remeasure the results of the Company’s Venezuelan operation, and the depreciation of local currencies, mainly in Brazil and Argentina. For more details on Venezuela, please refer to the Quarter Highlights & Recent Developments section on page 10 of this earnings release. Organic revenue growth of 10.3% was driven by a 9.4% expansion in systemwide comparable sales, reflecting average check growth. The net addition of 50 restaurants during the last 12-month period contributed $22.3 million to organic revenue growth.
2
Adjusted EBITDA ($ million)
Breakdown of main variations contributing to 1Q15 Adjusted EBITDA
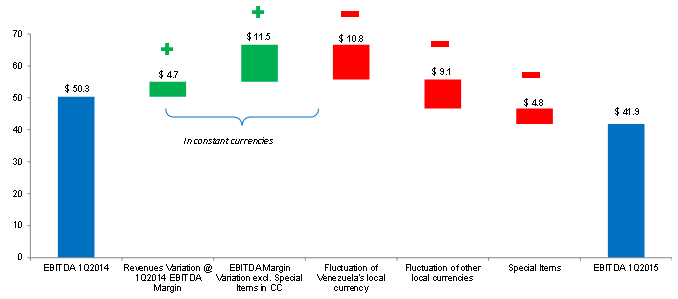
Reported Adjusted EBITDA for the first quarter decreased 16.8%, primarily due to the remeasurement of the Venezuelan operation at a weaker official foreign exchange rate versus the prior-year quarter and the depreciation of other currencies, mainly the Brazilian Real. As a consequence of the foreign exchange rate change in Venezuela, in the first quarter the Company recorded two charges that impacted the Adjusted EBITDA: (i) a $3.3 million write down of certain inventories, and (ii) a $1.1 million loss related to lower margin due to the impact of inventories measured at their historical exchange rate.
The Adjusted EBITDA margin decreased by 10 basis points to 5.4%, as Adjusted EBITDA margin expansion in each of the operating divisions was offset by a decrease in the Adjusted EBITDA of the Corporate segment. The absolute US dollar variance in the Corporate segment was primarily the result of (i) $3.1 million related to the impact of high inflation on our Argentina-based corporate expenses, which was only partially offset by a modest devaluation of the Argentine peso and (ii) $3.5 million related to an adjustment to the variable compensation accrual in the first quarter of 2014, which was reduced by the difference between the actual variable compensation paid for 2013 and the accrual that was on the books for that year.
Despite the abovementioned negative impacts, the Company’s total G&A in the quarter decreased by 2.5% year-over year in absolute terms. Excluding points (i) and (ii) above, total G&A would have declined by more than 12.0% versus the prior year quarter.
3
Special items impacting Adjusted EBITDA consisted of:
|
Special Items
(In thousands of U.S. dollars)
|
|||||||||||
| 1Q | 1Q |
Variation
|
|||||||||
| 2015 | 2014 | ||||||||||
|
Royalty waiver from Venezuela
|
- | 4,713 | -4,713 | ||||||||
|
CADs net (loss) (i)
|
-442 | -345 | -97 | ||||||||
|
TOTAL
|
(442 | ) | 4,368 | (4,810 | ) | ||||||
|
(i) Compensation expense. Includes the result from the total equity return swap.
|
|||||||||||
Consolidated – excluding Venezuela
|
Figure 2. AD Holdings Inc Consolidated - Excluding Venezuela: Key Financial Results
(In millions of U.S. dollars, except as noted)
|
|||||||||||||||||||||||||||
|
1Q14
(a)
|
Special Items
(b)
|
Currency Translation
(c)
|
Organic Growth
(d)
|
1Q15
(a+b+c+d)
|
% As Reported
|
% Organic
|
|||||||||||||||||||||
|
Total Restaurants (Units)
|
1,930 | 1,983 | 2.7 | % | |||||||||||||||||||||||
|
Sales by Company-operated Restaurants
|
793.2 | (115.3 | ) | 53.1 | 730.9 | -7.8 | % | 6.7 | % | ||||||||||||||||||
|
Revenues from franchised restaurants
|
32.2 | (5.1 | ) | 3.4 | 30.5 | -5.4 | % | 10.4 | % | ||||||||||||||||||
|
Total Revenues
|
825.4 | (120.4 | ) | 56.4 | 761.5 | -7.7 | % | 6.8 | % | ||||||||||||||||||
|
Systemwide Comparable Sales
|
3.8 | % | |||||||||||||||||||||||||
|
Adjusted EBITDA
|
59.4 | (0.1 | ) | (9.1 | ) | (3.1 | ) | 47.0 | -20.8 | % | -5.2 | % | |||||||||||||||
|
Adjusted EBITDA Margin
|
7.2 | % | 6.2 | % | |||||||||||||||||||||||
|
Net income (loss) attributable to AD
|
9.3 | 6.1 | (2.3 | ) | (17.0 | ) | (3.8 | ) | -140.3 | % | -105.8 | % | |||||||||||||||
|
No. of shares outstanding (thousands)
|
209,867 | 210,216 | |||||||||||||||||||||||||
|
EPS (US$/Share)
|
0.04 | (0.02 | ) | ||||||||||||||||||||||||
Excluding the Venezuelan operation, as reported revenues declined by 7.7% due to the depreciation of some local currencies, mainly in Brazil and Argentina, while organic revenues rose 6.8% in the first quarter. Systemwide comparable sales increased 3.8% due to average check growth, which was partially offset by a decline in traffic. As reported Adjusted EBITDA contracted 20.8% and decreased 5.2% in organic terms. The Adjusted EBITDA margin declined 100 basis points to 6.2%, as higher F&P and G&A expenses as a percentage of revenues more than offset labor cost leverage.
Non-operating Results
Non-operating results for the first quarter reflected a non-cash $3.3 million increase in foreign currency exchange losses. FX losses for the quarter were mainly the result of (i) $11.7 million lower losses on Venezuelan net monetary assets, and (ii) $16.8 million higher losses from the depreciation of the Brazilian Real (BRL) within the quarter, which generated a loss on intercompany balances, partially offset by a gain related to the BRL-denominated long-term debt. Net interest expense was relatively flat year-over-year, totaling $16.3 million in the quarter.
4
The Company reported an income tax credit of $6.6 million for the quarter, compared to an expense of $3.7 million in the prior year, based on the methodology required for determining income tax provisions for partial year periods.
The first quarter net loss was $28.2 million, compared to a loss of $20.6 million in the same period of 2014. The result is mainly explained by lower operating results and higher foreign exchange losses. The net loss also included an impairment charge on Venezuelan fixed assets of $7.8 million classified as an operating charge but excluded from the Adjusted EBITDA computation.
The Company reported a basic net loss per share of $0.13 in the first quarter of 2015, compared to a loss of $0.10 in the previous corresponding period. Total weighted average shares for the first quarter of 2015 were 210,216,043 as compared to 209,867,426 in the first quarter of 2014, reflecting the issuance of shares as a result of the partial vesting of restricted share units.
Analysis by Division:
Brazil Division
|
Figure 3. Brazil Division: Key Financial Results
(In millions of U.S. dollars, except as noted)
|
|||||||||||||||||||||||||||
|
1Q14
(a)
|
Special Items
(b)
|
Currency Translation
(c)
|
Organic Growth
(d)
|
1Q15
(a+b+c+d)
|
% As Reported
|
% Organic
|
|||||||||||||||||||||
|
Total Restaurants (Units)
|
816 | 867 | 6.3 | % | |||||||||||||||||||||||
|
Total Revenues
|
428.6 | (75.4 | ) | 12.8 | 365.9 | -14.6 | % | 3.0 | % | ||||||||||||||||||
|
Systemwide Comparable Sales
|
-0.5 | % | |||||||||||||||||||||||||
|
Adjusted EBITDA
|
45.5 | 0.0 | (7.8 | ) | 2.5 | 40.2 | -11.7 | % | 5.4 | % | |||||||||||||||||
|
Adjusted EBITDA Margin
|
10.6 | % | 11.0 | % | |||||||||||||||||||||||
Brazil’s as reported revenues decreased by 14.6%, as a 22% year-over-year average depreciation of the Brazilian Real more than offset broadly stable comparable sales and the contribution of new restaurant openings. Excluding the Real’s depreciation, organic revenues increased 3.0% year-over-year. Systemwide comparable sales were relatively flat year-over-year as average check growth was offset by a decline in traffic. Traffic levels were impacted by a continued weak consumption environment in Brazil and a tough year-over-year comparison due to the launch of the Monopoly campaign in March of 2014. The Company’s marketing activities in the quarter were focused on consumer needs and included the launch of the favorite, Triple Bacon sandwich in the affordability platform to boost accessibility, and the Mega McFries promotion. Also in the quarter, the Happy Meal benefited from strong properties such as Cut the Rope and Penguins of Madagascar, reaffirming the Company’s focus on the family business.
5
The net addition of 51 restaurants during the last 12-month period, of which over 60% were free-standing units, which allows the Company to deliver a full experience to its customers, contributed $23.5 million to revenues on a constant currency basis during the quarter.
As reported Adjusted EBITDA contracted 11.7% but increased 5.4% excluding the impact of currency depreciation. The Adjusted EBITDA margin improved 36 basis points to 11.0% as efficiencies in F&P costs as a percentage of sales, helped by currency hedges, more than offset higher Occupancy and Other Operating Expenses as a percentage of sales. Both payroll costs and G&A expenses were unchanged as a percentage of revenues versus the prior year.
NOLAD
|
Figure 4. NOLAD Division: Key Financial Results
(In millions of U.S. dollars, except as noted)
|
|||||||||||||||||||||||||||
|
1Q14
(a)
|
Special Items
(b)
|
Currency Translation
(c)
|
Organic Growth
(d)
|
1Q15
(a+b+c+d)
|
% As Reported
|
% Organic
|
|||||||||||||||||||||
|
Total Restaurants (Units)
|
509 | 512 | 0.6 | % | |||||||||||||||||||||||
|
Total Revenues
|
92.7 | (6.0 | ) | (0.1 | ) | 86.5 | -6.6 | % | -0.1 | % | |||||||||||||||||
|
Systemwide Comparable Sales
|
-2.4 | % | |||||||||||||||||||||||||
|
Adjusted EBITDA
|
5.6 | 0.0 | (0.0 | ) | 0.6 | 6.2 | 10.1 | % | 10.2 | % | |||||||||||||||||
|
Adjusted EBITDA Margin
|
6.1 | % | 7.1 | % | |||||||||||||||||||||||
NOLAD’s revenues decreased by 6.6% year-over-year, but were flat versus the prior year period on an organic basis. Systemwide comparable sales declined 2.4% as average check growth was more than offset by a decline in traffic, which was impacted by a tough competitive environment in the division. Marketing initiatives, which were focused on enhancing the Mexican consumer’s value perception of the Company’s food, included the return of the CBO (Angus and Chicken) and the launch of the McTrio Amigo in the affordability platform and the McFlurry Crunch in the dessert category.
The net addition of 3 restaurants during the last 12-month period contributed $2.2 million to revenues in constant currency.
As reported Adjusted EBITDA increased by 10.1%, with similar growth achieved on an organic basis. The Adjusted EBITDA margin increased by more than 100 basis points to 7.1%. Lower G&A as a percentage of revenues combined with efficiencies in Payroll costs and Occupancy & Other Operating Expenses, more than offset higher F&P costs as a percentage of sales.
6
SLAD
|
Figure 5. SLAD Division: Key Financial Results
(In millions of U.S. dollars, except as noted)
|
|||||||||||||||||||||||||||
|
1Q14
(a)
|
Special Items
(b)
|
Currency Translation
(c)
|
Organic Growth
(d)
|
1Q15
(a+b+c+d)
|
% As Reported
|
% Organic
|
|||||||||||||||||||||
|
Total Restaurants (Units)
|
379 | 382 | 0.8 | % | |||||||||||||||||||||||
|
Total Revenues
|
206.6 | (29.4 | ) | 44.8 | 222.0 | 7.4 | % | 21.7 | % | ||||||||||||||||||
|
Systemwide Comparable Sales
|
22.1 | % | |||||||||||||||||||||||||
|
Adjusted EBITDA
|
22.3 | 0.0 | (3.6 | ) | 6.4 | 25.0 | 12.6 | % | 28.9 | % | |||||||||||||||||
|
Adjusted EBITDA Margin
|
10.8 | % | 11.3 | % | |||||||||||||||||||||||
SLAD’s revenues increased by 7.4%, or 21.7% in organic terms, versus the prior year quarter. Currency translation was largely impacted by the 14% lower average value of the Argentine Peso versus the same period last year. Systemwide comparable sales increased 22.1% versus a blended inflation rate of 22.0% in the division. Consistent improvement in the Company’s family business along with inflation-driven average check growth was partially offset by a decline in traffic due to a soft macroeconomic environment in Argentina. The Company’s ongoing strategy, focused on improving the quality perception of its food, resulted in marketing activities that included the launch of the Hot Pepper sandwich (Angus & Chicken), the Triple Cheeseburger in the affordability platform and the McFlurry Shot in the dessert category.
The net addition of 3 restaurants during the last 12-month period contributed $1.8 million to revenues in constant currency in the quarter.
As reported Adjusted EBITDA increased 12.6% and rose 28.9% in organic terms. The Adjusted EBITDA margin expanded 51 basis points to 11.3%, driven by efficiencies in F&P, Payroll costs, and Occupancy & Other Operating Expenses as a percentage of sales.
Caribbean Division
|
Figure 6. Caribbean Division: Key Financial Results
(In millions of U.S. dollars, except as noted)
|
|||||||
|
1Q14
(a)
|
Special Items
(b)
|
Currency Translation
(c)
|
Organic Growth
(d)
|
1Q15
(a+b+c+d)
|
% As Reported
|
% Organic
|
|
|
Total Restaurants (Units)
|
365
|
358
|
-1.9%
|
||||
|
Total Revenues
|
187.6
|
(124.2)
|
37.1
|
100.6
|
-46.4%
|
19.8%
|
|
|
Systemwide Comparable Sales
|
26.4%
|
||||||
|
Adjusted EBITDA
|
(4.0)
|
(4.7)
|
(12.9)
|
19.8
|
(1.7)
|
57.0%
|
228.6%
|
|
Adjusted EBITDA Margin
|
-2.1%
|
-1.7%
|
|||||
The Caribbean division’s as reported revenues declined by 46.4%, primarily due to the remeasurement of the results of the Venezuelan operation at a weaker year-over-year average
7
exchange rate. Excluding this factor, organic revenues rose 19.8% year-over-year. Systemwide comparable sales increased by 26.4%, as inflation-driven growth in average check more than offset a decrease in traffic. The division continues to be affected by challenging conditions in Venezuela, and a soft macroeconomic environment in Puerto Rico. Key marketing initiatives during the quarter included the Big Mac & Chicken Mac, the launch of the Beef Tasty Bacon, and the McFlurry Lemmon Pie, among others.
The Company continues to focus on long term growth, offering relevant locations to its consumers. As part of that strategy, the Company closed 10 underperforming restaurants, against 3 openings, in the Caribbean Division over the last 12-month period. The combined contribution to constant currency revenues of the restaurants that were closed and opened was $1.8 million.
As reported Adjusted EBITDA was negative $1.7 million, compared with negative $4.0 million in the prior year period. The Adjusted EBITDA margin was negative 1.7%, versus negative 2.1% in the first quarter of 2014. The improvement reflects lower F&P costs, which more than offset increases in all other cost items as a percentage of sales. Operating results in the division were affected by the change in the Venezuelan exchange rate, including (i) $3.3 million related to the write down of certain inventories, and (ii) $1.1 million related to lower margin due to the impact of inventories measured at the historical exchange rate. Special items impacting Adjusted EBITDA included the recognition of a $4.7 million royalty waiver for the Venezuelan operation from McDonald’s Corporation in the first quarter of last year.
Caribbean Division – excluding Venezuela
|
Figure 7. Caribbean Division - Excluding Venezuela: Key Financial Results
(In millions of U.S. dollars, except as noted)
|
|||||||||||||||||||||||||||
|
1Q14
(a)
|
Special Items
(b)
|
Currency Translation
(c)
|
Organic Growth
(d)
|
1Q15
(a+b+c+d)
|
% As Reported
|
% Organic
|
|||||||||||||||||||||
|
Total Restaurants (Units)
|
226 | 222 | -1.8 | % | |||||||||||||||||||||||
|
Total Revenues
|
97.6 | (9.6 | ) | (1.0 | ) | 87.0 | -10.8 | % | -1.0 | % | |||||||||||||||||
|
Systemwide Comparable Sales
|
-4.5 | % | |||||||||||||||||||||||||
|
Adjusted EBITDA
|
2.8 | 0.0 | (0.5 | ) | 0.2 | 2.6 | -7.9 | % | 8.6 | % | |||||||||||||||||
|
Adjusted EBITDA Margin
|
2.9 | % | 3.0 | % | |||||||||||||||||||||||
Revenues in the Caribbean division excluding Venezuela decreased by 10.8% versus the prior-year period, mainly due to the depreciation of the Colombian Peso and the Euro as well as a softening consumer environment in Puerto Rico. Excluding currency movements, organic revenues declined 1.0%. Comparable sales decreased by 4.5%, largely due to decreased traffic in Puerto Rico.
As reported Adjusted EBITDA contracted 7.9%, mostly due to the depreciation of the Colombian peso, while organic Adjusted EBITDA rose 8.6%. The Adjusted EBITDA margin increased by
8
almost 10 basis points to 3.0% as efficiencies in G&A, Payroll, and Occupancy and Other Operating Expenses more than offset higher F&P costs as a percentage of sales.
New Unit Development
|
Figure 8. Total Restaurants (eop)*
|
|||||||||||||||||||
|
March
2015
|
December
2014
|
September
2014
|
June
2014
|
March
2014
|
|||||||||||||||
|
Brazil
|
867 | 866 | 833 | 824 | 816 | ||||||||||||||
|
NOLAD
|
512 | 513 | 511 | 509 | 509 | ||||||||||||||
|
SLAD
|
382 | 383 | 380 | 378 | 379 | ||||||||||||||
|
Caribbean
|
358 | 359 | 362 | 364 | 365 | ||||||||||||||
|
TOTAL
|
2,119 | 2,121 | 2,086 | 2,075 | 2,069 | ||||||||||||||
|
LTM Net Openings
|
50 | 59 | 93 | 104 | 110 | ||||||||||||||
|
* Considers Company-operated and franchised restaurants at period-end
|
|||||||||||||||||||
The Company completed 77 new restaurant openings for the twelve month period ended March 31, 2015, resulting in a total of 2,119 restaurants. Also in the period, the Company added 255 Dessert Centers and 8 McCafés, bringing the totals to 2,526 and 335, respectively.
Balance Sheet & Cash Flow Highlights
Cash and cash equivalents were $71.9 million at March 31, 2015. The Company’s total financial debt (including derivative instruments) was $750.3 million. Net debt was $678.4 million and the Net Debt/Adjusted EBITDA ratio was 2.8x at March 31, 2015.
Net cash used in operating activities was $30.4 million in the first quarter of 2015, while cash used in financing activities amounted to $4.1 million. During the quarter, capital expenditures totaled $12.0 million.
9
Quarter Highlights & Recent Developments
Venezuelan exchange rate used for financial reporting
During February 2015, the Venezuelan government announced the unification of SICAD and SICAD II into a single foreign exchange mechanism called SICAD and established a new open-market foreign exchange system called SIMADI (Sistema Marginal de Divisas). As of March 31, 2015, three foreign exchange rates were legally available: (i) the official exchange rate settled at 6.30; (ii) the new SICAD exchange rate settled at 12; and (iii) the SIMADI exchange rate settled at 192.95.
Considering that the SICAD II exchange rate no longer exists, the lack of operations at the SICAD exchange rate and its success in accessing U.S. dollars via the SIMADI mechanism, the Company concluded that the SIMADI exchange rate, amounting to 177 VEF per US dollar as of March 1, 2015, was the rate applicable for remeasurement purposes as of that date. As a result of the exchange rate change to SIMADI, the Company recognized a foreign currency exchange loss of $8.0 million, a write down of certain inventories of $3.3 million due to the currency exchange rate change impact on their net recoverable value, a $1.1 million loss related to lower margin due to the impact of inventories measured at the historical exchange rate and an impairment of long-lived assets amounting to $7.8 million within “Other operating expenses, net”.
As of March 31, 2015, the Company’s local currency denominated net monetary position, which would be subject to remeasurement in the event of further changes in the SIMADI rate, was $3.1 million (including $4.5 million of cash and cash equivalents). Venezuela’s non-monetary assets were $61.9 million at March 31, 2015 and included approximately $53.9 million of fixed assets. Please refer to the Company’s Form 6-K filed with the SEC today for more information on the Venezuelan operation.
Covenants under the Master Franchise Agreement (MFA)
Under the terms of the MFA, the Company is required to maintain a minimum fixed charge coverage ratio as well as a maximum leverage ratio. Primarily as a result of the Company’s decision to change the exchange rates used for remeasurement of its bolivar-denominated assets and liabilities and operating results in Venezuela, the Company was not in compliance with the minimum fixed charge coverage ratio and maximum leverage ratio specified in the MFA as of June 30, 2014. On July 31, 2014, McDonald´s Corporation granted the Company a six-month waiver (until and including December 31, 2014), during which time period and including for the quarter ended June 30, 2014, the Company was not required to comply with the financial ratios set forth in the MFA.
The Company was not in compliance with the ratios specified in the MFA as of March 31, 2015. On May 8, 2015, McDonald’s granted the Company an extension of the aforementioned limited waiver for an additional three-month period (until and including March 31, 2015), during which
10
time, the Company was not required to maintain the financial ratios set forth in the MFA. Notwithstanding the foregoing, the Company does not expect any material adverse effect to its business, results of operations, financial condition or cash flows as a result of this situation.
Annual General Shareholders Meeting
The Company held its Annual Shareholders’ Meeting on April 27, 2015. All proposals were approved.
Investor Relations Contact
Daniel Schleiniger
Arcos Dorados – IR Director
+54 11 4711-2287
www.arcosdorados.com/ir
Media Contact:
Farrell Kramer
MBS Value Partners
+1 212 710-9685
11
Definitions:
Systemwide comparable sales: growth refers to the change, measured in constant currency, in our Company-operated and franchised restaurant sales in one period from a comparable period for restaurants that have been open for thirteen months or longer. While sales by our franchisees are not recorded as revenues by us, we believe the information is important in understanding our financial performance because these sales are the basis on which we calculate and record franchised revenues, and are indicative of the financial health of our franchisee base.
Constant currency: basis refers to amounts calculated using the same exchange rate over the periods under comparison to remove the effects of currency fluctuations from this trend analysis.
Organic: To better discern underlying business trends, this release uses non-GAAP financial measures that segregate year-over-year growth into three categories: (i) currency translation, (ii) special items and (iii) organic growth. (i) Currency translation reflects the impact on growth of the appreciation or depreciation of the local currencies in which we conduct our business against the US dollar (the currency in which our financial statements are prepared). (ii) Special items include the impact of events that management does not consider part of the underlying performance of the business. (iii) Organic growth reflects the underlying growth of the business excluding the effect from currency translation and special items.
About Arcos Dorados
Arcos Dorados is the world’s largest McDonald’s franchisee in terms of systemwide sales and number of restaurants, operating the largest quick service restaurant (“QSR”) chain in Latin America and the Caribbean. It has the exclusive right to own, operate and grant franchises of McDonald’s restaurants in 20 Latin American and Caribbean countries and territories, including Argentina, Aruba, Brazil, Chile, Colombia, Costa Rica, Curaçao, Ecuador, French Guyana, Guadeloupe, Martinique, Mexico, Panama, Peru, Puerto Rico, St. Croix, St. Thomas, Trinidad & Tobago, Uruguay and Venezuela. The Company operates or franchises 2,119 McDonald’s-branded restaurants with over 95,000 employees serving approximately 4.3 million customers a day, as of March 31, 2015. Recognized as one of the best companies to work for in Latin America, Arcos Dorados is traded on the New York Stock Exchange (NYSE: ARCO). To learn more about the Company, please visit the Investors section of our website: www.arcosdorados.com
Cautionary Statement on Forward-Looking Statements
This press release contains forward-looking statements. The forward-looking statements contained herein include statements about the Company’s business prospects, its ability to attract customers, its affordable platform, its expectation for revenue generation and its outlook for 2015. These statements are subject to the general risks inherent in Arcos Dorados' business. These expectations may or may not be realized. Some of these expectations may be based upon assumptions or judgments that prove to be incorrect. In addition, Arcos Dorados' business and operations involve numerous risks and uncertainties, many of which are beyond the control of Arcos Dorados, which could result in Arcos Dorados' expectations not being realized or otherwise materially affect the financial condition, results of operations and cash flows of Arcos Dorados. Additional information relating to the uncertainties affecting Arcos Dorados' business is contained in its filings with the Securities and Exchange Commission. The forward-looking statements are made only
12
as of the date hereof, and Arcos Dorados does not undertake any obligation to (and expressly disclaims any obligation to) update any forward-looking statements to reflect events or circumstances after the date such statements were made, or to reflect the occurrence of unanticipated events.
Use of Non-GAAP Financial Measures
In addition to financial measures prepared in accordance with the general accepted accounting principles (GAAP), within this press release and the accompanying tables, we use a financial measure titled ‘Adjusted EBITDA’. We use Adjusted EBITDA to facilitate operating performance comparisons from period to period. Adjusted EBITDA is defined as our operating income plus depreciation and amortization plus/minus the following losses/gains included within other operating expenses, net and within general and administrative expenses in our statement of income: gains from sale or insurance recovery of property and equipment, write-offs of property and equipment, impairment of long-lived assets, stock-based compensation in connection with the Company’s initial public listing, and the ADBV Long-Term Incentive Plan incremental compensation from modification.
We believe Adjusted EBITDA facilitates company-to-company operating performance comparisons by backing out potential differences caused by variations such as capital structures (affecting net interest expense and other financial charges), taxation (affecting income tax expense) and the age and book depreciation of facilities and equipment (affecting relative depreciation expense), which may vary for different companies for reasons unrelated to operating performance.
13
First Quarter 2015 Consolidated Results
(In thousands of U.S. dollars, except per share data)
|
Figure 9. First Quarter 2015 Consolidated Results
(In thousands of U.S. dollars, except per share data)
|
|||||||
|
For Three-Months ended
|
|||||||
|
March 31,
|
|||||||
|
2015
|
2014
|
||||||
|
REVENUES
|
|||||||
|
Sales by Company-operated restaurants
|
743,471 | 878,058 | |||||
|
Revenues from franchised restaurants
|
31,587 | 37,436 | |||||
|
Total Revenues
|
775,058 | 915,494 | |||||
|
OPERATING COSTS AND EXPENSES
|
|||||||
|
Company-operated restaurant expenses:
|
|||||||
|
Food and paper
|
(259,461 | ) | (315,722 | ) | |||
|
Payroll and employee benefits
|
(160,743 | ) | (189,569 | ) | |||
|
Occupancy and other operating expenses
|
(216,551 | ) | (252,119 | ) | |||
|
Royalty fees
|
(38,002 | ) | (41,386 | ) | |||
|
Franchised restaurants - occupancy expenses
|
(15,226 | ) | (15,717 | ) | |||
|
General and administrative expenses
|
(65,471 | ) | (67,176 | ) | |||
|
Other operating expenses, net
|
(14,219 | ) | (13,031 | ) | |||
|
Total operating costs and expenses
|
(769,673 | ) | (894,720 | ) | |||
|
Operating income
|
5,385 | 20,774 | |||||
|
Net interest expense
|
(16,324 | ) | (16,957 | ) | |||
|
(Loss) gain from derivative instruments
|
(73 | ) | 10 | ||||
|
Foreign currency exchange results
|
(23,698 | ) | (20,447 | ) | |||
|
Other non-operating income (expense), net
|
(46 | ) | (318 | ) | |||
|
Income (loss) before income taxes
|
(34,756 | ) | (16,938 | ) | |||
|
Income tax expense
|
6,587 | (3,699 | ) | ||||
|
Net income (loss)
|
(28,169 | ) | (20,637 | ) | |||
|
(Less) Plus: Net (income) loss attributable to non-controlling interests
|
(64 | ) | 7 | ||||
|
Net income (loss) attributable to Arcos Dorados Holdings Inc.
|
(28,233 | ) | (20,630 | ) | |||
|
(Loss) earnings per share information ($ per share):
|
|||||||
|
Basic net income per common share
|
$ | (0.13 | ) | $ | (0.10 | ) | |
|
Weighted-average number of common shares outstanding-Basic
|
210,216,043 | 209,867,426 | |||||
|
Adjusted EBITDA Reconciliation
|
|||||||
|
Operating income
|
5,385 | 20,774 | |||||
|
Depreciation and amortization
|
27,696 | 28,016 | |||||
|
Operating charges excluded from EBITDA computation
|
8,772 | 1,533 | |||||
|
Adjusted EBITDA
|
41,853 | 50,323 | |||||
|
Adjusted EBITDA Margin as % of total revenues
|
5.4 | % | 5.5 | % | |||
14
First Quarter 2015 Results by Division
(In thousands of U.S. dollars)
|
Figure 10. First Quarter 2015 Consolidated Results by Division
(In thousands of U.S. dollars)
|
|||||||||||||||
| 1Q | |||||||||||||||
|
Three-Months ended
|
% Incr.
|
Constant
|
|||||||||||||
|
March 31,
|
/ |
Currency
|
|||||||||||||
| 2015 | 2014 |
(Decr)
|
Incr/(Decr)%
|
||||||||||||
|
Revenues
|
|||||||||||||||
|
Brazil
|
365,930 | 428,565 | -14.6 | % | 3.0 | % | |||||||||
|
Caribbean
|
100,582 | 187,638 | -46.4 | % | 19.8 | % | |||||||||
|
NOLAD
|
86,543 | 92,679 | -6.6 | % | -0.1 | % | |||||||||
|
SLAD
|
222,003 | 206,612 | 7.4 | % | 21.7 | % | |||||||||
|
TOTAL
|
775,058 | 915,494 | -15.3 | % | 10.3 | % | |||||||||
|
Operating Income (loss)
|
|||||||||||||||
|
Brazil
|
26,311 | 31,192 | -15.6 | % | -0.1 | % | |||||||||
|
Caribbean
|
(16,483 | ) | (11,694 | ) | 41.0 | % | -71.9 | % | |||||||
|
NOLAD
|
(320 | ) | (1,624 | ) | -80.3 | % | -46.2 | % | |||||||
|
SLAD
|
20,139 | 17,403 | 15.7 | % | 33.2 | % | |||||||||
|
Corporate and Other
|
(24,262 | ) | (14,503 | ) | 67.3 | % | 98.7 | % | |||||||
|
TOTAL
|
5,385 | 20,774 | -74.1 | % | 2.9 | % | |||||||||
|
Adjusted EBITDA
|
|||||||||||||||
|
Brazil
|
40,223 | 45,546 | -11.7 | % | 5.4 | % | |||||||||
|
Caribbean
|
(1,702 | ) | (3,962 | ) | -57.0 | % | -381.5 | % | |||||||
|
NOLAD
|
6,179 | 5,614 | 10.1 | % | 10.2 | % | |||||||||
|
SLAD
|
25,045 | 22,252 | 12.6 | % | 28.9 | % | |||||||||
|
Corporate and Other
|
(27,892 | ) | (19,127 | ) | 45.8 | % | 68.4 | % | |||||||
|
TOTAL
|
41,853 | 50,323 | -16.8 | % | 22.8 | % | |||||||||
|
Figure 11. Average Exchange Rate per Quarter*
|
|||||
|
Brazil
|
Mexico
|
Argentina
|
Venezuela
|
||
|
1Q15
|
2.87
|
14.96
|
8.69
|
96.61
|
|
|
1Q14
|
2.36
|
13.23
|
7.62
|
11.05
|
|
|
* Local $ per 1 US$
|
|||||
15
Summarized Consolidated Balance Sheets
(In thousands of U.S. dollars)
|
Figure 12. Summarized Consolidated Balance Sheets
(In thousands of U.S. dollars)
|
|||||||
|
March 31
|
December 31 | ||||||
|
2015
|
2014
|
||||||
|
ASSETS
|
|||||||
|
Current assets
|
|||||||
|
Cash and cash equivalents
|
71,888 | 139,030 | |||||
|
Accounts and notes receivable, net
|
56,706 | 83,003 | |||||
|
Other current assets (1)
|
204,971 | 225,163 | |||||
|
Total current assets
|
333,565 | 447,196 | |||||
|
Non-current assets
|
|||||||
|
Property and equipment, net
|
993,163 | 1,116,281 | |||||
|
Net intangible assets and goodwill
|
51,760 | 57,864 | |||||
|
Deferred income taxes
|
77,170 | 75,319 | |||||
|
Other non-current assets (2)
|
99,412 | 98,120 | |||||
|
Total non-current assets
|
1,221,505 | 1,347,584 | |||||
|
Total assets
|
1,555,070 | 1,794,780 | |||||
|
LIABILITIES AND EQUITY
|
|||||||
|
Current liabilities
|
|||||||
|
Accounts payable
|
171,990 | 220,337 | |||||
|
Taxes payable (3)
|
89,439 | 120,763 | |||||
|
Accrued payroll and other liabilities
|
86,702 | 112,072 | |||||
|
Other current liabilities (4)
|
17,751 | 37,580 | |||||
|
Provision for contingencies
|
673 | 777 | |||||
|
Financial debt (5)
|
58,205 | 49,642 | |||||
|
Deferred income taxes
|
818 | 895 | |||||
|
Total current liabilities
|
425,578 | 542,066 | |||||
|
Non-current liabilities
|
|||||||
|
Accrued payroll and other liabilities
|
18,367 | 18,440 | |||||
|
Provision for contingencies
|
10,560 | 11,427 | |||||
|
Financial debt (6)
|
711,813 | 761,080 | |||||
|
Deferred income taxes
|
4,294 | 4,180 | |||||
|
Total non-current liabilities
|
745,034 | 795,127 | |||||
|
Total liabilities
|
1,170,612 | 1,337,193 | |||||
|
Equity
|
|||||||
|
Class A shares of common stock
|
365,701 | 365,701 | |||||
|
Class B shares of common stock
|
132,915 | 132,915 | |||||
|
Additional paid-in capital
|
16,981 | 15,974 | |||||
|
Retained earnings
|
216,558 | 244,791 | |||||
|
Accumulated other comprehensive losses
|
(348,412 | ) | (302,467 | ) | |||
|
Total Arcos Dorados Holdings Inc shareholders’ equity
|
383,743 | 456,914 | |||||
|
Non-controlling interest in subsidiaries
|
715 | 673 | |||||
|
Total equity
|
384,458 | 457,587 | |||||
|
Total liabilities and equity
|
1,555,070 | 1,794,780 | |||||
|
(1) Includes "Other receivables", "Inventories", "Prepaid expenses and other current assets", "Deferred income taxes", and "Collateral deposits".
|
|||||||
|
(2) Includes "Miscellaneous", "Collateral deposits", "Derivative instruments" and "McDonald´s Corporation indemnification for contingencies".
|
|||||||
|
(3) Includes "Income taxes payable" and "Other taxes payable".
|
|||||||
|
(4) Includes "Royalties payable to McDonald´s Corporation" and "Interest payable".
|
|||||||
|
(5) Includes "Short-term debt", "Current portion of long-term debt" and "Derivative instruments".
|
|||||||
|
(6) Includes "Long-term debt, excluding current portion".
|
|||||||
16
Consolidated Financial Ratios
(In thousands of U.S. dollars, except ratios)
|
Figure 13. Consolidated Financial Ratios
(In thousands of U.S. dollars, except ratios)
|
|||||||
|
March 31
|
December 31 | ||||||
|
2015
|
2014
|
||||||
|
Cash & cash equivalents
|
71,888 | 139,030 | |||||
|
Total Financial Debt (i)
|
750,297 | 801,205 | |||||
|
Net Financial Debt (ii)
|
678,409 | 662,175 | |||||
|
Total Financial Debt / LTM Adjusted EBITDA ratio
|
3.1 | 3.2 | |||||
|
Net Financial Debt / LTM Adjusted EBITDA ratio
|
2.8 | 2.6 | |||||
|
(i)Total financial debt includes short-term debt, long-term debt and derivative instruments (including the asset portion of derivatives amounting to $19.7 million and $9.5 million as a reduction of financial debt as of March 31, 2015 and December 31, 2014, respectively).
|
|||||||
|
(ii) Total financial debt less cash and cash equivalents.
|
|||||||
17
Serious News for Serious Traders! Try StreetInsider.com Premium Free!
You May Also Be Interested In
- Pre-Investor Call Presentation available to shareholders
- NETA Auto: The First Car from the Indonesian Factory Powers up Global Strategy
- FD Capital Launches Head Of Finance Recruitment Team
Create E-mail Alert Related Categories
SEC FilingsSign up for StreetInsider Free!
Receive full access to all new and archived articles, unlimited portfolio tracking, e-mail alerts, custom newswires and RSS feeds - and more!
