

Form 8-K Hilltop Holdings Inc. For: Apr 30
 Tweet
Tweet Share
Share
UNITED STATES
SECURITIES AND EXCHANGE COMMISSION
Washington, D.C. 20549
FORM 8-K
CURRENT REPORT
Pursuant to Section 13 OR 15(d) of The Securities Exchange Act of 1934
Date of Report (Date of earliest event reported): April 30, 2015
Hilltop Holdings Inc.
(Exact name of registrant as specified in its charter)
|
Maryland |
|
1-31987 |
|
84-1477939 |
|
(State or other jurisdiction of |
|
(Commission |
|
(IRS Employer Identification |
|
incorporation) |
|
File Number) |
|
No.) |
|
200 Crescent Court, Suite 1330 |
|
|
|
Dallas, Texas |
|
75201 |
|
(Address of principal executive offices) |
|
(Zip Code) |
Registrant’s telephone number, including area code: (214) 855-2177
(Former name or former address, if changed since last report.)
Check the appropriate box below if the Form 8-K filing is intended to simultaneously satisfy the filing obligation of the registrant under any of the following provisions (see General Instruction A.2. below):
¨ Written communications pursuant to Rule 425 under the Securities Act (17 CFR 230.425)
¨ Soliciting material pursuant to Rule 14a-12 under the Exchange Act (17 CFR 240.14a-12)
¨ Pre-commencement communications pursuant to Rule 14d-2(b) under the Exchange Act (17 CFR 240.14d-2(b))
¨ Pre-commencement communications pursuant to Rule 13e-4(c) under the Exchange Act (17 CFR 240.13e-4(c))
Section 2 — Financial Information
Item 2.02 Results of Operations and Financial Condition.
On April 30, 2015, Hilltop Holdings Inc., or the Company, issued a press release announcing its results of operations and financial condition as of and for the three month period ended March 31, 2015. The text of the release is set forth in Exhibit 99.1 attached to this Current Report on Form 8-K and is incorporated herein by reference.
A copy of the Earnings Presentation of the Company for the quarter ended March 31, 2015 is set forth in Exhibit 99.2 attached to this Current Report on Form 8-K and is incorporated herein by reference. The Company intends to use the Earnings Presentation, in whole or in part, in one or more meetings with investors or analysts, including in a webcast on April 30, 2015 at 8:00 a.m. (central time).
The information in this Current Report on Form 8-K (including Exhibits 99.1 and 99.2) is being furnished pursuant to Item 2.02 and shall not be deemed to be “filed” for the purposes of Section 18 of the Securities Exchange Act of 1934, or otherwise subject to liabilities of that section, nor shall it be deemed incorporated by reference in any filing under the Securities Act of 1933, as amended, except as expressly set forth in such filing.
Section 9 — Financial Statements and Exhibits
Item 9.01 Financial Statements and Exhibits.
(a) Financial statements of businesses acquired.
Not applicable.
(b) Pro forma financial information.
Not applicable.
(c) Shell company transactions.
Not applicable.
(d) Exhibits.
The following exhibits are filed or furnished, depending on the relative item requiring such exhibit, in accordance with the provisions of Item 601 of Regulation S-K and Instruction B.2 to this form.
|
Exhibit |
|
Description of Exhibit |
|
|
|
|
|
99.1 |
|
Press Release dated April 30, 2015 (furnished pursuant to Item 2.02). |
|
|
|
|
|
99.2 |
|
First Quarter 2015 Earnings Presentation (furnished pursuant to Item 2.02). |
SIGNATURES
Pursuant to the requirements of the Securities Exchange Act of 1934, the registrant has duly caused this report to be signed on its behalf by the undersigned hereunto duly authorized.
|
|
|
Hilltop Holdings Inc., | |
|
|
|
a Maryland corporation | |
|
|
|
| |
|
|
|
| |
|
Date: April 30, 2015 |
By: |
/s/ COREY PRESTIDGE | |
|
|
|
Name: |
Corey G. Prestidge |
|
|
|
Title: |
Executive Vice President, |
|
|
|
|
General Counsel & Secretary |
INDEX TO EXHIBITS
|
Exhibit |
|
Description of Exhibit |
|
|
|
|
|
99.1 |
|
Press Release dated April 30, 2015 (furnished pursuant to Item 2.02). |
|
|
|
|
|
99.2 |
|
First Quarter 2015 Earnings Presentation (furnished pursuant to Item 2.02). |
Exhibit 99.1
|
|
Investor Relations Contact: |
|
|
Isabell Novakov |
|
|
214-252-4029 |
|
|
Hilltop Holdings Inc. Announces Financial Results for First Quarter 2015
DALLAS — (BUSINESS WIRE) April 30, 2015 — Hilltop Holdings Inc. (NYSE: HTH) (“Hilltop”) today announced financial results for the first quarter 2015. Hilltop produced income to common stockholders of $113.4 million, or $1.13 per diluted share, for the first quarter of 2015, compared to $23.8 million, or $0.26 per diluted share, for the first quarter of 2014. Hilltop’s annualized return on average assets and return on average equity for the first quarter of 2015 were 3.72% and 27.27%, respectively. The return on average assets and return on average equity for the first quarter of 2014 were 1.14% and 7.65%, respectively.
Jeremy Ford, CEO of Hilltop, said “We are excited to report strong results for the first quarter of 2015, which reflects purchase accounting related to the SWS acquisition, as well as favorable operating earnings from our subsidiaries. PlainsCapital Bank generated loan growth in its key markets, PrimeLending increased its mortgage originations year-over-year by 51%, and National Lloyds achieved an 82% combined ratio.”
Mr. Ford continued, “With the completion of our acquisition of SWS, this marks the initial quarter to include the operations of SWS in our consolidated results. The leadership team and employees of First Southwest and Southwest Securities have worked diligently and continue to make significant progress towards a full integration.”
Mr. Ford concluded, “Since 2011, Hilltop has grown from $925 million to $12.6 billion in assets through three key acquisitions as well as prudent organic growth. We continue to evaluate M&A opportunities to build our core banking franchise in Texas and remain focused on delivering profitable long-term results.”
First Quarter 2015 Highlights for Hilltop:
· On January 1, 2015, Hilltop completed its acquisition of SWS;
· Hilltop’s total assets increased to $12.6 billion at March 31, 2015, compared to $9.2 billion at December 31, 2014;
· Total stockholders’ equity increased by $321.1 million from December 31, 2014 to $1.8 billion at March 31, 2015;
· Non-covered loans(1) held for investment, net of allowance for loan losses, increased by 23.5% to $4.8 billion, and covered loans(1), net of allowance for loan losses, decreased by 13.7% to $550.6 million from December 31, 2014 to March 31, 2015;
· Loans held for sale decreased by 7.2% to $1.2 billion, from December 31, 2014 to March 31, 2015;
· Total deposits increased by $759.4 million from December 31, 2014 to $7.1 billion at March 31, 2015;
· Hilltop was well-capitalized with a Tier 1 Leverage Ratio(2) of 12.68% and Total Capital Ratio of 20.82% at March 31, 2015; and
· Hilltop continues to retain approximately $58.9 million of freely usable cash, as well as excess capital at our subsidiaries, at March 31, 2015.
(1) “Covered loans” refers to loans acquired in the FNB Transaction that are subject to loss-share agreements with the FDIC, while all other loans are referred to as “non-covered loans.”
(2) Based on the end of period Tier 1 capital divided by total average assets during the first quarter of 2015, excluding goodwill and intangible assets.
![]()
For the first quarter of 2015, consolidated taxable equivalent net interest income was $94.2 million compared with $86.0 million in the first quarter of 2014, a 9.5% increase, primarily due to the inclusion of operations acquired in the SWS Merger within our broker-dealer segment. The consolidated taxable equivalent net interest margin was 3.53% for the first quarter of 2015, a 109 basis point decrease from 4.62% in the first quarter of 2014, impacted by the securities lending business acquired in the SWS Merger. During the first quarter of 2015, the consolidated taxable equivalent net interest margin was 69 basis points greater due to purchase accounting and driven mainly by accretion of discount on loans of $17.0 million, offset by amortization of premium on acquired securities of $0.9 million.
For the first quarter of 2015, noninterest income was $354.4 million compared to $170.1 million in the first quarter of 2014, a 108.3% increase. The year-over-year change included the recognition of a preliminary bargain purchase gain related to the SWS Merger of $82.8 million during the quarter ended March 31, 2015. Net gains from sale of loans, other mortgage production income and mortgage loan origination fees increased $43.7 million from the first quarter of 2014 to $135.1 million in the first quarter of 2015. The increase was primarily driven by a decline in mortgage interest rates during the last three quarters of 2014 that continued into 2015. Refinancing volume increased to $1.1 billion during the three months ended March 31, 2015 from $397.4 million during the three months ended March 31, 2014 (representing 40.0% and 21.3%, respectively, of total loan origination volume). Home purchases volume during the three months ended March 31, 2015 and 2014 was $1.7 billion and $1.5 billion, respectively, a 15.0% increase. Improvement in the mortgage origination segment was partially offset by changes in the fair value of the MSR asset and the related derivatives, which resulted in a loss of $5.0 million during the three months ended March 31, 2015. Net insurance premiums earned decreased to $39.6 million in the first quarter of 2015 from $40.3 million in the first quarter of 2014, which was primarily attributable to previously discussed efforts to manage and diversify its business concentrations and products to minimize the effects of future weather-related events. Advisory fees and commissions from our broker-dealer segment increased $46.6 million to $68.0 million in the first quarter of 2015, primarily due to the operations acquired in the SWS Merger as well as increased volumes in our non-profit housing program and on higher revenues from advising public finance clients.
For the first quarter of 2015, noninterest expense was $314.5 million compared to $212.6 million in the first quarter of 2014, a 47.9% increase. Employees’ compensation and benefits increased $76.1 million, or 71.5%, to $182.6 million in the first quarter of 2015, primarily due to operations acquired in the SWS Merger as well as increased variable compensation tied to the mortgage origination and broker-dealer segments. Loss and loss adjustment expenses increased to $18.9 million in the first quarter of 2015 from $18.3 million in the first quarter of 2014, while policy acquisition and other underwriting expenses remained unchanged at $11.7 million during the first quarter of 2015 compared to the same quarter a year ago. Occupancy and equipment expense increased by $2.8 million from the first quarter of 2014 to $29.2 million in the first quarter of 2015 and other noninterest expense increased by $22.3 million from the first quarter of 2014 to $72.2 million in the first quarter of 2015. Amortization of identifiable intangibles from purchase accounting was $2.8 million for the first quarter of 2015. In connection with the SWS Merger, we incurred $5.6 million in pre-tax transaction costs and pre-tax integration related costs associated with employee expenses and professional fees were $4.0 million and $0.4 million, respectively, during the three months ended March 31, 2015.
For the first quarter of 2015, the provision for loan losses was $2.7 million, compared to $3.2 million for the first quarter of 2014. The first quarter of 2015 provision was comprised of charges relating to newly originated loans and acquired loans without credit impairment at acquisition of $3.4 million, partially offset by the recapture of charges on purchased credit impaired (“PCI”) loans of $0.7 million. Net charge-offs on non-covered loans for the first quarter of 2015 were $0.5 million, and the allowance for non-covered loan losses was $39.4 million, or 0.81% of total non-covered loans at March 31, 2015. Non-covered, non-performing assets at March 31, 2015 were $32.8 million, or 0.26% of total assets, compared to $23.2 million, or 0.25% of total assets, at December 31, 2014.
Senior Notes Offering
On April 9, 2015, Hilltop completed an offering of $150.0 million aggregate principal amount of its 5% senior notes due 2025 (“Senior Notes”) in a private offering that was exempt from the registration requirements of the Securities Act of 1933, as amended (the “Securities Act”). The Senior Notes were offered within the United States only to qualified institutional buyers pursuant to Rule 144A under the Securities Act, and to persons outside of the United States under Regulation S under the Securities Act. The Senior Notes were issued pursuant to an indenture, dated as of April 9, 2015, by and between Hilltop and U.S. Bank National Association, as trustee. The net proceeds from the offering, after deducting estimated fees and expenses and the initial purchaser’ discounts, were approximately $148 million. Hilltop used the net proceeds of the offering to redeem all of Hilltop’s outstanding Non-Cumulative Perpetual Preferred Stock, Series B at an aggregate liquidation value of $114.1 million, plus accrued but unpaid dividends of $0.4 million and Hilltop will utilize the remainder for general corporate purposes.
|
Condensed Balance Sheet |
|
March 31, |
|
December 31, |
|
September 30, |
|
June 30, |
|
March 31, |
|
|
($000s) |
|
2015 |
|
2014 |
|
2014 |
|
2014 |
|
2014 |
|
|
Cash and due from banks |
|
694,108 |
|
782,473 |
|
635,933 |
|
673,972 |
|
889,950 |
|
|
Securities |
|
1,363,157 |
|
1,109,461 |
|
1,332,342 |
|
1,328,716 |
|
1,329,690 |
|
|
Loans held for sale |
|
1,215,308 |
|
1,309,693 |
|
1,272,813 |
|
1,410,873 |
|
887,200 |
|
|
Non-covered loans, net of unearned income |
|
4,834,687 |
|
3,920,476 |
|
3,768,843 |
|
3,714,837 |
|
3,646,946 |
|
|
Allowance for non-covered loan losses |
|
(39,365 |
) |
(37,041 |
) |
(39,027 |
) |
(36,431 |
) |
(34,645 |
) |
|
Non-covered loans, net |
|
4,795,322 |
|
3,883,435 |
|
3,729,816 |
|
3,678,406 |
|
3,612,301 |
|
|
Covered loans, net of allowance for loan losses |
|
550,626 |
|
638,029 |
|
747,514 |
|
840,898 |
|
909,783 |
|
|
Broker-dealer and clearing organization receivables |
|
2,222,517 |
|
167,884 |
|
223,679 |
|
190,764 |
|
174,442 |
|
|
Covered other real estate owned |
|
137,703 |
|
136,945 |
|
126,798 |
|
142,174 |
|
152,310 |
|
|
FDIC indemnification asset |
|
107,567 |
|
130,437 |
|
149,788 |
|
175,114 |
|
188,736 |
|
|
Premises and equipment, net |
|
215,684 |
|
206,991 |
|
205,734 |
|
201,545 |
|
202,155 |
|
|
Other assets |
|
1,260,902 |
|
877,068 |
|
755,985 |
|
753,986 |
|
686,865 |
|
|
Total assets |
|
12,562,894 |
|
9,242,416 |
|
9,180,402 |
|
9,396,448 |
|
9,033,432 |
|
|
|
|
|
|
|
|
|
|
|
|
|
|
|
Deposits |
|
7,129,277 |
|
6,369,892 |
|
6,236,282 |
|
6,155,310 |
|
6,663,176 |
|
|
Broker-dealer and clearing organization payables |
|
1,951,040 |
|
179,042 |
|
243,835 |
|
227,891 |
|
161,888 |
|
|
Short-term borrowings |
|
999,476 |
|
762,696 |
|
845,984 |
|
1,187,193 |
|
491,406 |
|
|
Notes payable |
|
108,682 |
|
56,684 |
|
55,684 |
|
55,584 |
|
55,465 |
|
|
Other liabilities |
|
592,100 |
|
412,863 |
|
374,873 |
|
373,308 |
|
306,284 |
|
|
Total liabilities |
|
10,780,575 |
|
7,781,177 |
|
7,756,658 |
|
7,999,286 |
|
7,678,219 |
|
|
Total Hilltop stockholders’ equity |
|
1,781,443 |
|
1,460,452 |
|
1,422,975 |
|
1,396,442 |
|
1,354,497 |
|
|
Noncontrolling interest |
|
876 |
|
787 |
|
769 |
|
720 |
|
716 |
|
|
Total liabilities & stockholders’ equity |
|
12,562,894 |
|
9,242,416 |
|
9,180,402 |
|
9,396,448 |
|
9,033,432 |
|
|
|
|
Three Months Ended |
| ||||||||
|
Condensed Income Statement |
|
March 31, |
|
December 31, |
|
September 30, |
|
June 30, |
|
March 31, |
|
|
($000s) |
|
2015 |
|
2014 |
|
2014 |
|
2014 |
|
2014 |
|
|
Interest income |
|
107,669 |
|
99,316 |
|
93,217 |
|
104,408 |
|
91,828 |
|
|
Interest expense |
|
14,277 |
|
7,802 |
|
7,457 |
|
5,962 |
|
6,407 |
|
|
Net interest income |
|
93,392 |
|
91,514 |
|
85,760 |
|
98,446 |
|
85,421 |
|
|
Provision for loan losses |
|
2,687 |
|
4,125 |
|
4,033 |
|
5,533 |
|
3,242 |
|
|
Net interest income after provision for loan losses |
|
90,705 |
|
87,389 |
|
81,727 |
|
92,913 |
|
82,179 |
|
|
Noninterest income |
|
354,372 |
|
213,795 |
|
212,135 |
|
203,281 |
|
170,100 |
|
|
Noninterest expense |
|
314,476 |
|
246,768 |
|
254,744 |
|
251,212 |
|
212,629 |
|
|
Income before income taxes |
|
130,601 |
|
54,416 |
|
39,118 |
|
44,982 |
|
39,650 |
|
|
Income tax expense |
|
15,420 |
|
20,950 |
|
14,010 |
|
16,294 |
|
14,354 |
|
|
Net income |
|
115,181 |
|
33,466 |
|
25,108 |
|
28,688 |
|
25,296 |
|
|
Less: Net income attributable to noncontrolling interest |
|
353 |
|
325 |
|
296 |
|
177 |
|
110 |
|
|
Income attributable to Hilltop |
|
114,828 |
|
33,141 |
|
24,812 |
|
28,511 |
|
25,186 |
|
|
Dividends on preferred stock |
|
1,426 |
|
1,425 |
|
1,426 |
|
1,426 |
|
1,426 |
|
|
Income applicable to Hilltop common stockholders |
|
113,402 |
|
31,716 |
|
23,386 |
|
27,085 |
|
23,760 |
|
|
|
|
Three Months Ended |
| ||||||||
|
|
|
March 31, |
|
December 31, |
|
September 30, |
|
June 30, |
|
March 31, |
|
|
Selected Financial Data |
|
2015 |
|
2014 |
|
2014 |
|
2014 |
|
2014 |
|
|
Return on average stockholders’ equity |
|
27.27 |
% |
8.55 |
% |
6.51 |
% |
7.99 |
% |
7.65 |
% |
|
Return on average assets |
|
3.72 |
% |
1.42 |
% |
1.03 |
% |
1.24 |
% |
1.14 |
% |
|
Net interest margin (taxable equivalent) |
|
3.53 |
% |
4.72 |
% |
4.38 |
% |
5.18 |
% |
4.62 |
% |
|
Earnings per common share ($): |
|
|
|
|
|
|
|
|
|
|
|
|
Basic |
|
1.13 |
|
0.35 |
|
0.26 |
|
0.30 |
|
0.26 |
|
|
Diluted |
|
1.13 |
|
0.35 |
|
0.26 |
|
0.30 |
|
0.26 |
|
|
Weighted average shares outstanding (000’s): |
|
|
|
|
|
|
|
|
|
|
|
|
Basic |
|
99,741 |
|
89,713 |
|
89,711 |
|
89,709 |
|
89,707 |
|
|
Diluted |
|
100,627 |
|
90,560 |
|
90,558 |
|
90,569 |
|
90,585 |
|
|
Book value per share ($) |
|
16.63 |
|
14.93 |
|
14.51 |
|
14.22 |
|
13.76 |
|
|
Shares outstanding (000’s) |
|
100,286 |
|
90,182 |
|
90,180 |
|
90,181 |
|
90,178 |
|
|
|
|
March 31, |
|
December 31, |
|
September 30, |
|
June 30, |
|
March 31, |
|
|
Capital Ratios |
|
2015 |
|
2014 |
|
2014 |
|
2014 |
|
2014 |
|
|
|
|
|
|
|
|
|
|
|
|
|
|
|
Tier 1 capital (to average quarterly assets): |
|
|
|
|
|
|
|
|
|
|
|
|
Bank |
|
11.34 |
% |
10.31 |
% |
9.95 |
% |
9.97 |
% |
9.53 |
% |
|
Hilltop |
|
12.68 |
% |
14.17 |
% |
13.63 |
% |
13.51 |
% |
13.12 |
% |
|
Common Equity Tier 1 capital (to risk-weighted assets): |
|
|
|
|
|
|
|
|
|
|
|
|
Bank |
|
16.46 |
% |
NA |
|
NA |
|
NA |
|
NA |
|
|
Hilltop |
|
18.05 |
% |
NA |
|
NA |
|
NA |
|
NA |
|
|
Tier 1 capital (to risk-weighted assets): |
|
|
|
|
|
|
|
|
|
|
|
|
Bank |
|
16.46 |
% |
13.74 |
% |
13.48 |
% |
13.22 |
% |
13.47 |
% |
|
Hilltop |
|
20.26 |
% |
19.02 |
% |
18.57 |
% |
18.11 |
% |
18.66 |
% |
|
Total capital (to risk-weighted assets): |
|
|
|
|
|
|
|
|
|
|
|
|
Bank |
|
17.19 |
% |
14.45 |
% |
14.21 |
% |
13.90 |
% |
14.14 |
% |
|
Hilltop |
|
20.82 |
% |
19.69 |
% |
19.28 |
% |
18.79 |
% |
19.32 |
% |
|
|
|
Three Months Ended |
|
Three Months Ended |
| ||||||||||||
|
|
|
March 31, 2015 |
|
March 30, 2014 |
| ||||||||||||
|
|
|
Average |
|
Interest |
|
Annualized |
|
Average |
|
Interest |
|
Annualized |
| ||||
|
|
|
Outstanding |
|
Earned or |
|
Yield or |
|
Outstanding |
|
Earned or |
|
Yield or |
| ||||
|
|
|
Balance |
|
Paid |
|
Rate |
|
Balance |
|
Paid |
|
Rate |
| ||||
|
Assets |
|
|
|
|
|
|
|
|
|
|
|
|
| ||||
|
Interest-earning assets |
|
|
|
|
|
|
|
|
|
|
|
|
| ||||
|
Loans, gross (1) |
|
$ |
6,354,615 |
|
$ |
87,388 |
|
5.50 |
% |
$ |
5,068,892 |
|
$ |
79,744 |
|
6.29 |
% |
|
Investment securities - taxable |
|
1,164,030 |
|
7,049 |
|
2.80 |
% |
1,122,241 |
|
7,588 |
|
2.71 |
% | ||||
|
Investment securities - non-taxable (2) |
|
264,123 |
|
2,525 |
|
3.84 |
% |
183,143 |
|
1,861 |
|
4.06 |
% | ||||
|
Federal funds sold and securities purchased under agreements to resell |
|
70,449 |
|
17 |
|
0.10 |
% |
26,336 |
|
19 |
|
0.29 |
% | ||||
|
Interest-bearing deposits in other financial institutions |
|
872,032 |
|
574 |
|
0.27 |
% |
966,921 |
|
595 |
|
0.25 |
% | ||||
|
Other |
|
2,088,380 |
|
10,901 |
|
2.11 |
% |
188,276 |
|
2,640 |
|
5.67 |
% | ||||
|
Interest-earning assets, gross |
|
10,813,629 |
|
108,454 |
|
4.06 |
% |
7,555,809 |
|
92,447 |
|
4.90 |
% | ||||
|
Allowance for loan losses |
|
(41,424 |
) |
|
|
|
|
(36,861 |
) |
|
|
|
| ||||
|
Interest-earning assets, net |
|
10,772,205 |
|
|
|
|
|
7,518,948 |
|
|
|
|
| ||||
|
Noninterest-earning assets |
|
1,796,232 |
|
|
|
|
|
1,432,519 |
|
|
|
|
| ||||
|
Total assets |
|
$ |
12,568,437 |
|
|
|
|
|
$ |
8,951,467 |
|
|
|
|
| ||
|
|
|
|
|
|
|
|
|
|
|
|
|
|
| ||||
|
Liabilities and Stockholders’ Equity |
|
|
|
|
|
|
|
|
|
|
|
|
| ||||
|
Interest-bearing liabilities |
|
|
|
|
|
|
|
|
|
|
|
|
| ||||
|
Interest-bearing deposits |
|
$ |
5,104,544 |
|
$ |
4,315 |
|
0.34 |
% |
$ |
4,949,212 |
|
$ |
3,759 |
|
0.31 |
% |
|
Notes payable and other borrowings |
|
2,877,686 |
|
9,962 |
|
1.40 |
% |
664,072 |
|
2,648 |
|
1.60 |
% | ||||
|
Total interest-bearing liabilities |
|
7,982,230 |
|
14,277 |
|
0.72 |
% |
5,613,284 |
|
6,407 |
|
0.46 |
% | ||||
|
Noninterest-bearing liabilities |
|
|
|
|
|
|
|
|
|
|
|
|
| ||||
|
Noninterest-bearing deposits |
|
2,152,610 |
|
|
|
|
|
1,721,403 |
|
|
|
|
| ||||
|
Other liabilities |
|
725,469 |
|
|
|
|
|
285,121 |
|
|
|
|
| ||||
|
Total liabilities |
|
10,860,309 |
|
|
|
|
|
7,619,808 |
|
|
|
|
| ||||
|
Stockholders’ equity |
|
1,707,624 |
|
|
|
|
|
1,331,243 |
|
|
|
|
| ||||
|
Noncontrolling interest |
|
504 |
|
|
|
|
|
416 |
|
|
|
|
| ||||
|
Total liabilities and stockholders’ equity |
|
$ |
12,568,437 |
|
|
|
|
|
$ |
8,951,467 |
|
|
|
|
| ||
|
|
|
|
|
|
|
|
|
|
|
|
|
|
| ||||
|
Net interest income(2) |
|
|
|
$ |
94,177 |
|
|
|
|
|
$ |
86,040 |
|
|
| ||
|
Net interest spread(2) |
|
|
|
|
|
3.34 |
% |
|
|
|
|
4.44 |
% | ||||
|
Net interest margin(2) |
|
|
|
|
|
3.53 |
% |
|
|
|
|
4.62 |
% | ||||
(1) Average balance includes non-accrual loans.
(2) Annualized taxable equivalent adjustments are based on a 35% tax rate. The adjustment to interest income was $0.8 million and $0.6 million for the three months ended March 31, 2015 and 2014, respectively.
Conference Call Information
Hilltop will host a live webcast and conference call at 8:00 AM Central (9:00 AM Eastern), Thursday, April 30, 2015. Hilltop President and CEO Jeremy B. Ford and other key management members will discuss results for the first quarter of 2015. Interested parties can access the conference call by dialing 1-877-508-9457 (domestic) or 1-412-317-0789 (international). The conference call also will be webcast simultaneously on Hilltop’s Investor Relations website (http://ir.hilltop-holdings.com).
About Hilltop
Hilltop Holdings is a Dallas-based financial holding company. Through its wholly owned subsidiary, PlainsCapital Corporation, a regional commercial banking franchise, it has two operating subsidiaries: PlainsCapital Bank and PrimeLending. Under Hilltop Securities Holdings LLC, First Southwest, Southwest Securities and SWS Financial Services provide a full complement of securities brokerage, institutional and investment banking services in addition to clearing services and retail financial advisory. Through Hilltop Holdings’ other wholly owned subsidiary, National Lloyds Corporation, it provides property and casualty insurance through two insurance companies, National Lloyds Insurance Company and American Summit Insurance Company. At March 31, 2015, Hilltop employed approximately 5,300 people and operated approximately 450 locations in 44 states. Hilltop Holdings’ common stock is listed on the New York Stock Exchange under the symbol “HTH.” Find more information at Hilltop-Holdings.com, PlainsCapital.com, Firstsw.com and Swst.com.
FORWARD-LOOKING STATEMENTS
This press release contains forward-looking statements within the meaning of the Private Securities Litigation Reform Act of 1995. These forward-looking statements involve known and unknown risks, uncertainties and other factors that may cause our actual results, performance or achievements to be materially different from any future results, performance or achievements anticipated in such statements. Forward-looking statements speak only as of the date they are made and, except as required by law, we do not assume any duty to update forward-looking statements. Such forward-looking statements include, but are not limited to, statements concerning such things as our business strategy, our financial condition, our litigation, our efforts to make strategic acquisitions, our recent acquisition of SWS Group, Inc. (“SWS”) and integration thereof, our revenue, our liquidity and sources of funding, market trends, operations and business, expectations concerning mortgage loan origination volume, expected losses on covered loans and related reimbursements from the Federal Deposit Insurance Corporation (“FDIC”), projected losses on mortgage loans originated, anticipated changes in our revenues or earnings, the effects of government regulation applicable to our operations, the appropriateness of our allowance for loan losses and provision for loan losses, the collectability of loans, our other plans, objectives, strategies, expectations and intentions and other statements that are not statements of historical fact, and may be identified by words such as “anticipates,” “believes,” “could,” “estimates,” “expects,” “forecasts,” “goal,” “intends,” “may,” “might,” “probable,” “projects,” “seeks,” “should,” “view,” or “would” or the negative of these words and phrases or similar words or phrases. The following factors, among others, could cause actual results to differ from those set forth in the forward-looking statements: (i) risks associated with merger and acquisition integration, including the diversion of management time on acquisition-related issues and our ability to promptly and effectively integrate our businesses with those of SWS and achieve the synergies and value creation contemplated by the acquisition; (ii) our ability to estimate loan losses; (iii) changes in the default rate of our; (iv) risks associated with concentration in real estate related loans; (v) our ability to obtain reimbursements for losses on acquired loans under loss-share agreements with the FDIC; (vi) changes in general economic, market and business conditions in areas or markets where we compete; (vii) severe catastrophic events in Texas and other areas of the southern United States; (viii) changes in the interest rate environment; (ix) cost and availability of capital; (x) changes in state and federal laws, regulations or policies affecting one or more of the Company’s business segments, including changes in regulatory fees, deposit insurance premiums, capital requirements and the Dodd-Frank Wall Street Reform and Consumer Protection Act; (xi) our ability to use net operating loss carry forwards to reduce future tax payments; (xii) approval of new, or changes in, accounting policies and practices; (xiii) changes in key management; (xiv) competition in our banking, broker-dealer, mortgage origination, and insurance segments from other banks and financial institutions, as well as investment banking and financial advisory firms, mortgage bankers, asset-based non-bank lenders, government agencies and insurance companies; (xv) failure of our insurance segment reinsurers to pay obligations under reinsurance contracts; and (xvi) our ability to use excess cash in an effective manner, including the execution of
successful acquisitions. For further discussion of such factors, see the risk factors described in the Hilltop Annual Report on Form 10-K for the year ended December 31, 2014 and other reports filed with the Securities and Exchange Commission. All forward-looking statements are qualified in their entirety by this cautionary statement.
Source: Hilltop Holdings Inc.
Exhibit 99.2
|
|
Hilltop Holdings Inc. Q1 2015 Earnings Presentation Investor Presentation April 30, 2015 |

|
|
Preface 2 200 Crescent Court, Suite 1330 Dallas, TX 75201 Phone: (214) 855-2177 Fax: (817) 887-1687 www.hilltop-holdings.com Please contact: Isabell Novakov Phone: (214) 252-4029 Email: [email protected] FORWARD-LOOKING STATEMENTS This presentation and statements made by representatives of Hilltop Holdings Inc. (“Hilltop” or the “Company”) during the course of this presentation include “forward-looking statements” within the meaning of the Private Securities Litigation Reform Act of 1995. These forward-looking statements involve known and unknown risks, uncertainties and other factors that may cause the Company’s actual results, performance or achievements to be materially different from any future results, performance or achievements anticipated in such statements. Forward-looking statements speak only as of the date they are made and, except as required by law, the Company does not assume any duty to update forward-looking statements. Such forward-looking statements include, but are not limited to, statements concerning such things as our business strategy, our financial condition, our litigation, our efforts to make strategic acquisitions, our recent acquisition of SWS Group, Inc. (“SWS”) and integration thereof, our revenue, our liquidity and sources of funding, market trends, operations and business, expectations concerning mortgage loan origination volume, expected losses on covered loans and related reimbursements from the Federal Deposit Insurance Corporation (“FDIC”), projected losses on mortgage loans originated, anticipated changes in our revenues or earnings, the effects of government regulation applicable to our operations, the appropriateness of our allowance for loan losses and provision for loan losses, the collectability of loans, the Company’s other plans, objectives, strategies, expectations and intentions and other statements that are not statements of historical fact, and may be identified by words such as “anticipates,” “believes,” “could,” “estimates,” “expects,” “forecasts,” “goal,” “intends,” “may,” “might,” “probable,” “projects,” “seeks,” “should,” “view,” or “would” or the negative of these words and phrases or similar words or phrases. The following factors, among others, could cause actual results to differ from those set forth in the forward-looking statements: (i) risks associated with merger and acquisition integration, including the diversion of management time on acquisition-related issues and our ability to promptly and effectively integrate our businesses with those of SWS and achieve the synergies and value creation contemplated by the acquisition; (ii) the Company’s ability to estimate loan losses; (iii) changes in the default rate of the Company’s loans; (iv) risks associated with concentration in real estate related loans; (v) the Company’s ability to obtain reimbursements for losses on acquired loans under loss-share agreements with the FDIC; (vi) changes in general economic, market and business conditions in areas or markets where the Company competes; (vii) severe catastrophic events in Texas and other areas of the southern United States; (viii) changes in the interest rate environment; (ix) cost and availability of capital; (x) changes in state and federal laws, regulations or policies affecting one or more of the Company’s business segments, including changes in regulatory fees, deposit insurance premiums, capital requirements and the Dodd-Frank Wall Street Reform and Consumer Protection Act; (xi) the Company’s ability to use net operating loss carry forwards to reduce future tax payments; (xii) approval of new, or changes in, accounting policies and practices; (xiii) changes in key management; (xiv) competition in the Company’s banking, broker-dealer, mortgage origination, and insurance segments from other banks and financial institutions, as well as investment banking and financial advisory firms, mortgage bankers, asset-based non-bank lenders, government agencies and insurance companies; (xv) failure of the Company’s insurance segment reinsurers to pay obligations under reinsurance contracts; and (xvi) the Company’s ability to use excess cash in an effective manner, including the execution of successful acquisitions. For further discussion of such factors, see the risk factors described in the Hilltop Annual Report on Form 10-K for the year ended December 31, 2014 and other reports filed with the Securities and Exchange Commission. All forward-looking statements are qualified in their entirety by this cautionary statement. Corporate Headquarters Additional Information |
|
|
3 Hilltop Holdings – Q1 2015 Highlights For the first quarter of 2015, net income to common stockholders was $113.4 million, or $1.13 per diluted share First quarter 2015 adjusted net income was $38.8 million1, or $0.39 per diluted share, when excluding the bargain purchase gain and transaction and integration costs related to the SWS Merger (closed January 1, 2015) For the first quarter of 2014, net income to common stockholders was $23.8 million, or $0.26 per diluted share ROAA was 3.72% in Q1 2015, relative to 1.14% in Q1 2014 ROAE was 27.27% in Q1 2015, relative to 7.65% in Q1 2014 Hilltop’s four operating segments reported $140.2 million in pre-tax income during Q1 2015 PlainsCapital Bank contributed $81.2 million of pre-tax income, including a preliminary bargain purchase gain of $39.5 million Hilltop Securities Holdings contributed $39.9 million of pre-tax income, including a preliminary bargain purchase gain of $43.3 million PrimeLending contributed $10.0 million of pre-tax income National Lloyds Corporation contributed $9.1 million of pre-tax income Total stockholders’ equity increased to $1.8 billion at March 31, 2015, up $321.1 million from Dec. 31, 2014 Hilltop remains well-capitalized with a 12.68% Tier 1 Leverage Ratio2 and a 20.82% Total Risk Based Capital Ratio Hilltop had approximately $59 million of freely usable cash at quarter end and retains excess capital at subsidiaries On April 9, 2015, Hilltop issued $150 million of 10 year senior debt at 5.00% On April 28, 2015, Hilltop used proceeds of $114.5 million from the offering to redeem all of its outstanding Non-Cumulative Series B Perpetual Preferred Stock and associated accrued but unpaid dividends Remaining excess cash from the debt issuance will be used for for general corporate purposes Will continue to be disciplined and seek new bank M&A opportunities in 2015, while focusing internally on an efficient integration of the broker-dealers Note: (1) See appendix for reconciliation of reported net income to adjusted net income as presented (2) Based on the end of period Tier 1 capital divided by total average assets during the respective quarter, excluding goodwill and intangible assets |
|
|
4 Hilltop Holdings – Financial Summary Selected Items Q1 2014 Q4 2014 Q1 2015 Net Income to Common ($000) 23,760 31,716 113,402 EPS - Diluted ($) $0.26 $0.35 $1.13 Book Value Per Share ($) $13.76 $14.93 $16.63 NIM (taxable equivalent) 4.62% 4.72% 3.53% Assets ($000) 9,033,432 9,242,416 12,562,894 Loans HFI, Gross ($000) 4,559,394 4,563,116 5,386,701 Deposits ($000) 6,663,176 6,369,892 7,129,277 Hilltop Stockholders’ Equity ($000) 1,354,497 1,460,452 1,781,443 NPLs/Total Loans 1 0.51% 0.42% 0.44% NPAs/Total Assets1 0.32% 0.25% 0.26% Tier 1 Leverage Ratio2 13.12% 14.17% 12.68% Total Risk Based Capital Ratio 19.32% 19.69% 20.82% Notes: (1) NPLs, NPAs and Total Loans exclude covered loans and covered OREO (2) Based on the end of period Tier 1 capital divided by total average assets during the quarter, excluding goodwill and intangible assets |
|
|
5 Hilltop Holdings – Net Interest Income & Margin Stated NIM decreased by 119 bps in Q1 2015 to 3.53% compared with 4.72% in Q4 2014 primarily due to the inclusion of the stock loan business from SWS Average balance of other earning assets and other borrowings increased approximately $2 billion each during Q1 2015 (legacy SWS stock loan business) Cost of interest bearing deposits down 11 bps vs Q4 2014 For Q1 2015, the tax equivalent NIM for Hilltop was 69 bps greater due to purchase accounting, driven mainly by: Accretion of discount on loans of $17.0 million Amortization of premium on acquired securities of $0.9 million Annual Yields and Rates (%) Q1 2014 Q4 2014 Q1 2015 Interest Earning Assets Loans, Gross 6.29 6.25 5.50 Investment Securities, Taxable 2.71 2.49 2.80 Investment Securities, Non-Taxable 4.06 3.73 3.84 Fed Funds Sold and Securities to Resell 0.29 0.31 0.10 Interest Earning Deposits 0.25 0.22 0.27 Other 5.67 4.27 2.11 Total Int. Earning Assets 4.90 5.09 4.06 Interest Bearing Liabilities Interest Bearing Deposits 0.31 0.45 0.34 Notes Payable and Borrowings 1.60 1.28 1.40 Total Int. Bearing Liabilities 0.46 0.60 0.72 Net Interest Margin (Stated) 4.62 4.72 3.53 Net Interest Margin (Pre-PAA) 3.35 3.53 2.84 Net Interest Spread 4.44 4.49 3.34 |
|
|
6 Hilltop Holdings – Noninterest Income Including the preliminary bargain purchase gain associated with the SWS Merger, noninterest income for Q1 2015 was $354.4 million Excluding the preliminary bargain purchase gain, noninterest income for Q1 2015 was $271.6 million, up 59.6% from Q1 2014 Investment advisory fees & commissions increased $46.6 million from Q1 2014 to $68.0 million in Q1 2015, representing 25% of noninterest income for the quarter Net gains from the sale of loans, other mortgage production income, and mortgage loan origination fees increased $43.7 million, or 47.8%, from Q1 2014 to $135.1 million in Q1 2015, representing 50% of noninterest income for the quarter Net insurance premiums earned were $39.6 million in Q1 2015, representing 15% of noninterest income for the quarter Note: Component % of noninterest income excludes bargain purchase gain from noninterest income total. Noninterest income without preliminary bargain purchase gain presented because certain investors may use it to evaluate our business and financial results. 91.5 135.1 40.3 39.6 21.3 68.0 17.0 28.9 82.8 $170.1 $354.4 $0.0 $100.0 $200.0 $300.0 $400.0 Q1 2014 Q1 2015 Noninterest Income ($M) Bargain Purchase Gain Other Investment Advisory Fees & Commissions Net Insurance Premium Earned Gains on Sale, Mortgage Origination Fees, Other Mortgage Income |
|
|
7 Hilltop Holdings – Noninterest Expense Noninterest expense was $314.5 million in Q1 2015, up 47.9% from Q1 2014 During the quarter Hilltop incurred $5.6 million in transaction costs and another $4.4 million in integration costs associated with employee expenses, contractual costs and professional fees, all related to the SWS Merger Compensation increased $76.1 million, or 71.5%, from Q1 2014 to $182.6 million in Q1 2015, representing 58% of noninterest expense for the quarter Loss and LAE and policy acquisition and other underwriting expense were $30.5 in Q1 2015, representing 10% of noninterest expense for the quarter Occupancy and equipment expense increased $2.8 million, or 10.8%, from Q1 2014 to $29.2 million in Q1 2015, representing 9% of noninterest expense for the quarter Other expenses increased $22.3 million, or 44.8%, from Q1 2014 to $72.2 million in Q1 2015 Amortization of identifiable intangibles from purchase accounting was $2.8 million in Q1 2015 106.4 182.6 30.0 30.5 26.3 29.2 49.8 72.2 $212.6 $314.5 $0.0 $100.0 $200.0 $300.0 $400.0 Q1 2014 Q1 2015 Noninterest Expense ($M) Other Occupancy and Equipment Loss, LAE, Policy Acquisition and Other Underwriting Expense Compensation and Benefits |
|
|
Hilltop Holdings – Balance Sheet Total assets increased in Q1 2015 relative to prior quarters primarily due to the inclusion of SWS Gross non-covered loans HFI increased $914.2 million, or 23.3%, from Q4 2014 to $4.8 billion at Q1 2015 Gross covered loans decreased $90.6 million, or 14.1%, from Q4 2014 to $552.0 million at Q1 2015 due to successful ongoing efforts to resolve troubled loans acquired with FNB Transaction in Q3 2013 $360.4 million, or 39.5%, decrease versus Q1 2014 Covered OREO increased by $758 thousand versus Q4 2014 due to foreclosure of properties related to covered loans $14.6 million, or 9.6%, decrease versus Q1 2014 Gross loans HFI (covered and non-covered) to deposits ratio increased to 75.6% at Q1 2015, up from 71.6% at Q4 2014 Total deposits increased $759.4 million, or 11.9%, from Q4 2014 to $7.1 billion at Q1 2015 31.4% of total deposits are noninterest bearing Common equity increased $321.0 million, or 23.8%, from Q4 2014 to $1.7 billion at Q1 2015 due to earnings and the inclusion of SWS Subsequent to quarter end, Hilltop issued $150.0 million in senior notes; redeemed SBLF preferred in full on April 28th 8 ($000s) Q1 2014 Q4 2014 Q1 2015 Assets Cash & Federal Funds 917,410 813,075 708,533 Securities 1,329,690 1,109,461 1,363,157 Loans Held for Sale 887,200 1,309,693 1,215,308 Non-Covered Loans HFI, Gross 3,646,946 3,920,476 4,834,687 Allowance for Non-Covered Loan Losses (34,645) (37,041) (39,365) Non-Covered Loans HFI, Net 3,612,301 3,883,435 4,795,322 Covered Loans, Net of Allowance 909,783 638,029 550,626 Covered OREO 152,310 136,945 137,703 Broker-Dealer & Clearing Receivables 174,442 167,884 2,222,517 FDIC Indemnification Asset 188,736 130,437 107,567 Goodwill & Other Intangibles 319,916 311,591 319,760 Other Assets 541,644 741,866 1,142,401 Total Assets 9,033,432 9,242,416 12,562,894 Liabilities and Stockholders’ Equity Non-Int. Bearing Deposits 1,748,391 2,076,385 2,259,790 Int. Bearing Deposits 4,914,785 4,293,507 4,869,487 Total Deposits 6,663,176 6,369,892 7,129,277 Broker-Dealer & Clearing Payables 161,888 179,042 1,951,040 Short Term Borrowings 491,406 762,696 999,476 Notes Payable 55,465 56,684 108,682 Junior Subordinated Debentures 67,012 67,012 67,012 Other Liabilities 239,272 345,851 525,088 Total Liabilities 7,678,219 7,781,177 10,780,575 SBLF Preferred Stock 114,068 114,068 114,068 Common Equity 1,240,429 1,346,384 1,667,375 Total Hilltop Equity 1,354,497 1,460,452 1,781,443 Minority Interest 716 787 876 Total Liabilities & Equity 9,033,432 9,242,416 12,562,894 |
|
|
9 Company Operational Updates PlainsCapital Bank Non-covered HFI loan growth of 19% in the quarter following the acquisition of SWS Bank; favorable loan pipeline with $1.57 billion in total unfunded commitments versus $1.43 billion at Q4 2014 Strong net interest margin of 4.59% for the quarter 68 branches at 3/31/15 and continue to divest unprofitable branches acquired in the FNB Transaction As a result of the 13 FNB branch closures in the quarter, PCB expects annualized, pre-tax savings of approximately $4.8 million, which includes reduction in staff and occupancy costs. In addition, PCB will save approximately $4.7 million pre-tax annually following the rolling off of high yielding FNB CDs by the end of 2015 Expect to dispose of branch in Eagle Pass on or about June 1, 2015 3 new Coastal Bend branches in Corpus Christi, Alice and Victoria to open in Q2 2015 Legacy PCB’s credit quality remains strong – non-covered NPAs to total consolidated assets of 0.26% Energy exposure declined from 6.5% of loan portfolio at Q4 2014 to 5.8% at Q1 2015 SWS Bank Integration Update PlainsCapital Bank integrated SWS Bank quickly and completed systems conversion over the weekend of April 10, 2015 Since the transaction, the Bank has consolidated 4 SWS Bank branches resulting in closures of Albuquerque, Ruidoso, SW Fort Worth, El Paso and 3 lending production offices located in Houston, Austin and San Antonio (approximately $1.4 million in annual occupancy and other noninterest expense) 4 SWS Bank branches (Granbury, Dallas Renaissance, Arlington, Waxahachie) and two major business lines (commercial lending and mortgage purchase) will be retained SWS Bank had 138 employees on the close date of January 1, 2015; the Bank will retain approximately 60 employees following an early Q2 reduction in force (approximately $8.3 million in annual salary & benefit savings) PrimeLending PrimeLending had a profitable quarter driven by declining rates and resulting increase in refinancings, with 40% refinance volume in Q1 2015 compared to 21% in Q1 2014 Gain on sale margins flat between Q1 2015 and Q4 2014 Q1 2015 lock volume has grown 66% versus Q1 2014 to $4.4 billion Q1 2015 volume increased 51% compared with Q1 2014, even with lower loan officer headcount (currently 1,246) Gained market share in the quarter, increased to 0.98% during Q1 2015 compared to 0.92% during FY 2014 Source: Mortgage market share based on Mortgage Bankers Association volume projections. Note: Non-covered HFI loan growth excludes margin loans to customers and correspondents |
|
|
10 Company Operational Updates (Continued) Hilltop Securities Holdings Public finance revenue up $6.4 million in Q1 2015 compared to Q1 2014, driven by addition of SWS bankers, continued refinancings by clients and improving market share (now top 10 in Texas underwriting market share rankings) Structured Finance (legacy FirstSouthwest TBA business) continues to see improved year over year performance as a result of increased lock production SWS Broker-Dealer Integration Update Have established new leadership in key areas: Bob Peterson has been appointed as President/CEO of Southwest Securities (Mr. Peterson will still become President/COO once the broker-dealers have been combined) David Geschke is a new hire that will now lead our Retail efforts After a thorough evaluation process, the integration and management teams have chosen a service bureau provider for the combined broker-dealer Continued focus on systems integration and regulatory approvals in order to drive timely integration of the broker-dealers National Lloyds Corporation National Lloyds Corporation had a strong and profitable quarter – earned premiums were relatively flat (policies-in-force down while rates were up) and claim counts down year over year Hired new Marketing and Product executives to improve distribution efforts and product analysis, respectively Source: Public finance underwriter market share year to date ranking per Thomson Reuters as of April 21, 2015. |
|
|
11 Pre-tax income increased to $81.2 million in Q1 2015 versus $31.9 million in Q1 2014 primarily due to a $39.5 million preliminary bargain purchase gain related to the SWS Transaction Q1 2015 results also included $1.8 million of costs (employee expenses) directly attributable to integration of the former SWS Bank and a $4.4 million gain on sale of SWS Bank’s securities Net interest income growth was driven by non-covered loan growth and operations from the SWS Merger, while noninterest income increased due to increases in service charges and fees on deposits assumed with SWS Bank as well Noninterest expense declined as a result of platform efficiency initiatives, such as the closure of certain legacy FNB branches PrimeLending funds originations through a $1.5 billion warehouse line from PlainsCapital Bank; $1.1 billion was drawn at March 31, 2015 Tier 1 Leverage Ratio1 increased to 11.34%, up from 10.31% in Q4 2014 Notes: (1) Based on the end of period Tier 1 capital divided by total average assets during the respective quarter, excluding goodwill and intangible assets (2) Loans and deposits by type represents consolidated balances at Hilltop and, therefore, eliminate intercompany balances; C&I loans include amounts due on margin loans to customers and correspondents (held at broker-dealer) of $608.6 million at Q1 2015 PlainsCapital Bank – Q1 2015 Highlights Reported Summary Results ($000) Q1 2014 Q1 2015 Net Interest Income 79,572 83,442 Provision for Loan Losses (3,228) (2,486) Noninterest Income 16,228 58,775 Noninterest Expense (60,677) (58,532) Income Before Taxes 31,895 81,199 Key Highlights Q1 2014 Q1 2015 ROAA (%) 1.04 3.37 NIM (%) 4.80 4.59 Efficiency (%) 63.3 41.2 Fee Income (%) 16.9 41.3 Assets ($000) $8,018,568 $8,373,160 HTH Consolidated Loans HFI by Type HTH Consolidated Deposit Mix by Type Total Deposits2: $7.1 billion Total Loans2: $5.4 billion Non Int. Bearing Demand 32% NOW 16% Money Market 18% Demand 7% Savings 5% Time 22% C&I 42% Real Estate 47% C&D 10% Consumer 1% |
|
|
12 PlainsCapital Bank – Credit Quality and Capital Ratios Credit Quality Bank Capital Ratios 9.53% 9.97% 9.95% 10.31% 11.34% 13.47% 13.22% 13.48% 13.74% 16.46% 14.14% 13.90% 14.21% 14.45% 17.19% 0.00% 2.00% 4.00% 6.00% 8.00% 10.00% 12.00% 14.00% 16.00% 18.00% 20.00% Q1 2014 Q2 2014 Q3 2014 Q4 2014 Q1 2015 Tier 1 Leverage Ratio Tier 1 RBC Ratio Total RBC Ratio $29.0 $28.0 $27.0 $23.2 $32.8 $0.0 $10.0 $20.0 $30.0 $40.0 $50.0 $60.0 Q1 2014 Q2 2014 Q3 2014 Q4 2014 Q1 2015 Non - Covered NPAs ($M) |
|
|
PlainsCapital Bank – Loan Portfolio by Classification 13 Note: PCI stands for Purchased Credit Impaired loans. Loan classification mix represents consolidated balances at Hilltop and, therefore, eliminate intercompany loans. Amounts above equal carrying value, after deductions for discount Covered PCI Loans Covered Non-PCI Loans Non-Covered PCI Loans Non-Covered Non-PCI Loans Q1 2015 Total: $114.9 million Q1 2015 Total: $4,719.8 million Q1 2015 Total: $360.1 million Q1 2015 Total: $191.9 million C&I 5% Real Estate 84% C&D 11% C&I 3% Real Estate 91% C&D 6% C&I 17% Real Estate 73% C&D 8% Consumer 1% C&I 47% Real Estate 42% C&D 10% Consumer 1% |
|
|
PlainsCapital Bank – PCI Loans at March 31, 2015 14 ($000) Covered PCI Non-Covered PCI Total PCI Outstanding Balance 599,104 151,037 750,141 (Discount) (239,009) (36,169) (275,178) Carrying Amount 360,095 114,868 474,963 Allowance for Loan Loss 1,316 4,934 6,250 Total PCI Loans, Net of Allowance 358,779 109,934 468,713 Carrying Amount (Net of Allowance) / Outstanding Balance 59.9% 72.8% 62.5% Note: Outstanding balance represents unpaid principal balance net of charge-offs and interest applied to principal Purchased Credit Impaired (“PCI”) loans are loans with evidence of credit quality deterioration, for which it is probable that not all contractually required payments will be collected PCI loans include covered and non-covered loans PCI loans had a total discount of $275.2 million $239.0 million of the discount was related to covered loans Weighted average expected loss on PCI loans associated with each of the PlainsCapital Merger, FNB Transaction, and SWS Merger was 24%, 23%, and 19%, respectively |
|
|
PlainsCapital Bank – Non-PCI Loans at March 31, 2015 15 ($000) Covered Non-PCI Non-Covered Non-PCI Total Non-PCI Outstanding Balance 205,933 4,754,644 4,960,577 (Discount) (14,014) (34,825) (48,839) Carrying Amount 191,919 4,719,819 4,911,738 Allowance for Loan Loss 72 34,431 34,503 Total Non-PCI Loans, Net of Allowance 191,847 4,685,388 4,877,235 Carrying Amount (Net of Allowance) / Outstanding Balance 93.2% 98.5% 98.3% Note: Outstanding balance represents unpaid principal balance net of charge-offs and interest applied to principal Non-PCI loans include newly originated loans, acquired loans without credit impairment at acquisition, and acquired loans that have renewed Non-PCI loans include covered loans and non-covered loans Portfolio on balance sheet at 98.3% unpaid principal balance with a total discount of $48.8 million $34.8 million discount was related to non-covered loans, while covered loans had a $14.0 million discount |
|
|
16 PrimeLending – Q1 2015 Highlights Pre-tax income grew to $10.0 million in Q1 2015 versus a pre-tax loss of $3.0 million in Q1 2014 due to significantly higher origination volumes in a typically seasonally low quarter Origination volume of $2.8 billion in Q1 2015 was $947 million greater than Q1 2014 due to growth in both purchase and refinance business Purchase volume (as % of total volume) decreased to 60.0% in Q1 2015 from 78.7% in Q1 2014, although dollar volume was up $219.6 million Refinance volume increased $727.7 million, or 183.1%, from Q1 2014 to $1,125.2 million in Q1 2015 due to a drop in interest rates Noninterest income increased $43.5 million, or 47.4%, from Q1 2014 to $135.3 million in Q1 2015 due to the higher origination volume and stable margins Noninterest expense increased $31.7 million, or 34.9%, from Q1 2014 to $122.3 million in Q1 2015 due to higher variable compensation associated with higher origination volume PrimeLending retained servicing on approximately 9% of new loans originated in Q1 2015 Net MSR asset value of $31.6 million at Q1 2015 on $3.6 billion of serviced loan volume Fair value of net MSR declined $5.0 million during the quarter Reported Summary Results ($000) Q1 2014 Q1 2015 Net Interest Income (4,139) (3,014) Provision for Loan Losses – – Noninterest Income 91,763 135,292 Noninterest Expense (90,632) (122,302) Income Before Taxes (3,008) 9,976 Key Highlights Q1 2014 Q1 2015 Volume - $M $1,866 $2,814 Volume – Units 9,152 12,363 Volume - % Purchase 78.7% 60.0% Volume - % Conventional 64.0% 65.7% Locks ($M) $2,616 $4,351 Servicing Asset ($M) $29.9 $31.6 Mortgage Loans Serviced For Others ($M) $2,693 $3,615 Mortgage Origination Volume ($M) 1,469 1,688 397 1,125 $1,866 $2,814 $0 $500 $1,000 $1,500 $2,000 $2,500 $3,000 $3,500 $4,000 Q1 2014 Q1 2015 Thousands Home Purchases Refinancings |
|
|
17 Hilltop Securities Holdings – Q1 2015 Highlights Q1 2015 includes full quarter of operations with SWS, though Q1 2014 includes only FirstSouthwest Pre-tax income grew to $39.9 million in Q1 2015 versus a pre-tax loss of $153 thousand in Q1 2014 primarily due a preliminary bargain purchase gain of $43.3 million related to the SWS Merger Q1 2015 results also include pre-tax transaction costs of $0.8 million, integration costs of $2.2 million and $0.2 million of professional fees related to the SWS Merger After adjusting for preliminary bargain purchase gain and transaction and integration costs, Q1 2015 pre-tax was breakeven Public finance revenue increased year over year, as issue volume by count was up 66% and by aggregate dollar volume up 83% versus Q1 2014 The U.S. Agency to-be-announced, or TBA, business, which provides interest rate protection for housing authorities, had fair value changes on derivatives that provided a net gain of $8.6 million for Q1 2015 Noninterest expense increased $63.4 million, or 231.8%, from Q1 2014 to $90.8 million in Q1 2015 primarily due to the inclusion of employees brought in as part of the SWS Merger ($42.6 million of increase was associated with operations of SWS) Reported Summary Results ($000) Q1 2014 Q1 2015 Net Interest Income 2,629 7,996 Provision for Loan Losses (14) (201) Noninterest Income 24,597 122,877 Noninterest Expense (27,365) (90,795) Income Before Taxes (153) 39,877 Key Highlights Q1 2014 Q1 2015 Compensation/Net Revenue (%) 61.3 73.7 FDIC Insured Balances at PCB ($000) $225,784 $548,197 Other FDIC Insured Balances ($000) $114,938 $1,268,587 Public Finance Issues (#) 289 480 Public Finance Aggregate Amount of Offerings ($M) $20,358 $37,174 Capital Markets Volume ($M) $6,525 $17,506 Lock Production/TBA Volume ($M) $328 $3,026 |
|
|
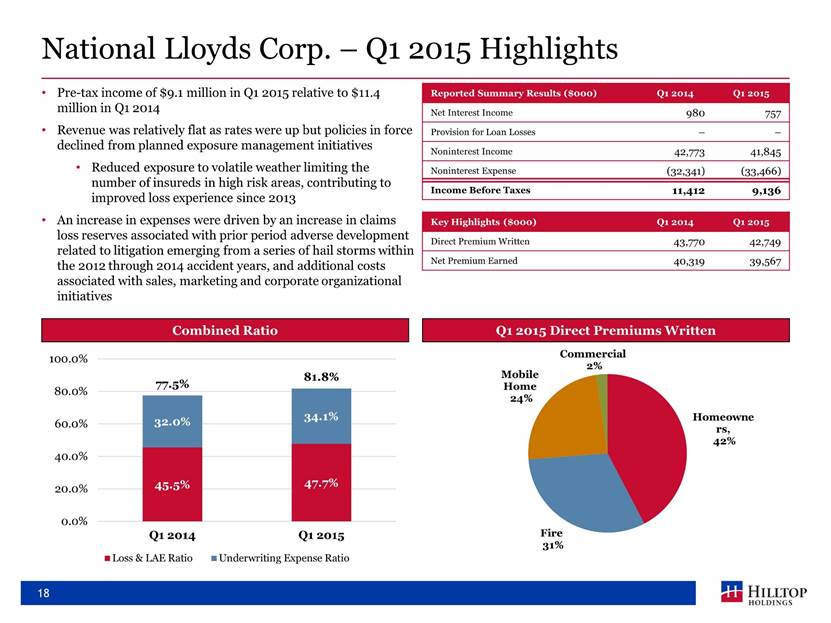
18 National Lloyds Corp. – Q1 2015 Highlights Reported Summary Results ($000) Q1 2014 Q1 2015 Net Interest Income 980 757 Provision for Loan Losses – – Noninterest Income 42,773 41,845 Noninterest Expense (32,341) (33,466) Income Before Taxes 11,412 9,136 Combined Ratio Q1 2015 Direct Premiums Written Key Highlights ($000) Q1 2014 Q1 2015 Direct Premium Written 43,770 42,749 Net Premium Earned 40,319 39,567 Pre-tax income of $9.1 million in Q1 2015 relative to $11.4 million in Q1 2014 Revenue was relatively flat as rates were up but policies in force declined from planned exposure management initiatives Reduced exposure to volatile weather limiting the number of insureds in high risk areas, contributing to improved loss experience since 2013 An increase in expenses were driven by an increase in claims loss reserves associated with prior period adverse development related to litigation emerging from a series of hail storms within the 2012 through 2014 accident years, and additional costs associated with sales, marketing and corporate organizational initiatives Homeowne rs , 42% Fire 31% Mobile Home 24% Commercial 2% 45.5% 47.7% 32.0% 34.1% 77.5% 81.8% 0.0% 20.0% 40.0% 60.0% 80.0% 100.0% Q1 2014 Q1 2015 Loss & LAE Ratio Underwriting Expense Ratio |
|
|
19 Questions? |

|
|
20 Appendix |
|
|
21 Hilltop Non-GAAP to GAAP Reconciliation and Management’s Explanation of Non-GAAP Financial Measures Q1 2015 Reconciliation of Non-GAAP Adjusted Net Income ($000) Diluted EPS ($) GAAP Net Income to HTH Common Shareholders 113,402 1.13 Add (Deduct): Bargain Purchase Gain (82,816) (0.82) Transaction and Integration Costs (net of tax)1 8,187 0.08 Non-GAAP Adjusted Net Income 38,773 0.39 Note: (1) Includes various transaction and integration costs associated with the SWS Merger, which closed January 1, 2015 Hilltop presents two measures on page three of this presentation that are not measures of financial performance recognized by generally accepted accounting principles in the United States (“GAAP”). These measures are important to investors interested in changes from period to period in net income and net income per diluted share. For companies, such as Hilltop, business combinations can result in the recording of significant amounts of goodwill or bargain purchase gain and other expenses related to those transactions. You should not view this disclosure as a substitute for results determined in accordance with GAAP, and this disclosure is not necessarily comparable to that of other companies that use non-GAAP measures. The following table reconciles these Hilltop non-GAAP financial measures to the most comparable GAAP financial measures, “net income to common shareholders" and “net income per diluted share.” |
Serious News for Serious Traders! Try StreetInsider.com Premium Free!
You May Also Be Interested In
- Hilltop Holdings (HTH) Tops Q1 EPS by 17c
- Hilltop Holdings Inc. Announces First Quarter 2024 Earnings Conference Call and Webcast
- Glow Announces Late Filing of Financial Statements
Create E-mail Alert Related Categories
SEC FilingsSign up for StreetInsider Free!
Receive full access to all new and archived articles, unlimited portfolio tracking, e-mail alerts, custom newswires and RSS feeds - and more!
