

Form 6-K CREDIT SUISSE GROUP AG For: Mar 31
 Tweet
Tweet Share
Share
UNITED STATES
SECURITIES AND EXCHANGE COMMISSION
SECURITIES AND EXCHANGE COMMISSION
Washington, D.C. 20549
Form 6-K
REPORT OF FOREIGN PRIVATE ISSUER PURSUANT TO RULE 13a-16 OR 15d-16
UNDER THE SECURITIES EXCHANGE ACT OF 1934
UNDER THE SECURITIES EXCHANGE ACT OF 1934
April 21, 2015
Commission File Number 001-15244
CREDIT SUISSE GROUP AG
(Translation of registrant’s name into English)
Paradeplatz 8, CH 8001 Zurich, Switzerland
(Address of principal executive office)
(Address of principal executive office)
Indicate by check mark whether the registrant files or will file annual reports under cover of Form 20-F or Form 40-F.
Form 20-F  Form 40-F
Form 40-F
Indicate by check mark if the registrant is submitting the Form 6-K in paper as permitted by Regulation S-T Rule 101(b)(1):
Note: Regulation S-T Rule 101(b)(1) only permits the submission in paper of a Form 6-K if submitted solely to provide an attached annual report to security holders.
Indicate by check mark if the registrant is submitting the Form 6-K in paper as permitted by Regulation S-T Rule 101(b)(7):
Note: Regulation S-T Rule 101(b)(7) only permits the submission in paper of a Form 6-K if submitted to furnish a report or other document that the registrant foreign private issuer must furnish and make public under the laws of the jurisdiction in which the registrant is incorporated, domiciled or legally organized (the registrant’s “home country”), or under the rules of the home country exchange on which the registrant’s securities are traded, as long as the report or other document is not a press release, is not required to be and has not been distributed to the registrant’s security holders, and, if discussing a material event, has already been the subject of a Form 6-K submission or other Commission filing on EDGAR.
Introduction
On April 21, 2015, Credit Suisse Group AG announced its results as of and for the three months ended March 31, 2015. A copy of the related Earnings Release is attached as an exhibit to this Form 6-K.
This Form 6-K (including the exhibit hereto) is hereby (i) incorporated by reference into the Registration Statement on Form F-3 (file no. 333-180300) and the Registration Statement on Form S-8 (file no. 333-101259) and (ii) shall be deemed to be “filed” for purposes of the Securities Exchange Act of 1934, as amended except, in the case of both (i) and (ii), the section entitled “Dear shareholders” of the Earnings Release.
The 1Q15 Credit Suisse Financial Report as of and for the three months ended March 31, 2015 will be published on or about April 30, 2015.
2
Exhibits
No. Description
3
Signatures
Pursuant to the requirements of the Securities Exchange Act of 1934, the registrant has duly caused this report to be signed on its behalf by the undersigned, thereunto duly authorized.
CREDIT SUISSE GROUP AG
(Registrant)
Date: April 21, 2015
By:
/s/ Brady W. Dougan
Brady W. Dougan
Chief Executive Officer
By:
/s/ David R. Mathers
David R. Mathers
Chief Financial Officer
4

| Key metrics | |||||||||||
| in / end of | % change | ||||||||||
| 1Q15 | 4Q14 | 1Q14 | QoQ | YoY | |||||||
| Credit Suisse (CHF million, except where indicated) | |||||||||||
| Net income attributable to shareholders | 1,054 | 691 | 859 | 53 | 23 | ||||||
| of which from continuing operations | 1,054 | 701 | 844 | 50 | 25 | ||||||
| Basic earnings per share from continuing operations (CHF) | 0.63 | 0.41 | 0.47 | 54 | 34 | ||||||
| Diluted earnings per share from continuing operations (CHF) | 0.62 | 0.40 | 0.47 | 55 | 32 | ||||||
| Return on equity attributable to shareholders (%) | 9.9 | 6.2 | 8.0 | – | – | ||||||
| Effective tax rate (%) | 31.6 | 21.2 | 31.2 | – | – | ||||||
| Core Results (CHF million, except where indicated) | |||||||||||
| Net revenues | 6,673 | 6,376 | 6,469 | 5 | 3 | ||||||
| Provision for credit losses | 30 | 75 | 34 | (60) | (12) | ||||||
| Total operating expenses | 5,105 | 5,400 | 5,035 | (5) | 1 | ||||||
| Income from continuing operations before taxes | 1,538 | 901 | 1,400 | 71 | 10 | ||||||
| Cost/income ratio (%) | 76.5 | 84.7 | 77.8 | – | – | ||||||
| Pre-tax income margin (%) | 23.0 | 14.1 | 21.6 | – | – | ||||||
| Strategic results (CHF million, except where indicated) | |||||||||||
| Net revenues | 6,590 | 6,000 | 6,530 | 10 | 1 | ||||||
| Income from continuing operations before taxes | 1,822 | 1,449 | 1,944 | 26 | (6) | ||||||
| Cost/income ratio (%) | 72.0 | 74.9 | 70.0 | – | – | ||||||
| Return on equity – strategic results (%) | 12.0 | 10.9 | 14.0 | – | – | ||||||
| Non-strategic results (CHF million) | |||||||||||
| Net revenues | 83 | 376 | (61) | (78) | – | ||||||
| Loss from continuing operations before taxes | (284) | (548) | (544) | (48) | (48) | ||||||
| Assets under management and net new assets (CHF billion) | |||||||||||
| Assets under management from continuing operations | 1,374.0 | 1,377.3 | 1,281.1 | (0.2) | 7.3 | ||||||
| Net new assets from continuing operations | 17.0 | (3.0) | 14.7 | – | 15.6 | ||||||
| Balance sheet statistics (CHF million) | |||||||||||
| Total assets | 904,390 | 921,462 | 878,090 | (2) | 3 | ||||||
| Net loans | 270,774 | 272,551 | 250,659 | (1) | 8 | ||||||
| Total shareholders' equity | 43,396 | 43,959 | 43,230 | (1) | 0 | ||||||
| Tangible shareholders' equity | 34,672 | 35,066 | 35,046 | (1) | (1) | ||||||
| Basel III regulatory capital and leverage statistics | |||||||||||
| Risk-weighted assets (CHF million) | 288,514 | 291,410 | 285,996 | (1) | 1 | ||||||
| CET1 ratio (%) | 13.8 | 14.9 | 14.3 | – | – | ||||||
| Look-through CET1 ratio (%) | 10.0 | 10.1 | 10.0 | – | – | ||||||
| Look-through CET1 leverage ratio (%) | 2.6 | 2.5 | – | – | – | ||||||
| Look-through Tier 1 leverage ratio (%) | 3.6 | 3.5 | – | – | – | ||||||
| Share information | |||||||||||
| Shares outstanding (million) | 1,563.5 | 1,599.5 | 1,587.2 | (2) | (1) | ||||||
| of which common shares issued | 1,607.2 | 1,607.2 | 1,596.1 | 0 | 1 | ||||||
| of which treasury shares | (43.7) | (7.7) | (8.9) | 468 | 391 | ||||||
| Book value per share (CHF) | 27.76 | 27.48 | 27.24 | 1 | 2 | ||||||
| Tangible book value per share (CHF) | 22.18 | 21.92 | 22.08 | 1 | 0 | ||||||
| Market capitalization (CHF million) | 42,076 | 40,308 | 45,633 | 4 | (8) | ||||||
| Number of employees (full-time equivalents) | |||||||||||
| Number of employees | 46,400 | 45,800 | 45,600 | 1 | 2 | ||||||
|
See relevant tables for additional information on these metrics.
|
|||||||||||
2
For Switzerland and Credit Suisse, one of the most significant economic and political events during the first quarter of 2015 was the Swiss National Bank’s decision in January to discontinue the minimum exchange rate of the Swiss franc against the euro and introduce negative short-term interest rates. These actions significantly altered the market environment for a number of Swiss companies. In order to moderate the impact on our results, we announced a number of mitigating actions in February, including a combination of incremental cost reductions and revenue growth initiatives. These swift and proactive measures, combined with an improvement in market activity, successfully mitigated the impact from the changed currency and interest rate environment on our results.
Against this challenging backdrop, Credit Suisse again delivered a strong and consistent performance in the first quarter. Reported net income attributable to shareholders was CHF 1.1 billion, reflecting an increase of 23% compared to the first quarter of 2014. The Private Banking & Wealth Management results benefitted from a particularly strong performance in our Wealth Management Clients business with improved margins and profitability. We had relatively stable results in Corporate & Institutional Clients, while Asset Management had lower revenues reflecting increased seasonality. Investment Banking results reflected increased sales and trading revenues, while we continued to significantly reduce leverage exposure during the quarter. Additionally, we made further progress in winding down our non-strategic units.
We continue to build on our strong position in the Swiss market and capitalize on our presence and expertise in the emerging markets, including Asia Pacific and the Middle East. The Asia Pacific region continues to be a strong driver of growth in both divisions, contributing 16% to the overall revenues of Credit Suisse.
Further leverage reductions and continued strong capital generation
In recent years, there was a shift in regulatory focus toward the unweighted view of capital in the form of more restrictive leverage requirements. In order to comply with these stricter requirements, we laid out a plan to significantly reduce leverage exposure, mainly driven by reductions in Investment Banking. During the first quarter, we reduced leverage exposure by CHF 95 billion, reaching a look-through BIS tier 1 leverage ratio of 3.6%, which is within reach of our 4.0% target for the end of 2015. Regarding the current Swiss requirements, we reported a look-through Swiss leverage ratio of 4.2%, approaching our end-2015 target of 4.5%.
At the end of the first quarter, our look-through CET1 capital ratio, an important metric in measuring our capital position, stood at 10.0%. This is slightly lower than at year-end 2014 due to a combination of the foreign exchange impact, share purchases for employee compensation plans and the impact on risk-weighted assets from regulatory and mandated methodology changes. Looking at the Swiss framework, where high- and low-trigger contingent convertible instruments are recognized as eligible capital, we reported a look-through Swiss total capital ratio of 16.2%.
Private Banking & Wealth Management
In Private Banking & Wealth Management, we delivered pre-tax income of CHF 0.9 billion from our strategic businesses, with higher client activity in Wealth Management Clients and lower revenues in Asset Management. The net margin of the Wealth Management Clients business increased to 30 basis points with lower expenses and higher net interest income. Compared to the prior quarter, the net margin also benefitted from a decrease in average assets under management, largely due to the foreign exchange impact. As a result of the swift mitigating actions we took and the cumulative benefit of our lending program, net interest income in Wealth Management Clients increased in spite of the low interest rate environment.
We saw strong client momentum in Private Banking & Wealth Management with strategic net new assets of CHF 18.4 billion in the quarter. Wealth Management Clients contributed CHF 7.0 billion, driven by strong inflows from Asia Pacific, the Americas and Switzerland. Overall, we reported total net new assets of CHF 17.0 billion, including CHF 1.4 billion of outflows due to the ongoing regularization of our asset base.
3
During the first quarter, we successfully executed on our growth initiatives. In Switzerland and selected other markets, we launched our new advisory offering Credit Suisse Invest, focusing on improving flexibility and transparency for clients. This is part of our effort to further increase mandate penetration and we saw strong sales momentum during the first quarter that is expected to continue. Since 2013, we are also expanding our lending program to ultra-high-net-worth clients. Loan volume increased by 39% with growth across all regions, despite muted growth in the first quarter of 2015. Additionally, in light of the evolving digital landscape, we are creating a state-of-the-art digital private banking platform, which was already successfully launched in Singapore. With this platform, Credit Suisse aims to upgrade its service offering and make it even more accessible to clients.
Investment Banking
In our diversified Investment Banking strategic franchise, we achieved consistent results with a return on regulatory capital of 19%. We generated pre-tax income of CHF 1.1 billion in our strategic businesses, stable compared to the same period of 2014, with slightly higher revenues.
Fixed income sales and trading revenues improved compared to the same quarter in the prior year due to increased client activity, particularly in global macro products and emerging markets. Equity sales and trading results were strong, reflecting a more favorable trading environment and sustained market shares. The strength in our sales and trading businesses offset the slowdown in underwriting and advisory, where we had a difficult start to the year. Year-over-year, total operating expenses increased in Swiss francs but decreased in US dollars, reflecting the foreign exchange impact of the weakening of the Swiss franc on an average basis compared to the US dollar.
Additionally, we made continued progress at improving the capital efficiency in Investment Banking across strategic and non-strategic businesses. We reduced leverage exposure by USD 97 billion and risk-weighted assets increased slightly in US dollars, as an increase in risk-weighting calculations offset business reductions.
Outlook
Looking at the second quarter to date, the momentum in the businesses has carried over from the first quarter, with an improving trend in underwriting and advisory. We remain committed to our capital and leverage goals and expect to make further progress in executing our strategic initiatives over the balance of 2015.
CEO succession
This is the last quarterly shareholder letter that you will receive from the two of us together. As announced in March, Brady Dougan will be stepping down from his role at the end of June, after a 25-year career at the bank, including eight years as CEO. Given the progress we have made and the good momentum across our businesses, we decided that this is the appropriate time for CEO succession. The Board of Directors has appointed Tidjane Thiam as the new CEO. He currently serves as Group Chief Executive of Prudential plc and has a distinguished record of achievement in the financial services industry.
4
During the eight years that Brady Dougan has served as CEO, the financial services industry has undergone significant change. Together with our management team, Brady has successfully navigated our bank through this difficult period and has proactively responded to various reforms and changes. Despite these challenging conditions, we consistently collaborated with our stakeholders to find the best course for our company and our clients. While the industry will continue to evolve going forward, we believe that our bank is well positioned to thrive over the long term as our employees, management team and new CEO will strive to ensure the success of Credit Suisse over the years to come.
We would like to express our sincere gratitude to our clients, our shareholders and our employees for their continued support over the past eight years and going forward.
Sincerely
Urs Rohner Brady W. Dougan
April 2015
5
For additional information on financial information presented in this Earnings Release, including references to return on equity and return on regulatory capital, refer to the tabular disclosures in the Appendix and other explanatory disclosures regarding capital and leverage metrics in the section titled “Important information” on page 22.
| Core Results highlights | |||||||||||
| in / end of | % change | ||||||||||
| 1Q15 | 4Q14 | 1Q14 | QoQ | YoY | |||||||
| Reported results (CHF million) | |||||||||||
| Net revenues | 6,673 | 6,376 | 6,469 | 5 | 3 | ||||||
| Provision for credit losses | 30 | 75 | 34 | (60) | (12) | ||||||
| Total operating expenses | 5,105 | 5,400 | 5,035 | (5) | 1 | ||||||
| Income from continuing operations before taxes | 1,538 | 901 | 1,400 | 71 | 10 | ||||||
| Net income attributable to shareholders | 1,054 | 691 | 859 | 53 | 23 | ||||||
| Metrics (%) | |||||||||||
| Return on regulatory capital | 13.9 | 8.7 | 14.4 | – | – | ||||||
| Cost/income ratio | 76.5 | 84.7 | 77.8 | – | – | ||||||
| Strategic results (CHF million) | |||||||||||
| Net revenues | 6,590 | 6,000 | 6,530 | 10 | 1 | ||||||
| Provision for credit losses | 26 | 56 | 18 | (54) | 44 | ||||||
| Total operating expenses | 4,742 | 4,495 | 4,568 | 5 | 4 | ||||||
| Income from continuing operations before taxes | 1,822 | 1,449 | 1,944 | 26 | (6) | ||||||
| Net income attributable to shareholders | 1,235 | 1,155 | 1,404 | 7 | (12) | ||||||
| Metrics (%) | |||||||||||
| Return on regulatory capital | 17.3 | 14.9 | 21.9 | – | – | ||||||
| Cost/income ratio | 72.0 | 74.9 | 70.0 | – | – | ||||||
| Non-strategic results (CHF million) | |||||||||||
| Net revenues | 83 | 376 | (61) | (78) | – | ||||||
| Provision for credit losses | 4 | 19 | 16 | (79) | (75) | ||||||
| Total operating expenses | 363 | 905 | 467 | (60) | (22) | ||||||
| Loss from continuing operations before taxes | (284) | (548) | (544) | (48) | (48) | ||||||
| Net loss attributable to shareholders | (181) | (464) | (545) | (61) | (67) | ||||||
|
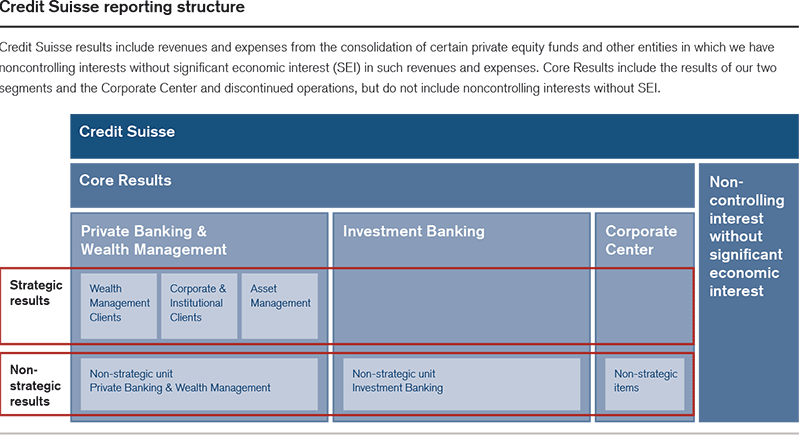
Core Results do not include noncontrolling interests without significant economic interests.
|
|||||||||||
In 1Q15, net income attributable to shareholders was CHF 1,054 million.
Income before taxes of CHF 1,538 million increased 10% compared to 1Q14, primarily reflecting a 3% increase in net revenues. In the strategic businesses, income before taxes of CHF 1,822 million decreased 6% compared to 1Q14. In the non-strategic businesses, loss before taxes was CHF 284 million in 1Q15 compared to a loss before taxes of CHF 544 million in 1Q14.
Net revenues of CHF 6,673 million increased 3% compared to 1Q14. In the strategic businesses, net revenues were stable at CHF 6,590 million, primarily reflecting higher net revenues in Investment Banking, offset by lower net revenues in Private Banking & Wealth Management. In the non-strategic businesses, net revenues were CHF 83 million in 1Q15 compared to negative net revenues of CHF 61 million in 1Q14.
Provision for credit losses was CHF 30 million in 1Q15, with net provisions of CHF 29 million in Private Banking & Wealth Management and CHF 1 million in Investment Banking.
6
Total operating expenses were stable at CHF 5,105 million compared to 1Q14. In the strategic businesses, total operating expenses of CHF 4,742 million increased 4% compared to 1Q14, primarily reflecting an 8% increase in general and administrative expenses. In the non-strategic businesses, total operating expenses of CHF 363 million decreased 22% compared to 1Q14, primarily due to a 24% decrease in general and administrative expenses and a 22% decrease in compensation and benefits. Business realignment costs in 1Q15 were CHF 119 million.
Income tax expense of CHF 477 million recorded in 1Q15 mainly reflected the impact of the geographical mix of results. Overall, net deferred tax assets decreased CHF 336 million to CHF 5,694 million, mainly driven by earnings and foreign exchange movements as of the end of 1Q15 compared to 4Q14. Deferred tax assets on net operating losses decreased CHF 430 million to CHF 1,384 million during 1Q15. The Core Results effective tax rate was 31.0% in 1Q15, compared to 21.0% in 4Q14.
Range of reasonably possible losses related to certain legal proceedings: The Group’s estimate of the aggregate range of reasonably possible losses that are not covered by existing provisions for certain proceedings for which the Group believes an estimate is possible was zero to CHF 1.8 billion at the end 1Q15.
Diluted earnings per share from continuing operations were CHF 0.62 for 1Q15 compared to CHF 0.47 in 1Q14 and CHF 0.40 in 4Q14.
Benefits of the integrated bank: In 1Q15, Credit Suisse generated CHF 1.0 billion of collaboration revenues from the integrated bank. This corresponds to 14.9% of Core net revenues in 1Q15.
Cost savings: As of the end of 1Q15, Credit Suisse achieved cost savings of approximately CHF 3.6 billion since the start of the expense reduction program in 2011. Further cost savings are expected to be delivered over the balance of the year, reaching CHF 4.0–4.25 billion by the end of 2015. However, Credit Suisse expects that risk, compliance and regulatory costs will continue to rise across both divisions. Credit Suisse remains committed to achieving incremental cost savings of approximately CHF 200 million by the end of 2017 through a better alignment of the Swiss franc cost and revenue base within Private Banking & Wealth Management.
7
In 1Q15, Private Banking & Wealth Management reported income before taxes of CHF 834 million and net revenues of CHF 2,972 million. In its strategic businesses, Private Banking & Wealth Management reported income before taxes of CHF 938 million and net revenues of CHF 2,970 million. Compared to 1Q14, net revenues were slightly lower reflecting lower recurring commissions and fees and lower other revenues, partially offset by slightly higher net interest income. Net revenues were lower compared to 4Q14, mainly driven by fourth-quarter performance fees in Asset Management, gains on the sale of the local affluent and upper affluent business in Italy and the partial sale of an investment in Euroclear in 4Q14, and lower asset management fees. In its non-strategic businesses, Private Banking & Wealth Management reported a loss before taxes of CHF 104 million. In 1Q15, assets under management for the division were CHF 1,374.0 billion and the division attracted net new assets of CHF 17.0 billion.
Capital and leverage metrics: At the end of 1Q15, Private Banking & Wealth Management strategic businesses reported risk-weighted assets of CHF 104.6 billion, an increase of CHF 2.2 billion compared to the end of 4Q14. The increase was driven by methodology changes and market movements, partially offset by foreign exchange related reductions. Leverage exposure was CHF 385.7 billion, reflecting an increase of 6% compared to the end of 4Q14. At the end of 1Q15, Private Banking & Wealth Management non-strategic businesses reported risk-weighted assets of CHF 4.4 billion, CHF 1.4 billion lower compared to the end of 4Q14 due to the continued progress in winding down the non-strategic portfolio. Leverage exposure was CHF 4.1 billion, a decrease of CHF 0.7 billion compared to the end of 4Q14 primarily due to foreign exchange related reductions.
| Private Banking & Wealth Management | |||||||||||
| in / end of | % change | ||||||||||
| 1Q15 | 4Q14 | 1Q14 | QoQ | YoY | |||||||
| Reported results (CHF million) | |||||||||||
| Net revenues | 2,972 | 3,226 | 3,240 | (8) | (8) | ||||||
| Provision for credit losses | 29 | 42 | 33 | (31) | (12) | ||||||
| Compensation and benefits | 1,229 | 1,265 | 1,290 | (3) | (5) | ||||||
| Total other operating expenses | 880 | 1,037 | 905 | (15) | (3) | ||||||
| Total operating expenses | 2,109 | 2,302 | 2,195 | (8) | (4) | ||||||
| Income before taxes | 834 | 882 | 1,012 | (5) | (18) | ||||||
| Metrics (%) | |||||||||||
| Return on regulatory capital | 21.0 | 24.9 | 31.0 | – | – | ||||||
| Cost/income ratio | 71.0 | 71.4 | 67.7 | – | – | ||||||
8
Strategic results
Private Banking & Wealth Management’s strategic results comprise businesses from Wealth Management Clients, Corporate & Institutional Clients and Asset Management.
| Private Banking & Wealth Management – strategic results | |||||||||||
| in / end of | % change | ||||||||||
| 1Q15 | 4Q14 | 1Q14 | QoQ | YoY | |||||||
| Strategic results (CHF million) | |||||||||||
| Net interest income | 981 | 985 | 963 | 0 | 2 | ||||||
| Recurring commissions and fees | 1,067 | 1,177 | 1,139 | (9) | (6) | ||||||
| Transaction- and performance-based revenues | 922 | 976 | 919 | (6) | 0 | ||||||
| Other revenues | 0 | 68 | 10 | (100) | (100) | ||||||
| Net revenues | 2,970 | 3,206 | 3,031 | (7) | (2) | ||||||
| Provision for credit losses | 25 | 39 | 17 | (36) | 47 | ||||||
| Total operating expenses | 2,007 | 2,160 | 2,049 | (7) | (2) | ||||||
| Income before taxes | 938 | 1,007 | 965 | (7) | (3) | ||||||
| Metrics (%) | |||||||||||
| Return on regulatory capital | 24.3 | 29.8 | 31.6 | – | – | ||||||
| Cost/income ratio | 67.6 | 67.4 | 67.6 | – | – | ||||||
In 1Q15, the strategic businesses for Private Banking & Wealth Management reported income before taxes of CHF 938 million and net revenues of CHF 2,970 million. Following the appreciation of the Swiss franc in 1Q15, the strategic businesses saw a muted impact on their year-over-year comparisons. However, quarter-over-quarter the strategic businesses saw a negative impact on net revenues and a positive impact on operating expenses, particularly in Wealth Management Clients.
Compared to 1Q14, net revenues decreased slightly, mainly reflecting lower recurring commissions and fees. The decrease of CHF 72 million in recurring commissions and fees reflected lower asset management fees, lower banking services fees and lower investment product management fees, partially offset by higher discretionary mandates management fees and higher revenues from wealth structuring solutions. Other revenues decreased due to lower investment-related gains. Net interest income was slightly higher with higher loan margins on higher average loan volumes, partially offset by significantly lower deposit margins on higher average deposit volumes. Transaction- and performance-based revenues were stable with higher foreign exchange client business and higher trading and sales revenues amid more volatile market conditions, offset by lower performance fees and carried interest and lower brokerage and product issuing fees.
Compared to 4Q14, net revenues decreased 7% with lower recurring commissions and fees, other revenues and transaction- and performance-based revenues. Recurring commissions and fees decreased, reflecting lower asset management fees, lower investment product management fees and lower investment advisory fees. Other revenues were lower reflecting the gain on the sale of the local affluent and upper affluent business in Italy and the gain related to the partial sale of an investment in Euroclear in 4Q14. The decrease in transaction- and performance-based revenues reflected fourth-quarter performance fees in Asset Management, lower placement fees and lower corporate advisory fees related to integrated solutions, partially offset by higher client activity in Wealth Management Clients following the SNB announcement in January and higher equity participations income. Net interest income was stable with significantly lower deposit margins on stable average deposit volumes, offset by higher loan margins on stable average loan volumes.
Provision for credit losses was CHF 25 million, compared to CHF 17 million in 1Q14 and CHF 39 million in 4Q14.
9
Total operating expenses were slightly lower compared to 1Q14 and 7% lower compared to 4Q14. Compared to 1Q14, compensation and benefits were slightly lower reflecting lower discretionary compensation expenses. General and administrative expenses were CHF 9 million lower primarily reflecting lower occupancy expenses and lower advertising and marketing costs. Compared to 4Q14, compensation and benefits were stable reflecting lower salary expenses and lower discretionary compensation expenses offset by higher deferred compensation expenses from prior-year awards. General and administrative expenses decreased 17%, reflecting lower litigation provisions, lower professional services fees and lower advertising and marketing costs.
The cost/income ratio for the strategic results was 68% in 1Q15, stable compared to 1Q14 and 4Q14.
| Wealth Management Clients | |||||||||||
| in / end of | % change | ||||||||||
| 1Q15 | 4Q14 | 1Q14 | QoQ | YoY | |||||||
| Strategic results (CHF million) | |||||||||||
| Net interest income | 741 | 695 | 706 | 7 | 5 | ||||||
| Recurring commissions and fees | 700 | 765 | 730 | (8) | (4) | ||||||
| Transaction- and performance-based revenues | 670 | 600 | 638 | 12 | 5 | ||||||
| Other revenues | 0 | 93 | 0 | (100) | – | ||||||
| Net revenues | 2,111 | 2,153 | 2,074 | (2) | 2 | ||||||
| Provision for credit losses | 17 | 10 | 16 | 70 | 6 | ||||||
| Total operating expenses | 1,458 | 1,566 | 1,480 | (7) | (1) | ||||||
| Income before taxes | 636 | 577 | 578 | 10 | 10 | ||||||
| Metrics (%) | |||||||||||
| Return on regulatory capital | 28.5 | 29.8 | 32.1 | – | – | ||||||
| Cost/income ratio | 69.1 | 72.7 | 71.4 | – | – | ||||||
The Wealth Management Clients business in 1Q15 reported income before taxes of CHF 636 million and net revenues of CHF 2,111 million. Net revenues were slightly higher compared to 1Q14, with higher net interest income and higher transaction- and performance-based revenues, partially offset by lower recurring commissions and fees. Higher net interest income reflected higher loan margins on higher average loan volumes, partially offset by significantly lower deposit margins on slightly higher average deposit volumes. Higher transaction- and performance-based revenues reflected increased foreign exchange client business and higher sales and trading revenues following the SNB announcement, partially offset by lower brokerage and product issuing fees and lower transaction fees. Recurring commissions and fees decreased with lower banking services fees, lower investment product management fees and lower security account and custody services fees partially offset by higher discretionary mandates management fees and higher revenues from wealth structuring solutions.
Compared to 4Q14, net revenues decreased slightly, driven by lower other revenues and lower recurring commissions and fees, partially offset by higher transaction- and performance-based revenues and higher net interest income. Lower other revenues reflected the gain on the sale of the local affluent and upper affluent business in Italy and the majority of the gain related to the partial sale of an investment in Euroclear in 4Q14. Recurring commissions and fees were lower reflecting decreased investment product management fees, lower security account and custody services fees, lower investment advisory fees and lower banking services fees, partially offset by higher revenues from wealth structuring solutions. Higher transaction- and performance-based revenues reflected higher sales and trading revenues, increased foreign exchange client business and higher brokerage and product issuing fees, partially offset by lower corporate advisory fees compared to a strong 4Q14. Net interest income was higher with higher loan margins on stable average loan volumes, partially offset by lower deposit margins on slightly lower average deposit volumes.
10
In 1Q15, the gross margin was 100 basis points, four basis points lower compared to 1Q14, mainly reflecting a 5.7% increase in average assets under management, partially offset by slightly higher net revenues. Compared to 4Q14, the gross margin was up one basis point, reflecting a 3.1% decrease in average assets under management, partially offset by slightly lower net revenues.
Wealth Management Clients net margin was 30 basis points in 1Q15, one basis point higher compared to 1Q14, reflecting slightly higher net revenues and slightly lower operating expenses, partially offset by a 5.7% increase in average assets under management. Compared to 4Q14, the net margin was three basis points higher, reflecting lower operating expenses and a 3.1% decrease in average assets under management, partially offset by slightly lower net revenues.
| Corporate & Institutional Clients | |||||||||||
| in / end of | % change | ||||||||||
| 1Q15 | 4Q14 | 1Q14 | QoQ | YoY | |||||||
| Strategic results (CHF million) | |||||||||||
| Net interest income | 240 | 290 | 257 | (17) | (7) | ||||||
| Recurring commissions and fees | 123 | 112 | 122 | 10 | 1 | ||||||
| Transaction- and performance-based revenues | 126 | 111 | 117 | 14 | 8 | ||||||
| Other revenues | (5) | 5 | (4) | – | 25 | ||||||
| Net revenues | 484 | 518 | 492 | (7) | (2) | ||||||
| Provision for credit losses | 8 | 29 | 1 | (72) | – | ||||||
| Total operating expenses | 246 | 269 | 245 | (9) | 0 | ||||||
| Income before taxes | 230 | 220 | 246 | 5 | (7) | ||||||
| Metrics (%) | |||||||||||
| Return on regulatory capital | 17.6 | 18.6 | 23.0 | – | – | ||||||
| Cost/income ratio | 50.8 | 51.9 | 49.8 | – | – | ||||||
The Corporate & Institutional Clients business in 1Q15 reported income before taxes of CHF 230 million and net revenues of CHF 484 million. Net revenues were slightly lower compared to 1Q14, reflecting a decrease in net interest income partially offset by higher transaction- and performance-based revenues. Net interest income was lower with significantly lower deposit margins on higher average deposit volumes partially offset by significantly higher loan margins on higher average loan volumes. Higher transaction- and performance-based revenues reflected higher sales and trading revenues and higher foreign exchange client business following the SNB announcement, partially offset by lower corporate advisory fees. Recurring commissions and fees were stable and included higher discretionary mandates management fees offset by decreased fee income on lending activities.
Compared to 4Q14, net revenues decreased 7%, with lower net interest income and lower other revenues partially offset by higher transaction- and performance-based revenues and higher recurring commissions and fees. Decreased net interest income reflected significantly lower deposit margins on higher average deposit volumes, partially offset by significantly higher loan margins on stable average loan volumes. Following the change in the interest rate environment in 1Q15, Corporate & Institutional Clients saw a negative impact on net interest income, reflecting the shorter average duration of client deposits compared to Wealth Management Clients. Lower other revenues reflected the gain related to the partial sale of an investment in Euroclear in 4Q14. Higher transaction- and performance-based revenues reflected higher sales and trading revenues and higher foreign exchange client business. Recurring commissions and fees increased with higher fee income on lending activities and higher discretionary mandates management fees, partially offset by lower investment advisory fees.
11
| Asset Management | |||||||||||
| in / end of | % change | ||||||||||
| 1Q15 | 4Q14 | 1Q14 | QoQ | YoY | |||||||
| Strategic results (CHF million) | |||||||||||
| Recurring commissions and fees | 244 | 300 | 287 | (19) | (15) | ||||||
| Transaction- and performance-based revenues | 126 | 265 | 164 | (52) | (23) | ||||||
| Other revenues | 5 | (30) | 14 | – | (64) | ||||||
| Net revenues | 375 | 535 | 465 | (30) | (19) | ||||||
| of which fee-based revenues | 353 | 554 | 438 | (36) | (19) | ||||||
| Provision for credit losses | 0 | 0 | 0 | – | – | ||||||
| Total operating expenses | 303 | 325 | 324 | (7) | (6) | ||||||
| Income before taxes | 72 | 210 | 141 | (66) | (49) | ||||||
| Metrics (%) | |||||||||||
| Return on regulatory capital | 22.7 | 80.9 | 76.4 | – | – | ||||||
| Cost/income ratio | 80.8 | 60.7 | 69.7 | – | – | ||||||
The Asset Management business reported income before taxes of CHF 72 million in 1Q15, with net revenues of CHF 375 million. Net revenues decreased 19% compared to 1Q14, mainly driven by lower fee-based revenues partially offset by improved equity participations and other gains. Fee-based revenues decreased reflecting lower asset management fees, lower carried interest and lower performance fees from single manager hedge funds, partially offset by higher equity participations income. The decrease in asset management fees reflected the absence of asset management fees from Hedging-Griffo following the change in fund management from Hedging-Griffo to a new venture in Brazil, Verde Asset Management, in which Credit Suisse has a significant investment. Improved equity participations and other gains reflected an equity participation gain of CHF 9 million related to Asset Management Finance LLC (AMF) recognized in 1Q15.
Net revenues decreased 30% compared to 4Q14, primarily due to lower fee-based revenues partially offset by improved investment-related gains and improved equity participations and other gains. Fee-based revenues decreased reflecting significantly lower performance fees from single manager hedge funds, lower asset management fees and lower placement fees, partially offset by higher equity participations income. The decrease in performance fees primarily reflected annual performance fees from single manager hedge funds in 4Q14. Improved investment-related gains reflected gains in hedge fund investments. Improved equity participations and other gains reflected the equity participation gain of CHF 9 million related to AMF recognized in 1Q15 compared to an impairment of CHF 4 million in 4Q14.
The fee-based margin was 37 basis points in 1Q15, compared to 49 basis points in 1Q14 and 57 basis points in 4Q14. The decrease compared to 1Q14 reflected both the lower fee-based revenues and the higher average assets under management, which increased 6.6% compared to 1Q14. The decrease compared to 4Q14 reflected the lower fee-based revenues, partially offset by the lower average assets under management, which decreased 2.8% compared to 4Q14.
12
Non-strategic results
The non-strategic results for Private Banking & Wealth Management include positions relating to the restructuring of the former Asset Management division, run-off operations relating to the small markets exit initiative and certain legacy cross-border related run-off operations, litigation costs, primarily related to the final settlement of all outstanding US cross-border matters, other smaller non-strategic positions formerly in the Corporate & Institutional Clients business and the run-off and active reduction of selected products. Furthermore, it comprises certain remaining operations that Credit Suisse continues to wind-down relating to its domestic private banking business booked in Germany, which was sold in 2014.
| Private Banking & Wealth Management – non-strategic results | |||||||||||
| in / end of | % change | ||||||||||
| 1Q15 | 4Q14 | 1Q14 | QoQ | YoY | |||||||
| Non-strategic results (CHF million) | |||||||||||
| Net revenues | 2 | 20 | 209 | (90) | (99) | ||||||
| Provision for credit losses | 4 | 3 | 16 | 33 | (75) | ||||||
| Total operating expenses | 102 | 142 | 146 | (28) | (30) | ||||||
| Income/(loss) before taxes | (104) | (125) | 47 | (17) | – | ||||||
In 1Q15, the non-strategic businesses reported a loss before taxes of CHF 104 million including a CHF 22 million loss on the sale of the division’s capital interests in investment funds managed by Customized Fund Investment Group (CFIG). In 4Q14, Private Banking & Wealth Management’s non-strategic businesses reported a loss before taxes of CHF 125 million including higher restructuring costs related to the winding-down of non-strategic operations.
In March 2015, Private Banking & Wealth Management sold substantially all of its capital interests, including related unfunded commitments, in investment funds managed by CFIG, but continue to hold certain capital interests and carried interest in, and have unfunded commitments to, funds managed by CFIG.
Assets under management – Private Banking & Wealth Management
Assets under management of CHF 1,374.0 billion decreased CHF 3.3 billion compared to the end of 4Q14, driven by unfavorable foreign exchange-related movements, primarily resulting from the appreciation of the Swiss franc, mostly offset by positive market movements and net new assets.
Net new assets: Private Banking & Wealth Management recorded net new assets of CHF 17.0 billion in 1Q15. In the strategic portfolio, Wealth Management Clients contributed net new assets of CHF 7.0 billion in 1Q15 with continued strong inflows from Asia Pacific, the Americas and Switzerland, partially offset by outflows in EMEA. Corporate & Institutional Clients in Switzerland reported strong net new assets of CHF 6.1 billion in 1Q15. Asset Management reported strong net new assets of CHF 10.2 billion in 1Q15, mainly driven by traditional products, in particular index strategies and multi-asset class solutions. In the non-strategic portfolio, net asset outflows of CHF 1.4 billion reflected the winding-down of non-strategic operations.
13
| Assets under management – Private Banking & Wealth Management | |||||||||||
| in / end of | % change | ||||||||||
| 1Q15 | 4Q14 | 1Q14 | QoQ | YoY | |||||||
| Assets under management by business (CHF billion) | |||||||||||
| Wealth Management Clients | 861.2 | 874.5 | 804.9 | (1.5) | 7.0 | ||||||
| Corporate & Institutional Clients | 286.7 | 275.9 | 254.4 | 3.9 | 12.7 | ||||||
| Asset Management | 391.7 | 388.5 | 363.4 | 0.8 | 7.8 | ||||||
| Non-strategic | 9.2 | 10.8 | 25.9 | (14.8) | (64.5) | ||||||
| Assets managed across businesses | (174.8) | (172.4) | (156.1) | 1.4 | 12.0 | ||||||
| Assets under management | 1,374.0 | 1,377.3 | 1,292.5 | (0.2) | 6.3 | ||||||
| Average assets under management (CHF billion) | |||||||||||
| Average assets under management | 1,340.6 | 1,373.8 | 1,282.1 | (2.4) | 4.6 | ||||||
| Net new assets by business (CHF billion) | |||||||||||
| Wealth Management Clients | 7.0 | 4.4 | 10.6 | 59.1 | (34.0) | ||||||
| Corporate & Institutional Clients | 6.1 | 3.6 | 0.4 | 69.4 | – | ||||||
| Asset Management | 10.2 | (10.6) | 6.9 | – | 47.8 | ||||||
| Non-strategic | (1.4) | (2.8) | (2.3) | (50.0) | (39.1) | ||||||
| Assets managed across businesses | (4.9) | 2.4 | (1.9) | – | 157.9 | ||||||
| Net new assets | 17.0 | (3.0) | 13.7 | – | 24.1 | ||||||
| Net new asset growth rate (annualized) (%) | |||||||||||
| Net new asset growth rate – Wealth Management Clients | 3.2 | 2.0 | 5.4 | – | – | ||||||
| Net new asset growth rate – Asset Management | 10.5 | (10.8) | 7.8 | – | – | ||||||
14
In 1Q15, Investment Banking reported income before taxes of CHF 945 million and net revenues of CHF 3,583 million. Investment Banking delivered solid results, reflecting higher revenues and improved profitability and returns on significantly reduced regulatory capital compared to 1Q14. Revenues in the strategic businesses increased slightly compared to 1Q14, as strong fixed income and equity sales and trading results more than offset a slowdown in underwriting and advisory activity, highlighting the strength of the diversified strategic franchise. Compared to 4Q14, strategic revenues increased, driven by seasonally stronger trading volumes and client activity in the fixed income and equities businesses. The non-strategic business continued to execute on the wind-down strategy during the quarter, reporting lower negative net revenues and leverage exposure compared to 1Q14 and 4Q14.
Capital and leverage metrics: At the end of 1Q15, Investment Banking strategic businesses reported risk-weighted assets of USD 153.1 billion, an increase of USD 1.7 billion compared to the end of 4Q14. The strategic businesses made continued progress in reducing leverage exposure by USD 49.2 billion from 4Q14, to USD 648.0 billion at the end of 1Q15. Investment Banking made continued progress in winding down its non-strategic businesses. At the end of 1Q15, risk-weighted assets were USD 9.7 billion, down USD 10.2 billion compared to the end of 1Q14 and stable compared the end of 4Q14. This compares to a risk-weighted assets target of USD 6 billion by year-end 2015. Leverage exposure was USD 48.9 billion at the end of 1Q15, reflecting a decrease of USD 9.5 billion compared to the end of 4Q14. This compares to a target of USD 24 billion in leverage exposure by year-end 2015.
| Investment Banking | |||||||||||
| in / end of | % change | ||||||||||
| 1Q15 | 4Q14 | 1Q14 | QoQ | YoY | |||||||
| Reported results (CHF million) | |||||||||||
| Net revenues | 3,583 | 2,454 | 3,416 | 46 | 5 | ||||||
| Provision for credit losses | 1 | 30 | 0 | (97) | – | ||||||
| Compensation and benefits | 1,552 | 1,179 | 1,521 | 32 | 2 | ||||||
| Total other operating expenses | 1,085 | 1,510 | 1,068 | (28) | 2 | ||||||
| Total operating expenses | 2,637 | 2,689 | 2,589 | (2) | 2 | ||||||
| Income/(loss) before taxes | 945 | (265) | 827 | – | 14 | ||||||
| Metrics (%) | |||||||||||
| Return on regulatory capital | 14.7 | – | 13.6 | – | – | ||||||
| Cost/income ratio | 73.6 | 109.6 | 75.8 | – | – | ||||||
Strategic results
In 1Q15, the strategic businesses reported income before taxes of CHF 1,115 million and net revenues of CHF 3,626 million. Fixed income sales and trading revenues improved compared to 1Q14, reflecting increased client activity, particularly in global macro products and emerging markets. Revenues increased significantly compared to 4Q14 due to seasonally higher client activity across all fixed income businesses. Equity sales and trading results were stronger compared to both 1Q14 and 4Q14 due to more favorable trading conditions, reflecting improved market volatility and sustained market shares. Underwriting and advisory results declined compared to both 1Q14 and 4Q14, reflecting a challenging start to the year due to significantly lower advisory revenues, a slowdown in leveraged finance underwriting activity and lower IPO issuance levels. Results in 1Q15 were impacted by the weakening of the average rate of the Swiss franc against the US dollar, which positively impacted revenues, but adversely impacted expenses. Compared to 1Q14, revenues increased 2% and total operating expenses increased 4% in Swiss Francs, while revenues declined 4% and total operating expenses declined 2% in US dollars.
15
Fixed income sales and trading: Fixed income results were strong compared to 1Q14, reflecting improved trading conditions and client activity, as significant actions from the European Central Bank and the Swiss National Bank drove higher market volatility, which positively impacted the global macro products and emerging markets businesses. In 1Q14, the rates business and certain emerging markets businesses were adversely impacted by difficult trading conditions, which resulted in reduced first quarter seasonal contribution from these franchises. Global macro products revenues significantly increased from subdued levels, driven by increased client activity across the rates and foreign exchange businesses. Revenues from emerging markets were also higher, driven by robust trading revenues across all markets, most notably Asia Pacific and EMEA. Securitized products revenues increased, primarily driven by robust growth in asset finance. These gains were partially offset by lower revenues in global credit products, as a slowdown in US leveraged finance underwriting activity resulted in weaker trading performance, given reduced client risk appetite. Compared to 4Q14, revenues increased significantly, as a seasonal increase in client activity resulted in higher results across all fixed income businesses. Global credit products revenues increased, driven by higher leveraged finance and investment grade results, both reflecting strong secondary trading activity. Improved global macro products revenues were driven by higher market volatility and increased client activity across the rates and foreign exchange businesses. Emerging market revenues increased, reflecting higher trading activity across most regions, most notably Asia Pacific and Latin America. In addition, securitized products revenues increased, reflecting higher non-agency and agency results.
Equity sales and trading: Equity sales and trading revenues improved compared to 1Q14, driven by more favorable trading conditions, reflecting increased market volatility, higher flows into equity funds and sustained leading market shares. Revenues in systematic market making were significantly higher, following less favorable trading conditions in 1Q14. Derivatives results were robust, primarily due to strong growth in Asia Pacific and continued momentum in fee-based products distributed by Private Banking and Wealth Management. Cash equities revenues increased, reflecting improved trading conditions and strong market positions. Results in prime services were stable despite significantly reduced leverage exposure, highlighting continued progress in the client portfolio optimization strategy. Equity sales and trading and revenues increased compared to 4Q14, reflecting more favorable trading conditions. The gains were primarily driven by continued strength in derivatives, particularly in Asia Pacific. Revenues from systematic market making were also higher. These gains were partially offset by lower revenues in both prime services and cash equities.
Underwriting and advisory: Debt underwriting results were lower compared to 1Q14, primarily driven by weak performance in the leveraged finance business, following strong 1Q14 results and due to a slow debt underwriting environment, particularly in the US. These declines were partially offset by higher investment grade revenues due to increased investment grade corporate issuance in the US. Equity underwriting results declined compared to 1Q14, primarily due to a slowdown in IPO activity, following strong 1Q14 results. Convertibles revenues were also lower as a decline in the share of wallet offset an increase in the overall fee pool. These declines were partially offset by higher revenues from follow-on offerings, particularly in the US. Advisory revenues were lower, reflecting market share losses due to certain deal closings moving into 2Q15, slower industry activity in our market-leading sponsors mergers and acquisitions (M&A) franchise and underperformance in our healthcare business. Debt underwriting results increased compared to 4Q14, primarily due to strong investment grade performance, in line with an increase in investment grade underwriting issuance as well as higher structured lending in emerging markets. Leveraged finance revenues were stable, reflecting an increase in high yield revenues in EMEA, as share of wallet gains and an increase in the overall fee pool offset slower leveraged finance underwriting issuance in the US. Equity underwriting results declined from 4Q14, primarily due to lower IPO results, reflecting a decline in both the overall fee pool and the share of wallet. Convertibles revenues were also lower. These declines were partially offset by significantly higher revenues from follow-on offerings, reflecting strong market conditions. The decrease in advisory revenues compared to 4Q14 was primarily due to a decline in both the overall advisory fee pool and share of wallet.
16
| Investment Banking – strategic results | |||||||||||
| in / end of | % change | ||||||||||
| 1Q15 | 4Q14 | 1Q14 | QoQ | YoY | |||||||
| Strategic results (CHF million) | |||||||||||
| Debt underwriting | 332 | 307 | 468 | 8 | (29) | ||||||
| Equity underwriting | 153 | 205 | 183 | (25) | (16) | ||||||
| Total underwriting | 485 | 512 | 651 | (5) | (25) | ||||||
| Advisory and other fees | 132 | 238 | 180 | (45) | (27) | ||||||
| Total underwriting and advisory | 617 | 750 | 831 | (18) | (26) | ||||||
| Fixed income sales and trading | 1,732 | 850 | 1,586 | 104 | 9 | ||||||
| Equity sales and trading | 1,344 | 1,231 | 1,206 | 9 | 11 | ||||||
| Total sales and trading | 3,076 | 2,081 | 2,792 | 48 | 10 | ||||||
| Other | (67) | (83) | (83) | (19) | (19) | ||||||
| Net revenues | 3,626 | 2,748 | 3,540 | 32 | 2 | ||||||
| Provision for credit losses | 1 | 14 | 0 | (93) | – | ||||||
| Total operating expenses | 2,510 | 2,155 | 2,412 | 16 | 4 | ||||||
| Income before taxes | 1,115 | 579 | 1,128 | 93 | (1) | ||||||
| Metrics (%) | |||||||||||
| Return on regulatory capital | 18.6 | 9.9 | 20.7 | – | – | ||||||
| Cost/income ratio | 69.2 | 78.4 | 68.1 | – | – | ||||||
Total operating expenses increased 4% compared to 1Q14, reflecting the foreign exchange impact of the weakening of the Swiss franc compared to the US dollar. Total operating expenses in US dollars declined 2%, primarily due to lower deferred compensation expenses from prior-year awards, while reduced infrastructure costs offset higher UK bank levy expenses. Compared to 4Q14, total operating expenses increased 16% in Swiss francs, primarily driven by higher discretionary compensation expenses, reflecting seasonally higher results and slightly lower general and administrative expenses, as a decline in infrastructure costs were partially offset higher UK bank levy expenses.
17
Non-strategic results
The non-strategic results for Investment Banking comprise the legacy fixed income portfolio including the legacy rates business, primarily non-exchange-cleared instruments and capital-intensive structured positions, legacy funding costs associated with non-Basel III compliant debt instruments, as well as certain legacy litigation costs and other small non-strategic positions.
| Investment Banking – non-strategic results | |||||||||||
| in / end of | % change | ||||||||||
| 1Q15 | 4Q14 | 1Q14 | QoQ | YoY | |||||||
| Non-strategic results (CHF million) | |||||||||||
| Net revenues | (43) | (294) | (124) | (85) | (65) | ||||||
| Provision for credit losses | 0 | 16 | 0 | (100) | – | ||||||
| Total operating expenses | 127 | 534 | 177 | (76) | (28) | ||||||
| Loss before taxes | (170) | (844) | (301) | (80) | (44) | ||||||
The non-strategic businesses reported a loss before taxes of CHF 170 million and negative net revenues of CHF 43 million in 1Q15. Negative net revenues were lower compared to 1Q14, primarily due to net valuation gains in the legacy fixed income portfolio, proactive portfolio management initiatives, and lower funding costs. Negative net revenues were also lower compared to 4Q14, which included the adverse impact from the recognition of funding value adjustments of CHF 171 million. Total operating expenses declined compared to both 1Q14 and 4Q14, reflecting significantly lower litigation provisions.
18
Corporate Center includes parent company operations such as Group financing, expenses for projects sponsored by the Group and certain expenses and revenues that have not been allocated to the segments. It also includes consolidation and elimination adjustments required to eliminate intercompany revenues and expenses.
In 1Q15, the Corporate Center recorded a loss before taxes of CHF 241 million compared to a loss before taxes of CHF 439 million in 1Q14 and income before taxes of CHF 284 million in 4Q14. The Corporate Center recorded a loss before taxes of CHF 231 million in its strategic results. The non-strategic results reported a loss before taxes of CHF 10 million, primarily including IT architecture simplification expenses of CHF 61 million, business realignment costs of CHF 48 million and legacy funding costs of CHF 21 million, partially offset by fair value gains on own credit spreads of CHF 117 million.
| Corporate Center | |||||||||||
| in / end of | % change | ||||||||||
| 1Q15 | 4Q14 | 1Q14 | QoQ | YoY | |||||||
| Reported results (CHF million) | |||||||||||
| Net revenues | 118 | 696 | (187) | (83) | – | ||||||
| Provision for credit losses | 0 | 3 | 1 | (100) | (100) | ||||||
| Compensation and benefits | 194 | 174 | 166 | 11 | 17 | ||||||
| Total other operating expenses | 165 | 235 | 85 | (30) | 94 | ||||||
| Total operating expenses | 359 | 409 | 251 | (12) | 43 | ||||||
| Income/(loss) before taxes | (241) | 284 | (439) | – | (45) | ||||||
| Non-strategic results (CHF million) | |||||||||||
| Net revenues | 124 | 650 | (146) | (81) | – | ||||||
| Provision for credit losses | 0 | 0 | 0 | – | – | ||||||
| Total operating expenses | 134 | 229 | 144 | (41) | (7) | ||||||
| Income/(loss) before taxes | (10) | 421 | (290) | – | (97) | ||||||
19
Balance sheet: As of the end of 1Q15, total assets of CHF 904.4 billion decreased 2% compared to 4Q14, mainly reflecting the foreign exchange translation impact. Excluding the foreign exchange translation impact, total assets were stable.
Total shareholders’ equity: Credit Suisse’s total shareholders’ equity decreased to CHF 43.4 billion as of the end of 1Q15 compared to CHF 44.0 billion as of the end of 4Q14. Total shareholders’ equity was impacted by foreign exchange-related movements on cumulative translation adjustments and transactions relating to the future settlement of share-based compensation awards. These movements were partially offset by net income and an increase in the share-based compensation obligation. As of the end of 1Q15, Credit Suisse had 1,607.2 million shares issued.
BIS regulatory capital and ratios: The common equity tier 1 (CET1) ratio was 13.8% as of the end of 1Q15, compared to 14.9% as of the end of 4Q14, reflecting a decrease in CET1 capital, partially offset by a slight decrease in risk-weighted assets. Credit Suisse’s tier 1 ratio was 16.5% as of the end of 1Q15, compared to 17.1% as of the end of 4Q14. The total capital ratio was 20.0% as of the end of 1Q15 compared to 20.8% as of the end of 4Q14.
CET1 capital was CHF 39.7 billion as of the end of 1Q15 compared to CHF 43.3 billion as of the end of 4Q14, mainly reflecting an additional annual 20% phase-in of regulatory deductions from CET1 (from 20% to 40%), including goodwill, other intangible assets and certain deferred tax assets, and an additional annual 20% decrease in the adjustment for the accounting treatment of pension plans (from 80% to 60%), pursuant to phase-in requirements. CET1 capital was also affected by a negative foreign exchange impact and the share purchases for share-based compensation awards, partially offset by net income and an increase in the share-based compensation obligation.
Risk-weighted assets decreased slightly to CHF 288.5 billion as of the end of 1Q15 compared to CHF 291.4 billion as of the end of 4Q14, primarily reflecting the foreign exchange impact and movements in risk levels in credit risk and market risk. This was partially offset by externally prescribed methodology and policy changes, primarily in credit risk.
Total eligible capital was CHF 57.6 billion as of the end of 1Q15, compared to CHF 60.8 billion as of the end of 4Q14, reflecting the decrease in CET1 capital to CHF 39.7 billion, the increase in additional tier 1 capital to CHF 7.9 billion and the decrease in tier 2 capital to CHF 10.0 billion.
As of the end of 1Q15, the look-through CET1 ratio was 10.0%, compared to 10.1% as of the end of 4Q14.
20
Leverage metrics: Beginning in 1Q15, Credit Suisse adopted the Bank for International Settlements (BIS) leverage ratio framework, as issued by the Basel Committee on Banking Supervision (BCBS) and implemented in Switzerland by FINMA. Under the BIS framework, the leverage ratio measures tier 1 capital against the end of period exposure. Leverage exposure is based on the BIS leverage ratio framework and consists of period-end balance sheet assets and prescribed regulatory adjustments.
The BIS tier 1 leverage ratio was 4.3% as of the end of 1Q15, with a BIS CET1 component of 3.6%. On a look-through basis, the BIS tier 1 leverage ratio was 3.6% as of the end of 1Q15, with a BIS CET1 component of 2.6%.
The Swiss leverage ratio was 5.2% as of the end of 1Q15 versus a requirement of 2.9%. On a look-through basis, the Swiss leverage ratio was 4.2% as of the end of 1Q15 versus the 2019 requirement of 4.1%.
The look-through leverage exposure was CHF 1,102.7 billion as of the end of 1Q15. Credit Suisse is targeting a leverage exposure of CHF 960–990 billion by the end of 2015, on a foreign exchange adjusted basis.
| Capital and leverage metrics | |||||||||
| Phase-in | Look-through | ||||||||
| end of | 1Q15 | 4Q14 | 1Q15 | 4Q14 | |||||
| BIS capital ratios (%) | |||||||||
| CET1 ratio | 13.8 | 14.9 | 10.0 | 10.1 | |||||
| Tier 1 ratio | 16.5 | 17.1 | 14.0 | 14.0 | |||||
| Total capital ratio | 20.0 | 20.8 | 16.4 | 16.5 | |||||
| Leverage metrics (%, except where indicated) | |||||||||
| Leverage exposure (CHF billion) | 1,108.6 | 1,157.6 | 1,102.7 | 1,149.7 | |||||
| BIS CET1 leverage ratio | 3.6 | 3.7 | 2.6 | 2.5 | |||||
| BIS tier 1 leverage ratio | 4.3 | 4.3 | 3.6 | 3.5 | |||||
| Swiss leverage ratio | 5.2 | 5.2 | 4.2 | 4.1 | |||||
21
The Group has not finalized its 1Q15 Financial Report and the Group’s independent registered public accounting firm has not completed its review of the condensed consolidated financial statements (unaudited) for the period. Accordingly, the financial information contained in this Earnings Release is subject to completion of quarter-end procedures, which may result in changes to that information. Certain reclassifications have been made to prior periods to conform to the current presentation.
For purposes of this Earnings Release, unless the context otherwise requires, the terms “Credit Suisse” and “the Group” mean Credit Suisse Group AG and its consolidated subsidiaries. The business of Credit Suisse AG, the Swiss bank subsidiary of the Group, is substantially similar to the Group, and these terms are used to refer to both when the subject is the same or substantially similar. The term “the Bank” is used when referring to Credit Suisse AG, the Swiss bank subsidiary of the Group, and its consolidated subsidiaries.
Information referenced in this Earnings Release, whether via website links or otherwise, is not incorporated into this Earnings Release.
As of January 1, 2013, Basel III was implemented in Switzerland along with the Swiss “Too Big to Fail” legislation and regulations thereunder. As of January 1, 2015, the BIS leverage ratio framework, as issued by BCBS, was implemented in Switzerland by FINMA. The related disclosures are in accordance with Credit Suisse’s interpretation of such requirements, including relevant assumptions. Changes in the interpretation of these requirements in Switzerland or in any of Credit Suisse’s assumptions or estimates could result in different numbers from those shown herein.
References to phase-in and look-through included herein refer to Basel III requirements. Phase-in under the Basel III capital framework reflects that for the years 2014 – 2018, there will be a five-year (20% per annum) phase in of goodwill and other intangible assets and other capital deductions (e.g., certain deferred tax assets and participations in financial institutions) and for the years 2013 – 2022, there will be a phase out of certain capital instruments. Look-through assumes the full phase-in of goodwill and other intangible assets and other regulatory adjustments and the full phase out of certain capital instruments.
Unless otherwise noted, leverage exposure is based on the BIS leverage ratio framework and consists of period-end balance sheet assets and prescribed regulatory adjustments. Leverage amounts for 4Q14, which are presented in order to show meaningful comparative information, are based on estimates which are calculated as if the BIS leverage ratio framework had been implemented in Switzerland at such time. We have revised previously reported estimates of BIS leverage amounts for 4Q14 to take into account refinements in our calculation of BIS leverage amounts. Beginning in 2015, the Swiss leverage ratio is calculated as Swiss total eligible capital, divided by period-end leverage exposure. The look-through BIS tier 1 leverage ratio and CET1 leverage ratio are calculated as look-through BIS tier 1 capital and CET1 capital, respectively, divided by end-period leverage exposure. Leverage exposure target assumes constant USD/CHF and EUR/CHF exchange rates equal to those at the end of 1Q15.
Return on equity for strategic results is calculated by dividing annualized strategic net income by average strategic shareholders’ equity (derived by deducting 10% of non-strategic risk-weighted assets from reported shareholders’ equity). Return on regulatory capital is calculated using income after tax and assumes a tax rate of 30% and capital allocated based on the average of 10% of average risk-weighted assets and an average of a certain percentage of leverage exposure (2.4% for periods prior to 2015 and 3% for periods after January 1, 2015).
Adjusted cost run-rates are non-GAAP financial measures. All expense reduction metrics against 6M11 annualized total expenses are measured at constant foreign exchange rates and exclude realignment and other significant expense items and variable compensation expenses. For further information regarding these measures, see the 1Q15 Results Presentation Slides.
The Group’s estimate of the aggregate range of reasonably possible losses that are not covered by existing provisions which is discussed above relates only to those proceedings for which the Group believes an estimate is possible and which are discussed in Note 38 to the Consolidated Financial Statements in the Group’s Annual Report on Form 20-F and updated in its quarterly reports (including the Group’s 1Q15 Financial Report that is scheduled to be released on April 30, 2015). It is inherently difficult to determine whether a loss is probable or even reasonably possible or to estimate the amount of any loss or loss range for many of the Group’s legal proceedings. The Group’s aggregate litigation provisions include estimates of losses, additional losses or ranges of loss for proceedings for which such losses are probable and can be reasonably estimated. The Group does not believe that it can estimate an aggregate range of reasonably possible losses for certain of its proceedings because of their complexity, the novelty of some of the claims, the early stage of the proceedings, the limited amount of discovery that has occurred and/or other factors. For additional details, see Note 38 to the Consolidated Financial Statements in the Group’s Annual Report on Form 20-F and the litigation note in each of its quarterly Financial Reports.
Strategic net new assets are determined based on the assumption that assets managed across businesses relate to strategic businesses only.
Investors and others should note that we announce material information (including quarterly earnings releases and financial reports) to the investing public using press releases, SEC and Swiss ad hoc filings, our website and public conference calls and webcasts. We intend to also use our Twitter account @creditsuisse (https://twitter.com/creditsuisse) to excerpt key messages from our public disclosures, including earnings releases. We may retweet such messages through certain of our regional Twitter accounts, including @csschweiz (https://twitter.com/csschweiz) and @csapac (https://twitter.com/csapac). Investors and others should take care to consider such abbreviated messages in the context of the disclosures from which they are excerpted. The information we post on these Twitter accounts is not a part of this Earnings Release.
In various tables, use of “–” indicates not meaningful or not applicable.
22
| in / end of | % change | ||||||||||
| 1Q15 | 4Q14 | 1Q14 | QoQ | YoY | |||||||
| Statements of operations (CHF million) | |||||||||||
| Net revenues | 6,647 | 6,372 | 6,829 | 4 | (3) | ||||||
| Provision for credit losses | 30 | 75 | 34 | (60) | (12) | ||||||
| Compensation and benefits | 2,976 | 2,621 | 2,993 | 14 | (1) | ||||||
| General and administrative expenses | 1,738 | 2,362 | 1,690 | (26) | 3 | ||||||
| Commission expenses | 392 | 422 | 369 | (7) | 6 | ||||||
| Total other operating expenses | 2,130 | 2,784 | 2,059 | (23) | 3 | ||||||
| Total operating expenses | 5,106 | 5,405 | 5,052 | (6) | 1 | ||||||
| Income from continuing operations before taxes | 1,511 | 892 | 1,743 | 69 | (13) | ||||||
| Income tax expense | 477 | 189 | 543 | 152 | (12) | ||||||
| Income from continuing operations | 1,034 | 703 | 1,200 | 47 | (14) | ||||||
| Income/(loss) from discontinued operations | 0 | (10) | 15 | 100 | (100) | ||||||
| Net income | 1,034 | 693 | 1,215 | 49 | (15) | ||||||
| Net income/(loss) attributable to noncontrolling interests | (20) | 2 | 356 | – | – | ||||||
| Net income/(loss) attributable to shareholders | 1,054 | 691 | 859 | 53 | 23 | ||||||
| of which from continuing operations | 1,054 | 701 | 844 | 50 | 25 | ||||||
| of which from discontinued operations | 0 | (10) | 15 | 100 | (100) | ||||||
| Earnings per share (CHF) | |||||||||||
| Basic earnings per share from continuing operations | 0.63 | 0.41 | 0.47 | 54 | 34 | ||||||
| Basic earnings per share | 0.63 | 0.40 | 0.48 | 58 | 31 | ||||||
| Diluted earnings per share from continuing operations | 0.62 | 0.40 | 0.47 | 55 | 32 | ||||||
| Diluted earnings per share | 0.62 | 0.39 | 0.48 | 59 | 29 | ||||||
| Return on equity (%, annualized) | |||||||||||
| Return on equity attributable to shareholders | 9.9 | 6.2 | 8.0 | – | – | ||||||
| Return on tangible equity attributable to shareholders 1 | 12.4 | 7.8 | 10.0 | – | – | ||||||
| Number of employees (full-time equivalents) | |||||||||||
| Number of employees | 46,400 | 45,800 | 45,600 | 1 | 2 | ||||||
|
1
Based on tangible shareholders' equity attributable to shareholders, a non-GAAP financial measure, which is calculated by deducting goodwill and other intangible assets from total shareholders' equity attributable to shareholders. Management believes that the return on tangible shareholders' equity attributable to shareholders is meaningful as it allows consistent measurement of the performance of businesses without regard to whether the businesses were acquired.
|
|||||||||||
23
| Credit Suisse and Core Results | |||||||||||||||||||
| Core Results | Noncontrolling interests without SEI | Credit Suisse | |||||||||||||||||
| in | 1Q15 | 4Q14 | 1Q14 | 1Q15 | 4Q14 | 1Q14 | 1Q15 | 4Q14 | 1Q14 | ||||||||||
| Statements of operations (CHF million) | |||||||||||||||||||
| Net revenues | 6,673 | 6,376 | 6,469 | (26) | (4) | 360 | 6,647 | 6,372 | 6,829 | ||||||||||
| Provision for credit losses | 30 | 75 | 34 | 0 | 0 | 0 | 30 | 75 | 34 | ||||||||||
| Compensation and benefits | 2,975 | 2,618 | 2,977 | 1 | 3 | 16 | 2,976 | 2,621 | 2,993 | ||||||||||
| General and administrative expenses | 1,738 | 2,360 | 1,689 | 0 | 2 | 1 | 1,738 | 2,362 | 1,690 | ||||||||||
| Commission expenses | 392 | 422 | 369 | 0 | 0 | 0 | 392 | 422 | 369 | ||||||||||
| Total other operating expenses | 2,130 | 2,782 | 2,058 | 0 | 2 | 1 | 2,130 | 2,784 | 2,059 | ||||||||||
| Total operating expenses | 5,105 | 5,400 | 5,035 | 1 | 5 | 17 | 5,106 | 5,405 | 5,052 | ||||||||||
| Income/(loss) from continuing operations before taxes | 1,538 | 901 | 1,400 | (27) | (9) | 343 | 1,511 | 892 | 1,743 | ||||||||||
| Income tax expense | 477 | 189 | 543 | 0 | 0 | 0 | 477 | 189 | 543 | ||||||||||
| Income/(loss) from continuing operations | 1,061 | 712 | 857 | (27) | (9) | 343 | 1,034 | 703 | 1,200 | ||||||||||
| Income/(loss) from discontinued operations | 0 | (10) | 15 | 0 | 0 | 0 | 0 | (10) | 15 | ||||||||||
| Net income/(loss) | 1,061 | 702 | 872 | (27) | (9) | 343 | 1,034 | 693 | 1,215 | ||||||||||
| Net income/(loss) attributable to noncontrolling interests | 7 | 11 | 13 | (27) | (9) | 343 | (20) | 2 | 356 | ||||||||||
| Net income attributable to shareholders | 1,054 | 691 | 859 | – | – | – | 1,054 | 691 | 859 | ||||||||||
| of which from continuing operations | 1,054 | 701 | 844 | – | – | – | 1,054 | 701 | 844 | ||||||||||
| of which from discontinued operations | 0 | (10) | 15 | – | – | – | 0 | (10) | 15 | ||||||||||
| Statement of operations metrics (%) | |||||||||||||||||||
| Cost/income ratio | 76.5 | 84.7 | 77.8 | – | – | – | 76.8 | 84.8 | 74.0 | ||||||||||
| Pre-tax income margin | 23.0 | 14.1 | 21.6 | – | – | – | 22.7 | 14.0 | 25.5 | ||||||||||
| Effective tax rate | 31.0 | 21.0 | 38.8 | – | – | – | 31.6 | 21.2 | 31.2 | ||||||||||
| Net income margin 1 | 15.8 | 10.8 | 13.3 | – | – | – | 15.9 | 10.8 | 12.6 | ||||||||||
|
1
Based on amounts attributable to shareholders.
|
|||||||||||||||||||
24
| Core Results | |||||||||||
| in / end of | % change | ||||||||||
| 1Q15 | 4Q14 | 1Q14 | QoQ | YoY | |||||||
| Statements of operations (CHF million) | |||||||||||
| Net interest income | 2,153 | 2,133 | 2,183 | 1 | (1) | ||||||
| Commissions and fees | 2,980 | 3,215 | 3,276 | (7) | (9) | ||||||
| Trading revenues | 1,386 | 297 | 630 | 367 | 120 | ||||||
| Other revenues | 154 | 731 | 380 | (79) | (59) | ||||||
| Net revenues | 6,673 | 6,376 | 6,469 | 5 | 3 | ||||||
| of which strategic results | 6,590 | 6,000 | 6,530 | 10 | 1 | ||||||
| of which non-strategic results | 83 | 376 | (61) | (78) | – | ||||||
| Provision for credit losses | 30 | 75 | 34 | (60) | (12) | ||||||
| Compensation and benefits | 2,975 | 2,618 | 2,977 | 14 | 0 | ||||||
| General and administrative expenses | 1,738 | 2,360 | 1,689 | (26) | 3 | ||||||
| Commission expenses | 392 | 422 | 369 | (7) | 6 | ||||||
| Total other operating expenses | 2,130 | 2,782 | 2,058 | (23) | 3 | ||||||
| Total operating expenses | 5,105 | 5,400 | 5,035 | (5) | 1 | ||||||
| of which strategic results | 4,742 | 4,495 | 4,568 | 5 | 4 | ||||||
| of which non-strategic results | 363 | 905 | 467 | (60) | (22) | ||||||
| Income from continuing operations before taxes | 1,538 | 901 | 1,400 | 71 | 10 | ||||||
| of which strategic results | 1,822 | 1,449 | 1,944 | 26 | (6) | ||||||
| of which non-strategic results | (284) | (548) | (544) | (48) | (48) | ||||||
| Income tax expense | 477 | 189 | 543 | 152 | (12) | ||||||
| Income from continuing operations | 1,061 | 712 | 857 | 49 | 24 | ||||||
| Income/(loss) from discontinued operations | 0 | (10) | 15 | 100 | (100) | ||||||
| Net income | 1,061 | 702 | 872 | 51 | 22 | ||||||
| Net income attributable to noncontrolling interests | 7 | 11 | 13 | (36) | (46) | ||||||
| Net income/(loss) attributable to shareholders | 1,054 | 691 | 859 | 53 | 23 | ||||||
| of which strategic results | 1,235 | 1,155 | 1,404 | 7 | (12) | ||||||
| of which non-strategic results | (181) | (464) | (545) | (61) | (67) | ||||||
| Statement of operations metrics (%) | |||||||||||
| Return on regulatory capital | 13.9 | 8.7 | 14.4 | – | – | ||||||
| Cost/income ratio | 76.5 | 84.7 | 77.8 | – | – | ||||||
| Pre-tax income margin | 23.0 | 14.1 | 21.6 | – | – | ||||||
| Effective tax rate | 31.0 | 21.0 | 38.8 | – | – | ||||||
| Net income margin 1 | 15.8 | 10.8 | 13.3 | – | – | ||||||
| Return on equity (%, annualized) | |||||||||||
| Return on equity – strategic results | 12.0 | 10.9 | 14.0 | – | – | ||||||
| Number of employees (full-time equivalents) | |||||||||||
| Number of employees | 46,400 | 45,800 | 45,600 | 1 | 2 | ||||||
|
1
Based on amounts attributable to shareholders.
|
|||||||||||
25
| Strategic results | Non-strategic results | Core Results | |||||||||||||||||
| in / end of | 1Q15 | 4Q14 | 1Q14 | 1Q15 | 4Q14 | 1Q14 | 1Q15 | 4Q14 | 1Q14 | ||||||||||
| Statements of operations (CHF million) | |||||||||||||||||||
| Net revenues | 6,590 | 6,000 | 6,530 | 83 | 376 | (61) | 6,673 | 6,376 | 6,469 | ||||||||||
| Provision for credit losses | 26 | 56 | 18 | 4 | 19 | 16 | 30 | 75 | 34 | ||||||||||
| Compensation and benefits | 2,822 | 2,414 | 2,782 | 153 | 204 | 195 | 2,975 | 2,618 | 2,977 | ||||||||||
| Total other operating expenses | 1,920 | 2,081 | 1,786 | 210 | 701 | 272 | 2,130 | 2,782 | 2,058 | ||||||||||
| Total operating expenses | 4,742 | 4,495 | 4,568 | 363 | 905 | 467 | 5,105 | 5,400 | 5,035 | ||||||||||
| Income/(loss) from continuing operations before taxes | 1,822 | 1,449 | 1,944 | (284) | (548) | (544) | 1,538 | 901 | 1,400 | ||||||||||
| Income tax expense/(benefit) | 580 | 283 | 527 | (103) | (94) | 16 | 477 | 189 | 543 | ||||||||||
| Income/(loss) from continuing operations | 1,242 | 1,166 | 1,417 | (181) | (454) | (560) | 1,061 | 712 | 857 | ||||||||||
| Income/(loss) from discontinued operations | 0 | 0 | 0 | 0 | (10) | 15 | 0 | (10) | 15 | ||||||||||
| Net income/(loss) | 1,242 | 1,166 | 1,417 | (181) | (464) | (545) | 1,061 | 702 | 872 | ||||||||||
| Net income attributable to noncontrolling interests | 7 | 11 | 13 | 0 | 0 | 0 | 7 | 11 | 13 | ||||||||||
| Net income/(loss) attributable to shareholders | 1,235 | 1,155 | 1,404 | (181) | (464) | (545) | 1,054 | 691 | 859 | ||||||||||
| Balance sheet statistics (CHF million) | |||||||||||||||||||
| Risk-weighted assets 1 | 269,273 | 268,428 | 254,568 | 13,822 | 15,820 | 25,126 | 283,095 | 284,248 | 279,694 | ||||||||||
| Total assets | 875,940 | 887,450 | 833,988 | 27,450 | 32,791 | 42,811 | 903,390 | 920,241 | 876,799 | ||||||||||
| Leverage exposure 1 | 1,051,078 | 1,086,964 | – | 51,650 | 62,692 | – | 1,102,728 | 1,149,656 | – | ||||||||||
|
1
Disclosed on a fully phased-in look-through basis.
|
|||||||||||||||||||
| in / end of | % change | ||||||||||
| 1Q15 | 4Q14 | 1Q14 | QoQ | YoY | |||||||
| Statements of operations (CHF million) | |||||||||||
| Net revenues | 6,590 | 6,000 | 6,530 | 10 | 1 | ||||||
| Provision for credit losses | 26 | 56 | 18 | (54) | 44 | ||||||
| Compensation and benefits | 2,822 | 2,414 | 2,782 | 17 | 1 | ||||||
| General and administrative expenses | 1,538 | 1,674 | 1,427 | (8) | 8 | ||||||
| Commission expenses | 382 | 407 | 359 | (6) | 6 | ||||||
| Total other operating expenses | 1,920 | 2,081 | 1,786 | (8) | 8 | ||||||
| Total operating expenses | 4,742 | 4,495 | 4,568 | 5 | 4 | ||||||
| Income from continuing operations before taxes | 1,822 | 1,449 | 1,944 | 26 | (6) | ||||||
| Income tax expense | 580 | 283 | 527 | 105 | 10 | ||||||
| Net income | 1,242 | 1,166 | 1,417 | 7 | (12) | ||||||
| Net income attributable to noncontrolling interests | 7 | 11 | 13 | (36) | (46) | ||||||
| Net income attributable to shareholders | 1,235 | 1,155 | 1,404 | 7 | (12) | ||||||
| Statement of operations metrics (%) | |||||||||||
| Return on regulatory capital | 17.3 | 14.9 | 21.9 | – | – | ||||||
| Cost/income ratio | 72.0 | 74.9 | 70.0 | – | – | ||||||
| Pre-tax income margin | 27.6 | 24.2 | 29.8 | – | – | ||||||
26
| in / end of | % change | ||||||||||
| 1Q15 | 4Q14 | 1Q14 | QoQ | YoY | |||||||
| Statements of operations (CHF million) | |||||||||||
| Net revenues | 83 | 376 | (61) | (78) | – | ||||||
| Provision for credit losses | 4 | 19 | 16 | (79) | (75) | ||||||
| Compensation and benefits | 153 | 204 | 195 | (25) | (22) | ||||||
| General and administrative expenses | 200 | 686 | 262 | (71) | (24) | ||||||
| Commission expenses | 10 | 15 | 10 | (33) | 0 | ||||||
| Total other operating expenses | 210 | 701 | 272 | (70) | (23) | ||||||
| Total operating expenses | 363 | 905 | 467 | (60) | (22) | ||||||
| Loss from continuing operations before taxes | (284) | (548) | (544) | (48) | (48) | ||||||
| Income tax expense/(benefit) | (103) | (94) | 16 | 10 | – | ||||||
| Loss from continuing operations | (181) | (454) | (560) | (60) | (68) | ||||||
| Income/(loss) from discontinued operations | 0 | (10) | 15 | 100 | (100) | ||||||
| Loss attributable to shareholders | (181) | (464) | (545) | (61) | (67) | ||||||
| in / end of | % change | ||||||||||
| 1Q15 | 4Q14 | 1Q14 | QoQ | YoY | |||||||
| Statements of operations (CHF million) | |||||||||||
| Net revenues | 2,972 | 3,226 | 3,240 | (8) | (8) | ||||||
| of which strategic results | 2,970 | 3,206 | 3,031 | (7) | (2) | ||||||
| of which non-strategic results | 2 | 20 | 209 | (90) | (99) | ||||||
| Provision for credit losses | 29 | 42 | 33 | (31) | (12) | ||||||
| Compensation and benefits | 1,229 | 1,265 | 1,290 | (3) | (5) | ||||||
| General and administrative expenses | 725 | 870 | 736 | (17) | (1) | ||||||
| Commission expenses | 155 | 167 | 169 | (7) | (8) | ||||||
| Total other operating expenses | 880 | 1,037 | 905 | (15) | (3) | ||||||
| Total operating expenses | 2,109 | 2,302 | 2,195 | (8) | (4) | ||||||
| of which strategic results | 2,007 | 2,160 | 2,049 | (7) | (2) | ||||||
| of which non-strategic results | 102 | 142 | 146 | (28) | (30) | ||||||
| Income/(loss) before taxes | 834 | 882 | 1,012 | (5) | (18) | ||||||
| of which strategic results | 938 | 1,007 | 965 | (7) | (3) | ||||||
| of which non-strategic results | (104) | (125) | 47 | (17) | – | ||||||
| Statement of operations metrics (%) | |||||||||||
| Return on regulatory capital | 21.0 | 24.9 | 31.0 | – | – | ||||||
| Cost/income ratio | 71.0 | 71.4 | 67.7 | – | – | ||||||
| Pre-tax income margin | 28.1 | 27.3 | 31.2 | – | – | ||||||
| Assets under management (CHF billion) | |||||||||||
| Assets under management | 1,374.0 | 1,377.3 | 1,292.5 | (0.2) | 6.3 | ||||||
| Net new assets | 17.0 | (3.0) | 13.7 | – | 24.1 | ||||||
| Number of employees and relationship managers | |||||||||||
| Number of employees (full-time equivalents) | 26,300 | 26,100 | 26,100 | 1 | 1 | ||||||
| Number of relationship managers | 4,290 | 4,260 | 4,410 | 1 | (3) | ||||||
27
| in / end of | % change | ||||||||||
| 1Q15 | 4Q14 | 1Q14 | QoQ | YoY | |||||||
| Net revenue detail (CHF million) | |||||||||||
| Net interest income | 991 | 995 | 979 | 0 | 1 | ||||||
| Recurring commissions and fees | 1,095 | 1,208 | 1,189 | (9) | (8) | ||||||
| Transaction- and performance-based revenues | 932 | 989 | 937 | (6) | (1) | ||||||
| Other revenues 1 | (46) | 34 | 135 | – | – | ||||||
| Net revenues | 2,972 | 3,226 | 3,240 | (8) | (8) | ||||||
| Provision for credit losses (CHF million) | |||||||||||
| New provisions | 48 | 61 | 53 | (21) | (9) | ||||||
| Releases of provisions | (19) | (19) | (20) | 0 | (5) | ||||||
| Provision for credit losses | 29 | 42 | 33 | (31) | (12) | ||||||
|
1
Includes investment-related gains/(losses), equity participations and other gains/(losses) and fair value gains/(losses) on the Clock Finance transaction.
|
|||||||||||
| Strategic results | Non-strategic results | Private Banking & Wealth Management | |||||||||||||||||
| in / end of | 1Q15 | 4Q14 | 1Q14 | 1Q15 | 4Q14 | 1Q14 | 1Q15 | 4Q14 | 1Q14 | ||||||||||
| Statements of operations (CHF million) | |||||||||||||||||||
| Net revenues | 2,970 | 3,206 | 3,031 | 2 | 20 | 209 | 2,972 | 3,226 | 3,240 | ||||||||||
| Provision for credit losses | 25 | 39 | 17 | 4 | 3 | 16 | 29 | 42 | 33 | ||||||||||
| Compensation and benefits | 1,205 | 1,216 | 1,225 | 24 | 49 | 65 | 1,229 | 1,265 | 1,290 | ||||||||||
| Total other operating expenses | 802 | 944 | 824 | 78 | 93 | 81 | 880 | 1,037 | 905 | ||||||||||
| Total operating expenses | 2,007 | 2,160 | 2,049 | 102 | 142 | 146 | 2,109 | 2,302 | 2,195 | ||||||||||
| Income/(loss) before taxes | 938 | 1,007 | 965 | (104) | (125) | 47 | 834 | 882 | 1,012 | ||||||||||
| Balance sheet statistics (CHF million) | |||||||||||||||||||
| Risk-weighted assets | 104,594 | 102,407 | 93,522 | 4,436 | 5,854 | 7,561 | 109,030 | 108,261 | 101,083 | ||||||||||
| Total assets | 357,648 | 335,382 | 306,228 | 8,743 | 10,567 | 17,856 | 366,391 | 345,949 | 324,084 | ||||||||||
| Leverage exposure | 385,691 | 365,177 | – | 4,118 | 4,867 | – | 389,809 | 370,044 | – | ||||||||||
28
| in / end of | % change | ||||||||||
| 1Q15 | 4Q14 | 1Q14 | QoQ | YoY | |||||||
| Statements of operations (CHF million) | |||||||||||
| Net interest income | 981 | 985 | 963 | 0 | 2 | ||||||
| Recurring commissions and fees | 1,067 | 1,177 | 1,139 | (9) | (6) | ||||||
| Transaction- and performance-based revenues | 922 | 976 | 919 | (6) | 0 | ||||||
| Other revenues | 0 | 68 | 10 | (100) | (100) | ||||||
| Net revenues | 2,970 | 3,206 | 3,031 | (7) | (2) | ||||||
| New provisions | 44 | 58 | 36 | (24) | 22 | ||||||
| Releases of provisions | (19) | (19) | (19) | 0 | 0 | ||||||
| Provision for credit losses | 25 | 39 | 17 | (36) | 47 | ||||||
| Compensation and benefits | 1,205 | 1,216 | 1,225 | (1) | (2) | ||||||
| General and administrative expenses | 651 | 784 | 660 | (17) | (1) | ||||||
| Commission expenses | 151 | 160 | 164 | (6) | (8) | ||||||
| Total other operating expenses | 802 | 944 | 824 | (15) | (3) | ||||||
| Total operating expenses | 2,007 | 2,160 | 2,049 | (7) | (2) | ||||||
| Income before taxes | 938 | 1,007 | 965 | (7) | (3) | ||||||
| of which Wealth Management Clients | 636 | 577 | 578 | 10 | 10 | ||||||
| of which Corporate & Institutional Clients | 230 | 220 | 246 | 5 | (7) | ||||||
| of which Asset Management | 72 | 210 | 141 | (66) | (49) | ||||||
| Statement of operations metrics (%) | |||||||||||
| Return on regulatory capital | 24.3 | 29.8 | 31.6 | – | – | ||||||
| Cost/income ratio | 67.6 | 67.4 | 67.6 | – | – | ||||||
| Pre-tax income margin | 31.6 | 31.4 | 31.8 | – | – | ||||||
29
| Wealth Management Clients | |||||||||||
| in / end of | % change | ||||||||||
| 1Q15 | 4Q14 | 1Q14 | QoQ | YoY | |||||||
| Statements of operations (CHF million) | |||||||||||
| Net revenues | 2,111 | 2,153 | 2,074 | (2) | 2 | ||||||
| Provision for credit losses | 17 | 10 | 16 | 70 | 6 | ||||||
| Total operating expenses | 1,458 | 1,566 | 1,480 | (7) | (1) | ||||||
| Income before taxes | 636 | 577 | 578 | 10 | 10 | ||||||
| Statement of operations metrics (%) | |||||||||||
| Return on regulatory capital | 28.5 | 29.8 | 32.1 | – | – | ||||||
| Cost/income ratio | 69.1 | 72.7 | 71.4 | – | – | ||||||
| Pre-tax income margin | 30.1 | 26.8 | 27.9 | – | – | ||||||
| Net revenue detail (CHF million) | |||||||||||
| Net interest income | 741 | 695 | 706 | 7 | 5 | ||||||
| Recurring commissions and fees | 700 | 765 | 730 | (8) | (4) | ||||||
| Transaction- and performance-based revenues | 670 | 600 | 638 | 12 | 5 | ||||||
| Other revenues | 0 | 93 | 1 | 0 | (100) | – | |||||
| Net revenues | 2,111 | 2,153 | 2,074 | (2) | 2 | ||||||
| Gross and net margin (annualized) (bp) | |||||||||||
| Net interest income | 35 | 32 | 35 | – | – | ||||||
| Recurring commissions and fees | 33 | 35 | 37 | – | – | ||||||
| Transaction- and performance-based revenues | 32 | 28 | 32 | – | – | ||||||
| Other revenues | 0 | 4 | 0 | – | – | ||||||
| Gross margin 2 | 100 | 99 | 104 | – | – | ||||||
| Net margin 3 | 30 | 27 | 29 | – | – | ||||||
| Balance sheet statistics (CHF million) | |||||||||||
| Risk-weighted assets | 53,618 | 51,541 | 50,457 | 4 | 6 | ||||||
| Number of relationship managers | |||||||||||
| Switzerland | 1,670 | 1,670 | 1,690 | 0 | (1) | ||||||
| EMEA | 1,030 | 1,030 | 1,150 | 0 | (10) | ||||||
| Americas | 540 | 540 | 560 | 0 | (4) | ||||||
| Asia Pacific | 510 | 490 | 460 | 4 | 11 | ||||||
| Number of relationship managers | 3,750 | 3,730 | 3,860 | 1 | (3) | ||||||
|
1
Reflects a gain on the sale of the local affluent and upper affluent business in Italy and a gain related to the partial sale of an investment in Euroclear.
|
|||||||||||
|
2
Net revenues divided by average assets under management.
|
|||||||||||
|
3
Income before taxes divided by average assets under management.
|
|||||||||||
30
| Corporate & Institutional Clients | |||||||||||
| in / end of | % change | ||||||||||
| 1Q15 | 4Q14 | 1Q14 | QoQ | YoY | |||||||
| Statements of operations (CHF million) | |||||||||||
| Net revenues | 484 | 518 | 492 | (7) | (2) | ||||||
| Provision for credit losses | 8 | 29 | 1 | (72) | – | ||||||
| Total operating expenses | 246 | 269 | 245 | (9) | 0 | ||||||
| Income before taxes | 230 | 220 | 246 | 5 | (7) | ||||||
| Statement of operations metrics (%) | |||||||||||
| Return on regulatory capital | 17.6 | 18.6 | 23.0 | – | – | ||||||
| Cost/income ratio | 50.8 | 51.9 | 49.8 | – | – | ||||||
| Pre-tax income margin | 47.5 | 42.5 | 50.0 | – | – | ||||||
| Net revenue detail (CHF million) | |||||||||||
| Net interest income | 240 | 290 | 257 | (17) | (7) | ||||||
| Recurring commissions and fees | 123 | 112 | 122 | 10 | 1 | ||||||
| Transaction- and performance-based revenues | 126 | 111 | 117 | 14 | 8 | ||||||
| Other revenues 1 | (5) | 5 | (4) | – | 25 | ||||||
| Net revenues | 484 | 518 | 492 | (7) | (2) | ||||||
| Balance sheet statistics (CHF million) | |||||||||||
| Risk-weighted assets | 38,867 | 37,812 | 34,023 | 3 | 14 | ||||||
| Number of relationship managers | |||||||||||
| Number of relationship managers (Switzerland) | 540 | 530 | 550 | 2 | (2) | ||||||
|
1
Includes fair value losses on the Clock Finance transaction and a gain related to the partial sale of an investment in Euroclear in 4Q14. Other periods presented relate to fair value gains/(losses) on the Clock Finance transaction.
|
|||||||||||
31
| Asset Management | |||||||||||
| in / end of | % change | ||||||||||
| 1Q15 | 4Q14 | 1Q14 | QoQ | YoY | |||||||
| Statements of operations (CHF million) | |||||||||||
| Net revenues | 375 | 535 | 465 | (30) | (19) | ||||||
| Provision for credit losses | 0 | 0 | 0 | – | – | ||||||
| Total operating expenses | 303 | 325 | 324 | (7) | (6) | ||||||
| Income before taxes | 72 | 210 | 141 | (66) | (49) | ||||||
| Statement of operations metrics (%) | |||||||||||
| Return on regulatory capital | 22.7 | 80.9 | 76.4 | – | – | ||||||
| Cost/income ratio | 80.8 | 60.7 | 69.7 | – | – | ||||||
| Pre-tax income margin | 19.2 | 39.3 | 30.3 | – | – | ||||||
| Net revenue detail (CHF million) | |||||||||||
| Recurring commissions and fees | 244 | 300 | 287 | (19) | (15) | ||||||
| Transaction- and performance-based revenues | 126 | 265 | 164 | (52) | (23) | ||||||
| Other revenues | 5 | (30) | 14 | – | (64) | ||||||
| Net revenues | 375 | 535 | 465 | (30) | (19) | ||||||
| Net revenue detail by type (CHF million) | |||||||||||
| Asset management fees | 244 | 300 | 287 | (19) | (15) | ||||||
| Placement, transaction and other fees | 48 | 84 | 56 | (43) | (14) | ||||||
| Performance fees and carried interest | 29 | 148 | 80 | (80) | (64) | ||||||
| Equity participations income | 32 | 22 | 15 | 45 | 113 | ||||||
| Fee-based revenues | 353 | 554 | 438 | (36) | (19) | ||||||
| Investment-related gains/(losses) | 11 | (15) | 19 | – | (42) | ||||||
| Equity participations and other gains/(losses) | 9 | (4) | 0 | – | – | ||||||
| Other revenues 1 | 2 | 0 | 8 | – | (75) | ||||||
| Net revenues | 375 | 535 | 465 | (30) | (19) | ||||||
| Fee-based margin on assets under management (annualized) (bp) | |||||||||||
| Fee-based margin 2 | 37 | 57 | 49 | – | – | ||||||
| Balance sheet statistics (CHF million) | |||||||||||
| Risk-weighted assets | 12,109 | 13,054 | 9,042 | (7) | 34 | ||||||
|
1
Includes allocated funding costs.
|
|||||||||||
|
2
Fee-based revenues divided by average assets under management.
|
|||||||||||
| in / end of | % change | ||||||||||
| 1Q15 | 4Q14 | 1Q14 | QoQ | YoY | |||||||
| Statements of operations (CHF million) | |||||||||||
| Net revenues | 2 | 20 | 209 | (90) | (99) | ||||||
| Provision for credit losses | 4 | 3 | 16 | 33 | (75) | ||||||
| Compensation and benefits | 24 | 49 | 65 | (51) | (63) | ||||||
| Total other operating expenses | 78 | 93 | 81 | (16) | (4) | ||||||
| Total operating expenses | 102 | 142 | 146 | (28) | (30) | ||||||
| Income/(loss) before taxes | (104) | (125) | 47 | (17) | – | ||||||
| Revenue details (CHF million) | |||||||||||
| Restructuring of select onshore businesses | 1 | 3 | 22 | (67) | (95) | ||||||
| Legacy cross-border business and small markets | 34 | 35 | 44 | (3) | (23) | ||||||
| Restructuring of former Asset Management division | (45) | (29) | 134 | 55 | – | ||||||
| Other | 12 | 11 | 9 | 9 | 33 | ||||||
| Net revenues | 2 | 20 | 209 | (90) | (99) | ||||||
32
| in / end of | % change | ||||||||||
| 1Q15 | 4Q14 | 1Q14 | QoQ | YoY | |||||||
| Statements of operations (CHF million) | |||||||||||
| Net revenues | 3,583 | 2,454 | 3,416 | 46 | 5 | ||||||
| of which strategic results | 3,626 | 2,748 | 3,540 | 32 | 2 | ||||||
| of which non-strategic results | (43) | (294) | (124) | (85) | (65) | ||||||
| Provision for credit losses | 1 | 30 | 0 | (97) | – | ||||||
| Compensation and benefits | 1,552 | 1,179 | 1,521 | 32 | 2 | ||||||
| General and administrative expenses | 853 | 1,269 | 856 | (33) | 0 | ||||||
| Commission expenses | 232 | 241 | 212 | (4) | 9 | ||||||
| Total other operating expenses | 1,085 | 1,510 | 1,068 | (28) | 2 | ||||||
| Total operating expenses | 2,637 | 2,689 | 2,589 | (2) | 2 | ||||||
| of which strategic results | 2,510 | 2,155 | 2,412 | 16 | 4 | ||||||
| of which non-strategic results | 127 | 534 | 177 | (76) | (28) | ||||||
| Income/(loss) before taxes | 945 | (265) | 827 | – | 14 | ||||||
| of which strategic results | 1,115 | 579 | 1,128 | 93 | (1) | ||||||
| of which non-strategic results | (170) | (844) | (301) | (80) | (44) | ||||||
| Statement of operations metrics (%) | |||||||||||
| Return on regulatory capital | 14.7 | – | 13.6 | – | – | ||||||
| Cost/income ratio | 73.6 | 109.6 | 75.8 | – | – | ||||||
| Pre-tax income margin | 26.4 | (10.8) | 24.2 | – | – | ||||||
| Number of employees (full-time equivalents) | |||||||||||
| Number of employees | 19,800 | 19,400 | 19,200 | 2 | 3 | ||||||
| in / end of | % change | ||||||||||
| 1Q15 | 4Q14 | 1Q14 | QoQ | YoY | |||||||
| Net revenue detail (CHF million) | |||||||||||
| Debt underwriting | 332 | 307 | 468 | 8 | (29) | ||||||
| Equity underwriting | 153 | 205 | 183 | (25) | (16) | ||||||
| Total underwriting | 485 | 512 | 651 | (5) | (25) | ||||||
| Advisory and other fees | 132 | 237 | 180 | (44) | (27) | ||||||
| Total underwriting and advisory | 617 | 749 | 831 | (18) | (26) | ||||||
| Fixed income sales and trading | 1,676 | 610 | 1,489 | 175 | 13 | ||||||
| Equity sales and trading | 1,376 | 1,185 | 1,201 | 16 | 15 | ||||||
| Total sales and trading | 3,052 | 1,795 | 2,690 | 70 | 13 | ||||||
| Other | (86) | (90) | (105) | (4) | (18) | ||||||
| Net revenues | 3,583 | 2,454 | 3,416 | 46 | 5 | ||||||
33
| Strategic results | Non-strategic results | Investment Banking | |||||||||||||||||
| in / end of | 1Q15 | 4Q14 | 1Q14 | 1Q15 | 4Q14 | 1Q14 | 1Q15 | 4Q14 | 1Q14 | ||||||||||
| Statements of operations (CHF million) | |||||||||||||||||||
| Net revenues | 3,626 | 2,748 | 3,540 | (43) | (294) | (124) | 3,583 | 2,454 | 3,416 | ||||||||||
| Provision for credit losses | 1 | 14 | 0 | 0 | 16 | 0 | 1 | 30 | 0 | ||||||||||
| Compensation and benefits | 1,514 | 1,137 | 1,480 | 38 | 42 | 41 | 1,552 | 1,179 | 1,521 | ||||||||||
| Total other operating expenses | 996 | 1,018 | 932 | 89 | 492 | 136 | 1,085 | 1,510 | 1,068 | ||||||||||
| Total operating expenses | 2,510 | 2,155 | 2,412 | 127 | 534 | 177 | 2,637 | 2,689 | 2,589 | ||||||||||
| Income/(loss) before taxes | 1,115 | 579 | 1,128 | (170) | (844) | (301) | 945 | (265) | 827 | ||||||||||
| Balance sheet statistics (CHF million, except where indicated) | |||||||||||||||||||
| Risk-weighted assets | 148,716 | 149,849 | 145,147 | 9,386 | 9,966 | 17,565 | 158,102 | 159,815 | 162,712 | ||||||||||
| Risk-weighted assets (USD) | 153,111 | 151,420 | 164,314 | 9,663 | 10,070 | 19,885 | 162,774 | 161,490 | 184,199 | ||||||||||
| Total assets | 470,495 | 506,820 | 496,540 | 18,707 | 22,224 | 24,955 | 489,202 | 529,044 | 521,495 | ||||||||||
| Leverage exposure | 629,380 | 689,957 | – | 47,532 | 57,825 | – | 676,912 | 747,782 | – | ||||||||||
| Leverage exposure (USD) | 647,977 | 697,191 | – | 48,936 | 58,431 | – | 696,913 | 755,622 | – | ||||||||||
| in / end of | % change | ||||||||||
| 1Q15 | 4Q14 | 1Q14 | QoQ | YoY | |||||||
| Statements of operations (CHF million) | |||||||||||
| Debt underwriting | 332 | 307 | 468 | 8 | (29) | ||||||
| Equity underwriting | 153 | 205 | 183 | (25) | (16) | ||||||
| Total underwriting | 485 | 512 | 651 | (5) | (25) | ||||||
| Advisory and other fees | 132 | 238 | 180 | (45) | (27) | ||||||
| Total underwriting and advisory | 617 | 750 | 831 | (18) | (26) | ||||||
| Fixed income sales and trading | 1,732 | 850 | 1,586 | 104 | 9 | ||||||
| Equity sales and trading | 1,344 | 1,231 | 1,206 | 9 | 11 | ||||||
| Total sales and trading | 3,076 | 2,081 | 2,792 | 48 | 10 | ||||||
| Other | (67) | (83) | (83) | (19) | (19) | ||||||
| Net revenues | 3,626 | 2,748 | 3,540 | 32 | 2 | ||||||
| Provision for credit losses | 1 | 14 | 0 | (93) | – | ||||||
| Compensation and benefits | 1,514 | 1,137 | 1,480 | 33 | 2 | ||||||
| General and administrative expenses | 770 | 785 | 726 | (2) | 6 | ||||||
| Commission expenses | 226 | 233 | 206 | (3) | 10 | ||||||
| Total other operating expenses | 996 | 1,018 | 932 | (2) | 7 | ||||||
| Total operating expenses | 2,510 | 2,155 | 2,412 | 16 | 4 | ||||||
| Income before taxes | 1,115 | 579 | 1,128 | 93 | (1) | ||||||
| Statement of operations metrics (%) | |||||||||||
| Return on regulatory capital | 18.6 | 9.9 | 20.7 | – | – | ||||||
| Cost/income ratio | 69.2 | 78.4 | 68.1 | – | – | ||||||
| Pre-tax income margin | 30.8 | 21.1 | 31.9 | – | – | ||||||
34
| in / end of | % change | ||||||||||
| 1Q15 | 4Q14 | 1Q14 | QoQ | YoY | |||||||
| Statements of operations (CHF million) | |||||||||||
| Net revenues | (43) | (294) | (124) | (85) | (65) | ||||||
| Provision for credit losses | 0 | 16 | 0 | (100) | – | ||||||
| Compensation and benefits | 38 | 42 | 41 | (10) | (7) | ||||||
| Total other operating expenses | 89 | 492 | 136 | (82) | (35) | ||||||
| of which litigation | 34 | 410 | 66 | (92) | (48) | ||||||
| Total operating expenses | 127 | 534 | 177 | (76) | (28) | ||||||
| Loss before taxes | (170) | (844) | (301) | (80) | (44) | ||||||
| Revenue details (CHF million) | |||||||||||
| Legacy fixed income portfolio | (29) | (239) | (61) | (88) | (52) | ||||||
| Legacy funding costs | (33) | (33) | (46) | 0 | (28) | ||||||
| Other | 19 | (22) | (17) | – | – | ||||||
| Net revenues | (43) | (294) | (124) | (85) | (65) | ||||||
| Corporate Center results | |||||||||||
| in / end of | % change | ||||||||||
| 1Q15 | 4Q14 | 1Q14 | QoQ | YoY | |||||||
| Statements of operations (CHF million) | |||||||||||
| Net revenues | 118 | 696 | (187) | (83) | – | ||||||
| Provision for credit losses | 0 | 3 | 1 | (100) | (100) | ||||||
| Compensation and benefits | 194 | 174 | 166 | 11 | 17 | ||||||
| General and administrative expenses | 160 | 221 | 97 | (28) | 65 | ||||||
| Commission expenses | 5 | 14 | (12) | (64) | – | ||||||
| Total other operating expenses | 165 | 235 | 85 | (30) | 94 | ||||||
| Total operating expenses | 359 | 409 | 251 | (12) | 43 | ||||||
| Income/(loss) before taxes | (241) | 284 | (439) | – | (45) | ||||||
| Balance sheet statistics (CHF million) | |||||||||||
| Risk-weighted assets 1 | 15,963 | 16,172 | 15,899 | (1) | 0 | ||||||
| Total assets | 47,797 | 45,248 | 31,220 | 6 | 53 | ||||||
| Leverage exposure 1 | 36,007 | 31,830 | – | 13 | – | ||||||
|
1
Disclosed on a fully phased-in look-through basis.
|
|||||||||||
35
| Corporate Center – non-strategic results | |||||||||||
| in / end of | % change | ||||||||||
| 1Q15 | 4Q14 | 1Q14 | QoQ | YoY | |||||||
| Statements of operations (CHF million) | |||||||||||
| Net revenues | 124 | 650 | (146) | (81) | – | ||||||
| Provision for credit losses | 0 | 0 | 0 | – | – | ||||||
| Total operating expenses | 134 | 229 | 144 | (41) | (7) | ||||||
| Income/(loss) before taxes | (10) | 421 | (290) | – | (97) | ||||||
| of which fair value impact from movements in own credit spreads | 117 | 324 | (120) | (64) | – | ||||||
| of which realignment costs 1 | (48) | (206) | (62) | (77) | (23) | ||||||
| of which IT architecture simplification expenses | (61) | (82) | (61) | (26) | – | ||||||
| of which real estate sales | 1 | 375 | 34 | (100) | (97) | ||||||
| of which litigation provisions | – | 21 | – | (100) | – | ||||||
| of which legacy funding costs 2 | (21) | (22) | (6) | (5) | 250 | ||||||
| of which reclassifications to discontinued operations 3 | – | 9 | (56) | (100) | 100 | ||||||
| of which other non-strategic items | 2 | 2 | (19) | – | – | ||||||
|
1
Business realignment costs relating to divisional realignment costs are presented in the relevant divisional non-strategic results.
|
|||||||||||
|
2
Represents legacy funding costs associated with non-Basel III compliant debt instruments.
|
|||||||||||
|
3
Includes reclassifications to discontinued operations of revenues and expenses arising from the sale of our Customized Fund Investment Group businesses and the domestic private banking business booked in Germany.
|
|||||||||||
Impact from movements in own credit spreads
Core Results revenues are impacted by changes in credit spreads on fair-valued Credit Suisse long-term vanilla debt and debit valuation adjustments (DVA) relating to certain structured notes liabilities carried at fair value. Core Results are also impacted by fair value gains/(losses) on stand-alone derivatives relating to certain of our funding liabilities and reflect the volatility of cross-currency swaps and yield curve volatility and, over the life of the derivatives, will result in no net gains/(losses). These fair value gains/(losses) are recorded in the Corporate Center.
| in | 1Q15 | 4Q14 | 1Q14 | ||||
| Impact from movements in own credit spreads (CHF million) | |||||||
| Fair value gains/(losses) from movements in own credit spreads | 117 | 324 | (120) | ||||
| of which fair value gains/(losses) on own long-term vanilla debt | (60) | 205 | (92) | ||||
| of which fair value gains/(losses) from DVA on structured notes | 127 | 164 | (4) | ||||
| of which fair value gains/(losses) on stand-alone derivatives | 50 | (45) | (24) | ||||
36
| Assets under management – Group | |||||||||||||
| end of | % change | ||||||||||||
| 1Q15 | 4Q14 | 1Q14 | QoQ | YoY | |||||||||
| Assets under management (CHF billion) | |||||||||||||
| Wealth Management Clients | 861.2 | 874.5 | 804.9 | (1.5) | 7.0 | ||||||||
| Corporate & Institutional Clients | 286.7 | 275.9 | 254.4 | 3.9 | 12.7 | ||||||||
| Asset Management | 391.7 | 388.5 | 363.4 | 0.8 | 7.8 | ||||||||
| Non-strategic | 9.2 | 10.8 | 25.9 | (14.8) | (64.5) | ||||||||
| Assets managed across businesses 1 | (174.8) | (172.4) | (156.1) | 1.4 | 12.0 | ||||||||
| Assets under management | 1,374.0 | 1,377.3 | 1,292.5 | (0.2) | 6.3 | ||||||||
| of which continuing operations | 1,374.0 | 1,377.3 | 1,281.1 | (0.2) | 7.3 | ||||||||
| of which discontinued operations | 0.0 | 0.0 | 11.4 | – | (100.0) | ||||||||
| Assets under management from continuing operations | 1,374.0 | 1,377.3 | 1,281.1 | (0.2) | 7.3 | ||||||||
| of which discretionary assets | 431.5 | 429.0 | 410.7 | 0.6 | 5.1 | ||||||||
| of which advisory assets | 942.5 | 948.3 | 870.4 | (0.6) | 8.3 | ||||||||
|
1
Assets managed by Asset Management for Wealth Management Clients, Corporate & Institutional Clients and the non-strategic businesses.
|
|||||||||||||
| in | 1Q15 | 4Q14 | 1Q14 | ||||
| Net new assets (CHF billion) | |||||||
| Wealth Management Clients | 7.0 | 4.4 | 10.6 | ||||
| Corporate & Institutional Clients | 6.1 | 3.6 | 0.4 | ||||
| Asset Management | 10.2 | (10.6) | 6.9 | ||||
| Non-strategic | (1.4) | (2.8) | (2.3) | ||||
| Assets managed across businesses 1 | (4.9) | 2.4 | (1.9) | ||||
| Net new assets | 17.0 | (3.0) | 13.7 | ||||
| of which continuing operations | 17.0 | (3.0) | 14.7 | ||||
| of which discontinued operations | 0.0 | 0.0 | (1.0) | ||||
|
1
Assets managed by Asset Management for Wealth Management Clients, Corporate & Institutional Clients and the non-strategic businesses.
|
|||||||
37
| BIS statistics – Group | |||||||||||||
| Phase-in | Look-through | ||||||||||||
| % change | % change | ||||||||||||
| end of | 1Q15 | 4Q14 | QoQ | 1Q15 | 4Q14 | QoQ | |||||||
| Eligible capital (CHF million) | |||||||||||||
| Total shareholders' equity | 43,396 | 43,959 | (1) | 43,396 | 43,959 | (1) | |||||||
| Regulatory adjustments 1 | 304 | (375) | – | 304 | (375) | – | |||||||
| Adjustments subject to phase-in | (3,954) | 2 | (262) | – | (15,449) | (15,008) | 3 | ||||||
| CET1 capital | 39,746 | 43,322 | (8) | 28,251 | 28,576 | (1) | |||||||
| Additional tier 1 instruments | 11,313 | 3 | 11,316 | 0 | 11,313 | 11,316 | 0 | ||||||
| Additional tier 1 instruments subject to phase-out 4 | 2,470 | 2,473 | 0 | – | – | – | |||||||
| Deductions from additional tier 1 capital | (5,919) | 5 | (7,307) | (19) | – | – | – | ||||||
| Additional tier 1 capital | 7,864 | 6,482 | 21 | 11,313 | 11,316 | 0 | |||||||
| Total tier 1 capital | 47,610 | 49,804 | (4) | 39,564 | 39,892 | (1) | |||||||
| Tier 2 instruments | 6,739 | 6 | 6,984 | (4) | 6,739 | 6,984 | (4) | ||||||
| Tier 2 instruments subject to phase-out | 3,421 | 4,190 | (18) | – | – | – | |||||||
| Deductions from tier 2 capital | (167) | (227) | (26) | – | – | – | |||||||
| Tier 2 capital | 9,993 | 10,947 | (9) | 6,739 | 6,984 | (4) | |||||||
| Total eligible capital | 57,603 | 60,751 | (5) | 46,303 | 46,876 | (1) | |||||||
| Risk-weighted assets by risk type (CHF million) | |||||||||||||
| Credit risk | 192,858 | 192,663 | 0 | 187,439 | 185,501 | 1 | |||||||
| Market risk | 31,464 | 34,468 | (9) | 31,464 | 34,468 | (9) | |||||||
| Operational risk | 58,413 | 58,413 | 0 | 58,413 | 58,413 | 0 | |||||||
| Non-counterparty risk | 5,779 | 5,866 | (1) | 5,779 | 5,866 | (1) | |||||||
| Risk-weighted assets | 288,514 | 291,410 | (1) | 283,095 | 284,248 | 0 | |||||||
| of which Private Banking & Wealth Management | 109,030 | 108,261 | 1 | 109,030 | 108,261 | 1 | |||||||
| of which Investment Banking | 158,102 | 159,815 | (1) | 158,102 | 159,815 | (1) | |||||||
| of which Corporate Center | 21,382 | 23,334 | (8) | 15,963 | 16,172 | (1) | |||||||
| Capital ratios (%) | |||||||||||||
| CET1 ratio | 13.8 | 14.9 | – | 10.0 | 10.1 | – | |||||||
| Tier 1 ratio | 16.5 | 17.1 | – | 14.0 | 14.0 | – | |||||||
| Total capital ratio | 20.0 | 20.8 | – | 16.4 | 16.5 | – | |||||||
|
1
Includes regulatory adjustments not subject to phase-in, including a cumulative dividend accrual.
|
|||||||||||||
|
2
Reflects 40% phase-in deductions, including goodwill, other intangible assets and certain deferred tax assets, and 60% of an adjustment for the accounting treatment of pension plans pursuant to phase-in requirements.
|
|||||||||||||
|
3
Consists of high-trigger and low-trigger capital instruments. Of this amount, CHF 6.2 billion consists of capital instruments with a capital ratio write-down trigger of 7% and CHF 5.1 billion consists of capital instruments with a capital ratio write-down trigger of 5.125%.
|
|||||||||||||
|
4
Includes hybrid capital instruments that are subject to phase-out.
|
|||||||||||||
|
5
Includes 60% of goodwill and other intangible assets (CHF 5.2 billion) and other capital deductions, including gains/(losses) due to changes in own credit risk on fair valued financial liabilities, that will be deducted from CET1 once Basel III is fully implemented.
|
|||||||||||||
|
6
Consists of high-trigger and low-trigger capital instruments. Of this amount, CHF 2.7 billion consists of capital instruments with a capital ratio write-down trigger of 7% and CHF 4.1 billion consists of capital instruments with a capital ratio write-down trigger of 5%.
|
|||||||||||||
38
| CET1 Capital movement – Group | |||
| 1Q15 | |||
| CET1 capital (CHF million) | |||
| Balance at beginning of period | 43,322 | ||
| Net income | 1,054 | ||
| Foreign exchange impact | (1,369) | ||
| Impact of deductions relating to phase-in requirements | (3,356) | ||
| Other 1 | 95 | ||
| Balance at end of period | 39,746 | ||
|
1
Reflects the net effect of share-based compensation, the impact of a dividend accrual, which includes the assumption that 50% of the proposed dividend is distributed in shares, and a change in other regulatory adjustments.
|
|||
| Risk-weighted asset movement by risk type – Group | |||||||||||
|
Credit risk |
Market risk |
Operational risk |
Non- counterparty risk |
Total risk- weighted assets |
|||||||
| 1Q15 (CHF million) | |||||||||||
| Balance at beginning of period | 192,663 | 34,468 | 58,413 | 5,866 | 291,410 | ||||||
| Foreign exchange impact | (5,190) | (1,525) | 0 | 0 | (6,715) | ||||||
| Movements in risk levels | (1,390) | (934) | 0 | (87) | (2,411) | ||||||
| Model and parameter updates 1 | (5) | 548 | 0 | 0 | 543 | ||||||
| Methodology and policy – internal 2 | 1,225 | (1,093) | 0 | 0 | 132 | ||||||
| Methodology and policy – external 3 | 5,555 | 0 | 0 | 0 | 5,555 | ||||||
| Balance at end of period | 192,858 | 31,464 | 58,413 | 5,779 | 288,514 | ||||||
|
1
Represents movements arising from updates to models and recalibrations of parameters.
|
|||||||||||
|
2
Represents internal changes impacting how exposures are treated.
|
|||||||||||
|
3
Represents externally prescribed regulatory changes impacting how exposures are treated.
|
|||||||||||
| BIS leverage ratios – Group | |||||||||||||
| Phase-in | Look-through | ||||||||||||
| % change | % change | ||||||||||||
| end of | 1Q15 | 4Q14 | QoQ | 1Q15 | 4Q14 | QoQ | |||||||
| Capital (CHF million) | |||||||||||||
| CET1 capital | 39,746 | 43,322 | (8) | 28,251 | 28,576 | (1) | |||||||
| Tier 1 capital | 47,610 | 49,804 | (4) | 39,564 | 39,892 | (1) | |||||||
| Leverage exposure (CHF million) | |||||||||||||
| Leverage exposure | 1,108,649 | 1,157,557 | (4) | 1,102,728 | 1,149,656 | (4) | |||||||
| Leverage ratios (%) | |||||||||||||
| CET1 leverage ratio | 3.6 | 3.7 | – | 2.6 | 2.5 | – | |||||||
| Tier 1 leverage ratio | 4.3 | 4.3 | – | 3.6 | 3.5 | – | |||||||
39
| Swiss statistics – Group | |||||||||||||
| Phase-in | Look-through | ||||||||||||
| % change | % change | ||||||||||||
| end of | 1Q15 | 4Q14 | QoQ | 1Q15 | 4Q14 | QoQ | |||||||
| Capital development (CHF million) | |||||||||||||
| CET1 capital | 39,746 | 43,322 | (8) | 28,251 | 28,576 | (1) | |||||||
| Swiss regulatory adjustments 1 | (142) | (133) | 7 | (151) | (143) | 6 | |||||||
| Swiss CET1 capital | 39,604 | 43,189 | (8) | 28,100 | 28,433 | (1) | |||||||
| High-trigger capital instruments | 8,875 | 2 | 8,893 | 0 | 8,875 | 8,893 | 0 | ||||||
| Low-trigger capital instruments | 9,177 | 3 | 9,406 | (2) | 9,177 | 9,406 | (2) | ||||||
| Additional tier 1 and tier 2 instruments subject to phase-out | 5,891 | 6,663 | (12) | – | – | – | |||||||
| Deductions from additional tier 1 and tier 2 capital | (6,087) | (7,533) | (19) | – | – | – | |||||||
| Swiss total eligible capital | 57,460 | 60,618 | (5) | 46,152 | 46,732 | (1) | |||||||
| Risk-weighted assets (CHF million) | |||||||||||||
| Risk-weighted assets – Basel III | 288,514 | 291,410 | (1) | 283,095 | 284,248 | 0 | |||||||
| Swiss regulatory adjustments 4 | 951 | 1,058 | (10) | 951 | 1,057 | (10) | |||||||
| Swiss risk-weighted assets | 289,465 | 292,468 | (1) | 284,046 | 285,305 | 0 | |||||||
| Swiss capital ratios (%) | |||||||||||||
| Swiss CET1 ratio | 13.7 | 14.8 | – | 9.9 | 10.0 | – | |||||||
| Swiss total capital ratio | 19.9 | 20.7 | – | 16.2 | 16.4 | – | |||||||
|
1
Includes adjustments for certain unrealized gains outside the trading book.
|
|||||||||||||
|
2
Consists of CHF 6.2 billion additional tier 1 instruments and CHF 2.7 billion tier 2 instruments.
|
|||||||||||||
|
3
Consists of CHF 5.1 billion additional tier 1 instruments and CHF 4.1 billion tier 2 instruments.
|
|||||||||||||
|
4
Primarily includes differences in the credit risk multiplier.
|
|||||||||||||
| Swiss leverage metrics – Group | |||||||||||||
| Phase-in | Look-through | ||||||||||||
| % change | % change | ||||||||||||
| end of | 1Q15 | 4Q14 | QoQ | 1Q15 | 4Q14 | QoQ | |||||||
| Swiss leverage ratio (CHF million, except where indicated) | |||||||||||||
| Swiss total eligible capital | 57,460 | 60,618 | (5) | 46,152 | 46,732 | (1) | |||||||
| Leverage exposure | 1,108,649 | 1,157,557 | (4) | 1,102,728 | 1,149,656 | (4) | |||||||
| Swiss leverage ratio (%) | 5.2 | 5.2 | – | 4.2 | 4.1 | – | |||||||
|
in / end of |
Interest rate |
Credit spread |
Foreign exchange |
Commodity |
Equity |
Diversi- fication benefit |
Total |
||||||||
| 1Q15 (CHF million) | |||||||||||||||
| Average | 15 | 36 | 9 | 2 | 20 | (36) | 46 | ||||||||
| Minimum | 6 | 32 | 6 | 1 | 16 | – | 1 | 34 | |||||||
| Maximum | 22 | 40 | 15 | 3 | 24 | – | 1 | 56 | |||||||
| End of period | 17 | 37 | 13 | 1 | 24 | (38) | 54 | ||||||||
| 4Q14 (CHF million) | |||||||||||||||
| Average | 10 | 36 | 8 | 1 | 19 | (29) | 45 | ||||||||
| Minimum | 7 | 33 | 6 | 0 | 16 | – | 1 | 36 | |||||||
| Maximum | 16 | 39 | 13 | 2 | 25 | – | 1 | 53 | |||||||
| End of period | 9 | 39 | 7 | 1 | 20 | (29) | 47 | ||||||||
| 1Q14 (CHF million) | |||||||||||||||
| Average | 13 | 31 | 10 | 3 | 19 | (35) | 41 | ||||||||
| Minimum | 9 | 29 | 5 | 1 | 14 | – | 1 | 36 | |||||||
| Maximum | 17 | 33 | 17 | 4 | 24 | – | 1 | 46 | |||||||
| End of period | 14 | 31 | 9 | 2 | 15 | (29) | 42 | ||||||||
|
Excludes risks associated with counterparty and own credit exposures.
|
|||||||||||||||
|
1
As the maximum and minimum occur on different days for different risk types, it is not meaningful to calculate a portfolio diversification benefit.
|
|||||||||||||||
40
| in | 1Q15 | 4Q14 | 1Q14 | ||||
| Consolidated statements of operations (CHF million) | |||||||
| Interest and dividend income | 4,490 | 4,406 | 4,445 | ||||
| Interest expense | (2,338) | (2,280) | (2,267) | ||||
| Net interest income | 2,152 | 2,126 | 2,178 | ||||
| Commissions and fees | 2,979 | 3,213 | 3,275 | ||||
| Trading revenues | 1,390 | 287 | 638 | ||||
| Other revenues | 126 | 746 | 738 | ||||
| Net revenues | 6,647 | 6,372 | 6,829 | ||||
| Provision for credit losses | 30 | 75 | 34 | ||||
| Compensation and benefits | 2,976 | 2,621 | 2,993 | ||||
| General and administrative expenses | 1,738 | 2,362 | 1,690 | ||||
| Commission expenses | 392 | 422 | 369 | ||||
| Total other operating expenses | 2,130 | 2,784 | 2,059 | ||||
| Total operating expenses | 5,106 | 5,405 | 5,052 | ||||
| Income from continuing operations before taxes | 1,511 | 892 | 1,743 | ||||
| Income tax expense | 477 | 189 | 543 | ||||
| Income from continuing operations | 1,034 | 703 | 1,200 | ||||
| Income/(loss) from discontinued operations, net of tax | 0 | (10) | 15 | ||||
| Net income | 1,034 | 693 | 1,215 | ||||
| Net income/(loss) attributable to noncontrolling interests | (20) | 2 | 356 | ||||
| Net income/(loss) attributable to shareholders | 1,054 | 691 | 859 | ||||
| of which from continuing operations | 1,054 | 701 | 844 | ||||
| of which from discontinued operations | 0 | (10) | 15 | ||||
| Basic earnings per share (CHF) | |||||||
| Basic earnings per share from continuing operations | 0.63 | 0.41 | 0.47 | ||||
| Basic earnings/(loss) per share from discontinued operations | 0.00 | (0.01) | 0.01 | ||||
| Basic earnings per share | 0.63 | 0.40 | 0.48 | ||||
| Diluted earnings per share (CHF) | |||||||
| Diluted earnings per share from continuing operations | 0.62 | 0.40 | 0.47 | ||||
| Diluted earnings/(loss) per share from discontinued operations | 0.00 | (0.01) | 0.01 | ||||
| Diluted earnings per share | 0.62 | 0.39 | 0.48 | ||||
41
| end of | 1Q15 | 4Q14 | 1Q14 | ||||
| Assets (CHF million) | |||||||
| Cash and due from banks | 87,913 | 79,349 | 65,972 | ||||
| Interest-bearing deposits with banks | 1,117 | 1,244 | 1,728 | ||||
| Central bank funds sold, securities purchased under resale agreements and securities borrowing transactions | 144,859 | 163,208 | 162,890 | ||||
| Securities received as collateral, at fair value | 28,106 | 26,854 | 23,029 | ||||
| Trading assets, at fair value | 235,564 | 241,131 | 237,069 | ||||
| Investment securities | 3,052 | 2,791 | 3,320 | ||||
| Other investments | 7,881 | 8,613 | 7,806 | ||||
| Net loans | 270,774 | 272,551 | 250,659 | ||||
| Premises and equipment | 4,520 | 4,641 | 4,926 | ||||
| Goodwill | 8,504 | 8,644 | 7,956 | ||||
| Other intangible assets | 220 | 249 | 228 | ||||
| Brokerage receivables | 45,383 | 41,629 | 49,353 | ||||
| Other assets | 66,497 | 70,558 | 62,405 | ||||
| Assets of discontinued operations held-for-sale | 0 | 0 | 749 | ||||
| Total assets | 904,390 | 921,462 | 878,090 | ||||
| Liabilities and equity (CHF million) | |||||||
| Due to banks | 27,262 | 26,009 | 24,211 | ||||
| Customer deposits | 365,007 | 369,058 | 348,450 | ||||
| Central bank funds purchased, securities sold under repurchase agreements and securities lending transactions | 66,140 | 70,119 | 88,675 | ||||
| Obligation to return securities received as collateral, at fair value | 28,106 | 26,854 | 23,029 | ||||
| Trading liabilities, at fair value | 69,757 | 72,655 | 73,029 | ||||
| Short-term borrowings | 27,577 | 25,921 | 24,181 | ||||
| Long-term debt | 175,678 | 177,898 | 132,434 | ||||
| Brokerage payables | 55,229 | 56,977 | 70,250 | ||||
| Other liabilities | 45,349 | 50,970 | 48,768 | ||||
| Liabilities of discontinued operations held-for-sale | 0 | 0 | 781 | ||||
| Total liabilities | 860,105 | 876,461 | 833,808 | ||||
| Common shares | 64 | 64 | 64 | ||||
| Additional paid-in capital | 27,589 | 27,007 | 28,406 | ||||
| Retained earnings | 33,137 | 32,083 | 31,092 | ||||
| Treasury shares, at cost | (1,008) | (192) | (249) | ||||
| Accumulated other comprehensive income/(loss) | (16,386) | (15,003) | (16,083) | ||||
| Total shareholders' equity | 43,396 | 43,959 | 43,230 | ||||
| Noncontrolling interests | 889 | 1,042 | 1,052 | ||||
| Total equity | 44,285 | 45,001 | 44,282 | ||||
| Total liabilities and equity | 904,390 | 921,462 | 878,090 | ||||
42
| Attributable to shareholders | |||||||||||||||||
|
Common shares |
Additional paid-in capital |
Retained earnings |
Treasury shares, at cost |
Accumu- lated other compre- hensive income |
Total share- holders' equity |
Non- controlling interests |
Total equity |
||||||||||
| 1Q15 (CHF million) | |||||||||||||||||
| Balance at beginning of period | 64 | 27,007 | 32,083 | (192) | (15,003) | 43,959 | 1,042 | 45,001 | |||||||||
| Purchase of subsidiary shares from non- controlling interests, not changing ownership 1, 2 | – | – | – | – | – | – | (122) | (122) | |||||||||
| Sale of subsidiary shares to noncontrolling interests, not changing ownership 2 | – | – | – | – | – | – | 15 | 15 | |||||||||
| Net income/(loss) | – | – | 1,054 | – | – | 1,054 | (20) | 1,034 | |||||||||
| Total other comprehensive income/(loss), net of tax | – | – | – | – | (1,383) | (1,383) | (24) | (1,407) | |||||||||
| Sale of treasury shares | – | (10) | – | 1,833 | – | 1,823 | – | 1,823 | |||||||||
| Repurchase of treasury shares | – | – | – | (2,666) | – | (2,666) | – | (2,666) | |||||||||
| Share-based compensation, net of tax | – | 376 | 3 | – | 17 | – | 393 | – | 393 | ||||||||
| Financial instruments indexed to own shares 4 | – | 216 | – | – | – | 216 | – | 216 | |||||||||
| Other | – | – | – | – | – | – | (2) | (2) | |||||||||
| Balance at end of period | 64 | 27,589 | 33,137 | (1,008) | (16,386) | 43,396 | 889 | 44,285 | |||||||||
|
1
Distributions to owners in funds include the return of original capital invested and any related dividends.
|
|||||||||||||||||
|
2
Transactions with and without ownership changes related to fund activity are all displayed under "not changing ownership".
|
|||||||||||||||||
|
3
Includes a net tax benefit of CHF 2 million from the excess fair value of shares delivered over recognized compensation expense.
|
|||||||||||||||||
|
4
The Group had purchased certain call options on its own shares to economically hedge share-based compensation awards. In accordance with US GAAP, these call options were designated as equity instruments and, as such, were initially recognized in shareholders' equity at their fair values and not subsequently remeasured.
|
|||||||||||||||||
43
| in | 1Q15 | 4Q14 | 1Q14 | ||||
| Basic net income attributable to shareholders (CHF million) | |||||||
| Income from continuing operations | 1,054 | 701 | 844 | ||||
| Income/(loss) from discontinued operations, net of tax | 0 | (10) | 15 | ||||
| Net income attributable to shareholders | 1,054 | 691 | 859 | ||||
| Preferred securities dividends | – | (25) | (28) | ||||
| Net income attributable to shareholders for basic earnings per share | 1,054 | 666 | 831 | ||||
| Available for common shares | 1,028 | 641 | 785 | ||||
| Available for unvested share-based payment awards | 26 | 25 | 46 | ||||
| Diluted net income attributable to shareholders (CHF million) | |||||||
| Net income attributable to shareholders for diluted earnings per share | 1,054 | 666 | 831 | ||||
| Available for common shares | 1,028 | 642 | 785 | ||||
| Available for unvested share-based payment awards | 26 | 24 | 46 | ||||
| Weighted-average shares outstanding (million) | |||||||
| Weighted-average shares outstanding for basic earnings per share available for common shares | 1,621.5 | 1,610.6 | 1,621.2 | ||||
| Dilutive share options and warrants | 1.0 | 0.8 | 1.4 | ||||
| Dilutive share awards | 30.8 | 25.5 | 5.2 | ||||
| Weighted-average shares outstanding for diluted earnings per share available for common shares 1 | 1,653.3 | 1,636.9 | 1,627.8 | ||||
| Weighted-average shares outstanding for basic/diluted earnings per share available for unvested share-based payment awards | 41.3 | 62.2 | 95.5 | ||||
| Basic earnings/(loss) per share available for common shares (CHF) | |||||||
| Basic earnings per share from continuing operations | 0.63 | 0.41 | 0.47 | ||||
| Basic earnings/(loss) per share from discontinued operations | 0.00 | (0.01) | 0.01 | ||||
| Basic earnings per share available for common shares | 0.63 | 0.40 | 0.48 | ||||
| Diluted earnings/(loss) per share available for common shares (CHF) | |||||||
| Diluted earnings per share from continuing operations | 0.62 | 0.40 | 0.47 | ||||
| Diluted earnings/(loss) per share from discontinued operations | 0.00 | (0.01) | 0.01 | ||||
| Diluted earnings per share available for common shares | 0.62 | 0.39 | 0.48 | ||||
|
1
Weighted-average potential common shares relating to instruments that were not dilutive for the respective periods (and therefore not included in the diluted earnings per share calculation above) but could potentially dilute earnings per share in the future were 9.2 million, 9.1 million and 9.1 million for 1Q15, 4Q14 and 1Q14, respectively.
|
|||||||
44
Relationship between total shareholders’ equity, tangible shareholders’ equity and regulatory capital
Credit Suisse measures firm-wide returns against total shareholders’ equity and tangible shareholders’ equity. In addition, it also measures the efficiency of the firm and its divisions with regards to the usage of capital as determined by the minimum requirements set by regulators. This regulatory capital is calculated as the average of 10% of risk-weighted assets and 3% of the leverage exposure utilized by each division and the firm as a whole. These percentages are used in the calculation in order to reflect the 2019 fully phased in Swiss regulatory minimum requirements for Basel III CET1 capital and leverage ratio.

45
Cautionary statement regarding forward-looking information
This earnings release contains statements that constitute forward-looking statements. In addition, in the future we, and others on our behalf, may make statements that constitute forward-looking statements. Such forward-looking statements may include, without limitation, statements relating to the following:
– our plans, objectives or goals;
– our future economic performance or prospects;
– the potential effect on our future performance of certain contingencies; and
– assumptions underlying any such statements.
Words such as “believes,” “anticipates,” “expects,” “intends” and “plans” and similar expressions are intended to identify forward-looking statements but are not the exclusive means of identifying such statements. We do not intend to update these forward-looking statements except as may be required by applicable securities laws.
By their very nature, forward-looking statements involve inherent risks and uncertainties, both general and specific, and risks exist that predictions, forecasts, projections and other outcomes described or implied in forward-looking statements will not be achieved. We caution you that a number of important factors could cause results to differ materially from the plans, objectives, expectations, estimates and intentions expressed in such forward-looking statements. These factors include:
– the ability to maintain sufficient liquidity and access capital markets;
– market volatility and interest rate fluctuations and developments affecting interest rate levels;
– the strength of the global economy in general and the strength of the economies of the countries in which we conduct our operations, in particular the risk of continued slow economic recovery or downturn in the US or other developed countries in 2015 and beyond;
– the direct and indirect impacts of deterioration or slow recovery in residential and commercial real estate markets;
– adverse rating actions by credit rating agencies in respect of us, sovereign issuers, structured credit products or other credit-related exposures;
– the ability to achieve our strategic objectives, including improved performance, reduced risks, lower costs and more efficient use of capital;
– the ability of counterparties to meet their obligations to us;
– the effects of, and changes in, fiscal, monetary, exchange rate, trade and tax policies, as well as currency fluctuations;
– political and social developments, including war, civil unrest or terrorist activity;
– the possibility of foreign exchange controls, expropriation, nationalization or confiscation of assets in countries in which we conduct our operations;
– operational factors such as systems failure, human error, or the failure to implement procedures properly;
– actions taken by regulators with respect to our business and practices and possible resulting changes to our business organization, practices and policies in countries in which we conduct our operations;
– the effects of changes in laws, regulations or accounting policies or practices in countries in which we conduct our operations;
– competition or changes in our competitive position in geographic and business areas in which we conduct our operations;
– the ability to retain and recruit qualified personnel;
– the ability to maintain our reputation and promote our brand;
– the ability to increase market share and control expenses;
– technological changes;
– the timely development and acceptance of our new products and services and the perceived overall value of these products and services by users;
– acquisitions, including the ability to integrate acquired businesses successfully, and divestitures, including the ability to sell non-core assets;
– the adverse resolution of litigation, regulatory proceedings and other contingencies;
– the ability to achieve our cost efficiency goals and cost targets; and
– our success at managing the risks involved in the foregoing.
We caution you that the foregoing list of important factors is not exclusive. When evaluating forward-looking statements, you should carefully consider the foregoing factors and other uncertainties and events, including the information set forth in “Risk factors” in I – Information on the company in our Annual Report 2014.
46
Serious News for Serious Traders! Try StreetInsider.com Premium Free!
You May Also Be Interested In
- UBS (UBS) Said To Plan More Than 100 Job Cuts In Investment Bank - Bloomberg
- Vistra (VST) Prices Private Offerings of $500 Mln of Senior Secured Notes and $1 Bln Senior Unsecured Notes
- Orion Resource Partners announces sale of minority stake in Capstone Copper
Create E-mail Alert Related Categories
SEC FilingsRelated Entities
Credit SuisseSign up for StreetInsider Free!
Receive full access to all new and archived articles, unlimited portfolio tracking, e-mail alerts, custom newswires and RSS feeds - and more!
