

Form 6-K ASML HOLDING NV For: Apr 15
 Tweet
Tweet Share
ShareSECURITIES AND EXCHANGE COMMISSION
Washington, D.C. 20549
FORM 6-K
REPORT OF A FOREIGN ISSUER
PURSUANT TO RULE 13A-16 OR 15D-16
OF THE SECURITIES EXCHANGE ACT OF 1934
For April 15, 2015
ASML Holding N.V.
De Run 6501
5504 DR Veldhoven
The Netherlands
(Address of principal executive offices)
Indicate by check mark whether the registrant files or will file annual reports under cover of Form 20-F or Form 40-F.
Form 20-F x Form 40-F ¨
Indicate by check mark whether the registrant by furnishing the information contained in this Form is also thereby furnishing the information to the Commission pursuant to Rule 12g3-2(b) under the Securities Exchange Act of 1934.
Yes ¨ No x
If ‘‘Yes’’ is marked, indicate below the file number assigned to the registrant in connection with Rule 12g3-2(b):
EXCEPT FOR REFERENCES TO “NET BOOKINGS, EXCLUDING EUV” AND “SYSTEM BACKLOG, EXCLUDING EUV,” EXHIBITS 99.1, 99.3, 99.4 AND 99.5 TO THIS REPORT ON FORM 6-K ARE INCORPORATED BY REFERENCE IN THE REGISTRATION STATEMENT ON FORM S-8 (FILE NO. 333-116337), THE REGISTRATION STATEMENT ON FORM S-8 (FILE NO. 333-126340), THE REGISTRATION STATEMENT ON FORM S-8 (FILE NO. 333-136362), THE REGISTRATION STATEMENT ON FORM S-8 (FILE NO. 333-141125), THE REGISTRATION STATEMENT ON FORM S-8 (FILE NO. 333-142254), THE REGISTRATION STATEMENT ON FORM S-8 (FILE NO. 333-144356), THE REGISTRATION STATEMENT ON FORM S-8 (FILE NO. 333-147128), THE REGISTRATION STATEMENT ON FORM S-8 (FILE NO. 333-153277), THE REGISTRATION STATEMENT ON FORM S-8 (FILE NO. 333-162439), THE REGISTRATION STATEMENT ON FORM S-8 (FILE NO. 333-170034), THE REGISTRATION STATEMENT ON FORM S-8 (FILE NO. 333-188938), THE REGISTRATION STATEMENT ON FORM S-8 (FILE NO. 333-192951) AND THE REGISTRATION STATEMENT ON FORM S-8 (FILE NO. 333-203390) OF ASML HOLDING N.V. AND IN THE OUTSTANDING PROSPECTUSES CONTAINED IN SUCH REGISTRATION STATEMENTS.

| Exhibits |
| 99.1 | “ASML Q1 net sales in line with guidance at EUR 1.65 billion, gross margin 47.2 pct”, press release dated April 15, 2015 | |
| 99.2 | “ASML Q1 net sales in line with guidance at €1.65 billion gross margin 47.2%”, presentation dated April 15, 2015 | |
| 99.3 | Summary U.S. GAAP Consolidated Financial Statements | |
| 99.4 | Summary IFRS Consolidated Financial Statements | |
SIGNATURES
Pursuant to the requirements of the Securities Exchange Act of 1934, the registrant has duly caused this report to be signed on its behalf by the undersigned, thereunto duly authorized.
| ASML HOLDING N.V. (Registrant) | ||||
| Date: April 15, 2015 | By: | /s/ Peter T.F.M. Wennink | ||
| Peter T.F.M. Wennink | ||||
| Chief Executive Officer | ||||
Exhibit 99.1
Media Relations Contacts
Lucas van Grinsven - Corporate Communications - +31 6 101 99 532 - Veldhoven, the Netherlands
Niclas Mika - Corporate Communications - +31 6 201 528 63 - Veldhoven, the Netherlands
Investor Relations Contacts
Craig DeYoung - Investor Relations - +1 480 696 2762 - Chandler, Arizona, USA
Marcel Kemp - Investor Relations - +31 40 268 6494 - Veldhoven, the Netherlands
ASML Q1 net sales in line with guidance at EUR 1.65 billion, gross margin 47.2 pct
VELDHOVEN, the Netherlands, 15 April 2015 - ASML Holding N.V. (ASML) today publishes its 2015 first-quarter results.
| • | Q1 net sales of EUR 1.65 billion, gross margin 47.2 percent |
| • | ASML guides Q2 2015 net sales at around EUR 1.6 billion and a gross margin of around 45 percent |
| (Figures in millions of euros unless otherwise indicated) | Q4 2014 | Q1 2015 | ||||||
| Net sales |
1,494 | 1,650 | ||||||
| of which service and field option sales |
409 | 403 | ||||||
| Other income (Co-Investment Program) |
20 | 21 | ||||||
| New systems sold (units) |
30 | 39 | ||||||
| Used systems sold (units) |
5 | 8 | ||||||
| Average Selling Price (ASP) of net system sales |
31.0 | 26.5 | ||||||
| Net bookings * |
1,387 | 1,028 | ||||||
| Systems backlog * |
2,772 | 2,602 | ||||||
| Gross profit |
657 | 779 | ||||||
| Gross margin (%) |
44.0 | 47.2 | ||||||
| Net income |
305 | 403 | ||||||
| EPS (basic; in euro) |
0.70 | 0.93 | ||||||
| End-quarter cash and cash equivalents and short-term investments |
2,754 | 2,839 | ||||||
| *) | As of Q4 2014 our net bookings and systems backlog include NXE:3350B orders. For the definition of our net bookings and systems backlog see footnote 4 of our US GAAP Consolidated Financial Statements. |
A complete summary of US GAAP Consolidated Statements of Operations is published on www.asml.com
1
CEO Statement
“Our first-quarter net sales came in as guided at 1.65 billion euros, driven by continued strong DRAM memory segment sales in combination with higher foundry segment sales. Our gross margin rose to 47.2 percent, a reflection of product mix as well as better utilization of our production facilities, which was partly offset by unfavorable foreign exchange effects. Our Q2 guidance of around 1.6 billion euros of net sales confirms our earlier expectation that the first half of 2015 will be stronger than the second half of 2014. In memory, our Q1 sales and order book suggest that sales to the DRAM segment will stay healthy in 2015, although more weighted to the first half of the year. In logic, we expect stable sales throughout 2015. Our service and field options sales will likely increase over coming quarters as we benefit from increased adoption of our Holistic Lithography products and the purchase of system node enhancement packages supporting customer node migrations,” ASML President and Chief Executive Officer Peter Wennink said.
“Regarding our EUV program, our focus for 2015 is to continue the recent encouraging progress on source power and productivity, to increase stability and availability of the systems as well as to ship our fourth-generation EUV system, the NXE:3350B.”
Q1 Product Highlights
| • | Exposed more than 1000 wafers in a 24-hour period on a NXE:3300B |
| • | EUV source power upgrade is being rolled out to multiple customer sites |
| • | Our Overlay and Focus Package for the TWINSCAN NXT:1970Ci, which improves focus uniformity by up to 30 percent and matched machine overlay by more than 30 percent, experienced good adoption by logic customers |
| • | First orders received for next-generation TWINSCAN NXT:1980Ci immersion tool, aimed at production of critical layers for the next advanced logic nodes. |
Outlook
For the second quarter of 2015, ASML expects net sales of around EUR 1.6 billion, a gross margin of around 45 percent, R&D costs of about EUR 265 million, other income of about EUR 21 million — which consists of contributions from participants of the Customer Co-Investment Program — , SG&A costs of about EUR 85 million and an effective tax rate of approximately 11 percent.
Update Share Buyback Program
As part of ASML’s policy to return excess cash to shareholders through dividend and regularly timed share buybacks, ASML has announced its intention to purchase up to EUR 750 million of shares, which it intends to cancel upon repurchase. In addition, ASML announced its intention to purchase up to 3.3 million shares to cover employee stock and stock option plans (ESOPs). Through 29 March 2015, ASML has acquired 1.4 million shares under this program for a total consideration of EUR 129 million. These shares have been purchased to cover ESOPs. The share buyback program will be executed within the limitations of the existing authority granted by the AGM on April 23, 2014 and of the authority granted at future AGMs. The share buyback program may be suspended, modified or discontinued at any time. All transactions under this program will be published on ASML’s website (www.asml.com/investors) on a weekly basis.
2
About ASML
ASML makes possible affordable microelectronics that improve the quality of life. ASML invents and develops complex technology for high-tech lithography machines for the semiconductor industry. ASML’s guiding principle is continuing Moore’s Law towards ever smaller, cheaper, more powerful and energy-efficient semiconductors. Our success is based on three pillars: technology leadership combined with customer and supplier intimacy, highly efficient processes and entrepreneurial people. We are a multinational company with over 70 locations in 16 countries, headquartered in Veldhoven, the Netherlands. We employ more than 14,000 people on payroll and flexible contracts (expressed in full time equivalents). Our company is an inspiring place where employees work, meet, learn and share. ASML is traded on Euronext Amsterdam and NASDAQ under the symbol ASML. More information about ASML, our products and technology, and career opportunities is available on: www.asml.com
Investor and Media Conference Call
A conference call for investors and media will be hosted by CEO Peter Wennink and CFO Wolfgang Nickl at 15:00 PM Central European Time / 09:00 AM U.S. Eastern time. To register for the call and receive dial-in information, go to www.asml.com/resultscall. Listen-only access is also available via www.asml.com.
US GAAP and IFRS Financial Reporting
ASML’s primary accounting standard for quarterly earnings releases and annual reports is US GAAP, the accounting principles generally accepted in the United States of America. Quarterly US GAAP consolidated statements of operations, consolidated statements of cash flows and consolidated balance sheets, and a reconciliation of net income and equity from US GAAP to IFRS as adopted by the EU (‘IFRS’) are available on www.asml.com
In addition to reporting financial figures in accordance with US GAAP, ASML also reports financial figures in accordance with IFRS for statutory purposes. The most significant differences between US GAAP and IFRS that affect ASML concern the capitalization of certain product development costs, the accounting of share-based payment plans and the accounting of income taxes. ASML’s quarterly IFRS consolidated statement of profit or loss, consolidated statement of cash flows, consolidated statement of financial position and a reconciliation of net income and equity from US GAAP to IFRS are available on www.asml.com
The consolidated balance sheets of ASML Holding N.V. as of 29 March 2015, the related consolidated statements of operations and consolidated statements of cash flows for the quarter ended 29 March 2015 as presented in this press release are unaudited.
3
Regulated Information
This press release constitutes regulated information within the meaning of the Dutch Financial Markets Supervision Act (Wet op het financieel toezicht).
Forward Looking Statements
This document contains statements relating to certain projections and business trends that are forward-looking, including statements with respect to our outlook, expected customer demand in specified market segments including DRAM and logic, expected trends, systems backlog, IC unit demand, expected financial results, including expected or potential sales, other income, gross margin, earnings per share and expenses, tool orders and expected shipment of tools, productivity of our tools and systems performance, including the continuation of Moore’s law, industry acceptance of EUV, annual revenue opportunity by 2020, expected tax rate, TWINSCAN and EUV system performance (such as endurance tests), expected industry trends, the development of EUV technology and the number of EUV systems expected to be shipped and timing of shipments, intention to return excess cash to shareholders, our proposed dividend for 2014 and our intention to repurchase shares. You can generally identify these statements by the use of words like “may”, “will”, “could”, “should”, “project”, “believe”, “anticipate”, “expect”, “plan”, “estimate”, “forecast”, “potential”, “intend”, “continue” and variations of these words or comparable words. These statements are not historical facts, but rather are based on current expectations, estimates, assumptions and projections about the business and our future financial results and readers should not place undue reliance on them. Forward-looking statements do not guarantee future performance and involve risks and uncertainties. These risks and uncertainties include, without limitation, economic conditions, product demand and semiconductor equipment industry capacity, worldwide demand and manufacturing capacity utilization for semiconductors (the principal product of our customer base), including the impact of general economic conditions on consumer confidence and demand for our customers’ products, competitive products and pricing, the impact of manufacturing efficiencies and capacity constraints, performance of our systems, the continuing success of technology advances and the related pace of new product development and customer acceptance of new products, the number and timing of EUV systems expected to be shipped and recognized in revenue, our ability to enforce patents and protect intellectual property rights, the risk of intellectual property litigation, availability of raw materials and critical manufacturing equipment, trade environment, changes in exchange rates, changes in tax rates, available cash, distributable reserves for dividend payments and share repurchases, risks associated with the Cymer acquisition and other risks indicated in the risk factors included in ASML’s Annual Report on Form 20-F and other filings with the US Securities and Exchange Commission. These forward-looking statements are made only as of the date of this document. We do not undertake to update or revise the forward-looking statements, whether as a result of new information, future events or otherwise.
4
| Exhibit 99.2
|
Public
ASML Q1 net sales in line with guidance at € 1.65 billion, gross margin 47.2%
ASML 2015 First Quarter Results
Veldhoven, the Netherlands
April 15, 2015
|
|
Forward looking statements
Public
Slide 2
15 April 2015
This document contains statements relating to certain projections and business trends that are forward-looking, including statements with respect to our outlook, expected customer demand in specified market segments including DRAM and logic, expected trends, systems backlog, IC unit demand, expected financial results, including expected or potential sales, other income, gross margin, earnings per share and expenses, tool orders and expected shipment of tools, productivity of our tools and systems performance, including the continuation of Moore’s law, industry acceptance of EUV, annual revenue opportunity by 2020, expected tax rate, TWINSCAN and EUV system performance (such as endurance tests), expected industry trends, the development of EUV technology and the number of EUV systems expected to be shipped and timing of shipments, intention to return excess cash to shareholders, our proposed dividend for 2014 and our intention to repurchase shares.
You can generally identify these statements by the use of words like “may”, “will”, “could”, “should”, “project”, “believe”, “anticipate”, “expect”, “plan”, “estimate”, “forecast”, “potential”, “intend”, “continue” and variations of these words or comparable words. These statements are not historical facts, but rather are based on current expectations, estimates, assumptions and projections about the business and our future financial results and readers should not place undue reliance on them. Forward-looking statements do not guarantee future performance and involve risks and uncertainties. These risks and uncertainties include, without limitation, economic conditions, product demand and semiconductor equipment industry capacity, worldwide demand and manufacturing capacity utilization for semiconductors (the principal product of our customer base), including the impact of general economic conditions on consumer confidence and demand for our customers’ products, competitive products and pricing, the impact of manufacturing efficiencies and capacity constraints, performance of our systems, the continuing success of technology advances and the related pace of new product development and customer acceptance of new products, the number and timing of EUV systems expected to be shipped and recognized in revenue, our ability to enforce patents and protect intellectual property rights, the risk of intellectual property litigation, availability of raw materials and critical manufacturing equipment, trade environment, changes in exchange rates, changes in tax rates, available cash, distributable reserves for dividend payments and share repurchases, risks associated with the Cymer acquisition and other risks indicated in the risk factors included in ASML’s Annual Report on Form 20-F and other filings with the US Securities and Exchange Commission. These forward-looking statements are made only as of the date of this document. We do not undertake to update or revise the forward-looking statements, whether as a result of new information, future events or otherwise.
|
|
Public
Slide 3
15 April 2015
Agenda
Investor key messages
Business highlights
Business environment
Outlook
Technology highlights
Financial statements
|
|

Public
Slide 4
15 April 2015
Investor key messages
|
|
Investor key messages
Public
Slide 5
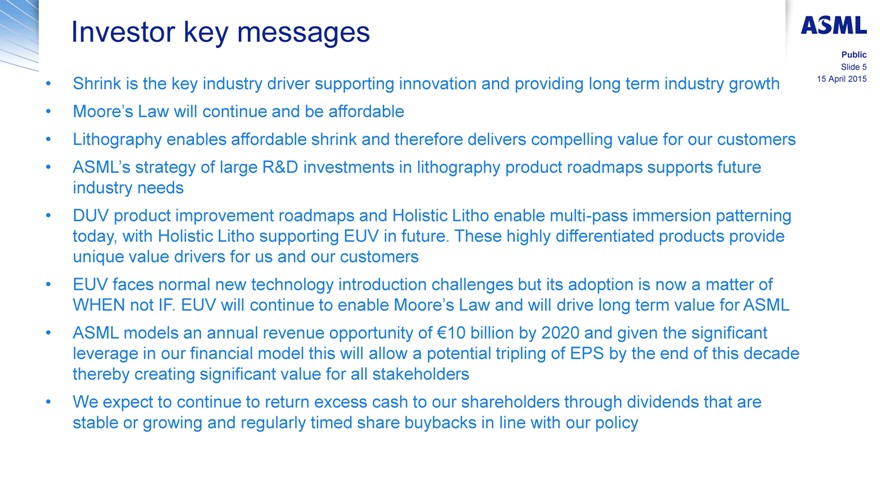
Shrink is the key industry driver supporting innovation and providing long term industry growth 15 April 2015
Moore’s Law will continue and be affordable
Lithography enables affordable shrink and therefore delivers compelling value for our customers
ASML’s strategy of large R&D investments in lithography product roadmaps supports future industry needs
DUV product improvement roadmaps and Holistic Litho enable multi-pass immersion patterning today, with Holistic Litho supporting EUV in future. These highly differentiated products provide unique value drivers for us and our customers
EUV faces normal new technology introduction challenges but its adoption is now a matter of WHEN not IF. EUV will continue to enable Moore’s Law and will drive long term value for ASML
ASML models an annual revenue opportunity of €10 billion by 2020 and given the significant leverage in our financial model this will allow a potential tripling of EPS by the end of this decade thereby creating significant value for all stakeholders
We expect to continue to return excess cash to our shareholders through dividends that are stable or growing and regularly timed share buybacks in line with our policy
|
|

Public
Slide 6
15 April 2015
Business highlights
|
|
Q1 results
Public
Slide 7
15 April 2015
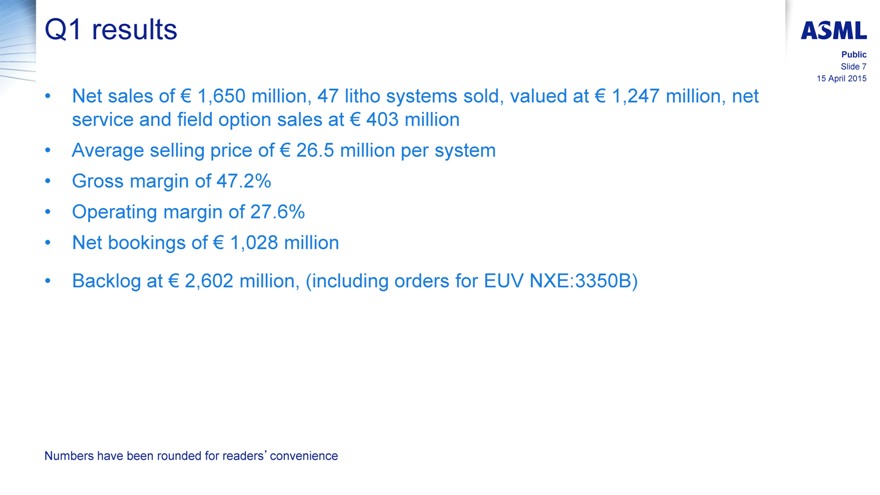
Net sales of € 1,650 million, 47 litho systems sold, valued at € 1,247 million, net service and field option sales at € 403 million
Average selling price of € 26.5 million per system
Gross margin of 47.2%
Operating margin of 27.6%
Net bookings of € 1,028 million
Backlog at € 2,602 million, (including orders for EUV NXE:3350B)
Numbers have been rounded for readers’convenience
|
|
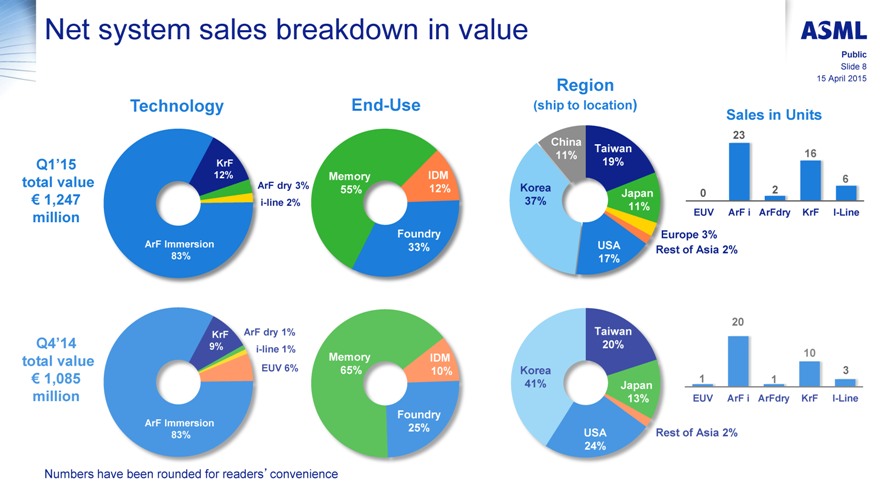
Net system sales breakdown in value
Public
Slide 8 Region 15 April 2015
Technology End-Use (ship to location)
Sales in Units
23 China Taiwan
11% 16
Q1’15 KrF 19%
12% Memory IDM 6
total value ArF dry 3% Korea
55% 12% Japan 0 2
€ 1,247 i-line 2% 37%
11% million EUV ArF i ArFdry KrF I-Line
Foundry Europe 3%
ArF Immersion 33% USA
Rest of Asia 2%
83% 17%
3
Numbers have been rounded for readers’convenience
|
|
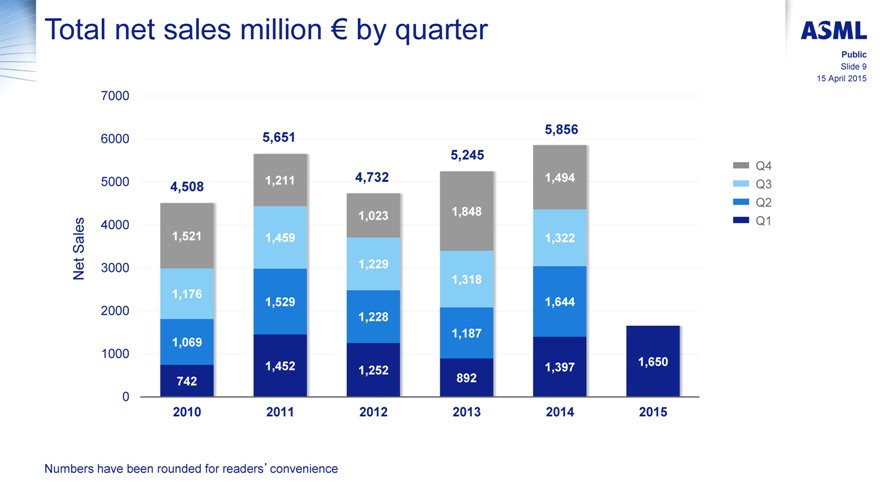
Total net sales million € by quarter
Public
Slide 9
15 April 2015
7000
5,856 6000 5,651
5,245 Q4
5000 1,211 4,732 1,494
4,508 Q3
Q2
1,023 1,848
4000 Q1
Sales 1,521 1,459 1,322 1,229
Net 3000
1,318 1,176
1,529 1,644
2000
1,228
1,187 1000 1,069
1,452 1,650 1,252 892 1,397 742
0
2010 2011 2012 2013 2014 2015
Numbers have been rounded for readers’convenience
|
|
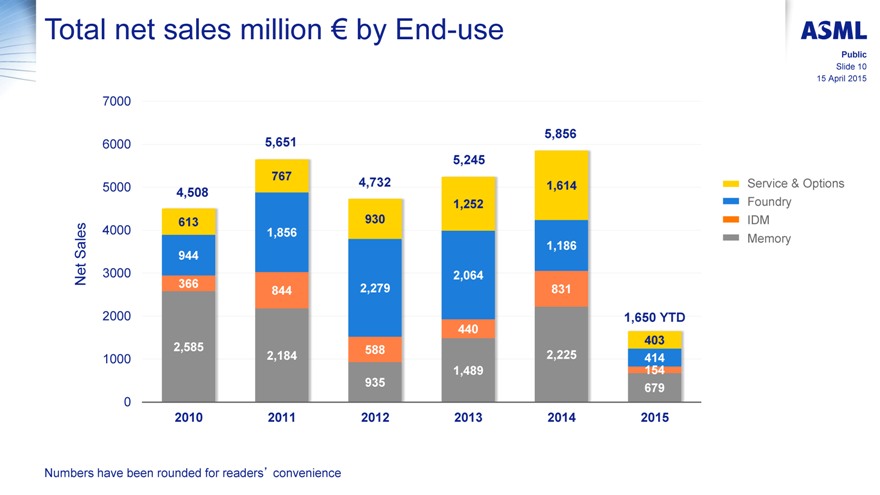
Total net sales million € by End-use
Public
Slide 10
15 April 2015
7000
5,856 6000 5,651 5,245
767
5000 4,732 1,614 Service & Options
4,508
1,252 Foundry
613 930 IDM
4000 1,856
Memory
Sales 1,186
944
Net 3000 366 2,064
844 2,279 831
2000 1,650 YTD
440 403 2,585 588 1000 2,184 2,225 414 1,489 154 935 679
0
2010 2011 2012 2013 2014 2015
Numbers have been rounded for readers’ convenience
|
|
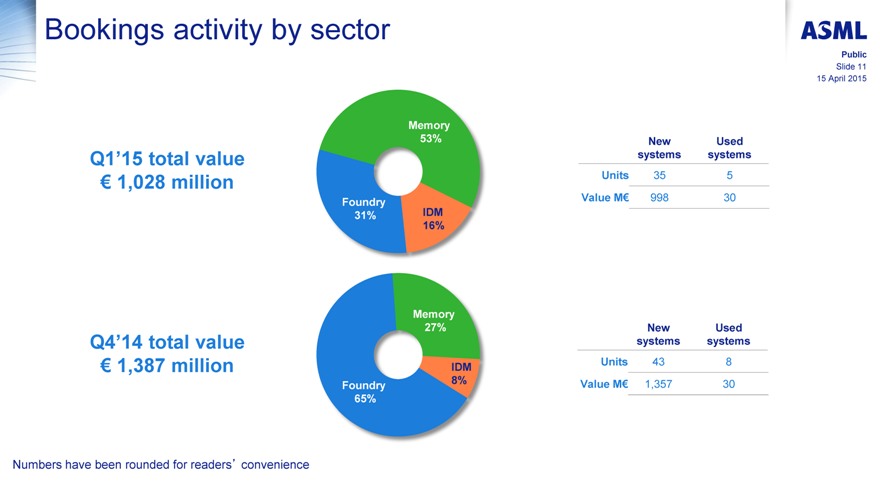
Bookings activity by sector
Memory
53% New Used
Q1’15 total value systems systems
€ 1,028 million Units 35 5
Foundry Value M€ 998 30 31% IDM
16%
Memory
27% New Used
Q4’14 total value systems systems
Units 43 8
€ 1,387 million IDM
8% Value M€ 1,357 30 Foundry 65%
Public
Slide 11
15 April 2015
Numbers have been rounded for readers’ convenience
|
|
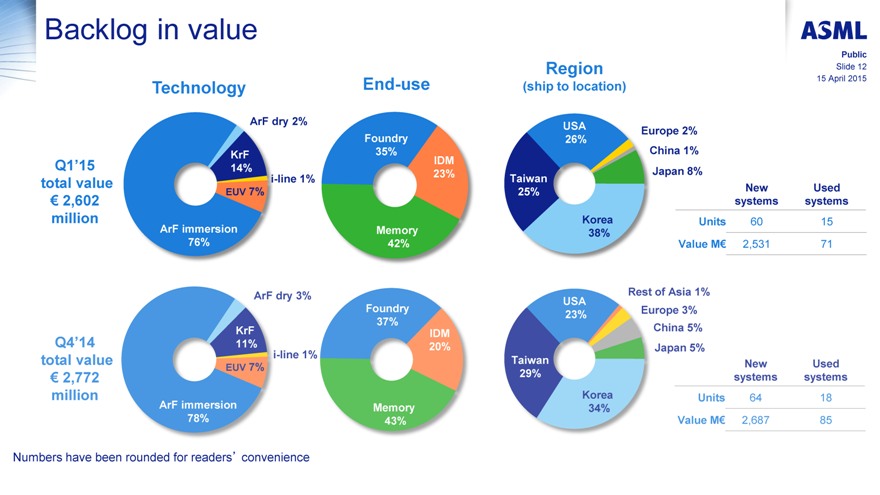
Backlog in value
Region
Technology End-use (ship to location)
ArF dry 2% USA Europe 2% Foundry 26% KrF 35% IDM China 1% Q1’15 14% Japan 8% 23% total value i-line 1% Taiwan New Used EUV 7% 25% systems systems
€ 2,602
million ArF immersion Korea Units 60 15 Memory 38% 76% 42% Value M€ 2,531 71
Numbers have been rounded for readers’ convenience
Public
Slide 12
15 April 2015
|
|
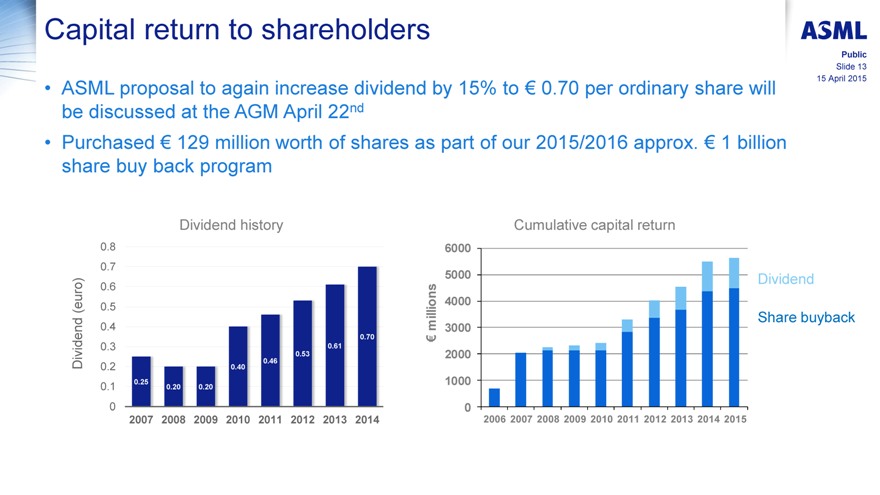
Capital return to shareholders
ASML proposal to again increase dividend by 15% to € 0.70 per ordinary share will be discussed at the AGM April 22nd
Purchased € 129 million worth of shares as part of our 2015/2016 approx. € 1 billion share buy back program
Dividend history Cumulative capital return
0.8 6000
0.7
5000 Dividend
0.6
4000
(euro) 0.5
Share buyback
0.4 millions 3000
0.70 €
0.3 0.61
0.46 0.53 2000
Dividend 0.2 0.40
0.25 1000
0.1 0.20 0.20
0 0
2007 2008 2009 2010 2011 2012 2013 2014 2006 2007 2008 2009 2010 2011 2012 2013 2014 2015
Public
Slide 13
15 April 2015
|
|

Public
Slide 14
15 April 2015
Business environment
|
|

Business environment
DRAM segment remains healthy in 2015 with litho sales weighted to the first half of 2015
Limited NAND litho tool shipments driven by planar NAND shrink and Memory 3D process development programs
Stable business throughout 2015
Modest tool shipments at 28nm node continue
20/16/14nm foundry nodes shipments ongoing
Next node process development accelerating
Logic
Growing demand for Holistic Litho products from all sectors
System node enhancement packages increasing in support of
customer capital efficiency
Service &
Service maintenance revenues growing with installed base
field options
Public
Slide 15
15 April 2015
|
|

Public
Slide 16
15 April 2015
Outlook
|
|
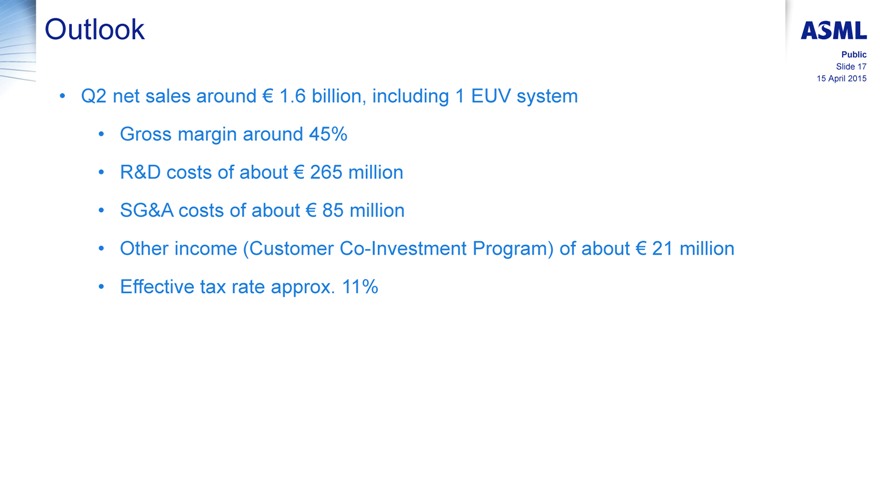
Outlook
Q2 net sales around € 1.6 billion, including 1 EUV system
Gross margin around 45%
R&D costs of about € 265 million
SG&A costs of about € 85 million
Other income (Customer Co-Investment Program) of about € 21 million
Effective tax rate approx. 11%
Public
Slide 17
15 April 2015
|
|

Public
Slide 18
15 April 2015
Technology highlights
|
|
EUV program: priorities for 2015
ASML
In 2015, we will focus on:
Improving stability and availability
Continuing progress on productivity
Shipping the NXE:3350B, our 4th generation EUV tool
Public
Slide 19
15 April 2015
|
|
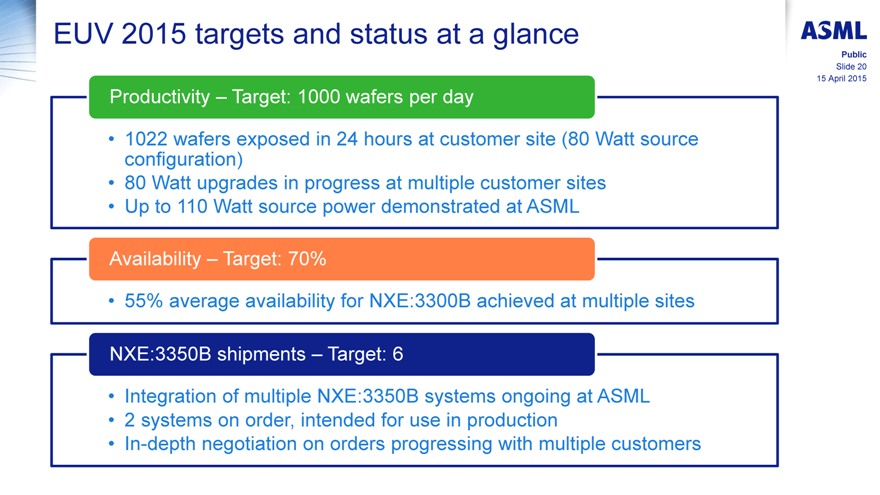
EUV 2015 targets and status at a glance
Productivity – Target: 1000 wafers per day
1022 wafers exposed in 24 hours at customer site (80 Watt source configuration)
80 Watt upgrades in progress at multiple customer sites
Up to 110 Watt source power demonstrated at ASML
Availability – Target: 70%
55% average availability for NXE:3300B achieved at multiple sites
NXE:3350B shipments – Target: 6
Integration of multiple NXE:3350B systems ongoing at ASML
2 systems on order, intended for use in production
In-depth negotiation on orders progressing with multiple customers
Public
Slide 20
15 April 2015
|
|
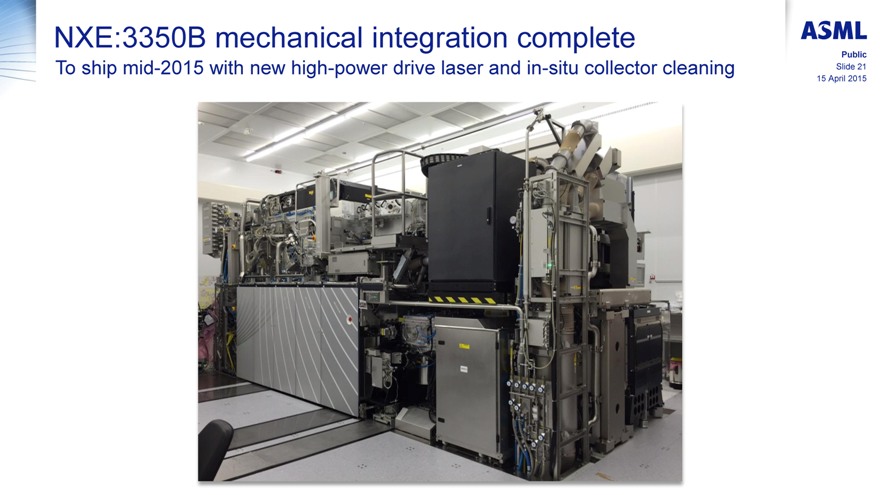
NXE:3350B mechanical integration complete
To ship mid-2015 with new high-power drive laser and in-situ collector cleaning
Public
Slide 21
15 April 2015
|
|
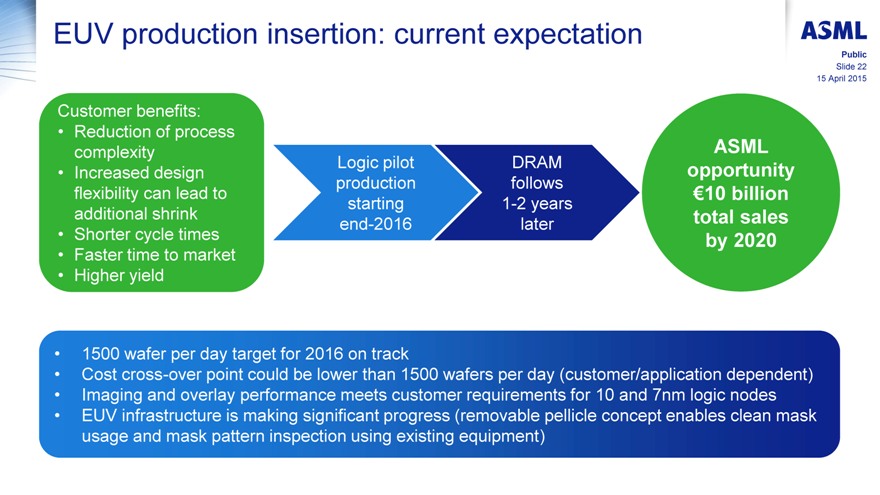
EUV production insertion: current expectation
Customer benefits:
Reduction of process complexity Logic pilot DRAM ASML
Increased design opportunity production follows flexibility can lead to €10 billion starting 1-2 years additional shrink total sales end-2016 later
Shorter cycle times by 2020
Faster time to market
Higher yield
1500 wafer per day target for 2016 on track
Cost cross-over point could be lower than 1500 wafers per day (customer/application dependent)
Imaging and overlay performance meets customer requirements for 10 and 7nm logic nodes
EUV infrastructure is making significant progress (removable pellicle concept enables clean mask usage and mask pattern inspection using existing equipment)
Public
Slide 22
15 April 2015
|
|
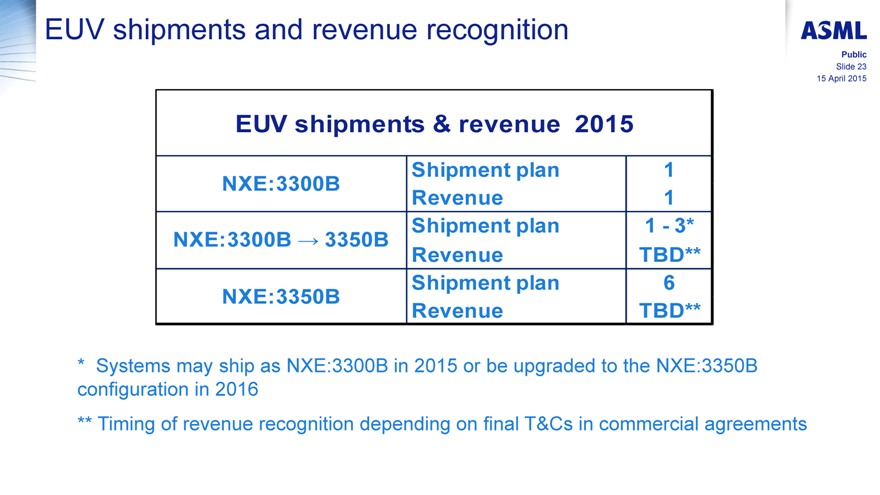
EUV shipments and revenue recognition
EUV shipments & revenue 2015
Shipment plan 1 NXE:3300B
Revenue 1 Shipment plan 1—3*
NXE:3300B 3350B
Revenue TBD** Shipment plan 6 NXE:3350B
Revenue TBD**
* Systems may ship as NXE:3300B in 2015 or be upgraded to the NXE:3350B configuration in 2016
** Timing of revenue recognition depending on final T&Cs in commercial agreements
Public
Slide 23
15 April 2015
|
|
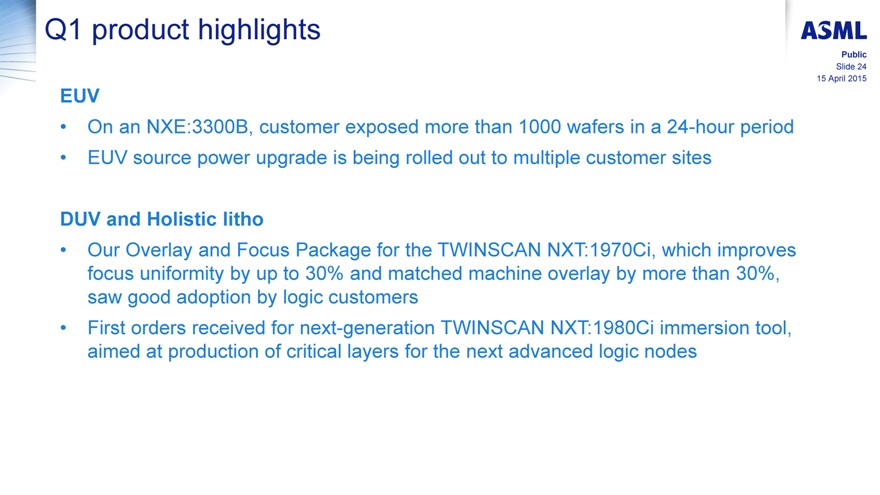
Q1 product highlights
EUV
On an NXE:3300B, customer exposed more than 1000 wafers in a 24-hour period
EUV source power upgrade is being rolled out to multiple customer sites
DUV and Holistic litho
Our Overlay and Focus Package for the TWINSCAN NXT:1970Ci, which improves focus uniformity by up to 30% and matched machine overlay by more than 30%, saw good adoption by logic customers
First orders received for next-generation TWINSCAN NXT:1980Ci immersion tool, aimed at production of critical layers for the next advanced logic nodes
Public
Slide 24
15 April 2015
|
|

Financial statements
Public
Slide 25
15 April 2015
|
|
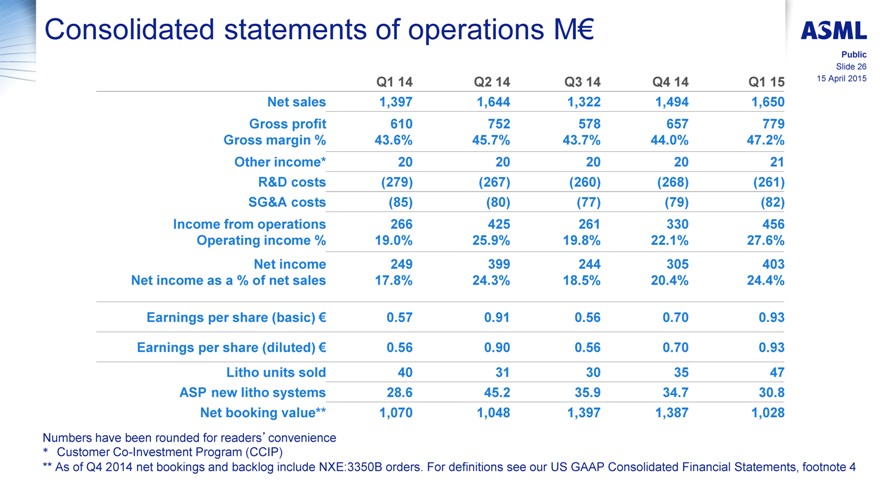
Consolidated statements of operations M€
Q1 14 Q2 14 Q3 14 Q4 14 Q1 15
Net sales 1,397 1,644 1,322 1,494 1,650
Gross profit 610 752 578 657 779
Gross margin % 43.6% 45.7% 43.7% 44.0% 47.2%
Other income* 20 20 20 20 21
R&D costs (279) (267) (260) (268) (261)
SG&A costs (85) (80) (77) (79) (82)
Income from operations 266 425 261 330 456
Operating income % 19.0% 25.9% 19.8% 22.1% 27.6%
Net income 249 399 244 305 403
Net income as a % of net sales 17.8% 24.3% 18.5% 20.4% 24.4%
Earnings per share (basic) € 0.57 0.91 0.56 0.70 0.93
Earnings per share (diluted) € 0.56 0.90 0.56 0.70 0.93
Litho units sold 40 31 30 35 47
ASP new litho systems 28.6 45.2 35.9 34.7 30.8
Net booking value** 1,070 1,048 1,397 1,387 1,028
Numbers have been rounded for readers’convenience
* Customer Co-Investment Program (CCIP)
** As of Q4 2014 net bookings and backlog include NXE:3350B orders. For definitions see our US GAAP Consolidated Financial Statements, footnote 4
Public
Slide 26
15 April 2015
|
|
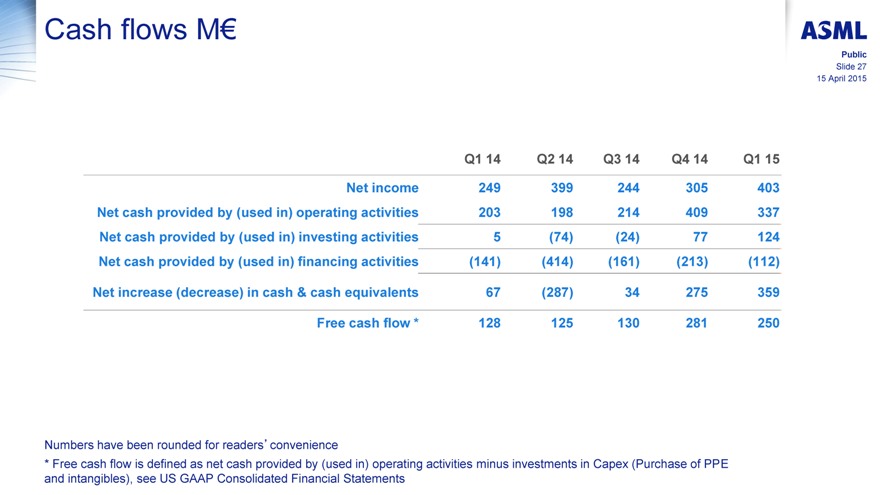
Cash flows M€
Q1 14 Q2 14 Q3 14 Q4 14 Q1 15
Net income 249 399 244 305 403 Net cash provided by (used in) operating activities 203 198 214 409 337 Net cash provided by (used in) investing activities 5 (74) (24) 77 124 Net cash provided by (used in) financing activities (141) (414) (161) (213) (112)
Net increase (decrease) in cash & cash equivalents 67 (287) 34 275 359
Free cash flow * 128 125 130 281 250
Public
Slide 27
15 April 2015
Numbers have been rounded for readers’convenience
* Free cash flow is defined as net cash provided by (used in) operating activities minus investments in Capex (Purchase of PPE and intangibles), see US GAAP Consolidated Financial Statements
|
|
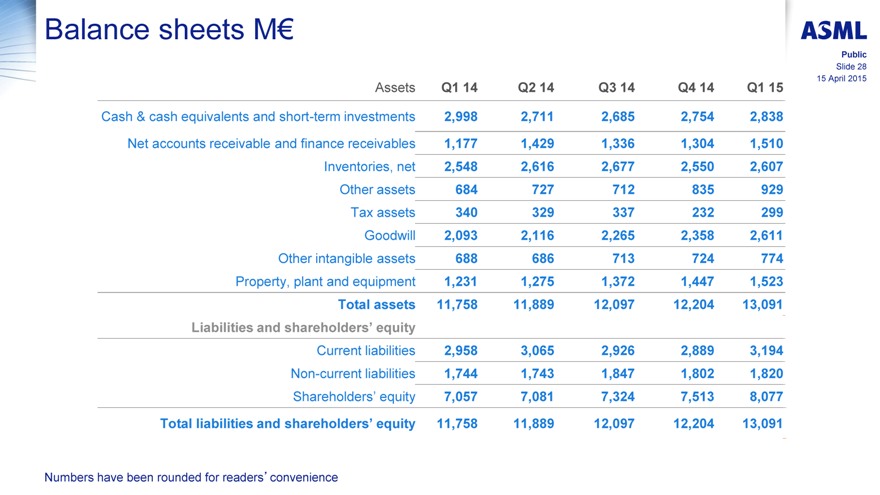
Balance sheets M€
Public
Slide 28
15 April 2015
Assets Q1 14 Q2 14 Q3 14 Q4 14 Q1 15
Cash & cash equivalents and short-term investments 2,998 2,711 2,685 2,754 2,838
Net accounts receivable and finance receivables 1,177 1,429 1,336 1,304 1,510
Inventories, net 2,548 2,616 2,677 2,550 2,607 Other assets 684 727 712 835 929 Tax assets 340 329 337 232 299 Goodwill 2,093 2,116 2,265 2,358 2,611
Other intangible assets 688 686 713 724 774 Property, plant and equipment 1,231 1,275 1,372 1,447 1,523 Total assets 11,758 11,889 12,097 12,204 13,091
Liabilities and shareholders’ equity
Current liabilities 2,958 3,065 2,926 2,889 3,194 Non-current liabilities 1,744 1,743 1,847 1,802 1,820 Shareholders’ equity 7,057 7,081 7,324 7,513 8,077
Total liabilities and shareholders’ equity 11,758 11,889 12,097 12,204 13,091
Numbers have been rounded for readers’convenience
|
|

ASML
Exhibit 99.3
ASML—Summary U.S. GAAP Consolidated Statements of Operations 1,2
| Three months ended, | ||||||||
| (in millions EUR, except per share data) | Mar 30, 2014 |
Mar 29, 2015 |
||||||
| Net system sales |
1,030.0 | 1,246.5 | ||||||
| Net service and field option sales |
366.5 | 403.4 | ||||||
| Total net sales |
1,396.5 | 1,649.9 | ||||||
| Total cost of sales |
(787.0 | ) | (871.3 | ) | ||||
| Gross profit |
609.5 | 778.6 | ||||||
| Other income |
20.2 | 20.8 | ||||||
| Research and development costs |
(279.1 | ) | (261.4 | ) | ||||
| Selling, general and administrative costs |
(84.9 | ) | (82.3 | ) | ||||
| Income from operations |
265.7 | 455.7 | ||||||
| Interest and other, net |
(2.6 | ) | (3.5 | ) | ||||
| Income before income taxes |
263.1 | 452.2 | ||||||
| Benefit from (provision for) income taxes |
(14.0 | ) | (49.5 | ) | ||||
| Net income |
249.1 | 402.7 | ||||||
| Basic net income per ordinary share |
0.57 | 0.93 | ||||||
| Diluted net income per ordinary share 3 |
0.56 | 0.93 | ||||||
| Weighted average number of ordinary shares used in computing per share amounts (in millions): |
| |||||||
| Basic |
440.0 | 432.6 | ||||||
| Diluted 3 |
443.5 | 435.3 | ||||||
ASML—Ratios and Other Data 1,2
| Three months ended, | ||||||||
| (in millions EUR, except otherwise indicated) | Mar 30, 2014 |
Mar 29, 2015 |
||||||
| Gross profit as a percentage of net sales |
43.6 | 47.2 | ||||||
| Income from operations as a percentage of net sales |
19.0 | 27.6 | ||||||
| Net income as a percentage of net sales |
17.8 | 24.4 | ||||||
| Income taxes as a percentage of income before income taxes |
5.3 | 11.0 | ||||||
| Shareholders’ equity as a percentage of total assets |
60.0 | 61.7 | ||||||
| Sales of systems (in units) |
40 | 47 | ||||||
| Average selling price of system sales (EUR millions) |
25.8 | 26.5 | ||||||
| Value of systems backlog (EUR millions) |
1,939 | 2,602 | 4 | |||||
| Systems backlog (in units) |
47 | 75 | 4 | |||||
| Average selling price of systems backlog (EUR millions) |
41.3 | 34.7 | 4 | |||||
| Value of booked systems (EUR millions) |
1,070 | 1,028 | 4 | |||||
| Net bookings (in units) |
30 | 40 | 4 | |||||
| Average selling price of booked systems (EUR millions) |
35.7 | 25.7 | 4 | |||||
| Number of payroll employees in FTEs |
10,582 | 11,533 | ||||||
| Number of temporary employees in FTEs |
2,867 | 2,644 | ||||||
ASML—Summary U.S. GAAP Consolidated Balance Sheets 1,2
| Dec 31, | Mar 29, | |||||||
| (in millions EUR) | 2014 | 2015 | ||||||
| ASSETS |
||||||||
| Cash and cash equivalents |
2,419.5 | 2,778.5 | ||||||
| Short-term investments |
334.9 | 60.0 | ||||||
| Accounts receivable, net |
1,052.5 | 1,270.6 | ||||||
| Finance receivables, net |
196.1 | 184.0 | ||||||
| Current tax assets |
43.9 | 94.3 | ||||||
| Inventories, net |
2,549.8 | 2,607.5 | ||||||
| Deferred tax assets |
159.5 | 173.8 | ||||||
| Other assets |
390.0 | 456.4 | ||||||
| Total current assets |
7,146.2 | 7,625.1 | ||||||
| Finance receivables, net |
55.3 | 55.3 | ||||||
| Deferred tax assets |
28.8 | 30.5 | ||||||
| Other assets |
444.8 | 472.2 | ||||||
| Goodwill |
2,357.5 | 2,610.8 | ||||||
| Other intangible assets, net |
723.8 | 773.8 | ||||||
| Property, plant and equipment, net |
1,447.5 | 1,523.4 | ||||||
| Total non-current assets |
5,057.7 | 5,466.0 | ||||||
| Total assets |
12,203.9 | 13,091.1 | ||||||
| LIABILITIES AND SHAREHOLDERS’ EQUITY |
||||||||
| Total current liabilities |
2,888.8 | 3,194.3 | ||||||
| Long-term debt |
1,149.9 | 1,155.5 | ||||||
| Deferred and other tax liabilities |
237.3 | 269.3 | ||||||
| Provisions |
3.6 | 3.7 | ||||||
| Accrued and other liabilities |
411.7 | 391.5 | ||||||
| Total non-current liabilities |
1,802.5 | 1,820.0 | ||||||
| Total liabilities |
4,691.3 | 5,014.3 | ||||||
| Total shareholders’ equity |
7,512.6 | 8,076.8 | ||||||
| Total liabilities and shareholders’ equity |
12,203.9 | 13,091.1 | ||||||
ASML—Summary U.S. GAAP Consolidated Statements of Cash Flows 1,2
| Three months ended, | ||||||||
| (in millions EUR) | Mar 30, 2014 |
Mar 29, 2015 |
||||||
| CASH FLOWS FROM OPERATING ACTIVITIES |
||||||||
| Net income |
249.1 | 402.7 | ||||||
| Adjustments to reconcile net income to net cash flows from operating activities: |
||||||||
| Depreciation and amortization |
64.7 | 66.1 | ||||||
| Impairment |
3.9 | — | ||||||
| Loss on disposal of property, plant and equipment |
0.7 | 0.9 | ||||||
| Share-based payments |
23.1 | 14.6 | ||||||
| Allowance for doubtful receivables |
0.1 | 0.4 | ||||||
| Allowance for obsolete inventory |
41.5 | 37.0 | ||||||
| Deferred income taxes |
(29.9 | ) | 16.5 | |||||
| Changes in assets and liabilities |
(149.8 | ) | (201.0 | ) | ||||
| Net cash provided by (used in) operating activities |
203.4 | 337.2 | ||||||
| CASH FLOWS FROM INVESTING ACTIVITIES |
||||||||
| Purchase of property, plant and equipment |
(75.5 | ) | (85.6 | ) | ||||
| Purchase of intangible assets |
— | (1.1 | ) | |||||
| Purchase of available for sale securities |
(194.8 | ) | — | |||||
| Maturity of available for sale securities |
275.0 | 274.9 | ||||||
| Cash from (used for) derivative financial instruments |
— | (64.0 | ) | |||||
| Net cash provided by (used in) investing activities |
4.7 | 124.2 | ||||||
| CASH FLOWS FROM FINANCING ACTIVITIES |
||||||||
| Dividend paid |
— | — | ||||||
| Purchase of shares |
(145.0 | ) | (117.1 | ) | ||||
| Net proceeds from issuance of shares |
5.5 | 4.4 | ||||||
| Repayment of debt |
(1.1 | ) | (0.8 | ) | ||||
| Tax benefit from share-based payments |
— | 1.8 | ||||||
| Net cash provided by (used in) financing activities |
(140.6 | ) | (111.7 | ) | ||||
| Net cash flows |
67.5 | 349.7 | ||||||
| Effect of changes in exchange rates on cash |
(0.1 | ) | 9.3 | |||||
| Net increase (decrease) in cash and cash equivalents |
67.4 | 359.0 | ||||||
ASML—Quarterly Summary U.S. GAAP Consolidated Statements of Operations 1,2
| Three months ended, | ||||||||||||||||||||
| (in millions EUR, except per share data) | Mar 30, 2014 |
Jun 29, 2014 |
Sep 28, 2014 |
Dec 31, 2014 |
Mar 29, 2015 |
|||||||||||||||
| Net system sales |
1,030.0 | 1,243.0 | 884.5 | 1,085.3 | 1,246.5 | |||||||||||||||
| Net service and field option sales |
366.5 | 400.6 | 437.7 | 408.7 | 403.4 | |||||||||||||||
| Total net sales |
1,396.5 | 1,643.6 | 1,322.2 | 1,494.0 | 1,649.9 | |||||||||||||||
| Total cost of sales |
(787.0 | ) | (891.7 | ) | (744.1 | ) | (837.1 | ) | (871.3 | ) | ||||||||||
| Gross profit |
609.5 | 751.9 | 578.1 | 656.9 | 778.6 | |||||||||||||||
| Other income |
20.2 | 20.3 | 20.3 | 20.2 | 20.8 | |||||||||||||||
| Research and development costs |
(279.1 | ) | (266.9 | ) | (260.1 | ) | (268.0 | ) | (261.4 | ) | ||||||||||
| Selling, general and administrative costs |
(84.9 | ) | (79.9 | ) | (76.9 | ) | (79.4 | ) | (82.3 | ) | ||||||||||
| Income from operations |
265.7 | 425.4 | 261.4 | 329.7 | 455.7 | |||||||||||||||
| Interest and other, net |
(2.6 | ) | (1.4 | ) | (2.0 | ) | (2.6 | ) | (3.5 | ) | ||||||||||
| Income before income taxes |
263.1 | 424.0 | 259.4 | 327.1 | 452.2 | |||||||||||||||
| Benefit from (provision for) income taxes |
(14.0 | ) | (25.3 | ) | (15.4 | ) | (22.3 | ) | (49.5 | ) | ||||||||||
| Net income |
249.1 | 398.7 | 244.0 | 304.8 | 402.7 | |||||||||||||||
| Basic net income per ordinary share |
0.57 | 0.91 | 0.56 | 0.70 | 0.93 | |||||||||||||||
| Diluted net income per ordinary share 3 |
0.56 | 0.90 | 0.56 | 0.70 | 0.93 | |||||||||||||||
| Weighted average number of ordinary shares used in computing per share amounts (in millions): |
|
|||||||||||||||||||
| Basic |
440.0 | 438.5 | 436.1 | 434.1 | 432.6 | |||||||||||||||
| Diluted 3 |
443.5 | 441.6 | 439.0 | 436.7 | 435.3 | |||||||||||||||
ASML—Quarterly Summary Ratios and other data 1,2
| Three months ended, | ||||||||||||||||||||
| (in millions EUR, except otherwise indicated) | Mar 30, 2014 |
Jun 29, 2014 |
Sep 28, 2014 |
Dec 31, 2014 |
Mar 29, 2015 |
|||||||||||||||
| Gross profit as a percentage of net sales |
43.6 | 45.7 | 43.7 | 44.0 | 47.2 | |||||||||||||||
| Income from operations as a percentage of net sales |
19.0 | 25.9 | 19.8 | 22.1 | 27.6 | |||||||||||||||
| Net income as a percentage of net sales |
17.8 | 24.3 | 18.5 | 20.4 | 24.4 | |||||||||||||||
| Income taxes as a percentage of income before income taxes |
5.3 | 6.0 | 5.9 | 6.8 | 11.0 | |||||||||||||||
| Shareholders’ equity as a percentage of total assets |
60.0 | 59.6 | 60.5 | 61.6 | 61.7 | |||||||||||||||
| Sales of systems (in units) |
40 | 31 | 30 | 35 | 47 | |||||||||||||||
| Average selling price of system sales (EUR millions) |
25.8 | 40.1 | 29.5 | 31.0 | 26.5 | |||||||||||||||
| Value of systems backlog (EUR millions) |
1,939 | 1,763 | 2,406 | 2,772 | 4 | 2,602 | 4 | |||||||||||||
| Systems backlog (in units) |
47 | 46 | 65 | 82 | 4 | 75 | 4 | |||||||||||||
| Average selling price of systems backlog (EUR millions) |
41.3 | 38.3 | 37.0 | 33.8 | 4 | 34.7 | 4 | |||||||||||||
| Value of booked systems (EUR millions) |
1,070 | 1,048 | 1,397 | 1,387 | 4 | 1,028 | 4 | |||||||||||||
| Net bookings (in units) |
30 | 29 | 47 | 51 | 4 | 40 | 4 | |||||||||||||
| Average selling price of booked systems (EUR millions) |
35.7 | 36.1 | 29.7 | 27.2 | 4 | 25.7 | 4 | |||||||||||||
| Number of payroll employees in FTEs |
10,582 | 10,786 | 11,076 | 11,318 | 11,533 | |||||||||||||||
| Number of temporary employees in FTEs |
2,867 | 2,820 | 2,771 | 2,754 | 2,644 | |||||||||||||||
ASML—Quarterly Summary U.S. GAAP Consolidated Balance Sheets 1,2
| (in millions EUR) | Mar 30, 2014 |
Jun 29, 2014 |
Sep 28, 2014 |
Dec 31, 2014 |
Mar 29, 2015 |
|||||||||||||||
| ASSETS |
||||||||||||||||||||
| Cash and cash equivalents |
2,398.1 | 2,111.0 | 2,144.8 | 2,419.5 | 2,778.5 | |||||||||||||||
| Short-term investments |
599.7 | 599.7 | 539.8 | 334.9 | 60.0 | |||||||||||||||
| Accounts receivable, net |
832.2 | 1,085.6 | 961.2 | 1,052.5 | 1,270.6 | |||||||||||||||
| Finance receivables, net |
298.6 | 297.3 | 255.9 | 196.1 | 184.0 | |||||||||||||||
| Current tax assets |
92.1 | 94.0 | 76.7 | 43.9 | 94.3 | |||||||||||||||
| Inventories, net |
2,547.7 | 2,615.5 | 2,676.8 | 2,549.8 | 2,607.5 | |||||||||||||||
| Deferred tax assets |
118.5 | 108.6 | 144.2 | 159.5 | 173.8 | |||||||||||||||
| Other assets |
353.9 | 378.6 | 362.2 | 390.0 | 456.4 | |||||||||||||||
| Total current assets |
7,240.8 | 7,290.3 | 7,161.6 | 7,146.2 | 7,625.1 | |||||||||||||||
| Finance receivables, net |
46.2 | 46.4 | 119.3 | 55.3 | 55.3 | |||||||||||||||
| Deferred tax assets |
129.1 | 126.2 | 115.8 | 28.8 | 30.5 | |||||||||||||||
| Other assets |
330.2 | 347.9 | 349.9 | 444.8 | 472.2 | |||||||||||||||
| Goodwill |
2,092.7 | 2,116.1 | 2,264.9 | 2,357.5 | 2,610.8 | |||||||||||||||
| Other intangible assets, net |
688.1 | 686.5 | 712.7 | 723.8 | 773.8 | |||||||||||||||
| Property, plant and equipment, net |
1,231.2 | 1,275.1 | 1,372.4 | 1,447.5 | 1,523.4 | |||||||||||||||
| Total non-current assets |
4,517.5 | 4,598.2 | 4,935.0 | 5,057.7 | 5,466.0 | |||||||||||||||
| Total assets |
11,758.3 | 11,888.5 | 12,096.6 | 12,203.9 | 13,091.1 | |||||||||||||||
| LIABILITIES AND SHAREHOLDERS’ EQUITY |
||||||||||||||||||||
| Total current liabilities |
2,957.5 | 3,065.2 | 2,926.0 | 2,888.8 | 3,194.3 | |||||||||||||||
| Long-term debt |
1,097.3 | 1,118.4 | 1,137.4 | 1,149.9 | 1,155.5 | |||||||||||||||
| Deferred and other tax liabilities |
318.8 | 318.0 | 304.7 | 237.3 | 269.3 | |||||||||||||||
| Provisions |
4.4 | 4.1 | 4.0 | 3.6 | 3.7 | |||||||||||||||
| Accrued and other liabilities |
323.4 | 302.4 | 400.4 | 411.7 | 391.5 | |||||||||||||||
| Total non-current liabilities |
1,743.9 | 1,742.9 | 1,846.5 | 1,802.5 | 1,820.0 | |||||||||||||||
| Total liabilities |
4,701.4 | 4,808.1 | 4,772.5 | 4,691.3 | 5,014.3 | |||||||||||||||
| Total shareholders’ equity |
7,056.9 | 7,080.4 | 7,324.1 | 7,512.6 | 8,076.8 | |||||||||||||||
| Total liabilities and shareholders’ equity |
11,758.3 | 11,888.5 | 12,096.6 | 12,203.9 | 13,091.1 | |||||||||||||||
ASML—Quarterly Summary U.S. GAAP Consolidated Statements of Cash Flows 1,2
| Three months ended, | ||||||||||||||||||||
| (in millions EUR) | Mar 30, 2014 |
Jun 29, 2014 |
Sep 28, 2014 |
Dec 31, 2014 |
Mar 29, 2015 |
|||||||||||||||
| CASH FLOWS FROM OPERATING ACTIVITIES |
||||||||||||||||||||
| Net income |
249.1 | 398.7 | 244.0 | 304.8 | 402.7 | |||||||||||||||
| Adjustments to reconcile net income to net cash flows from operating activities: |
||||||||||||||||||||
| Depreciation and amortization |
64.7 | 67.0 | 60.4 | 62.5 | 66.1 | |||||||||||||||
| Impairment |
3.9 | 2.5 | 3.6 | 0.5 | — | |||||||||||||||
| Loss on disposal of property, plant and equipment |
0.7 | 0.5 | 0.9 | 1.4 | 0.9 | |||||||||||||||
| Share-based payments |
23.1 | 13.5 | 13.7 | 13.1 | 14.6 | |||||||||||||||
| Allowance for doubtful receivables |
0.1 | 0.1 | 0.1 | (0.2 | ) | 0.4 | ||||||||||||||
| Allowance for obsolete inventory |
41.5 | 45.2 | 35.8 | 40.3 | 37.0 | |||||||||||||||
| Deferred income taxes |
(29.9 | ) | 11.0 | (39.0 | ) | (1.2 | ) | 16.5 | ||||||||||||
| Changes in assets and liabilities |
(149.8 | ) | (340.1 | ) | (105.3 | ) | (12.0 | ) | (201.0 | ) | ||||||||||
| Net cash provided by (used in) operating activities |
203.4 | 198.4 | 214.2 | 409.2 | 337.2 | |||||||||||||||
| CASH FLOWS FROM INVESTING ACTIVITIES |
||||||||||||||||||||
| Purchase of property, plant and equipment |
(75.5 | ) | (70.7 | ) | (84.2 | ) | (127.9 | ) | (85.6 | ) | ||||||||||
| Purchase of intangible assets |
— | (3.0 | ) | — | — | (1.1 | ) | |||||||||||||
| Purchase of available for sale securities |
(194.8 | ) | (174.9 | ) | (110.0 | ) | (25.0 | ) | — | |||||||||||
| Maturity of available for sale securities |
275.0 | 175.0 | 169.9 | 229.9 | 274.9 | |||||||||||||||
| Cash from (used for) derivative financial instruments |
— | — | — | — | (64.0 | ) | ||||||||||||||
| Net cash provided by (used in) investing activities |
4.7 | (73.6 | ) | (24.3 | ) | 77.0 | 124.2 | |||||||||||||
| CASH FLOWS FROM FINANCING ACTIVITIES |
||||||||||||||||||||
| Dividend paid |
— | (268.0 | ) | — | — | — | ||||||||||||||
| Purchase of shares |
(145.0 | ) | (154.9 | ) | (171.1 | ) | (229.0 | ) | (117.1 | ) | ||||||||||
| Net proceeds from issuance of shares |
5.5 | 8.1 | 10.6 | 15.5 | 4.4 | |||||||||||||||
| Repayment of debt |
(1.1 | ) | (1.0 | ) | (1.2 | ) | (0.8 | ) | (0.8 | ) | ||||||||||
| Tax benefit from share-based payments |
— | 1.9 | 0.9 | 1.2 | 1.8 | |||||||||||||||
| Net cash provided by (used in) financing activities |
(140.6 | ) | (413.9 | ) | (160.8 | ) | (213.1 | ) | (111.7 | ) | ||||||||||
| Net cash flows |
67.5 | (289.1 | ) | 29.1 | 273.1 | 349.7 | ||||||||||||||
| Effect of changes in exchange rates on cash |
(0.1 | ) | 2.0 | 4.7 | 1.6 | 9.3 | ||||||||||||||
| Net increase (decrease) in cash and cash equivalents |
67.4 | (287.1 | ) | 33.8 | 274.7 | 359.0 | ||||||||||||||
Notes to the Summary US GAAP Consolidated Financial Statements
Basis of Presentation
The accompanying summary consolidated financial statements are stated in millions of euros (“EUR”) unless otherwise indicated. ASML follows accounting principles generally accepted in the United States of America (“US GAAP”). Further disclosures, as required under US GAAP in annual reports, are not included in the summary consolidated financial statements.
Use of estimates
The preparation of our consolidated financial statements in conformity with US GAAP requires management to make estimates and assumptions that affect the reported amounts of assets and liabilities and the disclosure of contingent assets and liabilities on the balance sheet dates, and the reported amounts of net sales and costs during the reported periods. Actual results could differ from those estimates.
Principles of consolidation
The consolidated financial statements include the financial statements of ASML Holding N.V. and all of its subsidiaries and the variable interest entity of which ASML is the primary beneficiary (referred to as “ASML”). All intercompany profits, balances and transactions have been eliminated in the consolidation. Subsidiaries are all entities over which ASML has the power to govern the financial and operating policies generally accompanying a shareholding of more than 50 percent of the voting rights.
Revenue recognition
In general, ASML recognizes revenue when all four revenue recognition criteria are met: persuasive evidence of an arrangement exists; delivery has occurred or services have been rendered; seller’s price to buyer is fixed or determinable; and collectability is reasonably assured. At ASML this policy generally results in revenue recognition from the sale of a system upon shipment. The revenue from the installation of a system is generally recognized upon completion of that installation at the customer site. Each system undergoes, prior to shipment, a “Factory Acceptance Test” in ASML’s cleanroom facilities, effectively replicating the operating conditions that will be present on the customer’s site, in order to verify whether the system will meet its standard specifications and any additional technical and performance criteria agreed with the customer, if any. A system is shipped, and revenue is recognized, only after all specifications are met and customer sign-off is received or waived. In case not all specifications are met and the remaining performance obligation is not essential to the functionality of the system but is substantive rather than inconsequential or perfunctory, a portion of the sales price is deferred. Although each system’s performance is re-tested upon installation at the customer’s site, we have never failed to successfully complete installation of a system at a customer’s premises.
In connection with the introduction of new technology, such as NXE:3300B, we initially defer revenue recognition until acceptance of the new technology based system and completion of installation at the customer’s premises. As our systems are based largely on two product platforms that permit incremental, modular upgrades, the introduction of genuinely “new” technology occurs infrequently, and in the past 15 years, has occurred on only two occasions: 2000 (TWINSCAN) and 2010 (EUV).
The main portion of our revenue is derived from contractual arrangements with our customers that have multiple deliverables, which mainly include the sale of our systems, installation and training services and prepaid extended and enhanced (optic) warranty contracts. For each of the specified deliverables ASML determines the selling price by using either vendor specific objective evidence (‘VSOE’), third party evidence (‘TPE’) or by best estimate of the selling price (‘BESP’). When we are unable to establish relative selling price using VSOE or TPE, ASML uses BESP in its allocation of arrangement consideration. The total arrangement consideration is allocated at inception of the arrangement to all deliverables on the basis of their relative selling price. The revenue relating to the undelivered elements of the arrangements is deferred at their relative selling prices until delivery of these elements. Revenue from installation and training services is recognized when the services are completed. Revenue from prepaid extended and enhanced (optic) warranty contracts is recognized over the term of the contract.
For our NXE:3300B systems, we are unable to determine VSOE for prepaid extended, enhanced (optic) warranty contracts and installation. We determined for NXE:3300B systems that BESP is the appropriate reference in the fair value hierarchy for prepaid extended and enhanced (optic) warranty contracts. We review selling prices periodically and maintain internal controls over the establishment and updates of these elements.
Foreign currency risk management
Our sales are predominately denominated in euros. Exceptions may occur on a customer by customer basis. Our cost of sales and other expenses are mainly denominated in euros, to a certain extent in US dollars, Taiwanese dollars and Japanese yen and to a limited extent in other currencies. Therefore, we are exposed to foreign currency exchange risk.
It is our policy to hedge material transaction exposures, such as forecasted sales and purchase transactions, and material net remeasurement exposures, such as accounts receivable and payable. We hedge these exposures through the use of foreign exchange contracts.
ASML—Reconciliation US GAAP—IFRS 1,2
| Net income | Three months ended, | |||||||
| (in millions EUR) | Mar 30, 2014 |
Mar 29, 2015 |
||||||
| Net income based on U.S. GAAP |
249.1 | 402.7 | ||||||
| Development expenditures (see Note 1) |
27.5 | 69.5 | ||||||
| Share-based payments (see Note 2) |
0.7 | 1.2 | ||||||
| Income taxes (see Note 3) |
6.0 | (3.4 | ) | |||||
| Net income based on IFRS |
283.3 | 470.0 | ||||||
| Shareholders’ equity (in millions EUR) |
Mar 30, 2014 |
Jun 29, 2014 |
Sep 28, 2014 |
Dec 31, 2014 |
Mar 29, 2015 |
|||||||||||||||
| Shareholders’ equity based on U.S. GAAP |
7,056.9 | 7,080.4 | 7,324.1 | 7,512.6 | 8,076.8 | |||||||||||||||
| Development expenditures (see Note 1) |
610.2 | 646.9 | 702.3 | 792.1 | 878.1 | |||||||||||||||
| Share-based payments (see Note 2) |
26.0 | 20.1 | 20.7 | 21.0 | 22.4 | |||||||||||||||
| Income taxes (see Note 3) |
18.7 | 33.7 | 43.8 | 40.2 | 42.1 | |||||||||||||||
| Equity based on IFRS |
7,711.8 | 7,781.1 | 8,090.9 | 8,365.9 | 9,019.4 | |||||||||||||||
Notes to the reconciliation from US GAAP to IFRS
Note 1 Development expenditures
Under US GAAP, ASML applies ASC 730, “Research and Development”. In accordance with ASC 730, ASML charges costs relating to research and development to operating expense as incurred.
Under IFRS, ASML applies IAS 38, “Intangible Assets”. In accordance with IAS 38, ASML capitalizes certain development expenditures that are amortized over the expected useful life of the related product generally ranging between one and five years. Amortization starts when the developed product is ready for volume production.
Note 2 Share-based Payments
Under US GAAP, ASML applies ASC 718 “Compensation-Stock Compensation” which requires companies to recognize the cost of employee services received in exchange for awards of equity instruments based upon the grant-date fair value of those instruments. ASC 718’s general principle is that a deferred tax asset is established as we recognize compensation costs for commercial purposes for awards that are expected to result in a tax deduction under existing tax law. Under US GAAP, the deferred tax recorded on share-based compensation is computed on the basis of the expense recognized in the financial statements. Therefore, changes in ASML’s share price do not affect the deferred tax asset recorded in our financial statements.
Under IFRS, ASML applies IFRS 2, “Share-based Payments”. In accordance with IFRS 2, ASML records as an expense the fair value of its share-based payments with respect to stock options and shares granted to its employees. Under IFRS, at period end a deferred tax asset is computed on the basis of the tax deduction for the share-based payments under the applicable tax law and is recognized to the extent it is probable that future taxable profit will be available against which these deductible temporary differences will be utilized. Therefore, changes in ASML’s share price do affect the deferred tax asset at period-end and result in adjustments to the deferred tax asset.
Note 3 Income taxes
Under US GAAP, the elimination of unrealized net income from intercompany transactions that are eliminated from the carrying amount of assets in consolidation give rise to a temporary difference for which prepaid taxes must be recognized in consolidation. Contrary to IFRS, the prepaid taxes under US GAAP are calculated based on the tax rate applicable in the seller’s rather than the purchaser’s tax jurisdiction.
Under IFRS, ASML applies IAS 12, “Income Taxes”. In accordance with IAS 12 unrealized net income resulting from intercompany transactions that are eliminated from the carrying amount of assets in consolidation give rise to a temporary difference for which deferred taxes must be recognized in consolidation. The deferred taxes are calculated based on the tax rate applicable in the purchaser’s tax jurisdiction.
This document contains statements relating to certain projections and business trends that are forward-looking, including statements with respect to our outlook, expected customer demand in specified market segments including DRAM and logic, expected trends, systems backlog, IC unit demand, expected financial results, including expected or potential sales, other income, gross margin, earnings per share and expenses, tool orders and expected shipment of tools, productivity of our tools and systems performance, including the continuation of Moore’s law, industry acceptance of EUV, annual revenue opportunity by 2020, expected tax rate, TWINSCAN and EUV system performance (such as endurance tests), expected industry trends, the development of EUV technology and the number of EUV systems expected to be shipped and timing of shipments, intention to return excess cash to shareholders, our proposed dividend for 2014 and our intention to repurchase shares. You can generally identify these statements by the use of words like “may”, “will”, “could”, “should”, “project”, “believe”, “anticipate”, “expect”, “plan”, “estimate”, “forecast”, “potential”, “intend”, “continue” and variations of these words or comparable words. These statements are not historical facts, but rather are based on current expectations, estimates, assumptions and projections about the business and our future financial results and readers should not place undue reliance on them. Forward-looking statements do not guarantee future performance and involve risks and uncertainties. These risks and uncertainties include, without limitation, economic conditions, product demand and semiconductor equipment industry capacity, worldwide demand and manufacturing capacity utilization for semiconductors (the principal product of our customer base), including the impact of general economic conditions on consumer confidence and demand for our customers’ products, competitive products and pricing, the impact of manufacturing efficiencies and capacity constraints, performance of our systems, the continuing success of technology advances and the related pace of new product development and customer acceptance of new products, the number and timing of EUV systems expected to be shipped and recognized in revenue, our ability to enforce patents and protect intellectual property rights, the risk of intellectual property litigation, availability of raw materials and critical manufacturing equipment, trade environment, changes in exchange rates, changes in tax rates, available cash, distributable reserves for dividend payments and share repurchases, risks associated with the Cymer acquisition and other risks indicated in the risk factors included in ASML’s Annual Report on Form 20-F and other filings with the US Securities and Exchange Commission. These forward-looking statements are made only as of the date of this document. We do not undertake to update or revise the forward-looking statements, whether as a result of new information, future events or otherwise.
| 1 | These financial statements are unaudited. |
| 2 | Numbers have been rounded. |
| 3 | The calculation of diluted net income per ordinary share assumes the exercise of options issued under ASML stock option plans and the issuance of shares under ASML share plans for periods in which exercises or issuances would have a dilutive effect. The calculation of diluted net income per ordinary share does not assume exercise of such options or issuance of shares when such exercises or issuance would be anti-dilutive. |
| 4 | Our systems backlog and net bookings include sales orders for which written authorizations have been accepted and shipment and/or revenue recognition is expected within 12 months. As of Q4 2014 we also include EUV in our backlog starting with our NXE:3350B systems. Before Q4 2014, our systems backlog and net bookings include only sales orders for which written authorizations have been accepted and system shipment and revenue recognition dates within the following 12 months have been assigned. This change has no impact on the comparative figures. |
Exhibit 99.4
ASML—Summary IFRS Consolidated Statement of Profit or Loss 1,2
| Three months ended, | ||||||||
| (in millions EUR) | Mar 30, 2014 |
Mar 29, 2015 |
||||||
| Net system sales |
1,030.0 | 1,246.5 | ||||||
| Net service and field option sales |
366.5 | 403.4 | ||||||
| Total net sales |
1,396.5 | 1,649.9 | ||||||
| Total cost of sales |
(818.9 | ) | (885.4 | ) | ||||
| Gross profit |
577.6 | 764.5 | ||||||
| Other income |
20.2 | 20.8 | ||||||
| Research and development costs |
(212.8 | ) | (164.1 | ) | ||||
| Selling, general and administrative costs |
(86.4 | ) | (82.7 | ) | ||||
| Operating income |
298.6 | 538.5 | ||||||
| Interest and other, net |
(2.6 | ) | (0.9 | ) | ||||
| Income before income taxes |
296.0 | 537.6 | ||||||
| Benefit from (provision for) income taxes |
(12.7 | ) | (67.6 | ) | ||||
| Net income |
283.3 | 470.0 | ||||||
ASML—Summary IFRS Consolidated Statement of Financial Position 1,2
| (in millions EUR) | Dec 31, 2014 |
Mar 29, 2015 |
||||||
| ASSETS |
||||||||
| Property, plant and equipment |
1,447.5 | 1,523.4 | ||||||
| Goodwill |
2,378.4 | 2,633.9 | ||||||
| Other intangible assets |
1,670.1 | 1,831.4 | ||||||
| Deferred tax assets |
142.7 | 151.5 | ||||||
| Finance receivables |
55.3 | 55.3 | ||||||
| Derivative financial instruments |
115.5 | 130.3 | ||||||
| Other assets |
329.3 | 342.0 | ||||||
| Total non-current assets |
6,138.8 | 6,667.8 | ||||||
| Inventories |
2,549.8 | 2,607.5 | ||||||
| Current tax assets |
43.9 | 94.3 | ||||||
| Derivative financial instruments |
38.3 | 41.1 | ||||||
| Finance receivables |
196.1 | 184.0 | ||||||
| Accounts receivable |
1,052.5 | 1,270.6 | ||||||
| Other assets |
293.6 | 353.8 | ||||||
| Short-term investments |
334.9 | 60.0 | ||||||
| Cash and cash equivalents |
2,419.5 | 2,778.5 | ||||||
| Total current assets |
6,928.6 | 7,389.8 | ||||||
| Total assets |
13,067.4 | 14,057.6 | ||||||
| EQUITY AND LIABILITIES |
||||||||
| Equity |
8,365.9 | 9,019.4 | ||||||
| Long-term debt |
1,149.9 | 1,155.5 | ||||||
| Derivative financial instruments |
2.8 | 2.6 | ||||||
| Deferred and other tax liabilities |
249.3 | 295.3 | ||||||
| Provisions |
3.6 | 3.7 | ||||||
| Accrued and other liabilities |
408.9 | 388.9 | ||||||
| Total non-current liabilities |
1,814.5 | 1,846.0 | ||||||
| Provisions |
2.4 | 2.4 | ||||||
| Derivative financial instruments |
64.9 | 118.4 | ||||||
| Current portion of long-term debt |
4.3 | 4.3 | ||||||
| Current and other tax liabilities |
36.3 | 32.4 | ||||||
| Accrued and other liabilities |
2,282.9 | 2,299.4 | ||||||
| Accounts payable |
496.2 | 735.3 | ||||||
| Total current liabilities |
2,887.0 | 3,192.2 | ||||||
| Total equity and liabilities |
13,067.4 | 14,057.6 | ||||||
ASML—Summary IFRS Consolidated Statement of Cash Flows 1,2
| Three months ended, | ||||||||
| Mar 30, | Mar 29, | |||||||
| (in millions EUR) | 2014 | 2015 | ||||||
| CASH FLOWS FROM OPERATING ACTIVITIES |
||||||||
| Net income |
283.3 | 470.0 | ||||||
| Adjustments to reconcile net income to net cash flows from operating activities: |
||||||||
| Depreciation and amortization |
96.6 | 80.3 | ||||||
| Impairment |
3.9 | — | ||||||
| Loss on disposal of property, plant and equipment |
0.7 | 0.9 | ||||||
| Share-based payments |
23.1 | 13.4 | ||||||
| Allowance for doubtful receivables |
0.1 | 0.4 | ||||||
| Allowance for obsolete inventory |
41.5 | 37.0 | ||||||
| Deferred income taxes |
(30.7 | ) | 40.1 | |||||
| Changes in assets and liabilities |
(146.6 | ) | (202.6 | ) | ||||
| Net cash provided by (used in) operating activities |
271.9 | 439.5 | ||||||
| CASH FLOWS FROM INVESTING ACTIVITIES |
||||||||
| Purchase of property, plant and equipment |
(75.5 | ) | (85.6 | ) | ||||
| Purchase of intangible assets |
(68.5 | ) | (101.6 | ) | ||||
| Purchase of available for sale securities |
(194.8 | ) | — | |||||
| Maturity of available for sale securities |
275.0 | 274.9 | ||||||
| Cash from (used for) derivative financial instruments |
— | (64.0 | ) | |||||
| Net cash provided by (used in) investing activities |
(63.8 | ) | 23.7 | |||||
| CASH FLOWS FROM FINANCING ACTIVITIES |
||||||||
| Dividend paid |
— | — | ||||||
| Purchase of shares |
(145.0 | ) | (117.1 | ) | ||||
| Net proceeds from issuance of shares |
5.5 | 4.4 | ||||||
| Repayment of debt |
(1.1 | ) | (0.8 | ) | ||||
| Net cash provided by (used in) financing activities |
(140.6 | ) | (113.5 | ) | ||||
| Net cash flows |
67.5 | 349.7 | ||||||
| Effect of changes in exchange rates on cash |
(0.1 | ) | 9.3 | |||||
| Net increase (decrease) in cash and cash equivalents |
67.4 | 359.0 | ||||||
ASML—Quarterly Summary IFRS Consolidated Statement of Profit or Loss 1,2
| Three months ended, | ||||||||||||||||||||
| Mar 30, | Jun 29, | Sep 28, | Dec 31, | Mar 29, | ||||||||||||||||
| (in millions EUR) | 2014 | 2014 | 2014 | 2014 | 2015 | |||||||||||||||
| Net system sales |
1,030.0 | 1,243.0 | 884.5 | 1,085.3 | 1,246.5 | |||||||||||||||
| Net service and field option sales |
366.5 | 400.6 | 437.7 | 408.7 | 403.4 | |||||||||||||||
| Total net sales |
1,396.5 | 1,643.6 | 1,322.2 | 1,494.0 | 1,649.9 | |||||||||||||||
| Total cost of sales |
(818.9 | ) | (923.1 | ) | (762.0 | ) | (854.9 | ) | (885.4 | ) | ||||||||||
| Gross profit |
577.6 | 720.5 | 560.2 | 639.1 | 764.5 | |||||||||||||||
| Other income |
20.2 | 20.3 | 20.3 | 20.2 | 20.8 | |||||||||||||||
| Research and development costs |
(212.8 | ) | (188.7 | ) | (184.6 | ) | (149.8 | ) | (164.1 | ) | ||||||||||
| Selling, general and administrative costs |
(86.4 | ) | (78.3 | ) | (75.1 | ) | (78.9 | ) | (82.7 | ) | ||||||||||
| Operating income |
298.6 | 473.8 | 320.8 | 430.6 | 538.5 | |||||||||||||||
| Interest and other, net |
(2.6 | ) | 1.2 | 2.1 | 1.9 | (0.9 | ) | |||||||||||||
| Income before income taxes |
296.0 | 475.0 | 322.9 | 432.5 | 537.6 | |||||||||||||||
| Benefit from (provision for) income taxes |
(12.7 | ) | (23.2 | ) | (24.7 | ) | (47.5 | ) | (67.6 | ) | ||||||||||
| Net income |
283.3 | 451.8 | 298.2 | 385.0 | 470.0 | |||||||||||||||
ASML—Quarterly Summary IFRS Consolidated Statement of Financial Position 1,2
| Mar 30, | Jun 29, | Sep 28, | Dec 31, | Mar 29, | ||||||||||||||||
| (in millions EUR) | 2014 | 2014 | 2014 | 2014 | 2015 | |||||||||||||||
| ASSETS |
||||||||||||||||||||
| Property, plant and equipment |
1,231.2 | 1,275.1 | 1,372.4 | 1,447.5 | 1,523.4 | |||||||||||||||
| Goodwill |
2,114.0 | 2,136.3 | 2,285.0 | 2,378.4 | 2,633.9 | |||||||||||||||
| Other intangible assets |
1,402.7 | 1,449.0 | 1,547.4 | 1,670.1 | 1,831.4 | |||||||||||||||
| Deferred tax assets |
295.8 | 317.2 | 344.1 | 142.7 | 151.5 | |||||||||||||||
| Finance receivables |
46.2 | 46.4 | 119.3 | 55.3 | 55.3 | |||||||||||||||
| Derivative financial instruments |
68.2 | 85.4 | 88.7 | 115.5 | 130.3 | |||||||||||||||
| Other assets |
257.8 | 258.4 | 257.2 | 329.3 | 342.0 | |||||||||||||||
| Total non-current assets |
5,415.9 | 5,567.8 | 6,014.1 | 6,138.8 | 6,667.8 | |||||||||||||||
| Inventories |
2,547.7 | 2,615.5 | 2,676.8 | 2,549.8 | 2,607.5 | |||||||||||||||
| Current tax assets |
92.1 | 94.0 | 76.7 | 43.9 | 94.3 | |||||||||||||||
| Derivative financial instruments |
37.1 | 28.9 | 38.1 | 38.3 | 41.1 | |||||||||||||||
| Finance receivables |
298.6 | 297.3 | 255.9 | 196.1 | 184.0 | |||||||||||||||
| Accounts receivable |
832.2 | 1,085.6 | 961.2 | 1,052.5 | 1,270.6 | |||||||||||||||
| Other assets |
268.3 | 276.9 | 258.1 | 293.6 | 353.8 | |||||||||||||||
| Short-term investments |
599.7 | 599.7 | 539.8 | 334.9 | 60.0 | |||||||||||||||
| Cash and cash equivalents |
2,398.1 | 2,111.0 | 2,144.8 | 2,419.5 | 2,778.5 | |||||||||||||||
| Total current assets |
7,073.8 | 7,108.9 | 6,951.4 | 6,928.6 | 7,389.8 | |||||||||||||||
| Total assets |
12,489.7 | 12,676.7 | 12,965.5 | 13,067.4 | 14,057.6 | |||||||||||||||
| EQUITY AND LIABILITIES |
||||||||||||||||||||
| Equity |
7,711.8 | 7,781.1 | 8,090.9 | 8,365.9 | 9,019.4 | |||||||||||||||
| Long-term debt |
1,093.0 | 1,114.3 | 1,133.4 | 1,149.9 | 1,155.5 | |||||||||||||||
| Derivative financial instruments |
2.8 | 3.1 | 3.0 | 2.8 | 2.6 | |||||||||||||||
| Deferred and other tax liabilities |
403.0 | 412.0 | 413.8 | 249.3 | 295.3 | |||||||||||||||
| Provisions |
4.4 | 4.1 | 4.0 | 3.6 | 3.7 | |||||||||||||||
| Accrued and other liabilities |
320.6 | 299.3 | 397.4 | 408.9 | 388.9 | |||||||||||||||
| Total non-current liabilities |
1,823.8 | 1,832.8 | 1,951.6 | 1,814.5 | 1,846.0 | |||||||||||||||
| Provisions |
2.1 | 2.1 | 2.3 | 2.4 | 2.4 | |||||||||||||||
| Derivative financial instruments |
5.9 | 10.4 | 63.5 | 64.9 | 118.4 | |||||||||||||||
| Current portion of long-term debt |
4.4 | 4.3 | 4.3 | 4.3 | 4.3 | |||||||||||||||
| Current and other tax liabilities |
96.7 | 88.9 | 71.1 | 36.3 | 32.4 | |||||||||||||||
| Accrued and other liabilities |
2,116.0 | 2,283.9 | 2,065.0 | 2,282.9 | 2,299.4 | |||||||||||||||
| Accounts payable |
729.0 | 673.2 | 716.8 | 496.2 | 735.3 | |||||||||||||||
| Total current liabilities |
2,954.1 | 3,062.8 | 2,923.0 | 2,887.0 | 3,192.2 | |||||||||||||||
| Total equity and liabilities |
12,489.7 | 12,676.7 | 12,965.5 | 13,067.4 | 14,057.6 | |||||||||||||||
ASML—Quarterly Summary IFRS Consolidated Statement of Cash Flows 1,2
| Three months ended, | ||||||||||||||||||||
| Mar 30, | Jun 29, | Sep 28, | Dec 31, | Mar 29, | ||||||||||||||||
| (in millions EUR) | 2014 | 2014 | 2014 | 2014 | 2015 | |||||||||||||||
| CASH FLOWS FROM OPERATING ACTIVITIES |
||||||||||||||||||||
| Net income |
283.3 | 451.8 | 298.2 | 385.0 | 470.0 | |||||||||||||||
| Adjustments to reconcile net income to net cash flows from operating activities: |
||||||||||||||||||||
| Depreciation and amortization |
96.6 | 98.8 | 77.6 | 80.1 | 80.3 | |||||||||||||||
| Impairment |
3.9 | 2.5 | 3.6 | 0.5 | — | |||||||||||||||
| Loss on disposal of property, plant and equipment |
0.7 | 0.5 | 0.9 | 1.4 | 0.9 | |||||||||||||||
| Share-based payments |
23.1 | 7.4 | 12.9 | 12.3 | 13.4 | |||||||||||||||
| Allowance for doubtful receivables |
0.1 | 0.1 | 0.1 | (0.2 | ) | 0.4 | ||||||||||||||
| Allowance for obsolete inventory |
41.5 | 45.2 | 35.8 | 40.3 | 37.0 | |||||||||||||||
| Deferred income taxes |
(30.7 | ) | (11.8 | ) | (20.9 | ) | 33.3 | 40.1 | ||||||||||||
| Changes in assets and liabilities |
(146.6 | ) | (316.1 | ) | (115.4 | ) | (21.5 | ) | (202.6 | ) | ||||||||||
| Net cash provided by (used in) operating activities |
271.9 | 278.4 | 292.8 | 531.2 | 439.5 | |||||||||||||||
| CASH FLOWS FROM INVESTING ACTIVITIES |
||||||||||||||||||||
| Purchase of property, plant and equipment |
(75.5 | ) | (70.7 | ) | (84.2 | ) | (127.9 | ) | (85.6 | ) | ||||||||||
| Purchase of intangible assets |
(68.5 | ) | (81.1 | ) | (77.7 | ) | (120.8 | ) | (101.6 | ) | ||||||||||
| Purchase of available for sale securities |
(194.8 | ) | (174.9 | ) | (110.0 | ) | (25.0 | ) | — | |||||||||||
| Maturity of available for sale securities |
275.0 | 175.0 | 169.9 | 229.9 | 274.9 | |||||||||||||||
| Cash from (used for) derivative financial instruments |
— | — | — | — | (64.0 | ) | ||||||||||||||
| Net cash provided by (used in) investing activities |
(63.8 | ) | (151.7 | ) | (102.0 | ) | (43.8 | ) | 23.7 | |||||||||||
| CASH FLOWS FROM FINANCING ACTIVITIES |
||||||||||||||||||||
| Dividend paid |
— | (268.0 | ) | — | — | — | ||||||||||||||
| Purchase of shares |
(145.0 | ) | (154.9 | ) | (171.1 | ) | (229.0 | ) | (117.1 | ) | ||||||||||
| Net proceeds from issuance of shares |
5.5 | 8.1 | 10.6 | 15.5 | 4.4 | |||||||||||||||
| Repayment of debt |
(1.1 | ) | (1.0 | ) | (1.2 | ) | (0.8 | ) | (0.8 | ) | ||||||||||
| Net cash provided by (used in) financing activities |
(140.6 | ) | (415.8 | ) | (161.7 | ) | (214.3 | ) | (113.5 | ) | ||||||||||
| Net cash flows |
67.5 | (289.1 | ) | 29.1 | 273.1 | 349.7 | ||||||||||||||
| Effect of changes in exchange rates on cash |
(0.1 | ) | 2.0 | 4.7 | 1.6 | 9.3 | ||||||||||||||
| Net increase (decrease) in cash and cash equivalents |
67.4 | (287.1 | ) | 33.8 | 274.7 | 359.0 | ||||||||||||||
Notes to the Summary IFRS Consolidated Financial Statements
Basis of Presentation
The accompanying summary consolidated financial statements are stated in millions of euros (“EUR”) unless otherwise indicated. ASML has prepared the accompanying summary consolidated financial statements in accordance with International Financial Reporting Standards as adopted by the EU (“IFRS”) accounting principles generally accepted in the Netherlands for companies quoted on Euronext Amsterdam. Further disclosures, as required under IFRS in annual reports and interim reporting (IAS 34), are not included in the summary consolidated financial statements.
For internal and external reporting purposes, we apply accounting principles generally accepted in the United States of America (“US GAAP”). US GAAP is our primary accounting standard for the setting of financial and operational performance targets.
Use of estimates
The preparation of our consolidated financial statements in conformity with IFRS requires management to make estimates and assumptions that affect the reported amounts of assets and liabilities and the disclosure of contingent assets and liabilities on the dates of the consolidated statement of financial position and the reported amounts of net sales and costs during the reported periods. Actual results could differ from those estimates.
Basis of consolidation
The consolidated financial statements include the financial statements of ASML Holding N.V. and all of its subsidiaries and the special purpose entity of which ASML is the primary beneficiary (referred to as “ASML”). All intercompany profits, balances and transactions have been eliminated in the consolidation. Subsidiaries are all entities over which ASML has the power to govern the financial and operating policies generally accompanying a shareholding of more than 50 percent of the voting rights.
Revenue recognition
In general, we recognize the revenue from the sale of a system upon shipment and the revenue from the installation of a system upon completion of that installation at the customer site. Each system undergoes, prior to shipment, a “Factory Acceptance Test” in ASML’s cleanroom facilities, effectively replicating the operating conditions that will be present on the customer’s site, in order to verify whether the system will meet its standard specifications and any additional technical and performance criteria agreed with the customer, if any. A system is shipped, and revenue is recognized, only after all specifications are met and customer sign-off is received or waived. In case not all specifications are met and the remaining performance obligation is not essential to the functionality of the system but is substantive rather than inconsequential or perfunctory, a portion of the sales price is deferred. Although each system’s performance is re-tested upon installation at the customer’s site, we have never failed to successfully complete installation of a system at a customer’s premises.
In connection with the introduction of new technology, such as NXE:3300B, we initially defer revenue recognition until acceptance of the new technology based system and completion of installation at the customer’s premises. As our systems are based largely on two product platforms that permit incremental, modular upgrades, the introduction of genuinely “new” technology occurs infrequently, and in the past 15 years, has occurred on only two occasions: 2000 (TWINSCAN) and 2010 (EUV).
The main portion of our revenue is derived from contractual arrangements with our customers that have multiple deliverables, which mainly include the sale of our systems, installation and training services and prepaid extended and enhanced (optic) warranty contracts. The revenue relating to the undelivered elements of the arrangements is deferred until delivery of these elements. Revenue from installation and training services is recognized when the services are completed. Revenue from prepaid extended and enhanced (optic) warranty contracts is recognized over the term of the contract.
Foreign currency risk management
Our sales are predominately denominated in euros. Exceptions may occur on a customer by customer basis. Our cost of sales and other expenses are mainly denominated in euros, to a certain extent in US dollars, Taiwanese dollars and Japanese yen and to a limited extent in other currencies. Therefore, we are exposed to foreign currency exchange risk.
It is our policy to hedge material transaction exposures, such as forecasted sales and purchase transactions, and material net remeasurement exposures, such as accounts receivable and payable. We hedge these exposures through the use of foreign exchange contracts.
ASML—Reconciliation US GAAP – IFRS 1,2
| Net income | Three months ended, | |||||||
| (in millions EUR) | Mar 30, 2014 |
Mar 29, 2015 |
||||||
| Net income based on U.S. GAAP |
249.1 | 402.7 | ||||||
| Development expenditures (see Note 1) |
27.5 | 69.5 | ||||||
| Share-based payments (see Note 2) |
0.7 | 1.2 | ||||||
| Income taxes (see Note 3) |
6.0 | (3.4 | ) | |||||
| Net income based on IFRS |
283.3 | 470.0 | ||||||
| Shareholders’ equity (in millions EUR) |
Mar 30, 2014 |
Jun 29, 2014 |
Sep 28, 2014 |
Dec 31, 2014 |
Mar 29, 2015 |
|||||||||||||||
| Shareholders’ equity based on U.S. GAAP |
7,056.9 | 7,080.4 | 7,324.1 | 7,512.6 | 8,076.8 | |||||||||||||||
| Development expenditures (see Note 1) |
610.2 | 646.9 | 702.3 | 792.1 | 878.1 | |||||||||||||||
| Share-based payments (see Note 2) |
26.0 | 20.1 | 20.7 | 21.0 | 22.4 | |||||||||||||||
| Income taxes (see Note 3) |
18.7 | 33.7 | 43.8 | 40.2 | 42.1 | |||||||||||||||
| Equity based on IFRS |
7,711.8 | 7,781.1 | 8,090.9 | 8,365.9 | 9,019.4 | |||||||||||||||
Notes to the reconciliation from US GAAP to IFRS
Note 1 Development expenditures
Under US GAAP, ASML applies ASC 730, “Research and Development”. In accordance with ASC 730, ASML charges costs relating to research and development to operating expense as incurred.
Under IFRS, ASML applies IAS 38, “Intangible Assets”. In accordance with IAS 38, ASML capitalizes certain development expenditures that are amortized over the expected useful life of the related product generally ranging between one and five years. Amortization starts when the developed product is ready for volume production.
Note 2 Share-based Payments
Under US GAAP, ASML applies ASC 718 “Compensation- Stock Compensation” which requires companies to recognize the cost of employee services received in exchange for awards of equity instruments based upon the grant-date fair value of those instruments. ASC 718’s general principle is that a deferred tax asset is established as we recognize compensation costs for commercial purposes for awards that are expected to result in a tax deduction under existing tax law. Under US GAAP, the deferred tax recorded on share-based compensation is computed on the basis of the expense recognized in the financial statements. Therefore, changes in ASML’s share price do not affect the deferred tax asset recorded in our financial statements.
Under IFRS, ASML applies IFRS 2, “Share-based Payments”. In accordance with IFRS 2, ASML records as an expense the fair value of its share-based payments with respect to stock options and shares granted to its employees. Under IFRS, at period end a deferred tax asset is computed on the basis of the tax deduction for the share-based payments under the applicable tax law and is recognized to the extent it is probable that future taxable profit will be available against which these deductible temporary differences will be utilized. Therefore, changes in ASML’s share price do affect the deferred tax asset at period-end and result in adjustments to the deferred tax asset.
Note 3 Income taxes
Under US GAAP, the elimination of unrealized net income from intercompany transactions that are eliminated from the carrying amount of assets in consolidation give rise to a temporary difference for which prepaid taxes must be recognized in consolidation. Contrary to IFRS, the prepaid taxes under US GAAP are calculated based on the tax rate applicable in the seller’s rather than the purchaser’s tax jurisdiction.
Under IFRS, ASML applies IAS 12, “Income Taxes”. In accordance with IAS 12 unrealized net income resulting from intercompany transactions that are eliminated from the carrying amount of assets in consolidation give rise to a temporary difference for which deferred taxes must be recognized in consolidation. The deferred taxes are calculated based on the tax rate applicable in the purchaser’s tax jurisdiction.
This document contains statements relating to certain projections and business trends that are forward-looking, including statements with respect to our outlook, expected customer demand in specified market segments including DRAM and logic, expected trends, systems backlog, IC unit demand, expected financial results, including expected or potential sales, other income, gross margin, earnings per share and expenses, tool orders and expected shipment of tools, productivity of our tools and systems performance, including the continuation of Moore’s law, industry acceptance of EUV, annual revenue opportunity by 2020, expected tax rate, TWINSCAN and EUV system performance (such as endurance tests), expected industry trends, the development of EUV technology and the number of EUV systems expected to be shipped and timing of shipments, intention to return excess cash to shareholders, our proposed dividend for 2014 and our intention to repurchase shares. You can generally identify these statements by the use of words like “may”, “will”, “could”, “should”, “project”, “believe”, “anticipate”, “expect”, “plan”, “estimate”, “forecast”, “potential”, “intend”, “continue” and variations of these words or comparable words. These statements are not historical facts, but rather are based on current expectations, estimates, assumptions and projections about the business and our future financial results and readers should not place undue reliance on them. Forward-looking statements do not guarantee future performance and involve risks and uncertainties. These risks and uncertainties include, without limitation, economic conditions, product demand and semiconductor equipment industry capacity, worldwide demand and manufacturing capacity utilization for semiconductors (the principal product of our customer base), including the impact of general economic conditions on consumer confidence and demand for our customers’ products, competitive products and pricing, the impact of manufacturing efficiencies and capacity constraints, performance of our systems, the continuing success of technology advances and the related pace of new product development and customer acceptance of new products, the number and timing of EUV systems expected to be shipped and recognized in revenue, our ability to enforce patents and protect intellectual property rights, the risk of intellectual property litigation, availability of raw materials and critical manufacturing equipment, trade environment, changes in exchange rates, changes in tax rates, available cash, distributable reserves for dividend payments and share repurchases, risks associated with the Cymer acquisition and other risks indicated in the risk factors included in ASML’s Annual Report on Form 20-F and other filings with the US Securities and Exchange Commission. These forward-looking statements are made only as of the date of this document. We do not undertake to update or revise the forward-looking statements, whether as a result of new information, future events or otherwise.
| 1 | These financial statements are unaudited. |
| 2 | Numbers have been rounded. |
Serious News for Serious Traders! Try StreetInsider.com Premium Free!
You May Also Be Interested In
- Midday movers: Travelers, JB Hunt fall; United Airlines rises
- Bio-Path Holdings, Inc. Announces Closing of $1.2 Million Registered Direct Offering Priced At-the-Market Under Nasdaq Rules
- Aedifica NV/SA: Repurchase of own shares
Create E-mail Alert Related Categories
SEC FilingsSign up for StreetInsider Free!
Receive full access to all new and archived articles, unlimited portfolio tracking, e-mail alerts, custom newswires and RSS feeds - and more!
