

Form 6-K PRUDENTIAL PLC For: Mar 31
 Tweet
Tweet Share
Share
SECURITIES AND EXCHANGE COMMISSION
Washington, D.C. 20549
FORM 6-K
REPORT OF FOREIGN PRIVATE ISSUER
Pursuant to Rule 13a-16 or 15d-16
of the Securities Exchange Act of 1934
For the month of March, 2015
PRUDENTIAL PUBLIC LIMITED COMPANY
(Translation of registrant’s name into English)
LAURENCE POUNTNEY HILL,
LONDON, EC4R 0HH, ENGLAND
(Address of principal executive offices)
Indicate by check mark whether the registrant files or will file annual reports under cover Form 20-F or Form 40-F.
Form 20-F x Form 40-F ¨
Indicate by check mark whether the registrant is submitting the Form6-K in paper as permitted by Regulation S-T
Rule 101(b)(1): ¨
Indicate by check mark whether the registrant is submitting the Form6-K in paper as permitted by Regulation S-T
Rule 101(b)(7): ¨

PRUDENTIAL Long-term thinking Prudential plc Annual Report 2014 HK Stock Code: 2378
Contents Group overview 03–13 04 Chairman’s statement 1 06 Group Chief Executive’s report Strategic report 15-70 16 Our world 39 Chief Financial Officer’s 2 18 Our strategy and operating report on our 2014 financial principles performance 19 How our business works 51 Group Chief Risk Officer’s report 20 Measuring our performance on the risks facing our business 22 Our businesses and their and our capital strength performance 61 Corporate responsibility review Governance 71-91 72 Board of Directors 81 Board committee reports 3 76 Chairman’s introduction 89 Additional information 77 Board governance 90 Statutory and regulatory disclosures 80 Group governance 91 Index to principal Directors’ Report disclosures Directors’ remuneration report 93-120 94 Annual statement from the 98 Summary of Directors’ remuneration policy 4 Chairman of the Remuneration 101 Annual report on remuneration Committee 116 Supplementary information 96 Our executive remuneration at a glance Financial statements 5 121-273 European Embedded Value (EEV) basis results 6 275-309 Additional information 311-352 313 Additional unaudited financial information 7 338 Risk factors 344 Glossary 348 Shareholder information 351 How to contact us www.prudential.co.uk
Prudential plc Annual Report 2014 01
Delivering
long-term value
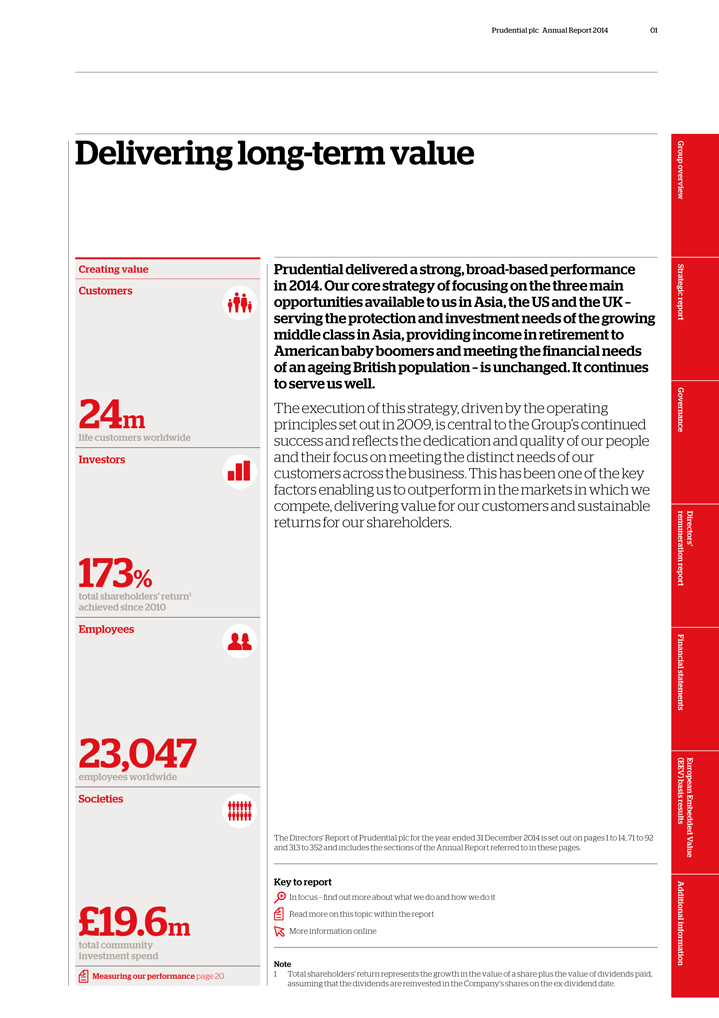
Creating value
Customers
24m
life customers worldwide
Investors
173%
total shareholders’ return1 achieved since 2010
Employees
23,047
employees worldwide
Societies
£19.6m
total community investment spend
Measuring our performance page 20
Prudential delivered a strong, broad-based performance in 2014. Our core strategy of focusing on the three main opportunities available to us in Asia, the US and the UK –
serving the protection and investment needs of the growing middle class in Asia, providing income in retirement to American baby boomers and meeting the fi nancial needs of an ageing British population – is unchanged. It continues to serve us
well.
The execution of this strategy, driven by the operating principles set out in 2009, is central to the Group’s continued success and refl ects the
dedication and quality of our people and their focus on meeting the distinct needs of our customers across the business. This has been one of the key factors enabling us to outperform in the markets in which we compete, delivering value for our
customers and sustainable returns for our shareholders.
The Directors’ Report of Prudential plc for the year ended 31 December 2014 is set out on pages 1 to
14, 71 to 92 and 313 to 352 and includes the sections of the Annual Report referred to in these pages.
Key to report
In focus – fi nd out more about what we do and how we do it Read more on this topic within the report More information online
Note
1 Total shareholders’ return represents the growth in the value of a share plus the
value of dividends paid, assuming that the dividends are reinvested in the Company’s shares on the ex-dividend date.
Directors’ European Embedded Value
Group overview Strategic report Governance remuneration report Financial statements (EEV) basis results Additional information

02 Prudential plc Annual Report 2014

Prudential plc Annual Report 2014 03 Section 1 Group overview Group overview 04 Chairman’s statement 06 Group Chief Executive’s report 1

04 Prudential plc Annual Report 2014 Group overview Chairman’s statement Value for our customers and growing returns for our shareholders Prudential was established on the principles of integrity, security and prudence. Those principles are still central to our culture, while we also take the initiative to capture new opportunities. Paul Manduca Chairman I am pleased to introduce Prudential’s 2014 Annual Report. The Group has produced another strong performance, delivering value to our customers, benefits to the communities in which we operate and good returns for our shareholders. This performance has been driven by a consistent focus on the long term and on the needs of our customers. We build sustainable businesses and we know that the service we provide to our customers is central to this goal. As our businesses grow and we continue to develop our high-performing teams in Asia, the US, the UK, Europe, and now in Africa, we ensure that this clear focus is at the core of everything we do. We also make sure that we adhere to our founding values. We were established in London in 1848 on the principles of integrity, security and prudence. More than 166 years later, those principles are still central to our culture, while we also take the initiative to capture new opportunities. Our commitment to creating sustainable value for our customers and our principled approach enable us also to deliver strong returns for our shareholders. I am delighted to report that all four of our major business units have made significant contributions to our profitability in 2014, with Asia remaining our primary focus for growth. Our success is based on a number of key factors. First, we have a clear and disciplined strategy, focused on the long term. Following our success in achieving our previous demanding set of targets, at the end of 2013 our executive team set new objectives to reach by 2017. These are just as testing as their predecessors, and I am pleased to say that we are making solid progress towards them. Our second key advantage is the strength of our leadership. Tidjane Thiam has been an exceptional servant of the Group since 2008, first as Chief Financial Officer and then as Group Chief Executive. As announced, he will be leaving Prudential once his successor is appointed. We will be sorry to see him go but understand his desire to take on a new challenge elsewhere and we wish him every success in his new role at Credit Suisse. We are fortunate to have strength in depth in our management team and the Board has been very focused on succession planning. At the time of writing, I can say that we expect to announce a new Group Chief Executive very shortly. Our third key strength is our robust corporate governance. Good governance is critical to success in financial services. It is one of the factors that has allowed Prudential to flourish for more than a century and a half, by ensuring our purpose and values inform the behaviours and culture of our organisation, and that decisions are taken within proper, effective and transparent reporting structures. Central to good governance is an experienced and skilled Board that is able both to support the executive and provide appropriate challenge, and we have continued to meet our commitment to implement changes that strengthen our Board. In line with that commitment, we have made a number of changes. In April 2014 we announced that our Group Chief Risk Officer, Pierre-Olivier Bouée, was joining the Board. It is important that at a large, complex financial services business such as ours, the Chief Risk Officer is represented, and Pierre-Olivier brings extensive expertise and experience to the Board. At the same time, our former Chief Risk Officer, John Foley, stepped down from the Board, while continuing in his role as Group Investment Director. I would like to thank John for his contribution and I am pleased that he is continuing to fulfil the vital role of Group oversight of financial investments as a member of the Group Executive Committee. In October we also announced that Lord Turnbull, who has been a member of the Board since May 2006, as well as Chairman of the Remuneration Committee since June 2011, would be stepping down at our next Annual General Meeting. I would like to thank Lord Turnbull for his contribution over nine years, which has been of considerable value to the Group. He will be succeeded as Chairman of the Remuneration Committee by Anthony Nightingale CMG, who will also join the Nomination Committee. I am determined to ensure that our Board makes the greatest contribution that it can to Prudential’s success, providing the best possible governance, forming a clear
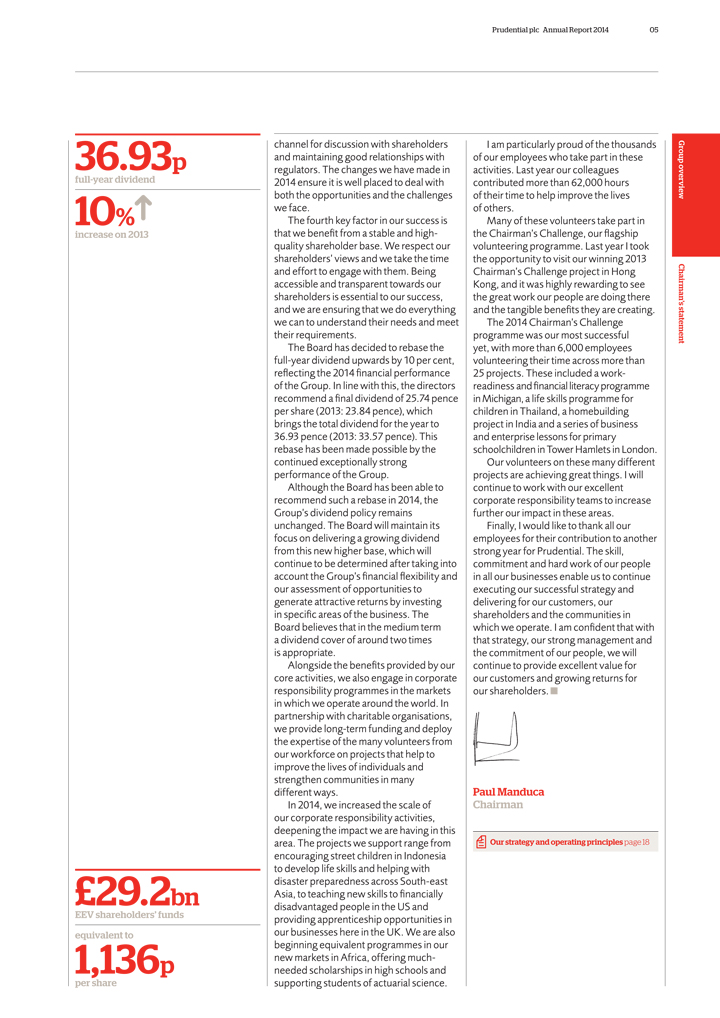
Prudential plc Annual Report 2014 05 36.93p full-year dividend 10% increase on 2013 £29.2bn EEV shareholders’ funds equivalent to 1,136p per share channel for discussion with shareholders and maintaining good relationships with regulators. The changes we have made in 2014 ensure it is well placed to deal with both the opportunities and the challenges we face. The fourth key factor in our success is that we benefit from a stable and high-quality shareholder base. We respect our shareholders’ views and we take the time and effort to engage with them. Being accessible and transparent towards our shareholders is essential to our success, and we are ensuring that we do everything we can to understand their needs and meet their requirements. The Board has decided to rebase the full-year dividend upwards by 10 per cent, reflecting the 2014 financial performance of the Group. In line with this, the directors recommend a final dividend of 25.74 pence per share (2013: 23.84 pence), which brings the total dividend for the year to 36.93 pence (2013: 33.57 pence). This rebase has been made possible by the continued exceptionally strong performance of the Group. Although the Board has been able to recommend such a rebase in 2014, the Group’s dividend policy remains unchanged. The Board will maintain its focus on delivering a growing dividend from this new higher base, which will continue to be determined after taking into account the Group’s financial flexibility and our assessment of opportunities to generate attractive returns by investing in specific areas of the business. The Board believes that in the medium term a dividend cover of around two times is appropriate. Alongside the benefits provided by our core activities, we also engage in corporate responsibility programmes in the markets in which we operate around the world. In partnership with charitable organisations, we provide long-term funding and deploy the expertise of the many volunteers from our workforce on projects that help to improve the lives of individuals and strengthen communities in many different ways. In 2014, we increased the scale of our corporate responsibility activities, deepening the impact we are having in this area. The projects we support range from encouraging street children in Indonesia to develop life skills and helping with disaster preparedness across South-east Asia, to teaching new skills to financially disadvantaged people in the US and providing apprenticeship opportunities in our businesses here in the UK. We are also beginning equivalent programmes in our new markets in Africa, offering much-needed scholarships in high schools and supporting students of actuarial science. I am particularly proud of the thousands of our employees who take part in these activities. Last year our colleagues contributed more than 62,000 hours of their time to help improve the lives of others. Many of these volunteers take part in the Chairman’s Challenge, our flagship volunteering programme. Last year I took the opportunity to visit our winning 2013 Chairman’s Challenge project in Hong Kong, and it was highly rewarding to see the great work our people are doing there and the tangible benefits they are creating. The 2014 Chairman’s Challenge programme was our most successful yet, with more than 6,000 employees volunteering their time across more than 25 projects. These included a work-readiness and financial literacy programme in Michigan, a life skills programme for children in Thailand, a homebuilding project in India and a series of business and enterprise lessons for primary schoolchildren in Tower Hamlets in London. Our volunteers on these many different projects are achieving great things. I will continue to work with our excellent corporate responsibility teams to increase further our impact in these areas. Finally, I would like to thank all our employees for their contribution to another strong year for Prudential. The skill, commitment and hard work of our people in all our businesses enable us to continue executing our successful strategy and delivering for our customers, our shareholders and the communities in which we operate. I am confident that with that strategy, our strong management and the commitment of our people, we will continue to provide excellent value for our customers and growing returns for our shareholders. Paul Manduca Chairman Our strategy and operating principles page 18 Group overview Chairman’s statement
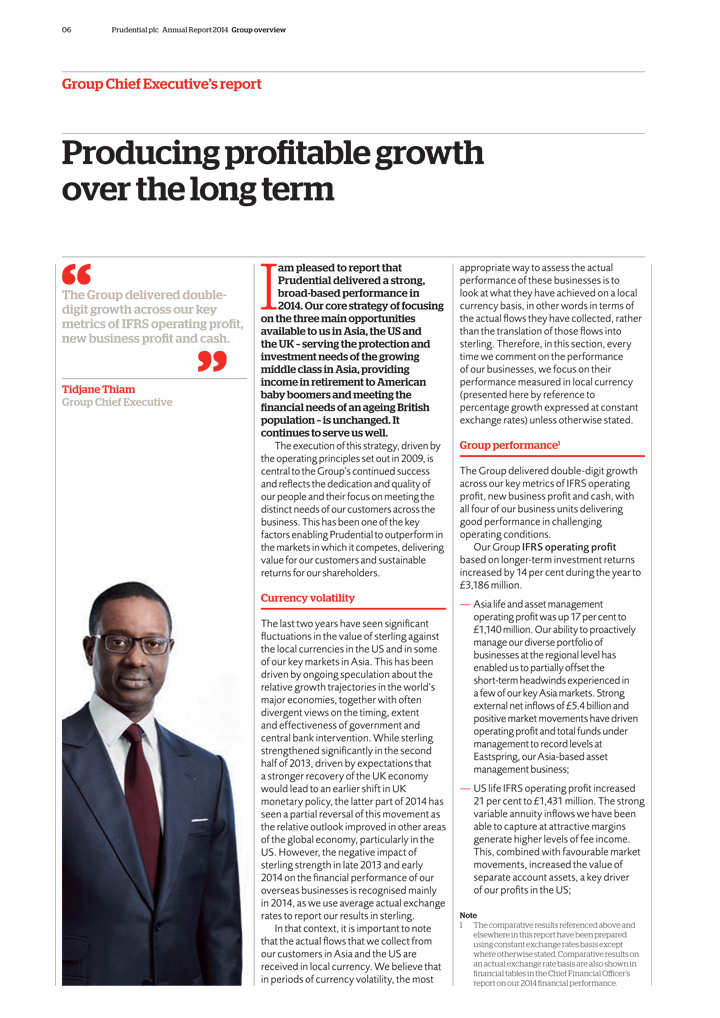
06 Prudential plc Annual Report 2014 Group overview Group Chief Executive’s report Producing profitable growth over the long term The Group delivered double-digit growth across our key metrics of IFRS operating profit, new business profit and cash. Tidjane Thiam Group Chief Executive I am pleased to report that Prudential delivered a strong, broad-based performance in 2014. Our core strategy of focusing on the three main opportunities available to us in Asia, the US and the UK – serving the protection and investment needs of the growing middle class in Asia, providing income in retirement to American baby boomers and meeting the financial needs of an ageing British population – is unchanged. It continues to serve us well. The execution of this strategy, driven by the operating principles set out in 2009, is central to the Group’s continued success and reflects the dedication and quality of our people and their focus on meeting the distinct needs of our customers across the business. This has been one of the key factors enabling Prudential to outperform in the markets in which it competes, delivering value for our customers and sustainable returns for our shareholders. Currency volatility The last two years have seen significant fluctuations in the value of sterling against the local currencies in the US and in some of our key markets in Asia. This has been driven by ongoing speculation about the relative growth trajectories in the world’s major economies, together with often divergent views on the timing, extent and effectiveness of government and central bank intervention. While sterling strengthened significantly in the second half of 2013, driven by expectations that a stronger recovery of the UK economy would lead to an earlier shift in UK monetary policy, the latter part of 2014 has seen a partial reversal of this movement as the relative outlook improved in other areas of the global economy, particularly in the US. However, the negative impact of sterling strength in late 2013 and early 2014 on the financial performance of our overseas businesses is recognised mainly in 2014, as we use average actual exchange rates to report our results in sterling. In that context, it is important to note that the actual flows that we collect from our customers in Asia and the US are received in local currency. We believe that in periods of currency volatility, the most appropriate way to assess the actual performance of these businesses is to look at what they have achieved on a local currency basis, in other words in terms of the actual flows they have collected, rather than the translation of those flows into sterling. Therefore, in this section, every time we comment on the performance of our businesses, we focus on their performance measured in local currency (presented here by reference to percentage growth expressed at constant exchange rates) unless otherwise stated. Group performance1 The Group delivered double-digit growth across our key metrics of IFRS operating profit, new business profit and cash, with all four of our business units delivering good performance in challenging operating conditions. Our Group IFRS operating profit based on longer-term investment returns increased by 14 per cent during the year to £3,186 million. Asia life and asset management operating profit was up 17 per cent to £1,140 million. Our ability to proactively manage our diverse portfolio of businesses at the regional level has enabled us to partially offset the short-term headwinds experienced in a few of our key Asia markets. Strong external net inflows of £5.4 billion and positive market movements have driven operating profit and total funds under management to record levels at Eastspring, our Asia-based asset management business; US life IFRS operating profit increased 21 per cent to £1,431 million. The strong variable annuity inflows we have been able to capture at attractive margins generate higher levels of fee income. This, combined with favourable market movements, increased the value of separate account assets, a key driver of our profits in the US; Note 1 The comparative results referenced above and elsewhere in this report have been prepared using constant exchange rates basis except where otherwise stated. Comparative results on an actual exchange rate basis are also shown in financial tables in the Chief Financial Officer’s report on our 2014 financial performance.
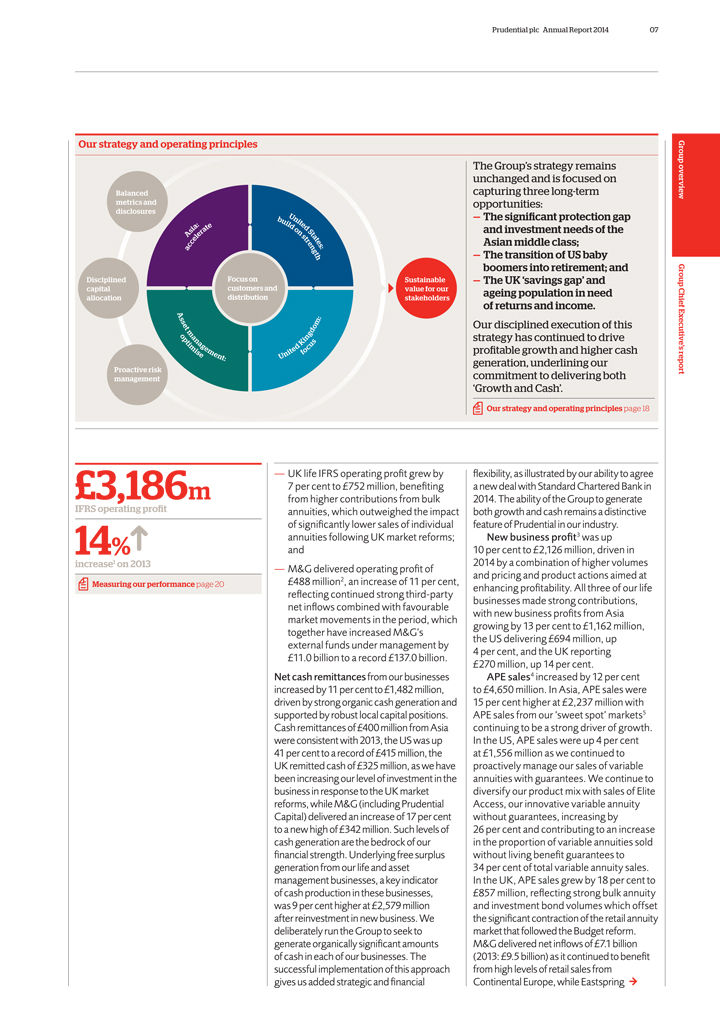
Prudential plc Annual Report 2014 07 Our strategy and operating principles Balanced metrics and disclosures Disciplined capital allocation Proactive risk management Focus on customers and distribution Asia: accelerate United States: build on strength United Kingdom: focus Asset Management: optimise Sustainable value for our stakeholders The Group’s strategy remains unchanged and is focused on capturing three long-term opportunities: — The significant protection gap and investment needs of the Asian middle class; — The transition of US baby boomers into retirement; and — The UK ‘savings gap’ and ageing population in need of returns and income. Our disciplined execution of this strategy has continued to drive profitable growth and higher cash generation, underlining our commitment to delivering both ‘Growth and Cash’. Our strategy and operating principles page 18 £3,186m IFRS operating profit 14% increase1 on 2013 Measuring our performance page 20 — UK life IFRS operating profit grew by 7 per cent to £752 million, benefiting from higher contributions from bulk annuities, which outweighed the impact of significantly lower sales of individual annuities following UK market reforms; and — M&G delivered operating profit of £488 million2, an increase of 11 per cent, reflecting continued strong third-party net inflows combined with favourable market movements in the period, which together have increased M&G’s external funds under management by £11.0 billion to a record £137.0 billion. Net cash remittances from our businesses increased by 11 per cent to £1,482 million, driven by strong organic cash generation and supported by robust local capital positions. Cash remittances of £400 million from Asia were consistent with 2013, the US was up 41 per cent to a record of £415 million, the UK remitted cash of £325 million, as we have been increasing our level of investment in the business in response to the UK market reforms, while M&G (including Prudential Capital) delivered an increase of 17 per cent to a new high of £342 million. Such levels of cash generation are the bedrock of our financial strength. Underlying free surplus generation from our life and asset management businesses, a key indicator of cash production in these businesses, was 9 per cent higher at £2,579 million after reinvestment in new business. We deliberately run the Group to seek to generate organically significant amounts of cash in each of our businesses. The successful implementation of this approach gives us added strategic and financial flexibility, as illustrated by our ability to agree a new deal with Standard Chartered Bank in 2014. The ability of the Group to generate both growth and cash remains a distinctive feature of Prudential in our industry. New business profit3 was up 10 per cent to £2,126 million, driven in 2014 by a combination of higher volumes and pricing and product actions aimed at enhancing profitability. All three of our life businesses made strong contributions, with new business profits from Asia growing by 13 per cent to £1,162 million, the US delivering £694 million, up 4 per cent, and the UK reporting £270 million, up 14 per cent. APE sales4 increased by 12 per cent to £4,650 million. In Asia, APE sales were 15 per cent higher at £2,237 million with APE sales from our ‘sweet spot’ markets5 continuing to be a strong driver of growth. In the US, APE sales were up 4 per cent at £1,556 million as we continued to proactively manage our sales of variable annuities with guarantees. We continue to diversify our product mix with sales of Elite Access, our innovative variable annuity without guarantees, increasing by 26 per cent and contributing to an increase in the proportion of variable annuities sold without living benefit guarantees to 34 per cent of total variable annuity sales. In the UK, APE sales grew by 18 per cent to £857 million, reflecting strong bulk annuity and investment bond volumes which offset the significant contraction of the retail annuity market that followed the Budget reform. M&G delivered net inflows of £7.1 billion (2013: £9.5 billion) as it continued to benefit from high levels of retail sales from Continental Europe, while Eastspring Group overview Group Chief Executive’s report
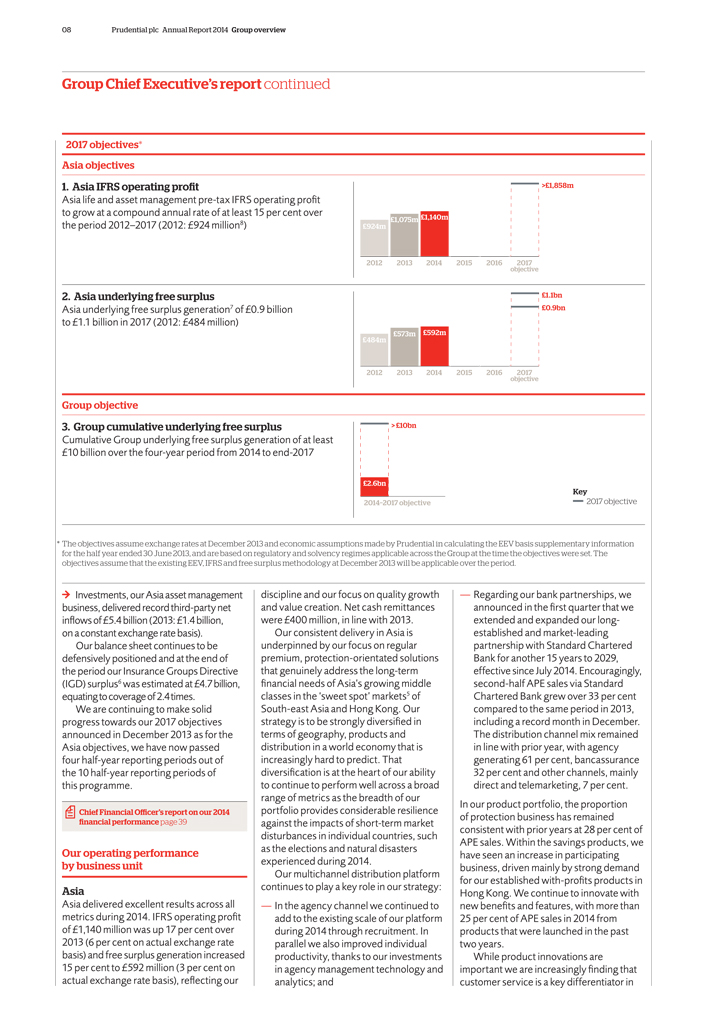
08 Prudential plc Annual Report 2014 Group overview Group Chief Executive’s report continued 2017 objectives* Asia objectives 1. Asia IFRS operating profit Asia life and asset management pre-tax IFRS operating profit to grow at a compound annual rate of at least 15 per cent over the period 2012–2017 (2012: £924 million8) 2. Asia underlying free surplus Asia underlying free surplus generation7 of £0.9 billion to £1.1 billion in 2017 (2012: £484 million) Group objective 3. Group cumulative underlying free surplus Cumulative Group underlying free surplus generation of at least £10 billion over the four-year period from 2014 to end-2017 >£1,858m £924m £1,075m £1,140m 2012 2013 2014 2015 2016 objective 2017 £1.1bn £0.9bn £484m £573m £592m 2012 2013 2014 2015 2016 objective 2017 > £10bn £2.6bn 2014_2017 objective Key 2017 objective * The objectives assume exchange rates at December 2013 and economic assumptions made by Prudential in calculating the EEV basis supplementary information for the half year ended 30 June 2013, and are based on regulatory and solvency regimes applicable across the Group at the time the objectives were set. The objectives assume that the existing EEV, IFRS and free surplus methodology at December 2013 will be applicable over the period. Investments, our Asia asset management business, delivered record third-party net inflows of £5.4 billion (2013: £1.4 billion, on a constant exchange rate basis). Our balance sheet continues to be defensively positioned and at the end of the period our Insurance Groups Directive (IGD) surplus6 was estimated at £4.7 billion, equating to coverage of 2.4 times. We are continuing to make solid progress towards our 2017 objectives announced in December 2013 as for the Asia objectives, we have now passed four half-year reporting periods out of the 10 half-year reporting periods of this programme. Chief Financial Officer’s report on our 2014 financial performance page 39 Our operating performance by business unit Asia Asia delivered excellent results across all metrics during 2014. IFRS operating profit of £1,140 million was up 17 per cent over 2013 (6 per cent on actual exchange rate basis) and free surplus generation increased 15 per cent to £592 million (3 per cent on actual exchange rate basis), reflecting our discipline and our focus on quality growth and value creation. Net cash remittances were £400 million, in line with 2013. Our consistent delivery in Asia is underpinned by our focus on regular premium, protection-orientated solutions that genuinely address the long-term financial needs of Asia’s growing middle classes in the ‘sweet spot’ markets5 of South-east Asia and Hong Kong. Our strategy is to be strongly diversified in terms of geography, products and distribution in a world economy that is increasingly hard to predict. That diversification is at the heart of our ability to continue to perform well across a broad range of metrics as the breadth of our portfolio provides considerable resilience against the impacts of short-term market disturbances in individual countries, such as the elections and natural disasters experienced during 2014. Our multichannel distribution platform continues to play a key role in our strategy: — In the agency channel we continued to add to the existing scale of our platform during 2014 through recruitment. In parallel we also improved individual productivity, thanks to our investments in agency management technology and analytics; and — Regarding our bank partnerships, we announced in the first quarter that we extended and expanded our long-established and market-leading partnership with Standard Chartered Bank for another 15 years to 2029, effective since July 2014. Encouragingly, second-half APE sales via Standard Chartered Bank grew over 33 per cent compared to the same period in 2013, including a record month in December. The distribution channel mix remained in line with prior year, with agency generating 61 per cent, bancassurance 32 per cent and other channels, mainly direct and telemarketing, 7 per cent. In our product portfolio, the proportion of protection business has remained consistent with prior years at 28 per cent of APE sales. Within the savings products, we have seen an increase in participating business, driven mainly by strong demand for our established with-profits products in Hong Kong. We continue to innovate with new benefits and features, with more than 25 per cent of APE sales in 2014 from products that were launched in the past two years. While product innovations are important we are increasingly finding that customer service is a key differentiator in
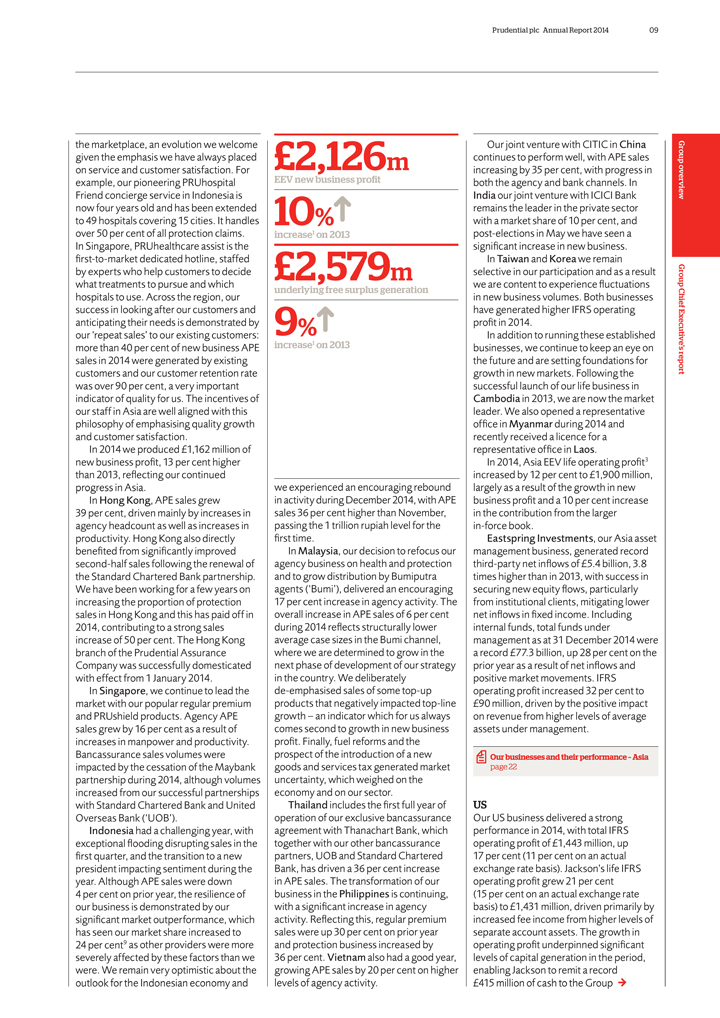
Prudential plc Annual Report 2014 09 the marketplace, an evolution we welcome given the emphasis we have always placed on service and customer satisfaction. For example, our pioneering PRUhospital Friend concierge service in Indonesia is now four years old and has been extended to 49 hospitals covering 15 cities. It handles over 50 per cent of all protection claims. In Singapore, PRUhealthcare assist is the first-to-market dedicated hotline, staffed by experts who help customers to decide what treatments to pursue and which hospitals to use. Across the region, our success in looking after our customers and anticipating their needs is demonstrated by our ‘repeat sales’ to our existing customers: more than 40 per cent of new business APE sales in 2014 were generated by existing customers and our customer retention rate was over 90 per cent, a very important indicator of quality for us. The incentives of our staff in Asia are well aligned with this philosophy of emphasising quality growth and customer satisfaction. In 2014 we produced £1,162 million of new business profit, 13 per cent higher than 2013, reflecting our continued progress in Asia. In Hong Kong, APE sales grew 39 per cent, driven mainly by increases in agency headcount as well as increases in productivity. Hong Kong also directly benefited from significantly improved second-half sales following the renewal of the Standard Chartered Bank partnership. We have been working for a few years on increasing the proportion of protection sales in Hong Kong and this has paid off in 2014, contributing to a strong sales increase of 50 per cent. The Hong Kong branch of the Prudential Assurance Company was successfully domesticated with effect from 1 January 2014. In Singapore, we continue to lead the market with our popular regular premium and PRUshield products. Agency APE sales grew by 16 per cent as a result of increases in manpower and productivity. Bancassurance sales volumes were impacted by the cessation of the Maybank partnership during 2014, although volumes increased from our successful partnerships with Standard Chartered Bank and United Overseas Bank (‘UOB’). Indonesia had a challenging year, with exceptional flooding disrupting sales in the first quarter, and the transition to a new president impacting sentiment during the year. Although APE sales were down 4 per cent on prior year, the resilience of our business is demonstrated by our significant market outperformance, which has seen our market share increased to 24 per cent9 as other providers were more severely affected by these factors than we were. We remain very optimistic about the outlook for the Indonesian economy and £2,126m EEV new business profit 10% increase1 on 2013 £2,579m underlying free surplus generation 9% increase1 on 2013 we experienced an encouraging rebound in activity during December 2014, with APE sales 36 per cent higher than November, passing the 1 trillion rupiah level for the first time. In Malaysia, our decision to refocus our agency business on health and protection and to grow distribution by Bumiputra agents (‘Bumi’), delivered an encouraging 17 per cent increase in agency activity. The overall increase in APE sales of 6 per cent during 2014 reflects structurally lower average case sizes in the Bumi channel, where we are determined to grow in the next phase of development of our strategy in the country. We deliberately de-emphasised sales of some top-up products that negatively impacted top-line growth – an indicator which for us always comes second to growth in new business profit. Finally, fuel reforms and the prospect of the introduction of a new goods and services tax generated market uncertainty, which weighed on the economy and on our sector. Thailand includes the first full year of operation of our exclusive bancassurance agreement with Thanachart Bank, which together with our other bancassurance partners, UOB and Standard Chartered Bank, has driven a 36 per cent increase in APE sales. The transformation of our business in the Philippines is continuing, with a significant increase in agency activity. Reflecting this, regular premium sales were up 30 per cent on prior year and protection business increased by 36 per cent. Vietnam also had a good year, growing APE sales by 20 per cent on higher levels of agency activity. Our joint venture with CITIC in China continues to perform well, with APE sales increasing by 35 per cent, with progress in both the agency and bank channels. In India our joint venture with ICICI Bank remains the leader in the private sector with a market share of 10 per cent, and post-elections in May we have seen a significant increase in new business. In Taiwan and Korea we remain selective in our participation and as a result we are content to experience fluctuations in new business volumes. Both businesses have generated higher IFRS operating profit in 2014. In addition to running these established businesses, we continue to keep an eye on the future and are setting foundations for growth in new markets. Following the successful launch of our life business in Cambodia in 2013, we are now the market leader. We also opened a representative office in Myanmar during 2014 and recently received a licence for a representative office in Laos. In 2014, Asia EEV life operating profit3 increased by 12 per cent to £1,900 million, largely as a result of the growth in new business profit and a 10 per cent increase in the contribution from the larger in-force book. Eastspring Investments, our Asia asset management business, generated record third-party net inflows of £5.4 billion, 3.8 times higher than in 2013, with success in securing new equity flows, particularly from institutional clients, mitigating lower net inflows in fixed income. Including internal funds, total funds under management as at 31 December 2014 were a record £77.3 billion, up 28 per cent on the prior year as a result of net inflows and positive market movements. IFRS operating profit increased 32 per cent to £90 million, driven by the positive impact on revenue from higher levels of average assets under management. Our businesses and their performance – Asia page 22 US Our US business delivered a strong performance in 2014, with total IFRS operating profit of £1,443 million, up 17 per cent (11 per cent on an actual exchange rate basis). Jackson’s life IFRS operating profit grew 21 per cent (15 per cent on an actual exchange rate basis) to £1,431 million, driven primarily by increased fee income from higher levels of separate account assets. The growth in operating profit underpinned significant levels of capital generation in the period, enabling Jackson to remit a record £415 million of cash to the Group Group overview Group Chief Executive’s report
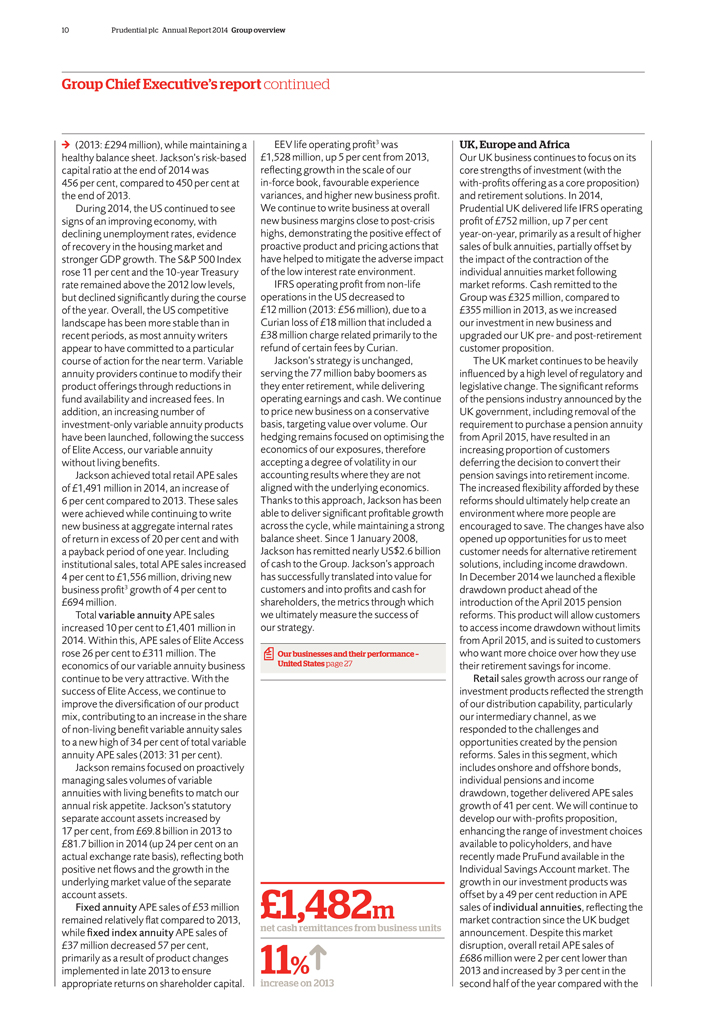
10 Prudential plc Annual Report 2014 Group overview Group Chief Executive’s report continued (2013: £294 million), while maintaining a healthy balance sheet. Jackson’s risk-based capital ratio at the end of 2014 was 456 per cent, compared to 450 per cent at the end of 2013. During 2014, the US continued to see signs of an improving economy, with declining unemployment rates, evidence of recovery in the housing market and stronger GDP growth. The S&P 500 Index rose 11 per cent and the 10-year Treasury rate remained above the 2012 low levels, but declined significantly during the course of the year. Overall, the US competitive landscape has been more stable than in recent periods, as most annuity writers appear to have committed to a particular course of action for the near term. Variable annuity providers continue to modify their product offerings through reductions in fund availability and increased fees. In addition, an increasing number of investment-only variable annuity products have been launched, following the success of Elite Access, our variable annuity without living benefits. Jackson achieved total retail APE sales of £1,491 million in 2014, an increase of 6 per cent compared to 2013. These sales were achieved while continuing to write new business at aggregate internal rates of return in excess of 20 per cent and with a payback period of one year. Including institutional sales, total APE sales increased 4 per cent to £1,556 million, driving new business profit3 growth of 4 per cent to £694 million. Total variable annuity APE sales increased 10 per cent to £1,401 million in 2014. Within this, APE sales of Elite Access rose 26 per cent to £311 million. The economics of our variable annuity business continue to be very attractive. With the success of Elite Access, we continue to improve the diversification of our product mix, contributing to an increase in the share of non-living benefit variable annuity sales to a new high of 34 per cent of total variable annuity APE sales (2013: 31 per cent). Jackson remains focused on proactively managing sales volumes of variable annuities with living benefits to match our annual risk appetite. Jackson’s statutory separate account assets increased by 17 per cent, from £69.8 billion in 2013 to £81.7 billion in 2014 (up 24 per cent on an actual exchange rate basis), reflecting both positive net flows and the growth in the underlying market value of the separate account assets. Fixed annuity APE sales of £53 million remained relatively flat compared to 2013, while fixed index annuity APE sales of £37 million decreased 57 per cent, primarily as a result of product changes implemented in late 2013 to ensure appropriate returns on shareholder capital. EEV life operating profit3 was £1,528 million, up 5 per cent from 2013, reflecting growth in the scale of our in-force book, favourable experience variances, and higher new business profit. We continue to write business at overall new business margins close to post-crisis highs, demonstrating the positive effect of proactive product and pricing actions that have helped to mitigate the adverse impact of the low interest rate environment. IFRS operating profit from non-life operations in the US decreased to £12 million (2013: £56 million), due to a Curian loss of £18 million that included a £38 million charge related primarily to the refund of certain fees by Curian. Jackson’s strategy is unchanged, serving the 77 million baby boomers as they enter retirement, while delivering operating earnings and cash. We continue to price new business on a conservative basis, targeting value over volume. Our hedging remains focused on optimising the economics of our exposures, therefore accepting a degree of volatility in our accounting results where they are not aligned with the underlying economics. Thanks to this approach, Jackson has been able to deliver significant profitable growth across the cycle, while maintaining a strong balance sheet. Since 1 January 2008, Jackson has remitted nearly US$2.6 billion of cash to the Group. Jackson’s approach has successfully translated into value for customers and into profits and cash for shareholders, the metrics through which we ultimately measure the success of our strategy. Our businesses and their performance – United States page 27 £1,482m net cash remittances from business units 11% increase on 2013 UK, Europe and Africa Our UK business continues to focus on its core strengths of investment (with the with-profits offering as a core proposition) and retirement solutions. In 2014, Prudential UK delivered life IFRS operating profit of £752 million, up 7 per cent year-on-year, primarily as a result of higher sales of bulk annuities, partially offset by the impact of the contraction of the individual annuities market following market reforms. Cash remitted to the Group was £325 million, compared to £355 million in 2013, as we increased our investment in new business and upgraded our UK pre- and post-retirement customer proposition. The UK market continues to be heavily influenced by a high level of regulatory and legislative change. The significant reforms of the pensions industry announced by the UK government, including removal of the requirement to purchase a pension annuity from April 2015, have resulted in an increasing proportion of customers deferring the decision to convert their pension savings into retirement income. The increased flexibility afforded by these reforms should ultimately help create an environment where more people are encouraged to save. The changes have also opened up opportunities for us to meet customer needs for alternative retirement solutions, including income drawdown. In December 2014 we launched a flexible drawdown product ahead of the introduction of the April 2015 pension reforms. This product will allow customers to access income drawdown without limits from April 2015, and is suited to customers who want more choice over how they use their retirement savings for income. Retail sales growth across our range of investment products reflected the strength of our distribution capability, particularly our intermediary channel, as we responded to the challenges and opportunities created by the pension reforms. Sales in this segment, which includes onshore and offshore bonds, individual pensions and income drawdown, together delivered APE sales growth of 41 per cent. We will continue to develop our with-profits proposition, enhancing the range of investment choices available to policyholders, and have recently made PruFund available in the Individual Savings Account market. The growth in our investment products was offset by a 49 per cent reduction in APE sales of individual annuities, reflecting the market contraction since the UK budget announcement. Despite this market disruption, overall retail APE sales of £686 million were 2 per cent lower than 2013 and increased by 3 per cent in the second half of the year compared with the
Prudential plc Annual Report 2014 11 same period in 2013. Retail new business profit was 23 per cent lower at £165 million, largely due to the reduced sales of higher-margin individual annuities. Onshore bonds APE sales of £232 million increased by 32 per cent, reflecting the strength of our investment proposition. APE sales from with-profits bonds of £214 million were 34 per cent higher, due to continuing demand for our non-guaranteed bond. We expect significant ongoing demand for our with-profits bond, with customers attracted by the benefit of a smoothed return to help manage market volatility and a strong track record of investment growth. APE sales from other retail products, including individual pensions, income drawdown and offshore bonds, increased by 44 per cent to £201 million. Offshore bond APE sales were 44 per cent higher, reflecting the growing popularity of our with-profits fund. Income drawdown APE sales grew by 133 per cent to £35 million and individual pensions APE sales increased by 44 per cent to £72 million, both driven by the strength of our with-profits PruFund offering, and by customers selecting more flexible retirement income solutions in anticipation of the pension reforms. In total, PruFund assets under management increased 27 per cent to £11.6 billion in 2014. Corporate pensions APE sales of £147 million were 15 per cent lower, mainly due to changes to public sector pension schemes. We remain the largest provider of Additional Voluntary Contribution plans within the public sector, where we provide schemes for 72 of the 99 public sector authorities in the UK (2013: 69 of the 99). Prudential’s continuing focus on the delivery of excellent customer service was recognised at the 2014 Financial Adviser Service Awards where we received an outstanding achievement award for retaining our two ‘Five Star’ ratings in the Life & Pensions and Investment categories for the fourth year running. In the wholesale market we wrote seven new bulk annuity deals in 2014 (2013: three), generating APE sales of £171 million (2013: £28 million) and new business profit3 of £105 million (2013: £24 million). Our approach to bulk transactions in the UK will continue to be one of selective participation, where we can bring both significant value to our customers and meet our shareholder return requirements. Through our longstanding presence in this segment of the life and pensions market, we have developed considerable longevity experience, operational scale and a good investment track record, which together represent expertise and capabilities that are increasingly in demand. The strength and focus of our teams and of our businesses enabled us to deliver good financial and operational progress. Tidjane Thiam Group Chief Executive In Poland, our new life company, Prudential Polska, conducted its second year of business in 2014, growing ahead of plan. Headquartered in Warsaw, the business now has 15 branches across the country and 712 financial planning consultants. Its success is evidence of our ability to build franchises in new territories, leveraging effectively in this case some of our Asian staff and skills. EEV life operating profit3 of £746 million was 10 per cent lower than 2013, reflecting a non-recurring contribution of £98 million in 2013 from the reduction in the rate of UK corporation tax. On 10 November 2014, Prudential Assurance Company Limited announced the sale of its 25 per cent equity stake in the PruHealth and PruProtect businesses to Discovery Group Europe Limited for £155 million in cash, generating an IFRS profit on disposal of £86 million. This transaction enabled Prudential UK to realise its investment at attractive terms and creates strategic flexibility for future participation in the UK protection market. During 2014, we completed the acquisition of Express Life in Ghana and Shield Assurance Company in Kenya, marking the Group’s entry into the nascent African life insurance industry. We are positive about the long-term opportunities in Africa, where we see many of the favourable structural characteristics of our preferred Asia markets, although most sub-Saharan life insurance markets are in the very early stages of development and therefore are not likely to be material in the short term. Our businesses and their performance – United Kingdom page 31 M&G M&G is an investment-led business that has managed money on behalf of individual and institutional investors for more than 80 years. Its focus on producing superior long-term investment returns, coupled with well-established distribution in the UK and across Europe, has underpinned another strong set of financial results, with funds under management and profits both reaching new highs. IFRS operating profit increased 13 per cent to £446 million in 2014, marking the fifth consecutive year of record profits. Over this period operating profit has grown by a compound annual growth rate of 16 per cent. While higher equity markets and buoyant bond markets have both contributed to improving profitability, strong net inflows of client assets since 2009, particularly in the retail market, have been a key driver of the increase in profit achieved by M&G. Reflecting this continued strong operating performance, M&G remitted £285 million of cash to Group in 2014, 21 per cent more than in 2013. During 2014, the combination of continued net fund inflows and generally positive market movements increased M&G’s total funds under management by 8 per cent to £264 billion at the end of the year. Within this, external funds under management grew by 9 per cent to £137 billion and now account for 52 per cent of M&G’s total funds under management, compared with 40 per cent five years ago. Within our retail business, we continue to make strong progress, with expansion of distribution in Continental Europe in recent years transforming the scale of funds under management and helping to diversify the business. Today, international clients account for 43 per cent of retail funds under management, compared with just 16 per cent five years ago, and M&G’s retail funds are now registered in 22 jurisdictions. Net inflows across Continental Europe were at a record level of £8.1 billion in 2014, compared to £7.6 billion in 2013. This more than offset a net outflow of £1.7 billion in the UK (2013: net outflow of £0.7 billion). In the UK, M&G achieved record net inflows into the M&G Property Portfolio Fund, which directly invests across different property sectors such as retail, offices and industrial on behalf of its UK retail client base. The Property Portfolio Fund finished 2014 with external funds under management of £3.0 billion, placing it as the largest retail property fund in the UK market. M&G also continues to pursue business diversification by fund, with seven of its retail funds, representing all the major asset classes, achieving net inflows of at least Group overview Group Chief Executive’s report
12 Prudential plc Annual Report 2014 Group overview
Group Chief Executive’s report continued
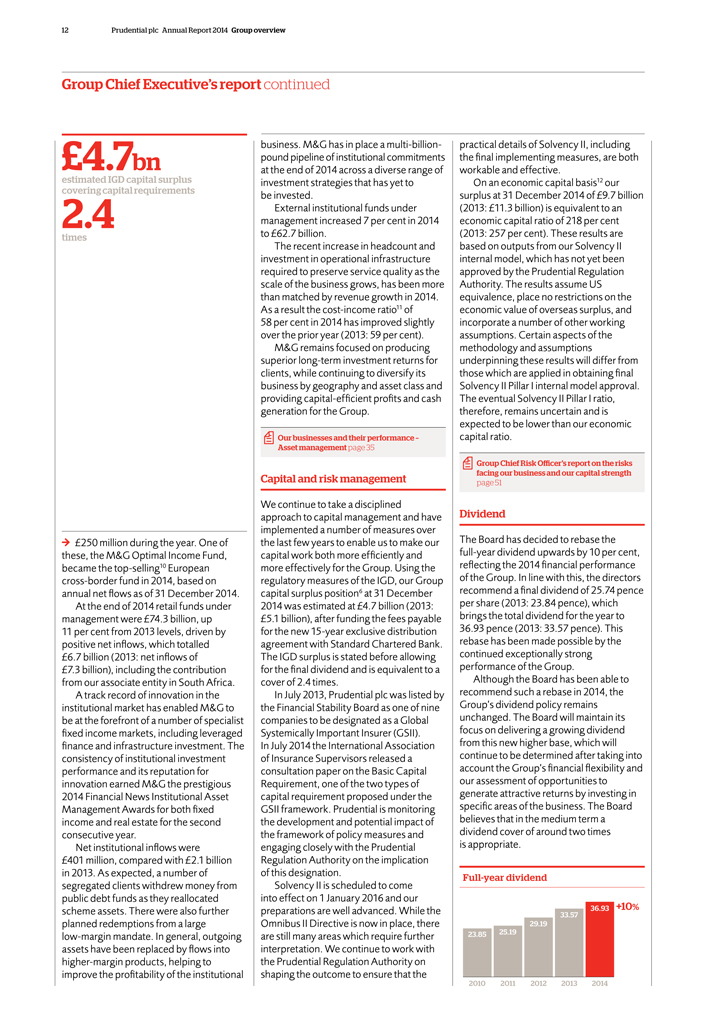
£4.7bn
estimated IGD capital surplus covering capital requirements
2.4
times
£250 million during the year. One of these, the M&G Optimal Income Fund,
became the top-selling10 European cross-border fund in 2014, based on annual net flows as of 31 December 2014.
At the end of 2014 retail funds under management
were £74.3 billion, up 11 per cent from 2013 levels, driven by positive net inflows, which totalled £6.7 billion (2013: net inflows of £7.3 billion), including the contribution from our associate entity in South Africa.
A track record of innovation in the institutional market has enabled M&G to be at the forefront of a number of specialist fixed income markets, including leveraged finance and
infrastructure investment. The consistency of institutional investment performance and its reputation for innovation earned M&G the prestigious 2014 Financial News Institutional Asset Management Awards for both fixed income and real estate for
the second consecutive year.
Net institutional inflows were £401 million, compared with £2.1 billion in 2013. As expected, a number of segregated
clients withdrew money from public debt funds as they reallocated scheme assets. There were also further planned redemptions from a large low-margin mandate. In general, outgoing assets have been replaced by flows into higher-margin products,
helping to improve the profitability of the institutional
business. M&G has in place a multi-billion-pound pipeline of institutional commitments at the end of
2014 across a diverse range of investment strategies that has yet to be invested.
External institutional funds under management increased 7 per cent in 2014 to
£62.7 billion.
The recent increase in headcount and investment in operational infrastructure required to preserve service quality as the scale of the
business grows, has been more than matched by revenue growth in 2014. As a result the cost-income ratio11 of 58 per cent in 2014 has improved slightly over the prior year (2013: 59 per cent).
M&G remains focused on producing superior long-term investment returns for clients, while continuing to diversify its business by geography and asset class and providing
capital-efficient profits and cash generation for the Group.
Our businesses and their performance – Asset management page 35
Capital and risk management
We continue to take a disciplined approach to capital management
and have implemented a number of measures over the last few years to enable us to make our capital work both more efficiently and more effectively for the Group. Using the regulatory measures of the IGD, our Group capital surplus position6 at 31
December 2014 was estimated at £4.7 billion (2013: £5.1 billion), after funding the fees payable for the new 15-year exclusive distribution agreement with Standard Chartered Bank. The IGD surplus is stated before allowing for the final
dividend and is equivalent to a cover of 2.4 times.
In July 2013, Prudential plc was listed by the Financial Stability Board as one of nine companies to be
designated as a Global Systemically Important Insurer (GSII). In July 2014 the International Association of Insurance Supervisors released a consultation paper on the Basic Capital Requirement, one of the two types of capital requirement proposed
under the GSII framework. Prudential is monitoring the development and potential impact of the framework of policy measures and engaging closely with the Prudential Regulation Authority on the implication of this designation.
Solvency II is scheduled to come into effect on 1 January 2016 and our preparations are well advanced. While the Omnibus II Directive is now in place, there are still many areas
which require further interpretation. We continue to work with the Prudential Regulation Authority on shaping the outcome to ensure that the
practical details of
Solvency II, including the final implementing measures, are both workable and effective.
On an economic capital basis12 our surplus at 31 December 2014 of
£9.7 billion (2013: £11.3 billion) is equivalent to an economic capital ratio of 218 per cent (2013: 257 per cent). These results are based on outputs from our Solvency II internal model, which has not yet been approved by the Prudential
Regulation Authority. The results assume US equivalence, place no restrictions on the economic value of overseas surplus, and incorporate a number of other working assumptions. Certain aspects of the methodology and assumptions underpinning these
results will differ from those which are applied in obtaining final Solvency II Pillar I internal model approval. The eventual Solvency II Pillar I ratio, therefore, remains uncertain and is expected to be lower than our economic capital ratio.
Group Chief Risk Officer’s report on the risks facing our business and our capital strength page 51
Dividend
The Board has decided to rebase the full-year dividend upwards by 10 per cent,
reflecting the 2014 financial performance of the Group. In line with this, the directors recommend a final dividend of 25.74 pence per share (2013: 23.84 pence), which brings the total dividend for the year to 36.93 pence (2013: 33.57 pence). This
rebase has been made possible by the continued exceptionally strong performance of the Group.
Although the Board has been able to recommend such a rebase in 2014,
the Group’s dividend policy remains unchanged. The Board will maintain its focus on delivering a growing dividend from this new higher base, which will continue to be determined after taking into account the Group’s financial flexibility
and our assessment of opportunities to generate attractive returns by investing in specific areas of the business. The Board believes that in the medium term a dividend cover of around two times is appropriate.
Full-year dividend
33.57 36.93 +10% 29.19 23.85 25.19
2010 2011 2012 2013 2014
Prudential plc Annual Report 2014 13 Outlook 2014 was a successful year for the Group, where the strength and focus of our teams and of our businesses enabled us to deliver good financial and operational progress and maintain a robust capital position, despite a number of challenges both globally and locally. It is clear that we are operating in a period of considerable change. 2015 has already seen a continuation of macroeconomic volatility, political upheaval and unexpected shifts in central bank positioning, with the uncertainty of election outcomes in many countries in Europe, including in the UK, still to come before the end of the year. As a result, investment markets generally remain cautious on the global outlook, reflected in further declines in long-term interest rates in most of the major economies in early 2015. The persistently low level of interest rates is a challenge for insurance companies. However, in recent years we have positioned the Group through proactive actions on product mix, pricing and our balance sheet to mitigate the negative effects of the low interest rate environment and continue to grow our earnings. We have had the same strategy since 2009 and it has served us well. We continue to execute with discipline and purpose and we believe our strategy and operating principles enable us to deliver relative outperformance across the cycle, as evidenced during the financial crisis. Asia, with its strong economic growth, young and growing population with savings and protection needs, and low levels of insurance penetration, continues to represent the most attractive opportunity in our industry today and therefore remains the primary focus o our profitable growth ambitions. Our established, growing multi-distribution platform puts us in a strong position to continue to capture profitably the opportunities available to us in Asia, while the breadth of our franchise, by geography, product and channel, provides us with the resilience that has allowed us to achieve relative outperformance through the cycle, even when individual countries presented short-term challenges. We will continue to invest in enhancing our agency and bancassurance distribution capabilities, to ensure our customers have effective advice-led access to our products. This was most recently evidenced by the renewal in 2014 of our pan-regional relationship with Standard Chartered Bank for another 15 years. The strong underlying fundamentals of economic growth and increasing affluence in Asia, and the quality of our products, people and distribution, remain powerful drivers of our ability to generate profitable growth while delivering value for our customers. In the US and the UK, we continue to utilise our established market position, distribution strength and distinctive products to ensure the delivery of earnings and cash, with strict allocation of capital to segments of the market that offer higher, capital-efficient margins. The UK life insurance market has been subject to significant reform, the ramifications of which are still playing out, but which we believe will ultimately lead to greater customer demand for savings and retirement solutions and create new opportunities for Prudential UK and M&G to leverage their existing expertise. We remain confident in our ability to produce profitable growth over the long term and to continue to create value for our customers and shareholders. It has been a privilege and a pleasure to lead Prudential, one of the iconic companies in UK financial services. We have successfully navigated some challenging times, including the global financial crisis, and have emerged with four profitable and strongly cash-generative businesses. I owe an enormous debt of gratitude to the staff and agents of Prudential around the world who have made these achievements possible and I want to thank them personally for their hard work and dedication. I leave the Group in good shape and look forward to seeing shareholders at my final Annual General Meeting as Group Chief Executive in May. Tidjane Thiam Group Chief Executive Notes 1 The comparative results referenced above and elsewhere in this report have been prepared using constant exchange rates basis except where otherwise stated. Comparative results on an actual exchange rate basis are also shown in financial tables in the Chief Financial Officer’s report on our 2014 financial performance. 2 Including Prudential Capital. 3 The 2014 EEV results of the Group are presented on a post-tax basis and, accordingly, 2013 results are shown on a comparable basis. 4 Annual Premium Equivalent (APE) sales comprise regular premium sales plus one-tenth of single premium insurance sales. 5 ‘Sweet spot’ markets are Indonesia, Singapore, Hong Kong, Malaysia, Philippines, Vietnam and Thailand. 6 Before allowing for final dividend. 7 Underlying free surplus generation comprises underlying free surplus released from long-term business (net of investment in new business) and that generated from asset management operations. The 2012 comparative is based on the retrospective application of new and amended accounting standards and excludes the 2012 one-off gain of £51 million from the sale of the Group’s holding in China Life Insurance Company of Taiwan. 8 Asia 2012 IFRS operating profit of £924 million is based on the retrospective application of new and amended accounting standards as at 31 December 2013, and excludes the 2012 one-off gain of £51 million from the sale of the Group’s holding in China Life Insurance Company of Taiwan. 9 Based on AAJI statistics to 30 September 2014. 10 Source: Lipper FMI, FundFile as of 31 December 2014. 11 Excluding performance fees, carried interest and share of profits from associate entity, PPM South Africa. 12 The methodology and assumptions used in calculating the economic capital results are set out in note II (c) of Additional unaudited financial information. The economic capital ratio is based on outputs from the Group’s Solvency II internal model which will be subject to Prudential Regulation Authority review and approval before its formal adoption in 2016. We remain on track to submit our Solvency II internal model to the Prudential Regulation Authority for approval in 2015 but given the degree of uncertainty remaining these economic capital disclosures should not be interpreted as outputs from an approved internal model. Group overview Group Chief Executive’s report

14 Prudential plc Annual Report 2014
Prudential plc Annual Report 2014 15 Section 2 Strategic report 16 Our world 18 Our strategy and operating principles 19 How our business works 20 Measuring our performance 22 Our businesses and their performance 22 Asia 27 United States 31 United Kingdom 35 Asset management 39 Chief Financial Officer’s report on our 2014 financial performance 51 Group Chief Risk Officer’s report on the risks facing our business and our capital strength 61 Corporate responsibility review Strategic report 2
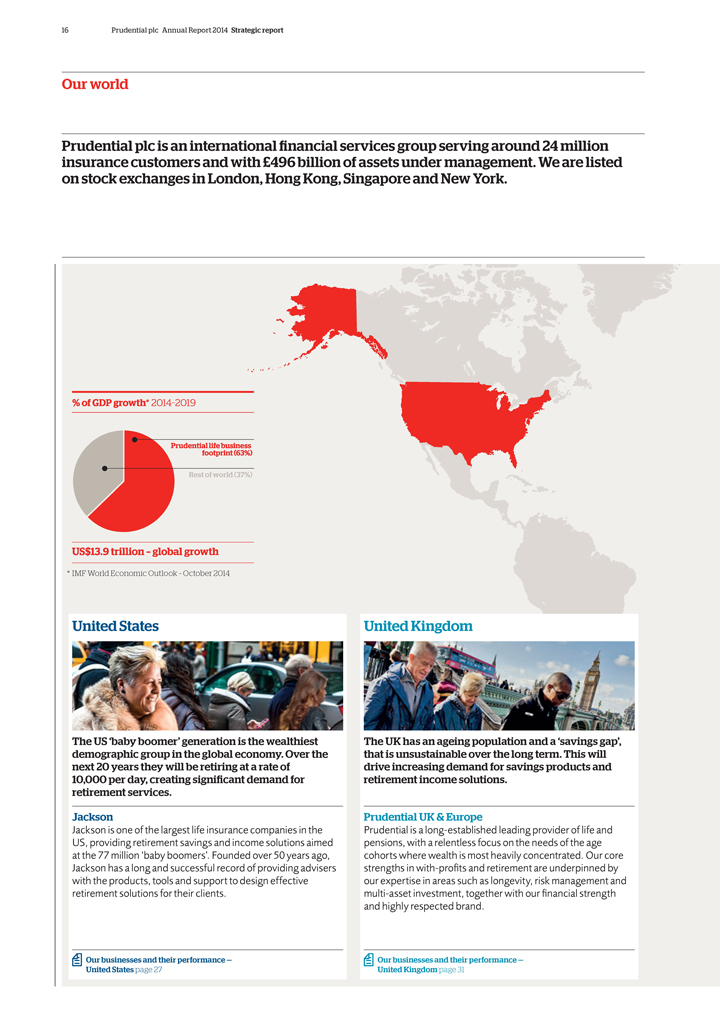
16 Prudential plc Annual Report 2014 Strategic report Our world Prudential plc is an international financial services group serving around 24 million insurance customers and with £496 billion of assets under management. We are listed on stock exchanges in London, Hong Kong, Singapore and New York. % of GDP growth* 2014_2019 Prudential footprint life business (63%) Rest of world (37%) US$13.9 trillion – global growth * IMF World Economic Outlook – October 2014 United States The US ‘baby boomer’ generation is the wealthiest demographic group in the global economy. Over the next 20 years they will be retiring at a rate of 10,000 per day, creating significant demand for retirement services. Jackson Jackson is one of the largest life insurance companies in the US, providing retirement savings and income solutions aimed at the 77 million ‘baby boomers’. Founded over 50 years ago, Jackson has a long and successful record of providing advisers with the products, tools and support to design effective retirement solutions for their clients. Our businesses and their performance — United States page 27 United Kingdom The UK has an ageing population and a ‘savings gap’, that is unsustainable over the long term. This will drive increasing demand for savings products and retirement income solutions. Prudential UK & Europe Prudential is a long-established leading provider of life and pensions, with a relentless focus on the needs of the age cohorts where wealth is most heavily concentrated. Our core strengths in with-profits and retirement are underpinned by our expertise in areas such as longevity, risk management and multi-asset investment, together with our financial strength and highly respected brand. Our businesses and their performance — United Kingdom page 31
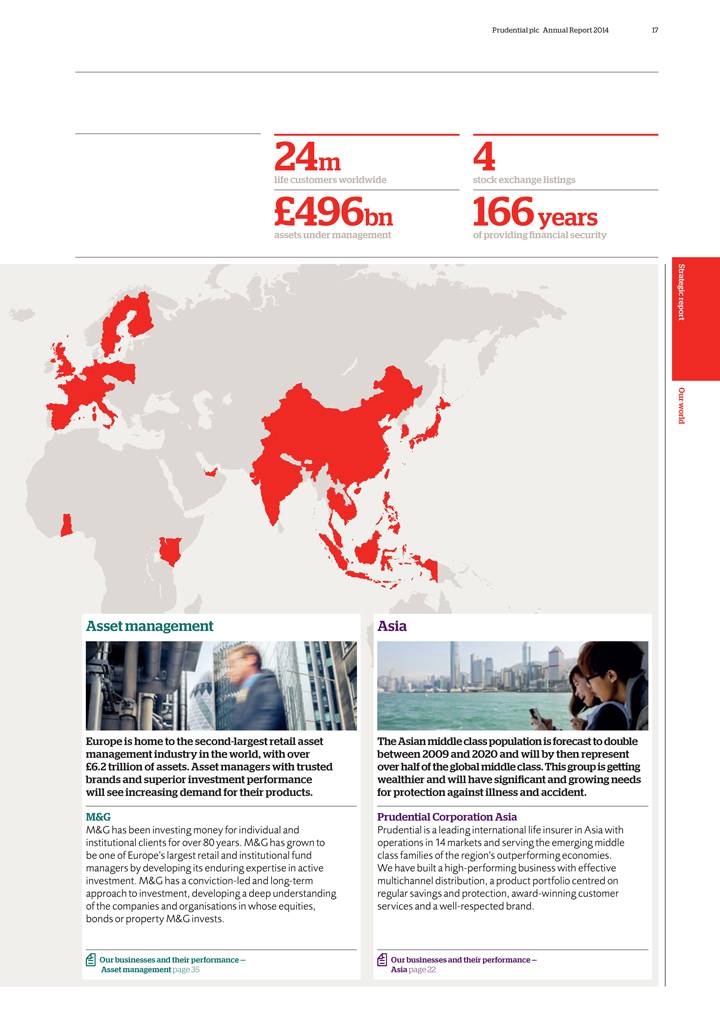
Prudential plc Annual Report 2014 17 24m life customers worldwide £496bn assets under management 4 stock exchange listings 166 years of providing financial security Asset management Europe is home to the second-largest retail asset management industry in the world, with over £6.2 trillion of assets. Asset managers with trusted brands and superior investment performance will see increasing demand for their products. M&G M&G has been investing money for individual and institutional clients for over 80 years. M&G has grown to be one of Europe’s largest retail and institutional fund managers by developing its enduring expertise in active investment. M&G has a conviction-led and long-term approach to investment, developing a deep understanding of the companies and organisations in whose equities, bonds or property M&G invests. Our businesses and their performance — Asset management page 35 Asia The Asian middle class population is forecast to double between 2009 and 2020 and will by then represent over half of the global middle class. This group is getting wealthier and will have significant and growing needs for protection against illness and accident. Prudential Corporation Asia Prudential is a leading international life insurer in Asia with operations in 14 markets and serving the emerging middle class families of the region’s outperforming economies. We have built a high-performing business with effective multichannel distribution, a product portfolio centred on regular savings and protection, award-winning customer services and a well-respected brand. Our businesses and their performance — Asia page 22 Strategic report Our world
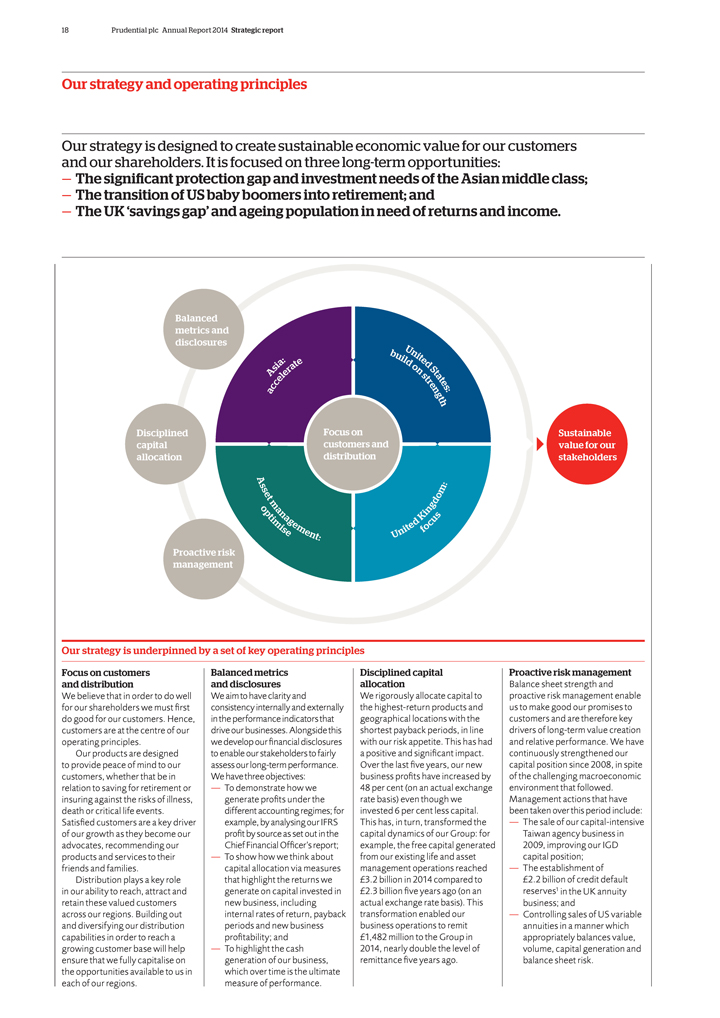
18 Prudential plc Annual Report 2014 Strategic report Our strategy and operating principles Our strategy is designed to create sustainable economic value for our customers and our shareholders. It is focused on three long-term opportunities: — The significant protection gap and investment needs of the Asian middle class; — The transition of US baby boomers into retirement; and — The UK ‘savings gap’ and ageing population in need of returns and income. Balanced metrics and disclosures Disciplined capital allocation Proactive risk management Focus on customers and distribution Asia: accelerate United States: build on strength United Kingdom: focus Asset Management: optimise Sustainable value for our stakeholders Our strategy is underpinned by a set of key operating principles Focus on customers and distribution We believe that in order to do well for our shareholders we must first do good for our customers. Hence, customers are at the centre of our operating principles. Our products are designed to provide peace of mind to our customers, whether that be in relation to saving for retirement or insuring against the risks of illness, death or critical life events. Satisfied customers are a key driver of our growth as they become our advocates, recommending our products and services to their friends and families. Distribution plays a key role in our ability to reach, attract and retain these valued customers across our regions. Building out and diversifying our distribution capabilities in order to reach a growing customer base will help ensure that we fully capitalise on the opportunities available to us in each of our regions. Balanced metrics and disclosures We aim to have clarity and consistency internally and externally in the performance indicators that drive our businesses. Alongside this we develop our financial disclosures to enable our stakeholders to fairly assess our long-term performance. We have three objectives: — To demonstrate how we generate profits under the different accounting regimes; for example, by analysing our IFRS profit by source as set out in the Chief Financial Officer’s report; — To show how we think about capital allocation via measures that highlight the returns we generate on capital invested in new business, including internal rates of return, payback periods and new business profitability; and — To highlight the cash generation of our business, which over time is the ultimate measure of performance. Disciplined capital allocation We rigorously allocate capital to the highest-return products and geographical locations with the shortest payback periods, in line with our risk appetite. This has had a positive and significant impact. Over the last five years, our new business profits have increased by 48 per cent (on an actual exchange rate basis) even though we invested 6 per cent less capital. This has, in turn, transformed the capital dynamics of our Group: for example, the free capital generated from our existing life and asset management operations reached £3.2 billion in 2014 compared to £2.3 billion five years ago (on an actual exchange rate basis). This transformation enabled our business operations to remit £1,482 million to the Group in 2014, nearly double the level of remittance five years ago. Proactive risk management Balance sheet strength and proactive risk management enable us to make good our promises to customers and are therefore key drivers of long-term value creation and relative performance. We have continuously strengthened our capital position since 2008, in spite of the challenging macroeconomic environment that followed. Management actions that have been taken over this period include: — The sale of our capital-intensive Taiwan agency business in 2009, improving our IGD capital position; — The establishment of £2.2 billion of credit default reserves1 in the UK annuity business; and — Controlling sales of US variable annuities in a manner which appropriately balances value, volume, capital generation and balance sheet risk.
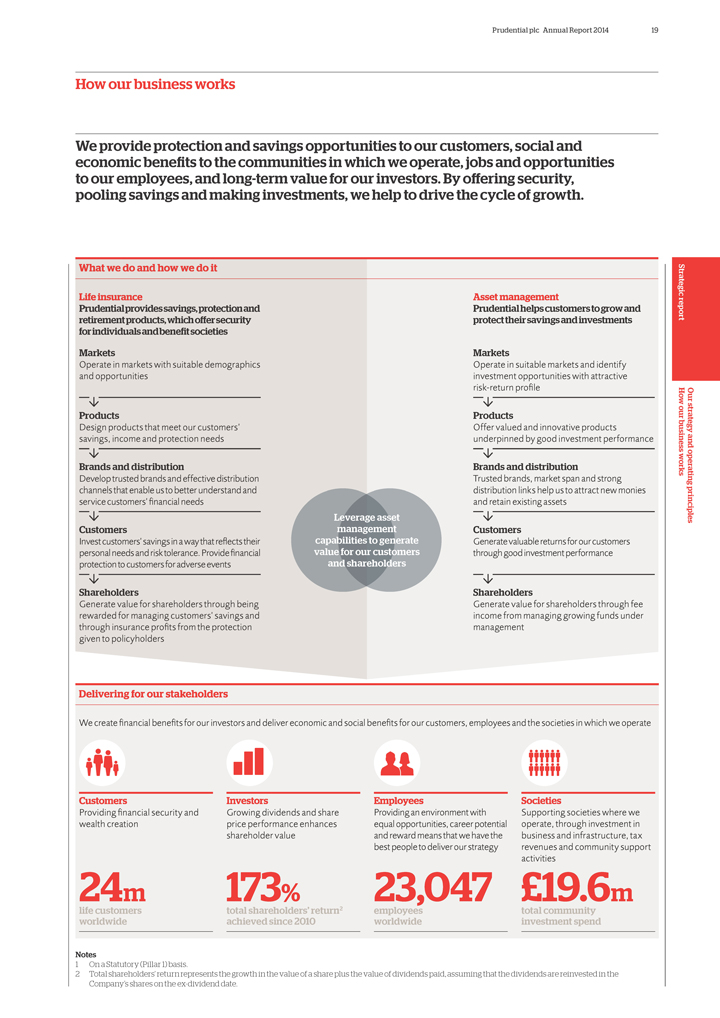
Prudential plc Annual Report 2014 19 How our business works We provide protection and savings opportunities to our customers, social and economic benefits to the communities in which we operate, jobs and opportunities to our employees, and long-term value for our investors. By offering security, pooling savings and making investments, we help to drive the cycle of growth. What we do and how we do it Life insurance Prudential provides savings, protection and retirement products, which offer security for individuals and benefit societies Markets Operate in markets with suitable demographics and opportunities Products Design products that meet our customers’ savings, income and protection needs Brands and distribution Develop trusted brands and effective distribution channels that enable us to better understand and service customers’ financial needs Customers Invest customers’ savings in a way that reflects their personal needs and risk tolerance. Provide financial protection to customers for adverse events Shareholders Generate value for shareholders through being rewarded for managing customers’ savings and through insurance profits from the protection given to policyholders Leverage asset management capabilities to generate value for our customers and shareholders Asset management Prudential helps customers to grow and protect their savings and investments Markets Operate in suitable markets and identify investment opportunities with attractive risk-return profile Products Offer valued and innovative products underpinned by good investment performance Brands and distribution Trusted brands, market span and strong distribution links help us to attract new monies and retain existing assets Customers Generate valuable returns for our customers through good investment performance Shareholders Generate value for shareholders through fee income from managing growing funds under management Delivering for our stakeholders We create financial benefits for our investors and deliver economic and social benefits for our customers, employees and the societies in which we operate Customers Providing financial security and wealth creation 24m life customers worldwide Investors Growing dividends and share price performance enhances shareholder value 173% total shareholders’ return2 achieved since 2010 Employees Providing an environment with equal opportunities, career potential and reward means that we have the best people to deliver our strategy 23,047 employees worldwide Societies Supporting societies where we operate, through investment in business and infrastructure, tax revenues and community support activities £19.6m total community investment spend Notes 1 On a Statutory (Pillar 1) basis. 2 Total shareholders’ return represents the growth in the value of a share plus the value of dividends paid, assuming that the dividends are reinvested in the Company’s shares on the ex-dividend date. Strategic report Our strategy and operating principles How our business works
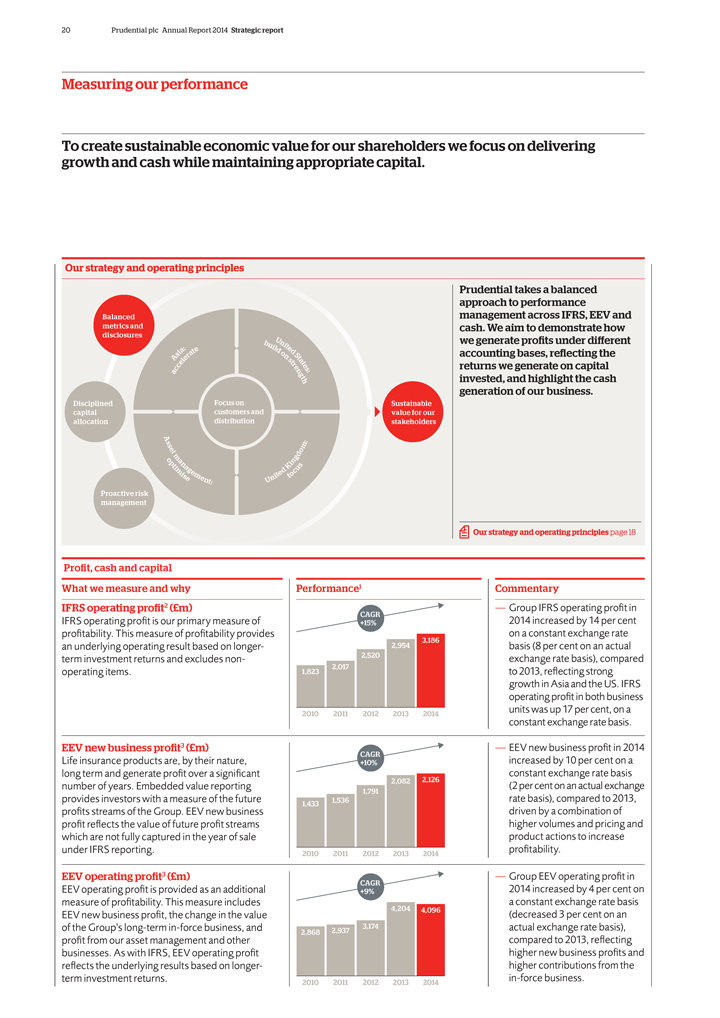
20 Prudential plc Annual Report 2014 Strategic report Measuring our performance To create sustainable economic value for our shareholders we focus on delivering growth and cash while maintaining appropriate capital. Our strategy and operating principles Balanced metrics and disclosures Disciplined capital allocation Proactive risk management Focus on customers and distribution Asia: accelerate United States: build on strength United Kingdom: focus Asset Management: optimize Sustainable value for our stakeholders Prudential takes a balanced approach to performance management across IFRS, EEV and cash. We aim to demonstrate how we generate profits under different accounting bases, reflecting the returns we generate on capital invested, and highlight the cash generation of our business. Our strategy and operating principles page 18 Profit, cash and capital What we measure and why IFRS operating profit2 (£m) IFRS operating profit is our primary measure of profitability. This measure of profitability provides an underlying operating result based on longer-term investment returns and excludes non-operating items. EEV new business profit3 (£m) Life insurance products are, by their nature, long term and generate profit over a significant number of years. Embedded value reporting provides investors with a measure of the future profits streams of the Group. EEV new business profit reflects the value of future profit streams which are not fully captured in the year of sale under IFRS reporting. EEV operating profit3 (£m) EEV operating profit is provided as an additional measure of profitability. This measure includes EEV new business profit, the change in the value of the Group’s long-term in-force business, and profit from our asset management and other businesses. As with IFRS, EEV operating profit reflects the underlying results based on longer-term investment returns. Performance1 CAGR +15% 3,186 2,954 2,520 1,823 2,017 2010 2011 2012 2013 2014 CAGR +10% 1,433 1,536 1,791 2,082 2,126 2010 2011 2012 2013 2014 CAGR +9% 2,868 2,937 3,174 4,204 4,096 2010 2011 2012 2013 2014 Commentary — Group IFRS operating profit in 2014 increased by 14 per cent on a constant exchange rate basis (8 per cent on an actual exchange rate basis), compared to 2013, reflecting strong growth in Asia and the US. IFRS operating profit in both business units was up 17 per cent, on a constant exchange rate basis. — EEV new business profit in 2014 increased by 10 per cent on a constant exchange rate basis (2 per cent on an actual exchange rate basis), compared to 2013, driven by a combination of higher volumes and pricing and product actions to increase profitability. — Group EEV operating profit in 2014 increased by 4 per cent on a constant exchange rate basis (decreased 3 per cent on an actual exchange rate basis), compared to 2013, reflecting higher new business profits and higher contributions from the in-force business.
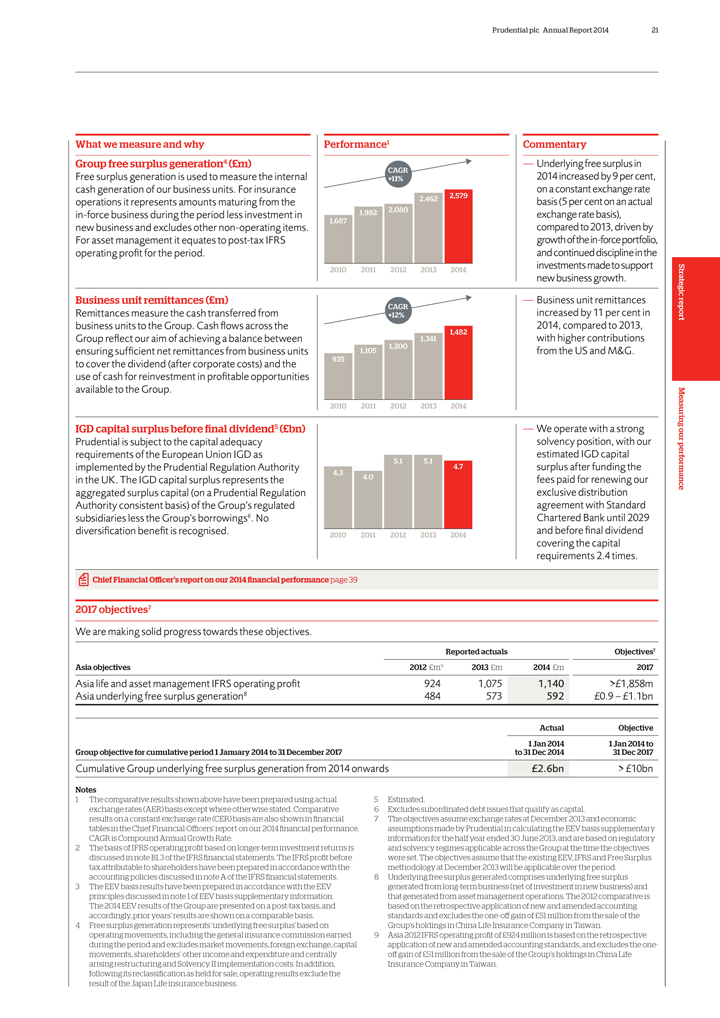
What we measure and why Group free surplus generation4 (£m) Free surplus generation is used to measure the internal cash generation of our business units. For insurance operations it represents amounts maturing from the in-force business during the period less investment in new business and excludes other non-operating items. For asset management it equates to post-tax IFRS operating profit for the period. Business unit remittances (£m) Remittances measure the cash transferred from business units to the Group. Cash flows across the Group reflect our aim of achieving a balance between ensuring sufficient net remittances from business units to cover the dividend (after corporate costs) and the use of cash for reinvestment in profitable opportunities available to the Group. IGD capital surplus before final dividend5 (£bn) Prudential is subject to the capital adequacy requirements of the European Union IGD as implemented by the Prudential Regulation Authority in the UK. The IGD capital surplus represents the aggregated surplus capital (on a Prudential Regulation Authority consistent basis) of the Group’s regulated subsidiaries less the Group’s borrowings6. No diversification benefit is recognised. Performance1 CAGR +11% 2,462 2,579 1,982 2,080 1,687 2010 2011 2012 2013 2014 CAGR +12% 1,341 1,482 1,200 1,105 935 2010 2011 2012 2013 2014 5.1 5.1 4.7 4.3 4.0 2010 2011 2012 2013 2014 Commentary — Underlying free surplus in 2014 increased by 9 per cent, on a constant exchange rate basis (5 per cent on an actual exchange rate basis), compared to 2013, driven by growth of the in-force portfolio, and continued discipline in the investments made to support new business growth. Business unit remittances increased by 11 per cent in 2014, compared to 2013, with higher contributions from the US and M&G. We operate with a strong solvency position, with our estimated IGD capital surplus after funding the fees paid for renewing our exclusive distribution agreement with Standard Chartered Bank until 2029 and before final dividend covering the capital requirements 2.4 times. 2017 objectives7 We are making solid progress towards these objectives. Reported actuals Objectives7 Asia objectives 2012 £m9 2013 £m 2014 £m 2017 Asia life and asset management IFRS operating profit 924 1,075 1,140 >£1,858m Asia underlying free surplus generation8 484 573 592 £0.9 – £1.1bn Actual Objective 1 Jan 2014 1 Jan 2014 to Group objective for cumulative period 1 January 2014 to 31 December 2017 to 31 Dec 2014 31 Dec 2017 Cumulative Group underlying free surplus generation from 2014 onwards £2.6bn > £10bn Chief Financial Officer’s report on our 2014 financial performance page 39 Notes 1 The comparative results shown above have been prepared using actual exchange rates (AER) basis except where otherwise stated. Comparative results on a constant exchange rate (CER) basis are also shown in financial tables in the Chief Financial Officers’ report on our 2014 financial performance. CAGR is Compound Annual Growth Rate. 2 The basis of IFRS operating profit based on longer-term investment returns is discussed in note B1.3 of the IFRS financial statements. The IFRS profit before tax attributable to shareholders have been prepared in accordance with the accounting policies discussed in note A of the IFRS financial statements. 3 The EEV basis results have been prepared in accordance with the EEV principles discussed in note 1 of EEV basis supplementary information. The 2014 EEV results of the Group are presented on a post-tax basis, and accordingly, prior years’ results are shown on a comparable basis. 4 Free surplus generation represents ‘underlying free surplus’ based on operating movements, including the general insurance commission earned during the period and excludes market movements, foreign exchange, capital movements, shareholders’ other income and expenditure and centrally arising restructuring and Solvency II implementation costs. In addition, following its reclassification as held for sale, operating results exclude the result of the Japan Life insurance business. Estimated. Excludes subordinated debt issues that qualify as capital. The objectives assume exchange rates at December 2013 and economic assumptions made by Prudential in calculating the EEV basis supplementary information for the half year ended 30 June 2013, and are based on regulatory and solvency regimes applicable across the Group at the time the objectives were set. The objectives assume that the existing EEV, IFRS and Free Surplus methodology at December 2013 will be applicable over the period. Underlying free surplus generated comprises underlying free surplus generated from long-term business (net of investment in new business) and that generated from asset management operations. The 2012 comparative is based on the retrospective application of new and amended accounting standards and excludes the one-off gain of £51 million from the sale of the Group’s holdings in China Life Insurance Company in Taiwan. Asia 2012 IFRS operating profit of £924 million is based on the retrospective application of new and amended accounting standards, and excludes the one- off gain of £51 million from the sale of the Group’s holdings in China Life Insurance Company in Taiwan.
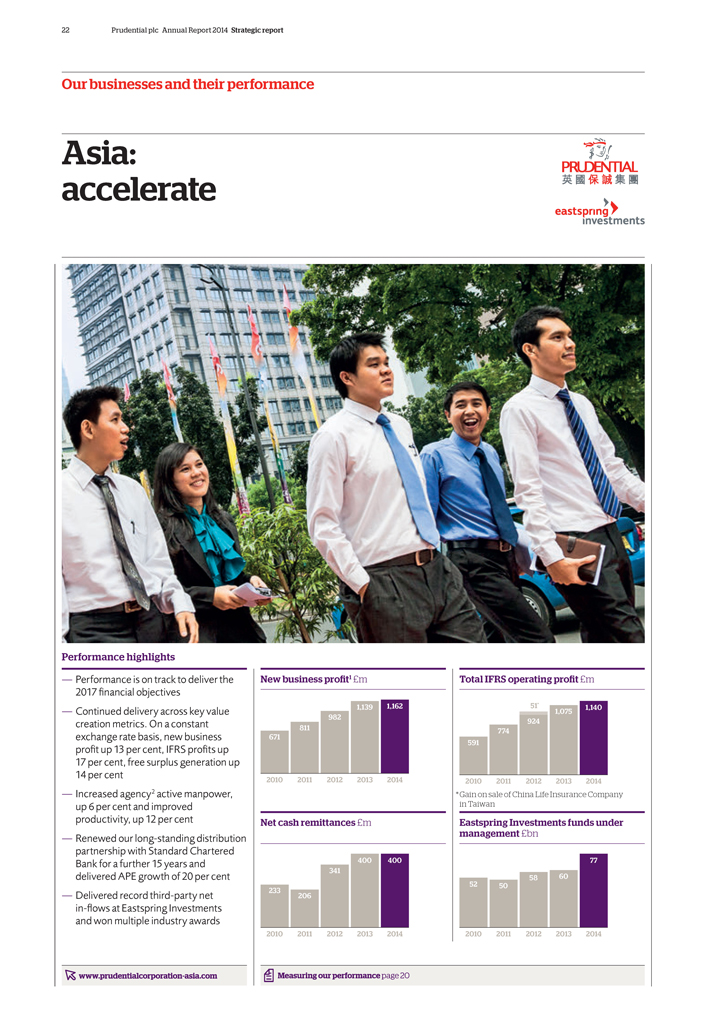
22 Prudential plc Annual Report 2014 Strategic report Our businesses and their performance Asia: accelerate Performance highlights Performance is on track to deliver the 2017 financial objectives Continued delivery across key value creation metrics. On a constant exchange rate basis, new business profit up 13 per cent, IFRS profits up per cent, free surplus generation up per cent Increased agency2 active manpower, up 6 per cent and improved productivity, up 12 per cent Renewed our long-standing distribution partnership with Standard Chartered Bank for a further 15 years and delivered APE growth of 20 per cent Delivered record third-party net in-flows at Eastspring Investments and won multiple industry awards www.prudentialcorporation-asia.com New business profit1 £m 1,139 1,162 982 811 671 2010 2011 2012 2013 2014 Net cash remittances £m 400 400 341 233 206 2010 2011 2012 2013 2014 Measuring our performance page 20 Total IFRS operating profit £m 51* 1,140 1,075 924 774 591 2010 2011 2012 2013 2014 *Gain on sale of China Life Insurance Company in Taiwan Eastspring Investments funds under management £bn 77 58 60 52 50 2010 2011 2012 2013 2014 Measuring our performance page 20
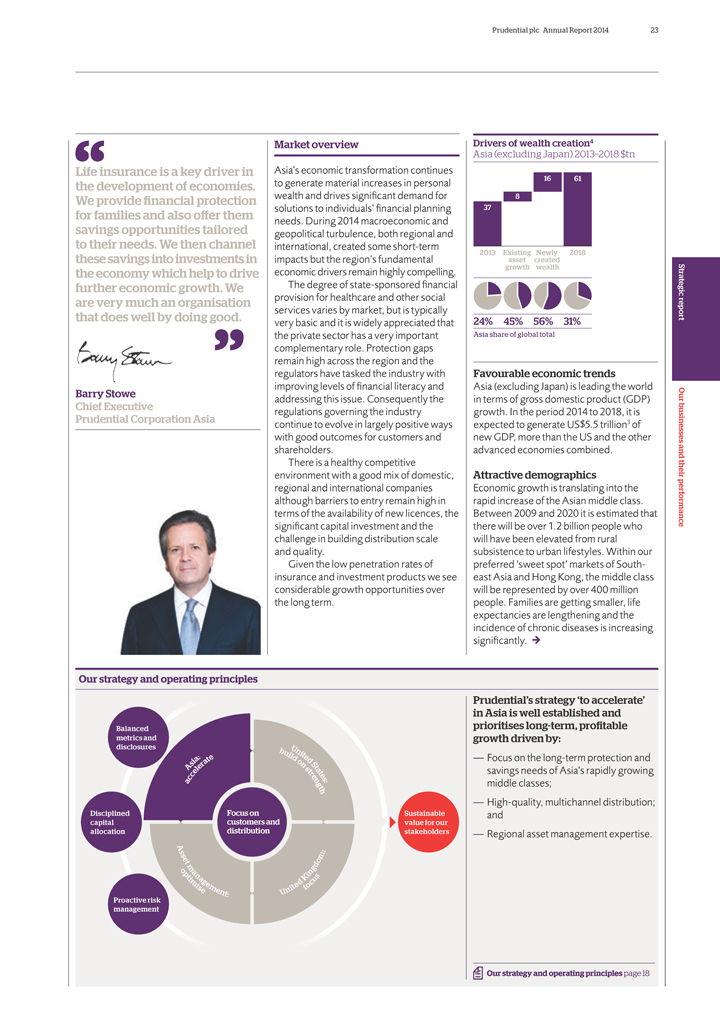
Life insurance is a key driver in the development of economies. We provide financial protection for families and also offer them savings opportunities tailored to their needs. We then channel these savings into investments in the economy which help to drive further economic growth. We are very much an organisation that does well by doing good. Barry Stowe Chief Executive Prudential Corporation Asia Market overview Asia’s economic transformation continues to generate material increases in personal wealth and drives significant demand for solutions to individuals’ financial planning needs. During 2014 macroeconomic and geopolitical turbulence, both regional and international, created some short-term impacts but the region’s fundamental economic drivers remain highly compelling. The degree of state-sponsored financial provision for healthcare and other social services varies by market, but is typically very basic and it is widely appreciated that the private sector has a very important complementary role. Protection gaps remain high across the region and the regulators have tasked the industry with improving levels of financial literacy and addressing this issue. Consequently the regulations governing the industry continue to evolve in largely positive ways with good outcomes for customers and shareholders. There is a healthy competitive environment with a good mix of domestic, regional and international companies although barriers to entry remain high in terms of the availability of new licences, the significant capital investment and the challenge in building distribution scale and quality. Given the low penetration rates of insurance and investment products we see considerable growth opportunities over the long term. Drivers of wealth creation4 Asia (excluding Japan) 2013–2018 $tn 16 61 8 37 2013 Existing asset created Newly 2018 growth wealth 24% 45% 56% 31% Asia share of global total Favourable economic trends Asia (excluding Japan) is leading the world in terms of gross domestic product (GDP) growth. In the period 2014 to 2018, it is expected to generate US$5.5 trillion3 of new GDP, more than the US and the other advanced economies combined. Attractive demographics Economic growth is translating into the rapid increase of the Asian middle class. Between 2009 and 2020 it is estimated that there will be over 1.2 billion people who will have been elevated from rural subsistence to urban lifestyles. Within our preferred ‘sweet spot’ markets of Southeast Asia and Hong Kong, the middle class will be represented by over 400 million people. Families are getting smaller, life expectancies are lengthening and the incidence of chronic diseases is increasing significantly. Our strategy and operating principles Balanced metrics and disclosures Disciplined Focus on Sustainable capital customers and value for our allocation distribution stakeholders Proactive risk management Prudential’s strategy ‘to accelerate’ in Asia is well established and prioritises long-term, profitable growth driven by: — Focus on the long-term protection and savings needs of Asia’s rapidly growing middle classes; — High-quality, multichannel distribution; and — Regional asset management expertise. Sustainable value for our stakeholders Balanced metrics and disclosures
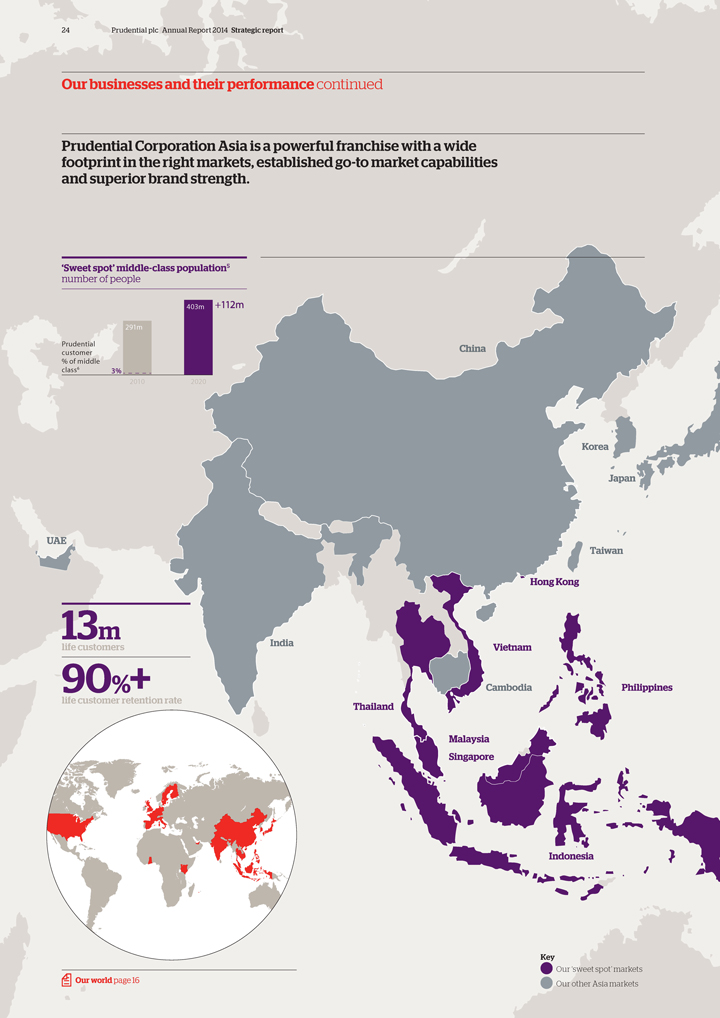
24 Prudential plc Annual Report 2014 Strategic report Our businesses and their performance continued Prudential Corporation Asia is a powerful franchise with a wide footprint in the right markets, established go-to market capabilities and superior brand strength. ‘Sweet spot’ middle-class population5 number of people 403m +112m 291m Prudential customer % of middle class6 3% 2010 2020 13m life customers 90%+ life customer retention rate Key Our ‘sweet spot’ markets Our other Asia markets Our world page 16

Our ‘sweet spot’ markets Prudential plc Annual Report 2014 25 Unmatched platform with scale and geographic reach — 371 agency offices in 152 cities — Largest agency force — Hi-tech agency training and licensing — ‘All-in-one’ product solution combines protection, investment and savings — Conventional and Takaful options — Value-add services such as ‘PRUHospital Friends’ Professional agency complemented by a distinctive range of bank partners — Market-leading PruShield product drives customer acquisition — Number one for regular premium new business — Expanding high net worth segment Resilient distribution platform — Leading insurer with scale in agency and bank distribution — 2014 saw 24 per cent increase in active manpower and a 24 per cent increase in productivity — Successful partnership with Standard Chartered Bank now in 17th year — Product innovations drive new customer acquisition and repeat sales Well positioned to capture emerging opportunity in Bumi segment — Most productive agency7 in the industry — Pioneer in linked policies with riders for flexible savings and protection — Over 31 per cent7 market share of Takaful (Sharia compliant) life business Ranked* 1 Ranked* 1 Ranked* 3 Ranked* 1 www.prudential.co.id www.prudential.com.sg www.prudential.com.hk www.prudential.com.my Rapidly scaling up distribution — More than doubled agency size in less than two years — Expanding across country — Improving efficiency – 80 per cent of policies now processed ‘straight through’ — Market leader in linked-with-protection policies Long-term industry leader — Industry number one since 2007 — 32 per cent of industry’s agents, productivity increased by 9 per cent in 2014 — Building bancassurance; eight partners and access to 260 branches Excellent bancassurance platform — Doubled market share following acquisition of Thanachart Life in 2013 — Access to 800 branches nationwide with partners – SCB, UOB and Thanachart Bank Philippines Vietnam Thailand Indonesia Singapore Hong Kong Malaysia Ranked* 2 Ranked* 1 Ranked* 8 www.prulifeuk.com.ph www.prudential.com.vn www.prudential.co.th Notes 1 The 2014 EEV results of the Group are presented on a post-tax basis and, accordingly, prior years’ results are shown on a comparable basis. 2 Agency excluding India. 3 Prudential estimates based on IMF data – October 2013. 4 Source: BCG Global Wealth 2014 – Riding a wave of growth. 5 Asian Development Bank (ADB) – Key indicators for Asia and the Pacific 2010. Prudential estimates. 6 Prudential customers as at 30 September 2014. 7 Based on APE sales. Source: LIAM and ISM. Prudential’s rank in insurance market by new business APE. Based on formal (competitors’ results releases, local regulators, insurance associations) and informal (industry exchange) market-share data.
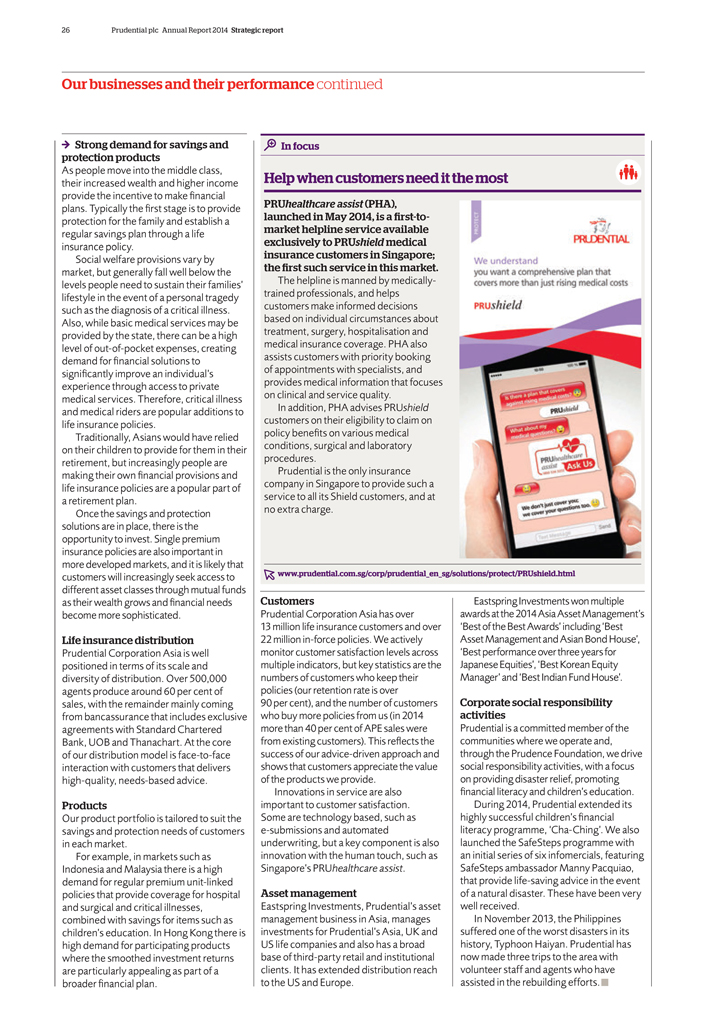
26 Prudential plc Annual Report 2014 Strategic report Our businesses and their performance continued Strong demand for savings and protection products As people move into the middle class, their increased wealth and higher income provide the incentive to make financial plans. Typically the first stage is to provide protection for the family and establish a regular savings plan through a life insurance policy. Social welfare provisions vary by market, but generally fall well below the levels people need to sustain their families’ lifestyle in the event of a personal tragedy such as the diagnosis of a critical illness. Also, while basic medical services may be provided by the state, there can be a high level of out-of-pocket expenses, creating demand for financial solutions to significantly improve an individual’s experience through access to private medical services. Therefore, critical illness and medical riders are popular additions to life insurance policies. Traditionally, Asians would have relied on their children to provide for them in their retirement, but increasingly people are making their own financial provisions and life insurance policies are a popular part of a retirement plan. Once the savings and protection solutions are in place, there is the opportunity to invest. Single premium insurance policies are also important in more developed markets, and it is likely that customers will increasingly seek access to different asset classes through mutual funds as their wealth grows and financial needs become more sophisticated. Life insurance distribution Prudential Corporation Asia is well positioned in terms of its scale and diversity of distribution. Over 500,000 agents produce around 60 per cent of sales, with the remainder mainly coming from bancassurance that includes exclusive agreements with Standard Chartered Bank, UOB and Thanachart. At the core of our distribution model is face-to-face interaction with customers that delivers high-quality, needs-based advice. Products Our product portfolio is tailored to suit the savings and protection needs of customers in each market. For example, in markets such as Indonesia and Malaysia there is a high demand for regular premium unit-linked policies that provide coverage for hospital and surgical and critical illnesses, combined with savings for items such as children’s education. In Hong Kong there is high demand for participating products where the smoothed investment returns are particularly appealing as part of a broader financial plan. In focus Help when customers need it the most PRU healthcare assist (PHA), launched in May 2014, is a first-to-market helpline service available exclusively to PRU shield medical insurance customers in Singapore; the first such service in this market The helpline is manned by medically trained professionals, and helps customers make informed decisions based on individual circumstances about treatment, surgery, hospitalisation and medical insurance coverage. PHA also assists customers with priority booking of appointments with specialists, and provides medical information that focuses on clinical and service quality. In addition, PHA advises PRUshield customers on their eligibility to claim on policy benefits on various medical conditions, surgical and laboratory procedures. Prudential is the only insurance company in Singapore to provide such a service to all its Shield customers, and at no extra charge. www.prudential.com.sg/corp/prudential_en_sg/solutions/protect/PRUsheild.html Customers Prudential Corporation Asia has over 13 million life insurance customers and over 22 million in-force policies. We actively monitor customer satisfaction levels across multiple indicators, but key statistics are the numbers of customers who keep their policies (our retention rate is over 90 per cent), and the number of customers who buy more policies from us (in 2014 more than 40 per cent of APE sales were from existing customers). This reflects the success of our advice-driven approach and shows that customers appreciate the value of the products we provide. Innovations in service are also important to customer satisfaction. Some are technology based, such as e-submissions and automated underwriting, but a key component is also innovation with the human touch, such as Singapore’s PRUhealthcare assist. Asset management Eastspring Investments, Prudential’s asset management business in Asia, manages investments for Prudential’s Asia, UK and US life companies and also has a broad base of third-party retail and institutional clients. It has extended distribution reach to the US and Europe. Eastspring Investments won multiple awards at the 2014 Asia Asset Management’s ‘Best of the Best Awards’ including ‘Best Asset Management and Asian Bond House’, ‘Best performance over three years for Japanese Equities’, ‘Best Korean Equity Manager’ and ‘Best Indian Fund House’. Corporate social responsibility activities Prudential is a committed member of the communities where we operate and, through the Prudence Foundation, we drive social responsibility activities, with a focus on providing disaster relief, promoting financial literacy and children’s education. During 2014, Prudential extended its highly successful children’s financial literacy programme, ‘Cha-Ching’. We also launched the SafeSteps programme with an initial series of six infomercials, featuring SafeSteps ambassador Manny Pacquiao, that provide life-saving advice in the event of a natural disaster. These have been very well received. In November 2013, the Philippines suffered one of the worst disasters in its history, Typhoon Haiyan. Prudential has now made three trips to the area with volunteer staff and agents who have assisted in the rebuilding efforts. We understand you want a comprehensive plant that covers more than just rising medical costs prushield

United States: build on strength Performance highlights Cash remittance increased by 41 per cent to a record level of £415 million Continued strong returns on shareholder capital across all key financial metrics Elite Access sales of £3,108 million in the second full year after launch, making Jackson the most successful player in the non-guarantee variable annuity market Successfully managed sales of variable annuities with guarantees in line with risk appetite Awarded ‘World Class Certification’ by Service Quality Measurement Group, Inc. and ‘Highest Customer Satisfaction by Industry’ award – the ninth consecutive year of recognition for customer service performance in these two categories www.jackson.com New business profit1 £m 706 694 568 530 495 2010 2011 2012 2013 2014 Net cash remittances £m 415 122* 294 249 200 80 2010 2011 2012 2013 2014 *One-off release of excess surplus Measuring our performance page 20 IFRS operating profit £m 1,302 1,443 1,003 750 675 2010 2011 2012 2013 2014 Growth in statutory admitted assets US$bn 170.9 190.0 142.8 107.6 97.5 2010 2011 2012 2013 2014

28 Prudential plc Annual Report 2014 Strategic report Our businesses and their performance continued “Jackson’s strategy remains focused on providing value to its customers and driving shareholder value while operating within a conservative risk-management framework. This approach has enabled us to successfully navigate the significant macroeconomic and financial market challenges of the last six years and ensured a continuation of our strong performance in 2014.” Mike Wells President and Chief Executive Officer Jackson National Life Insurance Company Market overview ‘Baby boomer’ retirement opportunities The United States is the world’s largest retirement savings market with total assets in the annuity sector of over US$2.6 trillion2. Each year, many of the 77 million ‘baby boomers’ reach retirement age, which is triggering a shift from savings accumulation to retirement income generation of more than US$10 trillion3 of accumulated wealth over the next decade. This demographic transition constitutes a significant opportunity for those companies that are able to provide the ‘baby boomers’ with long-term retirement solutions. US economic environment In 2014, the US economy continued to show signs of improvements, with stronger GDP growth, declining unemployment rates, and evidence of a recovery in the housing market. The S&P 500 Index rose 11 per cent, following a 30 per cent jump in 2013. In late October, the Federal Reserve announced an end to its Quantitative Easing programme due to an improved US economy. As part of quantitative easing, the Federal Reserve purchased trillions of dollars of bonds in order to add more money to the US economy. Despite these signs of strength domestically, longer-dated treasury yields pulled back in 2014, but remained above the lows experienced in 2012. Competitive landscape The market share shift in the US annuity market has slowed down, and Jackson continues to hold the leading position in the industry while generating healthy margins. Variable annuity providers continue to modify their product offerings through reductions in fund availability and increased fees. Several insurers with challenging legacy blocks of variable annuity business continue to implement policy changes to help mitigate the risk of their back book of business, including fee increases on older benefits, changes to the availability of investment options, subsequent premium restrictions on in-force contracts and buyback offers to their existing policyholders. Despite positive demographic trends, these activities have the potential to lead to overall contraction in the industry, and likely further market share adjustments, as customers and distributors seek insurers that offer consistency, stability and financial strength. Regulatory environment The financial services industry continues to deal with a multitude of emerging regulatory initiatives in response to the financial crisis. Many of these broader financial services initiatives specifically impact the insurance industry. Within the insurance industry, we are seeing evolving supervisory structures, new global group supervision standards, focus on the reduction of systemic risk, and amplified focus on enterprise risk management, as well as initiatives in the area of financial reporting. While discussions continue across many initiatives, they are resulting in significant resources being expended across the industry. Finding the appropriate path through all of the regulatory changes clearly remains a challenge. Our strategy and operating principles Balanced metrics and disclosures Disciplined Focus on Sustainable capital customers and value for our allocation distribution stakeholders Proactive risk management Prudential’s strategy of ‘build on strength’ in the US is well established and continues to focus on: Capitalising on the ‘baby boomer’ retirement opportunities; Maintaining a balanced product suite throughout the economic cycle; Streamlining operating platforms, driving further operational efficiencies; and Conservative, economic-based approach to pricing and risk management. Our strategy and operating principles page 18
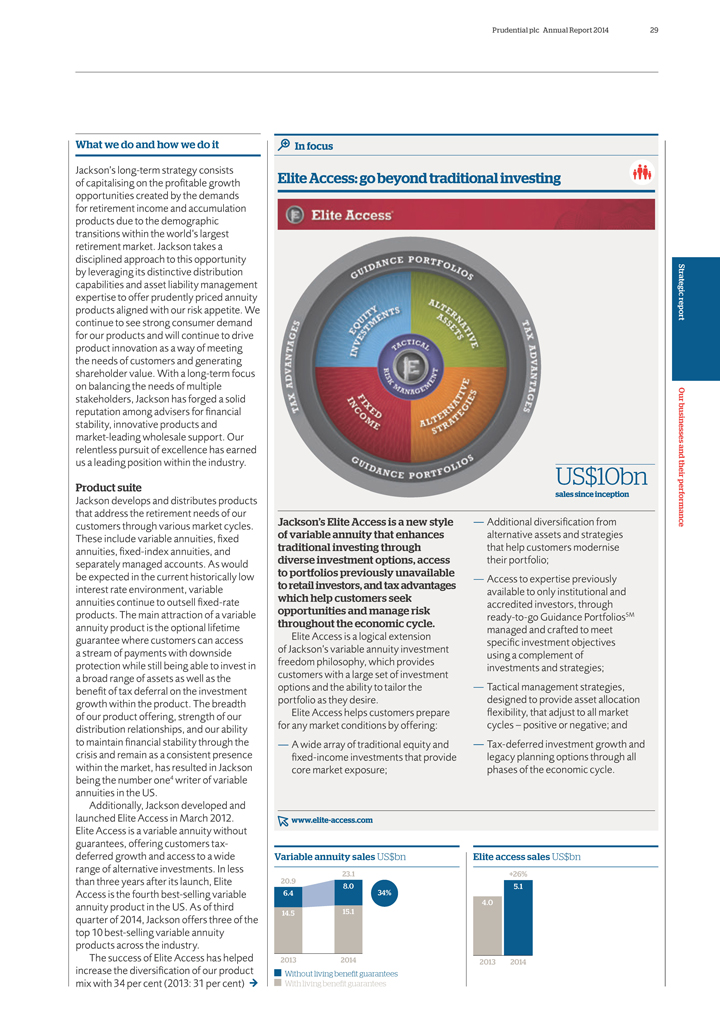
What we do and how we do it Jackson’s long-term strategy consists of capitalising on the profitable growth opportunities created by the demands for retirement income and accumulation products due to the demographic transitions within the world’s largest retirement market. Jackson takes a disciplined approach to this opportunity by leveraging its distinctive distribution capabilities and asset liability management expertise to offer prudently priced annuity products aligned with our risk appetite. We continue to see strong consumer demand for our products and will continue to drive product innovation as a way of meeting the needs of customers and generating shareholder value. With a long-term focus on balancing the needs of multiple stakeholders, Jackson has forged a solid reputation among advisers for financial stability, innovative products and market-leading wholesale support. Our relentless pursuit of excellence has earned us a leading position within the industry. Product suite Jackson develops and distributes products that address the retirement needs of our customers through various market cycles. These include variable annuities, fixed annuities, fixed-index annuities, and separately managed accounts. As would be expected in the current historically low interest rate environment, variable annuities continue to outsell fixed-rate products. The main attraction of a variable annuity product is the optional lifetime guarantee where customers can access a stream of payments with downside protection while still being able to invest in a broad range of assets as well as the benefit of tax deferral on the investment growth within the product. The breadth of our product offering, strength of our distribution relationships, and our ability to maintain financial stability through the crisis and remain as a consistent presence within the market, has resulted in Jackson being the number one4 writer of variable annuities in the US. Additionally, Jackson developed and Additionally, Jackson developed and launched Elite Access in March 2012. Elite Access is a variable annuity without guarantees, offering customers tax-deferred growth and access to a wide range of alternative investments. In less than three years after its launch, Elite Access is the fourth best-selling variable annuity product in the US. As of third quarter of 2014, Jackson offers three of the top 10 best-selling variable annuity products across the industry. The success of Elite Access has helped increase the diversification of our product mix with 34 per cent (2013: 31 per cent) In focus Elite Access: go beyond traditional investing Jackson’s Elite Access is a new style of variable annuity that enhances traditional investing through diverse investment options, access to portfolios previously unavailable to retail investors, and tax advantages which help customers seek opportunities and manage risk throughout the economic cycle. Elite Access is a logical extension of Jackson’s variable annuity investment freedom philosophy, which provides customers with a large set of investment options and the ability to tailor the portfolio as they desire. Elite Access helps customers prepare for any market conditions by offering: — A wide array of traditional equity and fixed-income investments that provide core market exposure; Additional diversification from alternative assets and strategies that help customers modernise their portfolio; — Access to expertise previously available to only institutional and accredited investors, through ready-to-go Guidance PortfoliosSM managed and crafted to meet specific investment objectives using a complement of investments and strategies; — Tactical management strategies, designed to provide asset allocation flexibility, that adjust to all market cycles – positive or negative; and — Tax-deferred investment growth and legacy planning options through all phases of the economic cycle. www.elite-access.com Variable annuity sales US$bn 20.9 23.1 6.4 8.0 34% 14.5 15.1 2013 2014 Without living benefit guarantees With living benefit guarantees Elite access sales US$bn +26% 6.4 5.1 4.0 2013 2014
30 Prudential plc Annual Report 2014 Strategic report Our businesses and their performance continued of our 2014 variable annuities sales not featuring living benefit guarantees. While sales of fixed annuities and fixed index annuities have been lower, though relatively in line with the market, they still make up a significant portion of our balance sheet and earnings. Jackson stopped selling life insurance products in 2012; however, we continue to look for opportunistic ‘bolt-on’ acquisitions to diversify our earnings and balance sheet risks further. The purchase of Reassure America Life Insurance Company (REALIC) in 2012 has contributed significantly to shape Jackson’s earnings while helping to diversify Jackson’s overall risk profile. We continue to proactively balance value, volume, capital and balance sheet strength across our suite of product offerings which allows us to compete effectively throughout the economic cycle. Distribution capabilities Our distribution teams set us apart from our competitors within the markets in which we compete. Jackson’s wholesaling force is the largest in the industry, supporting thousands of advisers across multiple channels and distribution outlets. Our wholesalers provide extensive training across a variety of topics to these advisers, and in 2014 continued to focus training efforts around its newest product, Elite Access, with a total of 374 Elite Access meetings and over 10,000 advisers in attendance. National Planning Holdings, an affiliate of Jackson, is the sixth5 largest independent broker-dealer network in the country. Leveraging the collective strength of the four broker-dealers within the network, National Planning Holdings is able to meet the specific needs of three key distribution channels: independent representatives, financial institutions, and tax and accounting professionals. We offer registered representatives and investment advisers access to industry-leading mutual fund/asset management companies, insurance carriers, and to thousands of brokerage products. National Planning Holdings provides significant benefits for Jackson by being an outlet for Jackson products and providing market intelligence. Curian is Jackson’s retail asset management arm, distributing investment solutions which include separate accounts, mutual funds, mutual fund wraps and exchange-traded funds through an online platform. Curian gives financial advisers efficient access to a broad range of investment solutions that are developed with institutional-level investment manager due diligence, portfolio construction and asset allocation resources. Operational efficiencies We support our industry-leading distribution teams with award-winning customer service. Jackson was awarded by Service Quality Measurement Group, Inc. ‘World Class Certification’ in customer satisfaction and received the ‘Highest Customer Satisfaction by Industry’ award, achieving the top rating for the financial industry, for the ninth consecutive year. High-quality information technology systems are critical for providing award-winning customer service. We leverage technology to minimise processing errors and reduce the time required to process new business and commissions. The flexibility of our information technology systems contributes to our ability to manufacture, distribute and service an unbundled product design and to distinguish us from others in the industry. This focus on our operational platforms, and the efficiencies achieved as a result, have provided us with among the lowest general and administration expense-to-asset ratio relative to competitors. Disciplined approach Jackson operates within a well-defined risk framework aligned with the overall Prudential Group risk appetite. The type and number of products we sell remains balanced with the acceptance of risks we retain. Our conservative and disciplined economic approach to pricing is designed to achieve both adequate returns on our products and sufficient resources to support our hedging programme. Our hedge philosophy has not changed in 2014. Jackson is able to aggregate financial risks across the Company, obtain a unified view of our risk positions, and actively manage net risks through economically-based hedging programmes. A key element of our core strategy is to protect the Company from severe economic scenarios while maintaining adequate regulatory capital. We benefit from the fact that the competitive environment continues to favour companies with good financial strength ratings and a strong track record of financial discipline, both key elements of our long-term strategy. 4m life customers The 2014 EEV results of the Group are presented on a post-tax basis and, accordingly, prior years’ results are shown on a comparable basis. According to LIMRA, U.S. Individual Annuities Survey Participant’s Report (Q3 2014). Source: US Census Bureau. Based on total annuity sales, LIMRA, U.S. Individual Annuities Survey Participant’s Report (Q3 2014). Jackson is ranked first in total variable annuities sales out of 30 participating companies in LIMRA’s quarterly sales survey. Investment News Broker-Dealer Rankings – April 2014 (as reported at the 2014 Investor Conference).
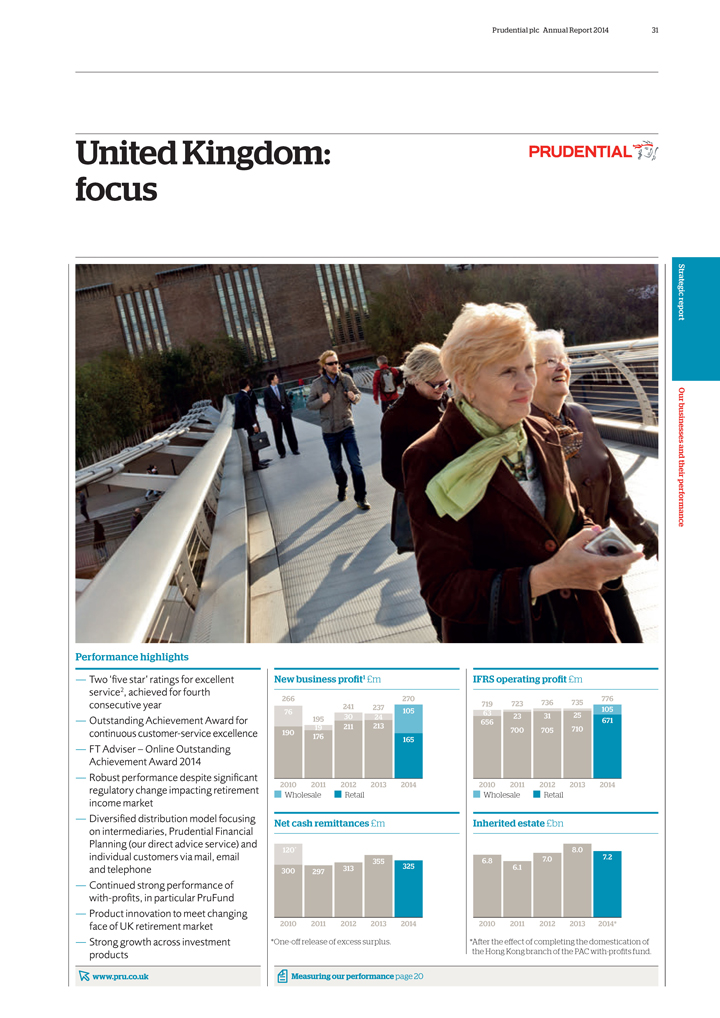
Prudential plc Annual Report 2014 31 United Kingdom: focus PRUDENTIAL Performance highlights — Two ‘five star’ ratings for excellent service2, achieved for fourth consecutive year — Outstanding Achievement Award for continuous customer-service excellence — FT Adviser – Online Outstanding Achievement Award 2014 — Robust performance despite significant regulatory change impacting retirement income market — Diversified distribution model focusing on intermediaries, Prudential Financial Planning (our direct advice service) and individual customers via mail, email and telephone — Continued strong performance of with-profits, in particular PruFund — Product innovation to meet changing face of UK retirement market — Strong growth across investment products www.pru.co.uk New business profit1 £m 266 76 190 195 19 176 241 30 211 237 24 213 270 105 165 2010 2011 2012 2013 2014 Wholesale Retail Net cash remittances £m 120* 300 297 313 355 325 2010 2011 2012 2013 2014 *One-off release of excess surplus. Measuring our performance page 20 IFRS operating profit £m 719 63 656 723 23 700 736 31 705 735 25 710 776 105 671 2010 2011 2012 2013 2014 Wholesale Retail Inherited estate £bn 6.8 6.1 8.0 7.2 7.0 2010 2011 2012 2013 2014* *After the effect of completing the domestication of the Hong Kong branch of the PAC with-profits fund. Strategic report Our businesses and their performance

32 Prudential plc Annual Report 2014 Strategic report Our businesses and their performance continued “The business proved resilient despite unprecedented regulatory change in 2014, delivering a stable, robust financial performance while favourable brand recognition, diversified distribution and a market leading with-profits proposition positions us strongly to help customers save with confidence to secure a dependable retirement income.” Jackie Hunt Chief Executive Prudential UK & Europe Market overview The evolution of saving in the UK The configuration of the UK market is unchanged, characterised by an ageing population with wealth concentrated in the 50+ age group and a younger generation of savers who are typically less well-funded. While the announcement of pensions freedoms in the 2014 Budget has significantly reduced restrictions on how these individuals will access their savings to help fund an income in retirement, the need to accumulate savings remains. It constitutes a significant opportunity for companies with a strong brand and a solid track record in the long-term savings market. In the UK we focus on those areas of the market where we are able to bring superior value to our customers, and where we enjoy a competitive advantage, primarily in with-profits and retirement income provision. The changing regulatory landscape The UK life and pensions industry continues to undergo significant change. The announcement by the UK Chancellor in the 2014 Budget to remove compulsory annuitisation and introduce new pension freedoms from April 2015 has been described as a once in a 100-year change. We are supportive of this change and more generally of policy initiatives that will help encourage people to save in greater numbers, and more often, particularly in an environment where there is a significant savings gap. Simultaneously, we are witnessing a shift in how customers view retirement. The distinction between accumulating funds and then using them to provide an income in retirement is no longer clear-cut. We expect to see further opportunities created in the saving and investment market with demand for financial advice increasing and customers engaging more frequently with their providers. These new developments represent major changes to the way business is conducted in a number of areas of the markets in which we operate in the UK, and impact not only insurance and investments providers, but also distributors and consumers. What we do and how we do it Valuable customer franchise With a pedigree stretching back over more than 166 years, the Prudential UK business has built the foundation of the Group’s iconic brand and its cash, capital and credit-ratings performance. Our approach in the UK is driven by a focus on providing long-term value to our customers based on our longevity experience, multi-asset investment capabilities and our financial strength. In the UK the Prudential brand is long established, well-known and, importantly, well-trusted both in the intermediary financial adviser and the retail marketplaces. This trust and recognition positions us favourably to help customers save with confidence and to understand how to secure a dependable retirement income, through our range of market-leading with-profits and retirement income products. Our strategy and operating principles Balanced metrics and disclosures Disciplined capital allocation Proactive risk management Focus on customers and distribution Asia: accelerate United States: build on strength United Kingdom: focus Asset management: optimise Sustainable value for our stakeholders The strategy in the UK business continues to be one of ‘focus’: — Selective participation; — Capital discipline; — Sustainable cash generation; — Delivering value through cost and persistency management; — Provision of market-leading with-profits investment returns to our customers; and — Opportunities for growth: – broaden risk-managed products and retirement solutions – enhance distribution. Our strategy and operating principles page 18
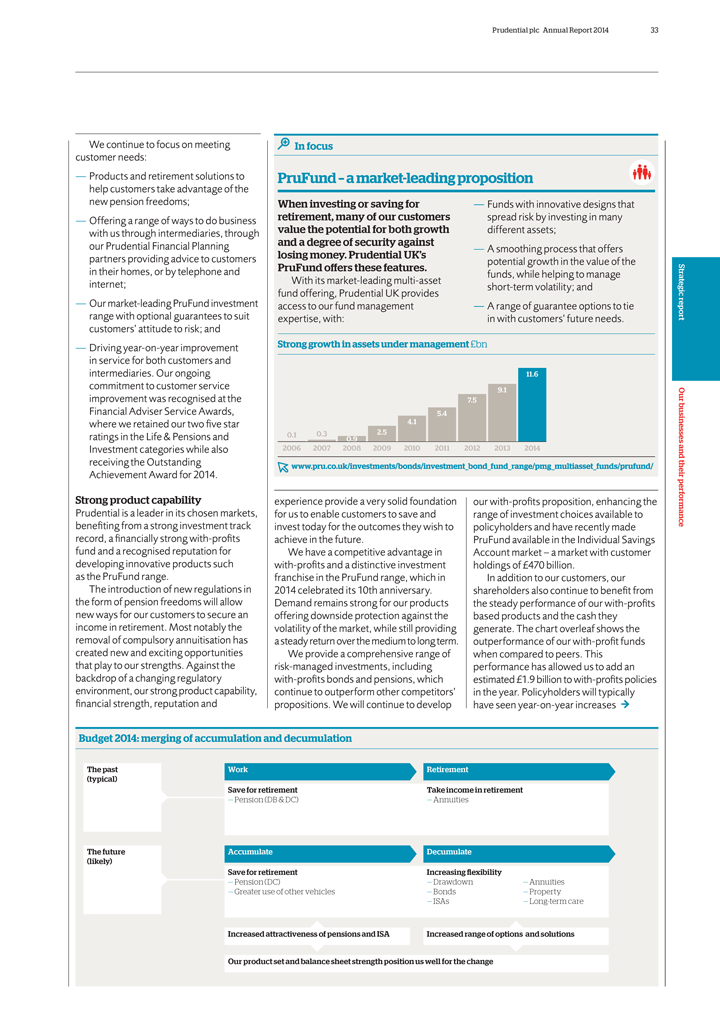
Prudential plc Annual Report 2014 33 We continue to focus on meeting customer needs: — Products and retirement solutions to help customers take advantage of the new pension freedoms; — Offering a range of ways to do business with us through intermediaries, through our Prudential Financial Planning partners providing advice to customers in their homes, or by telephone and internet; — Our market-leading PruFund investment range with optional guarantees to suit customers’ attitude to risk; and — Driving year-on-year improvement in service for both customers and intermediaries. Our ongoing commitment to customer service improvement was recognised at the Financial Adviser Service Awards, where we retained our two five star ratings in the Life & Pensions and Investment categories while also receiving the Outstanding Achievement Award for 2014. Strong product capability Prudential is a leader in its chosen markets, benefiting from a strong investment track record, a financially strong with-profits fund and a recognised reputation for developing innovative products such as the PruFund range. The introduction of new regulations in the form of pension freedoms will allow new ways for our customers to secure an income in retirement. Most notably the removal of compulsory annuitisation has created new and exciting opportunities that play to our strengths. Against the backdrop of a changing regulatory environment, our strong product capability, financial strength, reputation and In focus PruFund – a market-leading proposition When investing or saving for retirement, many of our customers value the potential for both growth and a degree of security against losing money. Prudential UK’s PruFund offers these features. With its market-leading multi-asset fund offering, Prudential UK provides access to our fund management expertise, with: — Funds with innovative designs that spread risk by investing in many different assets; — A smoothing process that offers potential growth in the value of the funds, while helping to manage short-term volatility; and — A range of guarantee options to tie in with customers’ future needs. Strong growth in assets under management £bn 0.1 0.3 0.9 2.5 5.4 4.1 9.1 7.5 11.6 2006 2007 2008 2009 2010 2011 2012 2013 2014 www.pru.co.uk/investments/bonds/investment_bond_fund_range/pmg_multiasset_funds/prufund/ experience provide a very solid foundation for us to enable customers to save and invest today for the outcomes they wish to achieve in the future. We have a competitive advantage in with-profits and a distinctive investment franchise in the PruFund range, which in 2014 celebrated its 10th anniversary. Demand remains strong for our products offering downside protection against the volatility of the market, while still providing a steady return over the medium to long term. We provide a comprehensive range of risk-managed investments, including with-profits bonds and pensions, which continue to outperform other competitors’ propositions. We will continue to develop our with-profits proposition, enhancing the range of investment choices available to policyholders and have recently made PruFund available in the Individual Savings Account market – a market with customer holdings of £470 billion. In addition to our customers, our shareholders also continue to benefit from the steady performance of our with-profits based products and the cash they generate. The chart overleaf shows the outperformance of our with-profit funds when compared to peers. This performance has allowed us to add an estimated £1.9 billion to with-profits policies in the year. Policyholders will typically have seen year-on-year increases Budget 2014: merging of accumulation and decumulation The past (typical) Work Save for retirement — Pension (DB & DC) Retirement Take income in retirement — Annuities The future (likely) Accumulate Save for retirement — Pension (DC) — Greater use of other vehicles Decumulate Increasing flexibility — Drawdown — Bonds — ISAs — Annuities — Property — Long-term care Increased attractiveness of pensions and ISA Increased range of options and solutions Our product set and balance sheet strength position us well for the change Strategic report Our businesses and their performance
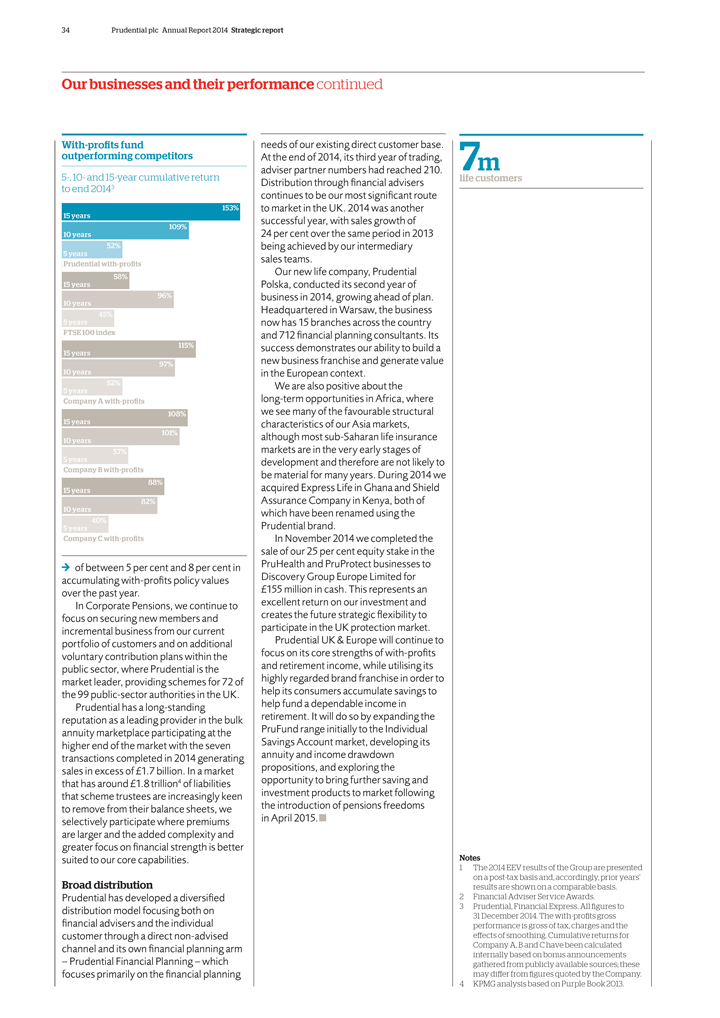
34 Prudential plc Annual Report 2014 Strategic report Our businesses and their performance continued With-profits fund outperforming competitors 5-, 10- and 15-year cumulative return to end 20143 153% 15 years 109% 10 years 52% 5 years Prudential with-profits 58% 15 years 96% 10 years 45% 5 years FTSE 100 index 115% 15 years 97% 10 years 52% 5 years Company A with-profits 108% 15 years 101% 10 years 57% 5 years Company B with-profits 88% 15 years 82% 10 years 40% 5 years Company C with-profits of between 5 per cent and 8 per cent in accumulating with-profits policy values over the past year. In Corporate Pensions, we continue to focus on securing new members and incremental business from our current portfolio of customers and on additional voluntary contribution plans within the public sector, where Prudential is the market leader, providing schemes for 72 of the 99 public-sector authorities in the UK. Prudential has a long-standing reputation as a leading provider in the bulk annuity marketplace participating at the higher end of the market with the seven transactions completed in 2014 generating sales in excess of £1.7 billion. In a market that has around £1.8 trillion4 of liabilities that scheme trustees are increasingly keen to remove from their balance sheets, we selectively participate where premiums are larger and the added complexity and greater focus on financial strength is better suited to our core capabilities. Broad distribution Prudential has developed a diversified distribution model focusing both on financial advisers and the individual customer through a direct non-advised channel and its own financial planning arm – Prudential Financial Planning – which focuses primarily on the financial planning needs of our existing direct customer base. At the end of 2014, its third year of trading, adviser partner numbers had reached 210. Distribution through financial advisers continues to be our most significant route to market in the UK. 2014 was another successful year, with sales growth of 24 per cent over the same period in 2013 being achieved by our intermediary sales teams. Our new life company, Prudential Polska, conducted its second year of business in 2014, growing ahead of plan. Headquartered in Warsaw, the business now has 15 branches across the country and 712 financial planning consultants. Its success demonstrates our ability to build a new business franchise and generate value in the European context. We are also positive about the long-term opportunities in Africa, where we see many of the favourable structural characteristics of our Asia markets, although most sub-Saharan life insurance markets are in the very early stages of development and therefore are not likely to be material for many years. During 2014 we acquired Express Life in Ghana and Shield Assurance Company in Kenya, both of which have been renamed using the Prudential brand. In November 2014 we completed the sale of our 25 per cent equity stake in the PruHealth and PruProtect businesses to Discovery Group Europe Limited for £155 million in cash. This represents an excellent return on our investment and creates the future strategic flexibility to participate in the UK protection market. Prudential UK & Europe will continue to focus on its core strengths of with-profits and retirement income, while utilising its highly regarded brand franchise in order to help its consumers accumulate savings to help fund a dependable income in retirement. It will do so by expanding the PruFund range initially to the Individual Savings Account market, developing its annuity and income drawdown propositions, and exploring the opportunity to bring further saving and investment products to market following the introduction of pensions freedoms in April 2015. 7m life customers Notes 1 The 2014 EEV results of the Group are presented on a post-tax basis and, accordingly, prior years’ results are shown on a comparable basis. 2 Financial Adviser Service Awards. 3 Prudential, Financial Express. All figures to 31 December 2014. The with-profits gross performance is gross of tax, charges and the effects of smoothing. Cumulative returns for Company A, B and C have been calculated internally based on bonus announcements gathered from publicly available sources; these may differ from figures quoted by the Company. 4 KPMG analysis based on Purple Book 2013.

Prudential plc Annual Report 2014 35 Asset management: optimise M&G INVESTMENTS Performance highlights — Record external funds under management of £137 billion — 34 per cent growth in European retail funds to £31.8 billion under management — Record 2014 profits of £446 million — Recognised for its investment performance with numerous awards, including Real Estate Manager and Fixed Income Manager of the Year at the Financial News Awards 2014 for the second consecutive year www.mandg.com M&G external net flows £bn 9.1 1.7 7.4 4.4 0.5 3.9 16.9 9.0* 7.9 9.5 2.1 7.4 7.1 0.4 6.7 2010 2011 2012 2013 2014 Institutional Retail *Including £7.6 billion mandate Net cash remittances £m 150 235 213 206 285 2010 2011 2012 2013 2014 Measuring our performance page 20 M&G European retail funds under management £bn 14.4 9.0 8.2 31.8 23.7 2010 2011 2012 2013 2014 IFRS operating profit1 £m 246 301 320 446 395 2010 2011 2012 2013 2014 Strategic report Our businesses and their performance

36 Prudential plc Annual Report 2014 Strategic report Our businesses and their performance continued “M&G’s objective is to produce superior long-term investment returns for its clients – individual and institutional investors – and its shareholder. We continue to diversify our business by geography and asset class, while providing capital efficient profits and cash generation for the Group.” Michael McLintock Chief Executive Officer M&G Market overview The European asset management market is the second largest region in the world with total assets of £6.2 trillion2. Demand for asset management services is expected to continue to grow as governments and employers increasingly pass the responsibility for retirement planning and other long-term savings to individuals. Asset managers with records of strong investment performance and well-regarded brands are in a good position to attract flows of new money. The UK asset management industry, M&G’s core market, is the second largest national market in the world with £835 billion3 of assets, and is a global centre of excellence for investment management and a major source of long-term funding for the UK economy. Across its chosen markets, M&G serves the needs of both retail and institutional investors. Market backdrop over the past year The global economy appeared to lose momentum towards the end of 2014. While the US showed signs of improving economics, the Eurozone and Japan struggled to generate positive growth with the Chinese economy softening. Concerns about slower economic activity fuelled an upsurge in market volatility, as investors worried whether central banks would be able to navigate the slowdown and whether ongoing geopolitical tensions would disrupt the recovery. European investors continue to favour fixed-income and mixed asset funds, while in the UK the bond sector saw several periods of net redemptions as savers moved more of their money into equities. What we do and how we do it M&G has been managing money on behalf of third-party investors for more than 80 years. We have long believed that our active approach to investment – selecting investments on a conviction basis rather than following a market index – produces superior returns over the longer term. In the retail market M&G operates a range of UK-domiciled funds which are now distributed across Europe and Asia. Today, clients outside the UK account for more than 45 per cent of M&G’s retail assets under management. In the institutional market, M&G provides a range of strategies that help pension funds, sovereign wealth funds and other large investors match liabilities and achieve growth targets. Some of these strategies were developed originally for Prudential’s insurance funds. Today M&G is an international asset manager with a physical presence in Our strategy and operating principles Balanced metrics and disclosures Disciplined capital allocation Proactive risk management Focus on customers and distribution Asia: accelerate United States: build on strength United kingdom: focus Asset management: optimise Sustainable value for our stakeholders Prudential believes the value of M&G’s asset management capabilities is allowing the business to focus on the generation of superior long-term returns for investors. Through its proven ability to convert investment performance into significant fund flows, M&G is able to increase its exposure to markets and so maximise revenue from the long-term stock of funds under management. The pillars of M&G’s business that support this approach are: — People – an environment that attracts, fosters and retains talented individuals; — Performance – an investment-led business focused on the delivery of long-term returns through active investment management; — Innovative investment ideas which meet client needs and a proven ability to convert these ideas into significant fund flows; and — Diversification by asset class, client type, fund and investment strategy and country.
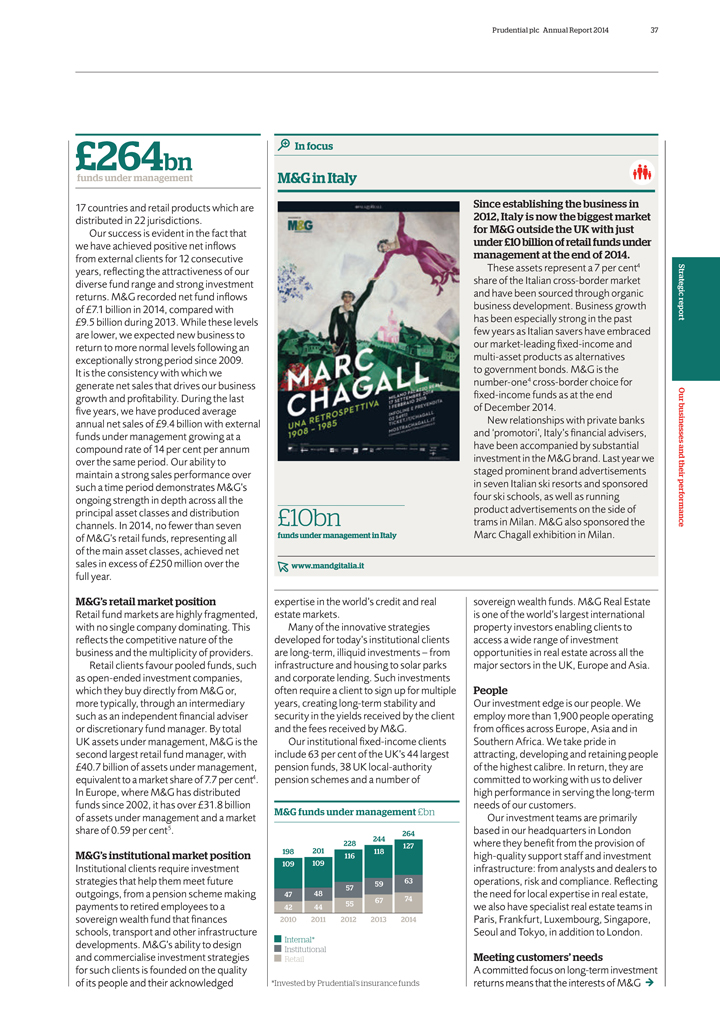
Prudential plc Annual Report 2014 37 £264bn funds under management 17 countries and retail products which are distributed in 22 jurisdictions. Our success is evident in the fact that we have achieved positive net inflows from external clients for 12 consecutive years, reflecting the attractiveness of our diverse fund range and strong investment returns. M&G recorded net fund inflows of £7.1 billion in 2014, compared with £9.5 billion during 2013. While these levels are lower, we expected new business to return to more normal levels following an exceptionally strong period since 2009. It is the consistency with which we generate net sales that drives our business growth and profitability. During the last five years, we have produced average annual net sales of £9.4 billion with external funds under management growing at a compound rate of 14 per cent per annum over the same period. Our ability to maintain a strong sales performance over such a time period demonstrates M&G’s ongoing strength in depth across all the principal asset classes and distribution channels. In 2014, no fewer than seven of M&G’s retail funds, representing all of the main asset classes, achieved net sales in excess of £250 million over the full year. M&G’s retail market position Retail fund markets are highly fragmented, with no single company dominating. This reflects the competitive nature of the business and the multiplicity of providers. Retail clients favour pooled funds, such as open-ended investment companies, which they buy directly from M&G or, more typically, through an intermediary such as an independent financial adviser or discretionary fund manager. By total UK assets under management, M&G is the second largest retail fund manager, with £40.7 billion of assets under management, equivalent to a market share of 7.7 per cent4. In Europe, where M&G has distributed funds since 2002, it has over £31.8 billion of assets under management and a market share of 0.59 per cent5. M&G’s institutional market position Institutional clients require investment strategies that help them meet future outgoings, from a pension scheme making payments to retired employees to a sovereign wealth fund that finances schools, transport and other infrastructure developments. M&G’s ability to design and commercialise investment strategies for such clients is founded on the quality of its people and their acknowledged Since establishing the business in 2012, Italy is now the biggest market for M&G outside the UK with just under £10 billion of retail funds under management at the end of 2014. These assets represent a 7 per cent4 share of the Italian cross-border market and have been sourced through organic business development. Business growth has been especially strong in the past few years as Italian savers have embraced our market-leading fixed-income and multi-asset products as alternatives to government bonds. M&G is the number-one4 cross-border choice for fixed-income funds as at the end of December 2014. New relationships with private banks and ‘promotori’, Italy’s financial advisers, have been accompanied by substantial investment in the M&G brand. Last year we staged prominent brand advertisements in seven Italian ski resorts and sponsored four ski schools, as well as running product advertisements on the side of trams in Milan. M&G also sponsored the Marc Chagall exhibition in Milan. In focus M&G in Italy £10bn funds under management in Italy www.mandgitalia.it expertise in the world’s credit and real estate markets. Many of the innovative strategies developed for today’s institutional clients are long-term, illiquid investments – from infrastructure and housing to solar parks and corporate lending. Such investments often require a client to sign up for multiple years, creating long-term stability and security in the yields received by the client and the fees received by M&G. Our institutional fixed-income clients include 63 per cent of the UK’s 44 largest pension funds, 38 UK local-authority pension schemes and a number of M&G funds under management £bn 120* 198 109 47 42 201 109 48 44 228 116 57 55 244 118 59 67 264 127 63 74 2010 2011 2012 2013 2014 Internal* Institutional Retail *Invested by Prudential’s insurance funds sovereign wealth funds. M&G Real Estate is one of the world’s largest international property investors enabling clients to access a wide range of investment opportunities in real estate across all the major sectors in the UK, Europe and Asia. People Our investment edge is our people. We employ more than 1,900 people operating from offices across Europe, Asia and in Southern Africa. We take pride in attracting, developing and retaining people of the highest calibre. In return, they are committed to working with us to deliver high performance in serving the long-term needs of our customers. Our investment teams are primarily based in our headquarters in London where they benefit from the provision of high-quality support staff and investment infrastructure: from analysts and dealers to operations, risk and compliance. Reflecting the need for local expertise in real estate, we also have specialist real estate teams in Paris, Frankfurt, Luxembourg, Singapore, Seoul and Tokyo, in addition to London. Meeting customers’ needs A committed focus on long-term investment returns means that the interests of M&G
38 Prudential plc Annual Report 2014 Strategic report Our businesses and their performance continued and its customers are always aligned, whether clients are individual savers, institutional investors or the funds of Prudential’s insurance operations. M&G has a strong investment brand, built over decades and based on a reputation for honesty, innovation and a commitment to building long-term wealth for our investors. We aim to put our customers at the heart of everything we do and seek to be a trusted partner for all our clients. Investment expertise M&G’s investment expertise spans all the principal asset classes – equities, fixed income and real estate – so that we can always offer investment solutions to our clients as market conditions and investor sentiment change. Equities: our fund managers have the freedom to develop their own investment approaches. Their main strength lies in stock selection, focusing on fundamental company analysis. M&G’s size and standing enables our fund managers to develop an effective dialogue with the management teams of the companies in which they invest. Fixed income: M&G is one of Europe’s largest fixed-income investors. Our fund managers benefit from one of the region’s largest and most experienced in-house credit research teams, whose knowledge covers the full range of fixed-income investment, from the management of sovereign debt and public corporate bond portfolios, through to private debt such as leveraged finance, real estate finance, direct lending and infrastructure. In a ranking of global private debt managers for 2014, M&G ranked fifth6 and was the only European firm in the top 105. Multi-asset: M&G’s multi-asset team, the Macro Investment Business, is responsible for the management of a range of funds for retail investors and segregated accounts for institutional clients. The team applies a top-down ‘macro’ approach, with a strong valuation framework, which can be applied across markets and regions in many market conditions. Real estate: M&G Real Estate is a leading global property investor and manager covering all major real estate sectors including business space, retail and leisure, residential and alternatives. We actively manage our assets, drawing on our long heritage of expertise and knowledge and our extensive network of contacts. This approach enables the business to identify and capitalise on attractive investment opportunities. We also have a track record for identifying and exploiting real-estate development opportunities and for the successful delivery of projects. M&G concluded 2014 with circa £4 billion of global transactions. This included £3.2 billion of acquisitions with an average deal size of £50 million. A history of innovation Since launching the UK’s first open-ended fund in 1931, we have brought a succession of new investment strategies to the retail and institutional markets. In combination with this tradition of innovative investment thinking, M&G has a proven ability to convert ideas into significant fund flows. It is these two qualities that make M&G distinctive. M&G has become a pioneer in fixed-income investing over the last two decades with the backing of one of the most experienced and well-resourced teams in the UK. Since the launch of the group’s first retail corporate bond fund in 1994, the Company has created a suite of fixed-income products designed to suit the varying needs of investors. Our latest offering, the M&G Global Floating Rate High Yield Bond Fund, was successfully launched in September 2014 and registered in the UK and across Continental Europe. We believe that this is the first time that retail investors have been given access to the high yield floating rate note market through a collective fund. For bond investors concerned about the risk of an increase in interest rates, this fund offers a means not only to protect their savings but also to benefit from rising yields. In the institutional market, pension funds, sovereign wealth funds and other large clients require stable, longer-term cash flows that help meet their liabilities. Over the last few years, M&G has met this need by building a comprehensive range of fixed-income credit funds designed to provide returns above either inflation or an interest rate. The range includes a public corporate bond fund for clients with daily dealing requirements, funds that allocate to private and illiquid credit (such as corporate and social housing loans) and a fund with the flexibility to seek the best investment opportunities across public and private debt markets. Diversification M&G has pursued business diversification across: — Asset class: expertise across equities, fixed-income, real estate and mixed-asset strategies; — Client type: retail customers and institutional clients including pension funds, sovereign wealth funds, and Prudential’s own long-term insurance funds; — Investment strategy: over 60 pooled retail funds covering domestic, global and emerging market strategies, 13 of which have funds under management of over £1 billion. Institutional clients benefit from a wide-range of pooled and/or segregated fixed-income, equity and real estate strategies; and — Country. Notes 1 Excludes Prudential Capital. 2 Based on data as at Q3 2014. European Fund & Asset Management Association (published on 8 January 2015). 3 Source: Investment Association, 31 December 2014. 4 Source: Assogestioni as of 31 December 2014. Cross-border market is based on assets and flows of funds domiciled outside Italy and managed by foreign groups only. 5 Lipper FMI FundFile, 31 December 2014, based on Europe excluding UK and International region. M&G data sourced internally. 6 Private Debt Investor figures based on amount of capital raised over the last five years for discrete private debt strategies.
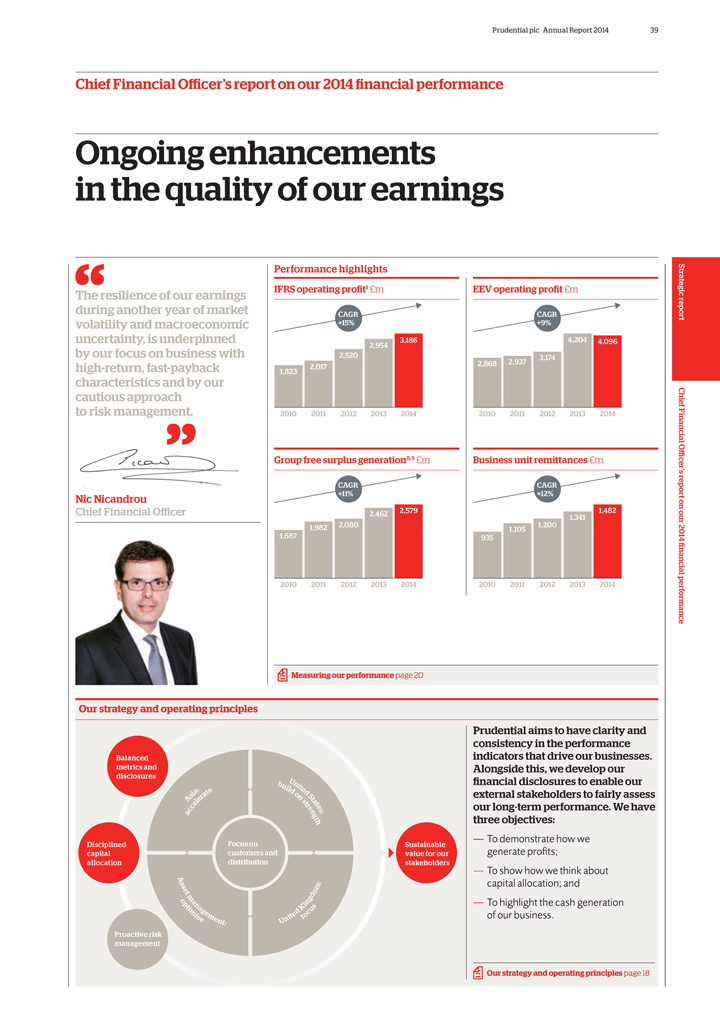
Prudential plc Annual Report 2014 39 Chief Financial Officer’s report on our 2014 financial performance Ongoing enhancements in the quality of our earnings “The resilience of our earnings during another year of market volatility and macroeconomic uncertainty, is underpinned by our focus on business with high-return, fast-payback characteristics and by our cautious approach to risk management.” Nic Nicandrou Chief Financial Officer Performance highlights IFRS operating profit1 £m CAGR +15% 2,017 1,823 2,520 3,186 2,954 2010 2011 2012 2013 2014 Group free surplus generation8,9 £m CAGR +11% 1,687 1,982 2,080 2,462 2,579 2010 2011 2012 2013 2014 EEV operating profit £m CAGR +9% 3,174 2,868 2,937 4,204 4,096 2010 2011 2012 2013 2014 Business unit remittances £m CAGR +12% 935 1,200 1,105 1,341 1,482 2010 2011 2012 2013 2014 Measuring our performance page 20 Our strategy and operating principles Balanced metrics and disclosures Disciplined capital allocation Proactive risk management Focus on customers and distribution Asia: accelerate United States: build on strength United kingdom: focus Asset management: optimise Sustainable value for our stakeholders Prudential aims to have clarity and consistency in the performance indicators that drive our businesses. Alongside this, we develop our financial disclosures to enable our external stakeholders to fairly assess our long-term performance. We have three objectives: — To demonstrate how we generate profits; — To show how we think about capital allocation; and — To highlight the cash generation of our business. Our strategy and operating principles page 18 Strategic report Chief Financial Officer’s report on our 2014 financial performance
40 Prudential plc Annual Report 2014 Strategic report Chief Financial Officer’s report on our 2014 financial performance continued £3,186m IFRS operating profit 14% increase on 2013 Measuring our performance page 20 In 2014 Prudential delivered strong growth in IFRS operating profit and underlying free surplus generation, the two metrics that underpin our 2017 financial objectives. The Group’s overall financial performance increasingly benefits from ongoing enhancements in the quality of our earnings – delivered through stronger growth in non-interest sensitive sources – and from improvements in the balance of profit and cash across different geographies, products and distribution channels. The resilience of our earnings during another year of market volatility and macroeconomic uncertainty, is underpinned by our focus on business with high-return, fast-payback characteristics and by our cautious approach to risk management. Prudential’s balance sheet remains conservatively positioned and the Group is strongly capitalised, with sufficient capital available to both fund new growth opportunities and absorb the effects of unexpected market shocks. During 2014, the performance of the equity markets in the countries that we operate in has been broadly positive, with the US S&P 500 index up 11 per cent, while the UK FTSE 100 index and the MSCI Asia ex-Japan index were flat. Continued speculation on global growth prospects and the timing of key interest rate decisions has led to some volatility in long-term yields, with most markets experiencing a significant decline in 10-year bond yields during 2014, largely reversing the increases seen in 2013. As significant long-term holders of investment securities, insurance company results reflect the negative and positive fluctuations in the value of these assets. We include the impact of these short-term market movements outside the operating result, which is based on longer-term investment assumptions, on both the IFRS and the European Embedded Value (‘EEV’) reporting bases. In addition, we continue to take steps to protect ourselves from the downside risks to the Group’s financial position associated with the guarantees that we offer to our customers and this also gives rise to short-term investment fluctuations, particularly on the IFRS reporting basis where the corresponding movement in the economic effects associated with these fluctuations is not recognised. Therefore, in the remainder of my report, my comments on the Group’s operating performance exclude these short-term, market-driven effects. In evaluating the 2014 financial performance of the Group, I have presented percentage growth rates before the impact of the pronounced fluctuations in the value of sterling against local currencies in the US and Asia, as this approach allows a more meaningful assessment of underlying performance trends. This is because our businesses in the US and Asia receive premiums and pay claims in local currencies and are, therefore, not exposed to any cross-currency trading effects. Growth rates based on actual exchange rates are also shown in the financial tables presented in this report. As the assets and liabilities of our overseas businesses are translated at period-end exchange rates, the effect of these currency movements has been fully incorporated within reported shareholders’ equity as at 31 December 2014. The key financial highlights of 2014 were: — Group IFRS operating profit of £3,186 million, up 14 per cent; — Group profit before tax attributable to shareholders on an IFRS basis increased to £2,614 million from £1,532 million in 2013, including the financial impact of short-term movements in investment values and other items reported outside the operating result; — Underlying free surplus generation9 (net of investment in new business) of £2,579 million, 9 per cent higher; — On the European Embedded Value (EEV) basis of reporting performance, new business profit1 increased 10 per cent to £2,126 million, contributing to a 4 per cent increase in EEV operating profit1 to £4,096 million; and — EEV basis shareholders’ funds at 31 December 2014 increased to £29.2 billion, 17 per cent higher than the previous year-end on an actual exchange rate basis.
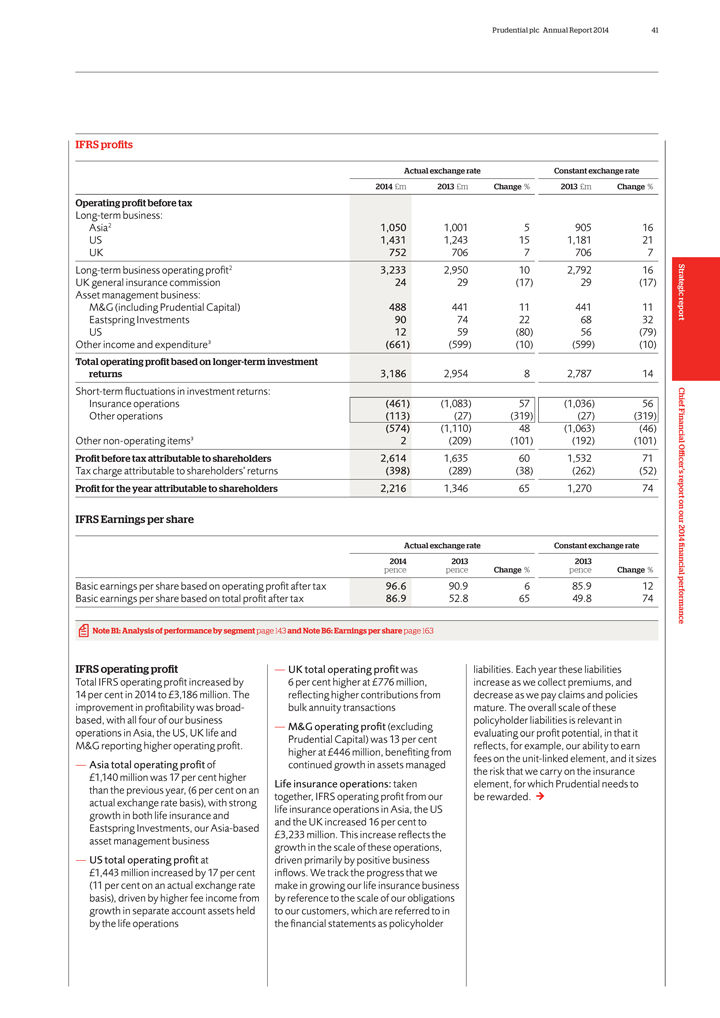
Prudential plc Annual Report 2014 41 IFRS profits Actual exchange rate Constant exchange rate 2014 £m 2013 £m Change % 2013 £m Change % Operating profit before tax Long-term business: Asia2 1,050 1,001 5 905 16 US 1,431 1,243 15 1,181 21 UK 752 706 7 706 7 Long-term business operating profit2 3,233 2,950 10 2,792 16 UK general insurance commission 24 29 (17) 29 (17) Asset management business: M&G (including Prudential Capital) 488 441 11 441 11 Eastspring Investments 90 74 22 68 32 US 12 59 (80) 56 (79) Other income and expenditure3 (661) (599) (10) (599) (10) Total operating profit based on longer-term investment returns 3,186 2,954 8 2,787 14 Short-term fluctuations in investment returns: Insurance operations (461) (1,083) 57 (1,036) 56 Other operations (113) (27) (319) (27) (319) (574) (1,110) 48 (1,063) (46) Other non-operating items3 2 (209) (101) (192) (101) Profit before tax attributable to shareholders 2,614 1,635 60 1,532 71 Tax charge attributable to shareholders’ returns (398) (289) (38) (262) (52) Profit for the year attributable to shareholders 2,216 1,346 65 1,270 74 IFRS Earnings per share Actual exchange rate Constant exchange rate 2014 2013 2013 pence pence Change % pence Change % Basic earnings per share based on operating profit after tax 96.6 90.9 6 85.9 12 Basic earnings per share based on total profit after tax 86.9 52.8 65 49.8 74 Note B1: Analysis of performance by segment page 143 and Note B6: Earnings per share page 163 IFRS operating profit Total IFRS operating profit increased by 14 per cent in 2014 to £3,186 million. The improvement in profitability was broad-based, with all four of our business operations in Asia, the US, UK life and M&G reporting higher operating profit. — Asia total operating profit of £1,140 million was 17 per cent higher than the previous year, (6 per cent on an actual exchange rate basis), with strong growth in both life insurance and Eastspring Investments, our Asia-based asset management business — US total operating profit at £1,443 million increased by 17 per cent (11 per cent on an actual exchange rate basis), driven by higher fee income from growth in separate account assets held by the life operations — UK total operating profit was 6 per cent higher at £776 million, reflecting higher contributions from bulk annuity transactions — M&G operating profit (excluding Prudential Capital) was 13 per cent higher at £446 million, benefiting from continued growth in assets managed Life insurance operations: taken together, IFRS operating profit from our life insurance operations in Asia, the US and the UK increased 16 per cent to £3,233 million. This increase reflects the growth in the scale of these operations, driven primarily by positive business inflows. We track the progress that we make in growing our life insurance business by reference to the scale of our obligations to our customers, which are referred to in the financial statements as policyholder liabilities. Each year these liabilities increase as we collect premiums, and decrease as we pay claims and policies mature. The overall scale of these policyholder liabilities is relevant in evaluating our profit potential, in that it reflects, for example, our ability to earn fees on the unit-linked element, and it sizes the risk that we carry on the insurance element, for which Prudential needs to be rewarded. Strategic report Chief Financial Officer’s report on our 2014 financial performance
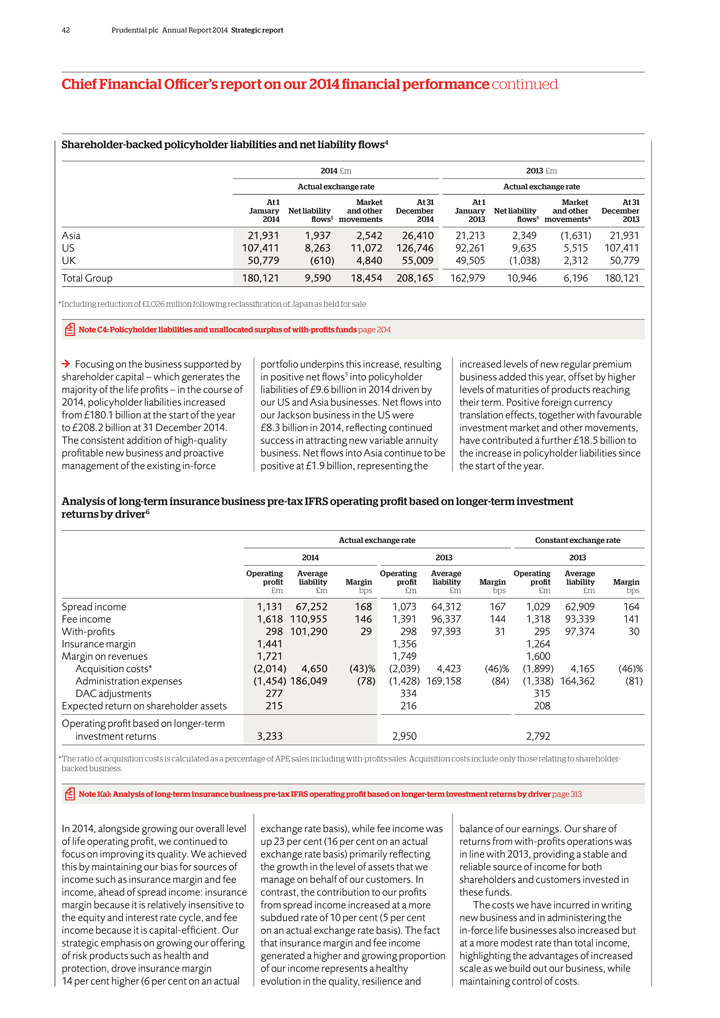
42 Prudential plc Annual Report 2014 Strategic report Chief Financial Officer’s report on our 2014 financial performance continued Shareholder-backed policyholder liabilities and net liability flows4 2014 £m 2013 £m Actual exchange rate Actual exchange rate At 1 January 2014 Net liability flows5 Market and other movements At 31 December 2014 At 1 January 2013 Net liability flows5 Market and other movements* At 31 December 2013 Asia 21,931 1,937 2,542 26,410 21,213 2,349 (1,631) 21,931 US 107,411 8,263 11,072 126,746 92,261 9,635 5,515 107,411 UK 50,779 (610) 4,840 55,009 49,505 (1,038) 2,312 50,779 Total Group 180,121 9,590 18,454 208,165 162,979 10,946 6,196 180,121 * Including reduction of £1,026 million following reclassification of Japan as held for sale Note C4: Policyholder liabilities and unallocated surplus of with-profits funds page 204 Focusing on the business supported by shareholder capital – which generates the majority of the life profits – in the course of 2014, policyholder liabilities increased from £180.1 billion at the start of the year to £208.2 billion at 31 December 2014. The consistent addition of high-quality profitable new business and proactive management of the existing in-force portfolio underpins this increase, resulting in positive net flows5 into policyholder liabilities of £9.6 billion in 2014 driven by our US and Asia businesses. Net flows into our Jackson business in the US were £8.3 billion in 2014, reflecting continued success in attracting new variable annuity business. Net flows into Asia continue to be positive at £1.9 billion, representing the increased levels of new regular premium business added this year, offset by higher levels of maturities of products reaching their term. Positive foreign currency translation effects, together with favourable investment market and other movements, have contributed a further £18.5 billion to the increase in policyholder liabilities since the start of the year. Analysis of long-term insurance business pre-tax IFRS operating profit based on longer-term investment returns by driver6 Actual exchange rate Constant exchange rate 2014 2013 2013 Operating profit £m Average liability £m Margin bps Operating profit £m Average liability £m Margin bps Operating profit £m Average liability £m Margin bps Spread income 1,131 67,252 168 1,073 64,312 167 1,029 62,909 164 Fee income 1,618 110,955 146 1,391 96,337 144 1,318 93,339 141 With-profits 298 101,290 29 298 97,393 31 295 97,374 30 Insurance margin 1,441 1,356 1,264 Margin on revenues 1,721 1,749 1,600 Acquisition costs* (2,014) 4,650 (43)% (2,039) 4,423 (46)% (1,899) 4,165 (46)% Administration expenses (1,454) 186,049 (78) (1,428) 169,158 (84) (1,338) 164,362 (81) DAC adjustments 277 334 315 Expected return on shareholder assets 215 216 208 Operating profit based on longer-term investment returns 3,233 2,950 2,792 * The ratio of acquisition costs is calculated as a percentage of APE sales including with-profits sales. Acquisition costs include only those relating to shareholder-backed business. Note 1(a): Analysis of long-term insurance business pre-tax IFRS operating profit based on longer-term investment returns by driver page 313 In 2014, alongside growing our overall level of life operating profit, we continued to focus on improving its quality. We achieved this by maintaining our bias for sources of income such as insurance margin and fee income, ahead of spread income: insurance margin because it is relatively insensitive to the equity and interest rate cycle, and fee income because it is capital-efficient. Our strategic emphasis on growing our offering of risk products such as health and protection, drove insurance margin 14 per cent higher (6 per cent on an actual exchange rate basis), while fee income was up 23 per cent (16 per cent on an actual exchange rate basis) primarily reflecting the growth in the level of assets that we manage on behalf of our customers. In contrast, the contribution to our profits from spread income increased at a more subdued rate of 10 per cent (5 per cent on an actual exchange rate basis). The fact that insurance margin and fee income generated a higher and growing proportion of our income represents a healthy evolution in the quality, resilience and balance of our earnings. Our share of returns from with-profits operations was in line with 2013, providing a stable and reliable source of income for both shareholders and customers invested in these funds. The costs we have incurred in writing new business and in administering the in-force life businesses also increased but at a more modest rate than total income, highlighting the advantages of increased scale as we build out our business, while maintaining control of costs.
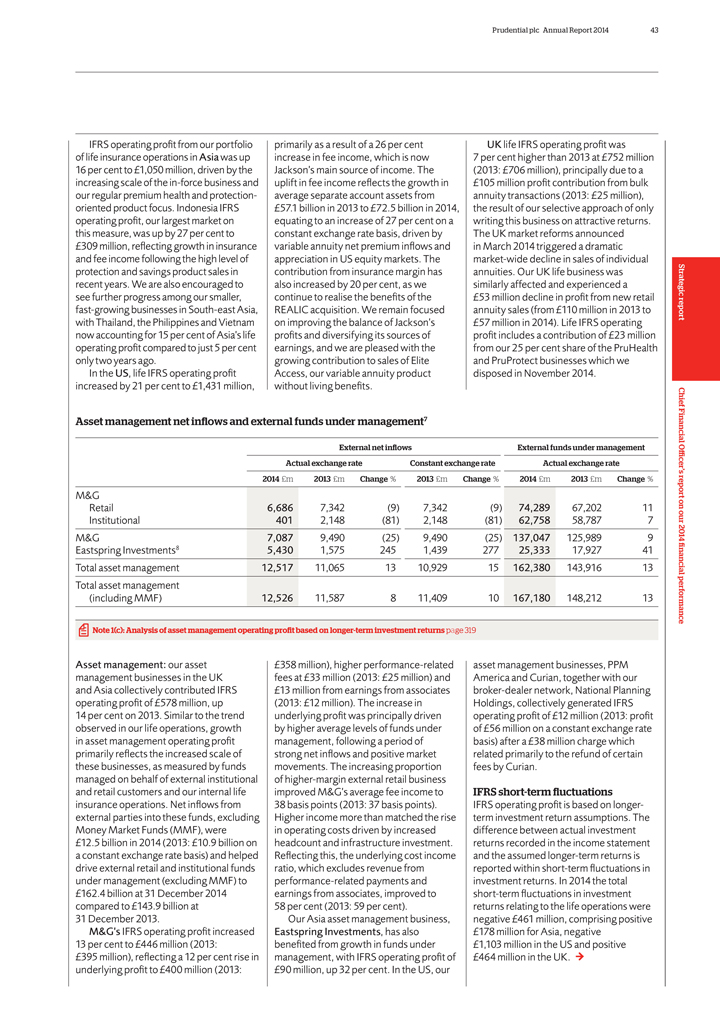
Prudential plc Annual Report 2014 43 IFRS operating profit from our portfolio of life insurance operations in Asia was up 16 per cent to £1,050 million, driven by the increasing scale of the in-force business and our regular premium health and protection-oriented product focus. Indonesia IFRS operating profit, our largest market on this measure, was up by 27 per cent to £309 million, reflecting growth in insurance and fee income following the high level of protection and savings product sales in recent years. We are also encouraged to see further progress among our smaller, fast-growing businesses in South-east Asia, with Thailand, the Philippines and Vietnam now accounting for 15 per cent of Asia’s life operating profit compared to just 5 per cent only two years ago. In the US, life IFRS operating profit increased by 21 per cent to £1,431 million, primarily as a result of a 26 per cent increase in fee income, which is now Jackson’s main source of income. The uplift in fee income reflects the growth in average separate account assets from £57.1 billion in 2013 to £72.5 billion in 2014, equating to an increase of 27 per cent on a constant exchange rate basis, driven by variable annuity net premium inflows and appreciation in US equity markets. The contribution from insurance margin has also increased by 20 per cent, as we continue to realise the benefits of the REALIC acquisition. We remain focused on improving the balance of Jackson’s profits and diversifying its sources of earnings, and we are pleased with the growing contribution to sales of Elite Access, our variable annuity product without living benefits. UK life IFRS operating profit was 7 per cent higher than 2013 at £752 million (2013: £706 million), principally due to a £105 million profit contribution from bulk annuity transactions (2013: £25 million), the result of our selective approach of only writing this business on attractive returns. The UK market reforms announced in March 2014 triggered a dramatic market-wide decline in sales of individual annuities. Our UK life business was similarly affected and experienced a £53 million decline in profit from new retail annuity sales (from £110 million in 2013 to £57 million in 2014). Life IFRS operating profit includes a contribution of £23 million from our 25 per cent share of the PruHealth and PruProtect businesses which we disposed in November 2014. Asset management net inflows and external funds under management7 External net inflows External funds under management Actual exchange rate Constant exchange rate Actual exchange rate 2014 £m 2013 £m Change % 2013 £m Change % 2014 £m 2013 £m Change % M&G Retail 6,686 7,342 (9) 7,342 (9) 74,289 67,202 11 Institutional 401 2,148 (81) 2,148 (81) 62,758 58,787 7 M&G 7,087 9,490 (25) 9,490 (25) 137,047 125,989 9 Eastspring Investments8 5,430 1,575 245 1,439 277 25,333 17,927 41 Total asset management 12,517 11,065 13 10,929 15 162,380 143,916 13 Total asset management (including MMF) 12,526 11,587 8 11,409 10 167,180 148,212 13 Note 1(c): Analysis of asset management operating profit based on longer-term investment returns page 319 Asset management: our asset management businesses in the UK and Asia collectively contributed IFRS operating profit of £578 million, up 14 per cent on 2013. Similar to the trend observed in our life operations, growth in asset management operating profit primarily reflects the increased scale of these businesses, as measured by funds managed on behalf of external institutional and retail customers and our internal life insurance operations. Net inflows from external parties into these funds, excluding Money Market Funds (MMF), were £12.5 billion in 2014 (2013: £10.9 billion on a constant exchange rate basis) and helped drive external retail and institutional funds under management (excluding MMF) to £162.4 billion at 31 December 2014 compared to £143.9 billion at 31 December 2013. M&G’s IFRS operating profit increased 13 per cent to £446 million (2013: £395 million), reflecting a 12 per cent rise in underlying profit to £400 million (2013: £358 million), higher performance-related fees at £33 million (2013: £25 million) and £13 million from earnings from associates (2013: £12 million). The increase in underlying profit was principally driven by higher average levels of funds under management, following a period of strong net inflows and positive market movements. The increasing proportion of higher-margin external retail business improved M&G’s average fee income to 38 basis points (2013: 37 basis points). Higher income more than matched the rise in operating costs driven by increased headcount and infrastructure investment. Reflecting this, the underlying cost income ratio, which excludes revenue from performance-related payments and earnings from associates, improved to 58 per cent (2013: 59 per cent). Our Asia asset management business, Eastspring Investments, has also benefited from growth in funds under management, with IFRS operating profit of £90 million, up 32 per cent. In the US, our asset management businesses, PPM America and Curian, together with our broker-dealer network, National Planning Holdings, collectively generated IFRS operating profit of £12 million (2013: profit of £56 million on a constant exchange rate basis) after a £38 million charge which related primarily to the refund of certain fees by Curian. IFRS short-term fluctuations IFRS operating profit is based on longer-term investment return assumptions. The difference between actual investment returns recorded in the income statement and the assumed longer-term returns is reported within short-term fluctuations in investment returns. In 2014 the total short-term fluctuations in investment returns relating to the life operations were negative £461 million, comprising positive £178 million for Asia, negative £1,103 million in the US and positive £464 million in the UK. Strategic report Chief Financial Officer’s report on our 2014 financial performance
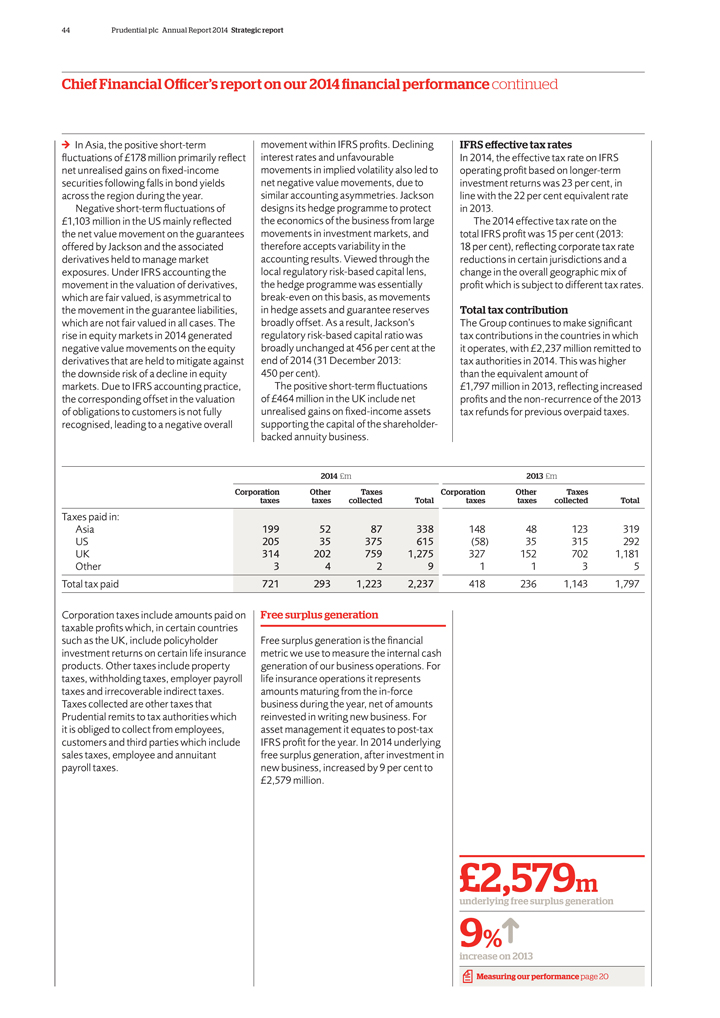
44 Prudential plc Annual Report 2014 Strategic report Chief Financial Officer’s report on our 2014 financial performance continued In Asia, the positive short-term fluctuations of £178 million primarily reflect net unrealised gains on fixed-income securities following falls in bond yields across the region during the year. Negative short-term fluctuations of £1,103 million in the US mainly reflected the net value movement on the guarantees offered by Jackson and the associated derivatives held to manage market exposures. Under IFRS accounting the movement in the valuation of derivatives, which are fair valued, is asymmetrical to the movement in the guarantee liabilities, which are not fair valued in all cases. The rise in equity markets in 2014 generated negative value movements on the equity derivatives that are held to mitigate against the downside risk of a decline in equity markets. Due to IFRS accounting practice, the corresponding offset in the valuation of obligations to customers is not fully recognised, leading to a negative overall movement within IFRS profits. Declining interest rates and unfavourable movements in implied volatility also led to net negative value movements, due to similar accounting asymmetries. Jackson designs its hedge programme to protect the economics of the business from large movements in investment markets, and therefore accepts variability in the accounting results. Viewed through the local regulatory risk-based capital lens, the hedge programme was essentially break-even on this basis, as movements in hedge assets and guarantee reserves broadly offset. As a result, Jackson’s regulatory risk-based capital ratio was broadly unchanged at 456 per cent at the end of 2014 (31 December 2013: 450 per cent). The positive short-term fluctuations of £464 million in the UK include net unrealised gains on fixed-income assets supporting the capital of the shareholder-backed annuity business. IFRS effective tax rates In 2014, the effective tax rate on IFRS operating profit based on longer-term investment returns was 23 per cent, in line with the 22 per cent equivalent rate in 2013. The 2014 effective tax rate on the total IFRS profit was 15 per cent (2013: 18 per cent), reflecting corporate tax rate reductions in certain jurisdictions and a change in the overall geographic mix of profit which is subject to different tax rates. Total tax contribution The Group continues to make significant tax contributions in the countries in which it operates, with £2,237 million remitted to tax authorities in 2014. This was higher than the equivalent amount of £1,797 million in 2013, reflecting increased profits and the non-recurrence of the 2013 tax refunds for previous overpaid taxes. 2014 £m 2013 £m Corporation taxes Other taxes Taxes collected Total Corporation taxes Other taxes Taxes collected Total Taxes paid in: Asia 199 52 87 338 148 48 123 319 US 205 35 375 615 (58) 35 315 292 UK 314 202 759 1,275 327 152 702 1,181 Other 3 4 2 9 1 1 3 5 Total tax paid 721 293 1,223 2,237 418 236 1,143 1,797 Corporation taxes include amounts paid on taxable profits which, in certain countries such as the UK, include policyholder investment returns on certain life insurance products. Other taxes include property taxes, withholding taxes, employer payroll taxes and irrecoverable indirect taxes. Taxes collected are other taxes that Prudential remits to tax authorities which it is obliged to collect from employees, customers and third parties which include sales taxes, employee and annuitant payroll taxes. Free surplus generation Free surplus generation is the financial metric we use to measure the internal cash generation of our business operations. For life insurance operations it represents amounts maturing from the in-force business during the year, net of amounts reinvested in writing new business. For asset management it equates to post-tax IFRS profit for the year. In 2014 underlying free surplus generation, after investment in new business, increased by 9 per cent to £2,579 million. £2,579m underlying free surplus generation 9% increase on 2013 Measuring our performance page 20

Prudential plc Annual Report 2014 45 Free surplus generation Actual exchange rate Constant exchange rate 2014 £m 2013 £m Change % 2013 £m Change % Free surplus generation9 Asia 938 883 6 801 17 US 1,197 1,168 2 1,109 8 UK 664 702 (5) 702 (5) M&G (including Prudential Capital) 386 346 12 346 12 Underlying free surplus generated from in-force life business and asset management 3,185 3,099 3 2,958 8 Investment in new business (606) (637) 5 (597) (2) Underlying free surplus generated 2,579 2,462 5 2,361 9 Market related movements, timing differences and other movements (6) (807) Net cash remitted by business units (1,482) (1,341) Total movement in free surplus 1,091 314 Free surplus at 1 January 4,003 3,689 Effect of domestication of Hong Kong branch (35) – Free surplus at end of year 5,059 4,003 Note 11: Analysis of movement in free surplus page 289 The increase in free surplus generated by our life insurance businesses reflects our growing scale and the highly capital generative nature of our business model. We drive this metric by targeting markets and products that have low-strain, high-return and fast-payback profiles, and by delivering both good service and value to improve customer retention. Our ability to generate both growth and cash is a distinctive feature of Prudential in our industry. In line with this approach, Asia and the US reported strong increases in free surplus generation. In the UK, a higher underlying contribution from the in-force portfolio was masked by the non-recurrence of a positive assumption change in 2013. The closing value of free surplus in our life and asset management operations increased to £5,059 million at 31 December 2014 (31 December 2013: £4,003 million, on an actual exchange rate basis), after financing reinvestment in new business and funding cash remittances from the business units to Group. We invested £606 million of the free surplus generated during the year in writing new business (2013: £597 million on a constant exchange rate basis) equivalent to a re-investment rate10 of 19 per cent, which is in line with recent periods. Asia remained the primary destination of our new business investment, given the superior profitable growth opportunities available in that region. In the US, new business investment decreased despite higher new business volumes, mainly due to proactive actions to reduce commissions and changes in product mix. New business investment in the UK increased to £73 million (2013: £29 million), reflecting changes to business mix, in particular the higher level of bulk annuity business written in 2014. The internal rates of return achieved on new business remain attractive at over 20 per cent across all three business operations, and the average payback period11 for business written in 2014 was three years for Asia, one year for the US and four years for the UK. We continue to manage cash flows across the Group with a view to achieving a balance between ensuring sufficient remittances are made to service central requirements (including paying the external dividend) and maximising value to shareholders through retention and reinvestment of capital in business opportunities. Holding company cash12 Actual exchange rate 2014 £m 2013 £m Change % Net cash remitted by business units: Asia 400 400 – US 415 294 41 UK 325 355 (8) M&G 285 235 21 Prudential Capital 57 57 – Net cash remitted by business units 1,482 1,341 11 Holding company cash at 31 December 1,480 2,230 Note II(a): Holding company cash flow page 320 Strategic report Chief Financial Officer’s report on our 2014 financial performance
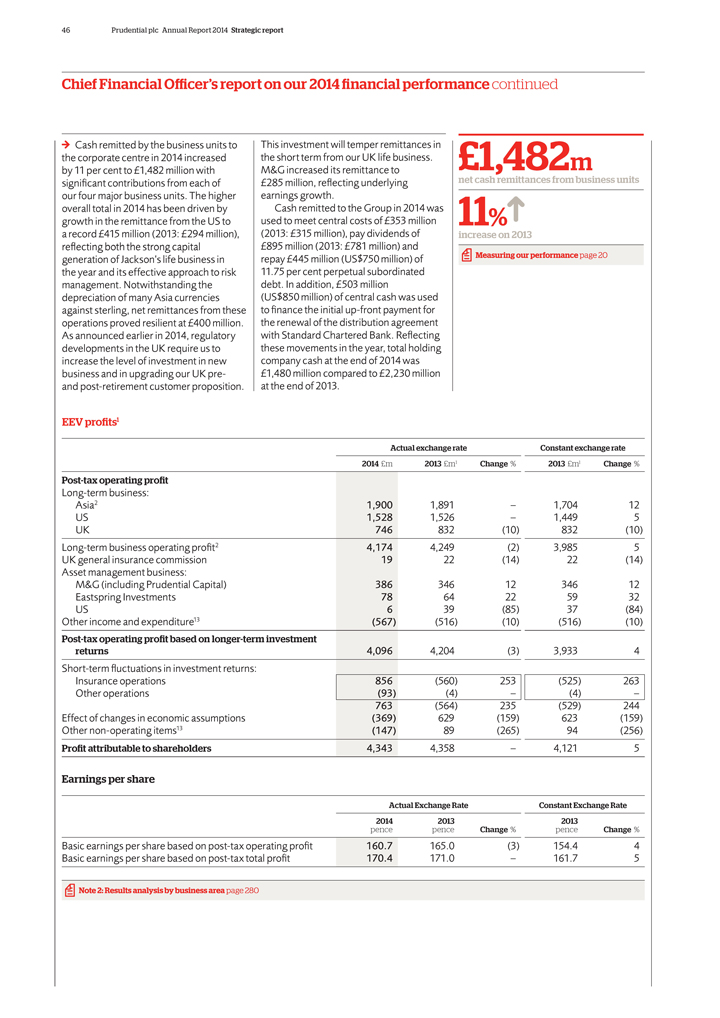
46 Prudential plc Annual Report 2014 Strategic report Chief Financial Officer’s report on our 2014 financial performance continued Cash remitted by the business units to the corporate centre in 2014 increased by 11 per cent to £1,482 million with significant contributions from each of our four major business units. The higher overall total in 2014 has been driven by growth in the remittance from the US to a record £415 million (2013: £294 million), reflecting both the strong capital generation of Jackson’s life business in the year and its effective approach to risk management. Notwithstanding the depreciation of many Asia currencies against sterling, net remittances from these operations proved resilient at £400 million. As announced earlier in 2014, regulatory developments in the UK require us to increase the level of investment in new business and in upgrading our UK pre- and post-retirement customer proposition. This investment will temper remittances in the short term from our UK life business. M&G increased its remittance to £285 million, reflecting underlying earnings growth. Cash remitted to the Group in 2014 was used to meet central costs of £353 million (2013: £315 million), pay dividends of £895 million (2013: £781 million) and repay £445 million (US$750 million) of 11.75 per cent perpetual subordinated debt. In addition, £503 million (US$850 million) of central cash was used to finance the initial up-front payment for the renewal of the distribution agreement with Standard Chartered Bank. Reflecting these movements in the year, total holding company cash at the end of 2014 was £1,480 million compared to £2,230 million at the end of 2013. £1,482m net cash remittances from business units 11% increase on 2013 Measuring our performance page 20 EEV profits1 Actual exchange rate Constant exchange rate 2014 £m 2013 £m1 Change % 2013 £m1 Change % Post-tax operating profit Long-term business: Asia2 1,900 1,891 – 1,704 12 US 1,528 1,526 – 1,449 5 UK 746 832 (10) 832 (10) Long-term business operating profit2 4,174 4,249 (2) 3,985 5 UK general insurance commission 19 22 (14) 22 (14) Asset management business: M&G (including Prudential Capital) 386 346 12 346 12 Eastspring Investments 78 64 22 59 32 US 6 39 (85) 37 (84) 13 Other income and expenditure13 (567) (516) (10) (516) (10) Post-tax operating profit based on longer-term investment returns 4,096 4,204 (3) 3,933 4 Short-term fluctuations in investment returns: Insurance operations 856 (560) 253 (525) 263 Other operations (93) (4) – (4) – 763 (564) 235 (529) 244 Effect of changes in economic assumptions (369) 629 (159) 623 (159) Other non-operating items13 (147) 89 (265) 94 (256) Profit attributable to shareholders 4,343 4,358 – 4,121 5 Earnings per share 2014 pence 2013 pence Change % 2013 pence Change % Basic earnings per share based on post-tax operating profit 160.7 165.0 (3) 154.4 4 Basic earnings per share based on post-tax total profit 170.4 171.0 – 161.7 5 Note 2: Results analysis by business area page 280
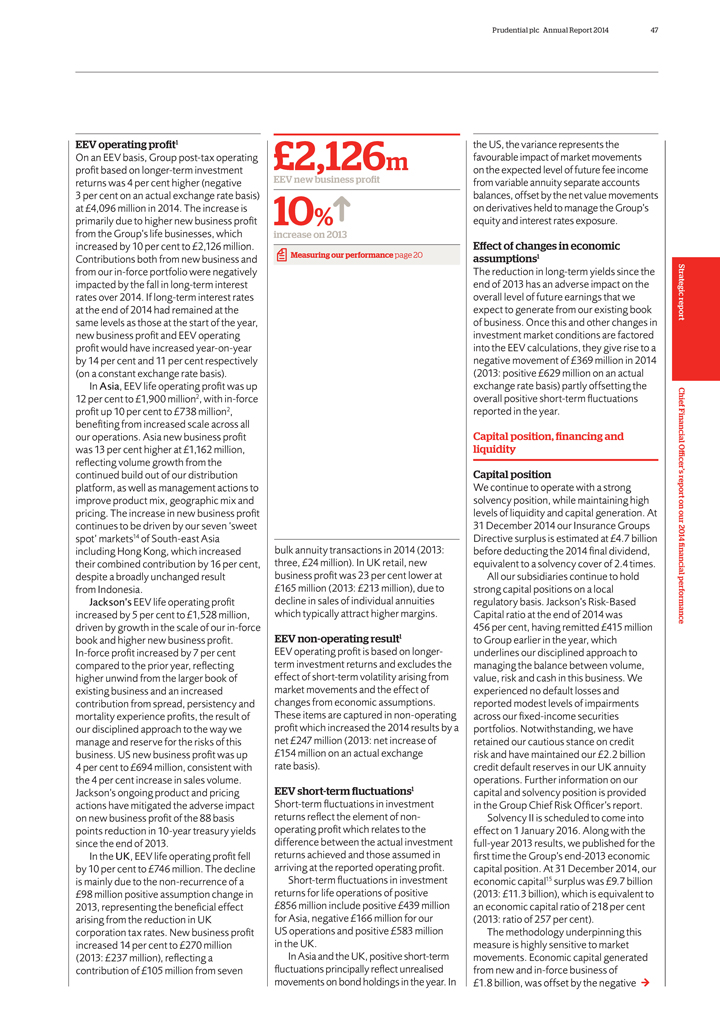
Prudential plc Annual Report 2014 47 EEV operating profit1 On an EEV basis, Group post-tax operating profit based on longer-term investment returns was 4 per cent higher (negative 3 per cent on an actual exchange rate basis) at £4,096 million in 2014. The increase is primarily due to higher new business profit from the Group’s life businesses, which increased by 10 per cent to £2,126 million. Contributions both from new business and from our in-force portfolio were negatively impacted by the fall in long-term interest rates over 2014. If long-term interest rates at the end of 2014 had remained at the same levels as those at the start of the year, new business profit and EEV operating profit would have increased year-on-year by 14 per cent and 11 per cent respectively (on a constant exchange rate basis). In Asia, EEV life operating profit was up 12 per cent to £1,900 million2, with in-force profit up 10 per cent to £738 million2, benefiting from increased scale across all our operations. Asia new business profit was 13 per cent higher at £1,162 million, reflecting volume growth from the continued build out of our distribution platform, as well as management actions to improve product mix, geographic mix and pricing. The increase in new business profit continues to be driven by our seven ‘sweet spot’ markets14 of South-east Asia including Hong Kong, which increased their combined contribution by 16 per cent, despite a broadly unchanged result from Indonesia. Jackson’s EEV life operating profit increased by 5 per cent to £1,528 million, driven by growth in the scale of our in-force book and higher new business profit. In-force profit increased by 7 per cent compared to the prior year, reflecting higher unwind from the larger book of existing business and an increased contribution from spread, persistency and mortality experience profits, the result of our disciplined approach to the way we manage and reserve for the risks of this business. US new business profit was up 4 per cent to £694 million, consistent with the 4 per cent increase in sales volume. Jackson’s ongoing product and pricing actions have mitigated the adverse impact on new business profit of the 88 basis points reduction in 10-year treasury yields since the end of 2013. In the UK, EEV life operating profit fell by 10 per cent to £746 million. The decline is mainly due to the non-recurrence of a £98 million positive assumption change in 2013, representing the beneficial effect arising from the reduction in UK corporation tax rates. New business profit increased 14 per cent to £270 million (2013: £237 million), reflecting a contribution of £105 million from seven £2,126m EEV new business profit 10% increase on 2013 Measuring our performance page 20 bulk annuity transactions in 2014 (2013: three, £24 million). In UK retail, new business profit was 23 per cent lower at £165 million (2013: £213 million), due to decline in sales of individual annuities which typically attract higher margins. EEV non-operating result1 EEV operating profit is based on longer-term investment returns and excludes the effect of short-term volatility arising from market movements and the effect of changes from economic assumptions. These items are captured in non-operating profit which increased the 2014 results by a net £247 million (2013: net increase of £154 million on an actual exchange rate basis). EEV short-term fluctuations1 Short-term fluctuations in investment returns reflect the element of non-operating profit which relates to the difference between the actual investment returns achieved and those assumed in arriving at the reported operating profit. Short-term fluctuations in investment returns for life operations of positive £856 million include positive £439 million for Asia, negative £166 million for our US operations and positive £583 million in the UK. In Asia and the UK, positive short-term fluctuations principally reflect unrealised movements on bond holdings in the year. In the US, the variance represents the favourable impact of market movements on the expected level of future fee income from variable annuity separate accounts balances, offset by the net value movements on derivatives held to manage the Group’s equity and interest rates exposure. Effect of changes in economic assumptions1 The reduction in long-term yields since the end of 2013 has an adverse impact on the overall level of future earnings that we expect to generate from our existing book of business. Once this and other changes in investment market conditions are factored into the EEV calculations, they give rise to a negative movement of £369 million in 2014 (2013: positive £629 million on an actual exchange rate basis) partly offsetting the overall positive short-term fluctuations reported in the year. Capital position, financing and liquidity Capital position We continue to operate with a strong solvency position, while maintaining high levels of liquidity and capital generation. At 31 December 2014 our Insurance Groups Directive surplus is estimated at £4.7 billion before deducting the 2014 final dividend, equivalent to a solvency cover of 2.4 times. All our subsidiaries continue to hold strong capital positions on a local regulatory basis. Jackson’s Risk-Based Capital ratio at the end of 2014 was 456 per cent, having remitted £415 million to Group earlier in the year, which underlines our disciplined approach to managing the balance between volume, value, risk and cash in this business. We experienced no default losses and reported modest levels of impairments across our fixed-income securities portfolios. Notwithstanding, we have retained our cautious stance on credit risk and have maintained our £2.2 billion credit default reserves in our UK annuity operations. Further information on our capital and solvency position is provided in the Group Chief Risk Officer’s report. Solvency II is scheduled to come into effect on 1 January 2016. Along with the full-year 2013 results, we published for the first time the Group’s end-2013 economic capital position. At 31 December 2014, our economic capital15 surplus was £9.7 billion (2013: £11.3 billion), which is equivalent to an economic capital ratio of 218 per cent (2013: ratio of 257 per cent). The methodology underpinning this measure is highly sensitive to market movements. Economic capital generated from new and in-force business of £1.8 billion, was offset by the negative Strategic report Chief Financial Officer’s report on our 2014 financial performance
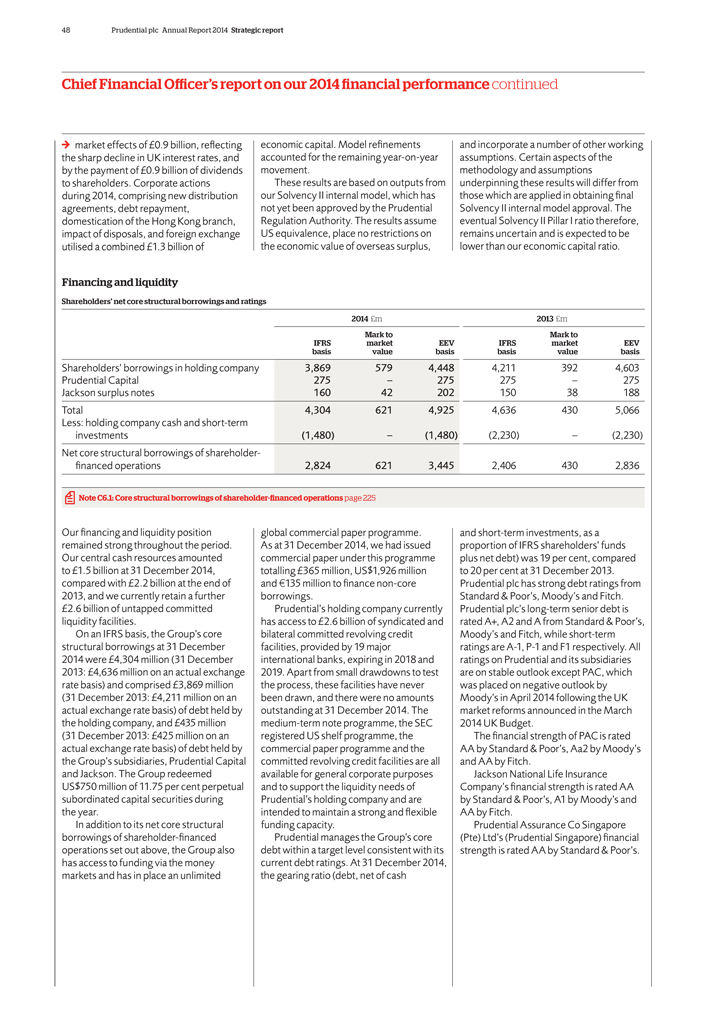
48 Prudential plc Annual Report 2014 Strategic report Chief Financial Officer’s report on our 2014 financial performance continued market effects of £0.9 billion, reflecting the sharp decline in UK interest rates, and by the payment of £0.9 billion of dividends to shareholders. Corporate actions during 2014, comprising new distribution agreements, debt repayment, domestication of the Hong Kong branch, impact of disposals, and foreign exchange utilised a combined £1.3 billion of economic capital. Model refinements accounted for the remaining year-on-year movement. These results are based on outputs from our Solvency II internal model, which has not yet been approved by the Prudential Regulation Authority. The results assume US equivalence, place no restrictions on the economic value of overseas surplus, and incorporate a number of other working assumptions. Certain aspects of the methodology and assumptions underpinning these results will differ from those which are applied in obtaining final Solvency II internal model approval. The eventual Solvency II Pillar I ratio therefore, remains uncertain and is expected to be lower than our economic capital ratio. Financing and liquidity Shareholders’ net core structural borrowings and ratings 2014 £m 2013 £m IFRS basis Mark to market value EEV basis IFRS basis Mark to market value EEV basis Shareholders’ borrowings in holding company 3,869 579 4,448 4,211 392 4,603 Prudential Capital 275 – 275 275 – 275 Jackson surplus notes 160 42 202 150 38 188 Total 4,304 621 4,925 4,636 430 5,066 Less: holding company cash and short-term investments (1,480) – (1,480) (2,230) – (2,230) Net core structural borrowings of shareholder- financed operations 2,824 621 3,445 2,406 430 2,836 Note C6.1: Core structural borrowings of shareholder-financed operations page 225 Our financing and liquidity position remained strong throughout the period. Our central cash resources amounted to £1.5 billion at 31 December 2014, compared with £2.2 billion at the end of 2013, and we currently retain a further £2.6 billion of untapped committed liquidity facilities. On an IFRS basis, the Group’s core structural borrowings at 31 December 2014 were £4,304 million (31 December 2013: £4,636 million on an actual exchange rate basis) and comprised £3,869 million (31 December 2013: £4,211 million on an actual exchange rate basis) of debt held by the holding company, and £435 million (31 December 2013: £425 million on an actual exchange rate basis) of debt held by the Group’s subsidiaries, Prudential Capital and Jackson. The Group redeemed US$750 million of 11.75 per cent perpetual subordinated capital securities during the year. In addition to its net core structural borrowings of shareholder-financed operations set out above, the Group also has access to funding via the money markets and has in place an unlimited global commercial paper programme. As at 31 December 2014, we had issued commercial paper under this programme totalling £365 million, US$1,926 million and e135 million to finance non-core borrowings. Prudential’s holding company currently has access to £2.6 billion of syndicated and bilateral committed revolving credit facilities, provided by 19 major international banks, expiring in 2018 and 2019. Apart from small drawdowns to test the process, these facilities have never been drawn, and there were no amounts outstanding at 31 December 2014. The medium-term note programme, the SEC registered US shelf programme, the commercial paper programme and the committed revolving credit facilities are all available for general corporate purposes and to support the liquidity needs of Prudential’s holding company and are intended to maintain a strong and flexible funding capacity. Prudential manages the Group’s core debt within a target level consistent with its current debt ratings. At 31 December 2014, the gearing ratio (debt, net of cash and short-term investments, as a proportion of IFRS shareholders’ funds plus net debt) was 19 per cent, compared to 20 per cent at 31 December 2013. Prudential plc has strong debt ratings from Standard & Poor’s, Moody’s and Fitch. Prudential plc’s long-term senior debt is rated A+, A2 and A from Standard & Poor’s, Moody’s and Fitch, while short-term ratings are A-1, P-1 and F1 respectively. All ratings on Prudential and its subsidiaries are on stable outlook except PAC, which was placed on negative outlook by Moody’s in April 2014 following the UK market reforms announced in the March 2014 UK Budget. The financial strength of PAC is rated AA by Standard & Poor’s, Aa2 by Moody’s and AA by Fitch. Jackson National Life Insurance Company’s financial strength is rated AA by Standard & Poor’s, A1 by Moody’s and AA by Fitch. Prudential Assurance Co Singapore (Pte) Ltd’s (Prudential Singapore) financial strength is rated AA by Standard & Poor’s.
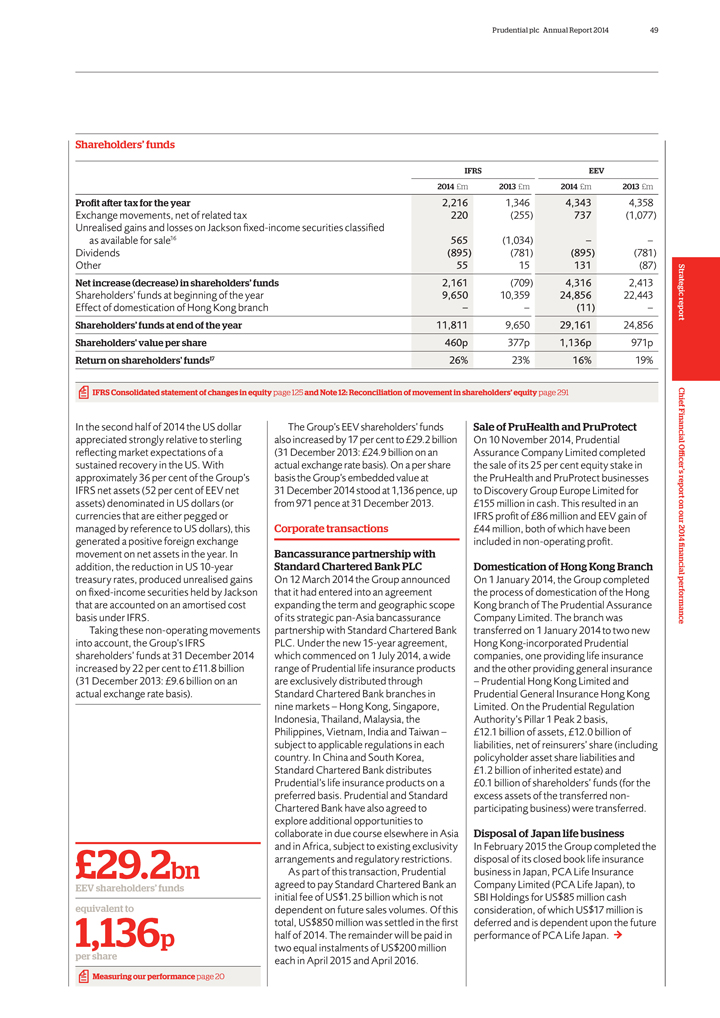
Prudential plc Annual Report 2014 49 Shareholders’ funds IFRS EEV 2014 £m 2013 £m 2014 £m 2013 £m Profit after tax for the year 2,216 1,346 4,343 4,358 Exchange movements, net of related tax 220 (255) 737 (1,077) Unrealised gains and losses on Jackson fixed-income securities classified as available for sale16 565 (1,034) – – Dividends (895) (781) (895) (781) Other 55 15 131 (87) Net increase (decrease) in shareholders’ funds 2,161 (709) 4,316 2,413 Shareholders’ funds at beginning of the year 9,650 10,359 24,856 22,443 Effect of domestication of Hong Kong branch – – (11) – Shareholders’ funds at end of the year 11,811 9,650 29,161 24,856 Shareholders’ value per share 460p 377p 1,136p 971p Return on shareholders’ funds17 26% 23% 16% 19% IFRS Consolidated statement of changes in equity page 125 and Note 12: Reconciliation of movement in shareholders’ equity page 291 In the second half of 2014 the US dollar appreciated strongly relative to sterling reflecting market expectations of a sustained recovery in the US. With approximately 36 per cent of the Group’s IFRS net assets (52 per cent of EEV net assets) denominated in US dollars (or currencies that are either pegged or managed by reference to US dollars), this generated a positive foreign exchange movement on net assets in the year. In addition, the reduction in US 10-year treasury rates, produced unrealised gains on fixed-income securities held by Jackson that are accounted on an amortised cost basis under IFRS. Taking these non-operating movements into account, the Group’s IFRS shareholders’ funds at 31 December 2014 increased by 22 per cent to £11.8 billion (31 December 2013: £9.6 billion on an actual exchange rate basis). £29.2bn EEV shareholders’ funds equivalent to 1,136p per share Measuring our performance page 20 The Group’s EEV shareholders’ funds also increased by 17 per cent to £29.2 billion (31 December 2013: £24.9 billion on an actual exchange rate basis). On a per share basis the Group’s embedded value at 31 December 2014 stood at 1,136 pence, up from 971 pence at 31 December 2013. Corporate transactions Bancassurance partnership with Standard Chartered Bank PLC On 12 March 2014 the Group announced that it had entered into an agreement expanding the term and geographic scope of its strategic pan-Asia bancassurance partnership with Standard Chartered Bank PLC. Under the new 15-year agreement, which commenced on 1 July 2014, a wide range of Prudential life insurance products are exclusively distributed through Standard Chartered Bank branches in nine markets – Hong Kong, Singapore, Indonesia, Thailand, Malaysia, the Philippines, Vietnam, India and Taiwan – subject to applicable regulations in each country. In China and South Korea, Standard Chartered Bank distributes Prudential’s life insurance products on a preferred basis. Prudential and Standard Chartered Bank have also agreed to explore additional opportunities to collaborate in due course elsewhere in Asia and in Africa, subject to existing exclusivity arrangements and regulatory restrictions. As part of this transaction, Prudential agreed to pay Standard Chartered Bank an initial fee of US$1.25 billion which is not dependent on future sales volumes. Of this total, US$850 million was settled in the first half of 2014. The remainder will be paid in two equal instalments of US$200 million each in April 2015 and April 2016. Sale of PruHealth and PruProtect On 10 November 2014, Prudential Assurance Company Limited completed the sale of its 25 per cent equity stake in the PruHealth and PruProtect businesses to Discovery Group Europe Limited for £155 million in cash. This resulted in an IFRS profit of £86 million and EEV gain of £44 million, both of which have been included in non-operating profit. Domestication of Hong Kong Branch On 1 January 2014, the Group completed the process of domestication of the Hong Kong branch of The Prudential Assurance Company Limited. The branch was transferred on 1 January 2014 to two new Hong Kong-incorporated Prudential companies, one providing life insurance and the other providing general insurance – Prudential Hong Kong Limited and Prudential General Insurance Hong Kong Limited. On the Prudential Regulation Authority’s Pillar 1 Peak 2 basis, £12.1 billion of assets, £12.0 billion of liabilities, net of reinsurers’ share (including policyholder asset share liabilities and £1.2 billion of inherited estate) and £0.1 billion of shareholders’ funds (for the excess assets of the transferred non-participating business) were transferred. Disposal of Japan life business In February 2015 the Group completed the disposal of its closed book life insurance business in Japan, PCA Life Insurance Company Limited (PCA Life Japan), to SBI Holdings for US$85 million cash consideration, of which US$17 million is deferred and is dependent upon the future performance of PCA Life Japan. Strategic report Chief Financial Officer’s report on our 2014 financial performance
50 Prudential plc Annual Report 2014 Strategic report Chief Financial Officer’s report on our 2014 financial performance continued Entrance into Ghana and Kenya life insurance markets In April 2014 we completed the acquisition of Express Life of Ghana, and in September 2014 we entered the Kenyan life insurance market via our acquisition of Shield Assurance Company Limited. Dividend The Board has decided to rebase the full-year dividend upwards by 10 per cent, reflecting the 2014 financial performance of the Group. In line with this, the directors recommend a final dividend of 25.74 pence per share (2013: 23.84 pence), which brings the total dividend for the year to 36.93 pence (2013: 33.57 pence). This rebase has been made possible by the continued exceptionally strong performance of the Group. Although the Board has been able to recommend such a rebase in 2014, the Group’s dividend policy remains unchanged. The Board will maintain its focus on delivering a growing dividend from this new higher base, which will continue to be determined after taking into account the Group’s financial flexibility and our assessment of opportunities to generate attractive returns by investing in specific areas of the business. The Board believes that in the medium term a dividend cover of around two times is appropriate. Notes 1 The 2014 EEV results of the Group are presented on a post-tax basis and, accordingly 2013 results are shown on a comparable basis. 2 After Asia development costs. 3 Refer to note B1.1 in IFRS financial statements for the breakdown of other income and expenditure, and other non-operating items. 4 Includes Group’s proportionate share of the liabilities and associated flows of the insurance joint ventures in Asia. 5 Defined as movements in shareholder-backed policyholder liabilities arising from premiums (net of charges), surrenders/withdrawals, maturities and deaths. 6 For basis of preparation, see note I (a) of additional unaudited IFRS financial information. 7 Includes Group’s proportionate share in PPM South Africa and the Asia asset management joint ventures. 8 Net inflows exclude Asia Money Market Fund (MMF) inflows of £9 million (2013: net inflows £522 million). External funds under management exclude Asia MMF balances of £4,800 million (2013: £4,296 million). 9 Free surplus generation represents ‘underlying free surplus’ based on operating movements, including the general insurance commission earned during the period, and excludes market movements, foreign exchange, capital movements, shareholders’ other income and expenditure and centrally arising restructuring and Solvency II implementation costs. In addition, following its reclassification as held for sale during 2013, operating results exclude the result of the Japan life insurance business. 10 Investment in new business as a percentage of underlying free surplus generated from in-force life business and asset management. 11 Payback period, measured on an undiscounted basis, is the time in which the initial ‘cash’ outflow of investment is expected to be recovered from the ‘cash’ inflows generated by the investment. The ‘cash’ outflow is measured by our investment of free surplus in new business sales. The payback period equals the time taken for new business sales to generate free surplus to cover this investment. 12 The full holding company cash flow is disclosed in note II (a) of additional unaudited IFRS financial information. 13 Refer to the EEV basis supplementary information – post-tax operating profit based on longer-term investment returns and post-tax summarised consolidated income statement, for the breakdown of other income and expenditure, and other non-operating items. 14 ‘Sweet spot’ markets are Indonesia, Singapore, Hong Kong, Malaysia, Philippines, Vietnam and Thailand. 15 The methodology and assumptions used in calculating the economic capital results are set out in note II (c) of additional unaudited financial information. The economic capital ratio is based on outputs from the Group’s Solvency II internal model which will be subject to Prudential Regulation Authority review and approval before its formal adoption in 2016. We remain on track to submit our Solvency II internal model to the Prudential Regulation Authority for approval in 2015 but, given the degree of uncertainty remaining, these economic capital disclosures should not be interpreted as outputs from an approved internal model. 16 Net of related charges to deferred acquisition costs and tax. 17 Operating profit after tax and non-controlling interests as percentage of opening shareholders’ funds.
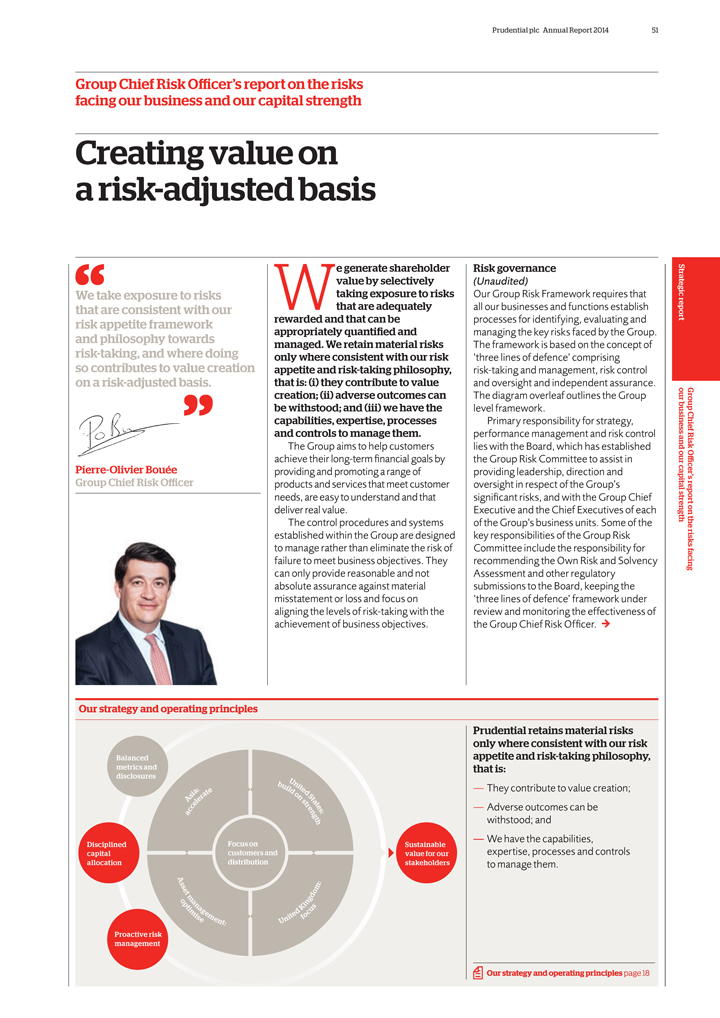
Prudential plc Annual Report 2014 51
Group Chief
Risk Officer’s report on the risks facing our business and our capital strength
Creating value on a risk-adjusted basis
We take exposure to risks that are consistent with our risk appetite framework and philosophy towards risk-taking, and where doing so contributes to value creation on a
risk-adjusted basis.
Pierre-Olivier Bouée Group Chief Risk Officer
e
generate shareholder value by selectively Wtaking exposure to risks that are adequately rewarded and that can be appropriately quantified and managed. We retain material risks only where consistent with our risk appetite and risk-taking philosophy,
that is: (i) they contribute to value creation; (ii) adverse outcomes can be withstood; and (iii) we have the capabilities, expertise, processes and controls to manage them.
The Group aims to help customers achieve their long-term financial goals by providing and promoting a range of products and services that meet customer needs, are easy to
understand and that deliver real value.
The control procedures and systems established within the Group are designed to manage rather than eliminate the risk of
failure to meet business objectives. They can only provide reasonable and not absolute assurance against material misstatement or loss and focus on aligning the levels of risk-taking with the achievement of business objectives.
Risk governance
(Unaudited)
Our Group Risk Framework requires that all our businesses and functions establish processes for identifying, evaluating and managing the key risks faced by the Group. The framework
is based on the concept of ‘three lines of defence’ comprising risk-taking and management, risk control and oversight and independent assurance. The diagram overleaf outlines the Group level framework.
Primary responsibility for strategy, performance management and risk control lies with the Board, which has established the Group Risk Committee to assist in providing leadership,
direction and oversight in respect of the Group’s significant risks, and with the Group Chief Executive and the Chief Executives of each of the Group’s business units. Some of the key responsibilities of the Group Risk Committee include
the responsibility for recommending the Own Risk and Solvency Assessment and other regulatory submissions to the Board, keeping the ‘three lines of defence’ framework under review and monitoring the effectiveness of the Group Chief Risk
Officer.
inciples
Balanced metrics and disclosures b Un ui it
: e l e i a t d d s r a on S
A l e s t a e t r t c e e a c n gs : t h
Disciplined Focus on Sustainable capital customers and value for our allocation distribution stakeholders
A : s s e m t d o o m g p a i n t i na K s g d u m e e c is m i t f o e ent U n
:
Proactive risk management
Prudential retains material risks only where consistent with our
risk appetite and risk-taking philosophy, that is:
— They contribute to value creation;
— Adverse outcomes can be withstood; and
— We have the capabilities, expertise,
processes and controls to manage them.
Our strategy and operating principles page 18
Group Chief Risk Officer’s report on the risks facing Strategic report our business and our capital strength
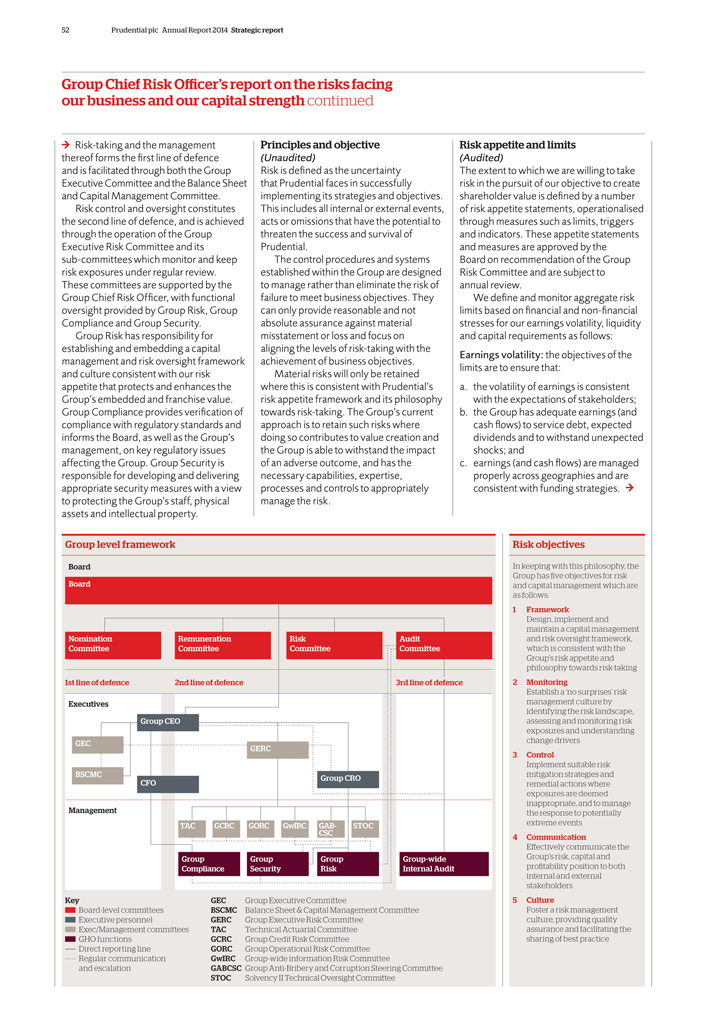
52 Prudential plc Annual Report 2014 Strategic report
Group Chief Risk Offi cer’s report on the risks facing our business and our capital strength continued
Risk-taking and the management thereof forms the ? rst line of defence and is facilitated through both the Group Executive Committee and the Balance Sheet and Capital Management
Committee.
Risk control and oversight constitutes the second line of defence, and is achieved through the operation of the Group Executive Risk Committee and its
sub-committees which monitor and keep risk exposures under regular review. These committees are supported by the Group Chief Risk Of? cer, with functional oversight provided by Group Risk, Group Compliance and Group Security.
Group Risk has responsibility for establishing and embedding a capital management and risk oversight framework and culture consistent with our risk appetite that protects and
enhances the Group’s embedded and franchise value. Group Compliance provides veri? cation of compliance with regulatory standards and informs the Board, as well as the Group’s management, on key regulatory issues affecting the Group. Group
Security is responsible for developing and delivering appropriate security measures with a view to protecting the Group’s staff, physical assets and intellectual property.
Principles and objective
(Unaudited)
Risk is de? ned as the uncertainty that Prudential faces in successfully implementing its strategies and objectives. This includes all internal or external events, acts or
omissions that have the potential to threaten the success and survival of Prudential.
The control procedures and systems established within the Group are designed
to manage rather than eliminate the risk of failure to meet business objectives. They can only provide reasonable and not absolute assurance against material misstatement or loss and focus on aligning the levels of risk-taking with the achievement
of business objectives.
Material risks will only be retained where this is consistent with Prudential’s risk appetite framework and its philosophy towards
risk-taking. The Group’s current approach is to retain such risks where doing so contributes to value creation and the Group is able to withstand the impact of an adverse outcome, and has the necessary capabilities, expertise, processes and
controls to appropriately manage the risk.
Risk appetite and limits
(Audited)
The extent to which we are willing to take risk in the pursuit of our objective to create shareholder value is de? ned by a number of risk appetite statements,
operationalised through measures such as limits, triggers and indicators. These appetite statements and measures are approved by the Board on recommendation of the Group Risk Committee and are subject to annual review.
We de? ne and monitor aggregate risk limits based on ? nancial and non-? nancial stresses for our earnings volatility, liquidity and capital requirements as follows:
Earnings volatility: the objectives of the limits are to ensure that:
a. the volatility of
earnings is consistent with the expectations of stakeholders; b. the Group has adequate earnings (and cash ? ows) to service debt, expected dividends and to withstand unexpected shocks; and c. earnings (and cash ? ows) are managed properly across
geographies and are consistent with funding strategies.
Group level framework
Board
Board
Nomination Remuneration Risk Audit Committee Committee Committee Committee
1st line of defence
2nd line of defence 3rd line of defence Executives Group CEO
GEC GERC
BSCMC
Group CRO CFO
Management
TAC GCRC GORC GwIRC GAB- STOC CSC
Group Group Group Group-wide Compliance Security Risk
Internal Audit
Key GEC Group Executive Committee
Board-level committees BSCMC
Balance Sheet & Capital Management Committee Executive personnel GERC Group Executive Risk Committee Exec/Management committees TAC Technical Actuarial Committee GHO functions GCRC Group Credit Risk Committee Direct reporting line GORC Group
Operational Risk Committee Regular communication GwIRC Group-wide information Risk Committee and escalation GABCSC Group Anti-Bribery and Corruption Steering Committee STOC Solvency II Technical Oversight Committee
Risk objectives
In keeping with this philosophy, the Group has fi ve objectives for risk and
capital management which are as follows:
1 Framework
Design, implement and
maintain a capital management and risk oversight framework, which is consistent with the Group’s risk appetite and philosophy towards risk-taking
2 Monitoring
Establish a ‘no surprises’ risk management culture by identifying the risk landscape, assessing and monitoring risk exposures and understanding change
drivers
3 Control
Implement suitable risk mitigation strategies and remedial
actions where exposures are deemed inappropriate, and to manage the response to potentially extreme events
4 Communication
Eff ectively communicate the Group’s risk, capital and profi tability position to both internal and external stakeholders
5 Culture
Foster a risk management culture, providing quality assurance and facilitating the
sharing of best practice
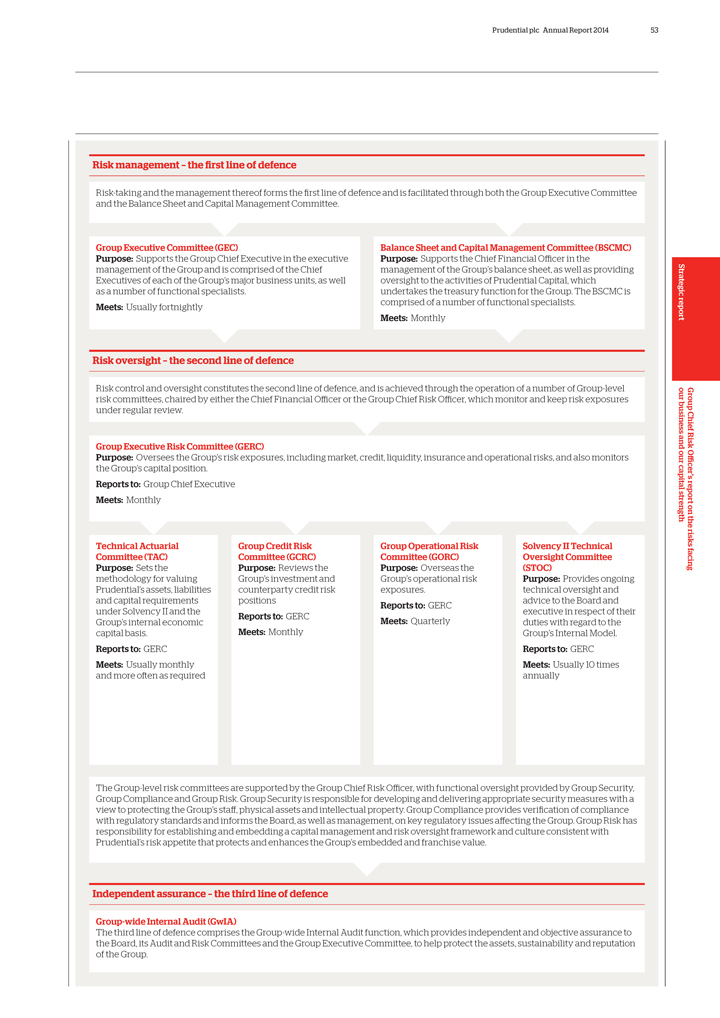
Prudential plc Annual Report 2014 53
Risk
management – the first line of defence
Risk-taking and the management thereof forms the first line of defence and is facilitated through both the Group
Executive Committee and the Balance Sheet and Capital Management Committee.
Group Executive Committee (GEC)
Purpose: Supports the Group Chief Executive in the executive management of the Group and is comprised of the Chief Executives of each of the Group’s major business units, as
well as a number of functional specialists.
Meets: Usually fortnightly
Balance Sheet and Capital Management Committee (BSCMC) Purpose: Supports the Chief Financial Officer in the management of the Group’s balance sheet, as well
as providing oversight to the activities of Prudential Capital, which undertakes the treasury function for the Group. The BSCMC is comprised of a number of functional specialists.
Meets: Monthly
Risk oversight – the second line of defence
Risk control and oversight constitutes the second line of defence, and is achieved through the operation of a number of Group-level risk committees, chaired by either the Chief
Financial Officer or the Group Chief Risk Officer, which monitor and keep risk exposures under regular review.
Group Executive Risk Committee (GERC)
Purpose: Oversees the Group’s risk exposures, including market, credit, liquidity, insurance and operational risks, and also monitors the Group’s capital position.
Reports to: Group Chief Executive Meets: Monthly
Technical Actuarial
Committee (TAC) Purpose: Sets the methodology for valuing Prudential’s assets, liabilities and capital requirements under Solvency II and the Group’s internal economic capital basis.
Reports to: GERC
Meets: Usually monthly and more often as required
Group Credit Risk Committee (GCRC) Purpose: Reviews the Group’s investment and counterparty credit risk positions
Reports to: GERC
Meets: Monthly
Group Operational Risk Committee (GORC) Purpose: Overseas the Group’s operational risk exposures.
Reports to: GERC
Meets: Quarterly
Solvency II Technical Oversight Committee (STOC) Purpose: Provides ongoing technical oversight and advice to the Board and executive in respect of their duties with regard to the
Group’s Internal Model.
Reports to: GERC
Meets: Usually 10 times
annually
The Group-level risk committees are supported by the Group Chief Risk Officer, with functional oversight provided by Group Security, Group Compliance and
Group Risk. Group Security is responsible for developing and delivering appropriate security measures with a view to protecting the Group’s staff, physical assets and intellectual property. Group Compliance provides verification of compliance
with regulatory standards and informs the Board, as well as management, on key regulatory issues affecting the Group. Group Risk has responsibility for establishing and embedding a capital management and risk oversight framework and culture
consistent with Prudential’s risk appetite that protects and enhances the Group’s embedded and franchise value.
Independent assurance – the third
line of defence
Group-wide Internal Audit (GwIA)
The third line of defence
comprises the Group-wide Internal Audit function, which provides independent and objective assurance to the Board, its Audit and Risk Committees and the Group Executive Committee, to help protect the assets, sustainability and reputation of the
Group.
Group Chief Risk Officer’s report on the risks facing Strategic report our business and our capital strength

54 Prudential plc Annual Report 2014 Strategic report
Group Chief Risk Officer’s report on the risks facing our business and our capital strength continued
The two measures used to monitor the volatility of earnings are EEV operating profit and IFRS operating profit, although EEV and IFRS total profits are also considered.
Liquidity: the objective is to ensure that the Group is able to generate sufficient cash resources to meet financial obligations as they fall due in business as usual and stressed
scenarios.
Capital requirements: the limits aim to ensure that: a. the Group meets its internal economic capital requirements; b. the Group achieves its desired
target rating to meet its business objectives; and c. supervisory intervention is avoided. The two measures used are the EU Insurance Groups Directive (IGD) capital requirements and internal economic capital requirements. In addition, capital
requirements are monitored on both local statutory and future Solvency II regulatory bases.
We also define risk appetite statements and measures (ie limits,
triggers and indicators) for the major constituents of each risk type as categorised and defined in the Group Risk Framework, where appropriate. These appetite statements and measures cover the most significant exposures to the Group, particularly
those that could impact our aggregate risk limits.
The Group Risk Framework risk categorisation is shown in the table below.
Our risk appetite framework forms an integral part of our annual business planning cycle. The Group Risk Committee is responsible for reviewing the risks inherent in the
Group’s business plan and for providing the Board with input on the risk/reward trade-offs implicit therein. This review is supported by the Group risk function, which uses submissions by business units to calculate the Group’s aggregated
position (allowing for diversification effects between business units) relative to the aggregate risk limits.
Risk policies
(Audited)
Risk policies set out specific requirements for the management of, and articulate
the risk appetite for, key risk types. There are policies for credit, market, insurance, liquidity, operational and tax risk, as well as dealing controls. They form part of the Group Governance Manual, which was developed to make a key contribution
to the sound system of internal control that we are expected to maintain under the UK Corporate Governance Code and the Hong Kong Code on Corporate Governance Practices. Group Head Office and business units confirm that they have implemented the
necessary controls to evidence compliance with the Group Governance Manual.
Risk culture
(Unaudited)
We work to promote a responsible risk culture in three main ways: a. by the
leadership and behaviours demonstrated by management; b. by building skills and capabilities to support management; and c. by including risk management (through the balance of risk with profitability and growth) in the performance evaluation of
individuals.
The remuneration strategy at Prudential is designed to be consistent with its risk appetite, and the Group Chief Risk Officer advises the Group
Remuneration Committee on adherence to our risk framework and appetite.
Risk reporting
(Unaudited)
An annual ‘top-down’ identification of our top risks assesses the risks
that have the greatest potential to impact the Group’s operating results and financial condition. The management information received by the Group Risk Committee and the Board is tailored around these risks, and it also covers ongoing
developments in other key and emerging risks. A discussion of the key risks, including how they affect our operations and how they are managed, follows below.
Group Risk Framework risk categorisation
Category Risk type Definition
Financial risks Market risk The risk of loss for the Group’s business, or of adverse change in the financial situation, resulting, directly or indirectly,
from fuctuations in the level or volatility of market prices of assets and liabilities.
Credit risk The risk of loss for the Group’s business or of adverse
change in the financial position, resulting from fuctuations in the credit standing of issuers of securities, counterparties and any debtors in the form of default or other significant credit event (e.g. downgrade or spread widening).
Insurance risk The risk of loss for the Group’s business or of adverse change in the value of insurance liabilities, resulting from changes in the level, trend or volatility
of a number of insurance risk drivers. This includes adverse mortality, longevity, morbidity, persistency and expense experience.
Liquidity risk The risk of the
Group being unable to generate sufficient cash resources or to meet financial obligations as they fall due in business as usual and stress scenarios.
Non-financial
risks Operational risk The risk of loss arising from inadequate or failed internal processes, or from personnel and systems, or from external events other than those covered by business environment risk.
Business Exposure to forces in the external environment that could significantly change the environment risk fundamentals that drive the business’s overall strategy.
Strategic risk Ineffective, inefficient or inadequate senior management processes for the development and implementation of business strategy in relation to the
business environment and the Group’s capabilities.
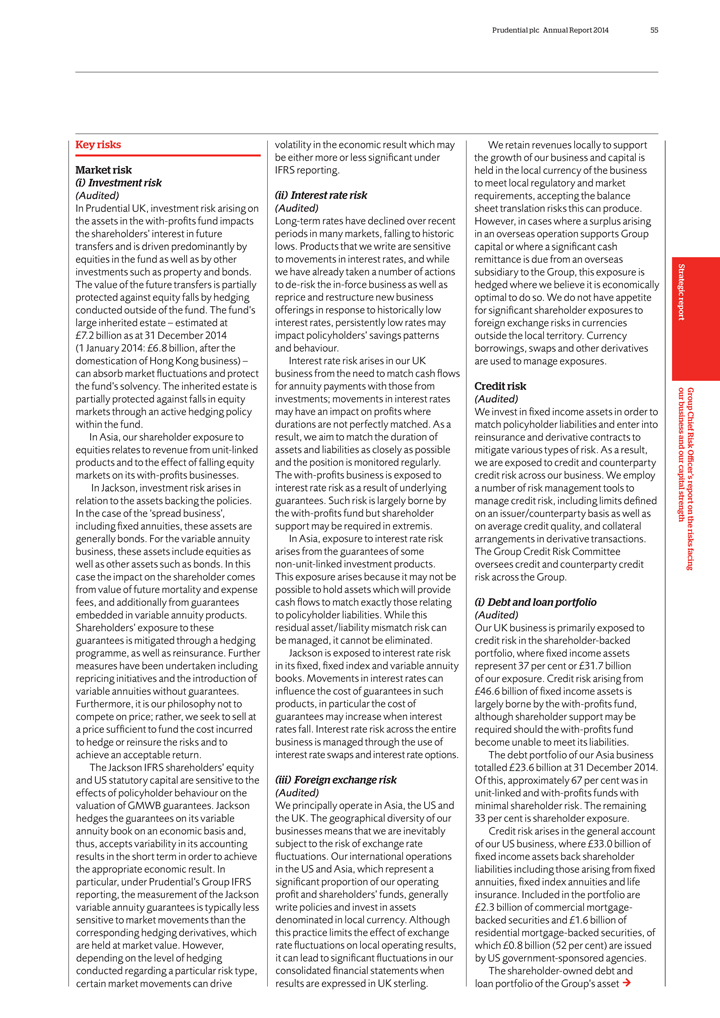
Prudential plc Annual Report 2014 55
Key risks
Market risk
(i) Investment risk
(Audited)
In Prudential UK, investment risk arising on the assets in the with-profits fund
impacts the shareholders’ interest in future transfers and is driven predominantly by equities in the fund as well as by other investments such as property and bonds. The value of the future transfers is partially protected against equity falls
by hedging conducted outside of the fund. The fund’s large inherited estate – estimated at £7.2 billion as at 31 December 2014
(1 January
2014: £6.8 billion, after the domestication of Hong Kong business) – can absorb market fluctuations and protect the fund’s solvency. The inherited estate is partially protected against falls in equity markets through an active
hedging policy within the fund.
In Asia, our shareholder exposure to equities relates to revenue from unit-linked products and to the effect of falling equity
markets on its with-profits businesses.
In Jackson, investment risk arises in relation to the assets backing the policies. In the case of the ‘spread
business’, including fixed annuities, these assets are generally bonds. For the variable annuity business, these assets include equities as well as other assets such as bonds. In this case the impact on the shareholder comes from value of
future mortality and expense fees, and additionally from guarantees embedded in variable annuity products. Shareholders’ exposure to these guarantees is mitigated through a hedging programme, as well as reinsurance. Further measures have been
undertaken including repricing initiatives and the introduction of variable annuities without guarantees. Furthermore, it is our philosophy not to compete on price; rather, we seek to sell at a price sufficient to fund the cost incurred to hedge or
reinsure the risks and to achieve an acceptable return.
The Jackson IFRS shareholders’ equity and US statutory capital are sensitive to the effects of
policyholder behaviour on the valuation of GMWB guarantees. Jackson hedges the guarantees on its variable annuity book on an economic basis and, thus, accepts variability in its accounting results in the short term in order to achieve the
appropriate economic result. In particular, under Prudential’s Group IFRS reporting, the measurement of the Jackson variable annuity guarantees is typically less sensitive to market movements than the corresponding hedging derivatives, which
are held at market value. However, depending on the level of hedging conducted regarding a particular risk type, certain market movements can drive
volatility in
the economic result which may be either more or less significant under IFRS reporting.
(ii) Interest rate risk
(Audited)
Long-term rates have declined over recent periods in many markets, falling to
historic lows. Products that we write are sensitive to movements in interest rates, and while we have already taken a number of actions to de-risk the in-force business as well as reprice and restructure new business offerings in response to
historically low interest rates, persistently low rates may impact policyholders’ savings patterns and behaviour.
Interest rate risk arises in our UK business
from the need to match cash fows for annuity payments with those from investments; movements in interest rates may have an impact on profits where durations are not perfectly matched. As a result, we aim to match the duration of assets and
liabilities as closely as possible and the position is monitored regularly. The with-profits business is exposed to interest rate risk as a result of underlying guarantees. Such risk is largely borne by the with-profits fund but shareholder support
may be required in extremis.
In Asia, exposure to interest rate risk arises from the guarantees of some non-unit-linked investment products. This exposure arises
because it may not be possible to hold assets which will provide cash fows to match exactly those relating to policyholder liabilities. While this residual asset/liability mismatch risk can be managed, it cannot be eliminated.
Jackson is exposed to interest rate risk in its fixed, fixed index and variable annuity books. Movements in interest rates can influence the cost of guarantees in such products, in
particular the cost of guarantees may increase when interest rates fall. Interest rate risk across the entire business is managed through the use of interest rate swaps and interest rate options.
(iii) Foreign exchange risk
(Audited)
We principally operate in Asia, the US and the UK. The geographical diversity of our businesses means that we are inevitably subject to the risk of exchange rate fluctuations. Our
international operations in the US and Asia, which represent a significant proportion of our operating profit and shareholders’ funds, generally write policies and invest in assets denominated in local currency. Although this practice limits
the effect of exchange rate fluctuations on local operating results, it can lead to significant fluctuations in our consolidated financial statements when results are expressed in UK sterling.
We retain revenues locally to support the growth of our business and capital is held in the local currency of the business to meet local regulatory and market requirements,
accepting the balance sheet translation risks this can produce. However, in cases where a surplus arising in an overseas operation supports Group capital or where a significant cash remittance is due from an overseas subsidiary to the Group, this
exposure is hedged where we believe it is economically optimal to do so. We do not have appetite for significant shareholder exposures to foreign exchange risks in currencies outside the local territory. Currency borrowings, swaps and other
derivatives are used to manage exposures.
Credit risk
(Audited)
We invest in fixed income assets in order to match policyholder liabilities and enter into reinsurance and derivative contracts to mitigate various types of risk. As a result, we
are exposed to credit and counterparty credit risk across our business. We employ a number of risk management tools to manage credit risk, including limits defined on an issuer/counterparty basis as well as on average credit quality, and collateral
arrangements in derivative transactions. The Group Credit Risk Committee oversees credit and counterparty credit risk across the Group.
(i) Debt and loan portfolio
(Audited)
Our UK business is primarily exposed to credit risk in the
shareholder-backed portfolio, where fixed income assets represent 37 per cent or £31.7 billion of our exposure. Credit risk arising from £46.6 billion of fixed income assets is largely borne by the with-profits fund, although
shareholder support may be required should the with-profits fund become unable to meet its liabilities.
The debt portfolio of our Asia business totalled
£23.6 billion at 31 December 2014. Of this, approximately 67 per cent was in unit-linked and with-profits funds with minimal shareholder risk. The remaining 33 per cent is shareholder exposure.
Credit risk arises in the general account of our US business, where £33.0 billion of fixed income assets back shareholder liabilities including those arising from fixed
annuities, fixed index annuities and life insurance. Included in the portfolio are £2.3 billion of commercial mortgage-backed securities and £1.6 billion of residential mortgage-backed securities, of which £0.8 billion (52 per
cent) are issued by US government-sponsored agencies.
The shareholder-owned debt and loan portfolio of the Group’s asset
Group Chief Risk Officer’s report on the risks facing Strategic report our business and our capital strength
56 Prudential plc Annual Report 2014 Strategic report
Group Chief Risk Officer’s report on the risks facing our business and our capital strength continued
management operations of £2.3 billion as at 31 December 2014 is principally related to Prudential Capital operations. Prudential Capital generates revenue by providing
bridging finance, managing investments and operating a securities lending and cash management business for the Prudential Group and our clients.
The Group’s
credit exposure to the oil and gas sector represents circa 5 per cent or £3.4 billion of the shareholder portfolio. Some counterparties may experience stress from ongoing low oil prices but this is not currently expected to have a
material adverse impact on the Group’s exposure. The oil and gas sector is subject to ongoing monitoring and regular management information reporting to the Group’s risk committees.
Further details of the composition and quality of our debt portfolio, and exposure to loans, can be found in the IFRS financial statements.
(ii) Group sovereign debt and bank debt exposure
(Audited)
Sovereign debt1 represented 15 per cent or £11.0 billion of the debt portfolio backing shareholder business at 31 December 2014 (31 December 2013: 15 per cent
or £10.2 billion). 43 per cent of this was rated AAA and 95 per cent investment grade (31 December 2013: 44 per cent AAA, 92 per cent investment grade). At
31 December 2014, the Group’s shareholder-backed business’s holding in Eurozone sovereign debt1 was £476 million. 82 per cent of this was AAA rated (31
December 2013: 84 per cent AAA rated). Shareholder exposure to the Eurozone sovereigns of Italy and Spain is £63 million (31 December 2013: £54 million). We do not have any sovereign debt exposure to Greece, Cyprus, Portugal or
Ireland.
Our bank exposure is a function of our core investment business, as well as of the hedging and other activities undertaken to manage our various financial
risks. Given the importance of our relationship with our banks, exposure to the banking sector is a key focus of management information provided to the Group’s risk committees and the Board.
The exposures held by the shareholder-backed business and with-profits funds in sovereign debt and bank debt securities at
31 December 2014 are given in Note C3.3(f) of the Group’s IFRS financial statements.
(iii) Counterparty credit risk
(Audited)
We enter into a variety of exchange traded and over-the-counter derivative financial instruments, including futures, options,
forward currency contracts and swaps such as interest rate swaps, infiation swaps, cross-currency swaps, swaptions and credit default swaps.
All over-the-counter derivative transactions, with the exception of some Asia transactions, are conducted under standardised International Swaps and Derivatives Association Inc
master agreements and we have collateral agreements between the individual Group entities and relevant counterparties in place under each of these master agreements.
Our exposure to derivative counterparty and reinsurance counterparty credit risk is managed using an array of risk management tools, including a comprehensive
system of limits. Where appropriate, we reduce our exposure, purchase credit protection or make use of additional collateral arrangements to control our levels of counterparty credit risk.
Note C3.3: Debt securities page 190 Note C3.4: Loans portfolio page 197
Insurance risk
(Audited)
The processes of determining the price of our products and
reporting the results of our long-term business operations require us to make a number of assumptions. In common with other industry players, the profitability of our businesses depends on a mix of factors including mortality and morbidity levels
and trends, persistency, investment performance, unit cost of administration and new business acquisition expenses.
We continue to conduct research into longevity
risk using both industry data and experience from our substantial annuity portfolio. The assumptions that we make about future rates of mortality improvement within our UK annuity portfolio are key to our pricing and reserving. Recent changes to UK
legislation, removing an individual’s requirement to convert a pension fund into an annuity, are also demanding particular scrutiny. We continue to seek opportunities to transfer longevity risk to reinsurers or to the capital markets and have
transacted when terms are suf?ciently attractive and aligned with our risk management framework.
Morbidity risk is mitigated by appropriate underwriting and use of
reinsurance. Our morbidity assumptions reflect our recent experience and expectation of future trends for each relevant line of business. In Asia, a key assumption is the rate of medical infiation, typically in excess of general price inflation.
Our persistency assumptions relect recent experience for each relevant line of business, and any expectations of future persistency. Persistency risk is mitigated
by appropriate training and sales processes and managed locally post-sale through regular experience monitoring and the identification of common characteristics of poor persistency business. Where appropriate, allowance is also made for the
relationship – either assumed or historically observed – between persistency and investment returns, and for the resulting additional risk.
Liquidity
risk
(Audited)
Our parent company has significant internal sources of
liquidity that are suf?cient to meet all of its expected requirements for the foreseeable future without having to make use of external funding. In aggregate, the Group currently has £2.6 billion of undrawn committed facilities, expiring in
2018 and 2019. In addition, the Group has access to liquidity via the debt capital markets. We also have in place an unlimited commercial paper programme and have maintained a consistent presence as an issuer in this market for the last decade.
Liquidity uses and sources have been assessed at the Group and at a business unit level under base case and stressed assumptions. The liquidity resources available and the subsequent liquidity coverage ratio are regularly monitored and we have
assessed these to be suf?cient.
Operational risk
(Unaudited)
We are exposed to operational risk through the course of running our business. We are dependent on the successful processing of a large number of transactions, utilising various
legacy and other IT systems and platforms, across numerous and diverse products. We also operate under the ever-evolving requirements set out by different regulatory and legal regimes (including tax), as well as utilising a significant number of
third parties to distribute products and to support business operations.
Our IT, compliance and other operational systems and processes incorporate controls that
are designed to manage and mitigate the operational risks associated with our activities. Although we have not identified a material failure or breach in relation to our legacy and other IT systems and processes to date, we have been, and likely
will continue to be, subject to computer viruses, attempts at unauthorised access and cyber-security attacks.
We have an operational risk management framework in
place that
Prudential plc Annual Report 2014 57
facilitates
both the qualitative and quantitative analysis of operational risk exposures. The output of this framework, in particular management information on key operational risk and control assessments, scenario analysis, internal incidents and external
incidents, is reported by the business units and presented to the Group Operational Risk Committee. This information also supports business decision-making and lessons-learned activities, the ongoing improvement of the control environment, and
determination of the adequacy of our corporate insurance programme.
Global regulatory risk
(Unaudited)
Global regulatory risk is considered a key risk. The EU has developed a new
prudential regulatory framework for insurance companies, referred to as Solvency II. The Solvency II Directive, which sets out the new framework, was formally approved by the Economic and Financial Affairs Council in November 2009 although its
implementation was delayed pending agreement on a directive known as Omnibus II which, having been adopted by the Council of the European Union in April 2014, amended certain aspects of the Solvency II Directive. The new approach is based on the
concept of three pillars – minimum capital requirements, supervisory review of firms’ assessments of risk, and enhanced disclosure requirements.
Specifically, Pillar 1 covers the quantitative requirements around own funds, valuation rules for assets and liabilities and capital requirements. Pillar 2
provides the qualitative requirements for risk management, governance and controls, including the requirement for insurers to submit an Own Risk and Solvency Assessment which will be used by the regulator as part of the supervisory review process.
Pillar 3 deals with the enhanced requirements for supervisory reporting and public disclosure.
A key aspect of Solvency II is that the assessment of risks and
capital requirements are intended to be aligned more closely with economic capital methodologies and may allow us to make use of our internal capital models if approved by the Prudential Regulation Authority.
Following adoption of the Omnibus II Directive, Solvency II will be implemented on 1 January 2016, although the European Commission and the European Insurance and Occupational
Pensions Authority (EIOPA) are continuing to develop the detailed rules and guidelines that will supplement the high-level rules and principles of the Solvency II and
Omnibus II Directives, which are not currently expected to be finalised until mid-late 2015.
There is significant uncertainty regarding the final outcome from this process. In particular, certain detailed aspects of the Solvency II rules relating to the
determination of the liability discount rate for UK annuity business remain to be clarified and our capital position is sensitive to these outcomes. Further, the effective application of a number of key measures incorporated in the Omnibus II
Directive, including the provisions for third-country equivalence and whether restrictions are placed on the economic value of overseas surplus, are subject to supervisory judgement and approval. There is a risk that the effect of the measures
finally adopted could be adverse for us, including potentially a significant increase in the capital required to support our business and that we may be placed at a competitive disadvantage to other European and non-European financial services
groups. We are actively participating in shaping the outcome through our involvement in industry bodies and trade associations, including the Pan-European Insurance Forum, Chief Risk Of?cer Forum and Chief Financial Of?cer Forum, together with the
Association of British Insurers and Insurance Europe.
Having assessed the requirements of Solvency II, an implementation programme was initiated with dedicated
teams to manage the required work across the Group. The activity of the local Solvency II teams is coordinated centrally to achieve consistency in the understanding and application of the requirements. We are continuing our preparations to adopt the
regime when it comes into force on
1 January 2016 and are undertaking in parallel an evaluation of the possible actions to mitigate its effects. We regularly
review our range of options to maximise the strategic flexibility of the Group. This includes consideration of optimising our domicile as a possible response to an adverse outcome on Solvency II.
Over the coming months we will remain in regular contact with the Prudential Regulation Authority as we continue to engage in the approval process for the internal model. In
addition, we are engaged in the Prudential Regulation Authority’s ‘Individual Capital Adequacy Standards Plus’ (ICAS+) regime, which is enabling our UK insurance entities to leverage the developments made in relation to the Solvency
II internal model for the purpose of meeting the existing ICAS+ regime.
Currently there are also a number of other global regulatory developments which could
impact the way in which we are supervised in our many jurisdictions.
These include the Dodd-Frank Act in the US, the work of the Financial Stability Board on
Global Systemically Important Insurers and the Common Framework for the Supervision of Internationally Active Insurance Groups (ComFrame) being developed by the International Association of Insurance Supervisors.
The Dodd-Frank Act represents a comprehensive overhaul of the financial services industry within the US that, among other reforms to financial services entities, products and
markets, may subject financial institutions designated as systemically important to heightened prudential and other requirements intended to prevent or mitigate the impact of future disruptions in the US financial system. The full impact of the
Dodd-Frank Act on our businesses is not currently clear, as many of its provisions have a delayed effectiveness and/or require rulemaking or other actions by various US regulators over the coming years.
In July 2013, the Financial Stability Board announced the initial list of nine insurance groups that have been designated as Global Systemically Important Insurers. Following
another assessment in 2014, the Financial Stability Board confirmed the same nine insurance groups as Global Systemically Important Insurers on 6 November 2014. This list included Prudential as well as a number of its competitors. Designation
as a Global Systemically Important Insurer has led to additional policy measures being applied to the designated group. Based on the policy framework released by the IAIS and subsequent guidance papers these additional policy measures include
enhanced group-wide supervision, effective resolution measures of the group in the event of failure, loss absorption, and higher loss absorption capacity. This enhanced supervision commenced immediately and included the annual submission of a
Systemic Risk Management Plan (SRMP), a group Recovery Plan (RCP) and Liquidity Risk Management Plan (LRMP). Prudential is monitoring the development and potential impact of the framework of policy measures and is continuing to engage with the
Prudential Regulation Authority on the implications of the policy measures and Prudential’s designation as a G-SII. The G-SII regime also introduces two types of capital requirements; the first, a Basic Capital Requirement (BCR), designed to
act as a minimum group capital requirement and the second, a Higher Loss Absorption (HLA) requirement, that should reflect the drivers of the assessment of G-SII designation. A consultation paper on BCR was released in July 2014 and the Group
participated in field testing ahead of the
Group Chief Risk Officer’s report on the risks facing Strategic report our business and our capital strength
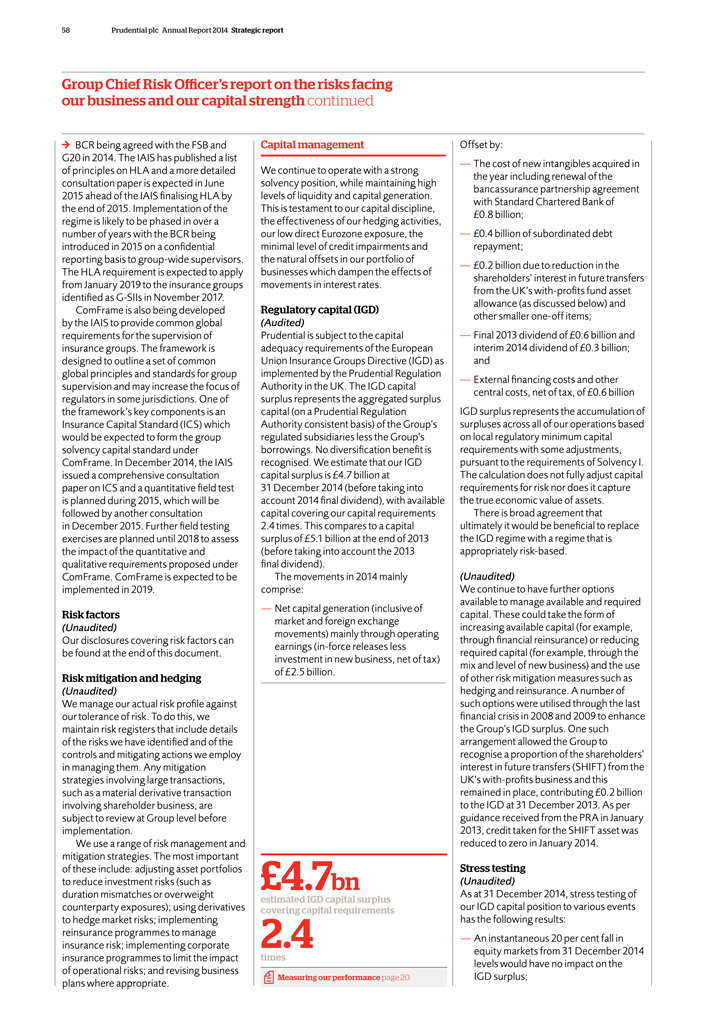
58 Prudential plc Annual Report 2014 Strategic report
Group Chief Risk Officer’s report on the risks facing our business and our capital strength continued
BCR being agreed with the FSB and G20 in 2014. The IAIS has published a list of principles on HLA and a more detailed consultation paper is expected in June 2015 ahead of the IAIS
finalising HLA by the end of 2015. Implementation of the regime is likely to be phased in over a number of years with the BCR being introduced in 2015 on a confidential reporting basis to group-wide supervisors. The HLA requirement is expected to
apply from January 2019 to the insurance groups identified as G-SIIs in November 2017.
ComFrame is also being developed by the IAIS to provide common global
requirements for the supervision of insurance groups. The framework is designed to outline a set of common global principles and standards for group supervision and may increase the focus of regulators in some jurisdictions. One of the
framework’s key components is an Insurance Capital Standard (ICS) which would be expected to form the group solvency capital standard under ComFrame. In December 2014, the IAIS issued a comprehensive consultation paper on ICS and a quantitative
field test is planned during 2015, which will be followed by another consultation in December 2015. Further field testing exercises are planned until 2018 to assess the impact of the quantitative and qualitative requirements proposed under ComFrame.
ComFrame is expected to be implemented in 2019.
Risk factors
(Unaudited)
Our disclosures covering risk factors can be found at the end of this document.
Risk mitigation and hedging
(Unaudited)
We manage our actual risk profile against our tolerance of risk. To do this, we maintain risk registers that include details of the risks we have identified and of the controls and
mitigating actions we employ in managing them. Any mitigation strategies involving large transactions, such as a material derivative transaction involving shareholder business, are subject to review at Group level before implementation.
We use a range of risk management and mitigation strategies. The most important of these include: adjusting asset portfolios to reduce investment risks (such as duration mismatches
or overweight counterparty exposures); using derivatives to hedge market risks; implementing reinsurance programmes to manage insurance risk; implementing corporate insurance programmes to limit the impact of operational risks; and revising business
plans where appropriate.
Capital management
We continue to operate with a
strong solvency position, while maintaining high levels of liquidity and capital generation. This is testament to our capital discipline, the effectiveness of our hedging activities, our low direct Eurozone exposure, the minimal level of credit
impairments and the natural offsets in our portfolio of businesses which dampen the effects of movements in interest rates.
Regulatory capital (IGD)
(Audited)
Prudential is subject to the capital adequacy requirements of the European Union
Insurance Groups Directive (IGD) as implemented by the Prudential Regulation Authority in the UK. The IGD capital surplus represents the aggregated surplus capital (on a Prudential Regulation Authority consistent basis) of the Group’s regulated
subsidiaries less the Group’s borrowings. No diversification benefit is recognised. We estimate that our IGD capital surplus is £4.7 billion at
31
December 2014 (before taking into account 2014 final dividend), with available capital covering our capital requirements 2.4 times. This compares to a capital surplus of £5.1 billion at the end of 2013 (before taking into account the 2013
final dividend).
The movements in 2014 mainly comprise:
— Net capital
generation (inclusive of market and foreign exchange movements) mainly through operating earnings (in-force releases less investment in new business, net of tax) of £2.5 billion.
£4.7bn
estimated IGD capital surplus covering capital requirements
2.4
times
Measuring our performance page 20
Offset by:
The cost of new intangibles acquired in the year including renewal of the bancassurance partnership agreement with Standard Chartered Bank of £0.8 billion; £0.4 billion
of subordinated debt repayment; £0.2 billion due to reduction in the shareholders’ interest in future transfers from the UK’s with-profits fund asset allowance (as discussed below) and other smaller one-off items; Final 2013 dividend
of £0.6 billion and interim 2014 dividend of £0.3 billion; and External financing costs and other central costs, net of tax, of £0.6 billion
IGD
surplus represents the accumulation of surpluses across all of our operations based on local regulatory minimum capital requirements with some adjustments, pursuant to the requirements of Solvency I. The calculation does not fully adjust capital
requirements for risk nor does it capture the true economic value of assets.
There is broad agreement that ultimately it would be beneficial to replace the IGD
regime with a regime that is appropriately risk-based.
(Unaudited)
We
continue to have further options available to manage available and required capital. These could take the form of increasing available capital (for example, through financial reinsurance) or reducing required capital (for example, through the mix
and level of new business) and the use of other risk mitigation measures such as hedging and reinsurance. A number of such options were utilised through the last financial crisis in 2008 and 2009 to enhance the Group’s IGD surplus. One such
arrangement allowed the Group to recognise a proportion of the shareholders’ interest in future transfers (SHIFT) from the UK’s with-profits business and this remained in place, contributing £0.2 billion to the IGD at 31 December
2013. As per guidance received from the PRA in January 2013, credit taken for the SHIFT asset was reduced to zero in January 2014.
Stress testing
(Unaudited)
As at 31 December 2014, stress testing of our IGD capital position to various
events has the following results:
— An instantaneous 20 per cent fall in equity markets from 31 December 2014 levels would have no impact on the IGD surplus;
Prudential plc Annual Report 2014 59
— A
40 per cent fall in equity markets (comprising an instantaneous 20 per cent fall followed by a further 20 per cent fall over a four-week period) would reduce the IGD surplus by £950 million;
— A 100 basis points reduction (subject to a floor of zero) in interest rates would reduce the IGD surplus by £450 million; and
— Credit defaults of 10 times the expected level would reduce IGD surplus by £700 million.
The impact of the 100 basis points reduction in interest rates is exacerbated by the current regulatory permitted practice used by Jackson, which values all interest rate swaps at
book value rather than fair value for regulatory purposes. At 31 December 2014, removing the permitted practice would have increased reported IGD surplus to £5.1 billion. As at
31 December 2014, it is estimated that a 100 basis point reduction in interest rates (subject to a floor of zero) would have resulted in an IGD surplus of £4.9 billion,
excluding the permitted practice.
Prudential believes that the results of these stress tests, together with the Group’s strong underlying earnings capacity,
our established hedging programmes and our additional areas of financial flexibility, demonstrate that we are in a position to withstand significant deterioration in market conditions.
Other capital metrics
(Unaudited)
We use an internal economic capital assessment calibrated on a multi-term basis to monitor our capital requirements across the Group. This approach considers, by risk drivers, the
timeframe over which each risk can threaten the ability of the Group to meet claims as they fall due, allowing for realistic diversification benefits. This assessment provides valuable insights into our risk profile and for continuing to maintain a
strong capital position.
All of our subsidiaries continue to hold strong capital positions on a local regulatory basis. Jackson’s risk-based capital ratio
level as of 31 December 2014 was 456 per cent after remitting £415 million to the Group in 2014 while supporting its balance sheet growth and maintaining adequate capital. The value of the estate of our UK With-Profits fund as
at
31 December 2014 is estimated at £7.2 billion after the effect of completing the domestication of the Hong Kong branch business of the PAC
With-Profits fund, which was effective on 1 January 2014 (1 January 2014: £6.8 billion, after the effect of the transfer). The value of the
shareholders’ interest in future transfers from the with-profits funds in the UK is estimated at £2.2 billion (1 January 2014: £2.3 billion, after
the effect of the transfer).
Furthermore, on a statutory (Pillar 1) basis the total credit default reserve for the UK shareholder annuity funds also contributes to
protecting our capital position in excess of the IGD surplus. Notwithstanding the absence of defaults in the year, at 31 December 2014 we maintained sizeable credit default reserves at £2.2 billion (31 December 2013: £1.9 billion),
representing 41 per cent of the portfolio spread over swaps, compared with 47 per cent at 31 December 2013.
Economic capital position (based on our
Solvency II internal model)
(Unaudited)
Following ratification of the
Solvency II Omnibus II Directive on 16 April 2014, Solvency II is scheduled to come into force on 1 January 2016. Our economic capital results are based on outputs from our Solvency II internal model. Although the Solvency II and Omnibus
II Directives, together with the Level 2 ‘Delegated Act’ published on 17 January 2015, provide a framework for the calculation of Solvency II results, there remain material areas of policy uncertainty and in many areas the
Group’s methodology and assumptions are subject to review and approval by the Prudential Regulation Authority, the Group’s lead regulator. We remain on track to submit our Solvency II internal model to the Prudential Regulation Authority
for approval in 2015 but given the degree of uncertainty remaining the economic capital position disclosed below should not be interpreted as output from an approved internal model.
At 31 December 2014 the Group had economic capital surplus2 of £9.7 billion (2013: £11.3 billion) and an economic capital ratio of 218 per cent (2013:
257 per cent) before taking into account the 2014 final dividend.
During 2014, the Group economic capital surplus reduced from £11.3 billion to
£9.7 billion. The total movement in the Group economic capital surplus over the year was driven by:
— Operating experience positive
£1.8 billion: generated by in-force business, new business written in 2014, the impact of non-market assumption changes and non-market experience variances over the year;
— Non-operating experience negative
£0.9 billion: mainly arising
from negative market experience during 2014, principally driven by the reduction in long-term interest rates in the UK;
— Other capital movements negative
£2.2 billion: representing a reduction in surplus from the repayment of subordinated debt (negative £0.4 billion), renewal of the bancassurance
partnership agreement with Standard Chartered Bank (negative £0.8 billion), the negative capital effect of the domestication of the Hong Kong branch (negative £0.3 billion), the sale of the PruHealth and PruProtect businesses (positive
£0.1 billion), foreign currency translation effects (positive £0.1 billion) and dividend payments in 2014 (negative £0.9 billion); and
—
Model changes negative £0.3 billion: a negative impact to Group surplus, for the estimated impact of evolving the liability discount rate for UK shareholder-backed annuity business from one based on a liquidity premium to one based on the
matching adjustment, and other internal model refinements.
The economic capital results are based on outputs from our Solvency II internal model with a number of
key working assumptions. Further explanation of the underlying methodology and assumptions are set out in note II of Additional unaudited financial information. Certain aspects of the methodology and assumptions underpinning these results will
differ from those which are applied in obtaining final internal model approval. The eventual Solvency II Pillar I ratio, therefore, remains uncertain and is expected to be lower than our economic capital ratio.
Stress testing
(Unaudited)
At 31 December 2014, stress testing the economic capital position gives the following results and demonstrates the Group’s ability to withstand significant deteriorations
in market conditions:
— An instantaneous 20 per cent fall in equity markets would reduce surplus by £0.6 billion and reduce the economic solvency
ratio to 214 per cent;
— An instantaneous 40 per cent fall in equity markets would reduce surplus by £2.2 billion and reduce the economic
solvency ratio to 195 per cent;
— A 50 basis points reduction in interest rates (subject to a floor of zero) would reduce surplus by £1.4 billion
and reduce the economic solvency ratio to 195 per cent;
— A 100 basis points increase in interest rates would increase surplus by £1.8 billion and
increase the economic solvency ratio to 254 per cent; and
Group Chief Risk Officer’s report on the risks facing Strategic report our business and our
capital strength

60 Prudential plc Annual Report 2014 Strategic report
Group Chief Risk Officer’s report on the risks facing our business and our capital strength continued
— A 100 basis points increase in credit spreads (with 15 per cent downgrades in the UK annuity portfolio and credit defaults of 10 times the expected level in Jackson)
would reduce surplus by £2.1 billion and reduce the economic solvency ratio to 190 per cent.
Note II(c): Development of economic capital page 322
Capital allocation
(Unaudited)
Our approach to capital allocation is to attain a balance between risk and return, investing in those businesses that create shareholder value. In order to efficiently allocate
capital, we measure the use of, and the return on, capital.
We use a variety of metrics for measuring capital performance and profitability, including traditional
accounting metrics and economic returns. Capital allocation decisions are supported by this quantitative analysis, as well as strategic considerations.
The
economic framework measures risk-adjusted returns on economic capital, a methodology that ensures meaningful comparison across the Group. Capital utilisation, return on capital and new business value creation are measured at the product level as
part of the business planning process.
Notes
1 Excludes Group’s
proportionate share in joint ventures and unit-linked assets and holdings of consolidated unit trusts and similar funds.
2 The methodology and assumptions used in
calculating the economic capital results are set out in note II (c) of Additional unaudited financial information. The economic capital ratio is based on outputs from the Group’s Solvency II internal model which will be subject to
Prudential Regulation Authority review and approval before its formal adoption in 2016. We remain on track to submit our Solvency II internal model to the Prudential Regulation Authority for approval in 2015 but given the degree of uncertainty
remaining these economic capital disclosures should not be interpreted as outputs from an approved internal model.
Prudential plc Annual Report 2014 61
Corporate
responsibility review
Helping build strong communities
Our corporate
responsibility strategy
Serving our Supporting local customers communities
We
aim to provide We seek to make a fair and transparent positive contribution products that to our communities meet our through long-term customers’ needs partnerships S with charitable Page 62 r up organisations o u co po g r s m rt that make a
real i n e m i n v m u g difference e rs t o n l i o
Su t i c c e sa l
Page
64
Long-term sustainable value
V h e a l g tn t p ui i n e e n t m o g e c n
p o o t o l e ur r i r
P v e n
Valuing our Protecting the people environment
We aspire to We take retain and develop responsibility for highly engaged the environment employees in which we operate
Page 63 Page 68
Our long-term sustainable approach to business is reinforced by our Group-wide
corporate responsibility strategy. While we believe that corporate responsibility is best managed on the ground by those closest to the customer and local stakeholders, our Group approach is underpinned by four global themes:
— Serving our customers;
— Valuing our people;
— Supporting local communities; and
— Protecting the environment.
prudential.co.uk/corporate-responsibility
Strategic report Corporate responsibility review
Performance highlights
£19.6m
total community investment
170,000
children in Asia supported to read over three years through First Read programme
62,309 hours
volunteered by employees across the Prudential Group
£518,101
donated by employees through payroll giving across the Group
In 2014 we
increased the scale of our corporate responsibility activities. In partnership with charitable organisations, we provide long-term funding and deploy the expertise of the many volunteers from our workforce on projects that help to improve the lives
of individuals and strengthen communities.
Paul Manduca Chairman
62 Prudential plc Annual Report 2014 Strategic report
Corporate responsibility review continued
Our corporate responsibility approach
We create social value through our day-to-day operations, by providing savings, income, investment and protection products and services. We offer customers ways to help manage
uncertainty and build a more secure future. Furthermore, in seeking to match the long-term liabilities we have towards our customers with similarly long-term financial assets, we are able to provide capital that finances businesses, builds
infrastructure and fosters economic and social development.
Our long-term, sustainable approach to business is reinforced by our Group-wide corporate
responsibility strategy. While we believe that corporate responsibility is best managed on the ground by those closest to the customer and local stakeholders, our Group approach is underpinned by four global corporate responsibility principles:
— Serving our customers: we aim to provide fair and transparent products that meet our customers’ needs;
— Valuing our people: we aspire to retain and develop highly engaged employees;
—
Supporting local communities: we seek to make a positive contribution to our communities through long-term partnerships with charitable organisations that make a real difference; and
— Protecting the environment: we take responsibility for the environment in which we operate.
These themes provide a framework for our businesses as to how they should focus their corporate responsibility efforts and resources in the context of their individual markets.
This review gives an overview of our activities and progress in 2014. More detailed information is available online at
www.prudential.co.uk/corporate-responsibility
Serving our customers
Prudential has been meeting people’s needs for 166 years and today we serve around 24 million insurance customers in diverse markets.
In each of our businesses, we are focused on providing for a distinct set of customers’ needs: the significant and growing demand for saving and protection of the middle class
in Asia; the retirement income requirements of baby boomers in
the US; and the financial needs of the UK’s ageing population, which needs both to save more
and to access secure income in retirement.
We want our customers to stay with us for the long term. This means we must listen to them to understand and respond to
their changing needs, and maintain their trust in us with fair, transparent products and services.
Asia
Listening to and understanding customers’ needs is the first step before the launch of any new initiative, product or service. This results in financial solutions that are
customised to the needs of each segment of the population, from young parents starting a family to middle-aged people providing for their extended family. The business has been operating in Asia for more than 90 years and has become a leading
provider of health and protection products, typically attached to a long-term savings policy. These products are driven by the needs of Asia’s rapidly growing middle classes and their aspirations to save for the future, protect their families
and increase their wealth.
In 2014, Prudential Corporation Asia introduced a number of tailored products and services.
Prudential Hong Kong introduced PRUmyhealth cancer protector, a lifetime guaranteed renewable cancer protection plan which offers customers reimbursement of both inpatient and
outpatient cancer treatment costs, from diagnostic tests to post-treatment monitoring, at an affordable premium rate. Specifically designed for the Hong Kong market, PRUmyhealth cancer protector also covers the costs of chemotherapy, radiotherapy,
targeted therapy and hormonal therapy conducted on an outpatient basis, which are usually not covered under traditional medical insurance plans.
Prudential
Assurance Malaysia Berhad introduced PRUcancer plan, a first-of-its-kind cancer plan in the market where underwriting is based on cancer risk only. Conditions such as stroke, hypertension, obesity and diabetes, which have very little or no
correlation with cancer risk, may not be taken into consideration when determining eligibility to the plan. Further protection is provided as the remaining sum assured will revert to the full original amount six months after the policyholder has
been diagnosed with early-stage cancer.
Prudential Vietnam Life introduced a new personal accident insurance product called Phu-Tam An, a comprehensive protection
solution with wide coverage against all accidental risks. It is the first
product in the market that offers customers real-time financial support for medical
treatment following an accident. To support this product a mobile application called PruCarePlus provides a quick and convenient guide to hospitals and medical practitioners in Vietnam.
US
Prudential’s US operation develops and distributes products that seek to address the
retirement needs of its more than four million contract-holders through the ups and downs of financial market cycles. Jackson offers a diverse suite of variable, fixed and fixed-index annuity products, designed with a variety of customisable
features and options to fit a wide range of investor needs, wants and goals.
As many investors entering or approaching retirement possess similar needs in the form
of guaranteed income after leaving the workforce and protections for assets accrued over a lifetime, consumer demand for insured retirement products in the US remains high.
Jackson is committed to ensuring customers are well informed and have access to the most up-to-date information, and in 2013 launched the Center for Financial Insight website. This
aims to ensure that consumers have the knowledge and confidence needed to make informed decisions regarding their financial future, regardless of whether they choose Jackson products. For example, to help meet the growing need for knowledge related
to Alzheimer’s disease, the centre has featured articles relating to the risks posed by the condition, which currently affects one in nine older Americans, and actions people can take to prepare for a future affected by dementia. While some of
the most popular content appealed to a pre-retiree or retirement age demographic, other popular articles were geared more towards younger generations of investors developing an interest in their financial future.
Since its launch the site has seen more than 625,000 unique visits, which is an average of more than 29,000 per month. There have been more than 1.87 million page views,
which is an average of more than 90,000 per month. The site is on track to reach two million page views by the second anniversary of its launch.
UK and Europe
The UK Government’s 2014 Budget saw the announcement of the most widespread changes to pensions regulations for more than a generation. The business welcomed
the changes as a boost to help address the ‘savings gap’ in the UK, while recognising it would also provide significant long-term opportunities for our business.
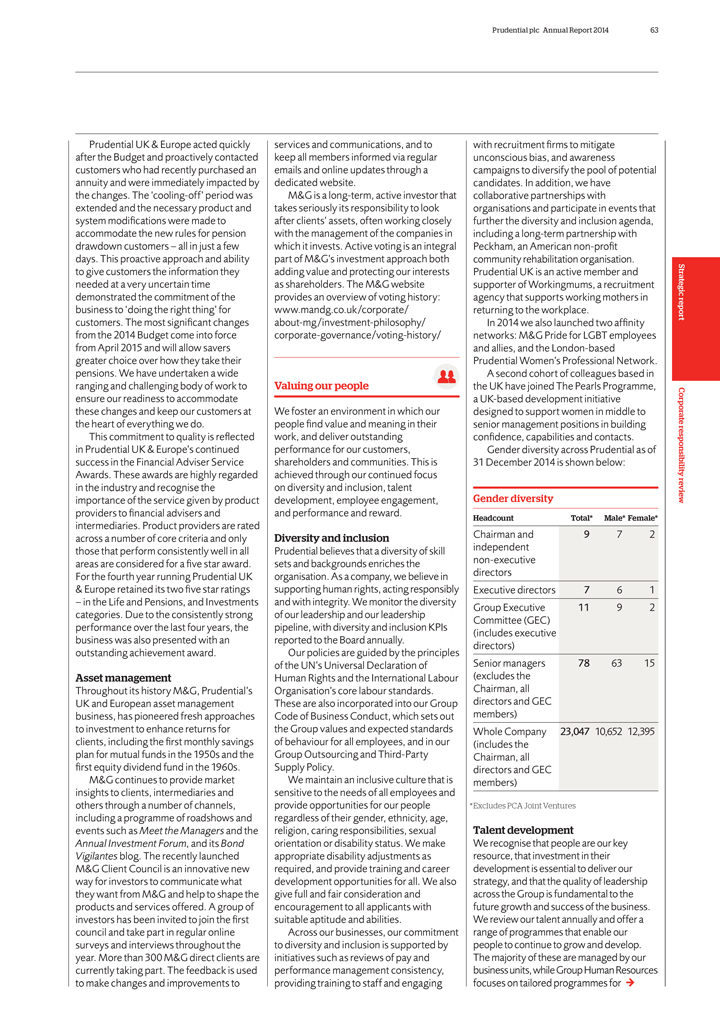
Prudential plc Annual Report 2014 63
Prudential
UK & Europe acted quickly after the Budget and proactively contacted customers who had recently purchased an annuity and were immediately impacted by the changes. The ‘cooling-off’ period was extended and the necessary product and
system modifications were made to accommodate the new rules for pension drawdown customers – all in just a few days. This proactive approach and ability to give customers the information they needed at a very uncertain time demonstrated the
commitment of the business to ‘doing the right thing’ for customers. The most significant changes from the 2014 Budget come into force from April 2015 and will allow savers greater choice over how they take their pensions. We have
undertaken a wide ranging and challenging body of work to ensure our readiness to accommodate these changes and keep our customers at the heart of everything we do.
This commitment to quality is reflected in Prudential UK & Europe’s continued success in the Financial Adviser Service Awards. These awards are
highly regarded in the industry and recognise the importance of the service given by product providers to financial advisers and intermediaries. Product providers are rated across a number of core criteria and only those that perform consistently
well in all areas are considered for a five star award. For the fourth year running Prudential UK
& Europe retained its two five star ratings – in the
Life and Pensions, and Investments categories. Due to the consistently strong performance over the last four years, the business was also presented with an outstanding achievement award.
Asset management
Throughout its history M&G, Prudential’s UK and European asset
management business, has pioneered fresh approaches to investment to enhance returns for clients, including the first monthly savings plan for mutual funds in the 1950s and the first equity dividend fund in the 1960s.
M&G continues to provide market insights to clients, intermediaries and others through a number of channels, including a programme of roadshows and events such as Meet the
Managers and the
Annual Investment Forum, and its Bond
Vigilantes blog. The
recently launched M&G Client Council is an innovative new way for investors to communicate what they want from M&G and help to shape the products and services offered. A group of investors has been invited to join the first council and take
part in regular online surveys and interviews throughout the year. More than 300 M&G direct clients are currently taking part. The feedback is used to make changes and improvements to
services and communications, and to keep all members informed via regular emails and online updates through a dedicated website.
M&G is a long-term, active investor that takes seriously its responsibility to look after clients’ assets, often working closely with the management of the companies in
which it invests. Active voting is an integral part of M&G’s investment approach both adding value and protecting our interests as shareholders. The M&G website provides an overview of voting history: www.mandg.co.uk/corporate/
about-mg/investment-philosophy/ corporate-governance/voting-history/
Valuing our people
We foster an environment in which our people find value and meaning in their work, and deliver outstanding performance for our customers, shareholders and communities. This is
achieved through our continued focus on diversity and inclusion, talent development, employee engagement, and performance and reward.
Diversity and inclusion
Prudential believes that a diversity of skill sets and backgrounds enriches the organisation. As a company, we believe in supporting human rights, acting
responsibly and with integrity. We monitor the diversity of our leadership and our leadership pipeline, with diversity and inclusion KPIs reported to the Board annually.
Our policies are guided by the principles of the UN’s Universal Declaration of Human Rights and the International Labour Organisation’s core labour standards. These are
also incorporated into our Group Code of Business Conduct, which sets out the Group values and expected standards of behaviour for all employees, and in our Group Outsourcing and Third-Party Supply Policy.
We maintain an inclusive culture that is sensitive to the needs of all employees and provide opportunities for our people regardless of their gender, ethnicity, age, religion,
caring responsibilities, sexual orientation or disability status. We make appropriate disability adjustments as required, and provide training and career development opportunities for all. We also give full and fair consideration and encouragement
to all applicants with suitable aptitude and abilities.
Across our businesses, our commitment to diversity and inclusion is supported by initiatives such as
reviews of pay and performance management consistency, providing training to staff and engaging
with recruitment firms to mitigate unconscious bias, and awareness
campaigns to diversify the pool of potential candidates. In addition, we have collaborative partnerships with organisations and participate in events that further the diversity and inclusion agenda, including a long-term partnership with Peckham, an
American non-profit community rehabilitation organisation. Prudential UK is an active member and supporter of Workingmums, a recruitment agency that supports working mothers in returning to the workplace.
In 2014 we also launched two affinity networks: M&G Pride for LGBT employees and allies, and the London-based Prudential Women’s Professional Network.
A second cohort of colleagues based in the UK have joined The Pearls Programme, a UK-based development initiative designed to support women in middle to senior management positions
in building confidence, capabilities and contacts.
Gender diversity across Prudential as of
31 December 2014 is shown below:
Gender diversity
Headcount Total* Male* Female*
Chairman and 9 7 2 independent non-executive directors
Executive directors 7 6 1 Group Executive 11 9 2 Committee (GEC) (includes executive directors) Senior managers 78 63 15 (excludes the Chairman, all directors and GEC members) Whole Company 23,047 10,652 12,395 (includes the Chairman, all directors
and GEC members)
* Excludes PCA Joint Ventures
Talent development
We recognise that people are our key resource, that investment in their development is essential to deliver our strategy, and that the quality of leadership across the Group is
fundamental to the future growth and success of the business. We review our talent annually and offer a range of programmes that enable our people to continue to grow and develop. The majority of these are managed by our business units, while Group
Human Resources focuses on tailored programmes for
Strategic report Corporate responsibility review

64 Prudential plc Annual Report 2014 Strategic report
Corporate responsibility review continued
senior leaders across the organisation, succession
planning for senior roles, and development of our leadership talent pipeline. We invest in succession planning for our leaders and critical specialists, and segment our talent to identify short, medium and long-term successors and support them with
the appropriate development and career planning, to ensure that we maintain an appropriate balance of internal progression and external hires.
Individually
tailored development offerings are provided for our most senior executives so they are well prepared to deliver the long-term ambitions of the Group. In addition, in 2014 more than 130 senior high-potential individuals have participated in our
Group-wide leadership development programmes ‘Impact’ and ‘Agility’, developed in partnership with world-leading academic institutions such as Duke Corporate Education and the Oxford Saïd Business School.
Within our businesses there are many examples of our continuing commitment to talent development. Prudential Corporation Asia is driving organisational change through mobilising
talent pool networks to coordinate on strategic business projects, and in the US, a Women in Business Symposium was held internally to provide career development education and opportunities for women to network with senior colleagues. Within
Prudential UK, the Leading Managers Programme was launched for individuals who are transitioning to managing managers, and a range of online business skills programmes have been refreshed and are available to all. M&G continues to develop
individuals with the potential to excel as investors, leaders and managers, through a diverse range of innovative programmes, and at Group Head Office, all employees have access to sessions that focus on cross-cultural awareness, building effective
partnerships and self-motivation.
Employee engagement
An array of initiatives
is in place within our different businesses to drive employee engagement. These include colleague appreciation days, employee focus groups, induction programmes for colleagues to learn about the history and strategy of the Group, opportunities to
meet senior managers, and facilities to network with other colleagues. We also have policies to encourage and support volunteering for charitable causes, including a programme in Jackson for colleagues to support public school systems and improve
STEM (science, technology, engineering, mathematics) education.
The success of our efforts has again been recognised internally and externally. In 2014, engagement
surveys in various
business units have shown excellent results, and we have received prestigious awards. For example, our Singapore business won the 2014
Asia’s Best Employer award and an award for Leading HR Practices in Quality Work-Life from Asia Pacific HRM. M&G was once again voted by employees as one of the four best places to work in the City by the website ‘Here is the City
News’.
In addition, our businesses in the UK have a long-standing relationship with the union Unite.
We encourage volunteering through which our employees can support our communities and acquire new skills. See page 67 for further details.
Performance and reward
At Prudential, our reward packages are designed to attract, motivate
and retain high-calibre people across all levels. Each individual contributes to the success of the Group and should be rewarded accordingly.
We recognise and
reward high performance while operating a fair and transparent system of reward. Reward is linked to the delivery of business goals and expected behaviours, and we ensure that rewards for our people are consistent with our values and do not
incentivise inappropriate risk-taking. To enable this, employees are not only regularly assessed on ‘what’ they have achieved, but also on ‘how’ they did so.
There are several recognition initiatives running across our businesses, including the High Five recognition programme in the US, which allows associates to choose from a list of
‘badges’ for actions such as teamwork, innovation and inspiration, to formally recognise when colleagues have gone above and beyond expectations. Similarly, at Group Head Office the Prudential Stars awards are made to individuals nominated
by their colleagues for outstanding examples of execution, impact and engagement.
We believe in the importance of enabling our employees to have the opportunity to
benefit from the Group’s success through share ownership, and operate employee share plans across the UK and Asia.
Supporting local communities
Our community programmes are grouped around the broad theme of ‘Strong foundations’. This reflects our focus on helping communities establish those fundamental building
blocks essential for their long-term futures. Our three ‘building blocks’ represent areas of primary need:
Education and life skills
Strengthening numeracy, financial literacy and employment training
Disaster readiness and
relief
Providing long-term support to help prevent disasters and deal with their impact
Wellbeing and protection
Helping provide resources, such as clean water and shelter, that are
essential for health and a thriving future
The inherent long-term social value of our business is complemented by community investments in each of the markets
within which we operate. We provide support to charitable organisations through both funding and the experience and expertise of our employees.
We establish
long-term relationships with our charity partners to ensure that the projects we support are sustainable and we work closely with them to ensure that our programmes continuously improve.
The diversity of our markets means that our programmes vary from region to region, but a shared focus for our community investment is education and life skills. These activities
include financial education, support to improve social mobility and employee volunteering.
Education and life skills
In Asia, the Prudence Foundation provides a unified charitable platform for aligning our regional philanthropic activities to our business, maximising the impact of our efforts in
the countries where we have a presence. Its mission is to make a lasting contribution to Asian societies through sustainable initiatives focused on three pillars: children, education, and disaster preparedness and recovery.
First Read was launched in 2013 in partnership with Save the Children. It is a distinctive programme that works closely with parents of pre-school children to

Prudential plc Annual Report 2014 65
promote
cognitive development, enabling children to benefit from future schooling, and preventing repetition of grades and drop-outs. First Read also works closely with local book publishers to help develop and create new books written in local languages.
Over three years, the programme will benefit over 170,000 children up to six years old as well as adults, through learning and reading materials with home-based early childhood care and development.
We further support the educational needs of Asian families by continuing to extend our long-standing commitment to financial literacy.
Prudence Foundation launched Cha-Ching, a multi-media programme built around a series of three-minute animated music videos, in 2011 to help parents instil ‘money-smart
skills’ in children aged seven to 12. This was developed with Cartoon Network and children’s education specialist, Dr Alice Wilder, to help children learn the fundamental money management concepts of earn, save, spend and donate. The
programme has gained international recognition for promoting financial literacy and won several industry awards. Over the past few years it has grown to become one of the top-rated children’s television programmes in Asia. In 2014, Cha-Ching
began airing in Korea, making it now available in nine languages through Cartoon Network, reaching 26 million households a day across Asia. Two new episodes were launched during the year, including Sweet Pepper Designs, which has received
almost one million views on YouTube. The Cha-Ching school contact programme, which brings Cha-Ching directly to school children across Asia, continues to develop and expand. To date it has reached 157,000 school children in nine countries. We have
also started to work with Junior Achievement on developing a standardised school curriculum for Cha-Ching. This will help meet the need for stronger financial literacy capabilities in students across Asia.
In the US in 2013, Jackson opened The Zone, a satellite office next to the Michigan State University campus, with the aim of offering students real-life work experience that could
potentially lead to career opportunities after graduation. In 2014, The Zone grew from 152 to 255 student employees and has been a successful talent pipeline and staffing support to the whole organisation. Of the original 152 employees, 100 are
still with Jackson. Furthermore, in its first year the Strategic Support Programme, which includes employees at The Zone, has promoted more than 40 people to full-time positions with the company or professional internships in their area of study.
While
working at The Zone, the employees often work on projects that support Jackson business operations and process improvement, while providing strategic
staffing support in a timely, efficient and cost-effective manner.
At Jackson’s operations in Nashville, employees are collaborating with public schools to
foster a passion for IT among students. At the start of the 2014 to 2015 school year, Jackson became an official IT academy partner with Overton, a local public high school. Overton is one of Nashville’s many academy high schools; schools that
follow the state curriculum while also offering focused classes in specific areas including science, engineering, performing arts and technology. Academy schools integrate traditional curriculum with professional experiences such as job shadowing,
field trips to Jackson’s offices and career fairs.
In the UK youth unemployment is one of the most pressing issues and Prudential UK
& Europe continues to play its part in supporting young people as they embark on their careers post-education. Our annual apprenticeship programme has taken on a new cohort of
40 young people to train and gain valuable work experience while continuing their education and providing a platform for a future career.
Prudential UK &
Europe’s award-winning Business Class programme is now firmly established. As national champion of the programme, Prudential UK is at the core of helping to promote and set direction for a nationwide programme and, through the commitment of its
colleagues, directly partners with three schools. The Business Class programme provides a rich vein of skilled volunteering opportunities, with around 70 colleagues being involved with partner schools.
M&G continues to fund a literacy centre at a primary school in the London Borough of Lambeth by funding the work of Springboard for Children, a charity that provides support to
children who are significantly below their national average reading age.
In our new markets in Africa we have committed to provide support for academically able
but financially disadvantaged high school students, and to help build capacity for training in actuarial sciences at local universities. We have worked with Plan Ghana to introduce a scholarship programme for senior high school students. Over five
years, the programme aims to support at least 500 disadvantaged but academically able senior high school students. In addition we have established the Prudential Actuarial Support System (PASS) awards for actuarial science in two Ghanaian
universities to support the top 10
graduating students for three years. We will be rolling out complementary scholarship programmes and educational initiatives in
Kenya.
Disaster readiness and relief
As a life insurance and asset management
company, our core business is the provision of protection, security and risk mitigation to families. Over the past four decades, the Asia Pacific region has experienced 75 per cent of the world’s natural disasters, resulting in a loss of
nearly two million lives. The Prudence Foundation is working with NGOs to help communities be better prepared with vital skills before disasters strike.
In May
2014 the Prudence Foundation, in partnership with National Geographic Channel and endorsed by the International Federation of Red Cross and Red Crescent Societies, launched Safe Steps, a first-of-its-kind pan-Asian public service initiative to
enhance disaster preparedness and awareness through the dissemination of educational survival tips in the event of natural disasters. Safe Steps is a programme with multiple platforms covering on-air videos, an informative website and educational
collateral that can be shared through community outreach initiatives. Core to the programme is a series of 60-second educational videos featuring Safe Steps ambassador Manny Pacquiao, a renowned Filipino ten-time world champion boxer, who advises
individuals and households on what they should do when disasters strike. The public service announcements cover what to do in a typhoon, earthquake, flood or fire and how to prepare an emergency kit.
Since its launch, Safe Steps has been well received across the region, with numerous partnerships being established to widen the reach of the programme. In the Philippines, we
partnered with the Office of the President, the Ministry of Defence, and the National Disaster Risk Reduction Management Council to have the campaign rolled out under existing national Disaster Risk Reduction programmes.
Furthermore, the Philippines’ Movie and Television Review Commission Board has approved the public service announcements to be shown in cinemas throughout the country. The
Prudence Foundation is also partnering with major national TV networks in the region to have Safe Steps run on free-to-air television. In 2014, Filipino network GMA, Myanmar network MRTV-4 and Cambodian network CTN all started to air the
announcements. Lastly, international NGOs such as Plan International, Save the Children and ActionAid will also be running Safe Steps across their existing Disaster Risk
Strategic report Corporate responsibility review

66 Prudential plc Annual Report 2014 Strategic report
Corporate responsibility review continued
In focus
spent by Prudential volunteers delivering educational programmes to young people
financial
Thailand and – developing life skills
In Thailand, 60 Prudential volunteers worked with more than 2,500 school children to enhance their financial knowledge
through a banking project and delivered a series of disaster relief reduction and preparedness activities. Over three years the project will provide 4,500 girls and boys from eight schools in Chiang Mai Province, Thailand, with financial literacy
knowledge by setting up school and environmental banks.
Through running their own banks, students learn how to save and acquire basic business skills. The
environmental banking forums extend the concept of banking by encouraging children to develop their enterprise and business skills. The activities of the environmental banks include the development of garbage banks, fertiliser banks and tree banks,
which contributed to increased resilience to disasters.
prudential.co.uk/indonesia
Reduction programmes. The Prudence Foundation aims to develop new partners across the region to ensure the Safe Steps content reaches as many people as possible.
In 2013 the Prudence Foundation pledged a total of £1.25 million to help with recovery efforts in the Philippines after the devastating impact of Typhoon Haiyan. The
funds were used not only to provide immediate emergency relief (working with Plan International and Save the Children), but also for longer-term focused recovery programmes. These programmes aim to help build greater resilience in the communities so
they can withstand the impact of future typhoons.
One of these programmes was with Habitat for Humanity, under which the Prudence Foundation has funded the
construction of 135 new disaster-resilient homes for the community of Santa Fe in Bantayan Island. To further demonstrate our commitment in 2014, we also arranged for two Prudential regional volunteers programmes to help with rebuilding the new
homes on Bantayan Island. Each group comprised around 100 volunteers from across 12 markets in Asia and the UK.
The volunteers generously gave one week of their
time and energy to work closely with Habitat for Humanity and the local community members, helping restore
their lives to normal. This area suffered 90 per
cent housing destruction and the local economy was severely affected by the typhoon. Recognising the importance of helping the community re-establish its livelihood, the Prudence Foundation also funded the provision of 183 new motorised fishing
boats with nets and 142 new pedicabs for members of the community, who were selected by the Mayor and his municipality office.
As a Group, Prudential has been a
partner of Save the Children’s Emergency Fund for a number of years and has committed to a further three years. The Children’s Emergency Fund enables the charity to respond immediately to emergencies in countries where there is the
greatest need and where children are most at risk.
In response to the Ebola crisis in West Africa and to support international efforts in containing the outbreak,
Prudential has made significant donations to two agencies working on the ground, Médecins sans Frontières and Save the Children. We will look at what further help we can provide in the longer term including building resilience against
future outbreaks.
Wellbeing and protection
We help to provide the resources
that are essential to secure a healthy, thriving future
for our customers, our people and our communities. For example, Jackson employees are actively engaged in
our commitment to communities by leading giving programmes such as the Jackson National Community Fund Advisory Committee and the employee nominated matching programme. The Jackson National Community Fund (JNCF) funds charities that support the
elderly and children through quarterly grants in locations where Jackson’s four largest offices are located. Jackson’s matching programme offers a two-to-one match on all employee donations made to approved charities. This programme
ensures that causes important to employees are given charitable consideration and ensures Jackson’s support is received by responsible organisations where funding will create a significant impact.
Prudential UK & Europe works with Age UK on programmes and initiatives that centre on making a difference to older people who are vulnerable and in need of support. Call
in Time volunteers contact a matched older person on a regular basis, usually once a week, for around 20-30 minutes. In many cases, this is the only phone call the older person receives that week. The Age UK Call in Time coordinators match the
employee volunteers and older people based on
Prudential plc Annual Report 2014 67
personal
history and shared interests. Each volunteer is provided with full training and ongoing support. Through the Call in Time programme in 2014, 66 lonely and isolated older people have been supported by Prudential volunteers, with 58 volunteers
actively calling and totalling more than 1,250 hours of volunteering time.
Age UK and Prudential’s Planning for Later Life programme has already helped over
5,000 older people across the UK. Launched in April 2012, this scheme provides help with financial planning, advice on benefits and support during hard times, such as a move into a care home, or following the death of a loved one. The funding of
this programme was increased by 100 per cent to support 22 local Age UK centres in the neediest areas of the UK to help deliver this much-needed advice programme.
Since 2012, M&G has supported the Good Times project at the Dulwich Picture Gallery. Good Times partners with over 100 community centres and organisations for the elderly, and
reaches over 2,000 people each year. Working with day centres, community centres and care homes, the project challenges negative perceptions about ageing and dementia and improves links between generations by celebrating the positive contributions
that older people make in society.
The Chairman’s Challenge and employee volunteering
Many of our employees play an active role in their communities through volunteering, charitable donations and fundraising. In the UK, the US and Asia we offer our employees the
opportunity to support charities through payroll giving.
In 2014, employees across the Group volunteered in their communities on a range of projects, providing a
total of 62,309 hours of volunteering. We recognise that employee volunteering brings benefit not only to the charities but also to the development of our people, and we actively encourage colleagues to participate in our programmes.
More than 6,000 employees volunteered through Prudential’s flagship international programme, the Chairman’s Challenge, which encourages people from across the Group to
volunteer on projects initiated by our global charity partners, including Plan International, Help Age International and Junior Achievement. Each volunteering project focuses on one or more of our Strong Foundations themes and allows us to support
both large, well established charities and innovative, smaller-scale activities with volunteers as well as financial support. Prudential donates £150 to our charity partners for every employee who registers for the
programme. Charity partners use this money to seed-fund charitable projects for Prudential volunteers. Employees across the Group are involved in the voting process to decide the
most innovative projects.
As well as volunteering efforts on behalf of the Chairman’s Challenge, employees around the Group volunteered on a number of other
charitable projects. Prudential Corporation Asia employees donated nearly 36,000 hours of their time to support activities across Asia. An example is the financial literacy programme run for women in Indonesia as a collaboration between the Prudence
Foundation and three government ministries. In 2014, there were 25 sessions led by volunteers, conducted in 12 cities with 6,320 women participating. Financial literacy is a key area of focus for the Prudence Foundation in Indonesia and its local
community investment efforts. Since 2009, it has helped more than 19,000 women.
In the US, the Lansing Corporate Social Responsibility team has moved to The Zone
to expand the existing Jackson in Action volunteer programme and connect the East Lansing staff with new opportunities. More than 100 Zone employees have participated in a Jackson in Action volunteer project in the past year, donating nearly 1,000
hours of service throughout the Lansing community. The partnership between Jackson, the city of East Lansing and Michigan State University has helped provide professional work experience for students and recent graduates. Overall, Jackson employees
spent more than 12,000 hours volunteering in 2014.
Jackson is dedicated to supporting Walks to End Alzheimer’s across the country and engaging associates in
educational events, fundraising and awareness efforts. Last autumn, Jackson employees across the country volunteered more than 160 hours towards ending Alzheimer’s disease and, with additional support from the Jackson National Community Fund,
raised more than US$151,500 to support the Alzheimer’s Association.
In 2014, Jackson also partnered with a Nashville Board Training programme, the Young
Leaders Council, to educate rising leaders in the Nashville office about the importance of board leadership in the charity community. Within a year of graduating from the Board Training class, half of the participants were placed on charity boards
throughout the community. Following the success of the Nashville office, Jackson will expand this annual programme to its Lansing and Denver locations by creating the Jackson Board
Corps. The Jackson Board Corps participants will better understand issues facing local communities while developing conflict management, communication and leadership skills, in
addition to strengthening Jackson’s presence in local communities. The programme will train up to 45 associates to serve in leadership positions with Jackson charity partners in 2015.
Prudential UK & Europe employees engaged in volunteering activities, totalling more than 11,000 hours in 2014. This included mentoring schoolchildren, supporting the
elderly, and skills-sharing with local charities and has supported more than 150 different charities, whether through giving time, sharing skills or making charity donations.
M&G also recognises the valuable contribution made by employees by their charitable activities. To support, encourage and recognise the contribution made by employees, every
M&G employee is eligible to apply for a donation, payable to their nominated charity, of up to £500 per calendar year in recognition of either their participation in an event to raise funds for charity or in recognition of time they
have volunteered on an ongoing basis to a charity. In 2014, M&G employees spent a total of 2,081 hours volunteering.
Prudential RideLondon
The second Prudential RideLondon event was held in August 2014. The number of cyclists who took part rose from 65,000 in 2013 to a total of 80,000 with the number of participants
in the flagship 100-mile ride rising from 16,000 to over 20,000. Furthermore, a total of more than £10 million was raised for charities, up from £7 million the year before.
Charitable arts sponsorships
Prudential has a proud tradition as a supporter of the arts. In
the UK, we support a number of charitable institutions including the Royal Opera House, the National Theatre, Barbican Centre, the National Gallery and the British Museum. With each of these institutions we seek to focus our partnerships on
education and access to the arts for the wider community.
Charitable donations
We calculate our community investment spend using the internationally recognised London Benchmarking Group standard. This includes cash donations to registered
charitable organisations, as well as a cash equivalent for in-kind contributions.
In 2014, the Group spent £19.6 million supporting community
activities, an increase of 5.7 per cent on 2013.
The direct cash donations to charitable organisations amounted to £15.9 million,
Strategic report Corporate responsibility review
68 Prudential plc Annual Report 2014 Strategic report
Corporate responsibility review continued
of which approximately £5.3 million came
from our UK and EU operations, which are principally our UK insurance operation and M&G. The remaining £10.6 million was contributed to charitable organisations by Jackson National Life Insurance Company and Prudential Corporation
Asia.
The cash contribution to charitable organisations from our UK and EU operations is broken down as follows: education £1,840,000; social, welfare and
environment £2,969,000; cultural £404,000 and staff volunteering £84,000.
The balance of the amount includes in-kind donations as set out in our
Corporate responsibility report and prepared in accordance with London Benchmarking Group (LBG) guidelines.
Political donations
It is the Group’s policy neither to make donations to political parties nor to incur political expenditure, within the meaning of those expressions as defined in the Political
Parties, Elections and Referendums Act 2000. The Group did not make any such donations or incur any such expenditure in 2014.
Protecting the environment
The management of environmental issues is an integral part of managing the total risks faced by our business. Part of our strategy to mitigate against climate
change includes:
— Measuring, reporting and improving the environmental performance of our global operations;
— Investing in the low-carbon economy; and
— Improving the indirect environmental
impacts as an asset owner.
In addition to our own internal reduction targets, we also participate in the Carbon Disclosure Project. This survey captures data on a
whole range of different aspects of an organisation’s impact on the global environment. Over the last three years we have been able to provide increasing levels of detail and this has improved our disclosure score from 70 per cent in 2013
to 97 per cent in 2014 and our performance rating from D to B. In 2014, Prudential was recognised as a leader for the depth and quality of our climate change disclosure to investors and was awarded a position on the FTSE 350 Climate Disclosure
Leadership Index.
As a financial services business we recognise that the most significant direct impact on the environment results from the operation of the
properties we occupy and invest in.
Reducing our direct impact: occupied properties
We monitor energy consumption and carbon dioxide emissions globally for all sites where we have operational control. We have strategies in place to reduce energy, waste generated,
water consumption and paper use.
In the past year several environmental improvement activities have taken place across the Group, including recycling and
energy-saving initiatives, as well as new office builds utilising innovative environmental construction practices. Prudential’s UK Occupied estate has been certified to the international Environmental Management standard ISO 14001 by the
British Standards Institute since 2008. Prudential was re-certified for the standard in August this year and commended for its performance.
Reducing our impact:
property investment portfolio
M&G Real Estate forms part of the M&G group of companies, the asset management arm of Prudential plc in the UK and Europe.
Its approach to Responsible Property Investment enables it to manage and respond to the growing range of environmental and social issues that can impact property values. This approach also helps M&G Real Estate to protect and enhance fund and
asset performance for its clients.
Responsible Property Investment is well integrated within M&G Real Estate’s day-to-day investment practices. It enables
them to adapt and respond to the challenges and opportunities posed by various issues, such as rising energy and resource costs, greater legislative demands and stronger tenant and investor requirements.
M&G Real Estate’s focus on embedding Responsible Property Investment principles into its investment activities has achieved some significant results. In the past year,
M&G Real Estate has:
— Reduced global energy consumption and carbon emissions by 6 per cent at properties held consistently for two years;
— Achieved three Green Stars in the Global Real Estate Sustainability Benchmark survey in recognition of its market-leading performance; and
— Ensured that more than 1,000,000m2 of floor space now has environmental certification, providing independent verification of its performance.
M&G Real Estate’s progress can be found in its annual Responsible Property Investment report at www.mandg.co.uk/-/ media/Literature/UK/Institutional/
MG-Real-Estate-RPI-Report-2014.pdf
Prudential plc – greenhouse gas emissions statement
We have compiled our greenhouse gas emissions data in accordance with the Companies Act 2006 (Strategic and Directors’ Reports) Regulations 2013.
We have included full reporting for all Scope 1 (direct emissions such as combustion of gas for heating, fugitive emissions and emissions from owned vehicles) and Scope 2 (indirect
emissions for consumption of
electricity, heat or steam) emissions where operational control of the emissions of the sources concerned was demonstrated. We have
also reported on a number of Scope 3 emissions as a matter of best practice. These are emissions arising as a consequence of the activities of the Company, but occur from sources not owned or controlled by the Company.
For the purpose of the 2014 report, these Scope 3 emissions include: waste generated in operations and business travel booked from the UK. We are continuously working with our
business units to review the extent of our Scope 3 reporting and increase where practicable.
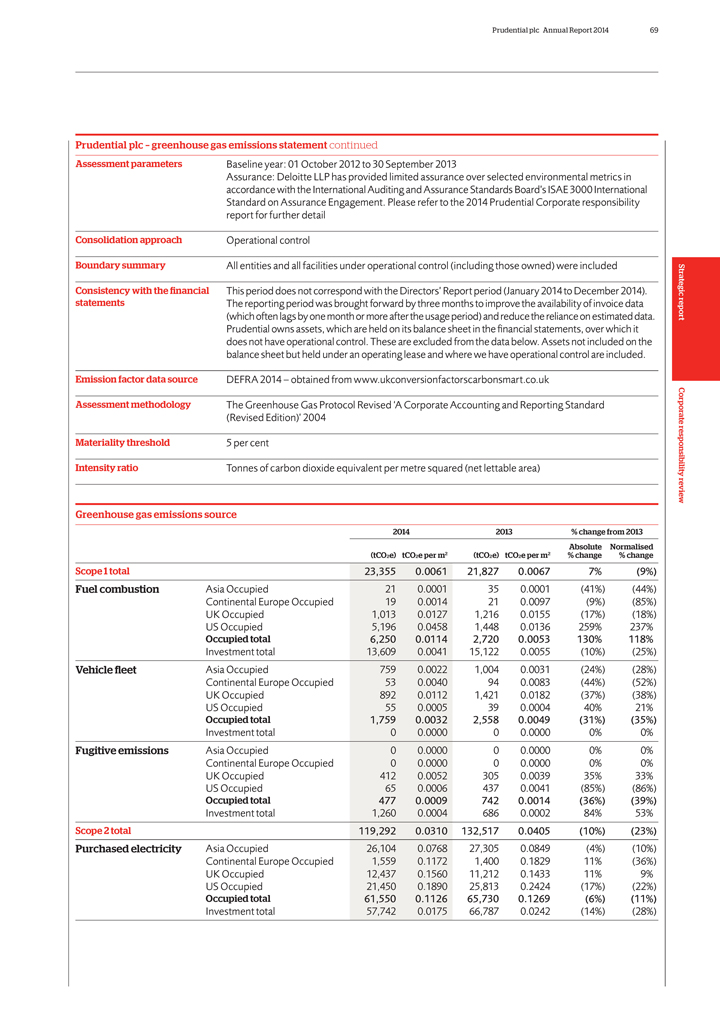
Prudential plc Annual Report 2014 69
Prudential
plc – greenhouse gas emissions statement continued
Assessment parameters Baseline year: 01 October 2012 to 30 September 2013
Assurance: Deloitte LLP has provided limited assurance over selected environmental metrics in
accordance with the International Auditing and Assurance Standards Board’s ISAE 3000 International
Standard on Assurance Engagement. Please refer to the 2014 Prudential Corporate responsibility
report for further detail
Consolidation approach Operational control
Boundary summary All entities and all facilities under operational control (including those owned) were included
Consistency with the financial This period does not correspond with the Directors’ Report period (January 2014 to December 2014).
statements The reporting period was brought forward by three months to improve the availability of invoice data
(which often lags by one month or more after the usage period) and reduce the reliance on estimated data.
Prudential owns assets, which are held on its balance sheet in the financial statements, over which it
does not have operational control. These are excluded from the data below. Assets not included on the
balance sheet but held under an operating lease and where we have operational control are included.
Emission factor data source DEFRA 2014 – obtained from www.ukconversionfactorscarbonsmart.co.uk
Assessment methodology The Greenhouse Gas Protocol Revised ‘A Corporate Accounting and Reporting Standard
(Revised Edition)’ 2004
Materiality threshold 5 per cent
Intensity ratio Tonnes of carbon dioxide equivalent per metre squared (net lettable area)
Greenhouse gas emissions source
2014 2013 % change from 2013
Absolute Normalised
(tCO2e) tCO2e per m2 (tCO2e) tCO2e per m2 % change % change
Scope 1 total 23,355 0.0061 21,827 0.0067 7% (9%)
Fuel combustion Asia Occupied 21 0.0001 35
0.0001 (41%) (44%)
Continental Europe Occupied 19 0.0014 21 0.0097 (9%) (85%)
UK Occupied 1,013 0.0127 1,216 0.0155 (17%) (18%)
US Occupied 5,196 0.0458 1,448 0.0136
259% 237%
Occupied total 6,250 0.0114 2,720 0.0053 130% 118%
Investment total
13,609 0.0041 15,122 0.0055 (10%) (25%)
Vehicle fleet Asia Occupied 759 0.0022 1,004 0.0031 (24%) (28%)
Continental Europe Occupied 53 0.0040 94 0.0083 (44%) (52%)
UK Occupied 892 0.0112 1,421
0.0182 (37%) (38%)
US Occupied 55 0.0005 39 0.0004 40% 21%
Occupied
total 1,759 0.0032 2,558 0.0049 (31%) (35%)
Investment total 0 0.0000 0 0.0000 0% 0%
Fugitive emissions Asia Occupied 0 0.0000 0 0.0000 0% 0%
Continental Europe Occupied 0 0.0000
0 0.0000 0% 0%
UK Occupied 412 0.0052 305 0.0039 35% 33%
US Occupied 65
0.0006 437 0.0041 (85%) (86%)
Occupied total 477 0.0009 742 0.0014 (36%) (39%)
Investment total 1,260 0.0004 686 0.0002 84% 53%
Scope 2 total 119,292 0.0310 132,517 0.0405
(10%) (23%)
Purchased electricity Asia Occupied 26,104 0.0768 27,305 0.0849 (4%) (10%)
Continental Europe Occupied 1,559 0.1172 1,400 0.1829 11% (36%)
UK Occupied 12,437 0.1560
11,212 0.1433 11% 9%
US Occupied 21,450 0.1890 25,813 0.2424 (17%) (22%)
Occupied total 61,550 0.1126 65,730 0.1269 (6%) (11%)
Investment total
57,742 0.0175 66,787 0.0242 (14%) (28%)
Strategic report Corporate responsibility review
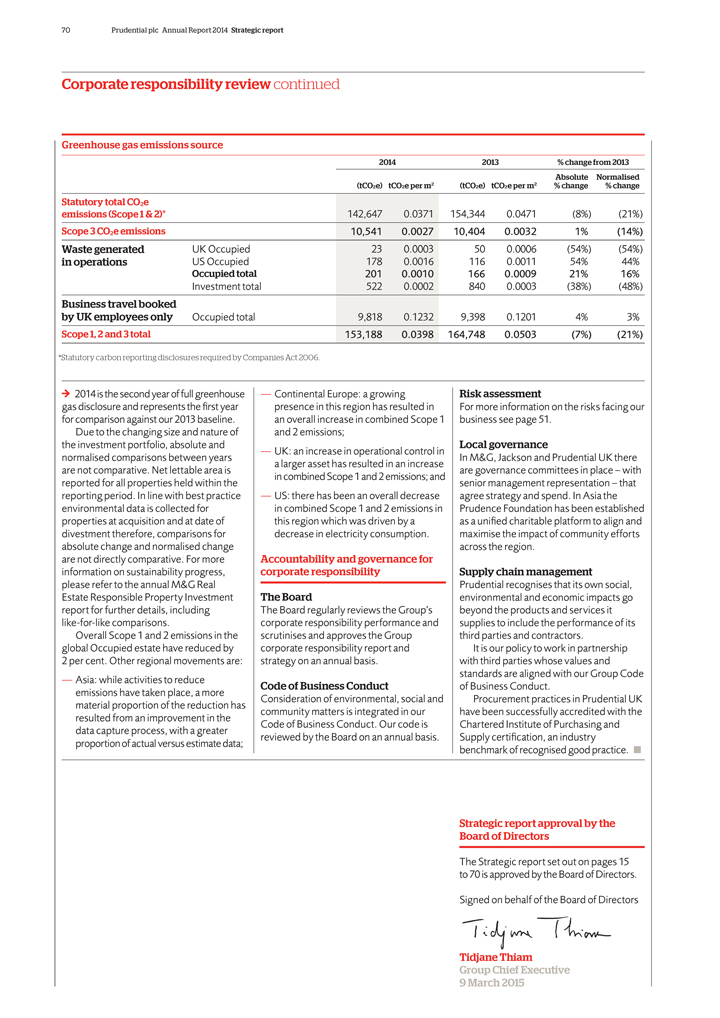
70 Prudential plc Annual Report 2014 Strategic report
Corporate responsibility review continued
Greenhouse gas emissions source
2014 2013 % change from 2013 Absolute Normalised (tCO e) tCO e per m2 (tCO e) tCO e per m2 % change % change
2 2 2 2
Statutory total CO2e emissions (Scope 1 & 2)* 142,647 0.0371 154,344 0.0471
(8%) (21%)
Scope 3 CO2e emissions 10,541 0.0027 10,404 0.0032 1% (14%)
Waste generated UK Occupied 23 0.0003 50 0.0006 (54%) (54%) in operations US Occupied 178 0.0016 116 0.0011 54% 44%
Occupied total 201 0.0010 166 0.0009 21% 16%
Investment total 522 0.0002 840 0.0003
(38%) (48%)
Business travel booked by UK employees only Occupied total 9,818 0.1232 9,398 0.1201 4% 3%
Scope 1, 2 and 3 total 153,188 0.0398 164,748 0.0503 (7%) (21%)
*Statutory carbon
reporting disclosures required by Companies Act 2006.
2014 is the second year of full greenhouse gas disclosure and represents the first year for comparison
against our 2013 baseline.
Due to the changing size and nature of the investment portfolio, absolute and normalised comparisons between years are not comparative.
Net lettable area is reported for all properties held within the reporting period. In line with best practice environmental data is collected for properties at acquisition and at date of divestment therefore, comparisons for absolute change and
normalised change are not directly comparative. For more information on sustainability progress, please refer to the annual M&G Real Estate Responsible Property Investment report for further details, including like-for-like comparisons.
Overall Scope 1 and 2 emissions in the global Occupied estate have reduced by 2 per cent. Other regional movements are:
— Asia: while activities to reduce emissions have taken place, a more material proportion of the reduction has resulted from an improvement in the data capture process, with a
greater proportion of actual versus estimate data;
— Continental Europe: a growing presence in this region has resulted in an overall increase in combined
Scope 1 and 2 emissions;
— UK: an increase in operational control in a larger asset has resulted in an increase in combined Scope 1 and 2 emissions; and
— US: there has been an overall decrease in combined Scope 1 and 2 emissions in this region which was driven by a decrease in electricity consumption.
Accountability and governance for corporate responsibility
The Board
The Board regularly reviews the Group’s corporate responsibility performance and scrutinises and approves the Group corporate responsibility report and
strategy on an annual basis.
Code of Business Conduct
Consideration of
environmental, social and community matters is integrated in our Code of Business Conduct. Our code is reviewed by the Board on an annual basis.
Risk assessment
For more information on the risks facing our business see page 51.
Local
governance
In M&G, Jackson and Prudential UK there are governance committees in place – with senior management representation – that agree strategy
and spend. In Asia the Prudence Foundation has been established as a unified charitable platform to align and maximise the impact of community efforts across the region.
Supply chain management
Prudential recognises that its own social, environmental and economic
impacts go beyond the products and services it supplies to include the performance of its third parties and contractors.
It is our policy to work in partnership
with third parties whose values and standards are aligned with our Group Code of Business Conduct.
Procurement practices in Prudential UK have been successfully
accredited with the Chartered Institute of Purchasing and Supply certification, an industry benchmark of recognised good practice.
Strategic report approval by the
Board of Directors
The Strategic report set out on pages 15 to 70 is approved by the Board of Directors.
Signed on behalf of the Board of Directors
Tidjane Thiam Group Chief Executive
9 March 2015
Prudential plc Annual Report 2014 71
Section 3
Governance
72 Board of Directors
76 Chairman’s introduction
77 Board governance
80 Group governance
81 Board committee reports
89 Additional information
90 Statutory and regulatory disclosures
91 Index to principal Directors’ Report
disclosures
Governance
3

72 Prudential plc Annual Report 2014 Governance
Board of Directors
Chairman
Paul Manduca Chairman
Appointment: October 2010 Chairman: July 2012
Committee: Nomination (Chair)
Paul was the Senior Independent Director prior to his
appointment as Chairman. He was also a member of the Audit and Remuneration Committees from October 2010 to June 2012 and joined the Nomination Committee in January 2011.
Relevant skills and experience
Paul retired as Chairman of JPM European Smaller Companies
Investment Trust Plc in December 2012 and was the Chairman of Aon UK Limited until September 2012. He was also a non-executive director and Chairman of the Audit Committee of KazMunaiGas Exploration & Production until the end of September
2012. From September 2005 until March 2011, Paul was a non-executive director of Wm Morrison Supermarkets Plc. During his tenure, he was the Senior Independent Director, the first Audit Committee Chairman and Chair of the Remuneration Committee.
Paul was the Senior Independent Director and Chairman of the Audit Committee of Development Securities plc until March 2010, Chairman of Bridgewell Group plc until 2007 and a director of Henderson Smaller Companies Investment Trust plc until 2006.
Prior to that, he was European CEO of Deutsche Asset Management from 2002 to 2005, global CEO of Rothschild Asset Management from 1999 to 2002 and founding CEO of Threadneedle Asset Management Limited from 1994 to 1999 when he was also a director of
Eagle Star
and Allied Dunbar. Paul has also served as Chairman of the Association of Investment Companies from 1991 to 1993 and is a former member of the Takeover
Panel.
Current external appointments
Paul is a member of the Securities
Institute and Chairman of Henderson Diversified Income Limited. Age 63.
Group Chief Executive
Tidjane Thiam Group Chief Executive
Appointment: March 2008 Group Chief Executive:
October 2009
Tidjane was the Chief Financial Officer from March 2008 until his appointment as
Group Chief Executive.
Relevant skills and experience
Tidjane spent the first
part of his professional career with McKinsey
& Company in Paris and New York, serving insurance companies and banks. He then spent a number of years in Africa
where he was Chief Executive and later Chairman of the National Bureau for Technical Studies and Development in Côte d’Ivoire and a cabinet member as Secretary of Planning and Development. Tidjane returned to France to become a partner
with McKinsey & Company and one of the leaders of their Financial Institutions practice before joining Aviva in 2002. He worked at Aviva until 2008, holding successively the positions of Group Strategy and Development Director, Managing
Director of Aviva International, Group Executive Director and Chief Executive Officer, Europe.
Current external appointments
Tidjane is a member of the Board of the Association of British Insurers (ABI) and was Chairman from July 2012 to October 2014. He is a member of the Council
of the Overseas Development Institute (ODI) in London, a member of the Africa Progress Panel chaired by Kofi Annan and a sponsor of Opportunity International. Tidjane is a member
of the UK-ASEAN Business Council and of the Strategic Advisory Group on UK Trade and Investment. In January 2012, Tidjane was appointed to the Prime Minister’s Business Advisory Group and has been a member of the European Financial Services
Round Table since 2013. He was elected to the Board of Directors of 21st Century Fox, Inc. on
12 November 2014, where he serves as a non-executive director.
Tidjane was awarded the Légion d’Honneur by the French President in July 2011 and the 2013 Grand Prix de l’Economie by the French newspaper Les Echos. In January 2014, Tidjane was appointed as a British Business Ambassador by
invitation from the Prime Minister. Age 52.

Prudential plc Annual Report 2014 73
Executive
directors
Nicolaos Nicandrou ACA Chief Financial Officer
Appointment: October
2009
Nic is Chief Financial Officer, a position he has held since October 2009.
Pierre-Olivier Bouée Group Chief Risk Officer
Appointment: April 2014
Pierre-Olivier is Group Chief Risk Officer, a position he has held since August 2013.
Jacqueline Hunt Executive director
Appointment: September 2013
Jackie is Chief Executive,
Prudential UK & Europe, a position she has held since
September 2013, and she took on responsibility for Africa in early 2014.
Michael McLintock Executive director
Appointment: September 2000
Michael is the Chief Executive of M&G, a position he held at
the time of M&G’s acquisition by Prudential in 1999.
Barry Stowe Executive director
Appointment: November 2006
Barry is the Chief Executive of Prudential Corporation Asia, a
position he has held since October 2006.
Michael Wells Executive director
Appointment: January 2011
Mike is President and Chief Executive Officer of
Jackson National Life Insurance Company (Jackson), a position he has held since January 2011.
Relevant skills and experience
Before joining Prudential, Nic worked at Aviva, where he held a number of senior finance roles, including Norwich Union Life Finance Director and Board Member, Aviva Group
Financial Control Director, Aviva Group Financial Management and Reporting Director and CGNU Group Financial Reporting
Relevant skills and experience
Pierre-Olivier joined Prudential in 2008 and has held positions as Business Representative for Asia, Director of Strategy and Corporate Development and Managing Director CEO
Office.
From 2004 until 2008, Pierre-Olivier worked for Aviva, first as Director, Group Strategy and then as Director, Central &
Relevant skills and experience
Jackie joined Prudential from Standard Life where she was Chief
Financial Officer. Prior to this, Jackie held a number of senior financial management positions in companies including Norwich Union Insurance, Aviva, Hibernian Group, Royal & Sun Alliance and PricewaterhouseCoopers.
Relevant skills and experience
Michael joined M&G in 1992. He also served on the Board of
Close Brothers as a non-executive director from 2001 to 2008.
Current external appointments
Michael has been a Trustee of the Grosvenor Estate since October 2008 and was appointed as a non-executive director of
Relevant skills and experience
Before joining Prudential, Barry was President,
Accident & Health Worldwide for AIG Life Companies. He joined AIG in 1995, and prior to that was President and CEO of Nisus, a subsidiary of Pan-American Life, from 1992 to 1995. Before joining Nisus, Barry spent 12 years at Willis Corroon
in the US. From October 2008
Relevant skills and experience
Mike has served
in a number of strategic and leadership roles at Jackson over the last 19 years, responsible for Jackson and its United States affliates. During this period he has led the development of Jackson’s variable annuity business and has been
responsible for IT, strategy, operations,
Director. Nic started his career at PricewaterhouseCoopers where he worked in both London and Paris. In December 2014 Nic
was appointed Chairman of the European Insurance CFO Forum. Age 49.
Eastern Europe. Pierre-Olivier began his career as a civil servant in the French Treasury,
where he worked at the Secretariat of the Paris Club, before joining McKinsey in 2000 as a consultant working mainly in the international financial institutions sector. Age 44.
Current external appointments
Jackie is the Senior Independent Director of National Express
Group PLC and a non-executive director of TheCityUK. She is also a member of the FCA Practitioner Panel. Age 46.
Grosvenor Group Limited in March 2012. He has been
a member of the Finance Committee of the MCC since October 2005. Age 53.
to October 2011, Barry was a director of the Life Insurance Marketing Research Association
(LIMRA) and the Life Office Management Association (LOMA).
Current external appointments
Barry is a member of the Board of Directors of the International Insurance Society. Age 57.
communications, distributions, Curian and the retail broker dealers. Age 54.
Chairman’s introduction Governance Board of Directors

74 Prudential plc Annual Report 2014 Governance
Board of Directors continued
Non-executive directors
The Hon. Philip Remnant CBE ACA
Senior Independent Director
Appointment: January 2013
Committees: Audit, Nomination and Remuneration
Relevant skills and experience
Philip was a senior adviser at Credit Suisse until December
2013. Philip was previously a Vice Chairman of Credit Suisse First Boston (CSFB) Europe and Head of the UK Investment Banking Department. Philip was seconded to the role of Director General of the
Sir Howard Davies Independent non-executive director
Appointment: October 2010
Committees: Risk (Chair), Audit and Nomination
Relevant skills and experience
Sir Howard has a wealth of experience in the financial services industry, across civil service, consultancy, asset management, regulatory and academia.
Ann Godbehere FCPA FCGA Independent non-executive director
Appointment: August 2007
Committees: Audit (Chair), Nomination and Risk
Relevant skills and experience
Ann began her career in 1976 with Sun Life of Canada, joining Mercantile & General Reinsurance Group in 1981, where she held a number of management roles
rising to Senior Vice President and Controller for life and health and property/casualty businesses in
Alexander (Alistair) Johnston CMG FCA
Independent non-executive director
Appointment: January 2012 Committee: Audit
Relevant skills and experience
Alistair was a partner of KPMG from 1986 to 2010. He joined
KPMG (then Peat Marwick Mitchell) in 1973 and held a number of senior leadership positions. These included Vice Chairman of UK Financial Services and Head of UK Insurance Practice,
Takeover Panel from 2001 to 2003, and again in 2010. He served on the Board of Northern Rock plc from 2008 to 2010, and from 2007 to 2012 was Chairman of the Shareholder Executive.
Current external appointments
Sir Howard is Chairman of the Phoenix Group,
and a Professor at Institut d’Études Politiques (Sciences Po). He is also Chairman of the UK Government’s Airports Commission. He chairs the International Advisory Board of the China Securities Regulatory Commission and is a member
of the International Advisory Board of the China Banking Regulatory Commission. In addition, Sir
North America in 1995. Between 1996 and 2003 Ann held a number of
CFO and CEO posts in different businesses within Swiss Re and from 2003 until February 2007, Ann was Chief Financial Officer of the Swiss Re Group. From its nationalisation in 2008 until January 2009, Ann was Interim Chief Financial Officer and
Executive director of Northern Rock. She was also a director of Atrium Underwriting Group Limited and Atrium Underwriters Limited (until March 2014), as well as Arden Holdings Limited (until November 2014).
International Managing Partner
– Global Markets and UK Vice Chairman. Latterly he served
as a Global Vice Chairman of KPMG from 2007 to 2010.
Alistair acted as a non-executive director of the Foreign & Commonwealth Office from 2005 to 2010 and
chaired the Audit Committee until 2009.
Current external appointments
Philip
is a Deputy Chairman of the Takeover Panel, a non-executive director of Severn Trent plc (since March 2014) and Senior Independent Director of UK Financial Investments Limited. Philip is also Chairman of City of London Investment Trust plc (since
2011). Age 60.
Howard is an independent director of Morgan Stanley Inc and a Director of the National Theatre. Age 64.
Current external appointments
Ann is a non-executive director of British American Tobacco
p.l.c., Rio Tinto plc, Rio Tinto Limited, UBS Group AG and UBS AG. Age 59.
Current external appointments
Alistair is a visiting Professor at Cass Business School, a Trustee of the Design Museum in London and a Trustee of The Royal Academy of Arts. Age 62.

Prudential plc Annual Report 2014 75
Non-executive
directors continued
Kaikhushru Nargolwala FCA Independent non-executive director
Appointment: January 2012
Committees: Remuneration and Risk
Relevant skills and experience
Kai was the non-executive Chairman of Credit Suisse Asia
Pacific until December 2011, having joined Credit Suisse in 2008 as a member of the Executive Board and CEO of the Asia Pacific region. From 1998 to 2007,
Anthony
Nightingale CMG SBS JP
Independent non-executive director
Appointment: June
2013
Committee: Remuneration
Relevant skills and experience
Anthony was Managing Director of the Jardine Matheson Group from 2006 to 2012. He joined that Group in 1969 and held a number of senior positions before joining the Board of
Jardine Matheson Holdings in 1994. Anthony is now a
Alice Schroeder Independent non-executive director
Appointment: June 2013 Committee: Audit
Relevant skills and experience
Alice began her career as a qualified accountant at Ernst & Young in 1980, where she worked for 11 years before leaving to join the Financial Accounting Standards Board as
a manager.
Lord Turnbull KCB CVO Independent non-executive director
Appointment: May 2006
Committees: Remuneration (Chair), Risk and Nomination
Relevant skills and experience
Lord Turnbull entered the House of Lords as a
Life Peer in 2005. In 2002 he became Secretary of the Cabinet and Head of the Home Civil Service until he retired in 2005. Prior to that he held a number of positions in the Civil Service, including Permanent
Kai worked for Standard Chartered PLC where he was a Group Executive director responsible for Asia Governance and Risk. Prior to that, he spent 19 years at Bank of America and from
1990 was based in Asia as Group Executive Vice President and Head of the Asia Wholesale Banking Group. From 2004 to 2007, he was a non-executive director at Tate & Lyle plc and at Visa International, where he served on the Asia Pacific
Board.
non-executive director of Jardine Matheson Holdings and of other Jardine Matheson group companies. These include Dairy Farm, Hongkong Land, Jardine
Cycle & Carriage, Jardine Strategic and Mandarin Oriental. Anthony is also a commissioner of Astra International.
Current external appointments
Anthony is a non-executive director of Schindler Holding AG and China Xintiandi Limited. He is a Hong Kong representative to the APEC Business Advisory Council
From September 1993 she worked at various investment banks leading teams of analysts specialising in property-casualty insurance before joining Morgan Stanley,
where she became a Managing Director in 2001 heading the Global Insurance Equity Research team. In May 2003, Alice became a senior adviser at Morgan Stanley leaving in November 2009. Alice was an independent board member of the Cetera Financial
Group until April 2014. She is author of the official biography of Warren Buffett.
Secretary at HM Treasury, Permanent Secretary at the Department of the
Environment (later Environment, Transport and the Regions), Private Secretary (Economics) to the Prime Minister and Principal Private Secretary to Margaret Thatcher and then John Major. He joined HM Treasury in 1970. He was formerly Chairman of BH
Global Limited until January 2013 and a non-executive director of the Arup Group from 2006 to 2007. He also worked part-time as a Senior Adviser to the London partners of Booz and Co (UK) until February 2011.
Current external appointments
Kai is a non-executive director and lead independent director of
Singapore Telecommunications Limited, a member of the Board of the Casino Regulatory Authority of Singapore, a non-executive director of PSA International Pte. Limited and a director and Chairman of Clifford Capital Pte. Limited. Kai was appointed
as a director of Credit Suisse Group AG in April 2013 and became a member of the Singapore Capital Markets Committee of the Monetary Authority of Singapore in January 2014. Age 64.
and Chairman of The Hong Kong- APEC Trade Policy Study Group. He is also a member of the Securities and Futures Commission Committee on Real Estate Investment Trusts, a council
member of the Employers’ Federation of Hong Kong, a member of the UK-ASEAN Business Council Advisory Panel, a non-official member of the Commission on Strategic Development in Hong Kong and Chairman of the Mission to Seamen in Hong Kong. Age
67.
Current external appointments
Alice is CEO of WebTurnerCorp. and a member
of the National Association of Corporate Directors and of WomenCorporateDirectors. Age 58.
Current external appointments
Lord Turnbull is a non-executive director of Frontier Economics Limited and The British Land Company PLC. Age 70.
Governance Board of Directors

76 Prudential plc Annual Report 2014 Governance
Chairman’s introduction
Strong, effective and transparent governance
Dear Shareholder
Good governance is a key ingredient of Prudential’s
success. Our governance policies, structures and processes contribute to the growth of our business, and the Board ensures that we have appropriate governance arrangements in place both to support our operations and protect our shareholders’
interests.
In line with our listings on the London and Hong Kong stock exchanges, we apply the principles of both the United Kingdom and Hong Kong corporate
governance codes (‘the Codes’), complying with the relevant provisions set out in the Codes. We also work to ensure
that our board composition and Group
governance continue to be appropriate for the business and the markets in which we operate around the world, while supporting our strategic goals.
It is vital to
us that, as well as being strong and effective, our governance is transparent. We are committed to reporting on our governance and ensuring that it remains as effective as it can be and continues to contribute to the long-term strength of the Group.
Paul Manduca Chairman
Board committees
Board of Directors
Committee Audit Nomination Risk Remuneration
Chairman Ann Godbehere Paul Manduca Howard Davies Lord Turnbull
Composition All members are
Chaired by the All members are All members are
independent non- Chairman of the Board, independent independent
executive directors all other members non-executive directors non-executive directors
are
independent
non-executive directors
Role Monitoring the integrity Ensuring
that the Board Providing leadership, Determining the overall
of the Group’s financial retains an appropriate direction and oversight remuneration policy for
reporting, including the balance of skills to of the Group’s overall the Group, including
effectiveness of the support the strategic risk appetite and risk the individual
internal
control and risk objectives of the Group, tolerance, as well as remuneration packages
management systems; has a formal rigorous the Group’s risk of the
Chairman and
and monitoring the and transparent and investment executive directors,
effectiveness of approach to the management as well as overseeing
internal audit and
appointment and frameworks. the remuneration
the performance, re-election of directors arrangements of the
independence and and maintains an senior management.
objectivity of external effective
framework for
auditors. succession planning.
Audit Committee report
Nomination Committee Risk Committee report Remuneration
page 81 report page 85 page 87 Committee report
page 101
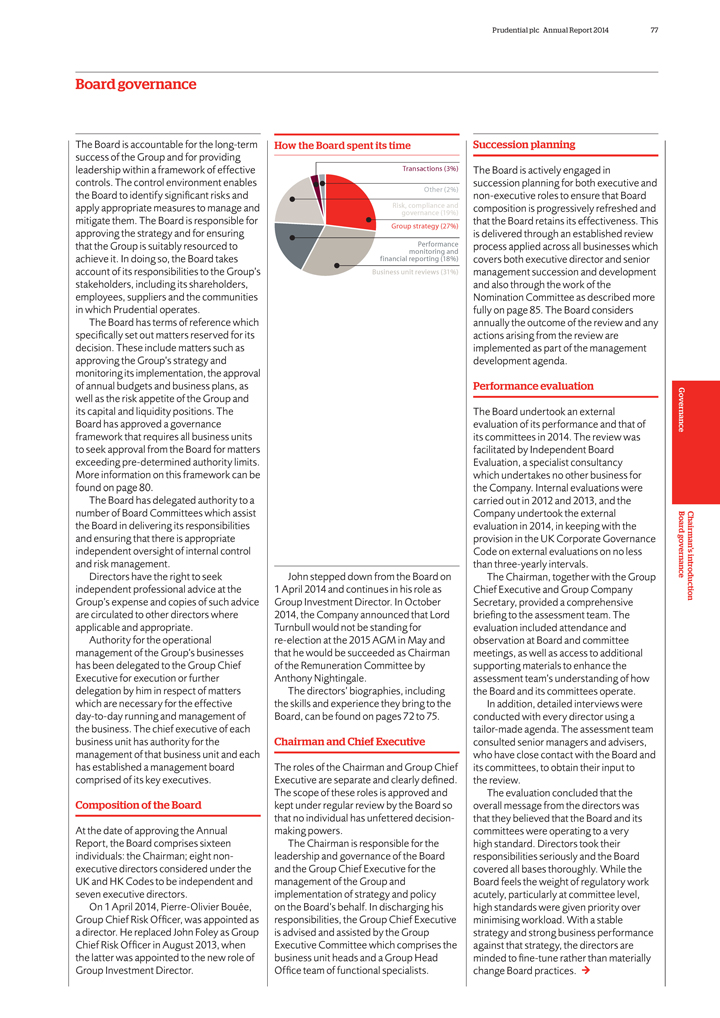
Prudential plc Annual Report 2014 77
Board
governance
The Board is accountable for the long-term success of the Group and for providing leadership within a framework of effective controls. The control
environment enables the Board to identify significant risks and apply appropriate measures to manage and mitigate them. The Board is responsible for approving the strategy and for ensuring that the Group is suitably resourced to achieve it. In doing
so, the Board takes account of its responsibilities to the Group’s stakeholders, including its shareholders, employees, suppliers and the communities in which Prudential operates.
The Board has terms of reference which specifically set out matters reserved for its decision. These include matters such as approving the Group’s strategy and monitoring its
implementation, the approval of annual budgets and business plans, as well as the risk appetite of the Group and its capital and liquidity positions. The Board has approved a governance framework that requires all business units to seek approval
from the Board for matters exceeding pre-determined authority limits. More information on this framework can be found on page 80.
The Board has delegated authority
to a number of Board Committees which assist the Board in delivering its responsibilities and ensuring that there is appropriate independent oversight of internal control and risk management.
Directors have the right to seek independent professional advice at the Group’s expense and copies of such advice are circulated to other directors where applicable and
appropriate.
Authority for the operational management of the Group’s businesses has been delegated to the Group Chief Executive for execution or further
delegation by him in respect of matters which are necessary for the effective day-to-day running and management of the business. The chief executive of each business unit has authority for the management of that business unit and each has
established a management board comprised of its key executives.
Composition of the Board
At the date of approving the Annual Report, the Board comprises sixteen individuals: the Chairman; eight non-executive directors considered under the UK and HK Codes to be
independent and seven executive directors.
On 1 April 2014, Pierre-Olivier Bouée, Group Chief Risk Officer, was appointed as a director. He replaced
John Foley as Group Chief Risk Officer in August 2013, when the latter was appointed to the new role of Group Investment Director.
How the Board spent its time
Transactions (3%)
Other (2%)
Risk, compliance and governance (19%) Group strategy (27%)
Performance monitoring and
financial reporting (18%) Business unit reviews (31%)
John stepped down from the Board on
1 April 2014 and continues in his role as Group Investment Director. In October 2014, the Company announced that Lord Turnbull would not be standing for re-election at the
2015 AGM in May and that he would be succeeded as Chairman of the Remuneration Committee by Anthony Nightingale.
The directors’ biographies, including the
skills and experience they bring to the Board, can be found on pages 72 to 75.
Chairman and Chief Executive
The roles of the Chairman and Group Chief Executive are separate and clearly defined. The scope of these roles is approved and kept under regular review by the Board so that no
individual has unfettered decision-making powers.
The Chairman is responsible for the leadership and governance of the Board and the Group Chief Executive for the
management of the Group and implementation of strategy and policy on the Board’s behalf. In discharging his responsibilities, the Group Chief Executive is advised and assisted by the Group Executive Committee which comprises the business unit
heads and a Group Head Office team of functional specialists.
Succession planning
The Board is actively engaged in succession planning for both executive and non-executive roles to ensure that Board composition is progressively refreshed and that the Board
retains its effectiveness. This is delivered through an established review process applied across all businesses which covers both executive director and senior management succession and development and also through the work of the Nomination
Committee as described more fully on page 85. The Board considers annually the outcome of the review and any actions arising from the review are implemented as part of the management development agenda.
Performance evaluation
The Board undertook an external evaluation of its performance and that
of its committees in 2014. The review was facilitated by Independent Board Evaluation, a specialist consultancy which undertakes no other business for the Company. Internal evaluations were carried out in 2012 and 2013, and the Company undertook the
external evaluation in 2014, in keeping with the provision in the UK Corporate Governance Code on external evaluations on no less than three-yearly intervals.
The
Chairman, together with the Group Chief Executive and Group Company Secretary, provided a comprehensive briefing to the assessment team. The evaluation included attendance and observation at Board and committee meetings, as well as access to
additional supporting materials to enhance the assessment team’s understanding of how the Board and its committees operate.
In addition, detailed interviews
were conducted with every director using a tailor-made agenda. The assessment team consulted senior managers and advisers, who have close contact with the Board and its committees, to obtain their input to the review.
The evaluation concluded that the overall message from the directors was that they believed that the Board and its committees were operating to a very high standard. Directors took
their responsibilities seriously and the Board covered all bases thoroughly. While the Board feels the weight of regulatory work acutely, particularly at committee level, high standards were given priority over minimising workload. With a stable
strategy and strong business performance against that strategy, the directors are minded to fine-tune rather than materially change Board practices.
Chairman’s introduction Governance Board governance
78 Prudential plc Annual Report 2014 Governance
Board governance continued
2014 Board performance evaluation
Through the evaluation and subsequent discussion at the Board meeting in February 2015, the Board identified areas of particular focus and the related actions set out in the table
below:
Theme Action
Board composition Prioritise operational experience,
gender balance and relevant geographical representation, where possible, in making new appointments to the Board. Keep the balance of executive and non-executive directors under review.
Relationship with Consider ways of further increasing informal contact senior management between non-executive directors and senior management, for example, inviting additional
senior managers to attend committee meetings where appropriate and continuing to create opportunities for contact with local management during overseas visits. Selection processes Provide more detailed updates and information on potential Board
candidates to the whole Board as early as possible.
Board papers Continue to review and streamline Board and committee papers.
Throughout the year, the Board also tracked progress through to completion against the actions agreed in respect of the 2013 performance evaluation of the Board and its committees.
These actions focused on three broad areas:
— Increasing Board time spent on business operations generally and on specific markets, which was addressed by
extending time spent at Board away visits, allowing greater focus on operational aspects;
— Continuing work on succession planning and reporting to the Board,
with particular emphasis on Board committees and executive level succession planning. This has been refiected in the work of the Nomination Committee and by continuing the more detailed reporting to the Board, introduced during 2013, on senior
management development initiatives; and
— Fine tuning the timing, format and content of Board meetings. These elements have been reviewed and adjusted to
ensure Board time is used in the best possible way, balancing time spent on strategic and operational issues and management contact with time spent on regulatory and governance issues.
Philip Remnant, the Senior Independent Director, led the performance evaluation of Paul Manduca and was assisted by Independent Board Evaluation in this process. Feedback on the
outcome was provided to the Chairman.
Re-election of directors
All directors
will retire from the Board at the 2015 AGM and, with the exception of Lord Turnbull, each wishes to seek re-election. The performance of each director formed part of the overall performance evaluation of the Board and the feedback compiled assisted
the Chairman, and the Nomination Committee, in the assessment of the contribution and commitment of the individual directors. This exercise concluded that each director’s performance continued to be effective and supported the Nomination
Committee’s recommendation to shareholders to re-elect all directors.
The Board believes that the non-executive directors bring a wide range of business,
financial and international experience to the Board and its committees. The executive directors, who head the main businesses of the Group, each bring an in-depth understanding to the Board of their particular business, its markets and challenges,
ensuring the Group’s principal activities are represented.
Independence
The independence of the non-executive directors is determined with reference to the United Kingdom (UK) and Hong Kong (HK) corporate governance codes. Prudential
is required to affirm annually the independence of all non-executive directors under the HK Listing Rules and the independence of its Audit Committee members under the Sarbanes-Oxley legislation.
The Board has appropriate processes in place to manage any potential confiicts of interest. Additional information on these processes can be found on page 89.
Throughout the year, the non-executive directors were considered by the Board to be independent in character and judgement and met the criteria for independence as set out in the
UK and HK Codes. The Company has received confirmation of independence from each of the independent non-executive directors as required by the HK Listing Rules.
Alistair Johnston was a partner in the Group’s auditor, KPMG, from 1986 to 2010. However, he did not audit the Prudential Group and he no longer has any
financial or other interest in KPMG. The Board does not consider that this former relationship with KPMG affects Alistair’s status as an independent director of Prudential.
Prudential is one of the UK’s largest institutional investors and the Board does not believe that this compromises the independence of those non-executive directors who are on
the boards of companies in which the Group has a shareholding. The Board also believes that such shareholdings should not preclude the Company from having the most appropriate and highest calibre non-executive directors.
Induction
The Chairman is responsible for ensuring that induction programmes are provided for
all new directors. These are tailored to refiect the experience of each director and their position as either executive or non-executive directors. On appointment, all directors embark upon a wide-ranging induction programme covering, among other
things, the principal bases of accounting for the Group’s results, the role of the Board and its key committees, the Group’s key risks and the risk management framework within which these sit, as well as the compliance environment in which
the Group operates. In addition, they receive detailed briefings on the Group’s principal businesses, its product range, the markets in which it operates and the overall competitive environment. These sessions are facilitated through meetings
with executive management and other senior members of the management team. Other areas addressed include the directors’ obligations under the different listing regimes, legal and regulatory issues affecting directors of financial services
companies, the Group’s governance arrangements and its investor relations programme, as well as its remuneration policies.
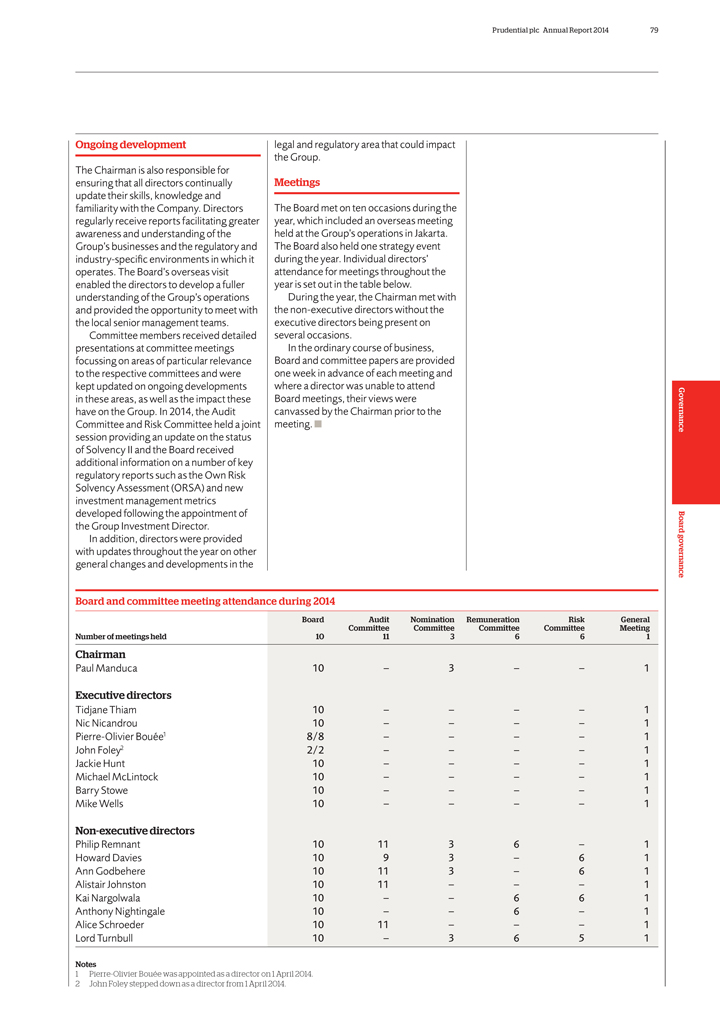
Prudential plc Annual Report 2014 79
Ongoing
development
The Chairman is also responsible for ensuring that all directors continually update their skills, knowledge and familiarity with the Company. Directors
regularly receive reports facilitating greater awareness and understanding of the Group’s businesses and the regulatory and industry-specific environments in which it operates. The Board’s overseas visit enabled the directors to develop a
fuller understanding of the Group’s operations and provided the opportunity to meet with the local senior management teams.
Committee members received
detailed presentations at committee meetings focussing on areas of particular relevance to the respective committees and were kept updated on ongoing developments in these areas, as well as the impact these have on the Group. In 2014, the Audit
Committee and Risk Committee held a joint session providing an update on the status of Solvency II and the Board received additional information on a number of key regulatory reports such as the Own Risk Solvency Assessment (ORSA) and new investment
management metrics developed following the appointment of the Group Investment Director.
In addition, directors were provided with updates throughout the year on
other general changes and developments in the
legal and regulatory area that could impact the Group.
Meetings
The Board met on ten occasions during the year, which included an overseas meeting
held at the Group’s operations in Jakarta. The Board also held one strategy event during the year. Individual directors’ attendance for meetings throughout the year is set out in the table below.
During the year, the Chairman met with the non-executive directors without the executive directors being present on several occasions.
In the ordinary course of business, Board and committee papers are provided one week in advance of each meeting and where a director was unable to attend Board meetings, their
views were canvassed by the Chairman prior to the meeting.
Governance Board governance
Board and committee meeting attendance during 2014
Board Audit Nomination Remuneration Risk
General
Committee Committee Committee Committee Meeting
Number of meetings
held 10 11 3 6 6 1
Chairman
Paul Manduca 10 – 3 – – 1
Executive directors
Tidjane Thiam 10 – – – – 1
Nic Nicandrou 10 – – – – 1
Pierre-Olivier Bouée1
8/8 – – – – 1
John Foley2 2/2 – – – – 1
Jackie Hunt 10 – – – – 1
Michael McLintock 10 –
– – – 1
Barry Stowe 10 – – – – 1
Mike
Wells 10 – – – – 1
Non-executive directors
Philip Remnant
10 11 3 6 – 1
Howard Davies 10 9 3 – 6 1
Ann Godbehere 10 11 3
– 6 1
Alistair Johnston 10 11 – – – 1
Kai Nargolwala 10
– – 6 6 1
Anthony Nightingale 10 – – 6 – 1
Alice
Schroeder 10 11 – – – 1
Lord Turnbull 10 – 3 6 5 1
Notes
1 Pierre-Olivier Bouée was appointed as a director on 1 April 2014.
2 John Foley stepped down as a director from 1 April 2014.
80 Prudential plc Annual Report 2014 Governance
Group governance
The Board is responsible for establishing a system of
internal control and for reviewing its effectiveness. To achieve this, the Board has established a framework of internal governance which is based on full accountability and transparency across all parts of the Group.
Framework
The framework of internal governance centres on clear delegated authorities,
ensuring there is appropriate Board oversight and control of important decisions and the day-to-day business is managed effectively.
The Group Governance Manual
sets out the policies and processes by which the Group operates within the framework and it takes account of relevant statutory, regulatory and governance matters.
The Group Risk Framework forms a key component of the Group Governance Framework and sets out the Group-wide approach to managing risk, as part of the internal
control system.
The Strategic report contains more detail on risk governance on page 51.
The framework of internal governance is underpinned by the Group Code of Business Conduct, which sets out the ethical standards the Board requires of itself, employees, agents and
others working in the Group.
Compliance, reporting and review
The Chief
Executive and Chief Financial Officer of each business unit, including Group Head Office, annually certify compliance with the Group’s governance, internal control and risk management requirements. The Group Risk function facilitates a review
of the matters identified by this certification process. This includes the assessment of any risk and control issues reported during the year, risk and control matters identified and reported by the other Group oversight functions and the findings
from the work of the internal audit function, which carries out risk-based audit plans across the Group, and issues arising from any external regulatory engagement. The system of internal control and its effectiveness is reviewed by the Audit
Committee as described on page 82.
The system of internal control complies with the UK and HK Codes, as well as the relevant provisions required by the
Company’s secondary listings in New York and Singapore.
For the purposes of the effectiveness review, the Group has followed the 2005 Turnbull Guidance on
internal control effectiveness. In line with the Turnbull Guidance, the certification provided above
Summary of Group Risk Framework
Sets out the Group-wide approach to risk management and the key risk provisions which support compliance with the Group’s internal, statutory and regulatory requirements in
this area
Establishes the six key components of the framework which are governance, appetite, policies, culture, processes, and definition and categorisation
Risk policies
There are five Group Risk Policies covering credit, insurance,
liquidity, market and operational risks
The Group Risk Framework is supported by the Group Dealing Controls Policy, Group Outsourcing and Third-Party Supply Policy
and Group–wide Tax Risk Management Framework
Internal control standards and guidance also support the Group Risk Framework
does not apply to certain material joint ventures where the Group does not exercise full management control. In these cases, the Group satisfies itself that suitable governance and
risk management arrangements are in place to protect the Group’s interests. However, the relevant Group company which is party to the joint venture must, in respect of any services it provides in support of the joint venture, comply with the
requirements of the Group’s internal governance framework.
Effectiveness
The Board reviewed the framework of internal governance in December 2014 and the effectiveness of the system of internal control in February 2015, covering all
material controls, including financial, operational and compliance controls, risk management systems and the adequacy of the resources, qualifications and experience of staff of the Group’s accounting and financial reporting function. The Board
confirms that there is an ongoing process for identifying, evaluating and managing the significant risks faced by the Group, which has been in place throughout the period and up to the date of this report and confirms that the system remains
effective and adequate.
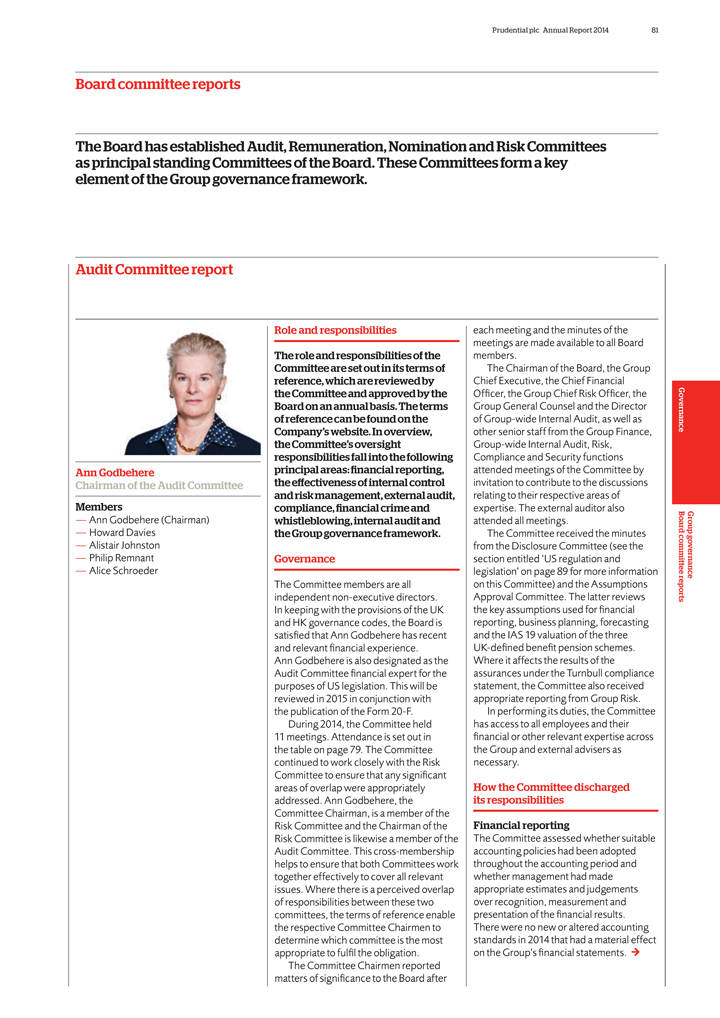
Prudential plc Annual Report 2014 81
Board
committee reports
The Board has established Audit, Remuneration, Nomination and Risk Committees as principal standing Committees of the Board. These Committees
form a key element of the Group governance framework.
Audit Committee report
Ann Godbehere
Chairman of the Audit Committee Members
— Ann Godbehere (Chairman)
— Howard Davies
— Alistair Johnston
— Philip Remnant
— Alice Schroeder
Role and responsibilities
The role and responsibilities of the Committee are set out in its terms of reference, which are reviewed by the Committee and approved by the Board on an annual basis. The terms of
reference can be found on the Company’s website. In overview, the Committee’s oversight responsibilities fall into the following principal areas: financial reporting, the effectiveness of internal control and risk management, external
audit, compliance, financial crime and whistleblowing, internal audit and the Group governance framework.
Governance
The Committee members are all independent non-executive directors. In keeping with the provisions of the UK and HK governance codes, the Board is satisfied that Ann Godbehere has
recent and relevant financial experience. Ann Godbehere is also designated as the Audit Committee financial expert for the purposes of US legislation. This will be reviewed in 2015 in conjunction with the publication of the Form 20-F.
During 2014, the Committee held 11 meetings. Attendance is set out in the table on page 79. The Committee continued to work closely with the Risk Committee to ensure that any
significant areas of overlap were appropriately addressed. Ann Godbehere, the Committee Chairman, is a member of the Risk Committee and the Chairman of the Risk Committee is likewise a member of the Audit Committee. This cross-membership helps to
ensure that both Committees work together effectively to cover all relevant issues. Where there is a perceived overlap of responsibilities between these two committees, the terms of reference enable the respective Committee Chairmen to determine
which committee is the most appropriate to fulfil the obligation.
The Committee Chairmen reported matters of significance to the Board after
each meeting and the minutes of the meetings are made available to all Board members.
The
Chairman of the Board, the Group Chief Executive, the Chief Financial Officer, the Group Chief Risk Officer, the Group General Counsel and the Director of Group-wide Internal Audit, as well as other senior staff from the Group Finance, Group-wide
Internal Audit, Risk, Compliance and Security functions attended meetings of the Committee by invitation to contribute to the discussions relating to their respective areas of expertise. The external auditor also attended all meetings.
The Committee received the minutes from the Disclosure Committee (see the section entitled ‘US regulation and legislation’ on page 89 for more information on this
Committee) and the Assumptions Approval Committee. The latter reviews the key assumptions used for financial reporting, business planning, forecasting and the IAS 19 valuation of the three UK-defined benefit pension schemes. Where it affects the
results of the assurances under the Turnbull compliance statement, the Committee also received appropriate reporting from Group Risk.
In performing its duties, the
Committee has access to all employees and their financial or other relevant expertise across the Group and external advisers as necessary.
How the Committee
discharged its responsibilities
Financial reporting
The Committee assessed
whether suitable accounting policies had been adopted throughout the accounting period and whether management had made appropriate estimates and judgements over recognition, measurement and presentation of the financial results. There were no new or
altered accounting standards in 2014 that had a material effect on the Group’s financial statements.
Group governance Governance Board committee reports
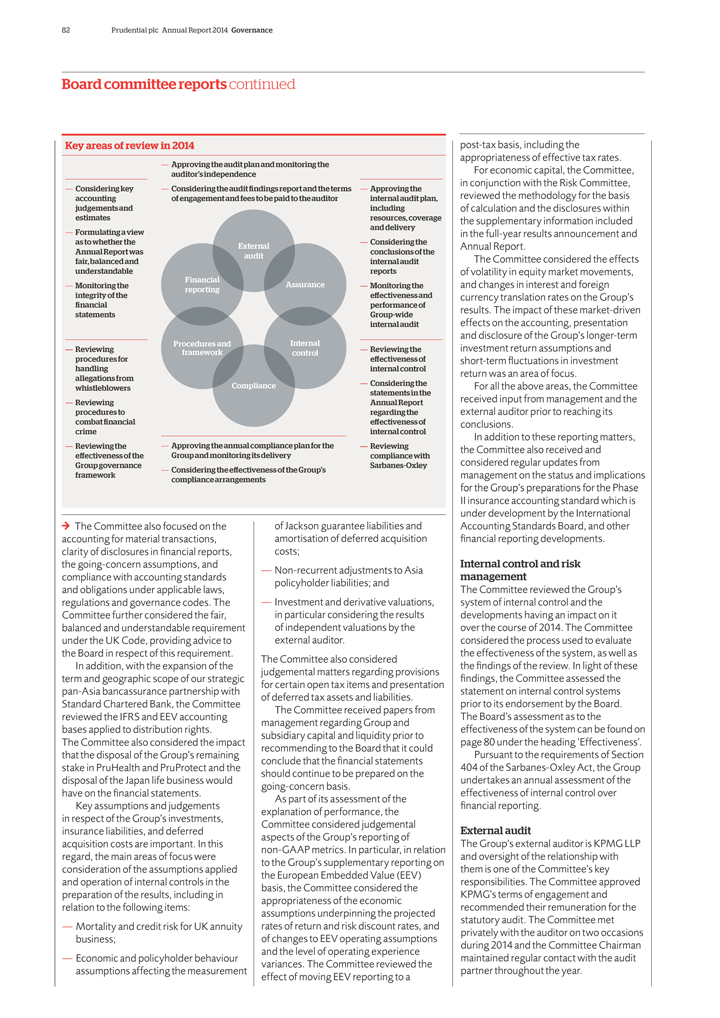
82 Prudential plc Annual Report 2014 Governance
Board committee reports continued
Key areas of review in 2014
— Considering key
accounting
judgements and
estimates
— Formulating a view
as to whether the
Annual Report was
fair, balanced and
understandable
— Monitoring the
integrity of the
financial
statements
— Reviewing
procedures for
handling
allegations from
whistleblowers
— Reviewing
procedures to
combat financial
crime
— Reviewing the
effectiveness of the
Group governance
framework
Approving the audit plan and monitoring the auditor’s independence Considering the audit findings report and the terms of engagement and fees to be paid to the auditor
External audit
Financial
Assurance reporting
Procedures and Internal framework control
Compliance
Approving the annual compliance plan for the Group and monitoring its delivery
Considering the effectiveness of the Group’s compliance arrangements
— Approving the
internal audit plan,
including
resources, coverage
and delivery
— Considering the
conclusions of the
internal audit
reports
— Monitoring the
effectiveness and
performance of
Group-wide
internal audit
— Reviewing the
effectiveness of
internal control
— Considering the
statements in the
Annual Report
regarding the
effectiveness of
internal control
— Reviewing
compliance with
Sarbanes-Oxley
The Committee also focused on the accounting for material transactions, clarity
of disclosures in financial reports, the going-concern assumptions, and compliance with accounting standards and obligations under applicable laws, regulations and governance codes. The Committee further considered the fair, balanced and
understandable requirement under the UK Code, providing advice to the Board in respect of this requirement.
In addition, with the expansion of the term and
geographic scope of our strategic pan-Asia bancassurance partnership with Standard Chartered Bank, the Committee reviewed the IFRS and EEV accounting bases applied to distribution rights. The Committee also considered the impact that the disposal of
the Group’s remaining stake in PruHealth and PruProtect and the disposal of the Japan life business would have on the financial statements.
Key assumptions
and judgements in respect of the Group’s investments, insurance liabilities, and deferred acquisition costs are important. In this regard, the main areas of focus were consideration of the assumptions applied and operation of internal controls
in the preparation of the results, including in relation to the following items:
— Mortality and credit risk for UK annuity business;
— Economic and policyholder behaviour assumptions affecting the measurement
of Jackson
guarantee liabilities and amortisation of deferred acquisition costs;
— Non-recurrent adjustments to Asia policyholder liabilities; and
— Investment and derivative valuations, in particular considering the results of independent valuations by the external auditor.
The Committee also considered judgemental matters regarding provisions for certain open tax items and presentation of deferred tax assets and liabilities.
The Committee received papers from management regarding Group and subsidiary capital and liquidity prior to recommending to the Board that it could conclude that the financial
statements should continue to be prepared on the going-concern basis.
As part of its assessment of the explanation of performance, the Committee considered
judgemental aspects of the Group’s reporting of non-GAAP metrics. In particular, in relation to the Group’s supplementary reporting on the European Embedded Value (EEV) basis, the Committee considered the appropriateness of the economic
assumptions underpinning the projected rates of return and risk discount rates, and of changes to EEV operating assumptions and the level of operating experience variances. The Committee reviewed the effect of moving EEV reporting to a
post-tax basis, including the appropriateness of effective tax rates.
For economic capital,
the Committee, in conjunction with the Risk Committee, reviewed the methodology for the basis of calculation and the disclosures within the supplementary information included in the full-year results announcement and Annual Report.
The Committee considered the effects of volatility in equity market movements, and changes in interest and foreign currency translation rates on the Group’s results. The
impact of these market-driven effects on the accounting, presentation and disclosure of the Group’s longer-term investment return assumptions and short-term fiuctuations in investment return was an area of focus.
For all the above areas, the Committee received input from management and the external auditor prior to reaching its conclusions.
In addition to these reporting matters, the Committee also received and considered regular updates from management on the status and implications for the Group’s preparations
for the Phase II insurance accounting standard which is under development by the International Accounting Standards Board, and other financial reporting developments.
Internal control and risk management
The Committee reviewed the Group’s system of
internal control and the developments having an impact on it over the course of 2014. The Committee considered the process used to evaluate the effectiveness of the system, as well as the findings of the review. In light of these findings, the
Committee assessed the statement on internal control systems prior to its endorsement by the Board. The Board’s assessment as to the effectiveness of the system can be found on page 80 under the heading ‘Effectiveness’.
Pursuant to the requirements of Section 404 of the Sarbanes-Oxley Act, the Group undertakes an annual assessment of the effectiveness of internal control over financial
reporting.
External audit
The Group’s external auditor is KPMG LLP and
oversight of the relationship with them is one of the Committee’s key responsibilities. The Committee approved KPMG’s terms of engagement and recommended their remuneration for the statutory audit. The Committee met privately with the
auditor on two occasions during 2014 and the Committee Chairman maintained regular contact with the audit partner throughout the year.

Prudential plc Annual Report 2014 83
Effectiveness
To assess the effectiveness of the auditor, the Committee reviewed the audit approach and strategy and received a report on their performance. The evaluation was
conducted using a questionnaire which was circulated to the Committee, the Chief Financial Officer and the Group’s senior finance leadership for completion. The feedback provided was reviewed and compiled into a report for the Committee which
covered areas such as the knowledge and expertise of the partners and team members, their understanding of the Group, the resourcing applied to the audit and continuity of the team, liaison with Group-wide internal audit and approach to resolution
of issues, as well as factors such as their coordination across the Group’s multiple jurisdictions and quality of their written and oral communication. The degree of challenge and robustness of approach to the audit were key components of the
evaluation. Audit fees and the FRC Audit Quality review findings were also considered.
The Committee Chairman invited other Group stakeholders to provide their
views on the performance of the auditor, and KPMG was given the opportunity to respond to the findings in the report. On completion of the exercise, the Committee concluded that the audit had been effective and the challenge appropriately robust
across all parts of the Group.
Auditor independence and objectivity
The
Committee is responsible for monitoring auditor independence and objectivity and is supported in doing so by the Group’s Auditor Independence Policy (the ‘Policy’). The Policy sets out the circumstances in which the external auditor
may be permitted to undertake non-audit services and is based on four key principles which specify that the auditor should not:
— Audit its own firm’s
work;
— Make management decisions for the Group;
— Have a mutuality
of financial interest with the Group; or
— Be put in the role of advocate for the Group.
The Policy has two permissible service types: those that require specific approval by the Committee on an engagement basis and those that are pre-approved by the Committee with an
annual limit. In accordance with the Policy, the Committee approved these permissible services, classified as either audit or non-audit services, and monitored the annual limits on a quarterly basis. All non-audit services
undertaken by KPMG were agreed prior to the commencement of work and were confirmed as permissible for the external auditor to undertake under the provisions of the Sarbanes-Oxley
Act.
In keeping with professional ethical standards, KPMG also confirmed their independence to the Committee and set out the supporting evidence for their
conclusion in a report which was considered by the Committee prior to the publication of the financial results.
Fees paid to the auditor
The fees paid to KPMG for the year ended 31 December 2014 amounted to £16.6 million, of which £5.1 million was payable in respect of non-audit services.
Non-audit services accounted for 31 per cent of total fees payable.
A further breakdown on the fees paid to KPMG can be found in Note B3.4 to the financial
statements on page 157.
Re-appointment
Based on the outcome of the
effectiveness evaluation and all other considerations, the Committee recommended to the Board that KPMG be re-appointed as the auditor. A resolution to this effect will be proposed to shareholders at the 2015 Annual General Meeting.
Audit tender
The Group operates a policy under which at least once every five years a formal
review is undertaken by the Committee to assess whether the external audit should be re-tendered. The external audit was last put out to competitive tender in 1999 when the present auditor was appointed. Since 2005, the Committee has annually
considered the need to re-tender the external audit service and it again considered this in February 2015, concluding that there was nothing in the performance of the auditor which required a change.
The Committee acknowledges the provisions contained in the UK Code in respect of audit tendering, along with European rules on mandatory audit rotation and audit tendering. In
light of this, and conforming to the requirements of the European Union rules, it is expected that the Company will be required to change auditor no later than for the 2023 financial year-end. The Committee also recognises that the industry is in a
period of unprecedented change with the introduction of Solvency II in 2016, and the IASB expecting to issue a new insurance accounting standard for implementation, mostly likely, in 2019. The Committee currently believes any change of auditor
should be scheduled to limit operational disruption during such a period of change and, as a consequence, is not currently planning to re-tender the audit
ahead of
2019, subject to the Committee’s normal annual review.
In line with the Auditing Practices Board Ethical Statements and the Sarbanes-Oxley Act, a new lead
audit partner was appointed in respect of the 2012 financial year.
Internal audit
The independent assurance provided by Group-wide Internal Audit formed a fundamental part of the Committee’s deliberations on the Group’s overall control environment. The
Committee approved Group-wide Internal Audit’s annual plan, resource and budget, and considered the performance of the Director of Group-wide Internal Audit.
Each of the Group’s business units has an internal audit team, the heads of which report to the Director of Group-wide Internal Audit. The function also has a
Quality Assurance Director, whose primary role is to monitor and evaluate adherence to industry practice guidelines and Group-wide Internal Audit’s own standards and methodology. Internal audit resources, plans, budgets and its work are
overseen by both the Committee and the relevant business unit audit committee. The Director of Group-wide Internal Audit reports functionally to the Chairman of the Committee and for management purposes to the Group Chief Executive.
As part of its remit, the Committee periodically meets with the Director of Group-wide Internal Audit without the presence of management, a practice replicated at the business unit
level.
Internal auditor performance
In addition to the periodic external
effectiveness review required every five years (last conducted by PwC in 2012); the Committee annually assesses the performance and effectiveness of the internal audit function. The internal effectiveness review, performed by the Group-wide Internal
Audit Quality Assurance Director, was conducted in accordance with the professional practice standards of the Chartered Institute of Internal Auditors (CIIA). The review concluded that Group-wide Internal Audit continued to comply with the
requirements of internal audit policies, procedures and practices, and standards in all material respects and that the function continued to be aligned with its mandated objectives.
Furthermore, following the introduction in July 2013 of the CIIA guidance for Effective Internal Audit in the Financial Services (the Code), an independent third party has assessed
Group-wide Internal Audit’s conformance with the Code. In February 2015, their conclusions for 2014 were reported to the Group Audit
Governance Board
committee reports

84 Prudential plc Annual Report 2014 Governance
Board committee reports continued
Committee. They reported that the function
had designed and implemented enhanced practices to comply with the CIIA guidelines, that Group-wide Internal Audit was generally conformant with the Code, with most areas of the Code embedded and with work well advanced to embed the remaining areas
in 2015.
The Committee considered the findings of the Quality Assurance review and the opinion provided by the external verification, and concluded that Group-wide
Internal Audit had continued to operate effectively during 2014.
Group Compliance
Regular updates from Group Compliance were provided to the Committee. This function is responsible for assessing the risks posed to the Group as a result of non-compliance with
relevant regulations, including those in respect of anti-money laundering and sanctions.
Each business unit has its own compliance function, and the role of Group
Compliance is to assess the effectiveness of these functions, as well as to provide oversight and support in the identification, mitigation and reporting of regulatory risks arising from both current business activities and from changes in the
regulatory environment.
Group Compliance is responsible for ensuring Group-wide compliance policies remain up to date and fit for purpose. These include the Group
Compliance Policy, Group Sanctions Policy, Group Anti-Money Laundering Policy and the Policy regulating communications with the Prudential Regulation Authority and Financial Conduct Authority. All these were reviewed during the year and changes
considered by the Committee in October.
Financial crime and whistleblowing
The Committee is responsible for reviewing the Group’s whistleblowing procedures, and received regular updates on concerns raised through these channels, as
well as management actions taken in response.
The Confidential Helpline Reporting Policy is kept under regular review by the Committee and is maintained as part of
the Group Governance Manual. The Group Resilience Director is responsible for the policy and the Committee met with him privately during the year as required to discuss any concerns regarding such issues.
Ongoing development
Throughout the year, the Committee received detailed presentations on a
range of topics including updated financial accounting developments, new reporting requirements and briefings on developments in the regulatory environment. Members of the Committee and relevant executive directors attended a joint session with the
Risk Committee in respect of the results of the internal model developed under Solvency II provisions.
Committee effectiveness
The Committee reviewed compliance with various applicable regulations and codes of conduct. The results of this assessment were presented to the meeting in December 2014.
The effectiveness of the Committee was evaluated as part of the overall performance evaluation of the Board which confirmed that the Committee continued to operate
effectively during the year. More information on this exercise can be found under the Performance Evaluation section on page 77.
Business unit audit committees
The Committee is supported by the work carried out by the business unit audit committees. These committees provide oversight of the respective business units and
are comprised primarily of senior management who are independent of the business unit. The minutes of these committees are reported regularly to the Committee, and their meetings are attended by the external auditor as well as senior management from
the business unit (including the BU Chief Executive, heads of Finance, Risk, Compliance and Group-wide Internal Audit).
Group-wide Internal Audit assesses the
effectiveness of each business unit audit committee annually and provides a report to the Committee.
Each business unit audit committee has adopted the
Group’s standard terms of reference, with minor variations to address local regulations or the particular requirements of the business. During 2014, and with the approval of the Committee, these were updated to improve alignment with the
Committee’s own terms of reference. The Committee Chairman also reviewed and approved appointments of business unit audit committee members during the year.
Note of thanks from the Committee
Finally, the Committee would like to note
that this report is the 30th Prudential annual report to which David Martin, our Head of Financial Accounting, has been a key contributor. The Committee would like to congratulate him on this achievement and thank him for his support and dedication.
Effectiveness
Group-wide Internal Audit carries out an annual assessment of
the effectiveness of the business unit audit committees. This is to ensure that these committees continue to function effectively and provide appropriate support enabling the Committee to fulfil its responsibilities.
Internal audit teams in each of the business units carried out the assessments, considering whether each of the committees fulfilled the responsibilities as documented in their
terms of reference. Attendance rates by committee members and evidence of the committees’ coverage of key business unit issues, as well as the appropriate escalation of concerns to the Committee, formed part of the criteria used for the
evaluation. The assessment further factored in the suitability of the business unit audit committee structures and the appropriateness of the membership on each committee.
The Committee considered a report on the findings of the assessment at its October meeting, noting the conclusion that these continued to operate effectively.

Prudential plc Annual Report 2014 85
Nomination
Committee report
Paul Manduca Chairman of the Nomination Committee Members
— Paul Manduca (Chairman)
— Howard Davies
— Ann Godbehere
— Philip Remnant
— Lord Turnbull
Role and responsibilities
The role and responsibilities of the Committee are set out in its terms of reference, which are reviewed by the Committee and approved by the Board on an annual basis. The terms of
reference can be found on the Company’s website. The Committee’s responsibilities include keeping under review the composition of the Board, identifying and nominating candidates for approval by the Board to fill any vacancies, evaluating
the independence of the non-executive directors and authorising actual or potential conflicts of interest.
Governance
With the exception of the Chairman, all the members of the Committee are non-executive directors. As announced in October 2014, Anthony Nightingale is to join the Committee in May
2015.
The Committee met three times during the year and the Chairman reported to the Board on matters of significance after each meeting. Attendance is set out in
the table on page 79. The Group Chief Executive is closely involved in the work of the Committee and was invited to attend and contribute to meetings, as was the Group HR Director.
How the Committee discharged its responsibilities
Board composition and succession planning
The Committee reviewed the composition of the Board and, in particular, the non-executive directors to ensure that the balance of skills, experience and knowledge
continued to be appropriate to oversee the achievement of the Group’s
strategic objectives. The Committee also considered whether any additional skills and
experience would be needed, either to complement those already on the Board or to plan for filling vacancies due to future retirements. The Committee reviewed the succession plans for both executive and non-executive directors, taking into account
the board composition criteria outlined previously, as well as the level of diversity desirable for a global Group. The process included consideration of the anticipated demands of the business, and the skills and knowledge required to successfully
deliver against these.
Conflicts of interest and independence
The Board has
delegated authority to the Committee to consider, and where necessary authorise, any actual or potential confiicts of interest arising in respect of the directors. The Committee considered potential confiicts of interest as they arose during the
course of the year, and in respect of the appointment of new directors.
The Committee also reviewed confiicts previously considered and authorised prior to the
publication of the Annual Report, and considered the independence of the non-executive directors in the context of the criteria set out in the UK and HK Codes.
Committee effectiveness
The effectiveness of the Committee was evaluated as
part of the overall performance evaluation of the Board. These assessments confirmed that the Committee continued to operate effectively during the year. More information on this exercise can be found under the Performance Evaluation section on page
77.
Key areas of review in 2014
— Considering the effectiveness of the
composition of Board and Committees
— Evaluating the Board’s diversity including experience, perspective and knowledge
Board Conflicts composition of interest
Succession planning
Conducting the annual review of the conflicts- of-interest register Considering potential conflicts of interest for existing directors and individuals recommended to the Board for
appointment as directors
— Considering the future retirement of non-executive directors
— Considering the overall skills and knowledge required to support strategic goals of the Group
Governance Board committee reports
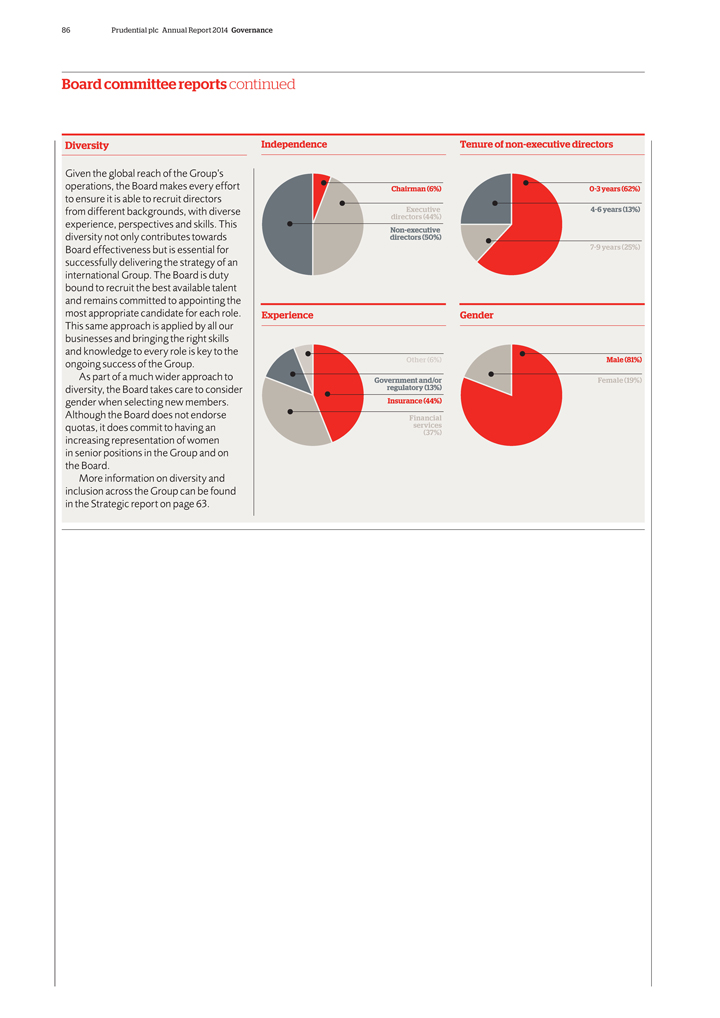
86 Prudential plc Annual Report 2014 Governance
Board committee reports continued
Diversity
Given the global reach of the Group’s operations, the Board makes every effort to ensure it is able to recruit directors from different backgrounds, with diverse experience,
perspectives and skills. This diversity not only contributes towards Board effectiveness but is essential for successfully delivering the strategy of an international Group. The Board is duty bound to recruit the best available talent and remains
committed to appointing the most appropriate candidate for each role. This same approach is applied by all our businesses and bringing the right skills and knowledge to every role is key to the ongoing success of the Group.
As part of a much wider approach to diversity, the Board takes care to consider gender when selecting new members. Although the Board does not endorse quotas, it does commit to
having an increasing representation of women in senior positions in the Group and on the Board.
More information on diversity and inclusion across the Group can be
found in the Strategic report on page 63.
Independence Tenure of non-executive directors
Chairman (6%) 0_3 years (62%)
directors Executive (44%) 4_6 years
(13%) directors Non-executive (50%)
7_9 years (25%)
Experience Gender
Other (6%) Male (81%)
Government regulatory and/or (13%) Female
(19%) Insurance (44%)
Financial services (37%)
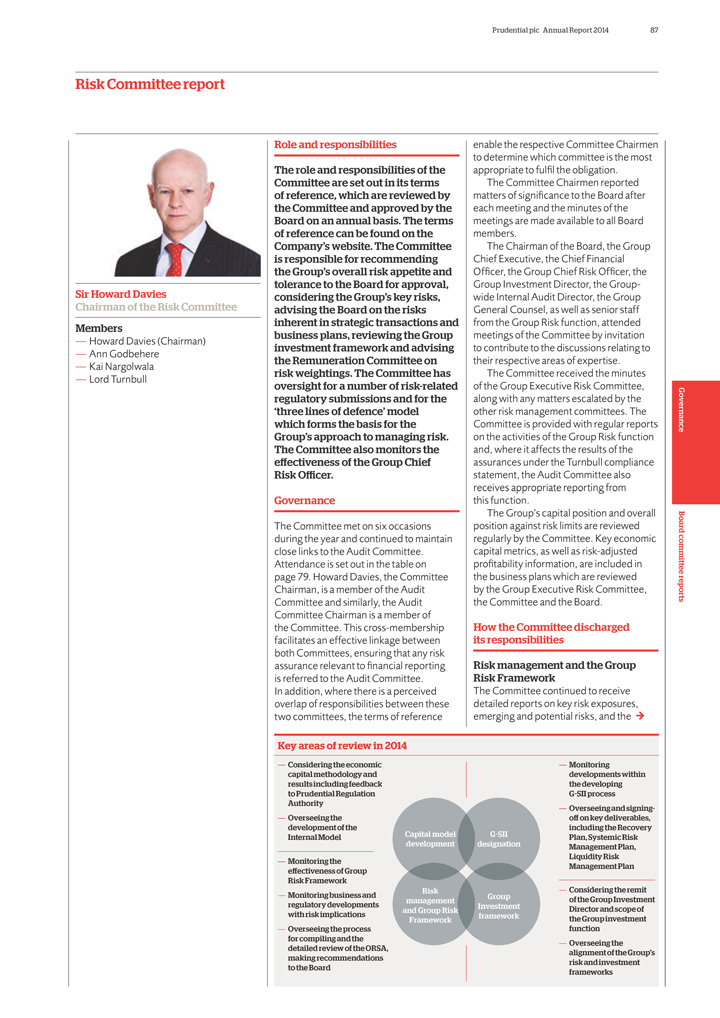
Prudential plc Annual Report 2014 87
Risk
Committee report
Sir Howard Davies
Chairman of the Risk Committee Members
— Howard Davies (Chairman)
— Ann Godbehere
— Kai Nargolwala
— Lord Turnbull
Role and responsibilities
The role and responsibilities of the Committee are set out in its
terms of reference, which are reviewed by the Committee and approved by the Board on an annual basis. The terms of reference can be found on the Company’s website. The Committee is responsible for recommending the Group’s overall risk
appetite and tolerance to the Board for approval, considering the Group’s key risks, advising the Board on the risks inherent in strategic transactions and business plans, reviewing the Group investment framework and advising the Remuneration
Committee on risk weightings. The Committee has oversight for a number of risk-related regulatory submissions and for the ‘three lines of defence’ model which forms the basis for the Group’s approach to managing risk. The Committee
also monitors the effectiveness of the Group Chief Risk Officer.
Governance
The Committee met on six occasions during the year and continued to maintain close links to the Audit Committee. Attendance is set out in the table on page 79.
Howard Davies, the Committee Chairman, is a member of the Audit Committee and similarly, the Audit Committee Chairman is a member of the Committee. This cross-membership facilitates an effective linkage between both Committees, ensuring that any
risk assurance relevant to financial reporting is referred to the Audit Committee. In addition, where there is a perceived overlap of responsibilities between these two committees, the terms of reference
enable the respective Committee Chairmen to determine which committee is the most appropriate to fulfil the obligation.
The Committee Chairmen reported matters of significance to the Board after each meeting and the minutes of the meetings are made available to all Board members.
The Chairman of the Board, the Group Chief Executive, the Chief Financial Officer, the Group Chief Risk Officer, the Group Investment Director, the Group-wide Internal Audit
Director, the Group General Counsel, as well as senior staff from the Group Risk function, attended meetings of the Committee by invitation to contribute to the discussions relating to their respective areas of expertise.
The Committee received the minutes of the Group Executive Risk Committee, along with any matters escalated by the other risk management committees. The Committee is provided with
regular reports on the activities of the Group Risk function and, where it affects the results of the assurances under the Turnbull compliance statement, the Audit Committee also receives appropriate reporting from this function.
The Group’s capital position and overall position against risk limits are reviewed regularly by the Committee. Key economic capital metrics, as well as risk-adjusted
profitability information, are included in the business plans which are reviewed by the Group Executive Risk Committee, the Committee and the Board.
How the
Committee discharged its responsibilities
Risk management and the Group Risk Framework
The Committee continued to receive detailed reports on key risk exposures, emerging and potential risks, and the
Key areas of review in 2014
— Considering the economic
capital methodology and
results including feedback
to Prudential Regulation
Authority
— Overseeing the
development of the
Internal Model
— Monitoring the
effectiveness of Group
Risk Framework
— Monitoring business and
regulatory developments
with risk implications
— Overseeing the process
for compiling and the
detailed review of the ORSA,
making recommendations
to the Board
Capital model development
Risk management and Group Risk Framework
G-SII designation
Group Investment framework
— Monitoring developments within the developing G-SII process
— Overseeing and
signing- off on key deliverables, including the Recovery Plan, Systemic Risk Management Plan, Liquidity Risk Management Plan
— Considering the remit of the
Group Investment Director and scope of the Group investment function
— Overseeing the alignment of the Group’s risk and investment frameworks
Governance Board committee reports
88 Prudential plc Annual Report 2014 Governance
Board committee reports continued
drivers of risk throughout the Group. It
received regular updates from the Group Investment Director and various departments on market conditions and their impact on the business as a whole. The committee considered the stress scenarios and results of the Group’s stress testing, and
considered the appropriateness of the ‘three lines of defence’ model on which the Group Risk Framework is based. More information on the model can be found in the Group Chief Risk Officer’s report on page 51. The information received
enabled the committee to monitor capital and liquidity management, and to assess and challenge both the effectiveness and appropriateness of the Group Risk Framework, ensuring that it continued to support the risk appetite as determined by the
Board. Adjustments to specific limits and policies within the established risk appetite were considered and approved by the committee.
The findings of the regular
survey on risk culture across the Group were reviewed by the Committee and provided a backdrop to the environment in which the Group Risk Framework is implemented.
Cyber risk
The committee reviewed an in-depth report into the Group’s
arrangements for managing cyber risk. This included measuring the current arrangements against the approved appetite and tolerance and considering the levels of inter-connectedness between the Group’s operating business units.
Economic capital models and regulatory reporting
The committee continued to oversee the
development of the Group’s economic
capital model ahead on the implementation of Solvency II in 2016. The model continues to be based on draft rules and a
number of working assumptions as set out in the Additional information on page 324. The committee’s oversight will continue through 2015 as the model is finalised and agreed with the Prudential Regulation Authority.
The committee reviewed a number of regulatory submissions and recommended them to the Board for approval. One of the key new submissions in the year was the Group’s Own Risk
and Solvency Assessment (ORSA). The committee was also kept updated on the discussions with the Prudential Regulation Authority in respect of the findings of the ORSA.
The Group’s response to the 2014 European Insurance and Occupational Pensions Authority Guidelines on the System of Governance stress test was considered by the committee
prior to its submission to the Regulator.
Globally Systemically Important Insurer (G-SII)
In July 2013, the Group was designated as a Globally Systemically Important Insurer by the Financial Stability Board. The committee continued to oversee the deliverables required
as a result of the Group’s designation and dialogue remained ongoing with the Prudential Regulation Authority in respect of the growing scope of this project.
Group investment framework
The alignment of the Group risk and investment
frameworks was considered by the committee. The views of the Group Chief Risk Officer and Group Investment Director were taken into account, as was the need to maintain a clear separation
between the relevant lines of defence. The Group Risk Framework already encompassed established limits and processes in respect of managing credit, liquidity, market, operational
and other risks, and it was deemed appropriate to use this framework to enhance the Group’s oversight of its investment approach. The committee’s terms of reference were updated accordingly to refiect this responsibility.
Ongoing development
The committee regularly received updates from the Group Investment
Director, Group Risk and Group Treasury functions on industry and market developments and their impact on the Group. Members of the committee and relevant executive directors attended a joint session with the Audit Committee in respect of the
results of the internal model developed under Solvency II provisions.
Committee effectiveness
The effectiveness of the committee was evaluated as part of the overall performance evaluation of the Board which confirmed that the committee continued to operate effectively
during the year. More information on this exercise can be found under the Performance Evaluation section on page 77.
Remuneration Committee report
The report on the responsibilities and activities of the Remuneration Committee can be found in the Directors’ Remuneration Report, which is set out on pages 93 to 120.
Corporate governance codes
In line with its primary listings on the London
and Hong Kong stock exchanges, the Company has applied the principles of the UK and HK Codes as set out in the Governance report on pages 71 to 91 and also in the Directors’ Remuneration Report, which can be found on pages 93 to 120.
The Board confirms that it has complied with all relevant principles set out in the UK and HK Codes throughout the accounting period. With respect to Code
Provision B.1.2(d) of the HK Code, the responsibilities of the Remuneration Committee do not include making recommendations to the Board on the remuneration of non-executive directors.
In line with the principles of the UK Code, fees for non-executive directors are determined by the Board.
The UK Code, issued in 2012, can be viewed on the Financial Reporting Council’s website, with the HK Code available on the website of the HK Stock Exchange.
Prudential plc Annual Report 2014 89
Additional
information
Appointment of Directors
The Board, or the members in a general
meeting, may appoint a maximum of 20 directors as set out in the Company’s Articles of Association. Their removal and resignation is also governed by the Articles, as well as provisions of the governance codes which the Company abides by and as
stipulated in the relevant provisions of the Companies Act 2006.
Conflicts of interest
Directors have a statutory duty to avoid confiicts of interest with the Company. The Company’s Articles of Association allow its directors to authorise confiicts of interest
and the Board has adopted a policy and effective procedures to manage and, where appropriate, approve confiicts or potential confiicts of interest. Under these procedures, directors are required to declare all directorships in companies which are
not part of the Group, along with other positions which could result in confiicts or could give rise to a potential confiict.
The Nomination Committee, or the
Board where appropriate, evaluates and approves each such situation individually where applicable and reviews authorisations annually prior to the publication of the Annual Report.
Directors’ external appointments
Directors may hold directorships or other significant
interests in companies outside the Group which may have business relationships with the Group.
Non-executive directors may hold positions on a number of external
company boards or other bodies provided that they are able to demonstrate satisfactory time commitment to their role at Prudential and that they discuss any new appointment with the Chairman prior to accepting. This ensures that they do not
compromise their independence and that any potential confiicts of interest and any possible issues arising out of the time commitments required by the new role can be identified and addressed appropriately. The major commitments of the non-executive
directors are detailed in their biographies on pages 74 to 75.
Executive directors may accept external directorships and retain any fees earned from those
directorships subject to prior discussion with either the Chairman or Group Chief Executive and, where necessary, consideration by the Nomination Committee. Permission is granted provided that they do not lead to any confiicts of interest.
Some executive directors hold directorships of other listed companies,
but
would not be expected to hold more than one such appointment, nor hold the chairmanship of a FTSE 100 company. In addition, executive directors may also hold directorships or trustee positions of unquoted companies or institutions. Details of any
fees retained are included in the Directors’ Remuneration Report on page 114.
Directors’ indemnities and protections
The Company’s Articles of Association permit the directors and officers of the Company to be indemnified in respect of liabilities incurred as a result of their office.
Suitable insurance cover is in place in respect of legal action against directors and senior managers of companies within the Group. Directors and certain senior
managers of companies within the Group are provided with protection against personal financial exposure which may be incurred in their capacity as such. These include qualifying third party indemnity provisions (as defined by the Companies Act 2006)
for the benefit of directors of Prudential plc and other such persons including, where applicable, in their capacity as directors of other companies within the Group. These indemnities were in force during 2014 and remain in force.
Terms of appointment for non-executive directors
Non-executive directors are appointed on the
understanding that they serve an initial term of three years. Subject to review by the Nomination Committee, it would be expected that they would serve a second term of three years. In both instances, non-executive directors remain subject to annual
election at the Annual General Meeting. After six years of service, non-executive directors may be appointed for a further year, up to a maximum of three years, subject to rigorous annual review by the Nomination Committee and annual election at the
Annual General Meeting. Good governance does not generally support the practice of serving longer than nine years on the Board as a non-executive director.
Compensation for loss of office
The Company’s policy on loss of office
payments for directors formed part of the directors’ remuneration policy which was approved by shareholders at the 2014 AGM. A copy of this can be found on the Company’s website.
Share dealing and inside information
Prudential confirms that it has adopted a code of conduct
regarding securities
transactions by directors on terms no less exacting than required by Appendix 10 to the Hong Kong Listing Rules, and that the directors have
complied with this code of conduct throughout the period.
Relevant controls are applied to the handling and dissemination of inside information which form part of
the Group’s internal governance framework.
Powers of the Board
The Board
may exercise all powers conferred on it by the Company’s Articles of Association and the Companies Act 2006. This includes the powers of the Company to borrow money and to mortgage or charge any of its assets (subject to the limitations set out
in the Companies Act 2006 and the Company’s Articles of Association) and to give a guarantee, security or indemnity in respect of a debt or other obligation of the Company.
US regulation and legislation
As a result of its listing on the New York stock exchange, the
Company is required to comply with the relevant provisions of the Sarbanes-Oxley Act 2002 as they apply to foreign private issuers and has adopted procedures to ensure such compliance.
In particular, in relation to s.302 of the Sarbanes-Oxley Act 2002 which covers disclosure controls and procedures, a Disclosure Committee has been established, reporting to the
Group Chief Executive, chaired by the Chief Financial Officer and comprising members of senior management. The work of the Disclosure Committee supports the Group Chief Executive and Chief Financial Officer in making the certifications regarding the
effectiveness of the Group’s disclosure procedures.
Change of control
Under the agreements governing
Prudential Corporation Holdings Limited’s
life insurance and fund management joint ventures with China International Trust & Investment Corporation (‘CITIC’), if there is a change of control of the Company, CITIC may terminate the agreements and either (i) purchase
the Company’s entire interest in the joint venture or require the Company to sell its interest to a third party designated by CITIC, or (ii) require the Company to purchase all of CITIC’s interest in the joint venture. The price of
such purchase or sale is to be the fair value of the shares to be transferred, as determined by the auditor of the joint venture.
Board committee reports Corporate
governance codes Governance Additional information
90 Prudential plc Annual Report 2014 Governance
Additional information continued
Significant contracts
At no time during the year did any director hold a material interest in any contract of significance with the Company or any subsidiary undertaking.
Customers
The five largest customers of the Group constituted in aggregate less than
30 per cent of its total sales for each of 2014 and 2013.
For the year ended 31 December 2014, none of the directors, their associates or any
shareholders of the Company (which have, to the knowledge of the directors of the Company, owned more than 5 per cent of the issued share capital) had any interest in the Group’s major customers.
Statutory and regulatory disclosures
Financial reporting
The directors have a duty to report to shareholders on the performance and financial position of the Group and are responsible for preparing the financial statements on pages 123
to 269 and the supplementary information on pages 277 to 307. It is the responsibility of the auditor to form independent opinions, based on its audit of the financial statements and its audit of the EEV basis supplementary information, and to
report its opinions to the Company’s shareholders and to the Company. Its opinions are given on pages 271 to 273 and 309.
Company law requires the directors
to prepare financial statements for each financial year which give a true and fair view of the financial affairs of the Company and of the Group. The criteria applied in the preparation of the financial statements are set out in the statement of
directors’ responsibilities on page 270 and page 308.
Company law also requires the Board to approve the Strategic report. In addition, the UK Code requires
the directors’ statement to state that they consider the annual report and financial statements, taken as a whole is fair, balanced and understandable and provides the information necessary for shareholders to assess the Company’s
performance, business model and strategy.
The directors are further required to confirm that the Strategic report includes a fair review of the development and
performance of the business, with a description of the principal risks and uncertainties. Such confirmation is included in the statement of directors’ responsibilities on pages 270 and 308.
The Strategic report provides, on pages 47 to 49, a description of the Group’s risk and capital management, which includes a description of the Group’s liquidity
position. These risks are also discussed in the audited sections of the Group Chief Risk Officer’s report on the risks facing our business and our capital strength.
The directors who held office at the date of approval of this directors’ report confirm that, so far as they are each aware, there is no relevant audit information of which
the Company’s auditor is unaware; each director has taken all the steps that he or she ought to have taken as a director to make himself or herself aware of any relevant audit information and to establish that the Company’s auditor is
aware of that information. This confirmation is given and should be interpreted in accordance with the provisions of Section 418 of the Companies Act 2006.
Going concern
In accordance with the requirements of the guidance issued by
the Financial Reporting Council in October 2009 ‘Going Concern and Liquidity Risk: Guidance for Directors of UK companies 2009’, after making sufficient enquiries the directors have a reasonable expectation that the Company and the Group
have adequate resources to continue their operations for the foreseeable future. In support of this expectation, the Company’s business activities, together with the factors likely to affect its future development, successful performance and
position in the current economic climate are set out in the Strategic report on pages 39 to 50. The risks facing the Group’s capital and liquidity
positions
and their sensitivities are referred to in the Strategic report on pages 51 to 60. Specifically, the Group’s borrowings are detailed in note C6 on pages 225 to 226, the market risk and liquidity analysis associated with the Group’s assets
and liabilities can be found in note C3.5(a) on pages 199 to 200, policyholder liability maturity profile by business units in notes C4.1(b), (c) and (d) on pages 207, 209 and 210 respectively, cash fiow details in the consolidated
statement of cash fiows and provisions and contingencies in note C12 on page 254. The directors therefore have continued to adopt the going concern basis of accounting in preparing the financial statements for the year ended
31 December 2014.
Prudential plc Annual Report 2014 91
Index to
principal Directors’ Report disclosures
Information required to be disclosed in the Directors’ Report may be found in the following sections:
Information Section in Annual Report Page number(s)
Business review Strategic report 15
Disclosure of information to auditor Additional information 90
Directors in
office during the year Board of Directors 72-75
Dividend recommended for the year Strategic report 50
Details of qualifying third-party indemnity provisions Governance report 89
Corporate
responsibility governance Corporate responsibility review 70
Political donations and expenditure Corporate responsibility review 68
Greenhouse gas emissions Corporate responsibility review 69
Financial instruments – risk
management objectives Strategic report 51
and policies
Post-balance sheet
events Note D4 of the Notes on the Group financial statements 259
Future developments of the business of the Company Group Chief Executive’s report 13
Employment policies and employee involvement Corporate responsibility review 63-66
Structure of share capital, including restrictions Shareholder information 348
on the transfer
of securities, voting rights and
significant shareholders
Rules governing
appointments of directors Governance report 89
Remuneration Committee report Directors’ remuneration report 101
Directors’ interests in shares Directors’ remuneration report 112
Rules governing
changes to the Articles of Association Shareholder information 348
Powers of directors Governance report 89
Significant agreements impacted by a change of control Governance report 89
Agreements for
compensation for loss of office Governance report 89
or employment on takeover
In addition, the risk factors set out on pages 338 to 343 and the additional unaudited financial information set out on pages 313 to 337, are incorporated by
reference into this Directors’ Report.
Signed on behalf of the Board of Directors
Alan F Porter
Group Company Secretary
9 March 2015
Additional information
Statutory and regulatory disclosures
Governance Index to principal Directors’ Report
disclosures

92 Prudential plc Annual Report 2014

Prudential plc Annual Report 2014 93
Section 4
Directors’ remuneration report
94 Annual statement from the Chairman of the Remuneration Committee
96 Our executive
remuneration at a glance
98 Summary of Directors’ remuneration policy 101 Annual report on remuneration 116 Supplementary information
remuneration Directors’ report
This report has been prepared to comply with Schedule 8 of
the Large and Medium-sized Companies and Groups (Accounts and Reports) (Amendment) Regulations 2013, as well as the Companies Act 2006 and other related regulations.
The following sections were subject to audit: Salary information table in section entitled ‘Base salary’, Annual Bonus, Long Term Incentive Plans with
performance periods ending on
31 December 2014, Pension entitlements, Table of 2014 and 2013 executive director total remuneration ‘The Single
Figure’ and related notes, Long-term incentives awarded in 2014, Non-executive director remuneration in 2014, Statement of directors’ shareholdings, Outstanding share options, Recruitment
Arrangements and Payments to past directors. 4
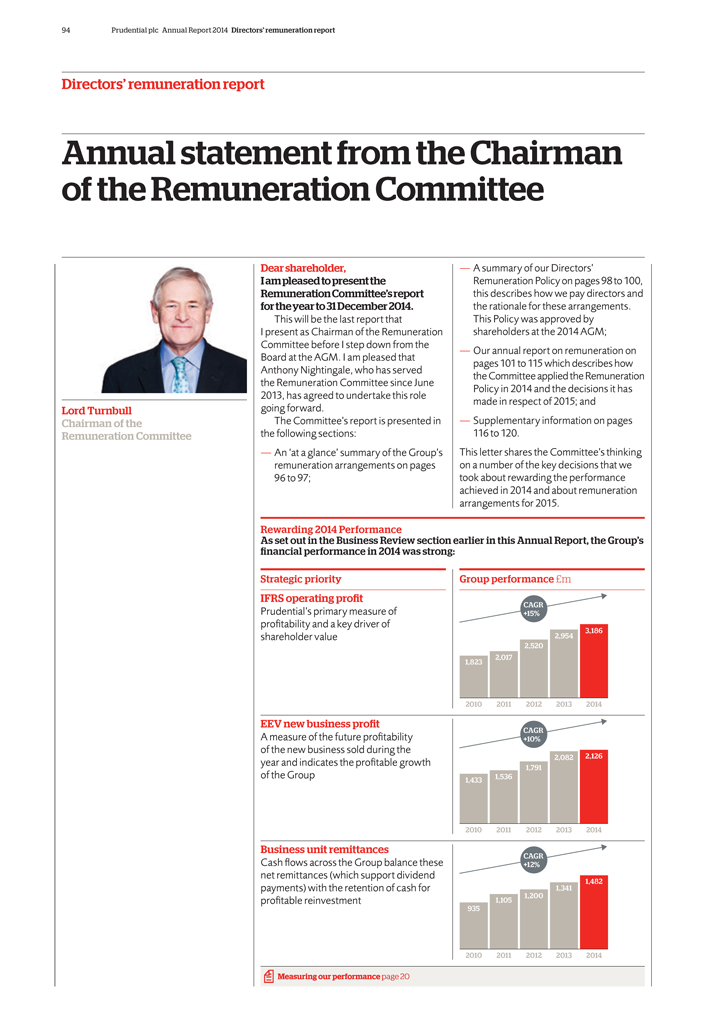
94 Prudential plc Annual Report 2014 Directors’ remuneration report
Directors’ remuneration report
Annual statement from the Chairman of the Remuneration
Committee
Lord Turnbull Chairman of the
Remuneration Committee
Dear shareholder, I am pleased to present the Remuneration Committee’s report for the year to 31 December 2014.
This will be the last report that
I present as Chairman of the Remuneration Committee before I
step down from the Board at the AGM. I am pleased that Anthony Nightingale, who has served the Remuneration Committee since June 2013, has agreed to undertake this role going forward.
The Committee’s report is presented in the following sections:
— An ‘at a
glance’ summary of the Group’s remuneration arrangements on pages 96 to 97;
— A summary of our Directors’
Remuneration Policy on pages 98 to 100, this describes how we pay directors and the rationale for these arrangements. This Policy was approved by shareholders at the 2014 AGM;
— Our annual report on remuneration on pages 101 to 115 which describes how the Committee applied the Remuneration Policy in 2014 and the decisions it has
made in respect of 2015; and
— Supplementary information on pages 116 to 120.
This letter shares the Committee’s thinking on a number of the key decisions that we took about rewarding the performance achieved in 2014 and about remuneration arrangements
for 2015.
Rewarding 2014 Performance
As set out in the Business Review
section earlier in this Annual Report, the Group’s financial performance in 2014 was strong:
Strategic priority
IFRS operating profit
Prudential’s primary measure of profitability and a key driver of
shareholder value
EEV new business profit
A measure of the future
profitability of the new business sold during the year and indicates the profitable growth of the Group
Business unit remittances
Cash fiows across the Group balance these net remittances (which support dividend payments) with the retention of cash for profitable reinvestment
Measuring our performance page 20
Group performance £m
CAGR +15%
3,186 2,954 2,520 2,017 1,823
2010 2011 2012 2013 2014
CAGR +10%
2,082 2,126 1,791 1,536 1,433
2010 2011 2012 2013 2014
CAGR +12%
1,341 1,482 1,200 1,105 935
2010 2011 2012 2013 2014
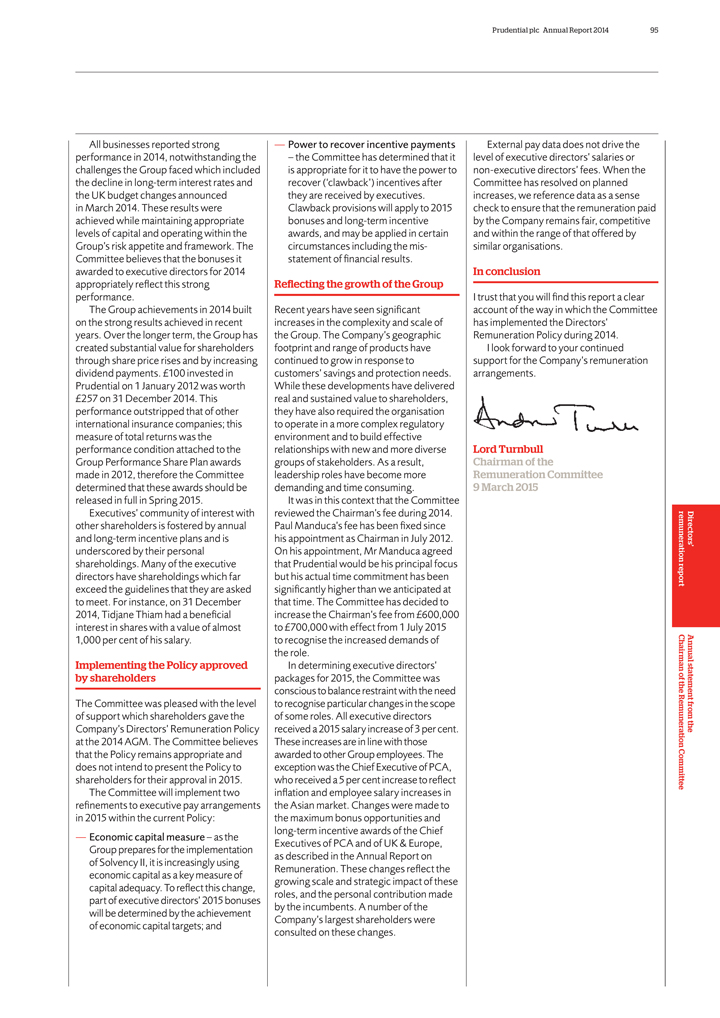
Prudential plc Annual Report 2014 95
All
businesses reported strong performance in 2014, notwithstanding the challenges the Group faced which included the decline in long-term interest rates and the UK budget changes announced in March 2014. These results were achieved while maintaining
appropriate levels of capital and operating within the Group’s risk appetite and framework. The Committee believes that the bonuses it awarded to executive directors for 2014 appropriately refiect this strong performance.
The Group achievements in 2014 built on the strong results achieved in recent years. Over the longer term, the Group has created substantial value for shareholders through share
price rises and by increasing dividend payments. £100 invested in Prudential on 1 January 2012 was worth £257 on 31 December 2014. This performance outstripped that of other international insurance companies; this measure of
total returns was the performance condition attached to the Group Performance Share Plan awards made in 2012, therefore the Committee determined that these awards should be released in full in Spring 2015.
Executives’ community of interest with other shareholders is fostered by annual and long-term incentive plans and is underscored by their personal shareholdings. Many of the
executive directors have shareholdings which far exceed the guidelines that they are asked to meet. For instance, on 31 December 2014, Tidjane Thiam had a beneficial interest in shares with a value of almost 1,000 per cent of his salary.
Implementing the Policy approved by shareholders
The Committee was pleased
with the level of support which shareholders gave the Company’s Directors’ Remuneration Policy at the 2014 AGM. The Committee believes that the Policy remains appropriate and does not intend to present the Policy to shareholders for their
approval in 2015.
The Committee will implement two refinements to executive pay arrangements in 2015 within the current Policy:
— Economic capital measure – as the
Group prepares for the implementation of
Solvency II, it is increasingly using economic capital as a key measure of capital adequacy. To refiect this change, part of executive directors’ 2015 bonuses will be determined by the achievement of economic capital targets; and
— Power to recover incentive payments
– the Committee has determined that it is
appropriate for it to have the power to recover (‘clawback’) incentives after they are received by executives. Clawback provisions will apply to 2015 bonuses and long-term incentive awards, and may be applied in certain circumstances
including the misstatement of financial results.
Reflecting the growth of the Group
Recent years have seen significant increases in the complexity and scale of the Group. The Company’s geographic footprint and range of products have continued to grow in
response to customers’ savings and protection needs. While these developments have delivered real and sustained value to shareholders, they have also required the organisation to operate in a more complex regulatory environment and to build
effective relationships with new and more dive groups of stakeholders. As a result, leadership roles have become more demanding and time consuming.
It was in this
context that the Committee reviewed the Chairman’s fee during 2014. Paul Manduca’s fee has been fixed since his appointment as Chairman in July 2012. On his appointment, Mr Manduca agreed that Prudential would be his principal focus but
his actual time commitment has been significantly higher than we anticipated at that time. The Committee has decided to increase the Chairman’s fee from £600,000 to £700,000 with effect from 1 July 2015 to recognise the
increased demands of the role.
In determining executive directors’ packages for 2015, the Committee was conscious to balance restraint with the need to
recognise particular changes in the scope of some roles. All executive directors received a 2015 salary increase of 3 per cent. These increases are in line with those awarded to other Group employees. The exception was the Chief Executive of
PCA, who received a 5 per cent increase to refiect infiation and employee salary increases in the Asian market. Changes were made to the maximum bonus opportunities and long-term incentive awards of the Chief Executives of PCA and of
UK & Europe, as described in the Annual Report on Remuneration. These changes refiect the growing scale and strategic impact of these roles, and the personal contribution made by the incumbents. A number of the Company’s largest
shareholders were consulted on these changes.
External pay data does not drive the level of executive directors’ salaries or non-executive directors’
fees. When the Committee has resolved on planned increases, we reference data as a sense check to ensure that the remuneration paid by the Company remains fair, competitive and within the range of that offered by similar organisations.
In conclusion
I trust that you will find this report a clear account of the way in which the
Committee has implemented the Directors’ Remuneration Policy during 2014.
I look forward to your continued support for the Company’s remuneration
arrangements.
Lord Turnbull Chairman of the
Remuneration Committee
9 March 2015
Directors’ Annual statement from the remuneration
report Chairman of the Remuneration Committee
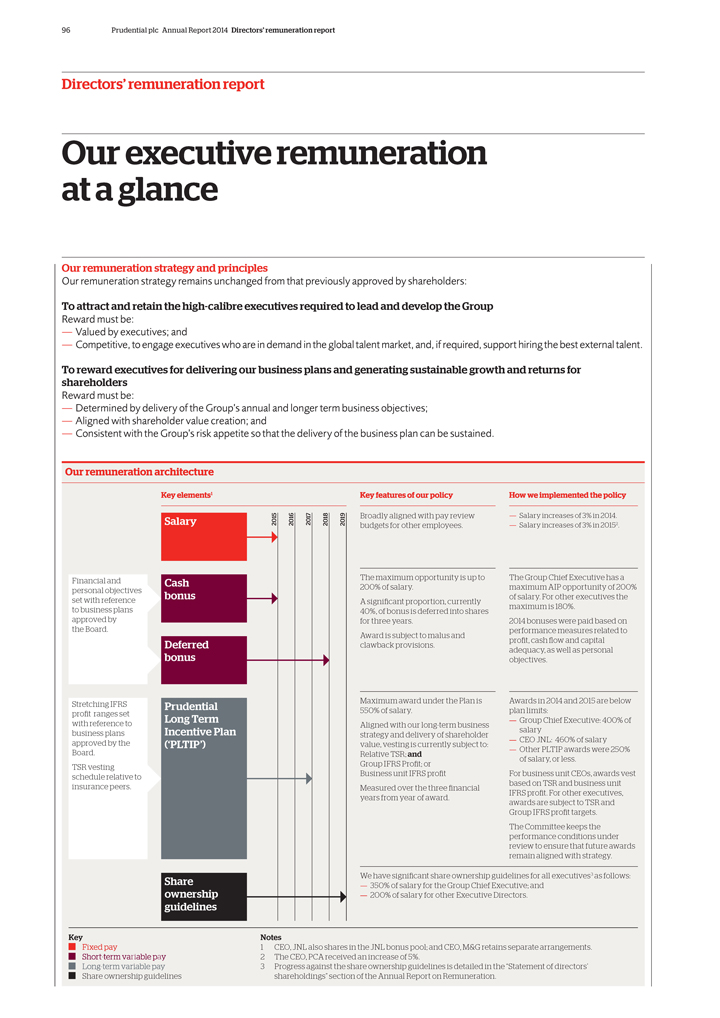
96 Prudential plc Annual Report 2014 Directors’ remuneration report
Directors’ remuneration report
Our executive remuneration at a glance
Our remuneration strategy and principles
Our remuneration strategy remains unchanged from that
previously approved by shareholders:
To attract and retain the high-calibre executives required to lead and develop the Group
Reward must be:
— Valued by executives; and
— Competitive, to engage executives who are in demand in the global talent market, and, if required, support hiring the best external talent.
To reward executives for delivering our business plans and generating sustainable growth and returns for shareholders
Reward must be:
— Determined by delivery of the Group’s annual and longer term
business objectives;
— Aligned with shareholder value creation; and
— Consistent with the Group’s risk appetite so that the delivery of the business plan can be sustained.
Our remuneration architecture
Financial and personal objectives set with reference to business
plans approved by the Board.
Stretching IFRS profit ranges set with reference to business plans approved by the Board.
TSR vesting schedule relative to insurance peers.
Key elements1
Salary 2015 2016 2017 2018 2019
Cash bonus
Deferred bonus
Prudential Long Term Incentive Plan (‘PLTIP’)
Share ownership guidelines
Key features of our policy
Broadly aligned with pay review budgets for other employees.
The maximum opportunity is up to
200% of salary.
A significant proportion, currently 40%, of bonus is deferred into shares for three years.
Award is subject to malus and clawback provisions.
Maximum award under the Plan is 550% of
salary.
Aligned with our long-term business strategy and delivery of shareholder value, vesting is currently subject to: Relative TSR; and Group IFRS Profit; or
Business unit IFRS profit Measured over the three financial years from year of award.
How we implemented the policy
— Salary increases of 3% in 2014.
— Salary increases of 3% in 20152.
The Group Chief Executive has a maximum AIP opportunity of 200% of salary. For other executives the maximum is 180%.
2014 bonuses were paid based on performance measures related to profit, cash flow and capital adequacy, as well as personal objectives.
Awards in 2014 and 2015 are below plan limits:
— Group Chief Executive: 400% of salary
— CEO JNL: 460% of salary
— Other PLTIP awards were 250% of salary,
or less.
For business unit CEOs, awards vest based on TSR and business unit IFRS profit. For other executives, awards are subject to TSR and Group IFRS profit
targets.
The Committee keeps the performance conditions under review to ensure that future awards remain aligned with strategy.
We have significant share ownership guidelines for all executives3 as follows:
— 350% of
salary for the Group Chief Executive; and
— 200% of salary for other Executive Directors.
Key
Fixed pay
Short-term variable pay Long-term variable pay Share ownership guidelines
Notes
| 1 | CEO, JNL also shares in the JNL bonus pool; and CEO, M&G retains separate arrangements. |
| 2 | The CEO, PCA received an increase of 5%. |
3 Progress against the share ownership guidelines is detailed in the “Statement of directors’ shareholdings” section of the Annual Report on Remuneration.
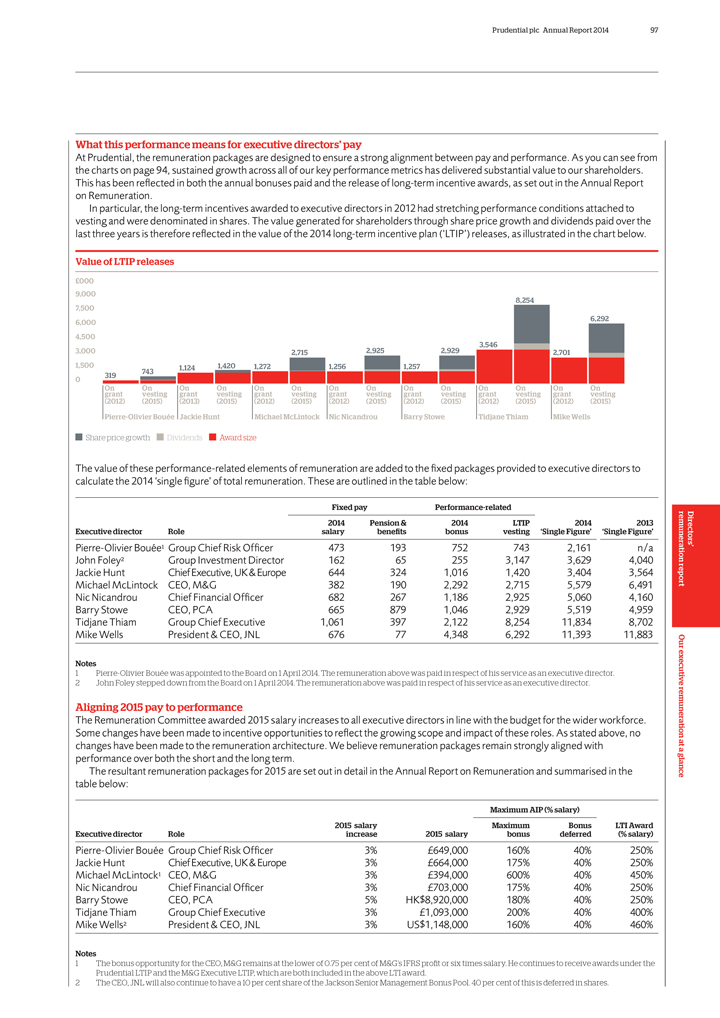
Prudential plc Annual Report 2014 97
What this
performance means for executive directors’ pay
At Prudential, the remuneration packages are designed to ensure a strong alignment between pay and performance.
As you can see from
the charts on page 94, sustained growth across all of our key performance metrics has delivered substantial value to our shareholders.
This has been refiected in both the annual bonuses paid and the release of long-term incentive awards, as set out in the Annual Report
on Remuneration.
In particular, the long-term incentives awarded to executive directors in
2012 had stretching performance conditions attached to
vesting and were denominated in shares. The value generated for shareholders through share price growth and
dividends paid over the
last three years is therefore reflected in the value of the 2014 long-term incentive plan (‘LTIP’) releases, as illustrated in
the chart below.
Value of LTIP releases
£000
9,000
8,254
7,500
6,000 6,292
4,500
3,546
3,000 2,715 2,925 2,929 2,701
1,500 1,124 1,420 1,272 1,256 1,257
319 743
0
On On On On On On On On On On On On On On
grant vesting grant vesting grant
vesting grant vesting grant vesting grant vesting grant vesting
(2012)
(2015) (2013) (2015) (2012) (2015) (2012) (2015) (2012) (2015) (2012) (2015) (2012) (2015)
Pierre-Olivier Bouée Jackie Hunt Michael McLintock Nic Nicandrou Barry Stowe Tidjane Thiam Mike Wells
Share price growth Dividends Award size
The value of these performance-related elements of
remuneration are added to the fixed packages provided to executive directors to calculate the 2014 ‘single figure’ of total remuneration. These are outlined in the table below:
Fixed pay Performance-related
2014 Pension & 2014 LTIP 2014 2013
Executive director Role salary benefits bonus vesting ‘Single Figure’ ‘Single Figure’
Pierre-Olivier Bouée1 Group Chief Risk Officer 473 193 752 743 2,161 n/a
John Foley2
Group Investment Director 162 65 255 3,147 3,629 4,040
Jackie Hunt Chief Executive, UK & Europe 644 324 1,016 1,420 3,404 3,564
Michael McLintock CEO, M&G 382 190 2,292 2,715 5,579 6,491
Nic Nicandrou Chief Financial
Officer 682 267 1,186 2,925 5,060 4,160
Barry Stowe CEO, PCA 665 879 1,046 2,929 5,519 4,959
Tidjane Thiam Group Chief Executive 1,061 397 2,122 8,254 11,834 8,702
Mike Wells
President & CEO, JNL 676 77 4,348 6,292 11,393 11,883
Notes
1
Pierre-Olivier Bouée was appointed to the Board on 1 April 2014. The remuneration above was paid in respect of his service as an executive director.
2
John Foley stepped down from the Board on 1 April 2014. The remuneration above was paid in respect of his service as an executive director.
Aligning 2015 pay
to performance
The Remuneration Committee awarded 2015 salary increases to all executive directors in line with the budget for the wider workforce. Some changes
have been made to incentive opportunities to refiect the growing scope and impact of these roles. As stated above, no changes have been made to the remuneration architecture. We believe remuneration packages remain strongly aligned with performance
over both the short and the long term.
The resultant remuneration packages for 2015 are set out in detail in the Annual Report on Remuneration and summarised in
the table below:
Maximum AIP (% salary)
2015 salary Maximum Bonus LTI Award
Executive director Role increase 2015 salary bonus deferred (% salary)
Pierre-Olivier Bouée Group Chief Risk Officer 3% £649,000 160% 40% 250%
Jackie Hunt Chief Executive, UK & Europe 3% £664,000 175% 40% 250%
Michael
McLintock1 CEO, M&G 3% £394,000 600% 40% 450%
Nic Nicandrou Chief Financial Officer 3% £703,000 175% 40% 250%
Barry Stowe CEO, PCA 5% HK$8,920,000 180% 40% 250%
Tidjane Thiam Group Chief Executive 3%
£1,093,000 200% 40% 400%
Mike Wells2 President & CEO, JNL 3% US$1,148,000 160% 40% 460%
Notes
1 The bonus opportunity for the CEO, M&G remains at the lower of 0.75 per cent
of M&G’s IFRS profit or six times salary. He continues to receive awards under the Prudential LTIP and the M&G Executive LTIP, which are both included in the above LTI award.
2 The CEO, JNL will also continue to have a 10 per cent share of the Jackson Senior Management Bonus Pool. 40 per cent of this is deferred in shares.
Directors’ remuneration report Our executive remuneration at a glance
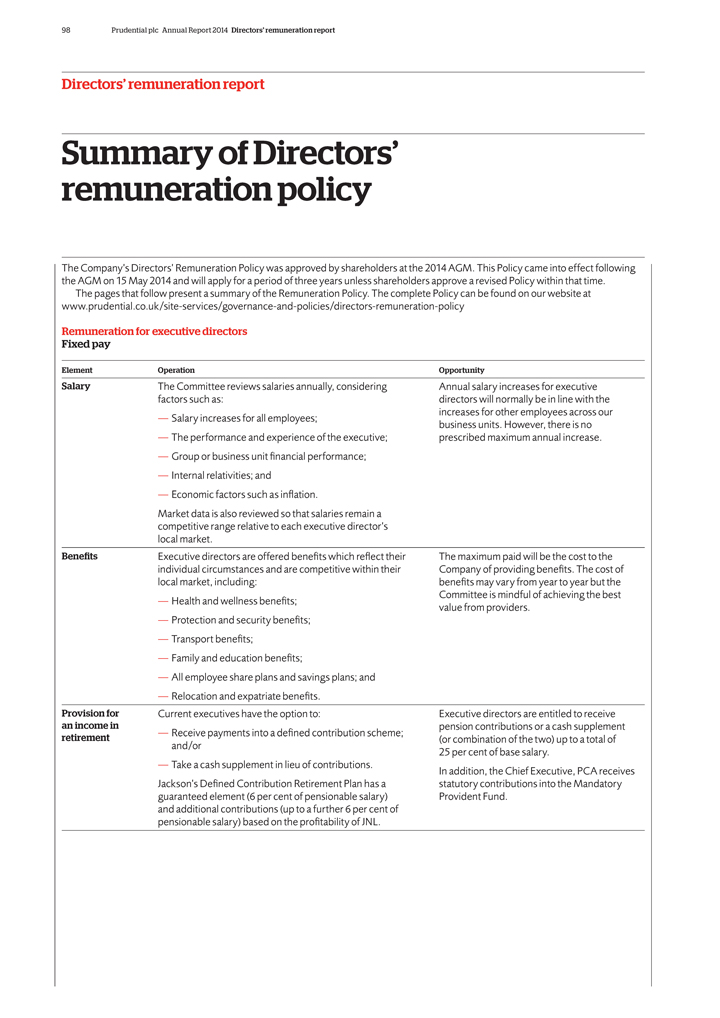
98 Prudential plc Annual Report 2014 Directors’ remuneration report
Directors’ remuneration report
Summary of Directors’ remuneration policy
The Company’s Directors’ Remuneration Policy was approved by shareholders at the 2014 AGM. This Policy came into effect following the AGM on 15 May 2014 and will
apply for a period of three years unless shareholders approve a revised Policy within that time.
The pages that follow present a summary of the Remuneration
Policy. The complete Policy can be found on our website at www.prudential.co.uk/site-services/governance-and-policies/directors-remuneration-policy
Remuneration
for executive directors Fixed pay
Element Operation Opportunity
Salary The
Committee reviews salaries annually, considering Annual salary increases for executive factors such as: directors will normally be in line with the increases for other employees across our
— Salary increases for all employees; business units. However, there is no
— The
performance and experience of the executive; prescribed maximum annual increase.
— Group or business unit financial performance;
— Internal relativities; and
— Economic factors such as infiation.
Market data is also reviewed so that salaries remain a competitive range relative to each executive director’s local market.
Benefits Executive directors are offered benefits which refiect their The maximum paid will be the cost to the individual circumstances and are competitive within their Company of
providing benefits. The cost of local market, including: benefits may vary from year to year but the Committee is mindful of achieving the best
— Health and
wellness benefits; value from providers.
— Protection and security benefits;
— Transport benefits;
— Family and education benefits;
— All employee share plans and savings plans; and
— Relocation and expatriate
benefits.
Provision for Current executives have the option to: Executive directors are entitled to receive an income in pension contributions or a cash supplement
— Receive payments into a defined contribution scheme; retirement (or combination of the two) up to a total of and/or 25 per cent of base salary.
— Take a cash supplement in lieu of contributions.
In addition, the
Chief Executive, PCA receives Jackson’s Defined Contribution Retirement Plan has a statutory contributions into the Mandatory guaranteed element (6 per cent of pensionable salary) Provident Fund. and additional contributions (up to a further
6 per cent of pensionable salary) based on the profitability of JNL.
Element Operation Opportunity
Salary The Committee reviews salaries annually, considering Annual salary increases for executive factors such as: directors will normally be in line with the increases for other
employees across our
— Salary increases for all employees; business units. However, there is no
— The performance and experience of the executive; prescribed maximum annual increase.
— Group or business unit financial performance;
— Internal
relativities; and
— Economic factors such as infiation.
Market data is
also reviewed so that salaries remain a competitive range relative to each executive director’s local market.
Benefits Executive directors are offered
benefits which refiect their The maximum paid will be the cost to the individual circumstances and are competitive within their Company of providing benefits. The cost of local market, including: benefits may vary from year to year but the Committee
is mindful of achieving the best
— Health and wellness benefits; value from providers.
— Protection and security benefits;
— Transport benefits;
— Family and education benefits;
— All employee share plans and savings plans; and
— Relocation and expatriate benefits.
Provision for Current executives
have the option to: Executive directors are entitled to receive an income in pension contributions or a cash supplement
— Receive payments into a defined
contribution scheme; retirement (or combination of the two) up to a total of and/or 25 per cent of base salary.
— Take a cash supplement in lieu of
contributions.
In addition, the Chief Executive, PCA receives Jackson’s Defined Contribution Retirement Plan has a statutory contributions into the Mandatory
guaranteed element (6 per cent of pensionable salary) Provident Fund. and additional contributions (up to a further 6 per cent of pensionable salary) based on the profitability of JNL.
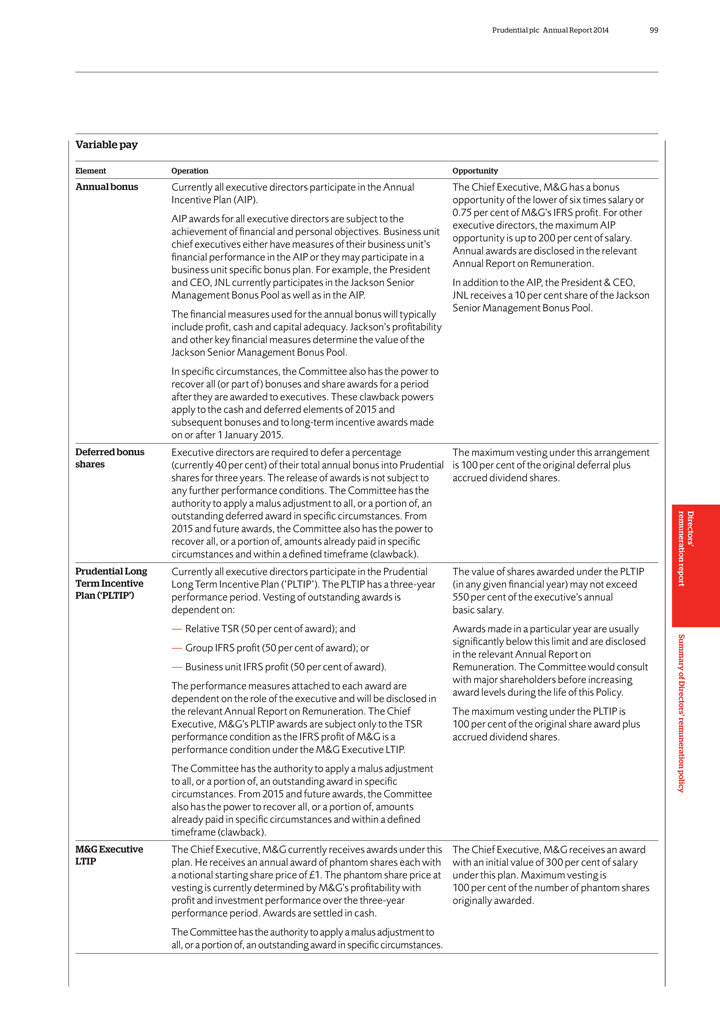
Prudential plc Annual Report 2014 99
Variable pay
Element Operation Opportunity
Annual bonus Currently all executive directors
participate in the Annual The Chief Executive, M&G has a bonus Incentive Plan (AIP). opportunity of the lower of six times salary or 0.75 per cent of M&G’s IFRS profit. For other AIP awards for all executive directors are subject
to the executive directors, the maximum AIP achievement of financial and personal objectives. Business unit opportunity is up to 200 per cent of salary. chief executives either have measures of their business unit’s Annual awards are
disclosed in the relevant financial performance in the AIP or they may participate in a Annual Report on Remuneration. business unit specific bonus plan. For example, the President and CEO, JNL currently participates in the Jackson Senior In
addition to the AIP, the President & CEO, Management Bonus Pool as well as in the AIP. JNL receives a 10 per cent share of the Jackson Senior Management Bonus Pool.
The financial measures used for the annual bonus will typically include profit, cash and capital adequacy. Jackson’s profitability and other key financial measures determine
the value of the Jackson Senior Management Bonus Pool.
In specific circumstances, the Committee also has the power to recover all (or part of) bonuses and share
awards for a period after they are awarded to executives. These clawback powers apply to the cash and deferred elements of 2015 and subsequent bonuses and to long-term incentive awards made on or after 1 January 2015.
Deferred bonus Executive directors are required to defer a percentage The maximum vesting under this arrangement shares (currently 40 per cent) of their total annual bonus
into Prudential is 100 per cent of the original deferral plus shares for three years. The release of awards is not subject to accrued dividend shares. any further performance conditions. The Committee has the authority to apply a malus
adjustment to all, or a portion of, an outstanding deferred award in specific circumstances. From 2015 and future awards, the Committee also has the power to recover all, or a portion of, amounts already paid in specific circumstances and within a
defined timeframe (clawback).
Prudential Long Currently all executive directors participate in the Prudential The value of shares awarded under the PLTIP Term
Incentive Long Term Incentive Plan (‘PLTIP’). The PLTIP has a three-year (in any given financial year) may not exceed Plan (‘PLTIP’) performance period. Vesting of outstanding awards is 550 per cent of the executive’s
annual dependent on: basic salary.
— Relative TSR (50 per cent of award); and Awards made in a particular year are usually significantly below this limit and
are disclosed
— Group IFRS profit (50 per cent of award); or in the relevant Annual Report on
— Business unit IFRS profit (50 per cent of award). Remuneration. The Committee would consult with major shareholders before increasing The performance measures attached to
each award are award levels during the life of this Policy. dependent on the role of the executive and will be disclosed in the relevant Annual Report on Remuneration. The Chief The maximum vesting under the PLTIP is Executive, M&G’s PLTIP
awards are subject only to the TSR 100 per cent of the original share award plus performance condition as the IFRS profit of M&G is a accrued dividend shares. performance condition under the M&G Executive LTIP.
The Committee has the authority to apply a malus adjustment to all, or a portion of, an outstanding award in specific circumstances. From 2015 and future awards, the Committee also
has the power to recover all, or a portion of, amounts already paid in specific circumstances and within a defined timeframe (clawback).
M&G Executive The
Chief Executive, M&G currently receives awards under this The Chief Executive, M&G receives an award LTIP plan. He receives an annual award of phantom shares each with with an initial value of 300 per cent of salary a notional starting
share price of £1. The phantom share price at under this plan. Maximum vesting is vesting is currently determined by M&G’s profitability with 100 per cent of the number of phantom shares profit and investment performance over the
three-year originally awarded. performance period. Awards are settled in cash.
The Committee has the authority to apply a malus adjustment to all, or a portion of,
an outstanding award in specific circumstances.
Directors’ remuneration report Summary of Directors’ remuneration policy
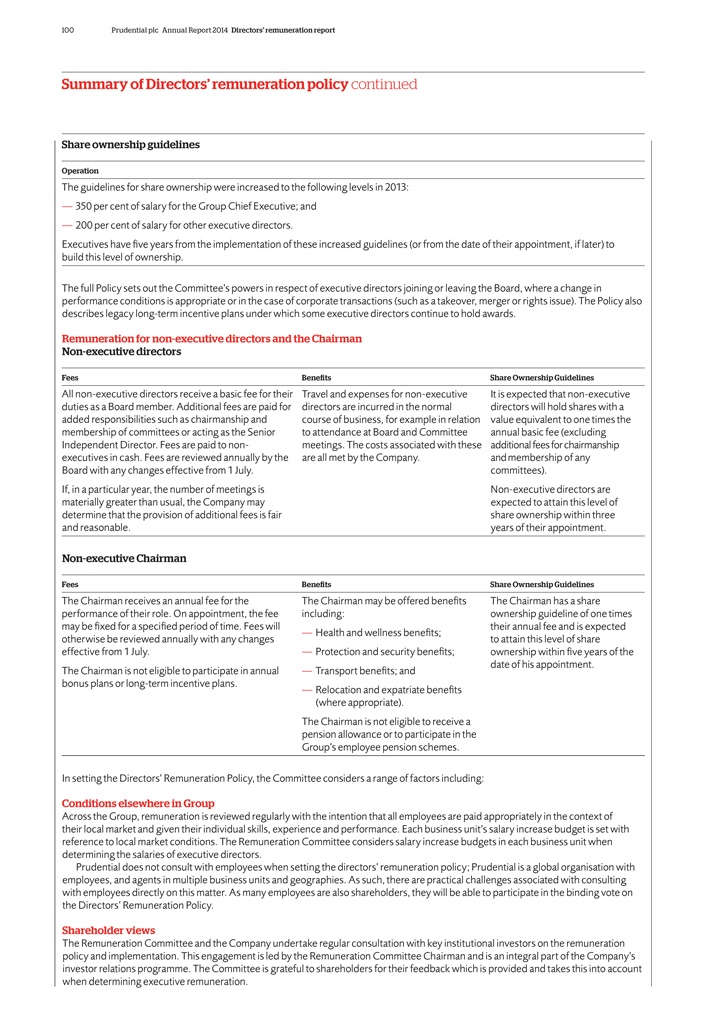
100 Prudential plc Annual Report 2014 Directors’ remuneration report
Summary of Directors’ remuneration policy continued
Share ownership guidelines
Operation
The guidelines for share ownership were increased to the following
levels in 2013:
— 350 per cent of salary for the Group Chief Executive; and
— 200 per cent of salary for other executive directors.
Executives have five years
from the implementation of these increased guidelines (or from the date of their appointment, if later) to build this level of ownership.
The full Policy sets out
the Committee’s powers in respect of executive directors joining or leaving the Board, where a change in performance conditions is appropriate or in the case of corporate transactions (such as a takeover, merger or rights issue). The Policy
also describes legacy long-term incentive plans under which some executive directors continue to hold awards.
Remuneration for non-executive directors and the
Chairman Non-executive directors
Fees Benefits Share Ownership Guidelines
All
non-executive directors receive a basic fee for their Travel and expenses for non-executive It is expected that non-executive
duties as a Board member. Additional
fees are paid for directors are incurred in the normal directors will hold shares with a
added responsibilities such as chairmanship and course of business, for
example in relation value equivalent to one times the
membership of committees or acting as the Senior to attendance at Board and Committee annual basic fee
(excluding
Independent Director. Fees are paid to non- meetings. The costs associated with these additional fees for chairmanship
executives in cash. Fees are reviewed annually by the are all met by the Company. and membership of any
Board with any changes effective from 1 July. committees).
If, in a particular year, the
number of meetings is Non-executive directors are
materially greater than usual, the Company may expected to attain this level of
determine that the provision of additional fees is fair share ownership within three
and
reasonable. years of their appointment.
Non-executive Chairman
Fees Benefits
Share Ownership Guidelines
The Chairman receives an annual fee for the The Chairman may be offered benefits The Chairman has a share
performance of their role. On appointment, the fee including: ownership guideline of one times
may be fixed for a specified period of time. Fees will their annual fee and is expected
— Health and wellness benefits;
otherwise be reviewed annually with any changes to attain
this level of share
effective from 1 July. — Protection and security benefits; ownership within five years of the
The Chairman is not eligible to participate in annual — Transport benefits; and date of his appointment.
bonus plans or long-term incentive plans. — Relocation and expatriate benefits
(where
appropriate).
The Chairman is not eligible to receive a
pension allowance or
to participate in the
Group’s employee pension schemes.
In setting the
Directors’ Remuneration Policy, the Committee considers a range of factors including:
Conditions elsewhere in Group
Across the Group, remuneration is reviewed regularly with the intention that all employees are paid appropriately in the context of their local market and given their individual
skills, experience and performance. Each business unit’s salary increase budget is set with reference to local market conditions. The Remuneration Committee considers salary increase budgets in each business unit when determining the salaries
of executive directors.
Prudential does not consult with employees when setting the directors’ remuneration policy; Prudential is a global organisation with
employees, and agents in multiple business units and geographies. As such, there are practical challenges associated with consulting with employees directly on this matter. As many employees are also shareholders, they will be able to participate in
the binding vote on the Directors’ Remuneration Policy.
Shareholder views
The Remuneration Committee and the Company undertake regular consultation with key institutional investors on the remuneration policy and implementation. This
engagement is led by the Remuneration Committee Chairman and is an integral part of the Company’s investor relations programme. The Committee is grateful to shareholders for their feedback which is provided and takes this into account when
determining executive remuneration.
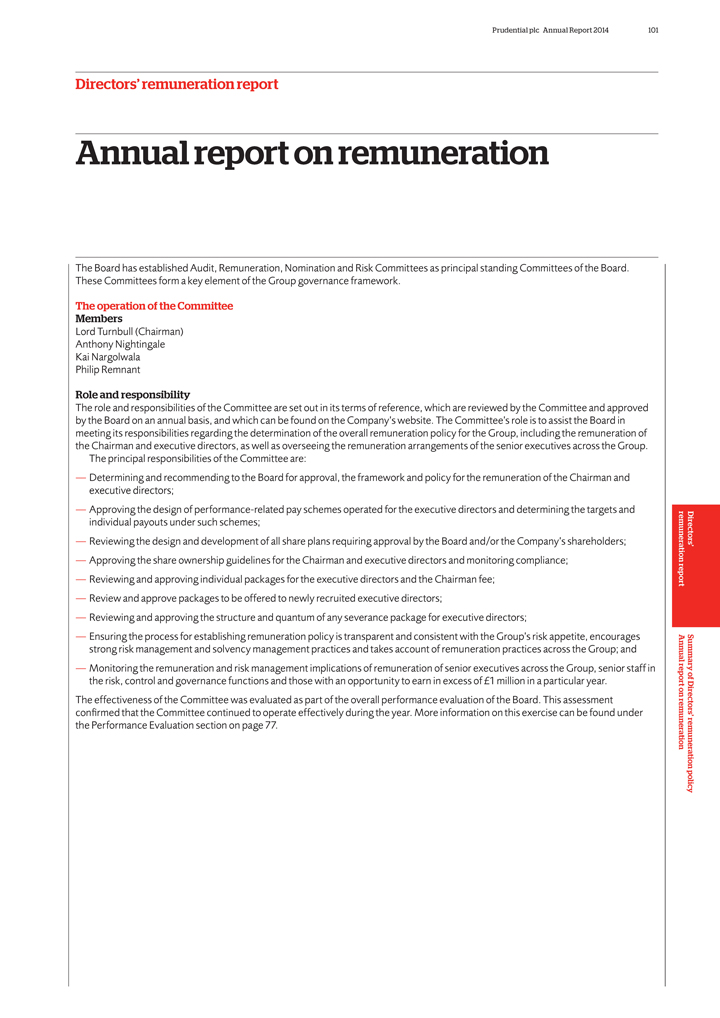
Prudential plc Annual Report 2014 101
Directors’ remuneration report
Annual report on remuneration
The Board has established Audit, Remuneration, Nomination and Risk Committees as principal standing Committees of the Board. These Committees form a key element of the Group
governance framework.
The operation of the Committee Members
Lord Turnbull
(Chairman) Anthony Nightingale Kai Nargolwala Philip Remnant
Role and responsibility
The role and responsibilities of the Committee are set out in its terms of reference, which are reviewed by the Committee and approved by the Board on an annual basis, and which
can be found on the Company’s website. The Committee’s role is to assist the Board in meeting its responsibilities regarding the determination of the overall remuneration policy for the Group, including the remuneration of the Chairman and
executive directors, as well as overseeing the remuneration arrangements of the senior executives across the Group.
The principal responsibilities of the Committee
are:
— Determining and recommending to the Board for approval, the framework and policy for the remuneration of the Chairman and executive directors;
— Approving the design of performance-related pay schemes operated for the executive directors and determining the targets and individual payouts under such
schemes;
— Reviewing the design and development of all share plans requiring approval by the Board and/or the Company’s shareholders;
— Approving the share ownership guidelines for the Chairman and executive directors and monitoring compliance;
— Reviewing and approving individual packages for the executive directors and the Chairman fee;
— Review and approve packages to be offered to newly recruited executive directors;
— Reviewing and approving the structure and quantum of any severance package for executive directors;
— Ensuring the process for establishing remuneration policy is transparent and consistent with the Group’s risk appetite, encourages strong risk management and solvency
management practices and takes account of remuneration practices across the Group; and
— Monitoring the remuneration and risk management implications of
remuneration of senior executives across the Group, senior staff in the risk, control and governance functions and those with an opportunity to earn in excess of £1 million in a particular year.
The effectiveness of the Committee was evaluated as part of the overall performance evaluation of the Board. This assessment confirmed that the Committee continued to operate
effectively during the year. More information on this exercise can be found under the Performance Evaluation section on page 77.
Directors’ Summary of
Directors’ remuneration policy remuneration report Annual report on remuneration
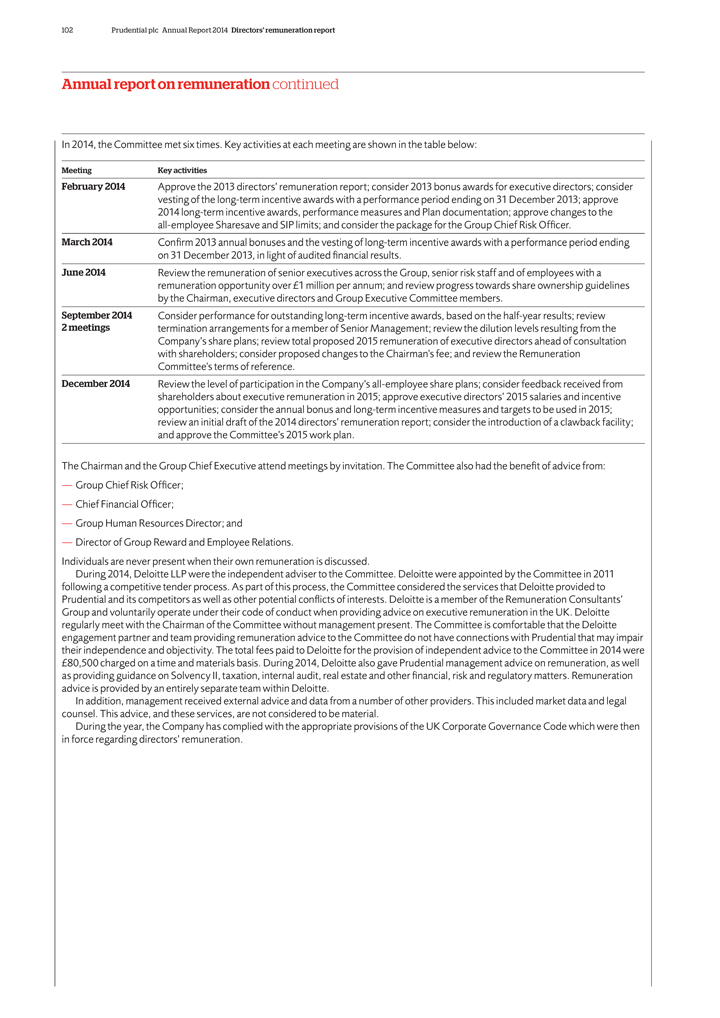
102 Prudential plc Annual Report 2014 Directors’ remuneration report
Annual report on remuneration continued
In 2014, the Committee met six times. Key activities
at each meeting are shown in the table below:
Meeting Key activities
February
2014 Approve the 2013 directors’ remuneration report; consider 2013 bonus awards for executive directors; consider vesting of the long-term incentive awards with a performance period ending on 31 December 2013; approve 2014 long-term
incentive awards, performance measures and Plan documentation; approve changes to the all-employee Sharesave and SIP limits; and consider the package for the Group Chief Risk Officer.
March 2014 Confirm 2013 annual bonuses and the vesting of long-term incentive awards with a performance period ending on 31 December 2013, in light of audited financial
results.
June 2014 Review the remuneration of senior executives across the Group, senior risk staff and of employees with a remuneration opportunity over
£1 million per annum; and review progress towards share ownership guidelines by the Chairman, executive directors and Group Executive Committee members.
September 2014 Consider performance for outstanding long-term incentive awards, based on the half-year results; review 2 meetings termination arrangements for a
member of Senior Management; review the dilution levels resulting from the Company’s share plans; review total proposed 2015 remuneration of executive directors ahead of consultation with shareholders; consider proposed changes to the
Chairman’s fee; and review the Remuneration Committee’s terms of reference.
December 2014 Review the level of participation in the Company’s
all-employee share plans; consider feedback received from shareholders about executive remuneration in 2015; approve executive directors’ 2015 salaries and incentive opportunities; consider the annual bonus and long-term incentive measures and
targets to be used in 2015; review an initial draft of the 2014 directors’ remuneration report; consider the introduction of a clawback facility; and approve the Committee’s 2015 work plan.
The Chairman and the Group Chief Executive attend meetings by invitation. The Committee also had the benefit of advice from:
— Group Chief Risk Officer;
— Chief Financial Officer;
— Group Human Resources Director; and
— Director of Group Reward and Employee
Relations.
Individuals are never present when their own remuneration is discussed.
During 2014, Deloitte LLP were the independent adviser to the Committee. Deloitte were appointed by the Committee in 2011 following a competitive tender process. As part of this
process, the Committee considered the services that Deloitte provided to Prudential and its competitors as well as other potential confiicts of interests. Deloitte is a member of the Remuneration Consultants’ Group and voluntarily operate under
their code of conduct when providing advice on executive remuneration in the UK. Deloitte regularly meet with the Chairman of the Committee without management present. The Committee is comfortable that the Deloitte engagement partner and team
providing remuneration advice to the Committee do not have connections with Prudential that may impair their independence and objectivity. The total fees paid to Deloitte for the provision of independent advice to the Committee in 2014 were
£80,500 charged on a time and materials basis. During 2014, Deloitte also gave Prudential management advice on remuneration, as well as providing guidance on Solvency II, taxation, internal audit, real estate and other financial, risk and
regulatory matters. Remuneration advice is provided by an entirely separate team within Deloitte.
In addition, management received external advice and data from a
number of other providers. This included market data and legal counsel. This advice, and these services, are not considered to be material.
During the year, the
Company has complied with the appropriate provisions of the UK Corporate Governance Code which were then in force regarding directors’ remuneration.
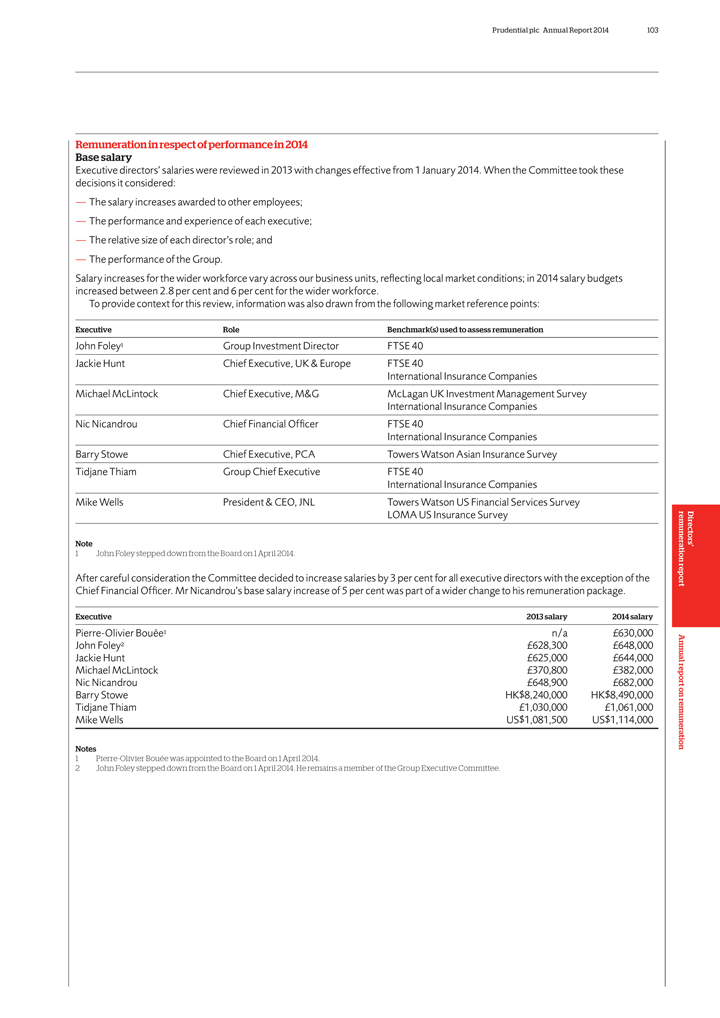
Prudential plc Annual Report 2014 103
Remuneration
in respect of performance in 2014 Base salary
Executive directors’ salaries were reviewed in 2013 with changes effective from 1 January 2014. When the
Committee took these decisions it considered:
— The salary increases awarded to other employees;
— The performance and experience of each executive;
— The relative size of each
director’s role; and
— The performance of the Group.
Salary
increases for the wider workforce vary across our business units, refiecting local market conditions; in 2014 salary budgets increased between 2.8 per cent and 6 per cent for the wider workforce.
To provide context for this review, information was also drawn from the following market reference points:
Executive Role Benchmark(s) used to assess remuneration
John Foley1 Group Investment Director
FTSE 40
Jackie Hunt Chief Executive, UK & Europe FTSE 40
International Insurance Companies
Michael McLintock Chief Executive, M&G
McLagan UK Investment Management Survey
International Insurance Companies
Nic
Nicandrou Chief Financial Officer FTSE 40
International Insurance Companies
Barry Stowe Chief Executive, PCA Towers Watson Asian Insurance Survey
Tidjane
Thiam Group Chief Executive FTSE 40
International Insurance Companies
Mike
Wells President & CEO, JNL Towers Watson US Financial Services Survey
LOMA US Insurance Survey
Note
| 1 | John Foley stepped down from the Board on 1 April 2014. |
After careful consideration the Committee decided to increase salaries by 3 per cent for all executive directors with the exception of
the
Chief Financial Officer. Mr Nicandrou’s base salary increase of 5 per cent was part of a wider change to his remuneration package.
Executive 2013 salary 2014 salary
Pierre-Olivier Bouée1 n/a £630,000
John Foley2 £628,300 £648,000
Jackie Hunt £625,000 £644,000
Michael McLintock £370,800 £382,000
Nic Nicandrou £648,900
£682,000
Barry Stowe HK$8,240,000 HK$8,490,000
Tidjane Thiam
£1,030,000 £1,061,000
Mike Wells US$1,081,500 US$1,114,000
Notes
| 1 | Pierre-Olivier Bouée was appointed to the Board on 1 April 2014. |
| 2 | John Foley stepped down from the Board on 1 April 2014. He remains a member of the Group Executive Committee. |
Directors’ remuneration report Annual report on remuneration
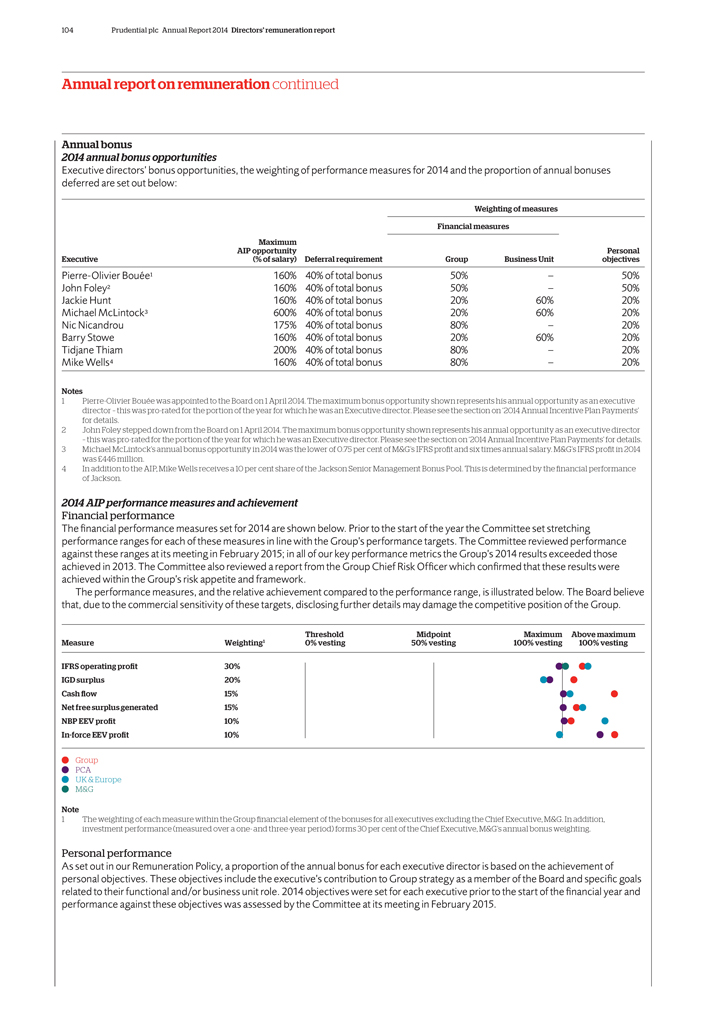
104 Prudential plc Annual Report 2014 Directors’ remuneration report
Annual report on remuneration continued
Annual bonus
2014 annual bonus opportunities
Executive directors’ bonus opportunities, the weighting
of performance measures for 2014 and the proportion of annual bonuses deferred are set out below:
Weighting of measures
Financial measures
Maximum
AIP opportunity Personal
Executive (% of salary) Deferral requirement Group Business Unit
objectives
Pierre-Olivier Bouée1 160% 40% of total bonus 50% – 50%
John Foley2 160% 40% of total bonus 50% – 50%
Jackie Hunt 160% 40% of
total bonus 20% 60% 20%
Michael McLintock3 600% 40% of total bonus 20% 60% 20%
Nic Nicandrou 175% 40% of total bonus 80% – 20%
Barry Stowe 160% 40% of
total bonus 20% 60% 20%
Tidjane Thiam 200% 40% of total bonus 80% – 20%
Mike Wells4 160% 40% of total bonus 80% – 20%
Notes
1 Pierre-Olivier Bouée was appointed to the Board on 1 April 2014. The maximum bonus opportunity shown represents his annual opportunity as an executive director –
this was pro-rated for the portion of the year for which he was an Executive director. Please see the section on ‘2014 Annual Incentive Plan Payments’ for details.
2 John Foley stepped down from the Board on 1 April 2014. The maximum bonus opportunity shown represents his annual opportunity as an executive director – this was
pro-rated for the portion of the year for which he was an Executive director. Please see the section on ‘2014 Annual Incentive Plan Payments’ for details.
3 Michael McLintock’s annual bonus opportunity in 2014 was the lower of 0.75 per cent of M&G’s IFRS profit and six times annual salary.
M&G’s IFRS profit in 2014 was £446 million.
4 In addition to the AIP, Mike Wells receives a 10 per cent share of the Jackson Senior Management
Bonus Pool. This is determined by the financial performance of Jackson.
2014 AIP performance measures and achievement
Financial performance
The financial performance measures set for 2014 are shown below. Prior
to the start of the year the Committee set stretching performance ranges for each of these measures in line with the Group’s performance targets. The Committee reviewed performance against these ranges at its meeting in February 2015; in all of
our key performance metrics the Group’s 2014 results exceeded those achieved in 2013. The Committee also reviewed a report from the Group Chief Risk Officer which confirmed that these results were achieved within the Group’s risk appetite
and framework.
The performance measures, and the relative achievement compared to the performance range, is illustrated below. The Board believe that, due to the
commercial sensitivity of these targets, disclosing further details may damage the competitive position of the Group.
Threshold Midpoint Maximum Above maximum
Measure Weighting1 0% vesting 50% vesting 100% vesting 100% vesting
IFRS
operating pro•t 30%
IGD surplus 20%
Cash •ow 15%
Net free surplus generated 15%
NBP EEV pro•t 10%
In-force EEV pro•t 10%
Group PCA UK & Europe M&G
Note
1 The weighting of each measure within the Group financial element of the bonuses for all
executives excluding the Chief Executive, M&G. In addition, investment performance (measured over a one- and three-year period) forms 30 per cent of the Chief Executive, M&G’s annual bonus weighting.
Personal performance
As set out in our Remuneration Policy, a proportion of the annual bonus
for each executive director is based on the achievement of personal objectives. These objectives include the executive’s contribution to Group strategy as a member of the Board and specific goals related to their functional and/or business unit
role. 2014 objectives were set for each executive prior to the start of the financial year and performance against these objectives was assessed by the Committee at its meeting in February 2015.
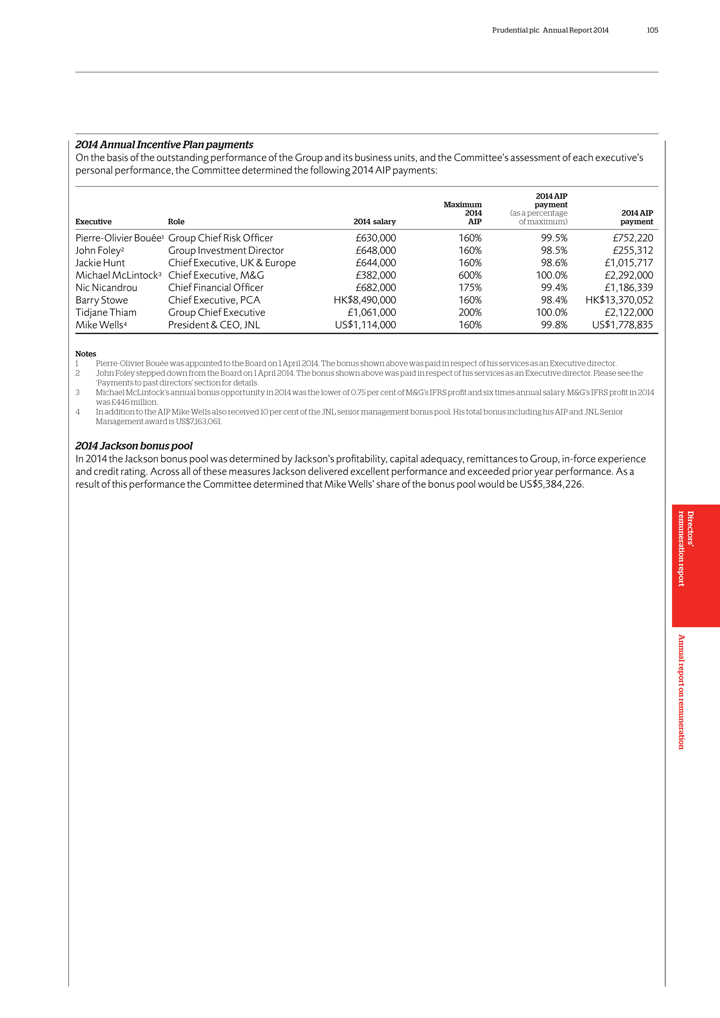
Prudential plc Annual Report 2014 105
2014 Annual
Incentive Plan payments
On the basis of the outstanding performance of the Group and its business units, and the Committee’s assessment of each
executive’s personal performance, the Committee determined the following 2014 AIP payments:
2014 AIP
Maximum payment
2014 (as a percentage 2014 AIP
Executive Role 2014 salary AIP of maximum) payment
Pierre-Olivier Bouée1 Group Chief
Risk Officer £630,000 160% 99.5% £752,220
John Foley2 Group Investment Director £648,000 160% 98.5% £255,312
Jackie Hunt Chief Executive, UK & Europe £644,000 160% 98.6% £1,015,717
Michael McLintock3 Chief Executive, M&G £382,000 600% 100.0% £2,292,000
Nic Nicandrou Chief Financial Officer £682,000 175% 99.4% £1,186,339
Barry Stowe
Chief Executive, PCA HK$8,490,000 160% 98.4% HK$13,370,052
Tidjane Thiam Group Chief Executive £1,061,000 200% 100.0% £2,122,000
Mike Wells4 President & CEO, JNL US$1,114,000 160% 99.8% US$1,778,835
Notes
1 Pierre-Olivier Bouée was appointed to the Board on 1 April 2014. The bonus shown above was paid in respect of his services as an Executive director.
2 John Foley stepped down from the Board on 1 April 2014. The bonus shown above was paid in respect of his services as an Executive director. Please see the
‘Payments to past directors’ section for details.
3 Michael McLintock’s annual bonus opportunity in 2014 was the lower of 0.75 per cent of
M&G’s IFRS profit and six times annual salary. M&G’s IFRS profit in 2014 was £446 million.
4 In addition to the AIP Mike Wells also
received 10 per cent of the JNL senior management bonus pool. His total bonus including his AIP and JNL Senior Management award is US$7,163,061.
2014 Jackson
bonus pool
In 2014 the Jackson bonus pool was determined by Jackson’s profitability, capital adequacy, remittances to Group, in-force experience and credit
rating. Across all of these measures Jackson delivered excellent performance and exceeded prior year performance. As a result of this performance the Committee determined that Mike Wells’ share of the bonus pool would be US$5,384,226.
Directors’ remuneration report Annual report on remuneration
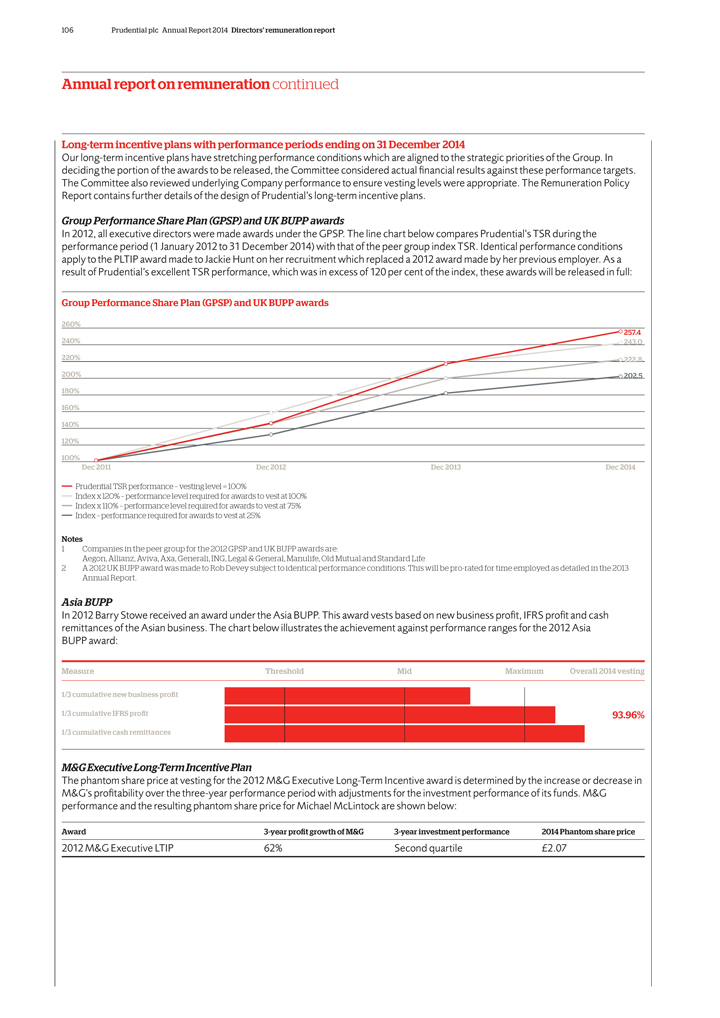
106 Prudential plc Annual Report 2014 Directors’ remuneration report
Annual report on remuneration continued
Long-term incentive plans with performance periods
ending on 31 December 2014
Our long-term incentive plans have stretching performance conditions which are aligned to the strategic priorities of the Group. In
deciding the portion of the awards to be released, the Committee considered actual financial results against these performance targets. The Committee also reviewed underlying Company performance to ensure vesting levels were appropriate. The
Remuneration Policy Report contains further details of the design of Prudential’s long-term incentive plans.
Group Performance Share Plan (GPSP) and UK BUPP
awards
In 2012, all executive directors were made awards under the GPSP. The line chart below compares Prudential’s TSR during the performance period (1
January 2012 to 31 December 2014) with that of the peer group index TSR. Identical performance conditions apply to the PLTIP award made to Jackie Hunt on her recruitment which replaced a 2012 award made by her previous employer. As a result of
Prudential’s excellent TSR performance, which was in excess of 120 per cent of the index, these awards will be released in full:
Group Performance Share
Plan (GPSP) and UK BUPP awards
260%
257.4
240% 243.0
220% 222.8
200% 202.5
180%
160%
140%
120%
100%
Dec 2011 Dec 2012 Dec 2013 Dec 2014
Prudential TSR performance – vesting level = 100%
Index x 120% – performance level required for awards to vest at 100% Index x 110% – performance level required for awards to vest at 75% Index –
performance required for awards to vest at 25%
Notes
| 1 | Companies in the peer group for the 2012 GPSP and UK BUPP awards are: |
Aegon, Allianz, Aviva, Axa, Generali, ING, Legal & General, Manulife, Old Mutual and Standard Life
2 A 2012 UK BUPP award was made to Rob Devey subject to identical performance conditions. This will be pro-rated for time employed as detailed in the 2013 Annual Report.
Asia BUPP
In 2012 Barry Stowe received an award under the Asia BUPP. This
award vests based on new business profit, IFRS profit and cash remittances of the Asian business. The chart below illustrates the achievement against performance ranges for the 2012 Asia BUPP award:
Measure Threshold Mid Maximum Overall 2014 vesting
1/3 cumulative new business pro_t
1/3 cumulative IFRS pro_t 93.96%
1/3 cumulative cash remittances
M&G Executive Long-Term Incentive Plan
The phantom share price at vesting for the 2012
M&G Executive Long-Term Incentive award is determined by the increase or decrease in M&G’s profitability over the three-year performance period with adjustments for the investment performance of its funds. M&G performance and the
resulting phantom share price for Michael McLintock are shown below:
Award 3-year profit growth of M&G 3-year investment performance 2014 Phantom share price
2012 M&G Executive LTIP 62% Second quartile £2.07
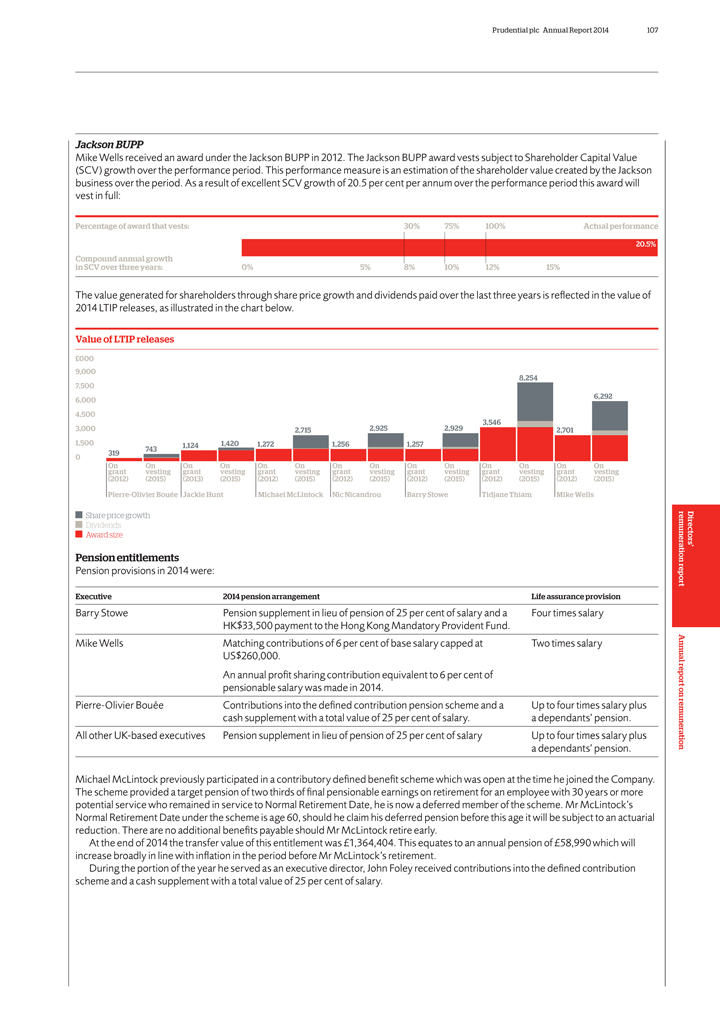
Prudential plc Annual Report 2014 107
Jackson BUPP
Mike Wells received an award under the Jackson BUPP in 2012. The Jackson BUPP award vests subject to Shareholder Capital Value (SCV) growth over the performance
period. This performance measure is an estimation of the shareholder value created by the Jackson business over the period. As a result of excellent SCV growth of 20.5 per cent per annum over the performance period this award will vest in full:
Percentage of award that vests: 30% 75% 100% Actual performance
20.5%
Compound annual growth
in SCV over three years: 0% 5% 8% 10% 12% 15%
The value generated for shareholders through share price growth and dividends paid over the last three years is refiected in the value of 2014 LTIP releases, as
illustrated in the chart below.
Value of LTIP releases
£000
9,000
8,254
7,500
6,000 6,292
4,500
3,546
3,000 2,715 2,925 2,929 2,701
1,500 1,124 1,420 1,272 1,256 1,257
319 743
0
On On On On On On On On On On On On On On
grant vesting grant vesting grant
vesting grant vesting grant vesting grant vesting grant vesting
(2012)
(2015) (2013) (2015) (2012) (2015) (2012) (2015) (2012) (2015) (2012) (2015) (2012) (2015)
Pierre-Olivier Bouée Jackie Hunt Michael McLintock Nic Nicandrou Barry Stowe Tidjane Thiam Mike Wells
Share price growth Dividends Award size
Pension entitlements
Pension provisions in 2014 were:
Executive 2014 pension arrangement Life assurance provision
Barry Stowe Pension supplement in lieu of pension of 25 per cent of salary and a Four times salary
HK$33,500 payment to the Hong Kong Mandatory Provident Fund.
Mike Wells Matching contributions
of 6 per cent of base salary capped at Two times salary
US$260,000.
An
annual profit sharing contribution equivalent to 6 per cent of
pensionable salary was made in 2014.
Pierre-Olivier Bouée Contributions into the defined contribution pension scheme and a Up to four times salary plus
cash supplement with a total value of 25 per cent of salary. a dependants’ pension.
All other UK-based executives Pension supplement in lieu of pension of 25 per cent of salary Up to four times salary plus
a dependants’ pension.
Michael McLintock previously participated in a contributory
defined benefit scheme which was open at the time he joined the Company. The scheme provided a target pension of two thirds of final pensionable earnings on retirement for an employee with 30 years or more potential service who remained in service
to Normal Retirement Date, he is now a deferred member of the scheme. Mr McLintock’s Normal Retirement Date under the scheme is age 60, should he claim his deferred pension before this age it will be subject to an actuarial reduction. There are
no additional benefits payable should Mr McLintock retire early.
At the end of 2014 the transfer value of this entitlement was £1,364,404. This equates to an
annual pension of £58,990 which will increase broadly in line with infiation in the period before Mr McLintock’s retirement.
During the portion of the
year he served as an executive director, John Foley received contributions into the defined contribution scheme and a cash supplement with a total value of 25 per cent of salary.
Directors’ remuneration report Annual report on remuneration
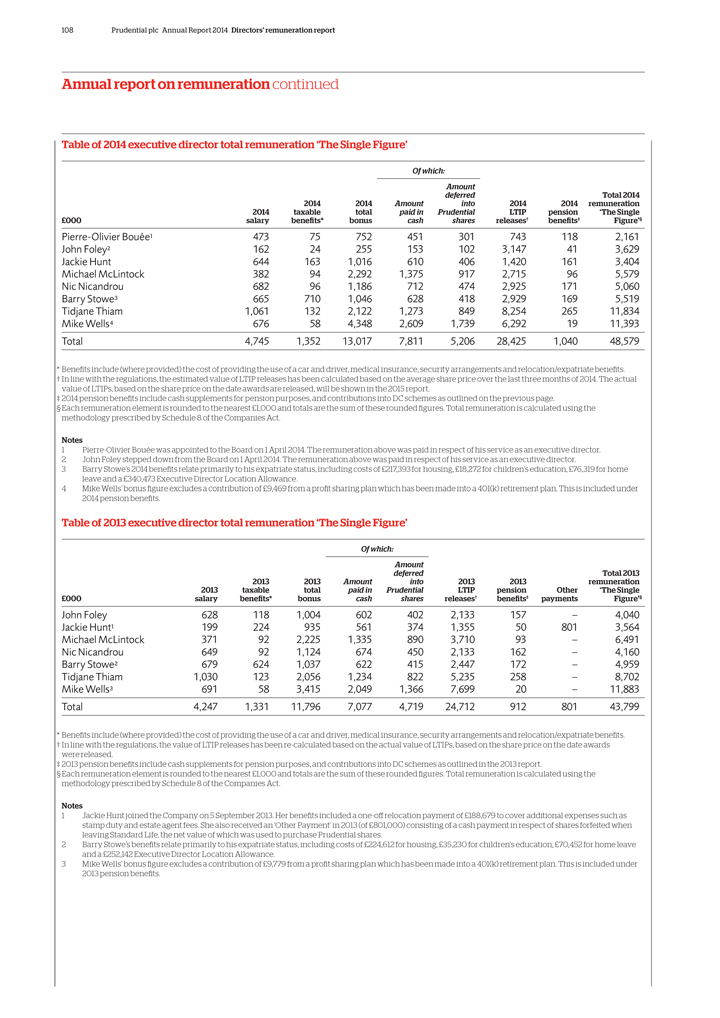
108 Prudential plc Annual Report 2014 Directors’ remuneration report
Annual report on remuneration continued
Table of 2014 executive director total remuneration
‘The Single Figure’
Of which:
Amount
deferred Total 2014
2014 2014 Amount into 2014 2014 remuneration
2014 taxable total paid in Prudential LTIP pension ‘The Single
£000 salary
benefits* bonus cash shares releases† benefits‡ Figure’§
Pierre-Olivier Bouée1 473 75 752 451 301 743 118 2,161
John Foley2 162 24 255 153 102 3,147 41 3,629
Jackie Hunt 644 163 1,016 610 406 1,420 161
3,404
Michael McLintock 382 94 2,292 1,375 917 2,715 96 5,579
Nic Nicandrou
682 96 1,186 712 474 2,925 171 5,060
Barry Stowe3 665 710 1,046 628 418 2,929 169 5,519
Tidjane Thiam 1,061 132 2,122 1,273 849 8,254 265 11,834
Mike Wells4 676 58 4,348 2,609 1,739
6,292 19 11,393
Total 4,745 1,352 13,017 7,811 5,206 28,425 1,040 48,579
*
Benefits include (where provided) the cost of providing the use of a car and driver, medical insurance, security arrangements and relocation/expatriate benefits.
† In line with the regulations, the estimated value of LTIP releases has been calculated based on the average share price over the last three months of 2014.
The actual value of LTIPs, based on the share price on the date awards are released, will be shown in the 2015 report.
‡ 2014 pension benefits include cash
supplements for pension purposes, and contributions into DC schemes as outlined on the previous page.
§ Each remuneration element is rounded to the nearest
£1,000 and totals are the sum of these rounded figures. Total remuneration is calculated using the methodology prescribed by Schedule 8 of the Companies Act.
Notes
1 Pierre-Olivier Bouée was appointed to the Board on
1 April 2014. The remuneration above was paid in respect of his service as an executive director.
2 John Foley stepped down from the Board on 1 April
2014. The remuneration above was paid in respect of his service as an executive director.
3 Barry Stowe’s 2014 benefits relate primarily to his expatriate
status, including costs of £217,393 for housing, £18,272 for children’s education, £76,319 for home leave and a £340,473 Executive Director Location Allowance.
4 Mike Wells’ bonus figure excludes a contribution of £9,469 from a profit sharing plan which has been made into a 401(k) retirement plan. This is included under 2014
pension benefits.
Table of 2013 executive director total remuneration ‘The Single Figure’
Of which:
Amount
deferred Total 2013
2013 2013 Amount into 2013 2013 remuneration
2013 taxable total paid in Prudential LTIP pension Other ‘The Single
£000 salary
benefits* bonus cash shares releases† benefits‡ payments Figure’§
John Foley 628 118 1,004 602 402 2,133 157 – 4,040
Jackie Hunt1 199 224 935 561 374 1,355 50 801 3,564
Michael McLintock 371 92 2,225 1,335 890
3,710 93 – 6,491
Nic Nicandrou 649 92 1,124 674 450 2,133 162 – 4,160
Barry Stowe2 679 624 1,037 622 415 2,447 172 – 4,959
Tidjane Thiam 1,030
123 2,056 1,234 822 5,235 258 – 8,702
Mike Wells3 691 58 3,415 2,049 1,366 7,699 20 – 11,883
Total 4,247 1,331 11,796 7,077 4,719 24,712 912 801 43,799
* Benefits include (where provided)
the cost of providing the use of a car and driver, medical insurance, security arrangements and relocation/expatriate benefits.
† In line with the
regulations, the value of LTIP releases has been re-calculated based on the actual value of LTIPs, based on the share price on the date awards were released.
‡ 2013 pension benefits include cash supplements for pension purposes, and contributions into DC schemes as outlined in the 2013 report.
§ Each remuneration element is rounded to the nearest £1,000 and totals are the sum of these rounded figures. Total remuneration is calculated using the methodology
prescribed by Schedule 8 of the Companies Act.
Notes
1 Jackie Hunt joined the
Company on 5 September 2013. Her benefits included a one-off relocation payment of £188,679 to cover additional expenses such as stamp duty and estate agent fees. She also received an ‘Other Payment’ in 2013 (of £801,000)
consisting of a cash payment in respect of shares forfeited when leaving Standard Life, the net value of which was used to purchase Prudential shares.
2 Barry
Stowe’s benefits relate primarily to his expatriate status, including costs of £224,612 for housing, £35,230 for children’s education, £70,452 for home leave and a £252,142 Executive Director Location Allowance.
3 Mike Wells’ bonus figure excludes a contribution of £9,779 from a profit sharing plan which has been made into a 401(k) retirement plan. This is
included under 2013 pension benefits.
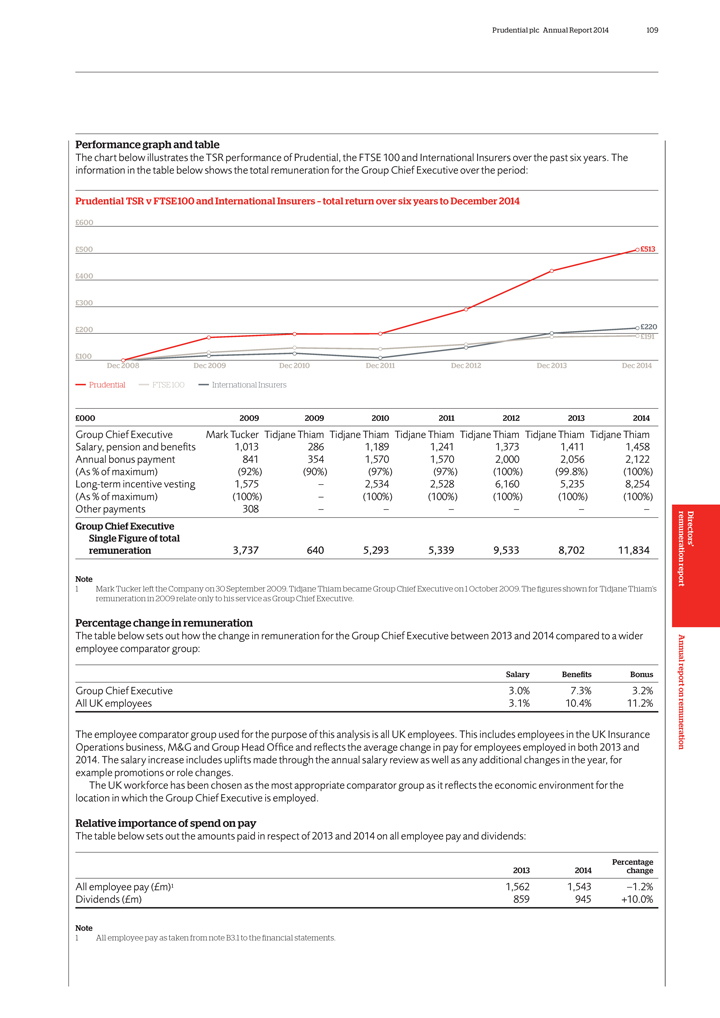
Prudential plc Annual Report 2014 109
Performance
graph and table
The chart below illustrates the TSR performance of Prudential, the FTSE 100 and International Insurers over the past six years. The information in
the table below shows the total remuneration for the Group Chief Executive over the period:
Prudential TSR v FTSE 100 and International Insurers – total
return over six years to December 2014
£600
£500 £513
£400 £300
£200 £220 £191
£100
Dec 2008 Dec 2009 Dec 2010 Dec 2011 Dec 2012 Dec 2013 Dec 2014
Prudential FTSE 100
International Insurers
£000 2009 2009 2010 2011 2012 2013 2014
Group
Chief Executive Mark Tucker Tidjane Thiam Tidjane Thiam Tidjane Thiam Tidjane Thiam Tidjane Thiam Tidjane Thiam Salary, pension and benefits 1,013 286 1,189 1,241 1,373 1,411 1,458 Annual bonus payment 841 354 1,570 1,570 2,000 2,056 2,122 (As % of
maximum) (92%) (90%) (97%) (97%) (100%) (99.8%) (100%) Long-term incentive vesting 1,575 – 2,534 2,528 6,160 5,235 8,254 (As % of maximum) (100%) –
(100%) (100%) (100%) (100%) (100%) Other payments 308 – – – – – –
Group Chief Executive Single Figure of
total remuneration 3,737 640 5,293 5,339 9,533 8,702 11,834
Note
1 Mark
Tucker left the Company on 30 September 2009. Tidjane Thiam became Group Chief Executive on 1 October 2009. The figures shown for Tidjane Thiam’s remuneration in 2009 relate only to his service as Group Chief Executive.
Percentage change in remuneration
The table below sets out how the change in remuneration for
the Group Chief Executive between 2013 and 2014 compared to a wider employee comparator group:
Salary Benefits Bonus
Group Chief Executive 3.0% 7.3% 3.2% All UK employees 3.1% 10.4% 11.2%
The employee comparator
group used for the purpose of this analysis is all UK employees. This includes employees in the UK Insurance Operations business, M&G and Group Head Office and refiects the average change in pay for employees employed in both 2013 and 2014. The
salary increase includes uplifts made through the annual salary review as well as any additional changes in the year, for example promotions or role changes.
The
UK workforce has been chosen as the most appropriate comparator group as it refiects the economic environment for the location in which the Group Chief Executive is employed.
Relative importance of spend on pay
The table below sets out the amounts paid in respect of
2013 and 2014 on all employee pay and dividends:
Percentage 2013 2014 change
All employee pay (£m)1 1,562 1,543 –1.2% Dividends (£m) 859 945 +10.0%
Note
| 1 | All employee pay as taken from note B3.1 to the financial statements. |
Directors’ remuneration report Annual report on remuneration
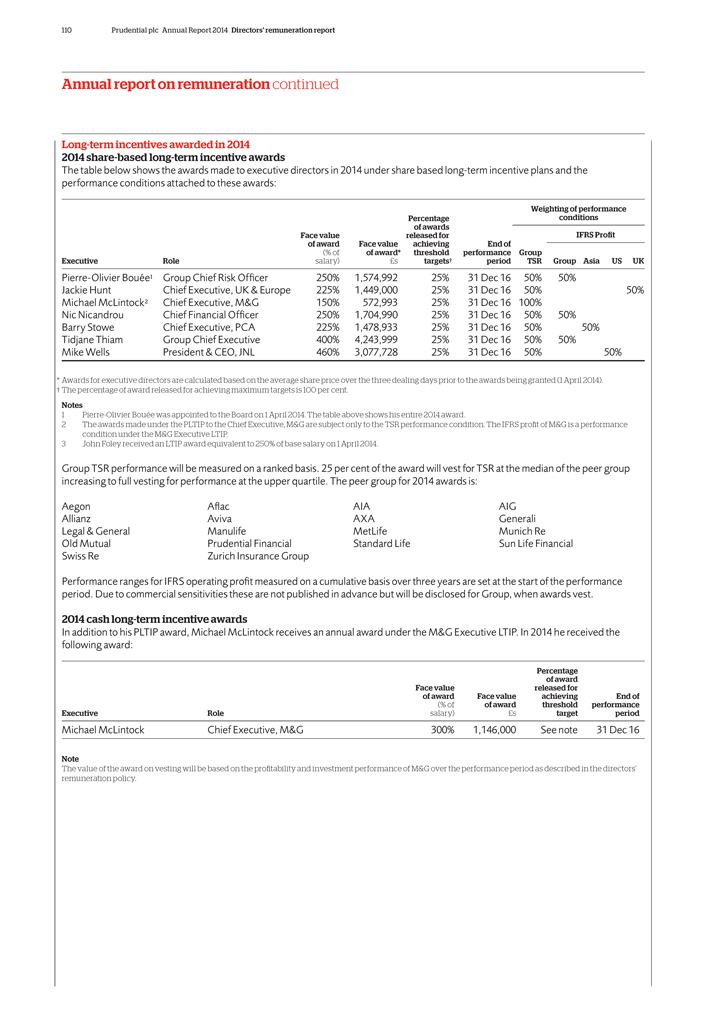
110 Prudential plc Annual Report 2014 Directors’ remuneration report
Annual report on remuneration continued
Long-term incentives awarded in 2014 2014 share-based
long-term incentive awards
The table below shows the awards made to executive directors in 2014 under share based long-term incentive plans and the performance
conditions attached to these awards:
Weighting of performance
Percentage
conditions
of awards
Face value released for IFRS Profit
of award Face value achieving End of
(% of of award* threshold performance Group
Executive Role salary) £s targets† period TSR Group Asia US UK
Pierre-Olivier
Bouée1 Group Chief Risk Officer 250% 1,574,992 25% 31 Dec 16 50% 50%
Jackie Hunt Chief Executive, UK & Europe 225% 1,449,000 25% 31 Dec 16 50% 50%
Michael McLintock2 Chief Executive, M&G 150% 572,993 25% 31 Dec 16 100%
Nic Nicandrou Chief Financial Officer 250% 1,704,990 25% 31 Dec 16 50% 50%
Barry Stowe Chief Executive, PCA 225% 1,478,933 25% 31 Dec 16 50% 50%
Tidjane
Thiam Group Chief Executive 400% 4,243,999 25% 31 Dec 16 50% 50%
Mike Wells President & CEO, JNL 460% 3,077,728 25% 31 Dec 16 50% 50%
* Awards for executive directors are calculated based on the average share price over the three dealing days prior to the awards being granted (1 April 2014).
† The percentage of award released for achieving maximum targets is 100 per cent.
Notes
| 1 | Pierre-Olivier Bouée was appointed to the Board on 1 April 2014. The table above shows his entire 2014 award. |
2 The awards made under the PLTIP to the Chief Executive, M&G are subject only to the TSR performance condition. The IFRS profit of M&G is a performance condition under the M&G Executive LTIP.
| 3 | John Foley received an LTIP award equivalent to 250% of base salary on 1 April 2014. |
Group TSR performance will be measured on a ranked basis. 25 per cent of the award will vest for TSR at the median of
the peer group increasing to full vesting for performance at the upper quartile. The peer group for 2014 awards is:
Aegon Afiac AIA AIG
Allianz Aviva AXA Generali
Legal & General Manulife MetLife Munich Re
Old Mutual Prudential Financial Standard Life Sun Life Financial
Swiss Re Zurich Insurance
Group
Performance ranges for IFRS operating profit measured on a cumulative basis over three years are set at the start of the performance period. Due to
commercial sensitivities these are not published in advance but will be disclosed for Group, when awards vest.
2014 cash long-term incentive awards
In addition to his PLTIP award, Michael McLintock receives an annual award under the M&G Executive LTIP. In 2014 he received the following award:
Percentage
of award
Face value released for
of award Face value achieving End of
(% of of award threshold performance
Executive Role salary) £s target period
Michael McLintock Chief Executive, M&G 300% 1,146,000 See note 31 Dec 16
Note
The value of the award on vesting will be based on the profitability and investment performance of M&G over the performance period as described in the directors’
remuneration policy.
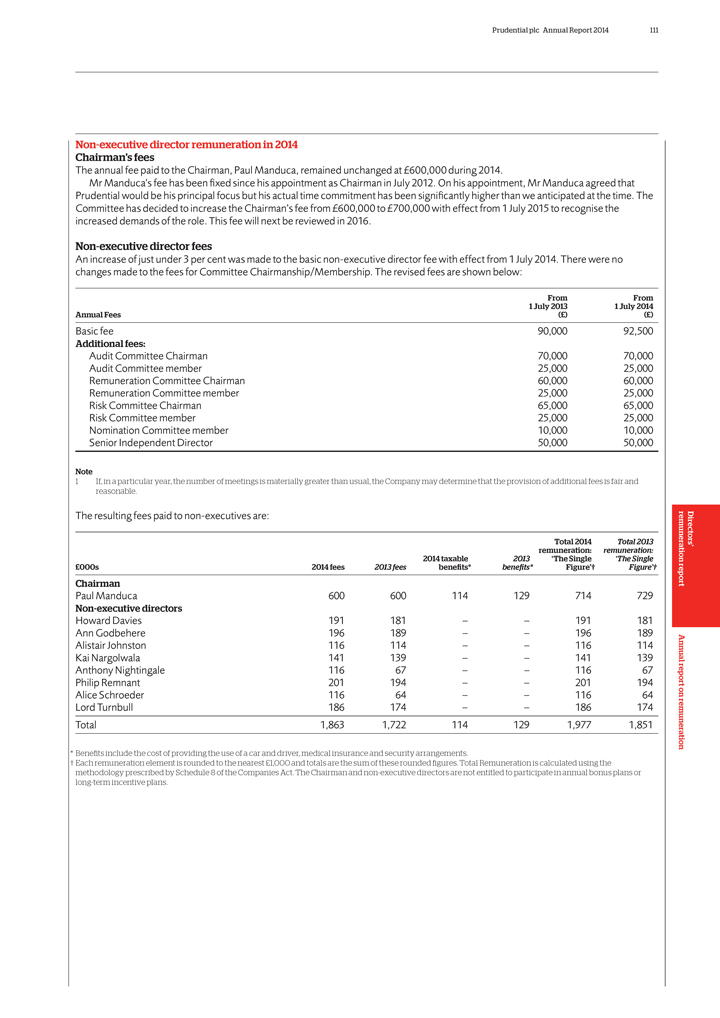
Prudential plc Annual Report 2014 111
Non-executive director remuneration in 2014 Chairman’s fees
The annual
fee paid to the Chairman, Paul Manduca, remained unchanged at £600,000 during 2014.
Mr Manduca’s fee has been fixed since his appointment as Chairman in
July 2012. On his appointment, Mr Manduca agreed that Prudential would be his principal focus but his actual time commitment has been significantly higher than we anticipated at the time. The Committee has decided to increase the Chairman’s fee
from £600,000 to £700,000 with effect from 1 July 2015 to recognise the increased demands of the role. This fee will next be reviewed in 2016.
Non-executive director fees
An increase of just under 3 per cent was
made to the basic non-executive director fee with effect from 1 July 2014. There were no changes made to the fees for Committee Chairmanship/Membership. The revised fees are shown below:
From From
| 1 | July 2013 1 July 2014 |
Annual Fees (£) (£)
Basic fee 90,000 92,500
Additional fees:
Audit Committee Chairman 70,000 70,000
Audit Committee member 25,000 25,000
Remuneration Committee Chairman 60,000 60,000
Remuneration Committee member 25,000 25,000
Risk Committee Chairman 65,000 65,000
Risk Committee member 25,000 25,000
Nomination Committee member 10,000 10,000
Senior Independent Director 50,000 50,000
Note
1 If, in a particular year, the number of meetings is materially greater than usual, the Company may determine that the provision of additional fees is fair and reasonable.
The resulting fees paid to non-executives are:
Total 2014 Total 2013
remuneration: remuneration:
2014 taxable 2013 ‘The Single ‘The
Single
£000s 2014 fees 2013 fees benefits* benefits* Figure’† Figure’†
Chairman
Paul Manduca 600 600 114 129 714 729
Non-executive directors
Howard Davies 191 181 – – 191 181
Ann Godbehere 196 189 – – 196 189
Alistair Johnston 116 114 – – 116 114
Kai Nargolwala 141 139 – – 141 139
Anthony Nightingale 116 67
– – 116 67
Philip Remnant 201 194 – – 201 194
Alice
Schroeder 116 64 – – 116 64
Lord Turnbull 186 174 – – 186 174
Total 1,863 1,722 114 129 1,977 1,851
| * | Benefits include the cost of providing the use of a car and driver, medical insurance and security arrangements. |
† Each remuneration element is rounded to the nearest £1,000 and totals are the sum of these
rounded figures. Total Remuneration is calculated using the methodology prescribed by Schedule 8 of the Companies Act. The Chairman and non-executive directors are not entitled to participate in annual bonus plans or long-term incentive plans.
Directors’ remuneration report Annual report on remuneration
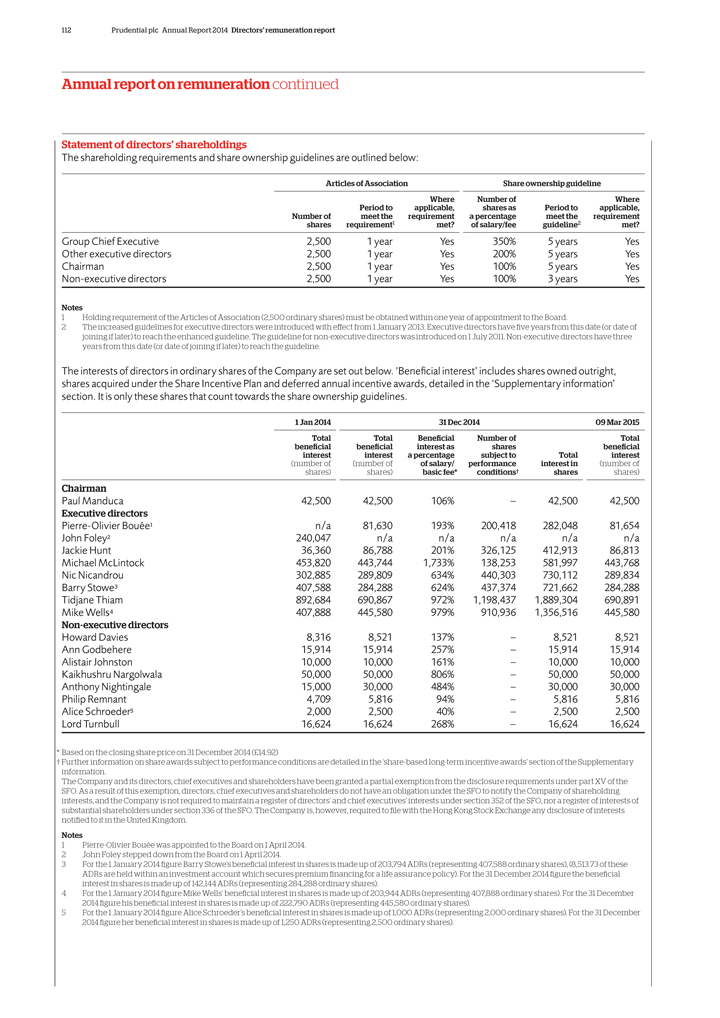
112 Prudential plc Annual Report 2014 Directors’ remuneration report
Annual report on remuneration continued
Statement of directors’ shareholdings
The shareholding requirements and share ownership guidelines are outlined below:
Articles of
Association Share ownership guideline
Where Number of Where
Period to
applicable, shares as Period to applicable,
Number of meet the requirement a percentage meet the requirement
shares requirement1 metfi of salary/fee guideline2 metfi
Group Chief Executive 2,500 1 year
Yes 350% 5 years Yes
Other executive directors 2,500 1 year Yes 200% 5 years Yes
Chairman 2,500 1 year Yes 100% 5 years Yes
Non-executive directors 2,500 1 year Yes 100% 3
years Yes
Notes
1 Holding requirement of the Articles of Association (2,500
ordinary shares) must be obtained within one year of appointment to the Board.
2 The increased guidelines for executive directors were introduced with effect from
1 January 2013. Executive directors have five years from this date (or date of joining if later) to reach the enhanced guideline. The guideline for non-executive directors was introduced on 1 July 2011. Non-executive directors have three
years from this date (or date of joining if later) to reach the guideline.
The interests of directors in ordinary shares of the Company are set out below.
‘Beneficial interest’ includes shares owned outright, shares acquired under the Share Incentive Plan and deferred annual incentive awards, detailed in the ‘Supplementary information’ section. It is only these shares that count
towards the share ownership guidelines.
1 Jan 2014 31 Dec 2014 09 Mar 2015
Total Total Beneficial Number of Total
beneficial beneficial interest as
shares beneficial
interest interest a percentage subject to Total interest
(number of (number of of salary/ performance interest in (number of
shares)
shares) basic fee* conditions† shares shares)
Chairman
Paul Manduca
42,500 42,500 106% – 42,500 42,500
Executive directors
Pierre-Olivier
Bouée1 n/a 81,630 193% 200,418 282,048 81,654
John Foley2 240,047 n/a n/a n/a n/a n/a
Jackie Hunt 36,360 86,788 201% 326,125 412,913 86,813
Michael McLintock 453,820 443,744 1,733%
138,253 581,997 443,768
Nic Nicandrou 302,885 289,809 634% 440,303 730,112 289,834
Barry Stowe3 407,588 284,288 624% 437,374 721,662 284,288
Tidjane Thiam 892,684 690,867 972%
1,198,437 1,889,304 690,891
Mike Wells4 407,888 445,580 979% 910,936 1,356,516 445,580
Non-executive directors
Howard Davies 8,316 8,521 137% – 8,521 8,521
Ann Godbehere 15,914 15,914 257% – 15,914 15,914
Alistair Johnston 10,000 10,000 161%
– 10,000 10,000
Kaikhushru Nargolwala 50,000 50,000 806% – 50,000 50,000
Anthony Nightingale 15,000 30,000 484% – 30,000 30,000
Philip Remnant 4,709 5,816 94%
– 5,816 5,816
Alice Schroeder5 2,000 2,500 40% – 2,500 2,500
Lord
Turnbull 16,624 16,624 268% – 16,624 16,624
* Based on the closing share price on 31 December 2014 (£14.92)
† Further information on share awards subject to performance conditions are detailed in the ‘share-based long-term incentive awards’ section of the Supplementary
information.
The Company and its directors, chief executives and shareholders have been granted a partial exemption from the disclosure requirements under part XV
of the SFO. As a result of this exemption, directors, chief executives and shareholders do not have an obligation under the SFO to notify the Company of shareholding interests, and the Company is not required to maintain a register of
directors’ and chief executives’ interests under section 352 of the SFO, nor a register of interests of substantial shareholders under section 336 of the SFO. The Company is, however, required to file with the Hong Kong Stock Exchange any
disclosure of interests notified to it in the United Kingdom.
Notes
1
Pierre-Olivier Bouée was appointed to the Board on 1 April 2014.
2 John Foley stepped down from the Board on 1 April 2014.
3 For the 1 January 2014 figure Barry Stowe’s beneficial interest in shares is made up of 203,794 ADRs (representing 407,588 ordinary shares), (8,513.73 of these ADRs are
held within an investment account which secures premium financing for a life assurance policy). For the 31 December 2014 figure the beneficial interest in shares is made up of 142,144 ADRs (representing 284,288 ordinary shares).
4 For the 1 January 2014 figure Mike Wells’ beneficial interest in shares is made up of 203,944 ADRs (representing 407,888 ordinary shares). For the 31 December 2014
figure his beneficial interest in shares is made up of 222,790 ADRs (representing 445,580 ordinary shares).
5 For the 1 January 2014 figure Alice
Schroeder’s beneficial interest in shares is made up of 1,000 ADRs (representing 2,000 ordinary shares). For the 31 December 2014 figure her beneficial interest in shares is made up of 1,250 ADRs (representing 2,500 ordinary shares).
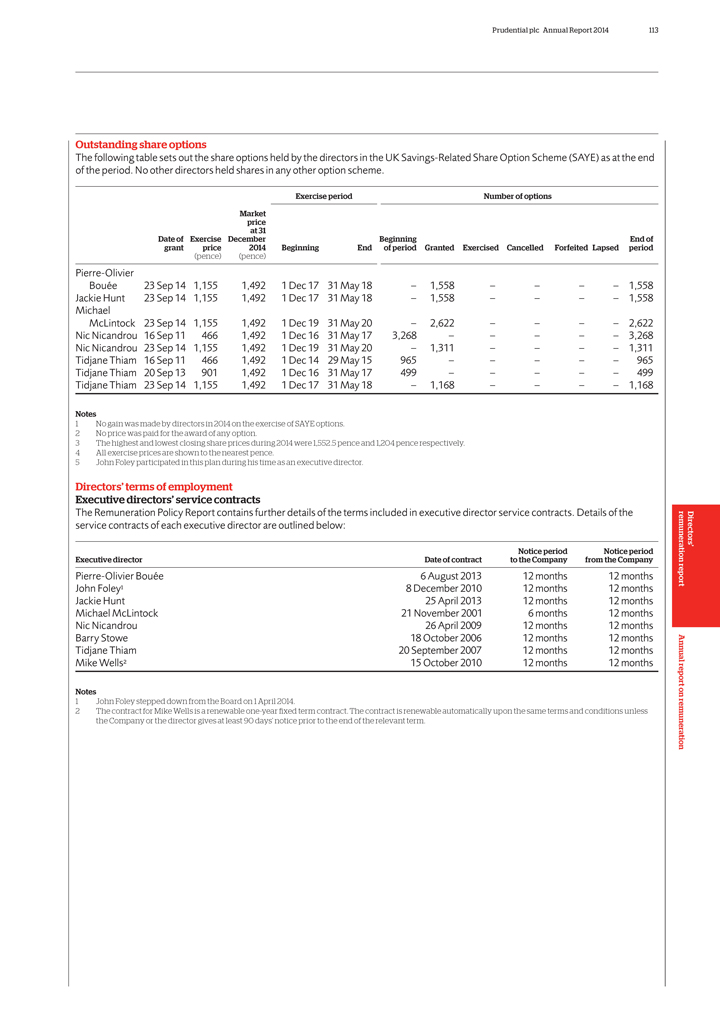
Prudential plc Annual Report 2014 113
Outstanding
share options
The following table sets out the share options held by the directors in the UK Savings-Related Share Option Scheme (SAYE) as at the end of the
period. No other directors held shares in any other option scheme.
Exercise period Number of options
Market
price
at 31
Date of Exercise December Beginning End of
grant price 2014 Beginning End of period Granted Exercised Cancelled Forfeited Lapsed period
(pence) (pence)
Pierre-Olivier
Bouée 23 Sep 14 1,155 1,492 1 Dec 17 31 May 18 – 1,558 – – – – 1,558
Jackie Hunt 23 Sep 14 1,155 1,492 1 Dec 17 31 May 18 – 1,558 – – – – 1,558
Michael
McLintock 23 Sep 14 1,155 1,492 1 Dec 19 31 May 20 – 2,622 –
– – – 2,622
Nic Nicandrou 16 Sep 11 466 1,492 1 Dec 16 31 May 17 3,268 – – – – – 3,268
Nic Nicandrou 23 Sep 14 1,155 1,492 1 Dec 19 31 May 20 – 1,311 – – – – 1,311
Tidjane Thiam 16 Sep 11 466 1,492 1 Dec 14 29 May 15 965 – – – – – 965
Tidjane Thiam 20 Sep 13 901 1,492 1 Dec 16 31 May 17 499 – – – – – 499
Tidjane Thiam 23 Sep 14 1,155 1,492 1 Dec 17 31 May 18 – 1,168 – – – – 1,168
Notes
| 1 | No gain was made by directors in 2014 on the exercise of SAYE options. |
| 2 | No price was paid for the award of any option. |
| 3 | The highest and lowest closing share prices during 2014 were 1,552.5 pence and 1,204 pence respectively. |
| 4 | All exercise prices are shown to the nearest pence. |
| 5 | John Foley participated in this plan during his time as an executive director. |
Directors’ terms of employment Executive directors’ service contracts
The Remuneration Policy Report contains further details of the terms included in executive director service contracts. Details of the service contracts of each executive director
are outlined below:
Notice period Notice period
Executive director Date of
contract to the Company from the Company
Pierre-Olivier Bouée 6 August 2013 12 months 12 months
John Foley1 8 December 2010 12 months 12 months
Jackie Hunt 25 April 2013 12 months
12 months
Michael McLintock 21 November 2001 6 months 12 months
Nic
Nicandrou 26 April 2009 12 months 12 months
Barry Stowe 18 October 2006 12 months 12 months
Tidjane Thiam 20 September 2007 12 months 12 months
Mike Wells2 15 October 2010 12
months 12 months
Notes
| 1 | John Foley stepped down from the Board on 1 April 2014. |
2 The contract for Mike Wells is a renewable one-year fixed term contract. The contract is renewable automatically upon the same terms and
conditions unless the Company or the director gives at least 90 days’ notice prior to the end of the relevant term.
Directors’ remuneration report Annual
report on remuneration
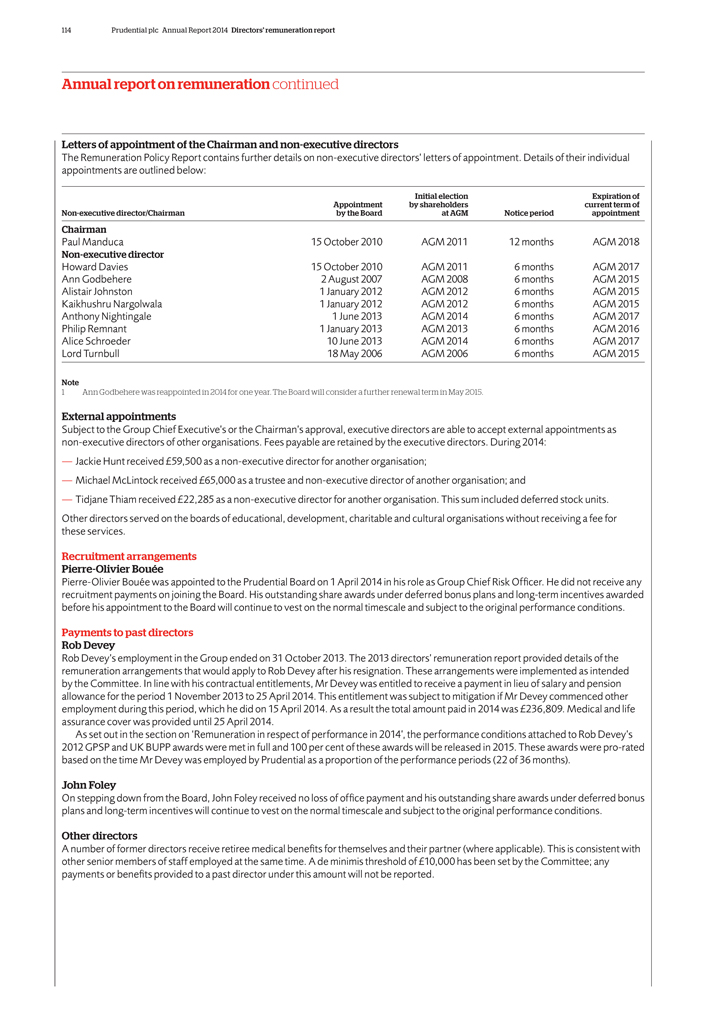
114 Prudential plc Annual Report 2014 Directors’ remuneration report
Annual report on remuneration continued
Letters of appointment of the Chairman and
non-executive directors
The Remuneration Policy Report contains further details on non-executive directors’ letters of appointment. Details of their
individual appointments are outlined below:
Initial election Expiration of
Appointment by shareholders current term of
Non-executive director/Chairman
by the Board at AGM Notice period appointment
Chairman
Paul Manduca
15 October 2010 AGM 2011 12 months AGM 2018
Non-executive director
Howard Davies 15 October 2010 AGM 2011 6 months AGM 2017
Ann Godbehere
2 August 2007 AGM 2008 6 months AGM 2015
Alistair Johnston 1 January 2012 AGM 2012 6 months AGM 2015
Kaikhushru Nargolwala 1 January 2012 AGM 2012 6 months AGM 2015
Anthony Nightingale
1 June 2013 AGM 2014 6 months AGM 2017
Philip Remnant 1 January 2013 AGM 2013 6 months AGM 2016
Alice Schroeder 10 June 2013 AGM 2014 6 months AGM 2017
Lord Turnbull 18 May 2006
AGM 2006 6 months AGM 2015
Note
| 1 | Ann Godbehere was reappointed in 2014 for one year. The Board will consider a further renewal term in May 2015. |
External appointments
Subject to the Group Chief Executive’s or the Chairman’s approval, executive directors are able to accept external appointments as non-executive
directors of other organisations. Fees payable are retained by the executive directors. During 2014:
— Jackie Hunt received £59,500 as a non-executive
director for another organisation;
— Michael McLintock received £65,000 as a trustee and non-executive director of another organisation; and
— Tidjane Thiam received £22,285 as a non-executive director for another organisation. This sum included deferred stock units.
Other directors served on the boards of educational, development, charitable and cultural organisations without receiving a fee for these services.
Recruitment arrangements Pierre-Olivier Bouée
Pierre-Olivier Bouée was appointed
to the Prudential Board on 1 April 2014 in his role as Group Chief Risk Officer. He did not receive any recruitment payments on joining the Board. His outstanding share awards under deferred bonus plans and long-term incentives awarded before
his appointment to the Board will continue to vest on the normal timescale and subject to the original performance conditions.
Payments to past directors Rob Devey
Rob Devey’s employment in the Group ended on 31 October 2013. The 2013 directors’ remuneration report provided details of the remuneration
arrangements that would apply to Rob Devey after his resignation. These arrangements were implemented as intended by the Committee. In line with his contractual entitlements, Mr Devey was entitled to receive a payment in lieu of salary and pension
allowance for the period 1 November 2013 to 25 April 2014. This entitlement was subject to mitigation if Mr Devey commenced other employment during this period, which he did on 15 April 2014. As a result the total amount paid in 2014
was £236,809. Medical and life assurance cover was provided until 25 April 2014.
As set out in the section on ‘Remuneration in respect of
performance in 2014’, the performance conditions attached to Rob Devey’s 2012 GPSP and UK BUPP awards were met in full and 100 per cent of these awards will be released in 2015. These awards were pro-rated based on the time Mr Devey
was employed by Prudential as a proportion of the performance periods (22 of 36 months).
John Foley
On stepping down from the Board, John Foley received no loss of office payment and his outstanding share awards under deferred bonus plans and long-term incentives will continue to
vest on the normal timescale and subject to the original performance conditions.
Other directors
A number of former directors receive retiree medical benefits for themselves and their partner (where applicable). This is consistent with other senior members of staff employed at
the same time. A de minimis threshold of £10,000 has been set by the Committee; any payments or benefits provided to a past director under this amount will not be reported.
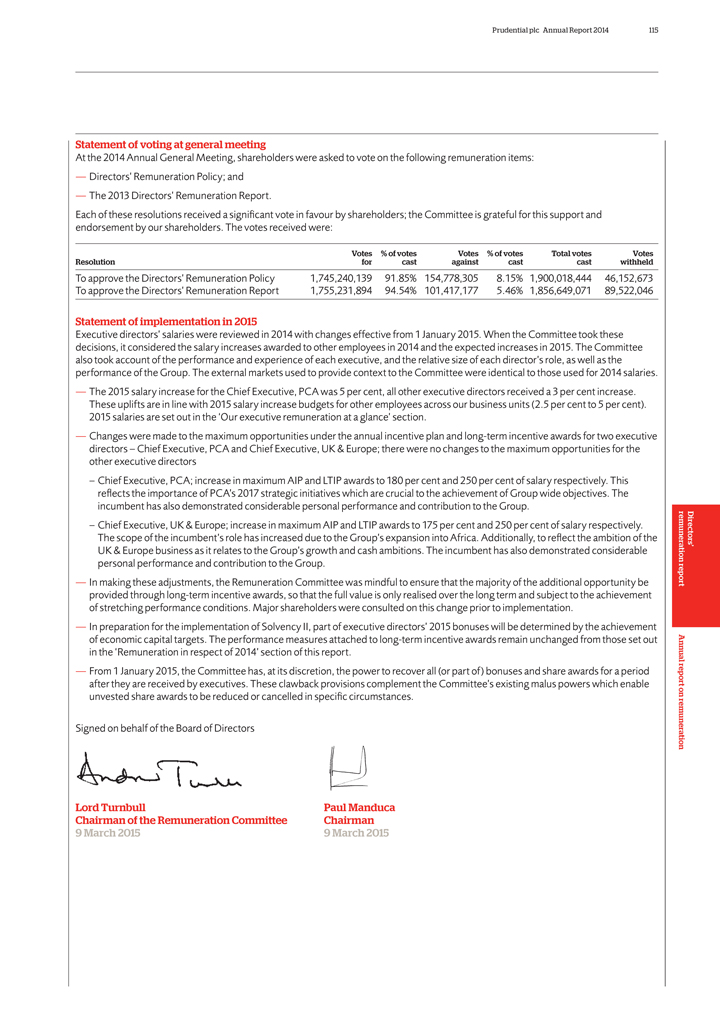
Prudential plc Annual Report 2014 115
Statement of
voting at general meeting
At the 2014 Annual General Meeting, shareholders were asked to vote on the following remuneration items:
— Directors’ Remuneration Policy; and
— The 2013 Directors’ Remuneration
Report.
Each of these resolutions received a significant vote in favour by shareholders; the Committee is grateful for this support and endorsement by our
shareholders. The votes received were:
Votes% of votes Votes% of votes Total votes Votes
Resolution for cast against cast cast withheld
To approve the Directors’ Remuneration
Policy 1,745,240,139 91.85% 154,778,305 8.15% 1,900,018,444 46,152,673
To approve the Directors’ Remuneration Report 1,755,231,894 94.54% 101,417,177 5.46%
1,856,649,071 89,522,046
Statement of implementation in 2015
Executive
directors’ salaries were reviewed in 2014 with changes effective from 1 January 2015. When the Committee took these decisions, it considered the salary increases awarded to other employees in 2014 and the expected increases in 2015. The
Committee also took account of the performance and experience of each executive, and the relative size of each director’s role, as well as the performance of the Group. The external markets used to provide context to the Committee were
identical to those used for 2014 salaries.
— The 2015 salary increase for the Chief Executive, PCA was 5 per cent, all other executive directors received
a 3 per cent increase. These uplifts are in line with 2015 salary increase budgets for other employees across our business units (2.5 per cent to 5 per cent). 2015 salaries are set out in the ‘Our executive remuneration at a
glance’ section.
— Changes were made to the maximum opportunities under the annual incentive plan and long-term incentive awards for two executive
directors – Chief Executive, PCA and Chief Executive, UK & Europe; there were no changes to the maximum opportunities for the other executive directors
– Chief Executive, PCA; increase in maximum AIP and LTIP awards to 180 per cent and 250 per cent of salary respectively. This refiects the
importance of PCA’s 2017 strategic initiatives which are crucial to the achievement of Group wide objectives. The incumbent has also demonstrated considerable personal performance and contribution to the Group.
– Chief Executive, UK & Europe; increase in maximum AIP and LTIP awards to 175 per cent and 250 per cent of salary respectively. The scope of the
incumbent’s role has increased due to the Group’s expansion into Africa. Additionally, to refiect the ambition of the UK & Europe business as it relates to the Group’s growth and cash ambitions. The incumbent has also
demonstrated considerable personal performance and contribution to the Group.
— In making these adjustments, the Remuneration Committee was mindful to ensure
that the majority of the additional opportunity be provided through long-term incentive awards, so that the full value is only realised over the long term and subject to the achievement of stretching performance conditions. Major shareholders were
consulted on this change prior to implementation.
— In preparation for the implementation of Solvency II, part of executive directors’ 2015 bonuses will
be determined by the achievement of economic capital targets. The performance measures attached to long-term incentive awards remain unchanged from those set out in the ‘Remuneration in respect of 2014’ section of this report.
— From 1 January 2015, the Committee has, at its discretion, the power to recover all (or part of) bonuses and share awards for a period after they are received by
executives. These clawback provisions complement the Committee’s existing malus powers which enable unvested share awards to be reduced or cancelled in specific circumstances.
Signed on behalf of the Board of Directors
Lord Turnbull Paul Manduca Chairman of the
Remuneration Committee Chairman
9 March 2015 9 March 2015
Directors’ remuneration report Annual report on remuneration
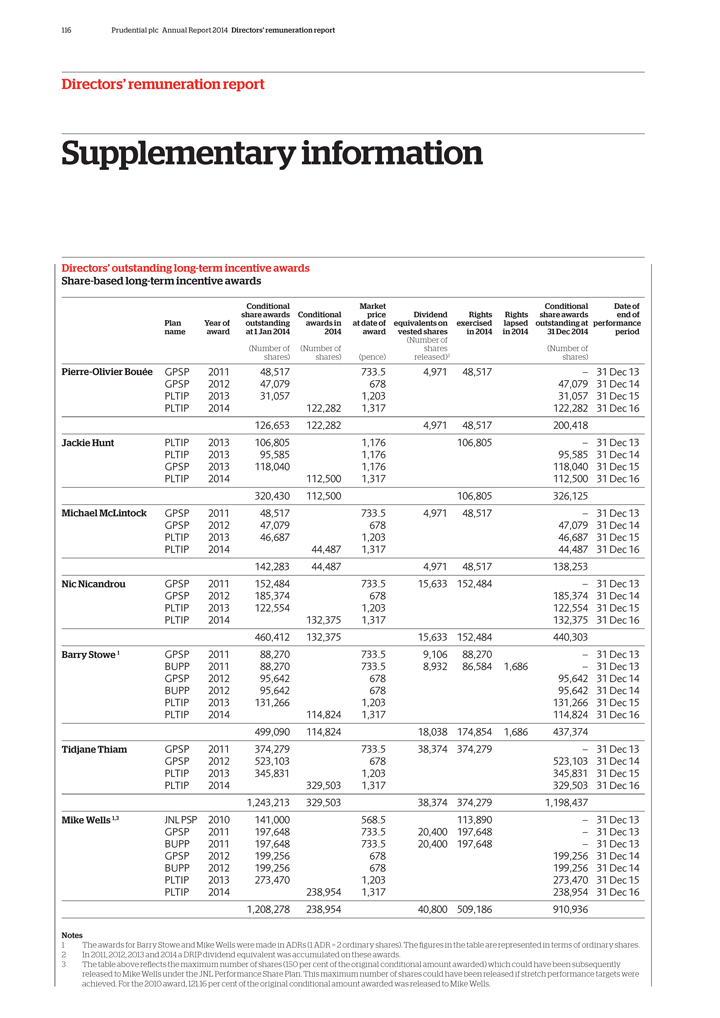
116 Prudential plc Annual Report 2014 Directors’ remuneration report
Directors’ remuneration report
Supplementary information
Directors’ outstanding long-term incentive awards Share-based long-term incentive awards
Conditional Market Conditional Date of
share awards Conditional price
Dividend Rights Rights share awards end of
Plan Year of outstanding awards in at date of equivalents on exercised lapsed outstanding at performance
name award at 1 Jan 2014 2014 award vested shares in 2014 in 2014 31 Dec 2014 period
(Number
of
(Number of (Number of shares (Number of
shares) shares) (pence) released)2
shares)
Pierre-Olivier Bouée GPSP 2011 48,517 733.5 4,971 48,517 – 31 Dec 13
GPSP 2012 47,079 678 47,079 31 Dec 14
PLTIP 2013 31,057 1,203 31,057 31 Dec 15
PLTIP 2014 122,282 1,317 122,282 31 Dec 16
126,653 122,282 4,971 48,517 200,418
Jackie Hunt PLTIP 2013 106,805 1,176 106,805 – 31 Dec 13
PLTIP 2013 95,585 1,176 95,585
31 Dec 14
GPSP 2013 118,040 1,176 118,040 31 Dec 15
PLTIP 2014 112,500 1,317
112,500 31 Dec 16
320,430 112,500 106,805 326,125
Michael McLintock GPSP 2011
48,517 733.5 4,971 48,517 – 31 Dec 13
GPSP 2012 47,079 678 47,079 31 Dec 14
PLTIP 2013 46,687 1,203 46,687 31 Dec 15
PLTIP 2014 44,487 1,317 44,487 31 Dec 16
142,283 44,487 4,971 48,517 138,253
Nic Nicandrou GPSP 2011 152,484 733.5 15,633 152,484
– 31 Dec 13
GPSP 2012 185,374 678 185,374 31 Dec 14
PLTIP 2013 122,554
1,203 122,554 31 Dec 15
PLTIP 2014 132,375 1,317 132,375 31 Dec 16
460,412
132,375 15,633 152,484 440,303
Barry Stowe 1 GPSP 2011 88,270 733.5 9,106 88,270 – 31 Dec 13
BUPP 2011 88,270 733.5 8,932 86,584 1,686 – 31 Dec 13
GPSP 2012 95,642 678 95,642 31 Dec
14
BUPP 2012 95,642 678 95,642 31 Dec 14
PLTIP 2013 131,266 1,203 131,266 31
Dec 15
PLTIP 2014 114,824 1,317 114,824 31 Dec 16
499,090 114,824 18,038
174,854 1,686 437,374
Tidjane Thiam GPSP 2011 374,279 733.5 38,374 374,279 – 31 Dec 13
GPSP 2012 523,103 678 523,103 31 Dec 14
PLTIP 2013 345,831 1,203 345,831 31 Dec 15
PLTIP 2014 329,503 1,317 329,503 31 Dec 16
1,243,213 329,503 38,374 374,279 1,198,437
Mike Wells 1,3 JNL PSP 2010 141,000 568.5 113,890 – 31 Dec 13
GPSP 2011
197,648 733.5 20,400 197,648 – 31 Dec 13
BUPP 2011 197,648 733.5 20,400 197,648 – 31 Dec 13
GPSP 2012 199,256 678 199,256 31 Dec 14
BUPP 2012 199,256 678 199,256 31 Dec 14
PLTIP 2013 273,470 1,203 273,470 31 Dec 15
PLTIP 2014 238,954 1,317 238,954 31 Dec 16
1,208,278 238,954 40,800 509,186 910,936
Notes
1 The awards for Barry Stowe and Mike Wells were made in ADRs (1 ADR = 2 ordinary shares). The figures in the table are represented in terms of ordinary shares.
| 2 | In 2011, 2012, 2013 and 2014 a DRIP dividend equivalent was accumulated on these awards. |
3 The table above reflects the maximum number of shares (150 per cent of the original conditional amount awarded) which could have been subsequently released to Mike Wells under the JNL Performance Share Plan. This maximum number of shares could have been released if stretch performance targets were achieved. For the 2010 award, 121.16 per cent of the original conditional amount awarded was released to Mike Wells.
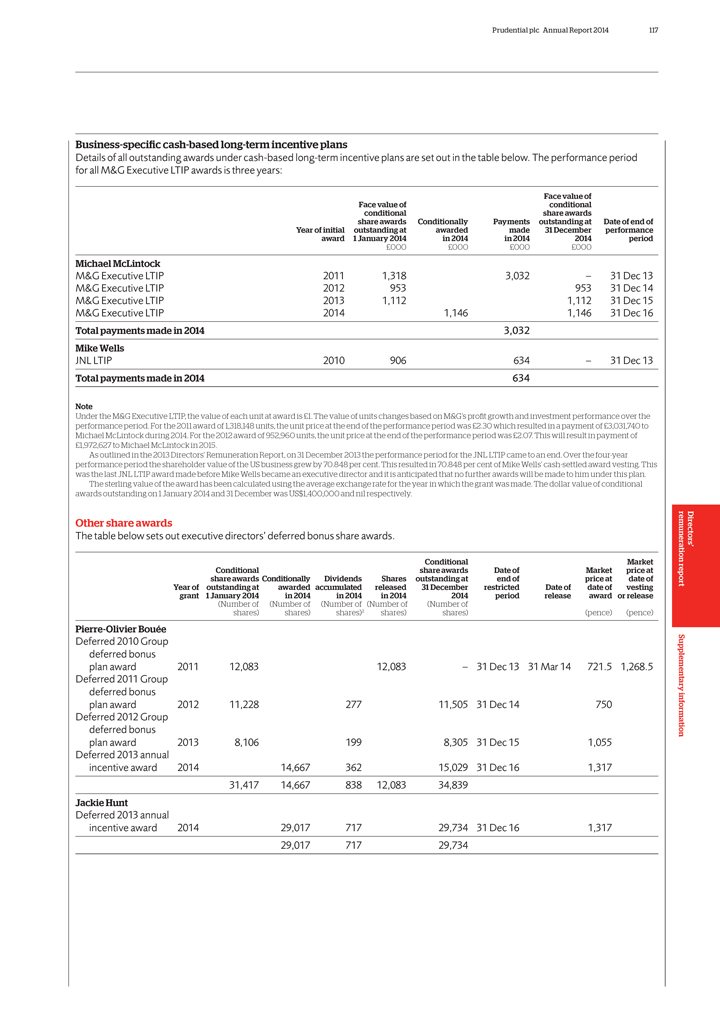
Prudential plc Annual Report 2014 117
Business-specific cash-based long-term incentive plans
Details of all
outstanding awards under cash-based long-term incentive plans are set out in the table below. The performance period for all M&G Executive LTIP awards is three years:
Face value of
Face value of conditional
conditional share awards
share awards Conditionally Payments outstanding at Date of end of
Year of initial outstanding at awarded made 31 December performance
award 1 January 2014 in 2014 in 2014 2014 period
£000 £000
£000 £000
Michael McLintock
M&G Executive LTIP 2011 1,318
3,032 – 31 Dec 13
M&G Executive LTIP 2012 953 953 31 Dec 14
M&G
Executive LTIP 2013 1,112 1,112 31 Dec 15
M&G Executive LTIP 2014 1,146 1,146 31 Dec 16
Total payments made in 2014 3,032
Mike Wells
JNL LTIP 2010 906 634 – 31 Dec 13
Total payments made in 2014 634
Note
Under the M&G Executive LTIP, the value of each unit at award is £1. The value
of units changes based on M&G’s profit growth and investment performance over the performance period. For the 2011 award of 1,318,148 units, the unit price at the end of the performance period was £2.30 which resulted in a payment of
£3,031,740 to Michael McLintock during 2014. For the 2012 award of 952,960 units, the unit price at the end of the performance period was £2.07. This will result in payment of £1,972,627 to Michael McLintock in 2015.
As outlined in the 2013 Directors’ Remuneration Report, on 31 December 2013 the performance period for the JNL LTIP came to an end. Over the four-year performance period
the shareholder value of the US business grew by 70.848 per cent. This resulted in 70.848 per cent of Mike Wells’ cash-settled award vesting. This was the last JNL LTIP award made before Mike Wells became an executive director and it
is anticipated that no further awards will be made to him under this plan.
The sterling value of the award has been calculated using the average exchange rate for
the year in which the grant was made. The dollar value of conditional awards outstanding on 1 January 2014 and 31 December was US$1,400,000 and nil respectively.
Other share awards
The table below sets out executive directors’ deferred bonus share
awards.
Conditional Market
Conditional share awards Date of Market price at
share awards Conditionally Dividends Shares outstanding at end of price at date of
Year of outstanding at awarded accumulated released 31 December restricted Date of date of vesting
grant 1 January 2014 in 2014 in 2014 in 2014 2014 period release award or release
(Number
of (Number of (Number of (Number of (Number of
shares) shares) shares)2 shares) shares) (pence) (pence)
Pierre-Olivier Bouée
Deferred 2010 Group
deferred bonus
plan award 2011 12,083 12,083 – 31 Dec 13 31 Mar 14 721.5 1,268.5
Deferred 2011 Group
deferred bonus
plan award 2012 11,228 277 11,505 31 Dec 14 750
Deferred 2012 Group
deferred bonus
plan award 2013 8,106 199 8,305 31 Dec 15 1,055
Deferred 2013 annual
incentive award 2014 14,667 362 15,029 31 Dec 16 1,317
31,417 14,667 838 12,083 34,839
Jackie Hunt
Deferred 2013 annual
incentive award 2014 29,017 717 29,734 31 Dec 16 1,317
29,017 717 29,734
Directors’ remuneration report Supplementary information
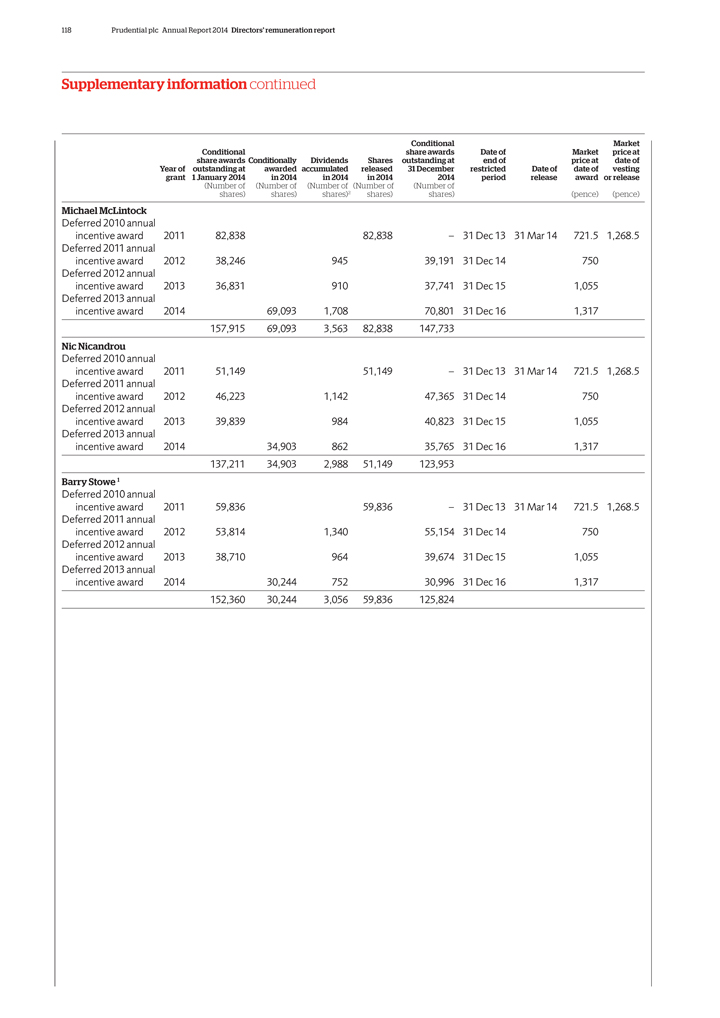
118 Prudential plc Annual Report 2014 Directors’ remuneration report
Supplementary information continued
Conditional Market
Conditional share awards Date of Market price at
share awards Conditionally Dividends Shares
outstanding at end of price at date of
Year of outstanding at awarded accumulated released 31 December restricted Date of date of vesting
grant 1 January 2014 in 2014 in 2014 in 2014 2014 period release award or release
(Number
of (Number of (Number of (Number of (Number of
shares) shares) shares)2 shares) shares) (pence) (pence)
Michael McLintock
Deferred 2010 annual
incentive award 2011 82,838 82,838 – 31 Dec 13 31 Mar 14 721.5 1,268.5
Deferred 2011
annual
incentive award 2012 38,246 945 39,191 31 Dec 14 750
Deferred 2012
annual
incentive award 2013 36,831 910 37,741 31 Dec 15 1,055
Deferred 2013
annual
incentive award 2014 69,093 1,708 70,801 31 Dec 16 1,317
157,915
69,093 3,563 82,838 147,733
Nic Nicandrou
Deferred 2010 annual
incentive award 2011 51,149 51,149 – 31 Dec 13 31 Mar 14 721.5 1,268.5
Deferred 2011
annual
incentive award 2012 46,223 1,142 47,365 31 Dec 14 750
Deferred 2012
annual
incentive award 2013 39,839 984 40,823 31 Dec 15 1,055
Deferred 2013
annual
incentive award 2014 34,903 862 35,765 31 Dec 16 1,317
137,211 34,903
2,988 51,149 123,953
Barry Stowe 1
Deferred 2010 annual
incentive award 2011 59,836 59,836 – 31 Dec 13 31 Mar 14 721.5 1,268.5
Deferred 2011
annual
incentive award 2012 53,814 1,340 55,154 31 Dec 14 750
Deferred 2012
annual
incentive award 2013 38,710 964 39,674 31 Dec 15 1,055
Deferred 2013
annual
incentive award 2014 30,244 752 30,996 31 Dec 16 1,317
152,360 30,244
3,056 59,836 125,824
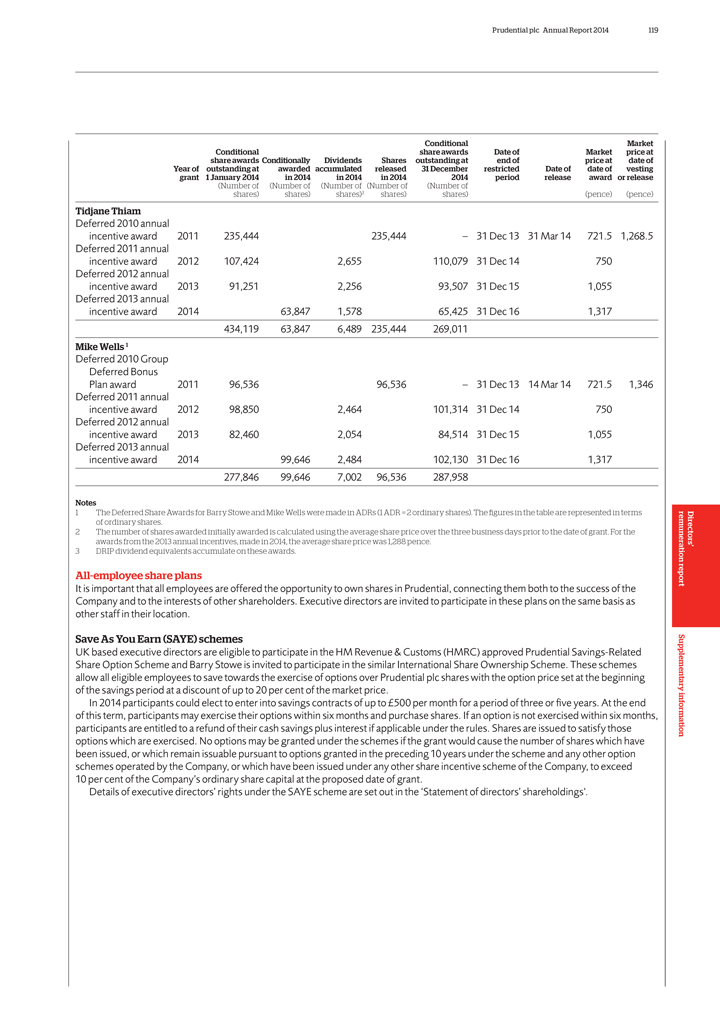
Prudential plc Annual Report 2014
119
Conditional
Market
Conditional
share awards
Date of
Market
price at
share awards Conditionally
Dividends
Shares
outstanding at
end of
price at
date of
Year of
outstanding at
awarded accumulated
released
31 December
restricted
Date of
date of
vesting
grant
1 January 2014
in 2014
in 2014
in 2014
2014
period
release
award or release
(Number of
(Number of
(Number of
(Number of
(Number of
shares)
shares)
shares)2
shares)
shares)
(pence)
(pence)
Tidjane Thiam
Deferred 2010 annual
incentive award
2011
235,444
235,444
–
31 Dec 13
31 Mar 14
721.5
1,268.5
Deferred 2011 annual
incentive award
2012
107,424
2,655
110,079
31 Dec 14
750
Deferred 2012 annual
incentive award
2013
91,251
2,256
93,507
31 Dec 15
1,055
Deferred 2013 annual
incentive award
2014
63,847
1,578
65,425
31 Dec 16
1,317
434,119
63,847
6,489
235,444
269,011
Mike Wells 1
Deferred 2010 Group
Deferred Bonus
Plan award
2011
96,536
96,536
–
31 Dec 13
14 Mar 14
721.5
1,346
Deferred 2011 annual
incentive award
2012
98,850
2,464
101,314
31 Dec 14
750
Deferred 2012 annual
incentive award
2013
82,460
2,054
84,514
31 Dec 15
1,055
Deferred 2013 annual
incentive award
2014
99,646
2,484
102,130
31 Dec 16
1,317
277,846
99,646
7,002
96,536
287,958
Notes
1
The Deferred Share Awards for Barry Stowe and Mike Wells were made in ADRs (1 ADR = 2
ordinary shares). The figures in the table are represented in terms
of ordinary shares.
2
The number of shares awarded initially awarded is calculated using the average share price
over the three business days prior to the date of grant. For the
awards from the 2013 annual incentives, made in 2014, the average share price was 1,288 pence.
3
DRIP dividend equivalents accumulate on these awards.
All-employee share plans
It is important that all employees are offered the opportunity to own
shares in Prudential, connecting them both to the success of the
Company and to the interests of other shareholders. Executive directors are invited to participate
in these plans on the same basis as
other staff in their location.
Save As
You Earn (SAYE) schemes
UK based executive directors are eligible to participate in the HM Revenue & Customs (HMRC) approved Prudential Savings-Related
Share Option Scheme and Barry Stowe is invited to participate in the similar International Share Ownership Scheme. These schemes
allow all eligible employees to save towards the exercise of options over Prudential plc shares with the option price set at the beginning
of the savings period at a discount of up to 20 per cent of the market price.
In 2014
participants could elect to enter into savings contracts of up to £500 per month for a period of three or five years. At the end
of this term,
participants may exercise their options within six months and purchase shares. If an option is not exercised within six months,
participants are entitled to a
refund of their cash savings plus interest if applicable under the rules. Shares are issued to satisfy those
options which are exercised. No options may be granted
under the schemes if the grant would cause the number of shares which have
been issued, or which remain issuable pursuant to options granted in the preceding 10
years under the scheme and any other option
schemes operated by the Company, or which have been issued under any other share incentive scheme of the Company, to
exceed
10 per cent of the Company’s ordinary share capital at the proposed date of grant.
Details of executive directors’ rights under the SAYE scheme are set out in the ‘Statement of directors’ shareholdings‘.
Directors’ remuneration report Supplementary information
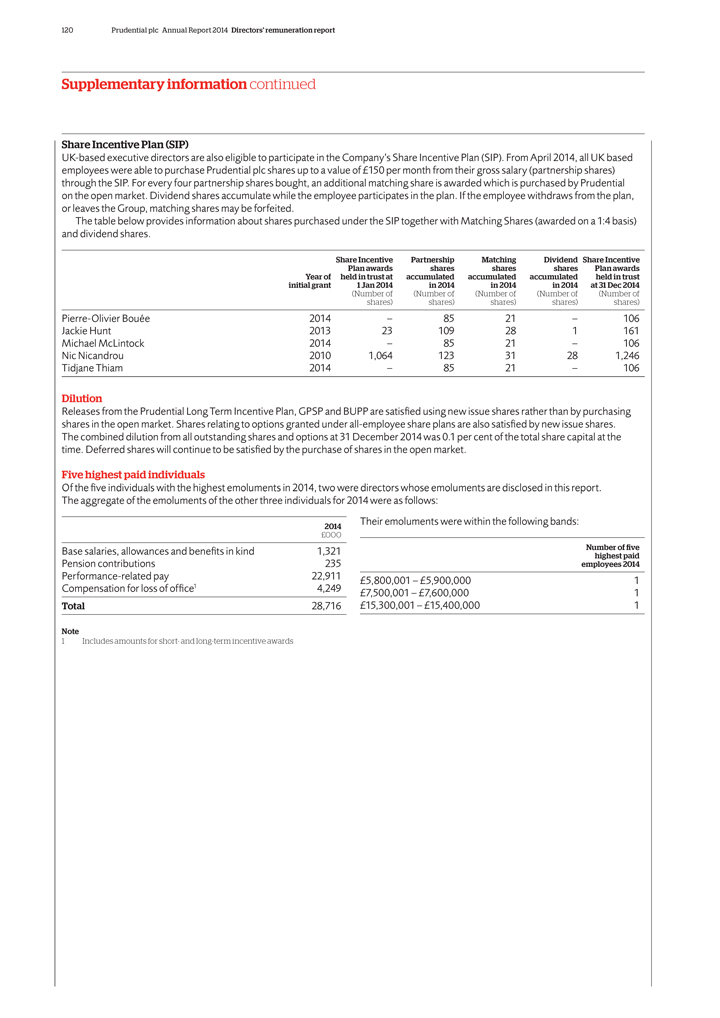
120 Prudential plc Annual Report 2014 Directors’ remuneration report
Supplementary information continued
Share Incentive Plan (SIP)
UK-based executive directors are also eligible to participate in the Company’s Share Incentive Plan (SIP). From April 2014, all UK based employees were able to purchase
Prudential plc shares up to a value of £150 per month from their gross salary (partnership shares) through the SIP. For every four partnership shares bought, an additional matching share is awarded which is purchased by Prudential on the
open market. Dividend shares accumulate while the employee participates in the plan. If the employee withdraws from the plan, or leaves the Group, matching shares may be forfeited.
The table below provides information about shares purchased under the SIP together with Matching Shares (awarded on a 1:4 basis) and dividend shares.
Share Incentive Partnership Matching Dividend Share Incentive
Plan awards shares shares shares
Plan awards
Year of held in trust at accumulated accumulated accumulated held in trust
initial grant 1 Jan 2014 in 2014 in 2014 in 2014 at 31 Dec 2014
(Number of (Number of (Number
of (Number of (Number of
shares) shares) shares) shares) shares)
Pierre-Olivier Bouée 2014 – 85 21 – 106
Jackie Hunt 2013 23
109 28 1 161
Michael McLintock 2014 – 85 21 – 106
Nic Nicandrou
2010 1,064 123 31 28 1,246
Tidjane Thiam 2014 – 85 21 – 106
Dilution
Releases from the Prudential Long Term Incentive Plan, GPSP and BUPP
are satisfied using new issue shares rather than by purchasing shares in the open market. Shares relating to options granted under all-employee share plans are also satisfied by new issue shares. The combined dilution from all outstanding shares and
options at 31 December 2014 was 0.1 per cent of the total share capital at the time. Deferred shares will continue to be satisfied by the purchase of shares in the open market.
Five highest paid individuals
Of the five individuals with the highest emoluments in 2014, two
were directors whose emoluments are disclosed in this report. The aggregate of the emoluments of the other three individuals for 2014 were as follows:
2014 Their
emoluments were within the following bands:
£000
Base salaries,
allowances and benefits in kind 1,321 Number of five
highest paid
Pension
contributions 235 employees 2014
Performance-related pay 22,911 £5,800,001 – £5,900,000 1
Compensation for loss of office1 4,249 £7,500,001 – £7,600,000 1
Total 28,716
£15,300,001 – £15,400,000 1
Note
| 1 | Includes amounts for short- and long-term incentive awards |

Prudential plc Annual Report 2014 121
Section 5
Financial statements
122 Index to Group IFRS financial statements 261 Balance sheet of the parent company
262 Notes
on the parent company financial statements 270 Statement of directors’ responsibilities in respect of the annual report and the financial statements 271 Independent auditor’s report to the members of Prudential plc only
Financial 5statements
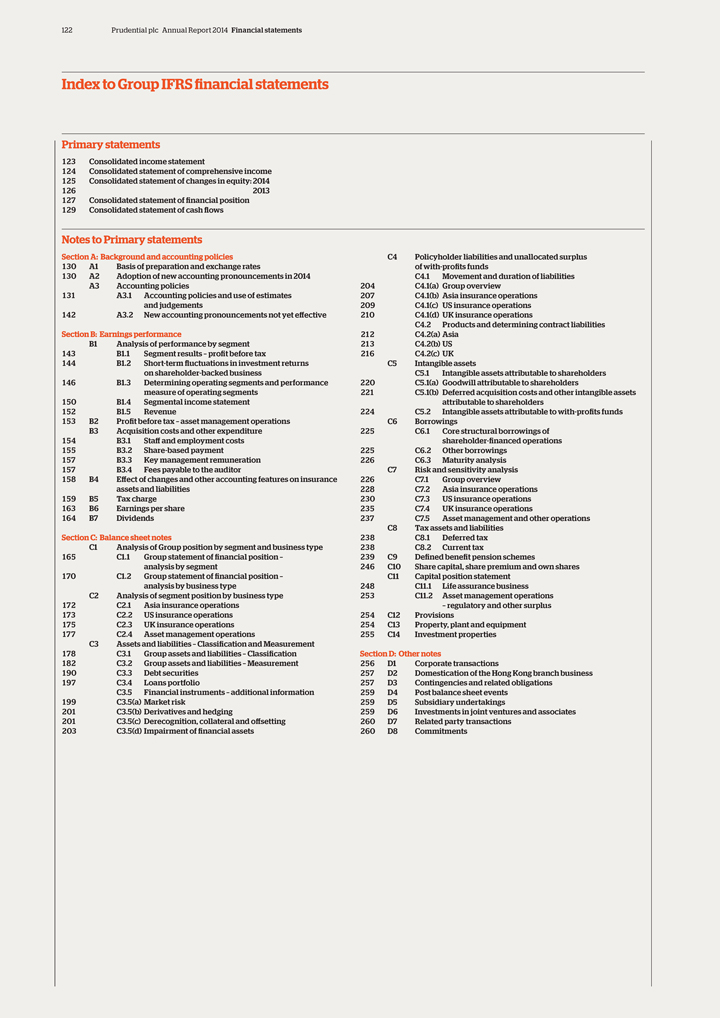
122 Prudential plc Annual Report 2014 Financial statements
Index to Group IFRS financial statements
Primary statements
123 Consolidated income statement
124 Consolidated statement of comprehensive income
125 Consolidated statement of changes in equity: 2014
126 2013
127 Consolidated statement of financial position
129 Consolidated statement of cash flows
Notes to Primary statements
Section A: Background and accounting policies
130 A1 Basis of preparation and exchange rates
130 A2 Adoption of new
accounting pronouncements in 2014
A3 Accounting policies
131 A3.1 Accounting
policies and use of estimates
and judgements
142 A3.2 New accounting
pronouncements not yet effective
Section B: Earnings performance
B1 Analysis
of performance by segment
143 B1.1 Segment results – profit before tax
144 B1.2 Short-term fluctuations in investment returns
on shareholder-backed
business
146 B1.3 Determining operating segments and performance
measure of
operating segments
150 B1.4 Segmental income statement
152 B1.5 Revenue
153 B2 Profit before tax – asset management operations
B3 Acquisition
costs and other expenditure
154 B3.1 Staff and employment costs
155 B3.2
Share-based payment
157 B3.3 Key management remuneration
157 B3.4 Fees
payable to the auditor
158 B4 Effect of changes and other accounting features on insurance
assets and liabilities
159 B5 Tax charge
163 B6 Earnings per share
164 B7 Dividends
Section C: Balance sheet notes
C1 Analysis of Group position by segment and business type
165 C1.1 Group statement of financial position –
analysis by segment
170 C1.2 Group statement of financial position –
analysis by business
type
C2 Analysis of segment position by business type
172 C2.1 Asia insurance
operations
173 C2.2 US insurance operations
175 C2.3 UK insurance operations
177 C2.4 Asset management operations
C3 Assets and liabilities –
Classification and Measurement
178 C3.1 Group assets and liabilities – Classification
182 C3.2 Group assets and liabilities – Measurement
190 C3.3 Debt securities
197 C3.4 Loans portfolio
C3.5 Financial instruments – additional information
199 C3.5(a) Market risk
201 C3.5(b) Derivatives and hedging
201 C3.5(c) Derecognition, collateral and offsetting
203 C3.5(d) Impairment of financial
assets
C4 Policyholder liabilities and unallocated surplus
of with-profits
funds
C4.1 Movement and duration of liabilities
204 C4.1(a) Group overview
207 C4.1(b) Asia insurance operations
209 C4.1(c) US insurance operations
210 C4.1(d) UK insurance operations
C4.2 Products and determining contract
liabilities
212 C4.2(a) Asia
213 C4.2(b) US
216 C4.2(c) UK
C5 Intangible assets
C5.1 Intangible assets attributable to shareholders
220 C5.1(a) Goodwill attributable to
shareholders
221 C5.1(b) Deferred acquisition costs and other intangible assets
attributable to shareholders
224 C5.2 Intangible assets attributable to
with-profits funds
C6 Borrowings
225 C6.1 Core structural borrowings of
shareholder-financed operations
225 C6.2 Other borrowings
226 C6.3 Maturity analysis
C7 Risk and sensitivity analysis
226 C7.1 Group overview
228 C7.2 Asia insurance operations
230 C7.3 US insurance operations
235 C7.4 UK insurance operations
237 C7.5 Asset management and other operations
C8 Tax assets and liabilities
238 C8.1 Deferred tax
238 C8.2 Current tax
239 C9 Defined benefit pension schemes
246 C10 Share capital, share premium and own shares
C11 Capital position statement
248 C11.1 Life assurance business
253 C11.2 Asset management operations
– regulatory and other surplus
254 C12 Provisions
254 C13 Property, plant and equipment
255 C14 Investment properties
Section D: Other notes
256 D1 Corporate transactions
257 D2 Domestication of the Hong Kong branch business
257 D3 Contingencies and related obligations
259 D4 Post balance sheet events
259 D5 Subsidiary undertakings
259 D6 Investments in joint ventures and
associates
260 D7 Related party transactions
260 D8 Commitments
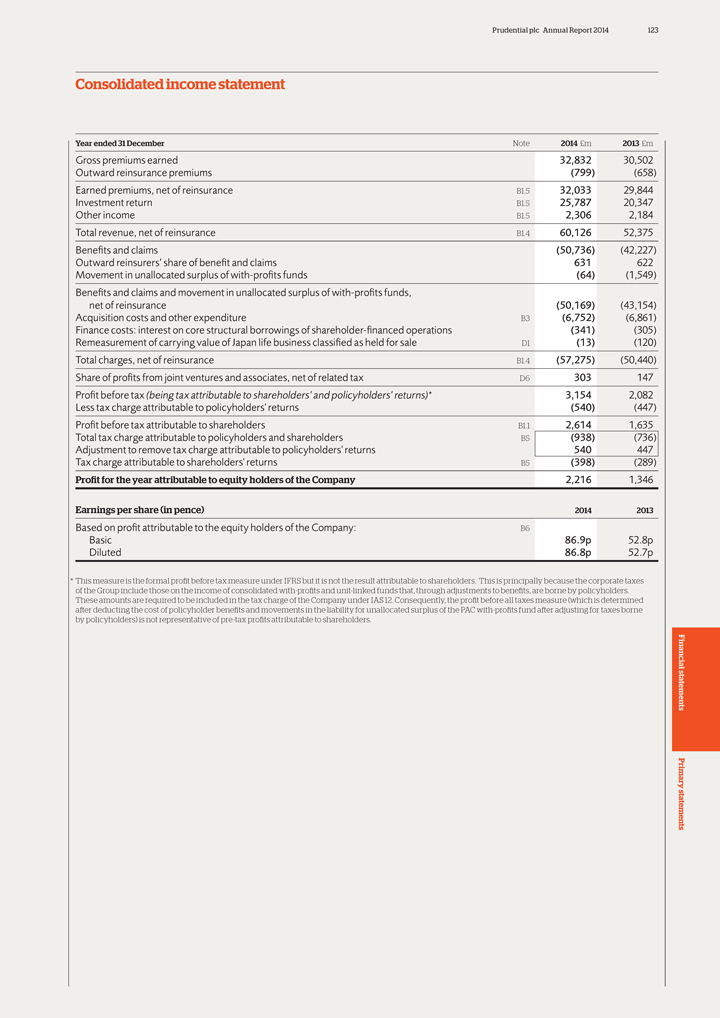
Prudential plc Annual Report 2014 123
Consolidated
income statement
Year ended 31 December Note 2014 £m 2013 £m
Gross premiums earned 32,832 30,502
Outward reinsurance premiums
(799) (658)
Earned premiums, net of reinsurance B1.5 32,033 29,844
Investment return B1.5 25,787 20,347
Other income B1.5 2,306 2,184
Total revenue, net of reinsurance B1.4 60,126 52,375
Bene?ts and claims
(50,736) (42,227)
Outward reinsurers’ share of benefit and claims 631 622
Movement in unallocated surplus of with-pro?ts funds (64) (1,549)
Bene?ts and claims and
movement in unallocated surplus of with-pro?ts funds,
net of reinsurance (50,169) (43,154)
Acquisition costs and other expenditure B3 (6,752) (6,861)
Finance costs: interest on
core structural borrowings of shareholder-?nanced operations (341) (305)
Remeasurement of carrying value of Japan life business classi?ed as held for sale D1
(13) (120)
Total charges, net of reinsurance B1.4 (57,275) (50,440)
Share of pro?ts from joint ventures and associates, net of related tax D6 303 147
Pro?t before tax (being tax attributable to shareholders’ and policyholders’ returns)* 3,154 2,082
Less tax charge attributable to policyholders’ returns (540) (447)
Pro?t before tax
attributable to shareholders B1.1 2,614 1,635
Total tax charge attributable to policyholders and shareholders B5 (938) (736)
Adjustment to remove tax charge attributable to policyholders’ returns 540 447
Tax charge
attributable to shareholders’ returns B5 (398) (289)
Profit for the year attributable to equity holders of the Company 2,216 1,346
Earnings per share (in pence) 2014 2013
Based on pro?t attributable to the equity holders of
the Company: B6
Basic 86.9p 52.8p
Diluted 86.8p 52.7p
* This measure is the formal profit before tax measure under IFRS but it is not the result attributable to shareholders. This is principally because the corporate taxes
of the Group include those on the income of consolidated with-profits and unit-linked funds that, through adjustments to benefits, are borne by policyholders.
These amounts are required to be included in the tax charge of the Company under IAS 12. Consequently, the profit before all taxes measure (which is determined
after deducting the cost of policyholder benefits and movements in the liability for unallocated surplus of the PAC with-profits fund after adjusting for taxes borne
by policyholders) is not representative of pre-tax profits attributable to shareholders.
Financial statements Primary statements
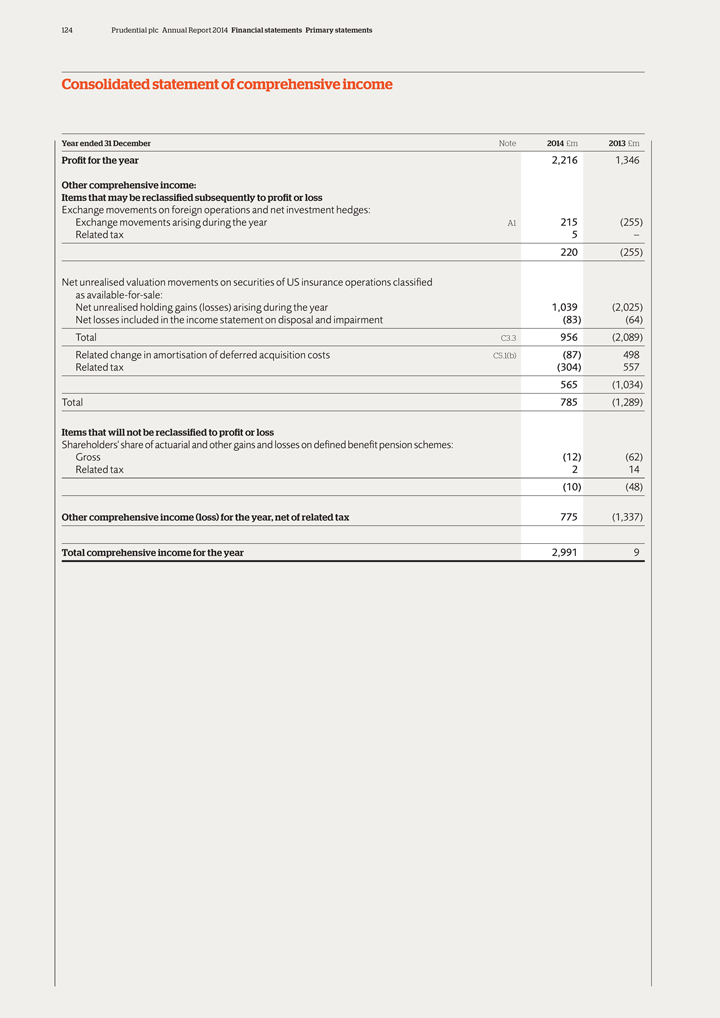
124 Prudential plc Annual Report 2014 Financial statements Primary statements
Consolidated statement of comprehensive income
Year ended 31 December Note 2014 £m
2013 £m
Profit for the year 2,216 1,346
Other comprehensive income:
Items that may be reclassified subsequently to profit or loss
Exchange
movements on foreign operations and net investment hedges:
Exchange movements arising during the year A1 215 (255)
Related tax 5 –
220 (255)
Net unrealised valuation movements on securities of US insurance operations classi?ed
as
available-for-sale:
Net unrealised holding gains (losses) arising during the year 1,039 (2,025)
Net losses included in the income statement on disposal and impairment (83) (64)
Total
C3.3 956 (2,089)
Related change in amortisation of deferred acquisition costs C5.1(b) (87) 498
Related tax (304) 557
565 (1,034)
Total 785 (1,289)
Items that will not be reclassified to profit or loss
Shareholders’ share of actuarial and other gains and losses on de?ned bene?t pension schemes:
Gross (12) (62)
Related tax 2 14
| (10) | (48) |
Other comprehensive income (loss) for the year, net of related tax 775 (1,337)
Total
comprehensive income for the year 2,991 9
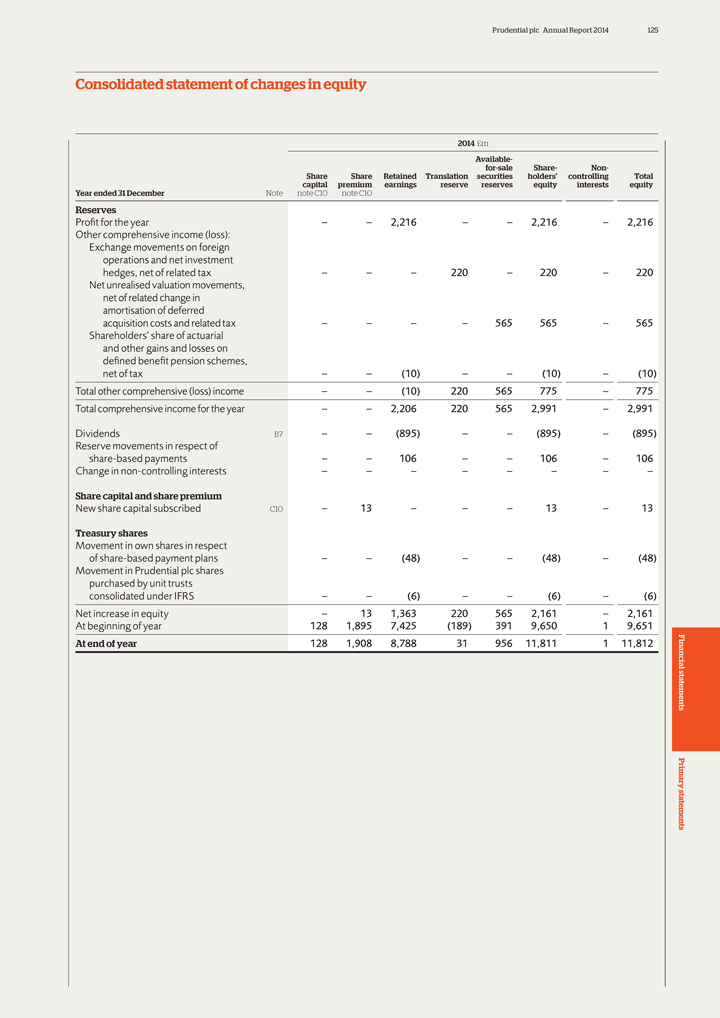
Prudential plc Annual Report 2014 125
Consolidated
statement of changes in equity
2014 £m
Available-
for-sale Share- Non-
Share Share Retained Translation securities holders’ controlling
Total
capital premium earnings reserve reserves equity interests equity
Year
ended 31 December Note note C10 note C10
Reserves
Profit for the year
– – 2,216 – – 2,216 – 2,216
Other comprehensive income (loss):
Exchange movements on foreign
operations and net investment
hedges, net of related tax – – – 220 – 220 – 220
Net unrealised
valuation movements,
net of related change in
amortisation of deferred
acquisition costs and related tax – – – – 565 565 – 565
Shareholders’ share of actuarial
and other gains and losses on
defined benefit pension schemes,
net of tax – – (10) – –
(10) – (10)
Total other comprehensive (loss) income – – (10) 220 565 775 – 775
Total comprehensive income for the year – – 2,206 220 565 2,991 – 2,991
Dividends B7 – – (895) – – (895) – (895)
Reserve movements in respect of
share-based payments – – 106 –
– 106 – 106
Change in non-controlling interests – – – – – – – –
Share capital and share premium
New share capital subscribed C10 – 13 – –
– 13 – 13
Treasury shares
Movement in own shares in respect
of share-based payment plans – – (48) – – (48) – (48)
Movement in Prudential plc shares
purchased by unit trusts
consolidated under IFRS – – (6) – – (6) – (6)
Net increase
in equity – 13 1,363 220 565 2,161 – 2,161
At beginning of year 128 1,895 7,425 (189) 391 9,650 1 9,651
At end of year 128 1,908 8,788 31 956 11,811 1 11,812
Financial statements Primary statements
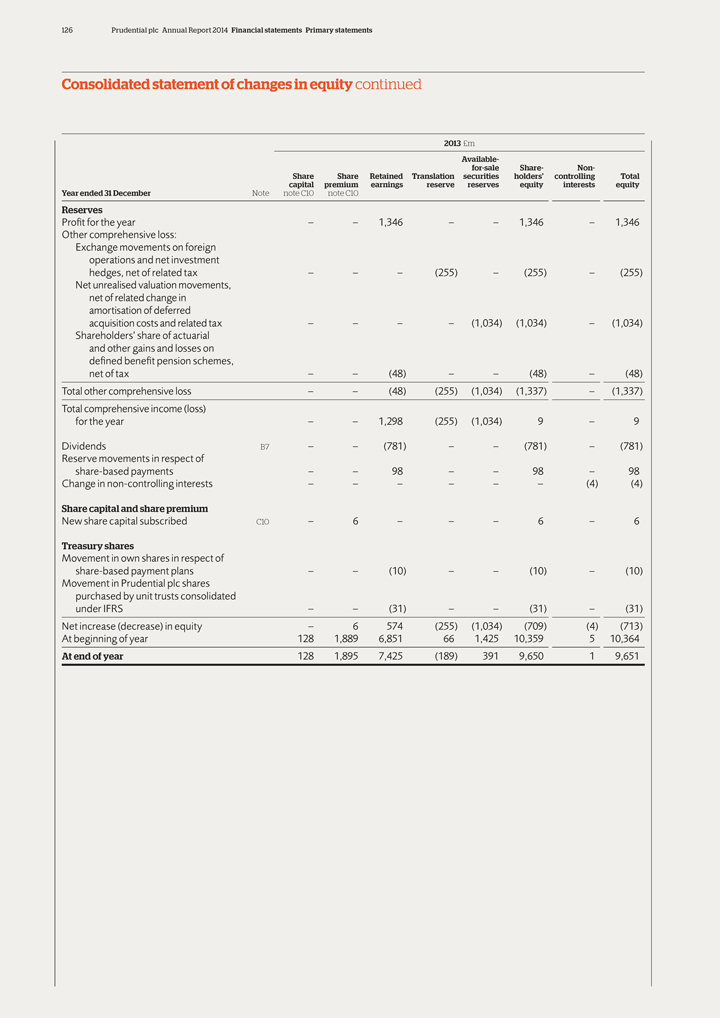
126 Prudential plc Annual Report 2014 Financial statements Primary statements
Consolidated statement of changes in equity continued
2013 £m
Available-
for-sale Share- Non-
Share Share Retained Translation securities holders’ controlling Total
capital premium
earnings reserve reserves equity interests equity
Year ended 31 December Note note C10 note C10
Reserves
Pro?t for the year – – 1,346 – – 1,346 – 1,346
Other comprehensive loss:
Exchange movements on foreign
operations and net investment
hedges, net of related tax – – –
(255) – (255) – (255)
Net unrealised valuation movements,
net of related change in
amortisation of deferred
acquisition costs and related tax – – – – (1,034) (1,034) – (1,034)
Shareholders’ share of actuarial
and other gains and losses on
de?ned bene?t pension schemes,
net of tax – – (48) – –
(48) – (48)
Total other comprehensive loss – – (48) (255) (1,034) (1,337) – (1,337)
Total comprehensive income (loss)
for the year – – 1,298 (255) (1,034) 9
– 9
Dividends B7 – – (781) – – (781) – (781)
Reserve movements in respect of
share-based payments – – 98 – – 98 –
98
Change in non-controlling interests – – – – – – (4) (4)
Share capital and share premium
New share capital subscribed C10 – 6 – – –
6 – 6
Treasury shares
Movement in own shares in respect of
share-based payment plans – – (10) – – (10) – (10)
Movement
in Prudential plc shares
purchased by unit trusts consolidated
under IFRS
– – (31) – – (31) – (31)
Net increase (decrease) in equity – 6 574 (255) (1,034) (709) (4) (713)
At beginning of year 128 1,889 6,851 66 1,425 10,359 5 10,364
At end of year
128 1,895 7,425 (189) 391 9,650 1 9,651
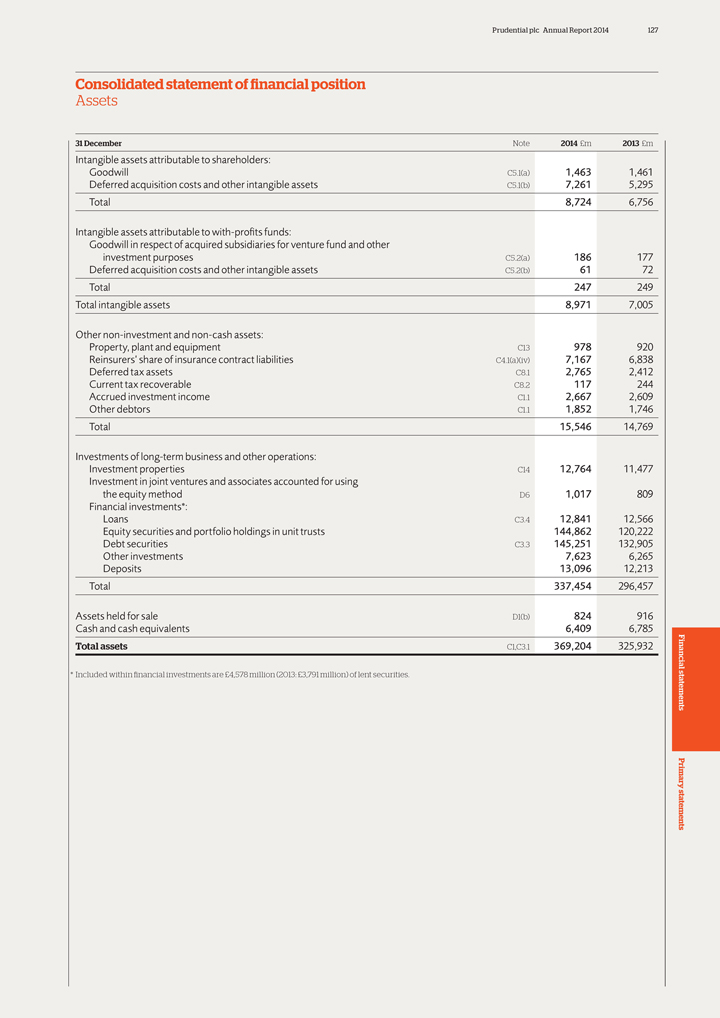
Prudential plc Annual Report 2014 127
Consolidated
statement of financial position
Assets
31 December Note 2014 £m
2013 £m
Intangible assets attributable to shareholders:
Goodwill
C5.1(a) 1,463 1,461 Deferred acquisition costs and other intangible assets C5.1(b) 7,261 5,295 Total 8,724 6,756
Intangible assets attributable to with-profits
funds:
Goodwill in respect of acquired subsidiaries for venture fund and other investment purposes C5.2(a) 186 177 Deferred acquisition costs and other intangible
assets C5.2(b) 61 72 Total 247 249 Total intangible assets 8,971 7,005
Other non-investment and non-cash assets:
Property, plant and equipment C13 978 920 Reinsurers’ share of insurance contract liabilities C4.1(a)(iv) 7,167 6,838 Deferred tax assets C8.1 2,765 2,412 Current tax
recoverable C8.2 117 244 Accrued investment income C1.1 2,667 2,609 Other debtors C1.1 1,852 1,746 Total 15,546 14,769
Investments of long-term business and other
operations:
Investment properties C14 12,764 11,477 Investment in joint ventures and associates accounted for using the equity method D6 1,017 809 Financial
investments*: Loans C3.4 12,841 12,566 Equity securities and portfolio holdings in unit trusts 144,862 120,222 Debt securities C3.3 145,251 132,905 Other investments 7,623 6,265 Deposits 13,096 12,213 Total 337,454 296,457
Assets held for sale D1(b) 824 916 Cash and cash equivalents 6,409 6,785
Total assets C1,C3.1
369,204 325,932
| * | Included within financial investments are £4,578 million (2013: £3,791 million) of lent securities. |
Financial statements Primary statements
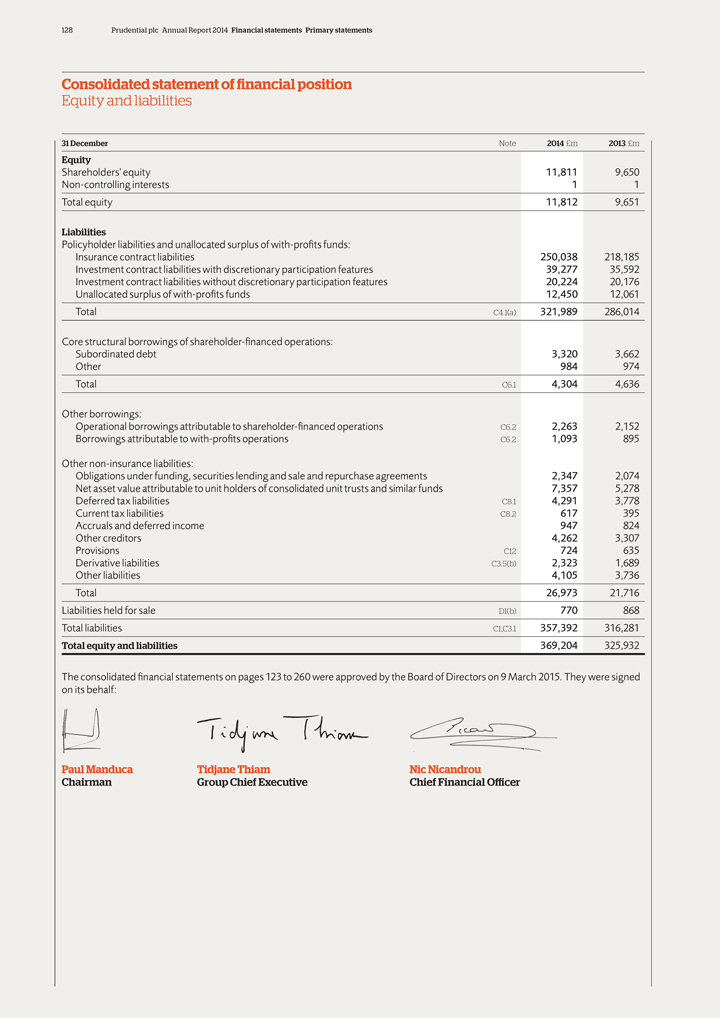
128 Prudential plc Annual Report 2014 Financial statements Primary statements
Consolidated statement of financial position
Equity and liabilities
31 December Note 2014 £m 2013 £m
Equity
Shareholders’ equity 11,811 9,650
Non-controlling interests 1 1
Total equity 11,812 9,651
Liabilities
Policyholder liabilities and unallocated surplus of with-pro?ts funds:
Insurance contract
liabilities 250,038 218,185
Investment contract liabilities with discretionary participation features 39,277 35,592
Investment contract liabilities without discretionary participation features 20,224 20,176
Unallocated surplus of with-pro?ts funds 12,450 12,061
Total C4.1(a) 321,989
286,014
Core structural borrowings of shareholder-?nanced operations:
Subordinated debt 3,320 3,662
Other 984 974
Total C6.1 4,304 4,636
Other borrowings:
Operational borrowings attributable to shareholder-?nanced operations C6.2 2,263 2,152
Borrowings attributable to with-pro?ts operations C6.2 1,093 895
Other
non-insurance liabilities:
Obligations under funding, securities lending and sale and repurchase agreements 2,347 2,074
Net asset value attributable to unit holders of consolidated unit trusts and similar funds 7,357 5,278
Deferred tax liabilities C8.1 4,291 3,778
Current tax liabilities C8.2 617 395
Accruals and deferred income 947 824
Other creditors 4,262 3,307
Provisions C12 724 635
Derivative liabilities C3.5(b) 2,323 1,689
Other liabilities 4,105 3,736
Total 26,973 21,716
Liabilities held for sale D1(b) 770 868
Total liabilities C1,C3.1 357,392 316,281
Total equity and liabilities 369,204 325,932
The consolidated ?nancial statements on pages 123
to 260 were approved by the Board of Directors on 9 March 2015. They were signed
on its behalf:
Paul Manduca Tidjane Thiam Nic Nicandrou
Chairman Group Chief Executive Chief Financial
Officer
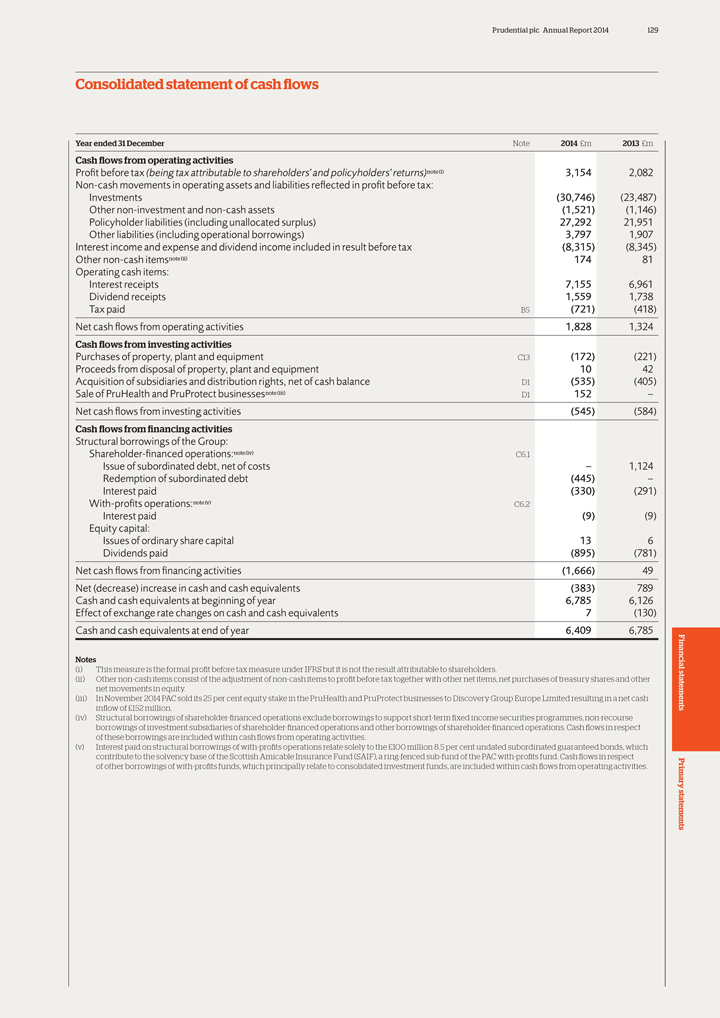
Prudential plc Annual Report 2014 129
Consolidated
statement of cash flows
Year ended 31 December Note 2014 £m 2013 £m
Cash flows from operating activities
Profit before tax (being tax attributable to
shareholders’ and policyholders’ returns)note(i) 3,154 2,082
Non-cash movements in operating assets and liabilities refiected in profit before tax:
Investments (30,746) (23,487)
Other non-investment and non-cash assets
(1,521) (1,146)
Policyholder liabilities (including unallocated surplus) 27,292 21,951
Other liabilities (including operational borrowings) 3,797 1,907
Interest income and expense
and dividend income included in result before tax (8,315) (8,345)
Other non-cash itemsnote(ii) 174 81
Operating cash items:
Interest receipts 7,155 6,961
Dividend receipts 1,559 1,738
Tax paid B5 (721) (418)
Net cash fiows from operating activities 1,828 1,324
Cash flows from investing activities
Purchases of property, plant and equipment C13 (172) (221)
Proceeds from
disposal of property, plant and equipment 10 42
Acquisition of subsidiaries and distribution rights, net of cash balance D1 (535) (405)
Sale of PruHealth and PruProtect businessesnote(iii) D1 152 –
Net cash fiows from
investing activities (545) (584)
Cash flows from financing activities
Structural borrowings of the Group:
Shareholder-financed operations:note(iv)
C6.1
Issue of subordinated debt, net of costs – 1,124
Redemption of
subordinated debt (445) –
Interest paid (330) (291)
With-profits operations:note(v) C6.2
Interest paid (9) (9)
Equity capital:
Issues of ordinary share capital 13 6
Dividends paid (895) (781)
Net cash fiows from financing activities (1,666) 49
Net (decrease) increase in cash and cash equivalents (383) 789
Cash and
cash equivalents at beginning of year 6,785 6,126
Effect of exchange rate changes on cash and cash equivalents 7 (130)
Cash and cash equivalents at end of year 6,409 6,785
Notes
(i) This measure is the formal profit before tax measure under IFRS but it is not the result attributable to shareholders.
(ii) Other non-cash items consist of the adjustment of non-cash items to profit before tax together with other net items, net purchases of treasury shares and other
net movements in equity.
(iii) In November 2014 PAC sold its 25 per cent equity stake in
the PruHealth and PruProtect businesses to Discovery Group Europe Limited resulting in a net cash
inflow of £152 million.
(iv) Structural borrowings of shareholder-financed operations exclude borrowings to support short-term fixed income securities programmes, non-recourse
borrowings of investment subsidiaries of shareholder-financed operations and other borrowings of shareholder-financed operations. Cash flows in respect
of these borrowings are included within cash flows from operating activities.
(v) Interest
paid on structural borrowings of with-profits operations relate solely to the £100 million 8.5 per cent undated subordinated guaranteed bonds, which
contribute to the solvency base of the Scottish Amicable Insurance Fund (SAIF), a ring-fenced sub-fund of the PAC with-profits fund. Cash flows in respect
of other borrowings of with-profits funds, which principally relate to consolidated investment funds, are included within cash flows from operating activities.
Financial statements Primary statements
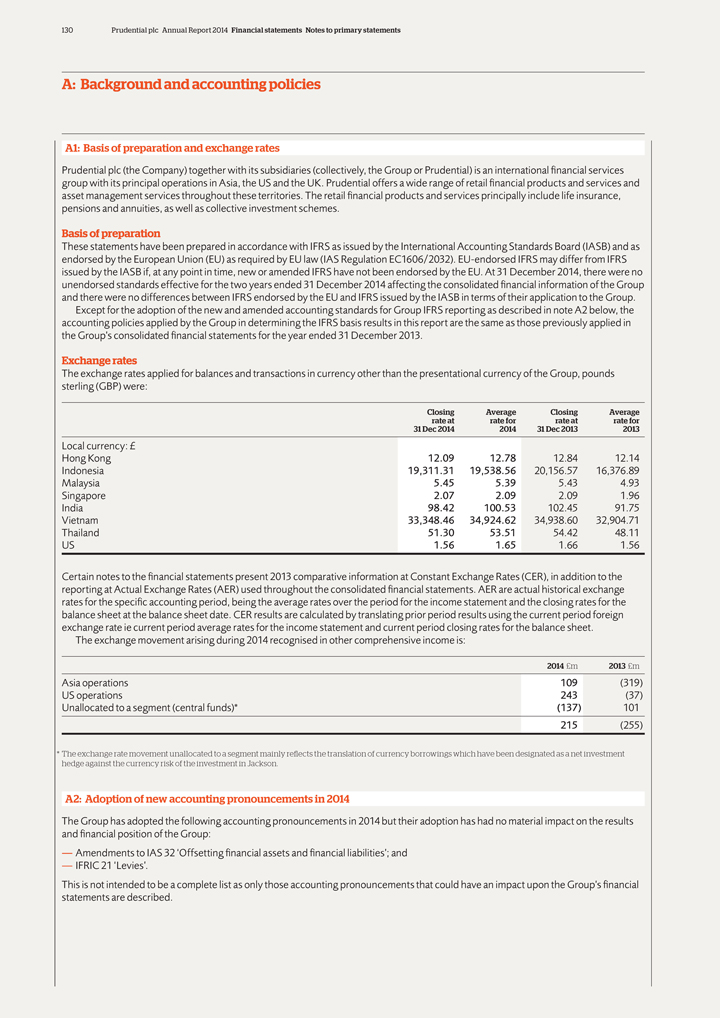
130 Prudential plc Annual Report 2014 Financial statements Notes to primary statements
A: Background and accounting policies
A1: Basis of preparation and exchange rates
Prudential plc (the Company) together with its subsidiaries (collectively, the Group or Prudential) is an international financial services group with its principal operations in
Asia, the US and the UK. Prudential offers a wide range of retail financial products and services and asset management services throughout these territories. The retail financial products and services principally include life insurance, pensions and
annuities, as well as collective investment schemes.
Basis of preparation
These statements have been prepared in accordance with IFRS as issued by the International Accounting Standards Board (IASB) and as endorsed by the European Union
(EU) as required by EU law (IAS Regulation EC1606/2032). EU-endorsed IFRS may differ from IFRS issued by the IASB if, at any point in time, new or amended IFRS have not been endorsed by the EU. At 31 December 2014, there were no unendorsed
standards effective for the two years ended 31 December 2014 affecting the consolidated financial information of the Group and there were no differences between IFRS endorsed by the EU and IFRS issued by the IASB in terms of their application
to the Group.
Except for the adoption of the new and amended accounting standards for Group IFRS reporting as described in note A2 below, the accounting policies
applied by the Group in determining the IFRS basis results in this report are the same as those previously applied in the Group’s consolidated financial statements for the year ended 31 December 2013.
Exchange rates
The exchange rates applied for balances and transactions in currency other than
the presentational currency of the Group, pounds sterling (GBP) were:
Closing Average Closing Average
rate at rate for rate at rate for
31 Dec 2014 2014 31 Dec 2013 2013
Local currency: £
Hong Kong 12.09 12.78 12.84 12.14
Indonesia 19,311.31 19,538.56 20,156.57 16,376.89
Malaysia 5.45 5.39 5.43 4.93
Singapore 2.07 2.09 2.09 1.96
India 98.42 100.53 102.45 91.75
Vietnam 33,348.46 34,924.62 34,938.60 32,904.71
Thailand 51.30 53.51 54.42 48.11
US 1.56 1.65 1.66 1.56
Certain notes to the financial statements present 2013 comparative
information at Constant Exchange Rates (CER), in addition to the reporting at Actual Exchange Rates (AER) used throughout the consolidated financial statements. AER are actual historical exchange rates for the specific accounting period, being the
average rates over the period for the income statement and the closing rates for the balance sheet at the balance sheet date. CER results are calculated by translating prior period results using the current period foreign exchange rate ie current
period average rates for the income statement and current period closing rates for the balance sheet.
The exchange movement arising during 2014 recognised in other
comprehensive income is:
2014 £m 2013 £m
Asia operations 109
(319)
US operations 243 (37)
Unallocated to a segment (central funds)*
(137) 101
215 (255)
* The exchange rate movement unallocated to a
segment mainly reflects the translation of currency borrowings which have been designated as a net investment hedge against the currency risk of the investment in Jackson.
A2: Adoption of new accounting pronouncements in 2014
The Group has adopted the following
accounting pronouncements in 2014 but their adoption has had no material impact on the results and financial position of the Group:
— Amendments to IAS 32
‘Offsetting financial assets and financial liabilities’; and
— IFRIC 21 ‘Levies’.
This is not intended to be a complete list as only those accounting pronouncements that could have an impact upon the Group’s financial statements are described.
Prudential plc Annual Report 2014 131
A3:
Accounting policies
A3.1 Accounting policies and use of estimates and judgements
This note provides detailed accounting policies adopted by the Group to prepare the consolidated financial statements.
These accounting policies are applied consistently for all years presented and normally are not subject to changes unless new accounting standards, interpretations or amendments
are introduced by the IASB.
a Critical accounting policies, accounting estimates and judgements
Prudential believes that its critical accounting policies are limited to those referenced in the table below:
Accounting
Critical accounting policies policy reference
Classification of insurance and investment contracts A3.1(c)
Measurement of policyholder
liabilities and unallocated surplus of with-profits fund A3.1(d)
Measurement and presentation of derivatives and debt securities of US insurance operations
A3.1(j)(v)
Presentation of results before tax A3.1(k)
Segmental analysis of
results and earnings distributable to shareholders A3.1(m)
The preparation of these financial statements requires Prudential to make estimates and judgements that
affect the reported amounts of assets, liabilities, revenues and expenses, and the related disclosure of contingent assets and liabilities. Prudential evaluates its estimates, including those related to long-term business provisioning and the fair
value of assets. The table below sets out items that require the Group to make critical estimates and judgements in applying the relevant accounting policy:
Accounting
Critical accounting estimates and assumptions policy reference
Classification of insurance and investment contracts A3.1(c)
Measurement of
policyholder liabilities A3.1(d)
Measurement of deferred acquisition costs A3.1(f)
Determination of fair value of financial investments A3.1(j)(ii)
Determining impairment
relating to financial assets A3.1(j)(iii)
b Basis of consolidation
The Group
consolidates those investees it is deemed to control. The Group has control over an investee if all three of the following are met: (1) it has power over an investee; (2) it is exposed to, or has rights to, variable returns from its
involvement with the investee; and (3) it has ability to use its power over the investee to affect its own returns.
i Subsidiaries
Subsidiaries are those investees which the Group controls. The vast majority of the Group’s subsidiaries are corporate entities where the Group holds the majority of voting
rights and are consolidated. The consolidation of other vehicles held by the Group is discussed below: The Group’s insurance operations invest in a number of limited partnerships, either directly or through unit trusts, through a mix of capital
and loans. These limited partnerships are managed by general partners, in which the Group holds equity. Such interest in general partners and limited partnerships provide the Group with voting and similar rights to participate in the governance
framework of the relevant activities in which limited partnerships are engaged in. Accounting for the limited partnerships as subsidiaries, joint ventures, associates or other financial investments depends on the terms of each partnership agreement
and the shareholdings in the general partners. In the context of direct investment in limited partnerships, the following circumstances may indicate a relationship in which, in substance, the Group controls and consequently consolidates a limited
partnership:
— The Group has existing rights that give it the current ability to direct the relevant activities of the limited partnership, ie activities that
significantly affect the generation of economic returns from the limited partnership’s operation;
— The Group has the power to obtain the significant
benefits of the activities of the limited partnerships. Generally, it is presumed that the Group has significant benefits if its participation in the limited partnership is greater than 20 per cent; and
— The Group’s current ability to join together with other partners to direct the activities of the partnership.
The Group performs a re-assessment of consolidation whenever there is a change in the substance of the relationship between the Group and a limited partnership. Where the Group is
deemed to control limited partnership, it is treated as a subsidiary and its results, assets and liabilities are consolidated. Where the Group holds a minority share in a limited partnership, with no control over their associated general partners,
the investments are carried at fair value through profit or loss within financial investments in the consolidated statement of financial position.
The limited
partnerships consolidated by the Group include Qualifying Partnerships as defined under the UK Partnerships (Accounts) Regulations 2008 (the ‘Partnerships Act’). Certain of these limited partnerships have taken advantage of the exemption
under regulation 7 of the Partnerships Act from the financial statements requirements under regulations 4 to 6, on the basis that these limited partnerships are dealt with on a consolidated basis in these financial statements.
The Group does not have subsidiaries with a material percentage of non-controlling interests.
Financial statements A: Background and accounting policies
132 Prudential plc Annual Report 2014 Financial statements Notes to primary statements
A: Background and accounting policies continued
A3: Accounting policies continued ii Joint
ventures and associates
Joint ventures are joint arrangements arising from a contractual agreement whereby the Group and other investors have joint control of the
net assets of the arrangement. In a number of these arrangements, the Group’s share of the underlying net assets may be less than 50 per cent but the terms of the relevant agreement make it clear that control is jointly exercised between
the Group and the third party. Associates are entities over which the Group has significant infiuence, but it does not control. Generally it is presumed that the Group has significant infiuence if it holds between 20 per cent and 50 per
cent voting rights of the entity.
With the exception of those referred to below, the Group accounts for its investments in joint ventures and associates by using
the equity method of accounting. The Group’s share of profit or loss of its joint ventures and associates is recognised in the income statement and its share of movements in other comprehensive income is recognised in other comprehensive
income. The equity method of accounting does not apply to investments in associates and joint ventures held by the Group’s insurance or investment funds including venture capital business or mutual funds or unit trusts, which as allowed by IAS
28 ‘Investments in Associates and Joint Ventures’, are carried at fair value through profit or loss.
iii Structured entities
Structured entities are those which have been designed so that voting or similar rights are not the dominant factor in deciding who controls the entity such as when any voting
rights relate to administrative tasks only and the relevant activities are directed by means of contractual arrangements. In addition to the entities discussed above in A3.1b(i), the Group, as part of its business strategy, invests in structured
entities such as Open-Ended Investment Companies (OEICs), Unit Trusts (UTs), variable interest entities, investment vehicles within separate accounts offered through variable annuities, collateral debt obligations, mortgage-backed securities, and
similar asset-backed securities.
Open-ended investment companies and unit trusts
The Group invests in OEICs and UTs, which invest mainly in equities, bonds, cash and cash equivalents, and properties. The Group’s percentage ownership in these entities can
fiuctuate on a daily basis according to the participation of the Group and other investors in them. For these entities, the following circumstances may indicate, in substance, the Group has power over an entity:
— The entity is managed by the Group’s asset manager and the Group holds a significant investment in the entity; and
— Where the entity is managed by asset managers outside the Group, Prudential has existing rights that gives it the ability to direct the current activities of the entity. In
assessing the Group’s ability to direct an entity, the Group considers its ability relative to other investors. The Group has a limited number of OEICs and UTs where it considers it has such ability.
For the entity managed by asset managers outside the Group with no current ability to direct its activities, the Group is deemed to have no power over such an entity.
For those entities managed by the Group’s asset managers, it is generally presumed that the Group is exposed to, or has rights, to variable returns from an entity and has
ability to use its power to affect its own returns where Group’s holding is greater than 50 per cent and is deemed to have no significant infiuence over an entity for participation less than 20 per cent. For holdings between
20 per cent and 50 per cent, the Group performs an assessment of power and associated control over an entity on a case by case basis. For these entities, the following circumstances may indicate that the Group controls an entity:
— The Group has power over the relevant activities of the entity; and
— The exposure, or rights, to variable returns (including administrative and performance fee earned by the Group’s asset manager) from the entity is
higher than the Group’s interest.
Where the Group is deemed to control these entities they are treated as a subsidiary and are consolidated, with the
interests of investors other than the Group being classified as liabilities and appear as net asset value attributable to unit holders of consolidated unit trusts and similar funds.
Where the Group does not control these entities (as it is deemed to be acting as an agent) and they do not meet the definition of associates, they are carried at fair value through
profit or loss within financial investments in the consolidated statement of financial position.
Where the Group’s asset manager set up the OEICs and UTs as
part of asset management operations, the Group’s interest is limited to the administration fees charged to manage the assets of such entities. With no participation in these entities, the Group does not retain risks associated with OEICs and
UTs.
The Group generates returns and retains the ownership risks in investment vehicles commensurate to its participation and does not have any further exposure to
the residual risks of the OEICs and UTs. For these OEICs and UTs, the Group is not deemed to control the entities but to be acting as an agent.
Jackson’s
separate account assets
Jackson offers variable contracts that invest contract holder’s premiums, at the contract holders’ direction, in investment
vehicles (‘Separate Accounts’) that invest in equity, fixed income, bonds and money market mutual funds. The contract holder retains the underlying returns and the ownership risks related to the separate accounts and its underlying
investments. The shareholder’s economic interest in separate accounts is limited to the administrative fees charged. The separate accounts are set up as separate regulated entities governed by a Board of Governors or trustees for which the
majority of the members are independent of Jackson or any affiliated entity. The independent members represent contract holders’ interest and are responsible for any decision making that impacts contract holders’ interest and governs the
operational activities of the entities’ advisers, including asset managers managing the investment vehicles. Accordingly, the Group does not control these vehicles. These investments are carried at fair value through profit or loss within
financial investments in the consolidated statement of financial position.
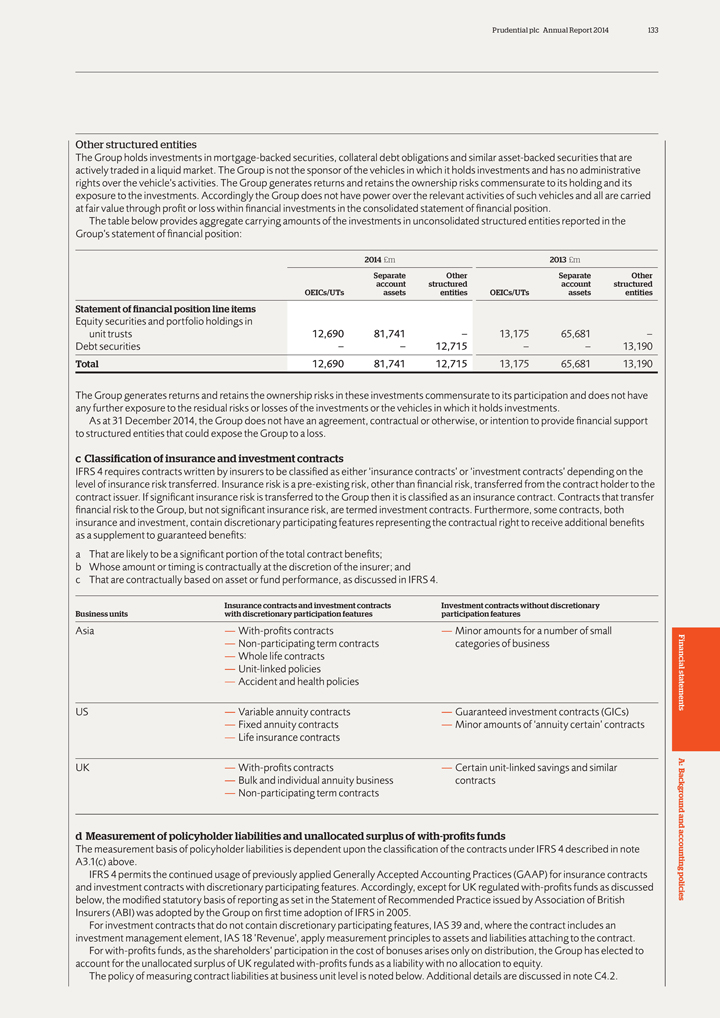
Prudential plc Annual Report 2014 133
Other
structured entities
The Group holds investments in mortgage-backed securities, collateral debt obligations and similar asset-backed securities that are actively
traded in a liquid market. The Group is not the sponsor of the vehicles in which it holds investments and has no administrative rights over the vehicle’s activities. The Group generates returns and retains the ownership risks commensurate to
its holding and its exposure to the investments. Accordingly the Group does not have power over the relevant activities of such vehicles and all are carried at fair value through profit or loss within financial investments in the consolidated
statement of financial position.
The table below provides aggregate carrying amounts of the investments in unconsolidated structured entities reported in the
Group’s statement of financial position:
2014 £m 2013 £m
Separate Other Separate Other
account structured account structured
OEICs/UTs assets entities OEICs/UTs assets entities
Statement of financial
position line items
Equity securities and portfolio holdings in
unit trusts
12,690 81,741 – 13,175 65,681 –
Debt securities – – 12,715 – – 13,190
Total 12,690 81,741 12,715 13,175 65,681 13,190
The Group generates returns and retains the
ownership risks in these investments commensurate to its participation and does not have any further exposure to the residual risks or losses of the investments or the vehicles in which it holds investments.
As at 31 December 2014, the Group does not have an agreement, contractual or otherwise, or intention to provide financial support to structured entities that could expose the
Group to a loss.
c Classification of insurance and investment contracts
IFRS
4 requires contracts written by insurers to be classified as either ‘insurance contracts’ or ‘investment contracts’ depending on the level of insurance risk transferred. Insurance risk is a pre-existing risk, other than financial
risk, transferred from the contract holder to the contract issuer. If significant insurance risk is transferred to the Group then it is classified as an insurance contract. Contracts that transfer financial risk to the Group, but not significant
insurance risk, are termed investment contracts. Furthermore, some contracts, both insurance and investment, contain discretionary participating features representing the contractual right to receive additional benefits as a supplement to guaranteed
benefits: a That are likely to be a significant portion of the total contract benefits; b Whose amount or timing is contractually at the discretion of the insurer; and c That are contractually based on asset or fund performance, as discussed in IFRS
4.
Insurance contracts and investment contracts Investment contracts without discretionary
Business units with discretionary participation features participation features
Asia —
With-profits contracts — Minor amounts for a number of small
— Non-participating term contracts categories of business
— Whole life contracts
— Unit-linked policies
— Accident and health policies
US — Variable annuity contracts — Guaranteed
investment contracts (GICs)
— Fixed annuity contracts — Minor amounts of ‘annuity certain’ contracts
— Life insurance contracts
UK — With-profits contracts — Certain unit-linked
savings and similar
— Bulk and individual annuity business contracts
— Non-participating term contracts
d Measurement of policyholder
liabilities and unallocated surplus of with-profits funds
The measurement basis of policyholder liabilities is dependent upon the classification of the contracts
under IFRS 4 described in note A3.1(c) above.
IFRS 4 permits the continued usage of previously applied Generally Accepted Accounting Practices (GAAP) for insurance
contracts and investment contracts with discretionary participating features. Accordingly, except for UK regulated with-profits funds as discussed below, the modified statutory basis of reporting as set in the Statement of Recommended Practice
issued by Association of British Insurers (ABI) was adopted by the Group on first time adoption of IFRS in 2005.
For investment contracts that do not contain
discretionary participating features, IAS 39 and, where the contract includes an investment management element, IAS 18 ’Revenue’, apply measurement principles to assets and liabilities attaching to the contract.
For with-profits funds, as the shareholders’ participation in the cost of bonuses arises only on distribution, the Group has elected to account for the unallocated surplus of
UK regulated with-profits funds as a liability with no allocation to equity.
The policy of measuring contract liabilities at business unit level is noted below.
Additional details are discussed in note C4.2.
Financial statements A: Background and accounting policies
134 Prudential plc Annual Report 2014 Financial statements Notes to primary statements
A: Background and accounting policies continued
A3: Accounting policies continued i Insurance
contracts
Asia insurance operations
The policyholder liabilities for
businesses in Asia are determined in accordance with methods prescribed by local GAAP adjusted to comply, where necessary, with the modified statutory basis. Refinements to the local reserving methodology are generally treated as changes in
estimates, dependent on their nature.
For the operations in India, Japan and Taiwan the local GAAP is not appropriate as a starting point in the context of the
modified statutory basis, and, instead, the accounting for insurance contracts is based on US GAAP. For these operations the business written is primarily non-participating linked and participating business. The future policyholder benefit
provisions for non-participating linked business are determined using the net level premium method, with an allowance for surrenders, maintenance and claim expenses. Rates of interest used in establishing the policyholder benefit provisions vary by
operation depending on the circumstances attaching to each block of business. Where appropriate, liabilities for participating business for these operations include provisions for the policyholders’ interest in investment gains and other
surpluses that have yet to be declared as bonuses.
While the basis of valuation of liabilities in this business is in accordance with the requirements of the ABI
SORP, it may differ from that determined on the modified statutory basis for UK operations with the same features.
US insurance operations
In accordance with the modified statutory basis, the policyholder liabilities for Jackson’s conventional protection-type policies are determined under US GAAP principles
with locked in assumptions for mortality, interest, policy lapses and expenses along with provisions for adverse deviations. For non-conventional protection-type policies, the policyholder liabilities includes the policyholder account balance.
Acquisition costs are accounted for as explained in note A3.1(f) below.
UK insurance operations
The UK regulated with-profits funds are accounted for by the voluntary application of the UK accounting standard FRS 27 ‘Life Assurance’ that requires liabilities to be
calculated as the realistic basis liabilities. The realistic basis liabilities are measured by reference to the PRA’s Peak 2 basis of reporting. This Peak 2 basis requires the value of liabilities to be calculated as:
— A with-profits benefits reserve; plus
— Future policy related liabilities; plus
— The realistic current liabilities of the fund.
The with-profits
benefits reserve is primarily based on the retrospective calculation of accumulated asset shares but is adjusted to refiect future policyholder benefits and other outgoings. Asset shares broadly refiect the policyholders’ share of the
with-profits fund assets attributable to their policies.
The future policy related liabilities must include a market consistent valuation of costs of guarantees,
options and smoothing, less any related charges, and this amount is determined using either a stochastic approach, hedging costs or a series of deterministic projections with attributed probabilities.
The Peak 2 basis realistic liabilities for with-profits business included in the PRA regulatory returns include the element for the shareholders’ share of the future cost of
bonuses consistent with the contract asset shares. For accounting purposes under FRS 27, this latter item is not shown as part of contract liabilities. This is because, consistent with the current basis of financial reporting, shareholder transfers
are recognised only on declaration. Instead the shareholders’ share of future costs of bonuses is included within the liabilities for unallocated surplus.
Other UK insurance contracts that contain significant insurance risk include unit-linked, annuity and other non-profit business. For the purposes of local
regulations, segregated accounts are established for linked business for which policyholder benefits are wholly or partly determined by reference to specific investments or to an investment-related index. The interest rates used in establishing
policyholder benefit provisions for pension annuities in the course of payment are adjusted each year. Mortality rates used in establishing policyholder benefits are based on published mortality tables adjusted to refiect actual experience.
ii Investment contracts with discretionary participation features
For
investment contracts with discretionary participation features, the accounting basis is consistent with the accounting for similar with-profits insurance contracts. Other investment contracts are accounted for on a basis that refiects the hybrid
nature of the arrangements, where part is accounted for as a financial instrument under IAS 39 and the investment management service component is accounted for under IAS 18.
For those investment contracts in the US with fixed and guaranteed terms, the Group uses the amortised cost model to measure the liability.
Those investment contracts without fixed and guaranteed terms are designated as fair value through profit or loss because the resulting liabilities are managed and their
performance is evaluated on a fair value basis. Where the contract includes a surrender option its carrying value is subject to a minimum carrying value equal to its surrender value.
iii Investment contracts without discretionary participation features
The measurement of
investment contracts without discretionary participation features is carried out in accordance with IAS 39 to refiect the deposit nature of the arrangement, with premiums and claims refiected as deposits and withdrawals and taken directly to the
statement of financial position as movements in the financial liability balance.
Prudential plc Annual Report 2014 135
Under IFRS,
investment contracts (excluding those with discretionary participation features) accounted for as financial liabilities in accordance with IAS 39 which also offer investment management services, require the application of IAS 18 for the revenue
attached to these services. Incremental, directly attributable acquisition costs relating to the investment management element of these contracts are capitalised and amortised in line with the related revenue. If the contracts involve up-front
charges, this income is also deferred and amortised through the income statement in line with contractual service provision.
iv Unallocated surplus of with-profits
funds
Unallocated surplus represents the excess of assets over policyholder liabilities for the Group’s with-profits funds that have yet to be appropriated
between policyholders and shareholders. As allowed under IFRS 4, the Group has opted to continue to record unallocated surplus of with-profits funds wholly as a liability with no allocation to equity. The annual excess (shortfall) of income over
expenditure of the with-profits funds, after declaration and attribution of the cost of bonuses to policyholders and shareholders, is transferred to (from) the unallocated surplus each year through a charge (credit) to the income statement. The
balance retained in the unallocated surplus represents cumulative income arising on the with-profits business that has not been allocated to policyholders or shareholders.
The balance of the unallocated surplus is determined after full provision for deferred tax on unrealised appreciation on investments.
e Reinsurance
The measurement of reinsurance assets is consistent with the measurement of the
underlying direct insurance contracts. The treatment of any gains or losses arising on the purchase of reinsurance contracts is dependent on the underlying accounting basis of the entity concerned.
f Deferred acquisition costs for insurance contracts
Except for acquisition costs of
with-profits contracts of the UK regulated with-profits funds, which are accounted for under the realistic PRA regime, costs of acquiring new insurance business are accounted for in a way that is consistent with the principles of the ABI SORP with
deferral and amortisation against margins in future revenues on the related insurance policies. Costs of acquiring new insurance business, principally commissions, marketing and advertising and certain other costs associated with policy insurance
and underwriting that are not reimbursed by policy charges, are specifically identified and capitalised as part of deferred acquisition costs. In general, this deferral is presentationally shown by an explicit carrying value in the balance sheet.
However, in some Asia operations the deferral is implicit through the reserving methodology. The recoverability of the explicitly and implicitly deferred acquisition costs is measured and are deemed impaired if the projected margins are less than
the carrying value. To the extent that the future margins differ from those anticipated, then an adjustment to the carrying value will be necessary.
The deferral
and amortisation of acquisition costs is of most relevance to the Group’s results for Asia and US insurance operations. The deferred acquisition costs for US and some Asia operations is determined with reference to US GAAP principles.
Asia insurance operations
For those territories applying US GAAP to
insurance assets and liabilities, as permitted by the ABI SORP, principles similar to those set out in the US insurance operations paragraph below are applied to the deferral and amortisation of acquisition costs. For other territories in Asia, the
general principles of the ABI SORP are applied with, as described above, deferral of acquisition costs being either explicit or implicit through the reserving basis.
US insurance operations
Under IFRS 4, the Group applies grandfathered
US GAAP for measuring the insurance assets and liabilities of US insurance operations. The Group adopted FAS ASU 2010-26 on ‘Accounting for Costs Associated with Acquiring or Renewing Insurance Contracts’ from
| 1 | January 2012 and capitalises only those incremental costs directly relating to successfully acquiring a contract. |
For term business, acquisition costs are deferred and amortised in line with expected premiums. For
annuity and interest-sensitive life business, acquisition costs are deferred and amortised in line with expected gross profits on the relevant contracts. For interest-sensitive business, the key assumption is the long-term spread between the earned
rate on investments and the rate credited to policyholders, which is based on an annual spread analysis. In addition, expected gross profits depend on mortality assumptions, assumed unit costs and terminations other than deaths (including the
related charges), all of which are based on a combination of Jackson’s actual industry experience and future expectations. A detailed analysis of actual mortality, lapse and expenses experience is performed using internally developed experience
studies.
For US variable annuity business, a key assumption is the investment return from the separate accounts, which is determined using a mean reversion
methodology. Under the mean reversion methodology, projected returns over the next five years are fiexed (subject to capping) so that, combined with the actual rates of return for the current and the previous two years is maintained. The projected
rates of return are capped at no more than 15 per cent for each of the next five years. These returns affect the level of future expected profits through their effects on the fee income with consequential impact on the amortisation of deferred
acquisition costs. The level of acquisition costs carried in the statement of financial position is also sensitive to unrealised valuation movements on debt securities held to back the liabilities and solvency capital. Further details are discussed
in note C5.1(b).
As permitted by IFRS 4, Jackson uses shadow accounting to make adjustments to the liabilities or related deferred acquisition costs which are
recognised directly in other comprehensive income. Jackson accounts for the majority of its investment portfolio on an available-for-sale basis whereby unrealised gains and losses are recognised in other comprehensive income. To the extent that
recognition of unrealised gains or losses on available-for-sale securities causes adjustments to the carrying value and amortisation patterns of deferred acquisition costs and deferred income, these adjustments are recognised in other comprehensive
income to be consistent with the treatment of the gains or losses on the securities. More precisely, shadow deferred acquisition costs adjustments refiect the change in deferred acquisition costs that would have arisen if the assets held in the
statement of financial position had been sold, crystallising unrealised gains or losses, and the proceeds reinvested at the yields currently available in the market.
Financial statements A: Background and accounting policies
136 Prudential plc Annual Report 2014 Financial statements Notes to primary statements
A: Background and accounting policies continued
A3: Accounting policies continued
UK insurance operations
For UK regulated with-profits funds where the realistic FSA regime is
applied, the basis of setting liabilities is such that it would be inappropriate for acquisition costs to be deferred, therefore these costs are expensed as incurred. The majority of the UK shareholder-backed business is individual and group annuity
business where the incidence of acquisition costs is negligible.
g Liability adequacy test
The Group performs adequacy testing on its insurance liabilities to ensure that the carrying amounts (net of related deferred acquisition costs) and, where relevant, present value
of acquired in-force business is sufficient to cover current estimates of future cash fiows. Any deficiency is immediately charged to the income statement.
h
Earned premiums, policy fees and claims paid
Premium and annuity considerations for conventional with-profits policies and other protection type insurance policies
are recognised as revenue when due. Premiums and annuity considerations for linked policies, unitised with-profits and other investment type policies are recognised as revenue when received or, in the case of unitised or unit-linked policies, when
units are issued. These amounts exclude premium taxes and similar duties where Prudential collects and settles taxes borne by the customer.
Policy fees charged on
linked and unitised with-profits policies for mortality, asset management and policy administration are recognised as revenue when related services are provided.
Claims paid include maturities, annuities, surrenders and deaths. Maturity claims are recorded as charges on the policy maturity date. Annuity claims are recorded
when each annuity instalment becomes due for payment. Surrenders are charged to the income statement when paid and death claims are recorded when notified.
i
Investment return
Investment return included in the income statement principally comprises interest income, dividends, investment appreciation/ depreciation
(realised and unrealised gains and losses) on investments designated as fair value through profit or loss, and realised gains and losses (including impairment losses) on Jackson’s debt securities designated as available-for-sale. Movements in
unrealised appreciation/depreciation of Jackson’s debt securities designated as available-for-sale are recorded in other comprehensive income. Interest income is recognised as it accrues, taking into account the effective yield on investments.
Dividends on equity securities are recognised on the ex-dividend date and rental income is recognised on an accrual basis.
j Financial investments other than
instruments classified as long-term business contracts i Investment classification
The Group holds financial investments in accordance with IAS 39, whereby subject
to specific criteria, financial instruments are required to be accounted for under one of the following categories:
— Financial assets and liabilities at fair
value through profit or loss – this comprises assets and liabilities designated by management as fair value through profit or loss on inception and derivatives that are held for trading. These investments are measured at fair value with all
changes thereon being recognised in investment return in the income statement;
— Financial investments on an available-for-sale basis – this comprises
assets that are designated by management as available-for-sale and/or do not fall into any of the other categories. These assets are initially recognised at fair value plus attributable transaction costs. For available-for-sale debt securities, the
difference between their cost and par value is amortised to the income statement using the effective interest rate. The effective interest rate is the rate that exactly discounts estimated future cash receipts through the expected life of the
financial instrument or, when appropriate, a shorter period to the net carrying amount of the financial asset;
— Available-for-sale assets are subsequently
measured at fair value. Interest income is recognised on an effective interest basis in the income statement. Except for foreign exchange gains and losses on debt securities, not in functional currency, which are included in the income statement,
unrealised gains and losses are recognised in other comprehensive income. Upon disposal or impairment, accumulated unrealised gains and losses are transferred from other comprehensive income to the income statement as realised gains or losses; and
— Loans and receivables – except for those designated as at fair value through profit or loss or available-for-sale, these instruments comprise
non-quoted investments that have fixed or determinable payments. These instruments include loans collateralised by mortgages, deposits, loans to policyholders and other unsecured loans and receivables. These investments are initially recognised at
fair value plus transaction costs. Subsequently, these instruments are carried at amortised cost using the effective interest method.
The Group uses the trade date
method to account for regular purchases and sales of financial assets.
ii Use of fair value
The Group uses current bid prices to value its investments with quoted prices. Actively traded investments without quoted prices are valued using prices provided by third parties
as described further in note C3.2. If there is no active established market for an investment, the Group applies an appropriate valuation technique such as a discounted cash fiow technique.
Determining the fair value of financial investments when the markets are not active
The Group
holds certain financial investments for which the markets are not active. These can include financial investments which are not quoted on active markets and financial investments for which markets are no longer active as a result of market
conditions eg market illiquidity. When the markets are not active, there is generally no or limited observable market data to account for financial investments at fair value. The determination of whether an active market exists for a financial
investment requires management’s judgement.
Prudential plc Annual Report 2014 137
If the
market for a financial investment of the Group is not active, the fair value is determined by using valuation techniques. The Group establishes fair value for these financial investments by using quotations from independent third parties, such as
brokers or pricing services, or by using internally developed pricing models. Priority is given to publicly available prices from independent sources when available, but overall the source of pricing and/or the valuation technique is chosen with the
objective of arriving at a fair value measurement which reflects the price at which an orderly transaction would take place between market participants on the measurement date. The valuation techniques include the use of recent arm’s length
transactions, reference to other instruments that are substantially the same, discounted cash flow analysis, option-adjusted spread models and, if applicable, enterprise valuation and may include a number of assumptions relating to variables such as
credit risk and interest rates. Changes in assumptions relating to these variables could positively or negatively impact the reported fair value of these financial investments.
Financial investments measured at fair value are classified into a three level hierarchy as described in note C3.2(b).
iii Determining impairments’ relation to financial assets
Available-for-sale securities
The majority of Jackson’s debt securities portfolio are accounted for on an available-for-sale basis. The consideration of evidence of impairment requires
management’s judgement. In making this determination the factors considered include, for example:
Determining factors Consideration of evidence of impairment
Whether the decline of the A substantial decline in fair value might be indicative of a credit loss event that would lead to a
financial investment’s fair value measurable decrease in the estimated future cash flows.
is substantial
The impact of the duration of The duration of a security to
maturity helps to inform whether assessments of estimated future cash
the security on the calculation of flows that are higher than market value are reasonable.
the revised estimated cash flows
The duration and extent to This factor
provides an indication of how the contractual cash flows and effective interest rate of
which the amortised cost a financial asset compares with the implicit
market estimate of cash flows and the risk attaching to
exceeds fair value a ‘fair value’ measurement. The length of time for which that level of
difference has been in place
may also provide further evidence as to whether the market assessment implies an impairment loss
has arisen.
The financial condition and These factors and other observable conditions may
indicate that an investment is impaired.
prospects of the issuer
If a loss
event that will have a detrimental effect on cash flows is identified, an impairment loss is recognised in the income statement. The loss recognised is determined as the difference between the book cost and the fair value of the relevant impaired
securities. This loss comprises the effect of the expected loss of contractual cash flows and any additional market-price-driven temporary reductions in values.
For Jackson’s residential mortgage-backed and other asset-backed securities, all of which are classified as available-for-sale, the model used to analyse cash
flows, begins with the current delinquency experience of the underlying collateral pool for the structure, by applying assumptions about how much of the currently delinquent loans will eventually default, and multiplying this by an assumed loss
severity. Additional factors are applied to anticipate ageing effects. After applying a cash flow simulation an indication is obtained as to whether or not the security has suffered, or is anticipated to suffer, contractual principal or interest
payment shortfalls. If a shortfall applies an impairment charge is recorded. The difference between the fair value and book cost for unimpaired securities designated as available-for-sale is accounted for as unrealised gains or losses, with the
movements in the accounting period being included in other comprehensive income.
The Group’s review of fair value involves several criteria, including
economic conditions, credit loss experience, other issuer-specific developments and future cash flows. These assessments are based on the best available information at the time. Factors such as market liquidity, the widening of bid/ask spreads and a
change in cash flow assumptions can contribute to future price volatility. If actual experience differs negatively from the assumptions and other considerations used in the consolidated financial statements, unrealised losses currently in equity may
be recognised in the income statement in future periods. Additional details on the impairments of the available-for-sale securities of Jackson are described in note C3.5(d).
Assets held at amortised cost
Financial assets classified as loans and receivables under IAS
39 are carried at amortised cost using the effective interest rate method. The loans and receivables include loans collateralised by mortgages, deposits and loans to policyholders. In estimating future cash flows, the Group looks at the expected
cash flows of the assets and applies historical loss experience of assets with similar credit risks that has been adjusted for conditions in the historical loss experience which no longer exist, or for conditions that are expected to arise. The
estimated future cash flows are discounted using the financial asset’s original or variable effective interest rate and exclude credit losses that have not yet been incurred.
The risks inherent in reviewing the impairment of any investment include: the risk that market results may differ from expectations; facts and circumstances may change in the
future and differ from estimates and assumptions; or the Group may later decide to sell the asset as a result of changed circumstances.
Financial statements A:
Background and accounting policies
138 Prudential plc Annual Report 2014 Financial statements Notes to primary statements
A: Background and accounting policies continued
A3: Accounting policies continued
Certain mortgage loans of the UK insurance operations and, consequent upon the purchase of REALIC in 2012 by Jackson, policy loans held to back funds withheld under reinsurance
arrangements have been designated at fair value through profit or loss, as these loan portfolios are managed and evaluated on a fair value basis.
Assets carried at
cost or amortised cost are subject to impairment testing where appropriate under IFRS requirements.
Reversal of impairment loss
If, in subsequent periods, an impaired debt security held on an available-for-sale basis or an impaired loan or receivable recovers in value (in part or in full), and this recovery
can be objectively related to an event occurring after the impairment, then the previously recognised impairment loss is reversed through the income statement (in part or in full).
iv Derivatives and hedge accounting
Derivative financial instruments are used to reduce or
manage investment, interest rate and currency exposures, to facilitate efficient portfolio management and for investment purposes.
The Group may designate certain
derivatives as hedges.
For hedges of net investments in foreign operations, the effective portion of any change in fair value of derivatives or other financial
instruments designated as net investment hedges is recognised in other comprehensive income. The ineffective portion of changes in the fair value of the hedging instrument is recorded in the income statement. The gain or loss on the hedging
instrument is recognised directly in other comprehensive income while the foreign operation is held.
For fair value hedges, movements in the fair value of the
hedged item attributable to the hedged risk are recognised in the income statement. The Group does not regularly seek to apply fair value or cash flow hedging treatment under IAS 39. The exceptions, where hedge accounting has been applied in 2014
and 2013, are summarised in note C3.5(b).
All derivatives that are not designated as hedging instruments are carried at fair value with movements in fair value
being recorded in the income statement.
The primary areas of the Group’s continuing operations where derivative instruments are held are the UK with-profits
funds and annuity business, and Jackson.
For UK with-profits funds the derivative programme derivatives are used for the purposes of efficient portfolio management
or reduction in investment risk.
For shareholder-backed UK annuity business the derivatives are held to contribute to the matching as far as practical, of asset
returns and duration with those of liabilities to policyholders. The carrying value of these liabilities is sensitive to the return on the matching financial assets including derivatives held.
For Jackson, an extensive derivative programme is maintained. Value movements on the derivatives held can be very significant in their effect on shareholder results. Further
details on this aspect of the Group’s financial reporting are described in note B1.2.
v Measurement and presentation of derivatives and debt securities of US
insurance operations
The policies for these items are significant factors in contributing to the volatility of the income statement result and shareholders’
equity. Under IAS 39, derivatives are required to be carried at fair value. Unless net investment hedge accounting is applied, value movements on derivatives are recognised in the income statement.
For derivative instruments of Jackson that are entered into to mitigate economic exposures, the Group has considered whether it is appropriate to undertake the necessary
operational changes to qualify for hedge accounting so as to achieve matching of value movements in hedging instruments and hedged items in the performance statements. In reaching the decision a number of factors were particularly relevant. These
were:
— IAS 39 hedging criteria have been designed primarily in the context of hedging and hedging instruments that are assessable as financial instruments
that are either stand-alone or separable from host contracts, rather than, for example, duration characteristics of insurance contracts;
— The high hurdle
levels under IAS 39 of ensuring hedge effectiveness at the level of individual hedge transactions;
— The difficulties in applying the macro hedge provisions
under IAS 39 (which are more suited to banking arrangements) to Jackson’s derivative book;
— The complexity of asset and liability matching of US life
insurers such as those with Jackson’s product range; and finally
— Whether it is possible or desirable, without an unacceptable level of costs and
constraint on commercial activity, to achieve the accounting hedge effectiveness required under IAS 39.
Taking account of these considerations, the Group has
decided that, except for occasional circumstances, it is not appropriate to seek to achieve hedge accounting under IAS 39. As a result of this decision, the total income statement results are more volatile as the movements in the value of
Jackson’s derivatives are reflected within it. This volatility is reflected in the level of short-term fluctuations in investment returns, as shown in notes B1.1 and B1.2.
Under IAS 39, unless carried at amortised cost (subject to impairment provisions where appropriate) under the held-to-maturity category, debt securities are also carried at fair
value. The Group has chosen not to classify any financial assets as held-to-maturity. Debt securities of Jackson are designated as available-for-sale with value movements, unless impaired, being recorded as movements within other comprehensive
income. Impairments are recorded in the income statement.
vi Embedded derivatives
Embedded derivatives are present in host contracts issued by various Group companies, in particular Jackson. They are embedded within other non-derivative host financial
instruments and insurance contracts to create hybrid instruments. Embedded derivatives meeting the definition of an insurance contract are accounted for under IFRS 4. Where economic characteristics and risks of the
Prudential plc Annual Report 2014 139
embedded
derivatives are not closely related to the economic characteristics and risks of the host instrument, and where the hybrid instrument is not measured at fair value with the changes in fair value recognised in the income statement, the embedded
derivative is bifurcated and carried at fair value as a derivative in accordance with IAS 39. For Jackson’s ‘not for life’ Guaranteed Minimum Withdrawal Benefit and Fixed Index Annuity reserves the determination of fair value requires
assumptions regarding future mix of Separate Account assets, equity volatility levels, and policyholder behaviour.
In addition, the Group applies the option under
IFRS 4 to not separate and fair value surrender options embedded in host contracts and with-profits investment contracts whose strike price is either a fixed amount or a fixed amount plus interest. Further details on the valuation basis for embedded
derivatives attaching to Jackson’s life assurance contracts are provided in note C4.2.
vii Securities lending including repurchase agreements
The Group is party to various securities lending agreements under which securities are loaned to third parties on a short-term basis. The loaned securities are not derecognised;
rather, they continue to be recognised within the appropriate investment classification. The Group’s policy is that collateral in excess of 100 per cent of the fair value of securities loaned is required from all securities’ borrowers
and typically consists of cash, debt securities, equity securities or letters of credit.
In cases where the Group takes possession of the collateral under its
securities lending programme, the collateral, and corresponding obligation to return such collateral, are recognised in the consolidated statement of financial position.
viii Derecognition of financial assets and liabilities
The Group’s policy is to
derecognise financial assets when it is deemed that substantially all the risks and rewards of ownership have been transferred.
The Group derecognises financial
liabilities only when the obligation specified in the contract is discharged, cancelled or has expired.
ix Financial liabilities designated at fair value through
profit or loss
Consistent with the Group’s risk management and investment strategy and the nature of the products concerned, the Group has designated under
IAS 39 classification certain financial liabilities at fair value through profit or loss as these instruments are managed and their performance evaluated on a fair value basis. These instruments include liabilities related to consolidated
collateralised debt obligations and net assets attributable to unit holders of consolidated unit trusts and similar funds.
k Presentation of results before tax
The total tax charge for the Group reflects tax that, in addition to relating to shareholders’ profits, is also attributable to policyholders and unallocated
surplus of with-profits funds and unit-linked policies. This is explained in more detail in note B5. Reported profit before the total tax charge is not representative of pre-tax profits attributable to shareholders. Accordingly, in order to provide
a measure of pre-tax profits attributable to shareholders the Group has chosen to adopt an income statement presentation of the tax charge and pre-tax results that distinguishes between policyholder and shareholder components.
l Segments
Under IFRS 8 ‘Operating Segments’, the Group determines and presents
operating segments based on the information that is internally provided to the Group Executive Committee which is the Group’s chief operating decision maker.
The operating segments identified by the Group reflect the Group’s organisational structure, which is by both geography (Asia, US and UK) and by product line
(insurance operations and asset management).
The products of the insurance operations contain both significant and insignificant levels of insurance risk. The
products are managed together and there is no distinction between these two categories other than for accounting purposes. This segment also includes the commission earned on general insurance business and investment subsidiaries held to support the
Group’s insurance operations.
Asset management comprises both internal and third-party asset management services, inclusive of portfolio and mutual fund
management, where the Group acts as an adviser, and broker-dealer activities. The nature of the products and the managing of the business differ from the risks inherent in the insurance operations segments, and the regulatory environment of the
asset management industry differs from that of the insurance operations segments.
Further information on the Group’s operating segments is provided in note
B1.3.
m Segmental analysis of results and earnings attributable to shareholders
The Group uses operating profit based on longer-term investment returns as the segmental measure of its results. The basis of calculation is disclosed in note
B1.3.
For shareholder-backed business, with the exception of debt securities held by Jackson and assets classified as loans and receivables at amortised cost, all
financial investments and investment property are designated as assets at fair value through profit or loss. The short-term fluctuations affect the result for the year and the Group provides additional analysis of results before and after short-term
fluctuations in investment returns, together with other items that are of a short-term, volatile or one-off nature. Short-term fluctuations in investment returns on such assets held by with-profits funds, do not affect directly reported shareholder
results. This is because (i) the unallocated surplus of with-profits funds is accounted for as a liability and (ii) excess or deficits of income and expenditure of the funds over the required surplus for distribution are transferred to or
from unallocated surplus.
n Borrowings
Although initially recognised at fair
value, net of transaction costs, borrowings, excluding liabilities of consolidated collateralised debt obligations, are subsequently accounted for on an amortised cost basis using the effective interest method. Under the effective interest method,
the difference between the redemption value of the borrowing and the initial proceeds (net of related issue costs) is amortised through the income statement to the date of maturity or for hybrid debt, over the expected life of the instrument.
Financial statements A: Background and accounting policies
140 Prudential plc Annual Report 2014 Financial statements Notes to primary statements
A: Background and accounting policies continued
A3: Accounting policies continued o Investment
properties
Investments in leasehold and freehold properties not for occupation by the Group, including properties under development for future use as investment
properties, are carried at fair value, with changes in fair value included in the income statement. Properties are valued annually either by the Group’s qualified surveyors or by taking into consideration the advice of professional external
valuers using the Royal Institution of Chartered Surveyors valuation standards. Each property is externally valued at least once every three years.
Leases of
investment property where the Group has substantially all the risks and rewards of ownership are classified as finance leases (leasehold property). Finance leases are capitalised at the lease’s inception at the lower of the fair value of the
leased property and the present value of the minimum lease payments.
p Pension schemes
For the Group’s defined benefit schemes, if the present value of the defined benefit obligation exceeds the fair value of the scheme assets, then a liability is recorded in
the Group’s statement of financial position. By contrast, if the fair value of the assets exceeds the present value of the defined benefit obligation then the surplus will only be recognised if the nature of the arrangements under the trust
deed, and funding arrangements between the Trustee and the Company, support the availability of refunds or recoverability through agreed reductions in future contributions. In addition, if there is a constructive obligation for the Company to pay
deficit funding, this is also recognised such that the financial position recorded for the scheme reflects the higher of any underlying IAS 19 deficit and the obligation for deficit funding.
The Group utilises the projected unit credit method to calculate the defined benefit obligation. This method sees each period of service as giving rise to an additional unit of
benefit entitlement and measures each unit separately to build up the final obligation. Estimated future cash flows are then discounted at a high-quality corporate bond rate, adjusted to allow for the difference in duration between the bond index
and the pension liabilities where appropriate, to determine its present value. These calculations are performed by independent actuaries.
The plan assets of the
Group’s pension schemes exclude several insurance contracts that have been issued by the Group. These assets are excluded from plan assets in determining the pension obligation recognised in the consolidated statement of financial position.
The aggregate of the actuarially determined service costs of the currently employed personnel and the net interest on the net defined benefit liability (asset) at
the start of the period, is charged to the income statement. Actuarial and other gains and losses as a result of changes in assumptions or experience variances are recognised as other comprehensive income.
Contributions to the Group’s defined contribution schemes are expensed when due.
q
Share-based payment and related movements in own shares
The Group offers share award and option plans for certain key employees and a Save As You Earn plan for all
UK and certain overseas employees. Shares held in trust relating to these plans are conditionally gifted to employees.
The compensation expense charged to the
income statement is primarily based upon the fair value of the options granted, the vesting period and the vesting conditions.
The Company has established trusts
to facilitate the delivery of Prudential plc shares under employee incentive plans and savings-related share option schemes. The cost to the Company of acquiring these treasury shares held in trusts is shown as a deduction from shareholders’
equity.
r Tax
Current tax expense is charged or credited based upon amounts
estimated to be payable or recoverable as a result of taxable amounts for the current year. To the extent that losses of an individual UK company are not offset in any one year, they can be carried back for one year or carried forward indefinitely
to be offset against profits arising from the same company.
Deferred taxes are provided under the liability method for all relevant temporary differences. IAS 12
‘Income Taxes’ does not require all temporary differences to be provided for, in particular, the Group does not provide for deferred tax on undistributed earnings of subsidiaries where the Group is able to control the timing of the
distribution and the temporary difference created is not expected to reverse in the foreseeable future. Deferred tax assets are only recognised when it is more likely than not that future taxable profits will be available against which these losses
can be utilised.
The tax charge for long-term business includes tax expense attributable to both policyholders and shareholders. In the UK, life insurance
companies are taxed on both their shareholders’ profits and on their policyholders’ insurance and investment returns on certain insurance and investment products. Tax on shareholders’ profits is calculated at the standard corporation
tax rate, and tax on policyholders’ investment returns is calculated at the basic rate of income tax. Although both types of tax are included in the total tax charge in the Group’s consolidated income statement, they are presented
separately in the income statement to provide the most relevant information about tax that the Group pays on its profits.
Deferred tax is measured at the tax rates
that are expected to apply to the period when the asset is realised or the liability settled, based on tax rates (and laws) that have been enacted or are substantively enacted at the end of the reporting period.
Prudential plc Annual Report 2014 141
s Business
acquisitions and disposals
Business acquisitions are accounted for by applying the purchase method of accounting, which adjusts the net assets of the acquired
company to fair value at the date of purchase. The excess of the acquisition consideration over the fair value of the assets and liabilities of the acquired entity is recorded as goodwill. Expenses related to acquiring new subsidiaries are expensed
in the period in which they are incurred. Income and expenses of acquired entities are included in the income statement from the date of acquisition.
Income and
expenses of entities sold during the period are included in the income statement up to the date of disposal. The gain or loss on disposal is calculated as the difference between sale proceeds net of selling costs, less the net assets of the entity
at the date of disposal adjusted for foreign exchange movements attaching to the sold entity that are required to be recycled to the income statement under IAS 21.
t Goodwill
Goodwill arising on acquisitions of subsidiaries and businesses is
capitalised and carried on the Group statement of financial position as an intangible asset at initial value less any accumulated impairment losses. Goodwill impairment testing is conducted annually and when there is an indication of impairment. For
the purposes of impairment testing, goodwill is allocated to cash generating units.
u Intangible assets
Intangible assets acquired on the purchase of a subsidiary or portfolio of contracts are measured at fair value on acquisition. Deferred acquisition costs are accounted for as
described in notes A3.1(d) and A3.1(f) above. Other intangible assets, such as distribution rights and software, are valued initially at the price paid to acquire them and are subsequently carried at cost less amortisation and any accumulated
impairment losses. Distribution rights relate to fees paid under bancassurance partnership arrangements for bank distribution of products for the term of the contract. Amounts for distribution rights are amortised on a basis to reflect the pattern
in which the future economic benefits are expected to be consumed by reference to new business levels. The same principles apply to determining the amortisation method for other intangible assets unless the pattern cannot be determined reliably, in
which case a straight line method is applied. Amortisation of intangible assets is charged to the ‘acquisition costs’ and other expenditure line in the income statement.
v Cash and cash equivalents
Cash and cash equivalents consist of cash at bank and in hand,
deposits held at call with banks, treasury bills and other short-term highly liquid investments with less than 90 day’s maturity from the date of acquisition.
w Shareholders’ dividends
Interim dividends are recorded in the period
in which they are paid. Final dividends are recorded in the period in which they are approved by shareholders.
x Share capital
Where there is no obligation to transfer assets, shares are classified as equity. The difference between the proceeds received on issue of the shares, net of share issue costs, and
the nominal value of the shares issued, is credited to share premium. Where the Company purchases shares for the purposes of employee incentive plans, the consideration paid, net of issue costs, is deducted from retained earnings. Upon issue or sale
any consideration received is credited to retained earnings net of related costs.
y Foreign exchange
The Group’s consolidated financial statements are presented in pounds sterling, the Group’s presentation currency. Accordingly, the results and financial position of
foreign subsidiaries must be translated into the presentation currency of the Group from their functional currencies, ie the currency of the primary economic environment in which the entity operates. All assets and liabilities of foreign
subsidiaries are converted at year end exchange rates while all income and expenses are converted at average exchange rates where this is a reasonable approximation of the rates prevailing on transaction dates. The impact of these currency
translations is recorded as a separate component in the statement of comprehensive income.
Foreign currency borrowings that are used to provide a hedge against
Group equity investments in overseas subsidiaries are translated at year end exchange rates and movements recognised in other comprehensive income. Other foreign currency monetary items are translated at year end exchange rates with changes
recognised in the income statement.
Foreign currency transactions are translated at the spot rate prevailing at the time.
z Earnings per share
Basic earnings per share is calculated by dividing the earnings
attributable to ordinary shareholders by the weighted average number of ordinary shares outstanding during the year, excluding those held in employee share trusts and consolidated unit trusts and OEICs, which are treated as cancelled.
For diluted earnings per share, the weighted average number of shares in issue is adjusted to assume conversion of all dilutive potential ordinary shares. The Group’s only
class of potentially dilutive ordinary shares are those share options granted to employees where the exercise price is less than the average market price of the Company’s ordinary shares during the year. No adjustment is made if the impact is
anti-dilutive overall.
Financial statements A: Background and accounting policies
142 Prudential plc Annual Report 2014 Financial statements Notes to primary statements
A: Background and accounting policies continued
A3: Accounting policies continued
A3.2 New accounting pronouncements not yet effective
The following standards, interpretations
and amendments have been issued but are not yet effective in 2014, including those which have not yet been adopted in the EU. This is not intended to be a complete list as only those standards, interpretations and amendments that could have an
impact upon the Group’s financial statements are discussed.
a Accounting pronouncements endorsed by the EU but not yet effective
Annual improvements to IFRS – 2010-2012 Cycle and 2011-2013 Cycle
These improvements
include minor changes to ten IFRS standards, and are effective for annual periods beginning on or after 1 July 2014. The amendment to IFRS 2 ‘Share-based Payment’ and IFRS 3 ‘Business Combinations’ included in Annual
improvements to IFRSs 2010-2012 cycle are applied to share-based payment transactions for which the grant date is on or after 1 July 2014 and to business combinations for which the date of acquisition is on or after 1 July 2014,
respectively. In these financial statements, the Group had no transactions on or after 1 July that were affected by these amendments. The Group is assessing the impact of the remaining amendments, but they are not expected to have a significant
impact on the Group’s financial statements.
b Accounting pronouncements not yet endorsed by the EU
Clarification of Acceptable Methods of Depreciation and Amortisation (Amendments to IAS 16 and IAS 38)
The amendments published in May 2014 provide additional guidance on how the depreciation or amortisation of property, plant and equipment and intangible assets should be
calculated. They are effective for annual periods beginning on or after 1 January 2016, with earlier application being permitted. The Group does not expect these amendments to have a significant impact on the Group’s financial statements.
IFRS 15 ‘Revenue from Contracts with Customers’
This standard
effective for annual periods beginning on or after 1 January 2017, provides a single framework to recognise revenue for contracts with different characteristics and overrides the framework provided for such contracts in other standards. The
following contracts are exempt from this standard:
— Lease contracts within IAS 17;
— Insurance contracts within IFRS 4;
— Financial instruments as covered within IAS
39, IFRS 9, 10 and 11; and
— IAS 27, IAS 28 and IAS 29.
The Group is
assessing the impact of this standard but it is not expected to have a significant impact on the Group’s financial statements.
IFRS 9 ‘Financial
Instruments: Classification and measurement’
In July 2014, the IASB published a complete version of IFRS 9 with the exception of macro hedge accounting. The
standard becomes mandatorily effective for the annual periods beginning on or after 1 January 2018, with early application permitted and transitional rules apply. This standard replaces the existing IAS 39 ’Financial Instruments:
Recognition and measurement’, and will affect:
— The classification and the measurement of financial assets and liabilities.
Under IFRS 9, financial assets are classified under one of the following categories: amortised cost, fair value through other comprehensive income (FVOCI) and fair value through
profit or loss (FVTPL) based on their contractual cash flow characteristics and/or the business model in which they are held. The existing amortised cost measurement for financial liabilities is largely maintained under IFRS 9, but for financial
liabilities designated at FVTPL, changes in fair value due to changes in entity’s own credit risk are to be recognised in other comprehensive income;
—
The calculation of the impairment charge relevant for financial assets held at amortised cost or FVOCI. A new impairment model based on an expected credit loss approach replaces the existing IAS 39 incurred loss impairment model; and
— The hedge accounting requirements which are more closely aligned with the risk management activities of the Company.
The Group is assessing the impact of this standard in conjunction with the requirements of the IASB’s proposals for insurance contracts accounting as they are developed to a
final standard. The adoption of the requirements of IFRS 9 may result in reclassification of certain of the Group’s financial assets and hence lead to a change in the measurement of these instruments or the performance reporting of value
movements. In addition, for the Group’s investments classified as FVOCI, as noted above, the impairment provisioning approach is altered. The Group does not currently apply hedge accounting for most of its derivative programmes but will
reconsider its approach in light of new requirements under the standard on adoption.
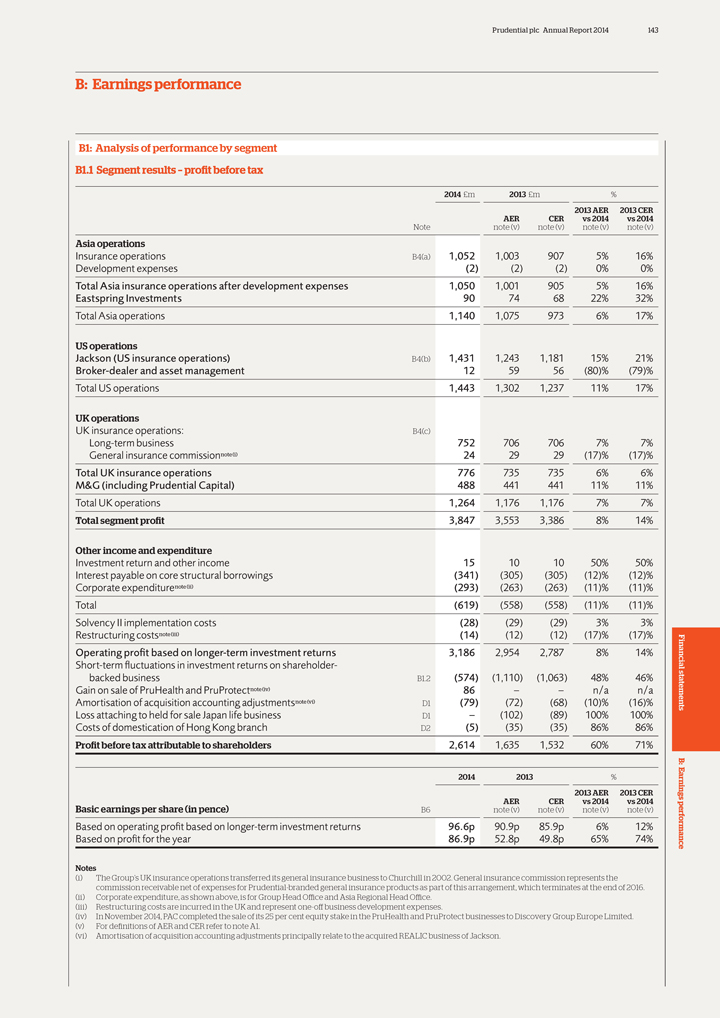
Prudential plc Annual Report 2014 143
B: Earnings
performance
B1: Analysis of performance by segment B1.1 Segment results – profit before tax
2014 £m 2013 £m %
2013 AER 2013 CER
AER CER vs 2014 vs 2014
Note note (v) note (v) note (v) note (v)
Asia operations
Insurance operations B4(a) 1,052 1,003 907 5% 16%
Development expenses (2) (2) (2) 0% 0%
Total Asia insurance operations after
development expenses 1,050 1,001 905 5% 16%
Eastspring Investments 90 74 68 22% 32%
Total Asia operations 1,140 1,075 973 6% 17%
US operations
Jackson (US insurance operations) B4(b) 1,431 1,243 1,181 15% 21%
Broker-dealer and asset
management 12 59 56 (80)% (79)%
Total US operations 1,443 1,302 1,237 11% 17%
UK operations
UK insurance operations: B4(c)
Long-term business 752 706 706 7% 7%
General insurance commissionnote(i) 24 29 29 (17)% (17)%
Total UK insurance operations 776 735 735 6% 6%
M&G (including Prudential
Capital) 488 441 441 11% 11%
Total UK operations 1,264 1,176 1,176 7% 7%
Total segment profit 3,847 3,553 3,386 8% 14%
Other income and expenditure
Investment return and other income 15 10 10 50% 50%
Interest payable on core
structural borrowings (341) (305) (305) (12)% (12)%
Corporate expenditurenote(ii) (293) (263) (263) (11)% (11)%
Total (619) (558) (558) (11)% (11)%
Solvency II implementation costs
(28) (29) (29) 3% 3%
Restructuring costsnote(iii) (14) (12) (12) (17)% (17)%
Operating profit based on longer-term investment returns 3,186 2,954 2,787 8% 14%
Short-term
fluctuations in investment returns on shareholder-
backed business B1.2 (574) (1,110) (1,063) 48% 46%
Gain on sale of PruHealth and PruProtectnote(iv) 86 – – n/a n/a
Amortisation of
acquisition accounting adjustmentsnote(vi) D1 (79) (72) (68) (10)% (16)%
Loss attaching to held for sale Japan life business D1 –
(102) (89) 100% 100%
Costs of domestication of Hong Kong branch D2 (5) (35) (35) 86% 86%
Profit before tax attributable to shareholders 2,614 1,635 1,532 60% 71%
2014 2013 %
2013 AER 2013 CER
AER CER vs 2014 vs 2014
Basic earnings per share (in pence) B6 note (v) note (v) note (v) note (v)
Based on operating profit based on longer-term investment returns 96.6p 90.9p 85.9p 6% 12%
Based on profit for the year 86.9p 52.8p 49.8p 65% 74%
Notes
(i) The Group’s UK insurance operations transferred its general insurance business to Churchill in 2002. General insurance commission represents the commission receivable net
of expenses for Prudential-branded general insurance products as part of this arrangement, which terminates at the end of 2016. (ii) Corporate expenditure, as shown above, is for Group Head Office and Asia Regional Head Office.
(iii) Restructuring costs are incurred in the UK and represent one-off business development expenses.
(iv) In November 2014, PAC completed the sale of its 25 per cent equity stake in the PruHealth and PruProtect businesses to Discovery Group Europe Limited. (v) For
definitions of AER and CER refer to note A1.
(vi) Amortisation of acquisition accounting adjustments principally relate to the acquired REALIC business of Jackson.
Financial statements B: Earnings performance
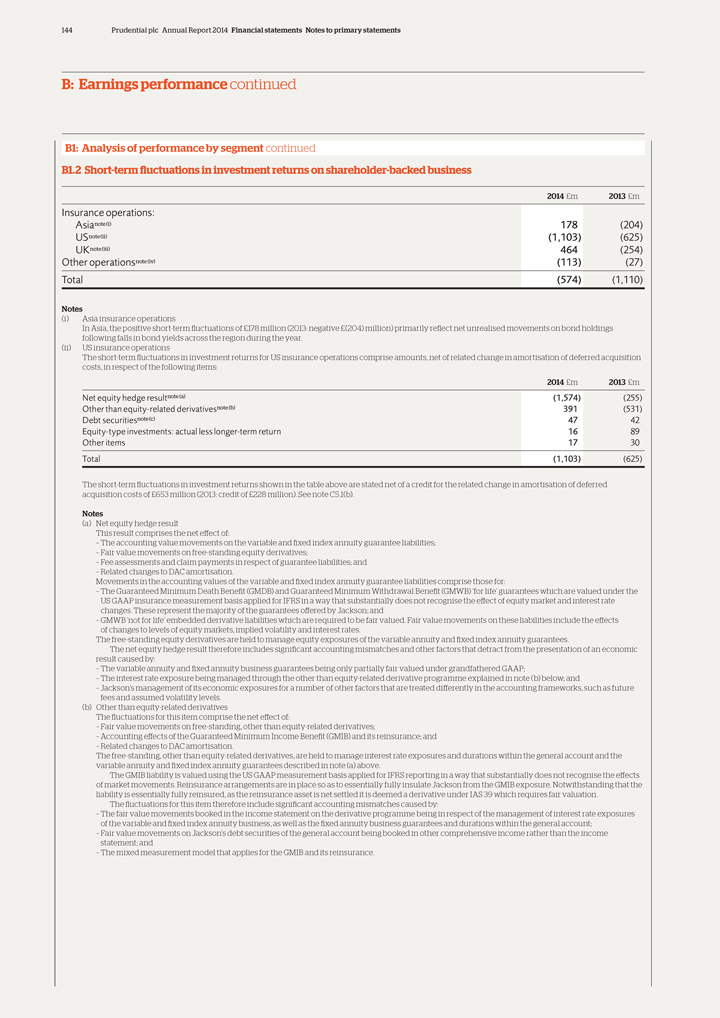
144 Prudential plc Annual Report 2014 Financial statements Notes to primary statements
B: Earnings performance continued
B1: Analysis of performance by segment continued
B1.2 Short-term fluctuations in investment returns on shareholder-backed business
2014
£m 2013 £m
Insurance operations:
Asianote(i) 178 (204)
USnote(ii) (1,103) (625)
UKnote(iii) 464 (254)
Other operationsnote(iv) (113) (27)
Total (574) (1,110)
Notes
(i) Asia insurance operations
In Asia, the positive short-term fluctuations of £178 million (2013: negative £(204) million) primarily reflect net unrealised movements on bond holdings
following falls in bond yields across the region during the year.
(ii) US insurance operations
The short-term fluctuations in investment returns for US insurance operations comprise amounts, net of related change in amortisation of deferred acquisition costs, in respect of
the following items:
Net equity hedge resultnote(a) (1,574) (255)
Other
than equity-related derivativesnote(b) 391 (531)
Debt securitiesnote(c) 47 42
Equity-type investments: actual less longer-term return 16 89
Other items 17
30
Total (1,103) (625)
The short-term fluctuations in investment returns
shown in the table above are stated net of a credit for the related change in amortisation of deferred acquisition costs of £653 million (2013: credit of £228 million). See note C5.1(b).
Notes
(a) Net equity hedge result
This result comprises the net effect of:
– The accounting value movements on the variable
and fixed index annuity guarantee liabilities;
– Fair value movements on free-standing equity derivatives;
– Fee assessments and claim payments in respect of guarantee liabilities; and
–
Related changes to DAC amortisation.
Movements in the accounting values of the variable and fixed index annuity guarantee liabilities comprise those for:
– The Guaranteed Minimum Death Benefit (GMDB) and Guaranteed Minimum Withdrawal Benefit (GMWB) ‘for life’ guarantees which are valued under the
US GAAP insurance measurement basis applied for IFRS in a way that substantially does not recognise the effect of equity market and interest rate changes. These represent the majority of the guarantees offered by Jackson; and
– GMWB ‘not for life’ embedded derivative liabilities which are required to be fair valued. Fair value movements on these liabilities include the effects of changes
to levels of equity markets, implied volatility and interest rates.
The free-standing equity derivatives are held to manage equity exposures of the variable
annuity and fixed index annuity guarantees.
The net equity hedge result therefore includes significant accounting mismatches and other factors that detract from
the presentation of an economic result caused by:
– The variable annuity and fixed annuity business guarantees being only partially fair valued under
grandfathered GAAP;
– The interest rate exposure being managed through the other than equity-related derivative programme explained in note (b) below;
and
– Jackson’s management of its economic exposures for a number of other factors that are treated differently in the accounting frameworks, such as
future fees and assumed volatility levels.
(b) Other than equity-related derivatives
The fluctuations for this item comprise the net effect of:
– Fair value movements on
free-standing, other than equity-related derivatives;
– Accounting effects of the Guaranteed Minimum Income Benefit (GMIB) and its reinsurance; and
– Related changes to DAC amortisation.
The free-standing, other than
equity-related derivatives, are held to manage interest rate exposures and durations within the general account and the variable annuity and fixed index annuity guarantees described in note (a) above.
The GMIB liability is valued using the US GAAP measurement basis applied for IFRS reporting in a way that substantially does not recognise the effects of market movements.
Reinsurance arrangements are in place so as to essentially fully insulate Jackson from the GMIB exposure. Notwithstanding that the liability is essentially fully reinsured, as the reinsurance asset is net settled it is deemed a derivative under IAS
39 which requires fair valuation.
The fluctuations for this item therefore include significant accounting mismatches caused by:
– The fair value movements booked in the income statement on the derivative programme being in respect of the management of interest rate exposures of the variable and fixed
index annuity business, as well as the fixed annuity business guarantees and durations within the general account;
– Fair value movements on Jackson’s
debt securities of the general account being booked in other comprehensive income rather than the income statement; and
– The mixed measurement model that
applies for the GMIB and its reinsurance.
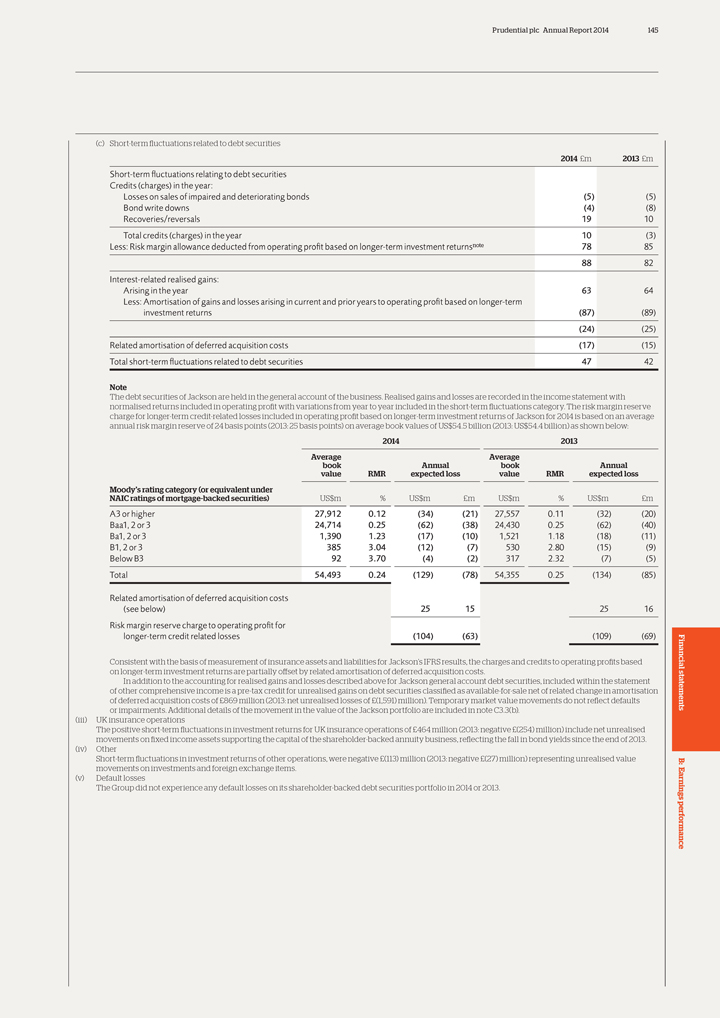
Prudential plc Annual Report 2014 145
(c)
Short-term fluctuations related to debt securities
2014 £m 2013 £m
Short-term fluctuations relating to debt securities
Credits (charges) in the
year:
Losses on sales of impaired and deteriorating bonds (5) (5)
Bond
write downs (4) (8)
Recoveries/reversals 19 10
Total credits (charges)
in the year 10 (3)
Less: Risk margin allowance deducted from operating profit based on longer-term investment returnsnote 78 85
88 82
Interest-related realised gains:
Arising in the year 63 64
Less: Amortisation of gains and losses arising in current and prior
years to operating profit based on longer-term
investment returns (87) (89)
(24) (25)
Related amortisation of deferred acquisition costs (17) (15)
Total short-term fluctuations related to debt securities 47 42
Note
The debt securities of Jackson are held in the general account of the business. Realised gains and losses are recorded in the income statement with normalised returns included in
operating profit with variations from year to year included in the short-term fluctuations category. The risk margin reserve charge for longer-term credit-related losses included in operating profit based on longer-term investment returns of Jackson
for 2014 is based on an average annual risk margin reserve of 24 basis points (2013: 25 basis points) on average book values of US$54.5 billion (2013: US$54.4 billion) as shown below:
2014 2013
Average Average
book Annual book Annual
value RMR expected loss value RMR expected loss
Moody’s rating category (or equivalent under
NAIC ratings of mortgage-backed securities)
US$m % US$m £m US$m % US$m £m
A3 or higher 27,912 0.12 (34) (21) 27,557 0.11 (32) (20)
Baa1, 2 or 3 24,714 0.25 (62) (38) 24,430 0.25 (62) (40)
Ba1, 2 or 3 1,390 1.23
(17) (10) 1,521 1.18 (18) (11)
B1, 2 or 3 385 3.04 (12) (7) 530 2.80 (15) (9)
Below B3 92 3.70 (4) (2) 317 2.32 (7) (5)
Total 54,493 0.24
(129) (78) 54,355 0.25 (134) (85)
Related amortisation of deferred acquisition costs
(see below) 25 15 25 16
Risk margin reserve charge to operating profit for
longer-term credit related losses (104) (63) (109) (69)
Consistent with the
basis of measurement of insurance assets and liabilities for Jackson’s IFRS results, the charges and credits to operating profits based on longer-term investment returns are partially offset by related amortisation of deferred acquisition
costs.
In addition to the accounting for realised gains and losses described above for Jackson general account debt securities, included within the statement of
other comprehensive income is a pre-tax credit for unrealised gains on debt securities classified as available-for-sale net of related change in amortisation of deferred acquisition costs of £869 million (2013: net unrealised losses of
£(1,591) million). Temporary market value movements do not reflect defaults or impairments. Additional details of the movement in the value of the Jackson portfolio are included in note C3.3(b).
(iii) UK insurance operations
The positive short-term fluctuations in investment returns for
UK insurance operations of £464 million (2013: negative £(254) million) include net unrealised movements on fixed income assets supporting the capital of the shareholder-backed annuity business, reflecting the fall in bond
yields since the end of 2013. (iv) Other Short-term fluctuations in investment returns of other operations, were negative £(113) million (2013: negative £(27) million) representing unrealised value movements on investments
and foreign exchange items.
(v) Default losses
The Group did not experience
any default losses on its shareholder-backed debt securities portfolio in 2014 or 2013.
Financial statements B: Earnings performance
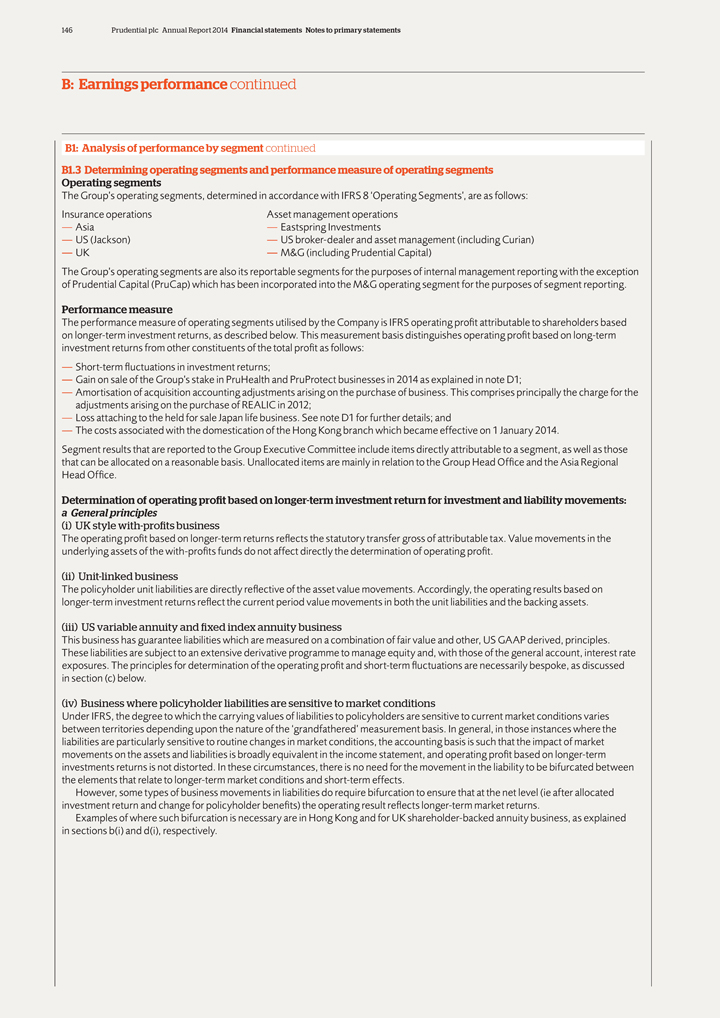
146 Prudential plc Annual Report 2014 Financial statements Notes to primary statements
B: Earnings performance continued
B1: Analysis of performance by segment continued
B1.3 Determining operating segments and performance measure of operating segments Operating segments
The Group’s operating segments, determined in accordance with IFRS 8 ‘Operating Segments’, are as follows: Insurance operations Asset management operations
— Asia — Eastspring Investments
— US (Jackson) — US
broker-dealer and asset management (including Curian)
— UK — M&G (including Prudential Capital)
The Group’s operating segments are also its reportable segments for the purposes of internal management reporting with the exception of Prudential Capital (PruCap) which has
been incorporated into the M&G operating segment for the purposes of segment reporting.
Performance measure
The performance measure of operating segments utilised by the Company is IFRS operating profit attributable to shareholders based on longer-term investment returns, as described
below. This measurement basis distinguishes operating profit based on long-term investment returns from other constituents of the total profit as follows:
—
Short-term fluctuations in investment returns;
— Gain on sale of the Group’s stake in PruHealth and PruProtect businesses in 2014 as explained in note
D1;
— Amortisation of acquisition accounting adjustments arising on the purchase of business. This comprises principally the charge for the adjustments
arising on the purchase of REALIC in 2012;
— Loss attaching to the held for sale Japan life business. See note D1 for further details; and
— The costs associated with the domestication of the Hong Kong branch which became effective on 1 January 2014.
Segment results that are reported to the Group Executive Committee include items directly attributable to a segment, as well as those that can be allocated on a reasonable basis.
Unallocated items are mainly in relation to the Group Head Office and the Asia Regional Head Office.
Determination of operating profit based on longer-term
investment return for investment and liability movements: a General principles
(i) UK style with-profits business
The operating profit based on longer-term returns reflects the statutory transfer gross of attributable tax. Value movements in the underlying assets of the with-profits funds do
not affect directly the determination of operating profit.
(ii) Unit-linked business
The policyholder unit liabilities are directly reflective of the asset value movements. Accordingly, the operating results based on longer-term investment returns reflect the
current period value movements in both the unit liabilities and the backing assets.
(iii) US variable annuity and fixed index annuity business
This business has guarantee liabilities which are measured on a combination of fair value and other, US GAAP derived, principles. These liabilities are subject to an extensive
derivative programme to manage equity and, with those of the general account, interest rate exposures. The principles for determination of the operating profit and short-term fluctuations are necessarily bespoke, as discussed in section
(c) below.
(iv) Business where policyholder liabilities are sensitive to market conditions
Under IFRS, the degree to which the carrying values of liabilities to policyholders are sensitive to current market conditions varies between territories depending upon the nature
of the ‘grandfathered’ measurement basis. In general, in those instances where the liabilities are particularly sensitive to routine changes in market conditions, the accounting basis is such that the impact of market movements on the
assets and liabilities is broadly equivalent in the income statement, and operating profit based on longer-term investments returns is not distorted. In these circumstances, there is no need for the movement in the liability to be bifurcated between
the elements that relate to longer-term market conditions and short-term effects.
However, some types of business movements in liabilities do require bifurcation
to ensure that at the net level (ie after allocated investment return and change for policyholder benefits) the operating result reflects longer-term market returns.
Examples of where such bifurcation is necessary are in Hong Kong and for UK shareholder-backed annuity business, as explained in sections b(i) and d(i),
respectively.
Prudential plc Annual Report 2014 147
(v) Other
shareholder-financed business
The measurement of operating profit based on longer-term investment returns reflects the particular features of long-term insurance
business where assets and liabilities are held for the long-term and for which the accounting basis for insurance liabilities under current IFRS is not generally conducive to demonstrating trends in underlying performance of life businesses
exclusive of the effects of short-term fluctuations in market conditions. In determining the profit on this basis, the following key elements are applied to the results of the Group’s shareholder-financed operations.
Except in the case of assets backing liabilities which are directly matched (such as linked business) or closely correlated with value movements (as discussed below) operating
profit based on longer-term investment returns for shareholder-financed business is determined on the basis of expected longer-term investment returns.
Debt,
equity-type securities and loans
Longer-term investment returns comprise actual income receivable for the period (interest/dividend income) and for both debt and
equity-type securities longer-term capital returns.
In principle, for debt securities and loans, the longer-term capital returns comprise two elements:
— Risk margin reserve based charge for the expected level of defaults for the period, which is determined by reference to the credit quality of the portfolio. The difference
between impairment losses in the reporting period and the risk margin reserve charge to the operating result is reflected in short-term fluctuations in investment returns; and
— The amortisation of interest-related realised gains and losses to operating results based on longer-term investment returns to the date when sold bonds would have otherwise
matured.
At 31 December 2014, the level of unamortised interest-related realised gains and losses related to previously sold bonds for the Group was a net
gain of £467 million (2013: £461 million).
Equity type securities
For equity-type securities, the longer-term rates of return are estimates of the long-term trend investment returns for income and capital having regard to past performance,
current trends and future expectations. Equity-type securities held for shareholder-financed operations other than the UK annuity business, unit-linked and US variable annuity are of significance for the US and Asia insurance operations. Different
rates apply to different categories of equity-type securities.
Derivative value movements
Generally, derivative value movements are excluded from operating results based on longer-term investment returns (unless those derivative value movements broadly offset changes in
the accounting value of other assets and liabilities included in operating profit). The principal example of non-equity based derivatives (for example interest rate swaps and swaptions) whose value movements are excluded from operating profit arises
in Jackson, as discussed below in section (c).
b Asia insurance operations
(i) Business where policyholder liabilities are sensitive to market conditions
For certain Asia non-participating business, for example in Hong Kong, the economic features are more akin to asset management products with policyholder
liabilities reflecting asset shares over the contract term. For these products, the charge for policyholder benefits in the operating results should reflect the asset share feature, rather than volatile movements that would otherwise be reflected if
the local regulatory basis (also applied for IFRS basis) was used.
For certain other types of non-participating business, longer-term interest rates are used to
determine the movement in policyholder liabilities for determining operating results.
(ii) Other Asia shareholder-financed business
Debt securities
For this business the realised gains and losses are principally interest
related. Accordingly, all realised gains and losses to date for these operations are being amortised over the period to the date those securities would otherwise have matured, with no explicit risk margin reserve charge.
Financial statements B: Earnings performance
148 Prudential plc Annual Report 2014 Financial statements Notes to primary statements
B: Earnings performance continued
B1: Analysis of performance by segment continued
Equity-type securities
For Asia insurance operations, excluding assets of the Japan life held
for sale business, investments in equity securities held for non-linked shareholder-financed operations amounted to £932 million as at 31 December 2014 (2013: £571 million). The rates of return applied in the years 2014 and
2013 ranged from 2.73 per cent to 13.75 per cent with the rates applied varying by territory. These rates are determined after consideration by the Group’s in-house economists of long-term expected real government bond returns, equity
risk premium and long-term inflation. These rates are broadly stable from period to period but may be different between countries reflecting, for example, differing expectations of inflation in each territory. The assumptions are for returns
expected to apply in equilibrium conditions. The assumed rates of return do not reflect any cyclical variability in economic performance and are not set by reference to prevailing asset valuations.
The longer-term investment returns for the Asia insurance joint ventures accounted for using the equity method are determined on a similar basis as the other Asia insurance
operations described above.
c US Insurance operations
(i) Separate account
business
For such business, the policyholder unit liabilities are directly reflective of the asset value movements. Accordingly, the operating results based on
longer-term investment returns reflect the current period value movements in unit liabilities and the backing assets.
(ii) US variable and fixed index annuity
business
The following value movements for Jackson’s variable and fixed index annuity business are excluded from operating profit based on longer-term
investment returns. See note B1.2 note (ii):
— Fair value movements for equity-based derivatives;
— Fair value movements for embedded derivatives for Guaranteed Minimum Withdrawal Benefit ‘not for life’ and fixed index annuity business, and Guaranteed Minimum
Income Benefit reinsurance (see below);
— Movements in accounts carrying value of Guaranteed Minimum Death Benefit and Guaranteed Minimum Withdrawal Benefit
‘for life’ and Guaranteed Minimum Income Benefit liabilities, for which, under the ‘grandfathered’ US GAAP applied under IFRS for Jackson’s insurance assets and liabilities, the measurement basis gives rise to a muted
impact of current period market movements;
— Fee assessments and claim payments, in respect of guarantee liabilities; and
— Related amortisation of deferred acquisition costs for each of the above items.
Embedded derivatives for variable annuity guarantee features
The Guaranteed
Minimum Income Benefit liability, which is essentially fully reinsured, subject to a deductible and annual claims limit, is accounted for in accordance with Financial Accounting Standards Board (FASB) Accounting Standards Codification (ASC) Subtopic
944-80 Financial Services – Insurance – Separate Accounts (formerly SOP 03-1) under IFRS using ‘grandfathered’ US GAAP. As the corresponding reinsurance asset is net settled, it is considered to be a derivative under IAS 39
‘Financial Instruments: Recognition and measurement’, and the asset is therefore recognised at fair value. As the Guaranteed Minimum Income Benefit is economically reinsured the mark to market element of the reinsurance asset is included
as a component of short-term fluctuations in investment returns.
(iii) Other derivative value movements
The principal example of non-equity based derivatives (for example interest rate swaps and swaptions) whose value movements are excluded from operating profit arises in Jackson.
Non-equity based derivatives are primarily held by Jackson as part of a broadly-based hedging programme for features of Jackson’s bond portfolio (for which value movements are booked in the statement of comprehensive income rather than the
income statement), product liabilities (for which US GAAP accounting as ‘grandfathered’ under IFRS 4 does not fully reflect the economic features being hedged), and the interest rate exposure attaching to equity-based embedded
derivatives.
(iv) Other US shareholder-financed business
Debt securities
Jackson is the shareholder-backed operation for which the distinction between impairment losses and interest-related realised gains and losses is in practice
relevant to a significant extent. Jackson has used the ratings by Nationally Recognised Statistical Ratings Organisations (NRSRO) or ratings resulting from the regulatory ratings detail issued by the National Association of Insurance Commissioners
(NAIC) developed by external third parties such as PIMCO or BlackRock Solutions to determine the average annual risk margin reserve to apply to debt securities held to back general account business. Debt securities held to back separate account and
reinsurance funds withheld are not subject to risk margin reserve charge. Further details of the risk margin reserve charge, as well as the amortisation of interest-related realised gains and losses, for Jackson are shown in note B1.2.
Prudential plc Annual Report 2014 149
Equity-type
securities
As at 31 December 2014, the equity-type securities for US insurance non-separate account operations amounted to £1,094 million (2013:
£1,118 million). For these operations, the longer-term rates of return for income and capital applied in 2014 and 2013, which reflect the combination of the average risk free rates over the period and appropriate risk premiums are as follows:
2014 2013
Equity-type securities such as common and preferred stock and
portfolio holdings in mutual funds 6.2% to 6.7% 5.7% to 6.8% Other equity-type securities such as investments in limited partnerships and private equity funds 8.2% to 8.7% 7.7% to 9.0%
d UK Insurance operations
(i) Shareholder-backed annuity business
For this business, policyholder liabilities are determined by reference to current interest rates. The value movements of the assets covering liabilities are closely correlated
with the related change in liabilities. Accordingly, asset value movements are recorded within the operating results based on longer-term investment returns. Policyholder liabilities include a margin for credit risk. Variations between actual and
best estimate expected impairments are recorded as a component of short-term fluctuations in investment returns.
The operating results based on longer-term
investment returns reflects the impact of value movements on policyholder liabilities for annuity business in PRIL and the PAC non-profit sub-fund after adjustments to allocate the following elements of the movement to the category of short-term
fluctuations in investment returns:
— The impact on credit risk provisioning of actual upgrades and downgrades during the period;
— Credit experience compared to assumptions; and
— Short-term value movements on
assets backing the capital of the business.
Credit experience reflects the impact of defaults and other similar experience, such as asset exchanges arising from
debt restructuring by issuers that include effectively an element of permanent impairment of the security held. Positive or negative experience compared to assumptions is included within short-term fluctuations in investment returns without further
adjustment. The effects of other changes to credit risk provisioning are included in the operating result, as is the net effect of changes to the valuation rate of interest due to portfolio rebalancing to align more closely with management
benchmark.
(ii) Non-linked shareholder-financed business
For debt securities
backing non-linked shareholder-financed business of the UK insurance operations (other than the annuity business) the realised gains and losses are principally interest related. Accordingly, all realised gains and losses to date for these operations
are being amortised over the period to the date those securities would otherwise have matured, with no explicit risk margin reserve charge.
e Fund management and
other non-insurance businesses
For these businesses, the particular features applicable for life assurance noted above do not apply. For these businesses it is
inappropriate to include returns in the operating result on the basis described above. Instead, it is appropriate to generally include realised gains and losses in the operating result with temporary unrealised gains and losses being included in
short-term fluctuations. In some instances, it may also be appropriate to amortise realised gains and losses on derivatives and other financial instruments to operating results over a time period that reflects the underlying economic substance of
the arrangements.
Financial statements B: Earnings performance
150 Prudential plc Annual Report 2014 Financial statements Notes to primary statements
B: Earnings performance continued
B1: Analysis of performance by segment continued
B1.4 Segmental income statement
2014 £m
Insurance operations Asset management Unallo-
cated to a
Eastspring segment
Invest- Total (central Group
Asia US UK M&G US ments segment operations) total
note (iii)
Gross premiums earned 11,193 15,654 7,358 – – – 34,205 (1,373) 32,832
Outward reinsurance premiums (311) (265) (1,596) – – – (2,172) 1,373 (799)
Earned premiums, net of reinsurance 10,882 15,389 5,762 – – – 32,033 – 32,033
Investment returnnote(ii) 3,888 5,438 16,447 104 (2) 3 25,878 (91) 25,787
Other
income 49 (2) 240 1,291 808 307 2,693 (387) 2,306
Total revenue, net of reinsurance 14,819 20,825 22,449 1,395 806 310 60,604 (478) 60,126
Benefits and claims (11,521) (19,788) (20,880) – – – (52,189) 1,453 (50,736)
Outward reinsurers’ share of benefits
and claims 254 27 1,803 – – – 2,084
(1,453) 631
Movement in unallocated surplus of
with-profits funds 20
– (84) – – – (64) – (64)
Benefits and claims and movements in
unallocated surplus of with-profits
funds, net of reinsurance
(11,247) (19,761) (19,161) – – – (50,169) – (50,169)
Acquisition costs and other operating
expenditureB3 (2,367) (795) (1,660) (920) (794) (249) (6,785) 33 (6,752)
Finance costs: interest on core structural
borrowings of shareholder-financed
operations – (12) – (17) – – (29) (312) (341)
Remeasurement of carrying value of
Japan life business classified as held
for sale (13) – – – – – (13) – (13)
Total charges, net of reinsurance (13,627) (20,568) (20,821) (937) (794) (249) (56,996) (279) (57,275)
Share of profit from joint ventures and
associates, net of related tax 133 – 128 13
– 29 303 – 303
Profit (loss) before tax (being tax
attributable to
shareholders’ and
policyholders’ returns)note(i) 1,325 257 1,756 471 12 90 3,911 (757) 3,154
Tax charge attributable to policyholders’
returns (105) – (435) –
– – (540) – (540)
Profit (loss) before tax attributable
to shareholders 1,220 257 1,321 471 12 90 3,371 (757) 2,614
The
segmental analysis of profit (loss) before tax attributable to shareholders as represented in note B1.1 is analysed below:
2014 £m
Insurance operations Asset management Unallo-
cated to a
Eastspring segment
Invest- Total (central Group
Asia US UK M&G US ments segment operations) total
Operating profit (loss) based on
longer-term investment returns 1,050 1,431 776 488 12 90 3,847 (661) 3,186
Short-term fluctuations in investment
returns on shareholder-backed
business 178 (1,103) 464 (17) – – (478) (96) (574)
Gain on sale of PruHealth and PruProtect – – 86 – – – 86 – 86
Amortisation of acquisition accounting
adjustments (8) (71) –
– – – (79) – (79)
Costs of domestication of Hong Kong
branch – – (5) – – – (5) – (5)
Profit
(loss) before tax attributable
to shareholders 1,220 257 1,321 471 12 90 3,371 (757) 2,614
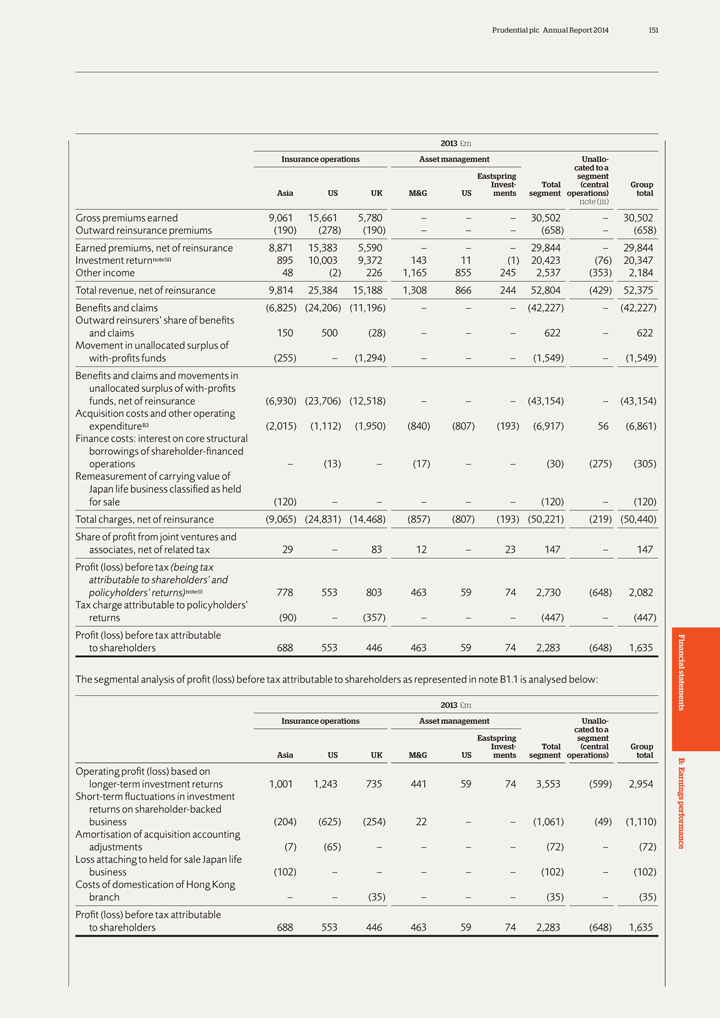
Prudential plc Annual Report 2014 151
2013
£m
Insurance operations Asset management Unallo-
cated to a
Eastspring segment
Invest- Total (central Group
Asia US UK M&G US ments segment operations) total
note (iii)
Gross premiums earned 9,061 15,661 5,780 – – – 30,502 – 30,502
Outward
reinsurance premiums (190) (278) (190) – – – (658) – (658)
Earned premiums, net of reinsurance 8,871 15,383 5,590 –
– – 29,844 – 29,844
Investment returnnote(ii) 895 10,003 9,372 143 11 (1) 20,423 (76) 20,347
Other income 48 (2) 226 1,165 855 245 2,537 (353) 2,184
Total revenue, net of
reinsurance 9,814 25,384 15,188 1,308 866 244 52,804 (429) 52,375
Benefits and claims (6,825) (24,206) (11,196) – – –
(42,227) – (42,227)
Outward reinsurers’ share of benefits
and
claims 150 500 (28) – – – 622 – 622
Movement in unallocated surplus of
with-profits funds (255) – (1,294) – – – (1,549) – (1,549)
Benefits and claims and movements in
unallocated surplus of with-profits
funds, net of reinsurance (6,930) (23,706) (12,518) – – – (43,154) – (43,154)
Acquisition costs and other operating
expenditureB3
(2,015) (1,112) (1,950) (840) (807) (193) (6,917) 56 (6,861)
Finance costs: interest on core structural
borrowings of shareholder-financed
operations – (13) – (17) – –
(30) (275) (305)
Remeasurement of carrying value of
Japan life
business classified as held
for sale (120) – – – – – (120) – (120)
Total charges, net of reinsurance (9,065) (24,831) (14,468) (857) (807) (193) (50,221) (219) (50,440)
Share of profit from joint ventures and
associates, net of related tax 29 – 83 12 –
23 147 – 147
Profit (loss) before tax (being tax
attributable to
shareholders’ and
policyholders’ returns)note(i) 778 553 803 463 59 74 2,730 (648) 2,082
Tax charge attributable to policyholders’
returns (90) – (357) –
– – (447) – (447)
Profit (loss) before tax attributable
to shareholders 688 553 446 463 59 74 2,283 (648) 1,635
The segmental
analysis of profit (loss) before tax attributable to shareholders as represented in note B1.1 is analysed below:
2013 £m
Insurance operations Asset management Unallo-
cated to a
Eastspring segment
Invest- Total (central Group
Asia US UK M&G US ments segment operations) total
Operating profit (loss) based on
longer-term investment returns 1,001 1,243 735 441 59 74 3,553 (599) 2,954
Short-term fluctuations in investment
returns on shareholder-backed
business (204) (625) (254) 22 – – (1,061) (49) (1,110)
Amortisation of acquisition accounting
adjustments (7) (65) – – –
– (72) – (72)
Loss attaching to held for sale Japan life
business (102) – – – – – (102) – (102)
Costs of domestication of Hong Kong
branch – – (35) –
– – (35) – (35)
Profit (loss) before tax attributable
to
shareholders 688 553 446 463 59 74 2,283 (648) 1,635
Financial statements B: Earnings performance
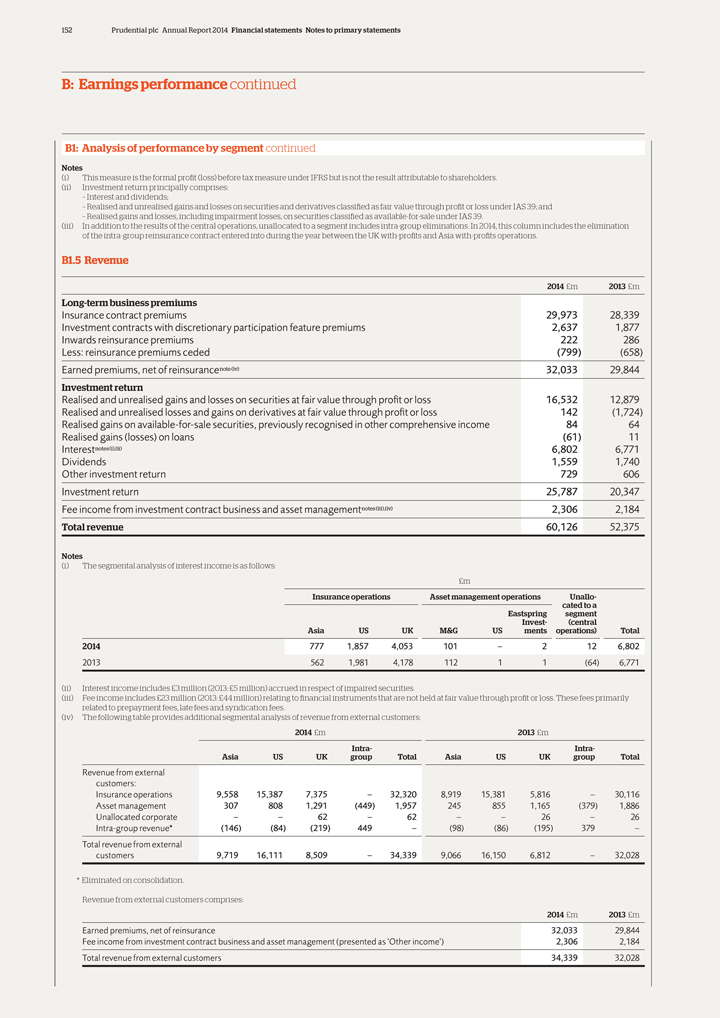
152 Prudential plc Annual Report 2014 Financial statements Notes to primary statements
B: Earnings performance continued
B1: Analysis of performance by segment continued
Notes
(i) This measure is the formal profit (loss) before tax measure under IFRS but is not
the result attributable to shareholders. (ii) Investment return principally comprises:
– Interest and dividends;
– Realised and unrealised gains and losses on securities and derivatives classified as fair value through profit or loss under IAS 39; and
– Realised gains and losses, including impairment losses, on securities classified as available-for-sale under IAS 39.
(iii) In addition to the results of the central operations, unallocated to a segment includes intra-group eliminations. In 2014, this column includes the elimination of the
intra-group reinsurance contract entered into during the year between the UK with-profits and Asia with-profits operations.
B1.5 Revenue
2014 £m 2013 £m
Long-term business premiums
Insurance contract premiums 29,973 28,339
Investment contracts with discretionary
participation feature premiums 2,637 1,877
Inwards reinsurance premiums 222 286
Less: reinsurance premiums ceded (799) (658)
Earned premiums, net of
reinsurancenote(iv) 32,033 29,844
Investment return
Realised and unrealised
gains and losses on securities at fair value through profit or loss 16,532 12,879
Realised and unrealised losses and gains on derivatives at fair value through
profit or loss 142 (1,724)
Realised gains on available-for-sale securities, previously recognised in other comprehensive income 84 64
Realised gains (losses) on loans (61) 11
Interestnotes(i),(ii) 6,802 6,771
Dividends 1,559 1,740
Other investment return 729 606
Investment return 25,787 20,347
Fee income from investment contract business and asset
managementnotes(iii),(iv) 2,306 2,184
Total revenue 60,126 52,375
Notes
(i) The segmental analysis of interest income is as follows:
Insurance
operations Asset management operations Unallo-
cated to a
Eastspring segment
Invest- (central
Asia US UK M&G US ments operations) Total
2014 777 1,857 4,053 101 – 2 12 6,802
2013 562 1,981 4,178 112 1 1 (64) 6,771
(ii) Interest income includes £3 million (2013: £5 million) accrued in respect of impaired securities.
(iii) Fee income includes £23 million (2013: £44 million) relating to financial instruments that are not held at fair value through profit or loss. These fees
primarily
related to prepayment fees, late fees and syndication fees.
(iv)
The following table provides additional segmental analysis of revenue from external customers:
2014 £m 2013 £m
Intra- Intra-
Asia US UK group Total Asia US UK group Total
Revenue from external
customers:
Insurance operations 9,558 15,387 7,375 – 32,320 8,919 15,381 5,816 – 30,116
Asset
management 307 808 1,291 (449) 1,957 245 855 1,165 (379) 1,886
Unallocated corporate – – 62 – 62 – – 26 – 26
Intra-group revenue* (146) (84) (219) 449 – (98) (86) (195) 379 –
Total revenue from external
customers 9,719 16,111 8,509 – 34,339 9,066 16,150 6,812
– 32,028
* Eliminated on consolidation.
Revenue from external customers
comprises:
Earned premiums, net of reinsurance 32,033 29,844
Fee income from
investment contract business and asset management (presented as ‘Other income’) 2,306 2,184
Total revenue from external customers 34,339 32,028
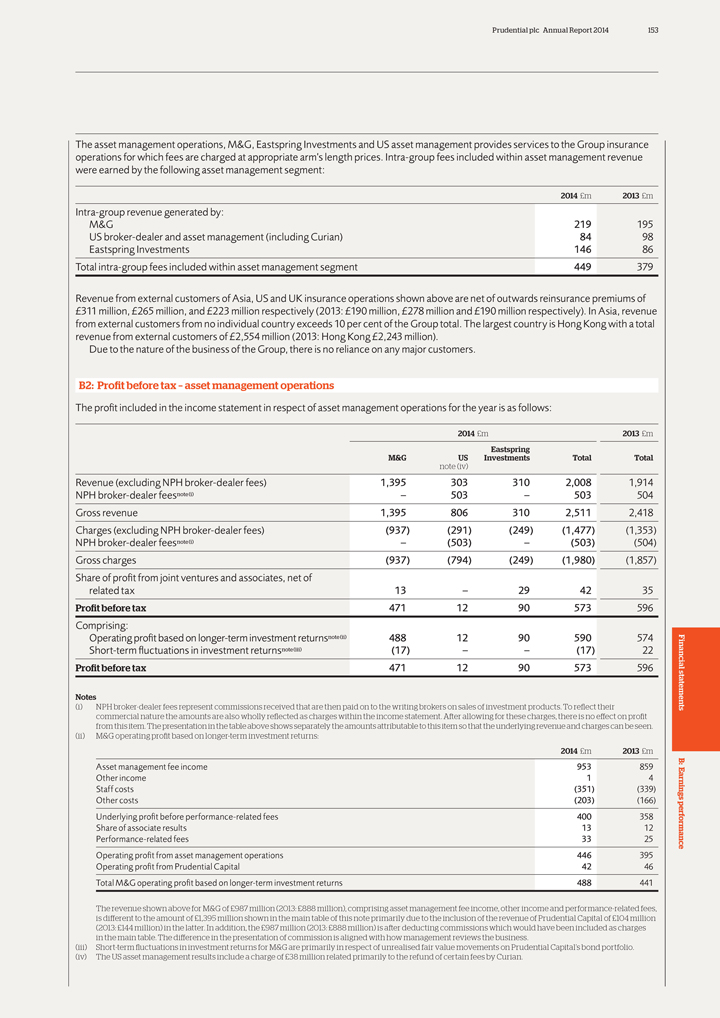
Prudential plc Annual Report 2014 153
The asset
management operations, M&G, Eastspring Investments and US asset management provides services to the Group insurance operations for which fees are charged at appropriate arm’s length prices. Intra-group fees included within asset management
revenue were earned by the following asset management segment:
2014 £m 2013 £m
Intra-group revenue generated by:
M&G 219 195
US broker-dealer and asset management (including Curian) 84 98
Eastspring Investments 146 86
Total intra-group fees included within asset management segment 449 379
Revenue from external customers of Asia, US and UK insurance operations shown above are net of outwards reinsurance premiums of £311 million,
£265 million, and £223 million respectively (2013: £190 million, £278 million and £190 million respectively). In Asia, revenue from external customers from no individual country exceeds
10 per cent of the Group total. The largest country is Hong Kong with a total revenue from external customers of £2,554 million (2013: Hong Kong £2,243 million).
Due to the nature of the business of the Group, there is no reliance on any major customers.
B2: Profit before tax – asset management operations
The profit included
in the income statement in respect of asset management operations for the year is as follows:
2014 £m 2013 £m
Eastspring
M&G US Investments Total Total
note (iv)
Revenue (excluding NPH broker-dealer fees) 1,395 303 310 2,008 1,914
NPH broker-dealer feesnote(i) – 503 – 503 504
Gross revenue 1,395 806 310 2,511
2,418
Charges (excluding NPH broker-dealer fees) (937) (291) (249) (1,477) (1,353)
NPH broker-dealer feesnote(i) – (503) – (503) (504)
Gross charges
(937) (794) (249) (1,980) (1,857)
Share of profit from joint ventures and associates, net of
related tax 13 – 29 42 35
Profit before tax 471 12 90 573 596
Comprising:
Operating profit based on longer-term investment returnsnote(ii) 488 12 90 590 574
Short-term fluctuations in investment returnsnote(iii) (17) – – (17) 22
Profit before tax 471 12 90 573 596
Notes
(i) NPH broker-dealer fees represent commissions received that are then paid on to the writing brokers on sales of investment products. To reflect their commercial nature the
amounts are also wholly reflected as charges within the income statement. After allowing for these charges, there is no effect on profit from this item. The presentation in the table above shows separately the amounts attributable to this item so
that the underlying revenue and charges can be seen. (ii) M&G operating profit based on longer-term investment returns:
2014 £m 2013 £m
Asset management fee income 953 859
Other income 1 4
Staff costs (351) (339)
Other costs (203) (166)
Underlying profit before performance-related fees 400 358
Share of associate results 13 12
Performance-related fees 33 25
Operating profit from asset management
operations 446 395
Operating profit from Prudential Capital 42 46
Total
M&G operating profit based on longer-term investment returns 488 441
The revenue shown above for M&G of £987 million (2013: £888 million),
comprising asset management fee income, other income and performance-related fees, is different to the amount of £1,395 million shown in the main table of this note primarily due to the inclusion of the revenue of Prudential Capital of
£104 million (2013: £144 million) in the latter. In addition, the £987 million (2013: £888 million) is after deducting commissions which would have been included as charges in the main table. The difference in the
presentation of commission is aligned with how management reviews the business.
Short-term fluctuations in investment returns for M&G are primarily in respect
of unrealised fair value movements on Prudential Capital’s bond portfolio.
The US asset management results include a charge of £38 million related
primarily to the refund of certain fees by Curian.
Financial statements B: Earnings performance
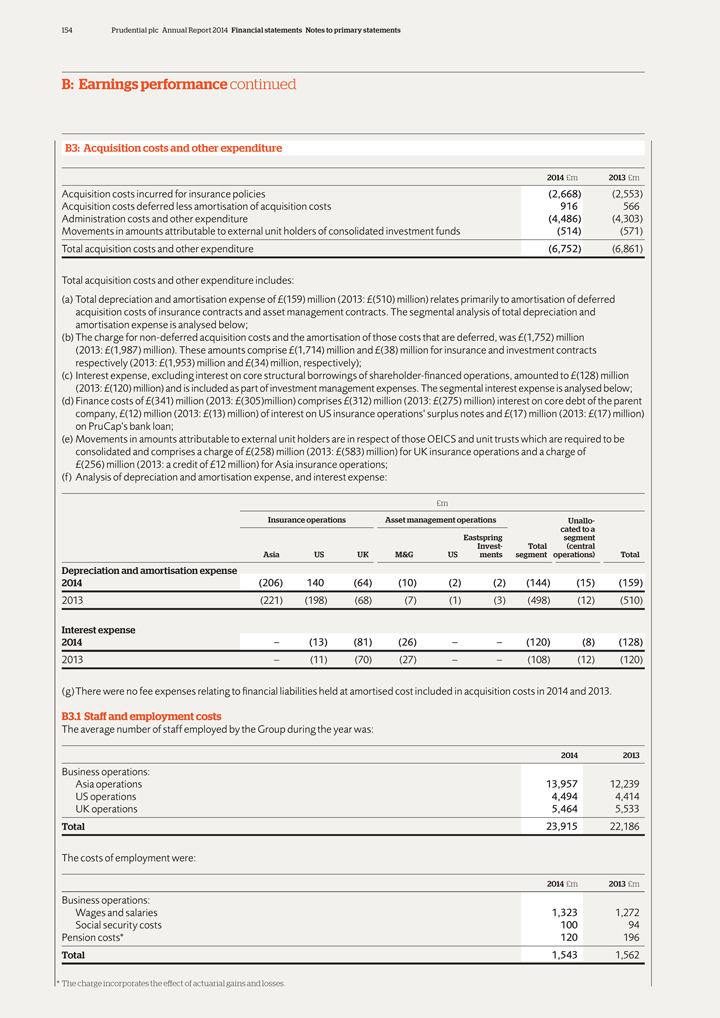
154 Prudential plc Annual Report 2014 Financial statements Notes to primary statements
B: Earnings performance continued
B3: Acquisition costs and other expenditure
2014 £m 2013 £m
Acquisition costs incurred for insurance policies
(2,668) (2,553)
Acquisition costs deferred less amortisation of acquisition costs 916 566
Administration costs and other expenditure (4,486) (4,303)
Movements in amounts
attributable to external unit holders of consolidated investment funds (514) (571)
Total acquisition costs and other expenditure (6,752) (6,861)
Total acquisition costs and other expenditure includes:
(a) Total
depreciation and amortisation expense of £(159) million (2013: £(510) million) relates primarily to amortisation of deferred acquisition costs of insurance contracts and asset management contracts. The segmental analysis of
total depreciation and amortisation expense is analysed below; (b) The charge for non-deferred acquisition costs and the amortisation of those costs that are deferred, was £(1,752) million (2013: £(1,987) million). These
amounts comprise £(1,714) million and £(38) million for insurance and investment contracts respectively (2013: £(1,953) million and £(34) million, respectively); (c) Interest expense, excluding
interest on core structural borrowings of shareholder-financed operations, amounted to £(128) million (2013: £(120) million) and is included as part of investment management expenses. The segmental interest expense is analysed
below; (d) Finance costs of £(341) million (2013: £(305)million) comprises £(312) million (2013: £(275) million) interest on core debt of the parent company, £(12) million (2013:
£(13) million) of interest on US insurance operations’ surplus notes and £(17) million (2013: £(17) million) on PruCap’s bank loan; (e) Movements in amounts attributable to external unit holders are in
respect of those OEICS and unit trusts which are required to be consolidated and comprises a charge of £(258) million (2013: £(583) million) for UK insurance operations and a charge of £(256) million (2013: a credit
of £12 million) for Asia insurance operations; (f) Analysis of depreciation and amortisation expense, and interest expense:
£m
Insurance operations Asset management operations Unallo-
cated to a
Eastspring segment
Invest- Total (central
Asia US UK M&G US ments segment operations) Total
Depreciation and amortisation expense
2014 (206) 140 (64) (10) (2) (2) (144) (15) (159)
2013 (221) (198) (68) (7) (1) (3) (498) (12) (510)
Interest expense
2014 – (13) (81) (26) – –
(120) (8) (128)
2013 – (11) (70) (27) – – (108) (12) (120)
(g) There were no fee expenses relating to financial liabilities held at amortised cost included in acquisition costs in 2014 and 2013.
B3.1 Staff and employment costs
The average number of staff employed by the Group during the
year was:
2014 2013
Business operations:
Asia operations 13,957 12,239
US operations 4,494 4,414
UK operations 5,464 5,533
Total 23,915 22,186
The costs of employment were:
2014 £m 2013 £m
Business operations:
Wages and salaries 1,323 1,272
Social security costs 100 94
Pension costs* 120 196
Total 1,543 1,562
* The charge incorporates the effect of actuarial gains and losses.
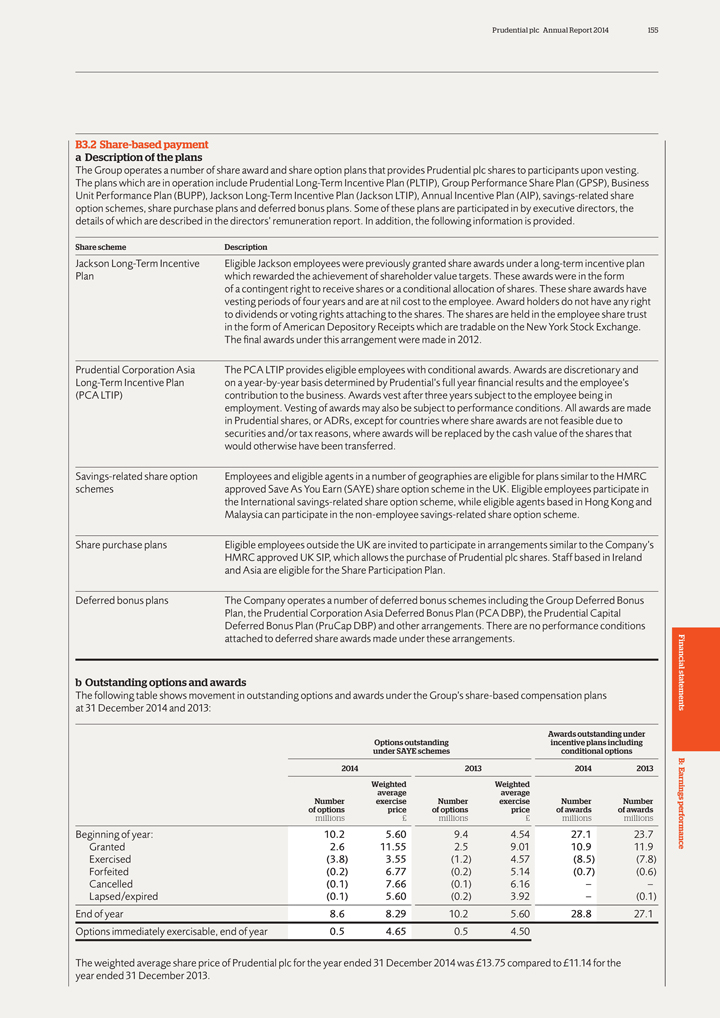
Prudential plc Annual Report 2014 155
B3.2
Share-based payment a Description of the plans
The Group operates a number of share award and share option plans that provides Prudential plc shares to
participants upon vesting. The plans which are in operation include Prudential Long-Term Incentive Plan (PLTIP), Group Performance Share Plan (GPSP), Business Unit Performance Plan (BUPP), Jackson Long-Term Incentive Plan (Jackson LTIP), Annual
Incentive Plan (AIP), savings-related share option schemes, share purchase plans and deferred bonus plans. Some of these plans are participated in by executive directors, the details of which are described in the directors’ remuneration report.
In addition, the following information is provided.
Share scheme Description
Jackson Long-Term Incentive Eligible Jackson employees were previously granted share awards under a long-term incentive plan
Plan which rewarded the achievement of shareholder value targets. These awards were in the form
of a contingent right to receive shares or a conditional allocation of shares. These share awards have
vesting periods of four years and are at nil cost to the employee. Award holders do not have any right
to dividends or voting rights attaching to the shares. The shares are held in the employee share trust
in the form of American Depository Receipts which are tradable on the New York Stock Exchange.
The final awards under this arrangement were made in 2012.
Prudential
Corporation Asia The PCA LTIP provides eligible employees with conditional awards. Awards are discretionary and
Long-Term Incentive Plan on a year-by-year basis
determined by Prudential’s full year financial results and the employee’s
(PCA LTIP) contribution to the business. Awards vest after three years subject
to the employee being in
employment. Vesting of awards may also be subject to performance conditions. All awards are made
in Prudential shares, or ADRs, except for countries where share awards are not feasible due to
securities and/or tax reasons, where awards will be replaced by the cash value of the shares that
would otherwise have been transferred.
Savings-related share option Employees and eligible
agents in a number of geographies are eligible for plans similar to the HMRC
schemes approved Save As You Earn (SAYE) share option scheme in the UK. Eligible
employees participate in
the International savings-related share option scheme, while eligible agents based in Hong Kong and
Malaysia can participate in the non-employee savings-related share option scheme.
Share
purchase plans Eligible employees outside the UK are invited to participate in arrangements similar to the Company’s
HMRC approved UK SIP, which allows the
purchase of Prudential plc shares. Staff based in Ireland
and Asia are eligible for the Share Participation Plan.
Deferred bonus plans The Company operates a number of deferred bonus schemes including the Group Deferred Bonus
Plan, the Prudential Corporation Asia Deferred Bonus Plan (PCA DBP), the Prudential Capital
Deferred Bonus Plan (PruCap DBP) and other arrangements. There are no performance conditions
attached to deferred share awards made under these arrangements.
b Outstanding options and
awards
The following table shows movement in outstanding options and awards under the Group’s share-based compensation plans at 31 December 2014 and
2013:
Awards outstanding under
Options outstanding incentive plans including
under SAYE schemes conditional options
2014 2013 2014 2013
Weighted Weighted
average average
Number exercise Number exercise Number Number
of options price of options price of awards of
awards
millions £ millions £ millions millions
Beginning of year:
10.2 5.60 9.4 4.54 27.1 23.7
Granted 2.6 11.55 2.5 9.01 10.9 11.9
Exercised
(3.8) 3.55 (1.2) 4.57 (8.5) (7.8)
Forfeited (0.2) 6.77 (0.2) 5.14 (0.7) (0.6)
Cancelled (0.1) 7.66 (0.1) 6.16 – –
Lapsed/expired (0.1) 5.60 (0.2) 3.92 –
(0.1)
End of year 8.6 8.29 10.2 5.60 28.8 27.1
Options immediately
exercisable, end of year 0.5 4.65 0.5 4.50
The weighted average share price of Prudential plc for the year ended 31 December 2014 was £13.75 compared to
£11.14 for the year ended 31 December 2013.
Financial statements B: Earnings performance
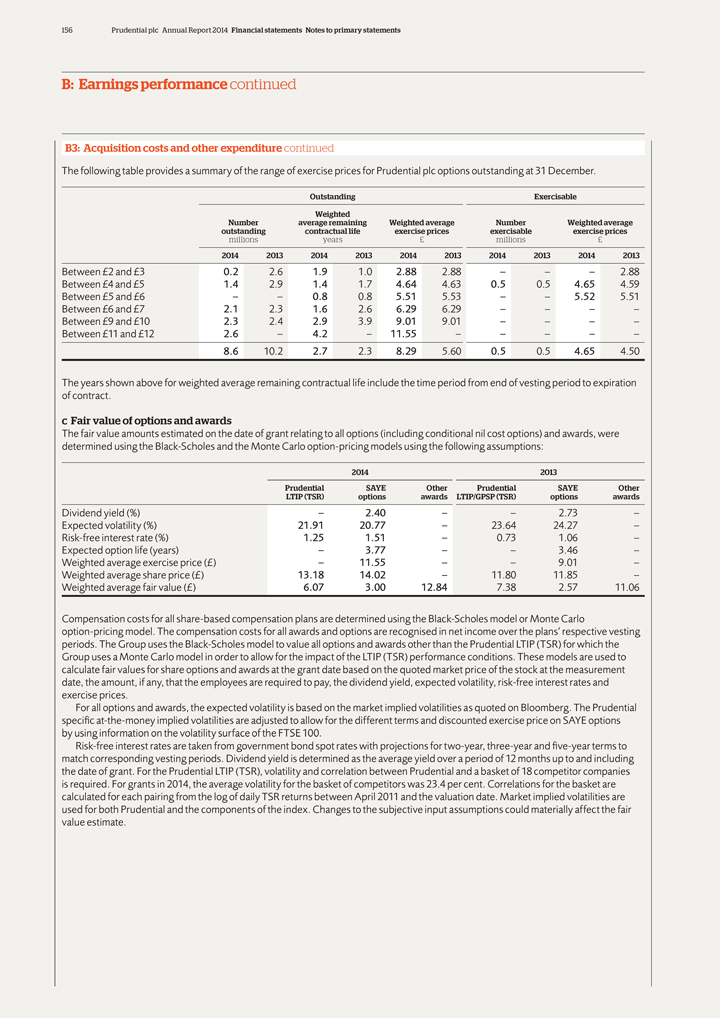
156 Prudential plc Annual Report 2014 Financial statements Notes to primary statements
B: Earnings performance continued
B3: Acquisition costs and other expenditure continued
The following table provides a summary of the range of exercise prices for Prudential plc options outstanding at 31 December.
Outstanding Exercisable
Weighted
Number average remaining Weighted average Number Weighted average
outstanding contractual life
exercise prices exercisable exercise prices
millions years £ millions £
2014 2013 2014 2013 2014 2013 2014 2013 2014 2013
Between £2 and £3 0.2 2.6 1.9
1.0 2.88 2.88 – – – 2.88
Between £4 and £5 1.4 2.9 1.4 1.7 4.64 4.63 0.5 0.5 4.65 4.59
Between £5 and £6 – – 0.8 0.8 5.51 5.53 – – 5.52 5.51
Between
£6 and £7 2.1 2.3 1.6 2.6 6.29 6.29 – – – –
Between £9 and £10 2.3 2.4 2.9 3.9 9.01 9.01 – – – –
Between £11 and £12 2.6 – 4.2 – 11.55 – – – – –
8.6 10.2 2.7 2.3 8.29 5.60 0.5 0.5 4.65 4.50
The years shown above for weighted average
remaining contractual life include the time period from end of vesting period to expiration of contract.
c Fair value of options and awards
The fair value amounts estimated on the date of grant relating to all options (including conditional nil cost options) and awards, were determined using the Black-Scholes and the
Monte Carlo option-pricing models using the following assumptions:
2014 2013
Prudential SAYE Other Prudential SAYE Other
LTIP (TSR) options awards
LTIP/GPSP (TSR) options awards
Dividend yield (%) – 2.40 – – 2.73 –
Expected volatility (%) 21.91 20.77 – 23.64 24.27 –
Risk-free interest rate
(%) 1.25 1.51 – 0.73 1.06 –
Expected option life (years) – 3.77 – – 3.46 –
Weighted average exercise price (£) – 11.55 – – 9.01 –
Weighted
average share price (£) 13.18 14.02 – 11.80 11.85 –
Weighted average fair value (£) 6.07 3.00 12.84 7.38 2.57 11.06
Compensation costs for all share-based compensation plans are determined using the Black-Scholes model or Monte Carlo option-pricing model. The compensation costs for all awards
and options are recognised in net income over the plans’ respective vesting periods. The Group uses the Black-Scholes model to value all options and awards other than the Prudential LTIP (TSR) for which the Group uses a Monte Carlo model in
order to allow for the impact of the LTIP (TSR) performance conditions. These models are used to calculate fair values for share options and awards at the grant date based on the quoted market price of the stock at the measurement date, the amount,
if any, that the employees are required to pay, the dividend yield, expected volatility, risk-free interest rates and exercise prices.
For all options and awards,
the expected volatility is based on the market implied volatilities as quoted on Bloomberg. The Prudential specific at-the-money implied volatilities are adjusted to allow for the different terms and discounted exercise price on SAYE options by
using information on the volatility surface of the FTSE 100.
Risk-free interest rates are taken from government bond spot rates with projections for two-year,
three-year and five-year terms to match corresponding vesting periods. Dividend yield is determined as the average yield over a period of 12 months up to and including the date of grant. For the Prudential LTIP (TSR), volatility and correlation
between Prudential and a basket of 18 competitor companies is required. For grants in 2014, the average volatility for the basket of competitors was 23.4 per cent. Correlations for the basket are calculated for each pairing from the log of
daily TSR returns between April 2011 and the valuation date. Market implied volatilities are used for both Prudential and the components of the index. Changes to the subjective input assumptions could materially affect the fair value estimate.
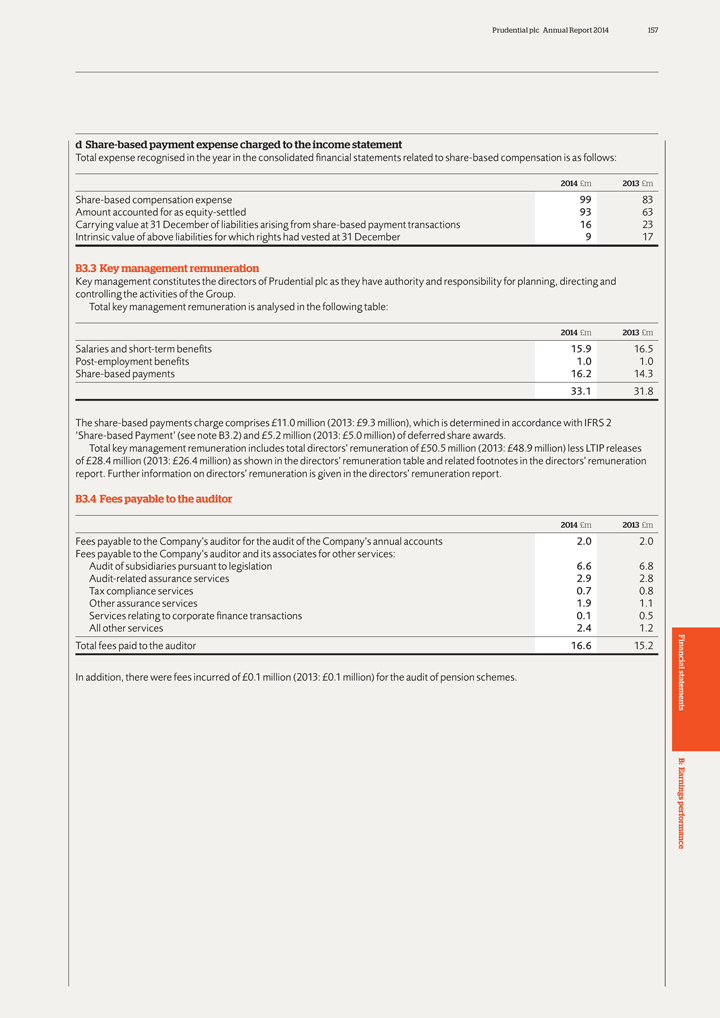
Prudential plc Annual Report 2014 157
d
Share-based payment expense charged to the income statement
Total expense recognised in the year in the consolidated financial statements related to share-based
compensation is as follows:
2014 £m 2013 £m
Share-based
compensation expense 99 83
Amount accounted for as equity-settled 93 63
Carrying value at 31 December of liabilities arising from share-based payment transactions 16 23
Intrinsic value of above liabilities for which rights had vested at 31 December 9 17
B3.3
Key management remuneration
Key management constitutes the directors of Prudential plc as they have authority and responsibility for planning, directing and
controlling the activities of the Group.
Total key management remuneration is analysed in the following table:
2014 £m 2013 £m
Salaries and short-term benefits 15.9 16.5
Post-employment benefits 1.0 1.0
Share-based payments 16.2 14.3
33.1 31.8
The share-based payments charge comprises £11.0 million (2013: £9.3
million), which is determined in accordance with IFRS 2 ‘Share-based Payment’ (see note B3.2) and £5.2 million (2013: £5.0 million) of deferred share awards.
Total key management remuneration includes total directors’ remuneration of £50.5 million (2013: £48.9 million) less LTIP releases of £28.4 million
(2013: £26.4 million) as shown in the directors’ remuneration table and related footnotes in the directors’ remuneration report. Further information on directors’ remuneration is given in the directors’ remuneration report.
B3.4 Fees payable to the auditor
2014 £m 2013 £m
Fees payable to the Company’s auditor for the audit of the Company’s annual accounts 2.0 2.0
Fees payable to the Company’s auditor and its associates for other services:
Audit of
subsidiaries pursuant to legislation 6.6 6.8
Audit-related assurance services 2.9 2.8
Tax compliance services 0.7 0.8
Other assurance services 1.9 1.1
Services relating to corporate finance transactions 0.1 0.5
All other services 2.4 1.2
Total fees paid to the auditor 16.6 15.2
In addition, there were fees
incurred of £0.1 million (2013: £0.1 million) for the audit of pension schemes.
Financial statements B: Earnings performance
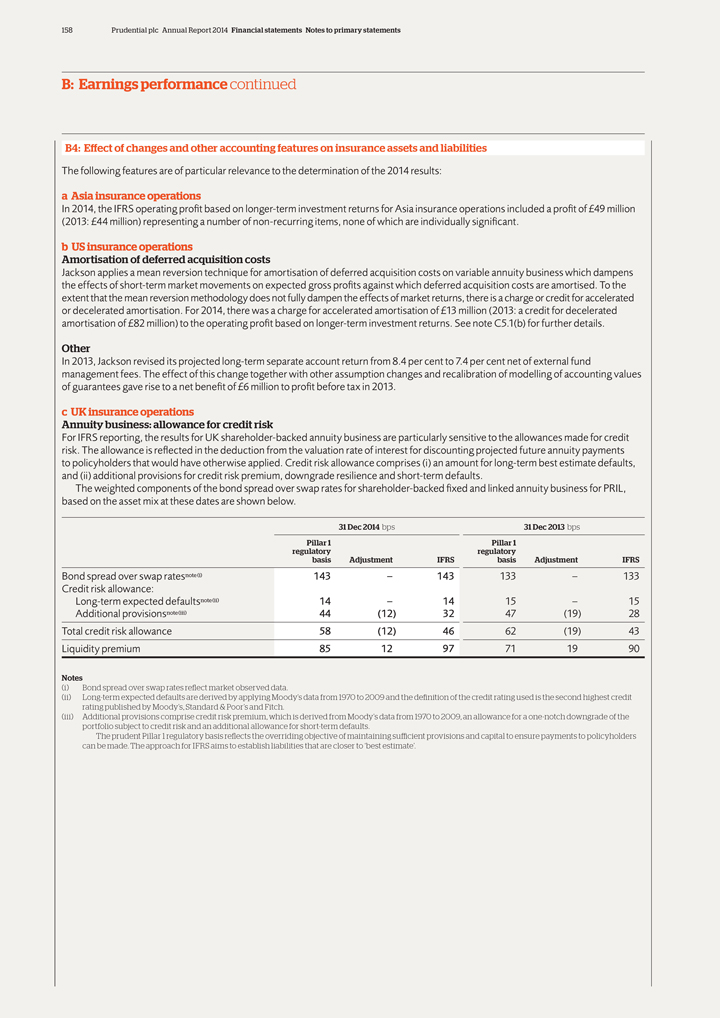
158 Prudential plc Annual Report 2014 Financial statements Notes to primary statements
B: Earnings performance continued
B4: Effect of changes and other accounting features on
insurance assets and liabilities
The following features are of particular relevance to the determination of the 2014 results:
a Asia insurance operations
In 2014, the IFRS operating profit based on longer-term investment
returns for Asia insurance operations included a profit of £49 million (2013: £44 million) representing a number of non-recurring items, none of which are individually significant.
b US insurance operations
Amortisation of deferred acquisition costs
Jackson applies a mean reversion technique for amortisation of deferred acquisition costs on variable annuity business which dampens the effects of short-term market movements on
expected gross profits against which deferred acquisition costs are amortised. To the extent that the mean reversion methodology does not fully dampen the effects of market returns, there is a charge or credit for accelerated or decelerated
amortisation. For 2014, there was a charge for accelerated amortisation of £13 million (2013: a credit for decelerated amortisation of £82 million) to the operating profit based on longer-term investment returns. See note C5.1(b)
for further details.
Other
In 2013, Jackson revised its projected long-term
separate account return from 8.4 per cent to 7.4 per cent net of external fund management fees. The effect of this change together with other assumption changes and recalibration of modelling of accounting values of guarantees gave rise to
a net benefit of £6 million to profit before tax in 2013.
c UK insurance operations
Annuity business: allowance for credit risk
For IFRS reporting, the results for UK
shareholder-backed annuity business are particularly sensitive to the allowances made for credit risk. The allowance is reflected in the deduction from the valuation rate of interest for discounting projected future annuity payments to policyholders
that would have otherwise applied. Credit risk allowance comprises (i) an amount for long-term best estimate defaults, and (ii) additional provisions for credit risk premium, downgrade resilience and short-term defaults.
The weighted components of the bond spread over swap rates for shareholder-backed fixed and linked annuity business for PRIL, based on the asset mix at these dates are shown below.
31 Dec 2014 bps 31 Dec 2013 bps
Pillar 1 Pillar 1
regulatory regulatory
basis Adjustment IFRS basis Adjustment IFRS
Bond spread over swap ratesnote(i) 143 – 143 133 – 133
Credit risk allowance:
Long-term expected defaultsnote(ii) 14 – 14 15 – 15
Additional
provisionsnote(iii) 44 (12) 32 47 (19) 28
Total credit risk allowance 58 (12) 46 62 (19) 43
Liquidity premium 85 12 97 71 19 90
Notes
(i) Bond spread over swap rates reflect market observed data.
(ii) Long-term expected defaults
are derived by applying Moody’s data from 1970 to 2009 and the definition of the credit rating used is the second highest credit rating published by Moody’s, Standard & Poor’s and Fitch.
(iii) Additional provisions comprise credit risk premium, which is derived from Moody’s data from 1970 to 2009, an allowance for a one-notch downgrade of the portfolio subject
to credit risk and an additional allowance for short-term defaults.
The prudent Pillar 1 regulatory basis reflects the overriding objective of maintaining
sufficient provisions and capital to ensure payments to policyholders can be made. The approach for IFRS aims to establish liabilities that are closer to ‘best estimate’.
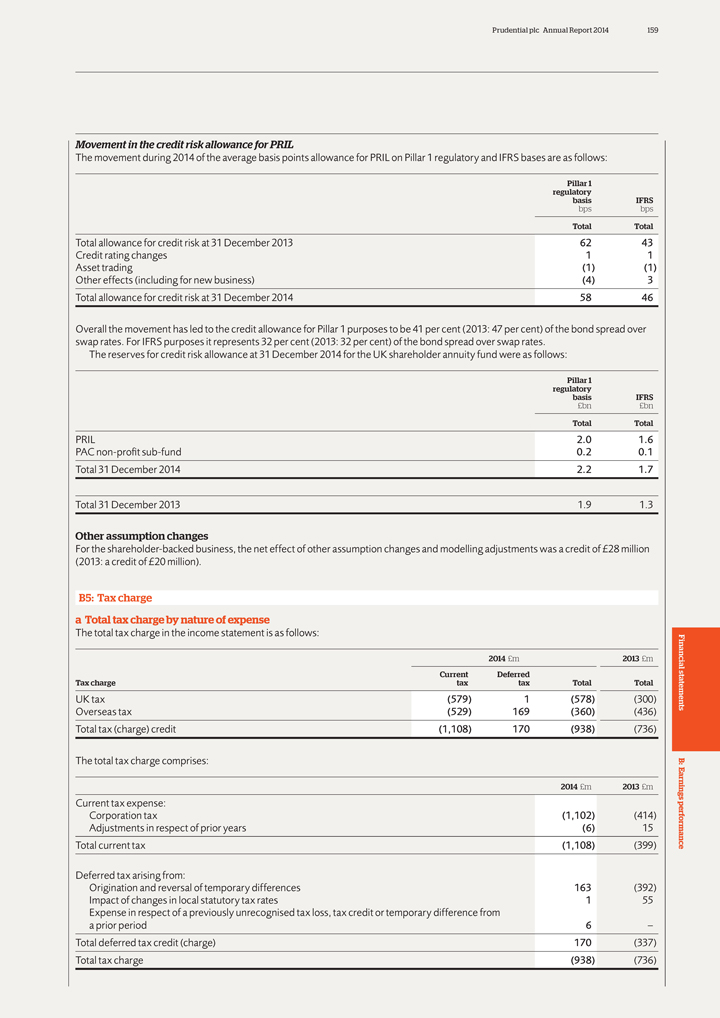
Prudential plc Annual Report 2014 159
Movement in
the credit risk allowance for PRIL
The movement during 2014 of the average basis points allowance for PRIL on Pillar 1 regulatory and IFRS bases are as follows:
Pillar 1
regulatory
basis IFRS
bps bps
Total Total
Total allowance for credit risk at 31 December 2013 62 43
Credit rating changes 1 1
Asset trading (1) (1)
Other effects (including for new business) (4) 3
Total allowance for credit risk at
31 December 2014 58 46
Overall the movement has led to the credit allowance for Pillar 1 purposes to be 41 per cent (2013: 47 per cent) of the bond
spread over swap rates. For IFRS purposes it represents 32 per cent (2013: 32 per cent) of the bond spread over swap rates.
The reserves for credit risk
allowance at 31 December 2014 for the UK shareholder annuity fund were as follows:
Pillar 1
regulatory
basis IFRS
£bn £bn
Total Total
PRIL 2.0 1.6
PAC non-profit sub-fund 0.2 0.1
Total 31 December 2014 2.2 1.7
Total 31 December 2013 1.9 1.3
Other assumption changes
For the shareholder-backed business, the net effect of other
assumption changes and modelling adjustments was a credit of £28 million (2013: a credit of £20 million).
B5: Tax charge a Total tax charge by
nature of expense
The total tax charge in the income statement is as follows:
2014 £m 2013 £m
Current Deferred
Tax charge tax tax Total Total
UK tax (579) 1 (578) (300)
Overseas tax (529) 169 (360) (436)
Total tax (charge) credit (1,108) 170
(938) (736)
The total tax charge comprises:
2014 £m 2013 £m
Current tax expense:
Corporation tax (1,102) (414)
Adjustments in respect of prior years (6) 15
Total current tax (1,108) (399)
Deferred tax arising from:
Origination and reversal of temporary differences
163 (392)
Impact of changes in local statutory tax rates 1 55
Expense in
respect of a previously unrecognised tax loss, tax credit or temporary difference from
a prior period 6 –
Total deferred tax credit (charge) 170 (337)
Total tax charge (938) (736)
Financial statements B: Earnings performance
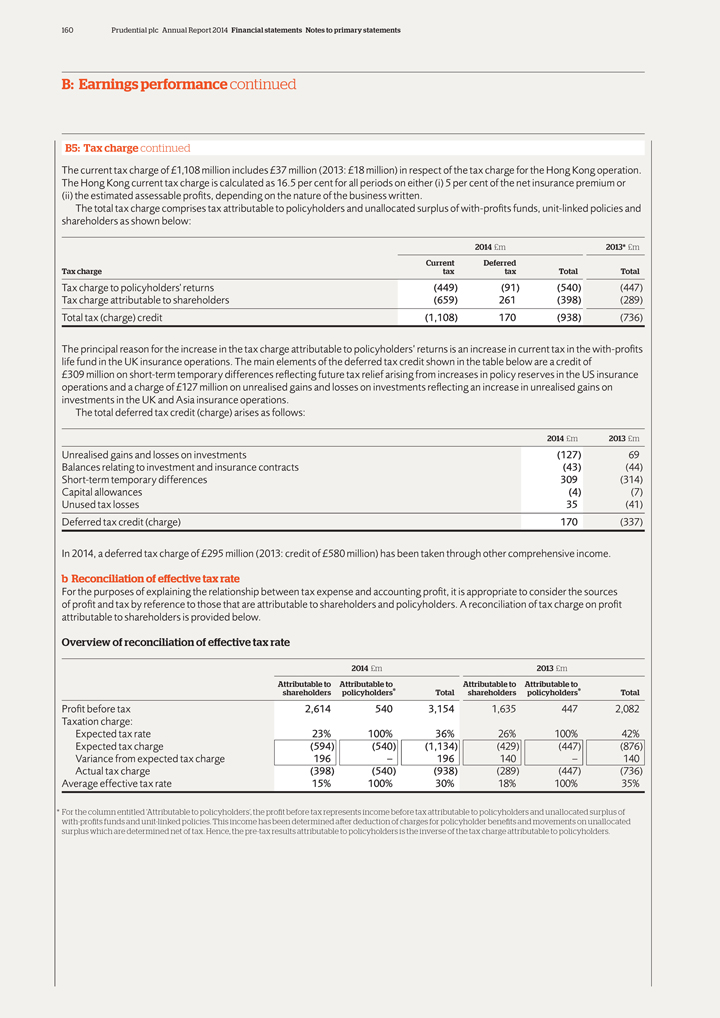
160 Prudential plc Annual Report 2014 Financial statements Notes to primary statements
B: Earnings performance continued
B5: Tax charge continued
The current tax charge of £1,108 million includes £37 million (2013: £18 million) in respect of the tax charge for the Hong Kong operation. The Hong
Kong current tax charge is calculated as 16.5 per cent for all periods on either (i) 5 per cent of the net insurance premium or (ii) the estimated assessable profits, depending on the nature of the business written.
The total tax charge comprises tax attributable to policyholders and unallocated surplus of with-profits funds, unit-linked policies and shareholders as shown below:
2014 £m 2013* £m
Current Deferred
Tax charge tax tax Total Total
Tax charge to policyholders’ returns
(449) (91) (540) (447)
Tax charge attributable to shareholders (659) 261 (398) (289)
Total tax (charge) credit (1,108) 170 (938) (736)
The principal reason for the
increase in the tax charge attributable to policyholders’ returns is an increase in current tax in the with-profits life fund in the UK insurance operations. The main elements of the deferred tax credit shown in the table below are a credit of
£309 million on short-term temporary differences reflecting future tax relief arising from increases in policy reserves in the US insurance operations and a charge of £127 million on unrealised gains and losses on investments
reflecting an increase in unrealised gains on investments in the UK and Asia insurance operations.
The total deferred tax credit (charge) arises as follows:
2014 £m 2013 £m
Unrealised gains and losses on investments
(127) 69
Balances relating to investment and insurance contracts (43) (44)
Short-term temporary differences 309 (314)
Capital allowances (4) (7)
Unused tax losses 35 (41)
Deferred tax credit (charge) 170 (337)
In 2014, a deferred tax charge of £295 million (2013: credit of £580 million) has been taken through other comprehensive income.
b Reconciliation of effective tax rate
For the purposes of explaining the relationship between
tax expense and accounting profit, it is appropriate to consider the sources of profit and tax by reference to those that are attributable to shareholders and policyholders. A reconciliation of tax charge on profit attributable to shareholders is
provided below.
Overview of reconciliation of effective tax rate
2014
£m 2013 £m
Attributable to Attributable to Attributable to Attributable to
shareholders policyholders* Total shareholders policyholders* Total
Profit before tax 2,614
540 3,154 1,635 447 2,082
Taxation charge:
Expected tax rate 23% 100% 36% 26%
100% 42%
Expected tax charge (594) (540) (1,134) (429) (447) (876)
Variance from expected tax charge 196 – 196 140 – 140
Actual tax charge
(398) (540) (938) (289) (447) (736)
Average effective tax rate 15% 100% 30% 18% 100% 35%
* For the column entitled ‘Attributable to policyholders’, the profit before tax represents income before tax attributable to policyholders and unallocated surplus of
with-profits funds and unit-linked policies. This income has been determined after deduction of charges for policyholder benefits and movements on unallocated surplus which are determined net of tax. Hence, the pre-tax results attributable to
policyholders is the inverse of the tax charge attributable to policyholders.
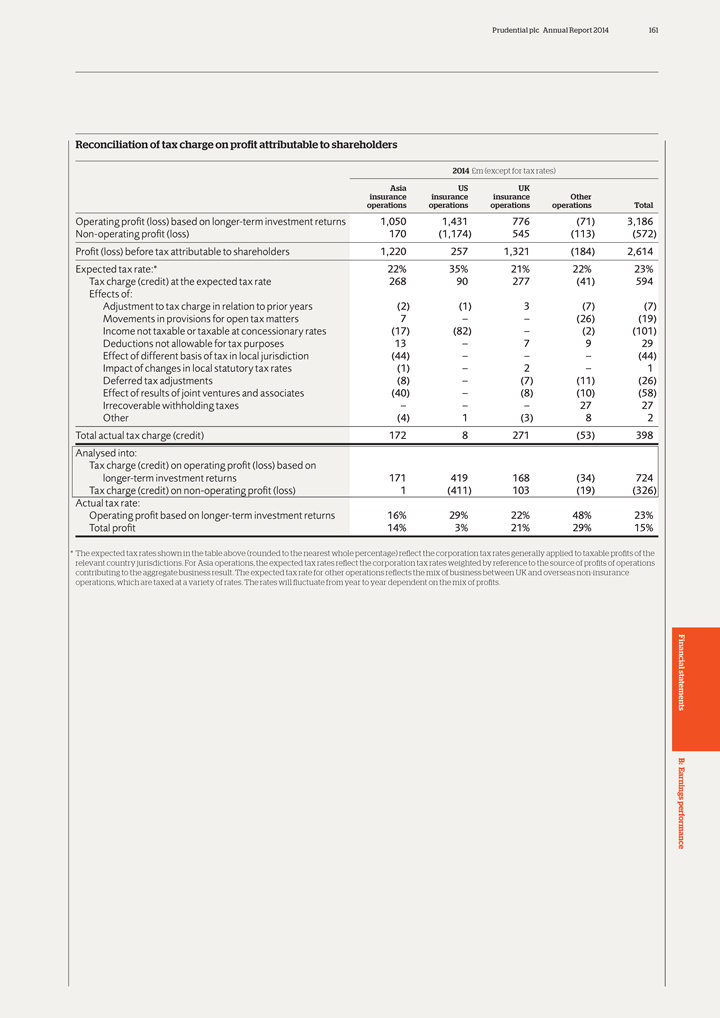
Prudential plc Annual Report 2014 161
Reconciliation of tax charge on profit attributable to shareholders
2014
£m (except for tax rates)
Asia US UK
insurance insurance insurance
Other
operations operations operations operations Total
Operating profit
(loss) based on longer-term investment returns 1,050 1,431 776 (71) 3,186
Non-operating profit (loss) 170 (1,174) 545 (113) (572)
Profit (loss) before tax attributable to shareholders 1,220 257 1,321 (184) 2,614
Expected tax rate:* 22% 35% 21% 22% 23%
Tax charge (credit) at the expected
tax rate 268 90 277 (41) 594
Effects of:
Adjustment to tax charge in
relation to prior years (2) (1) 3 (7) (7)
Movements in provisions for open tax matters 7 – – (26) (19)
Income not taxable or taxable at concessionary rates (17) (82) – (2) (101)
Deductions not allowable for tax purposes 13 – 7 9 29
Effect of
different basis of tax in local jurisdiction (44) – – – (44)
Impact of changes in local statutory tax rates (1) – 2 – 1
Deferred tax adjustments (8) – (7) (11) (26)
Effect of
results of joint ventures and associates (40) – (8) (10) (58)
Irrecoverable withholding taxes – – – 27 27
Other (4) 1 (3) 8 2
Total actual tax charge (credit) 172 8 271 (53) 398
Analysed into:
Tax charge (credit) on operating profit (loss) based on
longer-term investment returns 171 419 168 (34) 724
Tax charge (credit)
on non-operating profit (loss) 1 (411) 103 (19) (326)
Actual tax rate:
Operating profit based on longer-term investment returns 16% 29% 22% 48% 23%
Total profit 14%
3% 21% 29% 15%
* The expected tax rates shown in the table above (rounded to the nearest whole percentage) reflect the corporation tax rates generally applied to
taxable profits of the
relevant country jurisdictions. For Asia operations, the expected tax rates reflect the corporation tax rates weighted by reference to the
source of profits of operations
contributing to the aggregate business result. The expected tax rate for other operations reflects the mix of business between UK
and overseas non-insurance
operations, which are taxed at a variety of rates. The rates will fluctuate from year to year dependent on the mix of profits.
Financial statements B: Earnings performance
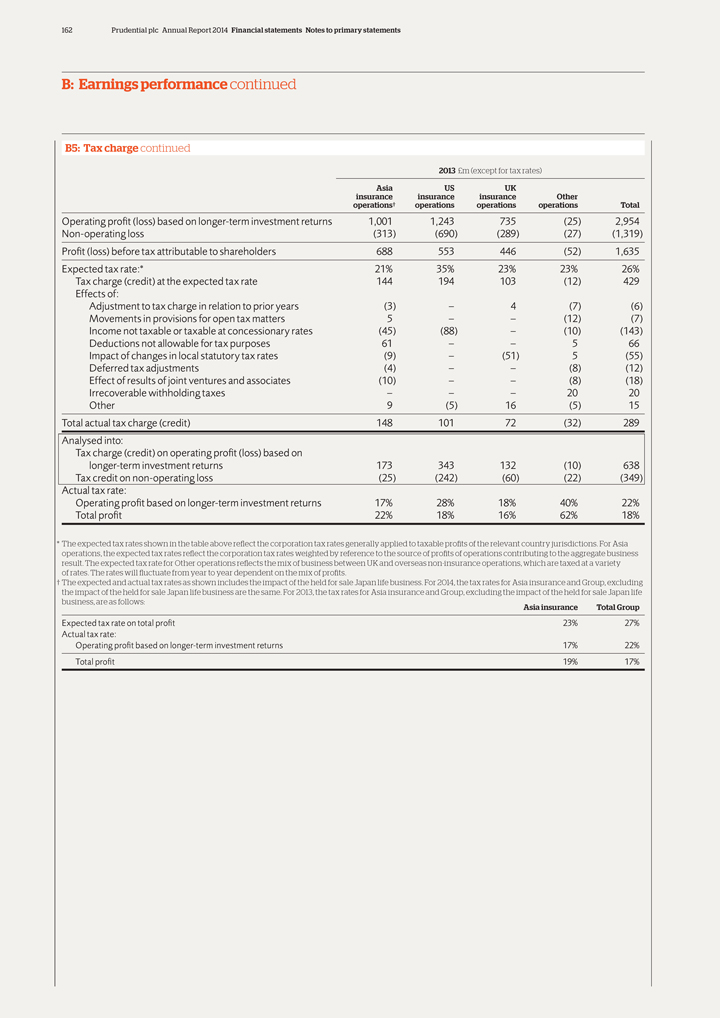
162 Prudential plc Annual Report 2014 Financial statements Notes to primary statements
B: Earnings performance continued
B5: Tax charge continued
2013 £m (except for tax rates)
Asia US UK
insurance insurance insurance Other
operations† operations operations operations Total
Operating profit (loss) based on longer-term investment returns 1,001 1,243 735 (25) 2,954
Non-operating loss (313) (690) (289) (27) (1,319)
Profit (loss) before tax
attributable to shareholders 688 553 446 (52) 1,635
Expected tax rate:* 21% 35% 23% 23% 26%
Tax charge (credit) at the expected tax rate 144 194 103 (12) 429
Effects of:
Adjustment to tax charge in relation to prior years (3) – 4 (7) (6)
Movements
in provisions for open tax matters 5 – – (12) (7)
Income not taxable or taxable at concessionary rates (45) (88) – (10) (143)
Deductions not allowable for tax purposes 61 – – 5 66
Impact of
changes in local statutory tax rates (9) – (51) 5 (55)
Deferred tax adjustments (4) – – (8) (12)
Effect of results of joint ventures and associates (10) – – (8) (18)
Irrecoverable withholding taxes – – – 20 20
Other 9
(5) 16 (5) 15
Total actual tax charge (credit) 148 101 72 (32) 289
Analysed into:
Tax charge (credit) on operating profit (loss) based on
longer-term investment returns 173 343 132 (10) 638
Tax credit on non-operating loss
(25) (242) (60) (22) (349)
Actual tax rate:
Operating
profit based on longer-term investment returns 17% 28% 18% 40% 22%
Total profit 22% 18% 16% 62% 18%
* The expected tax rates shown in the table above reflect the corporation tax rates generally applied to taxable profits of the relevant country jurisdictions. For Asia
operations, the expected tax rates reflect the corporation tax rates weighted by reference to the source of profits of operations contributing to the aggregate business
result. The expected tax rate for Other operations reflects the mix of business between UK and overseas non-insurance operations, which are taxed at a variety
of rates. The rates will fluctuate from year to year dependent on the mix of profits.
†
The expected and actual tax rates as shown includes the impact of the held for sale Japan life business. For 2014, the tax rates for Asia insurance and Group, excluding
the impact of the held for sale Japan life business are the same. For 2013, the tax rates for Asia insurance and Group, excluding the impact of the held for sale Japan life
business, are as follows: Asia insurance Total Group
Expected tax rate on
total profit 23% 27%
Actual tax rate:
Operating profit based on longer-term
investment returns 17% 22%
Total profit 19% 17%
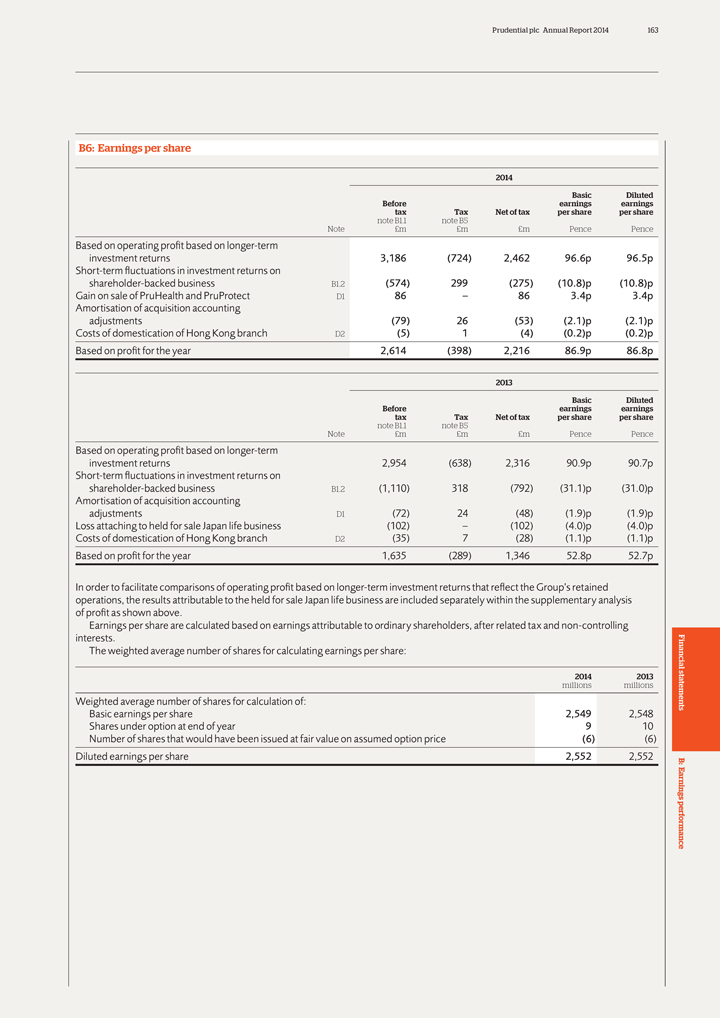
Prudential plc Annual Report 2014 163
B6: Earnings
per share
2014
Basic Diluted
Before earnings earnings
tax Tax Net of tax per share per share
note B1.1 note B5
Note £m £m £m Pence Pence
Based on operating profit based on longer-term
investment returns 3,186 (724) 2,462 96.6p
96.5p
Short-term fluctuations in investment returns on
shareholder-backed
business B1.2 (574) 299 (275) (10.8)p (10.8)p
Gain on sale of PruHealth and PruProtect D1 86 – 86 3.4p 3.4p
Amortisation of acquisition accounting
adjustments (79) 26 (53) (2.1)p (2.1)p
Costs of domestication of Hong Kong branch D2 (5) 1 (4) (0.2)p (0.2)p
Based on profit for the year 2,614 (398) 2,216 86.9p 86.8p
2013
Basic Diluted
Before earnings earnings
tax Tax Net of tax per share per share
note B1.1 note B5
Note £m £m £m Pence Pence
Based on operating profit based on longer-term
investment returns 2,954 (638) 2,316 90.9p 90.7p
Short-term fluctuations
in investment returns on
shareholder-backed business B1.2 (1,110) 318 (792) (31.1)p (31.0)p
Amortisation of acquisition accounting
adjustments D1 (72) 24 (48) (1.9)p (1.9)p
Loss attaching to held for sale Japan life business (102) – (102) (4.0)p (4.0)p
Costs of domestication of Hong Kong branch D2 (35) 7 (28) (1.1)p (1.1)p
Based on
profit for the year 1,635 (289) 1,346 52.8p 52.7p
In order to facilitate comparisons of operating profit based on longer-term investment returns that reflect
the Group’s retained
operations, the results attributable to the held for sale Japan life business are included separately within the supplementary analysis
of profit as shown above.
Earnings per share are calculated based on earnings
attributable to ordinary shareholders, after related tax and non-controlling
interests.
The weighted average number of shares for calculating earnings per share:
2014 2013
millions millions
Weighted average number of shares for calculation of:
Basic earnings per share 2,549 2,548
Shares under option at end of year 9 10
Number of shares that would have been issued at fair value on assumed option price (6) (6)
Diluted earnings per share 2,552 2,552
Financial statements B: Earnings performance
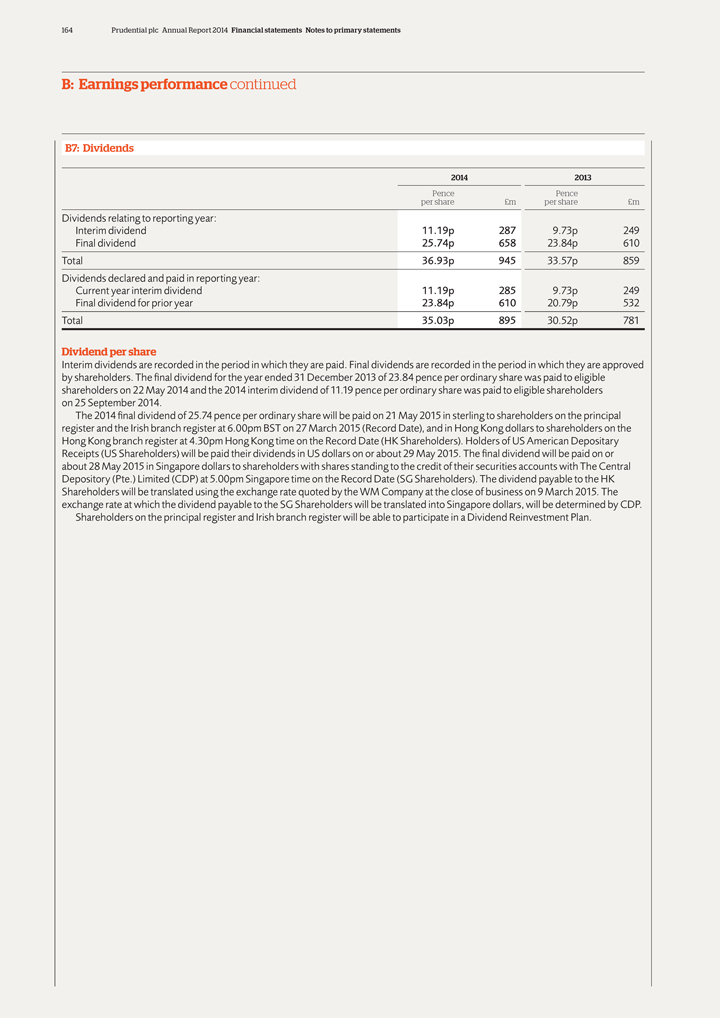
164 Prudential plc Annual Report 2014 Financial statements Notes to primary statements
B: Earnings performance continued
B7: Dividends
2014 2013
Pence Pence
per share £m per share £m
Dividends relating to reporting year:
Interim dividend 11.19p 287 9.73p 249
Final dividend 25.74p 658 23.84p 610
Total 36.93p 945 33.57p 859
Dividends declared and paid in reporting year:
Current year interim dividend 11.19p 285 9.73p 249
Final dividend for prior year 23.84p 610
20.79p 532
Total 35.03p 895 30.52p 781
Dividend per share
Interim dividends are recorded in the period in which they are paid. Final dividends are recorded in the period in which they are approved by shareholders. The final dividend for
the year ended 31 December 2013 of 23.84 pence per ordinary share was paid to eligible shareholders on 22 May 2014 and the 2014 interim dividend of 11.19 pence per ordinary share was paid to eligible shareholders on 25 September 2014.
The 2014 final dividend of 25.74 pence per ordinary share will be paid on 21 May 2015 in sterling to shareholders on the principal register and the Irish
branch register at 6.00pm BST on 27 March 2015 (Record Date), and in Hong Kong dollars to shareholders on the Hong Kong branch register at 4.30pm Hong Kong time on the Record Date (HK Shareholders). Holders of US American Depositary Receipts
(US Shareholders) will be paid their dividends in US dollars on or about 29 May 2015. The final dividend will be paid on or about 28 May 2015 in Singapore dollars to shareholders with shares standing to the credit of their securities
accounts with The Central Depository (Pte.) Limited (CDP) at 5.00pm Singapore time on the Record Date (SG Shareholders). The dividend payable to the HK Shareholders will be translated using the exchange rate quoted by the WM Company at the close of
business on 9 March 2015. The exchange rate at which the dividend payable to the SG Shareholders will be translated into Singapore dollars, will be determined by CDP.
Shareholders on the principal register and Irish branch register will be able to participate in a Dividend Reinvestment Plan.
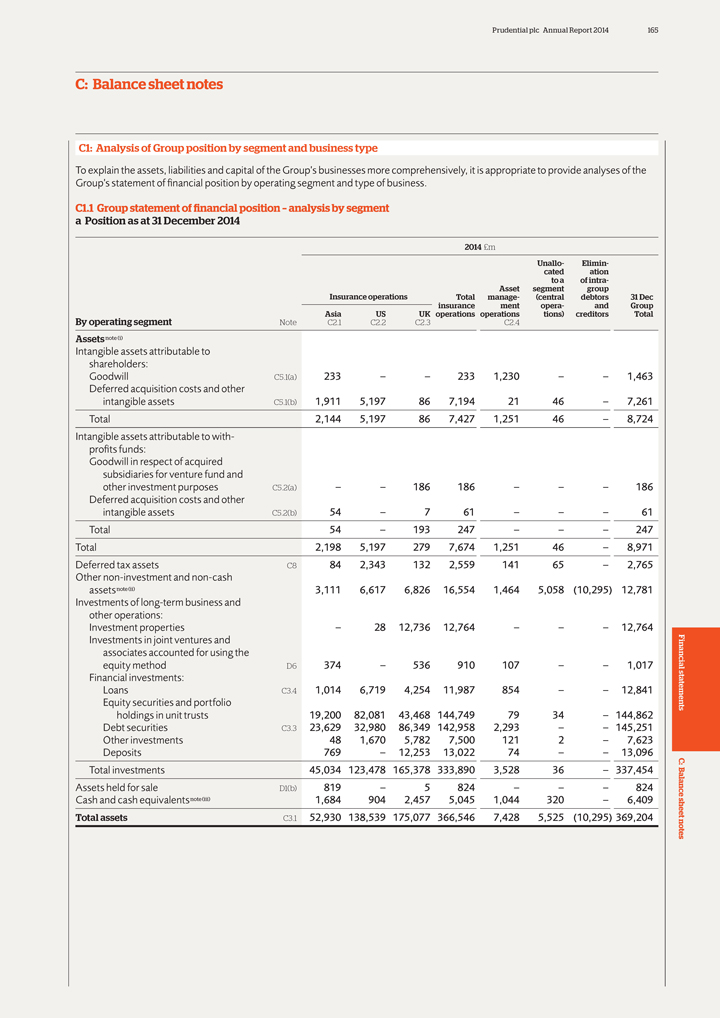
Prudential plc Annual Report 2014 165
C: Balance
sheet notes
C1: Analysis of Group position by segment and business type
To
explain the assets, liabilities and capital of the Group’s businesses more comprehensively, it is appropriate to provide analyses of the Group’s statement of financial position by operating segment and type of business.
C1.1 Group statement of financial position – analysis by segment a Position as at 31 December 2014
2014 £m
Unallo- Elimin-
cated ation
to a of intra-
Asset segment group
Insurance operations Total manage- (central debtors 31 Dec
insurance ment opera- and Group
Asia US UK operations operations tions) creditors Total
By operating segment Note C2.1 C2.2 C2.3 C2.4
Assets note (i)
Intangible assets attributable to
shareholders:
Goodwill C5.1(a) 233 – – 233 1,230 – – 1,463
Deferred acquisition costs
and other
intangible assets C5.1(b) 1,911 5,197 86 7,194 21 46 – 7,261
Total 2,144 5,197 86 7,427 1,251 46 – 8,724
Intangible assets
attributable to with-
profits funds:
Goodwill in respect of acquired
subsidiaries for venture fund and
other investment purposes C5.2(a) –
– 186 186 – – – 186
Deferred acquisition costs and other
intangible assets C5.2(b) 54 – 7 61 – – – 61
Total 54
– 193 247 – – – 247
Total 2,198 5,197 279 7,674 1,251 46 – 8,971
Deferred tax assets C8 84 2,343 132 2,559 141 65 – 2,765
Other non-investment and
non-cash
assetsnote(ii) 3,111 6,617 6,826 16,554 1,464 5,058 (10,295) 12,781
Investments of long-term business and
other operations:
Investment properties – 28 12,736 12,764 – – – 12,764
Investments in joint
ventures and
associates accounted for using the
equity method D6 374 –
536 910 107 – – 1,017
Financial investments:
Loans C3.4 1,014 6,719
4,254 11,987 854 – – 12,841
Equity securities and portfolio
holdings in unit trusts 19,200 82,081 43,468 144,749 79 34 – 144,862
Debt securities C3.3 23,629 32,980 86,349 142,958 2,293 – – 145,251
Other investments 48 1,670 5,782 7,500 121 2 – 7,623
Deposits 769 –
12,253 13,022 74 – – 13,096
Total investments 45,034 123,478 165,378 333,890 3,528 36 – 337,454
Assets held for sale D1(b) 819 – 5 824 – – – 824
Cash and cash
equivalentsnote(iii) 1,684 904 2,457 5,045 1,044 320 – 6,409
Total assets C3.1 52,930 138,539 175,077 366,546 7,428 5,525 (10,295) 369,204
Financial statements C: Balance sheet notes
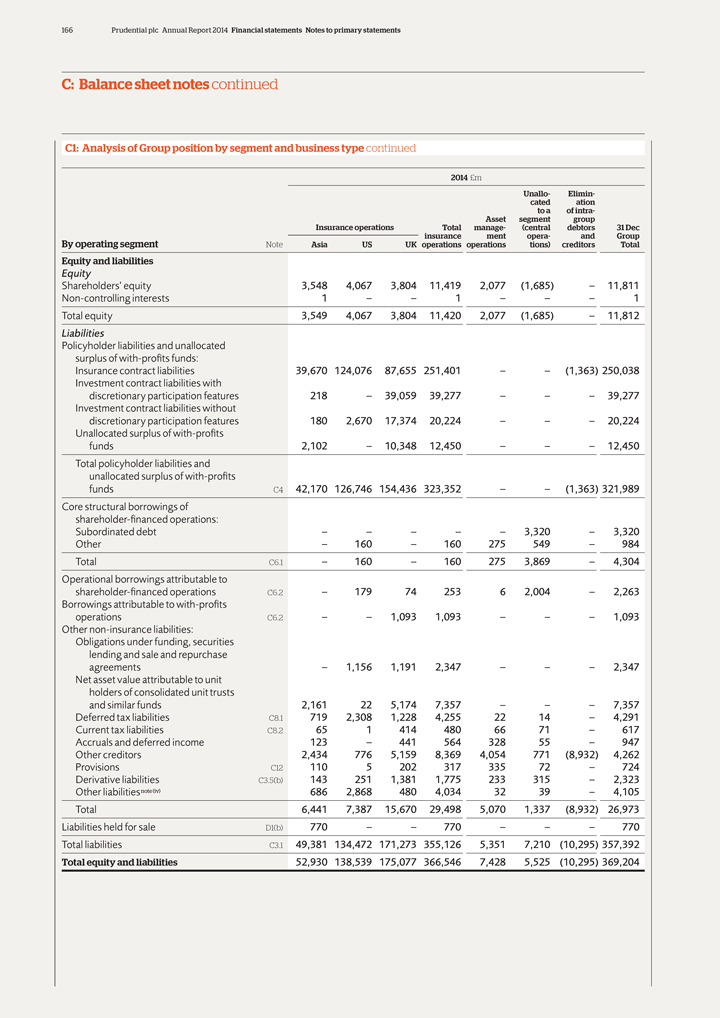
166 Prudential plc Annual Report 2014 Financial statements Notes to primary statements
C: Balance sheet notes continued
C1: Analysis of Group position by segment and business type
continued
2014 £m
Unallo- Elimin-
cated ation
to a of intra-
Asset segment group
Insurance operations Total manage- (central debtors 31 Dec
insurance ment opera- and Group
By operating segment Note Asia US UK operations operations
tions) creditors Total
Equity and liabilities
Equity
Shareholders’ equity 3,548 4,067 3,804 11,419 2,077 (1,685) – 11,811
Non-controlling interests 1 – – 1 – – – 1
Total
equity 3,549 4,067 3,804 11,420 2,077 (1,685) – 11,812
Liabilities
Policyholder liabilities and unallocated
surplus of with-profits funds:
Insurance contract liabilities 39,670 124,076 87,655 251,401 – – (1,363) 250,038
Investment contract liabilities with
discretionary participation features 218 – 39,059
39,277 – – – 39,277
Investment contract liabilities without
discretionary participation features 180 2,670 17,374 20,224 – – – 20,224
Unallocated surplus of with-profits
funds 2,102 – 10,348 12,450 – – –
12,450
Total policyholder liabilities and
unallocated surplus of with-profits
funds C4 42,170 126,746 154,436 323,352 – – (1,363) 321,989
Core structural borrowings of
shareholder-financed operations:
Subordinated debt – – – – – 3,320 – 3,320
Other – 160
– 160 275 549 – 984
Total C6.1 – 160 – 160 275 3,869 – 4,304
Operational borrowings attributable to
shareholder-financed operations C6.2 – 179 74 253
6 2,004 – 2,263
Borrowings attributable to with-profits
operations C6.2
– – 1,093 1,093 – – – 1,093
Other non-insurance liabilities:
Obligations under funding, securities
lending and sale and repurchase
agreements – 1,156 1,191 2,347 – – – 2,347
Net asset value attributable to
unit
holders of consolidated unit trusts
and similar funds 2,161 22 5,174
7,357 – – – 7,357
Deferred tax liabilities C8.1 719 2,308 1,228 4,255 22 14 – 4,291
Current tax liabilities C8.2 65 1 414 480 66 71 – 617
Accruals and deferred income 123
– 441 564 328 55 – 947
Other creditors 2,434 776 5,159 8,369 4,054 771 (8,932) 4,262
Provisions C12 110 5 202 317 335 72 – 724
Derivative liabilities C3.5(b) 143 251 1,381
1,775 233 315 – 2,323
Other liabilitiesnote(iv) 686 2,868 480 4,034 32 39 – 4,105
Total 6,441 7,387 15,670 29,498 5,070 1,337 (8,932) 26,973
Liabilities held for sale
D1(b) 770 – – 770 – – – 770
Total liabilities C3.1 49,381 134,472 171,273 355,126 5,351 7,210 (10,295) 357,392
Total equity and liabilities 52,930 138,539 175,077 366,546 7,428 5,525 (10,295) 369,204
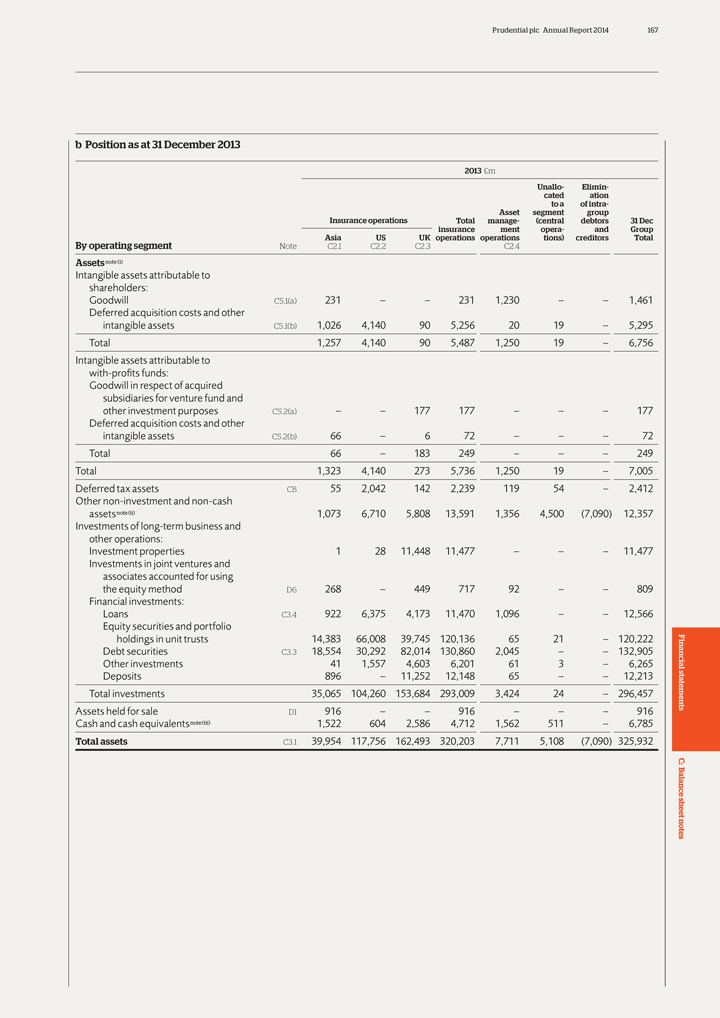
Prudential plc Annual Report 2014 167
b Position
as at 31 December 2013
2013 £m
Unallo- Elimin-
cated ation
to a of intra-
Asset segment group
Insurance operations Total manage- (central debtors 31 Dec
insurance ment opera- and Group
Asia US UK operations operations tions) creditors Total
By operating segment Note C2.1 C2.2 C2.3 C2.4
Assets note (i)
Intangible assets attributable to
shareholders:
Goodwill C5.1(a) 231 – – 231 1,230 – – 1,461
Deferred acquisition costs
and other
intangible assets C5.1(b) 1,026 4,140 90 5,256 20 19 – 5,295
Total 1,257 4,140 90 5,487 1,250 19 – 6,756
Intangible assets
attributable to
with-profits funds:
Goodwill in respect of acquired
subsidiaries for venture fund and
other investment purposes C5.2(a) –
– 177 177 – – – 177
Deferred acquisition costs and other
intangible assets C5.2(b) 66 – 6 72 – – – 72
Total 66
– 183 249 – – – 249
Total 1,323 4,140 273 5,736 1,250 19 – 7,005
Deferred tax assets C8 55 2,042 142 2,239 119 54 – 2,412
Other non-investment and
non-cash
assetsnote(ii) 1,073 6,710 5,808 13,591 1,356 4,500 (7,090) 12,357
Investments of long-term business and
other operations:
Investment properties 1 28 11,448 11,477 – – – 11,477
Investments in joint
ventures and
associates accounted for using
the equity method D6 268 –
449 717 92 – – 809
Financial investments:
Loans C3.4 922 6,375
4,173 11,470 1,096 – – 12,566
Equity securities and portfolio
holdings in unit trusts 14,383 66,008 39,745 120,136 65 21 – 120,222
Debt securities C3.3 18,554 30,292 82,014 130,860 2,045 – – 132,905
Other investments 41 1,557 4,603 6,201 61 3 – 6,265
Deposits 896 –
11,252 12,148 65 – – 12,213
Total investments 35,065 104,260 153,684 293,009 3,424 24 – 296,457
Assets held for sale D1 916 – – 916 – – – 916
Cash and cash
equivalentsnote(iii) 1,522 604 2,586 4,712 1,562 511 – 6,785
Total assets C3.1 39,954 117,756 162,493 320,203 7,711 5,108 (7,090) 325,932
Financial statements C: Balance sheet notes
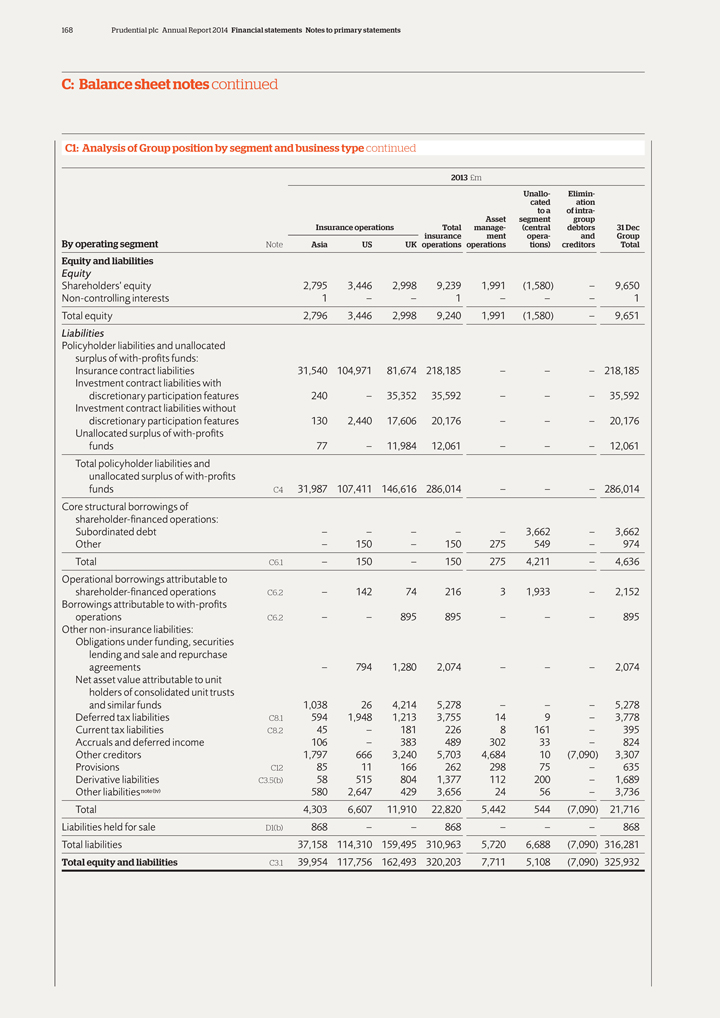
168 Prudential plc Annual Report 2014 Financial statements Notes to primary statements
C: Balance sheet notes continued
C1: Analysis of Group position by segment and business type
continued
2013 £m
Unallo- Elimin-
cated ation
to a of intra-
Asset segment group
Insurance operations Total manage- (central debtors 31 Dec
insurance ment opera- and Group
By operating segment Note Asia US UK operations operations
tions) creditors Total
Equity and liabilities
Equity
Shareholders’ equity 2,795 3,446 2,998 9,239 1,991 (1,580) – 9,650
Non-controlling interests 1 – – 1 – – – 1
Total
equity 2,796 3,446 2,998 9,240 1,991 (1,580) – 9,651
Liabilities
Policyholder liabilities and unallocated
surplus of with-profits funds:
Insurance contract liabilities 31,540 104,971 81,674 218,185 – – – 218,185
Investment contract liabilities with
discretionary participation features 240 – 35,352
35,592 – – – 35,592
Investment contract liabilities without
discretionary participation features 130 2,440 17,606 20,176 – – – 20,176
Unallocated surplus of with-profits
funds 77 – 11,984 12,061 – – – 12,061
Total policyholder liabilities and
unallocated surplus of with-profits
funds C4 31,987 107,411 146,616 286,014 – – – 286,014
Core
structural borrowings of
shareholder-financed operations:
Subordinated debt
– – – – – 3,662 – 3,662
Other – 150 – 150 275 549 – 974
Total C6.1 – 150 – 150 275 4,211 – 4,636
Operational borrowings attributable to
shareholder-financed operations C6.2 – 142 74 216 3 1,933 – 2,152
Borrowings attributable to with-profits
operations C6.2 – – 895 895
– – – 895
Other non-insurance liabilities:
Obligations under
funding, securities
lending and sale and repurchase
agreements – 794
1,280 2,074 – – – 2,074
Net asset value attributable to unit
holders of consolidated unit trusts
and similar funds 1,038 26 4,214 5,278
– – – 5,278
Deferred tax liabilities C8.1 594 1,948 1,213 3,755 14 9 – 3,778
Current tax liabilities C8.2 45 – 181 226 8 161 – 395
Accruals and deferred income
106 – 383 489 302 33 – 824
Other creditors 1,797 666 3,240 5,703 4,684 10 (7,090) 3,307
Provisions C12 85 11 166 262 298 75 – 635
Derivative liabilities C3.5(b) 58 515 804 1,377
112 200 – 1,689
Other liabilitiesnote(iv) 580 2,647 429 3,656 24 56 – 3,736
Total 4,303 6,607 11,910 22,820 5,442 544 (7,090) 21,716
Liabilities held for sale D1(b)
868 – – 868 – – – 868
Total liabilities 37,158 114,310 159,495 310,963 5,720 6,688 (7,090) 316,281
Total equity and liabilities C3.1 39,954 117,756 162,493 320,203 7,711 5,108 (7,090) 325,932
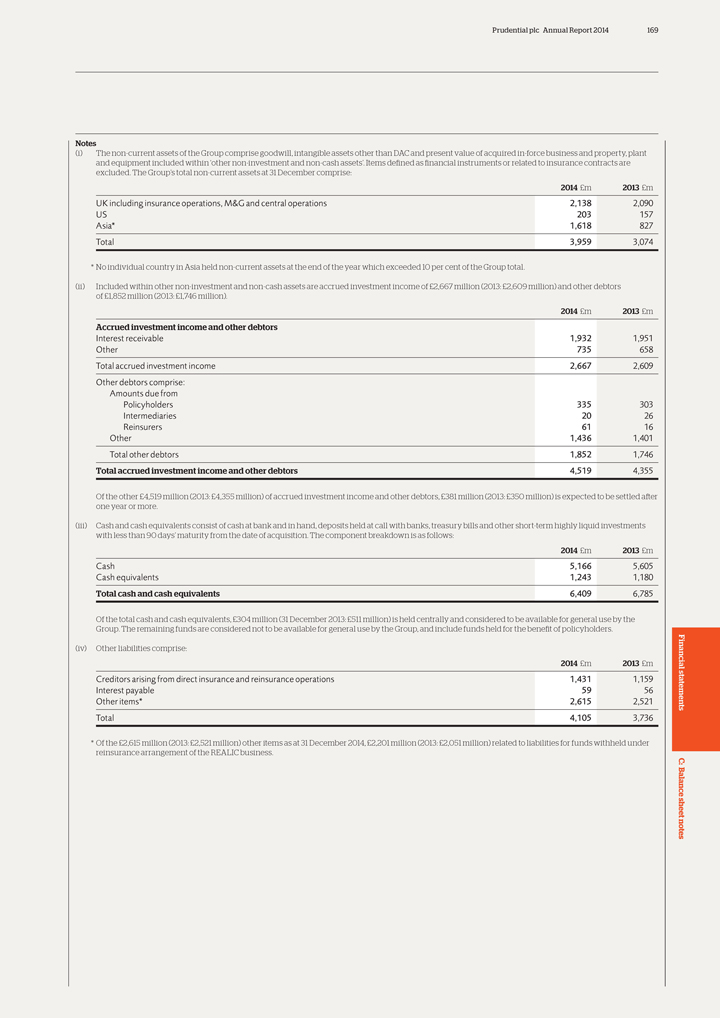
Prudential plc Annual Report 2014 169
Notes
(i) The non-current assets of the Group comprise goodwill, intangible assets other than DAC and present value of acquired in-force business and property, plant and
equipment included within ‘other non-investment and non-cash assets’. Items defined as financial instruments or related to insurance contracts are excluded. The Group’s total non-current assets at 31 December comprise:
UK including insurance operations, M&G and central operations 2,138 2,090
US 203 157
Asia* 1,618 827
Total 3,959 3,074
* No individual country in Asia held non-current assets at the end of the
year which exceeded 10 per cent of the Group total.
(ii) Included within other non-investment and non-cash assets are accrued investment income of
£2,667 million (2013: £2,609 million) and other debtors
of £1,852 million (2013: £1,746 million).
Accrued investment income and other debtors
Interest receivable 1,932 1,951 Other 735 658
Total accrued investment income 2,667 2,609 Other debtors comprise: Amounts due from Policyholders 335 303 Intermediaries 20 26 Reinsurers 61 16 Other 1,436 1,401 Total other debtors 1,852 1,746
Total accrued investment income and other debtors 4,519 4,355
Of the other
£4,519 million (2013: £4,355 million) of accrued investment income and other debtors, £381 million (2013: £350 million) is expected to be settled after
one year or more.
(iii) Cash and cash equivalents consist of cash at bank and in hand,
deposits held at call with banks, treasury bills and other short-term highly liquid investments
with less than 90 days’ maturity from the date of acquisition.
The component breakdown is as follows:
2014 £m 2013 £m
Cash 5,166
5,605
Cash equivalents 1,243 1,180
Total cash and cash equivalents 6,409
6,785
Of the total cash and cash equivalents, £304 million (31 December 2013: £511 million) is held centrally and considered to be available for
general use by the Group. The remaining funds are considered not to be available for general use by the Group, and include funds held for the benefit of policyholders.
(iv) Other liabilities comprise:
2014 £m 2013 £m
Creditors arising from direct insurance and reinsurance operations 1,431 1,159 Interest payable 59 56 Other items* 2,615 2,521
Total 4,105 3,736
Of the £2,615 million (2013: £2,521 million) other items as
at 31 December 2014, £2,201 million (2013: £2,051 million) related to liabilities for funds withheld under reinsurance arrangement of the REALIC business.
Financial statements C: Balance sheet notes
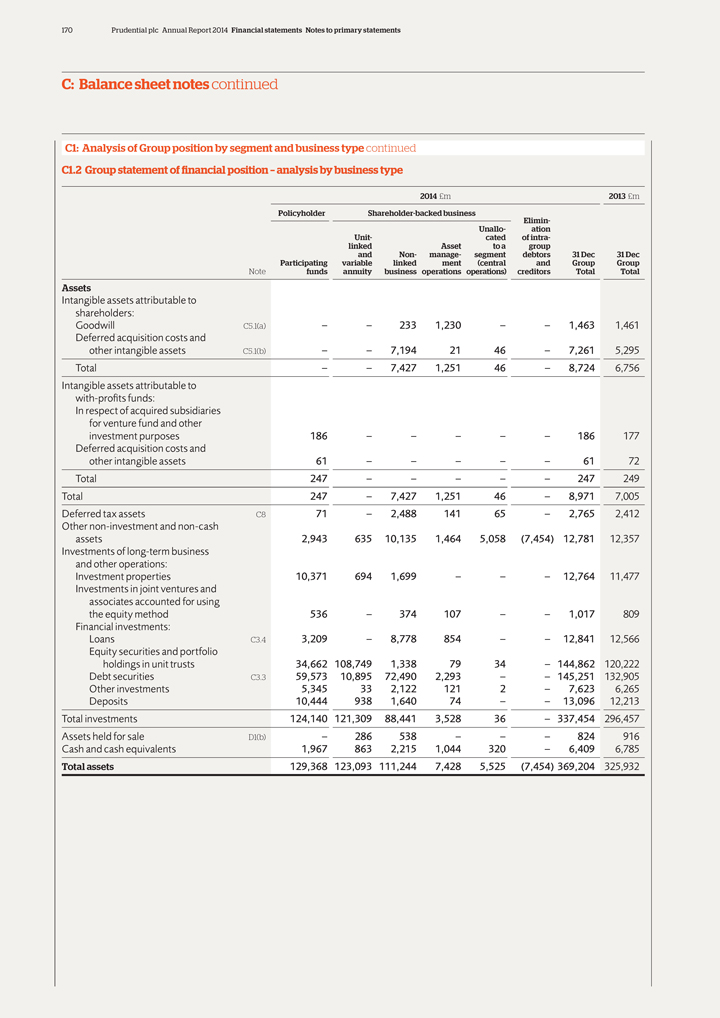
170 Prudential plc Annual Report 2014 Financial statements Notes to primary statements
C: Balance sheet notes continued
C1: Analysis of Group position by segment and business type
continued
C1.2 Group statement of financial position – analysis by business type
2014 £m 2013 £m
Policyholder Shareholder-backed business
Elimin-
Unallo- ation
Unit- cated of intra-
linked Asset to a group
and Non- manage- segment debtors 31 Dec 31 Dec
Participating variable linked ment (central and
Group Group
Note funds annuity business operations operations) creditors Total Total
Assets
Intangible assets attributable to
shareholders:
Goodwill C5.1(a) – – 233 1,230 – – 1,463 1,461
Deferred acquisition costs and
other intangible assets C5.1(b) – – 7,194 21 46
– 7,261 5,295
Total – – 7,427 1,251 46 – 8,724 6,756
Intangible assets attributable to
with-profits funds:
In respect of acquired subsidiaries
for venture fund and other
investment purposes 186 – – – – – 186 177
Deferred acquisition costs
and
other intangible assets 61 – – – – – 61 72
Total
247 – – – – – 247 249
Total 247 – 7,427 1,251 46 – 8,971 7,005
Deferred tax assets C8 71 – 2,488 141 65 – 2,765 2,412
Other non-investment and
non-cash
assets 2,943 635 10,135 1,464 5,058 (7,454) 12,781 12,357
Investments of long-term business
and other operations:
Investment properties 10,371 694 1,699 – – – 12,764 11,477
Investments in joint
ventures and
associates accounted for using
the equity method 536 – 374
107 – – 1,017 809
Financial investments:
Loans C3.4 3,209 –
8,778 854 – – 12,841 12,566
Equity securities and portfolio
holdings in unit trusts 34,662 108,749 1,338 79 34 – 144,862 120,222
Debt securities C3.3 59,573 10,895 72,490 2,293 – – 145,251 132,905
Other investments 5,345 33 2,122 121 2 – 7,623 6,265
Deposits 10,444 938
1,640 74 – – 13,096 12,213
Total investments 124,140 121,309 88,441 3,528 36 – 337,454 296,457
Assets held for sale D1(b) – 286 538 – – – 824 916
Cash and cash
equivalents 1,967 863 2,215 1,044 320 – 6,409 6,785
Total assets 129,368 123,093 111,244 7,428 5,525 (7,454) 369,204 325,932
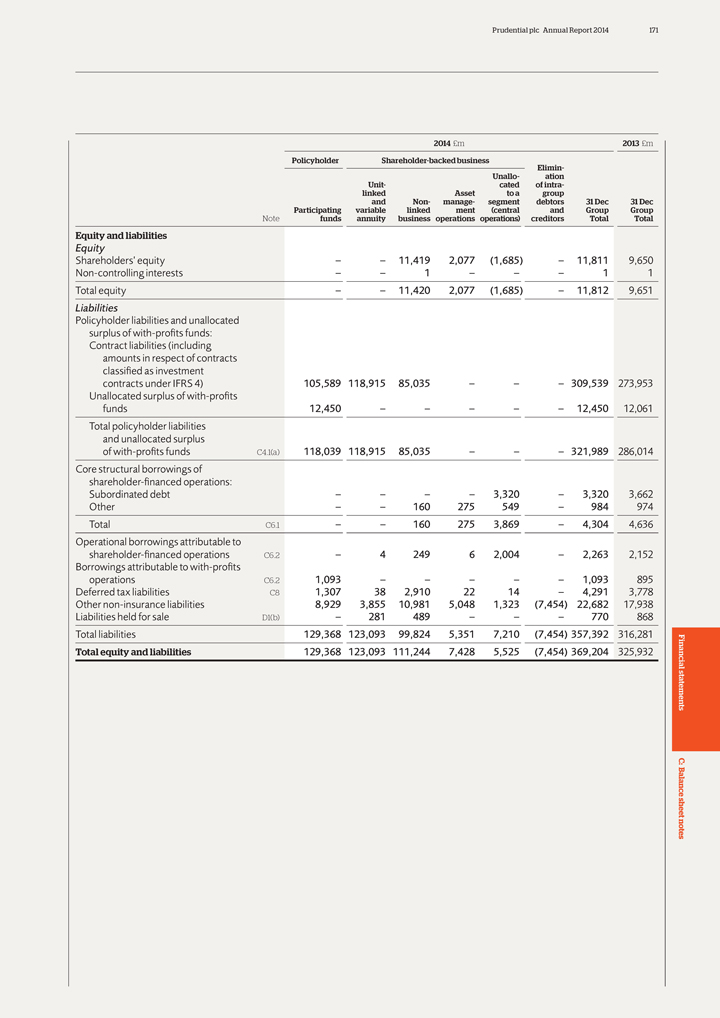
Prudential plc Annual Report 2014 171
2014
£m 2013 £m
Policyholder Shareholder-backed business
Elimin-
Unallo- ation
Unit- cated of intra-
linked Asset to a group
and Non- manage- segment debtors 31 Dec 31 Dec
Participating variable linked ment (central and Group Group
Note funds annuity business
operations operations) creditors Total Total
Equity and liabilities
Equity
Shareholders’ equity – – 11,419 2,077 (1,685) – 11,811 9,650
Non-controlling interests – – 1 – – – 1 1
Total equity – –
11,420 2,077 (1,685) – 11,812 9,651
Liabilities
Policyholder
liabilities and unallocated
surplus of with-profits funds:
Contract
liabilities (including
amounts in respect of contracts
classified as
investment
contracts under IFRS 4) 105,589 118,915 85,035 – – – 309,539 273,953
Unallocated surplus of with-profits
funds 12,450 – – – – – 12,450
12,061
Total policyholder liabilities
and unallocated surplus
of with-profits funds C4.1(a) 118,039 118,915 85,035 – – – 321,989 286,014
Core
structural borrowings of
shareholder-financed operations:
Subordinated debt
– – – – 3,320 – 3,320 3,662
Other – – 160 275 549 – 984 974
Total C6.1 – – 160 275 3,869 – 4,304 4,636
Operational borrowings attributable
to
shareholder-financed operations C6.2 – 4 249 6 2,004 – 2,263 2,152
Borrowings attributable to with-profits
operations C6.2 1,093 – –
– – – 1,093 895
Deferred tax liabilities C8 1,307 38 2,910 22 14 – 4,291 3,778
Other non-insurance liabilities 8,929 3,855 10,981 5,048 1,323 (7,454) 22,682 17,938
Liabilities held for sale D1(b) – 281 489 – – – 770 868
Total liabilities 129,368 123,093 99,824 5,351 7,210 (7,454) 357,392 316,281
Total equity and liabilities 129,368 123,093 111,244 7,428 5,525 (7,454) 369,204 325,932
Financial statements C: Balance sheet notes
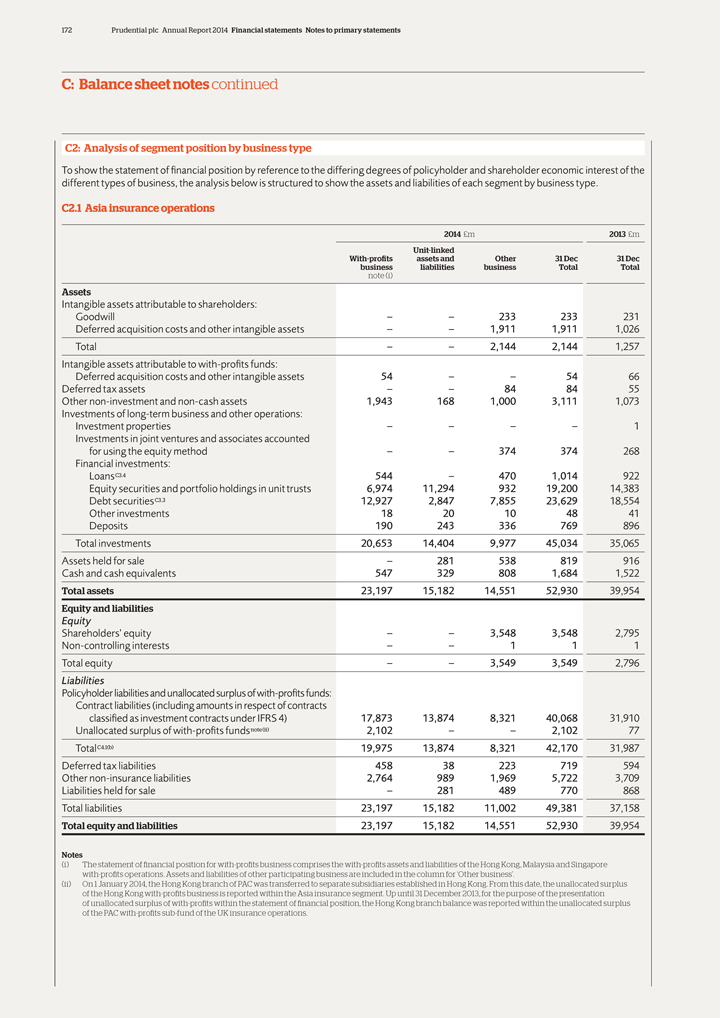
172 Prudential plc Annual Report 2014 Financial statements Notes to primary statements
C: Balance sheet notes continued
C2: Analysis of segment position by business type
To show the statement of financial position by reference to the differing degrees of policyholder and shareholder economic interest of the different types of business, the analysis
below is structured to show the assets and liabilities of each segment by business type.
C2.1 Asia insurance operations
2014 £m 2013 £m
Unit-linked
With-profits assets and Other 31 Dec 31 Dec
business liabilities business Total Total
note (i)
Assets
Intangible assets attributable to shareholders:
Goodwill – – 233 233 231
Deferred acquisition costs and other intangible assets – – 1,911 1,911 1,026
Total
– – 2,144 2,144 1,257
Intangible assets attributable to with-profits funds:
Deferred acquisition costs and other intangible assets 54 – – 54 66
Deferred tax
assets – – 84 84 55
Other non-investment and non-cash assets 1,943 168 1,000 3,111 1,073
Investments of long-term business and other operations:
Investment properties – –
– – 1
Investments in joint ventures and associates accounted
for
using the equity method – – 374 374 268
Financial investments:
LoansC3.4 544 – 470 1,014 922
Equity securities and portfolio holdings
in unit trusts 6,974 11,294 932 19,200 14,383
Debt securitiesC3.3 12,927 2,847 7,855 23,629 18,554
Other investments 18 20 10 48 41
Deposits 190 243 336 769 896
Total investments 20,653 14,404 9,977 45,034 35,065
Assets held for sale – 281 538 819
916
Cash and cash equivalents 547 329 808 1,684 1,522
Total assets 23,197
15,182 14,551 52,930 39,954
Equity and liabilities
Equity
Shareholders’ equity – – 3,548 3,548 2,795
Non-controlling interests –
– 1 1 1
Total equity – – 3,549 3,549 2,796
Liabilities
Policyholder liabilities and unallocated surplus of with-profits funds:
Contract liabilities (including amounts in respect of contracts
classified as
investment contracts under IFRS 4) 17,873 13,874 8,321 40,068 31,910
Unallocated surplus of with-profits fundsnote(ii) 2,102 – – 2,102 77
TotalC4.1(b) 19,975 13,874 8,321 42,170 31,987
Deferred tax liabilities 458 38 223 719 594
Other non-insurance liabilities 2,764 989 1,969 5,722 3,709
Liabilities held
for sale – 281 489 770 868
Total liabilities 23,197 15,182 11,002 49,381 37,158
Total equity and liabilities 23,197 15,182 14,551 52,930 39,954
Notes
(i) The statement of financial position for with-profits business comprises the with-profits assets and liabilities of the Hong Kong, Malaysia and Singapore
with-profits operations. Assets and liabilities of other participating business are included in the column for ‘Other business’.
(ii) On 1 January 2014, the Hong Kong branch of PAC was transferred to separate subsidiaries established in Hong Kong. From this date, the unallocated surplus
of the Hong Kong with-profits business is reported within the Asia insurance segment. Up until 31 December 2013, for the purpose of the presentation
of unallocated surplus of with-profits within the statement of financial position, the Hong Kong branch balance was reported within the unallocated surplus
of the PAC with-profits sub-fund of the UK insurance operations.
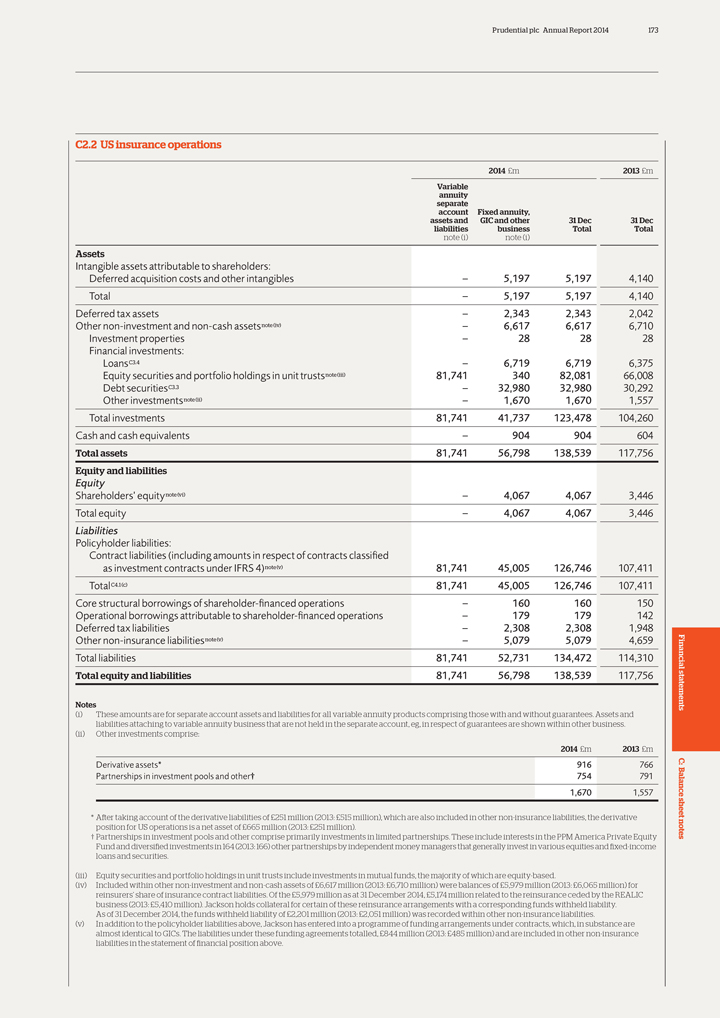
Prudential plc Annual Report 2014 173
C2.2 US
insurance operations
2014 £m 2013 £m
Variable
annuity
separate
account Fixed annuity,
assets and GIC and other 31 Dec 31 Dec
liabilities business Total Total
note (i) note (i)
Assets
Intangible assets attributable to shareholders:
Deferred acquisition costs and other intangibles – 5,197 5,197 4,140
Total – 5,197
5,197 4,140
Deferred tax assets – 2,343 2,343 2,042
Other non-investment
and non-cash assetsnote(iv) – 6,617 6,617 6,710
Investment properties – 28 28 28
Financial investments:
LoansC3.4 – 6,719 6,719 6,375
Equity securities and portfolio holdings in unit trustsnote(iii) 81,741 340 82,081 66,008
Debt
securitiesC3.3 – 32,980 32,980 30,292
Other investmentsnote(ii) – 1,670 1,670 1,557
Total investments 81,741 41,737 123,478 104,260
Cash and cash equivalents – 904 904 604
Total assets 81,741 56,798 138,539 117,756
Equity and liabilities
Equity
Shareholders’ equitynote(vi) – 4,067 4,067 3,446
Total equity – 4,067 4,067 3,446
Liabilities
Policyholder liabilities:
Contract liabilities (including amounts in respect of contracts
classified
as investment contracts under IFRS 4)note(v) 81,741 45,005 126,746 107,411
TotalC4.1(c) 81,741 45,005 126,746 107,411
Core structural borrowings of shareholder-financed
operations – 160 160 150
Operational borrowings attributable to shareholder-financed operations – 179 179 142
Deferred tax liabilities – 2,308 2,308 1,948
Other non-insurance liabilitiesnote(v)
– 5,079 5,079 4,659
Total liabilities 81,741 52,731 134,472 114,310
Total equity and liabilities 81,741 56,798 138,539 117,756
Notes
(i) These amounts are for separate account assets and liabilities for all variable annuity products comprising those with and without guarantees. Assets and liabilities attaching
to variable annuity business that are not held in the separate account, eg, in respect of guarantees are shown within other business. (ii) Other investments comprise:
2014 £m 2013 £m
Derivative assets* 916 766 Partnerships in investment pools and
other† 754 791
1,670 1,557
* After taking account of the derivative
liabilities of £251 million (2013: £515 million), which are also included in other non-insurance liabilities, the derivative position for US operations is a net asset of £665 million (2013: £251 million).
† Partnerships in investment pools and other comprise primarily investments in limited partnerships. These include interests in the PPM America Private Equity
Fund and diversified investments in 164 (2013: 166) other partnerships by independent money managers that generally invest in various equities and fixed-income loans and securities.
(iii) Equity securities and portfolio holdings in unit trusts include investments in mutual funds, the majority of which are equity-based.
(iv) Included within other non-investment and non-cash assets of £6,617 million (2013: £6,710 million) were balances of £5,979 million (2013:
£6,065 million) for reinsurers’ share of insurance contract liabilities. Of the £5,979 million as at 31 December 2014, £5,174 million related to the reinsurance ceded by the REALIC business (2013: £5,410
million). Jackson holds collateral for certain of these reinsurance arrangements with a corresponding funds withheld liability.
As of 31 December 2014, the
funds withheld liability of £2,201 million (2013: £2,051 million) was recorded within other non-insurance liabilities.
(v) In addition to the
policyholder liabilities above, Jackson has entered into a programme of funding arrangements under contracts, which, in substance are almost identical to GICs. The liabilities under these funding agreements totalled, £844 million (2013:
£485 million) and are included in other non-insurance liabilities in the statement of financial position above.
Financial statements C: Balance sheet notes
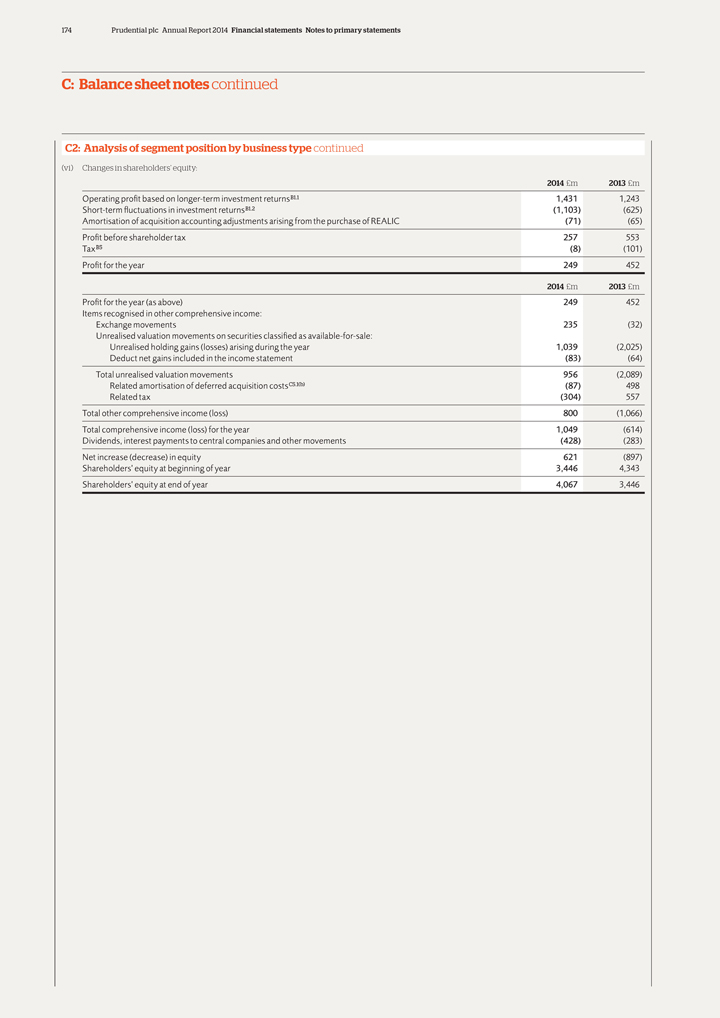
174 Prudential plc Annual Report 2014 Financial statements Notes to primary statements
C: Balance sheet notes continued
C2: Analysis of segment position by business type continued
(vi) Changes in shareholders’ equity:
2014 £m 2013 £m
Operating profit based on longer-term investment returnsB1.1 1,431 1,243
Short-term fluctuations in investment returnsB1.2 (1,103) (625)
Amortisation of acquisition accounting adjustments arising from the purchase of REALIC (71) (65)
Profit before shareholder tax 257 553
TaxB5 (8) (101)
Profit for the year 249 452
2014 £m 2013 £m
Profit for the year (as above) 249 452
Items recognised in other comprehensive income:
Exchange movements 235 (32)
Unrealised valuation movements on securities
classified as available-for-sale:
Unrealised holding gains (losses) arising during the year 1,039 (2,025)
Deduct net gains included in the income statement (83) (64)
Total unrealised valuation
movements 956 (2,089)
Related amortisation of deferred acquisition costsC5.1(b) (87) 498
Related tax (304) 557
Total other comprehensive income (loss) 800 (1,066)
Total comprehensive income (loss) for the year 1,049 (614)
Dividends, interest payments to
central companies and other movements (428) (283)
Net increase (decrease) in equity 621 (897)
Shareholders’ equity at beginning of year 3,446 4,343
Shareholders’ equity at end of
year 4,067 3,446

Prudential plc Annual Report 2014 175
C2.3 UK
insurance operations
Of the total investments of £165 billion in UK insurance operations, £103 billion of investments are held by Scottish Amicable
Insurance Fund and the PAC with-profits sub-fund. Shareholders are exposed only indirectly to value movements on these assets.
2014 £m 2013 £m
Other funds and subsidiaries
Scottish Unit- Annuity
Amicable PAC with- linked and other
Insurance profits assets and long-term 31 Dec 31 Dec
Fund sub-fund liabilities business Total Total Total
By operating segment
note (ii) note (i)
Assets
Intangible assets attributable to shareholders:
Deferred acquisition costs and other intangible assets – – – 86 86 86 90
Total – – – 86 86 86 90
Intangible assets attributable to with-profits funds:
In respect of acquired subsidiaries for venture fund and
other investment
purposes – 186 – – – 186 177
Deferred acquisition costs – 7 – – – 7 6
Total – 193 – – – 193 183
Total – 193 – 86 86 279 273
Deferred tax assets – 71 – 61 61 132 142
Other non-investment and
non-cash assets 208 3,633 467 2,518 2,985 6,826 5,808
Investments of long-term business and other operations:
Investment properties 390 9,981 694 1,671 2,365 12,736 11,448
Investments in joint ventures
and associates accounted
for using the equity method – 536 – – – 536 449
Financial investments:
LoansC3.4 66 2,599 – 1,589 1,589 4,254 4,173
Equity securities and portfolio holdings in unit trusts 2,508 25,180 15,714 66 15,780 43,468 39,745
Debt securitiesC3.3 2,709 43,937 8,048 31,655 39,703 86,349 82,014
Other investmentsnote(iii)
283 5,044 13 442 455 5,782 4,603
Deposits 728 9,526 695 1,304 1,999 12,253 11,252
Total investments 6,684 96,803 25,164 36,727 61,891 165,378 153,684
Properties held for sale
– – 5 – 5 5 –
Cash and cash equivalents 84 1,336 534 503 1,037 2,457 2,586
Total assets 6,976 102,036 26,170 39,895 66,065 175,077 162,493
Financial statements C:
Balance sheet notes
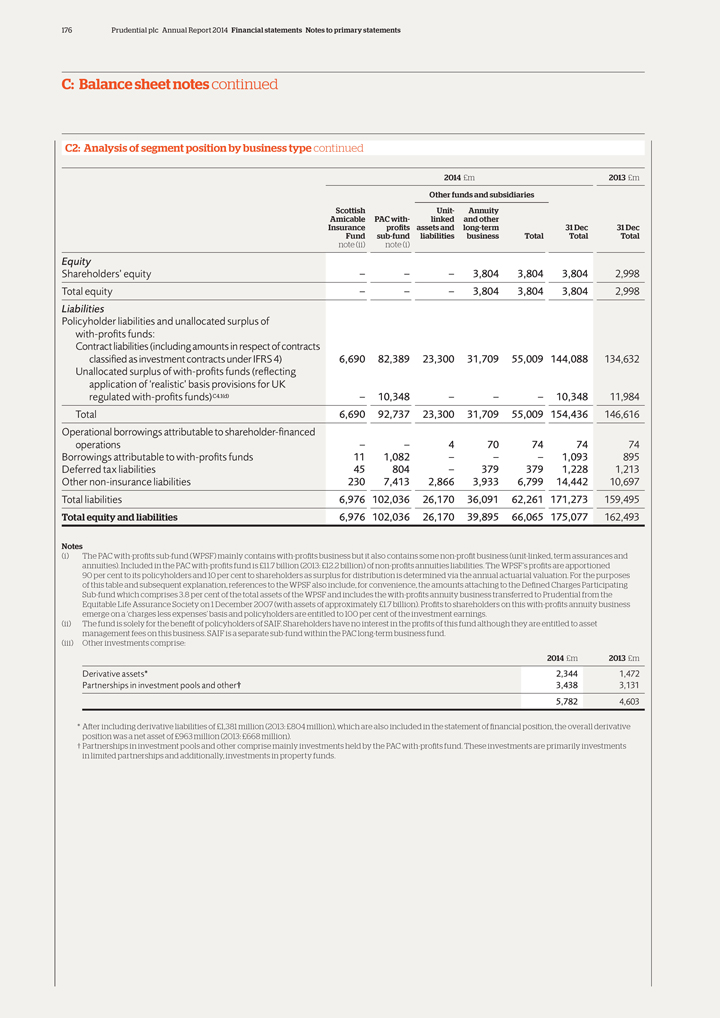
176 Prudential plc Annual Report 2014 Financial statements Notes to primary statements
C: Balance sheet notes continued
C2: Analysis of segment position by business type continued
2014 £m 2013 £m
Other funds and subsidiaries
Scottish Unit- Annuity
Amicable PAC with- linked and other
Insurance profits assets and long-term 31 Dec 31 Dec
Fund sub-fund liabilities business Total
Total Total
note (ii) note (i)
Equity
Shareholders’ equity – – – 3,804 3,804 3,804 2,998
Total equity –
– – 3,804 3,804 3,804 2,998
Liabilities
Policyholder liabilities
and unallocated surplus of
with-profits funds:
Contract liabilities
(including amounts in respect of contracts
classified as investment contracts under IFRS 4) 6,690 82,389 23,300 31,709 55,009 144,088 134,632
Unallocated surplus of with-profits funds (reflecting
application of ‘realistic’
basis provisions for UK
regulated with-profits funds)C4.1(d) – 10,348 – – – 10,348 11,984
Total 6,690 92,737 23,300 31,709 55,009 154,436 146,616
Operational borrowings attributable to
shareholder-financed
operations – – 4 70 74 74 74
Borrowings
attributable to with-profits funds 11 1,082 – – – 1,093 895
Deferred tax liabilities 45 804 – 379 379 1,228 1,213
Other non-insurance liabilities 230 7,413 2,866 3,933 6,799 14,442 10,697
Total liabilities
6,976 102,036 26,170 36,091 62,261 171,273 159,495
Total equity and liabilities 6,976 102,036 26,170 39,895 66,065 175,077 162,493
Notes
(i) The PAC with-profits sub-fund (WPSF) mainly contains with-profits business but it
also contains some non-profit business (unit-linked, term assurances and annuities). Included in the PAC with-profits fund is £11.7 billion (2013: £12.2 billion) of non-profits annuities liabilities. The WPSF’s profits are
apportioned 90 per cent to its policyholders and 10 per cent to shareholders as surplus for distribution is determined via the annual actuarial valuation. For the purposes of this table and subsequent explanation, references to the WPSF
also include, for convenience, the amounts attaching to the Defined Charges Participating Sub-fund which comprises 3.8 per cent of the total assets of the WPSF and includes the with-profits annuity business transferred to Prudential from the
Equitable Life Assurance Society on 1 December 2007 (with assets of approximately £1.7 billion). Profits to shareholders on this with-profits annuity business emerge on a ‘charges less expenses’ basis and policyholders are
entitled to 100 per cent of the investment earnings.
(ii) The fund is solely for the benefit of policyholders of SAIF. Shareholders have no interest in the
profits of this fund although they are entitled to asset management fees on this business. SAIF is a separate sub-fund within the PAC long-term business fund.
(iii) Other investments comprise:
2014 £m 2013 £m
Derivative assets* 2,344 1,472
Partnerships in investment pools and other† 3,438 3,131
5,782 4,603
* After including derivative liabilities of
£1,381 million (2013: £804 million), which are also included in the statement of financial position, the overall derivative position was a net asset of £963 million (2013: £668 million).
† Partnerships in investment pools and other comprise mainly investments held by the PAC with-profits fund. These investments are primarily investments in limited partnerships
and additionally, investments in property funds.
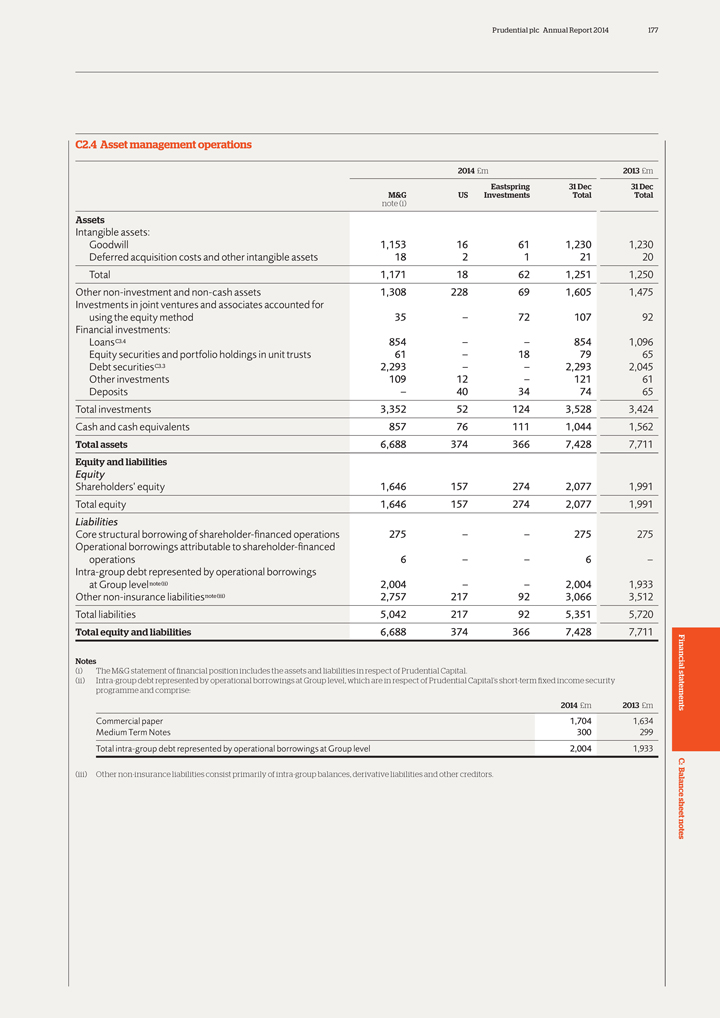
Prudential plc Annual Report 2014 177
C2.4 Asset
management operations
2014 £m 2013 £m
Eastspring 31 Dec 31 Dec
M&G US Investments Total Total
note (i)
Assets
Intangible assets:
Goodwill 1,153 16 61 1,230 1,230
Deferred acquisition costs and other intangible assets 18 2 1
21 20
Total 1,171 18 62 1,251 1,250
Other non-investment and non-cash assets
1,308 228 69 1,605 1,475
Investments in joint ventures and associates accounted for
using the equity method 35 – 72 107 92
Financial investments:
LoansC3.4 854 – – 854 1,096
Equity securities and portfolio holdings in unit trusts
61 – 18 79 65
Debt securitiesC3.3 2,293 – – 2,293 2,045
Other
investments 109 12 – 121 61
Deposits – 40 34 74 65
Total
investments 3,352 52 124 3,528 3,424
Cash and cash equivalents 857 76 111 1,044 1,562
Total assets 6,688 374 366 7,428 7,711
Equity and liabilities
Equity
Shareholders’ equity 1,646 157 274 2,077 1,991
Total equity 1,646 157 274 2,077 1,991
Liabilities
Core structural borrowing of shareholder-financed operations 275 – – 275 275
Operational borrowings attributable to shareholder-financed
operations 6
– – 6 –
Intra-group debt represented by operational borrowings
at Group levelnote(ii) 2,004 – – 2,004 1,933
Other non-insurance
liabilitiesnote(iii) 2,757 217 92 3,066 3,512
Total liabilities 5,042 217 92 5,351 5,720
Total equity and liabilities 6,688 374 366 7,428 7,711
Notes
(i) The M&G statement of financial position includes the assets and liabilities in respect of Prudential Capital.
(ii) Intra-group debt represented by operational borrowings at Group level, which are in respect of Prudential Capital’s short-term fixed income security
programme and comprise:
2014 £m 2013 £m
Commercial paper 1,704 1,634
Medium Term Notes 300 299
Total intra-group debt represented by operational borrowings at Group level 2,004 1,933
(iii)
Other non-insurance liabilities consist primarily of intra-group balances, derivative liabilities and other creditors.
Financial statements C: Balance sheet notes
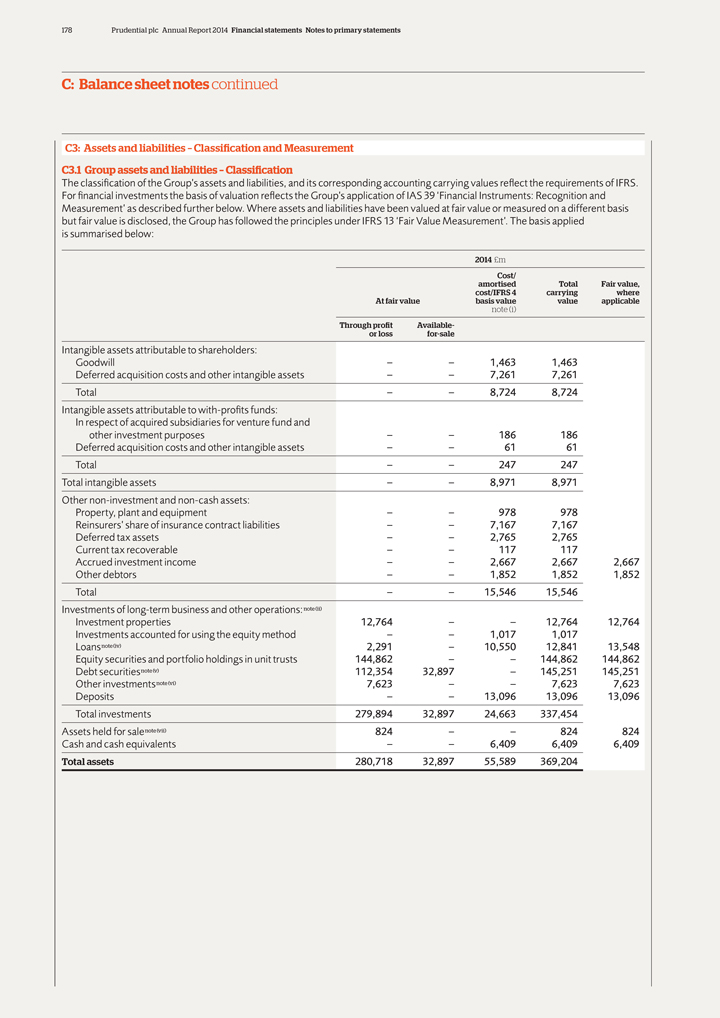
178 Prudential plc Annual Report 2014 Financial statements Notes to primary statements
C: Balance sheet notes continued
C3: Assets and liabilities – Classification and
Measurement C3.1 Group assets and liabilities – Classification
The classification of the Group’s assets and liabilities, and its corresponding accounting
carrying values reflect the requirements of IFRS. For financial investments the basis of valuation reflects the Group’s application of IAS 39 ‘Financial Instruments: Recognition and Measurement’ as described further below. Where
assets and liabilities have been valued at fair value or measured on a different basis but fair value is disclosed, the Group has followed the principles under IFRS 13 ‘Fair Value Measurement’. The basis applied is summarised below:
2014 £m
Cost/
amortised Total Fair value,
cost/IFRS 4 carrying where
At fair value basis value value applicable
note (i)
Through profit Available-
or loss for-sale
Intangible assets attributable to shareholders:
Goodwill – – 1,463 1,463
Deferred acquisition costs and other intangible assets – – 7,261 7,261
Total –
– 8,724 8,724
Intangible assets attributable to with-profits funds:
In
respect of acquired subsidiaries for venture fund and
other investment purposes – – 186 186
Deferred acquisition costs and other intangible assets – – 61 61
Total – –
247 247
Total intangible assets – – 8,971 8,971
Other
non-investment and non-cash assets:
Property, plant and equipment – – 978 978
Reinsurers’ share of insurance contract liabilities – – 7,167 7,167
Deferred
tax assets – – 2,765 2,765
Current tax recoverable – – 117 117
Accrued investment income – – 2,667 2,667 2,667
Other debtors – – 1,852
1,852 1,852
Total – – 15,546 15,546
Investments of long-term
business and other operations:note(ii)
Investment properties 12,764 – – 12,764 12,764
Investments accounted for using the equity method – – 1,017 1,017
Loansnote(iv)
2,291 – 10,550 12,841 13,548
Equity securities and portfolio holdings in unit trusts 144,862 – – 144,862 144,862
Debt securitiesnote(v) 112,354 32,897 – 145,251 145,251
Other investmentsnote(vi) 7,623
– – 7,623 7,623
Deposits – – 13,096 13,096 13,096
Total
investments 279,894 32,897 24,663 337,454
Assets held for salenote(vii) 824 – – 824 824
Cash and cash equivalents – – 6,409 6,409 6,409
Total assets 280,718 32,897 55,589
369,204
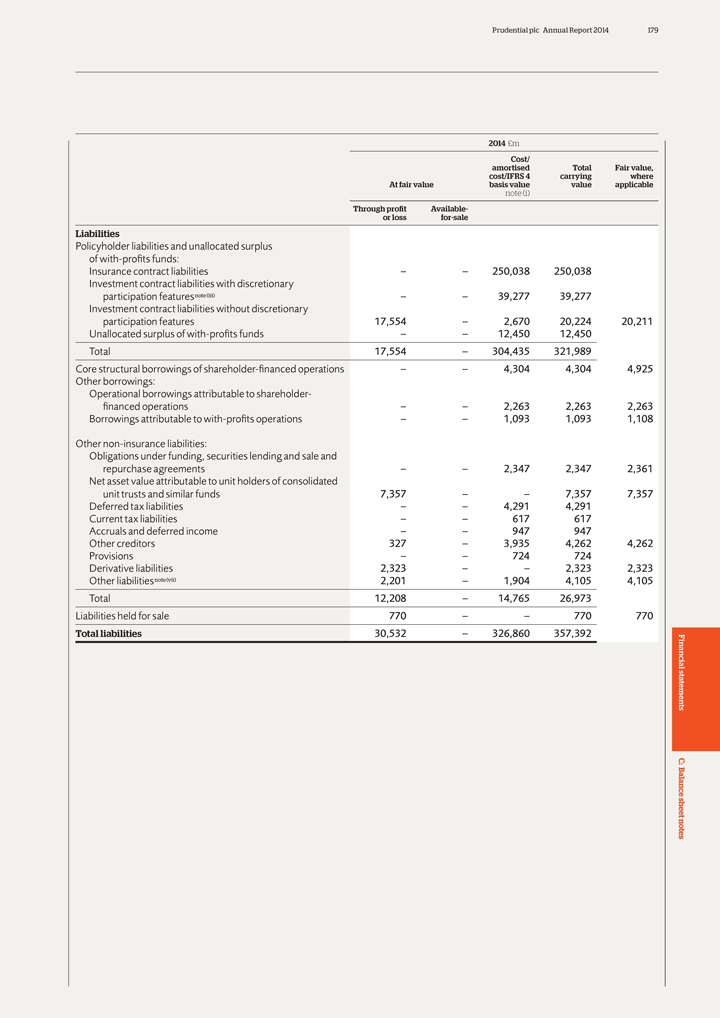
Prudential plc Annual Report 2014 179
2014
£m
Cost/
amortised Total Fair value,
cost/IFRS 4 carrying where
At fair value basis value value applicable
note (i)
Through profit Available-
or loss for-sale
Liabilities
Policyholder liabilities and unallocated surplus
of with-profits funds:
Insurance contract liabilities – – 250,038 250,038
Investment contract liabilities
with discretionary
participation featuresnote(iii) – – 39,277 39,277
Investment contract liabilities without discretionary
participation features
17,554 – 2,670 20,224 20,211
Unallocated surplus of with-profits funds – – 12,450 12,450
Total 17,554 – 304,435 321,989
Core structural borrowings of shareholder-financed
operations – – 4,304 4,304 4,925
Other borrowings:
Operational
borrowings attributable to shareholder-
financed operations – – 2,263 2,263 2,263
Borrowings attributable to with-profits operations – – 1,093 1,093 1,108
Other
non-insurance liabilities:
Obligations under funding, securities lending and sale and
repurchase agreements – – 2,347 2,347 2,361
Net asset value attributable to unit
holders of consolidated
unit trusts and similar funds 7,357 – – 7,357 7,357
Deferred tax liabilities – – 4,291 4,291
Current tax liabilities – – 617
617
Accruals and deferred income – – 947 947
Other creditors 327
– 3,935 4,262 4,262
Provisions – – 724 724
Derivative
liabilities 2,323 – – 2,323 2,323
Other liabilitiesnote(vii) 2,201 – 1,904 4,105 4,105
Total 12,208 – 14,765 26,973
Liabilities held for sale 770 – – 770 770
Total liabilities 30,532 – 326,860 357,392
Financial statements C:
Balance sheet notes
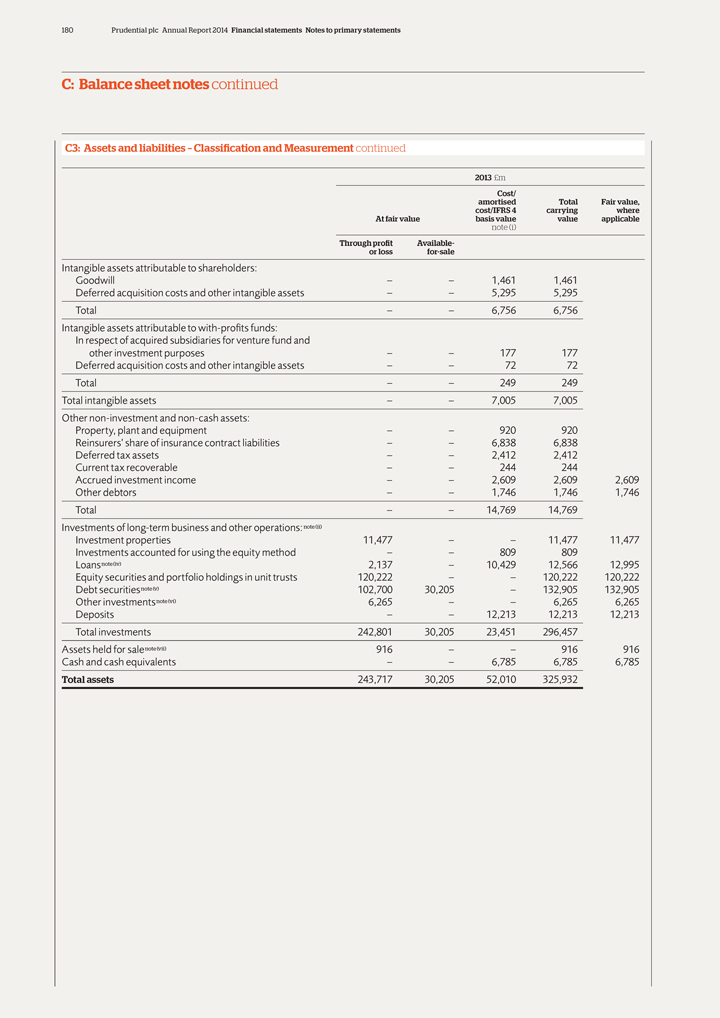
180 Prudential plc Annual Report 2014 Financial statements Notes to primary statements
C: Balance sheet notes continued
C3: Assets and liabilities – Classification and
Measurement continued
2013 £m
Cost/
amortised Total Fair value,
cost/IFRS 4 carrying where
At fair value basis value value applicable
note (i)
Through profit Available-
or loss for-sale
Intangible assets attributable to shareholders:
Goodwill – – 1,461 1,461
Deferred acquisition costs and other intangible assets – – 5,295 5,295
Total –
– 6,756 6,756
Intangible assets attributable to with-profits funds:
In
respect of acquired subsidiaries for venture fund and
other investment purposes – – 177 177
Deferred acquisition costs and other intangible assets – – 72 72
Total – –
249 249
Total intangible assets – – 7,005 7,005
Other
non-investment and non-cash assets:
Property, plant and equipment – – 920 920
Reinsurers’ share of insurance contract liabilities – – 6,838 6,838
Deferred
tax assets – – 2,412 2,412
Current tax recoverable – – 244 244
Accrued investment income – – 2,609 2,609 2,609
Other debtors – – 1,746
1,746 1,746
Total – – 14,769 14,769
Investments of long-term
business and other operations: note(ii)
Investment properties 11,477 – – 11,477 11,477
Investments accounted for using the equity method – – 809 809
Loansnote(iv) 2,137
– 10,429 12,566 12,995
Equity securities and portfolio holdings in unit trusts 120,222 – – 120,222 120,222
Debt securitiesnote(v) 102,700 30,205 – 132,905 132,905
Other investmentsnote(vi) 6,265
– – 6,265 6,265
Deposits – – 12,213 12,213 12,213
Total
investments 242,801 30,205 23,451 296,457
Assets held for salenote(vii) 916 – – 916 916
Cash and cash equivalents – – 6,785 6,785 6,785
Total assets 243,717 30,205 52,010
325,932
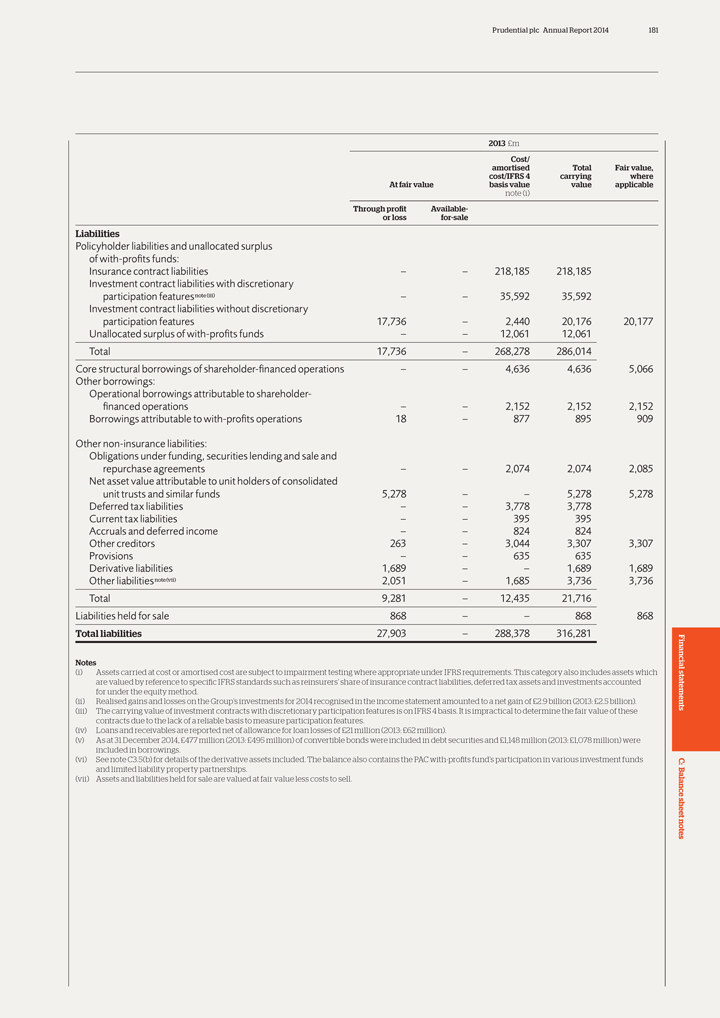
Prudential plc Annual Report 2014 181
2013
£m
Cost/
amortised Total Fair value,
cost/IFRS 4 carrying where
At fair value basis value value applicable
note (i)
Through profit Available-
or loss for-sale
Liabilities
Policyholder liabilities and unallocated surplus
of with-profits funds:
Insurance contract liabilities – – 218,185 218,185
Investment contract liabilities
with discretionary
participation featuresnote(iii) – – 35,592 35,592
Investment contract liabilities without discretionary
participation features
17,736 – 2,440 20,176 20,177
Unallocated surplus of with-profits funds – – 12,061 12,061
Total 17,736 – 268,278 286,014
Core structural borrowings of shareholder-financed
operations – – 4,636 4,636 5,066
Other borrowings:
Operational
borrowings attributable to shareholder-
financed operations – – 2,152 2,152 2,152
Borrowings attributable to with-profits operations 18 – 877 895 909
Other non-insurance
liabilities:
Obligations under funding, securities lending and sale and
repurchase agreements – – 2,074 2,074 2,085
Net asset value
attributable to unit holders of consolidated
unit trusts and similar funds 5,278 – – 5,278 5,278
Deferred tax liabilities – – 3,778 3,778
Current tax liabilities – – 395
395
Accruals and deferred income – – 824 824
Other creditors 263
– 3,044 3,307 3,307
Provisions – – 635 635
Derivative
liabilities 1,689 – – 1,689 1,689
Other liabilities note(vii) 2,051 – 1,685 3,736 3,736
Total 9,281 – 12,435 21,716
Liabilities held for sale 868 – – 868 868
Total liabilities 27,903 – 288,378 316,281
Notes
(i) Assets carried at cost or amortised cost are subject to impairment testing where appropriate under IFRS requirements. This category also includes assets which are valued by
reference to specific IFRS standards such as reinsurers’ share of insurance contract liabilities, deferred tax assets and investments accounted for under the equity method.
(ii) Realised gains and losses on the Group’s investments for 2014 recognised in the income statement amounted to a net gain of £2.9 billion (2013: £2.5 billion).
(iii) The carrying value of investment contracts with discretionary participation features is on IFRS 4 basis. It is impractical to determine the fair value of these contracts due to the lack of a reliable basis to measure participation
features.
(iv) Loans and receivables are reported net of allowance for loan losses of £21 million (2013: £62 million).
(v) As at 31 December 2014, £477 million (2013: £495 million) of convertible bonds were included in debt securities and £1,148 million (2013:
£1,078 million) were included in borrowings.
(vi) See note C3.5(b) for details of the derivative assets included. The balance also contains the PAC
with-profits fund’s participation in various investment funds and limited liability property partnerships.
(vii) Assets and liabilities held for sale are
valued at fair value less costs to sell.
Financial statements C: Balance sheet notes

182 Prudential plc Annual Report 2014 Financial statements Notes to primary statements
C: Balance sheet notes continued
C3: Assets and liabilities – Classification and
Measurement continued C3.2 Group assets and liabilities – Measurement
The section provides detail of the designation and valuation of the Group’s
financial assets and liabilities shown under following categories:
a Determination of fair value
The fair values of the assets and liabilities of the Group as shown in this note have been determined on the following bases.
The fair values of the financial instruments for which fair valuation is required under IFRS are determined by the use of current market bid prices for exchange-quoted investments,
or by using quotations from independent third parties, such as brokers and pricing services or by using appropriate valuation techniques.
The estimated fair value
of derivative financial instruments reflects the estimated amount the Group would receive or pay in an arm’s length transaction. This amount is determined using quoted prices if exchange listed, quotations from independent third parties or
valued internally using standard market practices.
The loans and receivables have been shown net of provisions for impairment. The fair value of loans has been
estimated from discounted cash flows expected to be received. The rate of discount used was the market rate of interest where applicable.
The fair value of
investment properties is based on market values as assessed by professionally qualified external valuers or by the Group’s qualified surveyors.
The fair value
of the subordinated and senior debt issued by the parent company is determined using quoted prices from independent third parties.
The fair value of financial
liabilities (other than derivative financial instruments) is determined using discounted cash flows of the amounts expected to be paid.
b Fair value measurement
hierarchy of Group assets and liabilities
Assets and liabilities carried at fair value on the statement of financial position
The table below shows the assets and liabilities carried at fair value analysed by level of the IFRS 13 ‘Fair Value Measurement’ defined fair value hierarchy. This
hierarchy is based on the inputs to the fair value measurement and reflects the lowest level input that is significant to that measurement.
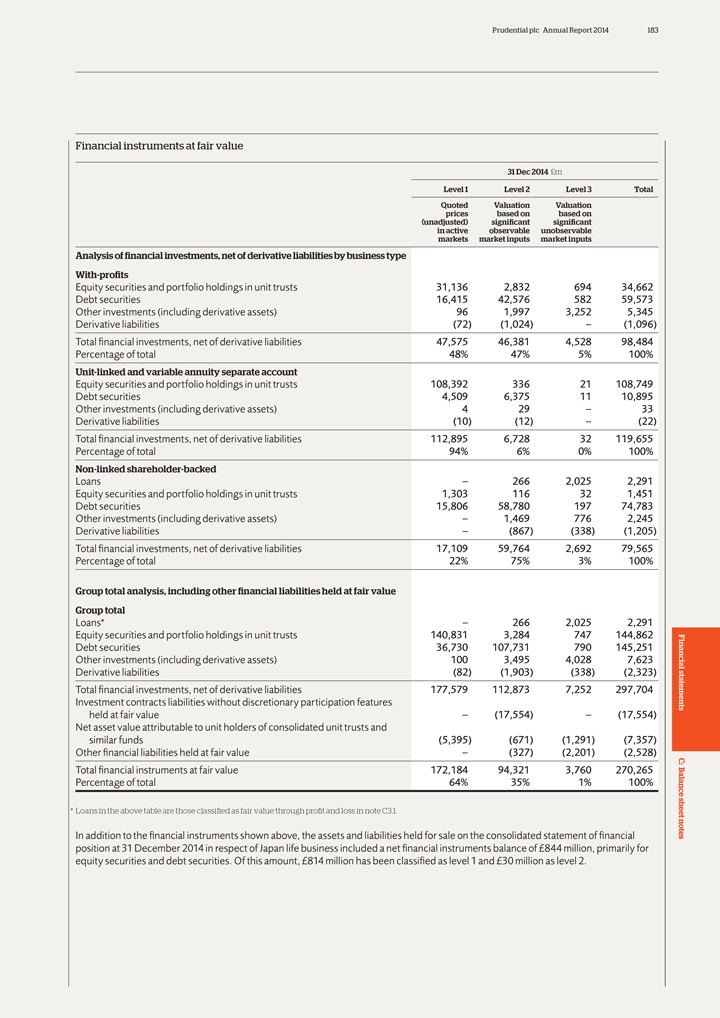
Prudential plc Annual Report 2014 183
Financial
instruments at fair value
31 Dec 2014 £m
Level 1 Level 2 Level 3 Total
Quoted Valuation Valuation
prices based on based on
(unadjusted) significant significant
in active observable unobservable
markets market inputs market inputs
Analysis of financial investments, net of derivative
liabilities by business type
With-profits
Equity securities and portfolio
holdings in unit trusts 31,136 2,832 694 34,662
Debt securities 16,415 42,576 582 59,573
Other investments (including derivative assets) 96 1,997 3,252 5,345
Derivative liabilities
(72) (1,024) – (1,096)
Total financial investments, net of derivative liabilities 47,575 46,381 4,528 98,484
Percentage of total 48% 47% 5% 100%
Unit-linked and variable annuity separate account
Equity securities and portfolio holdings in unit trusts 108,392 336 21 108,749
Debt securities 4,509 6,375 11 10,895
Other investments (including derivative
assets) 4 29 – 33
Derivative liabilities (10) (12) – (22)
Total financial investments, net of derivative liabilities 112,895 6,728 32 119,655
Percentage of total 94% 6% 0% 100%
Non-linked shareholder-backed
Loans – 266 2,025 2,291
Equity securities and portfolio holdings in unit trusts 1,303 116
32 1,451
Debt securities 15,806 58,780 197 74,783
Other investments
(including derivative assets) – 1,469 776 2,245
Derivative liabilities – (867) (338) (1,205)
Total financial investments, net of derivative liabilities 17,109 59,764 2,692 79,565
Percentage of total 22% 75% 3% 100%
Group total analysis, including other
financial liabilities held at fair value
Group total
Loans* – 266 2,025
2,291
Equity securities and portfolio holdings in unit trusts 140,831 3,284 747 144,862
Debt securities 36,730 107,731 790 145,251
Other investments (including derivative assets) 100
3,495 4,028 7,623
Derivative liabilities (82) (1,903) (338) (2,323)
Total financial investments, net of derivative liabilities 177,579 112,873 7,252 297,704
Investment contracts liabilities without discretionary participation features
held at fair value – (17,554) – (17,554)
Net asset value
attributable to unit holders of consolidated unit trusts and
similar funds (5,395) (671) (1,291) (7,357)
Other financial liabilities held at fair value – (327) (2,201) (2,528)
Total
financial instruments at fair value 172,184 94,321 3,760 270,265
Percentage of total 64% 35% 1% 100%
* Loans in the above table are those classified as fair value through profit and loss in note C3.1.
In addition to the financial instruments shown above, the assets and liabilities held for sale on the consolidated statement of financial position at 31 December 2014 in
respect of Japan life business included a net financial instruments balance of £844 million, primarily for equity securities and debt securities. Of this amount, £814 million has been classified as level 1 and
£30 million as level 2.
Financial statements C: Balance sheet notes
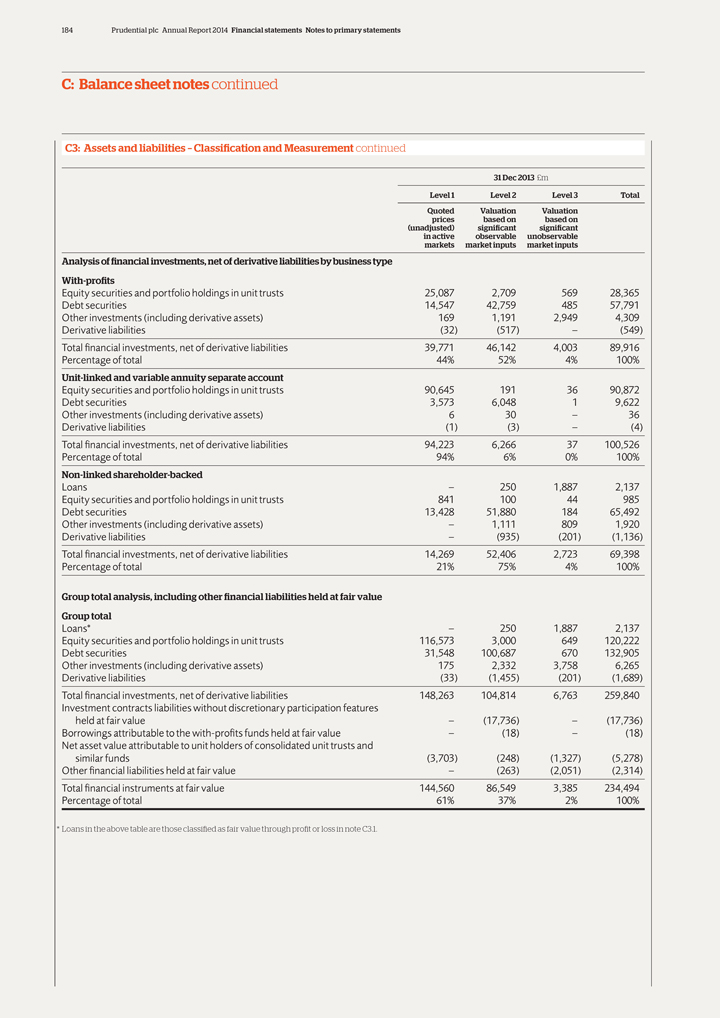
184 Prudential plc Annual Report 2014 Financial statements Notes to primary statements
C: Balance sheet notes continued
C3: Assets and liabilities – Classification and
Measurement continued
31 Dec 2013 £m
Level 1 Level 2 Level 3 Total
Quoted Valuation Valuation
prices based on based on
(unadjusted) significant significant
in active observable unobservable
markets market inputs market inputs
Analysis of financial investments, net of derivative
liabilities by business type
With-profits
Equity securities and portfolio
holdings in unit trusts 25,087 2,709 569 28,365
Debt securities 14,547 42,759 485 57,791
Other investments (including derivative assets) 169 1,191 2,949 4,309
Derivative liabilities
(32) (517) – (549)
Total financial investments, net of derivative liabilities 39,771 46,142 4,003 89,916
Percentage of total 44% 52% 4% 100%
Unit-linked and variable annuity separate account
Equity securities and portfolio holdings in unit trusts 90,645 191 36 90,872
Debt securities 3,573 6,048 1 9,622
Other investments (including derivative
assets) 6 30 – 36
Derivative liabilities (1) (3) – (4)
Total financial investments, net of derivative liabilities 94,223 6,266 37 100,526
Percentage of total 94% 6% 0% 100%
Non-linked shareholder-backed
Loans – 250 1,887 2,137
Equity securities and portfolio holdings in unit trusts 841 100
44 985
Debt securities 13,428 51,880 184 65,492
Other investments (including
derivative assets) – 1,111 809 1,920
Derivative liabilities – (935) (201) (1,136)
Total financial investments, net of derivative liabilities 14,269 52,406 2,723 69,398
Percentage of total 21% 75% 4% 100%
Group total analysis, including other
financial liabilities held at fair value
Group total
Loans* – 250 1,887
2,137
Equity securities and portfolio holdings in unit trusts 116,573 3,000 649 120,222
Debt securities 31,548 100,687 670 132,905
Other investments (including derivative assets) 175
2,332 3,758 6,265
Derivative liabilities (33) (1,455) (201) (1,689)
Total financial investments, net of derivative liabilities 148,263 104,814 6,763 259,840
Investment contracts liabilities without discretionary participation features
held at fair value – (17,736) – (17,736)
Borrowings
attributable to the with-profits funds held at fair value – (18) – (18)
Net asset value attributable to unit holders of consolidated unit trusts and
similar funds (3,703) (248) (1,327) (5,278)
Other financial
liabilities held at fair value – (263) (2,051) (2,314)
Total financial instruments at fair value 144,560 86,549 3,385 234,494
Percentage of total 61% 37% 2% 100%
* Loans in the above table are those classified as fair
value through profit or loss in note C3.1.
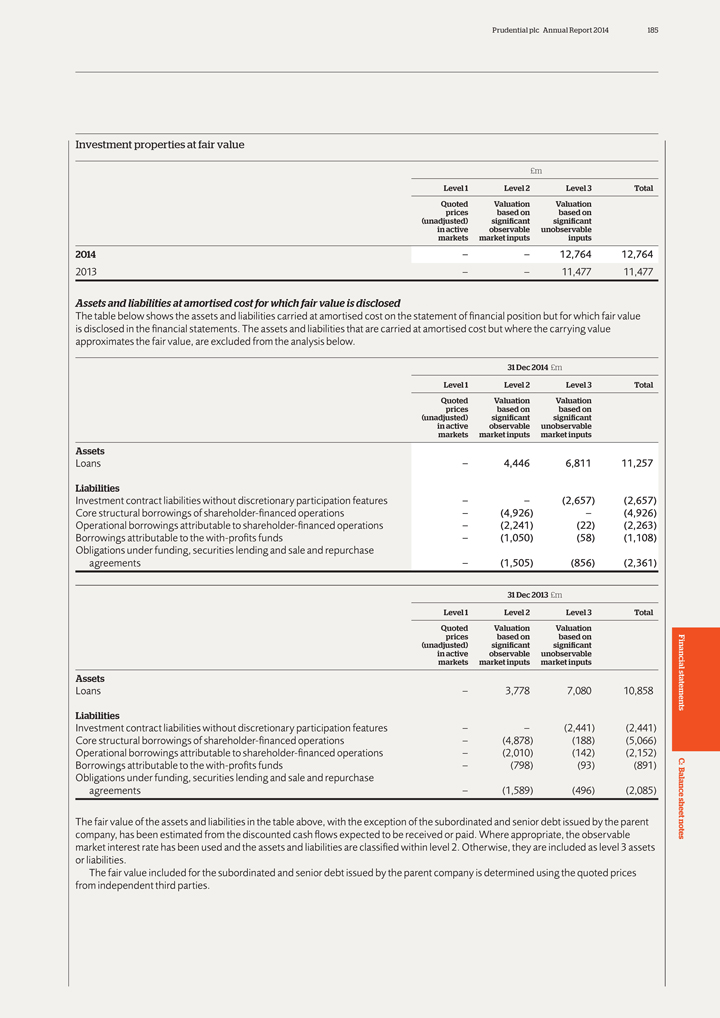
Prudential plc Annual Report 2014 185
Investment
properties at fair value
£m
Level 1 Level 2 Level 3 Total
Quoted Valuation Valuation
prices based on based on
(unadjusted) significant significant
in active observable unobservable
markets market inputs inputs
2014 – – 12,764 12,764
2013 – – 11,477 11,477
Assets and liabilities at amortised cost for which fair value
is disclosed
The table below shows the assets and liabilities carried at amortised cost on the statement of financial position but for which fair value is
disclosed in the financial statements. The assets and liabilities that are carried at amortised cost but where the carrying value approximates the fair value, are excluded from the analysis below.
31 Dec 2014 £m
Level 1 Level 2 Level 3 Total
Quoted Valuation Valuation
prices based on based on
(unadjusted) significant significant
in active observable unobservable
markets market inputs market inputs
Assets
Loans – 4,446 6,811 11,257
Liabilities
Investment contract liabilities without discretionary participation features – – (2,657) (2,657)
Core structural borrowings of shareholder-financed operations – (4,926) – (4,926)
Operational borrowings attributable to shareholder-financed operations – (2,241) (22) (2,263)
Borrowings attributable to the with-profits funds – (1,050) (58) (1,108)
Obligations under funding, securities lending and sale and repurchase
agreements – (1,505) (856) (2,361)
31 Dec 2013 £m
Level 1 Level 2 Level 3 Total
Quoted Valuation Valuation
prices based on based on
(unadjusted) significant significant
in active observable unobservable
markets market inputs market inputs
Assets
Loans – 3,778 7,080 10,858
Liabilities
Investment contract liabilities without discretionary participation features
– – (2,441) (2,441)
Core structural borrowings of shareholder-financed operations – (4,878) (188) (5,066)
Operational borrowings attributable to shareholder-financed operations – (2,010) (142) (2,152)
Borrowings attributable to the with-profits funds – (798) (93) (891)
Obligations under funding, securities lending and sale and repurchase
agreements – (1,589) (496) (2,085)
The fair value of the
assets and liabilities in the table above, with the exception of the subordinated and senior debt issued by the parent company, has been estimated from the discounted cash flows expected to be received or paid. Where appropriate, the observable
market interest rate has been used and the assets and liabilities are classified within level 2. Otherwise, they are included as level 3 assets or liabilities.
The
fair value included for the subordinated and senior debt issued by the parent company is determined using the quoted prices from independent third parties.
Financial statements C: Balance sheet notes

186 Prudential plc Annual Report 2014 Financial statements Notes to primary statements
C: Balance sheet notes continued
C3: Assets and liabilities – Classification and
Measurement continued c Valuation approach for level 2 fair valued assets and liabilities
A significant proportion of the Group’s level 2 assets are corporate
bonds, structured securities and other non-national government debt securities. These assets, in line with market practice, are generally valued using independent pricing services or third-party broker quotes. These valuations are determined using
independent external quotations from multiple sources and are subject to a number of monitoring controls, such as monthly price variances, stale price reviews and variance analysis on prices achieved on subsequent trades.
Pricing services, where available, are used to obtain the third-party broker quotes. Where pricing services providers are used, a single valuation is obtained and applied.
When prices are not available from pricing services, quotes are sourced directly from brokers. Prudential seeks to obtain a number of quotes from different brokers
so as to obtain the most comprehensive information available on their executability. Where quotes are sourced directly from brokers, the price used in the valuation is normally selected from one of the quotes based on a number of factors, including
the timeliness and regularity of the quotes and the accuracy of the quotes considering the spreads provided. The selected quote is the one which best represents an executable quote for the security at the measurement date.
Generally, no adjustment is made to the prices obtained from independent third parties. Adjustment is made in only limited circumstances, where it is determined that the
third-party valuations obtained do not reflect fair value (eg either because the value is stale and/or the values are extremely diverse in range). These are usually securities which are distressed or that could be subject to a debt restructure or
where reliable market prices are no longer available due to an inactive market or market dislocation. In these instances, prices are derived using internal valuation techniques including those as described below in this note with the objective of
arriving at a fair value measurement which reflects the price at which an orderly transaction would take place between market participants on the measurement date. The techniques used require a number of assumptions relating to variables such as
credit risk and interest rates. Examples of such variables include an average credit spread based on the corporate bond universe and the relevant duration of the asset being valued. Prudential determines the input assumptions based on the best
available information at the measurement dates.
Securities valued in such manner are classified as level 3 where these significant inputs are not based on
observable market data. Of the total level 2 debt securities of £107,731 million at 31 December 2014 (2013: £100,687 million), £10,093 million are valued internally (2013: £8,556 million). The majority of such
securities are valued using matrix pricing, which is based on assessing the credit quality of the underlying borrower to derive a suitable discount rate relative to government securities of a comparable duration. Under matrix pricing, the debt
securities are priced taking the credit spreads on comparable quoted public debt securities and applying these to the equivalent debt instruments factoring in a specified liquidity premium. The majority of the parameters used in this valuation
technique are readily observable in the market and, therefore, are not subject to interpretation.
d Fair value measurements for level 3 fair valued assets and
liabilities
Reconciliation of movements in level 3 assets and liabilities measured at fair value
The following table reconciles the value of level 3 fair valued assets and liabilities at 1 January 2014 to that presented at 31 December 2014.
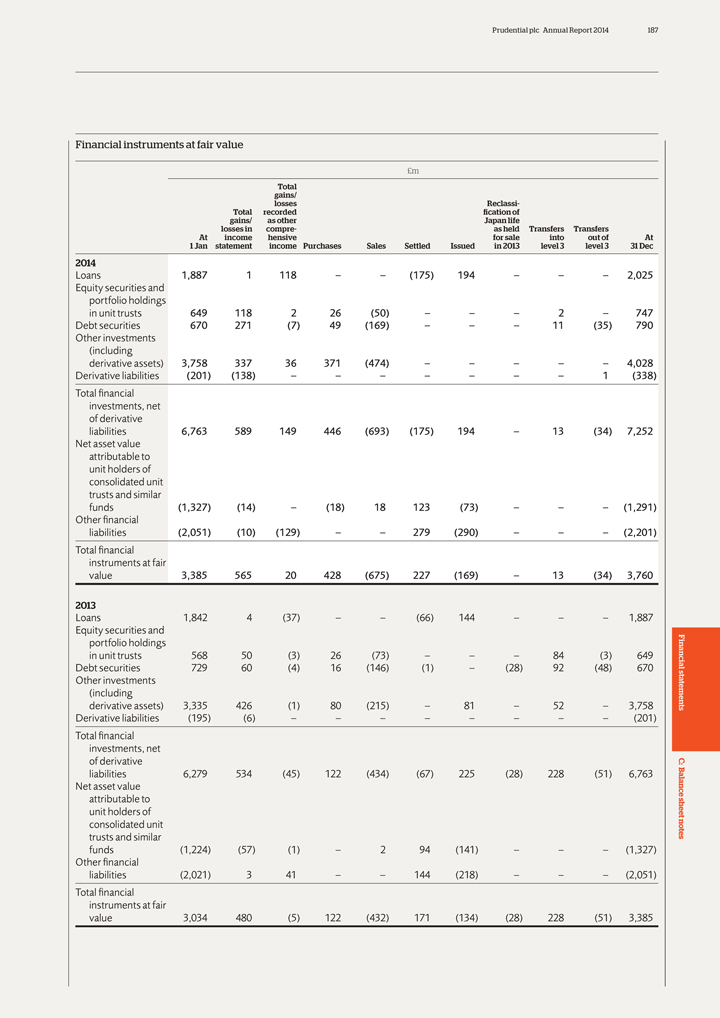
Prudential plc Annual Report 2014 187
Financial
instruments at fair value
£m
Total
gains/
losses Reclassi-
Total recorded fication of
gains/ as other Japan life
losses in compre- as held Transfers Transfers
At income hensive for sale into out of At
1 Jan statement income Purchases Sales Settled Issued in 2013 level 3 level 3 31 Dec
2014
Loans 1,887 1 118 – – (175) 194 – – – 2,025
Equity securities and
portfolio holdings
in unit trusts 649 118 2 26 (50) – – – 2 – 747
Debt securities 670
271 (7) 49 (169) – – – 11 (35) 790
Other investments
(including
derivative assets) 3,758 337 36 371 (474) – – – – –
4,028
Derivative liabilities (201) (138) – – – – – – – 1 (338)
Total financial
investments, net
of derivative
liabilities 6,763 589 149 446 (693) (175) 194 – 13
(34) 7,252
Net asset value
attributable to
unit holders of
consolidated unit
trusts and similar
funds (1,327) (14) – (18) 18 123 (73) –
– – (1,291)
Other financial
liabilities
(2,051) (10) (129) – – 279 (290) – – – (2,201)
Total financial
instruments at fair
value 3,385 565 20 428 (675) 227 (169) – 13 (34) 3,760
2013
Loans 1,842 4 (37) – – (66) 144 – – –
1,887
Equity securities and
portfolio holdings
in unit trusts 568 50 (3) 26 (73) – – – 84 (3) 649
Debt
securities 729 60 (4) 16 (146) (1) – (28) 92 (48) 670
Other investments
(including
derivative assets) 3,335 426 (1) 80 (215) – 81 – 52 –
3,758
Derivative liabilities (195) (6) – – – – – – – – (201)
Total financial
investments, net
of derivative
liabilities 6,279 534 (45) 122 (434) (67) 225 (28) 228
(51) 6,763
Net asset value
attributable to
unit holders of
consolidated unit
trusts and similar
funds (1,224) (57) (1) – 2 94 (141) – –
– (1,327)
Other financial
liabilities (2,021) 3 41 – –
144 (218) – – – (2,051)
Total financial
instruments at
fair
value 3,034 480 (5) 122 (432) 171 (134) (28) 228 (51) 3,385
Financial statements C: Balance sheet notes
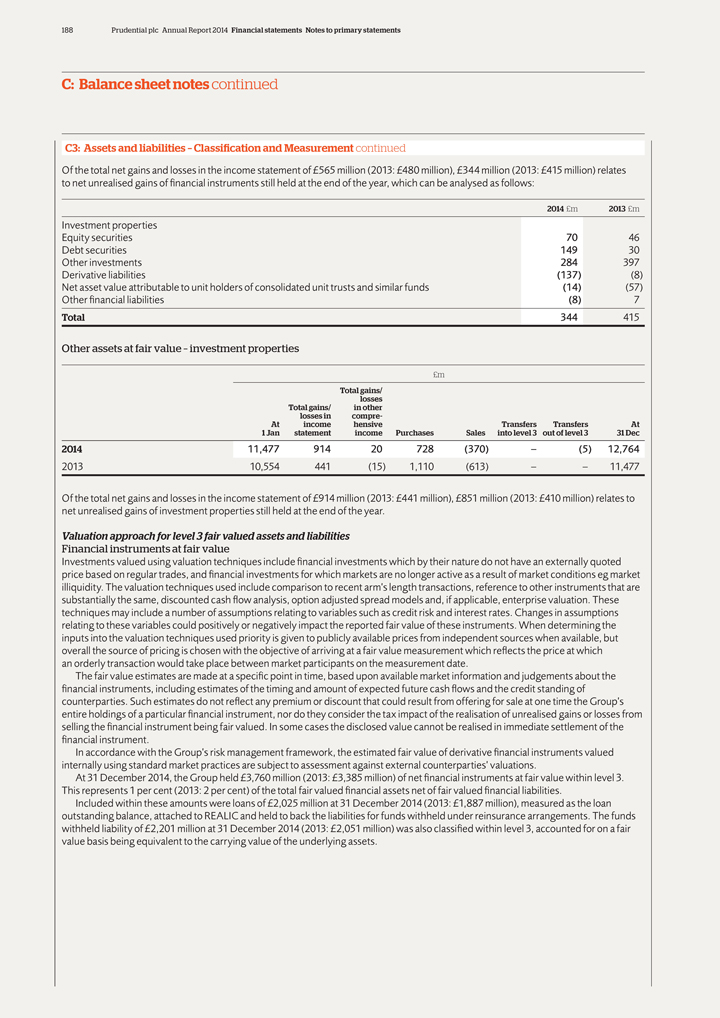
188 Prudential plc Annual Report 2014 Financial statements Notes to primary statements
C: Balance sheet notes continued
C3: Assets and liabilities – Classification and
Measurement continued
Of the total net gains and losses in the income statement of £565 million (2013: £480 million), £344 million
(2013: £415 million) relates to net unrealised gains of financial instruments still held at the end of the year, which can be analysed as follows:
2014
£m 2013 £m
Investment properties
Equity securities 70 46
Debt securities 149 30
Other investments 284 397
Derivative liabilities (137) (8)
Net asset value attributable to unit holders of
consolidated unit trusts and similar funds (14) (57)
Other financial liabilities (8) 7
Total 344 415
Other assets at fair value – investment properties
£m
Total gains/
losses
Total gains/ in other
losses in compre-
At income hensive Transfers Transfers At
1 Jan statement income Purchases Sales into level 3 out of level 3 31 Dec
2014 11,477 914 20
728 (370) – (5) 12,764
2013 10,554 441 (15) 1,110 (613) – – 11,477
Of the total net gains and losses in the income statement of £914 million (2013: £441 million), £851 million (2013: £410 million) relates to net
unrealised gains of investment properties still held at the end of the year.
Valuation approach for level 3 fair valued assets and liabilities
Financial instruments at fair value
Investments valued using valuation techniques include
financial investments which by their nature do not have an externally quoted price based on regular trades, and financial investments for which markets are no longer active as a result of market conditions eg market illiquidity. The valuation
techniques used include comparison to recent arm’s length transactions, reference to other instruments that are substantially the same, discounted cash flow analysis, option adjusted spread models and, if applicable, enterprise valuation. These
techniques may include a number of assumptions relating to variables such as credit risk and interest rates. Changes in assumptions relating to these variables could positively or negatively impact the reported fair value of these instruments. When
determining the inputs into the valuation techniques used priority is given to publicly available prices from independent sources when available, but overall the source of pricing is chosen with the objective of arriving at a fair value measurement
which reflects the price at which an orderly transaction would take place between market participants on the measurement date.
The fair value estimates are made at
a specific point in time, based upon available market information and judgements about the financial instruments, including estimates of the timing and amount of expected future cash flows and the credit standing of counterparties. Such estimates do
not reflect any premium or discount that could result from offering for sale at one time the Group’s entire holdings of a particular financial instrument, nor do they consider the tax impact of the realisation of unrealised gains or losses from
selling the financial instrument being fair valued. In some cases the disclosed value cannot be realised in immediate settlement of the financial instrument.
In
accordance with the Group’s risk management framework, the estimated fair value of derivative financial instruments valued internally using standard market practices are subject to assessment against external counterparties’ valuations.
At 31 December 2014, the Group held £3,760 million (2013: £3,385 million) of net financial instruments at fair value within level 3. This
represents 1 per cent (2013: 2 per cent) of the total fair valued financial assets net of fair valued financial liabilities.
Included within these
amounts were loans of £2,025 million at 31 December 2014 (2013: £1,887 million), measured as the loan outstanding balance, attached to REALIC and held to back the liabilities for funds withheld under reinsurance arrangements.
The funds withheld liability of £2,201 million at 31 December 2014 (2013: £2,051 million) was also classified within level 3, accounted for on a fair value basis being equivalent to the carrying value of the underlying assets.
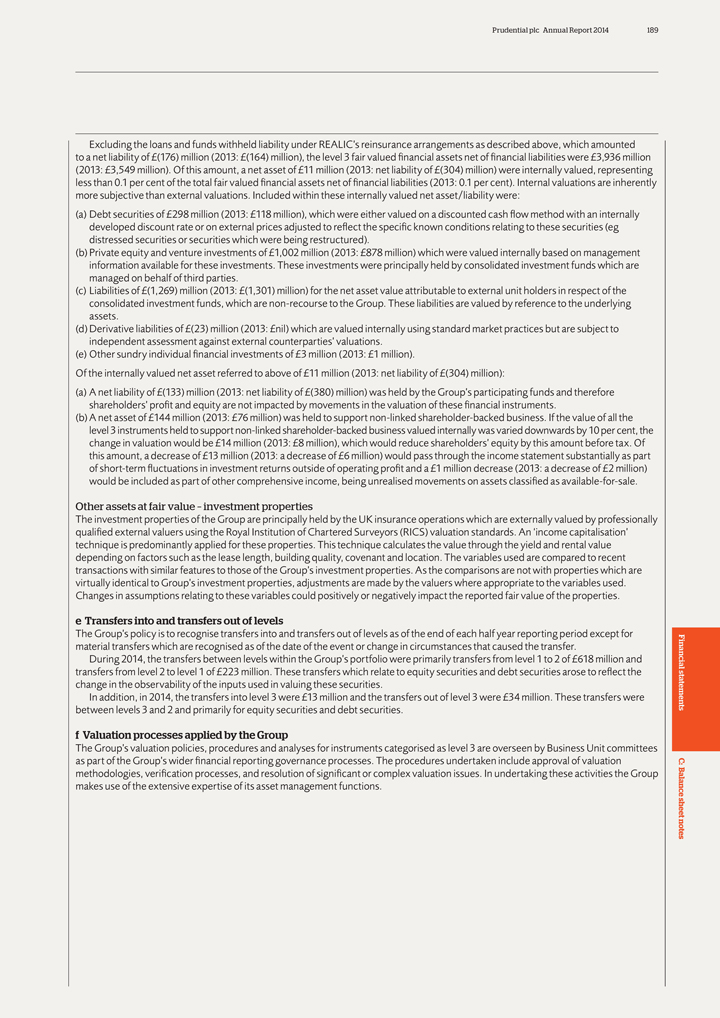
Prudential plc Annual Report 2014 189
Excluding
the loans and funds withheld liability under REALIC’s reinsurance arrangements as described above, which amounted to a net liability of £(176) million (2013: £(164) million), the level 3 fair valued financial assets net of
financial liabilities were £3,936 million (2013: £3,549 million). Of this amount, a net asset of £11 million (2013: net liability of £(304) million) were internally valued, representing less than 0.1 per
cent of the total fair valued financial assets net of financial liabilities (2013: 0.1 per cent). Internal valuations are inherently more subjective than external valuations. Included within these internally valued net asset/liability were:
(a) Debt securities of £298 million (2013: £118 million), which were either valued on a discounted cash flow method with an internally developed discount rate or on external prices adjusted to reflect the specific known
conditions relating to these securities (eg distressed securities or securities which were being restructured).
(b) Private equity and venture investments of
£1,002 million (2013: £878 million) which were valued internally based on management information available for these investments. These investments were principally held by consolidated investment funds which are managed on behalf
of third parties.
(c) Liabilities of £(1,269) million (2013: £(1,301) million) for the net asset value attributable to external unit holders
in respect of the consolidated investment funds, which are non-recourse to the Group. These liabilities are valued by reference to the underlying assets.
(d)
Derivative liabilities of £(23) million (2013: £nil) which are valued internally using standard market practices but are subject to independent assessment against external counterparties’ valuations.
(e) Other sundry individual financial investments of £3 million (2013: £1 million).
Of the internally valued net asset referred to above of £11 million (2013: net liability of £(304) million):
(a) A net liability of £(133) million (2013: net liability of £(380) million) was held by the Group’s participating funds and therefore
shareholders’ profit and equity are not impacted by movements in the valuation of these financial instruments.
(b) A net asset of £144 million
(2013: £76 million) was held to support non-linked shareholder-backed business. If the value of all the level 3 instruments held to support non-linked shareholder-backed business valued internally was varied downwards by 10 per cent, the
change in valuation would be £14 million (2013: £8 million), which would reduce shareholders’ equity by this amount before tax. Of this amount, a decrease of £13 million (2013: a decrease of £6 million) would
pass through the income statement substantially as part of short-term fluctuations in investment returns outside of operating profit and a £1 million decrease (2013: a decrease of £2 million) would be included as part of other
comprehensive income, being unrealised movements on assets classified as available-for-sale.
Other assets at fair value – investment properties
The investment properties of the Group are principally held by the UK insurance operations which are externally valued by professionally qualified external valuers using the Royal
Institution of Chartered Surveyors (RICS) valuation standards. An ‘income capitalisation’ technique is predominantly applied for these properties. This technique calculates the value through the yield and rental value depending on factors
such as the lease length, building quality, covenant and location. The variables used are compared to recent transactions with similar features to those of the Group’s investment properties. As the comparisons are not with properties which are
virtually identical to Group’s investment properties, adjustments are made by the valuers where appropriate to the variables used. Changes in assumptions relating to these variables could positively or negatively impact the reported fair value
of the properties.
e Transfers into and transfers out of levels
The
Group’s policy is to recognise transfers into and transfers out of levels as of the end of each half year reporting period except for material transfers which are recognised as of the date of the event or change in circumstances that caused the
transfer.
During 2014, the transfers between levels within the Group’s portfolio were primarily transfers from level 1 to 2 of £618 million and
transfers from level 2 to level 1 of £223 million. These transfers which relate to equity securities and debt securities arose to reflect the change in the observability of the inputs used in valuing these securities.
In addition, in 2014, the transfers into level 3 were £13 million and the transfers out of level 3 were £34 million. These transfers were between levels 3 and 2
and primarily for equity securities and debt securities.
f Valuation processes applied by the Group
The Group’s valuation policies, procedures and analyses for instruments categorised as level 3 are overseen by Business Unit committees as part of the Group’s wider
financial reporting governance processes. The procedures undertaken include approval of valuation methodologies, verification processes, and resolution of significant or complex valuation issues. In undertaking these activities the Group makes use
of the extensive expertise of its asset management functions.
Financial statements C: Balance sheet notes
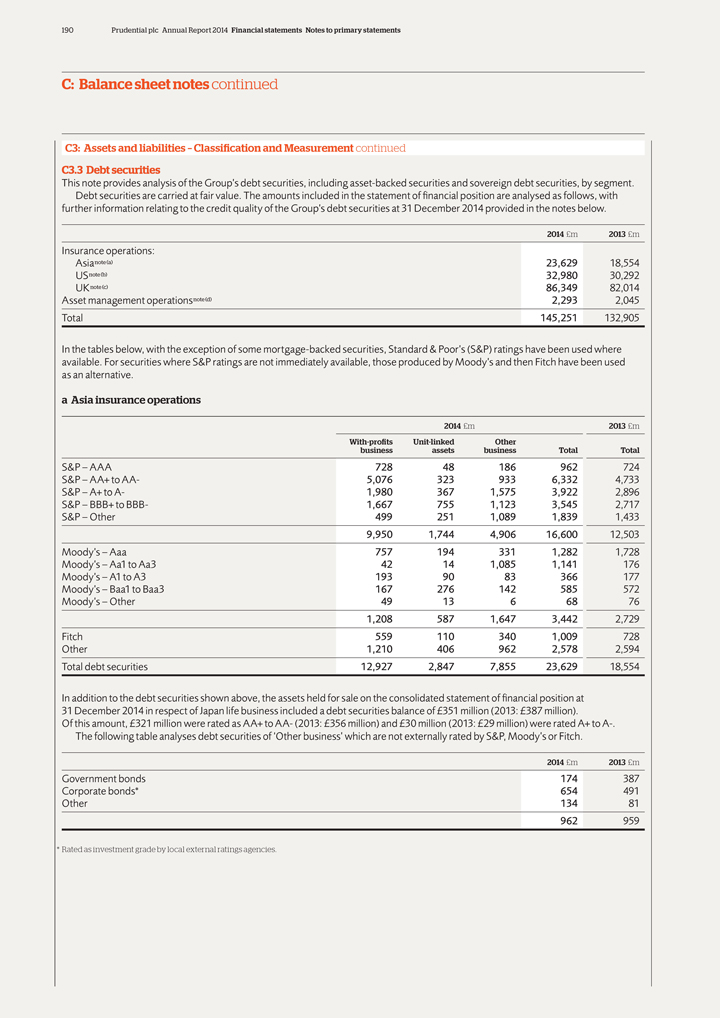
190 Prudential plc Annual Report 2014 Financial statements Notes to primary statements
C: Balance sheet notes continued
C3: Assets and liabilities – Classification and
Measurement continued C3.3 Debt securities
This note provides analysis of the Group’s debt securities, including asset-backed securities and sovereign debt
securities, by segment. Debt securities are carried at fair value. The amounts included in the statement of financial position are analysed as follows, with further information relating to the credit quality of the Group’s debt securities at
31 December 2014 provided in the notes below.
2014 £m 2013 £m
Insurance operations:
Asianote(a) 23,629 18,554
USnote(b) 32,980 30,292
UKnote(c) 86,349 82,014
Asset management operationsnote(d) 2,293 2,045
Total 145,251 132,905
In the tables below, with the exception of some mortgage-backed securities, Standard & Poor’s (S&P) ratings have been used where available. For securities where
S&P ratings are not immediately available, those produced by Moody’s and then Fitch have been used as an alternative.
a Asia insurance operations
2014 £m 2013 £m
With-profits Unit-linked Other
business assets business Total Total
S&P – AAA 728 48 186 962 724
S&P – AA+ to AA- 5,076 323 933 6,332 4,733
S&P – A+ to A- 1,980 367 1,575
3,922 2,896
S&P – BBB+ to BBB- 1,667 755 1,123 3,545 2,717
S&P
– Other 499 251 1,089 1,839 1,433
9,950 1,744 4,906 16,600 12,503
Moody’s – Aaa 757 194 331 1,282 1,728
Moody’s – Aa1 to
Aa3 42 14 1,085 1,141 176
Moody’s – A1 to A3 193 90 83 366 177
Moody’s – Baa1 to Baa3 167 276 142 585 572
Moody’s –
Other 49 13 6 68 76
1,208 587 1,647 3,442 2,729
Fitch 559 110 340 1,009 728
Other 1,210 406 962 2,578 2,594
Total debt securities 12,927 2,847 7,855
23,629 18,554
In addition to the debt securities shown above, the assets held for sale on the consolidated statement of financial position at
31 December 2014 in respect of Japan life business included a debt securities balance of £351 million (2013: £387 million).
Of this amount, £321 million were rated as AA+ to AA- (2013: £356 million) and £30 million (2013: £29 million) were rated A+ to A-. The following
table analyses debt securities of ‘Other business’ which are not externally rated by S&P, Moody’s or Fitch.
2014 £m 2013 £m
Government bonds 174 387
Corporate bonds* 654 491
Other 134 81
962 959
* Rated as investment grade by local external ratings agencies.
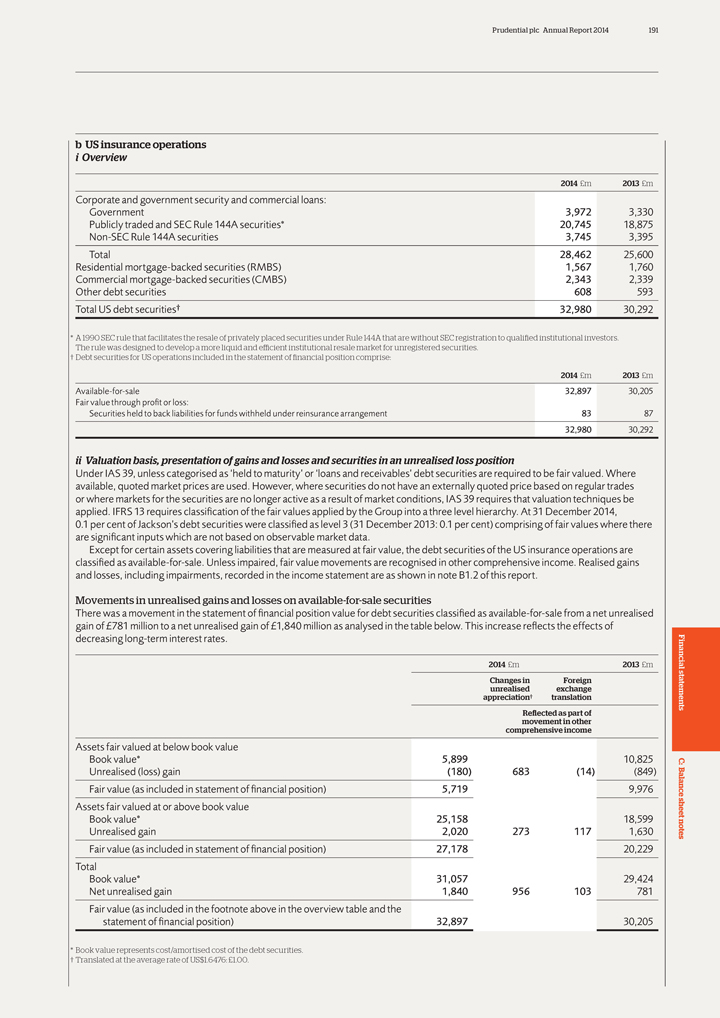
Prudential plc Annual Report 2014 191
b US
insurance operations i Overview
2014 £m 2013 £m
Corporate and
government security and commercial loans:
Government 3,972 3,330
Publicly
traded and SEC Rule 144A securities* 20,745 18,875
Non-SEC Rule 144A securities 3,745 3,395
Total 28,462 25,600
Residential mortgage-backed securities (RMBS) 1,567 1,760
Commercial mortgage-backed securities (CMBS) 2,343 2,339
Other debt securities 608 593
Total US debt securities† 32,980 30,292
* A 1990 SEC rule that
facilitates the resale of privately placed securities under Rule 144A that are without SEC registration to qualified institutional investors. The rule was designed to develop a more liquid and efficient institutional resale market for unregistered
securities.
† Debt securities for US operations included in the statement of financial position comprise:
2014 £m 2013 £m
Available-for-sale 32,897 30,205
Fair value through profit or loss:
Securities held to back liabilities for funds withheld
under reinsurance arrangement 83 87
32,980 30,292
ii Valuation basis,
presentation of gains and losses and securities in an unrealised loss position
Under IAS 39, unless categorised as ‘held to maturity’ or ‘loans and
receivables’ debt securities are required to be fair valued. Where available, quoted market prices are used. However, where securities do not have an externally quoted price based on regular trades or where markets for the securities are no
longer active as a result of market conditions, IAS 39 requires that valuation techniques be applied. IFRS 13 requires classification of the fair values applied by the Group into a three level hierarchy. At 31 December 2014, 0.1 per cent
of Jackson’s debt securities were classified as level 3 (31 December 2013: 0.1 per cent) comprising of fair values where there are significant inputs which are not based on observable market data.
Except for certain assets covering liabilities that are measured at fair value, the debt securities of the US insurance operations are classified as available-for-sale. Unless
impaired, fair value movements are recognised in other comprehensive income. Realised gains and losses, including impairments, recorded in the income statement are as shown in note B1.2 of this report.
Movements in unrealised gains and losses on available-for-sale securities
There was a movement
in the statement of financial position value for debt securities classified as available-for-sale from a net unrealised gain of £781 million to a net unrealised gain of £1,840 million as analysed in the table below. This
increase reflects the effects of decreasing long-term interest rates.
2014 £m 2013 £m
Changes in Foreign
unrealised exchange
appreciation† translation
Reflected as part of
movement in other
comprehensive income
Assets fair valued at below book value
Book value* 5,899 10,825
Unrealised (loss) gain (180) 683 (14) (849)
Fair value (as included in statement of
financial position) 5,719 9,976
Assets fair valued at or above book value
Book value* 25,158 18,599
Unrealised gain 2,020 273 117 1,630
Fair value (as included in statement of financial position) 27,178 20,229
Total
Book value* 31,057 29,424
Net unrealised gain 1,840 956 103 781
Fair value (as included in the footnote above in the overview table and the
statement of
financial position) 32,897 30,205
* Book value represents cost/amortised cost of the debt securities.
† Translated at the average rate of US$1.6476: £1.00.
Financial statements C:
Balance sheet notes
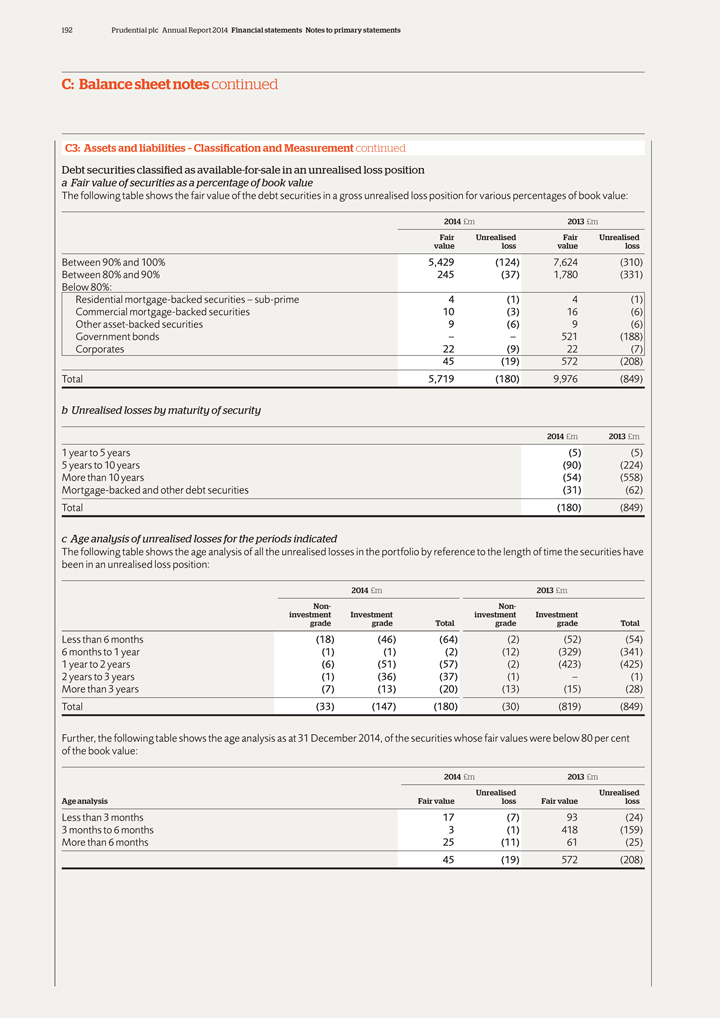
192 Prudential plc Annual Report 2014 Financial statements Notes to primary statements
C: Balance sheet notes continued
C3: Assets and liabilities – Classification and
Measurement continued
Debt securities classified as available-for-sale in an unrealised loss position a Fair value of securities as a percentage of book value
The following table shows the fair value of the debt securities in a gross unrealised loss position for various percentages of book value:
2014 £m 2013 £m
Fair Unrealised Fair Unrealised
value loss value loss
Between 90% and 100% 5,429 (124) 7,624 (310)
Between 80% and 90% 245 (37) 1,780 (331)
Below 80%:
Residential mortgage-backed securities – sub-prime 4 (1) 4 (1)
Commercial
mortgage-backed securities 10 (3) 16 (6)
Other asset-backed securities 9 (6) 9 (6)
Government bonds – – 521 (188)
Corporates 22 (9) 22 (7)
45 (19) 572 (208)
Total 5,719 (180) 9,976 (849)
b Unrealised losses by maturity of security
2014 £m 2013 £m
1 year to 5 years (5) (5)
5 years to 10 years (90) (224)
More than 10 years (54) (558)
Mortgage-backed and other debt securities (31) (62)
Total (180) (849)
c Age analysis of unrealised losses for the periods
indicated
The following table shows the age analysis of all the unrealised losses in the portfolio by reference to the length of time the securities have been in
an unrealised loss position:
2014 £m 2013 £m
Non- Non-
investment Investment investment Investment
grade grade Total grade grade
Total
Less than 6 months (18) (46) (64) (2) (52) (54)
6 months to 1 year (1) (1) (2) (12) (329) (341)
1
year to 2 years (6) (51) (57) (2) (423) (425)
2 years to 3 years (1) (36) (37) (1) – (1)
More than 3 years (7) (13) (20) (13) (15) (28)
Total
(33) (147) (180) (30) (819) (849)
Further, the following table shows the age analysis as at 31 December 2014, of the securities whose
fair values were below 80 per cent of the book value:
2014 £m 2013 £m
Unrealised Unrealised
Age analysis Fair value loss Fair value loss
Less than 3 months 17 (7) 93 (24)
3 months to 6 months 3 (1) 418 (159)
More than 6 months 25 (11) 61 (25)
45 (19) 572 (208)
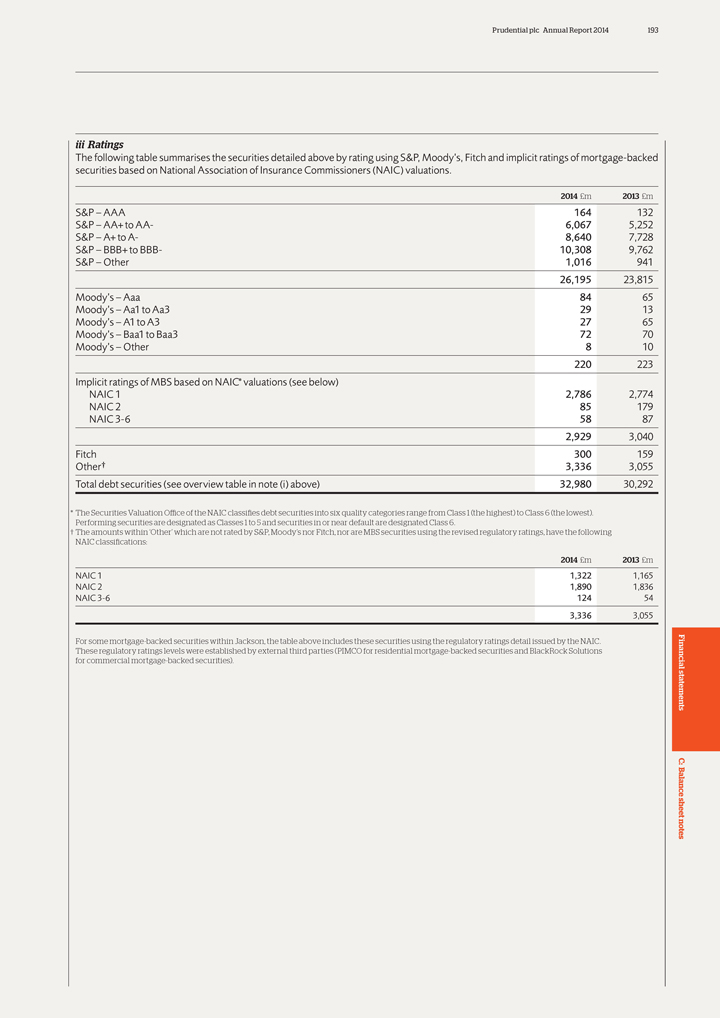
Prudential plc Annual Report 2014 193
iii Ratings
The following table summarises the securities detailed above by rating using S&P, Moody’s, Fitch and implicit ratings of mortgage-backed securities based
on National Association of Insurance Commissioners (NAIC) valuations.
2014 £m 2013 £m
S&P – AAA 164 132
S&P – AA+ to AA- 6,067 5,252
S&P – A+ to A- 8,640 7,728
S&P – BBB+ to BBB- 10,308 9,762
S&P – Other 1,016 941
26,195 23,815
Moody’s – Aaa 84 65
Moody’s – Aa1 to Aa3 29 13
Moody’s – A1 to A3 27 65
Moody’s – Baa1 to Baa3 72 70
Moody’s – Other 8 10
220 223
Implicit ratings of MBS based on NAIC* valuations (see below)
NAIC 1 2,786 2,774
NAIC 2 85 179
NAIC 3-6 58 87
2,929 3,040
Fitch 300 159
Other† 3,336 3,055
Total debt securities (see overview table in note (i) above)
32,980 30,292
* The Securities Valuation Office of the NAIC classifies debt securities into six quality categories range from Class 1 (the highest) to Class 6 (the
lowest). Performing securities are designated as Classes 1 to 5 and securities in or near default are designated Class 6.
† The amounts within
‘Other’ which are not rated by S&P, Moody’s nor Fitch, nor are MBS securities using the revised regulatory ratings, have the following NAIC classifications:
2014 £m 2013 £m
NAIC 1 1,322 1,165
NAIC 2 1,890 1,836
NAIC 3-6 124 54
3,336 3,055
For some mortgage-backed securities within Jackson, the table above includes these
securities using the regulatory ratings detail issued by the NAIC. These regulatory ratings levels were established by external third parties (PIMCO for residential mortgage-backed securities and BlackRock Solutions for commercial mortgage-backed
securities).
Financial statements C: Balance sheet notes
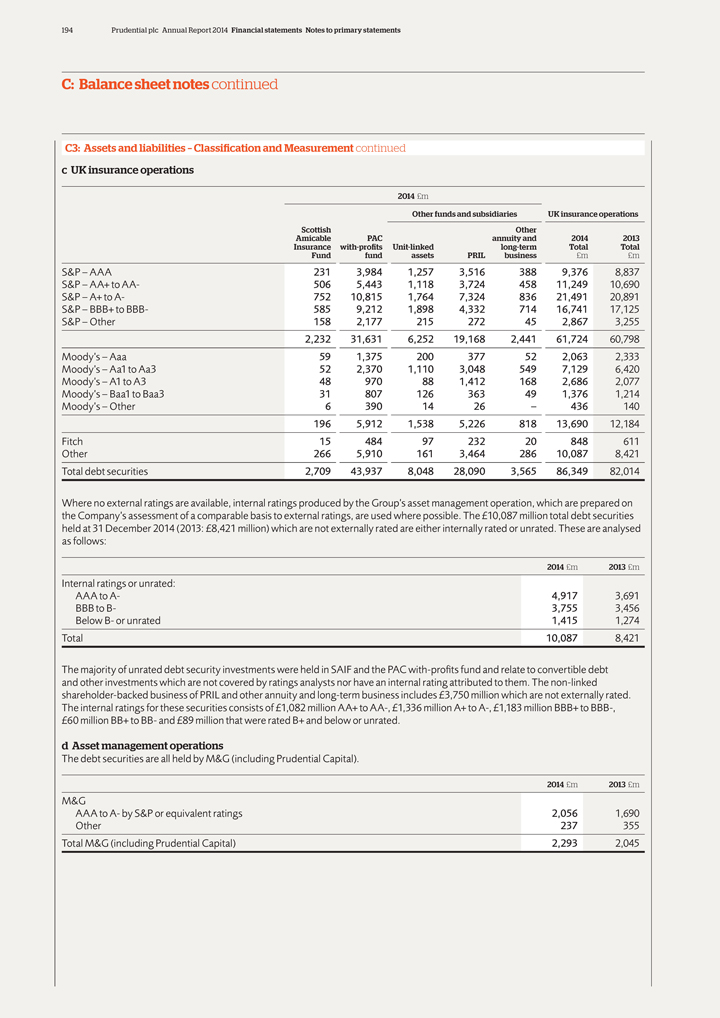
194 Prudential plc Annual Report 2014 Financial statements Notes to primary statements
C: Balance sheet notes continued
C3: Assets and liabilities – Classification and
Measurement continued c UK insurance operations
2014 £m
Other funds and
subsidiaries UK insurance operations
Scottish Other
Amicable PAC annuity and
2014 2013
Insurance with-profits Unit-linked long-term Total Total
Fund fund
assets PRIL business £m £m
S&P – AAA 231 3,984 1,257 3,516 388 9,376 8,837
S&P – AA+ to AA- 506 5,443 1,118 3,724 458 11,249 10,690
S&P – A+ to A- 752
10,815 1,764 7,324 836 21,491 20,891
S&P – BBB+ to BBB- 585 9,212 1,898 4,332 714 16,741 17,125
S&P – Other 158 2,177 215 272 45 2,867 3,255
2,232 31,631 6,252 19,168 2,441 61,724
60,798
Moody’s – Aaa 59 1,375 200 377 52 2,063 2,333
Moody’s
– Aa1 to Aa3 52 2,370 1,110 3,048 549 7,129 6,420
Moody’s – A1 to A3 48 970 88 1,412 168 2,686 2,077
Moody’s – Baa1 to Baa3 31 807 126 363 49 1,376 1,214
Moody’s – Other 6 390
14 26 – 436 140
196 5,912 1,538 5,226 818 13,690 12,184
Fitch 15 484 97
232 20 848 611
Other 266 5,910 161 3,464 286 10,087 8,421
Total debt
securities 2,709 43,937 8,048 28,090 3,565 86,349 82,014
Where no external ratings are available, internal ratings produced by the Group’s asset management
operation, which are prepared on the Company’s assessment of a comparable basis to external ratings, are used where possible. The £10,087 million total debt securities held at 31 December 2014 (2013: £8,421 million) which
are not externally rated are either internally rated or unrated. These are analysed as follows:
2014 £m 2013 £m
Internal ratings or unrated:
AAA to A- 4,917 3,691
BBB to B- 3,755 3,456
Below B- or unrated 1,415 1,274
Total 10,087 8,421
The majority of unrated debt security investments were held in SAIF and the
PAC with-profits fund and relate to convertible debt and other investments which are not covered by ratings analysts nor have an internal rating attributed to them. The non-linked shareholder-backed business of PRIL and other annuity and long-term
business includes £3,750 million which are not externally rated. The internal ratings for these securities consists of £1,082 million AA+ to AA-, £1,336 million A+ to A-, £1,183 million BBB+ to BBB-,
£60 million BB+ to BB- and £89 million that were rated B+ and below or unrated.
d Asset management operations
The debt securities are all held by M&G (including Prudential Capital).
2014 £m 2013
£m
M&G
AAA to A- by S&P or equivalent ratings 2,056 1,690
Other 237 355
Total M&G (including Prudential Capital) 2,293 2,045
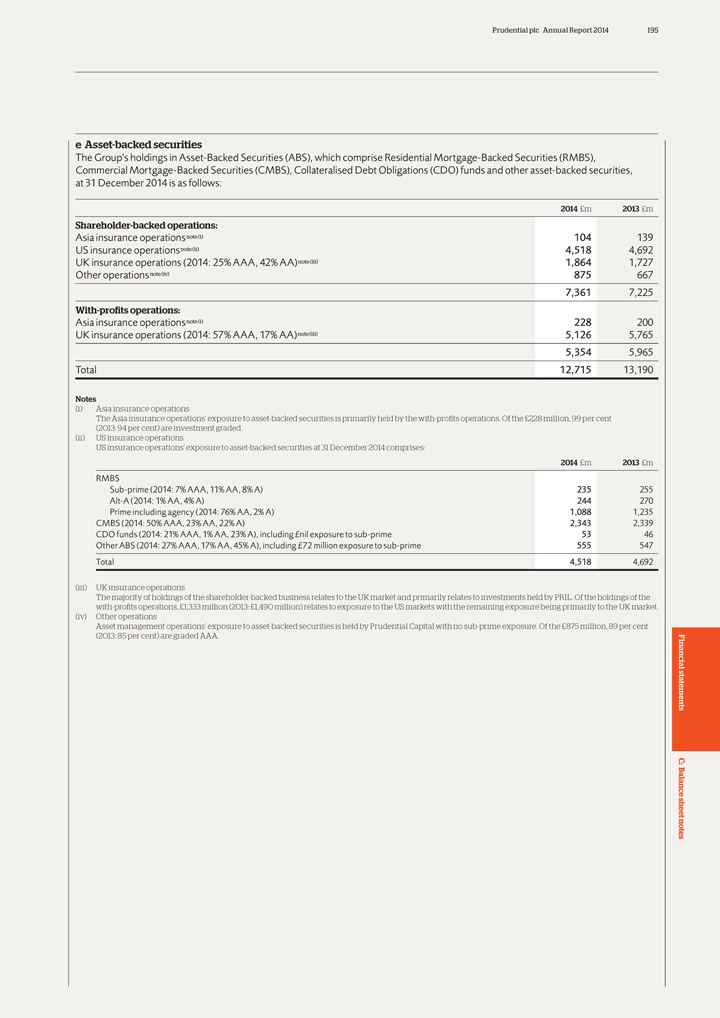
Prudential plc Annual Report 2014 195
e
Asset-backed securities
The Group’s holdings in Asset-Backed Securities (ABS), which comprise Residential Mortgage-Backed Securities (RMBS), Commercial
Mortgage-Backed Securities (CMBS), Collateralised Debt Obligations (CDO) funds and other asset-backed securities, at 31 December 2014 is as follows:
2014
£m 2013 £m
Shareholder-backed operations:
Asia insurance
operationsnote(i) 104 139
US insurance operationsnote(ii) 4,518 4,692
UK
insurance operations (2014: 25% AAA, 42% AA)note(iii) 1,864 1,727
Other operationsnote(iv) 875 667
7,361 7,225
With-profits operations:
Asia insurance operationsnote(i) 228 200
UK insurance operations (2014: 57% AAA, 17%
AA)note(iii) 5,126 5,765
5,354 5,965
Total 12,715 13,190
Notes
(i) Asia insurance operations
The Asia insurance operations’ exposure to asset-backed securities is primarily held by the with-profits operations. Of the £228 million, 99 per cent (2013:
94 per cent) are investment graded.
(ii) US insurance operations
US
insurance operations’ exposure to asset-backed securities at 31 December 2014 comprises:
2014 £m 2013 £m
RMBS
Sub-prime (2014: 7% AAA, 11% AA, 8% A) 235 255
Alt-A (2014: 1% AA, 4% A) 244 270
Prime including agency (2014: 76% AA, 2% A) 1,088 1,235
CMBS (2014: 50% AAA, 23% AA, 22% A) 2,343 2,339
CDO funds (2014: 21% AAA, 1%
AA, 23% A), including £nil exposure to sub-prime 53 46
Other ABS (2014: 27% AAA, 17% AA, 45% A), including £72 million exposure to sub-prime 555
547
Total 4,518 4,692
(iii) UK insurance operations
The majority of holdings of the shareholder-backed business relates to the UK market and primarily relates to investments held by PRIL. Of the holdings of the with-profits
operations, £1,333 million (2013: £1,490 million) relates to exposure to the US markets with the remaining exposure being primarily to the UK market. (iv) Other operations Asset management operations’ exposure to
asset-backed securities is held by Prudential Capital with no sub-prime exposure. Of the £875 million, 89 per cent (2013: 85 per cent) are graded AAA.
Financial statements C: Balance sheet notes
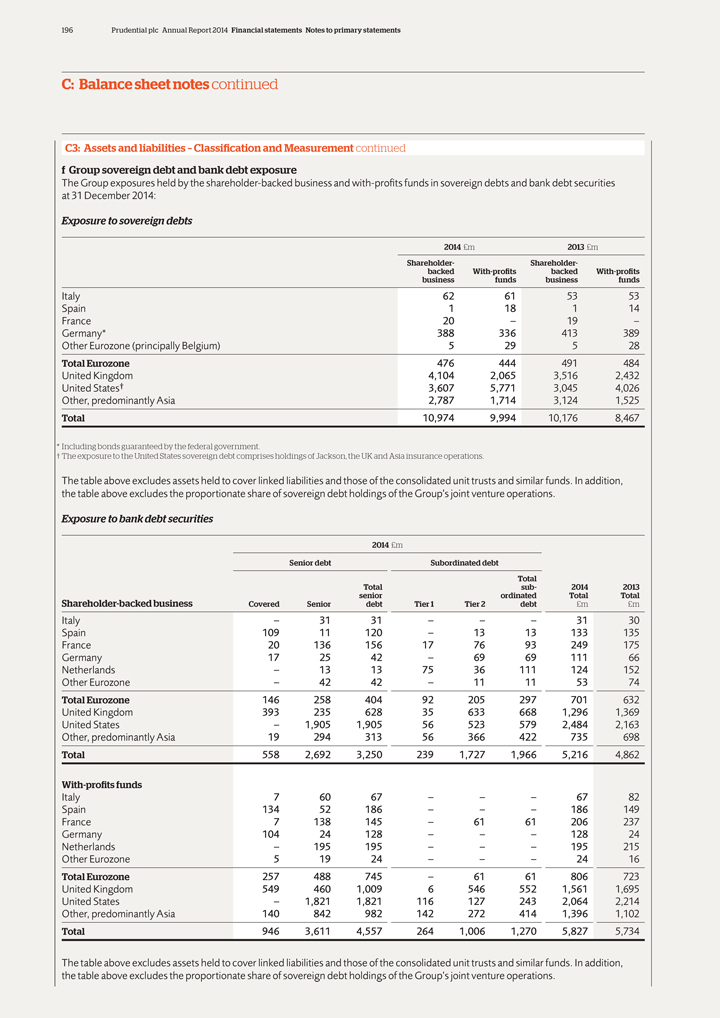
196 Prudential plc Annual Report 2014 Financial statements Notes to primary statements
C: Balance sheet notes continued
C3: Assets and liabilities – Classification and
Measurement continued f Group sovereign debt and bank debt exposure
The Group exposures held by the shareholder-backed business and with-profits funds in sovereign
debts and bank debt securities at 31 December 2014:
Exposure to sovereign debts
2014 £m 2013 £m
Shareholder- Shareholder-
backed With-profits backed With-profits
business funds business funds
Italy 62 61 53 53
Spain 1 18 1 14
France 20 – 19 –
Germany* 388 336 413 389
Other Eurozone (principally Belgium) 5 29 5 28
Total Eurozone 476 444 491 484
United Kingdom 4,104 2,065 3,516 2,432
United States† 3,607 5,771 3,045 4,026
Other, predominantly Asia 2,787 1,714 3,124 1,525
Total 10,974 9,994 10,176 8,467
* Including bonds guaranteed by the federal government.
† The exposure to the United
States sovereign debt comprises holdings of Jackson, the UK and Asia insurance operations.
The table above excludes assets held to cover linked liabilities and
those of the consolidated unit trusts and similar funds. In addition, the table above excludes the proportionate share of sovereign debt holdings of the Group’s joint venture operations.
Exposure to bank debt securities
2014 £m
Senior debt Subordinated debt
Total
Total sub- 2014 2013
senior ordinated Total Total
Shareholder-backed business Covered Senior debt Tier 1 Tier 2 debt £m £m
Italy
– 31 31 – – – 31 30
Spain 109 11 120 – 13 13 133 135
France 20 136 156 17 76 93 249 175
Germany 17 25 42 – 69 69 111 66
Netherlands – 13 13 75 36 111 124 152
Other Eurozone – 42 42 –
11 11 53 74
Total Eurozone 146 258 404 92 205 297 701 632
United Kingdom 393
235 628 35 633 668 1,296 1,369
United States – 1,905 1,905 56 523 579 2,484 2,163
Other, predominantly Asia 19 294 313 56 366 422 735 698
Total 558 2,692 3,250 239 1,727 1,966
5,216 4,862
With-profits funds
Italy 7 60 67 – – – 67 82
Spain 134 52 186 – – – 186 149
France 7 138 145 – 61 61
206 237
Germany 104 24 128 – – – 128 24
Netherlands – 195
195 – – – 195 215
Other Eurozone 5 19 24 – – – 24 16
Total Eurozone 257 488 745 – 61 61 806 723
United Kingdom 549 460 1,009 6 546 552 1,561
1,695
United States – 1,821 1,821 116 127 243 2,064 2,214
Other,
predominantly Asia 140 842 982 142 272 414 1,396 1,102
Total 946 3,611 4,557 264 1,006 1,270 5,827 5,734
The table above excludes assets held to cover linked liabilities and those of the consolidated unit trusts and similar funds. In addition, the table above excludes the
proportionate share of sovereign debt holdings of the Group’s joint venture operations.
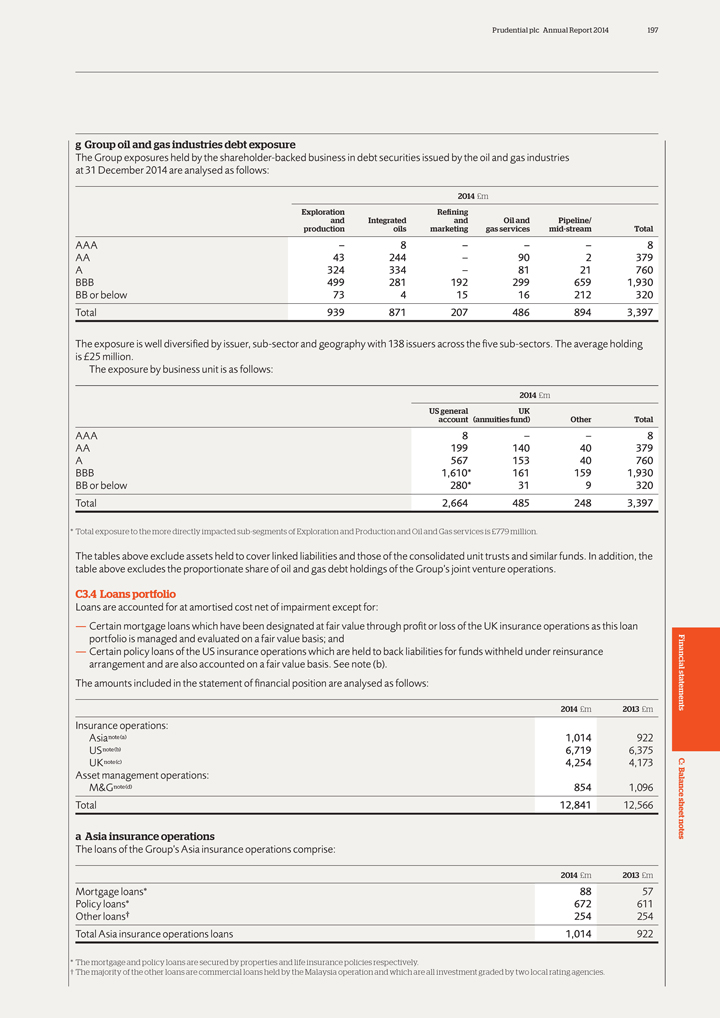
Prudential plc Annual Report 2014 197
g Group oil
and gas industries debt exposure
The Group exposures held by the shareholder-backed business in debt securities issued by the oil and gas industries at
31 December 2014 are analysed as follows:
2014 £m
Exploration
Refining
and Integrated and Oil and Pipeline/
production oils marketing gas
services mid-stream Total
AAA – 8 – – – 8
AA 43 244
– 90 2 379
A 324 334 – 81 21 760
BBB 499 281 192 299 659 1,930
BB or below 73 4 15 16 212 320
Total 939 871 207 486 894 3,397
The exposure is well diversified by issuer, sub-sector and geography with 138 issuers across the five sub-sectors. The average holding is £25 million.
The exposure by business unit is as follows:
2014 £m
US general UK
account (annuities fund) Other Total
AAA 8 – – 8
AA 199 140 40 379
A 567 153 40 760
BBB 1,610* 161 159 1,930
BB or below 280* 31 9 320
Total 2,664 485 248 3,397
* Total exposure to the more directly impacted sub-segments of Exploration and Production and Oil and Gas services is £779 million.
The tables above exclude assets held to cover linked liabilities and those of the consolidated unit trusts and similar funds. In addition, the table above excludes the
proportionate share of oil and gas debt holdings of the Group’s joint venture operations.
C3.4 Loans portfolio
Loans are accounted for at amortised cost net of impairment except for:
— Certain
mortgage loans which have been designated at fair value through profit or loss of the UK insurance operations as this loan portfolio is managed and evaluated on a fair value basis; and
— Certain policy loans of the US insurance operations which are held to back liabilities for funds withheld under reinsurance arrangement and are also accounted on a fair
value basis. See note (b).
The amounts included in the statement of financial position are analysed as follows:
2014 £m 2013 £m
Insurance operations:
Asianote(a) 1,014 922
USnote(b) 6,719 6,375
UKnote(c) 4,254 4,173
Asset management operations:
M&Gnote(d) 854 1,096
Total 12,841 12,566
a Asia insurance operations
The loans of the Group’s Asia insurance operations comprise:
2014 £m 2013 £m
Mortgage loans* 88 57
Policy loans* 672 611
Other loans† 254 254
Total Asia insurance operations loans 1,014 922
* The mortgage and policy loans are secured by
properties and life insurance policies respectively.
† The majority of the other loans are commercial loans held by the Malaysia operation and which are all
investment graded by two local rating agencies.
Financial statements C: Balance sheet notes
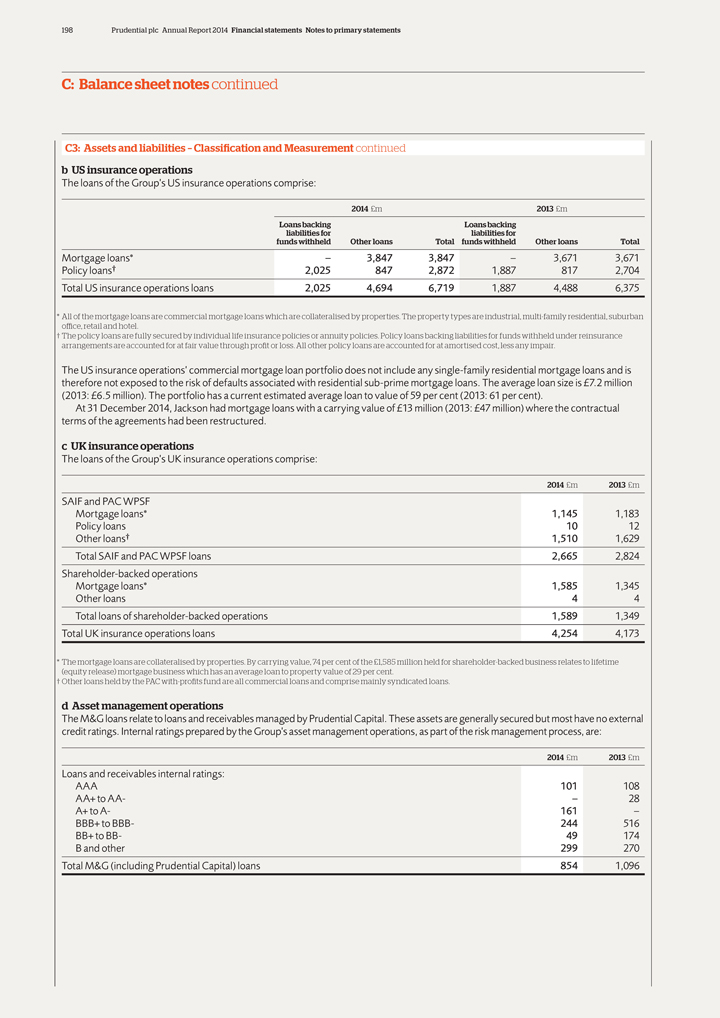
198 Prudential plc Annual Report 2014 Financial statements Notes to primary statements
C: Balance sheet notes continued
C3: Assets and liabilities – Classification and
Measurement continued b US insurance operations
The loans of the Group’s US insurance operations comprise:
2014 £m 2013 £m
Loans backing Loans backing
liabilities for liabilities for
funds withheld Other loans Total funds withheld Other loans
Total
Mortgage loans* – 3,847 3,847 – 3,671 3,671
Policy
loans† 2,025 847 2,872 1,887 817 2,704
Total US insurance operations loans 2,025 4,694 6,719 1,887 4,488 6,375
* All of the mortgage loans are commercial mortgage loans which are collateralised by properties. The property types are industrial, multi-family residential, suburban office,
retail and hotel.
† The policy loans are fully secured by individual life insurance policies or annuity policies. Policy loans backing liabilities for funds
withheld under reinsurance arrangements are accounted for at fair value through profit or loss. All other policy loans are accounted for at amortised cost, less any impair.
The US insurance operations’ commercial mortgage loan portfolio does not include any single-family residential mortgage loans and is therefore not exposed to the risk of
defaults associated with residential sub-prime mortgage loans. The average loan size is £7.2 million (2013: £6.5 million). The portfolio has a current estimated average loan to value of 59 per cent (2013: 61 per cent).
At 31 December 2014, Jackson had mortgage loans with a carrying value of £13 million (2013: £47 million) where the contractual terms of the
agreements had been restructured.
c UK insurance operations
The loans of the
Group’s UK insurance operations comprise:
2014 £m 2013 £m
SAIF and PAC WPSF
Mortgage loans* 1,145 1,183
Policy loans 10 12
Other loans† 1,510 1,629
Total SAIF and PAC WPSF loans 2,665 2,824
Shareholder-backed operations
Mortgage loans* 1,585 1,345
Other loans 4 4
Total loans of shareholder-backed operations 1,589 1,349
Total UK insurance operations loans
4,254 4,173
* The mortgage loans are collateralised by properties. By carrying value, 74 per cent of the £1,585 million held for shareholder-backed
business relates to lifetime (equity release) mortgage business which has an average loan to property value of 29 per cent.
† Other loans held by the PAC
with-profits fund are all commercial loans and comprise mainly syndicated loans.
d Asset management operations
The M&G loans relate to loans and receivables managed by Prudential Capital. These assets are generally secured but most have no external credit ratings. Internal ratings
prepared by the Group’s asset management operations, as part of the risk management process, are:
2014 £m 2013 £m
Loans and receivables internal ratings:
AAA 101 108
AA+ to AA- – 28
A+ to A- 161 –
BBB+ to BBB- 244 516
BB+ to BB- 49 174
B and other 299 270
Total M&G (including Prudential Capital) loans 854 1,096

Prudential plc Annual Report 2014 199
C3.5
Financial instruments – additional information a Market risk i Liquidity analysis
Contractual maturities of financial liabilities on an undiscounted cash flow
basis
The following table sets out the contractual maturities for applicable classes of financial liabilities, excluding derivative liabilities and investment
contracts that are separately presented. The financial liabilities are included in the column relating to the contractual maturities at the undiscounted cash flows (including contractual interest payments) due to be paid assuming conditions are
consistent with those of year end.
2014 £m
Total After 1 After 5 After
10 After 15
carrying 1 year year to years to years to years to Over No stated
value or less 5 years 10 years 15 years 20 years 20 years maturity Total
Financial liabilities
Core structural borrowings of
shareholder-financed operationsC6.1 4,304 166 927 1,079 1,064 914 2,456 1,796 8,402
Operational borrowings attributable to
shareholder-financed operationsC6.2
2,263 2,202 65 – – – – – 2,267
Borrowings attributable to with-profits
fundsC6.2 1,093 97 717 205 25 11 63 162 1,280
Obligations under funding, securities
lending and sale and repurchase
agreements 2,347 2,347 – – –
– – – 2,347
Other liabilities 4,105 1,678 133 13 – – – 2,281 4,105
Net asset value attributable to unit
holders of consolidated unit trusts
and similar funds 7,357 7,357 – – – – – – 7,357
Other creditors
4,262 3,941 24 44 86 78 365 – 4,538
25,731 17,788 1,866 1,341 1,175 1,003 2,884 4,239 30,296
2013 £m
Total After 1 After 5 After 10 After 15
carrying 1 year year to years to years to years to Over No stated
value or less 5 years 10
years 15 years 20 years 20 years maturity Total
Financial liabilities
Core
structural borrowings of
shareholder-financed operationsC6.1 4,636 166 928 1,100 823 1,196 2,542 1,721 8,476
Operational borrowings attributable to
shareholder-financed operationsC6.2 2,152 1,790 375
– – – – – 2,165
Borrowings attributable to with-profits
fundsC6.2 895 118 406 211 48 12 70 189 1,054
Obligations under funding, securities
lending and sale and repurchase
agreements 2,074 2,074 – – – – –
– 2,074
Other liabilities 3,736 1,526 44 58 – – – 2,108 3,736
Net asset value attributable to unit
holders of consolidated unit trusts
and similar funds 5,278 5,278 – – – – – – 5,278
Other creditors
3,307 3,049 24 39 79 74 386 – 3,651
22,078 14,001 1,777 1,408 950 1,282 2,998 4,018 26,434
Maturity analysis of derivatives
The following table shows the gross and net derivative
positions together with a maturity profile of the net derivative position:
Carrying value of net derivatives £m Maturity profile of net derivative position
£m
Net After 1 After 3
Derivative Derivative derivative 1 year year to
years to After 5
assets liabilities position or less 3 years 5 years years Total
2014 3,412 (2,323) 1,089 1,245 (14) (9) 10 1,232
2013 2,329 (1,689) 640
697 (12) (9) 18 694
Financial statements C: Balance sheet notes
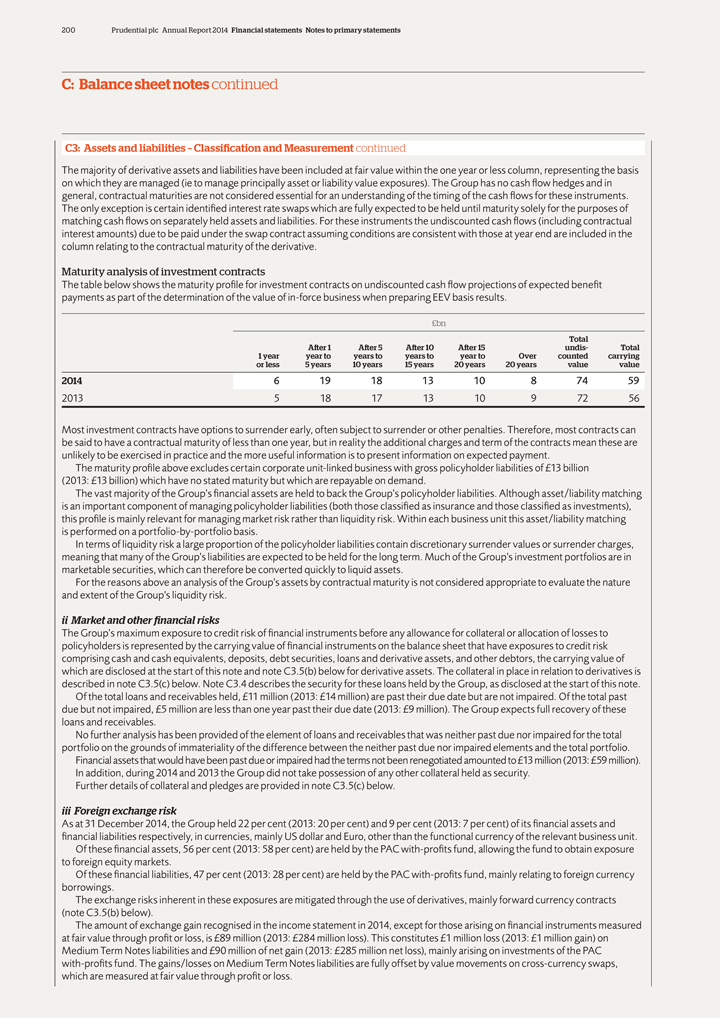
200 Prudential plc Annual Report 2014 Financial statements Notes to primary statements
C: Balance sheet notes continued
C3: Assets and liabilities – Classification and
Measurement continued
The majority of derivative assets and liabilities have been included at fair value within the one year or less column, representing the basis
on which they are managed (ie to manage principally asset or liability value exposures). The Group has no cash flow hedges and in general, contractual maturities are not considered essential for an understanding of the timing of the cash flows for
these instruments. The only exception is certain identified interest rate swaps which are fully expected to be held until maturity solely for the purposes of matching cash flows on separately held assets and liabilities. For these instruments the
undiscounted cash flows (including contractual interest amounts) due to be paid under the swap contract assuming conditions are consistent with those at year end are included in the column relating to the contractual maturity of the derivative.
Maturity analysis of investment contracts
The table below shows the maturity
profile for investment contracts on undiscounted cash flow projections of expected benefit payments as part of the determination of the value of in-force business when preparing EEV basis results.
£bn
Total
After 1 After 5 After 10 After 15 undis- Total
1 year year to years to years to year to Over
counted carrying
or less 5 years 10 years 15 years 20 years 20 years value value
2014 6 19 18 13 10 8 74 59
2013 5 18 17 13 10 9 72 56
Most investment contracts have options to surrender early, often subject to surrender or other penalties. Therefore, most contracts can be said to have a contractual maturity of
less than one year, but in reality the additional charges and term of the contracts mean these are unlikely to be exercised in practice and the more useful information is to present information on expected payment.
The maturity profile above excludes certain corporate unit-linked business with gross policyholder liabilities of £13 billion (2013: £13 billion) which have no stated
maturity but which are repayable on demand.
The vast majority of the Group’s financial assets are held to back the Group’s policyholder liabilities.
Although asset/liability matching is an important component of managing policyholder liabilities (both those classified as insurance and those classified as investments), this profile is mainly relevant for managing market risk rather than liquidity
risk. Within each business unit this asset/liability matching is performed on a portfolio-by-portfolio basis.
In terms of liquidity risk a large proportion of the
policyholder liabilities contain discretionary surrender values or surrender charges, meaning that many of the Group’s liabilities are expected to be held for the long term. Much of the Group’s investment portfolios are in marketable
securities, which can therefore be converted quickly to liquid assets.
For the reasons above an analysis of the Group’s assets by contractual maturity is not
considered appropriate to evaluate the nature and extent of the Group’s liquidity risk.
ii Market and other financial risks
The Group’s maximum exposure to credit risk of financial instruments before any allowance for collateral or allocation of losses to policyholders is represented by the
carrying value of financial instruments on the balance sheet that have exposures to credit risk comprising cash and cash equivalents, deposits, debt securities, loans and derivative assets, and other debtors, the carrying value of which are
disclosed at the start of this note and note C3.5(b) below for derivative assets. The collateral in place in relation to derivatives is described in note C3.5(c) below. Note C3.4 describes the security for these loans held by the Group, as disclosed
at the start of this note.
Of the total loans and receivables held, £11 million (2013: £14 million) are past their due date but are not impaired.
Of the total past due but not impaired, £5 million are less than one year past their due date (2013: £9 million). The Group expects full recovery of these loans and receivables.
No further analysis has been provided of the element of loans and receivables that was neither past due nor impaired for the total portfolio on the grounds of immateriality of the
difference between the neither past due nor impaired elements and the total portfolio.
Financial assets that would have been past due or impaired had the terms not
been renegotiated amounted to £13 million (2013: £59 million). In addition, during 2014 and 2013 the Group did not take possession of any other collateral held as security.
Further details of collateral and pledges are provided in note C3.5(c) below.
iii Foreign
exchange risk
As at 31 December 2014, the Group held 22 per cent (2013: 20 per cent) and 9 per cent (2013: 7 per cent) of its financial
assets and financial liabilities respectively, in currencies, mainly US dollar and Euro, other than the functional currency of the relevant business unit.
Of these
financial assets, 56 per cent (2013: 58 per cent) are held by the PAC with-profits fund, allowing the fund to obtain exposure to foreign equity markets.
Of these financial liabilities, 47 per cent (2013: 28 per cent) are held by the PAC with-profits fund, mainly relating to foreign currency borrowings.
The exchange risks inherent in these exposures are mitigated through the use of derivatives, mainly forward currency contracts (note C3.5(b) below).
The amount of exchange gain recognised in the income statement in 2014, except for those arising on financial instruments measured at fair value through profit or loss, is
£89 million (2013: £284 million loss). This constitutes £1 million loss (2013: £1 million gain) on Medium Term Notes liabilities and £90 million of net gain (2013: £285 million net
loss), mainly arising on investments of the PAC with-profits fund. The gains/losses on Medium Term Notes liabilities are fully offset by value movements on cross-currency swaps, which are measured at fair value through profit or loss.
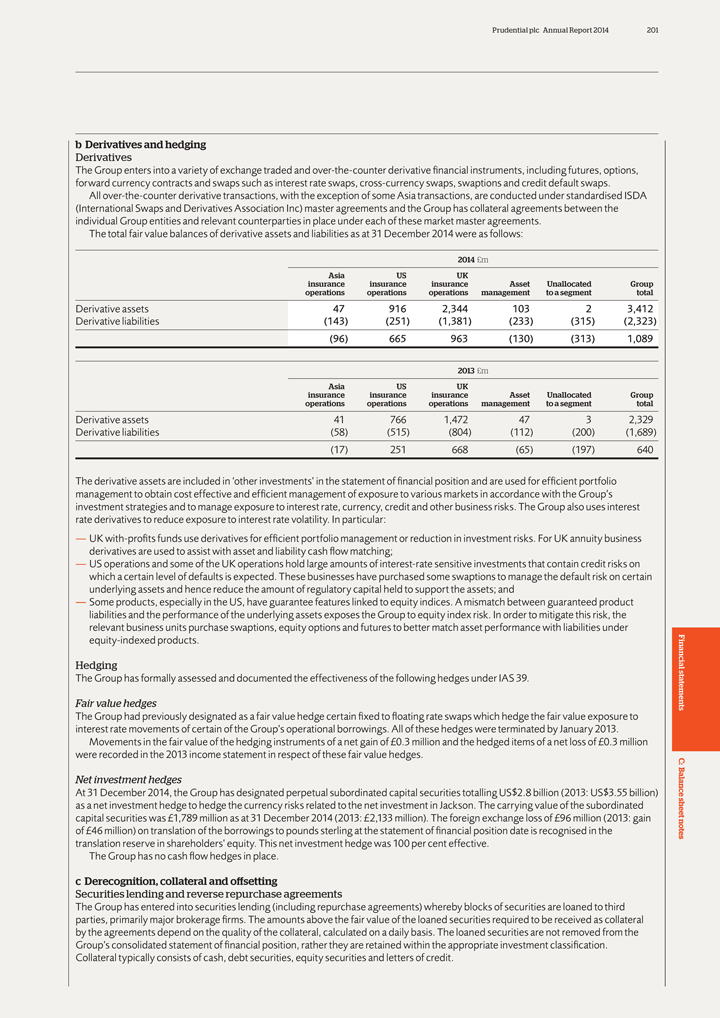
Prudential plc Annual Report 2014 201
b
Derivatives and hedging
Derivatives
The Group enters into a variety of
exchange traded and over-the-counter derivative financial instruments, including futures, options, forward currency contracts and swaps such as interest rate swaps, cross-currency swaps, swaptions and credit default swaps.
All over-the-counter derivative transactions, with the exception of some Asia transactions, are conducted under standardised ISDA (International Swaps and Derivatives Association
Inc) master agreements and the Group has collateral agreements between the individual Group entities and relevant counterparties in place under each of these market master agreements.
The total fair value balances of derivative assets and liabilities as at 31 December 2014 were as follows:
2014 £m Asia US UK insurance insurance insurance Asset Unallocated Group operations operations operations management to a segment total
Derivative assets 47 916 2,344 103 2 3,412 Derivative liabilities (143) (251) (1,381) (233) (315) (2,323) (96) 665 963
(130) (313) 1,089
2013 £m Asia US UK insurance insurance insurance Asset Unallocated Group operations operations operations management to a segment
total
Derivative assets 41 766 1,472 47 3 2,329 Derivative liabilities (58) (515) (804) (112) (200) (1,689) (17) 251 668
(65) (197) 640
The derivative assets are included in ‘other investments’ in the statement of financial position and are used for efficient
portfolio management to obtain cost effective and efficient management of exposure to various markets in accordance with the Group’s investment strategies and to manage exposure to interest rate, currency, credit and other business risks. The
Group also uses interest rate derivatives to reduce exposure to interest rate volatility. In particular:
— UK with-profits funds use derivatives for efficient
portfolio management or reduction in investment risks. For UK annuity business derivatives are used to assist with asset and liability cash flow matching;
—
US operations and some of the UK operations hold large amounts of interest-rate sensitive investments that contain credit risks on which a certain level of defaults is expected. These businesses have purchased some swaptions to manage the default
risk on certain underlying assets and hence reduce the amount of regulatory capital held to support the assets; and
— Some products, especially in the US,
have guarantee features linked to equity indices. A mismatch between guaranteed product liabilities and the performance of the underlying assets exposes the Group to equity index risk. In order to mitigate this risk, the relevant business units
purchase swaptions, equity options and futures to better match asset performance with liabilities under equity-indexed products.
Hedging
The Group has formally assessed and documented the effectiveness of the following hedges under IAS 39.
Fair value hedges
The Group had previously designated as a fair value hedge certain fixed to
floating rate swaps which hedge the fair value exposure to interest rate movements of certain of the Group’s operational borrowings. All of these hedges were terminated by January 2013.
Movements in the fair value of the hedging instruments of a net gain of £0.3 million and the hedged items of a net loss of £0.3 million were recorded in the
2013 income statement in respect of these fair value hedges.
Net investment hedges
At 31 December 2014, the Group has designated perpetual subordinated capital securities totalling US$2.8 billion (2013: US$3.55 billion) as a net investment hedge to hedge the
currency risks related to the net investment in Jackson. The carrying value of the subordinated capital securities was £1,789 million as at 31 December 2014 (2013: £2,133 million). The foreign exchange loss of
£96 million (2013: gain of £46 million) on translation of the borrowings to pounds sterling at the statement of financial position date is recognised in the translation reserve in shareholders’ equity. This net investment hedge
was 100 per cent effective.
The Group has no cash flow hedges in place.
c Derecognition, collateral and offsetting
Securities lending and reverse
repurchase agreements
The Group has entered into securities lending (including repurchase agreements) whereby blocks of securities are loaned to third parties,
primarily major brokerage firms. The amounts above the fair value of the loaned securities required to be received as collateral by the agreements depend on the quality of the collateral, calculated on a daily basis. The loaned securities are not
removed from the Group’s consolidated statement of financial position, rather they are retained within the appropriate investment classification. Collateral typically consists of cash, debt securities, equity securities and letters of credit.
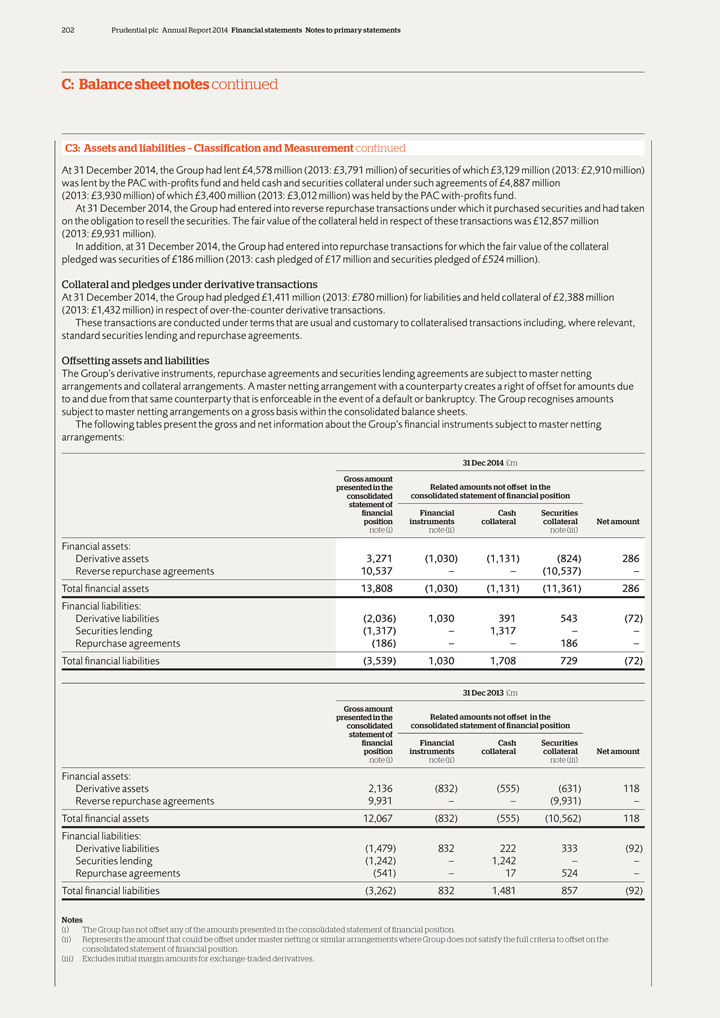
202 Prudential plc Annual Report 2014 Financial statements Notes to primary statements
C: Balance sheet notes continued
C3: Assets and liabilities – Classification and
Measurement continued
At 31 December 2014, the Group had lent £4,578 million (2013: £3,791 million) of securities of which
£3,129 million (2013: £2,910 million) was lent by the PAC with-profits fund and held cash and securities collateral under such agreements of £4,887 million (2013: £3,930 million) of which £3,400 million
(2013: £3,012 million) was held by the PAC with-profits fund.
At 31 December 2014, the Group had entered into reverse repurchase transactions under
which it purchased securities and had taken on the obligation to resell the securities. The fair value of the collateral held in respect of these transactions was £12,857 million (2013: £9,931 million).
In addition, at 31 December 2014, the Group had entered into repurchase transactions for which the fair value of the collateral pledged was securities of
£186 million (2013: cash pledged of £17 million and securities pledged of £524 million).
Collateral and pledges under derivative
transactions
At 31 December 2014, the Group had pledged £1,411 million (2013: £780 million) for liabilities and held collateral of
£2,388 million (2013: £1,432 million) in respect of over-the-counter derivative transactions.
These transactions are conducted under terms that
are usual and customary to collateralised transactions including, where relevant, standard securities lending and repurchase agreements.
Offsetting assets and
liabilities
The Group’s derivative instruments, repurchase agreements and securities lending agreements are subject to master netting arrangements and
collateral arrangements. A master netting arrangement with a counterparty creates a right of offset for amounts due to and due from that same counterparty that is enforceable in the event of a default or bankruptcy. The Group recognises amounts
subject to master netting arrangements on a gross basis within the consolidated balance sheets.
The following tables present the gross and net information about
the Group’s financial instruments subject to master netting arrangements:
31 Dec 2014 £m Gross amount presented in the Related amounts not offset in the
consolidated consolidated statement of financial position statement of financial Financial Cash Securities position instruments collateral collateral Net amount note (i) note (ii) note (iii)
Financial assets:
Derivative assets 3,271 (1,030) (1,131) (824) 286
Reverse repurchase agreements 10,537 – – (10,537) –
Total financial assets
13,808 (1,030) (1,131) (11,361) 286
Financial liabilities:
Derivative liabilities (2,036) 1,030 391 543 (72)
Securities lending
(1,317) – 1,317 – – Repurchase agreements (186) – – 186 – Total financial liabilities (3,539) 1,030 1,708 729 (72)
31
Dec 2013 £m Gross amount presented in the Related amounts not offset in the consolidated consolidated statement of financial position statement of financial Financial Cash Securities position instruments collateral collateral Net amount note
(i) note (ii) note (iii)
Financial assets:
Derivative assets 2,136
(832) (555) (631) 118 Reverse repurchase agreements 9,931 – – (9,931) – Total financial assets 12,067 (832) (555) (10,562) 118 Financial liabilities: Derivative liabilities (1,479) 832 222 333
(92) Securities lending (1,242) – 1,242 – – Repurchase agreements (541) – 17 524 – Total financial liabilities (3,262) 832 1,481 857 (92)
Notes
| (i) | The Group has not offset any of the amounts presented in the consolidated statement of financial position. |
(ii) Represents the amount that could be offset under master netting or similar arrangements where Group
does not satisfy the full criteria to offset on the consolidated statement of financial position.
(iii) Excludes initial margin amounts for exchange-traded
derivatives.
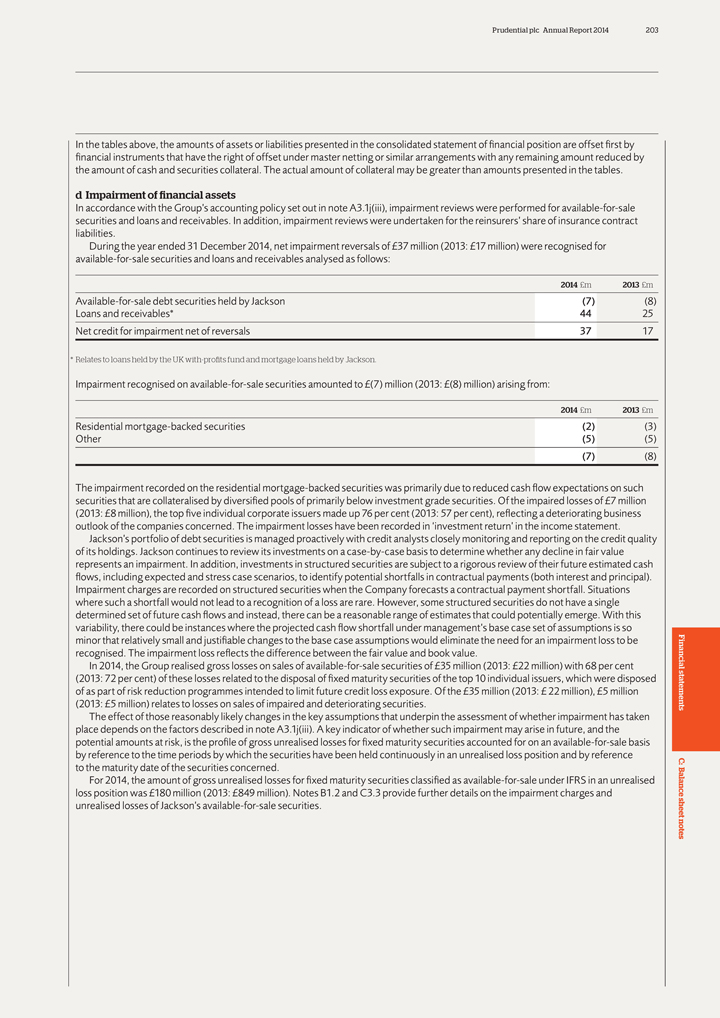
Prudential plc Annual Report 2014 203
In the
tables above, the amounts of assets or liabilities presented in the consolidated statement of financial position are offset first by financial instruments that have the right of offset under master netting or similar arrangements with any remaining
amount reduced by the amount of cash and securities collateral. The actual amount of collateral may be greater than amounts presented in the tables.
d Impairment
of financial assets
In accordance with the Group’s accounting policy set out in note A3.1j(iii), impairment reviews were performed for available-for-sale
securities and loans and receivables. In addition, impairment reviews were undertaken for the reinsurers’ share of insurance contract liabilities.
During the
year ended 31 December 2014, net impairment reversals of £37 million (2013: £17 million) were recognised for available-for-sale securities and loans and receivables analysed as follows:
2014 £m 2013 £m
Available-for-sale debt securities held by Jackson
(7) (8) Loans and receivables* 44 25 Net credit for impairment net of reversals 37 17
| * | Relates to loans held by the UK with-profits fund and mortgage loans held by Jackson. |
Impairment recognised on available-for-sale securities amounted to £(7) million (2013: £(8) million)
arising from:
2014 £m 2013 £m
Residential mortgage-backed
securities (2) (3) Other (5) (5)
| (7) | (8) |
The impairment recorded on the residential mortgage-backed securities was primarily due to reduced cash flow expectations on such securities that are collateralised by
diversified pools of primarily below investment grade securities. Of the impaired losses of £7 million (2013: £8 million), the top five individual corporate issuers made up 76 per cent (2013: 57 per cent), reflecting a
deteriorating business outlook of the companies concerned. The impairment losses have been recorded in ‘investment return’ in the income statement.
Jackson’s portfolio of debt securities is managed proactively with credit analysts closely monitoring and reporting on the credit quality of its holdings.
Jackson continues to review its investments on a case-by-case basis to determine whether any decline in fair value represents an impairment. In addition, investments in structured securities are subject to a rigorous review of their future estimated
cash flows, including expected and stress case scenarios, to identify potential shortfalls in contractual payments (both interest and principal). Impairment charges are recorded on structured securities when the Company forecasts a contractual
payment shortfall. Situations where such a shortfall would not lead to a recognition of a loss are rare. However, some structured securities do not have a single determined set of future cash flows and instead, there can be a reasonable range of
estimates that could potentially emerge. With this variability, there could be instances where the projected cash flow shortfall under management’s base case set of assumptions is so minor that relatively small and justifiable changes to the
base case assumptions would eliminate the need for an impairment loss to be recognised. The impairment loss reflects the difference between the fair value and book value. Financial In 2014, the Group realised gross losses on sales of
available-for-sale securities of £35 million (2013: £22 million) with 68 per cent (2013: 72 per cent) of these losses related to the disposal of fixed maturity securities of the top 10 individual issuers, which were
disposed of as part of risk reduction programmes intended to limit future credit loss exposure. Of the £35 million (2013: £ 22 million), £5 million (2013: £5 million) relates to losses on sales of impaired and
deteriorating securities. statements The effect of those reasonably likely changes in the key assumptions that underpin the assessment of whether impairment has taken place depends on the factors described in note A3.1j(iii). A key indicator of
whether such impairment may arise in future, and the potential amounts at risk, is the profile of gross unrealised losses for fixed maturity securities accounted for on an available-for-sale basis by reference to the time periods by which the
securities have been held continuously in an unrealised loss position and by reference C: to the maturity date of the securities concerned.
al B
For 2014, the amount of gross unrealised losses for fixed maturity securities classified as available-for-sale under IFRS in an unrealised loss position was £180 million
(2013: £849 million). Notes B1.2 and C3.3 provide further details on the impairment charges and ance unrealised losses of Jackson’s available-for-sale securities. sheet
notes
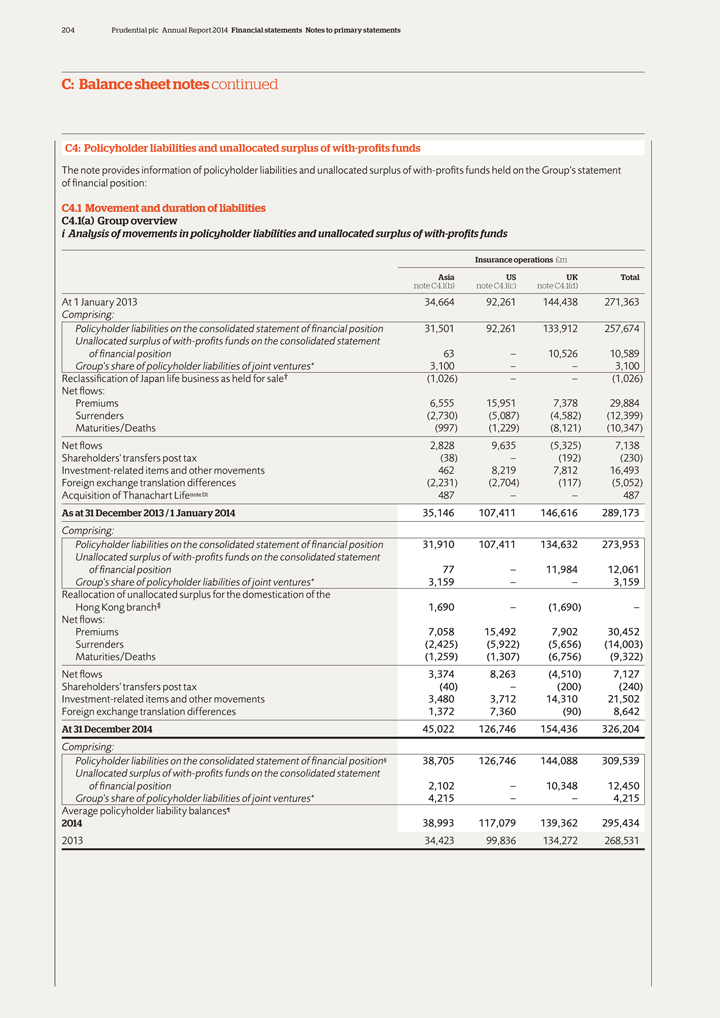
204 Prudential plc Annual Report 2014 Financial statements Notes to primary statements
C: Balance sheet notes continued
C4: Policyholder liabilities and unallocated surplus of
with-profits funds
The note provides information of policyholder liabilities and unallocated surplus of with-profits funds held on the Group’s statement of
financial position:
C4.1 Movement and duration of liabilities C4.1(a) Group overview i Analysis of movements in policyholder liabilities and unallocated surplus of
with-profits funds
Insurance operations £m
Asia US UK Total note
C4.1(b) note C4.1(c) note C4.1(d)
At 1 January 2013 34,664 92,261 144,438 271,363
Comprising:
Policyholder liabilities on the consolidated statement of financial position
31,501 92,261 133,912 257,674 Unallocated surplus of with-profits funds on the consolidated statement of financial position 63 – 10,526 10,589 Group’s share of policyholder liabilities of joint ventures* 3,100 – – 3,100
Reclassification of Japan life business as held for sale† (1,026) – – (1,026) Net flows: Premiums 6,555 15,951 7,378 29,884 Surrenders (2,730) (5,087) (4,582) (12,399) Maturities/Deaths
(997) (1,229) (8,121) (10,347) Net flows 2,828 9,635 (5,325) 7,138 Shareholders’ transfers post tax (38) – (192) (230) Investment-related items and other movements 462 8,219 7,812 16,493 Foreign
exchange translation differences (2,231) (2,704) (117) (5,052) Acquisition of Thanachart Lifenote D1 487 – – 487
As at
31 December 2013 / 1 January 2014 35,146 107,411 146,616 289,173
Comprising:
Policyholder liabilities on the consolidated statement of financial position 31,910 107,411 134,632 273,953 Unallocated surplus of with-profits funds on the consolidated statement
of financial position 77 – 11,984 12,061 Group’s share of policyholder liabilities of joint ventures* 3,159 – – 3,159
Reallocation of
unallocated surplus for the domestication of the
Hong Kong branch‡ 1,690 – (1,690) – Net flows: Premiums 7,058 15,492 7,902 30,452 Surrenders
(2,425) (5,922) (5,656) (14,003) Maturities/Deaths (1,259) (1,307) (6,756) (9,322) Net flows 3,374 8,263 (4,510) 7,127
Shareholders’ transfers post tax (40) – (200) (240) Investment-related items and other movements 3,480 3,712 14,310 21,502 Foreign
exchange translation differences 1,372 7,360 (90) 8,642
At 31 December 2014 45,022 126,746 154,436 326,204
Comprising:
Policyholder liabilities on the consolidated statement of financial position§
38,705 126,746 144,088 309,539 Unallocated surplus of with-profits funds on the consolidated statement of financial position 2,102 – 10,348 12,450 Group’s share of policyholder liabilities of joint ventures* 4,215 – – 4,215
Average policyholder liability balances¶
2014 38,993 117,079 139,362
295,434
2013 34,423 99,836 134,272 268,531
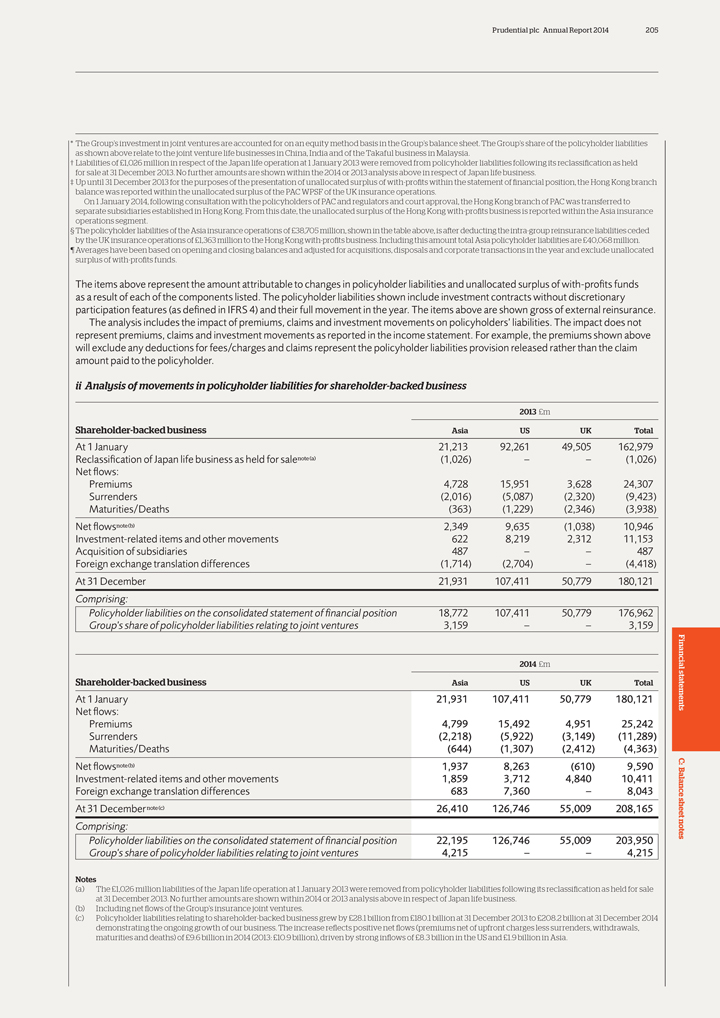
Prudential plc Annual Report 2014 205
* The
Group’s investment in joint ventures are accounted for on an equity method basis in the Group’s balance sheet. The Group’s share of the policyholder liabilities as shown above relate to the joint venture life businesses in China,
India and of the Takaful business in Malaysia.
† Liabilities of £1,026 million in respect of the Japan life operation at 1 January 2013 were
removed from policyholder liabilities following its reclassification as held for sale at 31 December 2013. No further amounts are shown within the 2014 or 2013 analysis above in respect of Japan life business.
‡ Up until 31 December 2013 for the purposes of the presentation of unallocated surplus of with-profits within the statement of financial position, the Hong Kong branch
balance was reported within the unallocated surplus of the PAC WPSF of the UK insurance operations.
On 1 January 2014, following consultation with the
policyholders of PAC and regulators and court approval, the Hong Kong branch of PAC was transferred to separate subsidiaries established in Hong Kong. From this date, the unallocated surplus of the Hong Kong with-profits business is reported within
the Asia insurance operations segment.
§ The policyholder liabilities of the Asia insurance operations of £38,705 million, shown in the table
above, is after deducting the intra-group reinsurance liabilities ceded by the UK insurance operations of £1,363 million to the Hong Kong with-profits business. Including this amount total Asia policyholder liabilities are £40,068
million.
¶ Averages have been based on opening and closing balances and adjusted for acquisitions, disposals and corporate transactions in the year and
exclude unallocated surplus of with-profits funds.
The items above represent the amount attributable to changes in policyholder liabilities and unallocated surplus
of with-profits funds as a result of each of the components listed. The policyholder liabilities shown include investment contracts without discretionary participation features (as defined in IFRS 4) and their full movement in the year. The items
above are shown gross of external reinsurance.
The analysis includes the impact of premiums, claims and investment movements on policyholders’ liabilities.
The impact does not represent premiums, claims and investment movements as reported in the income statement. For example, the premiums shown above will exclude any deductions for fees/charges and claims represent the policyholder liabilities
provision released rather than the claim amount paid to the policyholder.
ii Analysis of movements in policyholder liabilities for shareholder-backed business
2013 £m
Shareholder-backed business Asia US UK Total
At 1 January 21,213 92,261 49,505 162,979 Reclassification of Japan life business as held for salenote (a) (1,026) – – (1,026) Net flows:
Premiums 4,728 15,951 3,628 24,307 Surrenders (2,016) (5,087) (2,320) (9,423) Maturities/Deaths (363) (1,229) (2,346) (3,938) Net flowsnote (b) 2,349 9,635 (1,038) 10,946 Investment-related items and
other movements 622 8,219 2,312 11,153 Acquisition of subsidiaries 487 – – 487 Foreign exchange translation differences (1,714) (2,704) – (4,418) At 31 December 21,931 107,411 50,779 180,121
Comprising:
Policyholder liabilities on the consolidated statement of financial position
18,772 107,411 50,779 176,962 Group’s share of policyholder liabilities relating to joint ventures 3,159 – – 3,159
2014 £m Financial
Shareholder-backed business Asia US UK Total
At 1 January 21,931
107,411 50,779 180,121 statements
Net flows:
Premiums 4,799 15,492 4,951
25,242 Surrenders (2,218) (5,922) (3,149) (11,289) Maturities/Deaths (644) (1,307) (2,412) (4,363)
C:
Net flowsnote (b) 1,937 8,263 (610) 9,590 B
Investment-related items and other
movements 1,859 3,712 4,840 10,411 al Foreign exchange translation differences 683 7,360 – 8,043 ance
At 31 Decembernote (c) 26,410 126,746 55,009
208,165 sheet
Comprising: notes Policyholder liabilities on the consolidated statement of financial position 22,195 126,746 55,009 203,950 Group’s share of
policyholder liabilities relating to joint ventures 4,215 – – 4,215
Notes
(a) The £1,026 million liabilities of the Japan life operation at 1 January 2013 were removed from policyholder liabilities following its reclassification as held
for sale at 31 December 2013. No further amounts are shown within 2014 or 2013 analysis above in respect of Japan life business.
| (b) | Including net flows of the Group’s insurance joint ventures. |
(c) Policyholder liabilities relating to shareholder-backed business grew by £28.1 billion from £180.1 billion at 31 December 2013 to £208.2 billion at 31 December 2014 demonstrating the ongoing growth of our business. The increase reflects positive net flows (premiums net of upfront charges less surrenders, withdrawals, maturities and deaths) of £9.6 billion in 2014 (2013: £10.9 billion), driven by strong inflows of £8.3 billion in the US and £1.9 billion in Asia.
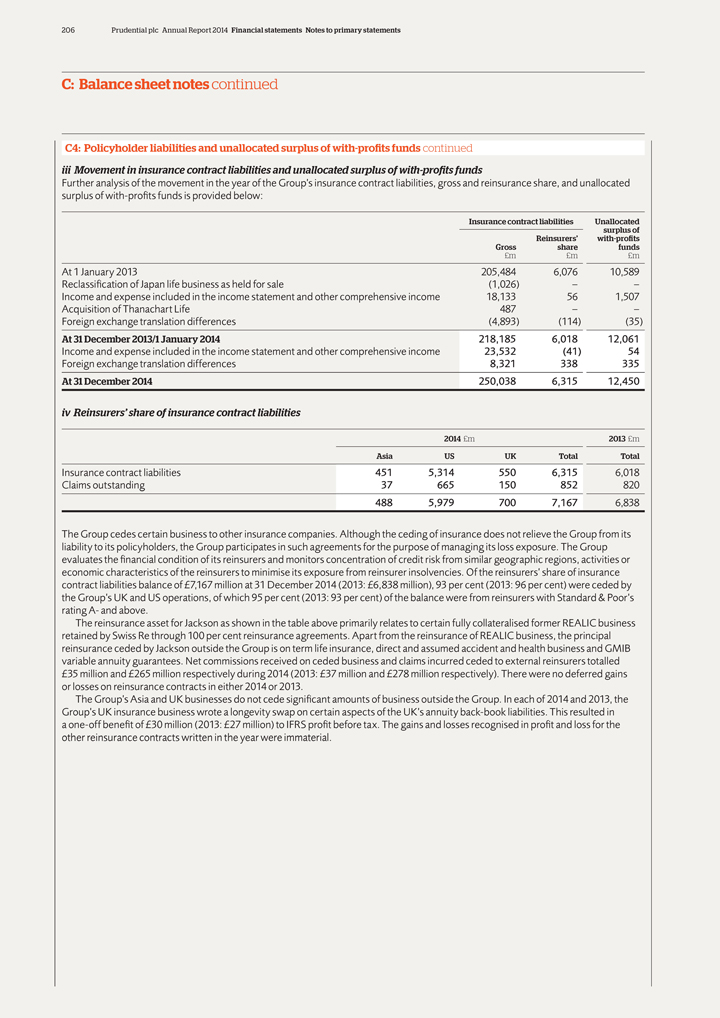
206 Prudential plc Annual Report 2014 Financial statements Notes to primary statements
C: Balance sheet notes continued
C4: Policyholder liabilities and unallocated surplus of
with-profits funds continued iii Movement in insurance contract liabilities and unallocated surplus of with-profits funds
Further analysis of the movement in the
year of the Group’s insurance contract liabilities, gross and reinsurance share, and unallocated surplus of with-profits funds is provided below:
Insurance
contract liabilities Unallocated surplus of Reinsurers’ with-profits Gross share funds
£m £m £m
At 1 January 2013 205,484 6,076 10,589 Reclassification of Japan life business as held for sale (1,026) – – Income and expense included in the income statement
and other comprehensive income 18,133 56 1,507 Acquisition of Thanachart Life 487 – – Foreign exchange translation differences (4,893) (114) (35)
At 31 December 2013/1 January 2014 218,185 6,018 12,061
Income and
expense included in the income statement and other comprehensive income 23,532 (41) 54 Foreign exchange translation differences 8,321 338 335
At
31 December 2014 250,038 6,315 12,450
iv Reinsurers’ share of insurance contract liabilities
2014 £m 2013 £m
Asia US UK Total Total
Insurance contract liabilities 451 5,314 550 6,315 6,018 Claims outstanding 37 665 150 852 820
488 5,979 700 7,167 6,838
The Group cedes certain business to other insurance
companies. Although the ceding of insurance does not relieve the Group from its liability to its policyholders, the Group participates in such agreements for the purpose of managing its loss exposure. The Group evaluates the financial condition of
its reinsurers and monitors concentration of credit risk from similar geographic regions, activities or economic characteristics of the reinsurers to minimise its exposure from reinsurer insolvencies. Of the reinsurers’ share of insurance
contract liabilities balance of £7,167 million at 31 December 2014 (2013: £6,838 million), 93 per cent (2013: 96 per cent) were ceded by the Group’s UK and US operations, of which 95 per cent (2013:
93 per cent) of the balance were from reinsurers with Standard & Poor’s rating A- and above.
The reinsurance asset for Jackson as shown in the
table above primarily relates to certain fully collateralised former REALIC business retained by Swiss Re through 100 per cent reinsurance agreements. Apart from the reinsurance of REALIC business, the principal reinsurance ceded by Jackson
outside the Group is on term life insurance, direct and assumed accident and health business and GMIB variable annuity guarantees. Net commissions received on ceded business and claims incurred ceded to external reinsurers totalled
£35 million and £265 million respectively during 2014 (2013: £37 million and £278 million respectively). There were no deferred gains or losses on reinsurance contracts in either 2014 or 2013.
The Group’s Asia and UK businesses do not cede significant amounts of business outside the Group. In each of 2014 and 2013, the Group’s UK insurance business wrote a
longevity swap on certain aspects of the UK’s annuity back-book liabilities. This resulted in a one-off benefit of £30 million (2013: £27 million) to IFRS profit before tax. The gains and losses recognised in profit and loss
for the other reinsurance contracts written in the year were immaterial.
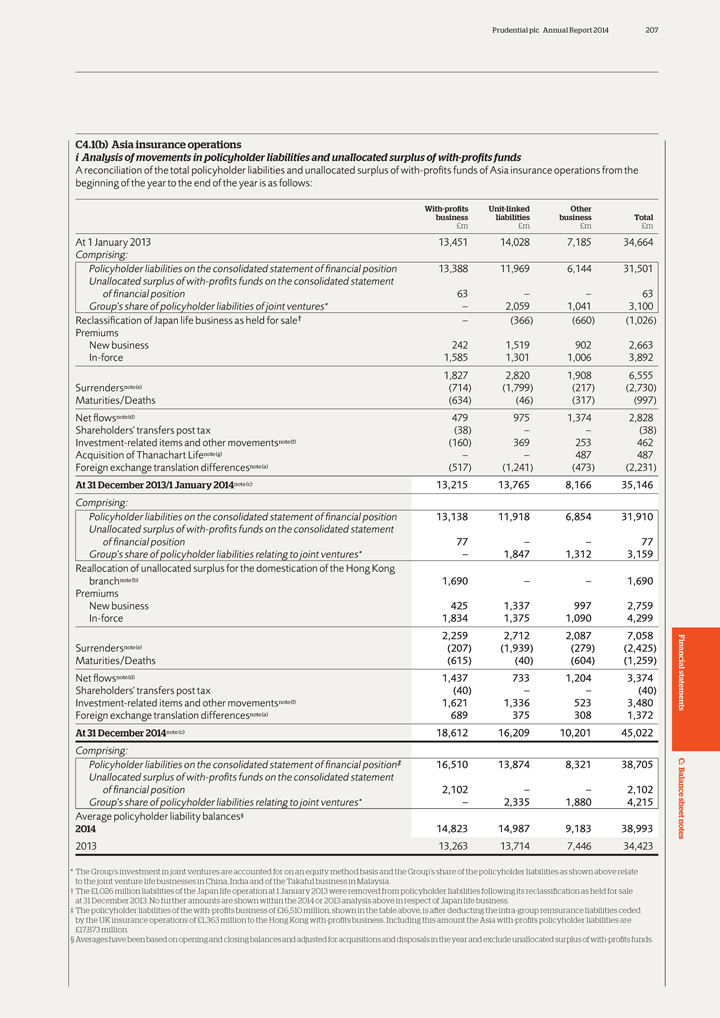
Prudential plc Annual Report 2014 207
C4.1(b) Asia
insurance operations i Analysis of movements in policyholder liabilities and unallocated surplus of with-profits funds
A reconciliation of the total policyholder
liabilities and unallocated surplus of with-profits funds of Asia insurance operations from the beginning of the year to the end of the year is as follows:
With-profits Unit-linked Other business liabilities business Total
£m
£m £m £m
At 1 January 2013 13,451 14,028 7,185 34,664
Comprising:
Policyholder liabilities on the consolidated statement of
financial position 13,388 11,969 6,144 31,501 Unallocated surplus of with-profits funds on the consolidated statement of financial position 63 – – 63 Group’s share of policyholder liabilities of joint ventures* – 2,059 1,041
3,100 Reclassification of Japan life business as held for sale† – (366) (660) (1,026) Premiums New business 242 1,519 902 2,663 In-force 1,585 1,301 1,006 3,892 1,827 2,820 1,908 6,555 Surrendersnote
(e) (714) (1,799) (217) (2,730) Maturities/Deaths (634) (46) (317) (997) Net flowsnote (d) 479 975 1,374 2,828 Shareholders’ transfers post tax (38) – –
(38) Investment-related items and other movementsnote (f) (160) 369 253 462 Acquisition of Thanachart Lifenote (g) – – 487 487 Foreign exchange translation differencesnote
(a) (517) (1,241) (473) (2,231)
At 31 December 2013/1 January 2014note (c) 13,215 13,765 8,166 35,146
Comprising:
Policyholder liabilities on the consolidated statement of financial position
13,138 11,918 6,854 31,910 Unallocated surplus of with-profits funds on the consolidated statement of financial position 77 – – 77 Group’s share of policyholder liabilities relating to joint ventures* – 1,847 1,312 3,159
Reallocation of unallocated surplus for the domestication of the Hong Kong branchnote (b) 1,690 – – 1,690
Premiums
New business 425 1,337 997 2,759 In-force 1,834 1,375 1,090 4,299 2,259 2,712 2,087
7,058 Surrendersnote (e) (207) (1,939) (279) (2,425) Maturities/Deaths (615) (40) (604) (1,259) Financial Net flowsnote (d) 1,437 733 1,204 3,374
Shareholders’ transfers post tax (40) – – (40) Investment-related items and other movementsnote (f) 1,621 1,336 523 3,480 statements Foreign exchange
translation differencesnote (a) 689 375 308 1,372
At 31 December 2014note (c) 18,612 16,209 10,201 45,022
Comprising:
Policyholder liabilities on the consolidated statement of financial position‡
16,510 13,874 8,321 38,705 C:
al B
Unallocated surplus of with-profits funds
on the consolidated statement of financial position 2,102 – – 2,102 ance Group’s share of policyholder liabilities relating to joint ventures* – 2,335 1,880 4,215
Average policyholder liability balances§ sheet
2014 14,823 14,987 9,183 38,993 notes
2013 13,263 13,714 7,446 34,423
* The Group’s investment in joint
ventures are accounted for on an equity method basis and the Group’s share of the policyholder liabilities as shown above relate to the joint venture life businesses in China, India and of the Takaful business in Malaysia.
† The £1,026 million liabilities of the Japan life operation at 1 January 2013 were removed from policyholder liabilities following its reclassification as
held for sale at 31 December 2013. No further amounts are shown within the 2014 or 2013 analysis above in respect of Japan life business.
‡ The
policyholder liabilities of the with-profits business of £16,510 million, shown in the table above, is after deducting the intra-group reinsurance liabilities ceded by the UK insurance operations of £1,363 million to the Hong
Kong with-profits business. Including this amount the Asia with-profits policyholder liabilities are £17,873 million.
§ Averages have been based on
opening and closing balances and adjusted for acquisitions and disposals in the year and exclude unallocated surplus of with-profits funds.
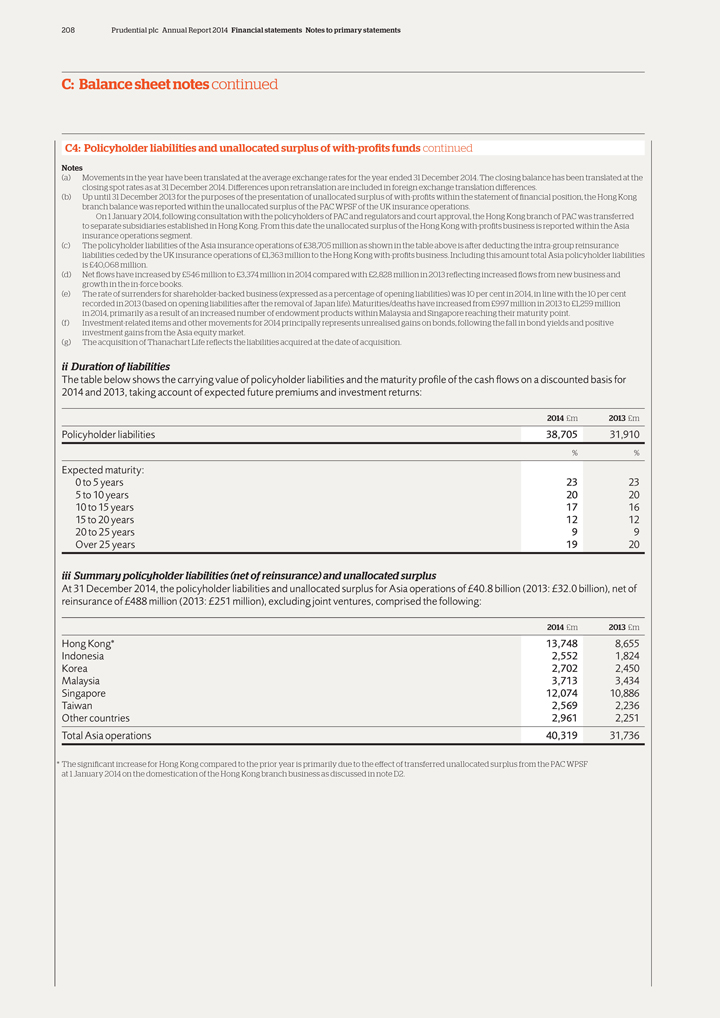
208 Prudential plc Annual Report 2014 Financial statements Notes to primary statements
C: Balance sheet notes continued
C4: Policyholder liabilities and unallocated surplus of
with-profits funds continued
Notes
(a) Movements in the year have been
translated at the average exchange rates for the year ended 31 December 2014. The closing balance has been translated at the closing spot rates as at 31 December 2014. Differences upon retranslation are included in foreign exchange
translation differences.
(b) Up until 31 December 2013 for the purposes of the presentation of unallocated surplus of with-profits within the statement of
financial position, the Hong Kong branch balance was reported within the unallocated surplus of the PAC WPSF of the UK insurance operations.
On 1 January
2014, following consultation with the policyholders of PAC and regulators and court approval, the Hong Kong branch of PAC was transferred to separate subsidiaries established in Hong Kong. From this date the unallocated surplus of the Hong Kong
with-profits business is reported within the Asia insurance operations segment.
(c) The policyholder liabilities of the Asia insurance operations of
£38,705 million as shown in the table above is after deducting the intra-group reinsurance liabilities ceded by the UK insurance operations of £1,363 million to the Hong Kong with-profits business. Including this amount total
Asia policyholder liabilities is £40,068 million.
(d) Net flows have increased by £546 million to £3,374 million in 2014 compared with
£2,828 million in 2013 reflecting increased flows from new business and growth in the in-force books.
(e) The rate of surrenders for shareholder-backed
business (expressed as a percentage of opening liabilities) was 10 per cent in 2014, in line with the 10 per cent recorded in 2013 (based on opening liabilities after the removal of Japan life). Maturities/deaths have increased from
£997 million in 2013 to £1,259 million in 2014, primarily as a result of an increased number of endowment products within Malaysia and Singapore reaching their maturity point.
(f) Investment-related items and other movements for 2014 principally represents unrealised gains on bonds, following the fall in bond yields and positive investment gains from the
Asia equity market.
| (g) | The acquisition of Thanachart Life reflects the liabilities acquired at the date of acquisition. |
ii Duration of liabilities
The
table below shows the carrying value of policyholder liabilities and the maturity profile of the cash flows on a discounted basis for 2014 and 2013, taking account of expected future premiums and investment returns:
2014 £m 2013 £m
Policyholder liabilities 38,705 31,910
% %
Expected maturity:
0 to 5 years 23 23 5 to 10 years 20 20 10 to 15 years 17 16 15 to 20 years 12 12 20 to 25 years 9 9 Over 25 years 19 20
iii Summary policyholder liabilities (net of reinsurance) and unallocated surplus
At
31 December 2014, the policyholder liabilities and unallocated surplus for Asia operations of £40.8 billion (2013: £32.0 billion), net of reinsurance of £488 million (2013: £251 million), excluding joint ventures,
comprised the following:
2014 £m 2013 £m
Hong Kong* 13,748 8,655
Indonesia 2,552 1,824 Korea 2,702 2,450 Malaysia 3,713 3,434 Singapore 12,074 10,886 Taiwan 2,569 2,236 Other countries 2,961 2,251 Total Asia operations 40,319 31,736
* The significant increase for Hong Kong compared to the prior year is primarily due to the effect of transferred unallocated surplus from the PAC WPSF at 1 January 2014 on
the domestication of the Hong Kong branch business as discussed in note D2.
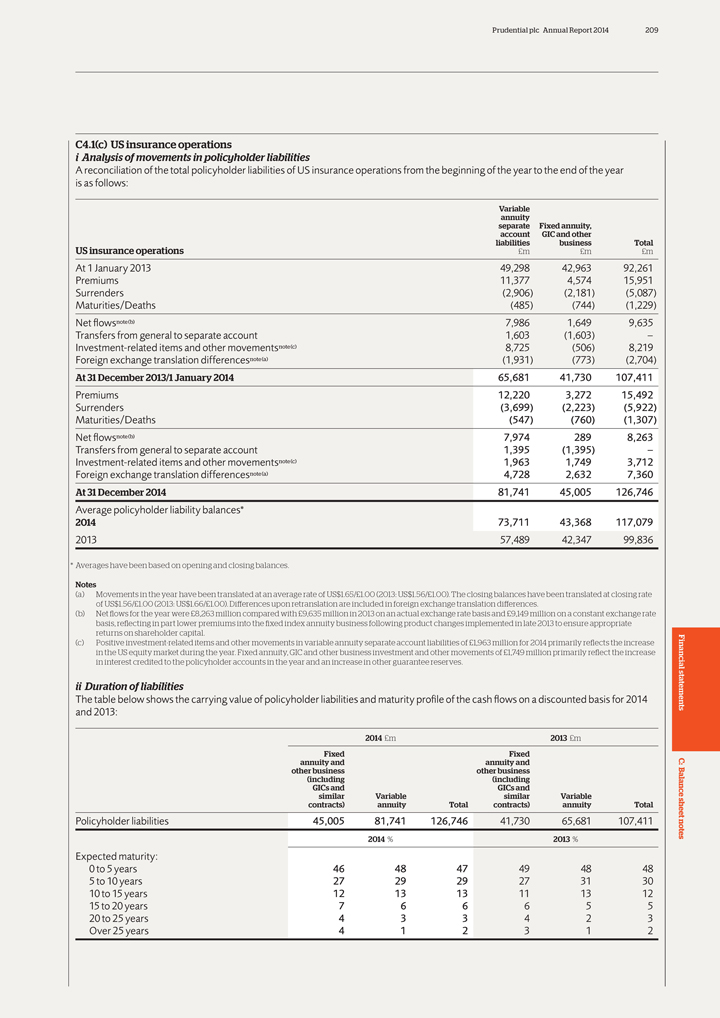
Prudential plc Annual Report 2014 209
C4.1(c) US
insurance operations i Analysis of movements in policyholder liabilities
A reconciliation of the total policyholder liabilities of US insurance operations from the
beginning of the year to the end of the year is as follows:
Variable annuity separate Fixed annuity, account GIC and other liabilities business Total
US insurance operations £m £m £m
At 1 January 2013 49,298 42,963 92,261
Premiums 11,377 4,574 15,951 Surrenders (2,906) (2,181) (5,087) Maturities/Deaths (485) (744) (1,229) Net flowsnote (b) 7,986 1,649 9,635 Transfers from general to separate account 1,603 (1,603) –
Investment-related items and other movementsnote (c) 8,725 (506) 8,219 Foreign exchange translation differencesnote (a) (1,931) (773) (2,704)
At 31 December 2013/1 January 2014 65,681 41,730 107,411
Premiums 12,220 3,272
15,492 Surrenders (3,699) (2,223) (5,922)
Maturities/Deaths (547) (760) (1,307)
Net flowsnote (b) 7,974 289 8,263
Transfers from general to separate account 1,395
(1,395) – Investment-related items and other movementsnote (c) 1,963 1,749 3,712 Foreign exchange translation differencesnote (a) 4,728 2,632 7,360
At 31 December 2014 81,741 45,005 126,746
Average policyholder liability balances*
2014 73,711 43,368 117,079
2013 57,489 42,347 99,836
| * | Averages have been based on opening and closing balances. |
Notes
(a) Movements in the year have been translated at
an average rate of US$1.65/£1.00 (2013: US$1.56/£1.00). The closing balances have been translated at closing rate of US$1.56/£1.00 (2013: US$1.66/£1.00). Differences upon retranslation are included in foreign exchange
translation differences.
(b) Net flows for the year were £8,263 million compared with £9,635 million in 2013 on an actual exchange rate basis
and £9,149 million on a constant exchange rate basis, reflecting in part lower premiums into the fixed index annuity business following product changes implemented in late 2013 to ensure appropriate returns on shareholder capital.
(c) Positive investment-related items and other movements in variable annuity separate account liabilities of £1,963 million for 2014 primarily reflects
the increase in the US equity market during the year. Fixed annuity, GIC and other business investment and other movements of £1,749 million primarily reflect the increase in interest credited to the policyholder accounts in the year and
an increase in other guarantee reserves. Financial
ii Duration of liabilities
The table below shows the carrying value of policyholder liabilities and maturity profile of the cash flows on a discounted basis for 2014 statements and 2013:
2014 £m 2013 £m Fixed Fixed annuity and annuity and C: other business other business al B
(including (including
GICs and GICs and ance similar Variable similar Variable contracts)
annuity Total contracts) annuity Total sheet
Policyholder liabilities 45,005 81,741 126,746 41,730 65,681 107,411notes
2014 % 2013 %
Expected maturity:
0 to 5 years 46 48 47 49 48 48 5 to 10 years 27 29 29 27 31 30 10 to 15 years 12 13 13 11 13 12 15 to 20 years 7 6 6 6 5 5 20 to 25 years 4 3 3 4 2 3 Over 25 years 4 1 2 3 1 2
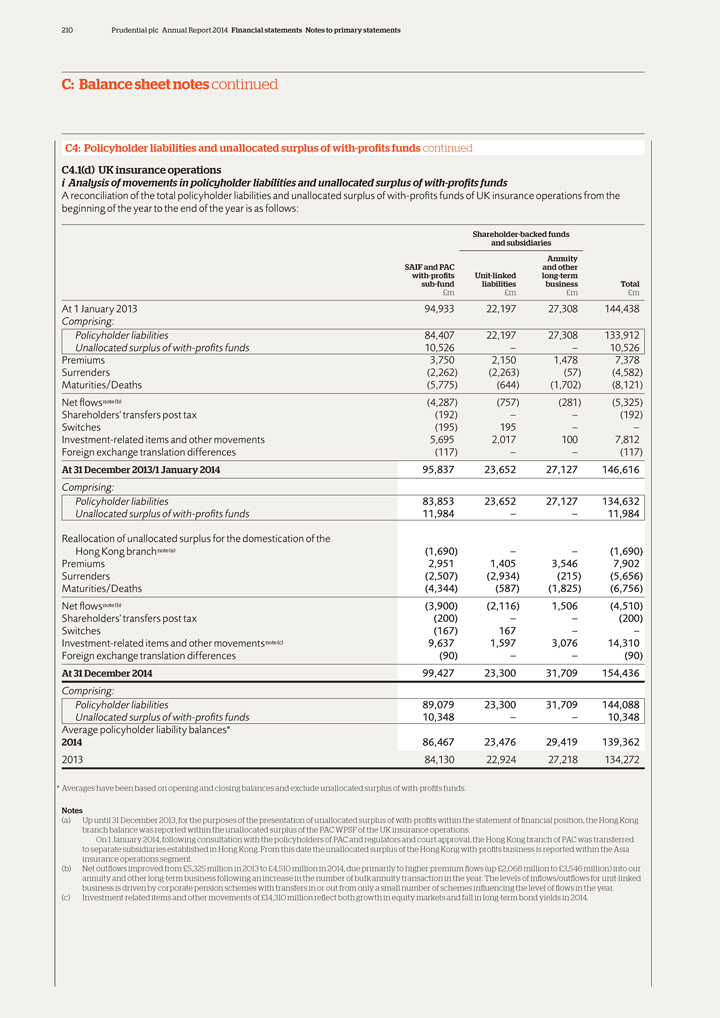
210 Prudential plc Annual Report 2014 Financial statements Notes to primary statements
C: Balance sheet notes continued
C4: Policyholder liabilities and unallocated surplus of
with-profits funds continued C4.1(d) UK insurance operations i Analysis of movements in policyholder liabilities and unallocated surplus of with-profits funds
A
reconciliation of the total policyholder liabilities and unallocated surplus of with-profits funds of UK insurance operations from the beginning of the year to the end of the year is as follows:
Shareholder-backed funds and subsidiaries Annuity SAIF and PAC and other with-profits Unit-linked long-term sub-fund liabilities business Total
£m £m £m £m
At 1 January 2013 94,933 22,197 27,308 144,438
Comprising:
Policyholder liabilities 84,407 22,197 27,308 133,912
Unallocated surplus of with-profits funds 10,526 – – 10,526 Premiums 3,750 2,150 1,478 7,378 Surrenders (2,262) (2,263) (57) (4,582) Maturities/Deaths
(5,775) (644) (1,702) (8,121) Net flows note (b) (4,287) (757) (281) (5,325) Shareholders’ transfers post tax (192) – – (192) Switches (195) 195 – –
Investment-related items and other movements 5,695 2,017 100 7,812 Foreign exchange translation differences (117) – – (117)
At 31 December
2013/1 January 2014 95,837 23,652 27,127 146,616
Comprising:
Policyholder liabilities 83,853 23,652 27,127 134,632
Unallocated surplus of
with-profits funds 11,984 – – 11,984
Reallocation of unallocated surplus for the domestication of the
Hong Kong branch note (a) (1,690) – – (1,690) Premiums 2,951 1,405 3,546 7,902 Surrenders
(2,507) (2,934) (215) (5,656) Maturities/Deaths (4,344) (587) (1,825) (6,756) Net flows note (b) (3,900) (2,116) 1,506 (4,510)
Shareholders’ transfers post tax (200) – – (200)
Switches (167) 167
– –
Investment-related items and other movements note (c) 9,637 1,597 3,076 14,310 Foreign exchange translation differences (90) – –
(90)
At 31 December 2014 99,427 23,300 31,709 154,436
Comprising:
Policyholder liabilities 89,079 23,300 31,709 144,088
Unallocated surplus of
with-profits funds 10,348 – – 10,348
Average policyholder liability balances*
2014 86,467 23,476 29,419 139,362
2013 84,130 22,924 27,218 134,272
| * | Averages have been based on opening and closing balances and exclude unallocated surplus of with-profits funds. |
Notes
(a) Up
until 31 December 2013, for the purposes of the presentation of unallocated surplus of with-profits within the statement of financial position, the Hong Kong branch balance was reported within the unallocated surplus of the PAC WPSF of the UK
insurance operations.
On 1 January 2014, following consultation with the policyholders of PAC and regulators and court approval, the Hong Kong branch of PAC
was transferred to separate subsidiaries established in Hong Kong. From this date the unallocated surplus of the Hong Kong with-profits business is reported within the Asia insurance operations segment.
(b) Net outflows improved from £5,325 million in 2013 to £4,510 million in 2014, due primarily to higher premium flows (up £2,068 million to
£3,546 million) into our annuity and other long-term business following an increase in the number of bulk annuity transaction in the year. The levels of inflows/outflows for unit-linked business is driven by corporate pension schemes with
transfers in or out from only a small number of schemes influencing the level of flows in the year. (c) Investment-related items and other movements of £14,310 million reflect both growth in equity markets and fall in long-term bond
yields in 2014.
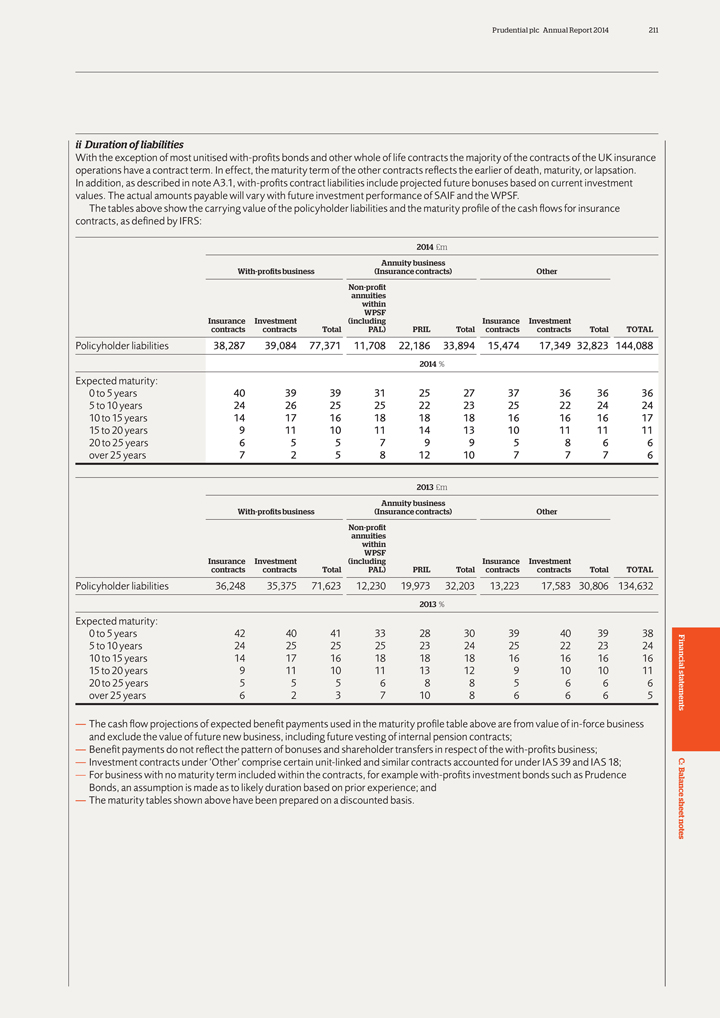
Prudential plc Annual Report 2014 211
ii Duration
of liabilities
With the exception of most unitised with-profits bonds and other whole of life contracts the majority of the contracts of the UK insurance
operations have a contract term. In effect, the maturity term of the other contracts reflects the earlier of death, maturity, or lapsation. In addition, as described in note A3.1, with-profits contract liabilities include projected future bonuses
based on current investment values. The actual amounts payable will vary with future investment performance of SAIF and the WPSF.
The tables above show the
carrying value of the policyholder liabilities and the maturity profile of the cash flows for insurance contracts, as defined by IFRS:
2014 £m Annuity
business
With-profits business (Insurance contracts) Other Non-profit annuities within WPSF
Insurance Investment (including Insurance Investment contracts contracts Total PAL) PRIL Total contracts contracts Total TOTAL
Policyholder liabilities 38,287 39,084 77,371 11,708 22,186 33,894 15,474 17,349 32,823 144,088
2014 %
Expected maturity:
0 to 5 years 40 39 39 31 25 27 37 36 36 36 5 to 10 years 24 26 25 25 22 23 25 22 24 24 10 to 15 years 14 17 16 18 18 18 16 16 16 17 15 to 20 years 9 11 10 11 14 13 10 11 11 11
20 to 25 years 6 5 5 7 9 9 5 8 6 6 over 25 years 7 2 5 8 12 10 7 7 7 6
2013
£m Annuity business
With-profits business (Insurance contracts) Other Non-profit annuities within WPSF
Insurance Investment (including Insurance Investment contracts contracts Total PAL) PRIL Total contracts contracts Total TOTAL
Policyholder liabilities 36,248 35,375 71,623 12,230 19,973 32,203 13,223 17,583 30,806 134,632
2013 %
Expected maturity:
0 to 5 years 42 40 41 33 28 30 39 40 39 38 5 to 10 years 24 25 25 25 23 24 25 22 23 24 10 to 15 years 14 17 16 18 18 18 16 16 16 16 Financial 15 to 20 years 9 11 10 11 13 12 9 10
10 11 20 to 25 years 5 5 5 6 8 8 5 6 6 6 over 25 years 6 2 3 7 10 8 6 6 6 5 statements
— The cash flow projections of expected benefit payments used in the
maturity profile table above are from value of in-force business and exclude the value of future new business, including future vesting of internal pension contracts;
— Benefit payments do not reflect the pattern of bonuses and shareholder transfers in respect of the with-profits business;
— Investment contracts under ‘Other’ comprise certain unit-linked and similar contracts accounted for under IAS 39 and IAS 18; C:
— For business with no maturity term included within the contracts, for example with-profits investment bonds such as Prudence B al Bonds, an assumption is made as to likely
duration based on prior experience; and ance
— The maturity tables shown above have been prepared on a discounted basis. sheet
notes
212 Prudential plc Annual Report 2014 Financial statements Notes to primary statements
C: Balance sheet notes continued
C4: Policyholder liabilities and unallocated surplus of
with-profits funds continued C4.2 Products and determining contract liabilities a Asia
Features of products and guarantees
The life insurance products offered by the Group’s Asia operations include a range of with-profits and non-participating term, whole life, endowment and unit-linked policies.
The Asia operations also offer health, disability, critical illness and accident coverage to supplement its core life products.
The terms and conditions of the
contracts written by the Asia operations and, in particular, the products’ options and guarantees, vary from territory to territory depending upon local market circumstances.
In general terms, the Asia participating products provide savings and protection where the basic sum assured can be enhanced by a profit share (or bonus) from the underlying fund
as determined at the discretion of the insurers. The Asia operations’ non-participating term, whole life and endowment products offer savings and/or protection where the benefits are guaranteed, or determined by a set of defined market-related
parameters. Unit-linked products combine savings with protection, the cash value of the policy depends on the value of the underlying unitised funds. Health and Protection policies provide mortality or morbidity benefits and include health,
disability, critical illness and accident coverage. Health and Protection products are commonly offered as supplements to main life policies but can be sold separately.
Product guarantees in Asia can be broadly classified into four main categories, namely premium rate, cash value or interest rate guarantees, policy renewability, and convertibility
options.
Subject to local market circumstances and regulatory requirements, the guarantee features described in note C4.2(c) in respect of UK business broadly
apply to similar types of participating contracts written in Hong Kong, Singapore and Malaysia. Participating products have both guaranteed and non-guaranteed elements.
Non-participating long-term products are the only ones where the Group is contractually obliged to provide guarantees on all benefits. Unit-linked products have the lowest level of
guarantee.
The risks on death coverage through premium rate guarantees are low due to the diversified nature of the business as well as rigorous product pricing.
Cash value and interest rate guarantees are of three types:
Types Features
Maturity values Maturity values are guaranteed for non-participating products and on the guaranteed portion of participating products. Declared regular bonuses are
also guaranteed once vested. Future bonus rates and cash dividends are not guaranteed on participating products.
Surrender values Surrender values are guaranteed
for non-participating products and on the guaranteed portion of participating products. The surrender value of declared reversionary bonuses are also guaranteed once vested. Market value adjustments and surrender penalties are used for certain
products and where the law permits such adjustments in cash values.
Interest rate guarantees It is common in Asia for regulations or market-driven demand and
competition to provide some form of capital value protection and minimum crediting interest rate guarantees. This would be reflected within the guaranteed maturity and surrender values.
The guarantees are borne by shareholders for non-participating and investment-linked (non-investment guarantees only) products. Participating product guarantees are predominantly
supported by the segregated life funds and their estates.
Whole of life contracts with floor levels of policyholder benefits that accrue at rates set at inception
and do not vary subsequently with market conditions are written in the Korea life operations though this is not to a significant extent as Korea has a much higher proportion of linked and health business. The Korea business has non-linked
liabilities and linked liabilities at 31 December 2014 of £596 million and £2,109 million respectively (2013: £547 million and £1,905 million respectively).
Determining contract liabilities
For the with-profits business, the total value of the
with-profits funds is driven by the underlying asset valuation with movements reflected principally in the accounting value of policyholder liabilities and unallocated surplus. Similarly, for the unit-linked business, the attaching liabilities
reflect the unit value obligation driven by the value of the investments of the unit fund.
For the shareholder-backed non-linked business, the future policyholder
benefit provisions for Asia businesses in the Group’s IFRS accounts, are determined in accordance with methods prescribed by local GAAP adjusted to comply, where necessary, with the modified statutory basis or where local GAAP is not well
established and in which the business written is primarily non-participating and linked business, US GAAP principles are used as the most appropriate reporting basis.
For the countries which apply local GAAP adjusted to comply, where necessary, with modified statutory basis, the approach to determining the contract liabilities is driven by the
local solvency basis. A gross premium valuation method is used in those countries where a Risk-Based Capital framework is adopted for local solvency. Under the gross premium valuation method, all cash flows are valued explicitly using best estimate
assumptions.
A Risk-Based Capital framework applying the gross premium valuation method is adopted by Singapore, Malaysia, Thailand and from 2013, Indonesia. In
applying this approach, an overlay constraint to the method is applied such that no negative reserves are derived at an individual policyholder level.
In Vietnam,
the Company uses an estimation basis aligned substantially to that used by the countries applying the gross premium valuation method.
Prudential plc Annual Report 2014 213
For India,
Japan and Taiwan, US GAAP is applied for measuring insurance assets and liabilities. For these countries, the future policyholder benefit provisions for non-linked business are determined using the net level premium method, with an allowance
for surrenders, maintenance and claims expenses. Rates of interest used in establishing the policyholder benefit provisions vary by operation depending on the circumstances attaching to each block of business.
The other Asia operations principally adopt a net premium valuation method to determine the future policyholder benefit provisions. The effect of changes in assumptions used to
measure insurance assets and liabilities for Asia insurance operations is as disclosed in note B4(a).
b US
Features of products and guarantees
Jackson provides long-term savings and retirement products
to retail and institutional customers throughout the US and offers the products discussed below:
i Fixed annuities
Fixed interest rate annuities
At 31 December 2014, fixed interest rate annuities
accounted for 9 per cent (2013: 10 per cent) of policy and contract liabilities of Jackson. Fixed interest rate annuities are primarily deferred annuity products that are used for asset accumulation in retirement planning and for providing
income in retirement. They permit tax-deferred accumulation of funds and flexible payout options.
The policyholder of a fixed interest rate annuity pays Jackson a
premium, which is credited to the policyholder’s account. Periodically, interest is credited to the policyholder’s account and in some cases administrative charges are deducted from the policyholder’s account. Jackson makes benefit
payments at a future date as specified in the policy based on the value of the policyholder’s account at that date.
The policy provides that at Jackson’s
discretion it may reset the interest rate, subject to a guaranteed minimum. At 31 December 2014, Jackson had fixed interest rate annuities totalling £11.7 billion (2013: £11.2 billion) in account value with minimum guaranteed rates
ranging from 1.0 per cent to 5.5 per cent and a 3.03 per cent average guaranteed rate (2013: 1.0 per cent to 5.5 per cent and a 3.05 per cent average guaranteed rate).
Approximately 57 per cent (2013: 50 per cent) of the fixed interest rate annuities Jackson wrote in 2014 provide for a market value adjustment (‘MVA’), that
could be positive or negative, on surrenders in the surrender period of the policy. This formula-based adjustment approximates the change in value that assets supporting the product would realise as interest rates move up or down. The minimum
guaranteed rate is not affected by this adjustment. While the MVA feature minimises the surrender risk associated with certain fixed annuities, Jackson still bears a portion of the surrender risk on policies without this feature, and the investment
risk on all fixed interest rate annuities.
Fixed index annuities
Fixed index
annuities accounted for 6 per cent (2013: 7 per cent) of Jackson’s policy and contract liabilities at 31 December 2014. Fixed index annuities vary in structure, but generally are deferred annuities that enable policyholders to
obtain a portion of an equity-linked return (based on participation rates and caps), and provide a guaranteed minimum return. These guaranteed minimum rates are generally set at 1.0 to 3.0 per cent. At 31 December 2014, Jackson had fixed
index annuities allocated to indexed funds totalling £6.3 billion (2013: £6.1 billion) in account value with minimum guaranteed rates on index accounts ranging from 1.0 per cent to 3.0 per cent and a 1.83 per cent average
guaranteed rate (2013: 1.0 per cent to 3.0 per cent and a 1.85 per cent average guarantee rate). At 31 December 2014, Jackson also offers fixed interest accounts on some fixed index annuity products. At 31 December 2014,
fixed interest accounts of fixed index annuities totalled £1.8 billion (2013: £1.5 billion) in account value with minimum guaranteed rates ranging from 1.0 per cent to 3.0 per cent and a 2.53 per cent average guaranteed
rate (2013: 1.0 per cent to 3.0 per cent and a 2.56 per cent Financial average guaranteed rate).
Jackson hedges the equity return risk on fixed
index products using futures and options linked to the relevant index as well as through offsetting equity exposure in the variable annuity product. The cost of these hedges is taken into account in setting the index statements participation rates
or caps. Jackson bears the investment risk and a portion of the surrender risk on these products.
Immediate annuities
At 31 December 2014, immediate annuities accounted for 1 per cent (2013: 1 per cent) of Jackson’s policy and contract liabilities. C: Immediate annuities
guarantee a series of payments beginning within a year of purchase and continuing over either a fixed period
al B
of years and/or the life of the policyholder. If the term is for the life of the policyholder, then Jackson’s primary risks are mortality and reinvestment. The implicit
interest rate on these products is based on the market conditions that exist at the time the policy is issued and ance is guaranteed for the term of the annuity. sheet ii Variable annuities notes
At 31 December 2014, variable annuities accounted for 69 per cent (2013: 65 per cent) of Jackson’s policy and contract liabilities. Variable annuities are
deferred annuities that have the same tax advantages and payout options as fixed interest rate and fixed index annuities. They are also used for asset accumulation in retirement planning and to provide income in retirement.
The primary differences between variable annuities and fixed interest rate or fixed index annuities are investment risk and return. If a policyholder chooses a variable annuity,
the rate of return depends upon the performance of the selected fund portfolio. Policyholders may allocate their investment to either the fixed account or a selection of variable accounts. Investment risk on the variable account is borne by the
policyholder, while investment risk on the fixed account is borne by Jackson through guaranteed minimum fixed rates of return. At 31 December 2014, 5 per cent (2013: 6 per cent) of variable annuity funds were in fixed accounts.
Jackson had variable annuity funds in fixed accounts totalling £4.4 billion (2013: £4.2 billion ) with minimum guaranteed rates ranging from 1.0 per cent to 3.0 per cent and a 1.81 per cent average guaranteed rate (2013:
1.0 per cent to 3.0 per cent and a 1.85 per cent average guaranteed rate).
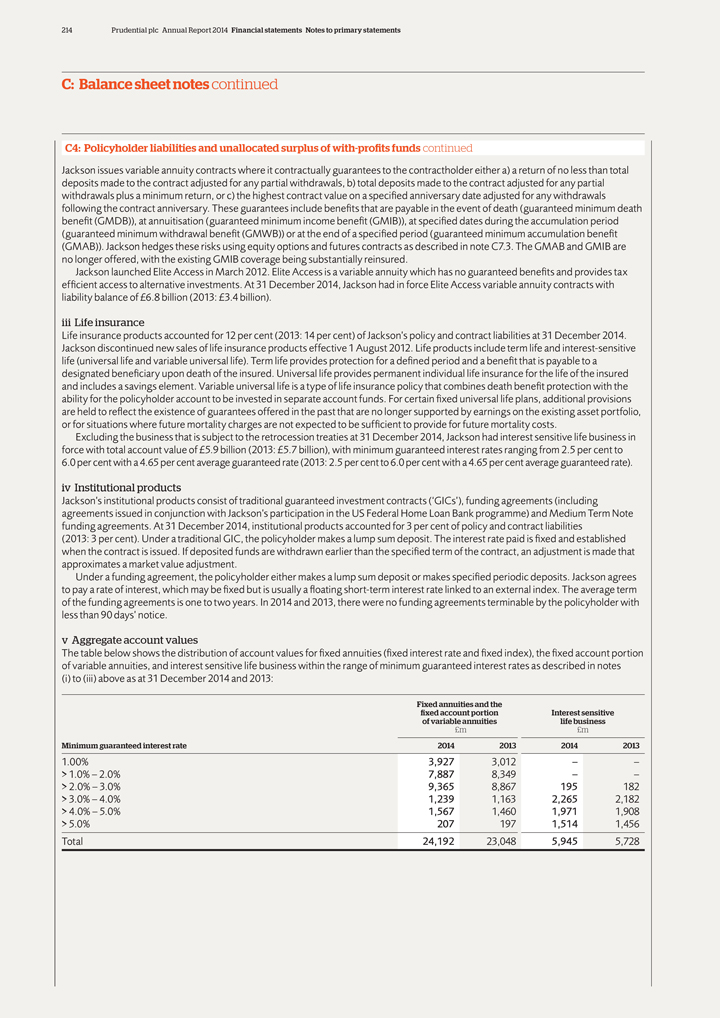
214 Prudential plc Annual Report 2014 Financial statements Notes to primary statements
C: Balance sheet notes continued
C4: Policyholder liabilities and unallocated surplus of
with-profits funds continued
Jackson issues variable annuity contracts where it contractually guarantees to the contractholder either a) a return of no less than
total deposits made to the contract adjusted for any partial withdrawals, b) total deposits made to the contract adjusted for any partial withdrawals plus a minimum return, or c) the highest contract value on a specified anniversary date adjusted
for any withdrawals following the contract anniversary. These guarantees include benefits that are payable in the event of death (guaranteed minimum death benefit (GMDB)), at annuitisation (guaranteed minimum income benefit (GMIB)), at specified
dates during the accumulation period (guaranteed minimum withdrawal benefit (GMWB)) or at the end of a specified period (guaranteed minimum accumulation benefit (GMAB)). Jackson hedges these risks using equity options and futures contracts as
described in note C7.3. The GMAB and GMIB are no longer offered, with the existing GMIB coverage being substantially reinsured.
Jackson launched Elite Access in
March 2012. Elite Access is a variable annuity which has no guaranteed benefits and provides tax efficient access to alternative investments. At 31 December 2014, Jackson had in force Elite Access variable annuity contracts with liability
balance of £6.8 billion (2013: £3.4 billion).
iii Life insurance
Life insurance products accounted for 12 per cent (2013: 14 per cent) of Jackson’s policy and contract liabilities at 31 December 2014. Jackson
discontinued new sales of life insurance products effective 1 August 2012. Life products include term life and interest-sensitive life (universal life and variable universal life). Term life provides protection for a defined period and a
benefit that is payable to a designated beneficiary upon death of the insured. Universal life provides permanent individual life insurance for the life of the insured and includes a savings element. Variable universal life is a type of life
insurance policy that combines death benefit protection with the ability for the policyholder account to be invested in separate account funds. For certain fixed universal life plans, additional provisions are held to reflect the existence of
guarantees offered in the past that are no longer supported by earnings on the existing asset portfolio, or for situations where future mortality charges are not expected to be sufficient to provide for future mortality costs.
Excluding the business that is subject to the retrocession treaties at 31 December 2014, Jackson had interest sensitive life business in force with total account value of
£5.9 billion (2013: £5.7 billion), with minimum guaranteed interest rates ranging from 2.5 per cent to 6.0 per cent with a 4.65 per cent average guaranteed rate (2013: 2.5 per cent to 6.0 per cent with a
4.65 per cent average guaranteed rate).
iv Institutional products
Jackson’s institutional products consist of traditional guaranteed investment contracts (‘GICs’), funding agreements (including agreements issued in
conjunction with Jackson’s participation in the US Federal Home Loan Bank programme) and Medium Term Note funding agreements. At 31 December 2014, institutional products accounted for 3 per cent of policy and contract liabilities
(2013: 3 per cent). Under a traditional GIC, the policyholder makes a lump sum deposit. The interest rate paid is fixed and established when the contract is issued. If deposited funds are withdrawn earlier than the specified term of the
contract, an adjustment is made that approximates a market value adjustment.
Under a funding agreement, the policyholder either makes a lump sum deposit or makes
specified periodic deposits. Jackson agrees to pay a rate of interest, which may be fixed but is usually a floating short-term interest rate linked to an external index. The average term of the funding agreements is one to two years. In 2014 and
2013, there were no funding agreements terminable by the policyholder with less than 90 days’ notice.
v Aggregate account values
The table below shows the distribution of account values for fixed annuities (fixed interest rate and fixed index), the fixed account portion of variable annuities, and interest
sensitive life business within the range of minimum guaranteed interest rates as described in notes (i) to (iii) above as at 31 December 2014 and 2013:
Fixed annuities and the fixed account portion Interest sensitive of variable annuities life business
£m £m
Minimum guaranteed interest rate 2014 2013 2014 2013
1.00% 3,927 3,012 – –
> 1.0% – 2.0% 7,887 8,349 – –
> 2.0% – 3.0% 9,365 8,867 195 182
> 3.0% – 4.0% 1,239 1,163 2,265 2,182
> 4.0% – 5.0% 1,567 1,460 1,971 1,908
> 5.0% 207 197 1,514 1,456
Total 24,192 23,048 5,945 5,728
Prudential plc Annual Report 2014 215
Determining
contract liabilities
As permissible under IFRS 4 and consistent with the basis explained in note A3.1, in the case of Jackson the carrying values of insurance
assets and liabilities are consolidated into the Group accounts based on US GAAP. An overview of the deferral and amortisation of acquisition costs for Jackson is provided in note C5.1(b).
With minor exceptions, all of Jackson’s contracts are accounted for as investment contracts as defined for US GAAP purposes by applying in the first instance a
retrospective deposit method to determine the liability for policyholder benefits. This is then augmented by potentially three additional amounts, namely:
—
Any amounts that have been assessed to compensate the insurer for services to be performed over future periods (ie deferred income);
— Any amounts previously
assessed against policyholders that are refundable on termination of the contract; and
— Any probable future loss on the contract (ie premium deficiency).
Capitalised acquisition costs and deferred income for these contracts are amortised over the life of the book of contracts. The present value of the estimated
gross profits is generally computed using the rate of interest that accrues to policyholder balances (sometimes referred to as the contract rate). Estimated gross profits include estimates of the elements, each of which will be determined based on
the best estimate of amounts of the elements over the life of the book of contracts without provision for adverse deviation:
— Amounts expected to be assessed
for mortality less benefit claims in excess of related policyholder balances;
— Amounts expected to be assessed for contract administration less costs
incurred for contract administration;
— Amounts expected to be earned from the investment of policyholder balances less interest credited to policyholder
balances;
— Amounts expected to be assessed against policyholder balances upon termination of contracts (sometimes referred to as surrender charges); and
— Other expected assessments and credits.
In the case of variable
annuity contracts with guaranteed benefits as described above, liabilities for these benefits are accounted for under US GAAP and are valued as described below.
In accordance with US GAAP, the Guaranteed Minimum Death Benefit and the ‘for life’ portion of Guaranteed Minimum Withdrawal Benefit liabilities are
determined each period end by estimating the expected value of benefits in excess of the projected account balance and recognising the excess ratably over the life of the contract based on total expected assessments. At 31 December 2014, these
liabilities were valued using a series of deterministic investment performance scenarios, a mean investment return of 7.4 per cent (2013: 7.4 per cent) net of external fund management fees, and assumptions for lapse, mortality and expense
that are similar to those used in amortising the capitalised acquisition costs.
The direct Guaranteed Minimum Income Benefit liability is determined by estimating
the expected value of the annuitisation benefits in excess of the projected account balance at the date of annuitisation and recognising the excess ratably over the accumulation period based on total expected assessments. The assumptions used for
calculating the direct Guaranteed Minimum Income Benefit liability at 31 December 2014 and 2013 are consistent with those used for calculating the Guaranteed Minimum Death Benefit and ‘for life’ Guaranteed Minimum Withdrawal Benefit
liabilities.
Jackson regularly evaluates estimates used and adjusts the additional Guaranteed Minimum Death Benefit, Guaranteed Minimum Income Benefit and
Guaranteed Minimum Withdrawal Benefit ‘for life’ liability balances, with a related charge or credit to benefit expense if actual experience or other evidence suggests that earlier assumptions should be revised.
Guaranteed Minimum Income Benefits are essentially fully reinsured, subject to a modest deductible and annual claim limits. As this reinsurance benefit is net settled, it is
considered to be a derivative under IAS 39, and is therefore recognised at fair value with the change Financial in fair value included as a component of short-term fluctuations. The direct GMIB liability is not considered a derivative instrument
under IAS 39 and, as such, an accounting difference arises from this one-sided mark to market.
Guaranteed Minimum Withdrawal Benefit ‘not for life’
features are considered to be embedded derivatives under IAS 39. Therefore, provisions for these benefits are recognised at fair value. The change in these guaranteed benefit reserves, along with claim payments statements and associated fees
included in reserves are included along with the hedge results in short-term fluctuations, resulting in removal of the market impact from the operating profit based on longer-term investment returns.
For Guaranteed Minimum Withdrawal Benefit and Guaranteed Minimum Income Benefit reinsurance embedded derivatives that are fair valued under IAS 39, Jackson bases its volatility
assumptions on implied market volatility for periods ranging from 5 to 10 years C: period, where sufficient market liquidity is assumed to exist, followed by grading to long-term historical volatility levels beyond that point,
al B
where such long-term historical volatility levels contain an explicit margin for
conservatism.
Non-performance risk is incorporated into the calculation through the use of discount interest rates sourced from an AA corporate ance credit curve
as a proxy for Jackson’s own credit risk. Other risk margins, particularly for policyholder behaviour and long-term volatility, sheet are also incorporated into the model through the use of explicitly conservative assumptions. On a periodic
basis, Jackson validates the resulting fair values based on comparisons to other models and market movements. notes With the exception of the Guaranteed Minimum Death Benefit, Guaranteed Minimum Income Benefit, Guaranteed Minimum Withdrawal Benefit
and Guaranteed Minimum Accumulation Benefit features of variable annuity contracts, the financial guarantee features of Jackson’s contracts are in most circumstances not explicitly valued, but the impact of any interest guarantees would be
reflected as they are earned in the current account value (ie the US GAAP liability).
For traditional life insurance contracts, provisions for future policy
benefits are determined under US GAAP using the net level premium method and assumptions as of the issue date as to mortality, interest, policy lapses and expenses plus provisions for adverse deviation.
Institutional products are accounted for as investment contracts under IFRS with the liability classified as being in respect of financial instruments rather than insurance
contracts, as defined by IFRS 4. In practice there is no material difference between the IFRS and US GAAP basis of recognition and measurement for these contracts.
216 Prudential plc Annual Report 2014 Financial statements Notes to primary statements
C: Balance sheet notes continued
C4: Policyholder liabilities and unallocated surplus of
with-profits funds continued
Certain institutional products representing obligations issued in currencies other than US dollars have been hedged for changes in
exchange rates using cross-currency swaps. The fair value of derivatives embedded in funding agreements, as well as foreign currency transaction gains and losses, are included in the carrying value of the trust instruments supported by funding
agreements recorded in other non-insurance liabilities.
The effect of any non-recurrent changes of assumptions used to measure insurance assets and liabilities of
Jackson is shown in note B4(b).
c UK
Features of products and guarantees
Prudential’s long-term products in the UK consist of life insurance, pension products and pension annuities. These products are written primarily in:
— One of three separate sub-funds of the PAC long-term fund, namely the with-profits sub-fund (WPSF), Scottish Amicable Insurance Funds (SAIF), and the
non-profit sub-fund;
— Prudential Retirement Income Limited (PRIL), a shareholder-owned subsidiary; or
— Other shareholder-backed subsidiaries writing mainly non-profit unit-linked business.
i
With-profits products and PAC with-profits sub-fund
The WPSF mainly contains with-profits business but it also contains some non-profit business (unit-linked, term
assurances and annuities). The WPSF’s profits are apportioned 90 per cent to its policyholders and 10 per cent to shareholders as surplus for distribution is determined via the annual actuarial valuation. In October 2014, the
long-term business of Prudential Annuities Limited (PAL) was transferred into the WPSF following a Part VII transfer under the Financial Services and Markets Act 2000. PAL is owned by the WPSF.
The WPSF held a provision of £50 million at 31 December 2014 (2013: £36 million) to honour guarantees on a small amount of guaranteed annuity products.
SAIF’s exposure to guaranteed annuities is described below.
With-profits products provide returns to policyholders through bonuses that are
‘smoothed’. There are two types of bonuses: ‘regular’ and ‘final’. Regular bonuses are declared once a year, and once credited, are guaranteed in accordance with the terms of the particular product. Unlike regular
bonuses, final bonuses are guaranteed only until the next bonus declaration.
The main factors that influence the determination of bonus rates are the return on the
investments of the with-profits fund, inflation, taxation, the expenses of the fund chargeable to policyholders and the degree to which investment returns are smoothed. The overall rate of return earned on investments and the expectation of future
investment returns are the most important influences on bonus rates.
A high proportion of the assets backing the with-profits business are invested in equities and
real estate. If the financial strength of the with-profits business is affected, then a higher proportion of fixed interest or similar assets might be held by the fund.
Further details on the determination of the two types of the bonuses: ‘regular’ and ‘final’ are provided below.
Regular bonus rates
For regular bonuses, the bonus rates are determined for each type of
policy primarily by targeting the bonus level at a prudent proportion of the long-term expected future investment return on underlying assets. The expected future investment return is reduced as appropriate for each type of policy to allow for items
such as expenses, charges, tax and shareholders’ transfers. However, the rates declared may differ by product type, or by the date of payment of the premium, or date of issue of the policy, or if the accumulated regular bonuses are particularly
high or low, relative to a prudent proportion of the achieved investment return.
When target bonus levels change the PAC Board of directors has regard to the
overall strength of the long-term fund when determining the length of time over which it will seek to achieve the amended prudent target bonus level.
In normal
investment conditions, PAC expects changes in regular bonus rates to be gradual over time. However, PAC retains the discretion whether or not to declare a regular bonus each year, and there is no limit on the amount by which regular bonus rates can
change.
Final bonus rates
A final bonus which is normally declared yearly,
may be added when a claim is paid or when units of a unitised product are realised. The rates of final bonus usually vary by type of policy and by reference to the period, usually a year, in which the policy commences or each premium is paid. These
rates are determined by reference to the asset shares for the sample policies but subject to the smoothing approach as explained below.
In general, the same final
bonus scale applies to maturity, death and surrender claims except that:
— The total surrender value may be impacted by the application of a Market Value
Reduction for accumulating with-profits policies and by the surrender bases for conventional with-profits business; and
— For the SAIF and Scottish Amicable,
the final bonus rates applicable on surrender may be adjusted to reflect expected future bonus rates.
Application of significant judgement
The application of the above method for determining bonuses requires the PAC Board to apply significant judgement in many respects, including in particular the following:
— Determining what constitutes fair treatment of customers: Prudential is required by UK law and regulation to consider the fair treatment of its customers in
setting bonus levels. The concept of determining what constitutes fair treatment, while established by statute, is not defined;
— Smoothing of investment
returns: This is an important feature of with-profits products. Determining when particular circumstances, such as a significant rise or fall in market values, warrant variations in the standard bonus smoothing limits that apply in normal
circumstances requires the PAC Board of directors to exercise significant judgement; and
— Determining at what level to set bonuses to ensure that they are
competitive: The overall return to policyholders is an important competitive measure for attracting new business.
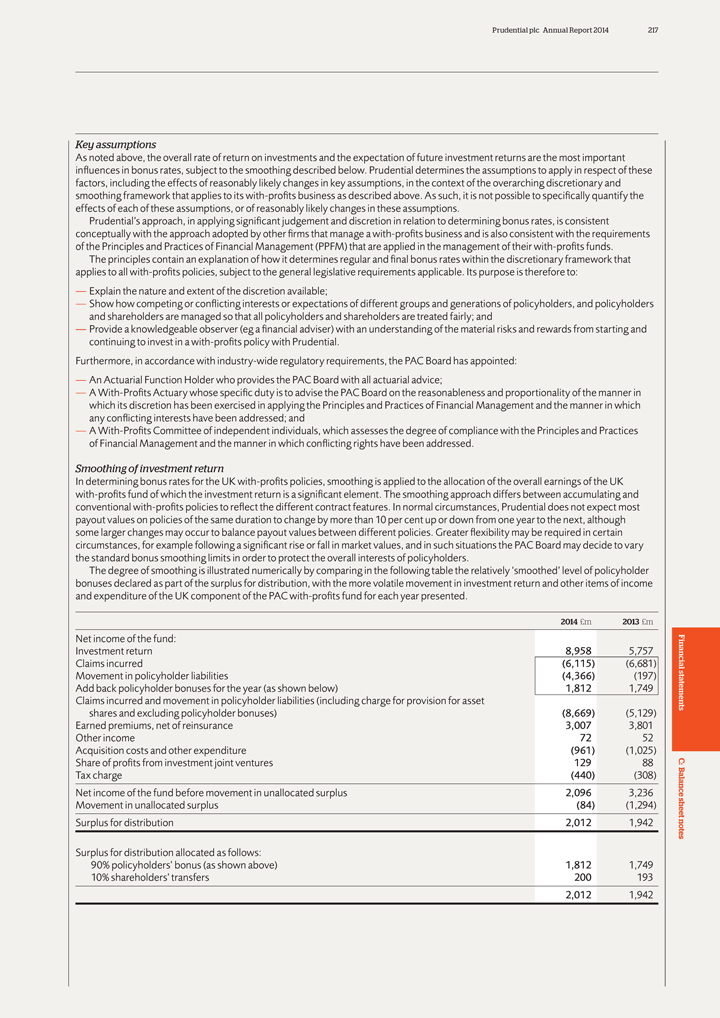
Prudential plc Annual Report 2014 217
Key
assumptions
As noted above, the overall rate of return on investments and the expectation of future investment returns are the most important influences in bonus
rates, subject to the smoothing described below. Prudential determines the assumptions to apply in respect of these factors, including the effects of reasonably likely changes in key assumptions, in the context of the overarching discretionary and
smoothing framework that applies to its with-profits business as described above. As such, it is not possible to specifically quantify the effects of each of these assumptions, or of reasonably likely changes in these assumptions.
Prudential’s approach, in applying significant judgement and discretion in relation to determining bonus rates, is consistent conceptually with the approach adopted by other
firms that manage a with-profits business and is also consistent with the requirements of the Principles and Practices of Financial Management (PPFM) that are applied in the management of their with-profits funds.
The principles contain an explanation of how it determines regular and final bonus rates within the discretionary framework that applies to all with-profits policies, subject to
the general legislative requirements applicable. Its purpose is therefore to:
— Explain the nature and extent of the discretion available;
— Show how competing or conflicting interests or expectations of different groups and generations of policyholders, and policyholders and shareholders are managed so that all
policyholders and shareholders are treated fairly; and
— Provide a knowledgeable observer (eg a financial adviser) with an understanding of the material risks
and rewards from starting and continuing to invest in a with-profits policy with Prudential.
Furthermore, in accordance with industry-wide regulatory requirements,
the PAC Board has appointed:
— An Actuarial Function Holder who provides the PAC Board with all actuarial advice;
— A With-Profits Actuary whose specific duty is to advise the PAC Board on the reasonableness and proportionality of the manner in which its discretion has been exercised in
applying the Principles and Practices of Financial Management and the manner in which any conflicting interests have been addressed; and
— A With-Profits
Committee of independent individuals, which assesses the degree of compliance with the Principles and Practices of Financial Management and the manner in which conflicting rights have been addressed.
Smoothing of investment return
In determining bonus rates for the UK with-profits policies,
smoothing is applied to the allocation of the overall earnings of the UK with-profits fund of which the investment return is a significant element. The smoothing approach differs between accumulating and conventional with-profits policies to reflect
the different contract features. In normal circumstances, Prudential does not expect most payout values on policies of the same duration to change by more than 10 per cent up or down from one year to the next, although some larger changes may
occur to balance payout values between different policies. Greater flexibility may be required in certain circumstances, for example following a significant rise or fall in market values, and in such situations the PAC Board may decide to vary the
standard bonus smoothing limits in order to protect the overall interests of policyholders.
The degree of smoothing is illustrated numerically by comparing in the
following table the relatively ‘smoothed’ level of policyholder bonuses declared as part of the surplus for distribution, with the more volatile movement in investment return and other items of income and expenditure of the UK component of
the PAC with-profits fund for each year presented.
2014 £m 2013 £m
Net income of the fund:
Investment return 8,958 5,757 Claims incurred
(6,115) (6,681) Financial Movement in policyholder liabilities (4,366) (197) Add back policyholder bonuses for the year (as shown below) 1,812 1,749 Claims incurred and movement in policyholder liabilities (including charge for
provision for asset statements shares and excluding policyholder bonuses) (8,669) (5,129) Earned premiums, net of reinsurance 3,007 3,801 Other income 72 52 Acquisition costs and other expenditure (961) (1,025) Share of profits
from investment joint ventures 129 88 C: Tax charge (440) (308) al B Net income of the fund before movement in unallocated surplus 2,096 3,236ance Movement in unallocated surplus (84) (1,294) sheet Surplus for distribution 2,012
1,942notes Surplus for distribution allocated as follows: 90% policyholders’ bonus (as shown above) 1,812 1,749 10% shareholders’ transfers 200 193
2,012
1,942
218 Prudential plc Annual Report 2014 Financial statements Notes to primary statements
C: Balance sheet notes continued
C4: Policyholder liabilities and unallocated surplus of
with-profits funds continued ii Annuity business
Prudential’s conventional annuities include level, fixed-increase and inflation-linked annuities, the link
being to the Retail Price Index (RPI) in the majority of cases.
Prudential’s fixed-increase annuities incorporate automatic increases in annuity payments by
fixed amounts over the policyholder’s life. The RPI annuities that Prudential offers provide for a regular annuity payment to which an additional amount is added periodically based on the increase in the UK RPI.
Prudential’s with-profits annuities, which are written in the WPSF, combine the income features of annuity products with the investment smoothing features of with-profits
products and enable policyholders to obtain exposure to investment return on the WPSF’s equity shares, property and other investment categories over time. Policyholders select a ‘required smoothed return’ bonus from the specific range
Prudential offers for the particular product. The amount of the annuity payment each year depends upon the relationship between the required smoothed return bonus rate selected by the policyholder when the product is purchased and the smoothed
return bonus rates Prudential subsequently declares each year during the term of the product. If the total bonus rates fall below the anticipated rate, then the annuity income falls.
iii SAIF
SAIF is a ring-fenced sub-fund of the PAC long-term fund formed following the
acquisition of the mutually owned Scottish Amicable Life Assurance Society in 1997. No new business may be written in SAIF, although regular premiums are still being paid on policies in force at the time of the acquisition and incremental premiums
are permitted on these policies.
The fund is solely for the benefit of policyholders of SAIF. Shareholders have no interest in the profits of this fund although
they are entitled to asset management fees on this business.
The process for determining policyholder bonuses of SAIF with-profits policies, which constitute the
vast majority of obligations of the funds, is similar to that for the with-profits policies of the WPSF. However, in addition, the surplus assets in SAIF are allocated to policies in an orderly and equitable distribution over time as enhancements to
policyholder benefits ie in excess of those based on asset share.
Provision is made for the risks attaching to some SAIF unitised with-profits policies that have
(Market Value Reduction) MVR-free dates and for those SAIF products which have a guaranteed minimum benefit on death or maturity of premiums accumulated at 4 per cent per annum.
The Group’s main exposure to guaranteed annuities in the UK is through SAIF and a provision of £549 million was held in SAIF at
31 December 2014 (2013: £328 million) to honour the guarantees. As SAIF is a separate sub-fund solely for the benefit of policyholders of SAIF, this provision has no
impact on the financial position of the Group’s shareholders’ equity.
iv Unit-linked (non-annuity) and other non-profit business
Prudential UK insurance operations also have an extensive book of unit-linked policies of varying types and provide a range of other non-profit business such as credit life and
protection contracts. These contracts do not contain significant financial guarantees.
There are no guaranteed maturity values or guaranteed annuity options on
unit-linked policies except for minor amounts for certain policies linked to cash units within SAIF.
Determining contract liabilities i Overview
The calculation of the contract liabilities involves the setting of assumptions for future experience. This is done following detailed review of the relevant experience including
in particular mortality, expenses, tax, economic assumptions and, where applicable, persistency.
For with-profits business written in the WPSF or SAIF, a market
consistent valuation is performed (as described in section (ii) below). Additional assumptions required are for persistency and the management actions under which the fund is managed. Assumptions used for a market-consistent valuation typically
do not contain margins, whereas those used for the valuation of other classes of business do.
Mortality assumptions are set based on the results of the most recent
experience analysis looking at the experience over recent years of the relevant business. For non-profit business, a margin for adverse deviation is added. Different assumptions are applied for different product groups. For annuitant mortality,
assumptions for current mortality rates are based on recent experience investigations and expected future improvements in mortality. The expected future improvements are based on recent experience and projections of the business and industry
experience generally.
Maintenance and, for some classes of business, termination expense assumptions are expressed as per policy amounts. They are set based on the
expenses incurred during the year, including an allowance for ongoing investment expenditure and allocated between entities and product groups in accordance with the operation’s internal cost allocation model. For non-profit business a margin
for adverse deviation is added to this amount. Expense inflation assumptions are set consistent with the economic basis and based on the difference between yields on nominal gilts and index-linked gilts.
The actual renewal expenses incurred on behalf of SAIF by other Group companies are recharged in full to SAIF.
The assumptions for asset management expenses are based on the charges specified in agreements with the Group’s asset management operations, plus a margin for adverse
deviation for non-profit business.
Tax assumptions are set equal to current rates of taxation.
For non-profit business excluding unit-linked business, the valuation interest rates used to discount the liabilities are based on the yields as at the valuation date on the assets
backing the technical provisions. For fixed interest securities the gross redemption yield is used except for the non-profit annuities within PAC and PRIL annuity business where the internal rate of return of the assets backing the liabilities is
used. Properties are valued using the rental yield, and for equities it is the greater of the dividend yield and the average of the dividend yield and the earnings yield. An adjustment is made to the yield on non-risk-free fixed interest securities
and property to reflect credit risk. To calculate the non-unit reserves for linked business, assumptions have been set for the gross unit growth rate and the rate of inflation of maintenance expenses, as well as for the valuation interest rate as
described above.
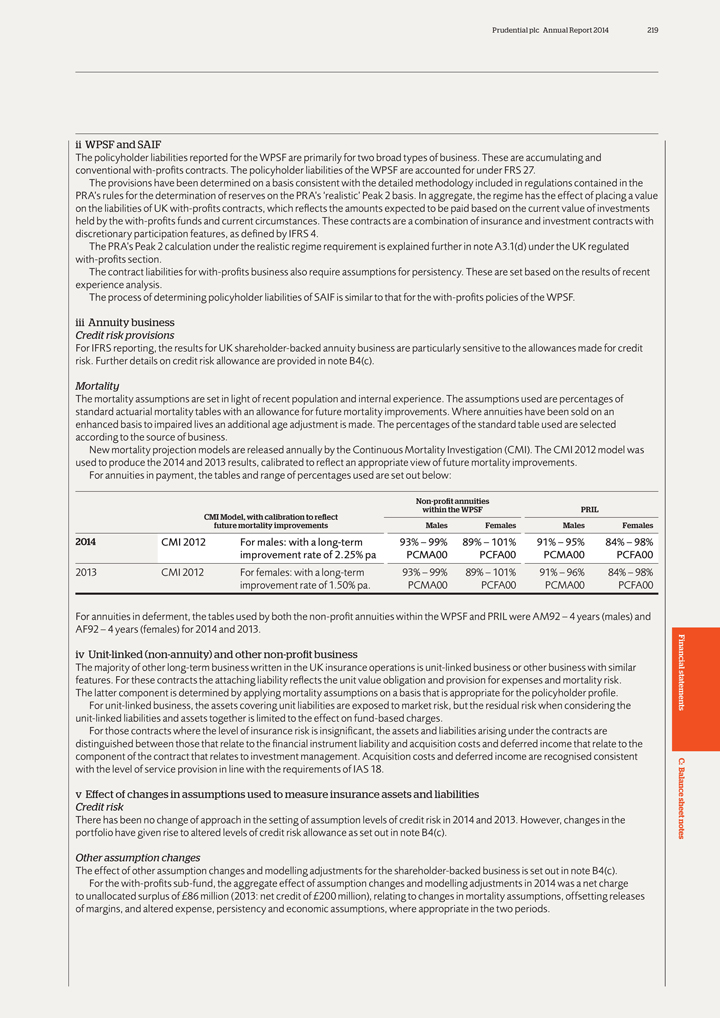
Prudential plc Annual Report 2014 219
ii WPSF and
SAIF
The policyholder liabilities reported for the WPSF are primarily for two broad types of business. These are accumulating and conventional with-profits
contracts. The policyholder liabilities of the WPSF are accounted for under FRS 27.
The provisions have been determined on a basis consistent with the detailed
methodology included in regulations contained in the PRA’s rules for the determination of reserves on the PRA’s ‘realistic’ Peak 2 basis. In aggregate, the regime has the effect of placing a value on the liabilities of UK
with-profits contracts, which reflects the amounts expected to be paid based on the current value of investments held by the with-profits funds and current circumstances. These contracts are a combination of insurance and investment contracts with
discretionary participation features, as defined by IFRS 4.
The PRA’s Peak 2 calculation under the realistic regime requirement is explained further in note
A3.1(d) under the UK regulated with-profits section.
The contract liabilities for with-profits business also require assumptions for persistency. These are set
based on the results of recent experience analysis.
The process of determining policyholder liabilities of SAIF is similar to that for the with-profits policies of
the WPSF.
iii Annuity business
Credit risk provisions
For IFRS reporting, the results for UK shareholder-backed annuity business are particularly sensitive to the allowances made for credit risk. Further details on credit risk
allowance are provided in note B4(c).
Mortality
The mortality assumptions are
set in light of recent population and internal experience. The assumptions used are percentages of standard actuarial mortality tables with an allowance for future mortality improvements. Where annuities have been sold on an enhanced basis to
impaired lives an additional age adjustment is made. The percentages of the standard table used are selected according to the source of business.
New mortality
projection models are released annually by the Continuous Mortality Investigation (CMI). The CMI 2012 model was used to produce the 2014 and 2013 results, calibrated to reflect an appropriate view of future mortality improvements.
For annuities in payment, the tables and range of percentages used are set out below:
Non-profit annuities
CMI Model, with calibration to reflect within the WPSF
PRIL future mortality improvements Males Females Males Females
2014 CMI 2012 For males: with a long-term 93% – 99% 89% – 101% 91% – 95% 84% –
98% improvement rate of 2.25% pa PCMA00 PCFA00 PCMA00 PCFA00
2013 CMI 2012 For females: with a long-term 93% – 99% 89% – 101% 91% – 96% 84% –
98% improvement rate of 1.50% pa. PCMA00 PCFA00 PCMA00 PCFA00
For annuities in deferment, the tables used by both the non-profit annuities within the WPSF and PRIL
were AM92 – 4 years (males) and AF92 – 4 years (females) for 2014 and 2013. iv Unit-linked (non-annuity) and other non-profit business Financial
The
majority of other long-term business written in the UK insurance operations is unit-linked business or other business with similar features. For these contracts the attaching liability reflects the unit value obligation and provision for expenses
and mortality risk.
The latter component is determined by applying mortality assumptions on a basis that is appropriate for the policyholder profile.
For unit-linked business, the assets covering unit liabilities are exposed to market risk, but the residual risk when considering the statements unit-linked liabilities and assets
together is limited to the effect on fund-based charges.
For those contracts where the level of insurance risk is insignificant, the assets and liabilities arising
under the contracts are distinguished between those that relate to the financial instrument liability and acquisition costs and deferred income that relate to the component of the contract that relates to investment management. Acquisition costs and
deferred income are recognised consistent
C:
with the level of service
provision in line with the requirements of IAS 18. B al v Effect of changes in assumptions used to measure insurance assets and liabilities ance
Credit risk sheet
There has been no change of approach in the setting of assumption levels of credit risk in 2014 and 2013. However, changes in the portfolio have given rise to
altered levels of credit risk allowance as set out in note B4(c). notes
Other assumption changes
The effect of other assumption changes and modelling adjustments for the shareholder-backed business is set out in note B4(c). For the with-profits sub-fund, the aggregate effect
of assumption changes and modelling adjustments in 2014 was a net charge to unallocated surplus of £86 million (2013: net credit of £200 million), relating to changes in mortality assumptions, offsetting releases of margins, and
altered expense, persistency and economic assumptions, where appropriate in the two periods.
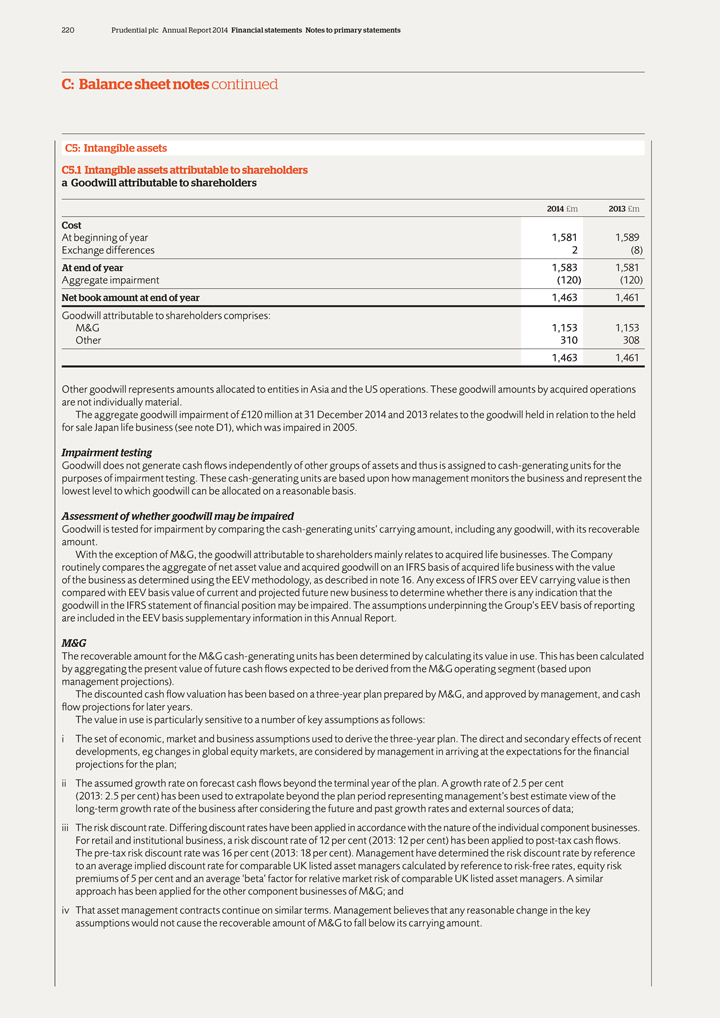
220 Prudential plc Annual Report 2014 Financial statements Notes to primary statements
C: Balance sheet notes continued
C5: Intangible assets
C5.1 Intangible assets attributable to shareholders a Goodwill attributable to shareholders
2014 £m 2013 £m
Cost
At beginning of year 1,581 1,589 Exchange differences 2 (8)
At end of year 1,583 1,581
Aggregate impairment (120) (120)
Net book amount at end of year 1,463 1,461 Goodwill attributable to shareholders comprises: M&G 1,153 1,153 Other 310 308
1,463 1,461
Other goodwill represents amounts allocated to entities in Asia
and the US operations. These goodwill amounts by acquired operations are not individually material.
The aggregate goodwill impairment of £120 million at
31 December 2014 and 2013 relates to the goodwill held in relation to the held for sale Japan life business (see note D1), which was impaired in 2005.
Impairment testing
Goodwill does not generate cash flows independently of
other groups of assets and thus is assigned to cash-generating units for the purposes of impairment testing. These cash-generating units are based upon how management monitors the business and represent the lowest level to which goodwill can be
allocated on a reasonable basis.
Assessment of whether goodwill may be impaired
Goodwill is tested for impairment by comparing the cash-generating units’ carrying amount, including any goodwill, with its recoverable amount.
With the exception of M&G, the goodwill attributable to shareholders mainly relates to acquired life businesses. The Company routinely compares the aggregate of net asset value
and acquired goodwill on an IFRS basis of acquired life business with the value of the business as determined using the EEV methodology, as described in note 16. Any excess of IFRS over EEV carrying value is then compared with EEV basis value of
current and projected future new business to determine whether there is any indication that the goodwill in the IFRS statement of financial position may be impaired. The assumptions underpinning the Group’s EEV basis of reporting are included
in the EEV basis supplementary information in this Annual Report.
M&G
The
recoverable amount for the M&G cash-generating units has been determined by calculating its value in use. This has been calculated by aggregating the present value of future cash flows expected to be derived from the M&G operating segment
(based upon management projections).
The discounted cash flow valuation has been based on a three-year plan prepared by M&G, and approved by management, and
cash flow projections for later years.
The value in use is particularly sensitive to a number of key assumptions as follows: i The set of economic, market and
business assumptions used to derive the three-year plan. The direct and secondary effects of recent developments, eg changes in global equity markets, are considered by management in arriving at the expectations for the financial projections for the
plan; ii The assumed growth rate on forecast cash flows beyond the terminal year of the plan. A growth rate of 2.5 per cent (2013: 2.5 per cent) has been used to extrapolate beyond the plan period representing management’s best
estimate view of the long-term growth rate of the business after considering the future and past growth rates and external sources of data; iii The risk discount rate. Differing discount rates have been applied in accordance with the nature of the
individual component businesses.
For retail and institutional business, a risk discount rate of 12 per cent (2013: 12 per cent) has been applied to
post-tax cash flows. The pre-tax risk discount rate was 16 per cent (2013: 18 per cent). Management have determined the risk discount rate by reference to an average implied discount rate for comparable UK listed asset managers calculated
by reference to risk-free rates, equity risk premiums of 5 per cent and an average ‘beta’ factor for relative market risk of comparable UK listed asset managers. A similar approach has been applied for the other component businesses
of M&G; and iv That asset management contracts continue on similar terms. Management believes that any reasonable change in the key assumptions would not cause the recoverable amount of M&G to fall below its carrying amount.
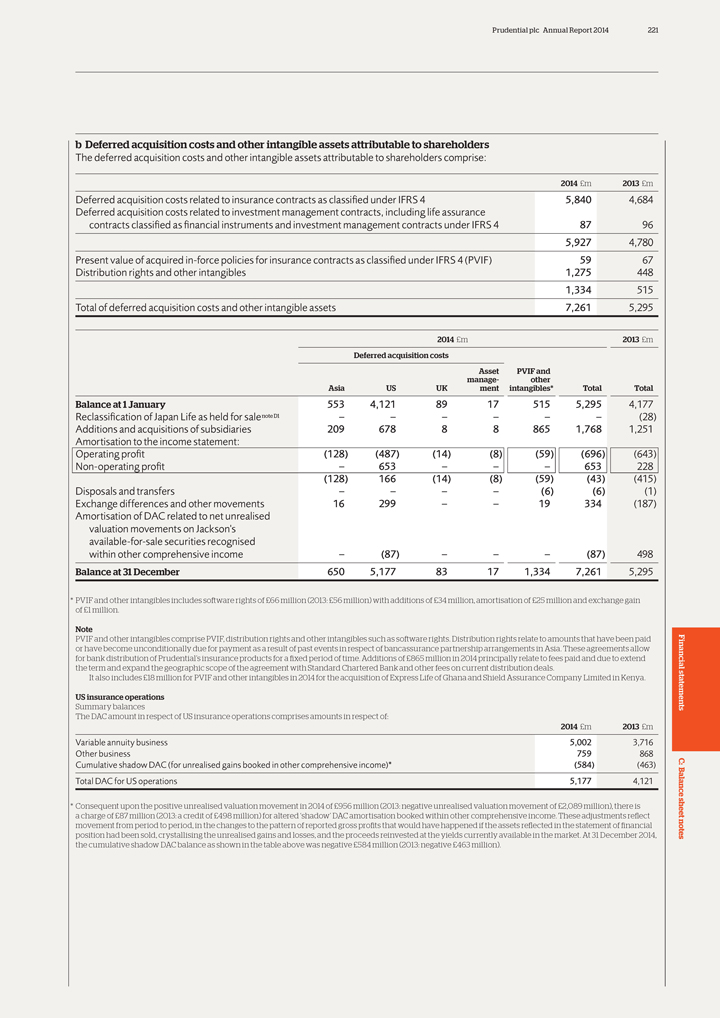
Prudential plc Annual Report 2014 221
b Deferred
acquisition costs and other intangible assets attributable to shareholders
The deferred acquisition costs and other intangible assets attributable to shareholders
comprise:
2014 £m 2013 £m
Deferred acquisition costs related to
insurance contracts as classified under IFRS 4 5,840 4,684 Deferred acquisition costs related to investment management contracts, including life assurance contracts classified as financial instruments and investment management contracts under IFRS 4
87 96
5,927 4,780 Present value of acquired in-force policies for insurance contracts as classified under IFRS 4 (PVIF) 59 67 Distribution rights and other
intangibles 1,275 448
1,334 515 Total of deferred acquisition costs and other intangible assets 7,261 5,295
2014 £m 2013 £m Deferred acquisition costs Asset PVIF and manage- other Asia US UK ment intangibles* Total Total
Balance at 1 January 553 4,121 89 17 515 5,295 4,177 Reclassification of Japan Life as held for sale note D1 – – – – – – (28) Additions and
acquisitions of subsidiaries 209 678 8 8 865 1,768 1,251 Amortisation to the income statement: Operating profit (128) (487) (14) (8) (59) (696) (643) Non-operating profit – 653 – – – 653 228
(128) 166 (14) (8) (59) (43) (415) Disposals and transfers – – – – (6) (6) (1) Exchange differences and
other movements 16 299 – – 19 334 (187) Amortisation of DAC related to net unrealised valuation movements on Jackson’s available-for-sale securities recognised within other comprehensive income – (87) – –
– (87) 498
Balance at 31 December 650 5,177 83 17 1,334 7,261 5,295
* PVIF and other intangibles includes software rights of £66 million (2013: £56 million) with additions of £34 million, amortisation of
£25 million and exchange gain of £1 million.
Note
PVIF and
other intangibles comprise PVIF, distribution rights and other intangibles such as software rights. Distribution rights relate to amounts that have been paid or have become unconditionally due for payment as a result of past events in respect of
bancassurance partnership arrangements in Asia. These agreements allow for bank distribution of Prudential’s insurance products for a fixed period of time. Additions of £865 million in 2014 principally relate to fees paid and due to
extend Financial the term and expand the geographic scope of the agreement with Standard Chartered Bank and other fees on current distribution deals.
It also
includes £18 million for PVIF and other intangibles in 2014 for the acquisition of Express Life of Ghana and Shield Assurance Company Limited in Kenya.
US insurance operations
Summary balances statements The DAC amount in respect
of US insurance operations comprises amounts in respect of:
2014 £m 2013 £m
Variable annuity business 5,002 3,716 Other business 759 868
Cumulative shadow DAC (for
unrealised gains booked in other comprehensive income)* (584) (463) C: al B
Total DAC for US operations 5,177 4,121 ance
* Consequent upon the positive unrealised valuation movement in 2014 of £956 million (2013: negative unrealised valuation movement of £2,089 million), there is
sheet a charge of £87 million (2013: a credit of £498 million) for altered ‘shadow’ DAC amortisation booked within other comprehensive income. These adjustments reflect movement from period to period, in the changes to the
pattern of reported gross profits that would have happened if the assets reflected in the statement of financial position had been sold, crystallising the unrealised gains and losses, and the proceeds reinvested at the yields currently available in
the market. At 31 December 2014, notes the cumulative shadow DAC balance as shown in the table above was negative £584 million (2013: negative £463 million).
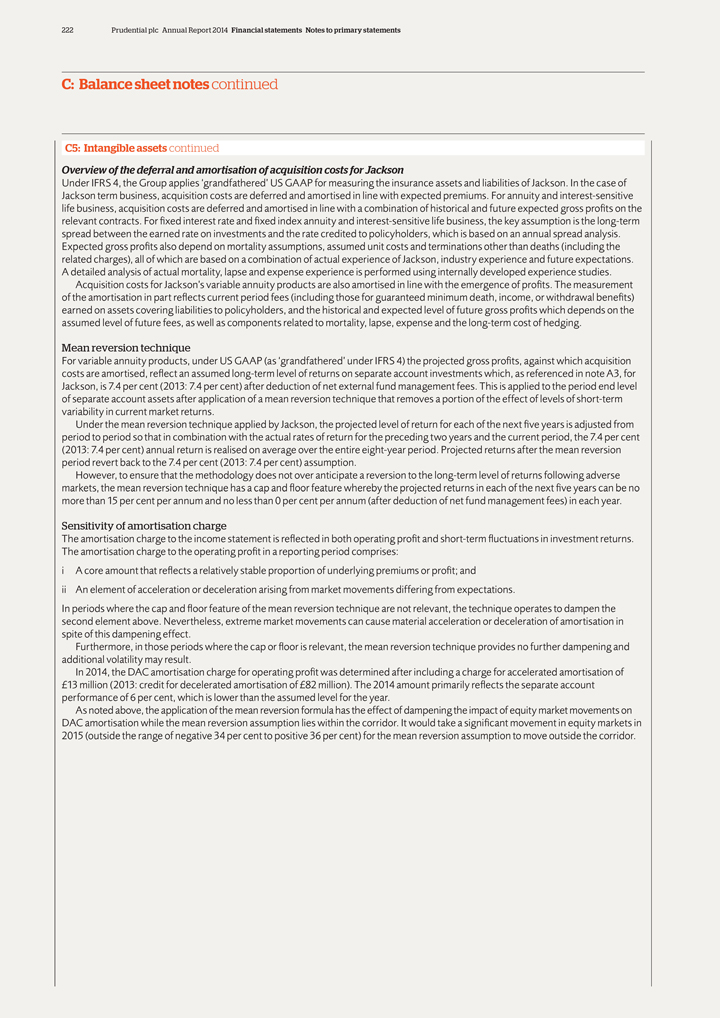
222 Prudential plc Annual Report 2014 Financial statements Notes to primary statements
C: Balance sheet notes continued
C5: Intangible assets continued
Overview of the deferral and amortisation of acquisition costs for Jackson
Under IFRS 4, the
Group applies ‘grandfathered’ US GAAP for measuring the insurance assets and liabilities of Jackson. In the case of Jackson term business, acquisition costs are deferred and amortised in line with expected premiums. For annuity and
interest-sensitive life business, acquisition costs are deferred and amortised in line with a combination of historical and future expected gross profits on the relevant contracts. For fixed interest rate and fixed index annuity and
interest-sensitive life business, the key assumption is the long-term spread between the earned rate on investments and the rate credited to policyholders, which is based on an annual spread analysis. Expected gross profits also depend on mortality
assumptions, assumed unit costs and terminations other than deaths (including the related charges), all of which are based on a combination of actual experience of Jackson, industry experience and future expectations. A detailed analysis of actual
mortality, lapse and expense experience is performed using internally developed experience studies.
Acquisition costs for Jackson’s variable annuity products
are also amortised in line with the emergence of profits. The measurement of the amortisation in part reflects current period fees (including those for guaranteed minimum death, income, or withdrawal benefits) earned on assets covering liabilities
to policyholders, and the historical and expected level of future gross profits which depends on the assumed level of future fees, as well as components related to mortality, lapse, expense and the long-term cost of hedging.
Mean reversion technique
For variable annuity products, under US GAAP (as
‘grandfathered’ under IFRS 4) the projected gross profits, against which acquisition costs are amortised, reflect an assumed long-term level of returns on separate account investments which, as referenced in note A3, for Jackson, is
7.4 per cent (2013: 7.4 per cent) after deduction of net external fund management fees. This is applied to the period end level of separate account assets after application of a mean reversion technique that removes a portion of the effect
of levels of short-term variability in current market returns.
Under the mean reversion technique applied by Jackson, the projected level of return for each of the
next five years is adjusted from period to period so that in combination with the actual rates of return for the preceding two years and the current period, the 7.4 per cent (2013: 7.4 per cent) annual return is realised on average over
the entire eight-year period. Projected returns after the mean reversion period revert back to the 7.4 per cent (2013: 7.4 per cent) assumption.
However,
to ensure that the methodology does not over anticipate a reversion to the long-term level of returns following adverse markets, the mean reversion technique has a cap and floor feature whereby the projected returns in each of the next five years
can be no more than 15 per cent per annum and no less than 0 per cent per annum (after deduction of net fund management fees) in each year.
Sensitivity of
amortisation charge
The amortisation charge to the income statement is reflected in both operating profit and short-term fluctuations in investment returns. The
amortisation charge to the operating profit in a reporting period comprises: i A core amount that reflects a relatively stable proportion of underlying premiums or profit; and ii An element of acceleration or deceleration arising from market
movements differing from expectations.
In periods where the cap and floor feature of the mean reversion technique are not relevant, the technique operates to
dampen the second element above. Nevertheless, extreme market movements can cause material acceleration or deceleration of amortisation in spite of this dampening effect.
Furthermore, in those periods where the cap or floor is relevant, the mean reversion technique provides no further dampening and additional volatility may result.
In 2014, the DAC amortisation charge for operating profit was determined after including a charge for accelerated amortisation of £13 million (2013: credit for
decelerated amortisation of £82 million). The 2014 amount primarily reflects the separate account performance of 6 per cent, which is lower than the assumed level for the year.
As noted above, the application of the mean reversion formula has the effect of dampening the impact of equity market movements on DAC amortisation while the mean reversion
assumption lies within the corridor. It would take a significant movement in equity markets in 2015 (outside the range of negative 34 per cent to positive 36 per cent) for the mean reversion assumption to move outside the corridor.
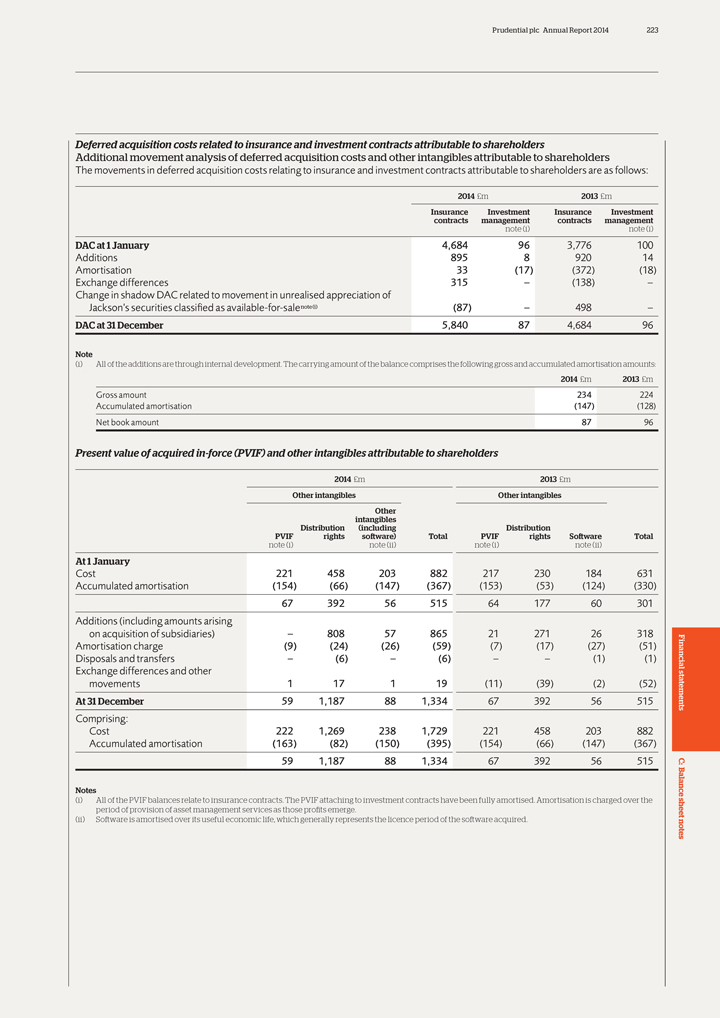
Prudential plc Annual Report 2014 223
Deferred
acquisition costs related to insurance and investment contracts attributable to shareholders
Additional movement analysis of deferred acquisition costs and other
intangibles attributable to shareholders
The movements in deferred acquisition costs relating to insurance and investment contracts attributable to shareholders
are as follows:
2014 £m 2013 £m
Insurance Investment Insurance
Investment contracts management contracts management note (i) note (i)
DAC at 1 January 4,684 96 3,776 100 Additions 895 8 920 14 Amortisation 33
(17) (372) (18) Exchange differences 315 – (138) –Change in shadow DAC related to movement in unrealised appreciation of Jackson’s securities classified as available-for-sale note (i) (87) – 498
–
DAC at 31 December 5,840 87 4,684 96
Note
(i) All of the additions are through internal development. The carrying amount of the balance comprises the following gross and accumulated amortisation amounts:
2014 £m 2013 £m
Gross amount 234 224 Accumulated amortisation
(147) (128) Net book amount 87 96
Present value of acquired in-force (PVIF) and other intangibles attributable to shareholders
2014 £m 2013 £m Other intangibles Other intangibles Other intangibles Distribution (including Distribution
PVIF rights software) Total PVIF rights Software Total note (i) note (ii) note (i) note (ii)
At 1 January
Cost 221 458 203 882 217 230 184 631 Accumulated amortisation
(154) (66) (147) (367) (153) (53) (124) (330)
67 392 56 515 64 177 60 301 Additions (including amounts arising on acquisition of
subsidiaries) – 808 57 865 21 271 26 318 Amortisation charge (9) (24) (26) (59) (7) (17) (27) (51) Disposals and transfers – (6) – (6) – – (1) (1) Financial
Exchange differences and other movements 1 17 1 19 (11) (39) (2) (52)
At 31 December 59 1,187 88 1,334 67 392 56 515 statements
Comprising:
Cost 222 1,269 238 1,729 221 458 203 882 Accumulated amortisation
(163) (82) (150) (395) (154) (66) (147) (367)
59 1,187 88 1,334 67 392 56 515C:
al B
Notes ance
(i) All of the PVIF balances relate to insurance contracts. The PVIF attaching to investment contracts have been fully amortised. Amortisation is charged over the period of
provision of asset management services as those profits emerge. sheet (ii) Software is amortised over its useful economic life, which generally represents the licence period of the software acquired. notes
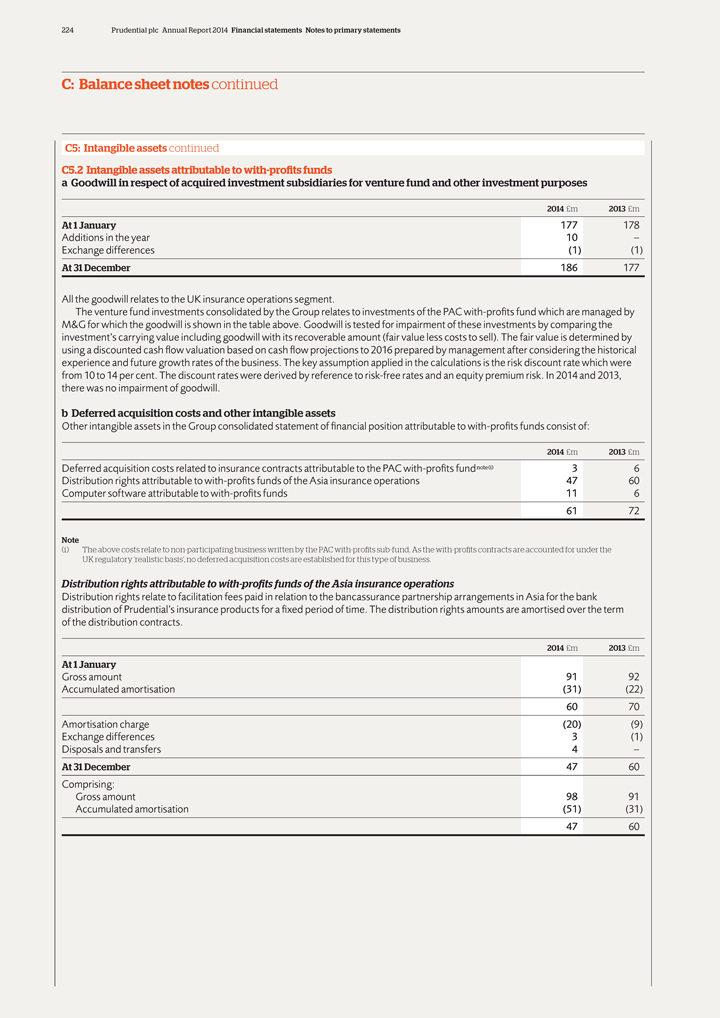
224 Prudential plc Annual Report 2014 Financial statements Notes to primary statements
C: Balance sheet notes continued
C5: Intangible assets continued
C5.2 Intangible assets attributable to with-profits funds a Goodwill in respect of acquired investment subsidiaries for venture fund and other investment purposes
2014 £m 2013 £m
At 1 January 177 178 Additions in the year 10 – Exchange
differences (1) (1)
At 31 December 186 177
All the goodwill relates
to the UK insurance operations segment.
The venture fund investments consolidated by the Group relates to investments of the PAC with-profits fund which are
managed by M&G for which the goodwill is shown in the table above. Goodwill is tested for impairment of these investments by comparing the investment’s carrying value including goodwill with its recoverable amount (fair value less costs to
sell). The fair value is determined by using a discounted cash flow valuation based on cash flow projections to 2016 prepared by management after considering the historical experience and future growth rates of the business. The key assumption
applied in the calculations is the risk discount rate which were from 10 to 14 per cent. The discount rates were derived by reference to risk-free rates and an equity premium risk. In 2014 and 2013, there was no impairment of goodwill.
b Deferred acquisition costs and other intangible assets
Other intangible
assets in the Group consolidated statement of financial position attributable to with-profits funds consist of:
2014 £m 2013 £m
Deferred acquisition costs related to insurance contracts attributable to the PAC with-profits fund note (i) 3 6 Distribution rights attributable to with-profits funds of the
Asia insurance operations 47 60 Computer software attributable to with-profits funds 11 6
61 72
Note
(i) The above costs relate to non-participating business written by the PAC with-profits
sub-fund. As the with-profits contracts are accounted for under the UK regulatory ‘realistic basis’, no deferred acquisition costs are established for this type of business.
Distribution rights attributable to with-profits funds of the Asia insurance operations
Distribution rights relate to facilitation fees paid in relation to the bancassurance partnership arrangements in Asia for the bank distribution of
Prudential’s insurance products for a fixed period of time. The distribution rights amounts are amortised over the term of the distribution contracts.
2014
£m 2013 £m
At 1 January
Gross amount 91 92 Accumulated
amortisation (31) (22)
60 70 Amortisation charge (20) (9) Exchange differences 3 (1) Disposals and transfers 4 –
At 31 December 47 60 Comprising: Gross amount 98 91 Accumulated amortisation (51) (31)
47 60
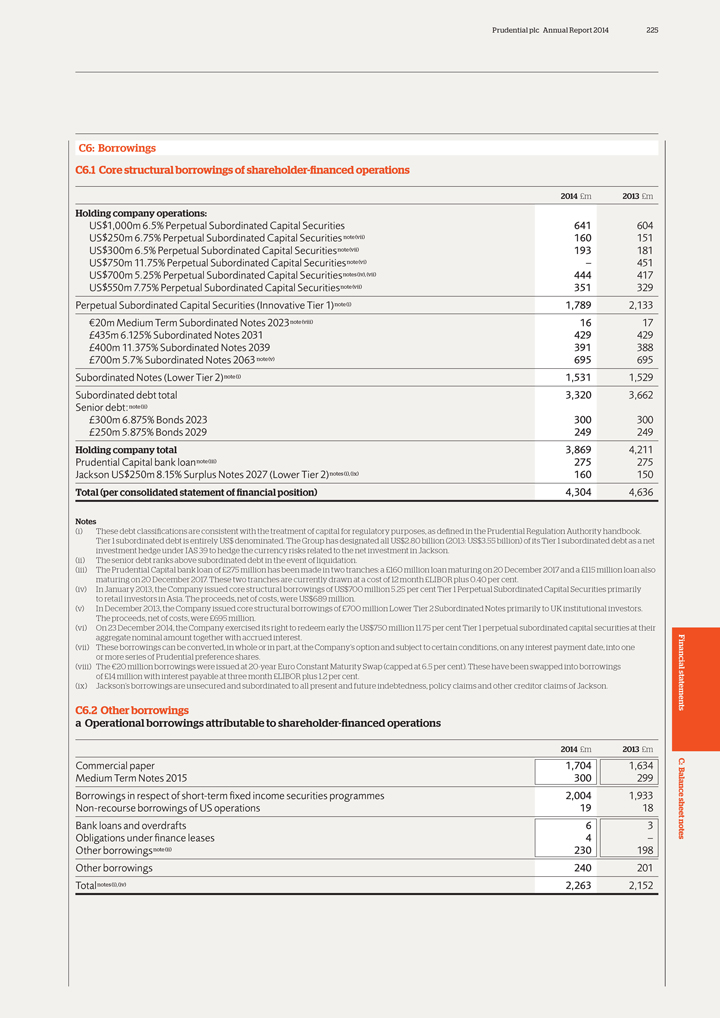
Prudential plc Annual Report 2014 225
C6:
Borrowings
C6.1 Core structural borrowings of shareholder-financed operations
2014 £m 2013 £m
Holding company operations:
US$1,000m 6.5% Perpetual Subordinated Capital Securities 641 604 US$250m 6.75% Perpetual Subordinated Capital Securities note (vii) 160 151 US$300m 6.5% Perpetual Subordinated
Capital Securities note (vii) 193 181 US$750m 11.75% Perpetual Subordinated Capital Securities note (vi) – 451 US$700m 5.25% Perpetual Subordinated Capital Securities notes (iv), (vii) 444 417 US$550m 7.75% Perpetual Subordinated
Capital Securities note (vii) 351 329 Perpetual Subordinated Capital Securities (Innovative Tier 1) note (i) 1,789 2,133 ¤20m Medium Term Subordinated Notes 2023 note (viii) 16 17 £435m 6.125% Subordinated Notes 2031 429
429 £400m 11.375% Subordinated Notes 2039 391 388 £700m 5.7% Subordinated Notes 2063 note (v) 695 695 Subordinated Notes (Lower Tier 2) note (i) 1,531 1,529 Subordinated debt total 3,320 3,662 Senior debt: note
(ii) £300m 6.875% Bonds 2023 300 300 £250m 5.875% Bonds 2029 249 249
Holding company total 3,869 4,211
Prudential Capital bank loan note (iii) 275 275 Jackson US$250m 8.15% Surplus Notes 2027 (Lower Tier 2) notes (i), (ix) 160 150
Total (per consolidated statement of financial position) 4,304 4,636
Notes
(i) These debt classifications are consistent with the treatment of capital for regulatory purposes, as defined in the Prudential Regulation Authority handbook. Tier 1 subordinated
debt is entirely US$ denominated. The Group has designated all US$2.80 billion (2013: US$3.55 billion) of its Tier 1 subordinated debt as a net investment hedge under IAS 39 to hedge the currency risks related to the net investment in Jackson.
(ii) The senior debt ranks above subordinated debt in the event of liquidation.
(iii) The Prudential Capital bank loan of £275 million has been made in two tranches: a £160 million loan maturing on 20 December 2017
and a £115 million loan also maturing on 20 December 2017. These two tranches are currently drawn at a cost of 12 month £LIBOR plus 0.40 per cent.
(iv) In January 2013, the Company issued core structural borrowings of US$700 million 5.25 per cent Tier 1 Perpetual Subordinated Capital Securities primarily to retail
investors in Asia. The proceeds, net of costs, were US$689 million.
(v) In December 2013, the Company issued core structural borrowings of £700 million
Lower Tier 2 Subordinated Notes primarily to UK institutional investors. The proceeds, net of costs, were £695 million.
(vi) On 23 December 2014, the
Company exercised its right to redeem early the US$750 million 11.75 per cent Tier 1 perpetual subordinated capital securities at their aggregate nominal amount together with accrued interest.
(vii) These borrowings can be converted, in whole or in part, at the Company’s option and subject to certain conditions, on any interest payment date, into one or more series
of Prudential preference shares. Financial (viii) The €20 million borrowings were issued at 20-year Euro Constant Maturity Swap (capped at 6.5 per cent). These have been swapped into borrowings of £14 million with
interest payable at three month £LIBOR plus 1.2 per cent.
(ix) Jackson’s borrowings are unsecured and subordinated to all present and future
indebtedness, policy claims and other creditor claims of Jackson. statements
C6.2 Other borrowings a Operational borrowings attributable to shareholder-financed
operations
2014 £m 2013 £m
Commercial paper 1,704 1,634C: Medium
Term Notes 2015 300 299 B al Borrowings in respect of short-term fixed income securities programmes 2,004 1,933 ance Non-recourse borrowings of US operations 19 18 sheet Bank loans and overdrafts 6 3notes Obligations under finance leases 4 –
Other borrowings note (ii) 230 198 Other borrowings 240 201
Total notes (i), (iv) 2,263 2,152
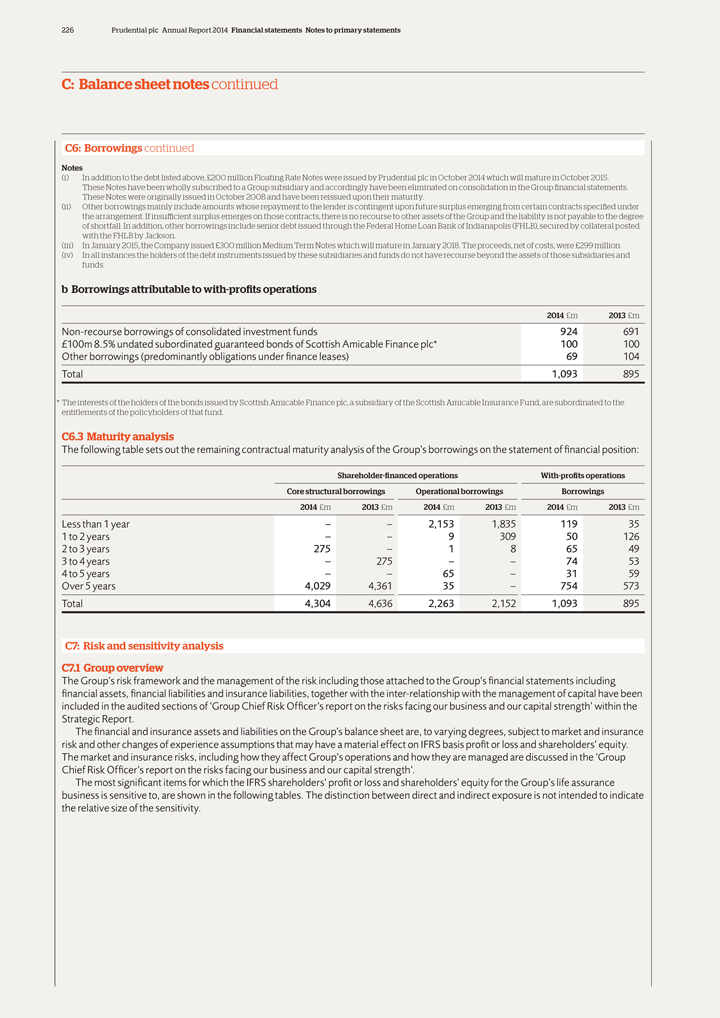
226 Prudential plc Annual Report 2014 Financial statements Notes to primary statements
C: Balance sheet notes continued
C6: Borrowings continued
Notes
(i) In addition to the debt listed above, £200 million Floating Rate Notes
were issued by Prudential plc in October 2014 which will mature in October 2015. These Notes have been wholly subscribed to a Group subsidiary and accordingly have been eliminated on consolidation in the Group financial statements.
These Notes were originally issued in October 2008 and have been reissued upon their maturity.
(ii) Other borrowings mainly include amounts whose repayment to the lender is contingent upon future surplus emerging from certain contracts specified under the
arrangement. If insufficient surplus emerges on those contracts, there is no recourse to other assets of the Group and the liability is not payable to the degree of shortfall. In addition, other borrowings include senior debt issued through the
Federal Home Loan Bank of Indianapolis (FHLB), secured by collateral posted with the FHLB by Jackson.
(iii) In January 2015, the Company issued
£300 million Medium Term Notes which will mature in January 2018. The proceeds, net of costs, were £299 million. (iv) In all instances the holders of the debt instruments issued by these subsidiaries and funds do not have
recourse beyond the assets of those subsidiaries and funds.
b Borrowings attributable to with-profits operations
2014 £m 2013 £m
Non-recourse borrowings of consolidated investment funds 924 691
£100m 8.5% undated subordinated guaranteed bonds of Scottish Amicable Finance plc* 100 100 Other borrowings (predominantly obligations under finance leases) 69 104 Total 1,093 895
* The interests of the holders of the bonds issued by Scottish Amicable Finance plc, a subsidiary of the Scottish Amicable Insurance Fund, are subordinated to the entitlements of
the policyholders of that fund.
C6.3 Maturity analysis
The following table
sets out the remaining contractual maturity analysis of the Group’s borrowings on the statement of financial position:
Shareholder-financed operations
With-profits operations Core structural borrowings Operational borrowings Borrowings 2014 £m 2013 £m 2014 £m 2013 £m 2014 £m 2013 £m
Less than 1 year – – 2,153 1,835 119 35 1 to 2 years – – 9 309 50 126 2 to 3 years 275 – 1 8 65 49 3 to 4 years – 275 – – 74 53 4 to 5 years
– – 65 – 31 59 Over 5 years 4,029 4,361 35 – 754 573 Total 4,304 4,636 2,263 2,152 1,093 895
C7: Risk and sensitivity analysis C7.1 Group
overview
The Group’s risk framework and the management of the risk including those attached to the Group’s financial statements including financial
assets, financial liabilities and insurance liabilities, together with the inter-relationship with the management of capital have been included in the audited sections of ‘Group Chief Risk Officer’s report on the risks facing our business
and our capital strength’ within the Strategic Report.
The financial and insurance assets and liabilities on the Group’s balance sheet are, to varying
degrees, subject to market and insurance risk and other changes of experience assumptions that may have a material effect on IFRS basis profit or loss and shareholders’ equity. The market and insurance risks, including how they affect
Group’s operations and how they are managed are discussed in the ‘Group Chief Risk Officer’s report on the risks facing our business and our capital strength’.
The most significant items for which the IFRS shareholders’ profit or loss and shareholders’ equity for the Group’s life assurance business is sensitive to, are
shown in the following tables. The distinction between direct and indirect exposure is not intended to indicate the relative size of the sensitivity.

Prudential plc Annual Report 2014 227
Type of
business Market and credit risk Insurance and lapse risk Investments/derivatives Liabilities/unallocated surplus Other exposure
Asia insurance operations (see also
section C7.2)
Mortality and All business Currency risk morbidity risk Persistency risk With-profits business Net neutral direct exposure (indirect exposure only)
Investment performance subject to smoothing through declared bonuses Unit-linked business Net neutral direct exposure (indirect exposure only) Investment performance through asset management fees Non-participating Asset/liability mismatch risk
business Credit risk Interest rates for those operations where the basis of insurance liabilities is sensitive to current market movements Interest rate and price risk
US insurance operations (see also section C7.3)
All business Currency risk Persistency risk
Variable annuity Net effect of market risk arising from incidence of guarantee business features and variability of asset management fees offset by derivative hedging programme Fixed index annuity Derivative hedge programme Incidence of equity
business to the extent not fully hedged participation features against liability Fixed index annuities, Credit risk Interest rate risk Spread difference Lapse risk, but the Fixed annuities and Profit and loss and between earned rate and effects of
extreme GIC business shareholders’ equity are rate credited to events are mitigated volatile for these risks as they policyholders by the application affect the values of derivatives of market value and embedded derivatives adjustments and
impairment losses. In addition, shareholders’ equity is volatile for the incidence of these risks on unrealised Financial appreciation of fixed income securities classified as available-for-sale under IAS 39 statements
UK insurance operations (see also section C7.4)
With-profits business Net neutral direct
exposure (indirect exposure only) Investment performance Persistency risk to subject to smoothing future shareholder through declared transfers C: bonuses al B SAIF sub-fund Net neutral direct exposure (indirect exposure only) Asset management fees
ance earned by M&G sheet Unit-linked business Net neutral direct exposure (indirect exposure only) Investment performance Persistency risk through asset notes management fees Asset/liability mismatch risk Shareholder-backed Credit risk for
assets covering Mortality experience annuity business liabilities and shareholder and assumptions capital for longevity Interest rate risk for assets in excess of liabilities ie assets representing shareholder capital
228 Prudential plc Annual Report 2014 Financial statements Notes to primary statements
C: Balance sheet notes continued
C7: Risk and sensitivity analysis continued
Detailed analyses of sensitivity of IFRS basis profit or loss and shareholders’ equity to key market and other risks by business unit are provided in notes C7.2, C7.3, C7.4
and C7.5. The sensitivity analyses provided show the effect on profit or loss and shareholders’ equity to changes in the relevant risk variables, all of which are reasonably possible at the relevant balance sheet date. In the equity risk
sensitivity analysis shown below, the Group has considered the impact of an instantaneous 20 per cent fall in equity markets. If equity markets were to fall by more than 20 per cent, the Group believes that this would not be an
instantaneous fall but rather this would be expected to occur over a period of time during which the Group would be able to put mitigating management actions in place. In addition, the equity risk sensitivity analysis provided assumed that all
equity indices fall by the same percentage.
Impact of diversification on risk exposure
The Group enjoys significant diversification benefits achieved through the geographical spread of the Group’s operations and, within those operations through a broad mix of
product types. This arises because not all risk scenarios are likely to happen at the same time and across all geographic regions. Relevant correlation factors include:
Correlation across geographic regions:
— Financial risk factors; and
— Non-financial risk factors.
Correlation across risk factors:
— Longevity risk;
— Expenses;
— Persistency; and
— Other risks.
The effect of Group diversification across the Group’s life businesses is to significantly reduce the aggregate standalone volatility risk to IFRS operating profit based on
longer-term investment returns. The effect is almost wholly explained by the correlations across risk types, in particular mortality and longevity risk.
C7.2 Asia
insurance operations
Exposure and sensitivity of IFRS basis profit and shareholders’ equity to market and other risks
The Asia operations sell with-profits and unit-linked policies and, although the with-profits business generally has a lower terminal bonus element than in the UK, the investment
portfolio still contains a proportion of equities. Non-participating business is largely backed by debt securities or deposits. The Group’s exposure to market risk arising from its Asia operations is therefore at modest levels. This reflects
the fact that the Asia operations have a balanced portfolio of with-profits, unit-linked and other types of business.
In Asia, adverse persistency experience can
impact the IFRS profitability of certain types of business written in the region. This risk is managed at a business unit level through regular monitoring of experience and the implementation of management actions as necessary. These actions could
include product enhancements, increased management focus on premium collection as well as other customer retention efforts. The potential financial impact of lapses is often mitigated through the specific features of the products, eg surrender
charges, or through the availability of premium holiday or partial withdrawal policy features.
In summary, for Asia operations, the operating profit based on
longer-term investment returns is mainly affected by the impact of market levels on unit-linked persistency, and other insurance risks. At the total IFRS profit level the Asia result is affected by short-term value movements on the asset portfolio
for non-linked shareholder-backed business.
i Sensitivity to risks other than foreign exchange risk
With-profits business
Similar principles to those explained for UK with-profits business in
C7.4 apply to profit emergence for the Asia with-profits business. Correspondingly, the profit emergence reflects bonus declaration and is relatively insensitive to period by period fluctuations in insurance risk or interest rate movements.
Unit-linked business
As for the UK insurance operations, for unit-linked
business, the main factor affecting the profit and shareholders’ equity of the Asia operations is investment performance through asset management fees. The sensitivity of profits and shareholders’ equity to changes in insurance risk,
interest rate risk and credit risk are not material.
Other business
Interest
rate risk
Excluding its with-profit and unit-linked business, the results of the Asia business are sensitive to the vagaries of routine movements in interest
rates.
Prudential plc Annual Report 2014 229
For the
purposes of analysing sensitivity to variations in interest rates, reference has been made to the movements in the 10-year government bond rates of the territories. At 31 December 2014, 10-year government bond rates vary from territory to
territory and range from 1.6 per cent to 8.0 per cent (2013: 1.7 per cent to 9.0 per cent).
For the sensitivity analysis as shown in the table
below, the reasonably possible interest rate movement used is one per cent for all territories but subject to a floor of zero where the bond rates are currently below 1 per cent.
The estimated sensitivity to the decrease and increase in interest rates at 31 December 2014 and 2013 is as follows:
2014 £m 2013 £m
Decrease Increase Decrease Increase of 1% of 1% of 1% of 1%
Profit before tax attributable to shareholders (54) (137) 311 (215) Related deferred tax (where applicable) (5) 24 (34) 40 Net effect on
profit and shareholders’ equity (59) (113) 277 (175)
The pre-tax impacts, if they arose, would mostly be recorded within the category short-term
fluctuations in investments returns in the Group’s segmental analysis of profit before tax.
The degree of sensitivity of the results of the non-linked
shareholder-backed business of the Asia operations to movements in interest rates depends upon the degree to which the liabilities under the ‘grandfathered’ IFRS 4 measurement basis reflects market interest rates from period to period. For
example for those countries, such as those applying US GAAP, the results can be more sensitive as the effect of interest rate movements on the backing investments may not be offset by liability movements.
In addition, the degree of sensitivity of the results shown in the table above is dependent on the interest rate level at that point of time. In 2014, the lower interest rates in
certain countries have had an adverse impact on the degree of sensitivity to a decrease in interest rates.
Equity price risk
The non-linked shareholder business has limited exposure to equity and property investment (31 December 2014: £932 million). Generally changes in equity and property
investment values are not directly offset by movements in policyholder liabilities.
The estimated sensitivity to a 10 per cent and 20 per cent change in
equity and property prices for shareholder-backed Asia other business, which would be reflected in the short-term fluctuation component of the Group’s segmental analysis of profit before tax, at 31 December 2014 and 2013 would be as
follows:
2014 £m 2013 £m
Decrease Decrease Decrease Decrease of
20% of 10% of 20% of 10%
Profit before tax attributable to shareholders (187) (93) (114) (57) Related deferred tax (where applicable) 23 11 24
12 Net effect on profit and shareholders’ equity (164) (82) (90) (45) A 10 or 20 per cent increase in their value would have an approximately equal and opposite effect on profit and shareholders’ equity Financial
to the sensitivities shown above. The market risk sensitivities shown above reflect the impact of temporary market movements and, therefore, the primary effect of such movements would, in the Group’s segmental analysis of profits, be included
within the short-term fluctuations in investment returns. statements
Insurance risk
Many of the territories in Asia are exposed to mortality/morbidity risk and provision is made within policyholder liabilities on a prudent regulatory basis to cover the potential
exposure. If these prudent assumptions were strengthened by 5 per cent then it is estimated that post-tax profit and shareholders’ equity would be decreased by approximately £47 million (2013: £38 million). Mortality and
morbidity
C:
has a symmetrical effect on the portfolio and any weakening of
these assumptions would have a similar equal and opposite impact. B al
ance sheet notes

230 Prudential plc Annual Report 2014 Financial statements Notes to primary statements
C: Balance sheet notes continued
C7: Risk and sensitivity analysis continued ii Sensitivity to
foreign exchange risk
Consistent with the Group’s accounting policies, the profits of the Asia insurance operations are translated at average exchange rates
and shareholders’ equity at the closing rate for the reporting period. For 2014, the rates for the most significant operations are given in note A1.
A
10 per cent increase (strengthening of the pound sterling) or decrease (weakening of the pound sterling) in these rates would have reduced or increased profit before tax attributable to shareholders, profit for the year and shareholders’
equity, excluding goodwill, attributable to Asia operations respectively as follows:
A 10% increase in local A 10% decrease in local currency to £ exchange
rates currency to £ exchange rates 2014 £m 2013 £m 2014 £m 2013 £m
Profit before tax attributable to shareholders
(111) (63) 135 77 Profit for the year (95) (49) 117 60 Shareholders’ equity, excluding goodwill, attributable to Asia operations (315) (246) 384 300
C7.3 US insurance operations
Exposure and sensitivity of IFRS basis profit and
shareholders’ equity to market and other risks
At the level of operating profit based on longer-term investment returns, Jackson’s results are sensitive
to market conditions to the extent of income earned on spread-based products and indirectly in respect of variable annuity asset management fees.
Jackson’s
main exposures are to market risk through its exposure to interest rate risk and equity risk. Approximately 94 per cent (2013: 94 per cent) of its general account investments support fixed interest rate and fixed index annuities, life
business and surplus and 6 per cent (2013: 6 per cent) support institutional businesses. All of these types of business contain considerable interest rate guarantee features and, consequently, require that the assets that support them are
primarily fixed income or fixed maturity.
Jackson is exposed primarily to the following risks:
Risks Risk of loss
Equity risk — Related to the incidence of benefits related to
guarantees issued in connection with its variable annuity contracts; and
— Related to meeting contractual accumulation requirements in fixed index annuity
contracts.
Interest rate risk — Related to meeting guaranteed rates of accumulation on fixed annuity products following a sharp and sustained fall in interest
rates;
— Related to the guarantee features attached to the Company’s products and to policyholder withdrawals following a sharp and sustained increase in
interest rates; and
— The risk of mismatch between the expected duration of certain annuity liabilities and prepayment risk and extension risk inherent in
mortgage-backed securities.
Jackson’s derivative programme is used to manage interest rate risk associated with a broad range of products and equity market
risk attaching to its equity-based products. Movements in equity markets, interest rates and credit spreads materially affect the carrying value of derivatives which are used to manage the liabilities to policyholders and backing investment assets.
Combined with the use of US GAAP measurement (as ‘grandfathered’ under IFRS 4) for the insurance contracts assets and liabilities which is largely insensitive to current period market movements, the Jackson total profit (ie including
short-term fluctuations in investment returns) is very sensitive to market movements. In addition to these effects the Jackson shareholders’ equity is sensitive to the impact of interest rate and credit spread movements on the value of fixed
income securities. Movements in unrealised appreciation on these securities are included as movement in shareholders’ equity (ie outside the income statement).
Prudential plc Annual Report 2014 231
Jackson
enters into financial derivative transactions, including those noted below to reduce and manage business risks.
These transactions manage the risk of a change in
the value, yield, price, cash flows or quantity of, or a degree of exposure with respect to assets, liabilities or future cash flows, which Jackson has acquired or incurred.
Jackson uses free-standing derivative instruments for hedging purposes. Additionally, certain liabilities, primarily trust instruments supported by funding agreements, fixed index
annuities, certain Guaranteed Minimum Withdrawal Benefit variable annuity features and reinsured Guaranteed Minimum Income Benefit variable annuity features contain embedded derivatives as defined by IAS 39, ‘Financial Instruments: Recognition
and Measurement’. Jackson does not account for such derivatives as either fair value or cash flow hedges as might be permitted if the specific hedge documentation requirements of IAS 39 were followed. Financial derivatives, including
derivatives embedded in certain host liabilities that have been separated for accounting and financial reporting purposes are carried at fair value.
Value
movements on the derivatives are reported within the income statement. In preparing Jackson’s segment profit as shown in note B1.1 value movements on Jackson’s derivative contracts, are included within short-term fluctuations in investment
returns and excluded from operating results based on longer-term investment returns.
The principal types of derivatives used by Jackson and their purpose are as
follows:
Derivative Purpose
Interest rate swap These generally involve the
exchange of fixed and floating payments over the period for which Jackson holds the instrument without an exchange of the underlying principal amount. These agreements are used for hedging purposes.
Put-swaption contracts These contracts provide the purchaser with the right, but not the obligation, to require the writer to pay the present value of a long-duration interest rate
swap at future exercise dates. Jackson purchases and writes put-swaptions with maturities up to 5 years. Put-swaptions hedge against significant movements in interest rates.
Equity index futures contracts These derivatives (including various call and put options and interest rate contingent options) are used and equity index options to hedge
Jackson’s obligations associated with its issuance of fixed index deferred annuities and certain VA guarantees. Some of these annuities and guarantees contain embedded options which are fair valued for financial reporting purposes.
Total return swaps Total return swaps in which Jackson receives equity returns or returns based on reference pools of assets in exchange for short-term floating rate payments based
on notional amounts, are held for both hedging and investment purposes.
Cross-currency swaps Cross-currency swaps, which embody spot and forward currency swaps and
additionally, in some cases, interest rate swaps and equity index swaps, are entered into for the purpose of hedging Jackson’s foreign currency denominated funding agreements supporting trust instrument obligations. Credit default swaps These
swaps, represent agreements under which Jackson has purchased default protection on certain underlying corporate bonds held in its portfolio. These contracts allow Jackson to sell the protected bonds at par value to the counterparty if a default
event occurs in exchange for periodic payments made by Jackson for the life of the agreement. Jackson does not write default protection using credit derivatives. Financial The estimated sensitivity of Jackson’s profit and shareholders’
equity to equity and interest rate risks provided below is net of the related changes in amortisation of DAC. The effect on the related changes in amortisation of DAC provided is based on the current ‘grandfathered’ US GAAP DAC basis
but does not include any effect from an acceleration or deceleration of amortisation of DAC. statements
C: al B ance sheet notes
232 Prudential plc Annual Report 2014 Financial statements Notes to primary statements
C: Balance sheet notes continued
C7: Risk and sensitivity analysis continued i Sensitivity to
equity risk
At 31 December 2014 and 2013, Jackson had variable annuity contracts with guarantees, for which the net amount at risk (‘NAR’) is
defined as the amount of guaranteed benefit in excess of current account value, as follows:
Period Net Weighted until Minimum Account amount average expected
return value at risk attained age annuitisation
31 December 2014 £m £m
Return of net deposits plus a minimum return
GMDB 0-6% 64,344 1,463 65.0 years
GMWB – Premium only 0% 2,151 32
GMWB* 0-5%† 264 17
GMAB – Premium only 0% 53 –Highest specified anniversary account value minus withdrawals post-anniversary
GMDB 6,581 193 65.0 years
GMWB – Highest anniversary only 2,131 85
GMWB* 830 58
Combination net deposits plus minimum return, highest specified anniversary
account value minus withdrawals post-anniversary
GMDB 0-6% 3,978 302 67.5 years
GMIB‡ 0-6% 1,595 360 1.4 years GMWB* 0-8%† 57,323 2,033
Period Net
Weighted until Minimum Account amount average expected return value at risk attained age annuitisation
31 December 2013 £m £m
Return of net deposits plus a minimum return
GMDB 0-6% 52,985 1,248 64.7 years GMWB –
Premium only 0% 2,260 36 GMWB* 0-5%† 289 18 GMAB – Premium only 0% 57 –Highest specified anniversary account value minus withdrawals post-anniversary GMDB 5,522 134 64.6 years GMWB – Highest anniversary only 2,039 93 GMWB* 875 63
Combination net deposits plus minimum return, highest specified anniversary account value minus withdrawals post-anniversary GMDB 0-6% 3,522 217 66.9 years
GMIB‡ 0-6% 1,642 317 2.4 years GMWB* 0-8%† 46,091 1,087
* Amounts
shown for Guaranteed Minimum Withdrawal Benefit comprise sums for the ‘not for life’ portion (where the guaranteed withdrawal base less the account value equals to the net amount at risk (NAR)), and a ‘for life’ portion (where
the NAR has been estimated as the present value of future expected benefit payment remaining after the amount of the ‘not for life’ guaranteed benefits is zero).
† Ranges shown based on simple interest. The upper limits of 5 per cent, or 8 per cent simple interest are approximately equal to 4.1 per cent and 6 per
cent respectively, on a compound interest basis over a typical ten year bonus period. For example 1 + 10 x 0.05 is similar to 1.041 growing at a compound rate of 4.01 per cent for a further nine years.
‡ The GMIB reinsurance guarantees are essentially fully reinsured.
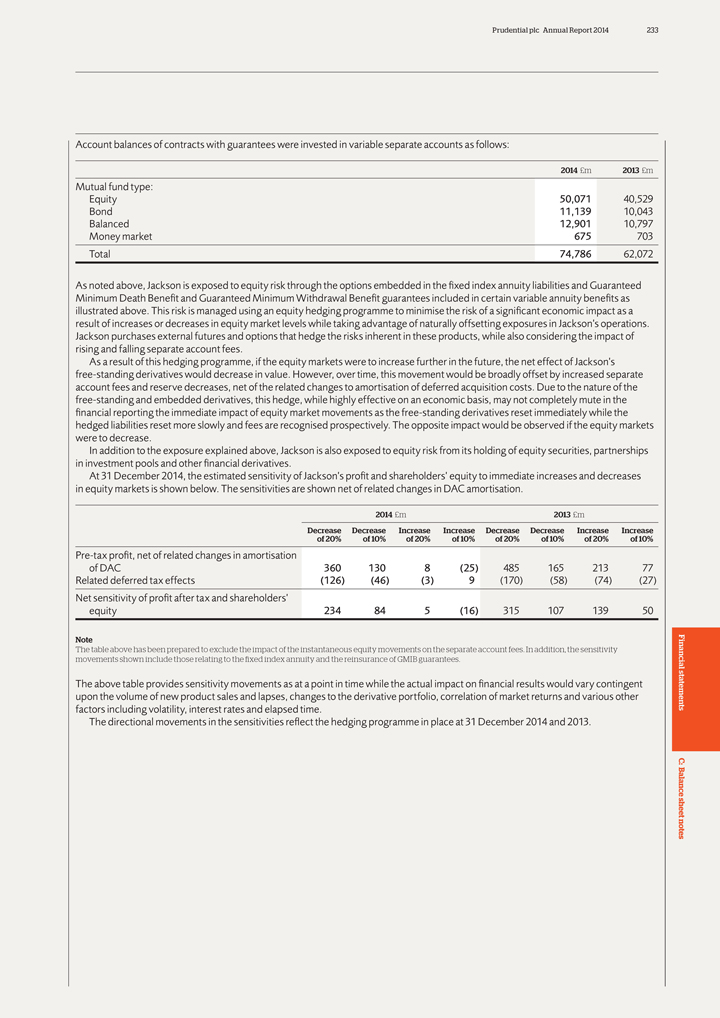
Prudential plc Annual Report 2014 233
Account
balances of contracts with guarantees were invested in variable separate accounts as follows:
2014 £m 2013 £m
Mutual fund type:
Equity 50,071 40,529 Bond 11,139 10,043 Balanced 12,901 10,797 Money market
675 703 Total 74,786 62,072
As noted above, Jackson is exposed to equity risk through the options embedded in the fixed index annuity liabilities and Guaranteed
Minimum Death Benefit and Guaranteed Minimum Withdrawal Benefit guarantees included in certain variable annuity benefits as illustrated above. This risk is managed using an equity hedging programme to minimise the risk of a significant economic
impact as a result of increases or decreases in equity market levels while taking advantage of naturally offsetting exposures in Jackson’s operations. Jackson purchases external futures and options that hedge the risks inherent in these
products, while also considering the impact of rising and falling separate account fees.
As a result of this hedging programme, if the equity markets were to
increase further in the future, the net effect of Jackson’s free-standing derivatives would decrease in value. However, over time, this movement would be broadly offset by increased separate account fees and reserve decreases, net of the
related changes to amortisation of deferred acquisition costs. Due to the nature of the free-standing and embedded derivatives, this hedge, while highly effective on an economic basis, may not completely mute in the financial reporting the immediate
impact of equity market movements as the free-standing derivatives reset immediately while the hedged liabilities reset more slowly and fees are recognised prospectively. The opposite impact would be observed if the equity markets were to decrease.
In addition to the exposure explained above, Jackson is also exposed to equity risk from its holding of equity securities, partnerships in investment pools and
other financial derivatives.
At 31 December 2014, the estimated sensitivity of Jackson’s profit and shareholders’ equity to immediate increases and
decreases in equity markets is shown below. The sensitivities are shown net of related changes in DAC amortisation.
2014 £m 2013 £m
Decrease Decrease Increase Increase Decrease Decrease Increase Increase of 20% of 10% of 20% of 10% of 20% of 10% of 20% of 10%
Pre-tax profit, net of related changes in amortisation of DAC 360 130 8 (25) 485 165 213 77 Related deferred tax effects (126) (46) (3) 9
(170) (58) (74) (27) Net sensitivity of profit after tax and shareholders’ equity 234 84 5 (16) 315 107 139 50
Note
The table above has been prepared to exclude the impact of the instantaneous equity movements on the separate account fees. In addition, the sensitivity movements shown include
those relating to the fixed index annuity and the reinsurance of GMIB guarantees. Financial
The above table provides sensitivity movements as at a point in time
while the actual impact on financial results would vary contingent upon the volume of new product sales and lapses, changes to the derivative portfolio, correlation of market returns and various other statements factors including volatility,
interest rates and elapsed time.
The directional movements in the sensitivities reflect the hedging programme in place at 31 December 2014 and 2013.
C: al B ance sheet notes
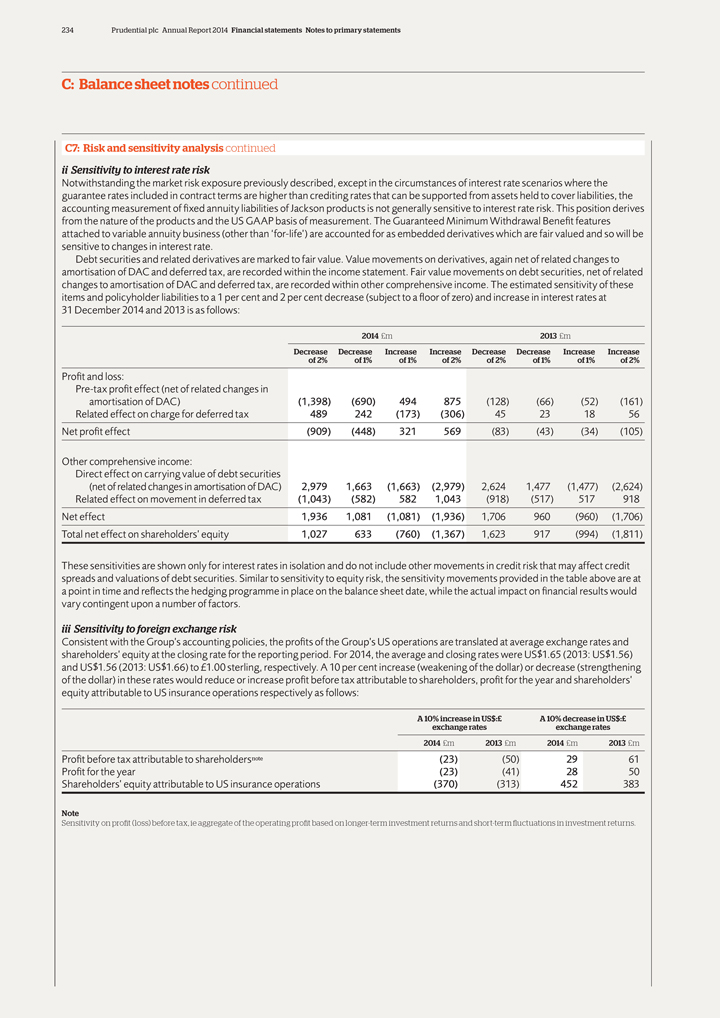
234 Prudential plc Annual Report 2014 Financial statements Notes to primary statements
C: Balance sheet notes continued
C7: Risk and sensitivity analysis continued ii Sensitivity to
interest rate risk
Notwithstanding the market risk exposure previously described, except in the circumstances of interest rate scenarios where the guarantee rates
included in contract terms are higher than crediting rates that can be supported from assets held to cover liabilities, the accounting measurement of fixed annuity liabilities of Jackson products is not generally sensitive to interest rate risk.
This position derives from the nature of the products and the US GAAP basis of measurement. The Guaranteed Minimum Withdrawal Benefit features attached to variable annuity business (other than ‘for-life’) are accounted for as embedded
derivatives which are fair valued and so will be sensitive to changes in interest rate.
Debt securities and related derivatives are marked to fair value. Value
movements on derivatives, again net of related changes to amortisation of DAC and deferred tax, are recorded within the income statement. Fair value movements on debt securities, net of related changes to amortisation of DAC and deferred tax, are
recorded within other comprehensive income. The estimated sensitivity of these items and policyholder liabilities to a 1 per cent and 2 per cent decrease (subject to a floor of zero) and increase in interest rates at
31 December 2014 and 2013 is as follows:
2014 £m 2013 £m
Decrease Decrease Increase Increase Decrease Decrease Increase Increase of 2% of 1% of 1% of 2% of 2% of 1% of 1% of 2%
Profit and loss:
Pre-tax profit effect (net of related changes in amortisation of DAC)
(1,398) (690) 494 875 (128) (66) (52) (161) Related effect on charge for deferred tax 489 242 (173) (306) 45 23 18 56 Net profit effect (909) (448) 321 569 (83) (43) (34) (105)
Other comprehensive income:
Direct effect on carrying value of debt
securities
(net of related changes in amortisation of DAC) 2,979 1,663 (1,663) (2,979) 2,624 1,477 (1,477) (2,624) Related effect on movement
in deferred tax (1,043) (582) 582 1,043 (918) (517) 517 918 Net effect 1,936 1,081 (1,081) (1,936) 1,706 960 (960) (1,706) Total net effect on shareholders’ equity 1,027 633 (760) (1,367) 1,623
917 (994) (1,811)
These sensitivities are shown only for interest rates in isolation and do not include other movements in credit risk that may affect credit
spreads and valuations of debt securities. Similar to sensitivity to equity risk, the sensitivity movements provided in the table above are at a point in time and reflects the hedging programme in place on the balance sheet date, while the actual
impact on financial results would vary contingent upon a number of factors.
iii Sensitivity to foreign exchange risk
Consistent with the Group’s accounting policies, the profits of the Group’s US operations are translated at average exchange rates and shareholders’ equity at the
closing rate for the reporting period. For 2014, the average and closing rates were US$1.65 (2013: US$1.56) and US$1.56 (2013: US$1.66) to £1.00 sterling, respectively. A 10 per cent increase (weakening of the dollar) or decrease
(strengthening of the dollar) in these rates would reduce or increase profit before tax attributable to shareholders, profit for the year and shareholders’ equity attributable to US insurance operations respectively as follows:
A 10% increase in US$:£ A 10% decrease in US$:£ exchange rates exchange rates 2014 £m 2013 £m 2014 £m 2013 £m
Profit before tax attributable to shareholdersnote (23) (50) 29 61 Profit for the year (23) (41) 28 50 Shareholders’ equity attributable to US insurance
operations (370) (313) 452 383
Note
Sensitivity on profit (loss)
before tax, ie aggregate of the operating profit based on longer-term investment returns and short-term fluctuations in investment returns.
Prudential plc Annual Report 2014 235
iv Other
sensitivities
Total profit of Jackson is very sensitive to market risk on the assets covering liabilities other than variable annuity business segregated in the
separate accounts.
As with other shareholder-backed business the profit or loss for Jackson is presented by distinguishing the result for the year between an
operating result based on longer-term investment returns and short-term fluctuations in investment returns. In this way the most significant direct effect of market changes that have taken place to the Jackson result are separately identified. The
principal determinants of variations in operating profit based on longer-term returns are:
— Growth in the size of assets under management covering the
liabilities for the contracts in force;
— Variations in fees and other income, offset by variations in market value adjustment payments and, where necessary,
strengthening of liabilities;
— Spread returns for the difference between investment returns and rates credited to policyholders; and
— Amortisation of deferred acquisition costs.
For term business, acquisition costs are
deferred and amortised in line with expected premiums. For annuity and interest sensitive life business, acquisition costs are deferred and amortised in line with expected gross profits on the relevant contracts. For interest-sensitive business, the
key assumption is the expected long-term spread between the earned rate and the rate credited to policyholders, which is based on an annual spread analysis. In addition, expected gross profits depend on mortality assumptions, assumed unit costs and
terminations other than deaths (including the related charges) all of which are based on a combination of actual experience of Jackson, industry experience and future expectations. A detailed analysis of actual experience is measured by internally
developed expense, mortality and persistency studies.
Except to the extent of mortality experience, which primarily affects profits through variations in claim
payments and Guaranteed Minimum Death Benefit reserves, the profits of Jackson are relatively insensitive to changes in insurance risk.
Jackson is sensitive to
lapse risk and other types of policyholder behaviour, such as the take-up of its Guaranteed Minimum Withdrawal Benefit product features. Jackson has extensive derivative programme to seek to manage the exposure for altered equity markets and
interest rates. For example, Jackson uses derivatives to ameliorate the effect of a sharp rise in interest rates, which would be the most likely cause of a sudden change in policyholder behaviour.
For variable annuity business, the key assumption is the expected long-term level of separate account returns, which for 2014 was 7.4 per cent (2013: 7.4 per cent). The
impact of using this return is reflected in two principal ways, namely:
— Through the projected expected gross profits which are used to determine the
amortisation of deferred acquisition costs. This is applied through the use of a mean reversion technique which is described in more detail in note C5.1(b) above; and
— The required level of provision for guaranteed minimum death benefit claims.
C7.4 UK
insurance operations
Exposure and sensitivity of IFRS basis profit and shareholders’ equity to market and other risks
The IFRS basis results of the UK insurance operations are most sensitive to asset/liability matching, mortality and default rate experience and longevity assumptions and the
difference between the return on corporate bond and risk-free rate for shareholder-backed annuity business of Prudential Retirement Income Limited and the Prudential Assurance Company non-profit sub-fund. Further details are described below.
The IFRS operating profit based on longer-term investment returns for UK insurance operations is sensitive to changes in longevity assumptions affecting the
carrying value of liabilities to policyholders for UK shareholder-backed annuity business. At the total IFRS profit level, the result is particularly sensitive to temporary value movements on assets backing the capital of the shareholder-backed
Financial annuity business.
With-profits business statements
SAIF
Shareholders have no interest in the profits of the ring-fenced fund of SAIF but are entitled to the asset management fees paid on the assets of the fund.
With-profits sub-fund businessC:
The shareholder results of the UK with-profits business
(including non-participating annuity business of the with-profits sub-fund) are B al only sensitive to market risk through the indirect effect of investment performance on declared policyholder bonuses. ance The investment assets of PAC with-profits
funds are subject to market risk. Changes in their carrying value, net of related changes to asset-share liabilities of with-profit contracts, affect the level of unallocated surplus of the fund. Therefore, the level of unallocated sheet surplus is
particularly sensitive to the level of investment returns on the portion of the assets that represents surplus. However, as notes unallocated surplus is accounted for as a liability under IFRS, movements in its value do not affect shareholders’
profit and equity.
The shareholder results of the UK with-profits fund correspond to the shareholders’ share of the cost of bonuses declared on the
with-profits business which is currently one-ninth of the cost of bonuses declared. Investment performance is a key driver of bonuses, and hence the shareholders’ share of the cost of bonuses. Due to the ‘smoothed’ basis of bonus
declaration, the sensitivity to investment performance in a single year is low relative to movements in the period to period performance. However, over multiple periods, it is important.
Mortality and other insurance risk are relatively minor factors in the determination of the bonus rates. Adverse persistency experience can affect the level of profitability from
with-profits but in any given one year, the shareholders’ share of cost of bonus may only be marginally affected. However, altered persistency trends may affect future expected shareholder transfers.
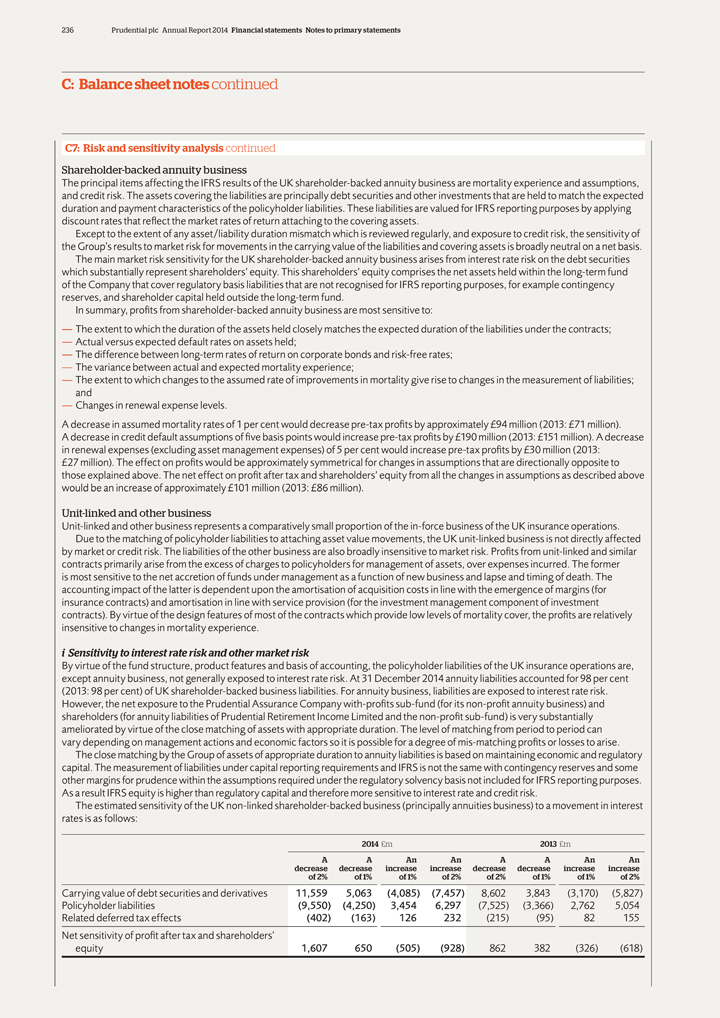
236 Prudential plc Annual Report 2014 Financial statements Notes to primary statements
C: Balance sheet notes continued
C7: Risk and sensitivity analysis continued
Shareholder-backed annuity business
The principal items affecting the IFRS results of the UK
shareholder-backed annuity business are mortality experience and assumptions, and credit risk. The assets covering the liabilities are principally debt securities and other investments that are held to match the expected duration and payment
characteristics of the policyholder liabilities. These liabilities are valued for IFRS reporting purposes by applying discount rates that reflect the market rates of return attaching to the covering assets.
Except to the extent of any asset/liability duration mismatch which is reviewed regularly, and exposure to credit risk, the sensitivity of the Group’s results to market risk
for movements in the carrying value of the liabilities and covering assets is broadly neutral on a net basis.
The main market risk sensitivity for the UK
shareholder-backed annuity business arises from interest rate risk on the debt securities which substantially represent shareholders’ equity. This shareholders’ equity comprises the net assets held within the long-term fund of the Company
that cover regulatory basis liabilities that are not recognised for IFRS reporting purposes, for example contingency reserves, and shareholder capital held outside the long-term fund.
In summary, profits from shareholder-backed annuity business are most sensitive to:
— The
extent to which the duration of the assets held closely matches the expected duration of the liabilities under the contracts;
— Actual versus expected default
rates on assets held;
— The difference between long-term rates of return on corporate bonds and risk-free rates;
— The variance between actual and expected mortality experience;
— The extent to
which changes to the assumed rate of improvements in mortality give rise to changes in the measurement of liabilities; and
— Changes in renewal expense
levels.
A decrease in assumed mortality rates of 1 per cent would decrease pre-tax profits by approximately £94 million (2013: £71 million).
A decrease in credit default assumptions of five basis points would increase pre-tax profits by £190 million (2013: £151 million). A decrease in renewal expenses (excluding asset management expenses) of 5 per cent would
increase pre-tax profits by £30 million (2013: £27 million). The effect on profits would be approximately symmetrical for changes in assumptions that are directionally opposite to those explained above. The net effect on profit
after tax and shareholders’ equity from all the changes in assumptions as described above would be an increase of approximately £101 million (2013: £86 million).
Unit-linked and other business
Unit-linked and other business represents a comparatively small
proportion of the in-force business of the UK insurance operations. Due to the matching of policyholder liabilities to attaching asset value movements, the UK unit-linked business is not directly affected by market or credit risk. The liabilities of
the other business are also broadly insensitive to market risk. Profits from unit-linked and similar contracts primarily arise from the excess of charges to policyholders for management of assets, over expenses incurred. The former is most sensitive
to the net accretion of funds under management as a function of new business and lapse and timing of death. The accounting impact of the latter is dependent upon the amortisation of acquisition costs in line with the emergence of margins (for
insurance contracts) and amortisation in line with service provision (for the investment management component of investment contracts). By virtue of the design features of most of the contracts which provide low levels of mortality cover, the
profits are relatively insensitive to changes in mortality experience.
i Sensitivity to interest rate risk and other market risk
By virtue of the fund structure, product features and basis of accounting, the policyholder liabilities of the UK insurance operations are, except annuity business, not generally
exposed to interest rate risk. At 31 December 2014 annuity liabilities accounted for 98 per cent (2013: 98 per cent) of UK shareholder-backed business liabilities. For annuity business, liabilities are exposed to interest rate risk.
However, the net exposure to the Prudential Assurance Company with-profits sub-fund (for its non-profit annuity business) and shareholders (for annuity liabilities of Prudential Retirement Income Limited and the non-profit sub-fund) is very
substantially ameliorated by virtue of the close matching of assets with appropriate duration. The level of matching from period to period can vary depending on management actions and economic factors so it is possible for a degree of mis-matching
profits or losses to arise.
The close matching by the Group of assets of appropriate duration to annuity liabilities is based on maintaining economic and
regulatory capital. The measurement of liabilities under capital reporting requirements and IFRS is not the same with contingency reserves and some other margins for prudence within the assumptions required under the regulatory solvency basis not
included for IFRS reporting purposes. As a result IFRS equity is higher than regulatory capital and therefore more sensitive to interest rate and credit risk.
The
estimated sensitivity of the UK non-linked shareholder-backed business (principally annuities business) to a movement in interest rates is as follows:
2014
£m 2013 £m
A A An An A A An An decrease decrease increase increase decrease decrease increase increase of 2% of 1% of 1% of 2% of 2% of 1% of 1% of 2%
Carrying value of debt securities and derivatives 11,559 5,063 (4,085) (7,457) 8,602 3,843 (3,170) (5,827) Policyholder liabilities
(9,550) (4,250) 3,454 6,297 (7,525) (3,366) 2,762 5,054 Related deferred tax effects (402) (163) 126 232 (215) (95) 82 155 Net sensitivity of profit after tax and shareholders’ equity 1,607 650
(505) (928) 862 382 (326) (618)
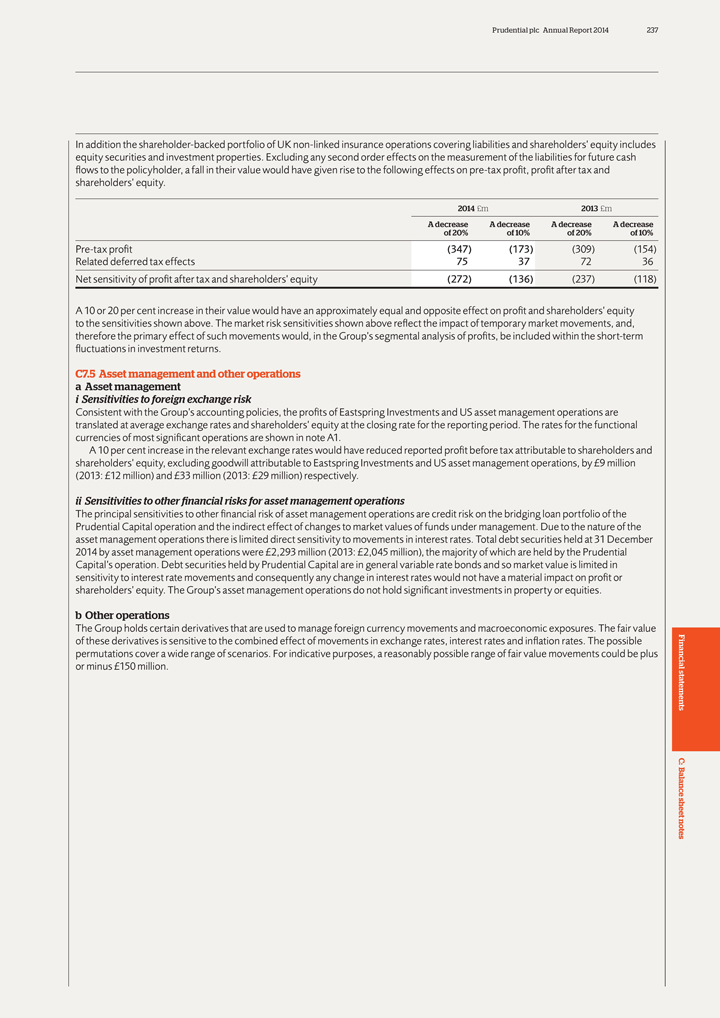
Prudential plc Annual Report 2014 237
In addition
the shareholder-backed portfolio of UK non-linked insurance operations covering liabilities and shareholders’ equity includes equity securities and investment properties. Excluding any second order effects on the measurement of the liabilities
for future cash flows to the policyholder, a fall in their value would have given rise to the following effects on pre-tax profit, profit after tax and shareholders’ equity.
2014 £m 2013 £m
A decrease A decrease A decrease A decrease of 20% of 10% of 20%
of 10%
Pre-tax profit (347) (173) (309) (154) Related deferred tax effects 75 37 72 36 Net sensitivity of profit after tax and
shareholders’ equity (272) (136) (237) (118)
A 10 or 20 per cent increase in their value would have an approximately equal and opposite
effect on profit and shareholders’ equity to the sensitivities shown above. The market risk sensitivities shown above reflect the impact of temporary market movements, and, therefore the primary effect of such movements would, in the
Group’s segmental analysis of profits, be included within the short-term fluctuations in investment returns.
C7.5 Asset management and other operations a
Asset management i Sensitivities to foreign exchange risk
Consistent with the Group’s accounting policies, the profits of Eastspring Investments and US asset
management operations are translated at average exchange rates and shareholders’ equity at the closing rate for the reporting period. The rates for the functional currencies of most significant operations are shown in note A1.
A 10 per cent increase in the relevant exchange rates would have reduced reported profit before tax attributable to shareholders and shareholders’ equity, excluding
goodwill attributable to Eastspring Investments and US asset management operations, by £9 million (2013: £12 million) and £33 million (2013: £29 million) respectively.
ii Sensitivities to other financial risks for asset management operations
The principal
sensitivities to other financial risk of asset management operations are credit risk on the bridging loan portfolio of the Prudential Capital operation and the indirect effect of changes to market values of funds under management. Due to the nature
of the asset management operations there is limited direct sensitivity to movements in interest rates. Total debt securities held at 31 December 2014 by asset management operations were £2,293 million (2013: £2,045 million),
the majority of which are held by the Prudential Capital’s operation. Debt securities held by Prudential Capital are in general variable rate bonds and so market value is limited in sensitivity to interest rate movements and consequently any
change in interest rates would not have a material impact on profit or shareholders’ equity. The Group’s asset management operations do not hold significant investments in property or equities.
b Other operations
The Group holds certain derivatives that are used to manage foreign
currency movements and macroeconomic exposures. The fair value of these derivatives is sensitive to the combined effect of movements in exchange rates, interest rates and inflation rates. The possible permutations cover a wide range of scenarios.
For indicative purposes, a reasonably possible range of fair value movements could be plus Financial or minus £150 million.
statements C: al B ance sheet
notes
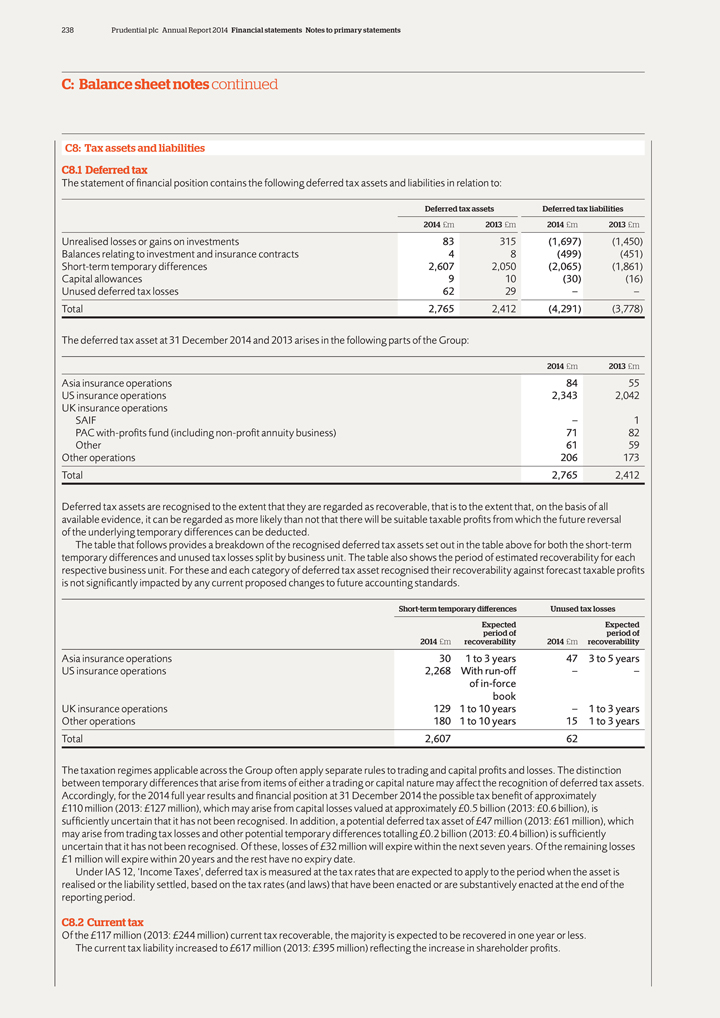
238 Prudential plc Annual Report 2014 Financial statements Notes to primary statements
C: Balance sheet notes continued
C8: Tax assets and liabilities C8.1 Deferred tax
The statement of financial position contains the following deferred tax assets and liabilities in relation to:
Deferred tax assets Deferred tax liabilities 2014 £m 2013 £m 2014 £m 2013 £m
Unrealised losses or gains on investments 83 315 (1,697) (1,450) Balances relating to investment and insurance contracts 4 8 (499) (451) Short-term temporary
differences 2,607 2,050 (2,065) (1,861) Capital allowances 9 10 (30) (16) Unused deferred tax losses 62 29 – – Total 2,765 2,412 (4,291) (3,778)
The deferred tax asset at 31 December 2014 and 2013 arises in the following parts of the Group:
2014 £m 2013 £m
Asia insurance operations 84 55 US insurance operations 2,343
2,042 UK insurance operations SAIF – 1 PAC with-profits fund (including non-profit annuity business) 71 82 Other 61 59 Other operations 206 173 Total 2,765 2,412
Deferred tax assets are recognised to the extent that they are regarded as recoverable, that is to the extent that, on the basis of all available evidence, it can be regarded as
more likely than not that there will be suitable taxable profits from which the future reversal of the underlying temporary differences can be deducted.
The table
that follows provides a breakdown of the recognised deferred tax assets set out in the table above for both the short-term temporary differences and unused tax losses split by business unit. The table also shows the period of estimated
recoverability for each respective business unit. For these and each category of deferred tax asset recognised their recoverability against forecast taxable profits is not significantly impacted by any current proposed changes to future accounting
standards.
Short-term temporary differences Unused tax losses Expected Expected period of period of 2014 £m recoverability 2014 £m recoverability
Asia insurance operations 30 1 to 3 years 47 3 to 5 years US insurance operations 2,268 With run-off – –of in-force book UK insurance operations 129 1 to
10 years – 1 to 3 years Other operations 180 1 to 10 years 15 1 to 3 years Total 2,607 62
The taxation regimes applicable across the Group often apply
separate rules to trading and capital profits and losses. The distinction between temporary differences that arise from items of either a trading or capital nature may affect the recognition of deferred tax assets. Accordingly, for the 2014 full
year results and financial position at 31 December 2014 the possible tax benefit of approximately £110 million (2013: £127 million), which may arise from capital losses valued at approximately £0.5 billion (2013:
£0.6 billion), is sufficiently uncertain that it has not been recognised. In addition, a potential deferred tax asset of £47 million (2013: £61 million), which may arise from trading tax losses and other potential temporary
differences totalling £0.2 billion (2013: £0.4 billion) is sufficiently uncertain that it has not been recognised. Of these, losses of £32 million will expire within the next seven years. Of the remaining losses
£1 million will expire within 20 years and the rest have no expiry date.
Under IAS 12, ‘Income Taxes’, deferred tax is measured at the tax
rates that are expected to apply to the period when the asset is realised or the liability settled, based on the tax rates (and laws) that have been enacted or are substantively enacted at the end of the reporting period.
C8.2 Current tax
Of the £117 million (2013: £244 million) current tax
recoverable, the majority is expected to be recovered in one year or less. The current tax liability increased to £617 million (2013: £395 million) reflecting the increase in shareholder profits.
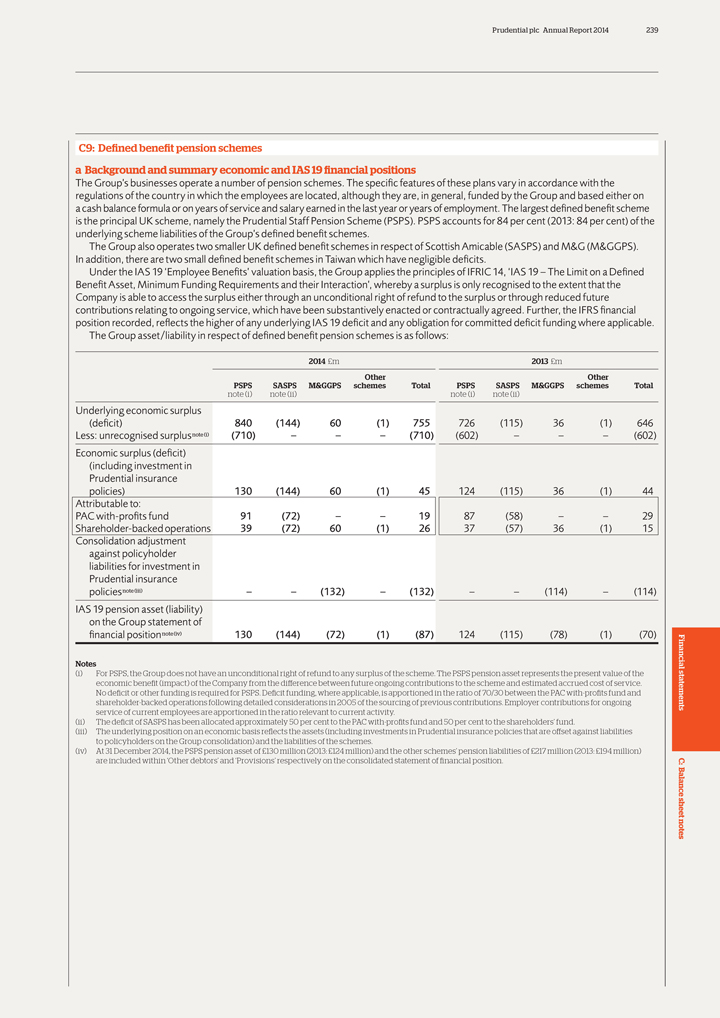
Prudential plc Annual Report 2014 239
C9: Defined
benefit pension schemes a Background and summary economic and IAS 19 financial positions
The Group’s businesses operate a number of pension schemes. The
specific features of these plans vary in accordance with the regulations of the country in which the employees are located, although they are, in general, funded by the Group and based either on a cash balance formula or on years of service and
salary earned in the last year or years of employment. The largest defined benefit scheme is the principal UK scheme, namely the Prudential Staff Pension Scheme (PSPS). PSPS accounts for 84 per cent (2013: 84 per cent) of the underlying
scheme liabilities of the Group’s defined benefit schemes.
The Group also operates two smaller UK defined benefit schemes in respect of Scottish Amicable
(SASPS) and M&G (M&GGPS). In addition, there are two small defined benefit schemes in Taiwan which have negligible deficits.
Under the IAS 19
‘Employee Benefits’ valuation basis, the Group applies the principles of IFRIC 14, ‘IAS 19 – The Limit on a Defined Benefit Asset, Minimum Funding Requirements and their Interaction’, whereby a surplus is only recognised to
the extent that the Company is able to access the surplus either through an unconditional right of refund to the surplus or through reduced future contributions relating to ongoing service, which have been substantively enacted or contractually
agreed. Further, the IFRS financial position recorded, reflects the higher of any underlying IAS 19 deficit and any obligation for committed deficit funding where applicable.
The Group asset/liability in respect of defined benefit pension schemes is as follows:
2014
£m 2013 £m
Other Other
PSPS SASPS M&GGPS schemes Total PSPS
SASPS M&GGPS schemes Total note (i) note (ii) note (i) note (ii)
Underlying economic surplus
(deficit) 840 (144) 60 (1) 755 726 (115) 36 (1) 646 Less: unrecognised surplus note (i) (710) – – – (710) (602) – –
– (602) Economic surplus (deficit) (including investment in Prudential insurance policies) 130 (144) 60 (1) 45 124 (115) 36 (1) 44 Attributable to: PAC with-profits fund 91 (72) – – 19 87 (58) –
– 29 Shareholder-backed operations 39 (72) 60 (1) 26 37 (57) 36 (1) 15 Consolidation adjustment against policyholder liabilities for investment in Prudential insurance policies note (iii) – – (132) –
(132) – – (114) – (114) IAS 19 pension asset (liability) on the Group statement of financial position note (iv) 130 (144) (72) (1) (87) 124 (115) (78) (1) (70)
Notes Financial
(i) For PSPS, the Group does not have an unconditional right of refund to any
surplus of the scheme. The PSPS pension asset represents the present value of the economic benefit (impact) of the Company from the difference between future ongoing contributions to the scheme and estimated accrued cost of service.
No deficit or other funding is required for PSPS. Deficit funding, where applicable, is apportioned in the ratio of 70/30 between the PAC with-profits fund and shareholder-backed
operations following detailed considerations in 2005 of the sourcing of previous contributions. Employer contributions for ongoing statements service of current employees are apportioned in the ratio relevant to current activity.
(ii) The deficit of SASPS has been allocated approximately 50 per cent to the PAC with-profits fund and 50 per cent to the shareholders’ fund.
(iii) The underlying position on an economic basis reflects the assets (including investments in Prudential insurance policies that are offset against liabilities to policyholders
on the Group consolidation) and the liabilities of the schemes.
(iv) At 31 December 2014, the PSPS pension asset of £130 million (2013: £124
million) and the other schemes’ pension liabilities of £217 million (2013: £194 million) are included within ‘Other debtors’ and ‘Provisions’ respectively on the consolidated statement of financial position.
C: al B ance sheet notes
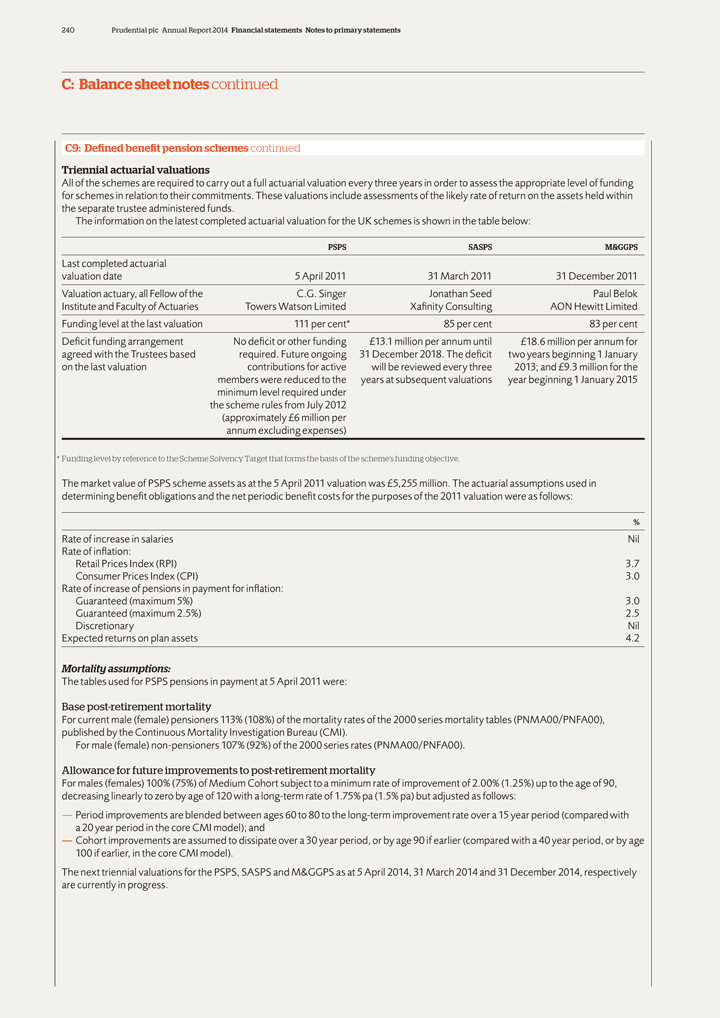
240 Prudential plc Annual Report 2014 Financial statements Notes to primary statements
C: Balance sheet notes continued
C9: Defined benefit pension schemes continued Triennial
actuarial valuations
All of the schemes are required to carry out a full actuarial valuation every three years in order to assess the appropriate level of funding
for schemes in relation to their commitments. These valuations include assessments of the likely rate of return on the assets held within the separate trustee administered funds.
The information on the latest completed actuarial valuation for the UK schemes is shown in the table below:
PSPS SASPS M&GGPS
Last completed actuarial valuation date 5 April 2011 31 March
2011 31 December 2011 Valuation actuary, all Fellow of the C.G. Singer Jonathan Seed Paul Belok Institute and Faculty of Actuaries Towers Watson Limited Xafinity Consulting AON Hewitt Limited Funding level at the last valuation 111 per
cent* 85 per cent 83 per cent Deficit funding arrangement No deficit or other funding £13.1 million per annum until £18.6 million per annum for agreed with the Trustees based required. Future ongoing 31 December
2018. The deficit two years beginning 1 January on the last valuation contributions for active will be reviewed every three 2013; and £9.3 million for the members were reduced to the years at subsequent valuations year beginning
1 January 2015 minimum level required under the scheme rules from July 2012 (approximately £6 million per annum excluding expenses)
| * | Funding level by reference to the Scheme Solvency Target that forms the basis of the scheme’s funding objective. |
The market value of PSPS scheme assets as at the 5 April 2011 valuation was £5,255
million. The actuarial assumptions used in determining benefit obligations and the net periodic benefit costs for the purposes of the 2011 valuation were as follows:
%
Rate of increase in salaries Nil Rate of inflation: Retail Prices Index
(RPI) 3.7 Consumer Prices Index (CPI) 3.0 Rate of increase of pensions in payment for inflation: Guaranteed (maximum 5%) 3.0 Guaranteed (maximum 2.5%) 2.5 Discretionary Nil Expected returns on plan assets 4.2
Mortality assumptions:
The tables used for PSPS pensions in payment at 5 April 2011 were:
Base post-retirement mortality
For current male (female) pensioners 113%
(108%) of the mortality rates of the 2000 series mortality tables (PNMA00/PNFA00), published by the Continuous Mortality Investigation Bureau (CMI).
For male
(female) non-pensioners 107% (92%) of the 2000 series rates (PNMA00/PNFA00).
Allowance for future improvements to post-retirement mortality
For males (females) 100% (75%) of Medium Cohort subject to a minimum rate of improvement of 2.00% (1.25%) up to the age of 90, decreasing linearly to zero by age of 120
with a long-term rate of 1.75% pa (1.5% pa) but adjusted as follows:
— Period improvements are blended between ages 60 to 80 to the long-term improvement rate
over a 15 year period (compared with a 20 year period in the core CMI model); and
— Cohort improvements are assumed to dissipate over a 30 year period, or by
age 90 if earlier (compared with a 40 year period, or by age 100 if earlier, in the core CMI model).
The next triennial valuations for the PSPS, SASPS and
M&GGPS as at 5 April 2014, 31 March 2014 and 31 December 2014, respectively are currently in progress.
Prudential plc Annual Report 2014 241
Risks to
which the defined benefit schemes expose the Group
Responsibility of making good of any deficit that may arise in the schemes lies with the employers of the
schemes, which are subsidiaries of the Group. Accordingly, the pension schemes expose the Group to a number of risks and the most significant of which are detailed below:
— Interest rate and investment risk – this risk arises because the schemes are not invested wholly in assets that most closely match the expected future cash flows.
Therefore, falling equity markets and bond yields may lead to higher deficits in the schemes. Details of the investment portfolio of the schemes are provided in section (c);
— Inflation risk – the majority of the benefit obligations of all three schemes are linked to inflation, and higher inflation will lead to higher liabilities; and
— Mortality risk – increases in life expectancy of the members would mean that benefits are paid for longer and will result in an increase in the
scheme’s liabilities.
Corporate governance
The Group’s UK pension
schemes are regulated by ‘The Pension Regulator’ in accordance with the Pension Act 1995. Trustees have been appointed for each pension scheme and they have the ultimate responsibility to ensure that the scheme is managed in accordance
with the Trust Deed & Rules. The Trustees are required by the Pension Regulator to be well conversant with the Trust Deed & Rules and to act in accordance with these Rules.
The Rules of the Group’s largest pension arrangement, the defined benefit section of PSPS, a final salary scheme, specify that, in exercising its investment powers, the
Trustee’s objective is to achieve the best overall investment return consistent with the security of the assets of the scheme. In doing this, consideration is given to the nature and duration of the scheme’s liabilities. The Trustee sets
the general investment policy and specifies any restrictions on types of investment and the degrees of divergence permitted from the benchmark, but delegates the responsibility for selection and realisation of specific investments to the Investment
Managers.
The Trustee reviews strategy, the asset mix benchmark and the Investment Managers’ objectives every three years, to coincide with the Actuarial
Valuation, or earlier if the Scheme Actuary recommends. Interim reviews are conducted annually based on changing economic circumstances and financial market levels.
The Trustee consults the Principal Employer, the Prudential Assurance Company, on the investment principles, but the ultimate responsibility for the investment of
the assets of the scheme lies with the Trustee.
The investment policies and strategies for the other two UK defined benefit schemes, (the SASPS and M&GGPS,
which are both final salary schemes), follow similar principles, but have different target allocations reflecting the particular requirements of the schemes. All of the three UK schemes are closed to new entrants.
The majority of the scheme liabilities are linked to inflation. The assets that would most closely match the liabilities are a combination of index-linked government bonds or
investment grade derivatives to match these inflation-linked liabilities and fixed interest gilts to match the fixed liabilities of the schemes. These ‘matching assets’ generally are expected to generate lower future returns than asset
classes such as equities. The risk that must be traded off against investing in higher expected returns assets is increased volatility of the schemes’ return and higher risk of default.
The Trustee of each of the schemes manages the investment strategy of the scheme to achieve an acceptable balance between investing in the assets that most closely match the
expected benefit payments and assets that are expected to achieve a greater return in the hope of reducing the contributions required or providing additional benefits to members. When determining the investment strategy, the Trustee considers the
risk that falls in asset values may not be matched by similar falls in the value of the schemes’ liabilities. It also consults the Principal Employer, in order to understand the Principal Employer’s appetite for bearing this risk and
considers the Employer’s ability to make good any shortfall that may arise.
The PSPS scheme has entered into a derivatives based strategy to match the
duration and inflation profile of its liabilities. This Financial involved a reallocation from other investments to other assets with an interest and inflation swap overlay. In broad terms, the scheme is committed to making a series of payments
related to LIBOR on a nominal amount and in return the scheme receives a series of fixed and inflation-linked payments which match a proportion of its liabilities. As at 31 December 2014, the nominal value of the interest and statements
inflation-linked swaps amounted to £0.8 billion (2013: £0.8 billion) and negative £3.0 billion (2013: £2.7 billion) respectively.
The SASPS
and M&GGPS use very limited or no derivatives to hedge their risks. The risks arising from these schemes are managed through well diversified investments with a portion of the scheme assets invested in inflation-indexed bonds to provide a
partial hedge against inflation. The M&G pension scheme also invests in leveraged gilts as part of its asset liability management.
C: al B ance sheet notes
242 Prudential plc Annual Report 2014 Financial statements Notes to primary statements
C: Balance sheet notes continued
C9: Defined benefit pension schemes continued b Assumptions
The actuarial assumptions used in determining benefit obligations and the net periodic benefit costs for the years ended 31 December were as follows:
2014 % 2013 %
Discount rate* 3.5 4.4 Rate of increase in salaries
3.0 3.3 Rate of inflation† Retail prices index (RPI) 3.0 3.3 Consumer prices index (CPI) 2.0 2.3 Rate of increase of pensions in payment for inflation: PSPS: Guaranteed (maximum 5%) 2.5 2.5 Guaranteed (maximum 2.5%) 2.5 2.5 Discretionary 2.5
2.5 Other schemes 3.0 3.3
* The discount rate has been determined by reference to an ‘AA’ corporate bond index, adjusted where applicable, to allow for
the difference in duration between the index and the pension liabilities.
† The rate of inflation reflects the long-term assumption for the UK RPI or CPI
depending on the tranche of the schemes.
The calculations are based on current actuarially calculated mortality estimates with a specific allowance made for future
improvements in mortality. The specific allowance made is in line with a custom calibration and has been updated in 2014 to reflect the 2012 mortality model from the Continuous Mortality Investigation Bureau of the Institute and Faculty of Actuaries
(CMI). The tables used for PSPS immediate annuities in payment at 31 December 2014 were: Male: 114.0 per cent PNMA00 with improvements in line with a custom calibration of the CMI’s 2012 mortality model, with a long-term mortality
improvement rate of 1.75 per cent per annum; and Female: 108.5 per cent PNFA00 with improvements in line with a custom calibration of the CMI’s 2012 mortality model, with a long-term mortality improvement rate of 1.25 per cent
per annum.
The tables used for PSPS immediate annuities in payment at 31 December 2013 were:
Male: 112.0 per cent PNMA00 with improvements in line with a custom calibration of the CMI’s 2011 mortality model, with a long-term mortality improvement rate of
1.75 per cent per annum; and Female: 108.5 per cent PNFA00 with improvements in line with a custom calibration of the CMI’s 2011 mortality model, with a long-term mortality improvement rate of 1.25 per cent per annum.
The assumed life expectancies on retirement at age 60, based on the mortality table used was:
2014 years 2013 years
Male Female Male Female
Retiring today 28.1 29.7 27.9 29.5 Retiring in 20 years’ time 30.6 32.7 31.5 32.8
The
mean term of the current PSPS liabilities is around 17 years.
Using external actuarial advice provided by the scheme actuaries being Towers Watson for the
valuation of PSPS, Xafinity Consulting for SASPS and Aon Hewitt Limited for the M&GGPS, the most recent full valuations have been updated to 31 December 2014, applying the principles prescribed by IAS 19.
c Estimated pension scheme surpluses and deficits
This section illustrates the financial
position of the Group’s defined benefit pension schemes on an economic basis and the IAS 19 basis. The underlying pension position on an economic basis reflects the assets (including investments in Prudential policies that are offset against
liabilities to policyholders on the Group consolidation) and the liabilities of the schemes. The IAS 19 basis excludes the investments in Prudential policies. At 31 December 2014, the investments in Prudential insurance policies comprise
£131 million (2013: £143 million) for PSPS and £132 million (2013: £114 million) for the M&GGPS. In principle, on consolidation the investments are eliminated against policyholder liabilities of UK insurance
operations, so that the formal IAS 19 position for the scheme in isolation excludes these items. This treatment applies to the M&GGPS investments. However, as a substantial portion of the Company’s interest in the underlying surplus of PSPS
is not recognised, the adjustment is not necessary for the PSPS investments.
Prudential plc Annual Report 2014 243
Movements on
the pension scheme deficit determined on the economic basis are as follows, with the effect of the application of IFRIC 14 being shown separately:
2014 £m
(Charge) credit to income statement or other comprehensive income Operating results (based
Surplus (deficit) on longer-term Actuarial and Surplus (deficit) in
schemes at investment other gains Contributions in schemes at
| 1 | Jan 2014 returns) and losses paid 31 Dec 2014 |
All schemes
Underlying position (without the effect of IFRIC 14)
Surplus (deficit) 646 (8) 62 55 755 Less: amount attributable to PAC with-profits fund (457) (4) (49) (15) (525) Shareholders’ share: Gross of
tax surplus (deficit) 189 (12) 13 40 230
Related tax (38) 2 (2) (8) (46)
Net of shareholders’ tax 151 (10) 11 32 184
Application of IFRIC 14 for the
derecognition of PSPS surplus
Derecognition of surplus (602) (26) (82) – (710) Less: amount attributable to PAC with-profits fund 428 18
60 – 506 Shareholders’ share: Gross of tax surplus (deficit) (174) (8) (22) – (204) Related tax 35 2 4 – 41 Net of shareholders’ tax (139) (6) (18) – (163)
With the effect of IFRIC 14
Surplus (deficit) 44 (34) (20) 55 45 Less: amount
attributable to PAC with-profits fund (29) 14 11 (15) (19) Shareholders’ share: Gross of tax surplus (deficit) 15 (20) (9) 40 26
Related tax (3) 4 2 (8) (5)
Net of shareholders’ tax 12
(16) (7) 32 21
Underlying investments of the schemes
On the
‘economic basis’, after including the underlying assets represented by the investments in Prudential insurance policies as scheme assets, the plans’ assets at 31 December comprise the following investments: Financial
2014 2013 Other Other PSPS schemes Total PSPS schemes Total
£m £m £m %
£m £m £m % statements
Equities
UK 126 86 212 2 133 76 209 3
Overseas 143 317 460 6 12 317 329 5 Bonds*: Government 5,078 440 5,518 68 4,288 311 4,599 66 C:
al B
Corporate 931 117 1,048 13 715 107 822 12 Asset-backed securities 197 26 223 3 45 17 62 1 ance Derivatives 159 (13) 146 2 91 6 97 1sheet Properties 93 57 150 2 71 44 115 2
Other assets 270 40 310 4 687 24 711 10 notes Total value of assets 6,997 1,070 8,067 100 6,042 902 6,944 100
| * | 94 per cent of the bonds are investment graded (2013: 97 per cent). |
244 Prudential plc Annual Report 2014 Financial statements Notes to primary statements
C: Balance sheet notes continued
C9: Defined benefit pension schemes continued
The movements in the IAS 19 pension schemes’ surplus and deficit between scheme assets and liabilities as consolidated in the financial statements were:
Attributable to policyholders and shareholders
2014 £m
Other adjustments Net surplus including for (deficit) Effect of Economic investments Present value (without the IFRIC 14 for basis in Prudential of benefit effect of derecognition
net surplus insurance IAS 19 basis Plan assets obligations IFRIC 14) of PSPS surplus (deficit) policies net deficit note (i) notes (i), (ii) note (iii) note (i)
Net deficit, beginning of year 6,944 (6,298) 646 (602) 44 (114) (70)
Current
service cost (30) (30) (30) (30) Past service cost (4) (4) (4) (4) Net interest on net defined benefit liability (asset) 301 (272) 29 (26) 3 (5) (2)
Administration expenses (6) (6) (6) (6) Benefit payments (266) 266 – – – Employers’ contributions note (iv) 55 55 55 55
Employees’ contributions 2 (2) – – – Actuarial and other gains and losses note (v) 1,037 (975) 62 (82) (20) (4) (24)
Settlements or curtailments – 3 3 3 – 3 Transfer out of investment in Prudential insurance policies – – (9) (9)
Net surplus (deficit), end of year 8,067 (7,312) 755 (710) 45 (132) (87)
2013
£m
Other adjustments Net surplus including for (deficit) Effect of Economic investments Present value (without the IFRIC 14 for basis in Prudential of
benefit effect of derecognition net surplus insurance IAS 19 basis Plan assets obligations IFRIC 14) of PSPS surplus (deficit) policies net deficit note (i) notes (i), (ii) note (iii) note (i)
Net deficit, beginning of year 7,197 (6,059) 1,138 (1,010) 128 (169) (41) Current service cost (27) (27) (27) (27) Net interest on net
defined benefit liability (asset) 313 (267) 46 (39) 7 (8) (1) Administration expenses paid out of plan assets (4) (4) (4) (4) Benefit payments (254) 254 – – – Employers’ contributions
note (iv) 56 56 56 56 Employees’ contributions 2 (2) – – – Actuarial and other gains and losses note (v) (366) (197) (563) 447 (116) 1 (115) Transfer out of investment in Prudential
insurance policies – – 62 62 Net surplus (deficit), end of year 6,944 (6,298) 646 (602) 44 (114) (70)
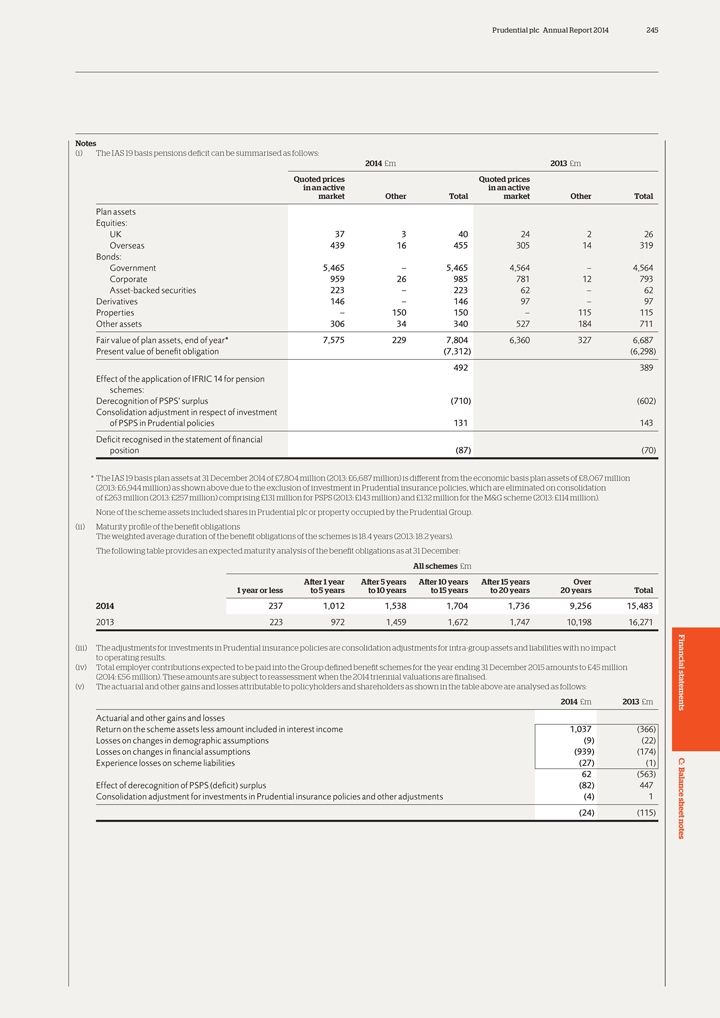
Prudential plc Annual Report 2014 245
Notes
| (i) | The IAS 19 basis pensions deficit can be summarised as follows: |
2014 £m 2013 £m Quoted prices Quoted prices in an active in an active market Other Total market Other Total
Plan assets Equities:
UK 37 3 40 24 2 26 Overseas 439 16 455 305 14 319 Bonds: Government
5,465 – 5,465 4,564 – 4,564 Corporate 959 26 985 781 12 793 Asset-backed securities 223 – 223 62 – 62 Derivatives 146 – 146 97 – 97 Properties – 150 150 – 115 115 Other assets 306 34 340 527 184 711 Fair value
of plan assets, end of year* 7,575 229 7,804 6,360 327 6,687 Present value of benefit obligation (7,312) (6,298)
492 389 Effect of the application of IFRIC 14
for pension schemes: Derecognition of PSPS’ surplus (710) (602) Consolidation adjustment in respect of investment of PSPS in Prudential policies 131 143 Deficit recognised in the statement of financial position (87) (70)
* The IAS 19 basis plan assets at 31 December 2014 of £7,804 million (2013: £6,687 million) is different from the economic basis plan assets
of £8,067 million (2013: £6,944 million) as shown above due to the exclusion of investment in Prudential insurance policies, which are eliminated on consolidation of £263 million (2013: £257 million) comprising
£131 million for PSPS (2013: £143 million) and £132 million for the M&G scheme (2013: £114 million).
None of the scheme
assets included shares in Prudential plc or property occupied by the Prudential Group. (ii) Maturity profile of the benefit obligations The weighted average duration of the benefit obligations of the schemes is 18.4 years (2013: 18.2 years).
The following table provides an expected maturity analysis of the benefit obligations as at 31 December:
All schemes £m
After 1 year After 5 years After 10 years After 15 years Over
| 1 | year or less to 5 years to 10 years to 15 years to 20 years 20 years Total |
2014 237 1,012 1,538 1,704 1,736 9,256 15,483
2013 223
972 1,459 1,672 1,747 10,198 16,271
(iii) The adjustments for investments in Prudential insurance policies are consolidation adjustments for intra-group assets and
liabilities with no impact to operating results. Financial (iv) Total employer contributions expected to be paid into the Group defined benefit schemes for the year ending 31 December 2015 amounts to £45 million (2014: £56
million). These amounts are subject to reassessment when the 2014 triennial valuations are finalised.
(v) The actuarial and other gains and losses attributable to
policyholders and shareholders as shown in the table above are analysed as follows:
2014 £m 2013 £m statements
Actuarial and other gains and losses
Return on the scheme assets less amount included in
interest income 1,037 (366) Losses on changes in demographic assumptions (9) (22) Losses on changes in financial assumptions (939) (174) Experience losses on scheme liabilities (27) (1) C:
62 (563) al B
Effect of derecognition of PSPS (deficit) surplus (82) 447 ance
Consolidation adjustment for investments in Prudential insurance policies and other adjustments (4) 1 (24) (115) sheet notes
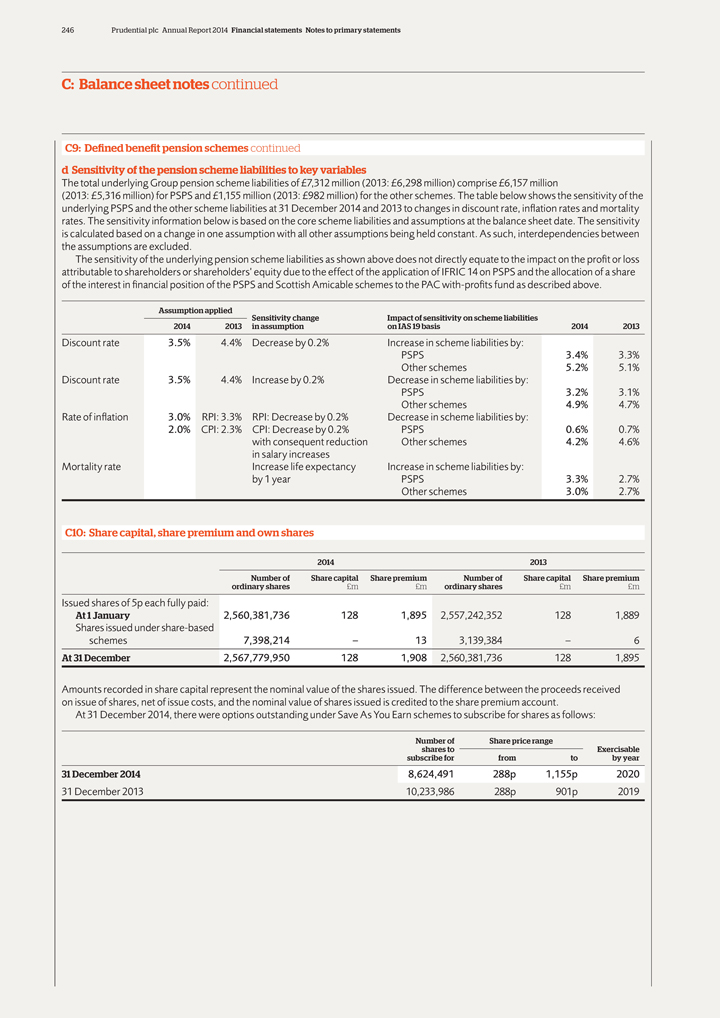
246 Prudential plc Annual Report 2014 Financial statements Notes to primary statements
C: Balance sheet notes continued
C9: Defined benefit pension schemes continued d Sensitivity
of the pension scheme liabilities to key variables
The total underlying Group pension scheme liabilities of £7,312 million (2013: £6,298 million)
comprise £6,157 million
(2013: £5,316 million) for PSPS and £1,155 million (2013: £982 million) for the other schemes. The table
below shows the sensitivity of the underlying PSPS and the other scheme liabilities at 31 December 2014 and 2013 to changes in discount rate, inflation rates and mortality rates. The sensitivity information below is based on the core scheme
liabilities and assumptions at the balance sheet date. The sensitivity is calculated based on a change in one assumption with all other assumptions being held constant. As such, interdependencies between the assumptions are excluded.
The sensitivity of the underlying pension scheme liabilities as shown above does not directly equate to the impact on the profit or loss attributable to shareholders or
shareholders’ equity due to the effect of the application of IFRIC 14 on PSPS and the allocation of a share of the interest in financial position of the PSPS and Scottish Amicable schemes to the PAC with-profits fund as described above.
Assumption applied Sensitivity change Impact of sensitivity on scheme liabilities
2014 2013 in assumption on IAS 19 basis 2014 2013
Discount rate 3.5% 4.4% Decrease by 0.2%
Increase in scheme liabilities by:
PSPS 3.4% 3.3% Other schemes 5.2% 5.1% Discount rate 3.5% 4.4% Increase by 0.2% Decrease in scheme liabilities by: PSPS 3.2%
3.1% Other schemes 4.9% 4.7% Rate of inflation 3.0% RPI: 3.3% RPI: Decrease by 0.2% Decrease in scheme liabilities by: 2.0% CPI: 2.3% CPI: Decrease by 0.2% PSPS 0.6% 0.7% with consequent reduction Other schemes 4.2% 4.6% in salary increases
Mortality rate Increase life expectancy Increase in scheme liabilities by: by 1 year PSPS 3.3% 2.7% Other schemes 3.0% 2.7%
C10: Share capital, share premium and
own shares
2014 2013
Number of Share capital Share premium Number of Share
capital Share premium ordinary shares £m £m ordinary shares £m £m
Issued shares of 5p each fully paid:
At 1 January 2,560,381,736 128 1,895 2,557,242,352 128 1,889 Shares issued under share-based schemes 7,398,214 – 13 3,139,384 – 6
At 31 December 2,567,779,950 128 1,908 2,560,381,736 128 1,895
Amounts recorded in
share capital represent the nominal value of the shares issued. The difference between the proceeds received on issue of shares, net of issue costs, and the nominal value of shares issued is credited to the share premium account.
At 31 December 2014, there were options outstanding under Save As You Earn schemes to subscribe for shares as follows:
Number of Share price range shares to Exercisable subscribe for from to by year
31 December 2014 8,624,491 288p 1,155p 2020
31 December 2013
10,233,986 288p 901p 2019

Prudential plc Annual Report 2014 247
Transactions
by Prudential plc and its subsidiaries in Prudential plc shares
The Group buys and sells Prudential plc (‘own shares’) either in relation to its employee
share schemes or via transactions undertaken by authorised investment funds that the Group is deemed to control. The cost of own shares of £195 million as at 31 December 2014 (2013: £141 million) is deducted from retained
earnings. The Company has established trusts to facilitate the delivery of shares under employee incentive plans. At 31 December 2014, 10.3 million (2013: 7.1 million) Prudential plc shares with a market value of £153.1 million
(2013: £94.5 million) were held in such trusts all of which are for employee incentive plans. The maximum number of shares held during 2014 was 10.3 million which was in December 2014.
The Company purchased the following number of shares in respect of employee incentive plans. The shares purchased each month are as follows:
2014 share price 2013 share price
Number Low High Cost Number Low High Cost of shares £
£ £ of shares £ £ £
January 13,740 13.56 13.56 186,314 11,864 9.15 9.15 108,496 February 16,841 12.77 12.77 215,060
10,900 9.25 9.25 100,868 March 4,623,303 12.82 13.59 60,161,823 11,342 10.15 10.15 115,121 April 149,199 13.12 13.48 2,006,955 894,567 10.30 10.86 9,692,613 May 1,361,688 13.90 14.13 19,184,679 54,781 11.56 11.72
643,608 June 11,290 13.80 13.80 155,802 15,950 10.89 11.11 176,139 July 10,745 13.83 13.83 148,550 11,385 11.20 11.20 135,132 August 11,321 13.22 13.22 149,607 924,499 11.48 11.94 10,955,609 September 355,268 14.18
14.41 5,074,731 10,960 11.38 11.38 124,725 October 51,199 13.75 13.84 704,601 103,999 11.54 11.69 1,201,870 November 51,314 14.36 14.47 737,173 12,108 12.52 12.65 151,773 December 1,223,290 14.41 15.47 17,983,248 2,362,435 12.63
12.93 30,377,986
Total 7,879,198 106,708,543 4,424,790 53,783,940
The Group
has consolidated a number of authorised investment funds where it is deemed to control these funds under IFRS.
Some of these funds hold shares in Prudential plc.
The total number of shares held by these funds at 31 December 2014 was 7.5 million (2013: 7.1 million) and the cost of acquiring these shares of £67 million (2013: £60 million) is included in the cost of own shares. The
market value of these shares as at 31 December 2014 was £112 million (2013: £95 million). During 2014, these funds made net additions of 405,940 Prudential shares (2013: net additions of 2,629,816) for a net increase of
£7 million to book cost (2013: net increase of £33 million).
All share transactions were made on an exchange other than the Stock Exchange of Hong
Kong.
Other than set out above the Group did not purchase, sell or redeem any Prudential plc listed securities during 2014 or 2013.
Financial statements C: al B ance sheet notes
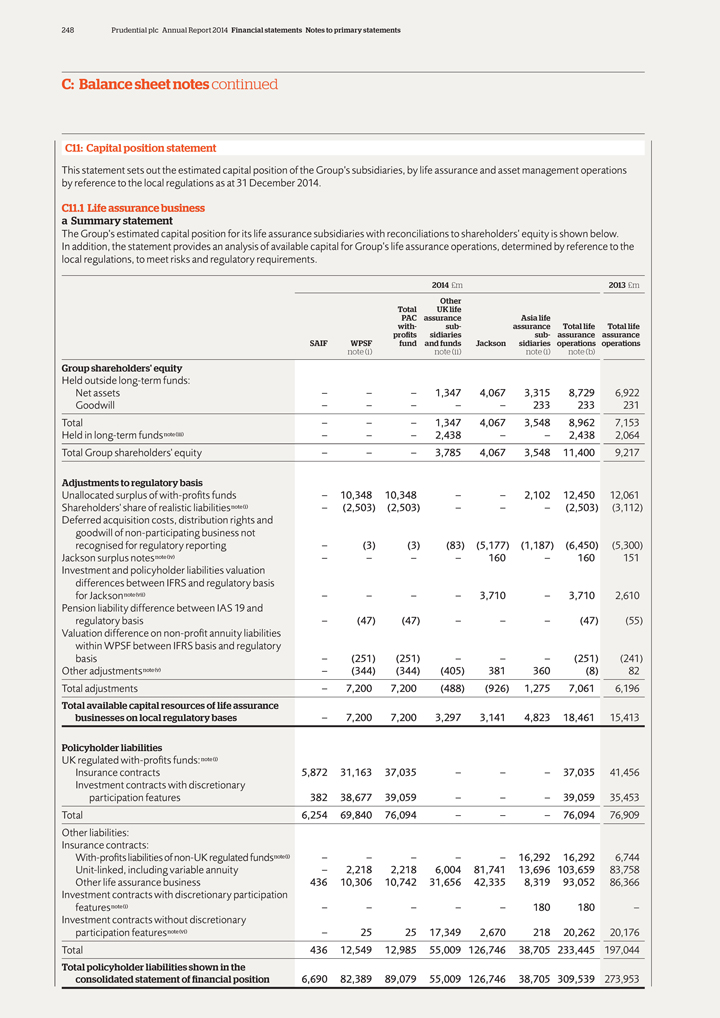
248 Prudential plc Annual Report 2014 Financial statements Notes to primary statements
C: Balance sheet notes continued
C11: Capital position statement
This statement sets out the estimated capital position of the Group’s subsidiaries, by life assurance and asset management operations by reference to the local regulations as
at 31 December 2014.
C11.1 Life assurance business a Summary statement
The Group’s estimated capital position for its life assurance subsidiaries with reconciliations to shareholders’ equity is shown below. In addition, the
statement provides an analysis of available capital for Group’s life assurance operations, determined by reference to the local regulations, to meet risks and regulatory requirements.
2014 £m 2013 £m Other Total UK life PAC assurance Asia life with- sub- assurance Total life Total life profits sidiaries sub- assurance assurance SAIF WPSF fund and
funds Jackson sidiaries operations operations note (i) note (ii) note (i) note (b)
Group shareholders’ equity
Held outside long-term funds:
Net assets – – – 1,347 4,067 3,315 8,729 6,922
Goodwill – – – – – 233 233 231 Total – – – 1,347 4,067 3,548 8,962 7,153 Held in long-term funds note (iii) – – – 2,438 – – 2,438 2,064 Total Group shareholders’ equity
– – – 3,785 4,067 3,548 11,400 9,217
Adjustments to regulatory basis
Unallocated surplus of with-profits funds – 10,348 10,348 – – 2,102 12,450 12,061 Shareholders’ share of realistic liabilities note (i) –
(2,503) (2,503) – – – (2,503) (3,112) Deferred acquisition costs, distribution rights and goodwill of non-participating business not recognised for regulatory reporting –
(3) (3) (83) (5,177) (1,187) (6,450) (5,300) Jackson surplus notes note (iv) – – – – 160 – 160 151 Investment and policyholder liabilities valuation differences between IFRS and
regulatory basis for Jackson note (vii) – – – – 3,710 – 3,710 2,610 Pension liability difference between IAS 19 and regulatory basis – (47) (47) – – – (47) (55) Valuation
difference on non-profit annuity liabilities within WPSF between IFRS basis and regulatory basis – (251) (251) – – – (251) (241) Other adjustments note (v) – (344) (344) (405) 381 360
(8) 82 Total adjustments – 7,200 7,200 (488) (926) 1,275 7,061 6,196
Total available capital resources of life assurance businesses on local
regulatory bases – 7,200 7,200 3,297 3,141 4,823 18,461 15,413
Policyholder liabilities
UK regulated with-profits funds: note (i)
Insurance contracts 5,872 31,163 37,035 –
– – 37,035 41,456 Investment contracts with discretionary participation features 382 38,677 39,059 – – – 39,059 35,453 Total 6,254 69,840 76,094 – – – 76,094 76,909 Other liabilities: Insurance contracts:
With-profits liabilities of non-UK regulated funds note(i) – – – – – 16,292 16,292 6,744 Unit-linked, including variable annuity – 2,218 2,218 6,004 81,741 13,696 103,659 83,758 Other life assurance business 436 10,306
10,742 31,656 42,335 8,319 93,052 86,366 Investment contracts with discretionary participation features note (i) – – – – – 180 180 –
Investment contracts without discretionary participation features note (vi) – 25 25 17,349 2,670 218 20,262 20,176 Total 436 12,549 12,985 55,009 126,746 38,705 233,445
197,044
Total policyholder liabilities shown in the consolidated statement of financial position 6,690 82,389 89,079 55,009 126,746 38,705 309,539 273,953
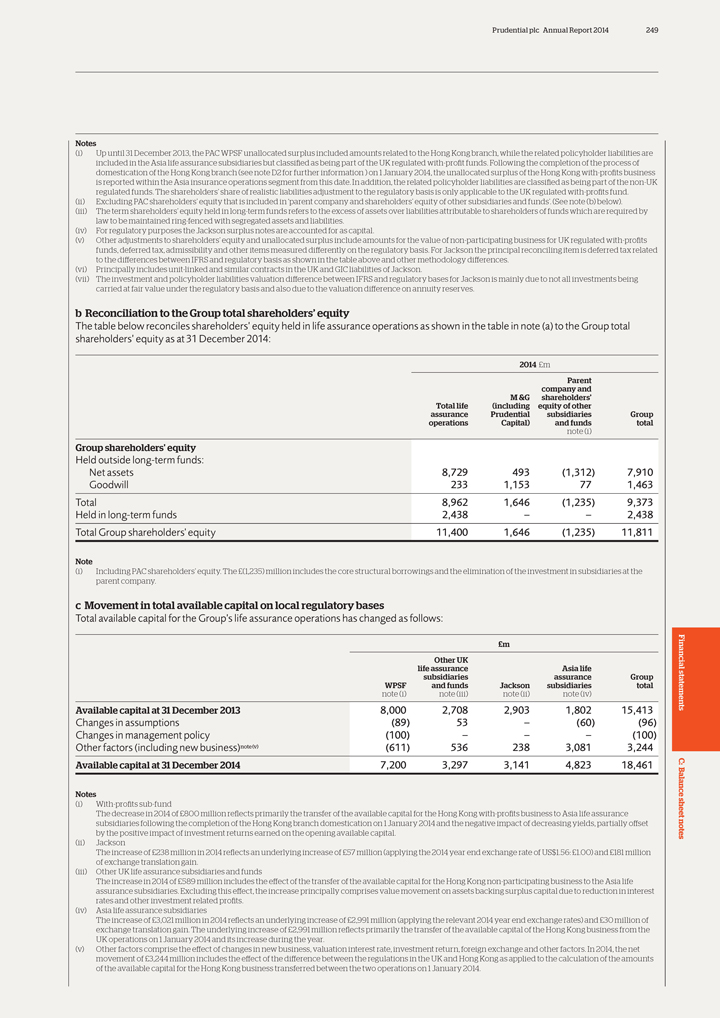
Prudential plc Annual Report 2014 249
Notes
(i) Up until 31 December 2013, the PAC WPSF unallocated surplus included amounts related to the Hong Kong branch, while the related policyholder liabilities
are included in the Asia life assurance subsidiaries but classified as being part of the UK regulated with-profit funds. Following the completion of the process of domestication of the Hong Kong branch (see note D2 for further information ) on
1 January 2014, the unallocated surplus of the Hong Kong with-profits business is reported within the Asia insurance operations segment from this date. In addition, the related policyholder liabilities are classified as being part of the non-UK
regulated funds. The shareholders’ share of realistic liabilities adjustment to the regulatory basis is only applicable to the UK regulated with-profits fund.
(ii) Excluding PAC shareholders’ equity that is included in ‘parent company and shareholders’ equity of other subsidiaries and funds’. (See
note (b) below). (iii) The term shareholders’ equity held in long-term funds refers to the excess of assets over liabilities attributable to shareholders of funds which are required by law to be maintained ring-fenced with segregated
assets and liabilities.
(iv) For regulatory purposes the Jackson surplus notes are accounted for as capital.
(v) Other adjustments to shareholders’ equity and unallocated surplus include amounts for the value of non-participating business for UK regulated with-profits funds, deferred
tax, admissibility and other items measured differently on the regulatory basis. For Jackson the principal reconciling item is deferred tax related to the differences between IFRS and regulatory basis as shown in the table above and other
methodology differences.
(vi) Principally includes unit-linked and similar contracts in the UK and GIC liabilities of Jackson.
(vii) The investment and policyholder liabilities valuation difference between IFRS and regulatory bases for Jackson is mainly due to not all investments being carried at fair
value under the regulatory basis and also due to the valuation difference on annuity reserves.
b Reconciliation to the Group total shareholders’ equity
The table below reconciles shareholders’ equity held in life assurance operations as shown in the table in note (a) to the Group total shareholders’
equity as at 31 December 2014:
2014 £m
Parent company and M &G
shareholders’ Total life (including equity of other assurance Prudential subsidiaries Group operations Capital) and funds total note (i)
Group
shareholders’ equity
Held outside long-term funds:
Net assets 8,729 493
(1,312) 7,910 Goodwill 233 1,153 77 1,463 Total 8,962 1,646 (1,235) 9,373
Held in long-term funds 2,438 – – 2,438 Total Group
shareholders’ equity 11,400 1,646 (1,235) 11,811
Note
(i) Including
PAC shareholders’ equity. The £(1,235) million includes the core structural borrowings and the elimination of the investment in subsidiaries at the parent company.
c Movement in total available capital on local regulatory bases
Total available capital for
the Group’s life assurance operations has changed as follows:
£m
Other UK Financial life assurance Asia life subsidiaries assurance Group WPSF and funds Jackson subsidiaries total note (i) note (iii) note
(ii) note (iv) statements
Available capital at 31 December 2013 8,000 2,708 2,903 1,802 15,413
Changes in assumptions (89) 53 – (60) (96) Changes in management policy (100) – – – (100) Other factors (including new business)note
(v) (611) 536 238 3,081 3,244
Available capital at 31 December 2014 7,200 3,297 3,141 4,823 18,461 C: al B
Notesance
| (i) | With-profits sub-fund |
The decrease in 2014 of £800 million reflects primarily the transfer of the available capital for the Hong Kong with-profits business to Asia life assurance
sheet subsidiaries following the completion of the Hong Kong branch domestication on 1 January 2014 and the negative impact of decreasing yields, partially offset by the positive impact of investment returns earned on the opening available
capital. notes (ii) Jackson The increase of £238 million in 2014 reflects an underlying increase of £57 million (applying the 2014 year end exchange rate of US$1.56: £1.00) and £181 million of exchange
translation gain.
(iii) Other UK life assurance subsidiaries and funds
The
increase in 2014 of £589 million includes the effect of the transfer of the available capital for the Hong Kong non-participating business to the Asia life assurance subsidiaries. Excluding this effect, the increase principally comprises
value movement on assets backing surplus capital due to reduction in interest rates and other investment related profits.
(iv) Asia life assurance subsidiaries
The increase of £3,021 million in 2014 reflects an underlying increase of £2,991 million (applying the relevant 2014 year end exchange rates)
and £30 million of exchange translation gain. The underlying increase of £2,991 million reflects primarily the transfer of the available capital of the Hong Kong business from the UK operations on 1 January 2014 and its
increase during the year.
(v) Other factors comprise the effect of changes in new business, valuation interest rate, investment return, foreign exchange and other
factors. In 2014, the net movement of £3,244 million includes the effect of the difference between the regulations in the UK and Hong Kong as applied to the calculation of the amounts of the available capital for the Hong Kong business
transferred between the two operations on 1 January 2014.
250 Prudential plc Annual Report 2014 Financial statements Notes to primary statements
C: Balance sheet notes continued
C11: Capital position statement continued d Basis of
preparation, capital requirements and management
Each of the Group’s long-term business operations is capitalised to a sufficiently strong level for its
individual circumstances. Details by the Group’s major operations are shown below.
i Asia insurance operations
The available capital shown above of £4,823 million (2013: £1,802 million) represents the excess of local regulatory basis assets over liabilities before deduction
of required capital of £1,514 million (2013: £699 million). The 2014 available capital and required capital for Asia insurance operations include the amounts for the Hong Kong with-profits and non-participating business following
its domestication as described further below.
The businesses in Asia are subject to local capital requirements in the jurisdictions in which they operate. The Hong
Kong business branch of PAC was transferred to separate subsidiaries established in Hong Kong following the completion of the process of the domestication of the Hong Kong business on 1 January 2014 (see note D2). Prior to 2014, the Hong Kong
business branch of PAC and its capital requirements were subsumed within those of the PAC long-term fund. From 2014, the Hong Kong business is solely regulated by the relevant regulators in Hong Kong and its local available capital and capital
requirements are shown within the Asia insurance operations in this note. For material Asian operations, the details of the basis of determining regulatory capital and regulatory capital requirements are as follows:
Hong Kong
As mentioned above, the Hong Kong business branch of PAC was domesticated on
1 January 2014 and the resulting companies Prudential Hong Kong Limited (PHKL), for long-term business, and Prudential General Insurance Hong Kong Limited (PGHK), for General Insurance business, were established.
For non-participating business, mathematical reserves are generally calculated using a modified net premium approach with no allowance for future discontinuance. The underlying
assumptions are based on a best estimate basis with prudent margins for adverse deviations. Cash flows are discounted at a valuation interest rate based on a blend between the risk-adjusted portfolio yield and the reinvestment rate.
For participating business, mathematical reserves are based on the guaranteed benefits only and use a modified net premium approach with no allowance for future discontinuances.
Similar to above, the underlying assumptions are based on a best estimate basis with prudent margins for adverse deviations with the valuation interest rate being a blend of the risk-adjusted portfolio yield and the reinvestment rate.
For linked business, the value of units is held together with the non-unit reserves calculated in accordance with the standard actuarial methodology and prevailing regulations.
The capital requirement for solvency margin calculation varies by underlying risk and duration of liabilities but is generally determined as 4 per cent of
mathematical reserves plus 0.3 per cent of the capital at risk.
Indonesia
Solvency capital is determined using a risk-based capital approach. Insurance companies in Indonesia are expected to maintain the level of net assets above
120 per cent of solvency capital.
Policy reserves for traditional business are determined on a gross premium reserve basis using prudent best estimate
assumptions. For linked business, the value of the units are maintained with a non-unit reserve which is calculated in accordance with standard actuarial methodology.
Korea
A risk-based capital framework applies in Korea.
Policy reserves for traditional business are determined on a net premium reserve basis using standard mortality and prescribed standard interest rates. For linked business, the
value of the units are held together with the non-unit reserves and calculated in accordance with the local regulator’s standard actuarial methodology.
In
accordance with the local risk-based capital framework, insurers are expected to maintain a level of free surplus in excess of the capital requirements.
Malaysia
A risk-based capital framework applies in Malaysia.
For participating
business, a gross premium reserve on the guaranteed and non-guaranteed benefits determined using best estimate assumptions is held. The amount held is subject to a minimum of a gross premium reserve on the guaranteed benefits, determined using best
estimate assumptions along with provisions of risk margin for adverse deviations discounted at the risk-free rate.
For non-participating business, gross premium
reserves are determined using best estimate assumptions along with provisions for risk margin for adverse deviations. For linked business the value of units is held together with a non-unit reserve calculated in accordance with standard actuarial
methodology.
Participating fund surplus is not allowed to be used to support a deficit (if any) and the capital requirement of the non-participating business. The
capital requirement is calculated based on a prescribed series of risk charges. The local regulator has set a Supervisory Target Capital Level of 130 per cent below which supervisory actions of increasing intensity will be taken. Each insurer
is also required to set its own Individual Target Capital Level to reflect its own risk profile and this is expected to be higher than the Supervisory Target Capital Level.

Prudential plc Annual Report 2014 251
Singapore
A risk-based capital framework applies in Singapore.
For participating
business, a gross premium reserve, determined using prudent best estimate assumptions and which makes allowance for future bonus, is held. The amount held is subject to a minimum of the higher of the assets attributed to participating business and a
gross premium reserve calculated on specified assumptions, but without allowance for future bonus, that include prescribed provisions for adverse deviations (PADs).
For non-participating business, gross premium reserves are held. For linked business the value of units is held together with a non-unit reserve calculated in
accordance with standard actuarial methodology.
A registered insurer incorporated in Singapore is required at all times to maintain a minimum level of paid-up
ordinary share capital and to ensure that its financial resources are not less than the greater of (i) the total risk requirement arising from the assets and liabilities of the insurer calculated in accordance with the Singapore Insurance Act;
or (ii) a minimum amount of 5 million Singapore Dollars. The regulator also has the authority to direct that the insurer satisfy additional capital adequacy requirements in addition to those set forth under the Singapore Insurance Act if
it considers such additional requirements appropriate.
Thailand
A risk-based
capital framework applies in Thailand.
For non-participating business, the gross premium reserves are determined using best estimate assumptions along with
provisions of risk margin for adverse deviations discounted at the risk-free rate.
The risk-free rate is derived from the greater of the current yield curve of
Thai government bonds and the weighted-average yield curve of the current and prior seven quarters of Thai government bonds, as with a greater weighting on the current quarter.
Life insurers are required by law to maintain capital funds which are not less than the greater of (i) the sum of capital for all risks and asset as prescribed in the
regulation and (ii) a minimum amount of 50 million Thai Baht.
Vietnam
For traditional business, mathematical reserves are calculated using a modified net premium approach, set using assumptions agreed with the regulator.
For linked business, the value of units is held together with the non-unit reserves calculated in accordance with the local regulator’s standard actuarial methodology.
The capital requirement is determined as 4 per cent of reserves plus a specified percentage of 0.1 per cent of sums at risk for policies with original
term less than or equal to five years or 0.3 per cent of sums at risk for policies with original term of more than five years. An additional capital requirement of Vietnamese Dong 200 billion is also required for companies transacting
unit-linked business.
ii US insurance operations
The regulatory framework for
Jackson is governed by the requirements of the US NAIC approved Risk-Based Capital standards. Under these requirements life insurance companies report using a formula-based capital standard that they calculate by applying factors to various asset,
premium and reserve items and separate model based calculations of risk associated primarily with variable annuity products. The Risk-Based Capital formula takes into account the risk characteristics of a company, including asset risk, insurance
risk, interest rate risk, market risk and business risk.
The available capital of Jackson shown above of £3,141 million (2013: £2,903 million)
reflects US regulatory basis available capital as adjusted to exclude asset valuation reserves. The asset valuation reserve, which is reflected as available capital, is designed to provide for future credit-related losses on debt securities and
losses on equity investments. Available capital includes a reduction for the effect of the interest maintenance reserve, which is designed by state regulators to defer recognition of non-credit related realised capital gains and losses and to
recognise them ratably in the future.
Jackson’s Risk-Based Capital ratio is significantly in excess of regulatory requirements. At 31 December 2014,
Jackson had a permitted practice in effect as granted by the local regulator allowing Jackson to carry certain interest rate swaps at book value, as if statutory hedge accounting were in place, instead of at fair value as would have been otherwise
required. Jackson is required to demonstrate the effectiveness of its interest rate swap programme pursuant to the Michigan Insurance Code. The total effect of this permitted practice, net of tax, was to decrease statutory surplus by
£356 million at 31 December 2014.
Michigan insurance law specifically allows value of business acquired as an admitted asset as long as certain
criteria are met. US NAIC standards limit the admitted amount of goodwill/value of business acquired generally to 10 per cent of capital and surplus. At 31 December 2014, Jackson reported £242 million of statutory basis value of
business acquired as a result of the REALIC acquisition, which is fully admissible under Michigan insurance law.
iii UK insurance operations
In the UK, the insurers, regulated by PRA, must hold capital resources equal at least to the Minimum Capital Requirement (MCR). In addition, the rules require insurers to perform
Individual Capital Assessments. Under these rules insurers must assess for themselves the amount of capital needed to back their business. If the PRA views the results of this assessment as insufficient, it may draw up its own Individual Capital
Guidance for a firm, which can be superimposed as a requirement.
Financial statements C: Balance sheet notes
252 Prudential plc Annual Report 2014 Financial statements Notes to primary statements
C: Balance sheet notes continued
C11: Capital position statement continued
PAC with-profits sub-fund and Scottish Amicable Insurance Fund
Under PRA rules, insurers with
with-profits liabilities of more than £500 million must hold capital equal to the higher of the MCR and the Enhanced Capital Requirement (ECR). The ECR is intended to provide a more risk responsive and ‘realistic’ measure of a
with-profit insurer’s capital requirements, whereas the MCR is broadly speaking equivalent to the previous required minimum margin under the Interim Prudential Sourcebook and satisfies the minimum EU Standards.
Determination of the ECR involves the comparison of two separate measurements of the firm’s resources requirement, which the PRA refers to as the ‘twin peaks’
approach.
The two separate peaks are: i The requirement comprised by the mathematical reserves plus the ‘Long-Term Insurance Capital Requirement’
(LTICR), together known as the ‘regulatory peak’; and ii A calculation of the ‘realistic’ present value of the insurer’s expected future contractual liabilities together with projected ‘fair’ discretionary bonuses
to policyholders, plus a risk capital margin, together known as the ‘realistic peak’.
Available capital of the with-profits sub-fund and Scottish
Amicable Insurance Fund of £7.2 billion (2013: £8.0 billion) represents the excess of assets over liabilities on the PRA realistic basis. Unlike the previously discussed FRS 27 basis, realistic liabilities on the regulatory basis include
the shareholders’ share of future bonuses. These amounts are shown before deduction of the risk capital margin which is estimated to be £1.0 billion at 31 December 2014 (2013: £0.9 billion).
The PRA’s basis of setting the risk capital margin is to target a level broadly equivalent to a Standard & Poor’s credit rating of BBB and to judge this by
ensuring there are sufficient assets to absorb a one in 200 year event. The risk capital margin calculation achieves this by setting rules for the determination of margins to cover defined stress changes in asset values and yields for market risk,
credit risk and termination risk for with-profits policies.
PAC has discretion in its management actions in the case of adverse investment conditions. Management
actions encompass, but are not confined to, investment allocation decisions, levels of reversionary bonuses, crediting rates and total claim values.
Other UK life
assurance subsidiaries and funds
The available capital of £3,297 million (2013: £2,708 million) reflects the excess of regulatory basis assets
over liabilities of the subsidiaries and funds, before deduction of the capital resources requirement of £1,552 million (2013: £1,364 million).
The capital resources requirement for these companies broadly reflects a formula which, for active funds, equates to a percentage of regulatory reserves plus a
percentage of death strains. Death strains represent the payments made to policyholders upon death in excess of amounts explicitly allocated to fund the provisions for policyholder’s claims and maturities.
iv Group capital requirements
In addition to the requirements at individual Company level, PRA
requirements under the IGD apply additional prudential requirements for the Group as a whole. Discussion of the Group’s estimated IGD position at 31 December 2014, together with market risk sensitivity disclosure provided to key
management, is provided in the Strategic Report section of the Group’s 2014 Annual Report. Following ratification of the Solvency II Omnibus II Directive on 16 April 2014, Solvency II is expected to come into force on 1 January 2016
and will replace the existing IGD capital requirements.
e Transferability of available capital
For PAC and all other UK long-term insurers, long-term business assets and liabilities must, by law, be maintained in funds separate from those for the assets and liabilities
attributable to non-life insurance business or to shareholders. Only the ‘established surplus’, the excess of assets over liabilities in the long-term fund determined through a formal valuation, may be transferred so as to be available for
other purposes. Distributions from the with-profits sub-fund to shareholders reflect the shareholders’ one-ninth share of the cost of declared policyholders’ bonuses.
Accordingly, the excess of assets over liabilities of the PAC long-term fund is retained within that company. The retention of the capital enables it to support with-profits and
other business of the fund by, for example, providing the benefits associated with smoothing and guarantees. It also provides investment flexibility for the fund’s assets by meeting the regulatory capital requirements that demonstrate solvency
and by absorbing the costs of significant events or fundamental changes in its long-term business without affecting the bonus and investment policies.
For other UK
long-term business subsidiaries, the amounts retained within the companies are at levels which provide an appropriate level of capital strength in excess of the regulatory minimum.
For Jackson, capital retention is maintained at a level consistent with an appropriate rating by Standard & Poor’s. Currently Jackson is rated AA. Jackson can pay
dividends on its capital stock only out of earned surplus unless prior regulatory approval is obtained. Furthermore, dividends which exceed the greater of statutory net gain from operations for the prior year or 10 per cent of Jackson’s
prior year-end statutory surplus require prior regulatory approval.
For Asia subsidiaries, the amounts retained within the companies are at levels that provide an
appropriate level of capital strength in excess of the local regulatory minimum. For ring-fenced with-profits funds, the excess of assets over liabilities is retained with distribution tied to the shareholders’ share of bonuses through
declaration of actuarially determined surplus. The businesses in Asia may, in general, remit dividends to the UK, provided the statutory insurance fund meets the local regulatory solvency targets.
Available capital of the non-insurance business units is transferable to the life assurance businesses after taking account of an appropriate level of operating capital, based on
local regulatory solvency targets, over and above basis liabilities.

Prudential plc Annual Report 2014 253
f
Sensitivity of liabilities and total capital to changed market conditions and capital management policies
Prudential manages its assets, liabilities and capital
locally, in accordance with local regulatory requirements and reflecting the different types of liabilities Prudential has in each business. As a result of the diversity of products offered by Prudential and the different regulatory requirements in
which it operates, Prudential employs differing methods of asset/liability and capital management, depending on the business concerned.
Stochastic modelling of
assets and liabilities is undertaken in the UK, Jackson and Asia to assess the economic capital requirements. A stochastic approach models the inter-relationship between asset and liability movements, taking into account asset correlation,
management actions and policyholder behaviour under a large number of alternative economic scenarios.
In addition, reserve adequacy testing under a range of
scenarios and dynamic solvency testing is carried out, including under certain scenarios mandated by the UK, US and Asian regulators.
The sensitivity of
liabilities and other components of total capital vary depending upon the type of business concerned and this conditions the approach to asset/liability management.
For example, for businesses that are most sensitive to interest rate changes, such as immediate annuity business, Prudential uses cash flow analysis to create a
portfolio of debt securities whose value is expected to change in line with the value of liabilities when interest rates change. This type of analysis helps protect profits from changing interest rates and is used in the UK for annuity business and
by Jackson for its fixed interest rate and fixed index annuities and institutional products.
For businesses that are most sensitive to equity price changes,
Prudential uses stochastic modelling and scenario testing to look at the future returns on its investments under different scenarios which best reflect the large diversity in returns that equities can produce. This allows Prudential to devise an
investment and with-profits policyholder bonus strategy that, based on the model assumptions, allows it to optimise returns to its policyholders and shareholders over time while maintaining appropriate financial strength. Prudential uses this
methodology extensively in connection with its UK with-profits business.
g Intra-group arrangements in respect of the Scottish Amicable Insurance Fund
Should the assets of the Scottish Amicable Insurance Fund be inadequate to meet the guaranteed benefit obligations of the policyholders of the Scottish Amicable Insurance Fund, the
PAC long-term fund would be liable to cover any such deficiency in the first instance.
C11.2 Asset management operations – regulatory and other surplus
Certain asset management subsidiaries of the Group are subject to regulatory requirements. The movement in the year of the surplus regulatory capital position of
those subsidiaries, combined with the movement in the IFRS basis shareholders’ funds for unregulated asset management operations, is as follows:
Asset
management operations
2014 £m 2013 £m
M&G including
Prudential Eastspring
Capital US Investments Total Total
Regulatory and other surplus
Beginning of year 309 134 129 572 513
Gains during the year 296 20 80 396 424
Movement in capital requirement(26) –(8)(34)(4)
Capital injection 1 – – 1 8
Distributions made to the parent
company(342)(5)(62)(409)(365)
Exchange movement – 8 – 8(4)
End of
year 238 157 139 534 572
Financial statements C: Balance sheet notes
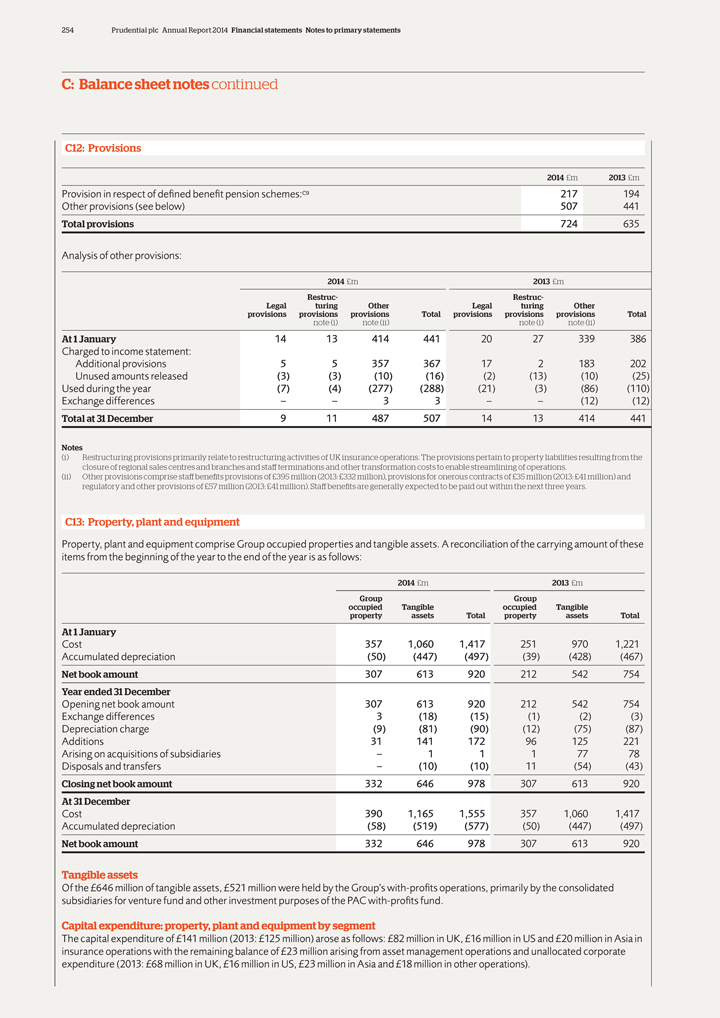
254 Prudential plc Annual Report 2014 Financial statements Notes to primary statements
C: Balance sheet notes continued
C12: Provisions
2014 £m 2013 £m
Provision in respect of defined benefit pension schemes:C9 217 194
Other provisions (see below) 507 441
Total provisions 724 635
Analysis of other provisions:
2014 £m 2013 £m
Restruc- Restruc-
Legal turing Other Legal turing Other
provisions provisions provisions Total provisions provisions provisions Total
note
(i) note (ii) note (i) note (ii)
At 1 January 14 13 414 441 20 27 339 386
Charged to income statement:
Additional provisions 5 5 357 367 17 2 183 202
Unused amounts released(3)(3)(10)(16)(2)(13)(10)(25)
Used during the
year(7)(4)(277)(288)(21)(3)(86)(110)
Exchange differences – – 3 3 – –(12)(12)
Total at 31 December 9 11 487 507 14 13 414 441
Notes
(i) Restructuring provisions primarily relate to restructuring activities of UK insurance operations. The provisions pertain to property liabilities resulting from the closure of
regional sales centres and branches and staff terminations and other transformation costs to enable streamlining of operations.
(ii) Other provisions comprise
staff benefits provisions of £395 million (2013: £332 million), provisions for onerous contracts of £35 million (2013: £41 million) and regulatory and other provisions of £57 million (2013: £41
million). Staff benefits are generally expected to be paid out within the next three years.
C13: Property, plant and equipment
Property, plant and equipment comprise Group occupied properties and tangible assets. A reconciliation of the carrying amount of these items from the beginning of the year to the
end of the year is as follows:
2014 £m 2013 £m
Group Group
occupied Tangible occupied Tangible
property assets Total property assets
Total
At 1 January
Cost 357 1,060 1,417 251 970 1,221
Accumulated depreciation(50)(447)(497)(39)(428)(467)
Net book amount 307 613 920 212 542 754
Year ended 31 December
Opening net book amount 307 613 920 212 542 754
Exchange differences 3(18)(15)(1)(2)(3)
Depreciation
charge(9)(81)(90)(12)(75)(87)
Additions 31 141 172 96 125 221
Arising on
acquisitions of subsidiaries – 1 1 1 77 78
Disposals and transfers –(10)(10) 11(54)(43)
Closing net book amount 332 646 978 307 613 920
At 31 December
Cost 390 1,165 1,555 357 1,060 1,417
Accumulated depreciation(58)(519)(577)(50)(447)(497)
Net book amount 332 646 978 307 613 920
Tangible assets
Of the £646 million of tangible assets, £521 million were held by the Group’s with-profits operations, primarily by the consolidated subsidiaries for
venture fund and other investment purposes of the PAC with-profits fund.
Capital expenditure: property, plant and equipment by segment
The capital expenditure of £141 million (2013: £125 million) arose as follows: £82 million in UK, £16 million in US and
£20 million in Asia in insurance operations with the remaining balance of £23 million arising from asset management operations and unallocated corporate expenditure (2013: £68 million in UK, £16 million in
US, £23 million in Asia and £18 million in other operations).
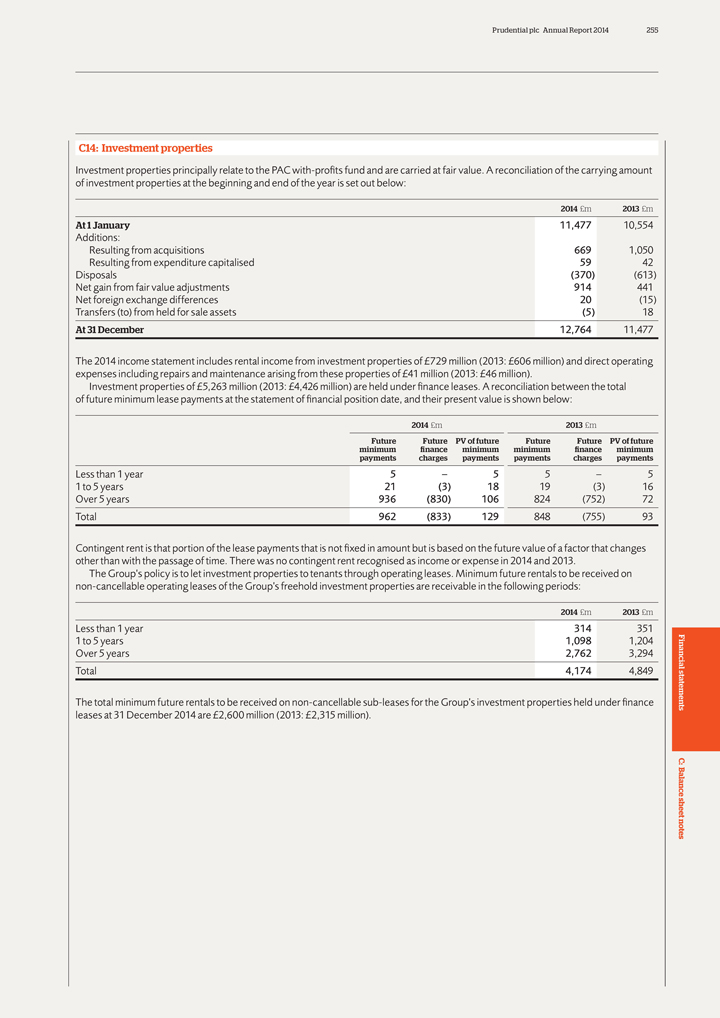
Prudential plc Annual Report 2014 255
C14:
Investment properties
Investment properties principally relate to the PAC with-profits fund and are carried at fair value. A reconciliation of the carrying amount
of investment properties at the beginning and end of the year is set out below:
2014 £m 2013 £m
At 1 January 11,477 10,554
Additions:
Resulting from acquisitions 669 1,050
Resulting from expenditure capitalised 59 42
Disposals(370)(613)
Net gain from fair value adjustments 914 441
Net foreign exchange differences 20(15)
Transfers (to) from held for sale assets(5) 18
At 31 December 12,764 11,477
The 2014 income statement includes
rental income from investment properties of £729 million (2013: £606 million) and direct operating expenses including repairs and maintenance arising from these properties of £41 million (2013: £46 million).
Investment properties of £5,263 million (2013: £4,426 million) are held under finance leases. A reconciliation between the total of future minimum
lease payments at the statement of financial position date, and their present value is shown below:
2014 £m 2013 £m
Future Future PV of future Future Future PV of future
minimum finance minimum minimum finance
minimum
payments charges payments payments charges payments
Less than 1 year
5 – 5 5 – 5
| 1 | to 5 years 21(3) 18 19(3) 16 |
Over 5 years 936(830) 106 824(752) 72
Total 962(833) 129 848(755) 93
Contingent rent is that portion of the lease payments that is not fixed in amount but is based on the future value of a factor that changes other than with the passage of time.
There was no contingent rent recognised as income or expense in 2014 and 2013.
The Group’s policy is to let investment properties to tenants through operating
leases. Minimum future rentals to be received on non-cancellable operating leases of the Group’s freehold investment properties are receivable in the following periods:
The total minimum future rentals to be received on non-cancellable sub-leases for the Group’s investment properties held under finance leases at 31 December 2014 are
£2,600 million (2013: £2,315 million).
Financial statements C: Balance sheet notes
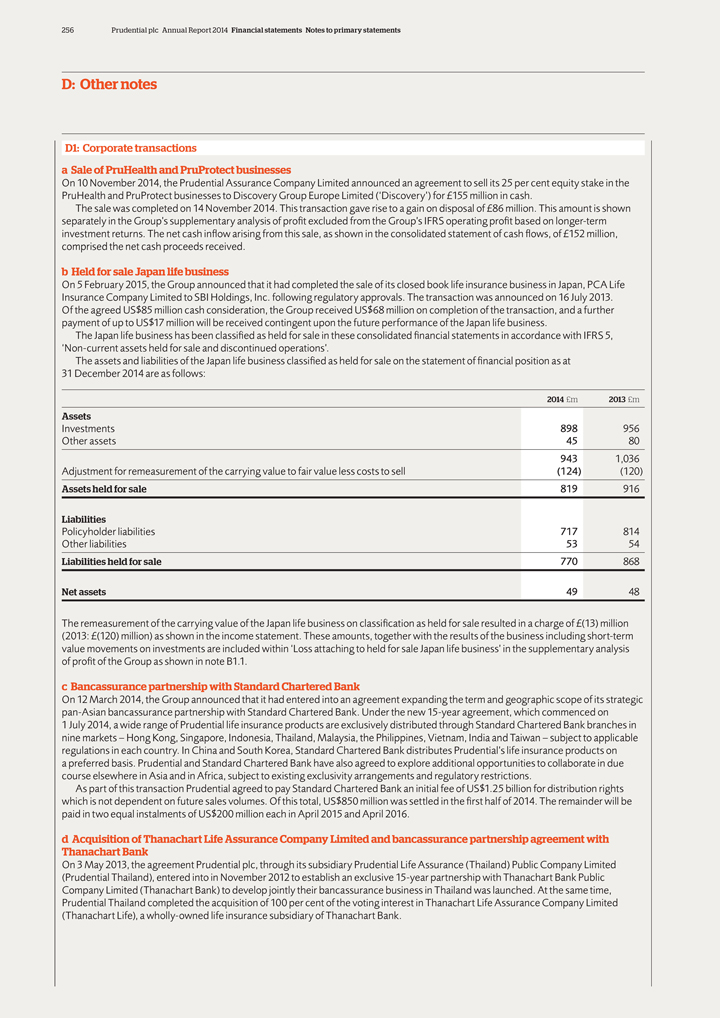
256 Prudential plc Annual Report 2014 Financial statements Notes to primary statements
D: Other notes
D1: Corporate transactions a Sale of PruHealth and PruProtect businesses
On 10 November 2014, the Prudential Assurance Company Limited announced an agreement to sell its 25 per cent equity stake in the PruHealth and PruProtect
businesses to Discovery Group Europe Limited (‘Discovery’) for £155 million in cash.
The sale was completed on 14 November 2014. This
transaction gave rise to a gain on disposal of £86 million. This amount is shown separately in the Group’s supplementary analysis of profit excluded from the Group’s IFRS operating profit based on longer-term investment returns. The
net cash inflow arising from this sale, as shown in the consolidated statement of cash flows, of £152 million, comprised the net cash proceeds received.
b Held for sale Japan life business
On 5 February 2015, the Group
announced that it had completed the sale of its closed book life insurance business in Japan, PCA Life Insurance Company Limited to SBI Holdings, Inc. following regulatory approvals. The transaction was announced on 16 July 2013. Of the agreed
US$85 million cash consideration, the Group received US$68 million on completion of the transaction, and a further payment of up to US$17 million will be received contingent upon the future performance of the Japan life business.
The Japan life business has been classified as held for sale in these consolidated financial statements in accordance with IFRS 5, ‘Non-current assets held for sale and
discontinued operations’.
The assets and liabilities of the Japan life business classified as held for sale on the statement of financial position as at
31 December 2014 are as follows:
2014 £m 2013 £m
Assets
Investments 898 956
Other assets 45 80
943 1,036
Adjustment for remeasurement of the carrying value to fair value less costs to sell(124)(120)
Assets held for sale 819 916
Liabilities
Policyholder liabilities 717 814
Other liabilities 53 54
Liabilities held for sale 770 868
Net assets 49 48
The remeasurement of the carrying value of the Japan life business on classification as held for sale resulted in a charge of £(13) million (2013:
£(120) million) as shown in the income statement. These amounts, together with the results of the business including short-term value movements on investments are included within ‘Loss attaching to held for sale Japan life
business’ in the supplementary analysis of profit of the Group as shown in note B1.1.
c Bancassurance partnership with Standard Chartered Bank
On 12 March 2014, the Group announced that it had entered into an agreement expanding the term and geographic scope of its strategic pan-Asian bancassurance partnership with
Standard Chartered Bank. Under the new 15-year agreement, which commenced on 1 July 2014, a wide range of Prudential life insurance products are exclusively distributed through Standard Chartered Bank branches in nine markets – Hong Kong,
Singapore, Indonesia, Thailand, Malaysia, the Philippines, Vietnam, India and Taiwan – subject to applicable regulations in each country. In China and South Korea, Standard Chartered Bank distributes Prudential’s life insurance products on
a preferred basis. Prudential and Standard Chartered Bank have also agreed to explore additional opportunities to collaborate in due course elsewhere in Asia and in Africa, subject to existing exclusivity arrangements and regulatory restrictions.
As part of this transaction Prudential agreed to pay Standard Chartered Bank an initial fee of US$1.25 billion for distribution rights which is not dependent on
future sales volumes. Of this total, US$850 million was settled in the first half of 2014. The remainder will be paid in two equal instalments of US$200 million each in April 2015 and April 2016.
d Acquisition of Thanachart Life Assurance Company Limited and bancassurance partnership agreement with Thanachart Bank
On 3 May 2013, the agreement Prudential plc, through its subsidiary Prudential Life Assurance (Thailand) Public Company Limited (Prudential Thailand), entered into in November
2012 to establish an exclusive 15-year partnership with Thanachart Bank Public Company Limited (Thanachart Bank) to develop jointly their bancassurance business in Thailand was launched. At the same time, Prudential Thailand completed the
acquisition of 100 per cent of the voting interest in Thanachart Life Assurance Company Limited (Thanachart Life), a wholly-owned life insurance subsidiary of Thanachart Bank.
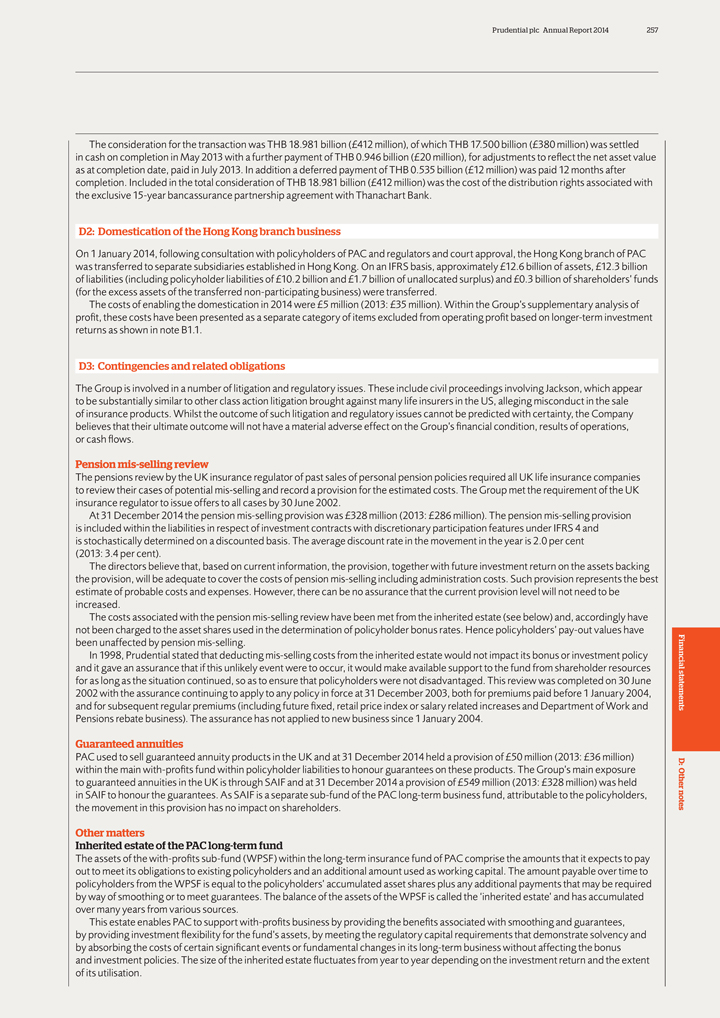
Prudential plc Annual Report 2014 257
The
consideration for the transaction was THB 18.981 billion (£412 million), of which THB 17.500 billion (£380 million) was settled in cash on completion in May 2013 with a further payment of THB 0.946 billion (£20 million), for
adjustments to reflect the net asset value as at completion date, paid in July 2013. In addition a deferred payment of THB 0.535 billion (£12 million) was paid 12 months after completion. Included in the total consideration of THB 18.981
billion (£412 million) was the cost of the distribution rights associated with the exclusive 15-year bancassurance partnership agreement with Thanachart Bank.
D2: Domestication of the Hong Kong branch business
On 1 January 2014,
following consultation with policyholders of PAC and regulators and court approval, the Hong Kong branch of PAC was transferred to separate subsidiaries established in Hong Kong. On an IFRS basis, approximately £12.6 billion of assets,
£12.3 billion of liabilities (including policyholder liabilities of £10.2 billion and £1.7 billion of unallocated surplus) and £0.3 billion of shareholders’ funds (for the excess assets of the transferred
non-participating business) were transferred.
The costs of enabling the domestication in 2014 were £5 million (2013: £35 million). Within the
Group’s supplementary analysis of profit, these costs have been presented as a separate category of items excluded from operating profit based on longer-term investment returns as shown in note B1.1.
D3: Contingencies and related obligations
The Group is involved in a number of litigation and
regulatory issues. These include civil proceedings involving Jackson, which appear to be substantially similar to other class action litigation brought against many life insurers in the US, alleging misconduct in the sale of insurance products.
Whilst the outcome of such litigation and regulatory issues cannot be predicted with certainty, the Company believes that their ultimate outcome will not have a material adverse effect on the Group’s financial condition, results of operations,
or cash flows.
Pension mis-selling review
The pensions review by the UK
insurance regulator of past sales of personal pension policies required all UK life insurance companies to review their cases of potential mis-selling and record a provision for the estimated costs. The Group met the requirement of the UK insurance
regulator to issue offers to all cases by 30 June 2002.
At 31 December 2014 the pension mis-selling provision was £328 million (2013:
£286 million). The pension mis-selling provision is included within the liabilities in respect of investment contracts with discretionary participation features under IFRS 4 and is stochastically determined on a discounted basis. The average
discount rate in the movement in the year is 2.0 per cent (2013: 3.4 per cent).
The directors believe that, based on current information, the provision,
together with future investment return on the assets backing the provision, will be adequate to cover the costs of pension mis-selling including administration costs. Such provision represents the best estimate of probable costs and expenses.
However, there can be no assurance that the current provision level will not need to be increased.
The costs associated with the pension mis-selling review have
been met from the inherited estate (see below) and, accordingly have not been charged to the asset shares used in the determination of policyholder bonus rates. Hence policyholders’ pay-out values have been unaffected by pension mis-selling.
In 1998, Prudential stated that deducting mis-selling costs from the inherited estate would not impact its bonus or investment policy and it gave an assurance that
if this unlikely event were to occur, it would make available support to the fund from shareholder resources for as long as the situation continued, so as to ensure that policyholders were not disadvantaged. This review was completed on 30 June
2002 with the assurance continuing to apply to any policy in force at 31 December 2003, both for premiums paid before 1 January 2004, and for subsequent regular premiums (including future fixed, retail price index or salary related
increases and Department of Work and Pensions rebate business). The assurance has not applied to new business since 1 January 2004.
Guaranteed annuities
PAC used to sell guaranteed annuity products in the UK and at 31 December 2014 held a provision of £50 million (2013: £36 million) within the
main with-profits fund within policyholder liabilities to honour guarantees on these products. The Group’s main exposure to guaranteed annuities in the UK is through SAIF and at 31 December 2014 a provision of £549 million
(2013: £328 million) was held in SAIF to honour the guarantees. As SAIF is a separate sub-fund of the PAC long-term business fund, attributable to the policyholders, the movement in this provision has no impact on shareholders.
Other matters
Inherited estate of the PAC long-term fund
The assets of the with-profits sub-fund (WPSF) within the long-term insurance fund of PAC comprise the amounts that it expects to pay out to meet its obligations to existing
policyholders and an additional amount used as working capital. The amount payable over time to policyholders from the WPSF is equal to the policyholders’ accumulated asset shares plus any additional payments that may be required by way of
smoothing or to meet guarantees. The balance of the assets of the WPSF is called the ‘inherited estate’ and has accumulated over many years from various sources.
This estate enables PAC to support with-profits business by providing the benefits associated with smoothing and guarantees, by providing investment flexibility for the fund’s
assets, by meeting the regulatory capital requirements that demonstrate solvency and by absorbing the costs of certain significant events or fundamental changes in its long-term business without affecting the bonus and investment policies. The size
of the inherited estate fluctuates from year to year depending on the investment return and the extent of its utilisation.
Financial statements D: Other notes
258 Prudential plc Annual Report 2014 Financial statements Notes to primary statements
D: Other notes continued
D3: Contingencies and related obligations continued Support for
long-term business funds by shareholders’ funds
As a proprietary insurance company, PAC is liable to meet its obligations to policyholders even if the assets
of the long-term funds are insufficient to do so. The assets, represented by the unallocated surplus of with-profits funds, in excess of amounts expected to be paid for future terminal bonuses and related shareholder transfers (‘the excess
assets’) in the long-term funds could be materially depleted over time by, for example, a significant or sustained equity market downturn, costs of significant fundamental strategic change or a material increase in the pension mis-selling
provision. In the unlikely circumstance that the depletion of the excess assets within the long-term fund was such that the Group’s ability to satisfy policyholders’ reasonable expectations was adversely affected, it might become necessary
to restrict the annual distribution to shareholders or to contribute shareholders’ funds to the long-term funds to provide financial support.
In 1997, the
business of Scottish Amicable Life Assurance Society, a mutual society, was transferred to PAC with the creation of a separate sub-fund, SAIF within PAC’s long-term business fund containing all the with-profits business and all other pension
business that was transferred. No new business has been or will be written in the sub-fund and it is managed to ensure that all the invested assets are distributed to SAIF policyholders over the lifetime of SAIF policies. With the exception of
certain amounts in respect of the unitised with-profits life business, all future earnings arising in SAIF are retained for SAIF policyholders. Any excess (deficiency) of revenue over expense within SAIF during a period is attributable to the
policyholders of the fund. Shareholders have no interest in the profits of SAIF but are entitled to the asset management fees paid on this business.
SAIF
with-profits policies contain minimum levels of guaranteed benefit to policyholders. In addition, as mentioned earlier in this note, certain pensions products have guaranteed annuity rates at retirement. Should the assets of SAIF be inadequate to
meet the guaranteed benefit obligations of the policyholders of SAIF, the PAC long-term fund would be liable to cover any such deficiency in the first instance.
Unclaimed Property Provision
Jackson has received regulatory enquiries on an
industry-wide matter regarding claims settlement practices and compliance with unclaimed property laws. Concurrently, some regulators and state legislatures have required life insurance companies to take additional steps to identify unreported
deceased policy and contract holders. Additionally, numerous states are contracting with independent firms to perform specific unclaimed property audits or targeted market conduct examinations covering claims settlement practices and procedures for
escheating unclaimed property. Any regulatory audits, related examination activity and internal reviews may result in additional payments to beneficiaries, escheatment of funds (ie reversion of funds to the state) deemed abandoned under state laws,
administrative penalties and changes in Jackson’s procedures for the identification of unreported claims and handling of escheatable property.
Jackson
continually reviews active and recently terminated policies compared to vendors’ databases of known deaths. At 31 December 2014, Jackson has accrued £13 million to cover any such liability.
Guarantees and commitments
Guarantee funds in both the UK and the US provide for payments to
be made to policyholders on behalf of insolvent life insurance companies and are financed by payments assessed on solvent insurance companies based on location, volume and types of business. The Group estimated its reserve for future guarantee fund
assessments for Jackson, included within other liabilities to be £3 million at
31 December 2014 (2013: £13 million). Similar assessments for
the UK businesses were not significant. The directors believe that the reserve is adequate for all anticipated payments for known insolvencies.
At 31 December
2014, Jackson has unfunded commitments of £332 million (2013: £298 million) related to its investments in limited partnerships and £73 million (2013: £132 million) related to commercial mortgage loans. These
commitments were entered into in the normal course of business and the directors do not expect a material adverse impact on the operations to arise from them.
The
Group has provided other guarantees and commitments to third parties entered into in the normal course of business but the Company does not consider that the amounts involved are significant.
Intra-group capital support arrangements
Prudential and PAC have put in place intra-group
arrangements to formalise circumstances in which capital support would be made available by Prudential (including in the scenarios referred to in pension mis-selling review above). While Prudential considers it unlikely that such support will be
required, the arrangements are intended to provide additional comfort to PAC and its policyholders.
In addition, Prudential has put in place intra-group
arrangements to formalise undertakings by Prudential to the regulators of the Hong Kong subsidiaries, which from 1 January 2014, contain the domesticated branch business from PAC as noted in note D2 regarding their solvency levels. In addition,
the scheme of transfer of the Hong Kong branch includes short-term support arrangements between Prudential and PAC to underpin similar arrangements between PAC and the newly domesticated business. It is considered unlikely that support will need to
be provided under these arrangements.
Prudential plc Annual Report 2014 259
D4: Post
balance sheet events
Completion of the sale of Japan life business
On
5 February 2015, the Group announced that it had completed the sale of its closed book life insurance business in Japan, as described further in note D1(b).
Final dividend
The 2014 final dividend approved by the Board of Directors
after 31 December 2014 is as described in note B7.
D5: Subsidiary undertakings a Principal subsidiaries
The principal subsidiary undertakings (those undertakings whose results or financial position, in the opinion of the directors, principally affected the Group’s results or
financial position) of the Group at 31 December 2014 are disclosed in note 5 ‘Investments of the Company’ of the parent company financial statements.
Details of all Prudential subsidiaries, joint ventures and associates will be annexed to the next Annual Returns of Prudential plc filed with the UK Registrar of
Companies.
b Dividend restrictions and minimum capital requirements
Certain
Group subsidiaries and joint ventures are subject to restrictions on the amount of funds they may transfer in the form of cash dividends or otherwise to the parent company.
Under UK company law, UK companies can only declare dividends if they have sufficient distributable reserves. Further, UK insurance companies are required to maintain solvency
margins in accordance with the rules of the Prudential Regulation Authority. The Group UK asset management company, M&G Investment Management Ltd is also required to maintain capital in accordance with regulatory requirements before making any
distribution to the parent company.
Jackson is subject to state laws that limit the dividends payable to its parent company based on statutory capital and surplus
and prior year earnings. Dividends in excess of these limitations require prior regulatory approval.
The Group’s subsidiaries and joint ventures in Asia may
remit dividends to the Group, in general, provided the statutory insurance fund meets the capital adequacy standard required under local statutory regulations and has sufficient distributable reserves.
The Group capital position statement for life assurance businesses is set out in note C11.1, showing the available capital reflecting the excess of regulatory basis over
liabilities for each fund or group of companies determined by reference to the local regulation of the subsidiaries. In addition, disclosure is also provided in note C11.1 of the local capital requirement of the principal funds and companies.
D6: Investments in joint ventures and associates
Joint ventures represent
arrangements where the controlling parties through contractual or other agreement have the rights to the net assets of the arrangements. The Group has shareholder-backed joint venture insurance and asset management businesses in China with CITIC
Group, and in India with ICICI Bank. In addition, there is an asset management joint venture in Hong Kong with Bank of China International Holdings Limited (BOCI) and Takaful general and life insurance joint venture in Malaysia.
The Group has various joint ventures relating to property investments held by the PAC with-profits fund. The results of these joint ventures are reflected in the movement in the
unallocated surplus of the PAC with-profits funds and therefore do not affect shareholders’ results.
As a consequence of adoption of IFRS 11 ‘Joint
Arrangements’ from 1 January 2013, the Group’s joint ventures are accounted for by using the equity method. For these operations the net of tax results are included in the Group’s profit before tax.
The investments in these joint ventures have the same accounting year end as the Group, except for joint ventures in India. Although these entities have reporting periods ending
31 March, 12 months of financial information up to 31 December is recorded. Accordingly, the information covers the same period as that of the Group.
The
Group’s associates, which are also accounted for under the equity method, include PPM South Africa and PruHealth (until its sale in 2014, see note D1). In addition, the Group has investments in Open-Ended Investment Companies (OEICs), unit
trusts, funds holding collateralised debt obligations, property unit trusts and venture capital investments of the PAC with-profits funds where the Group has significant influence. As allowed under IAS 28, these investments are accounted for on a
fair value through profit or loss basis. The aggregate fair value of associates accounted for at fair value through profit or loss where there are published price quotations is approximately £1.2 billion at 31 December 2014 (2013:
£0.5 billion).
The Group’s share of the profits, net of related tax, and carrying amount of interest in joint ventures and associates, which are equity
accounted as shown in the consolidated income statement comprises the following:
Joint ventures Associates
2014 £m 2013 £m 2014 £m 2013 £m
Shareholder-backed business 162 52 12
7
PAC with-profits fund (prior to offsetting effect in
movement in
unallocated surplus) 129 88 – –
Total 291 140 12 7
Financial
statements D: Other notes
260 Prudential plc Annual Report 2014 Financial statements Notes to primary statements
D: Other notes continued
D6: Investments in joint ventures and associates continued
There is no other comprehensive income in the joint ventures and associates. There have been no unrecognised share of losses of a joint venture or associate that
the Group has stopped recognising in the total income.
The joint ventures have no significant contingent liabilities or capital commitments to which the Group is
exposed nor does the Group have any significant contingent liabilities or capital commitments in relation to its interests in the joint ventures.
D7: Related party
transactions
Transactions between the Company and its subsidiaries are eliminated on consolidation.
In addition, the Company has transactions and outstanding balances with certain unit trusts, Open-Ended Investment Companies (OEICs), collateralised debt obligations and similar
entities which are not consolidated and where a Group company acts as manager which are regarded as related parties for the purposes of IAS 24. The balances are included in the Group’s statement of financial position sheet at fair value or
amortised cost in accordance with their IAS 39 classifications. The transactions are included in the income statement and include amounts paid on issue of shares or units, amounts received on cancellation of shares or units and paid in respect of
the periodic charge and administration fee.
Further, following the adoption of IFRS 11 in 2013, the Group’s investments in joint ventures are now accounted
for on an equity method basis. There are no material transactions between these joint ventures and other Group companies.
Executive officers and directors of the
Company may from time to time purchase insurance, asset management or annuity products marketed by Group companies in the ordinary course of business on substantially the same terms as those prevailing at the time for comparable transactions with
other persons.
In 2014 and 2013, other transactions with directors were not deemed to be significant both by virtue of their size and in the context of the
directors’ financial positions. All of these transactions are on terms broadly equivalent to those that prevail in arm’s length transactions.
Apart from
these transactions with directors, no director had interests in shares, transactions or arrangements that require disclosure, other than those given in the directors’ remuneration report. Key management remuneration is disclosed in note B3.3.
D8: Commitments
Operating leases and capital commitments
The Group leases various offices to conduct its business. Leases in which a significant portion of the risks and rewards of ownership are retained by the lessor are classified as
operating leases. Payments made under operating leases (net of any incentives received from the lessor) are charged to the income statement on a straight-line basis over the period of the lease.
2014 £m 2013 £m
Future minimum lease payments for non-cancellable operating leases
fall due during the following periods:
Not later than 1 year 89 110
Later
than 1 year and not later than 5 years 214 308
Later than 5 years 105 333
Future minimum sub-lease rentals received for non-cancellable operating leases for land and buildings 17 20
Minimum lease rental payments included in consolidated income statement 95 92
In addition, the
Group has provided, from time to time, certain guarantees and commitments to third parties including funding the purchase or development of land and buildings and other related matters. The contractual obligations to purchase or develop investment
properties at 31 December 2014 were £232 million (2013: £92 million).
Prudential plc Annual Report 2014 261
Balance
sheet of the parent company
| 31 | December Note 2014 £m 2013 £m |
Fixed assets
Investments:
Shares in subsidiary undertakings 5 5,373 18,216
Loans to subsidiary undertakings 5 6,329
1,497
11,702 19,713
Current assets
Debtors:
Amounts owed by subsidiary undertakings 3,785 3,706
Other debtors 3 3
Deferred tax 6 8 9
Derivative assets 8 2 3
Cash at bank and in hand 7 224
3,805 3,945
Liabilities: amounts falling due within one year
Commercial paper 7(1,704)(1,634)
Other borrowings 7(500)(200)
Derivative liabilities 8(315)(199)
Amounts owed to subsidiary undertakings(1,108)(2,462)
Tax payable(55)(60)
Sundry creditors(3)(4)
Accruals and deferred income(39)(40)
(3,724)(4,599)
Net current assets (liabilities) 81(654)
Total assets less current liabilities 11,783 19,059
Liabilities: amounts falling due after more than one year
Subordinated
liabilities 7(3,320)(3,662)
Debenture loans 7(549)(549)
Other borrowings 7
–(299)
Amounts owed to subsidiary undertakings 5 –(7,227)
(3,869)(11,737)
Total net assets (excluding pension) 7,914 7,322
Pension asset (net of related deferred tax) 9 31 30
Total net assets (including pension) 7,945
7,352
Capital and reserves
Share capital 10 128 128
Share premium 10 1,908 1,895
Profit and loss account 11 5,909 5,329
Shareholders’ funds 11 7,945 7,352
The financial statements of the parent company on
pages 261 to 269 were approved by the Board of Directors on 9 March 2015 and signed on its behalf.
Paul Manduca Tidjane Thiam Nic Nicandrou
Chairman Group Chief Executive Chief Financial Officer
Financial statements Parent company
262 Prudential plc Annual Report 2014 Financial statements Notes on the parent company financial statements
Notes on the parent company financial statements
| 1 | Nature of operations |
Prudential plc (the ‘Company’) is a parent holding company. The Company, together with its subsidiaries (collectively the ‘Group’), is an international financial services group with its principal operations in Asia, the US and the UK. In Asia, the Group has operations in Hong Kong, Indonesia, Malaysia, Singapore and other countries. In the US, the Group’s principal subsidiary is Jackson National Life Insurance Company. In the UK, the Group operates through its subsidiaries, primarily The Prudential Assurance Company Limited, Prudential Retirement Income Limited and M&G Investment Management Limited.
| 2 | Basis of preparation |
The financial statements of the Company, which comprise the balance sheet and related notes, are prepared in accordance with Part 15 of the Companies Act 2006. The Company
has taken advantage of the exemption under Section 408 of the Companies Act 2006 from presenting its own profit and loss account.
The financial statements are
prepared in accordance with applicable accounting standards under UK Generally Accepted Accounting Practice (UK GAAP), including Financial Reporting Standards (FRS) and Statements of Standard Accounting Practice (SSAP).
The Company has not prepared a cash flow statement on the basis that its cash flow is included within the cash flow statement in the consolidated financial statements. The Company
has also taken advantage of the exemption within FRS 29, ‘Financial Instruments: Disclosures’, from the requirements of this standard, because the Company’s results are included in the publicly available consolidated financial
statements of the Group that include disclosures that comply with IFRS 7, ‘Financial Instruments: Disclosures’, which is equivalent to FRS 29.
| 3 | Significant accounting policies Shares in subsidiary undertakings |
Shares in subsidiary undertakings are shown at the lower of cost and estimated realisable value.
Loans to subsidiary undertakings
Loans to subsidiary undertakings are shown at cost, less
provisions.
Derivatives
Derivative financial instruments are held to manage
certain macroeconomic exposures. Derivative financial instruments are carried at fair value with changes in fair value included in the profit and loss account.
Borrowings
Borrowings are initially recognised at fair value, net of
transaction costs, and subsequently accounted for on an amortised cost basis using the effective interest method. Under the effective interest method, the difference between the redemption value of the borrowing and the initial proceeds, net of
transaction costs, is amortised through the profit and loss account to the date of maturity, or, for subordinated debt, over the expected life of the instrument.
Dividends
Interim dividends are recorded in the period in which they are
paid. Final dividends are recorded in the period in which they are approved by shareholders.
Share premium
The difference between the proceeds received on issue of shares and the nominal value of the shares issued is credited to the share premium account.
Foreign currency translation
Assets and liabilities denominated in foreign currencies,
including borrowings that have been used to finance or provide a hedge against Group equity investments in overseas subsidiaries, are translated at year end exchange rates. The impact of these currency translations is recorded within the profit and
loss account for the year.
Prudential plc Annual Report 2014 263
Tax
Current tax expense is charged or credited to operations based upon amounts estimated to be payable or recoverable as a result of taxable operations for the
current year. To the extent that losses of an individual UK company are not offset in any one year, they can be carried back for one year or carried forward indefinitely to be offset against profits arising from the same company.
Deferred tax assets and liabilities are recognised in accordance with the provisions of FRS 19, ’Deferred tax’. The Company has chosen not to apply the option available
of recognising such assets and liabilities on a discounted basis to reflect the time value of money. Except as set out in FRS 19, deferred tax is recognised in respect of all timing differences that have originated but not reversed by the balance
sheet date. Deferred tax assets are recognised to the extent that it is regarded as more likely than not that they will be recovered.
The Group’s UK
subsidiaries each file separate tax returns. In accordance with UK tax legislation, where one domestic UK company is a 75 per cent owned subsidiary of another UK company, or both are 75 per cent owned subsidiaries of a common parent, the
companies are considered to be within the same UK tax group. For companies within the same tax group, trading profits and losses arising in the same accounting period may be offset for the purposes of determining current and deferred taxes.
Pensions
The Company assumes a portion of the pension surplus or deficit of
the Group’s main pension scheme, the Prudential Staff Pension Scheme (‘PSPS’) and applied the requirements of FRS 17 ‘Retirement Benefits’ (as amended in December 2006) to its interest in the PSPS surplus or deficit. Further
details are disclosed in note 9.
A pension surplus or deficit is recorded as the difference between the present value of the scheme liabilities and the fair value
of the scheme assets. The Company’s share of pension surplus is recognised to the extent that the Company is able to recover a surplus either through reduced contributions in the future or through refunds from the scheme.
The assets and liabilities of the defined benefit pension schemes of the Prudential Group are subject to a full triennial actuarial valuation using the projected unit method.
Estimated future cash flows are then discounted at a high-quality corporate bond rate, adjusted to allow for the difference in duration between the bond index and the pension liabilities where appropriate, to determine their present value. These
calculations are performed by independent actuaries.
The aggregate of the actuarially determined service costs of the currently employed personnel and the unwind
of the discount on liabilities at the start of the period, gains and losses on settlements and curtailments, less the expected investment return on the scheme assets at the start of the period, is recognised in the profit and loss account. To the
extent that part or all of the Company’s interest in the pension surplus is not recognised as an asset, the unrecognised surplus is initially applied to extinguish any past service costs, losses on settlements or curtailments that would
otherwise be included in the profit and loss account. Next, the expected investment return on the scheme’s assets is restricted so that it does not exceed the total of the current service cost, interest cost and any increase in the recoverable
surplus. Any further adjustment for the unrecognised surplus is treated as an actuarial gain or loss.
Actuarial gains and losses as a result of the changes in
assumptions, the difference between actual and expected investment return on scheme assets and experience variances are recorded in the statement of total recognised gains and losses. Actuarial gains and losses also include adjustment for
unrecognised pension surplus as described above.
Share-based payment
The
Group offers share award and option plans for certain key employees and a Save As You Earn (‘SAYE’) plan for all UK and certain overseas employees. The share-based payment plans operated by the Group are mainly equity-settled plans with a
few cash-settled plans.
Under FRS 20 ‘Share-based Payment’, where the Company, as the parent company, has the obligation to settle the options or awards
of its equity instruments to employees of its subsidiary undertakings, and such share-based payments are accounted for as equity-settled in the Group financial statements, the Company records an increase in the investment in subsidiary undertakings
for the value of the share options and awards granted with a corresponding credit entry recognised directly in equity. The value of the share options and awards granted is based upon the fair value of the options and awards at the grant date, the
vesting period and the vesting conditions.
Financial statements Parent company
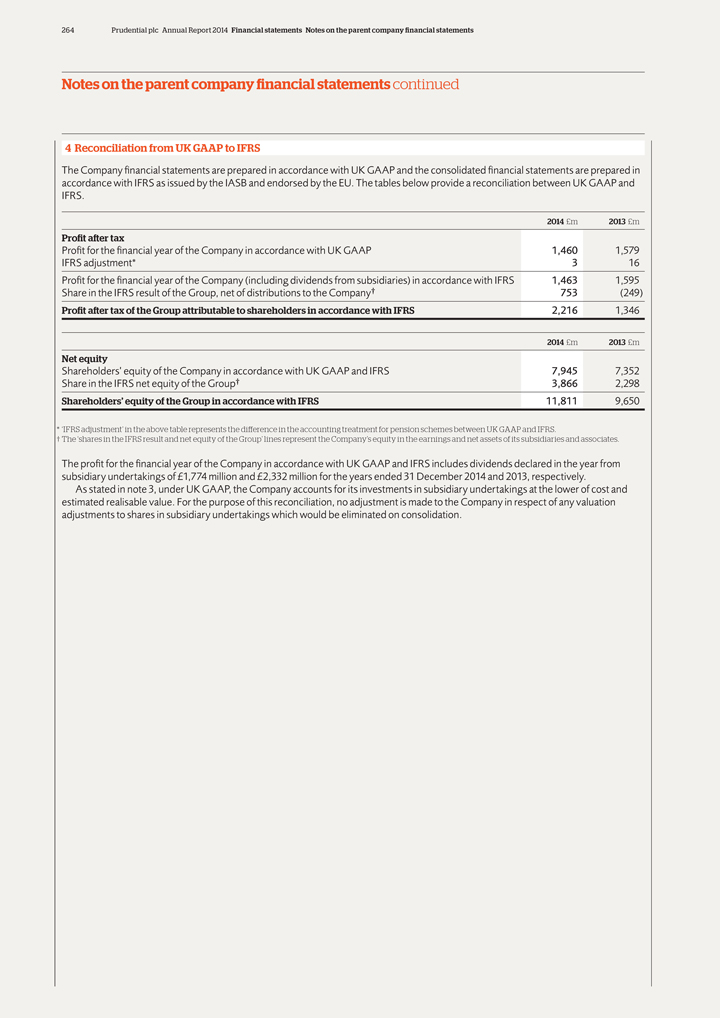
264 Prudential plc Annual Report 2014 Financial statements Notes on the parent company financial statements
Notes on the parent company financial statements continued
| 4 | Reconciliation from UK GAAP to IFRS |
The Company financial statements are prepared in accordance with UK GAAP and the consolidated financial statements are prepared in accordance with IFRS as issued by
the IASB and endorsed by the EU. The tables below provide a reconciliation between UK GAAP and IFRS.
2014 £m 2013 £m
Profit after tax
Profit for the financial year of the Company in accordance with UK GAAP
1,460 1,579
IFRS adjustment* 3 16
Profit for the financial year of the
Company (including dividends from subsidiaries) in accordance with IFRS 1,463 1,595
Share in the IFRS result of the Group, net of distributions to the
Company† 753(249)
Profit after tax of the Group attributable to shareholders in accordance with IFRS 2,216 1,346
2014 £m 2013 £m
Net equity
Shareholders’ equity of the Company in accordance with UK GAAP and IFRS 7,945 7,352
Share in the IFRS net equity of the Group† 3,866 2,298
Shareholders’ equity of the Group in accordance with IFRS 11,811 9,650
*
‘IFRS adjustment’ in the above table represents the difference in the accounting treatment for pension schemes between UK GAAP and IFRS.
† The
‘shares in the IFRS result and net equity of the Group’ lines represent the Company’s equity in the earnings and net assets of its subsidiaries and associates.
The profit for the financial year of the Company in accordance with UK GAAP and IFRS includes dividends declared in the year from subsidiary undertakings of
£1,774 million and £2,332 million for the years ended 31 December 2014 and 2013, respectively.
As stated in note 3, under UK GAAP,
the Company accounts for its investments in subsidiary undertakings at the lower of cost and estimated realisable value. For the purpose of this reconciliation, no adjustment is made to the Company in respect of any valuation adjustments to shares
in subsidiary undertakings which would be eliminated on consolidation.
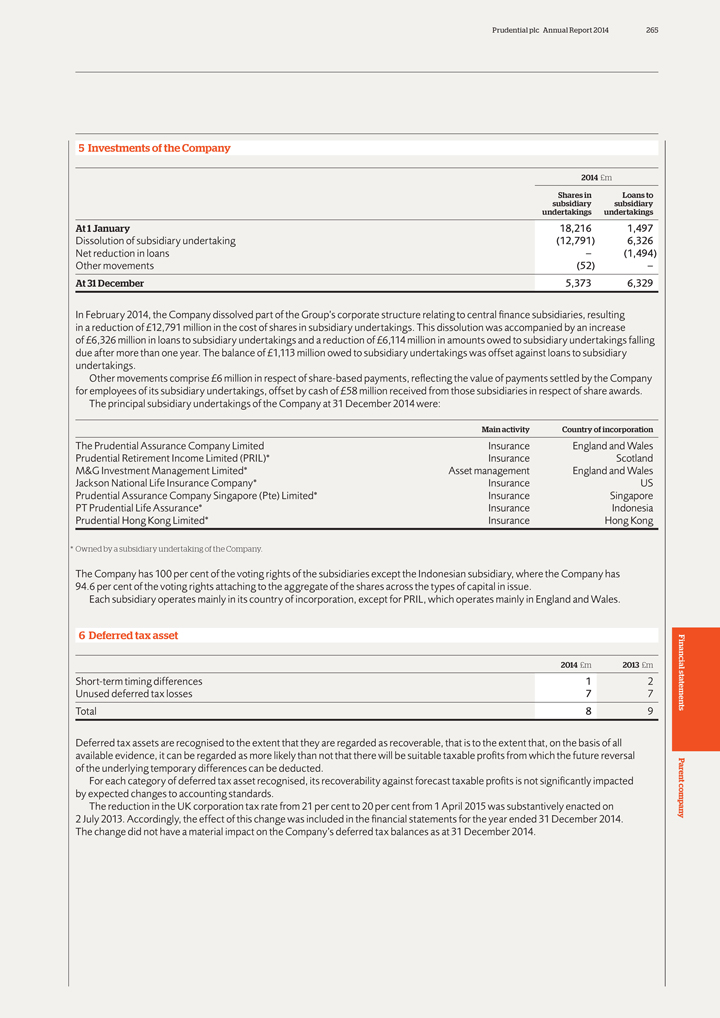
Prudential plc Annual Report 2014 265
| 5 | Investments of the Company |
2014 £m
Shares in Loans to
subsidiary subsidiary
undertakings undertakings
At 1 January 18,216 1,497
Dissolution of subsidiary undertaking(12,791) 6,326
Net reduction in loans –(1,494)
Other movements(52) –
At 31 December 5,373 6,329
In February 2014, the Company dissolved part of the
Group’s corporate structure relating to central finance subsidiaries, resulting in a reduction of £12,791 million in the cost of shares in subsidiary undertakings. This dissolution was accompanied by an increase of
£6,326 million in loans to subsidiary undertakings and a reduction of £6,114 million in amounts owed to subsidiary undertakings falling due after more than one year. The balance of £1,113 million owed to subsidiary
undertakings was offset against loans to subsidiary undertakings.
Other movements comprise £6 million in respect of share-based payments, reflecting the
value of payments settled by the Company for employees of its subsidiary undertakings, offset by cash of £58 million received from those subsidiaries in respect of share awards.
The principal subsidiary undertakings of the Company at 31 December 2014 were:
Main
activity Country of incorporation
The Prudential Assurance Company Limited Insurance England and Wales
Prudential Retirement Income Limited (PRIL)* Insurance Scotland
M&G Investment Management
Limited* Asset management England and Wales
Jackson National Life Insurance Company* Insurance US
Prudential Assurance Company Singapore (Pte) Limited* Insurance Singapore
PT Prudential Life
Assurance* Insurance Indonesia
Prudential Hong Kong Limited* Insurance Hong Kong
| * | Owned by a subsidiary undertaking of the Company. |
The Company has 100 per cent of the voting rights of the subsidiaries except the Indonesian subsidiary, where the Company has
94.6 per cent of the voting rights attaching to the aggregate of the shares across the types of capital in issue.
Each subsidiary operates mainly in its
country of incorporation, except for PRIL, which operates mainly in England and Wales.
| 6 | Deferred tax asset |
2014 £m 2013 £m
Short-term timing differences 1 2
Unused deferred tax losses 7 7
Total 8 9
Deferred tax assets are recognised to the extent that they are regarded as recoverable, that is to the extent that, on the basis of all available evidence, it can be regarded as
more likely than not that there will be suitable taxable profits from which the future reversal of the underlying temporary differences can be deducted.
For each
category of deferred tax asset recognised, its recoverability against forecast taxable profits is not significantly impacted by expected changes to accounting standards.
The reduction in the UK corporation tax rate from 21 per cent to 20 per cent from 1 April 2015 was substantively enacted on
2 July 2013. Accordingly, the effect of this change was included in the financial statements for the year ended 31 December 2014.
The change did not have a material impact on the Company’s deferred tax balances as at 31 December 2014.
Financial statements Parent company

266 Prudential plc Annual Report 2014 Financial statements Notes on the parent company financial statements
Notes on the parent company financial statements continued
| 7 | Borrowings |
Core structural borrowings Other borrowings Total
2014 £m 2013 £m 2014
£m 2013 £m 2014 £m 2013 £m
Core structural borrowingsnote(i) 3,869 4,211 – – 3,869 4,211
Other borrowings:
Commercial papernote(ii) – – 1,704 1,634 1,704 1,634
Floating Rate Notesnote(iii) – – 200 200 200 200
Medium Term Notes 2015note(ii)
– – 300 299 300 299
Total borrowings 3,869 4,211 2,204 2,133 6,073 6,344
Borrowings are repayable as follows:
Within 1 year or on demand – – 2,204 1,834
2,204 1,834
Between 1 and 5 years – – – 299 – 299
After 5
years 3,869 4,211 – – 3,869 4,211
3,869 4,211 2,204 2,133 6,073 6,344
Recorded in the balance sheet as:
Subordinated liabilitiesnote(iv) 3,662
Debenture loans 549 549
3,869 4,211
Notes
(i) Further details on the core structural borrowings of the Company are provided in
note C6.1 of the Group financial statements. (ii) These borrowings support a short-term fixed income securities programme.
(iii) The Company issued
£200 million Floating Rate Notes in October 2014 which will mature in October 2015. These Notes have been wholly subscribed to by a Group subsidiary and accordingly have been eliminated on consolidation in the Group financial statements.
These Notes were originally issued in October 2008 and have been continually reissued upon their maturity.
(iv) The interests of the holders of the subordinated
liabilities are subordinate to the entitlements of other creditors of the Company.
(v) In January 2015, the Company issued £300 million Medium Term
Notes which will mature in January 2018. The proceeds, net of costs, were £299 million.
| 8 | Derivative financial instruments |
2014 £m 2013 £m
Fair value Fair value Fair value Fair value
assets liabilities assets liabilities
Cross-currency swap 2 – 3 –
Inflation-linked swap – 315 – 199
Total 2 315 3 199
Derivative financial instruments are held to manage certain macroeconomic exposures. The change in fair value of the derivative financial instruments of the Company was a loss
before tax of £115 million (2013: loss before tax of £9 million).
The derivative financial instruments are valued internally using standard market
practices. In accordance with the Company’s risk management framework, all internally generated valuations are subject to independent assessment against external counterparties’ valuations.
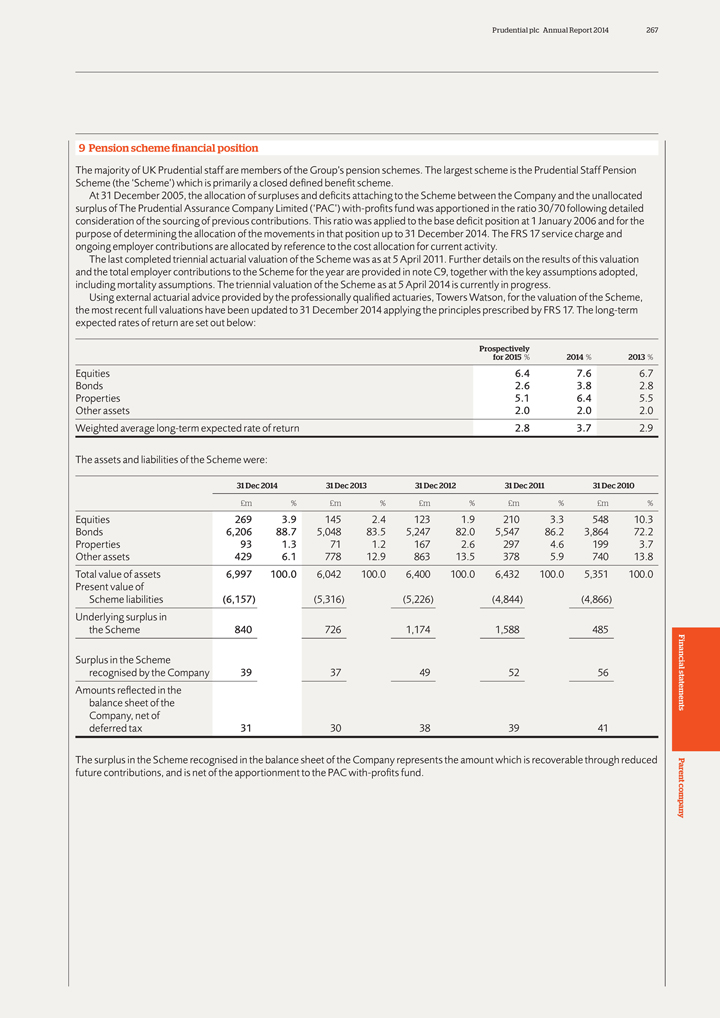
Prudential plc Annual Report 2014 267
9 Pension
scheme financial position
The majority of UK Prudential staff are members of the Group’s pension schemes. The largest scheme is the Prudential Staff Pension
Scheme (the ‘Scheme’) which is primarily a closed defined benefit scheme.
At 31 December 2005, the allocation of surpluses and deficits attaching to
the Scheme between the Company and the unallocated surplus of The Prudential Assurance Company Limited (‘PAC’) with-profits fund was apportioned in the ratio 30/70 following detailed consideration of the sourcing of previous contributions.
This ratio was applied to the base deficit position at 1 January 2006 and for the purpose of determining the allocation of the movements in that position up to 31 December 2014. The FRS 17 service charge and ongoing employer contributions
are allocated by reference to the cost allocation for current activity.
The last completed triennial actuarial valuation of the Scheme was as at 5 April 2011.
Further details on the results of this valuation and the total employer contributions to the Scheme for the year are provided in note C9, together with the key assumptions adopted, including mortality assumptions. The triennial valuation of the
Scheme as at 5 April 2014 is currently in progress.
Using external actuarial advice provided by the professionally qualified actuaries, Towers Watson, for the
valuation of the Scheme, the most recent full valuations have been updated to 31 December 2014 applying the principles prescribed by FRS 17. The long-term expected rates of return are set out below:
Prospectively
for 2015 % 2014 % 2013 %
Equities 6.4 7.6 6.7
Bonds 2.6 3.8 2.8
Properties 5.1 6.4 5.5
Other assets 2.0 2.0 2.0
Weighted average long-term expected rate of return 2.8 3.7 2.9
The assets and liabilities of
the Scheme were:
| 31 | Dec 2014 31 Dec 2013 31 Dec 2012 31 Dec 2011 31 Dec 2010 |
£m% £m% £m% £m% £m%
Equities 269 3.9 145 2.4 123 1.9 210 3.3 548 10.3
Bonds 6,206 88.7 5,048 83.5
5,247 82.0 5,547 86.2 3,864 72.2
Properties 93 1.3 71 1.2 167 2.6 297 4.6 199 3.7
Other assets 429 6.1 778 12.9 863 13.5 378 5.9 740 13.8
Total value of assets 6,997 100.0
6,042 100.0 6,400 100.0 6,432 100.0 5,351 100.0
Present value of
Scheme
liabilities(6,157)(5,316)(5,226)(4,844)(4,866)
Underlying surplus in
the
Scheme 840 726 1,174 1,588 485
Surplus in the Scheme
recognised by the
Company 39 37 49 52 56
Amounts reflected in the
balance sheet of the
Company, net of
deferred tax 31 30 38 39 41
The surplus in the Scheme recognised in the balance sheet of the Company represents the amount which is recoverable through reduced future contributions, and is net of the
apportionment to the PAC with-profits fund.
Financial statements Parent company
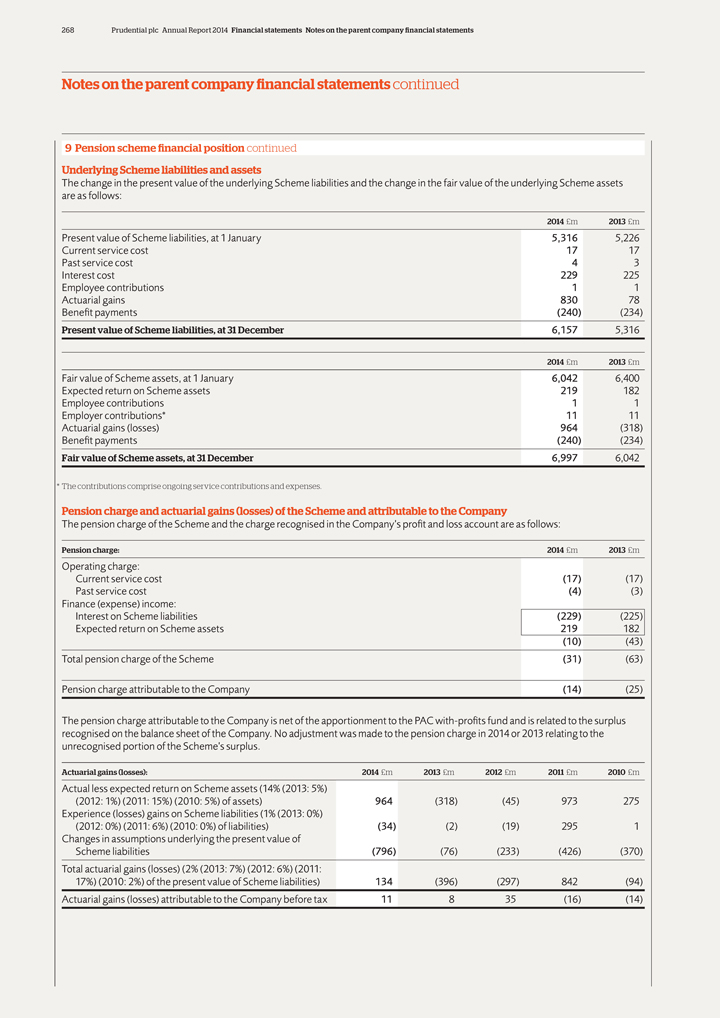
268 Prudential plc Annual Report 2014 Financial statements Notes on the parent company financial statements
Notes on the parent company financial statements continued
9 Pension scheme financial position
continued Underlying Scheme liabilities and assets
The change in the present value of the underlying Scheme liabilities and the change in the fair value of the
underlying Scheme assets are as follows:
2014 £m 2013 £m
Present
value of Scheme liabilities, at 1 January 5,316 5,226
Current service cost 17 17
Past service cost 4 3
Interest cost 229 225
Employee contributions 1 1
Actuarial gains 830 78
Benefit payments(240)(234)
Present value of Scheme liabilities, at 31 December 6,157
5,316
2014 £m 2013 £m
Fair value of Scheme assets, at
1 January 6,042 6,400
Expected return on Scheme assets 219 182
Employee contributions 1 1
Employer contributions* 11 11
Actuarial gains (losses) 964(318)
Benefit payments(240)(234)
Fair value of Scheme assets, at 31 December 6,997 6,042
| * | The contributions comprise ongoing service contributions and expenses. |
Pension charge and actuarial gains (losses) of the Scheme and attributable to the Company
The pension charge of the Scheme and the charge recognised in the Company’s profit and loss account are as follows:
Pension charge: 2014 £m 2013 £m
Operating charge:
Current service cost(17)(17)
Past service cost(4)(3)
Finance (expense) income:
Interest on Scheme liabilities(229)(225)
Expected return on Scheme assets 219 182
(10)(43)
Total pension charge of the Scheme(31)(63)
Pension charge attributable to the Company(14)(25)
The pension charge attributable to the Company is net of the apportionment to the PAC with-profits fund and is related to the surplus recognised on the balance
sheet of the Company. No adjustment was made to the pension charge in 2014 or 2013 relating to the unrecognised portion of the Scheme’s surplus.
Actuarial
gains (losses): 2014 £m 2013 £m 2012 £m 2011 £m 2010 £m
Actual less expected return on Scheme assets (14% (2013: 5%)
(2012: 1%) (2011: 15%) (2010: 5%) of assets) 964(318)(45) 973 275
Experience (losses) gains on
Scheme liabilities (1% (2013: 0%)
(2012: 0%) (2011: 6%) (2010: 0%) of liabilities)(34)(2)(19) 295 1
Changes in assumptions underlying the present value of
Scheme
liabilities(796)(76)(233)(426)(370)
Total actuarial gains (losses) (2% (2013: 7%) (2012: 6%) (2011:
17%) (2010: 2%) of the present value of Scheme liabilities) 134(396)(297) 842(94)
Actuarial
gains (losses) attributable to the Company before tax 11 8 35(16)(14)
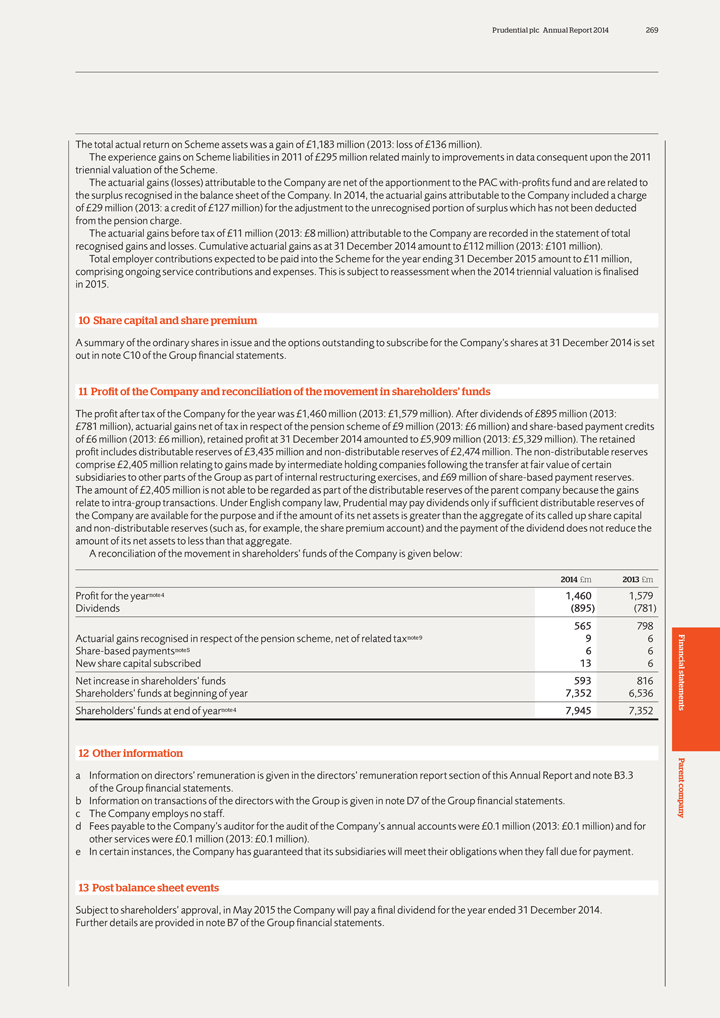
Prudential plc Annual Report 2014 269
The total
actual return on Scheme assets was a gain of £1,183 million (2013: loss of £136 million).
The experience gains on Scheme liabilities in 2011 of
£295 million related mainly to improvements in data consequent upon the 2011 triennial valuation of the Scheme.
The actuarial gains (losses)
attributable to the Company are net of the apportionment to the PAC with-profits fund and are related to the surplus recognised in the balance sheet of the Company. In 2014, the actuarial gains attributable to the Company included a charge of
£29 million (2013: a credit of £127 million) for the adjustment to the unrecognised portion of surplus which has not been deducted from the pension charge.
The actuarial gains before tax of £11 million (2013: £8 million) attributable to the Company are recorded in the statement of total recognised gains and losses.
Cumulative actuarial gains as at 31 December 2014 amount to £112 million (2013: £101 million).
Total employer contributions expected to be
paid into the Scheme for the year ending 31 December 2015 amount to £11 million, comprising ongoing service contributions and expenses. This is subject to reassessment when the 2014 triennial valuation is finalised in 2015.
10 Share capital and share premium
A summary of the ordinary shares in issue
and the options outstanding to subscribe for the Company’s shares at 31 December 2014 is set out in note C10 of the Group financial statements.
11 Profit
of the Company and reconciliation of the movement in shareholders’ funds
The profit after tax of the Company for the year was £1,460 million (2013:
£1,579 million). After dividends of £895 million (2013: £781 million), actuarial gains net of tax in respect of the pension scheme of £9 million (2013: £6 million) and share-based payment credits of
£6 million (2013: £6 million), retained profit at 31 December 2014 amounted to £5,909 million (2013: £5,329 million). The retained profit includes distributable reserves of £3,435 million and
non-distributable reserves of £2,474 million. The non-distributable reserves comprise £2,405 million relating to gains made by intermediate holding companies following the transfer at fair value of certain subsidiaries to other
parts of the Group as part of internal restructuring exercises, and £69 million of share-based payment reserves. The amount of £2,405 million is not able to be regarded as part of the distributable reserves of the parent
company because the gains relate to intra-group transactions. Under English company law, Prudential may pay dividends only if sufficient distributable reserves of the Company are available for the purpose and if the amount of its net assets is
greater than the aggregate of its called up share capital and non-distributable reserves (such as, for example, the share premium account) and the payment of the dividend does not reduce the amount of its net assets to less than that aggregate.
A reconciliation of the movement in shareholders’ funds of the Company is given below:
2014 £m 2013 £m
Profit for the yearnote4 1,460 1,579
Dividends(895)(781)
565 798
Actuarial gains recognised in respect of the pension scheme, net of related taxnote9 9 6
Share-based paymentsnote5 6 6
New share capital subscribed 13 6
Net increase in shareholders’ funds 593 816
Shareholders’ funds at beginning of year
7,352 6,536
Shareholders’ funds at end of yearnote4 7,945 7,352
12 Other
information a Information on directors’ remuneration is given in the directors’ remuneration report section of this Annual Report and note B3.3 of the Group financial statements. b Information on transactions of the directors with the
Group is given in note D7 of the Group financial statements. c The Company employs no staff. d Fees payable to the Company’s auditor for the audit of the Company’s annual accounts were £0.1 million (2013: £0.1 million) and
for other services were £0.1 million (2013: £0.1 million). e In certain instances, the Company has guaranteed that its subsidiaries will meet their obligations when they fall due for payment.
13 Post balance sheet events
Subject to shareholders’ approval, in May 2015 the Company
will pay a final dividend for the year ended 31 December 2014. Further details are provided in note B7 of the Group financial statements.
Financial statements
Parent company
270 Prudential plc Annual Report 2014 Financial statements Statement of directors’ responsibilities/Independent auditor’s
report
Statement of directors’ responsibilities in respect of the annual report and the financial statements
The directors are responsible for preparing the Annual Report and the Group and parent company financial statements in accordance with applicable law and regulations.
Company law requires the directors to prepare Group and parent company financial statements for each financial year. Under that law, the directors are required to prepare the Group
financial statements in accordance with International Financial Reporting Standards (IFRS) as adopted by the European Union (EU) and applicable law and have elected to prepare the parent company financial statements in accordance with UK Accounting
Standards and applicable law (UK Generally Accepted Accounting Practice).
Under company law, the directors must not approve the financial statements unless they
are satisfied that they give a true and fair view of the state of affairs of the Group and parent company and of their profit or loss for that period. In preparing each of the Group and parent company financial statements, the directors are required
to:
— Select suitable accounting policies and then apply them consistently;
— Make judgements and estimates that are reasonable and prudent;
— For the Group
financial statements, state whether they have been prepared in accordance with IFRS as adopted by the EU;
— For the parent company financial statements, state
whether applicable UK Accounting Standards have been followed, subject to any material departures disclosed and explained in the parent company financial statements; and
— Prepare the financial statements on the going-concern basis unless it is inappropriate to presume that the Group and the parent company will continue in business.
The directors are responsible for keeping adequate accounting records that are sufficient to show and explain the parent company’s transactions, and disclose
with reasonable accuracy, at any time, the financial position of the parent company, and enable them to ensure that its financial statements comply with the Companies Act 2006. They have general responsibility for taking such steps as are reasonably
open to them to safeguard the assets of the Group and to prevent and detect fraud and other irregularities.
Under applicable law and regulations, the directors are
also responsible for preparing a strategic report, directors’ report, directors’ remuneration report and corporate governance statement that comply with that law and those regulations.
The directors are responsible for the maintenance and integrity of the corporate and financial information included on the Company’s website. Legislation in the UK governing
the preparation and dissemination of financial statements may differ from legislation in other jurisdictions.
The directors of Prudential plc, whose names and
positions are set out on pages 72 to 75 confirm that to the best of their knowledge:
— The financial statements, prepared in accordance with the applicable
set of accounting standards, give a true and fair view of the assets, liabilities, financial position and profit or loss of the Company and the undertakings included in the consolidation taken as a whole;
— The strategic report includes a fair review of the development and performance of the business and the position of the Company and the undertakings included in the
consolidation taken as a whole, together with a description of the principal risks and uncertainties that they face; and
— The Annual Report and financial
statements, taken as a whole, is fair, balanced and understandable, and provides the information necessary for shareholders to assess the Company’s performance, business model and strategy.
Prudential plc Annual Report 2014 271
Independent
auditor’s report to the members of Prudential plc only
Opinions and conclusions arising from our audit
1. Our opinion on the financial statements is unmodified
We have audited the financial
statements of Prudential plc for the year ended
31 December 2014 set out on pages 123 to 269. In our opinion:
— The financial statements give a true and fair view of the state of the Group’s and of the parent company’s affairs as at
31 December 2014 and of the Group’s profit for the year then ended;
— The Group
financial statements have been properly prepared in accordance with International Financial Reporting Standards as adopted by the European Union;
— The parent
company financial statements have been properly prepared in accordance with UK Accounting Standards; and
— The financial statements have been prepared in
accordance with the requirements of the Companies Act 2006 and, as regards the Group financial statements, Article 4 of the IAS Regulation.
2. Our assessment of
risks of material misstatement
In arriving at our audit opinion above on the financial statements the risks of material misstatement that had the greatest effect
on our audit were as follows:
Investments (£337,454 million)
Refer to
page 81 (Audit Committee report), page 136 (accounting policy) and pages 182 to 203 (financial disclosures) The risk – The Group’s investment portfolio represents 91 per cent of the Group’s total assets.
The substantial majority of the portfolio does not involve significant judgement as prices are readily available from liquid market sources.
The areas that involved significant audit effort and judgement in 2014 were the valuation of illiquid positions within the financial investment portfolio representing 2 per
cent of the Group’s total assets. These included unlisted equity, unlisted debt securities, derivatives and loans such as commercial mortgage loans and bridge loans. For these positions a reliable third party price was not readily available and
therefore involved the application of expert judgement in the valuations adopted.
Our response – We used our own valuation specialists and pricing services to
assist us in performing our audit procedures in this area, which included:
— Assessing whether the valuation process is appropriately designed and captures
relevant valuation inputs;
— Testing associated controls in respect of the valuation process;
— Performing our own independent price checks from our own pricing services using external quotes for liquid positions and, where available, for illiquid positions;
— Assessing pricing model methodologies and assumptions against industry practice and valuation guidelines;
— Evaluating the testing performed by the Group in order to identify any impairment in relation to loans; and performing our own assessment of loan files to understand the
performance of the loans. We obtained an understanding of existing and prospective investee company cash flows to understand whether loans can be serviced or refinancing may be required and considered the impact on impairment testing performed.
We also assessed whether the Group’s disclosures in relation to the valuation of investments are compliant with the relevant accounting requirements, in
particular the sensitivity of the valuations adopted to alternative outcomes.
Policyholder Liabilities
(£309,539 million)
Refer to page 81 (Audit Committee report), page 133 (accounting
policy) and pages 204 to 219 (financial disclosures) The risk: The Group has significant insurance liabilities representing 87 per cent of the Group’s total liabilities. This is an area that involves significant judgement over uncertain
future outcomes, mainly the ultimate total settlement value of long term policyholder liabilities. Economic assumptions, such as investment return and associated discount rates, and operating assumptions such as mortality and persistency are the key
inputs used to estimate these long term liabilities. The valuation of the guarantees in the US variable annuity business is a complex exercise as it involves exercising significant judgement over the relationship between the investment return
attaching to these products and the guarantees contractually provided to policyholders and the likely policyholder behaviour in response to changes in investment performance. The valuation of the insurance liabilities in relation to the UK annuity
business requires the exercise of significant judgement over the setting of mortality and credit risk assumptions.
Our response: We used our own actuarial
specialists to assist us in performing our audit procedures in this area, which included: (a) Consideration of the appropriateness of the assumptions used in the stochastic models for the valuation of the US variable annuity guarantees. These
included assumptions for investment mix and projected investment returns considered by reference to company specific and industry data and for future growth rates considered by reference to market trends and market volatility.
We assessed assumptions of policyholder behaviour by reference to relevant company historical and industry data.
(b) Consideration of the appropriateness of the mortality and credit risk assumptions used in the valuation of the UK annuity liabilities by reference to company and industry data
on historical mortality experience and expectations of future mortality. Our work on the credit risk assumptions primarily considered the appropriateness of the methodology and assumptions by reference to industry practice and our expectation
derived from market experience.
Other key audit procedures included assessing the Group’s methodology for calculating the insurance liabilities and their
analysis of the movements in insurance liabilities during the year, including consideration of whether the movements are in line with the assumptions adopted by the Group, our understanding of developments in the business and our expectation derived
from market experience. We considered the validity of management’s liability adequacy testing which is a key test performed to check that the liabilities are adequate in the context of expected experience. Our work on the liability adequacy
test includes assessing the reasonableness of the projected cash flows and challenging the assumptions adopted in the context of company and industry experience data and specific product features.
We considered whether the Group’s disclosures in relation to the assumptions used in the calculation of insurance liabilities are compliant with the relevant accounting
requirements, in particular the sensitivities of these assumptions to alternative scenarios and inputs.
Statement of directors’ responsibilities Financial
statements Independent auditor’s report
272 Prudential plc Annual Report 2014 Financial statements Independent auditor’s report
Independent auditor’s report to the members of Prudential plc only continued
Deferred
Acquisition Costs (‘DAC’)
(£5,930 million)
Refer to page 81
(Audit Committee report), page 135 (accounting policy) and pages 220 to 224 (financial disclosures) The risk – DAC represents 1.6 per cent of the total assets and involves judgement in the identification of, and the extent to which,
certain acquisition costs can be deferred, and assessment of recoverability of the asset. The DAC associated with the US business, which represents 87 per cent of total DAC, involves the greatest judgement in terms of measurement and
recoverability. The amortisation and recoverability assessment of the US DAC asset is related to the achieved and projected future profit profile. This involves making assumptions about future investment returns and the consequential impact on fee
income.
Our response – We used our own actuarial specialists to assist us in performing our audit procedures in this area, which included (i) evaluating
the appropriateness of the Group’s deferral policy by comparing it against the requirements of relevant accounting standards;
(ii) evaluating whether costs
are deferred in accordance with the Group’s deferral policy; and
(iii)assessing the calculations performed including the appropriateness of the assumptions
used in determining the profit profile and the extent of the associated adjustment necessary to the DAC asset. Our work in this area included assessing the reasonableness of assumptions such as the projected investment return by comparing against
the Group’s investment portfolio mix and market return data.
We also considered the adequacy of the Group’s disclosures about the degree of estimation
involved in the valuation of DAC.
3. Our application of materiality and an overview of the scope of our audit
The materiality for the Group financial statements as a whole was set at £307 million determined with reference to a benchmark of IFRS shareholders’ equity (of
which it represents 3 per cent). We consider IFRS shareholders’ equity to be the most appropriate benchmark as it represents the residual interest that can be ascribed to shareholders after policyholder assets and corresponding liabilities
have been accounted for.
We report to the Group audit committee any corrected or uncorrected identified misstatements exceeding £15 million in addition
to other identified misstatements that warrant reporting on qualitative grounds.
We subjected the Group’s operations to audits for Group reporting purposes as
follows:
— Audits for Group reporting purposes in relation to the financial information of the insurance operations in the UK, US, Hong Kong, Indonesia,
Singapore, Malaysia, Korea, Vietnam and fund management operations in the UK (M&G). These audits covered 92 per cent of total Group revenue; 88 per cent of Group profit before tax; 91 per cent of total Group assets and 89 per
cent of Group shareholders’ equity.
— Audits of account balances that correspond to the risks of material misstatement identified above in relation to
Prudential Capital and the insurance operations in China, Taiwan and Thailand. The account balances audited are investments, policyholder liabilities and deferred acquisition costs. These operations covered 2 per cent of total Group revenue;
4 per cent of Group profit before tax; 2 per cent of total Group assets and 1 per cent of Group shareholders’ equity.
The remaining operations
cover 6 per cent of total Group revenue, 8 per cent of Group profit before tax and 7 per cent of total Group assets, none of which individually represented more than 4 per cent of any of total Group revenue, Group profit before
tax or total Group assets. For the remaining operations, we performed analysis at an aggregated Group level to re-examine our assessment that there were no significant risks of material misstatement within these operations.
The Group team in the UK covered the UK Group Head office operations. Component auditors performed the audit work in the remaining locations.
The Group audit team instructed component auditors as to the significant areas to be covered, including the relevant risks detailed above and the information to be reported back.
The Group audit team approved the component materialities, which were set as £110 million for key reporting components in Asia and £140 million for all other key reporting components listed above, having regard to the size and
risk profile of the Group.
The Group audit team visited 10 component locations in insurance operations in UK, US, Hong Kong, Indonesia, Singapore, Malaysia, Korea
and Vietnam, fund management operations in M&G and Prudential Capital. This included an assessment of the audit risk and strategy. Video and telephone conference meetings were also held with these component auditors and certain others that were
not physically visited. At these visits and meetings, the findings reported to the Group audit team were discussed in more detail, and any further work required by the Group audit team was then performed by the component auditor The Senior Statutory
Auditor, in conjunction with other senior staff in the Group team, also regularly attended Business Unit audit committee meetings (at a regional level for Asia) and participated in meetings with local management to understand at first hand the key
risks and audit issues at a component level which may affect the Group financial statements.
4. Our opinion on other matters prescribed by the Companies Act 2006
is unmodified
In our opinion:
— The part of the Directors’
Remuneration Report to be audited has been properly prepared in accordance with the Companies Act 2006; and
— The information given in the Strategic Report
and the Directors’ Report for the financial year for which the financial statements are prepared is consistent with the financial statements.
Prudential plc Annual Report 2014 273
We have
nothing to report in respect of the matters on which we are required to report by exception
Under ISAs (UK and Ireland) we are required to report to you if, based
on the knowledge we acquired during our audit, we have identified other information in the annual report that contains a material inconsistency with either that knowledge or the financial statements, a material misstatement of fact, or that is
otherwise misleading.
In particular, we are required to report to you if:
— We have identified material inconsistencies between the knowledge we acquired during our audit and the directors’ statement that they consider that the
annual report and financial statements taken as a whole is fair, balanced and understandable and provides the information necessary for shareholders to assess the Group’s performance, business model and strategy; or
— The Audit Committee Report does not appropriately address matters communicated by us to the audit committee.
Under the Companies Act 2006 we are required to report to you if, in our opinion:
—
Adequate accounting records have not been kept by the parent company, or returns adequate for our audit have not been received from branches not visited by us; or
— The parent company financial statements and the part of the Directors’ Remuneration Report to be audited are not in agreement with the accounting
records and returns; or
— Certain disclosures of directors’ remuneration specified by law are not made; or
— We have not received all the information and explanations we require for our audit.
Under the Listing Rules we are required to review:
— The directors’
statement, set out on page 90, in relation to going concern; and
— The part of the Corporate Governance Statement on page 88 relating to the Company’s
compliance with the ten provisions of the 2012 UK Corporate Governance Code specified for our review.
We have nothing to report in respect of the above
responsibilities.
Scope of report and responsibilities
As explained more
fully in the Directors’ Responsibilities Statement set out on page 270, the Directors are responsible for the preparation of the financial statements and for being satisfied that they give a true and fair view. A description of the scope of an
audit of financial statements is provided on the Financial Reporting Council’s website at www.frc.org.uk/auditscopeukprivate. This report is made solely to the Company’s members as a body and is subject to important explanations and
disclaimers regarding our responsibilities, published on our website at www.kpmg.com/uk/ auditscopeukco2014a which are incorporated into this report as if set out in full and should be read to provide an understanding of the purpose of this report,
the work we have undertaken and the basis of our opinions.
Rees Aronson
(Senior Statutory Auditor) for and on behalf of KPMG LLP, Statutory Auditor Chartered Accountants London
9 March 2015
Financial statements Independent auditor’s report

274 Prudential plc Annual Report 2014
Prudential plc Annual Report 2014 275
Section 6
European Embedded Value (EEV) basis results
276 Index to EEV basis results
Description of EEV basis reporting
In broad terms, IFRS profits for long-term business reflect the aggregate of results on a traditional accounting basis. By contrast, embedded value is a way of reporting the value
of the life insurance business.
The European Embedded Value principles were published by the CFO Forum of major European insurers in May 2004 and subsequently
supplemented by Additional Guidance issued in October 2005. The principles provide consistent definitions, a framework for setting actuarial assumptions and an approach to the underlying methodology and disclosures.
Results prepared under the EEV principles capture the discounted value of future profits expected to arise from the current book of long-term business. The results are prepared by
projecting cash flows, by product, using best estimate assumptions for all relevant factors. Furthermore, in determining these expected profits, full allowance is made for the risks attached to their emergence and the associated cost of capital, and
takes into account recent experience in assessing likely future persistency, mortality, morbidity and expenses. Further details are explained in notes 16 and 17.
Post-tax basis of presentation
As previously announced, from 1 January
2014, the basis of presentation has been altered to be on a post-tax basis and, accordingly, all comparatives are shown on a comparable basis.
| 6 |
European Embedded Value Financial statements (EEV basis) results

276 Prudential plc Annual Report 2014 Financial statements European Embedded Value (EEV) basis results
Index to European Embedded Value (EEV) basis results
277 Post-tax operating profit based on
longer-term
investment returns
278 Post-tax summarised consolidated income
statement
278 Movement in shareholders’ equity
279 Summary statement of
financial position
Notes on the EEV basis results
280 1 Basis of preparation
280 2 Results analysis by business area
282 3 Analysis of new business
contribution
283 4 Operating profit from business in force
285 5 Short-term
fluctuations in investment returns
286 6 Effect of changes in economic assumptions
287 7 Sale of PruHealth and PruProtect businesses
287 8 Held for sale Japan life business
288 9 Domestication of the Hong Kong branch business
288 10 Net core
structural borrowings of shareholder-
financed operations
289 11 Analysis of
movement in free surplus
291 12 Reconciliation of movement in shareholders’ equity
292 13 Reconciliation of movements in net worth and value of
in-force for long-term business
294 14 Expected transfer of value of in-force business to free
surplus
295 15 Sensitivity of results to alternative assumptions
297 16 Methodology
and accounting presentation
303 17 Assumptions
307 18 New business premiums
and contributions
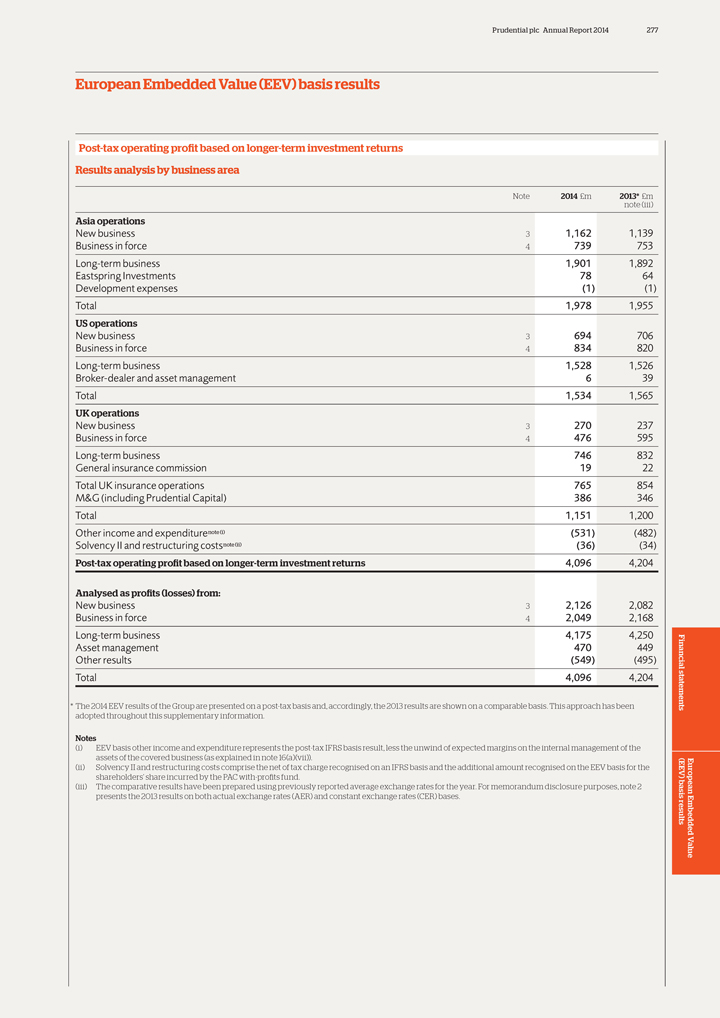
Prudential plc Annual Report 2014 277
European
Embedded Value (EEV) basis results
Post-tax operating profit based on longer-term investment returns Results analysis by business area
Note 2014 £m 2013* £m
note (iii)
Asia operations
New business 3 1,162 1,139
Business in force 4 739 753
Long-term business 1,901 1,892
Eastspring Investments 78 64
Development expenses(1)(1)
Total 1,978 1,955
US operations
New business 3 694 706
Business in force 4 834 820
Long-term business 1,528 1,526
Broker-dealer and asset management 6 39
Total 1,534 1,565
UK operations
New business 3 270 237
Business in force 4 476 595
Long-term business 746 832
General insurance commission 19 22
Total UK insurance operations 765 854
M&G (including Prudential Capital) 386 346
Total 1,151 1,200
Other income and expenditurenote(i)(531)(482)
Solvency II and restructuring costsnote(ii)(36)(34)
Post-tax operating profit based on
longer-term investment returns 4,096 4,204
Analysed as profits (losses) from:
New business 3 2,126 2,082
Business in force 4 2,049 2,168
Long-term business 4,175 4,250
Asset management 470 449
Other results(549)(495)
Total 4,096 4,204
* The 2014 EEV results of the Group are presented on a post-tax basis and, accordingly, the 2013 results are shown on a comparable basis. This approach has been adopted throughout
this supplementary information.
Notes
(i) EEV basis other income and
expenditure represents the post-tax IFRS basis result, less the unwind of expected margins on the internal management of the assets of the covered business (as explained in note 16(a)(vii)).
(ii) Solvency II and restructuring costs comprise the net of tax charge recognised on an IFRS basis and the additional amount recognised on the EEV basis for the shareholders’
share incurred by the PAC with-profits fund.
(iii) The comparative results have been prepared using previously reported average exchange rates for the year. For
memorandum disclosure purposes, note 2 presents the 2013 results on both actual exchange rates (AER) and constant exchange rates (CER) bases.
European Embedded
Value Financial statements (EEV basis) results
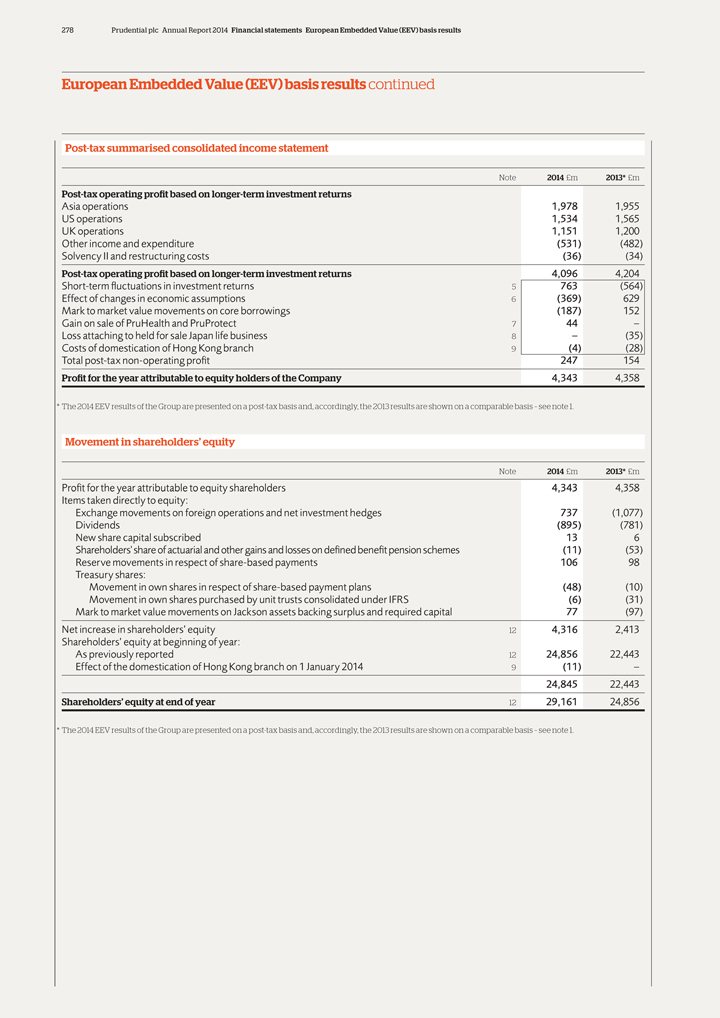
278 Prudential plc Annual Report 2014 Financial statements European Embedded Value (EEV) basis results
European Embedded Value (EEV) basis results continued
Post-tax summarised consolidated income
statement
Note 2014 £m 2013* £m
Post-tax operating profit based
on longer-term investment returns
Asia operations 1,978 1,955
US operations
1,534 1,565
UK operations 1,151 1,200
Other income and expenditure(531)(482)
Solvency II and restructuring costs(36)(34)
Post-tax operating profit based
on longer-term investment returns 4,096 4,204
Short-term fluctuations in investment returns 5 763(564)
Effect of changes in economic assumptions 6(369) 629
Mark to market value movements on core
borrowings(187) 152
Gain on sale of PruHealth and PruProtect 7 44 –
Loss
attaching to held for sale Japan life business 8 –(35)
Costs of domestication of Hong Kong branch 9(4)(28)
Total post-tax non-operating profit 247 154
Profit for the year attributable to equity holders
of the Company 4,343 4,358
* The 2014 EEV results of the Group are presented on a post-tax basis and, accordingly, the 2013 results are shown on a comparable basis
– see note 1.
Movement in shareholders’ equity
Note 2014 £m
2013* £m
Profit for the year attributable to equity shareholders 4,343 4,358
Items taken directly to equity:
Exchange movements on foreign operations and net investment
hedges 737(1,077)
Dividends(895)(781)
New share capital subscribed 13 6
Shareholders’ share of actuarial and other gains and losses on defined benefit pension schemes(11)(53)
Reserve movements in respect of share-based payments 106 98
Treasury shares:
Movement in own shares in respect of share-based payment plans(48)(10)
Movement in own shares
purchased by unit trusts consolidated under IFRS(6)(31)
Mark to market value movements on Jackson assets backing surplus and required capital 77(97)
Net increase in shareholders’ equity 12 4,316 2,413
Shareholders’ equity at
beginning of year:
As previously reported 12 24,856 22,443
Effect of the
domestication of Hong Kong branch on 1 January 2014 9(11) –
24,845 22,443
Shareholders’ equity at end of year 12 29,161 24,856
* The 2014 EEV results of the Group
are presented on a post-tax basis and, accordingly, the 2013 results are shown on a comparable basis – see note 1.
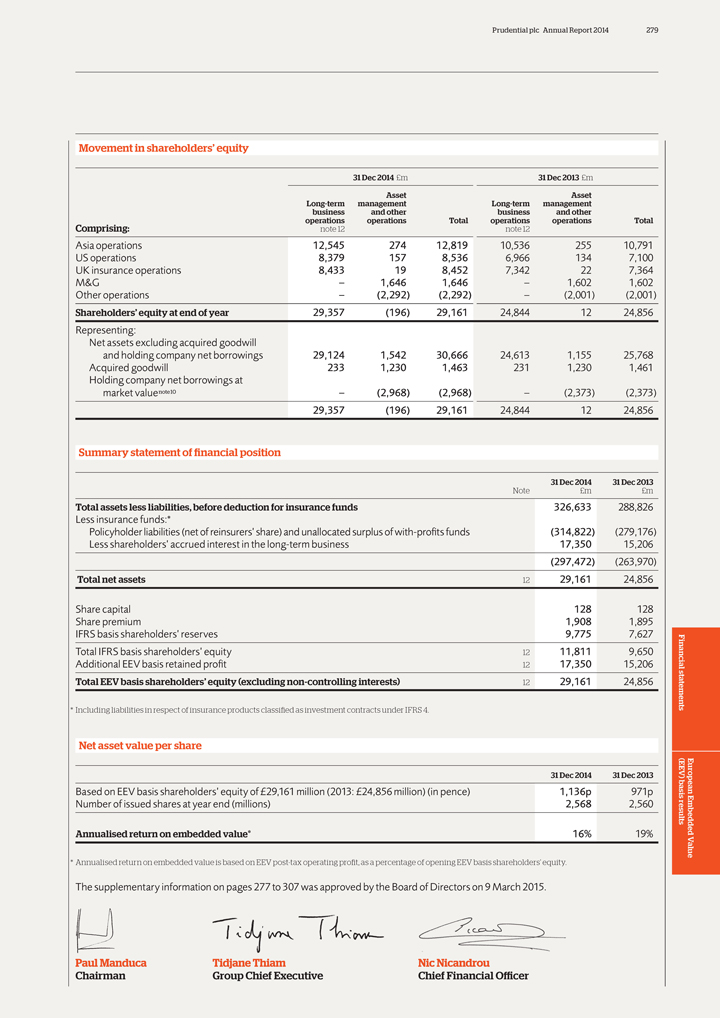
Prudential plc Annual Report 2014 279
Movement in
shareholders’ equity
| 31 | Dec 2014 £m 31 Dec 2013 £m |
Asset Asset
Long-term management Long-term management
business and other business and other
operations operations Total operations operations Total
Comprising: note 12 note 12
Asia operations 12,545 274 12,819 10,536 255
10,791
US operations 8,379 157 8,536 6,966 134 7,100
UK insurance operations
8,433 19 8,452 7,342 22 7,364
M&G – 1,646 1,646 – 1,602 1,602
Other operations –(2,292)(2,292) –(2,001)(2,001)
Shareholders’
equity at end of year 29,357(196) 29,161 24,844 12 24,856
Representing:
Net
assets excluding acquired goodwill
and holding company net borrowings 29,124 1,542 30,666 24,613 1,155 25,768
Acquired goodwill 233 1,230 1,463 231 1,230 1,461
Holding company net borrowings at
market valuenote10 –(2,968)(2,968) –(2,373)(2,373)
29,357(196)
29,161 24,844 12 24,856
Summary statement of financial position
| 31 | Dec 2014 31 Dec 2013 |
Note £m £m
Total assets less liabilities, before deduction for insurance
funds 326,633 288,826
Less insurance funds:*
Policyholder liabilities (net of
reinsurers’ share) and unallocated surplus of with-profits funds(314,822)(279,176)
Less shareholders’ accrued interest in the long-term business 17,350
15,206
(297,472)(263,970)
Total net assets 12 29,161 24,856
Share capital 128 128
Share premium 1,908 1,895
IFRS basis shareholders’ reserves 9,775 7,627
Total IFRS basis shareholders’ equity
12 11,811 9,650
Additional EEV basis retained profit 12 17,350 15,206
Total
EEV basis shareholders’ equity (excluding non-controlling interests) 12 29,161 24,856
| * | Including liabilities in respect of insurance products classified as investment contracts under IFRS 4. |
Net asset value per share
| 31 | Dec 2014 31 Dec 2013 |
Based on EEV basis shareholders’ equity of £29,161 million (2013: £24,856 million) (in pence) 1,136p 971p
Number of issued shares at year end (millions) 2,568 2,560
Annualised return on embedded
value* 16% 19%
* Annualised return on embedded value is based on EEV post-tax operating profit, as a percentage of opening EEV basis shareholders’ equity.
The supplementary information on pages 277 to 307 was approved by the Board of Directors on 9 March 2015.
Paul Manduca Tidjane Thiam Nic Nicandrou
Chairman Group Chief Executive Chief Financial
Officer
European Embedded Value Financial statements (EEV basis) results
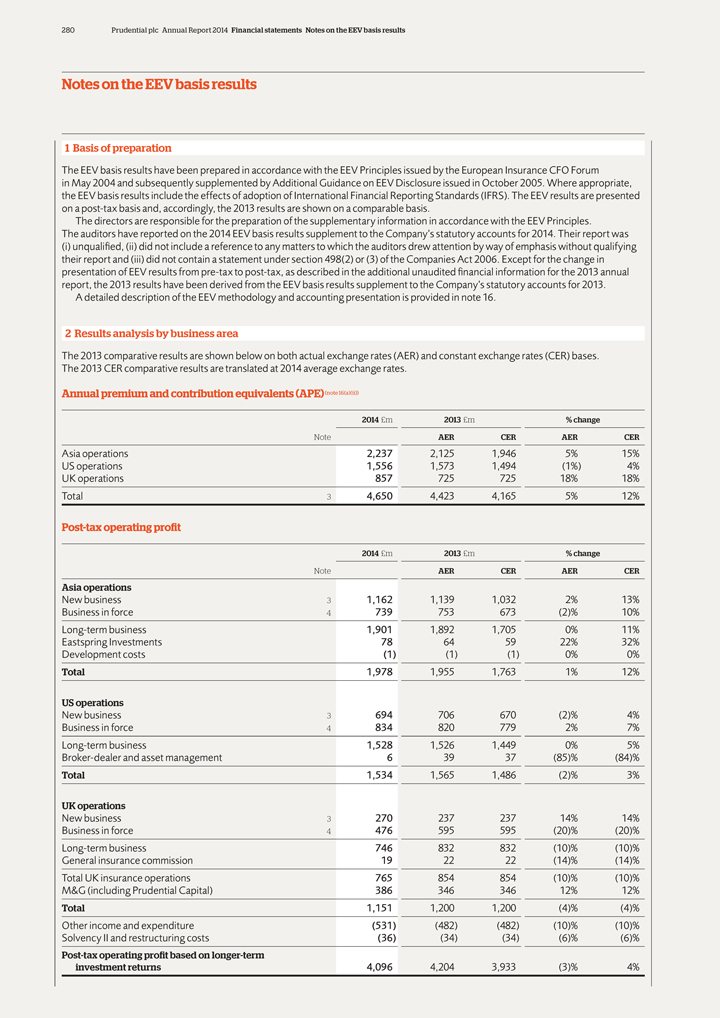
280 Prudential plc Annual Report 2014 Financial statements Notes on the EEV basis results
Notes on the EEV basis results
| 1 | Basis of preparation |
The EEV basis results have been prepared in accordance with the EEV Principles issued by the European Insurance CFO Forum in May 2004 and subsequently supplemented by
Additional Guidance on EEV Disclosure issued in October 2005. Where appropriate, the EEV basis results include the effects of adoption of International Financial Reporting Standards (IFRS). The EEV results are presented on a post-tax basis and,
accordingly, the 2013 results are shown on a comparable basis.
The directors are responsible for the preparation of the supplementary information in accordance
with the EEV Principles. The auditors have reported on the 2014 EEV basis results supplement to the Company’s statutory accounts for 2014. Their report was (i) unqualified, (ii) did not include a reference to any matters to which the
auditors drew attention by way of emphasis without qualifying their report and (iii) did not contain a statement under section 498(2) or (3) of the Companies Act 2006. Except for the change in presentation of EEV results from pre-tax to
post-tax, as described in the additional unaudited financial information for the 2013 annual report, the 2013 results have been derived from the EEV basis results supplement to the Company’s statutory accounts for 2013.
A detailed description of the EEV methodology and accounting presentation is provided in note 16.
| 2 | Results analysis by business area |
The 2013 comparative results are shown below on both actual exchange rates (AER) and constant exchange rates (CER) bases. The 2013 CER comparative results are translated
at 2014 average exchange rates.
Annual premium and contribution equivalents (APE) (note 16(a)(ii))
2014 £m 2013 £ m% change
Note AER CER AER CER
Asia operations 2,237 2,125 1,946 5% 15%
US operations 1,556 1,573 1,494(1%) 4%
UK operations 857 725 725 18% 18%
Total 3 4,650 4,423 4,165 5% 12%
Post-tax operating profit
2014 £m 2013 £ m% change
Note AER CER AER CER
Asia operations
New business 3 1,162 1,139 1,032 2% 13%
Business in force 4 739 753 673(2)% 10%
Long-term business 1,901 1,892 1,705 0% 11%
Eastspring Investments 78 64 59 22% 32%
Development costs(1)(1)(1) 0% 0%
Total 1,978 1,955 1,763 1% 12%
US operations
New business 3 694 706 670(2)% 4%
Business in force 4 834 820 779 2% 7%
Long-term business 1,528 1,526 1,449 0% 5%
Broker-dealer and asset management 6 39 37(85)%(84)%
Total 1,534 1,565 1,486(2)% 3%
UK operations
New business 3 270 237 237 14% 14%
Business in force 4 476 595 595(20)%(20)%
Long-term business 746 832 832(10)%(10)%
General insurance commission 19 22 22(14)%(14)%
Total UK insurance operations 765 854
854(10)%(10)%
M&G (including Prudential Capital) 386 346 346 12% 12%
Total 1,151 1,200 1,200(4)%(4)%
Other income and
expenditure(531)(482)(482)(10)%(10)%
Solvency II and restructuring costs(36)(34)(34)(6)%(6)%
Post-tax operating profit based on longer-term
investment returns 4,096 4,204 3,933(3)% 4%
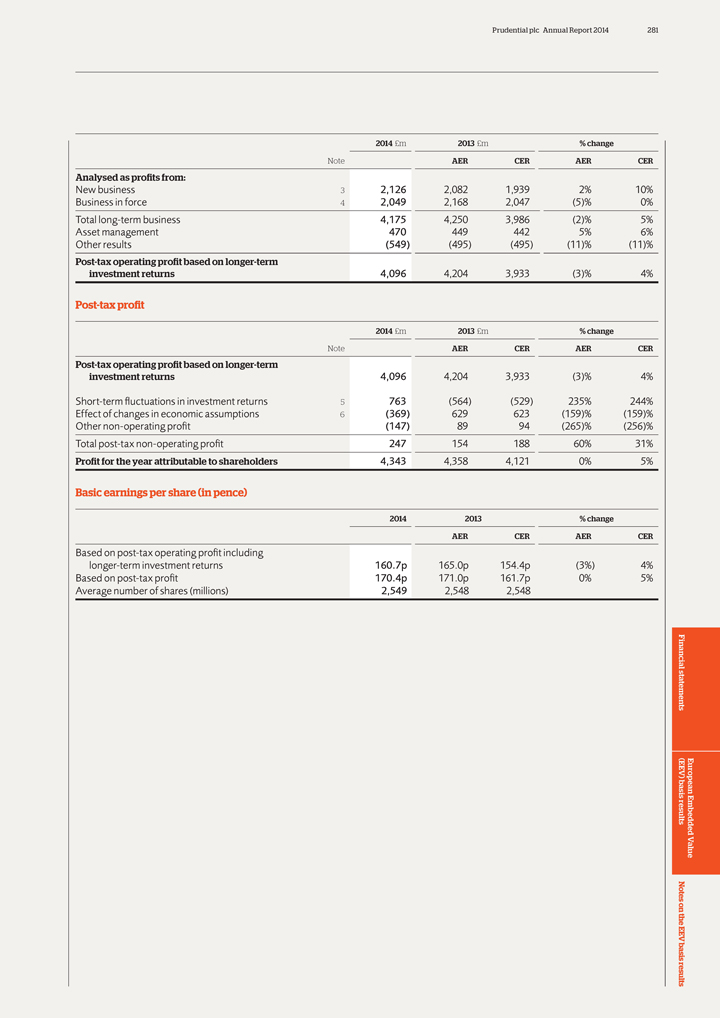
Prudential plc Annual Report 2014 281
2014
£m 2013 £ m% change
Note AER CER AER CER
Analysed as profits
from:
New business 3 2,126 2,082 1,939 2% 10%
Business in force 4 2,049 2,168
2,047(5)% 0%
Total long-term business 4,175 4,250 3,986(2)% 5%
Asset
management 470 449 442 5% 6%
Other results(549)(495)(495)(11)%(11)%
Post-tax
operating profit based on longer-term
investment returns 4,096 4,204 3,933(3)% 4%
Post-tax profit
2014 £m 2013 £ m% change
Note AER CER AER CER
Post-tax operating profit based on longer-term
investment returns 4,096 4,204 3,933(3)% 4%
Short-term fluctuations in investment returns 5
763(564)(529) 235% 244%
Effect of changes in economic assumptions 6(369) 629 623(159)%(159)%
Other non-operating profit(147) 89 94(265)%(256)%
Total post-tax non-operating profit 247 154
188 60% 31%
Profit for the year attributable to shareholders 4,343 4,358 4,121 0% 5%
Basic earnings per share (in pence)
2014 2013% change
AER CER AER CER
Based on post-tax operating profit including
longer-term investment returns 160.7p 165.0p 154.4p(3%) 4%
Based on post-tax profit 170.4p
171.0p 161.7p 0% 5%
Average number of shares (millions) 2,549 2,548 2,548
European Embedded Value
Financial statements (EEV basis) results Notes on the
EEV basis results
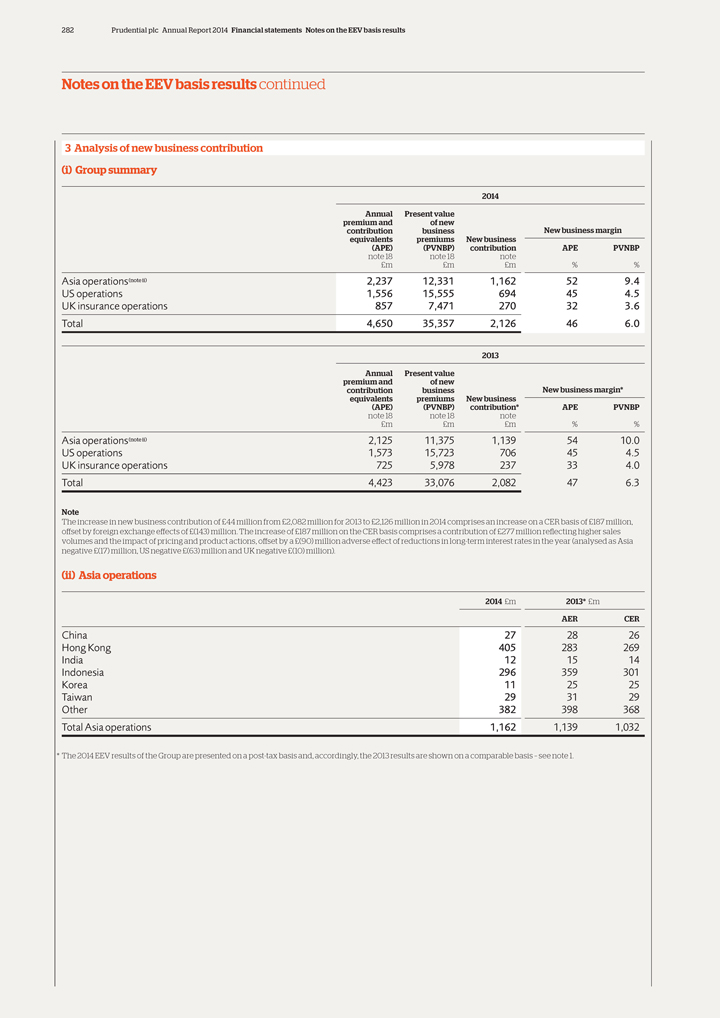
282 Prudential plc Annual Report 2014 Financial statements Notes on the EEV basis results
Notes on the EEV basis results continued
| 3 | Analysis of new business contribution |
| (i) | Group summary |
2014
Annual Present value
premium and of new
contribution business New business margin
equivalents premiums New business
(APE)(PVNBP) contribution APE PVNBP
note 18 note 18 note
£m £m £m%%
Asia operations(noteii) 2,237 12,331 1,162 52 9.4
US operations 1,556 15,555 694 45 4.5
UK insurance operations 857 7,471 270 32 3.6
Total 4,650 35,357 2,126 46 6.0
2013
Annual Present value
premium and of new
contribution business New business margin*
equivalents premiums New business
(APE)(PVNBP) contribution* APE PVNBP
note 18 note 18 note
£m £m £m%%
Asia operations(noteii) 2,125 11,375 1,139 54 10.0
US operations 1,573 15,723 706 45 4.5
UK insurance operations 725 5,978 237 33 4.0
Total 4,423 33,076 2,082 47 6.3
Note
The increase in new business contribution of £44 million from
£2,082 million for 2013 to £2,126 million in 2014 comprises an increase on a CER basis of £187 million,
offset by foreign exchange
effects of £(143) million. The increase of £187 million on the CER basis comprises a contribution of £277 million reflecting higher sales
volumes and the impact of pricing and product actions, offset by a £(90) million adverse effect of reductions in long-term interest rates in the year (analysed as Asia
negative £(17) million, US negative £(63) million and UK negative £(10) million).
(ii) Asia operations
2014 £m 2013* £m
AER CER
China 27 28 26
Hong Kong 405 283 269
India 12 15 14
Indonesia 296 359 301
Korea 11 25 25
Taiwan 29 31 29
Other 382 398 368
Total Asia operations 1,162 1,139 1,032
* The 2014 EEV results of the Group are presented on a
post-tax basis and, accordingly, the 2013 results are shown on a comparable basis – see note 1.
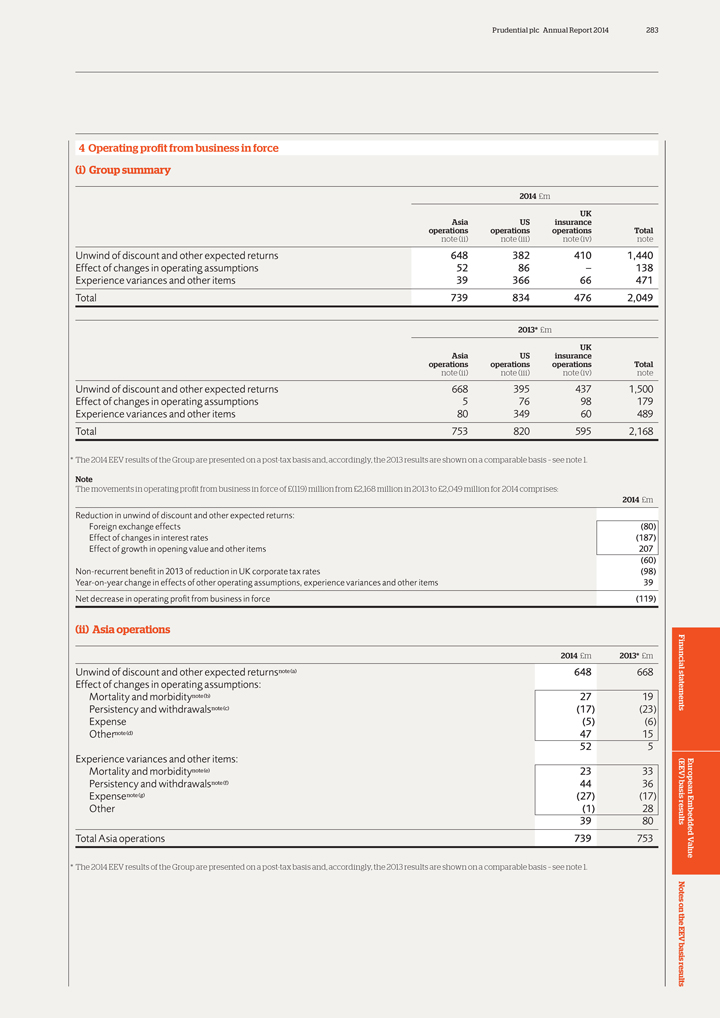
Prudential plc Annual Report 2014 283
| 4 | Operating profit from business in force |
| (i) | Group summary |
2014 £m
UK
Asia US insurance
operations operations operations Total
note (ii) note (iii) note (iv) note
Unwind of discount and other expected
returns 648 382 410 1,440
Effect of changes in operating assumptions 52 86 – 138
Experience variances and other items 39 366 66 471
Total 739 834 476 2,049
2013* £m
UK
Asia US insurance
operations operations operations Total
note (ii) note (iii) note (iv) note
Unwind of discount and other expected
returns 668 395 437 1,500
Effect of changes in operating assumptions 5 76 98 179
Experience variances and other items 80 349 60 489
Total 753 820 595 2,168
* The 2014 EEV results of the Group are presented on a post-tax basis and, accordingly, the 2013 results are shown on a comparable basis – see note 1.
Note
The movements in operating profit from business in force of £(119) million
from £2,168 million in 2013 to £2,049 million for 2014 comprises:
2014 £m
Reduction in unwind of discount and other expected returns:
Foreign exchange effects(80)
Effect of changes in interest rates(187)
Effect of growth in opening value
and other items 207
| (60) |
Non-recurrent benefit in 2013 of reduction in UK corporate tax rates(98)
Year-on-year change in effects of other operating assumptions, experience
variances and other items 39
Net decrease in operating profit from business in force(119)
(ii) Asia operations
2014 £m 2013* £m
Unwind of discount and other expected returnsnote(a) 648 668
Effect of changes in operating
assumptions:
Mortality and morbiditynote(b) 27 19
Persistency and
withdrawalsnote(c)(17)(23)
Expense(5)(6)
Othernote(d) 47 15
| 52 | 5 |
Experience variances and other items:
Mortality and morbiditynote(e) 23 33
Persistency and withdrawalsnote(f) 44 36
Expensenote(g)(27)(17)
Other(1) 28
| 39 | 80 |
Total Asia operations 739 753
* The 2014 EEV results of the Group are presented on a
post-tax basis and, accordingly, the 2013 results are shown on a comparable basis – see note 1.
European Embedded Value
Financial statements (EEV basis) results Notes on the EEV basis results
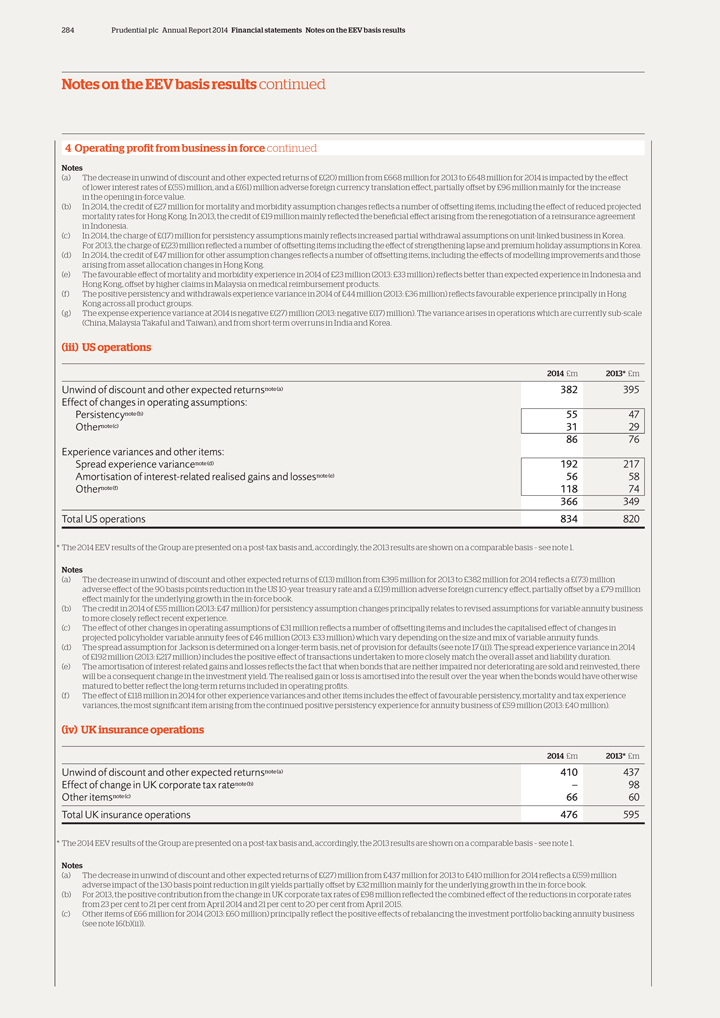
284 Prudential plc Annual Report 2014 Financial statements Notes on the EEV basis results
Notes on the EEV basis results continued
| 4 | Operating profit from business in force continued |
Notes
(a) The decrease in unwind of discount and other
expected returns of £(20) million from £668 million for 2013 to £648 million for 2014 is impacted by the effect of lower interest rates of £(55) million, and a £(61) million adverse foreign
currency translation effect, partially offset by £96 million mainly for the increase in the opening in-force value.
(b) In 2014, the credit of
£27 million for mortality and morbidity assumption changes reflects a number of offsetting items, including the effect of reduced projected mortality rates for Hong Kong. In 2013, the credit of £19 million mainly reflected the
beneficial effect arising from the renegotiation of a reinsurance agreement in Indonesia.
(c) In 2014, the charge of £(17) million for persistency
assumptions mainly reflects increased partial withdrawal assumptions on unit-linked business in Korea. For 2013, the charge of £(23) million reflected a number of offsetting items including the effect of strengthening lapse and premium
holiday assumptions in Korea. (d) In 2014, the credit of £47 million for other assumption changes reflects a number of offsetting items, including the effects of modelling improvements and those arising from asset allocation changes
in Hong Kong.
(e) The favourable effect of mortality and morbidity experience in 2014 of £23 million (2013: £33 million) reflects better than
expected experience in Indonesia and Hong Kong, offset by higher claims in Malaysia on medical reimbursement products.
(f) The positive persistency and withdrawals
experience variance in 2014 of £44 million (2013: £36 million) reflects favourable experience principally in Hong Kong across all product groups.
(g) The expense experience variance at 2014 is negative £(27) million (2013: negative £(17) million). The variance arises in operations which
are currently sub-scale (China, Malaysia Takaful and Taiwan), and from short-term overruns in India and Korea.
(iii) US operations
2014 £m 2013* £m
Unwind of discount and other expected returnsnote(a) 382 395
Effect of changes in operating assumptions:
Persistencynote(b) 55 47
Othernote(c) 31 29
| 86 | 76 |
Experience variances and other items:
Spread experience variancenote(d) 192 217
Amortisation of interest-related realised gains and lossesnote(e) 56 58
Othernote(f) 118 74
366 349
Total US operations 834 820
* The 2014 EEV results of the Group are presented on a post-tax
basis and, accordingly, the 2013 results are shown on a comparable basis – see note 1.
Notes
(a) The decrease in unwind of discount and other expected returns of £(13) million from £395 million for 2013 to £382 million for 2014 reflects a
£(73) million adverse effect of the 90 basis points reduction in the US 10-year treasury rate and a £(19) million adverse foreign currency effect, partially offset by a £79 million effect mainly for the underlying
growth in the in-force book.
(b) The credit in 2014 of £55 million (2013: £47 million) for persistency assumption changes principally relates to
revised assumptions for variable annuity business to more closely reflect recent experience.
(c) The effect of other changes in operating assumptions of
£31 million reflects a number of offsetting items and includes the capitalised effect of changes in projected policyholder variable annuity fees of £46 million (2013: £33 million) which vary depending on the size and mix
of variable annuity funds. (d) The spread assumption for Jackson is determined on a longer-term basis, net of provision for defaults (see note 17 (ii)). The spread experience variance in 2014 of £192 million (2013: £217
million) includes the positive effect of transactions undertaken to more closely match the overall asset and liability duration. (e) The amortisation of interest-related gains and losses reflects the fact that when bonds that are neither
impaired nor deteriorating are sold and reinvested, there will be a consequent change in the investment yield. The realised gain or loss is amortised into the result over the year when the bonds would have otherwise matured to better reflect the
long-term returns included in operating profits.
(f) The effect of £118 million in 2014 for other experience variances and other items includes the
effect of favourable persistency, mortality and tax experience variances, the most significant item arising from the continued positive persistency experience for annuity business of £59 million (2013: £40 million).
(iv) UK insurance operations
2014 £m 2013* £m
Unwind of discount and other expected returnsnote(a) 410 437
Effect of change in UK corporate
tax ratenote(b) – 98
Other itemsnote(c) 66 60
Total UK insurance
operations 476 595
* The 2014 EEV results of the Group are presented on a post-tax basis and, accordingly, the 2013 results are shown on a comparable basis –
see note 1.
Notes
(a) The decrease in unwind of discount and other expected
returns of £(27) million from £437 million for 2013 to £410 million for 2014 reflects a £(59) million
adverse impact of
the 130 basis point reduction in gilt yields partially offset by £32 million mainly for the underlying growth in the in-force book.
(b) For 2013, the
positive contribution from the change in UK corporate tax rates of £98 million reflected the combined effect of the reductions in corporate rates
from
23 per cent to 21 per cent from April 2014 and 21 per cent to 20 per cent from April 2015.
(c) Other items of £66 million for 2014
(2013: £60 million) principally reflect the positive effects of rebalancing the investment portfolio backing annuity business
(see note 16(b)(ii)).
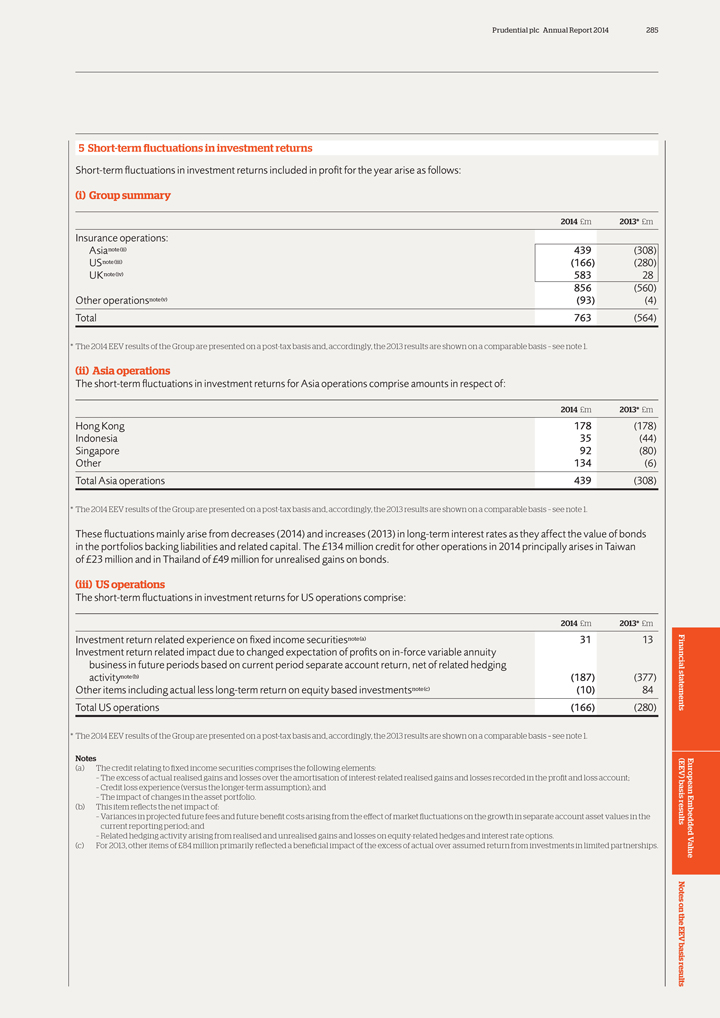
Prudential plc Annual Report 2014 285
| 5 | Short-term fluctuations in investment returns |
Short-term fluctuations in investment returns included in profit for the year arise as follows:
| (i) | Group summary |
2014 £m 2013* £m
Insurance operations:
Asianote(ii) 439(308)
USnote(iii)(166)(280)
UKnote(iv) 583 28
856(560)
Other operationsnote(v)(93)(4)
Total 763(564)
* The 2014 EEV results of the Group are presented on a post-tax basis and, accordingly, the 2013 results are shown on a comparable basis – see note 1.
(ii) Asia operations
The short-term fluctuations in investment returns for Asia operations
comprise amounts in respect of:
2014 £m 2013* £m
Hong Kong
178(178)
Indonesia 35(44)
Singapore 92(80)
Other 134(6)
Total Asia operations 439(308)
* The 2014 EEV results of the Group are presented on a post-tax basis and, accordingly, the 2013 results are shown on a comparable basis – see note 1.
These fluctuations mainly arise from decreases (2014) and increases (2013) in long-term interest rates as they affect the value of bonds in the portfolios backing
liabilities and related capital. The £134 million credit for other operations in 2014 principally arises in Taiwan of £23 million and in Thailand of £49 million for unrealised gains on bonds.
(iii) US operations
The short-term fluctuations in investment returns for US operations
comprise:
2014 £m 2013* £m
Investment return related experience
on fixed income securitiesnote(a) 31 13
Investment return related impact due to changed expectation of profits on in-force variable annuity
business in future periods based on current period separate account return, net of related hedging
activitynote(b)(187)(377)
Other items including actual less long-term return on equity based
investmentsnote(c)(10) 84
Total US operations(166)(280)
* The 2014 EEV
results of the Group are presented on a post-tax basis and, accordingly, the 2013 results are shown on a comparable basis – see note 1.
Notes
| (a) | The credit relating to fixed income securities comprises the following elements: |
– The excess of actual realised gains and losses over the amortisation of interest-related realised gains and losses recorded
in the profit and loss account;
– Credit loss experience (versus the longer-term assumption); and
– The impact of changes in the asset portfolio.
| (b) | This item reflects the net impact of: |
– Variances in projected future fees and future benefit costs arising from the effect of market fluctuations on the growth in separate account asset values in the
current reporting period; and
– Related hedging activity arising from realised and unrealised gains and losses on equity-related hedges and interest rate
options.
(c) For 2013, other items of £84 million primarily reflected a beneficial impact of the excess of actual over assumed return from investments
in limited partnerships.
European Embedded Value
Financial statements (EEV
basis) results Notes on the EEV basis results
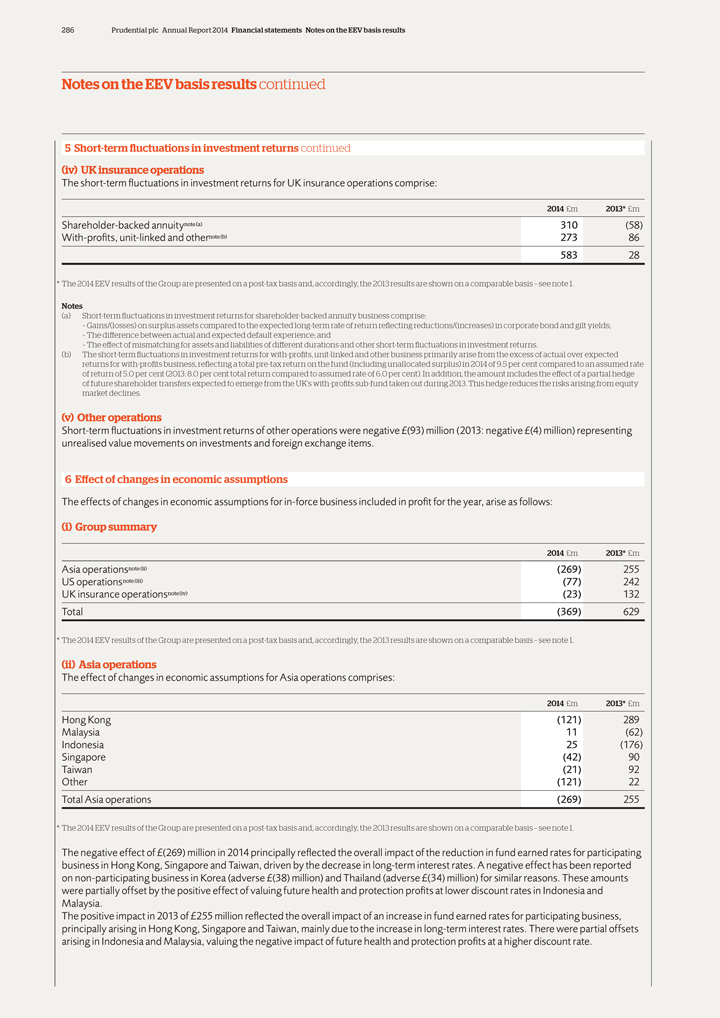
286 Prudential plc Annual Report 2014 Financial statements Notes on the EEV basis results
Notes on the EEV basis results continued
5 Short-term fluctuations in investment returns
continued
(iv) UK insurance operations
The short-term fluctuations in
investment returns for UK insurance operations comprise:
2014 £m 2013* £m
Shareholder-backed annuitynote(a) 310(58)
With-profits, unit-linked and othernote(b) 273 86
583 28
* The 2014 EEV results of the Group are presented on a post-tax basis
and, accordingly, the 2013 results are shown on a comparable basis – see note 1.
Notes
(a) Short-term fluctuations in investment returns for shareholder-backed annuity business comprise:
– Gains/(losses) on surplus assets compared to the expected long-term rate of return reflecting reductions/(increases) in corporate bond and gilt yields;
– The difference between actual and expected default experience; and
– The effect of
mismatching for assets and liabilities of different durations and other short-term fluctuations in investment returns.
(b) The short-term fluctuations in
investment returns for with-profits, unit-linked and other business primarily arise from the excess of actual over expected
returns for with-profits business,
reflecting a total pre-tax return on the fund (including unallocated surplus) in 2014 of 9.5 per cent compared to an assumed rate
of return of 5.0 per
cent (2013: 8.0 per cent total return compared to assumed rate of 6.0 per cent). In addition, the amount includes the effect of a partial hedge
of future
shareholder transfers expected to emerge from the UK’s with-profits sub-fund taken out during 2013. This hedge reduces the risks arising from equity
market
declines.
(v) Other operations
Short-term fluctuations in investment returns
of other operations were negative £(93) million (2013: negative £(4) million) representing
unrealised value movements on investments and
foreign exchange items.
6 Effect of changes in economic assumptions
The
effects of changes in economic assumptions for in-force business included in profit for the year, arise as follows:
(i) Group summary
2014 £m 2013* £m
Asia operationsnote(ii)(269) 255
US operationsnote(iii)(77) 242
UK insurance operationsnote(iv)(23) 132
Total(369) 629
* The 2014 EEV results of the Group are presented on a post-tax basis and,
accordingly, the 2013 results are shown on a comparable basis – see note 1.
(ii) Asia operations
The effect of changes in economic assumptions for Asia operations comprises:
2014 £m
2013* £m
Hong Kong(121) 289
Malaysia 11(62)
Indonesia 25(176)
Singapore(42) 90
Taiwan(21) 92
Other(121) 22
Total Asia operations(269) 255
* The 2014 EEV results of the Group are presented on a post-tax
basis and, accordingly, the 2013 results are shown on a comparable basis – see note 1.
The negative effect of £(269) million in 2014 principally
reflected the overall impact of the reduction in fund earned rates for participating
business in Hong Kong, Singapore and Taiwan, driven by the decrease in
long-term interest rates. A negative effect has been reported
on non-participating business in Korea (adverse £(38) million) and Thailand (adverse
£(34) million) for similar reasons. These amounts
were partially offset by the positive effect of valuing future health and protection profits at lower
discount rates in Indonesia and
Malaysia.
The positive impact in 2013 of
£255 million reflected the overall impact of an increase in fund earned rates for participating business,
principally arising in Hong Kong, Singapore
and Taiwan, mainly due to the increase in long-term interest rates. There were partial offsets
arising in Indonesia and Malaysia, valuing the negative impact of
future health and protection profits at a higher discount rate.
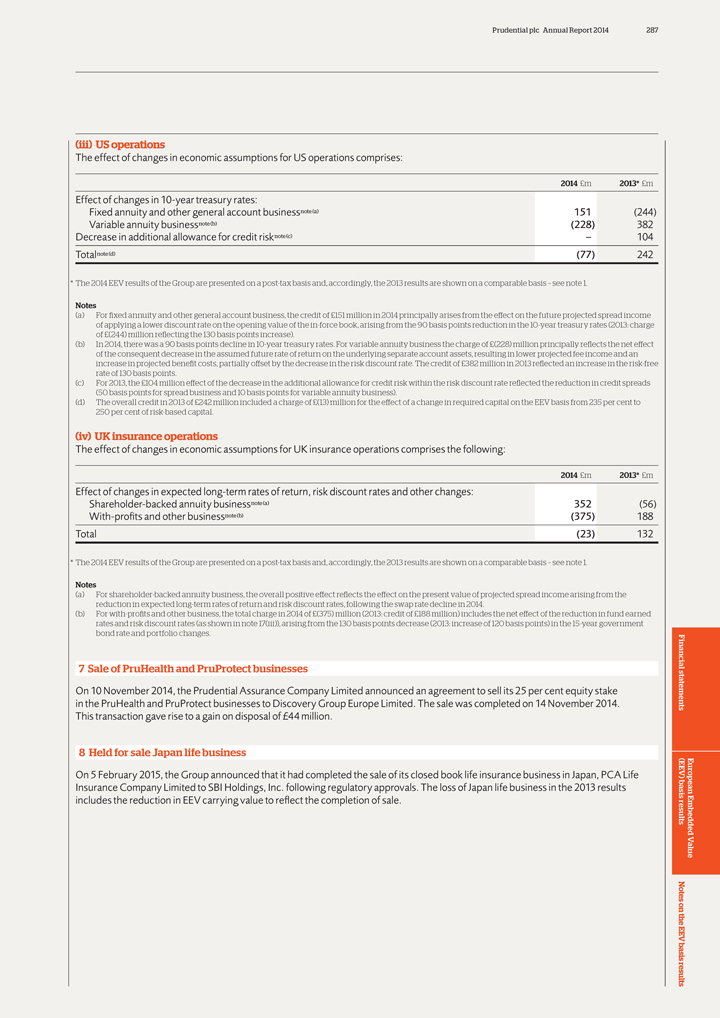
Prudential plc Annual Report 2014 287
(iii) US
operations
The effect of changes in economic assumptions for US operations comprises:
2014 £m 2013* £m
Effect of changes in 10-year treasury rates:
Fixed annuity and other general account businessnote(a) 151(244)
Variable annuity
businessnote(b)(228) 382
Decrease in additional allowance for credit risknote(c) – 104
Totalnote(d)(77) 242
* The 2014 EEV results of the Group are presented on a post-tax basis
and, accordingly, the 2013 results are shown on a comparable basis – see note 1.
Notes
(a) For fixed annuity and other general account business, the credit of £151 million in 2014 principally arises from the effect on the future projected spread income of
applying a lower discount rate on the opening value of the in-force book, arising from the 90 basis points reduction in the 10-year treasury rates (2013: charge of £(244) million reflecting the 130 basis points increase).
(b) In 2014, there was a 90 basis points decline in 10-year treasury rates. For variable annuity business the charge of £(228) million principally reflects the net
effect of the consequent decrease in the assumed future rate of return on the underlying separate account assets, resulting in lower projected fee income and an increase in projected benefit costs, partially offset by the decrease in the risk
discount rate. The credit of £382 million in 2013 reflected an increase in the risk-free rate of 130 basis points.
(c) For 2013, the
£104 million effect of the decrease in the additional allowance for credit risk within the risk discount rate reflected the reduction in credit spreads (50 basis points for spread business and 10 basis points for variable annuity
business).
(d) The overall credit in 2013 of £242 million included a charge of £(13) million for the effect of a change in required capital
on the EEV basis from 235 per cent to 250 per cent of risk-based capital.
(iv) UK insurance operations
The effect of changes in economic assumptions for UK insurance operations comprises the following:
2014 £m 2013* £m
Effect of changes in expected long-term rates of return, risk
discount rates and other changes:
Shareholder-backed annuity businessnote(a) 352(56)
With-profits and other businessnote(b)(375) 188
Total(23) 132
* The 2014 EEV results of the Group are presented on a post-tax basis and, accordingly, the 2013 results are shown on a comparable basis – see note 1.
Notes
(a) For shareholder-backed annuity business, the overall positive effect reflects the
effect on the present value of projected spread income arising from the
reduction in expected long-term rates of return and risk discount rates, following the swap
rate decline in 2014.
(b) For with-profits and other business, the total charge in 2014 of £(375) million (2013: credit of £188 million) includes
the net effect of the reduction in fund earned
rates and risk discount rates (as shown in note 17(iii)), arising from the 130 basis points decrease (2013: increase
of 120 basis points) in the 15-year government
bond rate and portfolio changes.
| 7 | Sale of PruHealth and PruProtect businesses |
On 10 November 2014, the Prudential Assurance Company Limited announced an agreement to sell its 25 per cent equity stake
in the PruHealth and PruProtect businesses to Discovery Group Europe Limited. The sale was completed on 14 November 2014.
This transaction gave rise to a gain on disposal of £44 million.
| 8 | Held for sale Japan life business |
On 5 February 2015, the Group announced that it had completed the sale of its closed book life insurance business in Japan, PCA Life
Insurance Company Limited to SBI Holdings, Inc. following regulatory approvals. The loss of Japan life business in the 2013 results
includes the reduction in EEV carrying value to reflect the completion of sale.
European
Embedded Value
Financial statements (EEV basis) results Notes on the EEV basis results
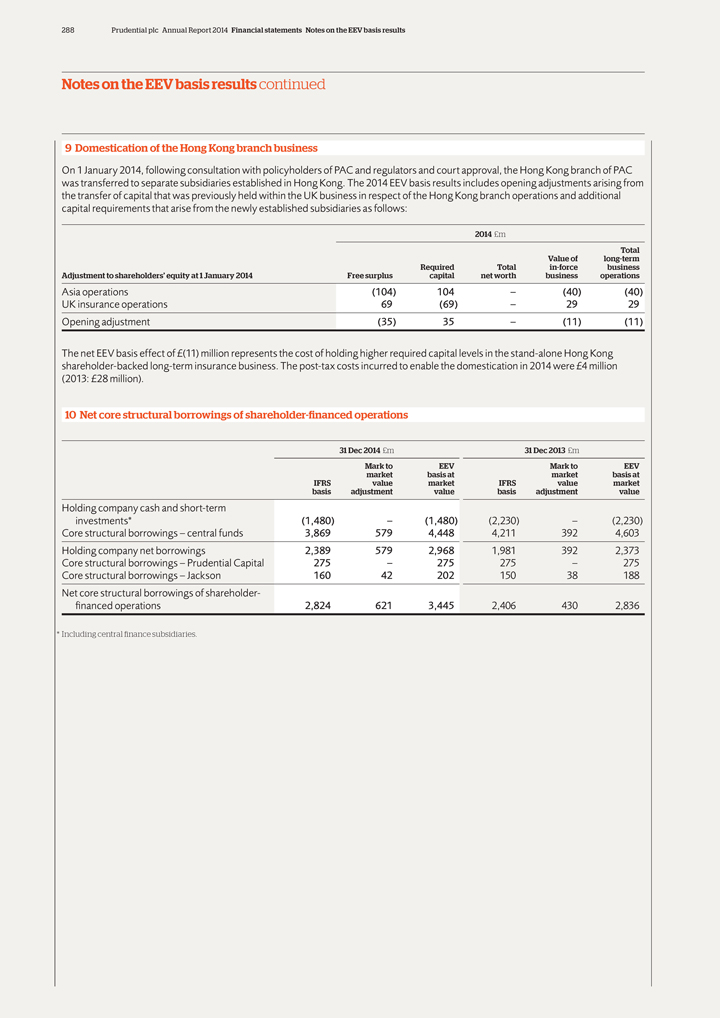
288 Prudential plc Annual Report 2014 Financial statements Notes on the EEV basis results
Notes on the EEV basis results continued
9 Domestication of the Hong Kong branch business
On 1 January 2014, following consultation with policyholders of PAC and regulators and court approval, the Hong Kong branch of PAC
was transferred to separate subsidiaries established in Hong Kong. The 2014 EEV basis results includes opening adjustments arising from
the transfer of capital that was previously held within the UK business in respect of the Hong Kong branch operations and additional
capital requirements that arise from the newly established subsidiaries as follows:
2014
£m
Total
Value of long-term
Required Total in-force business
Adjustment to shareholders’ equity at 1 January
2014 Free surplus capital net worth business operations
Asia operations(104) 104 –(40)(40)
UK insurance operations 69(69) – 29 29
Opening adjustment(35) 35 –(11)(11)
The net EEV basis effect of £(11) million represents the cost of holding higher required capital levels in the stand-alone Hong Kong
shareholder-backed long-term insurance business. The post-tax costs incurred to enable the domestication in 2014 were £4 million
(2013: £28 million).
| 10 | Net core structural borrowings of shareholder-financed operations |
| 31 | Dec 2014 £m 31 Dec 2013 £m |
Mark to EEV Mark to EEV
market basis at market basis at
IFRS value market IFRS value market
basis adjustment value basis adjustment value
Holding company cash and short-term
investments*(1,480) –(1,480)(2,230) –(2,230)
Core structural borrowings – central funds 3,869 579 4,448 4,211 392 4,603
Holding company net borrowings 2,389 579 2,968 1,981 392 2,373
Core
structural borrowings – Prudential Capital 275 – 275 275 – 275
Core structural borrowings – Jackson 160 42 202 150 38 188
Net core structural borrowings of shareholder-
financed operations 2,824 621 3,445 2,406 430
2,836
| * | Including central finance subsidiaries. |
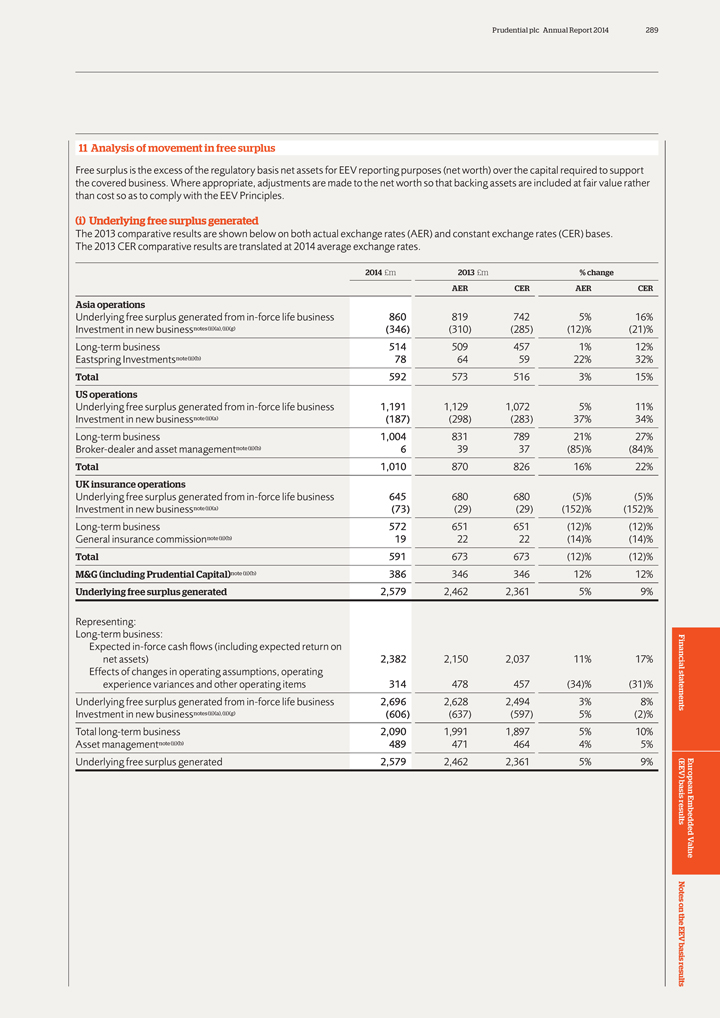
Prudential plc Annual Report 2014 289
| 11 | Analysis of movement in free surplus |
Free surplus is the excess of the regulatory basis net assets for EEV reporting purposes (net worth) over the capital required to support
the covered business. Where appropriate, adjustments are made to the net worth so that backing assets are included at fair value rather
than cost so as to comply with the EEV Principles.
| (i) | Underlying free surplus generated |
The 2013 comparative results are shown below on both actual exchange rates (AER) and constant exchange rates (CER) bases.
The 2013 CER comparative results are translated at 2014 average exchange rates.
2014 £m
2013 £m% change
AER CER AER CER
Asia operations
Underlying free surplus generated from in-force life business 860 819 742 5% 16%
Investment in
new businessnotes(ii)(a),(ii)(g)(346)(310)(285)(12)%(21)%
Long-term business 514 509 457 1% 12%
Eastspring Investmentsnote(ii)(b) 78 64 59 22% 32%
Total 592 573 516 3% 15%
US operations
Underlying free surplus generated from in-force life business 1,191 1,129 1,072
5% 11%
Investment in new businessnote(ii)(a)(187)(298)(283) 37% 34%
Long-term
business 1,004 831 789 21% 27%
Broker-dealer and asset managementnote(ii)(b) 6 39 37(85)%(84)%
Total 1,010 870 826 16% 22%
UK insurance operations
Underlying free surplus generated from in-force life business 645 680 680(5)%(5)%
Investment
in new businessnote(ii)(a)(73)(29)(29)(152)%(152)%
Long-term business 572 651 651(12)%(12)%
General insurance commissionnote(ii)(b) 19 22 22(14)%(14)%
Total 591 673 673(12)%(12)%
M&G (including Prudential Capital)note (ii)(b) 386 346 346 12% 12%
Underlying free surplus generated 2,579 2,462 2,361 5% 9%
Representing:
Long-term business:
Expected in-force cash flows (including expected return
on
net assets) 2,382 2,150 2,037 11% 17%
Effects of changes in operating
assumptions, operating
experience variances and other operating items 314 478 457(34)%(31)%
Underlying free surplus generated from in-force life business 2,696 2,628 2,494 3% 8%
Investment in new businessnotes(ii)(a),(ii)(g)(606)(637)(597) 5%(2)%
Total
long-term business 2,090 1,991 1,897 5% 10%
Asset managementnote(ii)(b) 489 471 464 4% 5%
Underlying free surplus generated 2,579 2,462 2,361 5% 9%
European Embedded Value
Financial statements (EEV basis) results Notes on the EEV basis results
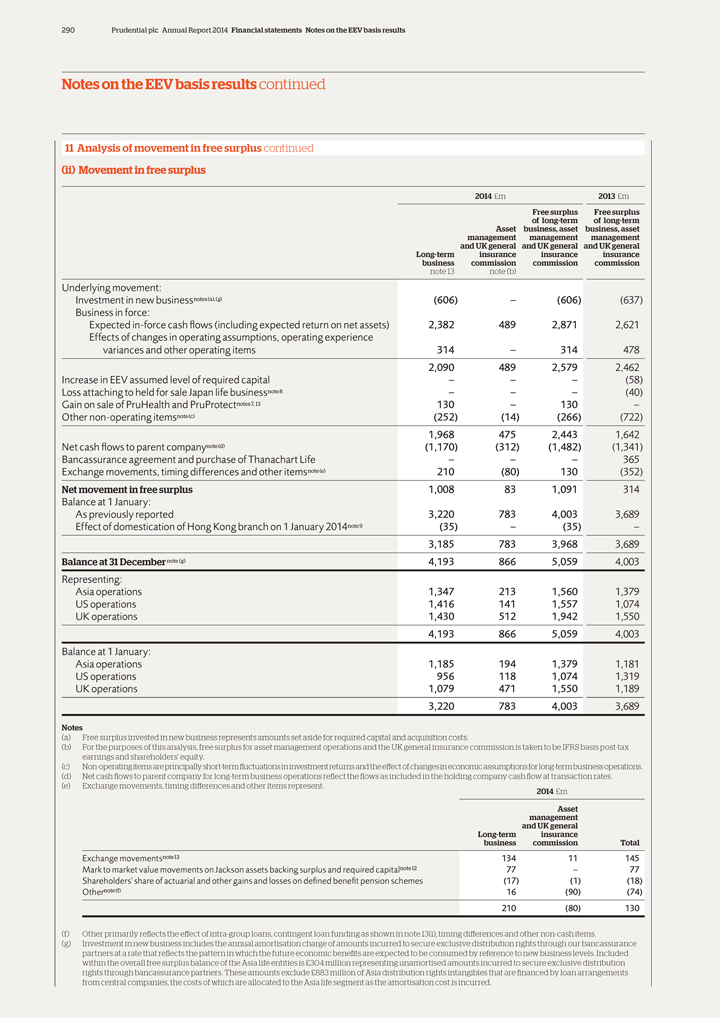
290 Prudential plc Annual Report 2014 Financial statements Notes on the EEV basis results
Notes on the EEV basis results continued
| 11 | Analysis of movement in free surplus continued |
(ii) Movement in free surplus
2014 £m 2013
£m
Free surplus Free surplus
of long-term of long-term
Asset business, asset business, asset
management management management
and UK general and UK general and UK general
Long-term insurance insurance insurance
business commission commission commission
note 13 note (b)
Underlying movement:
Investment in new businessnotes(a),(g)(606) –(606)(637)
Business in force:
Expected in-force cash flows (including expected return on net assets)
2,382 489 2,871 2,621
Effects of changes in operating assumptions, operating experience
variances and other operating items 314 – 314 478
2,090 489 2,579 2,462
Increase in EEV assumed level of required capital – – –(58)
Loss attaching to
held for sale Japan life businessnote8 – – –(40)
Gain on sale of PruHealth and PruProtectnotes7, 13 130 – 130 –
Other non-operating itemsnote(c)(252)(14)(266)(722)
1,968 475 2,443 1,642
Net cash flows to parent companynote(d)(1,170)(312)(1,482)(1,341)
Bancassurance agreement and
purchase of Thanachart Life – – – 365
Exchange movements, timing differences and other itemsnote(e) 210(80) 130(352)
Net movement in free surplus 1,008 83 1,091 314
Balance at 1 January:
As previously reported 3,220 783 4,003 3,689
Effect of domestication of Hong Kong branch on
1 January 2014note9(35) –(35) –
3,185 783 3,968 3,689
Balance
at 31 December note (g) 4,193 866 5,059 4,003
Representing:
Asia
operations 1,347 213 1,560 1,379
US operations 1,416 141 1,557 1,074
UK
operations 1,430 512 1,942 1,550
4,193 866 5,059 4,003
Balance at 1 January:
Asia operations 1,185 194 1,379 1,181
US operations 956 118 1,074 1,319
UK operations 1,079 471 1,550 1,189
3,220 783 4,003 3,689
Notes
| (a) | Free surplus invested in new business represents amounts set aside for required capital and acquisition costs. |
(b) For the purposes of this analysis, free surplus for asset management operations and the UK
general insurance commission is taken to be IFRS basis post-tax
earnings and shareholders’ equity.
(c) Non-operating items are principally short-term fluctuations in investment returns and the effect of changes in economic assumptions for long-term business operations.
(d) Net cash flows to parent company for long-term business operations reflect the flows as included in the holding company cash flow at transaction rates.
| (e) | Exchange movements, timing differences and other items represent: 2014 £m |
Asset
management
and UK general
Long-term insurance
business commission Total
Exchange movementsnote13 134 11 145
Mark to market value movements on Jackson assets backing surplus and required capitalnote12 77 – 77
Shareholders’ share of actuarial and other gains and losses on defined benefit pension schemes(17)(1)(18)
Othernote(f) 16(90)(74)
210(80) 130
(f) Other primarily reflects the effect of intra-group loans, contingent loan funding as shown in note 13(i), timing differences and other non-cash items.
(g) Investment in new business includes the annual amortisation charge of amounts incurred to secure exclusive distribution rights through our bancassurance
partners at a rate that reflects the pattern in which the future economic benefits are expected to be consumed by reference to new business levels. Included
within the overall free surplus balance of the Asia life entities is £304 million representing unamortised amounts incurred to secure exclusive distribution
rights through bancassurance partners. These amounts exclude £883 million of Asia distribution rights intangibles that are financed by loan arrangements
from central companies, the costs of which are allocated to the Asia life segment as the amortisation cost is incurred.
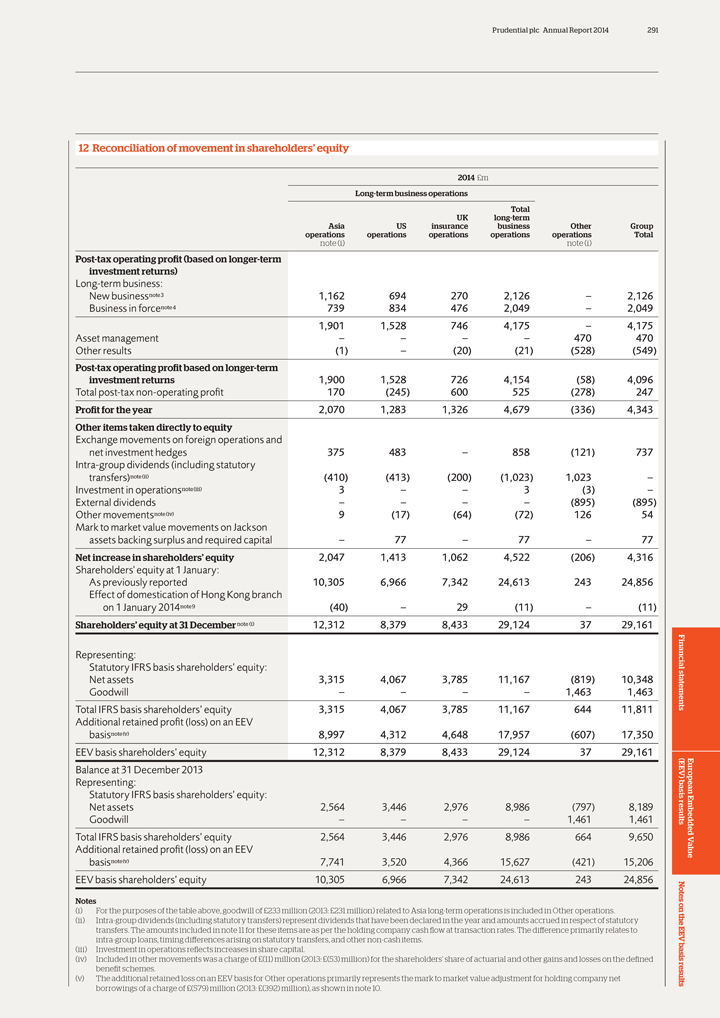
Prudential plc Annual Report 2014 291
| 12 | Reconciliation of movement in shareholders’ equity |
2014 £m
Long-term business operations
Total
UK long-term
Asia US insurance business Other Group
operations operations operations operations operations
Total
note (i) note (i)
Post-tax operating profit (based on longer-term
investment returns)
Long-term business:
New businessnote3 1,162 694 270 2,126 – 2,126
Business in forcenote4 739 834 476 2,049
– 2,049
1,901 1,528 746 4,175 – 4,175
Asset management –
– – – 470 470
Other results(1) –(20)(21)(528)(549)
Post-tax operating profit based on longer-term
investment returns 1,900 1,528
726 4,154(58) 4,096
Total post-tax non-operating profit 170(245) 600 525(278) 247
Profit for the year 2,070 1,283 1,326 4,679(336) 4,343
Other items taken directly to equity
Exchange movements on foreign operations and
net investment hedges 375 483
– 858(121) 737
Intra-group dividends (including statutory
transfers)note(ii)(410)(413)(200)(1,023) 1,023 –
Investment in
operationsnote(iii) 3 – – 3(3) –
External dividends – – – –(895)(895)
Other movementsnote(iv) 9(17)(64)(72) 126 54
Mark to market value movements on Jackson
assets backing surplus and required capital – 77 – 77 – 77
Net
increase in shareholders’ equity 2,047 1,413 1,062 4,522(206) 4,316
Shareholders’ equity at 1 January:
As previously reported 10,305 6,966 7,342 24,613 243 24,856
Effect of domestication of Hong
Kong branch
on 1 January 2014note9(40) – 29(11) –(11)
Shareholders’ equity at 31 December note (i) 12,312 8,379 8,433 29,124 37 29,161
Representing:
Statutory IFRS basis shareholders’ equity:
Net assets 3,315 4,067 3,785 11,167(819) 10,348
Goodwill – – – – 1,463
1,463
Total IFRS basis shareholders’ equity 3,315 4,067 3,785 11,167 644 11,811
Additional retained profit (loss) on an EEV
basisnote(v) 8,997 4,312 4,648 17,957(607) 17,350
EEV basis shareholders’ equity 12,312 8,379 8,433 29,124 37 29,161
Balance at 31 December 2013
Representing:
Statutory IFRS basis shareholders’ equity:
Net assets 2,564 3,446 2,976 8,986(797) 8,189
Goodwill – – – – 1,461 1,461
Total IFRS basis
shareholders’ equity 2,564 3,446 2,976 8,986 664 9,650
Additional retained profit (loss) on an EEV
basisnote(v) 7,741 3,520 4,366 15,627(421) 15,206
EEV basis shareholders’ equity 10,305
6,966 7,342 24,613 243 24,856
Notes
(i) For the purposes of the table above,
goodwill of £233 million (2013: £231 million) related to Asia long-term operations is included in Other operations.
(ii) Intra-group dividends
(including statutory transfers) represent dividends that have been declared in the year and amounts accrued in respect of statutory
transfers. The amounts included
in note 11 for these items are as per the holding company cash flow at transaction rates. The difference primarily relates to
intra-group loans, timing differences
arising on statutory transfers, and other non-cash items.
(iii) Investment in operations reflects increases in share capital.
(iv) Included in other movements was a charge of £(11) million (2013: £(53) million) for the shareholders’ share of actuarial and other gains and losses
on the defined
benefit schemes.
(v) The additional retained loss on an EEV
basis for Other operations primarily represents the mark to market value adjustment for holding company net
borrowings of a charge of £(579) million
(2013: £(392) million), as shown in note 10.
European Embedded Value
Financial statements (EEV basis) results Notes on the EEV basis results
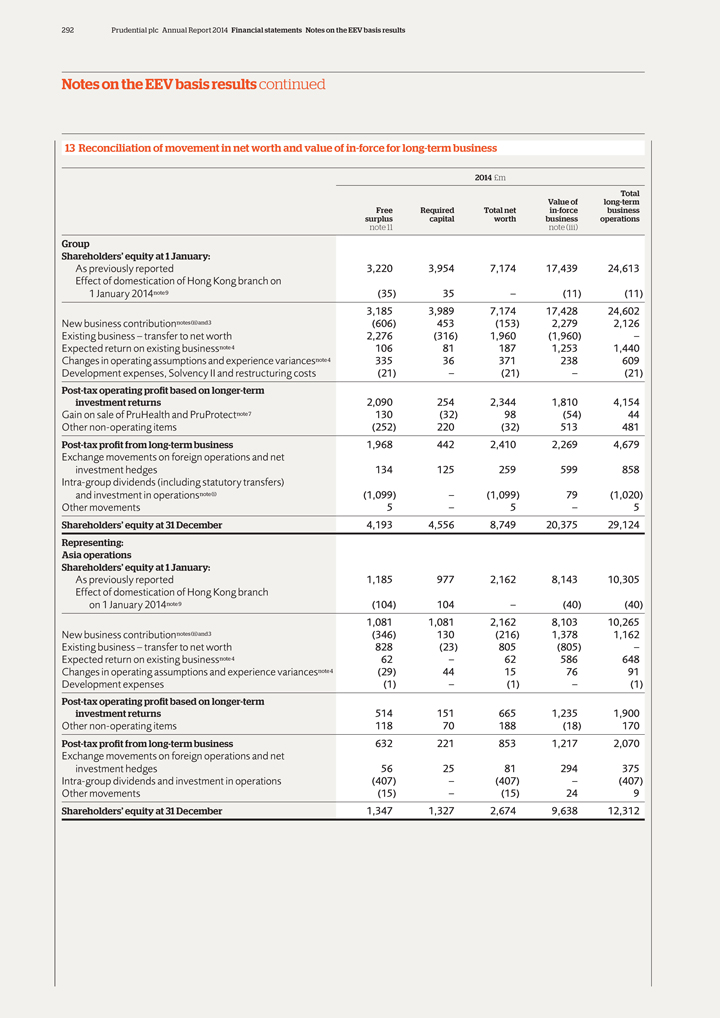
292 Prudential plc Annual Report 2014 Financial statements Notes on the EEV basis results
Notes on the EEV basis results continued
| 13 | Reconciliation of movement in net worth and value of in-force for long-term business |
2014 £m
Total
Value of long-term
Free Required Total net in-force business
surplus capital worth business operations
note 11 note (iii)
Group
Shareholders’ equity at 1 January:
As previously reported 3,220 3,954 7,174 17,439 24,613
Effect of domestication of Hong Kong
branch on
| 1 | January 2014note9(35) 35 –(11)(11) |
3,185 3,989 7,174 17,428 24,602
New business contributionnotes(ii)and3(606) 453(153)
2,279 2,126
Existing business – transfer to net worth 2,276(316) 1,960(1,960) –
Expected return on existing businessnote4 106 81 187 1,253 1,440
Changes in operating
assumptions and experience variancesnote4 335 36 371 238 609
Development expenses, Solvency II and restructuring costs(21) –(21) –(21)
Post-tax operating profit based on longer-term
investment returns 2,090 254 2,344 1,810 4,154
Gain on sale of PruHealth and PruProtectnote7 130(32) 98(54) 44
Other
non-operating items(252) 220(32) 513 481
Post-tax profit from long-term business 1,968 442 2,410 2,269 4,679
Exchange movements on foreign operations and net
investment hedges 134 125 259 599 858
Intra-group dividends (including statutory transfers)
and investment in
operationsnote(i)(1,099) –(1,099) 79(1,020)
Other movements 5 – 5 – 5
Shareholders’ equity at 31 December 4,193 4,556 8,749 20,375 29,124
Representing:
Asia operations
Shareholders’ equity at 1 January:
As previously reported 1,185 977 2,162 8,143 10,305
Effect of domestication of Hong Kong branch
on 1 January 2014note9(104)
104 –(40)(40)
1,081 1,081 2,162 8,103 10,265
New business
contributionnotes(ii)and3(346) 130(216) 1,378 1,162
Existing business – transfer to net worth 828(23) 805(805) –
Expected return on existing businessnote4 62 – 62 586 648
Changes in operating
assumptions and experience variancesnote4(29) 44 15 76 91
Development expenses(1) –(1) –(1)
Post-tax operating profit based on longer-term
investment returns 514 151 665 1,235 1,900
Other non-operating items 118 70 188(18) 170
Post-tax profit from long-term
business 632 221 853 1,217 2,070
Exchange movements on foreign operations and net
investment hedges 56 25 81 294 375
Intra-group dividends and investment in operations(407)
–(407) –(407)
Other movements(15) –(15) 24 9
Shareholders’ equity at 31 December 1,347 1,327 2,674 9,638 12,312
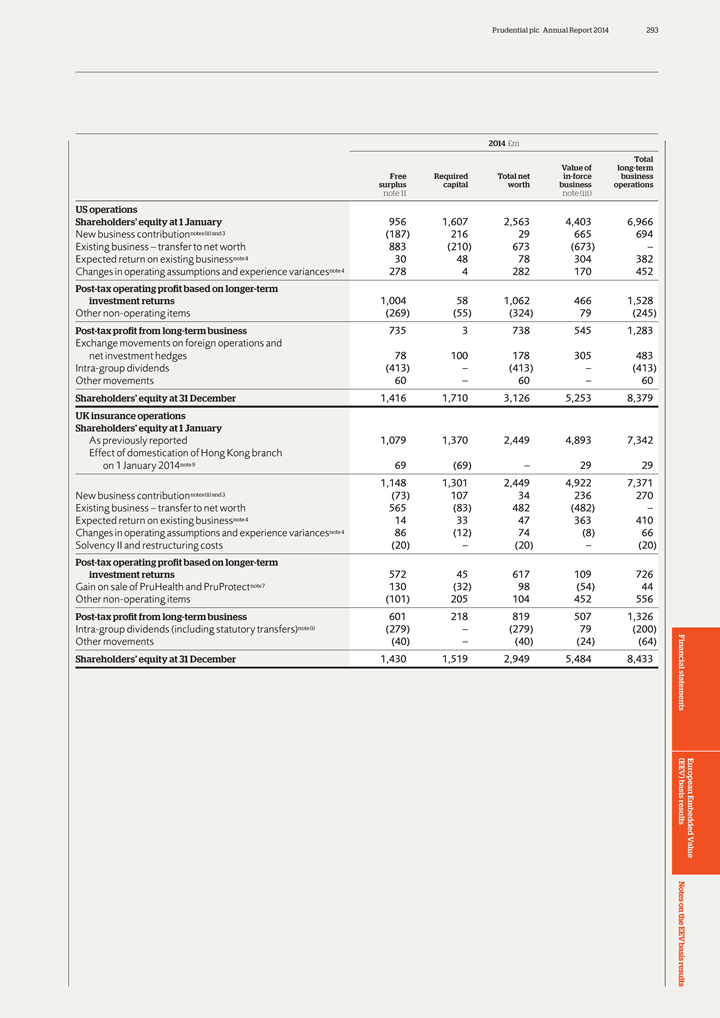
Prudential plc Annual Report 2014 293
2014
£m
Total
Value of long-term
Free Required Total net in-force business
surplus capital worth business operations
note 11 note (iii)
US operations
Shareholders’ equity at 1 January 956 1,607 2,563 4,403 6,966
New business
contributionnotes(ii)and3(187) 216 29 665 694
Existing business – transfer to net worth 883(210) 673(673) –
Expected return on existing businessnote4 30 48 78 304 382
Changes in operating assumptions
and experience variancesnote4 278 4 282 170 452
Post-tax operating profit based on longer-term
investment returns 1,004 58 1,062 466 1,528
Other non-operating items(269)(55)(324) 79(245)
Post-tax profit from long-term business 735 3 738 545 1,283
Exchange
movements on foreign operations and
net investment hedges 78 100 178 305 483
Intra-group dividends(413) –(413) –(413)
Other movements 60 –
60 – 60
Shareholders’ equity at 31 December 1,416 1,710 3,126 5,253 8,379
UK insurance operations
Shareholders’ equity at 1 January
As previously reported 1,079 1,370 2,449 4,893 7,342
Effect of domestication of Hong Kong
branch
on 1 January 2014note9 69(69) – 29 29
1,148 1,301 2,449
4,922 7,371
New business contributionnotes(ii)and3(73) 107 34 236 270
Existing business – transfer to net worth 565(83) 482(482) –
Expected return on existing businessnote4 14 33 47 363 410
Changes in
operating assumptions and experience variancesnote4 86(12) 74(8) 66
Solvency II and restructuring costs(20) –(20) –(20)
Post-tax operating profit based on longer-term
investment returns 572 45 617 109 726
Gain on sale of PruHealth and PruProtectnote7 130(32) 98(54) 44
Other
non-operating items(101) 205 104 452 556
Post-tax profit from long-term business 601 218 819 507 1,326
Intra-group dividends (including statutory transfers)note(i)(279) –(279) 79(200)
Other
movements(40) –(40)(24)(64)
Shareholders’ equity at 31 December 1,430 1,519 2,949 5,484 8,433
European Embedded Value
Financial statements (EEV basis) results Notes on the EEV basis
results
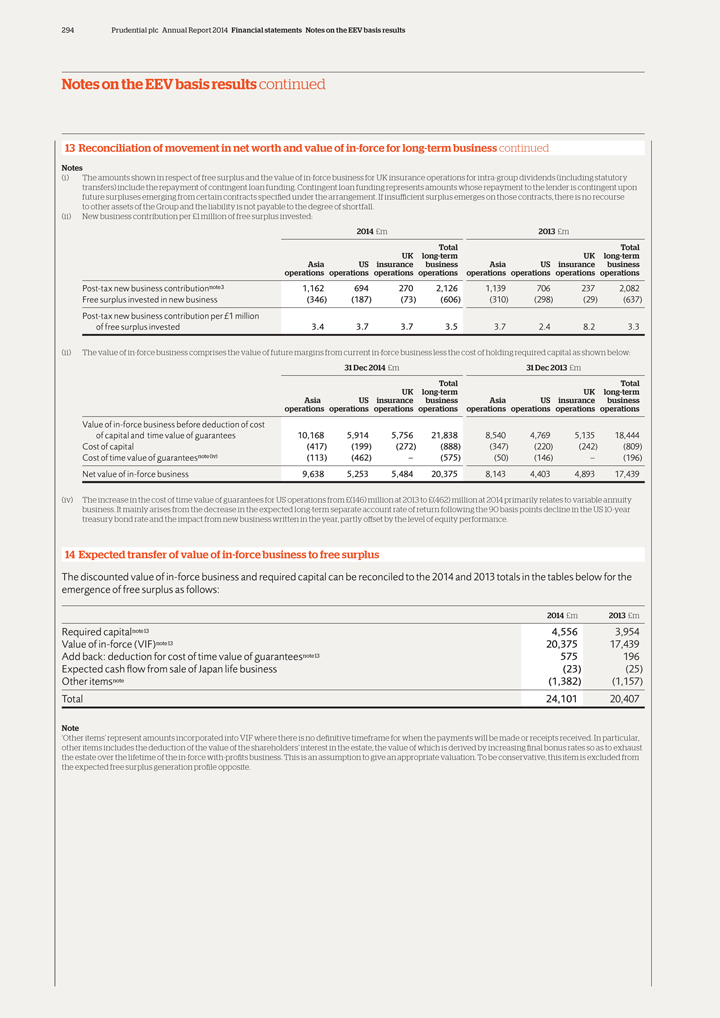
294 Prudential plc Annual Report 2014 Financial statements Notes on the EEV basis results
Notes on the EEV basis results continued
| 13 | Reconciliation of movement in net worth and value of in-force for long-term business continued |
Notes
(i) The amounts shown in
respect of free surplus and the value of in-force business for UK insurance operations for intra-group dividends (including statutory
transfers) include the
repayment of contingent loan funding. Contingent loan funding represents amounts whose repayment to the lender is contingent upon
future surpluses emerging from
certain contracts specified under the arrangement. If insufficient surplus emerges on those contracts, there is no recourse
to other assets of the Group and the
liability is not payable to the degree of shortfall.
(ii) New business contribution per £1 million of free surplus invested:
2014 £m 2013 £m
Total Total
UK long-term UK long-term
Asia US insurance business Asia US insurance business
operations operations operations operations operations operations operations operations
Post-tax new business contributionnote3 1,162 694 270 2,126 1,139 706 237 2,082
Free surplus invested in new business(346)(187)(73)(606)(310)(298)(29)(637)
Post-tax new business contribution per £1 million
of free surplus
invested 3.4 3.7 3.7 3.5 3.7 2.4 8.2 3.3
(ii) The value of in-force business comprises the value of future margins from current in-force business less the cost of
holding required capital as shown below:
| 31 | Dec 2014 £m 31 Dec 2013 £m |
Total Total
UK long-term UK long-term
Asia US insurance business Asia US insurance business
operations operations operations
operations operations operations operations operations
Value of in-force business before deduction of cost
of capital and time value of guarantees 10,168 5,914 5,756 21,838 8,540 4,769 5,135 18,444
Cost of capital(417)(199)(272)(888)(347)(220)(242)(809)
Cost of time value of
guaranteesnote(iv)(113)(462) –(575)(50)(146) –(196)
Net value of in-force business 9,638 5,253 5,484 20,375 8,143 4,403 4,893 17,439
(iv) The increase in the cost of time value of guarantees for US operations from £(146) million at 2013 to £(462) million at 2014 primarily relates to
variable annuity
business. It mainly arises from the decrease in the expected long-term separate account rate of return following the 90 basis points decline in
the US 10-year
treasury bond rate and the impact from new business written in the year, partly offset by the level of equity performance.
| 14 | Expected transfer of value of in-force business to free surplus |
The discounted value of in-force business and required capital can be reconciled to the 2014 and 2013 totals in the tables below for the
emergence of free surplus as follows:
2014 £m 2013 £m
Required capitalnote13 4,556 3,954
Value of in-force (VIF)note13 20,375 17,439
Add back: deduction for cost of time value of guaranteesnote13 575 196
Expected cash flow from
sale of Japan life business(23)(25)
Other itemsnote(1,382)(1,157)
Total
24,101 20,407
Note
‘Other items’ represent amounts incorporated
into VIF where there is no definitive timeframe for when the payments will be made or receipts received. In particular,
other items includes the deduction of the
value of the shareholders’ interest in the estate, the value of which is derived by increasing final bonus rates so as to exhaust
the estate over the lifetime
of the in-force with-profits business. This is an assumption to give an appropriate valuation. To be conservative, this item is excluded from
the expected free
surplus generation profile opposite.
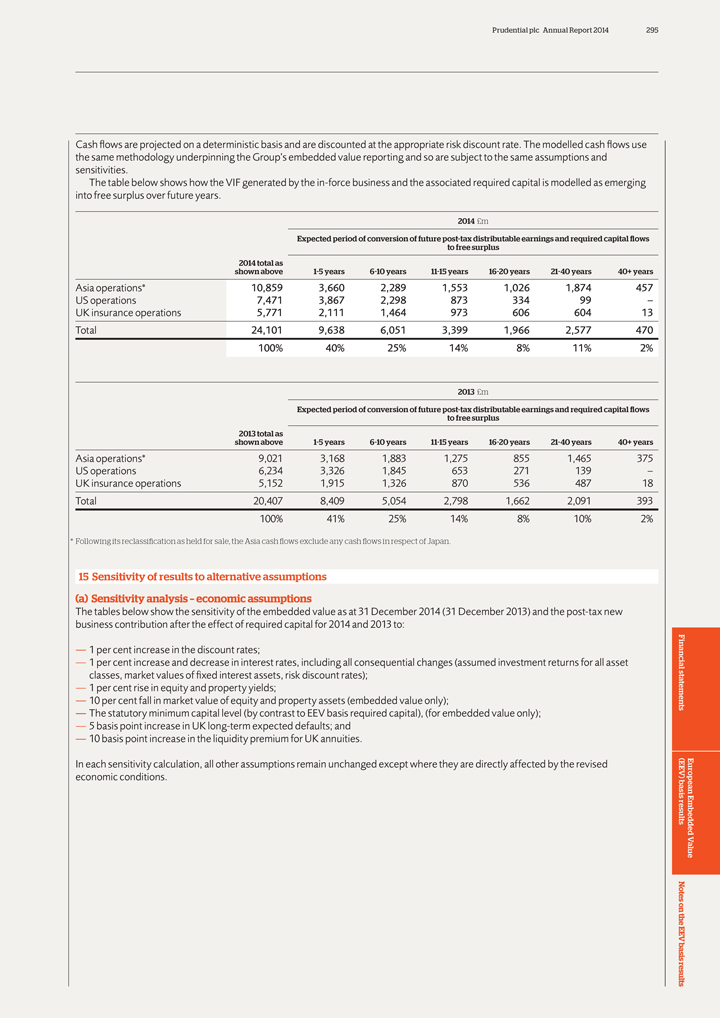
Prudential plc Annual Report 2014 295
Cash flows
are projected on a deterministic basis and are discounted at the appropriate risk discount rate. The modelled cash flows use
the same methodology underpinning the
Group’s embedded value reporting and so are subject to the same assumptions and
sensitivities.
The table below shows how the VIF generated by the in-force business and the associated required capital is modelled as emerging
into free surplus over future years.
2014 £m
Expected period of conversion of future post-tax distributable earnings and required capital flows
to free surplus
2014 total as
shown above
1-5 years
6-10 years
11-15 years
16-20 years
21-40 years
40+ years
Asia operations*
10,859
3,660
2,289
1,553
1,026
1,874
457
US operations
7,471
3,867
2,298
873
334
99
–
UK insurance operations
5,771
2,111
1,464
973
606
604
13
Total
24,101
9,638
6,051
3,399
1,966
2,577
470
100%
40%
25%
14%
8%
11%
2%
2013 £m
Expected period of conversion of future post-tax distributable earnings and
required capital flows
to free surplus
2013 total as
shown above
1-5 years
6-10 years
11-15 years
16-20 years
21-40 years
40+ years
Asia operations*
9,021
3,168
1,883
1,275
855
1,465
375
US operations
6,234
3,326
1,845
653
271
139
–
UK insurance operations
5,152
1,915
1,326
870
536
487
18
Total
20,407
8,409
5,054
2,798
1,662
2,091
393
100%
41%
25%
14%
8%
10%
2%
* Following its reclassification as held for sale, the Asia cash flows exclude any cash flows in respect of Japan.
15 Sensitivity of results to alternative assumptions
(a) Sensitivity analysis – economic
assumptions
The tables below show the sensitivity of the embedded value as at 31 December 2014 (31 December 2013) and the post-tax new
business contribution after the effect of required capital for 2014 and 2013 to:
—
1 per cent increase in the discount rates;
— 1 per cent increase and decrease in interest rates, including all consequential changes (assumed
investment returns for all asset
classes, market values of fixed interest assets, risk discount rates);
— 1 per cent rise in equity and property yields;
— 10 per cent fall in
market value of equity and property assets (embedded value only);
— The statutory minimum capital level (by contrast to EEV basis required capital), (for
embedded value only);
— 5 basis point increase in UK long-term expected defaults; and
— 10 basis point increase in the liquidity premium for UK annuities.
In each sensitivity
calculation, all other assumptions remain unchanged except where they are directly affected by the revised
economic conditions.
European Embedded Value
Financial statements (EEV basis) results Notes on the EEV basis
results
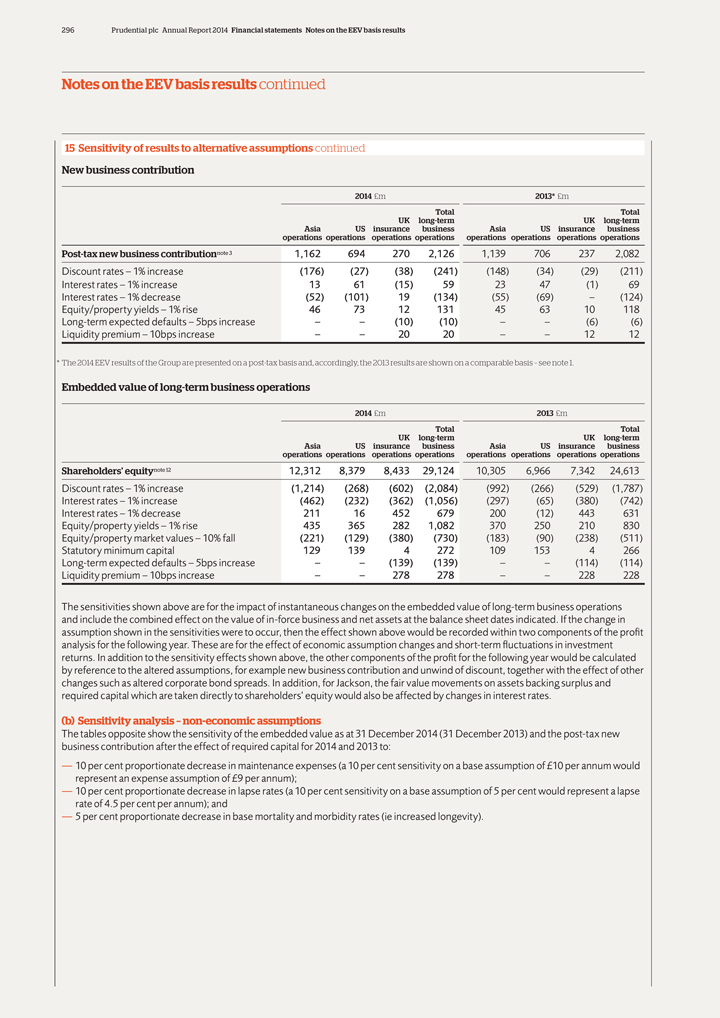
296 Prudential plc Annual Report 2014 Financial statements Notes on the EEV basis results
Notes on the EEV basis results continued
| 15 | Sensitivity of results to alternative assumptions continued |
New business contribution
2014 £m 2013* £m
Total Total
UK long-term UK long-term
Asia US insurance business Asia US insurance business
operations operations operations
operations operations operations operations operations
Post-tax new business contributionnote 3 1,162 694 270 2,126 1,139 706 237 2,082
Discount rates – 1% increase(176)(27)(38)(241)(148)(34)(29)(211)
Interest rates – 1%
increase 13 61(15) 59 23 47(1) 69
Interest rates – 1% decrease(52)(101) 19(134)(55)(69) –(124)
Equity/property yields – 1% rise 46 73 12 131 45 63 10 118
Long-term expected defaults
– 5bps increase – –(10)(10) – –(6)(6)
Liquidity premium – 10bps increase – – 20 20 – – 12 12
* The 2014 EEV results of the Group are presented on a post-tax basis and, accordingly, the 2013 results are shown on a comparable basis – see note 1.
Embedded value of long-term business operations
2014 £m 2013 £m
Total Total
UK long-term UK long-term
Asia US insurance business Asia US insurance business
operations operations operations
operations operations operations operations operations
Shareholders’ equitynote 12 12,312 8,379 8,433 29,124 10,305 6,966 7,342 24,613
Discount rates – 1% increase(1,214)(268)(602)(2,084)(992)(266)(529)(1,787)
Interest rates
– 1% increase(462)(232)(362)(1,056)(297)(65)(380)(742)
Interest rates – 1% decrease 211 16 452 679 200(12) 443 631
Equity/property yields – 1% rise 435 365 282 1,082 370 250 210 830
Equity/property market
values – 10% fall(221)(129)(380)(730)(183)(90)(238)(511)
Statutory minimum capital 129 139 4 272 109 153 4 266
Long-term expected defaults – 5bps increase – –(139)(139) – –(114)(114)
Liquidity premium – 10bps increase – – 278 278 – – 228 228
The sensitivities shown above are for the impact of instantaneous changes on the embedded value of long-term business operations and include the combined effect on the value of
in-force business and net assets at the balance sheet dates indicated. If the change in assumption shown in the sensitivities were to occur, then the effect shown above would be recorded within two components of the profit analysis for the following
year. These are for the effect of economic assumption changes and short-term fluctuations in investment returns. In addition to the sensitivity effects shown above, the other components of the profit for the following year would be calculated by
reference to the altered assumptions, for example new business contribution and unwind of discount, together with the effect of other changes such as altered corporate bond spreads. In addition, for Jackson, the fair value movements on assets
backing surplus and required capital which are taken directly to shareholders’ equity would also be affected by changes in interest rates.
| (b) | Sensitivity analysis – non-economic assumptions |
The tables opposite show the sensitivity of the embedded value as at 31 December 2014 (31 December 2013) and the post-tax new business
contribution after the effect of required capital for 2014 and 2013 to:
— 10 per cent proportionate decrease in maintenance expenses (a 10 per cent
sensitivity on a base assumption of £10 per annum would represent an expense assumption of £9 per annum);
— 10 per cent
proportionate decrease in lapse rates (a 10 per cent sensitivity on a base assumption of 5 per cent would represent a lapse rate of 4.5 per cent per annum); and
— 5 per cent proportionate decrease in base mortality and morbidity rates (ie increased longevity).
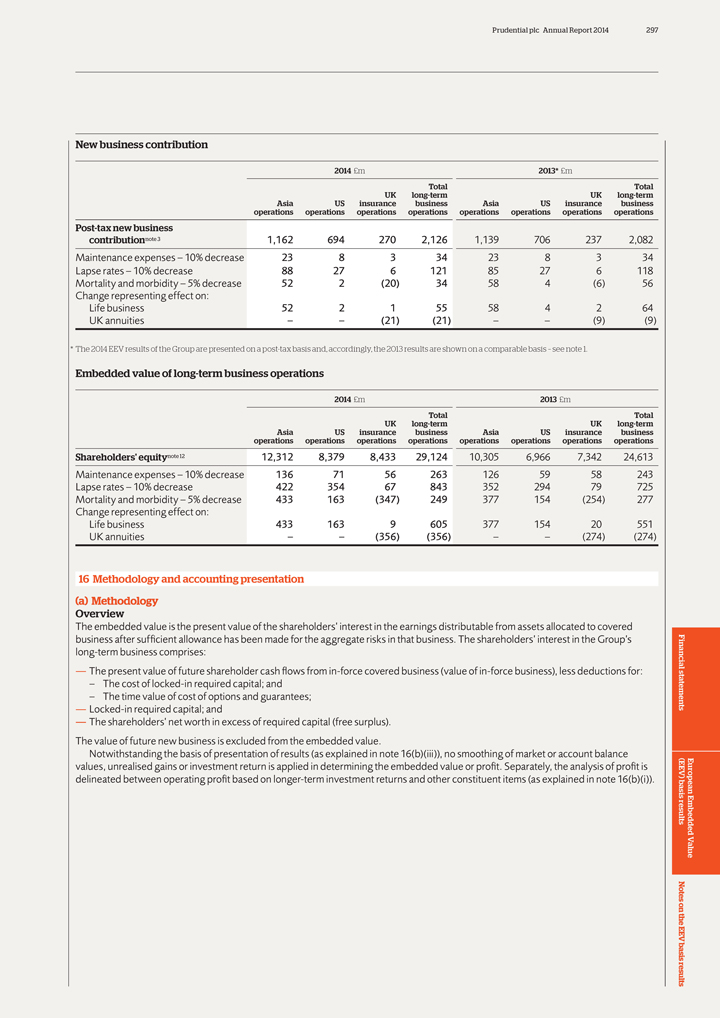
Prudential plc Annual Report 2014 297
New business
contribution
2014 £m 2013* £m
Total Total
UK long-term UK long-term
Asia US insurance business Asia US insurance business
operations operations operations operations operations operations operations operations
Post-tax new business
contributionnote 3 1,162 694 270 2,126 1,139 706 237
2,082
Maintenance expenses – 10% decrease 23 8 3 34 23 8 3 34
Lapse
rates – 10% decrease 88 27 6 121 85 27 6 118
Mortality and morbidity – 5% decrease 52 2(20) 34 58 4(6) 56
Change representing effect on:
Life business 52 2 1 55 58 4 2 64
UK annuities – –(21)(21) – –(9)(9)
* The 2014 EEV results of the Group are
presented on a post-tax basis and, accordingly, the 2013 results are shown on a comparable basis – see note 1.
Embedded value of long-term business operations
2014 £m 2013 £m
Total Total
UK long-term UK long-term
Asia US insurance business Asia US insurance business
operations operations operations operations operations operations operations operations
Shareholders’ equitynote 12 12,312 8,379 8,433 29,124 10,305 6,966 7,342 24,613
Maintenance expenses – 10% decrease 136 71 56 263 126 59 58 243
Lapse rates – 10%
decrease 422 354 67 843 352 294 79 725
Mortality and morbidity – 5% decrease 433 163(347) 249 377 154(254) 277
Change representing effect on:
Life business 433 163 9 605 377 154 20 551
UK annuities – –(356)(356) – –(274)(274)
16 Methodology and accounting
presentation (a) Methodology Overview
The embedded value is the present value of the shareholders’ interest in the earnings distributable from assets
allocated to covered business after sufficient allowance has been made for the aggregate risks in that business. The shareholders’ interest in the Group’s long-term business comprises:
— The present value of future shareholder cash flows from in-force covered business (value of in-force business), less deductions for:
– The cost of locked-in required capital; and
– The time value of cost of options
and guarantees;
— Locked-in required capital; and
— The
shareholders’ net worth in excess of required capital (free surplus).
The value of future new business is excluded from the embedded value.
Notwithstanding the basis of presentation of results (as explained in note 16(b)(iii)), no smoothing of market or account balance values, unrealised gains or investment return is
applied in determining the embedded value or profit. Separately, the analysis of profit is delineated between operating profit based on longer-term investment returns and other constituent items (as explained in note 16(b)(i)).
European Embedded Value
Financial statements (EEV basis) results Notes on the EEV basis
results
298 Prudential plc Annual Report 2014 Financial statements Notes on the EEV basis results
Notes on the EEV basis results continued
16 Methodology and accounting presentation continued
(i) Covered business
The EEV results for the Group are prepared for ‘covered business’, as defined by the EEV Principles. Covered business
represents the Group’s long-term insurance business for which the value of new and in-force contracts is attributable to shareholders. The post-tax EEV basis results for the Group’s covered business are then combined with the post-tax IFRS
basis results of the Group’s other operations. Under the EEV Principles, the results for covered business incorporate the projected margins of attaching internal asset management, as described in note 16(a)(vii).
The definition of long-term business operations is consistent with previous practice and comprises those contracts falling under the definition for regulatory purposes together
with, for US operations, contracts that are in substance the same as guaranteed investment contracts (GICs) but do not fall within the technical definition.
Covered business comprises the Group’s long-term business operations, with two exceptions:
— The closed Scottish Amicable Insurance Fund (SAIF) which is excluded from covered business. SAIF is a ring-fenced sub-fund of the Prudential Assurance Company (PAC)
long-term fund, established by a Court Approved Scheme of Arrangement in October 1997. SAIF is closed to new business and the assets and liabilities of the fund are wholly attributable to the policyholders of the fund; and
— The presentational treatment of the Group’s principal defined benefit pension scheme, the Prudential Staff Pension Scheme (PSPS). The partial recognition of the surplus
for PSPS is recognised in ‘Other’ operations.
A small amount of UK Group pensions business is also not modelled for EEV reporting purposes.
(ii) Valuation of in-force and new business
The embedded value results are prepared
incorporating best estimate assumptions about all relevant factors including levels of future investment returns, expenses, persistency and mortality (as described in note 17). These assumptions are used to project future cash flows. The present
value of the future cash flows is then calculated using a discount rate which reflects both the time value of money and the non-diversifiable risks associated with the cash flows that are not otherwise allowed for.
New business
In determining the EEV basis value of new business, premiums are included in
projected cash flows on the same basis of distinguishing annual and single premium business as set out for statutory basis reporting.
New business premiums reflect
those premiums attaching to covered business, including premiums for contracts classified as investment products for IFRS basis reporting. New business premiums for regular premium products are shown on an annualised basis. Internal vesting business
is classified as new business where the contracts include an open market option.
The post-tax contribution from new business represents profits determined by
applying operating assumptions as at the end of the year.
For UK immediate annuity business and single premium Universal Life products in Asia, primarily in
Singapore, the new business contribution is determined by applying economic assumptions reflecting point-of-sale market conditions. This is consistent with how the business is priced as crediting rates are linked to yields on specific assets and the
yield is locked-in when the assets are purchased at the point-of-sale of the policy. For other business within the Group, end-of-year economic assumptions are used.
New business profitability is a key metric for the Group’s management of the development of the business. In addition, post-tax new business margins are shown
by reference to annual premium equivalents (APE) and the present value of new business premiums (PVNBP). These margins are calculated as the percentage of the value of new business profit to APE and PVNBP. APE is calculated as the aggregate of
regular new business amounts and one-tenth of single new business amounts. PVNBP is calculated as equalling single premiums plus the present value of expected premiums of new regular premium business, allowing for lapses and other assumptions made
in determining the EEV new business contribution.
Valuation movements on investments
With the exception of debt securities held by Jackson, investment gains and losses during the year (to the extent that changes in capital values do not directly match changes in
liabilities) are included directly in the profit for the year and shareholders’ equity as they arise.
The results for any covered business conceptually
reflect the aggregate of the IFRS results and the movements on the additional shareholders’ interest recognised on the EEV basis. Thus the start point for the calculation of the EEV results for Jackson, as for other businesses, reflects the
market value movements recognised on the IFRS basis.
However, in determining the movements on the additional shareholders’ interest, the basis for calculating
the Jackson EEV result acknowledges that, for debt securities backing liabilities, the aggregate EEV results reflect the fact that the value of in-force business instead incorporates the discounted value of future spread earnings. This value is not
affected generally by short-term market movements on securities that broadly speaking, are held for the longer term.
Fixed income securities backing the free
surplus and required capital for Jackson are accounted for at fair value. However, consistent with the treatment applied under IFRS for Jackson securities classified as available-for-sale, movements in unrealised appreciation on these securities are
accounted for in equity rather than in the income statement, as shown in the movement in shareholders’ equity.
Prudential plc Annual Report 2014 299
(iii) Cost
of capital
A charge is deducted from the embedded value for the cost of capital supporting the Group’s long-term business. This capital is referred to as
required capital. The cost is the difference between the nominal value of the capital and the discounted value of the projected releases of this capital allowing for investment earnings (post-tax) on the capital.
The annual result is affected by the movement in this cost from year-to-year which comprises a charge against new business profit and generally a release in respect of the
reduction in capital requirements for business in force as this runs off.
Where required capital is held within a with-profits long-term fund, the value placed on
surplus assets in the fund is already discounted to reflect its release over time, and no further adjustment is necessary in respect of required capital.
(iv)
Financial options and guarantees
Nature of financial options and guarantees in Prudential’s long-term business
Asia operations
Subject to local market circumstances and regulatory requirements, the
guarantee features described below in respect of UK business broadly apply to similar types of participating contracts principally written in Hong Kong, Singapore and Malaysia. Participating products have both guaranteed and non-guaranteed elements.
There are also various non-participating long-term products with guarantees. The principal guarantees are those for whole of life contracts with floor levels of
policyholder benefits that accrue at rates set at inception and do not vary subsequently with market conditions.
US operations (Jackson)
The principal financial options and guarantees in Jackson are associated with the fixed annuity and variable annuity (VA) lines of business.
Fixed annuities provide that, at Jackson’s discretion, it may reset the interest rate credited to policyholders’ accounts, subject to a guaranteed minimum. The guaranteed
minimum return varies from 1.0 per cent to 5.5 per cent for 2014 and 2013, depending on the particular product, jurisdiction where issued, and date of issue. For 2014, 86 per cent (2013: 86 per cent) of the account values on
fixed annuities are for policies with guarantees of 3 per cent or less. The average guarantee rate is 2.7 per cent (2013: 2.8 per cent).
Fixed
annuities also present a risk that policyholders will exercise their option to surrender their contracts in periods of rapidly rising interest rates, possibly requiring Jackson to liquidate assets at an inopportune time.
Jackson issues VA contracts where it contractually guarantees to the contract holder either: a) return of no less than total deposits made to the contract adjusted for any partial
withdrawals; b) total deposits made to the contract adjusted for any partial withdrawals plus a minimum return; or c) the highest contract value on a specified anniversary date adjusted for any withdrawals following the specified contract
anniversary. These guarantees include benefits that are payable at specified dates during the accumulation period (Guaranteed Minimum Withdrawal Benefit (GMWB)), as death benefits (Guaranteed Minimum Death Benefits (GMDB)) or as income benefits
(Guaranteed Minimum Income Benefits (GMIB)). These guarantees generally protect the policyholder’s value in the event of poor equity market performance. Jackson hedges the GMDB and GMWB guarantees through the use of equity options and futures
contracts, and fully reinsures the GMIB guarantees.
Jackson also issues fixed index annuities that enable policyholders to obtain a portion of an equity-linked
return while providing a guaranteed minimum return. The guaranteed minimum returns are of a similar nature to those described above for fixed annuities.
UK
insurance operations
For covered business, the only significant financial options and guarantees in the UK insurance operations arise in the with-profits fund.
With-profits products provide returns to policyholders through bonuses that are smoothed. There are two types of bonuses – annual and final. Annual bonuses are declared once a year and, once credited, are guaranteed in accordance with the terms
of the particular product. Unlike annual bonuses, final bonuses are guaranteed only until the next bonus declaration. The with-profits fund also held a provision on the Pillar I Peak 2 basis of £50 million at 31 December 2014 (31
December 2013: £36 million) to honour guarantees on a small number of guaranteed annuity option products.
The Group’s main exposure to guaranteed
annuity options in the UK is through the non-covered business of SAIF. A provision on the Pillar I Peak 2 basis of £549 million was held in SAIF at 31 December 2014 (31 December 2013: £328 million) to honour the guarantees. As
described in note 16(a)(i), the assets and liabilities are wholly attributable to the policyholders of the fund. Therefore the movement in the provision has no direct impact on shareholders.
Time value
The value of financial options and guarantees comprises two parts. One is given by
a deterministic valuation on best estimate assumptions (the intrinsic value). The other part arises from the variability of economic outcomes in the future (the time value). Where appropriate, a full stochastic valuation has been undertaken to
determine the time value of the financial options and guarantees.
The economic assumptions used for the stochastic calculations are consistent with those used for
the deterministic calculations. Assumptions specific to the stochastic calculations reflect local market conditions and are based on a combination of actual market data, historic market data and an assessment of long-term economic conditions. Common
principles have been adopted across the Group for the stochastic asset models, for example, separate modelling of individual asset classes but with an allowance for correlation between the various asset classes. Details of the key characteristics of
each model are given in notes 17(iv),(v) and (vi).
In deriving the time value of financial options and guarantees, management actions in response to emerging
investment and fund solvency conditions have been modelled. Management actions encompass, but are not confined to, investment allocation decisions, levels of reversionary and terminal bonuses and credited rates. Bonus rates are projected from
current levels and varied in accordance with assumed management actions applying in the emerging investment and fund solvency conditions.
European Embedded Value
Financial statements (EEV basis) results Notes on the EEV basis results
300 Prudential plc Annual Report 2014 Financial statements Notes on the EEV basis results
Notes on the EEV basis results continued
16 Methodology and accounting presentation continued
In all instances, the modelled actions are in accordance with approved local practice and therefore reflect the options actually available to management. For the
PAC with-profits fund, the actions assumed are consistent with those set out in the Principles and Practices of Financial Management which explains how regular and final bonus rates within the discretionary framework are determined, subject to the
general legislative requirements applicable.
| (v) | Level of required capital |
In adopting the EEV Principles, Prudential has based required capital on its internal targets subject to it being at least the local statutory minimum requirements. For
with-profits business written in a segregated life fund, as is the case in Asia and the UK, the capital available in the fund is sufficient to meet the required capital requirements. For shareholder-backed business the following capital requirements
apply:
— Asia operations: the level of required capital has been set to an amount at least equal to the higher of local statutory requirements and the
internal target;
— US operations: the level of required capital has been set at 250 per cent of the risk-based capital required by the National
Association of Insurance Commissioners (NAIC) at the Company Action Level (CAL); and
— UK insurance operations: the capital requirements are set to an amount
at least equal to the higher of Pillar I and Pillar II requirements for shareholder-backed business of UK insurance operations as a whole.
(vi) With-profits
business and the treatment of the estate
The proportion of surplus allocated to shareholders from the PAC with-profits fund has been based on the present level of
10 per cent. The value attributed to the shareholders’ interest in the estate is derived by increasing final bonus rates (and related shareholder transfers) so as to exhaust the estate over the lifetime of the in-force with-profits
business. In any scenarios where the total assets of the life fund are insufficient to meet policyholder claims in full, the excess cost is fully attributed to shareholders. Similar principles apply, where appropriate, for other with-profits funds
of the Group’s Asia operations.
(vii) Internal asset management
The new
business and in-force results from long-term business include the projected value of profits or losses from asset management and service companies that support the Group’s covered insurance businesses. The results of the Group’s asset
management operations include the current year profits from the management of both internal and external funds. EEV basis shareholders’ other income and expenditure is adjusted to deduct the unwind of the expected internal asset management
profit margin for the year. The deduction is on a basis consistent with that used for projecting the results for covered insurance business. Group operating profit accordingly includes the variance between actual and expected profit in respect of
management of the covered business assets.
(viii) Allowance for risk and risk discount rates
Overview
Under the EEV Principles, discount rates used to determine the present value of
future cash flows are set by reference to risk-free rates plus a risk margin. The risk margin should reflect any non-diversifiable risk associated with the emergence of distributable earnings that is not allowed for elsewhere in the valuation.
Prudential has selected a granular approach to better reflect differences in market risk inherent in each product group. The risk discount rate so derived does not reflect an overall Group market beta, but instead reflects the expected volatility
associated with the cash flows for each product category in the embedded value model.
Since financial options and guarantees are explicitly valued under the EEV
methodology, discount rates under EEV are set excluding the effect of these product features.
The risk margin represents the aggregate of the allowance for market
risk, additional allowance for credit risk where appropriate, and allowance for non-diversifiable non-market risk. No allowance is required for non-market risks where these are assumed to be fully diversifiable.
Market risk allowance
The allowance for market risk represents the beta multiplied by an
equity risk premium. Except for UK shareholder-backed annuity business (as explained opposite) such an approach has been used for all of the Group’s businesses.
The beta of a portfolio or product measures its relative market risk. The risk discount rates reflect the market risk inherent in each product group and hence the
volatility of product cash flows. These are determined by considering how the profits from each product are affected by changes in expected returns on various asset classes. By converting this into a relative rate of return, it is possible to derive
a product-specific beta.
Product level betas reflect the most recent product mix to produce appropriate betas and risk discount rates for each major product
grouping.
Prudential plc Annual Report 2014 301
Additional
credit risk allowance
The Group’s methodology is to allow appropriately for credit risk. The allowance for total credit risk is to cover:
— Expected long-term defaults;
— Credit risk premium (to reflect the volatility in
downgrade and default levels); and
— Short-term downgrades and defaults.
These allowances are initially reflected in determining best estimate returns and through the market risk allowance described above. However, for those businesses
largely backed by holdings of debt securities, these allowances in the projected returns and market risk allowances may not be sufficient, and an additional allowance may be appropriate.
The practical application of the allowance for credit risk varies depending upon the type of business as described below.
Asia operations
For Asia operations, the allowance for credit risk incorporated in the
projected rates of return and the market risk allowance are sufficient. Accordingly no additional allowance for credit risk is required.
The projected rates of
return for holdings of corporate bonds comprise the risk-free rate plus an assessment of long-term spread over the risk-free rate.
US operations (Jackson)
For Jackson business, the allowance for long-term defaults is reflected in the risk margin reserve (RMR) charge which is deducted in determining the projected
spread margin between the earned rate on the investments and the policyholder crediting rate.
The risk discount rate incorporates an additional allowance for
credit risk premium and short-term downgrades and defaults as shown in note 17(ii). In determining this allowance, a number of factors have been considered. These factors, in particular, include:
(a) How much of the credit spread on debt securities represents an increased credit risk not reflected in the RMR long-term default assumptions, and how much is liquidity premium
(which is the premium required by investors to compensate for the risk of longer-term investments which cannot be easily converted into cash, and converted at the fair market value). In assessing this effect, consideration has been given to a number
of approaches to estimating the liquidity premium by considering recent statistical data; and
(b) Policyholder benefits for Jackson fixed annuity business are not
fixed. It is possible, in adverse economic scenarios, to pass on a component of credit losses to policyholders (subject to guarantee features) through lower investment return rates credited to policyholders. Consequently, it is only necessary to
allow for the balance of the credit risk in the risk discount rate.
The level of the additional allowance is assessed at each reporting period to take account of
prevailing credit conditions and as the business in force alters over time. The additional allowance for variable annuity business has been set at one-fifth of the non-variable annuity business to reflect the proportion of the allocated holdings of
general account debt securities.
The level of allowance differs from that for UK annuity business for investment portfolio differences and to take account of the
management actions available in adverse economic scenarios to reduce crediting rates to policyholders, subject to guarantee features of the products.
UK operations
(1) Shareholder-backed annuity business
For Prudential’s UK
shareholder-backed annuity business, Prudential has used a market consistent embedded value (MCEV) approach to derive an implied risk discount rate which is then applied to the projected best estimate cash flows.
In the annuity MCEV calculations, as the assets are generally held to maturity to match long duration liabilities, the future cash flows are discounted using the swap yield curve
plus an allowance for liquidity premium based on Prudential’s assessment of the expected return on the assets backing the annuity liabilities after allowing for:
(a) Expected long-term defaults derived as a percentage of historical default experience based on Moody’s data for the period 1970 to 2009 and the definition of the credit
rating assigned to each asset held is the second highest credit rating published by Moody’s, Standard & Poor’s and Fitch; (b) A credit risk premium, which is derived as the excess over the expected long-term defaults, of the
95th percentile of historical cumulative defaults based on Moody’s data for the period 1970 to 2009, and subject to a minimum margin over expected long-term defaults of 50 per cent; (c) An allowance for a 1-notch downgrade of the
asset portfolio subject to credit risk; and (d) An allowance for short-term downgrades and defaults.
For the purposes of presentation in the EEV results, the
results on this basis are reconfigured. Under this approach, the projected earned rate of return on the debt securities held is determined after allowing for expected long-term defaults and, where necessary, an additional allowance for an element of
short-term downgrades and defaults to bring the allowance in the earned rate up to best estimate levels. The allowances for credit risk premium, 1-notch downgrade and the remaining element of short-term
downgrade and default allowances are incorporated into the risk margin included in the discount rate, as shown in note 17(iii)(b).
European Embedded Value
Financial statements basis(EEV) results Notes on the EEV basis results
302 Prudential plc Annual Report 2014 Financial statements Notes on the EEV basis results
Notes on the EEV basis results continued
16 Methodology and accounting presentation continued
(2) With-profits fund non-profit annuity business
For UK non-profit annuity
business including that attributable to the PAC with-profits fund, the basis for determining the aggregate allowance for credit risk is consistent with that applied for UK shareholder-backed annuity business (as described previously). The allowance
for credit risk for this business is taken into account in determining the projected cash flows to the with-profits fund, which are in turn discounted at the risk discount rate applicable to all of the projected cash flows of the fund.
(3) With-profits fund holdings of debt securities
The UK with-profits fund holds debt
securities as part of its investment portfolio backing policyholder liabilities and unallocated surplus. The assumed earned rate for with-profit holdings of corporate bonds is defined as the risk-free rate plus an assessment of the long-term spread
over gilts, net of expected long-term defaults. This approach is similar to that applied for equities and properties for which the projected earned rate is defined as the risk-free rate plus a long-term risk premium.
Allowance for non-diversifiable non-market risks
The majority of non-market and non-credit
risks are considered to be diversifiable. Finance theory cannot be used to determine the appropriate component of beta for non-diversifiable non-market risks since there is no observable risk premium associated with it that is akin to the equity
risk premium. Recognising this, a pragmatic approach has been applied.
A base level allowance of 50 basis points is applied to cover the non-diversifiable
non-market risks associated with the Group’s businesses. For the Group’s US business and UK business, other than shareholder-backed annuity, no additional allowance is necessary. For UK shareholder-backed annuity business, a further
allowance of 50 basis points is used to reflect the longevity risk which is of particular relevance. For the Group’s Asia operations in China, India, Indonesia, the Philippines, Taiwan, Thailand and Vietnam, additional allowances are applied
for emerging market risk ranging from 100 to 250 basis points.
(ix) Foreign currency translation
Foreign currency profits and losses have been translated at average exchange rates for the year. Foreign currency assets and liabilities have been translated at year end rates of
exchange. The principal exchange rates are shown in note A1 of the IFRS statements.
(x) Taxation
In determining the post-tax profit for the year for covered business, the overall tax rate includes the impact of tax effects determined on a local regulatory basis. Tax payments
and receipts included in the projected cash flows to determine the value of in-force business are calculated using rates that have been announced and substantively enacted by the end of the reporting period.
(xi) Intercompany arrangements
The EEV results for covered business incorporate annuities
established in the PAC non-profit sub-fund from vesting pension polices in SAIF (which is not covered business). The EEV results also incorporate the effect of the reinsurance arrangement of non-profit immediate pension annuity liabilities of SAIF
to PRIL. In addition, the free surplus and value of in-force business are calculated after taking account of the impact of contingent loan arrangements between Group companies (movements in the contingent loan liability are reflected via the
projected cash flows in the value of in-force and the related funding is reflected in free surplus).
(b) Accounting presentation (i) Analysis of post-tax
profit
To the extent applicable, the presentation of the EEV post-tax profit for the year is consistent in the classification between operating and non-operating
results with the basis that the Group applies for the analysis of IFRS basis results. Operating results reflect underlying results including longer-term investment returns (which are determined as described in note 16(b)(ii) opposite) and
incorporate the following:
— New business contribution, as defined in note 16(a)(ii);
— Unwind of discount on the value of in-force business and other expected returns, as described in note 16(b)(iii) opposite;
— The impact of routine changes of estimates relating to non-economic assumptions, as described in note 16(b)(iv) opposite; and
— Non-economic experience variances, as described in note 16(b)(v) opposite.
Non-operating results comprise the following:
— Short-term fluctuations
in investment returns;
— The mark to market value movements on core borrowings;
— The effect of changes in economic assumptions;
— The gain on sale of PruHealth and
PruProtect businesses in 2014;
— The costs associated with the domestication of the Hong Kong branch which became effective on 1 January 2014; and
— The loss attaching to the held for sale Japan life business.
Total
profit attributable to shareholders and basic earnings per share include these items, together with actual investment returns. The Company believes that operating profit, as adjusted for these items, better reflects underlying performance.
Prudential plc Annual Report 2014 303
(ii)
Investment returns included in operating profit
For the investment element of the assets covering the net worth of long-term insurance business, investment returns
are recognised in operating results at the expected long-term rate of return. These expected returns are calculated by reference to the asset mix of the portfolio. For the purpose of calculating the longer-term investment return to be included in
the operating result of the PAC with-profits fund of UK operations, where assets backing the liabilities and unallocated surplus are subject to market volatility, asset values at the beginning of the reporting period are adjusted to remove the
effects of short-term market movements, as explained in note 16(b)(iii) below.
For the purpose of determining the long-term returns for debt securities of US
operations for fixed annuity and other general account business, a risk margin charge is included which reflects the expected long-term rate of default based on the credit quality of the portfolio. For Jackson, interest-related realised gains and
losses are amortised to the operating results over the maturity period of the sold bonds and for equity-related investments, a long-term rate of return is assumed, which reflects the aggregation of end-of-period risk-free rates and equity risk
premium. For US variable annuity separate account business, operating profit includes the unwind of discount on the opening value of in-force adjusted to reflect end-of-period projected rates of return with the excess or deficit of the actual return
recognised within non-operating profit, together with the related hedging activity.
For UK annuity business, rebalancing of the asset portfolio backing the
liabilities to policyholders may, from time to time, take place to align it more closely with the internal benchmark of credit quality that management applies. Such rebalancing will result in a change in the projected yield on the asset portfolio
and the allowance for default risk. The net effect of these changes is included in the result for the year.
(iii) Unwind of discount and other expected returns
The unwind of discount and other expected returns is determined by reference to:
— The value of in-force business at the beginning of the period (adjusted for the effect of current period economic and operating assumption changes); and
— Required capital and surplus assets.
In applying this general approach, the unwind of
discount included in operating profit for the with-profits business of UK insurance operations is determined by reference to the opening value of in-force, as adjusted for the effects of short-term investment volatility due to market movements (ie,
smoothed). In the summary statement of financial position, and for total profit reporting, asset values and investment returns are not smoothed. At 31 December 2014, the shareholders’ interest in the smoothed surplus assets used for this
purpose only, were £194 million lower (31 December 2013: £136 million lower) than the surplus assets carried in the statement of financial position.
(iv) Effect of changes in operating assumptions
Operating profit includes the effect of
changes to operating assumptions on the value of in-force at the end of the period.
For presentational purposes, the effect of change is delineated to show the
effect on the opening value of in-force with the experience variance being determined by reference to the end-of-period assumptions.
(v) Operating experience
variances
Operating profits include the effect of experience variances on non-economic assumptions, which are calculated with reference to the embedded value
assumptions at the end of the reporting period, such as persistency, mortality and morbidity, expenses and other factors.
(vi) Effect of changes in economic
assumptions
Movements in the value of in-force business at the beginning of the period caused by changes in economic assumptions, net of the related change in the
time value of cost of options and guarantees, are recorded in non-operating results.
17 Assumptions
Principal economic assumptions
The EEV basis results for the Group’s operations have been
determined using economic assumptions where the long-term expected rates of return on investments and risk discount rates are set by reference to period end rates of return on government bonds. Expected returns on equity and property asset classes
and corporate bonds are derived by adding a risk premium, based on the Group’s long-term view, to the risk-free rate.
The total profit that emerges over the
lifetime of an individual contract, as calculated using the embedded value basis, is the same as that calculated under the IFRS basis. Since the embedded value basis reflects discounted future cash flows, under this methodology the profit emergence
is advanced, thus more closely aligning the timing of the recognition of profits with the efforts and risks of current management actions, particularly with regard to business sold during the year.
European Embedded Value
Financial statements basis(EEV) results Notes on the EEV basis results
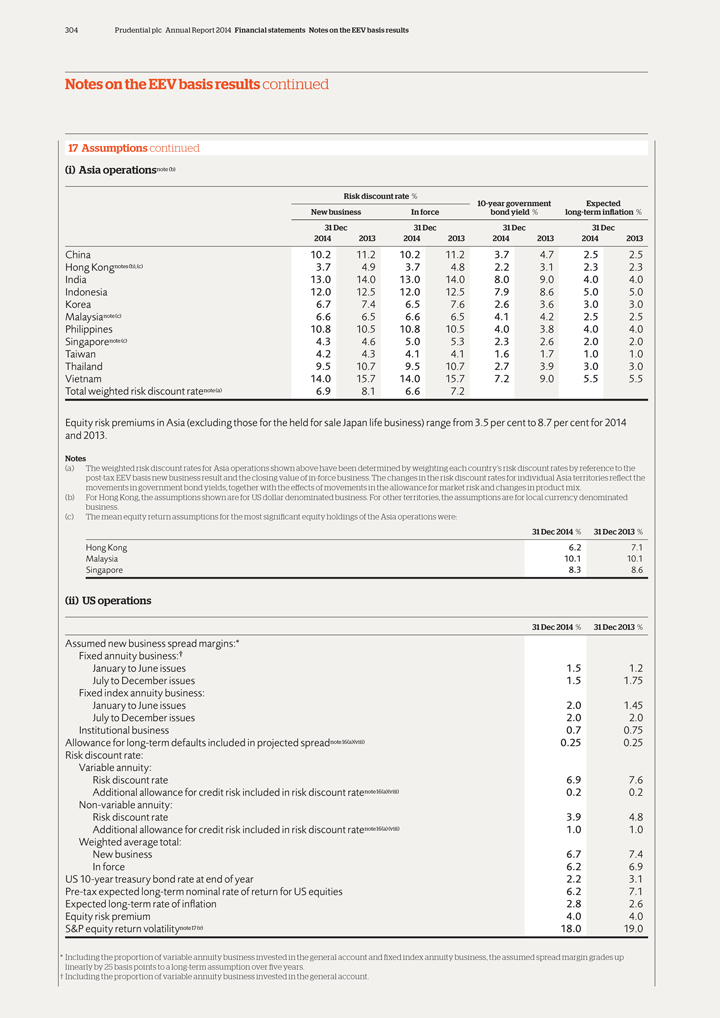
304 Prudential plc Annual Report 2014 Financial statements Notes on the EEV basis results
Notes on the EEV basis results continued
17 Assumptions continued (i) Asia operationsnote
(b)
Risk discount rate %
10-year government Expected
New business In force bond yield % long-term inflation %
31 Dec 31 Dec 31 Dec 31 Dec
2014 2013 2014 2013 2014 2013 2014 2013
China 10.2 11.2 10.2 11.2 3.7 4.7 2.5
2.5
Hong Kongnotes (b), (c) 3.7 4.9 3.7 4.8 2.2 3.1 2.3 2.3
India 13.0
14.0 13.0 14.0 8.0 9.0 4.0 4.0
Indonesia 12.0 12.5 12.0 12.5 7.9 8.6 5.0 5.0
Korea 6.7 7.4 6.5 7.6 2.6 3.6 3.0 3.0
Malaysianote (c) 6.6 6.5 6.6 6.5
4.1 4.2 2.5 2.5
Philippines 10.8 10.5 10.8 10.5 4.0 3.8 4.0 4.0
Singaporenote
(c) 4.3 4.6 5.0 5.3 2.3 2.6 2.0 2.0
Taiwan 4.2 4.3 4.1 4.1 1.6 1.7 1.0 1.0
Thailand 9.5 10.7 9.5 10.7 2.7 3.9 3.0 3.0
Vietnam 14.0 15.7 14.0 15.7 7.2
9.0 5.5 5.5
Total weighted risk discount ratenote (a) 6.9 8.1 6.6 7.2
Equity risk premiums in Asia (excluding those for the held for sale Japan life business) range from 3.5 per cent to 8.7 per cent for 2014 and 2013.
Notes
(a) The weighted risk discount rates for Asia operations shown above
have been determined by weighting each country’s risk discount rates by reference to the post-tax EEV basis new business result and the closing value of in-force business. The changes in the risk discount rates for individual Asia territories
reflect the movements in government bond yields, together with the effects of movements in the allowance for market risk and changes in product mix.
(b) For Hong
Kong, the assumptions shown are for US dollar denominated business. For other territories, the assumptions are for local currency denominated business.
(c) The
mean equity return assumptions for the most significant equity holdings of the Asia operations were:
31 Dec 2014 % 31 Dec 2013 %
Hong Kong 6.2 7.1
Malaysia 10.1 10.1
Singapore 8.3 8.6
(ii) US operations
31 Dec 2014 % 31 Dec 2013 %
Assumed new business spread margins:*
Fixed annuity business:†
January to June issues 1.5 1.2
July to December issues 1.5 1.75
Fixed index annuity business:
January to June issues 2.0 1.45
July to December issues 2.0 2.0
Institutional business 0.7 0.75
Allowance for long-term defaults included in projected
spreadnote 16(a)(viii) 0.25 0.25
Risk discount rate:
Variable annuity:
Risk discount rate 6.9 7.6
Additional allowance for credit risk included in
risk discount ratenote 16(a)(viii) 0.2 0.2
Non-variable annuity:
Risk
discount rate 3.9 4.8
Additional allowance for credit risk included in risk discount ratenote 16(a) (viii) 1.0 1.0
Weighted average total:
New business 6.7 7.4
In force 6.2 6.9
US 10-year treasury bond rate at end of year 2.2 3.1
Pre-tax expected long-term nominal rate of return for US equities 6.2 7.1
Expected long-term
rate of inflation 2.8 2.6
Equity risk premium 4.0 4.0
S&P equity return
volatilitynote 17 (v) 18.0 19.0
* Including the proportion of variable annuity business invested in the general account and fixed index annuity business, the
assumed spread margin grades up linearly by 25 basis points to a long-term assumption over five years.
† Including the proportion of variable annuity business
invested in the general account.
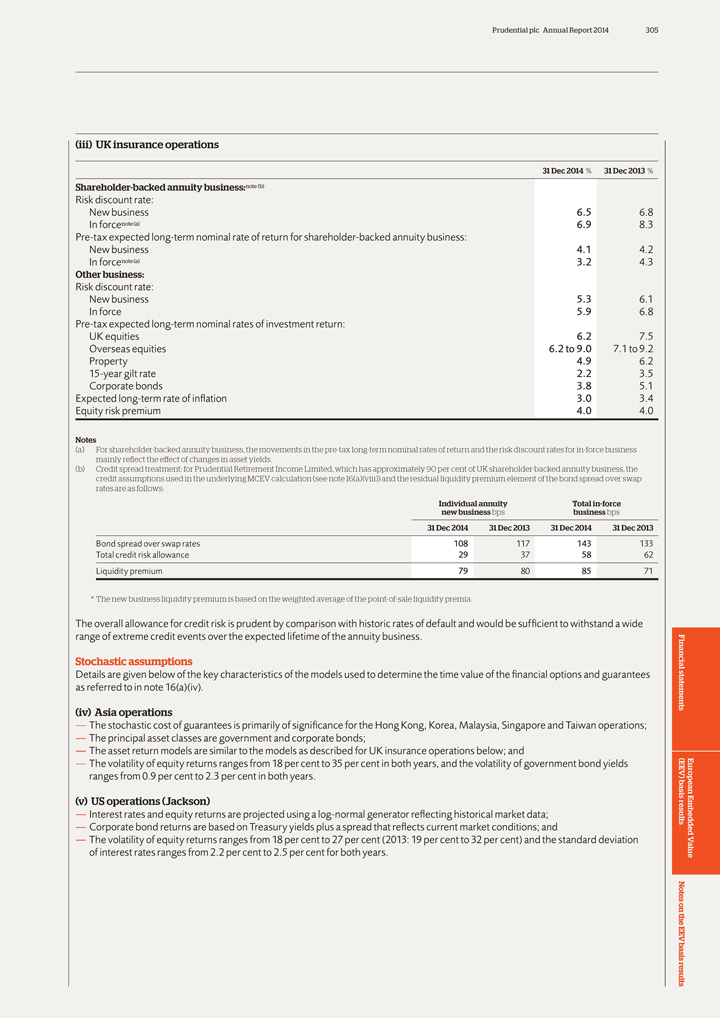
Prudential plc Annual Report 2014 305
(iii) UK
insurance operations
31 Dec 2014 % 31 Dec 2013 %
Shareholder-backed
annuity business:note (b)
Risk discount rate:
New business 6.5 6.8
In forcenote (a) 6.9 8.3
Pre-tax expected long-term nominal rate of return for
shareholder-backed annuity business:
New business 4.1 4.2
In forcenote
(a) 3.2 4.3
Other business:
Risk discount rate:
New business 5.3 6.1
In force 5.9 6.8
Pre-tax expected long-term nominal rates of investment return:
UK equities 6.2 7.5
Overseas equities 6.2 to 9.0 7.1 to 9.2
Property 4.9 6.2
15-year gilt rate 2.2 3.5
Corporate bonds 3.8 5.1
Expected long-term rate of inflation 3.0 3.4
Equity risk premium 4.0 4.0
Notes
(a) For shareholder-backed annuity business, the movements in the pre-tax long-term
nominal rates of return and the risk discount rates for in-force business mainly reflect the effect of changes in asset yields.
(b) Credit spread treatment: for
Prudential Retirement Income Limited, which has approximately 90 per cent of UK shareholder-backed annuity business, the credit assumptions used in the underlying MCEV calculation (see note 16(a)(viii)) and the residual liquidity premium
element of the bond spread over swap rates are as follows:
Individual annuity Total in-force
new business bps business bps
31 Dec 2014 31 Dec 2013 31 Dec 2014 31 Dec 2013
Bond spread over swap rates 108 117 143 133
Total credit risk allowance 29 37 58 62
Liquidity premium 79 80 85 71
* The new business liquidity premium is based
on the weighted average of the point-of-sale liquidity premia.
The overall allowance for credit risk is prudent by comparison with historic rates of default and
would be sufficient to withstand a wide range of extreme credit events over the expected lifetime of the annuity business.
Stochastic assumptions
Details are given below of the key characteristics of the models used to determine the time value of the financial options and guarantees as referred to in note 16(a)(iv).
(iv) Asia operations
— The stochastic cost of guarantees is primarily of
significance for the Hong Kong, Korea, Malaysia, Singapore and Taiwan operations;
— The principal asset classes are government and corporate bonds;
— The asset return models are similar to the models as described for UK insurance operations below; and
— The volatility of equity returns ranges from 18 per cent to 35 per cent in both years, and the volatility of government bond yields ranges from 0.9 per cent
to 2.3 per cent in both years.
(v) US operations (Jackson)
—
Interest rates and equity returns are projected using a log-normal generator reflecting historical market data;
— Corporate bond returns are based on Treasury
yields plus a spread that reflects current market conditions; and
— The volatility of equity returns ranges from 18 per cent to 27 per cent (2013:
19 per cent to 32 per cent) and the standard deviation of interest rates ranges from 2.2 per cent to 2.5 per cent for both years.
European
Embedded Value
Financial statements (EEV) basis results Notes on the EEV basis results
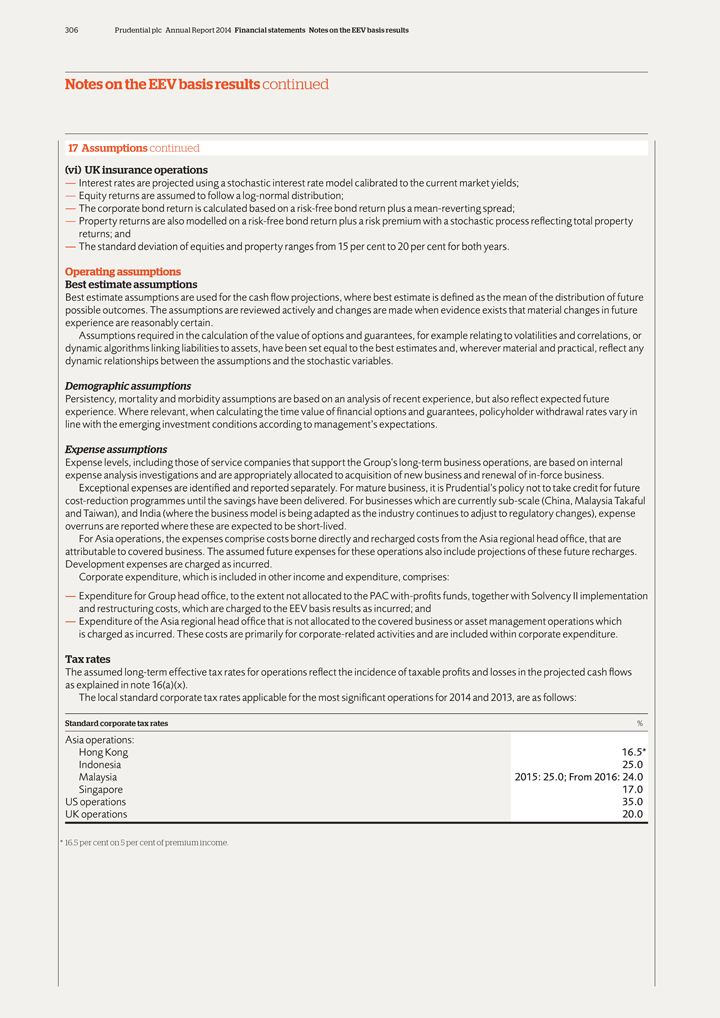
306 Prudential plc Annual Report 2014 Financial statements Notes on the EEV basis results
Notes on the EEV basis results continued
17 Assumptions continued
(vi) UK insurance operations
— Interest rates are projected using a stochastic interest
rate model calibrated to the current market yields;
— Equity returns are assumed to follow a log-normal distribution;
— The corporate bond return is calculated based on a risk-free bond return plus a mean-reverting spread;
— Property returns are also modelled on a risk-free bond return plus a risk premium with a stochastic process reflecting total property returns; and
— The standard deviation of equities and property ranges from 15 per cent to 20 per cent for both years.
Operating assumptions Best estimate assumptions
Best estimate assumptions are used for the
cash flow projections, where best estimate is defined as the mean of the distribution of future possible outcomes. The assumptions are reviewed actively and changes are made when evidence exists that material changes in future experience are
reasonably certain.
Assumptions required in the calculation of the value of options and guarantees, for example relating to volatilities and correlations, or
dynamic algorithms linking liabilities to assets, have been set equal to the best estimates and, wherever material and practical, reflect any dynamic relationships between the assumptions and the stochastic variables.
Demographic assumptions
Persistency, mortality and morbidity assumptions are based on an
analysis of recent experience, but also reflect expected future experience. Where relevant, when calculating the time value of financial options and guarantees, policyholder withdrawal rates vary in line with the emerging investment conditions
according to management’s expectations.
Expense assumptions
Expense
levels, including those of service companies that support the Group’s long-term business operations, are based on internal expense analysis investigations and are appropriately allocated to acquisition of new business and renewal of in-force
business.
Exceptional expenses are identified and reported separately. For mature business, it is Prudential’s policy not to take credit for future
cost-reduction programmes until the savings have been delivered. For businesses which are currently sub-scale (China, Malaysia Takaful and Taiwan), and India (where the business model is being adapted as the industry continues to adjust to
regulatory changes), expense overruns are reported where these are expected to be short-lived.
For Asia operations, the expenses comprise costs borne directly and
recharged costs from the Asia regional head office, that are attributable to covered business. The assumed future expenses for these operations also include projections of these future recharges. Development expenses are charged as incurred.
Corporate expenditure, which is included in other income and expenditure, comprises:
— Expenditure for Group head office, to the extent not allocated to the PAC with-profits funds, together with Solvency II implementation and restructuring costs, which are
charged to the EEV basis results as incurred; and
— Expenditure of the Asia regional head office that is not allocated to the covered business or asset
management operations which is charged as incurred. These costs are primarily for corporate-related activities and are included within corporate expenditure.
Tax
rates
The assumed long-term effective tax rates for operations reflect the incidence of taxable profits and losses in the projected cash flows as explained in note
16(a)(x).
The local standard corporate tax rates applicable for the most significant operations for 2014 and 2013, are as follows:
Standard corporate tax rates %
Asia operations:
Hong Kong 16.5*
Indonesia 25.0
Malaysia 2015: 25.0; From 2016: 24.0
Singapore 17.0
US operations 35.0
UK operations 20.0
* 16.5 per cent on 5 per cent of premium income.
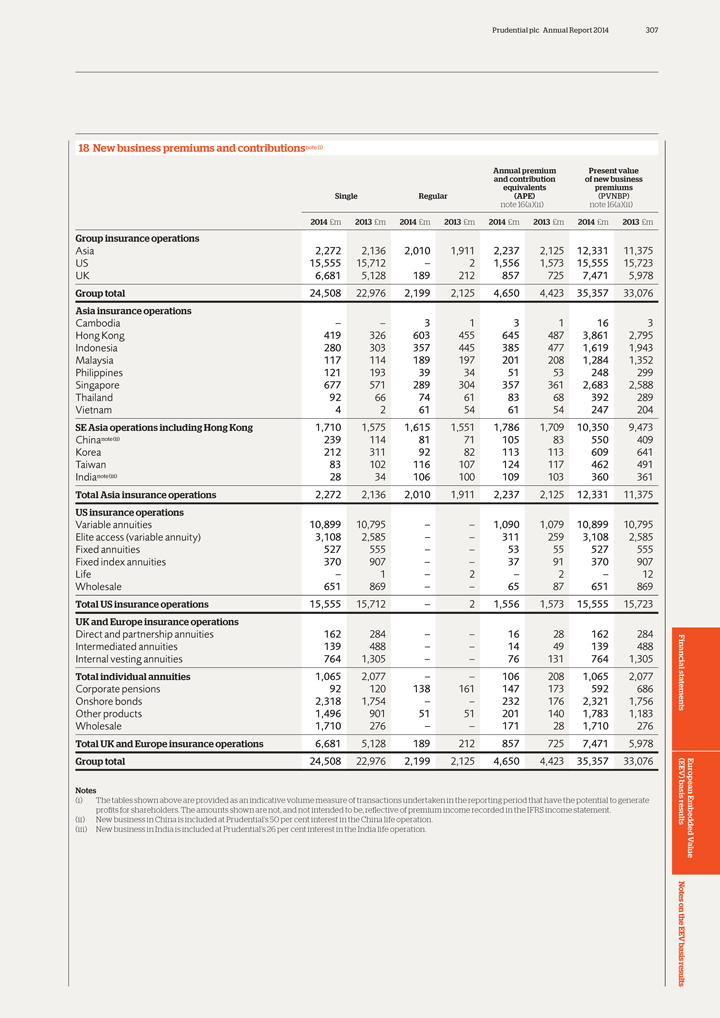
Prudential plc Annual Report 2014 307
18 New
business premiums and contributionsnote (i)
Annual premium Present value
and
contribution of new business
equivalents premiums
Single Regular (APE)
(PVNBP)
note 16(a)(ii) note 16(a)(ii)
2014 £m 2013 £m 2014
£m 2013 £m 2014 £m 2013 £m 2014 £m 2013 £m
Group insurance operations
Asia 2,272 2,136 2,010 1,911 2,237 2,125 12,331 11,375
US 15,555 15,712 – 2 1,556 1,573
15,555 15,723
UK 6,681 5,128 189 212 857 725 7,471 5,978
Group total 24,508
22,976 2,199 2,125 4,650 4,423 35,357 33,076
Asia insurance operations
Cambodia – – 3 1 3 1 16 3
Hong Kong 419 326 603 455 645 487 3,861
2,795
Indonesia 280 303 357 445 385 477 1,619 1,943
Malaysia 117 114 189 197
201 208 1,284 1,352
Philippines 121 193 39 34 51 53 248 299
Singapore 677 571
289 304 357 361 2,683 2,588
Thailand 92 66 74 61 83 68 392 289
Vietnam 4 2 61
54 61 54 247 204
SE Asia operations including Hong Kong 1,710 1,575 1,615 1,551 1,786 1,709 10,350 9,473
Chinanote (ii) 239 114 81 71 105 83 550 409
Korea 212 311 92 82 113 113 609 641
Taiwan 83 102 116 107 124 117 462 491
Indianote (iii) 28 34 106 100 109
103 360 361
Total Asia insurance operations 2,272 2,136 2,010 1,911 2,237 2,125 12,331 11,375
US insurance operations
Variable annuities 10,899 10,795 – – 1,090 1,079 10,899
10,795
Elite access (variable annuity) 3,108 2,585 – – 311 259 3,108 2,585
Fixed annuities 527 555 – – 53 55 527 555
Fixed index annuities 370 907 –
– 37 91 370 907
Life – 1 – 2 – 2 – 12
Wholesale 651
869 – – 65 87 651 869
Total US insurance operations 15,555 15,712 – 2 1,556 1,573 15,555 15,723
UK and Europe insurance operations
Direct and partnership annuities 162 284 – – 16
28 162 284
Intermediated annuities 139 488 – – 14 49 139 488
Internal vesting annuities 764 1,305 – – 76 131 764 1,305
Total
individual annuities 1,065 2,077 – – 106 208 1,065 2,077
Corporate pensions 92 120 138 161 147 173 592 686
Onshore bonds 2,318 1,754 – – 232 176 2,321 1,756
Other products 1,496 901 51 51 201
140 1,783 1,183
Wholesale 1,710 276 – – 171 28 1,710 276
Total UK
and Europe insurance operations 6,681 5,128 189 212 857 725 7,471 5,978
Group total 24,508 22,976 2,199 2,125 4,650 4,423 35,357 33,076
Notes
(i) The tables shown above are provided as an indicative volume measure of transactions
undertaken in the reporting period that have the potential to generate profits for shareholders. The amounts shown are not, and not intended to be, reflective of premium income recorded in the IFRS income statement.
(ii) New business in China is included at Prudential’s 50 per cent interest in the China life operation. (iii) New business in India is included at Prudential’s
26 per cent interest in the India life operation.
European Embedded Value
Financial statements basis(EEV) results Notes on the EEV basis results

308 Prudential plc Annual Report 2014 Financial statements Statement of directors’ responsibilities/Independent auditor’s
report
Statement of directors’ responsibilities in respect of the
European Embedded Value (EEV) basis supplementary information
The directors
have chosen to prepare In preparing the EEV supplementary
supplementary information in information, the directors have:
accordance with the EEV Principles
— Prepared the supplementary
issued in May 2004 by the European
information in accordance with the
CFO Forum as supplemented by the
EEV Principles;
Additional Guidance on EEV
Disclosures issued in October 2005. — Identified and described
the business
When compliance with the EEV covered by the EVM;
Principles is
stated, those principles require
— Applied the EVM consistently to the
the directors to prepare supplementary
covered business;
information in accordance with the
Embedded Value Methodology (EVM) — Determined
assumptions on a realistic
contained in the EEV Principles and to basis, having regard to past, current and
disclose and explain any non-compliance expected future experience and to any
with the EEV
guidance included in the relevant external data, and then applied
EEV Principles. them consistently;
— Made estimates that are reasonable and
consistent; and
— Described the basis on which business
that is not covered business has been
included in the supplementary
information, including any material
departures from the accounting
framework applicable to the Group’s
financial statements.
Prudential plc Annual Report 2014 309
Independent
auditor’s report to Prudential plc on the
European Embedded Value (EEV) basis supplementary information
Opinions and conclusions arising Respective responsibilities of The purpose of this report and
from our audit directors and auditor restrictions on its use by persons
As
explained more fully in the Directors’ other than the Company
Our opinion on the EEV basis Responsibilities statement set out on This report is made solely to
the Company
supplementary information is page 308, the directors have accepted in accordance with the terms of our
unmodified responsibility for the preparation of the engagement. Our audit work has been
We
have audited the EEV basis supplementary information on the undertaken so that we might state to the
supplementary information of Prudential EEV basis in
accordance with the Company those matters we have been
plc (the Company) for the year ended EEV Principles. engaged to state in this report and for no
31 December 2014 set out in the EEV basis Our responsibility is to audit, and other purpose. To the fullest extent
results and Notes on the EEV basis results express an opinion on, the supplementary permitted by law, we do not accept or
pages. The EEV basis supplementary information in accordance with the terms of assume responsibility to anyone other than
information should be read in conjunction our engagement and in accordance with the Company for our audit work, for this
with the Group financial statements. International Standards on Auditing (UK report, or for the opinions we have formed.
In our opinion, the EEV basis and Ireland). Those standards require us to
supplementary
information of the comply with the Auditing Practices Board’s
Company for the year ended 31 December Ethical Standards for Auditors.
2014 has been properly prepared, in all
material respects, in accordance with the Scope of an
audit of financial
European Embedded Value Principles statements performed in accordance
issued in May 2004 by the European CFO with ISAs (UK and Ireland)
Forum as supplemented by the
Additional A description of the scope of an audit of Rees Aronson
Guidance on European Embedded Value financial statements is provided on our
Disclosures issued in October 2005 website at www.kpmg.com/uk/ for and on behalf of KPMG LLP
(together ‘the EEV Principles’) using the auditscopeother2013 This report is made Chartered Accountants
methodology and assumptions set out in subject to important explanations London
the Notes on
the EEV basis results. regarding our responsibilities, as published 9 March 2015
This report is made solely to the on that website, which are incorporated
Company in accordance with the terms of into this report as if set out in full and
our engagement. Our audit work has been should be read to provide an
undertaken so that we
might state to the understanding of the purpose of this
Company those matters we have been report, the work we have undertaken and
engaged to state in this report and for no the basis of our opinions.
other purpose. To the
fullest extent
permitted by law, we do not accept or
assume responsibility to
anyone other than
the Company for our audit work, for this
report, or for the
opinions we have formed.
Statement of directors’ European Embedded Value responsibilities/Independent Financial statements basis(EEV) results auditor’s
report

310 Prudential plc Annual Report 2014

Prudential plc Annual Report 2014 311
Section 7
Additional information
312 Index to the additional unaudited financial information 338 Risk factors 344 Glossary 348 Shareholder information 351 How to contact us
Additional 7information

312 Prudential plc Annual Report 2014 Additional information Additional unaudited financial information
Index to the additional unaudited financial information
I. IFRS profit and loss information
313 a Analysis of long-term insurance business pre-tax IFRS operating profit based on longer-term investment returns by driver 318 b Asia operations –
analysis of IFRS operating profit by territory 319 c Analysis of asset management operating profit based on longer-term investment returns
II. Other information
320 a Holding company cash flow 321 b Funds under management 322 c Development of economic capital
328 d Reconciliation of expected transfer of value of in-force (VIF) and required capital business to free surplus 332 e Foreign currency source of key metrics 332 f Option schemes
335 g Selected historical financial information of Prudential 337 h Results of sold PruHealth and PruProtect businesses
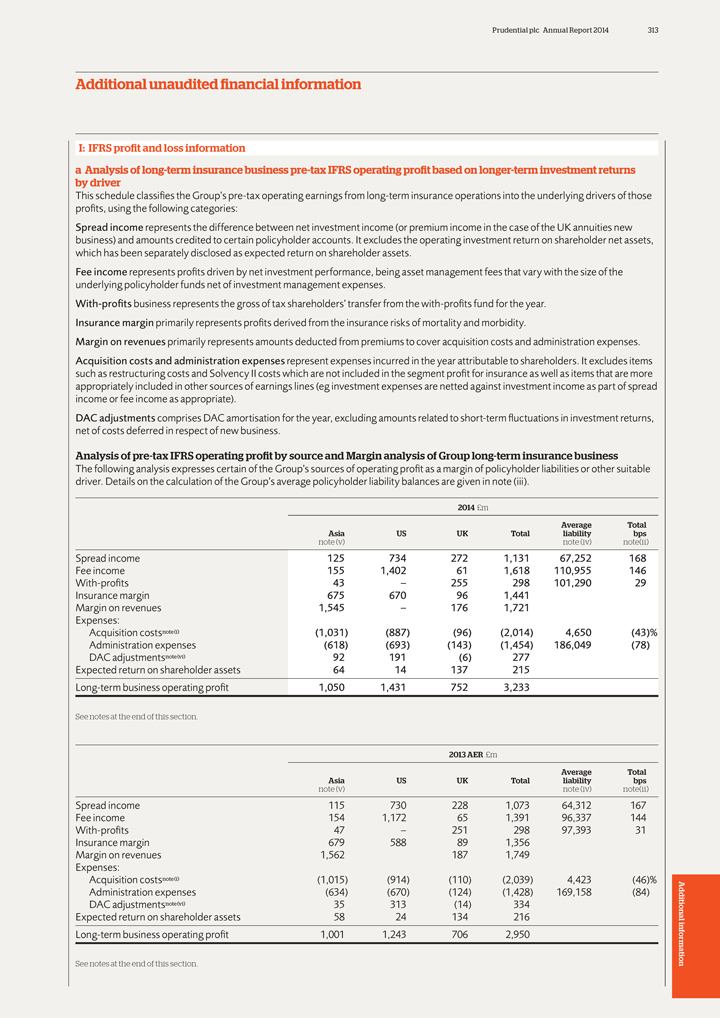
Prudential plc Annual Report 2014 313
Additional
unaudited financial information
I: IFRS profit and loss information
a
Analysis of long-term insurance business pre-tax IFRS operating profit based on longer-term investment returns by driver
This schedule classifies the Group’s
pre-tax operating earnings from long-term insurance operations into the underlying drivers of those profits, using the following categories:
Spread income
represents the difference between net investment income (or premium income in the case of the UK annuities new business) and amounts credited to certain policyholder accounts. It excludes the operating investment return on shareholder net assets,
which has been separately disclosed as expected return on shareholder assets.
Fee income represents profits driven by net investment performance, being asset
management fees that vary with the size of the underlying policyholder funds net of investment management expenses.
With-profits business represents the gross of
tax shareholders’ transfer from the with-profits fund for the year.
Insurance margin primarily represents profits derived from the insurance risks of
mortality and morbidity.
Margin on revenues primarily represents amounts deducted from premiums to cover acquisition costs and administration expenses.
Acquisition costs and administration expenses represent expenses incurred in the year attributable to shareholders. It excludes items such as restructuring costs and Solvency II
costs which are not included in the segment profit for insurance as well as items that are more appropriately included in other sources of earnings lines (eg investment expenses are netted against investment income as part of spread income or fee
income as appropriate).
DAC adjustments comprises DAC amortisation for the year, excluding amounts related to short-term fluctuations in investment returns, net of
costs deferred in respect of new business.
Analysis of pre-tax IFRS operating profit by source and Margin analysis of Group long-term insurance business
The following analysis expresses certain of the Group’s sources of operating profit as a margin of policyholder liabilities or other suitable driver. Details
on the calculation of the Group’s average policyholder liability balances are given in note (iii).
2014 £m
Average Total
Asia US UK Total liability bps
note (v) note (iv) note(ii)
Spread income 125 734 272 1,131 67,252 168
Fee income 155 1,402 61 1,618 110,955 146
With-profits 43 – 255 298 101,290 29
Insurance margin 675 670 96 1,441
Margin on revenues 1,545 – 176 1,721
Expenses:
Acquisition costsnote
(i) (1,031) (887) (96) (2,014) 4,650 (43)%
Administration expenses (618) (693) (143) (1,454) 186,049 (78)
DAC adjustmentsnote (vi) 92 191 (6) 277
Expected return on shareholder assets 64 14
137 215
Long-term business operating profit 1,050 1,431 752 3,233
See notes
at the end of this section.
2013 AER £m
Average Total
Asia US UK Total liability bps
note (v) note (iv) note(ii)
Spread income 115 730 228 1,073 64,312 167
Fee income 154 1,172 65 1,391 96,337 144
With-profits 47 – 251 298 97,393 31
Insurance margin 679 588 89 1,356
Margin on revenues 1,562 187 1,749
Expenses:
Acquisition costsnote (i) (1,015) (914) (110) (2,039) 4,423 (46)%
Administration expenses (634) (670) (124) (1,428) 169,158 (84)
DAC adjustmentsnote (vi) 35 313 (14) 334
Expected return on shareholder assets 58 24
134 216
Long-term business operating profit 1,001 1,243 706 2,950
See notes
at the end of this section.
Additional information
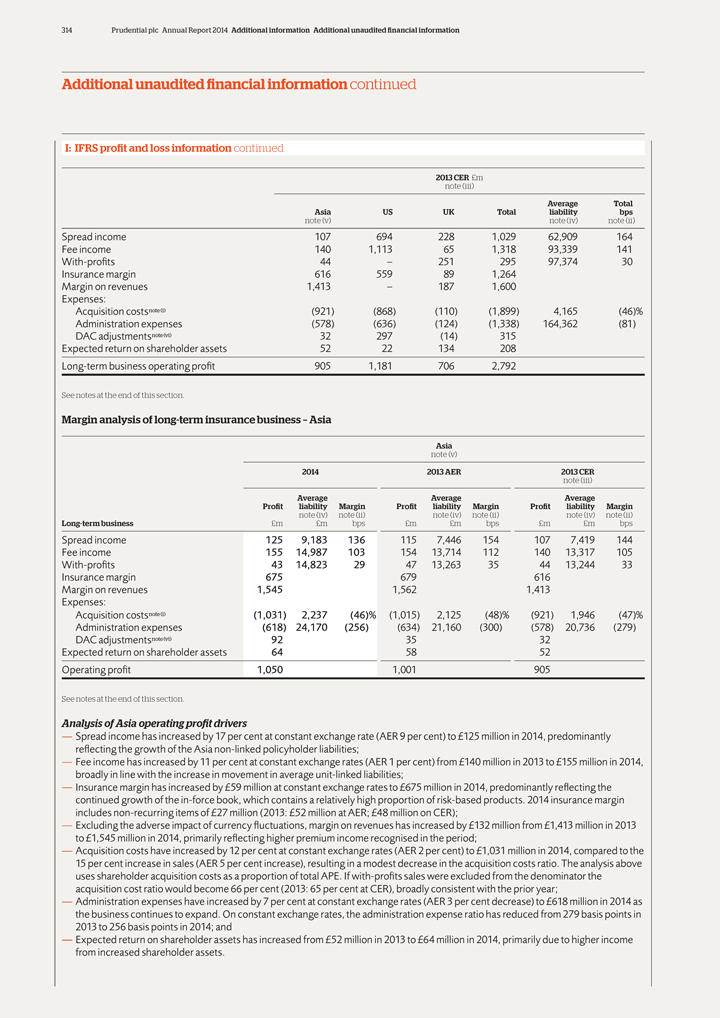
314 Prudential plc Annual Report 2014 Additional information Additional unaudited financial information
Additional unaudited financial information continued
I: IFRS profit and loss information
continued
2013 CER £m
note (iii)
Average Total
Asia US UK Total liability bps
note (v) note (iv) note (ii)
Spread income 107 694 228 1,029 62,909 164
Fee income 140 1,113 65 1,318 93,339 141
With-profits 44 – 251 295 97,374 30
Insurance margin 616 559 89 1,264
Margin on revenues 1,413 – 187 1,600
Expenses:
Acquisition costsnote (i) (921) (868) (110) (1,899) 4,165
(46)%
Administration expenses (578) (636) (124) (1,338) 164,362 (81)
DAC adjustmentsnote (vi) 32 297 (14) 315
Expected return on shareholder assets 52 22
134 208
Long-term business operating profit 905 1,181 706 2,792
See notes at
the end of this section.
Margin analysis of long-term insurance business – Asia
Asia
note (v)
2014 2013 AER 2013 CER
note (iii)
Average Average Average
Profit liability Margin Profit liability Margin Profit liability
Margin
note (iv) note (ii) note (iv) note (ii) note (iv) note (ii)
Long-term business £m £m bps £m £m bps £m £m bps
Spread
income 125 9,183 136 115 7,446 154 107 7,419 144
Fee income 155 14,987 103 154 13,714 112 140 13,317 105
With-profits 43 14,823 29 47 13,263 35 44 13,244 33
Insurance margin 675 679 616
Margin on revenues 1,545 1,562 1,413
Expenses:
Acquisition costsnote (i) (1,031) 2,237 (46)% (1,015) 2,125 (48)% (921) 1,946 (47)%
Administration expenses (618) 24,170 (256) (634) 21,160 (300) (578) 20,736 (279)
DAC adjustmentsnote (vi) 92 35 32
Expected return on shareholder assets 64 58 52
Operating profit 1,050 1,001 905
See notes at the end of this section.
Analysis of Asia operating profit drivers
— Spread income has increased
by 17 per cent at constant exchange rate (AER 9 per cent) to £125 million in 2014, predominantly reflecting the growth of the Asia non-linked policyholder liabilities;
— Fee income has increased by 11 per cent at constant exchange rates (AER 1 per cent) from £140 million in 2013 to £155 million in 2014,
broadly in line with the increase in movement in average unit-linked liabilities;
— Insurance margin has increased by £59 million at constant
exchange rates to £675 million in 2014, predominantly reflecting the continued growth of the in-force book, which contains a relatively high proportion of risk-based products. 2014 insurance margin includes non-recurring items of
£27 million (2013: £52 million at AER; £48 million on CER);
— Excluding the adverse impact of currency fluctuations, margin
on revenues has increased by £132 million from £1,413 million in 2013 to £1,545 million in 2014, primarily reflecting higher premium income recognised in the period;
— Acquisition costs have increased by 12 per cent at constant exchange rates (AER 2 per cent) to £1,031 million in 2014, compared to the 15 per cent
increase in sales (AER 5 per cent increase), resulting in a modest decrease in the acquisition costs ratio. The analysis above uses shareholder acquisition costs as a proportion of total APE. If with-profits sales were excluded from the
denominator the acquisition cost ratio would become 66 per cent (2013: 65 per cent at CER), broadly consistent with the prior year;
— Administration
expenses have increased by 7 per cent at constant exchange rates (AER 3 per cent decrease) to £618 million in 2014 as the business continues to expand. On constant exchange rates, the administration expense ratio has reduced
from 279 basis points in 2013 to 256 basis points in 2014; and
— Expected return on shareholder assets has increased from £52 million in 2013 to
£64 million in 2014, primarily due to higher income from increased shareholder assets.
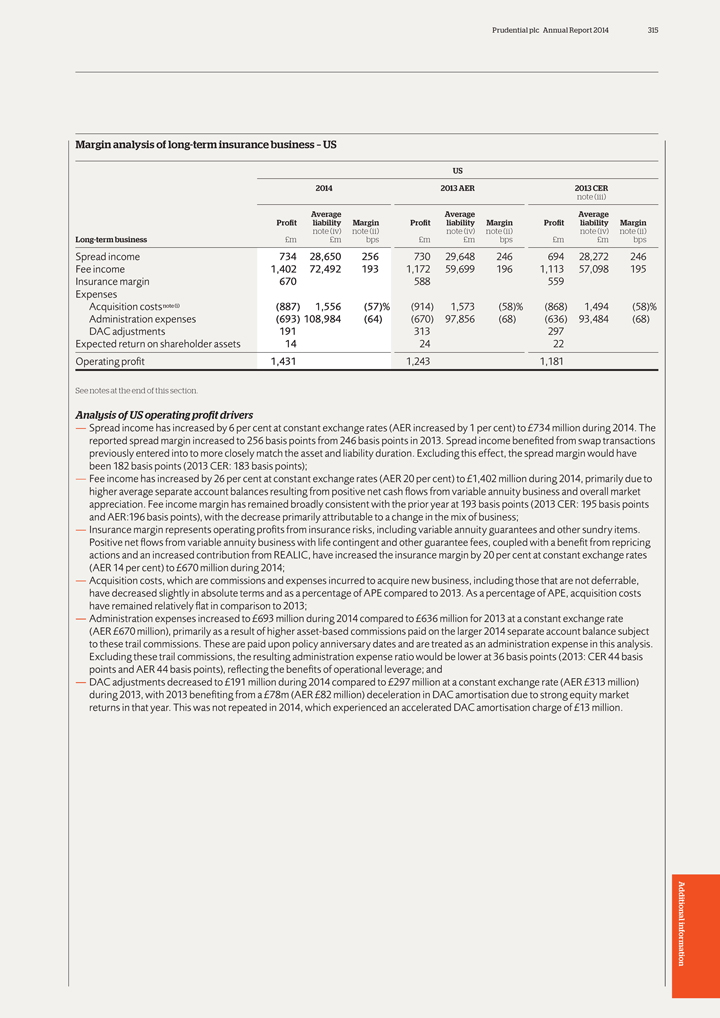
Prudential plc Annual Report 2014 315
Margin
analysis of long-term insurance business – US
US
2014 2013 AER 2013 CER
note (iii)
Average Average Average
Profit liability Margin Profit liability Margin Profit liability Margin
note (iv) note
(ii) note (iv) note (ii) note (iv) note (ii)
Long-term business £m £m bps £m £m bps £m £m bps
Spread income 734 28,650 256 730 29,648 246 694 28,272 246
Fee income 1,402 72,492 193 1,172
59,699 196 1,113 57,098 195
Insurance margin 670 588 559
Expenses
Acquisition costs note (i) (887) 1,556 (57)% (914) 1,573 (58)% (868) 1,494 (58)%
Administration expenses (693) 108,984 (64) (670) 97,856 (68) (636) 93,484 (68)
DAC adjustments 191 313 297
Expected return on shareholder assets 14 24 22
Operating profit 1,431 1,243 1,181
See notes at the end of this section.
Analysis of US operating profit drivers
— Spread income has increased by 6 per cent
at constant exchange rates (AER increased by 1 per cent) to £734 million during 2014. The reported spread margin increased to 256 basis points from 246 basis points in 2013. Spread income benefited from swap transactions previously
entered into to more closely match the asset and liability duration. Excluding this effect, the spread margin would have been 182 basis points (2013 CER: 183 basis points);
— Fee income has increased by 26 per cent at constant exchange rates (AER 20 per cent) to £1,402 million during 2014, primarily due to higher average
separate account balances resulting from positive net cash flows from variable annuity business and overall market appreciation. Fee income margin has remained broadly consistent with the prior year at 193 basis points (2013 CER: 195 basis points
and AER:196 basis points), with the decrease primarily attributable to a change in the mix of business;
— Insurance margin represents operating profits from
insurance risks, including variable annuity guarantees and other sundry items. Positive net flows from variable annuity business with life contingent and other guarantee fees, coupled with a benefit from repricing actions and an increased
contribution from REALIC, have increased the insurance margin by 20 per cent at constant exchange rates (AER 14 per cent) to £670 million during 2014;
— Acquisition costs, which are commissions and expenses incurred to acquire new business, including those that are not deferrable, have decreased slightly in absolute terms
and as a percentage of APE compared to 2013. As a percentage of APE, acquisition costs have remained relatively flat in comparison to 2013;
— Administration
expenses increased to £693 million during 2014 compared to £636 million for 2013 at a constant exchange rate (AER £670 million), primarily as a result of higher asset-based commissions paid on the larger 2014 separate
account balance subject to these trail commissions. These are paid upon policy anniversary dates and are treated as an administration expense in this analysis. Excluding these trail commissions, the resulting administration expense ratio would be
lower at 36 basis points (2013: CER 44 basis points and AER 44 basis points), reflecting the benefits of operational leverage; and
— DAC adjustments decreased
to £191 million during 2014 compared to £297 million at a constant exchange rate (AER £313 million) during 2013, with 2013 benefiting from a £78m (AER £82 million) deceleration in DAC amortisation due to
strong equity market returns in that year. This was not repeated in 2014, which experienced an accelerated DAC amortisation charge of £13 million.
Additional
information
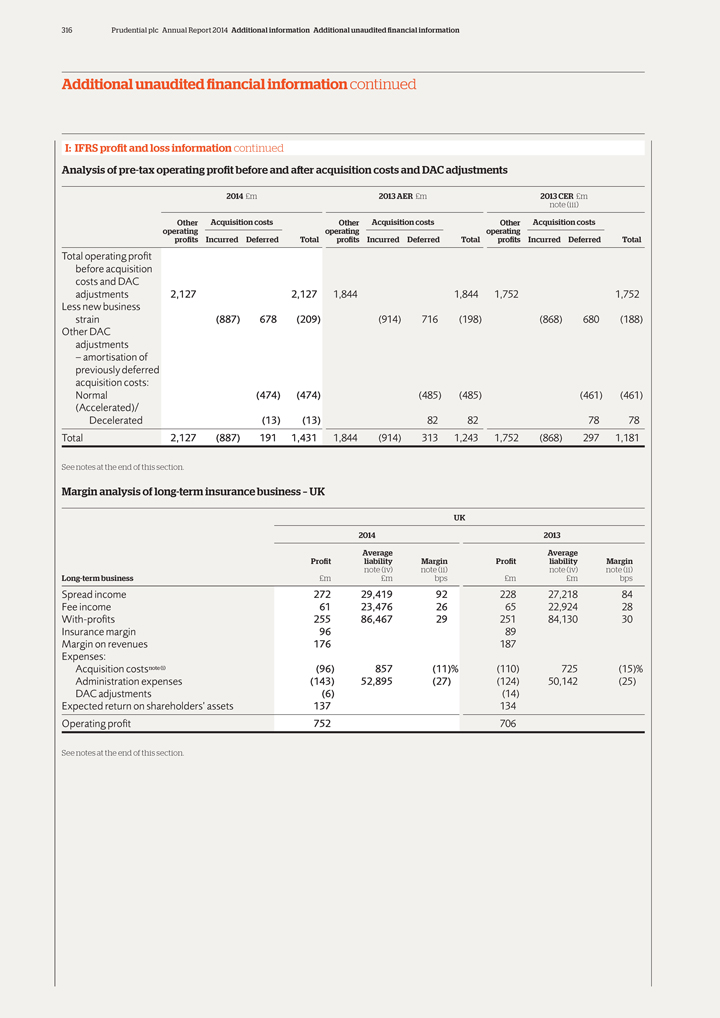
316 Prudential plc Annual Report 2014 Additional information Additional unaudited financial information
Additional unaudited financial information continued
I: IFRS profit and loss information
continued
Analysis of pre-tax operating profit before and after acquisition costs and DAC adjustments
2014 £m 2013 AER £m 2013 CER £m
note (iii)
Other Acquisition costs Other Acquisition costs Other Acquisition costs
operating operating
operating
profits Incurred Deferred Total profits Incurred Deferred Total profits Incurred Deferred Total
Total operating profit
before acquisition
costs and DAC
adjustments 2,127 2,127 1,844 1,844 1,752 1,752
Less new business
strain (887) 678 (209) (914) 716 (198) (868) 680
(188)
Other DAC
adjustments
– amortisation of
previously deferred
acquisition costs:
Normal (474) (474) (485) (485) (461) (461)
(Accelerated)/
Decelerated (13) (13) 82 82 78 78
Total 2,127 (887) 191 1,431 1,844 (914) 313 1,243 1,752 (868) 297 1,181
See
notes at the end of this section.
Margin analysis of long-term insurance business – UK
UK
2014 2013
Average Average
Profit liability Margin Profit liability Margin
note (iv) note (ii) note (iv) note (ii)
Long-term business £m £m
bps £m £m bps
Spread income 272 29,419 92 228 27,218 84
Fee
income 61 23,476 26 65 22,924 28
With-profits 255 86,467 29 251 84,130 30
Insurance margin 96 89
Margin on revenues 176 187
Expenses:
Acquisition costsnote (i) (96) 857 (11)% (110) 725 (15)%
Administration expenses (143) 52,895 (27) (124) 50,142 (25)
DAC adjustments
(6) (14)
Expected return on shareholders’ assets 137 134
Operating
profit 752 706
See notes at the end of this section.
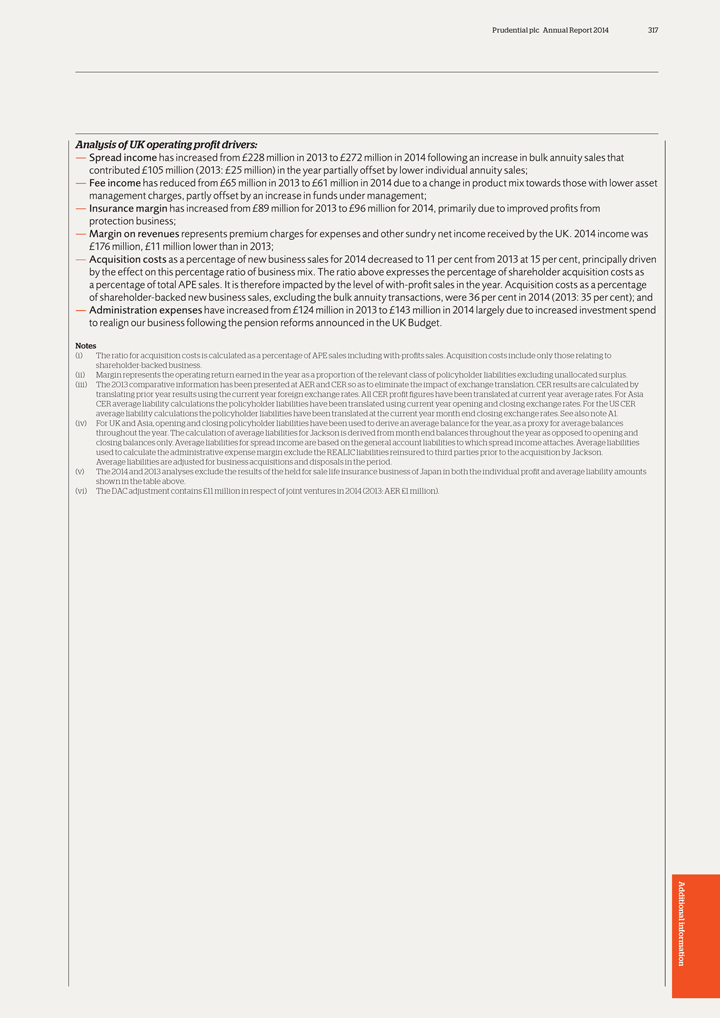
Prudential plc Annual Report 2014 317
Analysis of
UK operating profit drivers:
— Spread income has increased from £228 million in 2013 to £272 million in 2014 following an increase in
bulk annuity sales that contributed £105 million (2013: £25 million) in the year partially offset by lower individual annuity sales;
— Fee
income has reduced from £65 million in 2013 to £61 million in 2014 due to a change in product mix towards those with lower asset management charges, partly offset by an increase in funds under management;
— Insurance margin has increased from £89 million for 2013 to £96 million for 2014, primarily due to improved profits from protection business;
— Margin on revenues represents premium charges for expenses and other sundry net income received by the UK. 2014 income was £176 million,
£11 million lower than in 2013;
— Acquisition costs as a percentage of new business sales for 2014 decreased to 11 per cent from 2013 at
15 per cent, principally driven by the effect on this percentage ratio of business mix. The ratio above expresses the percentage of shareholder acquisition costs as a percentage of total APE sales. It is therefore impacted by the level of
with-profit sales in the year. Acquisition costs as a percentage of shareholder-backed new business sales, excluding the bulk annuity transactions, were 36 per cent in 2014 (2013: 35 per cent); and
— Administration expenses have increased from £124 million in 2013 to £143 million in 2014 largely due to increased investment spend to realign our
business following the pension reforms announced in the UK Budget.
Notes
(i)
The ratio for acquisition costs is calculated as a percentage of APE sales including with-profits sales. Acquisition costs include only those relating to shareholder-backed business.
(ii) Margin represents the operating return earned in the year as a proportion of the relevant class of policyholder liabilities excluding unallocated surplus. (iii) The 2013
comparative information has been presented at AER and CER so as to eliminate the impact of exchange translation. CER results are calculated by translating prior year results using the current year foreign exchange rates. All CER profit figures have
been translated at current year average rates. For Asia CER average liability calculations the policyholder liabilities have been translated using current year opening and closing exchange rates. For the US CER average liability calculations the
policyholder liabilities have been translated at the current year month end closing exchange rates. See also note A1. (iv) For UK and Asia, opening and closing policyholder liabilities have been used to derive an average balance for the year,
as a proxy for average balances throughout the year. The calculation of average liabilities for Jackson is derived from month end balances throughout the year as opposed to opening and closing balances only. Average liabilities for spread income are
based on the general account liabilities to which spread income attaches. Average liabilities used to calculate the administrative expense margin exclude the REALIC liabilities reinsured to third parties prior to the acquisition by Jackson. Average
liabilities are adjusted for business acquisitions and disposals in the period.
(v) The 2014 and 2013 analyses exclude the results of the held for sale life
insurance business of Japan in both the individual profit and average liability amounts shown in the table above.
(vi) The DAC adjustment contains
£11 million in respect of joint ventures in 2014 (2013: AER £1 million).
Additional information
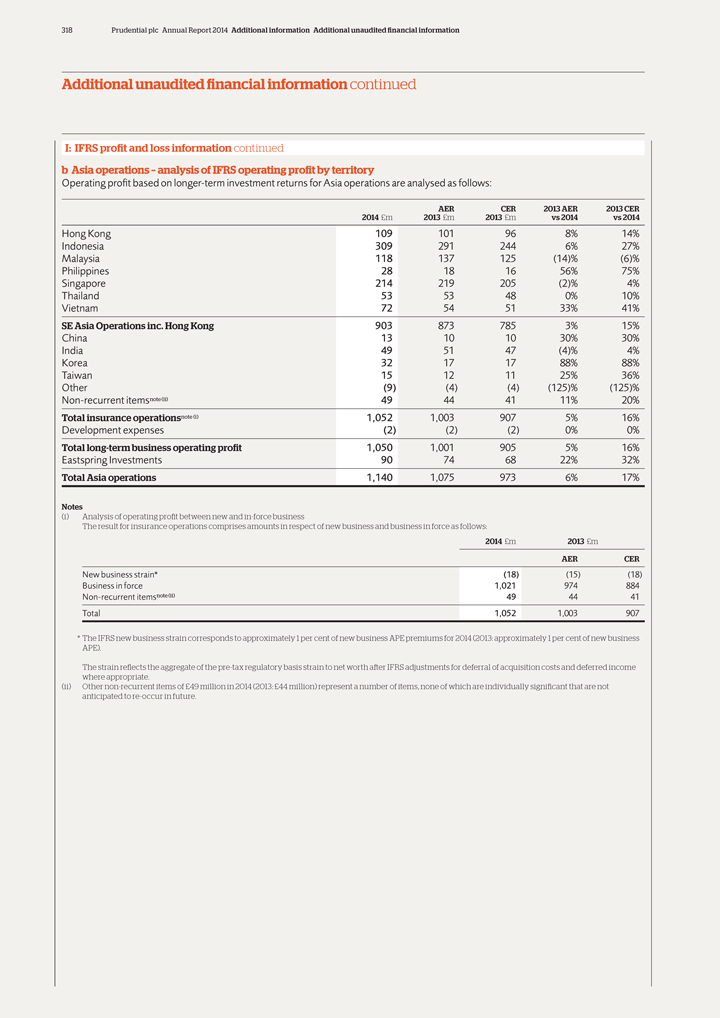
318 Prudential plc Annual Report 2014 Additional information Additional unaudited financial information
Additional unaudited financial information continued
I: IFRS profit and loss information
continued
b Asia operations – analysis of IFRS operating profit by territory
Operating profit based on longer-term investment returns for Asia operations are analysed as follows:
AER CER 2013 AER 2013 CER
2014 £m 2013 £m 2013 £m vs 2014 vs 2014
Hong Kong 109 101 96 8% 14%
Indonesia 309 291 244 6% 27%
Malaysia 118 137 125 (14)% (6)%
Philippines 28 18 16 56% 75%
Singapore 214 219 205 (2)% 4%
Thailand 53 53 48 0% 10%
Vietnam 72 54 51 33% 41%
SE Asia Operations inc. Hong Kong 903 873 785 3% 15%
China 13 10 10 30% 30%
India 49 51 47 (4)% 4%
Korea 32 17 17 88% 88%
Taiwan 15 12 11 25% 36%
Other (9) (4) (4) (125)% (125)%
Non-recurrent itemsnote (ii) 49 44 41 11%
20%
Total insurance operationsnote (i) 1,052 1,003 907 5% 16%
Development expenses (2) (2) (2) 0% 0%
Total long-term
business operating profit 1,050 1,001 905 5% 16%
Eastspring Investments 90 74 68 22% 32%
Total Asia operations 1,140 1,075 973 6% 17%
2014 £m 2013 £m
AER CER
New business strain* (18) (15) (18)
Business in force 1,021 974 884
Non-recurrent itemsnote (ii) 49 44 41
Total 1,052 1,003 907
Notes
(i) Analysis of operating profit between new and in-force business
The result for insurance
operations comprises amounts in respect of new business and business in force as follows:
* The IFRS new business strain corresponds to approximately 1 per
cent of new business APE premiums for 2014 (2013: approximately 1 per cent of new business APE).
The strain reflects the aggregate of the pre-tax regulatory
basis strain to net worth after IFRS adjustments for deferral of acquisition costs and deferred income where appropriate.
(ii) Other non-recurrent items of
£49 million in 2014 (2013: £44 million) represent a number of items, none of which are individually significant that are not anticipated to re-occur in future.
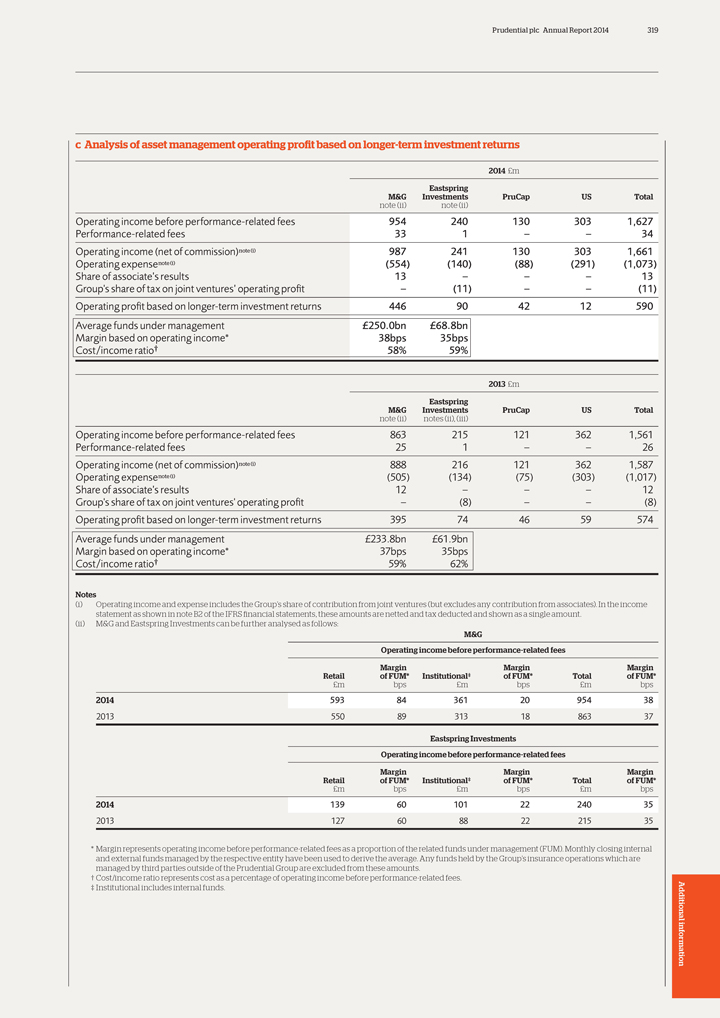
Prudential plc Annual Report 2014 319
c Analysis
of asset management operating profit based on longer-term investment returns
2014 £m
Eastspring
M&G Investments PruCap US Total
note (ii) note (ii)
Operating income before performance-related fees 954 240 130 303 1,627
Performance-related fees 33 1 – – 34
Operating income (net of
commission)note (i) 987 241 130 303 1,661
Operating expensenote (i) (554) (140) (88) (291) (1,073)
Share of associate’s results 13 – – – 13
Group’s share of tax on
joint ventures’ operating profit – (11) – – (11)
Operating profit based on longer-term investment returns 446 90 42 12 590
Average funds under management £250.0bn £68.8bn
Margin based on operating income*
38bps 35bps
Cost/income ratio† 58% 59%
2013 £m
Eastspring
M&G Investments PruCap US Total
note (ii) notes (ii), (iii)
Operating income before performance-related fees 863 215 121
362 1,561
Performance-related fees 25 1 – – 26
Operating income
(net of commission)note (i) 888 216 121 362 1,587
Operating expensenote (i) (505) (134) (75) (303) (1,017)
Share of associate’s results 12 – – – 12
Group’s share of tax on
joint ventures’ operating pro?t – (8) – – (8)
Operating pro?t based on longer-term investment returns 395 74 46 59 574
Average funds under management £233.8bn £61.9bn
Margin based on operating income*
37bps 35bps
Cost/income ratio† 59% 62%
M&G
Operating income before performance-related fees
Margin Margin Margin
Retail of FUM* Institutional‡ of FUM* Total of FUM*
£m bps £m bps £m
bps
2014 593 84 361 20 954 38
2013 550 89 313 18 863 37
Eastspring Investments
Operating income before performance-related fees
Margin Margin Margin
Retail of FUM* Institutional‡ of FUM* Total of FUM*
£m bps £m bps £m bps
2014 139 60 101 22 240 35
2013 127 60 88 22 215 35
Notes
(i) Operating income and expense includes the Group’s share of contribution from joint ventures (but excludes any contribution from associates). In the income statement as
shown in note B2 of the IFRS financial statements, these amounts are netted and tax deducted and shown as a single amount.
(ii) M&G and Eastspring Investments
can be further analysed as follows:
* Margin represents operating income before performance-related fees as a proportion of the related funds under management
(FUM). Monthly closing internal and external funds managed by the respective entity have been used to derive the average. Any funds held by the Group’s insurance operations which are managed by third parties outside of the Prudential Group are
excluded from these amounts.
† Cost/income ratio represents cost as a percentage of operating income before performance-related fees.
‡ Institutional includes internal funds.
Additional information
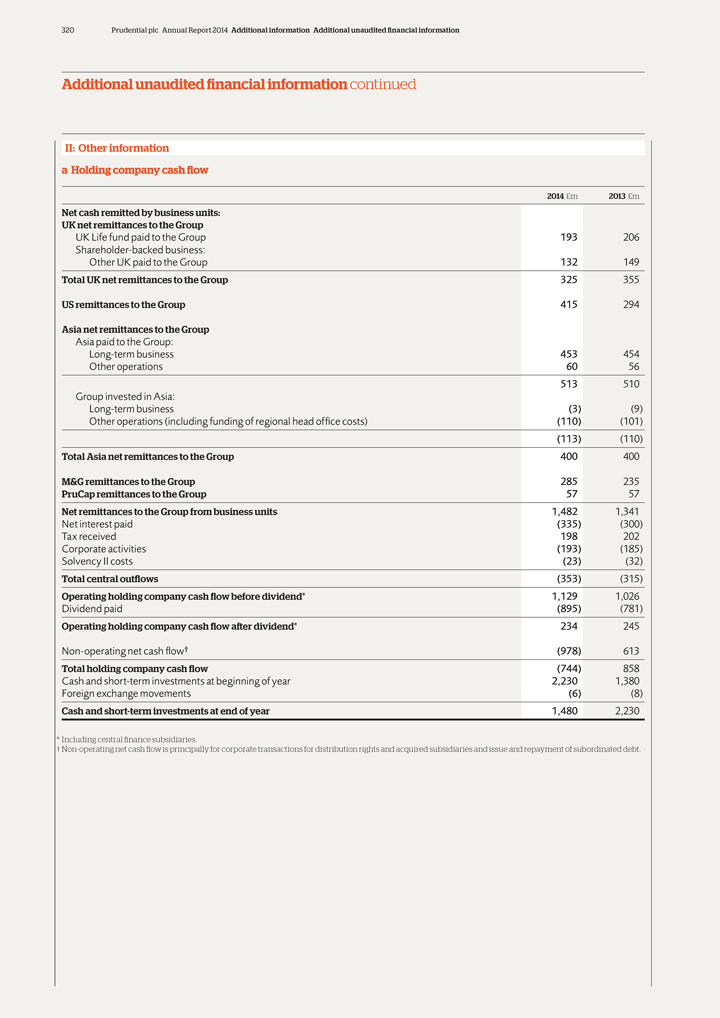
320 Prudential plc Annual Report 2014 Additional information Additional unaudited financial information
Additional unaudited financial information continued
II: Other information
a Holding company cash flow
2014 £m 2013 £m
Net cash remitted by business units:
UK net remittances to the Group
UK Life fund paid to the Group 193 206
Shareholder-backed business:
Other UK paid to the Group 132 149
Total UK net remittances to the Group 325 355
US remittances to the Group 415 294
Asia net remittances to the Group
Asia paid to the Group:
Long-term business 453 454
Other operations 60 56
513 510
Group invested in Asia:
Long-term business (3) (9)
Other operations (including funding of regional head office costs) (110) (101)
(113)
(110)
Total Asia net remittances to the Group 400 400
M&G remittances to
the Group 285 235
PruCap remittances to the Group 57 57
Net remittances to
the Group from business units 1,482 1,341
Net interest paid (335) (300)
Tax received 198 202
Corporate activities (193) (185)
Solvency II costs (23) (32)
Total central outflows (353) (315)
Operating holding company cash flow before dividend* 1,129 1,026
Dividend paid
(895) (781)
Operating holding company cash flow after dividend* 234 245
Non-operating net cash flow† (978) 613
Total holding company cash
flow (744) 858
Cash and short-term investments at beginning of year 2,230 1,380
Foreign exchange movements (6) (8)
Cash and short-term investments at end of year 1,480
2,230
* Including central finance subsidiaries.
† Non-operating net cash
flow is principally for corporate transactions for distribution rights and acquired subsidiaries and issue and repayment of subordinated debt.
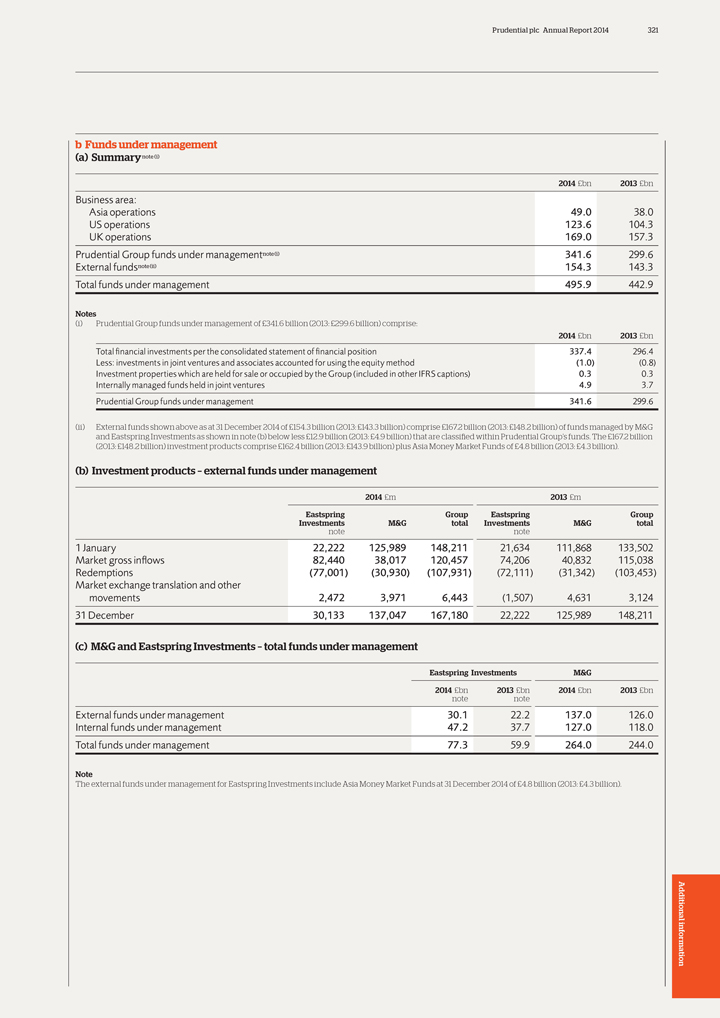
Prudential plc Annual Report 2014 321
b Funds
under management (a) Summary note (i)
2014 £bn 2013 £bn
Business area:
Asia operations 49.0 38.0 US operations 123.6 104.3 UK
operations 169.0 157.3 Prudential Group funds under managementnote (i) 341.6 299.6 External fundsnote (ii) 154.3 143.3 Total funds under management 495.9 442.9
Notes
(i) Prudential Group funds under management of £341.6 billion (2013: £299.6
billion) comprise:
2014 £bn 2013 £bn
Total financial investments
per the consolidated statement of financial position 337.4 296.4 Less: investments in joint ventures and associates accounted for using the equity method (1.0) (0.8) Investment properties which are held for sale or occupied by the Group
(included in other IFRS captions) 0.3 0.3 Internally managed funds held in joint ventures 4.9 3.7 Prudential Group funds under management 341.6 299.6
(ii) External
funds shown above as at 31 December 2014 of £154.3 billion (2013: £143.3 billion) comprise £167.2 billion (2013: £148.2 billion) of funds managed by M&G and Eastspring Investments as shown in note (b) below less
£12.9 billion (2013: £4.9 billion) that are classi fied within Prudential Group’s funds. The £167.2 billion (2013: £148.2 billion) investment products comprise £162.4 billion (2013: £143.9 billion) plus Asia
Money Market Funds of £4.8 billion (2013: £4.3 billion).
(b) Investment products – external funds under management
2014 £m 2013 £m
Eastspring Group Eastspring Group Investments M&G total
Investments M&G total note note
1 January 22,222 125,989 148,211 21,634 111,868 133,502 Market gross infiows 82,440 38,017 120,457 74,206 40,832
115,038 Redemptions (77,001) (30,930) (107,931) (72,111) (31,342) (103,453) Market exchange translation and other movements 2,472 3,971 6,443 (1,507) 4,631 3,124
31 December 30,133 137,047 167,180 22,222 125,989 148,211
(c) M&G and Eastspring
Investments – total funds under management
Eastspring Investments M&G
2014 £bn 2013 £bn 2014 £bn 2013 £bn note note
External funds under management 30.1 22.2 137.0 126.0 Internal funds under management 47.2 37.7 127.0 118.0 Total funds under management 77.3 59.9 264.0 244.0
Note
The external funds under management for Eastspring Investments include
Asia Money Market Funds at 31 December 2014 of £4.8 billion (2013: £4.3 billion).
Additional information
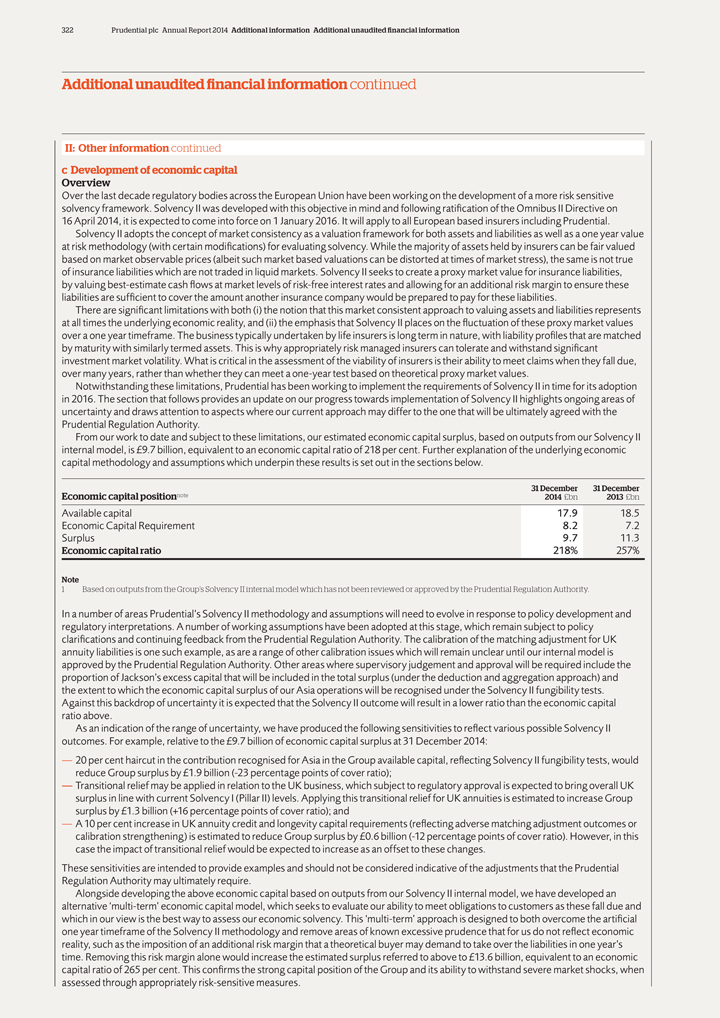
322 Prudential plc Annual Report 2014 Additional information Additional unaudited financial information
Additional unaudited financial information continued
II: Other information continued c
Development of economic capital Overview
Over the last decade regulatory bodies across the European Union have been working on the development of a more risk
sensitive solvency framework. Solvency II was developed with this objective in mind and following ratification of the Omnibus II Directive on
16 April 2014,
it is expected to come into force on 1 January 2016. It will apply to all European based insurers including Prudential. Solvency II adopts the concept of market consistency as a valuation framework for both assets and liabilities as well as a
one year value at risk methodology (with certain modifications) for evaluating solvency. While the majority of assets held by insurers can be fair valued based on market observable prices (albeit such market based valuations can be distorted at
times of market stress), the same is not true of insurance liabilities which are not traded in liquid markets. Solvency II seeks to create a proxy market value for insurance liabilities, by valuing best-estimate cash fiows at market levels of
risk-free interest rates and allowing for an additional risk margin to ensure these liabilities are sufficient to cover the amount another insurance company would be prepared to pay for these liabilities.
There are significant limitations with both (i) the notion that this market consistent approach to valuing assets and liabilities represents at all times the underlying
economic reality, and (ii) the emphasis that Solvency II places on the fiuctuation of these proxy market values over a one year timeframe. The business typically undertaken by life insurers is long term in nature, with liability profiles that
are matched by maturity with similarly termed assets. This is why appropriately risk managed insurers can tolerate and withstand significant investment market volatility. What is critical in the assessment of the viability of insurers is their
ability to meet claims when they fall due, over many years, rather than whether they can meet a one-year test based on theoretical proxy market values.
Notwithstanding these limitations, Prudential has been working to implement the requirements of Solvency II in time for its adoption in 2016. The section that
follows provides an update on our progress towards implementation of Solvency II highlights ongoing areas of uncertainty and draws attention to aspects where our current approach may differ to the one that will be ultimately agreed with the
Prudential Regulation Authority.
From our work to date and subject to these limitations, our estimated economic capital surplus, based on outputs from our Solvency
II internal model, is £9.7 billion, equivalent to an economic capital ratio of 218 per cent. Further explanation of the underlying economic capital methodology and assumptions which underpin these results is set out in the sections below.
31 December 31 December
Economic capital positionnote 2014
£bn 2013 £bn
Available capital 17.9 18.5 Economic Capital Requirement 8.2 7.2 Surplus 9.7 11.3
Economic capital ratio 218% 257%
Note
1 Based on outputs from the Group’s Solvency II internal model which has not been reviewed or approved by the Prudential Regulation Authority.
In a number of areas Prudential’s Solvency II methodology and assumptions will need to evolve in response to policy development and regulatory interpretations. A number of
working assumptions have been adopted at this stage, which remain subject to policy clarifications and continuing feedback from the Prudential Regulation Authority. The calibration of the matching adjustment for UK annuity liabilities is one such
example, as are a range of other calibration issues which will remain unclear until our internal model is approved by the Prudential Regulation Authority. Other areas where supervisory judgement and approval will be required include the proportion
of Jackson’s excess capital that will be included in the total surplus (under the deduction and aggregation approach) and the extent to which the economic capital surplus of our Asia operations will be recognised under the Solvency II
fungibility tests. Against this backdrop of uncertainty it is expected that the Solvency II outcome will result in a lower ratio than the economic capital ratio above.
As an indication of the range of uncertainty, we have produced the following sensitivities to refiect various possible Solvency II outcomes. For example, relative to the £9.7
billion of economic capital surplus at 31 December 2014:
— 20 per cent haircut in the contribution recognised for Asia in the Group available
capital, refiecting Solvency II fungibility tests, would reduce Group surplus by £1.9 billion (-23 percentage points of cover ratio);
— Transitional
relief may be applied in relation to the UK business, which subject to regulatory approval is expected to bring overall UK surplus in line with current Solvency I (Pillar II) levels. Applying this transitional relief for UK annuities is estimated to
increase Group surplus by £1.3 billion (+16 percentage points of cover ratio); and
— A 10 per cent increase in UK annuity credit and longevity
capital requirements (refiecting adverse matching adjustment outcomes or calibration strengthening) is estimated to reduce Group surplus by £0.6 billion (-12 percentage points of cover ratio). However, in this case the impact of transitional
relief would be expected to increase as an offset to these changes.
These sensitivities are intended to provide examples and should not be considered indicative of
the adjustments that the Prudential Regulation Authority may ultimately require.
Alongside developing the above economic capital based on outputs from our Solvency
II internal model, we have developed an alternative ‘multi-term’ economic capital model, which seeks to evaluate our ability to meet obligations to customers as these fall due and which in our view is the best way to assess our economic
solvency. This ‘multi-term’ approach is designed to both overcome the artificial one year timeframe of the Solvency II methodology and remove areas of known excessive prudence that for us do not refiect economic reality, such as the
imposition of an additional risk margin that a theoretical buyer may demand to take over the liabilities in one year’s time. Removing this risk margin alone would increase the estimated surplus referred to above to £13.6 billion,
equivalent to an economic capital ratio of 265 per cent. This confirms the strong capital position of the Group and its ability to withstand severe market shocks, when assessed through appropriately risk-sensitive measures.
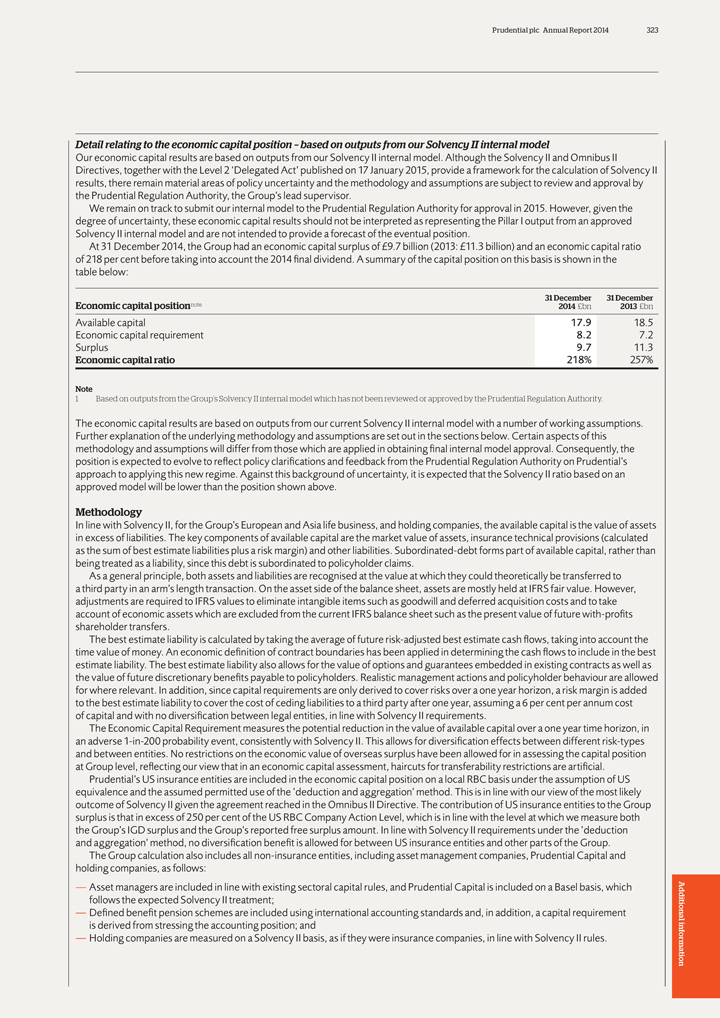
Prudential plc Annual Report 2014 323
Detail
relating to the economic capital position – based on outputs from our Solvency II internal model
Our economic capital results are based on outputs from our
Solvency II internal model. Although the Solvency II and Omnibus II
Directives, together with the Level 2 ‘Delegated Act’ published on 17 January
2015, provide a framework for the calculation of Solvency II results, there remain material areas of policy uncertainty and the methodology and assumptions are subject to review and approval by the Prudential Regulation Authority, the Group’s
lead supervisor.
We remain on track to submit our internal model to the Prudential Regulation Authority for approval in 2015. However, given the degree of
uncertainty, these economic capital results should not be interpreted as representing the Pillar I output from an approved Solvency II internal model and are not intended to provide a forecast of the eventual position.
At 31 December 2014, the Group had an economic capital surplus of £9.7 billion (2013: £11.3 billion) and an economic capital ratio of 218 per cent before
taking into account the 2014 final dividend. A summary of the capital position on this basis is shown in the table below:
31 December 31 December
Economic capital positionnote 2014 £bn 2013 £bn
Available capital
17.9 18.5 Economic capital requirement 8.2 7.2 Surplus 9.7 11.3
Economic capital ratio 218% 257%
Note
1 Based on outputs from the Group’s Solvency II internal model which has not been
reviewed or approved by the Prudential Regulation Authority.
The economic capital results are based on outputs from our current Solvency II internal model with a
number of working assumptions. Further explanation of the underlying methodology and assumptions are set out in the sections below. Certain aspects of this methodology and assumptions will differ from those which are applied in obtaining final
internal model approval. Consequently, the position is expected to evolve to refiect policy clarifications and feedback from the Prudential Regulation Authority on Prudential’s approach to applying this new regime. Against this background of
uncertainty, it is expected that the Solvency II ratio based on an approved model will be lower than the position shown above.
Methodology
In line with Solvency II, for the Group’s European and Asia life business, and holding companies, the available capital is the value of assets in excess of liabilities. The
key components of available capital are the market value of assets, insurance technical provisions (calculated as the sum of best estimate liabilities plus a risk margin) and other liabilities. Subordinated-debt forms part of available capital,
rather than being treated as a liability, since this debt is subordinated to policyholder claims.
As a general principle, both assets and liabilities are
recognised at the value at which they could theoretically be transferred to a third party in an arm’s length transaction. On the asset side of the balance sheet, assets are mostly held at IFRS fair value. However, adjustments are required to
IFRS values to eliminate intangible items such as goodwill and deferred acquisition costs and to take account of economic assets which are excluded from the current IFRS balance sheet such as the present value of future with-profits shareholder
transfers.
The best estimate liability is calculated by taking the average of future risk-adjusted best estimate cash fiows, taking into account the time value of
money. An economic definition of contract boundaries has been applied in determining the cash fiows to include in the best estimate liability. The best estimate liability also allows for the value of options and guarantees embedded in existing
contracts as well as the value of future discretionary benefits payable to policyholders. Realistic management actions and policyholder behaviour are allowed for where relevant. In addition, since capital requirements are only derived to cover risks
over a one year horizon, a risk margin is added to the best estimate liability to cover the cost of ceding liabilities to a third party after one year, assuming a 6 per cent per annum cost of capital and with no diversification between legal
entities, in line with Solvency II requirements.
The Economic Capital Requirement measures the potential reduction in the value of available capital over a one
year time horizon, in an adverse 1-in-200 probability event, consistently with Solvency II. This allows for diversification effects between different risk-types and between entities. No restrictions on the economic value of overseas surplus have
been allowed for in assessing the capital position at Group level, refiecting our view that in an economic capital assessment, haircuts for transferability restrictions are artificial.
Prudential’s US insurance entities are included in the economic capital position on a local RBC basis under the assumption of US equivalence and the assumed permitted use of
the ’deduction and aggregation’ method. This is in line with our view of the most likely outcome of Solvency II given the agreement reached in the Omnibus II Directive. The contribution of US insurance entities to the Group surplus is that
in excess of 250 per cent of the US RBC Company Action Level, which is in line with the level at which we measure both the Group’s IGD surplus and the Group’s reported free surplus amount. In line with Solvency II requirements under
the ’deduction and aggregation’ method, no diversification benefit is allowed for between US insurance entities and other parts of the Group.
The Group
calculation also includes all non-insurance entities, including asset management companies, Prudential Capital and holding companies, as follows:
— Asset
managers are included in line with existing sectoral capital rules, and Prudential Capital is included on a Basel basis, which follows the expected Solvency II treatment;
— Defined benefit pension schemes are included using international accounting standards and, in addition, a capital requirement Additional is derived from stressing the
accounting position; and
— Holding companies are measured on a Solvency II basis, as if they were insurance companies, in line with Solvency II rules.
information
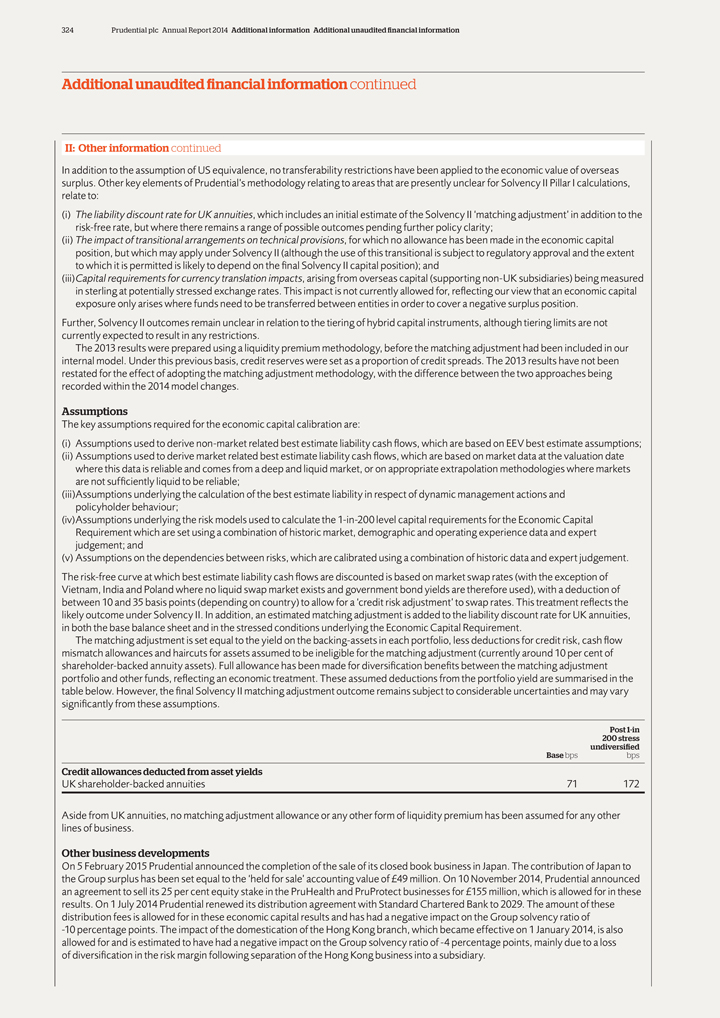
324 Prudential plc Annual Report 2014 Additional information Additional unaudited financial information
Additional unaudited financial information continued
II: Other information continued
In addition to the assumption of US equivalence, no transferability restrictions have been applied to the economic value of overseas surplus. Other key elements of
Prudential’s methodology relating to areas that are presently unclear for Solvency II Pillar I calculations, relate to: (i) The liability discount rate for UK annuities, which includes an initial estimate of the Solvency II ‘matching
adjustment’ in addition to the risk-free rate, but where there remains a range of possible outcomes pending further policy clarity; (ii) The impact of transitional arrangements on technical provisions, for which no allowance has been made
in the economic capital position, but which may apply under Solvency II (although the use of this transitional is subject to regulatory approval and the extent to which it is permitted is likely to depend on the final Solvency II capital position);
and (iii)Capital requirements for currency translation impacts, arising from overseas capital (supporting non-UK subsidiaries) being measured in sterling at potentially stressed exchange rates. This impact is not currently allowed for, refiecting
our view that an economic capital exposure only arises where funds need to be transferred between entities in order to cover a negative surplus position.
Further,
Solvency II outcomes remain unclear in relation to the tiering of hybrid capital instruments, although tiering limits are not currently expected to result in any restrictions.
The 2013 results were prepared using a liquidity premium methodology, before the matching adjustment had been included in our internal model. Under this previous basis, credit
reserves were set as a proportion of credit spreads. The 2013 results have not been restated for the effect of adopting the matching adjustment methodology, with the difference between the two approaches being recorded within the 2014 model changes.
Assumptions
The key assumptions required for the economic capital calibration
are:
(i) Assumptions used to derive non-market related best estimate liability cash fiows, which are based on EEV best estimate assumptions; (ii) Assumptions
used to derive market related best estimate liability cash fiows, which are based on market data at the valuation date where this data is reliable and comes from a deep and liquid market, or on appropriate extrapolation methodologies where markets
are not sufficiently liquid to be reliable; (iii)Assumptions underlying the calculation of the best estimate liability in respect of dynamic management actions and policyholder behaviour; (iv)Assumptions underlying the risk models used to calculate
the 1-in-200 level capital requirements for the Economic Capital Requirement which are set using a combination of historic market, demographic and operating experience data and expert judgement; and (v) Assumptions on the dependencies between
risks, which are calibrated using a combination of historic data and expert judgement. The risk-free curve at which best estimate liability cash fiows are discounted is based on market swap rates (with the exception of Vietnam, India and Poland
where no liquid swap market exists and government bond yields are therefore used), with a deduction of between 10 and 35 basis points (depending on country) to allow for a ‘credit risk adjustment’ to swap rates. This treatment refiects the
likely outcome under Solvency II. In addition, an estimated matching adjustment is added to the liability discount rate for UK annuities, in both the base balance sheet and in the stressed conditions underlying the Economic Capital Requirement.
The matching adjustment is set equal to the yield on the backing-assets in each portfolio, less deductions for credit risk, cash fiow mismatch allowances and
haircuts for assets assumed to be ineligible for the matching adjustment (currently around 10 per cent of shareholder-backed annuity assets). Full allowance has been made for diversification benefits between the matching adjustment portfolio
and other funds, refiecting an economic treatment. These assumed deductions from the portfolio yield are summarised in the table below. However, the final Solvency II matching adjustment outcome remains subject to considerable uncertainties and may
vary significantly from these assumptions.
Post 1-in 200 stress undiversi fied
Base bps bps
Credit allowances deducted from asset yields
UK shareholder-backed annuities 71 172
Aside from UK annuities, no matching adjustment
allowance or any other form of liquidity premium has been assumed for any other lines of business.
Other business developments
On 5 February 2015 Prudential announced the completion of the sale of its closed book business in Japan. The contribution of Japan to the Group surplus has been set equal to
the ‘held for sale’ accounting value of £49 million. On 10 November 2014, Prudential announced an agreement to sell its 25 per cent equity stake in the PruHealth and PruProtect businesses for £155 million, which
is allowed for in these results. On 1 July 2014 Prudential renewed its distribution agreement with Standard Chartered Bank to 2029. The amount of these distribution fees is allowed for in these economic capital results and has had a negative
impact on the Group solvency ratio of -10 percentage points. The impact of the domestication of the Hong Kong branch, which became effective on 1 January 2014, is also allowed for and is estimated to have had a negative impact on the Group
solvency ratio of -4 percentage points, mainly due to a loss of diversification in the risk margin following separation of the Hong Kong business into a subsidiary.
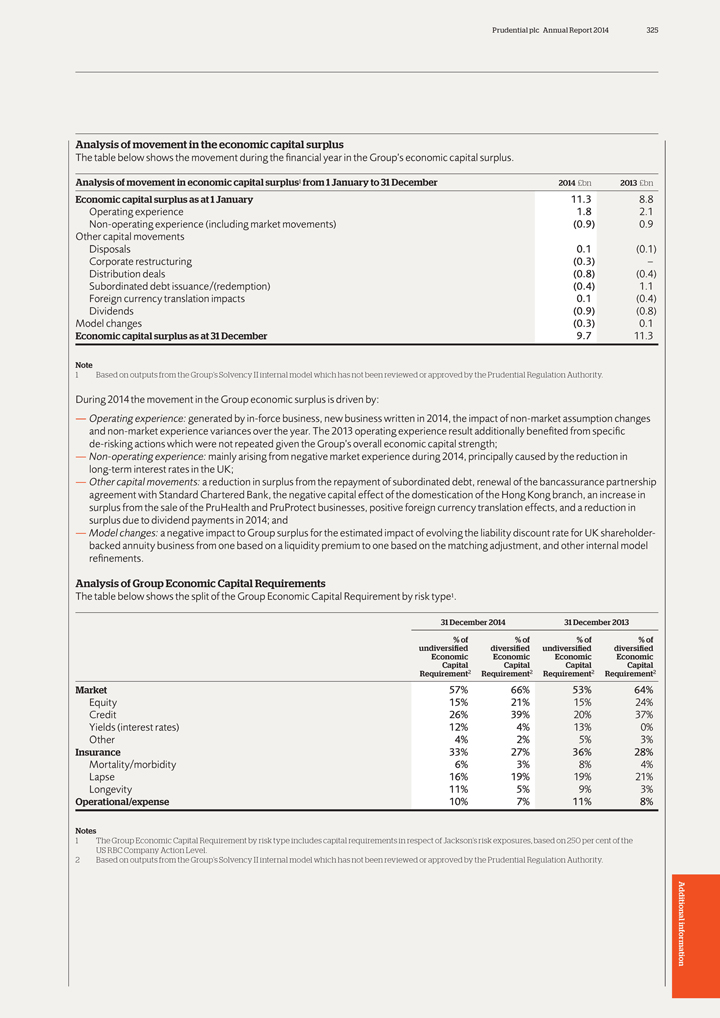
Prudential plc Annual Report 2014 325
Analysis of
movement in the economic capital surplus
The table below shows the movement during the financial year in the Group’s economic capital surplus.
Analysis of movement in economic capital surplus1 from 1 January to 31 December 2014 £bn 2013 £bn Economic capital surplus as at 1 January 11.3 8.8
Operating experience 1.8 2.1 Non-operating experience (including market movements) (0.9) 0.9 Other capital movements Disposals 0.1 (0.1) Corporate restructuring
(0.3) – Distribution deals (0.8) (0.4) Subordinated debt issuance/(redemption) (0.4) 1.1 Foreign currency translation impacts 0.1 (0.4) Dividends (0.9) (0.8) Model changes (0.3) 0.1
Economic capital surplus as at 31 December 9.7 11.3
Note
1 Based on outputs from the Group’s Solvency II internal model which has not been reviewed or approved by the Prudential Regulation Authority.
During 2014 the movement in the Group economic surplus is driven by:
— Operating
experience: generated by in-force business, new business written in 2014, the impact of non-market assumption changes and non-market experience variances over the year. The 2013 operating experience result additionally benefited from specific
de-risking actions which were not repeated given the Group’s overall economic capital strength;
— Non-operating experience: mainly arising from negative
market experience during 2014, principally caused by the reduction in long-term interest rates in the UK;
— Other capital movements: a reduction in surplus
from the repayment of subordinated debt, renewal of the bancassurance partnership agreement with Standard Chartered Bank, the negative capital effect of the domestication of the Hong Kong branch, an increase in surplus from the sale of the PruHealth
and PruProtect businesses, positive foreign currency translation effects, and a reduction in surplus due to dividend payments in 2014; and
— Model changes: a
negative impact to Group surplus for the estimated impact of evolving the liability discount rate for UK shareholder-backed annuity business from one based on a liquidity premium to one based on the matching adjustment, and other internal model
refinements.
Analysis of Group Economic Capital Requirements
The table below
shows the split of the Group Economic Capital Requirement by risk type1.
31 December 2014 31 December 2013
% of % of % of % of undiversi fied diversi fied undiversi fied diversi fied Economic Economic Economic Economic Capital Capital Capital Capital Requirement2 Requirement2
Requirement2 Requirement2
Market 57% 66% 53% 64%
Equity 15% 21% 15% 24%
Credit 26% 39% 20% 37% Yields (interest rates) 12% 4% 13% 0% Other 4% 2% 5% 3%
Insurance 33% 27% 36% 28%
Mortality/morbidity 6% 3% 8% 4% Lapse 16% 19% 19% 21% Longevity 11% 5% 9% 3%
Operational/expense 10% 7% 11% 8%
Notes
1 The Group Economic Capital Requirement by risk type includes capital requirements in respect of Jackson’s risk exposures, based on 250 per cent of the US RBC Company
Action Level.
2 Based on outputs from the Group’s Solvency II internal model which has not been reviewed or approved by the Prudential Regulation Authority.
Additional information
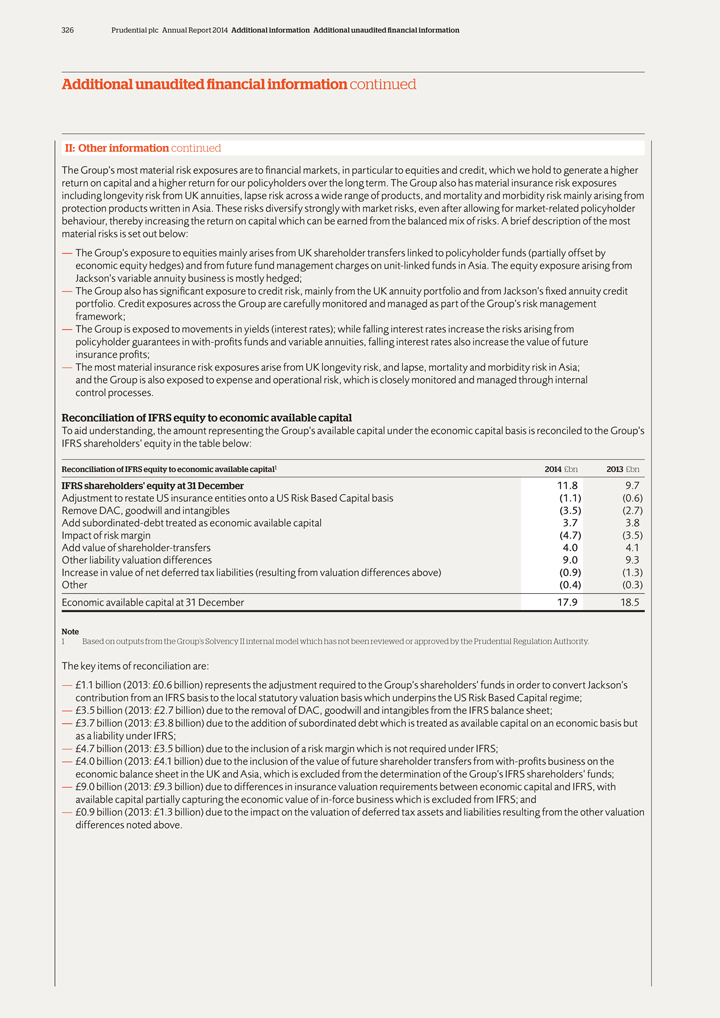
326 Prudential plc Annual Report 2014 Additional information Additional unaudited financial information
Additional unaudited financial information continued
II: Other information continued
The Group’s most material risk exposures are to financial markets, in particular to equities and credit, which we hold to generate a higher return on capital
and a higher return for our policyholders over the long term. The Group also has material insurance risk exposures including longevity risk from UK annuities, lapse risk across a wide range of products, and mortality and morbidity risk mainly
arising from protection products written in Asia. These risks diversify strongly with market risks, even after allowing for market-related policyholder behaviour, thereby increasing the return on capital which can be earned from the balanced mix of
risks. A brief description of the most material risks is set out below:
— The Group’s exposure to equities mainly arises from UK shareholder transfers
linked to policyholder funds (partially offset by economic equity hedges) and from future fund management charges on unit-linked funds in Asia. The equity exposure arising from Jackson’s variable annuity business is mostly hedged;
— The Group also has significant exposure to credit risk, mainly from the UK annuity portfolio and from Jackson’s fixed annuity credit portfolio. Credit exposures across
the Group are carefully monitored and managed as part of the Group’s risk management framework;
— The Group is exposed to movements in yields (interest
rates); while falling interest rates increase the risks arising from policyholder guarantees in with-profits funds and variable annuities, falling interest rates also increase the value of future insurance profits;
— The most material insurance risk exposures arise from UK longevity risk, and lapse, mortality and morbidity risk in Asia; and the Group is also exposed to expense and
operational risk, which is closely monitored and managed through internal control processes.
Reconciliation of IFRS equity to economic available capital
To aid understanding, the amount representing the Group’s available capital under the economic capital basis is reconciled to the Group’s IFRS
shareholders’ equity in the table below:
Reconciliation of IFRS equity to economic available capital1 2014 £bn 2013 £bn
IFRS shareholders’ equity at 31 December 11.8 9.7 Adjustment to restate US insurance entities onto a US Risk Based Capital basis (1.1) (0.6) Remove DAC,
goodwill and intangibles (3.5) (2.7) Add subordinated-debt treated as economic available capital 3.7 3.8 Impact of risk margin (4.7) (3.5) Add value of shareholder-transfers 4.0 4.1 Other liability valuation differences 9.0 9.3
Increase in value of net deferred tax liabilities (resulting from valuation differences above) (0.9) (1.3) Other (0.4) (0.3) Economic available capital at 31 December 17.9 18.5
Note
1 Based on outputs from the Group’s Solvency II internal model which has not been
reviewed or approved by the Prudential Regulation Authority.
The key items of reconciliation are:
— £1.1 billion (2013: £0.6 billion) represents the adjustment required to the Group’s shareholders’ funds in order to convert Jackson’s contribution
from an IFRS basis to the local statutory valuation basis which underpins the US Risk Based Capital regime;
— £3.5 billion (2013: £2.7 billion)
due to the removal of DAC, goodwill and intangibles from the IFRS balance sheet;
— £3.7 billion (2013: £3.8 billion) due to the addition of
subordinated debt which is treated as available capital on an economic basis but as a liability under IFRS;
— £4.7 billion (2013: £3.5 billion)
due to the inclusion of a risk margin which is not required under IFRS;
— £4.0 billion (2013: £4.1 billion) due to the inclusion of the value of
future shareholder transfers from with-profits business on the economic balance sheet in the UK and Asia, which is excluded from the determination of the Group’s IFRS shareholders’ funds;
— £9.0 billion (2013: £9.3 billion) due to differences in insurance valuation requirements between economic capital and IFRS, with available capital partially
capturing the economic value of in-force business which is excluded from IFRS; and
— £0.9 billion (2013: £1.3 billion) due to the impact on the
valuation of deferred tax assets and liabilities resulting from the other valuation differences noted above.
Prudential plc Annual Report 2014 327
Sensitivity
analysis
Stress testing this economic capital position gives the following results as at 31 December 2014:
— An instantaneous 20 per cent fall in equity markets would reduce surplus by £0.6 billion and reduce the economic solvency ratio to 214 per cent;
— An instantaneous 40 per cent fall in equity markets would reduce surplus by £2.2 billion and reduce the economic solvency ratio to 195 per cent;
— A 50 basis points reduction in interest rates (subject to a fioor of zero) would reduce surplus by £1.4 billion and reduce the economic solvency ratio to 195 per
cent;
— A 100 basis points increase in interest rates would increase surplus by £1.8 billion and increase the economic solvency ratio to 254 per
cent; and
— A 100 basis points increase in credit spreads with 15 per cent downgrades in the UK annuity portfolio1 would reduce surplus by £2.1
billion and reduce the economic solvency ratio to 190 per cent.
These sensitivity results are shown before the impact of potential management actions to
de-risk the exposures of shareholder funds. Even before such management actions are allowed for, the results demonstrate the resilience of the economic capital position following large falls in equity markets, sizeable reductions in yields (relative
to very low starting yields) and a severe credit event.
The adverse impact of falling equity markets mainly results from a reduction in the value of with-profits
shareholder transfers and future fund management charges in the UK and Asia. Equity hedging reduces the impact of these exposures and a dynamic equity hedging programme is also in place to manage the equity risk arising in Jackson’s variable
annuities business.
The adverse impact of a fall in yields largely arises from a decrease in the value of future with-profits shareholder transfers and an increase
in the size of risk margins. Falling yields also increases the value of the Group’s external debt, reducing the Group surplus. However, these impacts are partially offset by an increase in the value of future insurance profits and changes in
the value of hedging assets.
An increase in defaults and downgrades adversely impacts on the UK annuity credit book although the business is much less sensitive to
credit spreads under the matching adjustment framework. Jackson is not exposed to credit spread widening on a US RBC basis but an increase in defaults in the Jackson credit book would have a negative impact on the Group capital position and is
refiected in the credit stress test above.
Statement of independent review
The methodology, assumptions and overall result have been subject to examination by KPMG LLP.
Additional
Note
1 For UK annuity business, the matching adjustment is intended to signi ficantly reduce the sensitivity of surplus to credit spreads. The UK annuity credit information sensitivity
is therefore applied as 15 per cent of the portfolio downgrading, combined with an increase in credit spread stress of 88 basis points (which in total is commensurate with a 100 basis point credit spread stress). For Jackson, a 10x increase in
expected defaults is applied in line with IGD sensitivities since credit spreads do not directly affect the US RBC result.
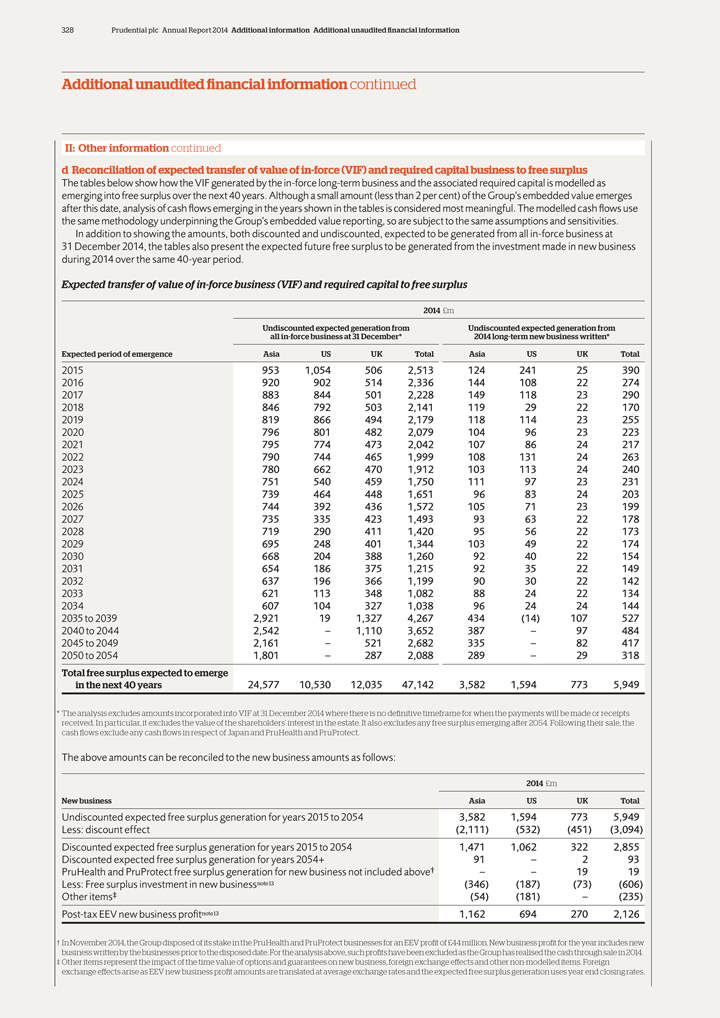
328 Prudential plc Annual Report 2014 Additional information Additional unaudited financial information
Additional unaudited financial information continued
II: Other information continued d
Reconciliation of expected transfer of value of in-force (VIF) and required capital business to free surplus
The tables below show how the VIF generated by the
in-force long-term business and the associated required capital is modelled as emerging into free surplus over the next 40 years. Although a small amount (less than 2 per cent) of the Group’s embedded value emerges after this date,
analysis of cash fiows emerging in the years shown in the tables is considered most meaningful. The modelled cash fiows use the same methodology underpinning the Group’s embedded value reporting, so are subject to the same assumptions and
sensitivities.
In addition to showing the amounts, both discounted and undiscounted, expected to be generated from all in-force business at
31 December 2014, the tables also present the expected future free surplus to be generated from the investment made in new business during 2014 over the same 40-year period.
Expected transfer of value of in-force business (VIF) and required capital to free surplus
2014 £m
Undiscounted expected generation from Undiscounted expected generation from all
in-force business at 31 December* 2014 long-term new business written*
Expected period of emergence Asia US UK Total Asia US UK Total
2015 953 1,054 506 2,513 124 241 25 390 2016 920 902 514 2,336 144 108 22 274 2017 883 844 501 2,228 149 118 23 290 2018 846 792 503 2,141 119 29 22 170 2019 819 866 494 2,179 118
114 23 255 2020 796 801 482 2,079 104 96 23 223 2021 795 774 473 2,042 107 86 24 217 2022 790 744 465 1,999 108 131 24 263 2023 780 662 470 1,912 103 113 24 240 2024 751 540 459 1,750 111 97 23 231 2025 739 464 448 1,651 96 83 24 203 2026 744 392
436 1,572 105 71 23 199 2027 735 335 423 1,493 93 63 22 178 2028 719 290 411 1,420 95 56 22 173 2029 695 248 401 1,344 103 49 22 174 2030 668 204 388 1,260 92 40 22 154 2031 654 186 375 1,215 92 35 22 149 2032 637 196 366 1,199 90 30 22 142 2033 621
113 348 1,082 88 24 22 134 2034 607 104 327 1,038 96 24 24 144 2035 to 2039 2,921 19 1,327 4,267 434 (14) 107 527 2040 to 2044 2,542 – 1,110 3,652 387 – 97 484 2045 to 2049 2,161 – 521 2,682 335 – 82 417 2050 to 2054 1,801
– 287 2,088 289 – 29 318
Total free surplus expected to emerge in the next 40 years 24,577 10,530 12,035 47,142 3,582 1,594 773 5,949
* The analysis excludes amounts incorporated into VIF at 31 December 2014 where there is no de finitive timeframe for when the payments will be made or receipts received. In
particular, it excludes the value of the shareholders’ interest in the estate. It also excludes any free surplus emerging after 2054. Following their sale, the cash flows exclude any cash flows in respect of Japan and PruHealth and PruProtect.
The above amounts can be reconciled to the new business amounts as follows:
2014 £m
New business Asia US UK Total
Undiscounted expected free surplus generation for years 2015 to 2054 3,582 1,594 773 5,949
Less: discount effect (2,111) (532) (451) (3,094)
Discounted
expected free surplus generation for years 2015 to 2054 1,471 1,062 322 2,855 Discounted expected free surplus generation for years 2054+ 91 – 2 93 PruHealth and PruProtect free surplus generation for new business not included above†
– – 19 19 Less: Free surplus investment in new businessnote 13 (346) (187) (73) (606)
Other items‡ (54) (181) – (235)
Post-tax EEV new business profitnote 13 1,162 694 270 2,126
† In
November 2014, the Group disposed of its stake in the PruHealth and PruProtect businesses for an EEV pro fit of £44 million. New business pro fit for the year includes new business written by the businesses prior to the disposed date. For the
analysis above, such pro fits have been excluded as the Group has realised the cash through sale in 2014.
‡ Other items represent the impact of the time value
of options and guarantees on new business, foreign exchange effects and other non-modelled items. Foreign exchange effects arise as EEV new business pro fit amounts are translated at average exchange rates and the expected free surplus generation
uses year end closing rates.
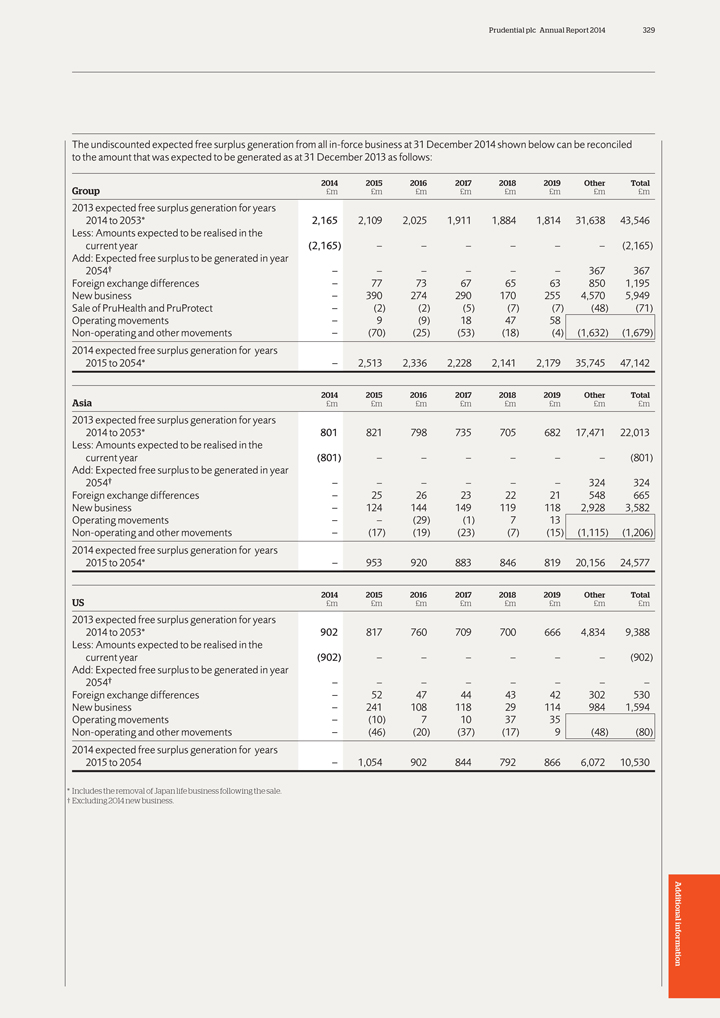
Prudential plc Annual Report 2014 329
The
undiscounted expected free surplus generation from all in-force business at 31 December 2014 shown below can be reconciled to the amount that was expected to be generated as at 31 December 2013 as follows:
2014 2015 2016 2017 2018 2019 Other Total
Group £m £m £m £m £m
£m £m £m
2013 expected free surplus generation for years
2014 to 2053* 2,165 2,109 2,025 1,911 1,884 1,814 31,638 43,546 Less: Amounts expected to be realised in the current year (2,165) – – – –
– – (2,165) Add: Expected free surplus to be generated in year 2054† – – – – – – 367 367 Foreign exchange differences – 77 73 67 65 63 850 1,195 New business – 390 274 290 170 255 4,570
5,949 Sale of PruHealth and PruProtect – (2) (2) (5) (7) (7) (48) (71) Operating movements – 9 (9) 18 47 58 Non-operating and other movements –
(70) (25) (53) (18) (4) (1,632) (1,679) 2014 expected free surplus generation for years 2015 to 2054* – 2,513 2,336 2,228 2,141 2,179 35,745 47,142
2014 2015 2016 2017 2018 2019 Other Total
Asia £m £m £m £m £m
£m £m £m
2013 expected free surplus generation for years
2014 to 2053* 801 821 798 735 705 682 17,471 22,013 Less: Amounts expected to be realised in the current year (801) – – – – – –
(801) Add: Expected free surplus to be generated in year 2054† – – – – – – 324 324 Foreign exchange differences – 25 26 23 22 21 548 665 New business – 124 144 149 119 118 2,928 3,582 Operating
movements – – (29) (1) 7 13 Non-operating and other movements – (17) (19) (23) (7) (15) (1,115) (1,206) 2014 expected free surplus generation for years 2015 to 2054* – 953 920 883 846
819 20,156 24,577
2014 2015 2016 2017 2018 2019 Other Total
US £m
£m £m £m £m £m £m £m
2013 expected free surplus generation for years
2014 to 2053* 902 817 760 709 700 666 4,834 9,388 Less: Amounts expected to be realised in the current year (902) – – – – – – (902) Add:
Expected free surplus to be generated in year
2054† – – – – – – – –
Foreign exchange differences – 52 47 44 43 42 302 530 New business – 241 108 118 29 114 984 1,594 Operating movements – (10) 7 10 37 35 Non-operating and other
movements – (46) (20) (37) (17) 9 (48) (80) 2014 expected free surplus generation for years 2015 to 2054 – 1,054 902 844 792 866 6,072 10,530
* Includes the removal of Japan life business following the sale.
† Excluding 2014 new
business.
Additional information
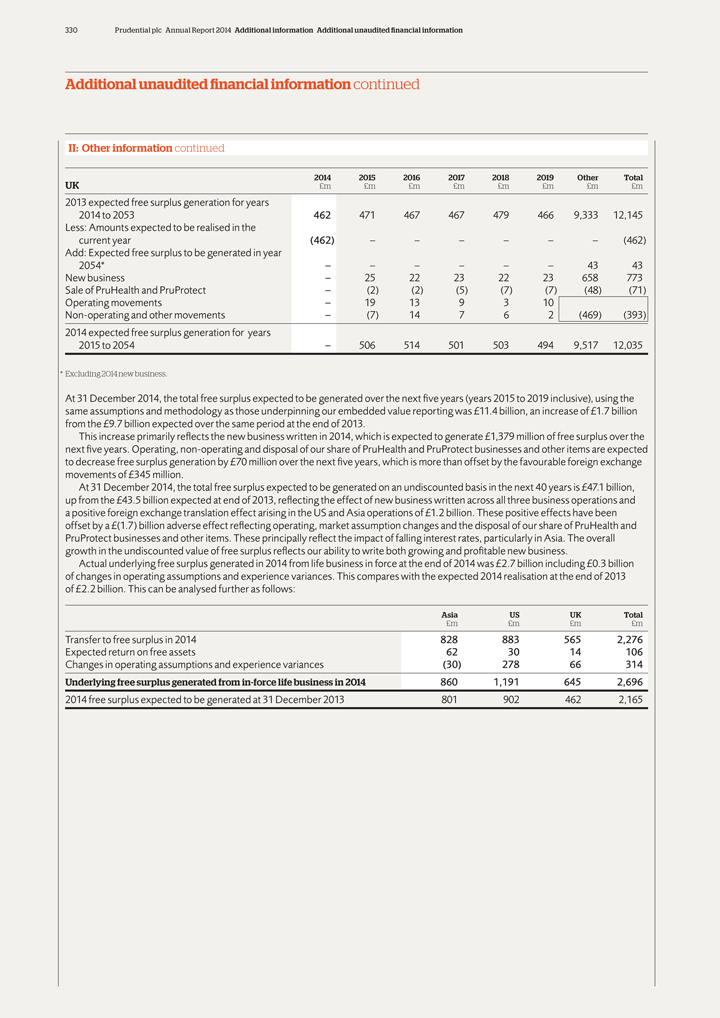
330 Prudential plc Annual Report 2014 Additional information Additional unaudited financial information
Additional unaudited financial information continued
II: Other information continued
2014 2015 2016 2017 2018 2019 Other Total
UK £m £m £m
£m £m £m £m £m
2013 expected free surplus generation for years
2014 to 2053 462 471 467 467 479 466 9,333 12,145 Less: Amounts expected to be realised in the current year (462) – – – – – – (462) Add:
Expected free surplus to be generated in year
2054* – – – – – – 43 43
New business – 25 22 23 22 23 658 773 Sale of PruHealth and PruProtect – (2) (2) (5) (7) (7) (48) (71) Operating movements – 19 13
9 3 10 Non-operating and other movements – (7) 14 7 6 2 (469) (393) 2014 expected free surplus generation for years 2015 to 2054 – 506 514 501 503 494 9,517 12,035
* Excluding 2014 new business.
At 31 December 2014, the total free surplus expected to be
generated over the next five years (years 2015 to 2019 inclusive), using the same assumptions and methodology as those underpinning our embedded value reporting was £11.4 billion, an increase of £1.7 billion from the £9.7 billion
expected over the same period at the end of 2013.
This increase primarily refiects the new business written in 2014, which is expected to generate
£1,379 million of free surplus over the next five years. Operating, non-operating and disposal of our share of PruHealth and PruProtect businesses and other items are expected to decrease free surplus generation by £70 million
over the next five years, which is more than offset by the favourable foreign exchange movements of £345 million.
At 31 December 2014, the total free
surplus expected to be generated on an undiscounted basis in the next 40 years is £47.1 billion, up from the £43.5 billion expected at end of 2013, refiecting the effect of new business written across all three business operations and a
positive foreign exchange translation effect arising in the US and Asia operations of £1.2 billion. These positive effects have been offset by a £(1.7) billion adverse effect refiecting operating, market assumption changes and the
disposal of our share of PruHealth and PruProtect businesses and other items. These principally refiect the impact of falling interest rates, particularly in Asia. The overall growth in the undiscounted value of free surplus refiects our ability to
write both growing and profitable new business.
Actual underlying free surplus generated in 2014 from life business in force at the end of 2014 was £2.7
billion including £0.3 billion of changes in operating assumptions and experience variances. This compares with the expected 2014 realisation at the end of 2013 of £2.2 billion. This can be analysed further as follows:
Asia US UK Total
£m £m £m £m
Transfer to free surplus in 2014 828 883 565 2,276 Expected return on free assets 62 30 14 106 Changes in operating assumptions and experience variances (30) 278 66 314
Underlying free surplus generated from in-force life business in 2014 860 1,191 645 2,696
2014 free surplus expected to be generated at 31 December 2013 801 902 462 2,165
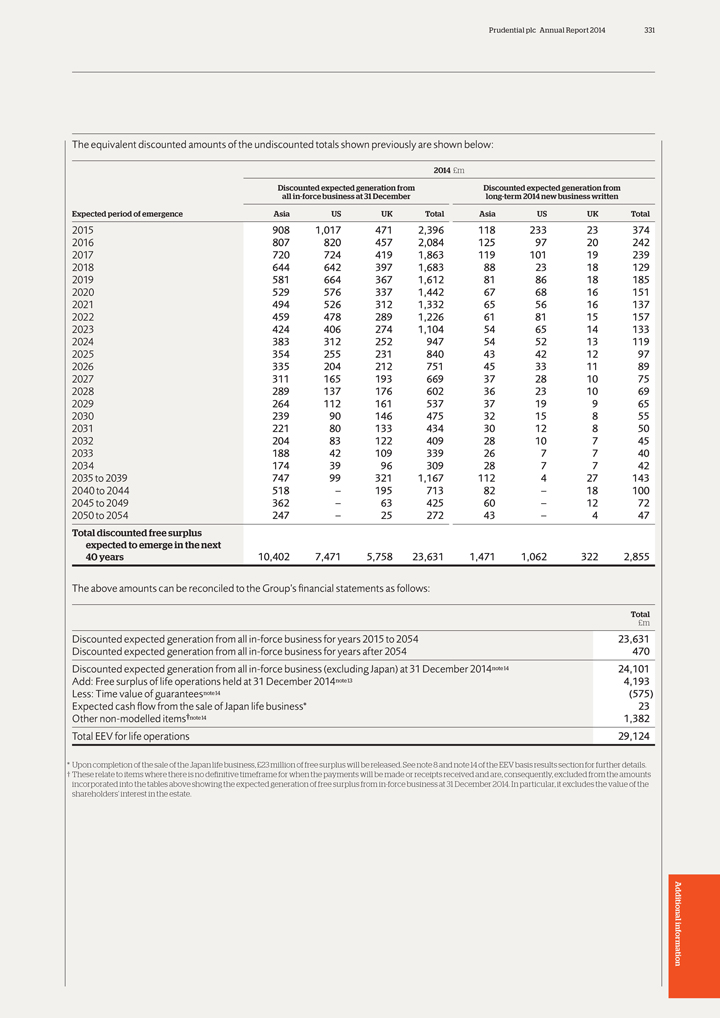
Prudential plc Annual Report 2014 331
The
equivalent discounted amounts of the undiscounted totals shown previously are shown below:
2014 £m
Discounted expected generation from Discounted expected generation from all in-force business at 31 December long-term 2014 new business written
Expected period of emergence Asia US UK Total Asia US UK Total
2015 908 1,017 471 2,396 118
233 23 374 2016 807 820 457 2,084 125 97 20 242 2017 720 724 419 1,863 119 101 19 239 2018 644 642 397 1,683 88 23 18 129 2019 581 664 367 1,612 81 86 18 185 2020 529 576 337 1,442 67 68 16 151 2021 494 526 312 1,332 65 56 16 137 2022 459 478 289
1,226 61 81 15 157 2023 424 406 274 1,104 54 65 14 133 2024 383 312 252 947 54 52 13 119 2025 354 255 231 840 43 42 12 97 2026 335 204 212 751 45 33 11 89 2027 311 165 193 669 37 28 10 75 2028 289 137 176 602 36 23 10 69 2029 264 112 161 537 37 19 9
65 2030 239 90 146 475 32 15 8 55 2031 221 80 133 434 30 12 8 50 2032 204 83 122 409 28 10 7 45 2033 188 42 109 339 26 7 7 40 2034 174 39 96 309 28 7 7 42 2035 to 2039 747 99 321 1,167 112 4 27 143 2040 to 2044 518 – 195 713 82 – 18 100
2045 to 2049 362 – 63 425 60 – 12 72 2050 to 2054 247 – 25 272 43 – 4 47
Total discounted free surplus expected to emerge in the next
40 years 10,402 7,471 5,758 23,631 1,471 1,062 322 2,855
The above amounts
can be reconciled to the Group’s financial statements as follows:
Total
£m
Discounted expected generation from all in-force business for years
2015 to 2054 23,631 Discounted expected generation from all in-force business for years after 2054 470 Discounted expected generation from all in-force business (excluding Japan) at 31 December 2014note 14 24,101 Add: Free surplus of life
operations held at 31 December 2014note 13 4,193 Less: Time value of guaranteesnote 14 (575) Expected cash fiow from the sale of Japan life business* 23 Other non-modelled items†note 14 1,382 Total EEV for life operations 29,124
* Upon completion of the sale of the Japan life business, £23 million of free surplus will be released. See note 8 and note 14 of the EEV basis results
section for further details.
† These relate to items where there is no de finitive timeframe for when the payments will be made or receipts received and are,
consequently, excluded from the amounts incorporated into the tables above showing the expected generation of free surplus from in-force business at 31 December 2014. In particular, it excludes the value of the shareholders’ interest in
the estate.
Additional information
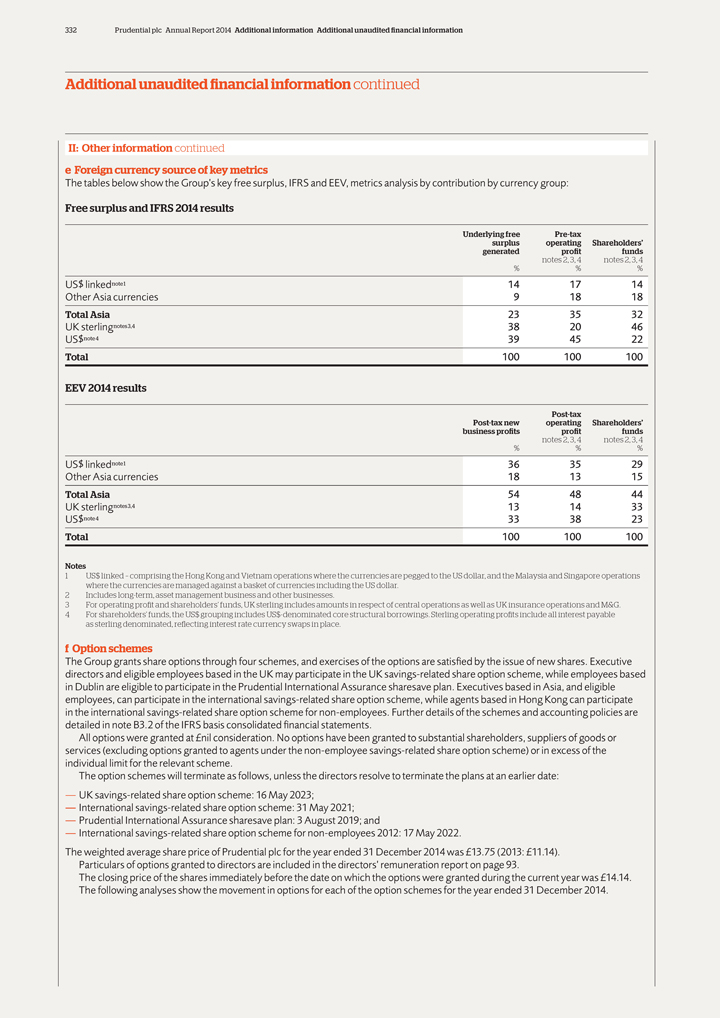
332 Prudential plc Annual Report 2014 Additional information Additional unaudited financial information
Additional unaudited financial information continued
II: Other information continued e Foreign
currency source of key metrics
The tables below show the Group’s key free surplus, IFRS and EEV, metrics analysis by contribution by currency group:
Free surplus and IFRS 2014 results
Underlying free Pre-tax surplus operating
Shareholders’ generated pro fit funds notes 2, 3, 4 notes 2, 3, 4
% % %
US$ linkednote 1 14 17 14 Other Asia currencies 9 18 18
Total Asia 23 35 32
UK sterlingnotes 3,4 38 20 46
US$note 4 39 45 22 Total 100 100 100
EEV 2014 results
Post-tax
Post-tax new operating Shareholders’ business pro fits pro fit funds notes 2, 3, 4 notes 2, 3, 4
% % %
US$ linkednote 1 36 35 29 Other Asia currencies 18 13 15
Total Asia 54 48 44
UK sterlingnotes 3,4 13 14 33
US$note 4 33 38 23 Total 100 100 100
Notes
1 US$ linked – comprising the Hong Kong and Vietnam operations where the currencies are pegged to the US dollar, and the Malaysia and Singapore operations where the currencies
are managed against a basket of currencies including the US dollar.
| 2 | Includes long-term, asset management business and other businesses. |
3 For operating pro fit and shareholders’ funds, UK sterling includes amounts in respect of central operations as well as UK insurance
operations and M&G.
4 For shareholders’ funds, the US$ grouping includes US$-denominated core structural borrowings. Sterling operating pro fits include
all interest payable as sterling denominated, reflecting interest rate currency swaps in place.
f Option schemes
The Group grants share options through four schemes, and exercises of the options are satisfied by the issue of new shares. Executive directors and eligible employees based in the
UK may participate in the UK savings-related share option scheme, while employees based in Dublin are eligible to participate in the Prudential International Assurance sharesave plan. Executives based in Asia, and eligible employees, can participate
in the international savings-related share option scheme, while agents based in Hong Kong can participate in the international savings-related share option scheme for non-employees. Further details of the schemes and accounting policies are detailed
in note B3.2 of the IFRS basis consolidated financial statements.
All options were granted at £nil consideration. No options have been granted to substantial
shareholders, suppliers of goods or services (excluding options granted to agents under the non-employee savings-related share option scheme) or in excess of the individual limit for the relevant scheme.
The option schemes will terminate as follows, unless the directors resolve to terminate the plans at an earlier date:
— UK savings-related share option scheme: 16 May 2023;
— International
savings-related share option scheme: 31 May 2021;
— Prudential International Assurance sharesave plan: 3 August 2019; and
— International savings-related share option scheme for non-employees 2012: 17 May 2022.
The weighted average share price of Prudential plc for the year ended 31 December 2014 was £13.75 (2013: £11.14). Particulars of options granted to directors are
included in the directors’ remuneration report on page 93.
The closing price of the shares immediately before the date on which the options were granted
during the current year was £14.14. The following analyses show the movement in options for each of the option schemes for the year ended 31 December 2014.
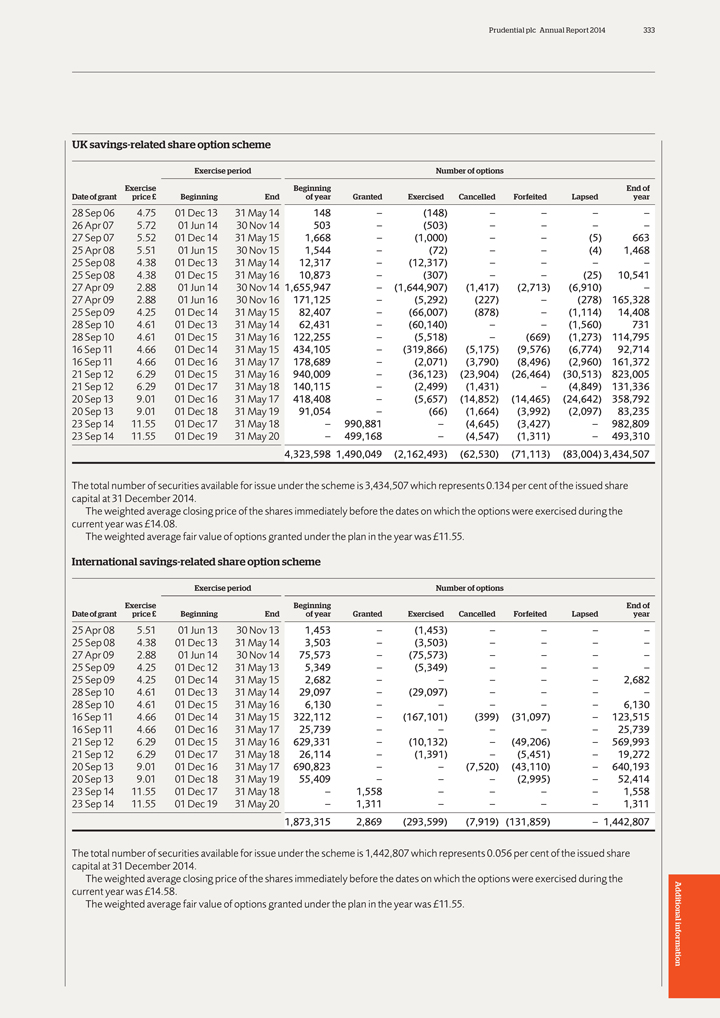
Prudential plc Annual Report 2014 333
UK
savings-related share option scheme
Exercise period Number of options
Exercise Beginning End of Date of grant price £ Beginning End of year Granted Exercised Cancelled Forfeited Lapsed year
28 Sep 06 4.75 01 Dec 13 31 May 14 148 – (148) – – – –
26 Apr 07 5.72 01 Jun 14 30 Nov 14 503 – (503) – – – –
27 Sep 07 5.52 01 Dec 14 31 May 15 1,668 – (1,000) – – (5) 663
25 Apr 08 5.51 01 Jun 15 30 Nov 15 1,544 – (72) – – (4) 1,468
25 Sep
08 4.38 01 Dec 13 31 May 14 12,317 – (12,317) – – – –
25 Sep 08 4.38 01 Dec 15 31 May 16 10,873 –
(307) – – (25) 10,541
27 Apr 09 2.88 01 Jun 14 30 Nov 14 1,655,947 – (1,644,907) (1,417) (2,713) (6,910) –
27 Apr 09 2.88 01 Jun 16 30 Nov 16 171,125 – (5,292) (227) – (278) 165,328
25 Sep 09 4.25 01 Dec 14 31 May 15 82,407 – (66,007) (878) – (1,114) 14,408
28 Sep 10 4.61 01 Dec 13 31 May 14 62,431 – (60,140) – – (1,560) 731
28 Sep 10 4.61 01 Dec 15 31 May 16 122,255 – (5,518) – (669) (1,273) 114,795
16 Sep 11 4.66 01 Dec 14 31 May 15 434,105 – (319,866) (5,175) (9,576) (6,774) 92,714
16 Sep 11 4.66 01 Dec 16 31 May 17 178,689 – (2,071) (3,790) (8,496) (2,960) 161,372
21 Sep 12 6.29 01 Dec 15 31 May 16 940,009 – (36,123) (23,904) (26,464) (30,513) 823,005
21 Sep 12 6.29 01 Dec 17 31 May 18 140,115 – (2,499) (1,431) – (4,849) 131,336
20 Sep 13 9.01 01 Dec 16 31 May 17 418,408 – (5,657) (14,852) (14,465) (24,642) 358,792
20 Sep 13 9.01 01 Dec 18 31 May 19 91,054 – (66) (1,664) (3,992) (2,097) 83,235
23 Sep 14 11.55 01 Dec 17 31 May 18 – 990,881 – (4,645) (3,427) – 982,809
23 Sep 14 11.55 01 Dec 19 31 May 20 – 499,168 – (4,547) (1,311) – 493,310 4,323,598 1,490,049
(2,162,493) (62,530) (71,113) (83,004) 3,434,507
The total number of securities available for issue under the scheme is 3,434,507 which
represents 0.134 per cent of the issued share capital at 31 December 2014.
The weighted average closing price of the shares immediately before the dates
on which the options were exercised during the current year was £14.08.
The weighted average fair value of options granted under the plan in the year was
£11.55.
International savings-related share option scheme
Exercise
period Number of options
Exercise Beginning End of Date of grant price £ Beginning End of year Granted Exercised Cancelled Forfeited Lapsed year
25 Apr 08 5.51 01 Jun 13 30 Nov 13 1,453 – (1,453) – – – –
25
Sep 08 4.38 01 Dec 13 31 May 14 3,503 – (3,503) – – – –
27 Apr 09 2.88 01 Jun 14 30 Nov 14 75,573 –
(75,573) – – – –
25 Sep 09 4.25 01 Dec 12 31 May 13 5,349 – (5,349) – – – –
25 Sep 09 4.25 01 Dec 14 31 May 15 2,682 – – – – – 2,682
28
Sep 10 4.61 01 Dec 13 31 May 14 29,097 – (29,097) – – – –
28 Sep 10 4.61 01 Dec 15 31 May 16 6,130 – –
– – – 6,130
16 Sep 11 4.66 01 Dec 14 31 May 15 322,112 – (167,101) (399) (31,097) – 123,515
16 Sep 11 4.66 01 Dec 16 31 May 17 25,739 – – – – – 25,739
21 Sep 12 6.29 01 Dec 15 31 May 16 629,331 – (10,132) – (49,206) – 569,993
21 Sep 12 6.29 01 Dec 17 31 May 18 26,114 – (1,391) – (5,451) – 19,272
20 Sep 13 9.01 01 Dec 16 31 May 17 690,823 – – (7,520) (43,110) – 640,193
20 Sep 13 9.01 01 Dec 18 31 May 19 55,409 – – – (2,995) – 52,414
23 Sep 14 11.55 01 Dec 17 31 May 18 – 1,558 – – – – 1,558
23 Sep 14 11.55 01 Dec 19 31 May 20 – 1,311 – – – – 1,311 1,873,315 2,869 (293,599) (7,919) (131,859) –
1,442,807
The total number of securities available for issue under the scheme is 1,442,807 which represents 0.056 per cent of the issued share capital at
31 December 2014.
The weighted average closing price of the shares immediately before the dates on which the options were exercised during the current year
was £14.58.
The weighted average fair value of options granted under the plan in the year was £11.55. Additional
information
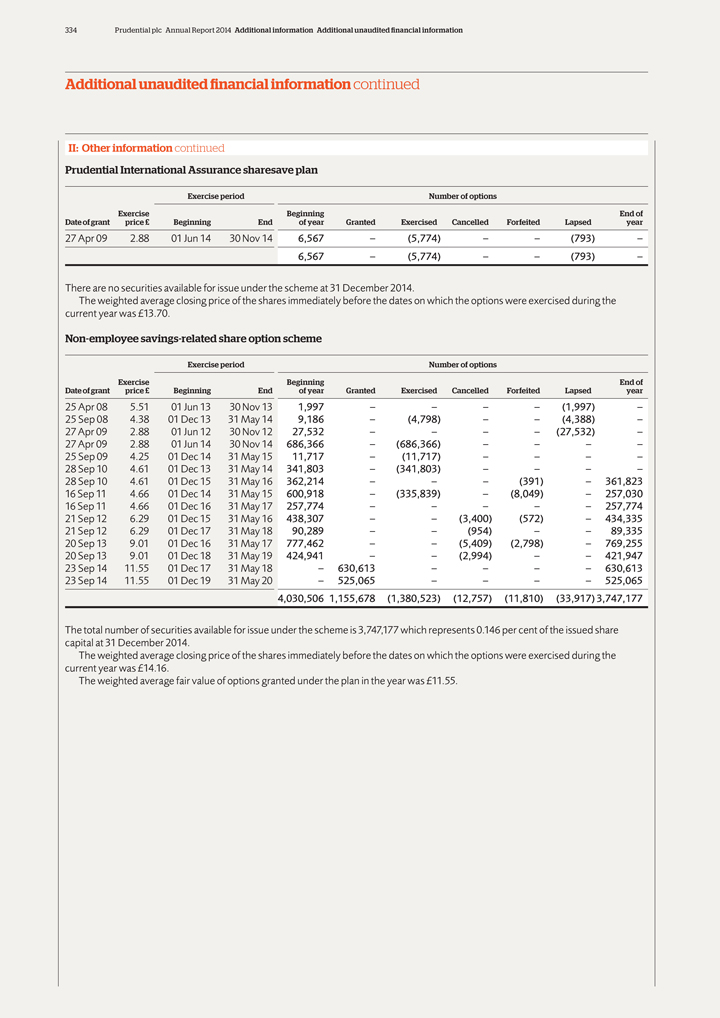
334 Prudential plc Annual Report 2014 Additional information Additional unaudited financial information
Additional unaudited financial information continued
II: Other information continued
Prudential International Assurance sharesave plan
Exercise period Number of
options
Exercise Beginning End of Date of grant price £ Beginning End of year Granted Exercised Cancelled Forfeited Lapsed year
27 Apr 09 2.88 01 Jun 14 30 Nov 14 6,567 – (5,774) – – (793) –6,567 – (5,774) – – (793) –
There are no securities available for issue under the scheme at 31 December 2014.
The
weighted average closing price of the shares immediately before the dates on which the options were exercised during the current year was £13.70.
Non-employee savings-related share option scheme
Exercise period Number of
options
Exercise Beginning End of Date of grant price £ Beginning End of year Granted Exercised Cancelled Forfeited Lapsed year
25 Apr 08 5.51 01 Jun 13 30 Nov 13 1,997 – – – – (1,997) –
25
Sep 08 4.38 01 Dec 13 31 May 14 9,186 – (4,798) – – (4,388) –
27 Apr 09 2.88 01 Jun 12 30 Nov 12 27,532 – –
– – (27,532) –
27 Apr 09 2.88 01 Jun 14 30 Nov 14 686,366 – (686,366) – – – –
25 Sep 09 4.25 01 Dec 14 31 May 15 11,717 – (11,717) – – – –
28 Sep 10 4.61 01 Dec 13 31 May 14 341,803 – (341,803) – – – –
28 Sep 10 4.61 01 Dec 15 31 May 16 362,214 – – – (391) – 361,823
16 Sep 11 4.66 01 Dec 14 31 May 15 600,918 – (335,839) – (8,049) – 257,030
16 Sep 11 4.66 01 Dec 16 31 May 17 257,774 – – – – – 257,774
21 Sep 12 6.29 01 Dec 15 31 May 16 438,307 – – (3,400) (572) – 434,335
21 Sep 12 6.29 01 Dec 17 31 May 18 90,289 – – (954) – – 89,335
20 Sep 13 9.01 01 Dec 16 31 May 17 777,462 – – (5,409) (2,798) – 769,255
20 Sep 13 9.01 01 Dec 18 31 May 19 424,941 – – (2,994) – – 421,947
23 Sep 14 11.55 01 Dec 17 31 May 18 – 630,613 – – – – 630,613
23 Sep 14 11.55 01 Dec 19 31 May 20 – 525,065 – – – – 525,065 4,030,506 1,155,678
(1,380,523) (12,757) (11,810) (33,917) 3,747,177
The total number of securities available for issue under the scheme is 3,747,177 which
represents 0.146 per cent of the issued share capital at 31 December 2014.
The weighted average closing price of the shares immediately before the dates
on which the options were exercised during the current year was £14.16.
The weighted average fair value of options granted under the plan in the year was
£11.55.
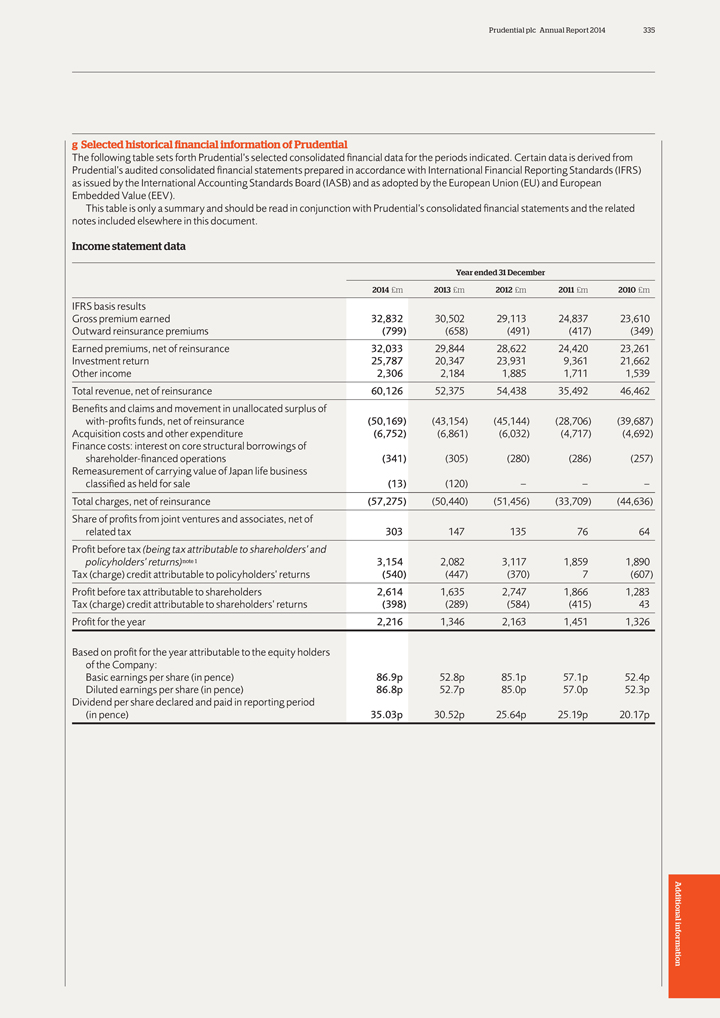
Prudential plc Annual Report 2014 335
g Selected
historical financial information of Prudential
The following table sets forth Prudential’s selected consolidated financial data for the periods indicated.
Certain data is derived from Prudential’s audited consolidated financial statements prepared in accordance with International financial Reporting Standards (IFRS) as issued by the International Accounting Standards Board (IASB) and as adopted
by the European Union (EU) and European Embedded Value (EEV).
This table is only a summary and should be read in conjunction with Prudential’s consolidated
financial statements and the related notes included elsewhere in this document.
Income statement data
Year ended 31 December
2014 £m 2013 £m 2012 £m 2011 £m 2010
£m
IFRS basis results
Gross premium earned 32,832 30,502 29,113 24,837
23,610 Outward reinsurance premiums (799) (658) (491) (417) (349) Earned premiums, net of reinsurance 32,033 29,844 28,622 24,420 23,261 Investment return 25,787 20,347 23,931 9,361 21,662 Other income 2,306 2,184 1,885
1,711 1,539 Total revenue, net of reinsurance 60,126 52,375 54,438 35,492 46,462 Benefits and claims and movement in unallocated surplus of with-profits funds, net of reinsurance
(50,169) (43,154) (45,144) (28,706) (39,687) Acquisition costs and other expenditure (6,752) (6,861) (6,032) (4,717) (4,692) finance costs: interest on core structural borrowings of
shareholder-financed operations (341) (305) (280) (286) (257) Remeasurement of carrying value of Japan life business classified as held for sale (13) (120) – – – Total charges, net of reinsurance
(57,275) (50,440) (51,456) (33,709) (44,636) Share of profits from joint ventures and associates, net of related tax 303 147 135 76 64 Profit before tax (being tax attributable to shareholders’ and policyholders’
returns)note 1 3,154 2,082 3,117 1,859 1,890 Tax (charge) credit attributable to policyholders’ returns (540) (447) (370) 7 (607) Profit before tax attributable to shareholders 2,614 1,635 2,747 1,866 1,283 Tax (charge)
credit attributable to shareholders’ returns (398) (289) (584) (415) 43 Profit for the year 2,216 1,346 2,163 1,451 1,326
Based on profit
for the year attributable to the equity holders of the Company:
Basic earnings per share (in pence) 86.9p 52.8p 85.1p 57.1p 52.4p Diluted earnings per share (in
pence) 86.8p 52.7p 85.0p 57.0p 52.3p Dividend per share declared and paid in reporting period (in pence) 35.03p 30.52p 25.64p 25.19p 20.17p
Additional information

336 Prudential plc Annual Report 2014 Additional information Additional unaudited financial information
Additional unaudited financial information continued
II: Other information continued
Supplementary IFRS income statement data
Year ended 31 December
2014 £m 2013 £m 2012 £m 2011 £m 2010 £m
Operating profit based on longer-term investment returnsnote 2 3,186 2,954 2,520 2,017 1,823 Non-operating items (572) (1,319) 227
(151) (540) Profit before tax attributable to shareholdersnote 2 2,614 1,635 2,747 1,866 1,283 Operating earnings per share (excluding 2010 exceptional tax credit) (in pence) 96.6p 90.9p 76.9p 62.7p 58.8p Operating earnings per share
(including 2010 exceptional tax credit) (in pence) 96.6p 90.9p 76.9p 62.7p 65.1p
Supplementary EEV income statement data
Year ended 31 December
2014 £m 2013* £m 2012* £m 2011* £m 2010*
£m
Operating profit based on longer-term investment returnsnote 2 4,096 4,204 3,174 2,942 2,697 Non-operating items 247 154 595 (751) (111) Profit
before tax attributable to shareholders 4,343 4,358 3,769 2,191 2,586 Operating earnings per share (excluding 2010 exceptional tax credit) (in pence) 160.7p 165.0p 124.9p 116.0p 107.4p Operating earnings per share (including 2010 exceptional tax
credit) (in pence) 160.7p 165.0p 124.9p 116.0p 113.7p
* The 2014 EEV results of the Group are presented on a post-tax basis and, accordingly, the 2010 to 2013
results are shown on a comparable basis.
New business datanote 3
New business
excluding Japan
Year ended 31 December
2014 £m 2013 £m 2012
£m 2011 £m 2010 £m
Annual premium equivalent (APE) sales 4,650 4,423 4,195 3,681 3,485 EEV new business profit (NBP) (post-tax)* 2,126 2,082
1,791 1,536 1,433 NBP margin (% APE) 46% 47% 43% 42% 41%
* The 2014 EEV results of the Group are presented on a post-tax basis and, accordingly, the 2010 to 2013
results are shown on a comparable basis.
Statement of financial position data
As of and for the year ended 31 December 2014 £m 2013 £m 2012 £m 2011 £m 2010 £m
Total assets 369,204 325,932 307,644 270,018 256,330 Total policyholder liabilities and unallocated surplus of with-profits funds 321,989 286,014 268,263 233,538 221,895 Core
structural borrowings of shareholder-financed operations 4,304 4,636 3,554 3,611 3,676 Total liabilities 357,392 316,281 297,280 261,411 248,765 Total equity 11,812 9,651 10,364 8,607 7,565
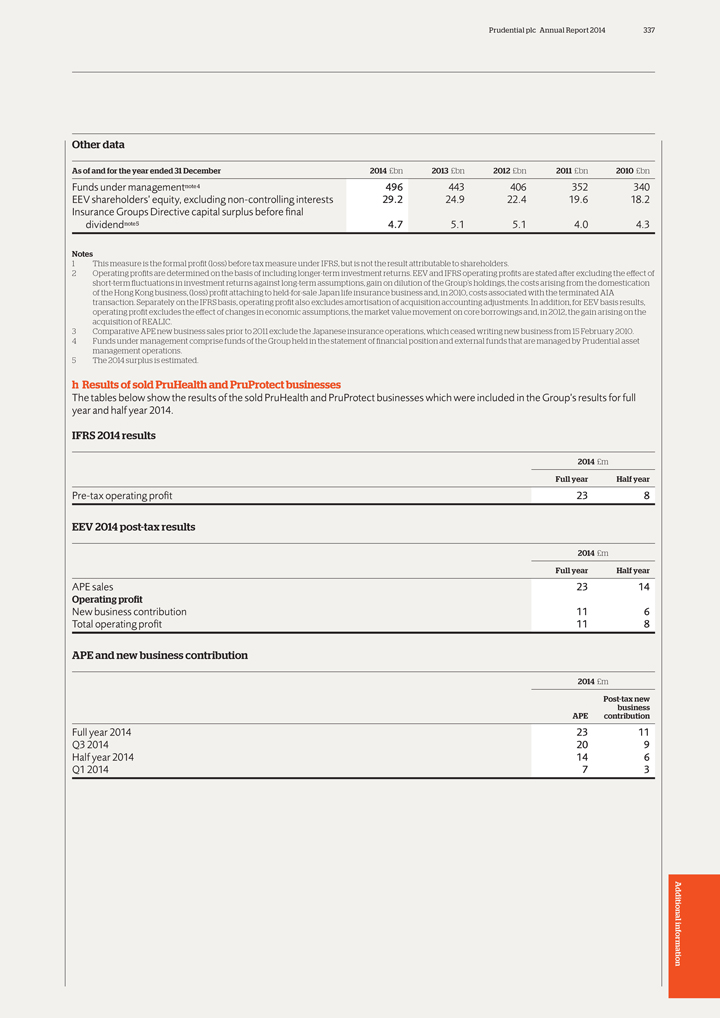
Prudential plc Annual Report 2014 337
Other data
As of and for the year ended 31 December 2014 £bn 2013 £bn 2012 £bn 2011 £bn 2010 £bn
Funds under managementnote 4 496 443 406 352 340 EEV shareholders’ equity, excluding non-controlling interests 29.2 24.9 22.4 19.6 18.2 Insurance Groups Directive capital
surplus before final dividendnote 5 4.7 5.1 5.1 4.0 4.3
Notes
1 This measure
is the formal pro fit (loss) before tax measure under IFRS, but is not the result attributable to shareholders.
2 Operating pro fits are determined on the basis of
including longer-term investment returns. EEV and IFRS operating pro fits are stated after excluding the effect of short-term fluctuations in investment returns against long-term assumptions, gain on dilution of the Group’s holdings, the costs
arising from the domestication of the Hong Kong business, (loss) pro fit attaching to held-for-sale Japan life insurance business and, in 2010, costs associated with the terminated AIA transaction. Separately on the IFRS basis, operating pro fit
also excludes amortisation of acquisition accounting adjustments. In addition, for EEV basis results, operating pro fit excludes the effect of changes in economic assumptions, the market value movement on core borrowings and, in 2012, the gain
arising on the acquisition of REALIC.
3 Comparative APE new business sales prior to 2011 exclude the Japanese insurance operations, which ceased writing new
business from 15 February 2010.
4 Funds under management comprise funds of the Group held in the statement of financial position and external funds that are
managed by Prudential asset management operations.
5 The 2014 surplus is estimated.
h Results of sold PruHealth and PruProtect businesses
The tables below show the results of the
sold PruHealth and PruProtect businesses which were included in the Group’s results for full year and half year 2014.
IFRS 2014 results
2014 £m
Full year Half year
Pre-tax operating profit 23 8
EEV 2014 post-tax results
2014 £m
Full year Half year
APE sales 23 14
Operating pro fit
New business contribution 11 6 Total operating profit 11 8
APE and new business contribution
2014 £m
Post-tax new business APE contribution
Full year 2014 23 11 Q3 2014 20 9 Half year 2014 14 6 Q1 2014 7 3
Additional information
338 Prudential plc Annual Report 2014 Additional information Risk factors
Risk factors
A number of risk factors affect Prudential’s instruments can be realised is
highly In particular, fixed annuities and stable operating results and financial condition subjective. Processes to ascertain such value products written by Jackson expose and, accordingly, the trading price of its values require substantial
elements of Prudential to the risk that changes in shares. The risk factors mentioned below judgement, assumptions and estimates interest rates, which are not fully refiected should not be regarded as a complete and (which may change over time); and
in the interest rates credited to customers, comprehensive statement of all potential will reduce spread. The spread is the
— Increased illiquidity also adds
to risks and uncertainties. The information difference between the rate of return uncertainty over the accessibility of given is as of the date of this document, Jackson is able to earn on the assets financial resources and may reduce and any
forward-looking statements are backing the policyholders’ liabilities, capital resources as valuations decline. made subject to the reservations specified and the amounts that are credited to below under ‘Forward-looking statements’.
Global financial markets are subject to policyholders in the form of benefit Prudential’s approaches to managing uncertainty and volatility created by a increases, subject to minimum crediting risks are explained in the ‘Group Chief Risk
variety of factors, including concerns over rates. Declines in spread from these Of ficer’s report on the risks facing our sovereign debt, general slowing in world products or other spread businesses that business and our capital strength’
section growth, the timing and scale of quantitative Jackson conducts, and increases in of this document. easing programmes of central banks and surrenders arising from interest rate rises, socio-political events. Upheavals in the could have a
material impact on its Risks relating to Prudential’s business financial markets may affect general levels businesses or results of operations. Prudential’s businesses are inherently of economic activity, employment and Jackson also writes
a significant amount subject to market fluctuations and customer behaviour. For example, insurers of variable annuities that offer capital or general economic conditions may experience an elevated incidence of income protection guarantees. The value
Prudential’s businesses are inherently claims, lapses, or surrenders of policies, of these guarantees is affected by market subject to market fiuctuations and general and some policyholders may choose to factors (such as interest rates, equity
economic conditions. Uncertainty or defer or stop paying insurance premiums. values, bond spreads and realised volatility) negative trends in international economic The demand for insurance products may and policyholder behaviour. There could and
investment climates could adversely also be adversely affected. In addition, be market circumstances where the affect Prudential’s business and profitability. there may be a higher incidence of derivatives that Jackson enters into to hedge
Since 2008, Prudential has operated against counterparty failures. If sustained, this its market risks may not fully cover its a challenging background of periods of environment is likely to have a negative exposures under the guarantees. The cost
significant volatility in global capital and impact on the insurance sector over time, of the guarantees that remain unhedged will equity markets, interest rates (which in and may consequently have a negative also affect Prudential’s results.
some jurisdictions have become negative) impact on Prudential’s business and Jackson hedges the guarantees on its and liquidity, and widespread economic its balance sheet and profitability. variable annuity book on an economic basis
uncertainty. For example, government For example, this could occur if the and, thus, accepts variability in its interest rates remain at or near historic lows recoverable value of intangible assets for accounting results in the short term in in the
US, the UK and some Asian countries bancassurance agreements and deferred order to achieve the appropriate economic in which Prudential operates. These factors acquisition costs are reduced. New result. In particular, for Prudential’s Group
have, at times during this period, had a challenges related to market fiuctuations IFRS reporting, the measurement of the material adverse effect on Prudential’s and general economic conditions may Jackson variable annuity guarantees is
business and profitability. continue to emerge. typically less sensitive to market In the future, the adverse effects of such For some non-unit-linked investment movements than for the corresponding factors would be felt principally through
products, in particular those written in hedging derivatives, which are held at the following items: some of the Group’s Asia operations, it market value. However, depending on the may not be possible to hold assets which level of hedging
conducted regarding
— Investment impairments or reduced will provide cash fiows to match those a particular risk type, certain market investment returns,
which could reduce relating to policyholder liabilities. This is movements can drive volatility in the Prudential’s capital and impair its ability particularly true in those countries where economic results which may be less to write
significant volumes of new bond markets are not developed and in significant under IFRS reporting. business, increase the potential adverse certain markets where regulated surrender A significant part of the profit from impact of product guarantees,
or have a values are set with reference to the interest Prudential’s UK insurance operations is negative impact on its assets under rate environment prevailing at the time of related to bonuses for policyholders management and profit; policy
issue. This results in a mismatch due declared on with-profits products, which
— Higher credit defaults and wider credit to the duration and uncertainty of
the are broadly based on historical and current and liquidity spreads resulting in liability cash fiows and the lack of sufficient rates of return on equity, real estate and realised and unrealised credit losses; assets of a suitable duration. While
this fixed income securities, as well as residual asset/liability mismatch risk can be Prudential’s expectations of future
— Failure of counterparties to
transactions managed, it cannot be eliminated. Where investment returns. This profit could with Prudential that could give rise to a interest rates in these markets remain lower be lower in a sustained low interest negative impact on
Prudential’s financial than those used to calculate surrender rate environment. position and on the accessibility or values over a sustained period, this could recoverability of amounts due or, for have a material adverse effect on Prudential
is subject to the risk of derivative transactions, adequate
Prudential’s reported profit. potential sovereign debt credit collateral not being in place; In
the US, fiuctuations in prevailing deterioration owing to the amounts
— Estimates of the value of financial interest rates can affect results from of
sovereign debt obligations held instruments being difficult because, Jackson which has a significant spread- in its investment portfolio in certain illiquid or closed markets, based business, with the majority of its Prudential is subject to the
risk of potential determining the value at which financial assets invested in fixed income securities. sovereign debt credit deterioration on the
Prudential plc Annual Report 2014 339
amounts of
sovereign debt obligations held or otherwise alter the currencies in which may change the level of capital required in its investment portfolio. In recent years, its obligations are denominated, this to be held by individual businesses, or rating
agencies have downgraded the could have a material adverse effect on could introduce possible changes in sovereign debt of some countries. There is Prudential’s financial condition and results the regulatory framework for pension a risk of
further downgrades. of operations. arrangements and policies, the regulation Investing in sovereign debt creates of selling practices and solvency exposure to the direct or indirect Prudential is subject to the risk of requirements. In addition,
there could be consequences of political, social or exchange rate fluctuations owing to changes to the maximum level of non-economic changes (including changes in the geographical diversity of its domestic ownership by foreign companies governments,
heads of states or monarchs) businesses in certain jurisdictions. Furthermore, as in the countries in which the issuers are Due to the geographical diversity of a result of interventions by governments located, and the creditworthiness of the
Prudential’s businesses, Prudential is in response to recent financial and global sovereign. Investment in sovereign debt subject to the risk of exchange rate economic conditions, it is widely expected obligations involves risks not present in
fiuctuations. Prudential’s operations in the that there will continue to be a substantial debt obligations of corporate issuers. In US and Asia, which represent a significant increase in government regulation and addition, the issuer of the
debt or the proportion of operating profit based on supervision of the financial services governmental authorities that control the longer-term investment returns and industry, including the possibility of higher repayment of the debt may be unable
or shareholders’ funds, generally write capital requirements, restrictions on unwilling to repay principal or pay interest policies and invest in assets denominated certain types of transactions and enhanced when due in accordance with the
terms of in local currencies. Although this practice supervisory powers. such debt, and Prudential may have limited limits the effect of exchange rate Current EU directives, including the recourse to compel payment in the event of fiuctuations on
local operating results, it EU Insurance Groups Directive (IGD) a default. A sovereign debtor’s willingness can lead to significant fiuctuations in require EU financial services groups to or ability to repay principal and to pay
Prudential’s consolidated financial demonstrate net aggregate surplus capital interest in a timely manner may be affected statements upon translation of results into in excess of solvency requirements at the by, among other factors, its cash
fiow pounds sterling. This exposure is not Group level in respect of shareholder-situation, its relations with its central bank, currently separately managed. The owned entities. The test is a continuous the extent of its foreign currency reserves,
currency exposure relating to the requirement, so that Prudential needs to the availability of sufficient foreign translation of reported earnings could maintain a higher amount of regulatory exchange on the date a payment is due, the impact on
financial reporting ratios such as capital at the Group level than otherwise relative size of the debt service burden to dividend cover, which is calculated as necessary in respect of some of its the economy as a whole, the sovereign operating
profit after tax on an IFRS basis, individual businesses to accommodate, for debtor’s policy toward local and divided by the current year interim example, short-term movements in global international lenders, and the political dividend plus the
proposed final dividend. foreign exchange rates, interest rates, constraints to which the sovereign debtor The impact of gains or losses on currency deterioration in credit quality and equity may be subject. translations is recorded as a component
of markets. The EU is also developing a new Moreover, governments may use a shareholders’ funds within other prudential regulatory framework for variety of techniques, such as intervention comprehensive income. Consequently, insurance
companies, referred to as by their central banks or imposition of this could impact on Prudential’s gearing ‘Solvency II’. regulatory controls or taxes, to devalue ratios (defined as debt over debt plus The Solvency II Directive
covers their currencies’ exchange rates, or may shareholders’ funds). The Group’s surplus valuation, the treatment of insurance adopt monetary and other policies capital position for regulatory reporting groups, the definition of
capital and the (including to manage their debt burdens) purposes may also be affected by overall level of capital requirements. A key that have a similar effect, all of which could fiuctuations in exchange rates with possible aspect of Solvency II
is that the assessment adversely impact the value of an consequences for the degree of fiexibility of risks and capital requirements are investment in sovereign debt even in the the Prudential has in managing its business. intended to be aligned
more closely with absence of a technical default. Periods of economic capital methodologies, and may economic uncertainty may affect the Prudential conducts its businesses allow Prudential to make use of its internal volatility of market prices of
sovereign debt subject to regulation and associated capital models, if approved by the to a greater extent than the volatility regulatory risks, including the effects Prudential Regulation Authority (PRA). inherent in debt obligations of other types
of changes in the laws, regulations, The Solvency II Directive was formally of issuers. policies and interpretations and any approved by the Economic and financial In addition, if a sovereign default or accounting standards in the markets Affairs
Council in November 2009, and other such events described above were to in which it operates the Omnibus II Directive, which amended occur, other financial institutions may also Changes in government policy, legislation certain aspects of the
Solvency II Directive, suffer losses or experience solvency or (including tax) or regulatory interpretation was adopted by the Council of the other concerns, and Prudential might face applying to companies in the financial European Union in April
2014. As such, additional risks relating to any debt of such services and insurance industries in any of Solvency II is expected to be implemented financial institutions held in its investment the markets in which Prudential operates, as of
1 January 2016, although the portfolio. There is also risk that public which in some circumstances may be European Commission and the European perceptions about the stability and applied retrospectively, may adversely Insurance and Occupational
Pensions Additional creditworthiness of financial institutions affect Prudential’s product range, Authority (EIOPA) are continuing to and the financial sector generally might be distribution channels, competitiveness, develop the detailed rules
and guidelines affected, as might counter party profitability, capital requirements and, that will supplement the high-level rules relationships between financial institutions. consequently, reported results and and principles of the Solvency II and
information If a sovereign were to default on its financing requirements. Also, regulators in Omnibus II Directives, including the obligations, or adopt policies that devalue jurisdictions in which Prudential operates Delegated Acts relating to
third-country
340 Prudential plc Annual Report 2014 Additional information Risk factors
Risk factors continued
equivalents. These detailed rules and also introduces two types of
capital The resolution of several issues guidelines are not currently expected to be requirements; the first, a Basic Capital affecting the financial services finalised until mid to late 2015. Further, the Requirement (BCR), designed to act as
industry could have a negative effective application of a number of key a minimum Group capital requirement; impact on Prudential’s reported measures incorporated in the Omnibus II and the second, a Higher Loss Absorption results or on its
relations with Directive, including the provisions for (HLA) requirement that should refiect the current and potential customers third-country equivalents, is subject to drivers of the assessment of G-SII Prudential is, and in the future may be,
supervisory judgement and approval. designation. G-SIIs will be required to subject to legal and regulatory actions in As a result, there is a risk that the effect report on their BCR to Group-wide the ordinary course of its business, both in of the
measures finally adopted could supervisors on a confidential basis from the UK and internationally. These actions be adverse for Prudential, including 2015. The HLA requirement will apply could involve a review of types of business potentially a
significant increase in the from January 2019 to the insurance groups sold in the past under acceptable market capital required to support its business, identified as G-SIIs in November 2017. practices at the time, such as the and that Prudential
may be placed at a ComFrame is also being developed requirement in the UK to provide redress competitive disadvantage to other by the IAIS to provide common global to certain past purchasers of pension and European and non-European financial
requirements for the supervision of mortgage endowment policies, changes services groups. insurance groups. The framework is to the tax regime affecting products, and Currently there are also a number of designed to outline a set of common global
regulatory reviews on products sold and other global regulatory developments principles and standards for Group industry practices, including, in the latter which could impact the way in which supervision, and may increase the focus case, lines of
business it has closed. Prudential is supervised in its many of regulators in some jurisdictions. One of Regulators’ interest may include the jurisdictions. These include the Dodd- the framework’s key components is an approach that product
providers use to Frank Wall Street Reform and Consumer Insurance Capital Standard (ICS) which select third-party distributors and to Protection Act (Dodd-Frank Act) in the US, would be expected to form the Group monitor the appropriateness of sales
made the work of the financial Stability Board solvency capital standard under by them. In some cases, product providers (FSB) on Global Systemically Important ComFrame. This new framework is can be held responsible for the deficiencies Insurers
(G-SIIs) and the Common expected to be implemented in 2019. of third-party distributors.
Framework for the Supervision of Various jurisdictions in which In the US,
there has been significant Internationally Active Insurance Groups Prudential operates have created investor attention on the different regulatory (ComFrame) being developed by the compensation schemes that require standards applied to investment
advice International Association of Insurance mandatory contributions from market delivered to retail customers by different Supervisors (IAIS). participants, in some instances, in the sectors of the industry. As a result of The Dodd-Frank Act
represents a event of a failure of a market participant. reports relating to perceptions of industry comprehensive overhaul of the financial As a major participant in the majority of abuses, there have been numerous services industry within the
United States its chosen markets, circumstances could regulatory inquiries and proposals for that, among other reforms to financial arise where Prudential, along with other legislative and regulatory reforms. This services entities, products and
markets, companies, may be required to make includes focus on the suitability of sales of may subject financial institutions designated such contributions. certain products, alternative investments as systemically important to heightened The
Group’s accounts are prepared in and the widening of the circumstances prudential and other requirements intended accordance with current International under which a person or entity providing to prevent or mitigate the impact of future
financial Reporting Standards (IFRS) investment advice, with respect to certain disruptions in the US financial system. applicable to the insurance industry. The employee benefit and pension plans, The full impact of the Dodd-Frank Act on
International Accounting Standards Board would be considered a fiduciary – and Prudential’s businesses is not currently clear, (IASB) introduced a framework that it would subject the person or entity to as many of its provisions have a
delayed described as Phase I, which permitted certain regulatory requirements. There is a effectiveness and/or require rulemaking or insurers to continue to use the statutory risk that new regulations introduced may other actions by various US
regulators over basis of accounting for insurance assets have a material adverse effect on the sales the coming years. and liabilities that existed in their of the products by Prudential and increase In July 2013 the FSB announced the jurisdictions
prior to January 2005. Prudential’s exposure to legal risks. initial list of nine insurance groups that have In July 2010, the IASB published its first In Asia, regulatory regimes are developing been designated as G-SIIs of which Exposure Draft
for its Phase II on insurance at different speeds, driven by a combination Prudential was one. Designation as a G-SII accounting, which would introduce of global factors and local considerations. has led to additional policy measures being
significant changes to the statutory There is a risk that new requirements are applied to the designated group. Based on reporting of insurance entities that prepare introduced that challenge current practices, the policy framework released by the
IAIS, accounts according to IFRS. A revised or are retrospectively applied to sales made and subsequent guidance papers, these Exposure Draft was issued in June 2013. prior to their introduction. additional policy measures include The IASB is
currently re-deliberating the enhanced Group-wide supervision, Exposure Draft proposals in light of Litigation, disputes and regulatory effective resolution measures of the Group comments by the insurance industry and investigations may adversely
affect in the event of failure, loss absorption, and other respondents. The timing of the final Prudential’s pro fitability and higher loss absorption capacity. Prudential proposals taking effect is uncertain but not financial condition is
monitoring the development, and expected to be before 2019. Prudential is, and may be in the future, potential impact, of the framework of Any changes or modification of IFRS subject to legal actions, disputes and policy measures and is continuing
to accounting policies may require a change regulatory investigations in various engage with the PRA on the implications in the future results or a retrospective contexts, including in the ordinary course of the policy measures and Prudential’s
adjustment of reported results. of its insurance, investment management designation as a G-SII. The G-SII regime and other business operations. These legal
Prudential plc Annual Report 2014 341
actions,
disputes and investigations may Schroders, Invesco Perpetual and fidelity. Adverse experience in the operational relate to aspects of Prudential’s businesses Jackson’s competitors in the US include risks inherent in Prudential’s and
operations that are specific to major stock and mutual insurance business, including failure in Prudential, or that are common to companies, mutual fund organisations, information technology and cyber-companies that operate in Prudential’s
banks and other financial services security, could disrupt its business markets. Legal actions and disputes may companies such as AIG, AXA financial Inc, functions and have a negative impact arise under contracts, regulations (including Allianz,
Prudential financial, Lincoln on its results of operations tax) or from a course of conduct taken by National, MetLife and Aegon. Operational risks are present in all of Prudential, and may be class actions. Prudential believes competition will
Prudential’s businesses, including the risk Although Prudential believes that it has intensify across all regions in response to of direct or indirect loss resulting from adequately provided in all material aspects consumer demand,
technological advances, inadequate or failed internal and external for the costs of litigation and regulatory the impact of consolidation, regulatory processes, systems and human error or matters, no assurance can be provided that actions and other
factors. Prudential’s ability from external events. Prudential’s business such provisions are sufficient. Given the to generate an appropriate return depends is dependent on processing a large number large or indeterminate amounts of
damages significantly upon its capacity to anticipate of transactions across numerous and sometimes sought, other sanctions that and respond appropriately to these diverse products, and is subject to a might be applicable, and the inherent
competitive pressures. number of different legal and regulatory unpredictability of litigation and disputes, regimes. Further, because of the long-term it is possible that an adverse outcome could, Downgrades in Prudential’s financial nature of
much of the Group’s business, from time to time, have an adverse effect on strength and credit ratings could accurate records have to be maintained for Prudential’s reputation, results of operations signi ficantly impact its competitive
significant periods. or cash fiows. position and damage its These factors, among others, result relationships with creditors or in significant reliance on, and require
Prudential’s businesses are trading counterparties significant investment in, information conducted in highly competitive Prudential’s financial strength and credit
technology (IT), compliance and other environments with developing ratings, which are used by the market to operational systems, personnel and demographic trends, and continued measure its ability to meet policyholder processes. In addition,
Prudential pro fitability depends upon obligations, are an important factor outsources several operations, including management’s ability to respond affecting public confidence in Prudential’s a significant part of its UK back office and
to these pressures and trends products and, as a result, its competitiveness. customer-facing functions as well as a The markets for financial services in the Downgrades in Prudential’s ratings, as number of IT functions, resulting in reliance
UK, US and Asia are highly competitive, a result of, for example, decreased upon the operational processing with several factors affecting Prudential’s profitability, increased costs, increased performance of its outsourcing partners. ability
to sell its products and continued indebtedness or other concerns, could Although Prudential’s IT, compliance profitability, including price and yields have an adverse effect on its ability to and other operational systems and offered,
financial strength and ratings, market products, retain current processes incorporate controls designed to range of product lines and product quality, policyholders, and on the Group’s financial manage and mitigate the operational risks brand
strength and name recognition, fiexibility. In addition, the interest rates associated with its activities, there can be investment management performance, Prudential pays on its borrowings are no assurance that such controls will always historical
bonus levels, developing affected by its credit ratings, which are in be effective. Due to human error, among demographic trends and customer appetite place to measure the Group’s ability to other reasons, operational incidents do for certain
savings products. In some of its meet its contractual obligations. happen periodically and no system or markets, Prudential faces competitors that Prudential plc’s long-term senior debt process can entirely prevent them – are larger, have
greater financial resources is rated as A2 by Moody’s, A+ by although there have not been any material or a greater market share, offer a broader Standard & Poor’s and A by fitch. These such events to date. For example, although
range of products or have higher bonus ratings have a stable outlook. Prudential has not identified a material rates. Further, heightened competition for Prudential plc’s short-term debt failure or breach in relation to its legacy and talented
and skilled employees and agents is rated as P-1 by Moody’s, A-1 by other IT systems and processes to date, it with local experience, particularly in Asia, Standard & Poor’s and F1 by fitch. has been, and likely will continue to
be, may limit Prudential’s potential to grow its The Prudential Assurance Company subject to computer viruses, attempts at business as quickly as planned. Limited’s financial strength is rated Aa2 unauthorised access and cyber-security In
Asia, the Group’s principal (negative outlook) by Moody’s, AA (stable attacks. Prudential’s legacy and other IT competitors in the region are international outlook) by Standard & Poor’s and AA systems and processes, as
with operational financial companies, including global life (stable outlook) by fitch. systems and processes generally, may be insurers such as Allianz, AXA, AIA, and Jackson’s financial strength is rated susceptible to failure or breaches.
Manulife, and multinational asset managers AA by Standard & Poor’s and fitch, A1 by Being part of the financial services such as J P Morgan Asset
Management, Moody’s, and A+ by AM Best. These sector, Prudential and its business partners Schroders, HSBC Global Asset ratings have a stable outlook. are increasingly exposed to the risk that Management and Franklin Templeton. Prudential
Assurance Co Singapore third parties may attempt to disrupt the In a number of markets, local companies (Pte) Ltd’s financial strength is rated AA availability, confidentiality and integrity have a very significant market presence. (stable
outlook) by Standard & Poor’s. of its IT systems. This could result in loss Additional Within the UK, Prudential’s principal In addition, changes in methodologies of trust from Prudential’s customers, competitors include many
of the major and criteria used by rating agencies could reputational damage and financial loss. retail financial services companies and result in downgrades that do not refiect The cyber-security threat continues to fund management companies
including, changes in the general economic conditions evolve globally in sophistication and information in particular, Aviva, Legal & General, or Prudential’s financial condition. potential significance as Prudential Lloyds Banking
Group, Standard Life, increasingly moves to digitalise its business
342 Prudential plc Annual Report 2014 Additional information Risk factors
Risk factors continued
and provide on-line business operations for Withdrawal Benefit (GMWB)
of Jackson’s Prudential operates in a number its customers. While a focus of Prudential is variable annuity business. If mortality of markets through joint ventures on being proactive to the exposure faced improvement rates significantly exceed
the and other arrangements with third from emerging threats through continually improvement assumed, Prudential’s results parties (including in China and reviewing and enhancing its IT environment of operations could be adversely affected.
India), involving certain risks that to remain robust and secure, together with A further example is the assumption Prudential does not face with respect increasing its ability to detect system that Prudential makes about future to its consolidated
subsidiaries compromise, and recover should such an expected levels of the rates of early Prudential operates, and in certain markets incident occur, there can be no assurance termination of products by its customers is required by local regulation
to operate, that such events will not take place with (persistency). This is particularly relevant through joint ventures (including in China adverse consequential effects on to its lines of business other than its UK and India). For the
Group’s joint venture Prudential’s business and financial position. annuity business, especially Jackson’s operations, management control is Such events could, among other things, portfolio of traditional and variable exercised
jointly with the venture harm Prudential’s ability to perform annuities. Prudential’s persistency participants. The level of control exercisable necessary business functions, result in the assumptions refiect recent past experience by the
Group depends on the terms of the loss of confidential or proprietary data for each relevant line of business. joint venture agreements, in particular, the (exposing it to potential legal claims and Any expected change in future persistency
allocation of control among, and continued regulatory sanctions) and damage its is also refiected in the assumption. If actual cooperation between, the joint venture relationships with its business partners and levels of future persistency are
significantly participants. Prudential may face financial, customers. Similarly, any weakness in different than assumed, the Group’s results reputational and other exposure (including administration systems (such as those of operations could be
adversely affected. regulatory censure) in the event that any of relating to policyholder records or meeting Furthermore, Jackson’s variable annuity its joint-venture partners fails to meet its regulatory requirements) or actuarial products are
sensitive to other types of obligations under the joint venture, reserving processes could have a material policyholder behaviour, such as the encounters financial difficulty, or fails to adverse effect on its results of operations take-up of its
GMWB product features. comply with local or international regulation during the effective period. Another example is the impact of and standards such as those pertaining to epidemics and other effects that cause the prevention of financial crime. In
addition, Adverse experience relative to the a large number of deaths. Significant a significant proportion of the Group’s assumptions used in pricing products infiuenza epidemics have occurred three product distribution is carried out through
and reporting business results could times in the last century, but the likelihood, arrangements with third parties not signi ficantly affect Prudential’s results timing, or the severity of future epidemics controlled by Prudential, and is
dependent of operations cannot be predicted. The effectiveness of upon continuation of these relationships. In common with other life insurers, the external parties, including governmental A temporary or permanent disruption to profitability of the
Group’s businesses and non-governmental organisations, in these distribution arrangements, such as depends on a mix of factors including combating the spread and severity of any through significant deterioration in the mortality and morbidity
levels and trends, epidemics could have a material impact on reputation, financial position or other policy surrenders and take-up rates on the Group’s loss experience. circumstances of the third party or material guarantee features of
products, investment failure in controls (such as those pertaining performance and impairments, unit cost As a holding company, Prudential to the prevention of financial crime) could of administration and new business is dependent upon its
subsidiaries adversely affect the results of operations acquisition expense. to cover operating expenses and of Prudential.
Prudential needs to make assumptions
dividend payments about a number of factors in determining The Group’s insurance and investment Prudential’s Articles of Association the pricing of its products, setting reserves, management operations are generally contain an exclusive
jurisdiction for reporting its capital levels and the conducted through direct and indirect provision results of its long-term business operations. subsidiaries. Under Prudential’s Articles of Association, For example, the assumption that As a
holding company, Prudential’s certain legal proceedings may only be Prudential makes about future expected principal sources of funds are remittances brought in the courts of England and Wales. levels of mortality is particularly relevant from
subsidiaries, shareholder-backed This applies to legal proceedings by for its UK annuity business. In exchange for funds, the shareholder transfer from a shareholder (in its capacity as such) against a premium equal to the capital value of their
long-term funds and any amounts that may Prudential and/or its directors and/or its accumulated pension fund, pension be raised through the issuance of equity, professional service providers. It also applies annuity policyholders receive a
guaranteed debt and commercial paper. to legal proceedings between Prudential payment, usually monthly, for as long as Certain of the subsidiaries are restricted and its directors and/or Prudential and they are alive. Prudential conducts rigorous by
applicable insurance, foreign exchange Prudential’s professional service providers research into longevity risk, using data from and tax laws, rules and regulations that can that arise in connection with legal its substantial annuitant
portfolio. As part limit remittances. In some circumstances, proceedings between the shareholder and of its pension annuity pricing and reserving this could limit Prudential’s ability to pay such professional service provider. This policy,
Prudential’s UK business assumes dividends to shareholders or to make provision could make it difficult for US and that current rates of mortality continuously available funds held in certain subsidiaries other non-UK shareholders to enforce
their improve over time at levels based on to cover operating expenses of other shareholder rights. adjusted data and models from the members of the Group.
Continuous Mortality Investigations (CMI) as published by the Institute and Faculty of Actuaries. Assumptions about future expected levels of mortality are
similarly relevant to the Guaranteed Minimum

Prudential plc Annual Report 2014 343
Changes in
tax legislation may result in adverse tax consequences
Tax rules, including those relating to the insurance industry, and their interpretation, may change,
possibly with retrospective effect, in any of the jurisdictions in which Prudential operates. Significant tax disputes with tax authorities, and any change in the tax status of any member of the Group or in taxation legislation or its scope or
interpretation could affect Prudential’s financial condition and results of operations.
Additional information

344 Prudential plc Annual Report 2014 Additional information Glossary
Glossary
AER Bulk annuity Deferred acquisition costs or DAC
Actual Exchange Rates are actual historical A bulk annuity, sometimes referred to as Acquisition costs are expenses of an exchange rates for the specific accounting a bulk purchase
annuity, is a contract insurer which are incurred in connection period, being the average rates over the between a defined benefit pension scheme with the acquisition of new insurance period for the income statement and the and an insurance company,
whereby an contracts or the renewal of existing closing rates for the balance sheet at the insurance company insures some or all of insurance policies. They include balance sheet date. the liabilities of the pension scheme. commissions and other
variable sales inducements and the direct costs
Annual premium equivalent or APE Cash surrender value of issuing the policy, such as underwriting
A measure of new business activity that The amount of cash available to and other policy issue expenses. Typically, is calculated as the sum of annualised a policyholder on the
surrender of, or under IFRS, an element of acquisition regular premiums from new business plus withdrawal from, a life insurance policy costs are deferred, ie, not expensed 10 per cent of single premiums on new or annuity contract. in the year
incurred, and instead amortised business written during the period. in the income statement in line with CER the emergence of surpluses on the Asset-backed security Constant Exchange Rate – Prudential plc related contracts.
A security whose value and income reports its results at both actual exchange payments are derived from, and rates (AER) to refiect actual results, and Deferred annuities
collateralised (or ‘backed’) by, a specified also constant exchange rates (CER) so as Annuities or pensions due to be paid from pool of underlying assets. The pool of to eliminate the impact from exchange a future date or when the
policyholder assets is typically a group of small and translation. CER results are calculated by reaches a specified age. illiquid assets that are unable to be translating prior year results using current sold individually. period foreign currency
exchange rates, ie, Discretionary participation features current period average rates for the income or DPF
Available for sale (AFS) statements and current period
closing rate A contractual right to receive, as a Securities that have been acquired neither for the balance sheet. supplement to guaranteed benefits, for short-term sale nor to be held to additional benefits: maturity. AFS securities are measured
at Closed-book life insurance business
— That are likely to be a significant portion fair value on the statement of financial A ‘closed book’ is
essentially a group of of the total contractual benefits; position with unrealised gains and losses insurance policies that are no longer sold, being booked in other comprehensive but are still featured on the books of a life — Whose amount or
timing is Income instead of the income statement. insurer as a premium-paying policy. The contractually at the discretion of the insurance company has ‘closed the books’ issuer; and Back book of business on new sales of these products
which will
— That are contractually based on The insurance policies sold in past periods remain in run-off until the policies expire asset, fund, company or
other that are still in force, and hence are still and all claims are settled. entity performance. recorded on the insurer’s balance sheet.
Core structural
borrowings
Dividend cover
Bonuses Borrowings which Prudential considers to
Dividend cover is calculated as operating Bonuses refer to the non-guaranteed form part of its core capital structure and profit after tax on an IFRS basis,
divided by benefit added to participating life insurance exclude operational borrowings. the current year interim dividend plus the policies and are the way in which proposed final dividend. policyholders receive their share of the Credit risk
profits of the policies. There are normally The risk of loss if another party fails
Endowment product two types of bonus; to meet its obligations, or fails to do
so in
An ordinary individual life insurance a timely fashion.
— Regular
bonus – expected to be added product that provides the insured party every year during the term of the policy. with various guaranteed benefits if it
Currency
risk
It is not guaranteed that a regular bonus survives specific maturity dates or periods The risk that asset or liability values, cash will be added each year,
but once it is stated in the policy. Upon the death of the fiows, income or expenses will be affected added, it cannot be reversed, also insured party within the coverage period, by changes in exchange rates. known as annual or reversionary a
designated beneficiary receives the face Also referred to as foreign exchange risk. bonus; and value of the policy.
— final bonus – an additional bonus
European Embedded Value or EEV expected to be paid when policyholders financial results that are prepared on take money from the policies. If a supplementary basis
to the Group’s investment return has been low over consolidated IFRS results and which are the lifetime of the policy, a final bonus prepared in accordance with a set of may not be paid. final bonuses may Principles issued by the Chief
financial vary and are not guaranteed.
Officers Forum of European Insurance Companies in May 2004 and expanded by the Additional Guidance of EEV Disclosures
published in October 2005. The principles are designed to capture the value of the new business sold in the period and of the business in force.

Prudential plc Annual Report 2014 345
fixed
annuities Guaranteed minimum accumulation Inherited estate
fixed annuity contracts written in the US bene fit (GMAB) (US) For life insurance proprietary companies,
which allow for tax-deferred accumulation A guarantee that ensures that the contract surplus capital available on top of what of funds, are used for asset accumulation in value of a variable annuity contract will be is necessary to cover
policyholders’ retirement planning and for providing at least equal to a certain minimum amount reasonable expectations. An inherited income in retirement and offer fiexible after a specified number of years. (orphan) estate is effectively
surplus capital pay-out options. The contract holder pays on a realistic basis built over time, and not the insurer a premium, which is credited to Guaranteed minimum death bene fit allocated to policyholders or shareholders. the contract
holders’ account. Periodically, (GMDB) (US) interest is credited to the contract holders’ The basic death benefit offered under Internal rate of return (IRR) account and administrative charges are variable annuity contracts, which
specifies The IRR is equivalent to the discount rate deducted, as appropriate. that if the owner dies before annuity at which the present EEV value of the income payments begin, the beneficiary post-tax cash fiows expected to be earned fixed indexed
annuities will receive a payment equal to the greater over the lifetime of the business written These are similar to fixed annuities in that of the contract value or purchase payments in shareholder-backed life funds is equal the contract holder
pays the insurer a less withdrawals. to the total invested capital to support premium, which is credited to the contract the writing of the business. The capital holders’ account and, periodically, interest Guaranteed minimum income included in
the calculation of the IRR is credited to the contract holders’ account bene fit (GMIB) (US) is equal to the amount required to pay and administrative charges are deducted, A guarantee that ensures, under certain acquisition costs and set up
reserves, less as appropriate. An annual minimum conditions, that the owner may annuitise premiums received, plus encumbered interest rate may be guaranteed, although the variable annuity contract based on the capital. The impact of the time value
of actual interest credited may be higher and greater of (a) the actual account value options and guarantees is included in is linked to an equity index over its indexed or (b) a pay-out base equal to premiums the calculation. option
period. credited with some interest rate, or the maximum anniversary value of the account Internal vesting Funds under management prior to annuitisation. Internal vestings are proceeds from a These comprise funds of the Group held Prudential policy
which the policyholder in the statement of financial position and Guaranteed minimum withdrawal has decided to reinvest in a Prudential external funds that are managed by bene fit (GMWB) (US) annuity product.
Prudential asset management operations. A guarantee in a variable annuity that promises that the owner may make annual International financial Reporting Group free surplus
withdrawals of a defined amount for the life Standards (IFRS) Group free surplus at the end of the period of the owner or until the total guaranteed Accounting standards that all publicly comprises free surplus for the insurance amount is recovered,
regardless of market listed groups in the European Union are businesses, representing the excess of the performance or the actual account balance. required to apply in preparing consolidated net worth over the required capital financial statements.
included in the EEV results, and IFRS net Health and protection assets for the asset management These comprise health and personal Investment grade businesses excluding goodwill. The free accident insurance products, which provide Investments rated
BBB- or above for S&P, surplus generated during the period morbidity or sickness benefits and include Baa3 or above for Moody’s. Generally they comprises the movement in this balance health, disability, critical illness and accident are
bonds that are judged by the rating excluding foreign exchange, capital, and coverage. Health and protection products agency as likely enough to meet payment other reserve movements. Specifically, are sold both as standalone policies and as
obligations that banks are allowed it includes amounts maturing from the riders that can be attached to life insurance to invest in them. in-force operations during the period, products. Health and protection riders are less the investment in new
business, the presented together with ordinary individual Investment-linked products or effect of market movements and other life insurance products for purposes of contracts one-off items. disclosure of financial information. Insurance products
where the surrender value of the policy is linked to the value of Guaranteed annuities IGD surplus underlying investments (such as collective Policies that pay out a fixed amount of The Prudential Group’s solvency surplus investment schemes,
internal investment benefit for a defined period. measured in accordance with the EU pools or other property) or fiuctuations Insurance Groups Directive. in the value of underlying investment or Guaranteed investment contract indices. Investment
risk associated with (GIC) (US) Immediate annuity the product is usually borne by the An investment contract between an An annuity in which payments to the policyholder. Insurance coverage, insurance company and an institutional annuitant or
beneficiary start at once upon investment and administration services investor, which provides a stated rate of establishment of the annuity plan or scheme. are provided for which the charges are return on deposits over a specified period Such
annuities are almost always purchased deducted from the investment fund assets. of time. They typically provide for partial or with a single (lump sum) payment. Benefits payable will depend on the price Additional total withdrawals at book value if
needed of the units prevailing at the time of for certain liquidity needs of the plan. In-force surrender, death or the maturity of the An insurance policy or contract refiected product, subject to surrender charges. on records that has not expired,
matured or These are also referred to as unit-linked information otherwise been surrendered or terminated. products or unit-linked contracts.

346 Prudential plc Annual Report 2014 Additional information Glossary
Glossary continued
Liquidity coverage ratio Non-participating business Present value of new
business
Prudential calculates this as assets and A life insurance policy where the premiums or PVNBP available resources that are readily policyholder is not
entitled to a share The present value of new business convertible to cash to cover corporate of the Company’s profits and surplus, premiums is calculated as equalling single obligations in a prescribed stress scenario. but receives certain
guaranteed benefits. premiums plus the present value of This ratio is calculated over a range of time Also known as non-profit in the UK. expected premiums of new regular horizons extending to 12 months. Examples include pure risk policies (eg,
premium business, allowing for lapses and fixed annuities, term insurance, critical other assumptions made in determining Liquidity premium illness) and unit-linked insurance contracts. the EEV new business contribution. This comprises the premium
that is required to compensate for the lower Open-ended investment company Prudential Regulation Authority or liquidity of corporate bonds relative to (OEIC ) PRA swaps, and the mark to market risk A collective investment fund structured as The PRA
is a UK regulatory body premium that is required to compensate for a limited company in which investors can responsible for prudential regulation and the potential volatility in corporate bond buy and sell shares. supervision of banks, building
societies, spreads (and hence market values) at the credit unions, insurers and major time of sale. Operational borrowings investment firms.
Borrowings which arise
in the normal
Market value reduction (MVR) course of the business. Regular premium product
A reduction applied to the payment on A life insurance product with regular with-profits bonds when policyholders Participating funds periodic premium payments. surrender in
adverse market conditions. Distinct portfolios where the policyholders have a contractual right to receive, at the Rider Money Market Fund (MMF) discretion of the insurer, additional benefits A supplemental plan that can be attached An MMF is an
open-ended mutual fund based on factors such as the performance to a basic insurance policy, with payment that invests in short-term debt securities of a pool of assets held within the fund, as of additional premium. such as US treasury bills and
commercial a supplement to any guaranteed benefits. paper. The purpose of an MMF is to The insurer may either have discretion as Risk margin reserve (RMR) charge provide investors with a safe place to the timing of the allocation of those An RMR is
included within operating profit to invest easily accessible cash-equivalent benefits to participating policyholders or based on longer-term investment returns assets characterised as a low-risk, may have discretion as to the timing and and
represents a charge for long-term low-return investment. the amount of the additional benefits. For expected defaults of debt securities, Prudential, the most significant participating determined by reference to the credit Mortality rate funds are
with-profits funds for businesses quality of the portfolio.
Rate of death, varying by such parameters written in the UK, Hong Kong, Malaysia as age, gender, and
health, used in pricing and Singapore. Scottish Amicable Insurance Fund and computing liabilities for future (SAIF) policyholders of life and annuity products, Participating policies or participating SAIF is a ring-fenced sub-fund of the which
contain mortality risks. business Prudential Assurance Company’s Contracts of insurance where the long-term fund following the acquisition of Net premiums policyholders have a contractual right to the mutually owned Scottish Amicable Life Life
insurance premiums, net of reinsurance receive, at the discretion of the insurer, Assurance Society in 1997. The fund is ceded to third-party reinsurers. additional benefits based on factors solely for the benefit of policyholders of such as
investment performance, SAIF. Shareholders of Prudential plc have Net worth as a supplement to any guaranteed no interest in the profits of this fund Net assets for EEV reporting purposes that benefits. This is also referred to although they are
entitled to asset refiect the regulatory basis position, as with-profits business. management fees on this business. sometimes with adjustments to achieve consistency with the IFRS treatment of Payback period Separate account certain items. Payback
period is the time in which the A separate account is a pool of investments initial ‘cash’ outfiow of investment is held by an insurance company not in or New business margin expected to be recovered from the ‘cash’
‘separate’ from its general account. The value of new business on an EEV basis infiows generated by the investment. We The returns from the separate account expressed as a percentage of the present measure cash outfiow by our investment
generally accrue to the policyholder. value of new business premiums expected of free surplus in new business sales. A separate account allows an investor to to be received from the new business. The payback period equals the time taken choose an
investment category according for this business to generate free surplus to the individual’s risk tolerance, and desire New business pro fit to cover this investment. Payback periods for performance.
The profits, calculated in accordance with are measured on an undiscounted basis.
European
Embedded Value Principles, Single premiums from business sold in the financial reporting Single premium policies of insurance are period under consideration. those that require only a single lump sum payment from the policyholder.

Prudential plc Annual Report 2014 347
Stochastic
techniques Unit-linked products or unit-linked
Stochastic techniques incorporate results contracts from repeated simulations using key See ‘investment-linked
products or financial parameters which are subject to contracts’ above. random variations and are projected into the future. Universal life
An insurance
product where the customer Subordinated debt pays fiexible premiums, subject to specified A fixed interest issue or debt that ranks limits, which are accumulated in an account below other debt in order of priority for and are credited with interest
(at a rate repayment if the issuer is liquidated. either set by the insurer or refiecting Holders are compensated for the added returns on a pool of matching assets). risk through higher rates of interest. The customer may vary the death benefit
Under EU insurance regulation, and the contract may permit the customer subordinated debt is not treated as a to withdraw the account balance, liability and counts towards the coverage typically subject to a surrender charge. of the required minimum
margin of solvency, with limitations. Variable annuity (VA) (US) An annuity whose value is determined by Surrender the performance of underlying investment The termination of a life insurance policy options that frequently includes securities. or
annuity contract at the request of the A variable annuity’s value is not guaranteed policyholder after which the policyholder and will fiuctuate, depending on the value receives the cash surrender value, if any, of its underlying investments.
The holder of the contract. of a variable annuity assumes the investment risk and the funds backing Surrender charge or surrender fee a variable annuity are held in the insurance The fee charged to a policyholder when company’s separate
account. VAs are a life insurance policy or annuity contract similar to unit-linked annuities in the UK. is surrendered for its cash surrender value prior to the end of the surrender Whole of life charge period. A type of life insurance policy that
provides lifetime protection; premiums must usually Takaful be paid for life. The sum assured is paid out Insurance that is compliant with whenever death occurs. Commonly used Islamic principles. for estate-planning purposes.
Time value of options and With-pro fits funds guarantees See ‘participating funds’ above. The value of financial options and guarantees comprises two parts: the Yield
intrinsic value and the time value. The A measure of the income received from intrinsic value is given by a deterministic an investment compared to the price paid valuation on best estimate assumptions. for the investment. Normally expressed The
time value is the additional value as a percentage. arising from the variability of economic outcomes in the future.
Total shareholder return (TSR)
TSR represents the growth in the value of a share plus the value of dividends paid, assuming that the dividends are reinvested in the Company’s shares on the ex-dividend date.
Unallocated surplus
Unallocated surplus is recorded wholly as a liability and
represents the excess of assets over policyholder liabilities for Prudential’s with-profits funds. The balance retained in the unallocated surplus represents Additional cumulative income arising on the with- profits business that has not been
allocated to policyholders or shareholders. information
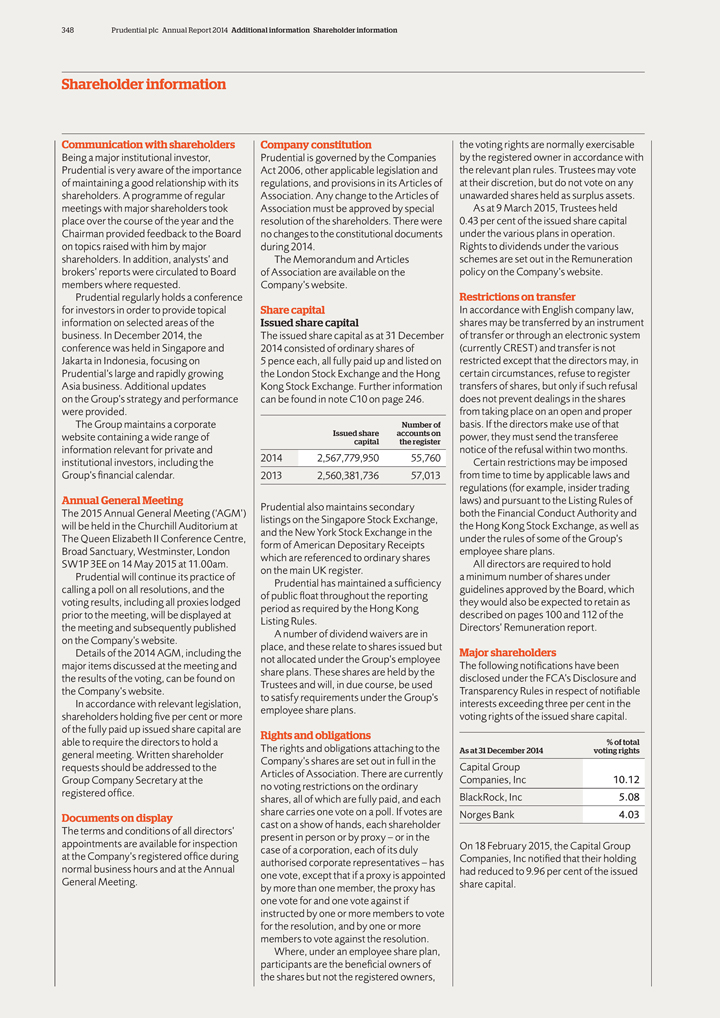
348 Prudential plc Annual Report 2014 Additional information Shareholder information
Shareholder information
Communication with shareholders Company constitution the voting rights
are normally exercisable
Being a major institutional investor, Prudential is governed by the Companies by the registered owner in accordance with Prudential is
very aware of the importance Act 2006, other applicable legislation and the relevant plan rules. Trustees may vote of maintaining a good relationship with its regulations, and provisions in its Articles of at their discretion, but do not vote on any
shareholders. A programme of regular Association. Any change to the Articles of unawarded shares held as surplus assets. meetings with major shareholders took Association must be approved by special As at 9 March 2015, Trustees held place over
the course of the year and the resolution of the shareholders. There were 0.43 per cent of the issued share capital Chairman provided feedback to the Board no changes to the constitutional documents under the various plans in operation. on
topics raised with him by major during 2014. Rights to dividends under the various shareholders. In addition, analysts’ and The Memorandum and Articles schemes are set out in the Remuneration brokers’ reports were circulated to Board of
Association are available on the policy on the Company’s website. members where requested. Company’s website.
Prudential regularly holds a conference
Restrictions on transfer for investors in order to provide topical Share capital In accordance with English company law, information on selected areas of the Issued share capital shares may be transferred by an instrument business. In December 2014,
the The issued share capital as at 31 December of transfer or through an electronic system conference was held in Singapore and 2014 consisted of ordinary shares of (currently CREST) and transfer is not Jakarta in Indonesia, focusing on 5 pence
each, all fully paid up and listed on restricted except that the directors may, in Prudential’s large and rapidly growing the London Stock Exchange and the Hong certain circumstances, refuse to register Asia business. Additional updates Kong
Stock Exchange. Further information transfers of shares, but only if such refusal on the Group’s strategy and performance can be found in note C10 on page 246. does not prevent dealings in the shares were provided. from taking place on an open
and proper The Group maintains a corporate Number of basis. If the directors make use of that website containing a wide range of Issued share accounts on power, they must send the transferee
capital the register
information relevant for private and notice of the refusal within two
months. institutional investors, including the 2014 2,567,779,950 55,760 Certain restrictions may be imposed Group’s financial calendar. 2013 2,560,381,736 57,013 from time to time by applicable laws and regulations (for example, insider
trading Annual General Meeting laws) and pursuant to the Listing Rules of Prudential also maintains secondary The 2015 Annual General Meeting (‘AGM’) both the financial Conduct Authority and listings on the Singapore Stock Exchange, will
be held in the Churchill Auditorium at the Hong Kong Stock Exchange, as well as and the New York Stock Exchange in the The Queen Elizabeth II Conference Centre, under the rules of some of the Group’s form of American Depositary Receipts Broad
Sanctuary, Westminster, London employee share plans. which are referenced to ordinary shares SW1P 3EE on 14 May 2015 at 11.00am. All directors are required to hold on the main UK register.
Prudential will continue its practice of a minimum number of shares under Prudential has maintained a sufficiency calling a poll on all resolutions, and the guidelines approved by
the Board, which of public fioat throughout the reporting voting results, including all proxies lodged they would also be expected to retain as period as required by the Hong Kong prior to the meeting, will be displayed at described on pages 100 and
112 of the Listing Rules. the meeting and subsequently published Directors’ Remuneration report.
A number of dividend waivers are in on the Company’s
website. place, and these relate to shares issued but
Details of the 2014 AGM, including the Major shareholders not allocated under the Group’s employee major
items discussed at the meeting and The following notifications have been share plans. These shares are held by the the results of the voting, can be found on disclosed under the FCA’s Disclosure and Trustees and will, in due course, be used the
Company’s website. Transparency Rules in respect of notifiable to satisfy requirements under the Group’s In accordance with relevant legislation, interests exceeding three per cent in the employee share plans. shareholders holding five per
cent or more voting rights of the issued share capital. of the fully paid up issued share capital are
Rights and obligations able to require the directors to hold
a % of total The rights and obligations attaching to the As at 31 December 2014 voting rights general meeting. Written shareholder Company’s shares are set out in full in the requests should be addressed to the Capital Group Articles of
Association. There are currently Group Company Secretary at the Companies, Inc 10.12 no voting restrictions on the ordinary registered office. BlackRock, Inc 5.08 shares, all of which are fully paid, and each share carries one vote on a poll. If
votes are Norges Bank 4.03
Documents on display cast on a show of hands, each shareholder The terms and conditions of all directors’ present in person or by
proxy – or in the appointments are available for inspection On 18 February 2015, the Capital Group case of a corporation, each of its duly at the Company’s registered office during Companies, Inc notified that their holding authorised
corporate representatives – has normal business hours and at the Annual had reduced to 9.96 per cent of the issued one vote, except that if a proxy is appointed General Meeting. share capital. by more than one member, the proxy has one
vote for and one vote against if instructed by one or more members to vote for the resolution, and by one or more members to vote against the resolution.
Where,
under an employee share plan, participants are the beneficial owners of the shares but not the registered owners,
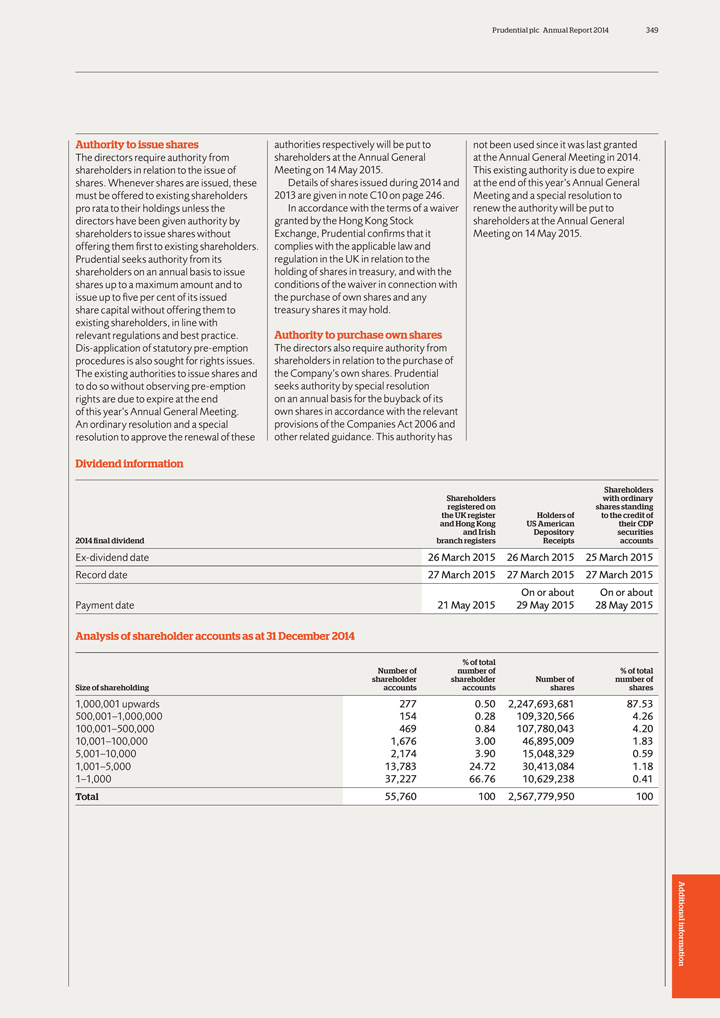
Prudential plc Annual Report 2014 349
Authority to
issue shares authorities respectively will be put to not been used since it was last granted The directors require authority from shareholders at the Annual General at the Annual General Meeting in 2014. shareholders in relation to the issue of
Meeting on 14 May 2015. This existing authority is due to expire shares. Whenever shares are issued, these Details of shares issued during 2014 and at the end of this year’s Annual General must be offered to existing shareholders 2013 are
given in note C10 on page 246. Meeting and a special resolution to pro rata to their holdings unless the In accordance with the terms of a waiver renew the authority will be put to directors have been given authority by granted by the Hong Kong
Stock shareholders at the Annual General shareholders to issue shares without Exchange, Prudential confirms that it Meeting on 14 May 2015. offering them first to existing shareholders. complies with the applicable law and Prudential seeks
authority from its regulation in the UK in relation to the shareholders on an annual basis to issue holding of shares in treasury, and with the shares up to a maximum amount and to conditions of the waiver in connection with issue up to five per
cent of its issued the purchase of own shares and any share capital without offering them to treasury shares it may hold. existing shareholders, in line with relevant regulations and best practice. Authority to purchase own shares Dis-application of
statutory pre-emption The directors also require authority from procedures is also sought for rights issues. shareholders in relation to the purchase of The existing authorities to issue shares and the Company’s own shares. Prudential to do so
without observing pre-emption seeks authority by special resolution rights are due to expire at the end on an annual basis for the buyback of its of this year’s Annual General Meeting. own shares in accordance with the relevant An ordinary
resolution and a special provisions of the Companies Act 2006 and resolution to approve the renewal of these other related guidance. This authority has
Dividend
information
Shareholders Shareholders with ordinary registered on shares standing the UK register Holders of to the credit of and Hong Kong US American their CDP
and Irish Depository securities 2014 final dividend branch registers Receipts accounts
Ex-dividend date 26 March 2015 26 March 2015 25 March 2015
Record date 27 March 2015 27 March 2015 27 March 2015 On or about On or about Payment date 21 May 2015 29 May 2015 28 May 2015
Analysis of shareholder accounts as at 31 December 2014
% of total
Number of number of % of total shareholder shareholder Number of number of Size of shareholding accounts accounts shares shares
1,000,001 upwards 277 0.50 2,247,693,681 87.53 500,001–1,000,000 154 0.28 109,320,566 4.26 100,001–500,000 469 0.84 107,780,043 4.20 10,001–100,000 1,676 3.00
46,895,009 1.83 5,001–10,000 2,174 3.90 15,048,329 0.59 1,001–5,000 13,783 24.72 30,413,084 1.18 1–1,000 37,227 66.76 10,629,238 0.41 Total 55,760 100 2,567,779,950 100
Additional information
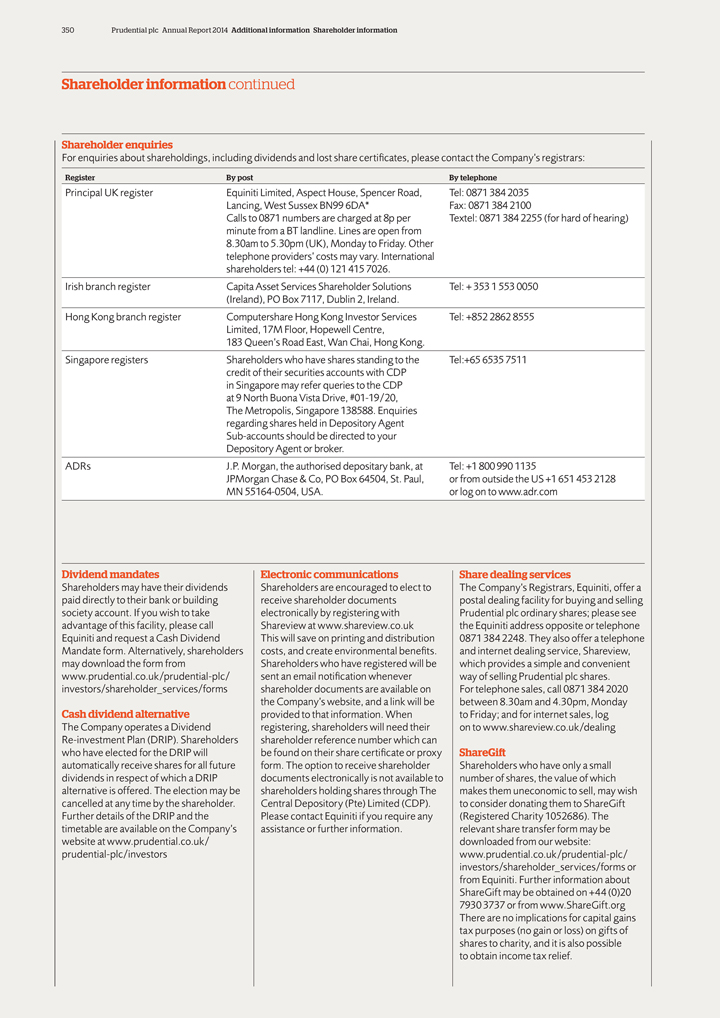
350 Prudential plc Annual Report 2014 Additional information Shareholder information
Shareholder information continued
Shareholder enquiries
For enquiries about shareholdings, including dividends and lost share certificates, please contact the Company’s registrars:
Register By post By telephone
Principal UK register Equiniti Limited, Aspect House, Spencer
Road, Tel: 0871 384 2035 Lancing, West Sussex BN99 6DA* Fax: 0871 384 2100
Calls to 0871 numbers are charged at 8p per Textel: 0871 384 2255 (for hard of
hearing) minute from a BT landline. Lines are open from 8.30am to 5.30pm (UK), Monday to Friday. Other telephone providers’ costs may vary. International shareholders tel: +44 (0) 121 415 7026.
Irish branch register Capita Asset Services Shareholder Solutions Tel: + 353 1 553 0050 (Ireland), PO Box 7117, Dublin 2, Ireland.
Hong Kong branch register Computershare Hong Kong Investor Services Tel: +852 2862 8555 Limited, 17M Floor, Hopewell Centre, 183 Queen’s Road East, Wan Chai, Hong Kong.
Singapore registers Shareholders who have shares standing to the Tel:+65 6535 7511 credit of their securities accounts with CDP in Singapore may refer queries to
the CDP at 9 North Buona Vista Drive, #01-19/20, The Metropolis, Singapore 138588. Enquiries regarding shares held in Depository Agent Sub-accounts should be directed to your Depository Agent or broker.
ADRs J.P. Morgan, the authorised depositary bank, at Tel: +1 800 990 1135
JPMorgan
Chase & Co, PO Box 64504, St. Paul, or from outside the US +1 651 453 2128 MN 55164-0504, USA. or log on to www.adr.com
Dividend mandates Electronic
communications Share dealing services
Shareholders may have their dividends Shareholders are encouraged to elect to The Company’s Registrars, Equiniti, offer
a paid directly to their bank or building receive shareholder documents postal dealing facility for buying and selling society account. If you wish to take electronically by registering with Prudential plc ordinary shares; please see advantage of
this facility, please call Shareview at www.shareview.co.uk the Equiniti address opposite or telephone Equiniti and request a Cash Dividend This will save on printing and distribution 0871 384 2248. They also offer a telephone Mandate form.
Alternatively, shareholders costs, and create environmental benefits. and internet dealing service, Shareview, may download the form from Shareholders who have registered will be which provides a simple and convenient
www.prudential.co.uk/prudential-plc/ sent an email notification whenever way of selling Prudential plc shares. investors/shareholder_services/forms shareholder documents are available on For telephone sales, call 0871 384 2020 the Company’s
website, and a link will be between 8.30am and 4.30pm, Monday Cash dividend alternative provided to that information. When to Friday; and for internet sales, log The Company operates a Dividend registering, shareholders will need their on to
www.shareview.co.uk/dealing Re-investment Plan (DRIP). Shareholders shareholder reference number which can who have elected for the DRIP will be found on their share certificate or proxy ShareGift automatically receive shares for all future form.
The option to receive shareholder Shareholders who have only a small dividends in respect of which a DRIP documents electronically is not available to number of shares, the value of which alternative is offered. The election may be shareholders
holding shares through The makes them uneconomic to sell, may wish cancelled at any time by the shareholder. Central Depository (Pte) Limited (CDP). to consider donating them to ShareGift Further details of the DRIP and the Please contact Equiniti
if you require any (Registered Charity 1052686). The timetable are available on the Company’s assistance or further information. relevant share transfer form may be website at www.prudential.co.uk/ downloaded from our website:
prudential-plc/investors www.prudential.co.uk/prudential-plc/ investors/shareholder_services/forms or from Equiniti. Further information about ShareGift may be obtained on +44 (0)20 7930 3737 or from www.ShareGift.org There are no implications for
capital gains tax purposes (no gain or loss) on gifts of shares to charity, and it is also possible to obtain income tax relief.

Prudential plc Annual Report 2014 351
How to
contact us
Prudential plc Prudential UK & Europe Institutional Analyst and Investor
Laurence Pountney Hill 3 Sheldon Square enquiries
London EC4R 0HH London W2 6PR Tel +44 (0)20
7548 3300
Tel +44 (0)20 7220 7588 Tel +44 (0)800 000 000 E-mail: [email protected] www.prudential.co.uk www.pru.co.uk
UK Register Private Shareholder Paul Manduca Jackie Hunt enquiries
Chairman Chief Executive
Tel: 0871 384 2035 International shareholders Tidjane Thiam M&G Tel +44 (0) 121 415 7026 Group Chief Executive Laurence Pountney Hill London EC4R 0HH Irish Branch Register Private Nic Nicandrou Tel +44 (0)20 7626 4588 Shareholder enquiries
Chief financial Officer www.mandg.co.uk Tel +353 1 553 0050
Pierre-Olivier
Bouée Michael McLintock Hong Kong Branch Register Private
Group Chief Risk Officer Chief Executive Shareholder enquiries Tel +852 2862 8555
Julian Adams Prudential Corporation Asia
Group Regulatory Director 13th Floor US American
Depository Receipts One International finance Centre Holder enquiries Margaret Coltman 1 Harbour View Street Tel +1 651 453 2128 Group General Counsel Central Hong Kong The Central Depository (Pte) Limited John Foley Tel +852 2918 6300 Shareholder
enquiries
Group Investment Director www.prudentialcorporation-asia.com Tel +65 6535 7511
John Murray Barry Stowe Media enquiries
Group Communications Director Chief Executive Tel +44
(0)20 7548 3559
E-mail: [email protected]
Tim Rolfe Jackson
National Life Insurance
Group Human Resources Director Company
1 Corporate
Way
Alan Porter Lansing Group Company Secretary Michigan 48951 USA
Tel +1 517
381 5500 www.jackson.com
Mike Wells
President and Chief Executive Officer
Additional information
352 Prudential plc Annual Report 2014 Additional information How to contact us
How to contact us continued
Prudential public limited company Forward-looking statements
relevant regulatory frameworks, and tax
Incorporated and registered in England This document may contain ‘forward- and other legislation and regulations in
the and Wales looking statements’ with respect to certain jurisdictions in which Prudential and its of Prudential’s plans and its goals and affiliates operate; and the impact of legal Registered of fice expectations relating to its future
financial actions and disputes.
Laurence Pountney Hill condition, performance, results, strategy These and other important factors may, London EC4R 0HH and
objectives. Statements that are not for example, result in changes to Registered number 1397169 historical facts, including statements about assumptions used for determining results Prudential’s beliefs and expectations, and of operations or
re-estimations of reserves www.prudential.co.uk including, without limitation, statements for future policy benefits. containing the words ‘may’, ‘will’, ‘should’, Further discussion of these and other Prudential plc is
a holding company, ‘continue’, ‘aims’, ‘estimates’, ‘projects’, important factors that could cause subsidiaries of which are authorised ‘believes’, ‘intends’, ‘expects’,
‘plans’, Prudential’s actual future financial and regulated by the Prudential ‘seeks’ and ‘anticipates’, and words of condition or performance or other Regulation Authority and the similar meaning, are
forward-looking indicated results to differ, possibly financial Conduct Authority statements. These statements are based materially, from those anticipated in on plans, estimates and projections as at Prudential’s forward-looking statements the
time they are made, and therefore can be found under the ‘Risk factors’ undue reliance should not be placed on heading in this Annual Report and the ‘Risk them. By their nature, all forward-looking factors’ heading of
Prudential’s most recent statements involve risk and uncertainty. annual report on Form 20-F filed with the A number of important factors could US Securities and Exchange Commission, cause Prudential’s actual future financial as well as
under the ‘Risk factors’ heading condition or performance or other of any subsequent Prudential Half Year indicated results to differ materially from Report. Prudential’s most recent Annual those indicated in any forward-looking
Report, Form 20-F and any subsequent statement. Such factors include, but are Half Year Report will be available on its not limited to, future market conditions, website at www.prudential.co.uk including fiuctuations in interest rates and Any
forward-looking statements exchange rates and the potential for contained in this document speak only a sustained low-interest rate environment, as of the date on which they are made. and the performance of financial markets Prudential expressly
disclaims any generally; the policies and actions of obligation to update any of the forward-regulatory authorities, including, for looking statements contained in this example, new government initiatives document or any other forward-looking
related to the financial crisis and the effect statements it may make, whether as a result of the European Union’s ‘Solvency II’ of future events, new information or requirements on Prudential’s capital otherwise, except as
required pursuant to maintenance requirements; the impact the UK Prospectus Rules, the UK Listing of continuing designation as a Global Rules, the UK Disclosure and Transparency Systemically Important Insurer or ‘G-SII’; Rules, the Hong
Kong Listing Rules, the the impact of competition, economic SGX-ST Listing Rules or other applicable growth, infiation, and defiation; experience laws and regulations. in particular with regard to mortality and morbidity trends, lapse rates and
policy renewal rates; the timing, impact and other uncertainties of future acquisitions or combinations within relevant industries; the impact of changes in capital, solvency standards, accounting standards or

This report is printed on Amadeus 75 Matt, a paper made from 75 per cent recycled post-consumer waste and 25 per cent virgin
fibre sourced from fully sustainable forests; and Cocoon Preprint, made from 100 per cent recycled fibre sourced from de-inked post-consumer waste.
All
material used in this report has been independently certi fied according to the rules of the Forest Stewardship Council (FSC). All pulps used are elemental chlorine free, and the inks used are vegetable oil based. The manufacturing mills and the
printer are registered to the Environmental Management System ISO 14001 and are FSC chain-of-custody certi fied.
Designed by fishburn®
Printed in the UK by CPI Colour

Prudential public limited company Incorporated and registered in England and Wales Registered of fice Laurence Pountney Hill London EC4R
0HH
Registered number 1397169 www.prudential.co.uk
Prudential plc is a
holding company, subsidiaries of which are authorised and regulated, as applicable, by the Prudential Regulation Authority and the financial Conduct Authority.
SIGNATURES
Pursuant to the requirements of the Securities Exchange Act of 1934, the registrant has duly caused this report to be signed on its behalf by the undersigned, thereunto duly authorized.
| Date: 31 March 2015 | ||||||
| PRUDENTIAL PUBLIC LIMITED COMPANY | ||||||
| By: | /s/ N Nicandrou | |||||
| Chief Financial Officer | ||||||
Serious News for Serious Traders! Try StreetInsider.com Premium Free!
You May Also Be Interested In
- Perseus Mining March Quarterly Report
- UBS Reiterates Buy Rating on Prudential (PRU:LN) (PUK)
- Red Pine Intercepts Significant Mineralization at the Wawa Gold Project, including 5.34 g/t over 13.39 metres including 16.50 g/t gold over 0.97 metre and 13.62 g/t gold over 2.13 metres
Create E-mail Alert Related Categories
SEC FilingsSign up for StreetInsider Free!
Receive full access to all new and archived articles, unlimited portfolio tracking, e-mail alerts, custom newswires and RSS feeds - and more!
