

Form 6-K IAMGOLD CORP For: Mar 30
 Tweet
Tweet Share
ShareFORM 6-K
UNITED STATES
SECURITIES AND EXCHANGE COMMISSION
Washington, D.C. 20549
Report of Foreign Private Issuer
Pursuant to Rule 13a-16 or 15d-16
of the Securities Exchange Act of 1934
Date: March 30, 2015
Commission File Number 001-31528
IAMGOLD Corporation
(Translation of registrant’s name into English)
401 Bay Street Suite 3200, PO Box 153
Toronto, Ontario, Canada M5H 2Y4
Tel: (416) 360-4710
(Address of principal executive offices)
Indicate by check mark whether the registrant files or will file annual reports under cover Form 20-F or Form 40-F.
| Form 20-F | ¨ | Form 40-F | x |
Indicate by check mark if the registrant is submitting the Form 6-K in paper as permitted by Regulation S-T Rule 101(b)(1):
Note: Regulation S-T Rule 101(b)(1) only permits the submission in paper of a Form 6-K if submitted solely to provide an attached annual report to security holders.
Indicate by check mark if the registrant is submitting the Form 6-K in paper as permitted by Regulation S-T Rule 101(b)(7):
Note: Regulation S-T Rule 101(b)(7) only permits the submission in paper of a Form 6-K if submitted to furnish a report or other document that the registrant foreign private issuer must furnish and make public under the laws of the jurisdiction in which the registrant is incorporated, domiciled or legally organized (the registrant’s “home country”), or under the rules of the home country exchange on which the registrant’s securities are traded, as long as the report or other document is not a press release, is not required to be and has not been distributed to the registrant’s security holders, and, if discussing a material event, has already been the subject of a Form 6-K submission or other Commission filing on EDGAR.
Description of Exhibit
| Exhibit | Description of Exhibit | |
| 99.1 | Annual Report 2014 |
Signatures
Pursuant to the requirements of the Securities Exchange Act of 1934, the registrant has duly caused this report to be signed on its behalf by the undersigned, thereunto duly authorized.
| IAMGOLD CORPORATION | ||||||
| Date: March 30, 2015 | By: | /s/ Tim Bradburn | ||||
| Vice President, Legal and Corporate Secretary | ||||||
Exhibit 99.1

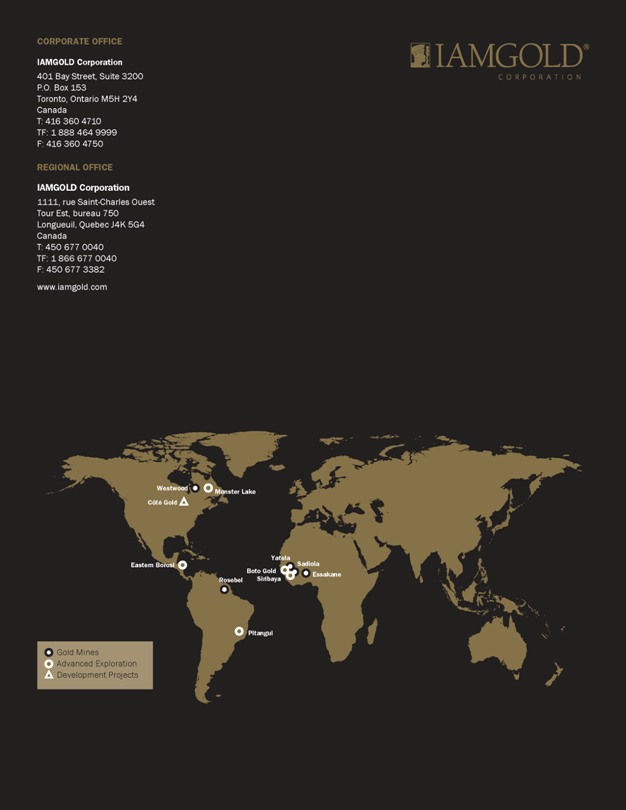
IAMGOLD (www.iamgold.com) is a mid-tier mining company with four operating gold mines (including current joint ventures) on three continents. A solid base of strategic assets in Canada, South America and Africa is complemented by development and exploration projects and continued assessment of accretive acquisition opportunities. IAMGOLD is in a strong financial position with extensive management and operational expertise.
O P E R A T I N G A N D F I N A N C I A L H I G H L I G H T S
| 2013 | 2014 | |||||||
| Gold production – attributable1 (oz.) |
835,000 | 844,000 | ||||||
| Average realized gold price2 ($/oz.) |
1,399 | 1,259 | ||||||
| Total cash cost2,3,4 – gold mines5 ($/oz.) |
801 | 848 | ||||||
| All-in sustaining costs2,4 – gold mines5 ($/oz.) |
1,222 | 1,101 | ||||||
| Financial |
||||||||
| Cash, cash equivalents and bullion (at market) ($ millions) |
384.6 | 321.0 | ||||||
| Net losses ($ millions) |
(832.5 | ) | (206.8 | ) | ||||
| Adjusted net earnings including discontinued operations attributable to IAMGOLD equity holders2 ($ millions) |
137.3 | 32.8 | ||||||
| Adjusted net earnings including discontinued operations per share2 ($/share)
|
|
0.36
|
|
|
0.09
|
| ||
| 1 | Attributable gold production includes Westwood pre-commercial production for the year ended December 31, 2014 and December 31, 2013 of 10,000 ounces of 73,000 ounces, respectively. |
| 2 | This is a non-GAAP measure; refer to the non-GAAP performance measures section of the MD&A. |
| 3 | The total cash costs computation does not include Westwood pre-commercial production for the year ended December 31, 2014 and December 31, 2013 of 10,000 ounces and 73,000 ounces, respectively. |
| 4 | By-product credits are included in the calculation of this measure; refer to the non-GAAP performance measures section of the MD&A for the reconciliation to GAAP. |
| 5 | Gold mines, as used with total cash costs and all-in sustaining costs, consist of Rosebel, Essakane, Westwood (commercial production), Mouska, Sadiola and Yatela on an attributable basis. |
K E Y O P E R AT I O N S AT A G L A N C E
| Mine
|
Location
|
Operator
|
IAMGOLD
|
2014 Production1 (000s oz.)
|
2015 Production1 (000s oz.)
| |||||||
| Rosebel |
Suriname | IAMGOLD | 95% | 325 | 290–300 | |||||||
| Essakane |
Burkina Faso | IAMGOLD | 90% | 332 | 360–370 | |||||||
| Westwood2
|
Canada
|
IAMGOLD
|
|
100%
|
|
92
|
110–130
| |||||
| Total Owner/Operated
|
749
|
760–800
| ||||||||||
| Joint ventures |
Mali | AngloGold Ashanti | Sadiola 41% | 95 | 60 | |||||||
| AngloGold Ashanti |
Yatela 40% | |||||||||||
| Total production
|
844
|
820–860
| ||||||||||
| 1 | All production numbers are on an attributable basis. |
| 2 | Westwood 2014 production includes production from the Doyon division. |
R E S E R V E S A N D R E S O U R C E S S U M M A R Y
| Gold Operations
|
Attributable Contained Ounces of Gold (000s)
| |||
| Dec. 31,2013 | Dec. 31, 2014 | |||||||
| Total proven and probable reserves |
10,127 | 8,608 | ||||||
| Total measured and indicated resources (includes mineral reserves)1,2 |
23,408 | 21,412 | ||||||
| Total inferred resources |
6,299 | 7,018 | ||||||
| 1 | Measured and indicated gold resources are inclusive of proven and probable reserves. |
| 2 | In mining operations, measured and indicated resources that are not mineral reserves are considered uneconomic at the price used for reserves estimations, but are deemed to have a reasonable prospect of economic extraction. |
All figures are in USD
C H A I R M A N ’ S M E S S A G E

Last year marked another challenging year for the gold sector. With a second year of compressed gold prices, many companies had no choice but to adapt to the new landscape.
I am a firm believer that it is during these challenging times that companies can make some of the most effective changes, and in doing so, come out stronger. It is for this reason that I commend IAMGOLD management for making the tough decisions that have allowed IAMGOLD to start 2015 on such a strong footing, setting the stage for an exciting year ahead.
For a second year in a row, cost reduction, cash preservation and capital discipline were entrenched in our business every day; they were the foundation upon which every decision was made. Our commitment to these three priorities resulted in a reduction in all-in sustaining costs year-over-year finishing at $1,021/oz. in the fourth quarter, a balance sheet with over $800 million in cash and bullion, and informed and strategic capital allocation decisions.
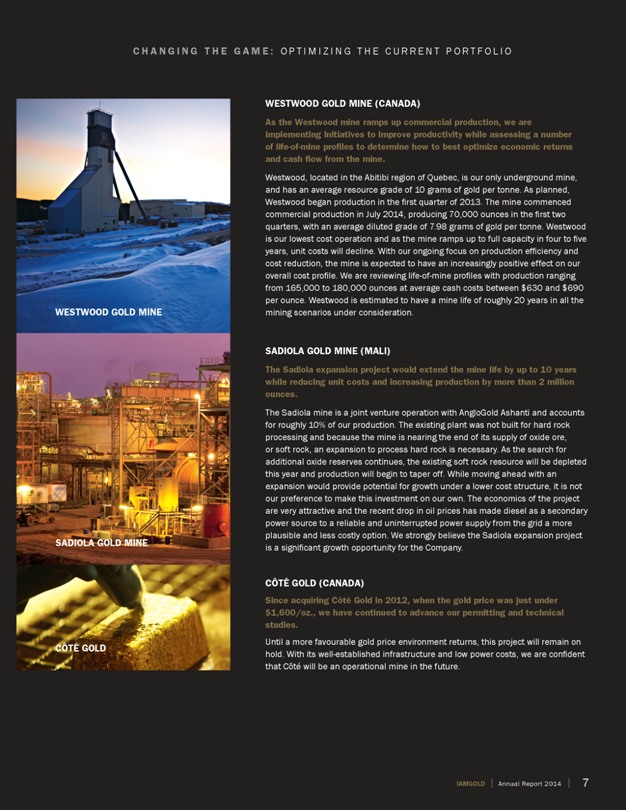
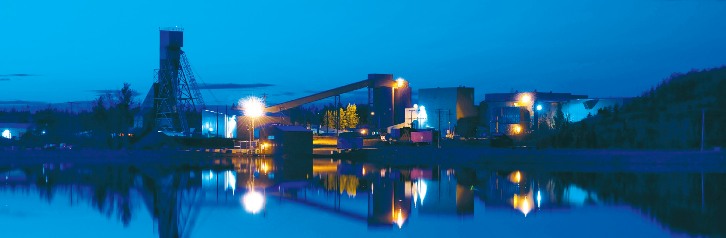
The Westwood mine commenced commercial production on July 1, 2014 and produced 70,000 ounces of gold in the first six months. I applaud the hard work that was necessary from everyone at the mine to achieve this result. I look forward to the mine’s first full year of commercial production as it ramps up to full production levels over the next 4 to 5 years.
With the three strategic priorities in mind, IAMGOLD underwent a restructuring which resulted in a leaner, more resilient company. Although not easy, this was necessary in order to better position the Company for success in the current environment in which we operate. As we enter the new year, IAMGOLD does so with reduced overall corporate general and administrative expenses, while at the same time having the flexibility and agility to act opportunistically should we find a compelling opportunity.
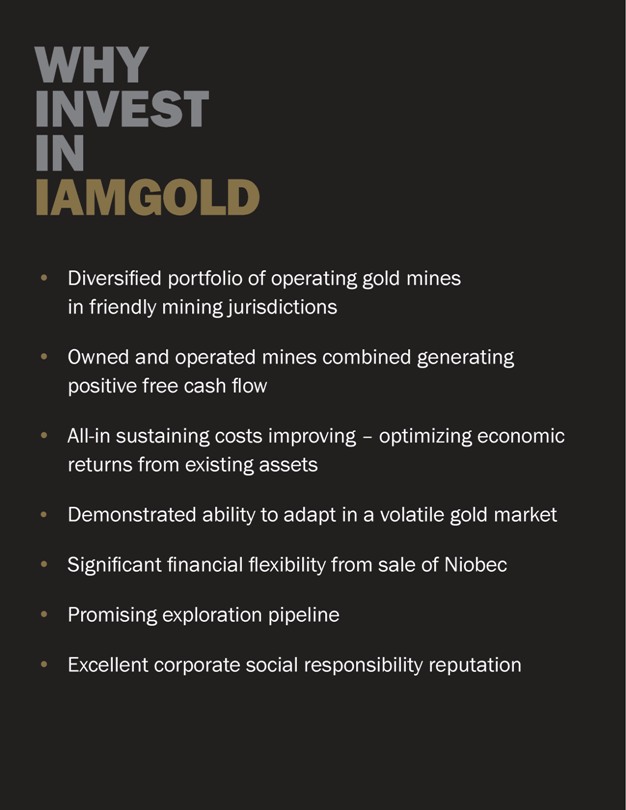
The sale of Niobec in 2014 was a significant milestone, a key factor that sets the stage for a transformational year ahead for IAMGOLD. This transaction has afforded the Company financial strength and capacity that separates IAMGOLD from its peers. It provides IAMGOLD with the ability to invest in its own gold portfolio and also to make an acquisition with attractive grades, which can lower the overall cost structure.
With commercial production ramping up at Westwood, a focus on optimizing performance at Rosebel and Essakane, the exploration team’s efforts to increase reserves and resources, and a balance sheet that facilitates the Company’s mergers and acquisitions (“M&A”) strategy, IAMGOLD is in a position to effect change. I am confident that the changes made under the direction of the Company’s management team in 2014 will serve us well into the years to come.

William D. Pugliese
Chairman
IAMGOLD Corporation
2 | IAMGOLD | Annual Report 2014
S T R A I G H T T A L K W I T H M A N A G E M E N T

I am proud of how the IAMGOLD team performed in 2014.
We continued reducing costs, enhancing returns from our existing assets and ensuring that capital projects met our internal rates of return. We beat our cost guidance by 10%, with four consecutive quarters of decreasing all-in sustaining costs to finish the fourth quarter at $1,021/oz., $209/oz. lower year-over-year. Westwood’s first six months of commercial production, improving grades at Rosebel, and benefits from Essakane’s expansion and its higher grades, all contributed to driving production for the year to 844,000 ounces. With safety a primary focus every day, I am pleased to report that the frequency of all types of serious injuries improved 35% year-over-year.
Essakane and Rosebel finished the year with positive free cash flow and I’m confident that we can achieve this at a consolidated level this year. With increasingly encouraging results from our advanced exploration projects and a cash and bullion position over $800 million, we start 2015 on solid ground. Building on our accomplishments in 2014, we will continue driving forward with our three strategic priorities at the root of every decision.
The sale of Niobec was completed on January 22, 2015. The $500 million received in cash for the niobium business strengthened our financial capacity for both investing in our existing assets and pursuing M&A and joint venture opportunities that can contribute to positive cash flow. With our long-term debt not due for another five years, we are positioned to dramatically change IAMGOLD’s profile this coming year. Although we have the ability to make an acquisition immediately, we will be disciplined, moving only if our investment criteria can be met.
In late 2014, we also changed the corporate structure as part of our continuing efforts to maximize economic returns. With the primary objective to create a more efficient and effective corporate structure with embedded agility and scalability, we reduced our top leadership team by 40% and decided to outsource future project development work. We are now much leaner, which allows us to better adapt to the market conditions at hand and provides us with the flexibility to act opportunistically when things change.
I believe in the long-term value of gold. The year has begun on a positive note for the industry with gold up, the price of oil and exchange rates moving in our favour and an increasing appetite for mergers and acquisitions. Our ability to optimize performance while having the financial means to add to our portfolio in a meaningful way, sets the stage for IAMGOLD to deliver value to our shareholders and to Change the Game.
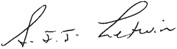
Stephen J.J. Letwin
President and Chief Executive Officer
IAMGOLD Corporation
IAMGOLD | Annual Report 2014 | 3

C H A N G I N G T H E G A M E : D I S C I P L I N E D A C Q U I S I T I O N S A N D D I V E S T I T U R E S
Sale of Niobec
On January 22, 2015, we announced the closing of the sale of Niobec for a total consideration of $530 million. The sale of Niobec comprised an underground niobium mine, the associated processing facilities located in Saint-Honoré-de-Chicoutimi in the Saguenay-Lac-Saint-Jean region, Quebec, and an adjacent rare earth element (“REE”) deposit. The sale of Niobec, for a price that was 10 times EBITDA, strengthened our financial capacity which allows us to optimize the returns from our existing asset portfolio and provides us the optionality to pursue profitable M&A growth opportunities. We could achieve this by deploying the partial or full proceeds from the sale to an acquisition that would generate positive near-term cash flow and improve our grade and cost profile, or explore JVs and partnerships. Although we have the financial means to act quickly, we will be disciplined in our approach. It is imperative that the below criteria be met in order for us to take the opportunity into consideration.
Acquisition Criteria
Under the leadership of Jeff Snow, our General Counsel and Senior Vice President of Business Development, we continue evaluating opportunities to acquire gold assets. With over $800 million in cash and bullion subsequent to the sale of Niobec, we have the financial capacity to acquire a producing or near-term producing mine that could increase our near-term cash flow, improve grades and reduce our cost structure. An acquisition could take the shape of another mining company, a stand-alone asset, or a bolt-on to one of our existing operations. Whether we make an acquisition or not will depend on it meeting the following criteria:
| • The mine is in production or nearing production and thus capable of generating positive free cash flow.
• It is producing or will produce at least 100,000 ounces annually.
• It has a lower cost structure and attractive grade profile.
• It is predominantly gold.
• It has reserves of at least 1 million ounces.
• It is located in a positive mining jurisdiction. |
|
Our priority for the use of proceeds is to reinvest in our business. We have the financial capacity to both optimize the returns from our existing assets and seek profitable M&A opportunities to acquire an asset that, if not already generating positive cash flow, is very close to doing so. By making an acquisition, our consolidated production and cost profile will improve, thus allowing us the opportunity to Change the Game.
8 | IAMGOLD | Annual Report 2014
C H A N G I N G T H E G A M E : M A N A G I N G A S T R O N G P I P E L I N E
Greenfield – Boto Gold Project, Senegal
Our wholly-owned Boto Gold Project comprises 236 square kilometres, and has an indicated resource of 1.23 million ounces, with an average grade of 1.68 grams of gold per tonne, and a further 635,000 ounces in inferred resources grading 1.80 grams of gold per tonne (resources as at December 31, 2014). Final assay results from the 2014 drilling program continued to demonstrate wide intervals of high-grade mineralization from the core of the Malikoundi deposit, the largest deposit discovered to date on the property. Further results from infill diamond drill holes reported in February 2015 included 9 metres grading 10.5 g/t Au (including 5 metres grading 17.55 g/t Au), 44 metres grading 4.46 g/t Au (including 6 metres grading 14.46 g/t Au) and 40 metres grading 3.24 g/t Au (including 11 metres grading 8.15 g/t Au). In 2015, we plan to complete our ongoing 50 metre by 50 metre infill delineation campaign started in 2014 for the purpose of upgrading resources at the Malikoundi deposit. Results will be incorporated in a further resource estimate to support ongoing technical studies.
Greenfield – Pitangui Project, Brazil
The Pitangui Project, 100%-owned, is located on an 180-square-kilometre land package in Brazil’s Iron Quadrangle, the second largest gold producing region in the country. Our focus is on the newly discovered São Sebastião deposit with an estimated resource of 638,000 inferred ounces averaging 4.88 grams of gold per tonne hosted in iron formations for which the region is well known (resources as at January 9, 2013). Subsequent drilling results confirmed the continuity of mineralization and revealed new high-grade intervals in a second zone, not surprising given that deposits of this nature typically comprise multiple mineralized shoots. Although drilling continues, highlights of results released during 2014 included 7.5 metres grading 9.73 g/t Au and 4.9 metres grading 10.16 g/t Au. With an objective to both expand and improve the confidence in the delineated resources, these results are expected to provide a positive impact and will be incorporated in an updated resource model once all results from the current program are received and validated.
C H A N G I N G T H E G A M E : J O I N T V E N T U R E S
MONSTER LAKE, QUEBEC
Partner: Option agreement with TomaGold Corporation. Why it is exciting: Encouraging results from our first exploration program have not only confirmed an extension of the high-grade 325-Megane zone at depth where it remains open, but also have identified several new gold-bearing structures for further exploration. Recent highlights reported from the drilling program (see news release dated February 5, 2015) include:
• 9.18 metres grading 46.33 g/t Au (including 2.2 metres grading 182.8 g/t Au), • 3.42 metres grading 18.68 g/t Au, and
• 7.1 metres grading 6.74 g/t Au.
EASTERN BOROSI, NICARAGUA
Partner: Option agreement with Calibre Mining. Why it is exciting: In 2014 diamond drilling tested five gold-silver vein systems over a strike length of 3 kilometres. Calibre Mining announced final 2014 assay results (news release dated January 21, 2015) including highlights of:
• 5.1 metres grading 13.44 g/t Au and 14.49 g/t Ag, and • 2.8 metres grading 26.48 g/t Au and 24.2 g/t Ag.
A Phase II drilling program planned for 2015 will focus on testing remaining priority targets and delineating extensions to the mineralized shoots discovered in 2014.
DIAKHA – SIRIBAYA, MALI
Partner: 50:50 joint venture with Merrex Gold Inc. Why it is exciting: The drill program in 2014 confirmed a new discovery at Diakha with the intersection of multiple zones of gold mineralization with significant widths and grades. In 2014, reported highlights from assay results (Merrex news release dated August 28, 2014) included:
• 34 metres grading 4.85 g/t Au, • 19 metres grading 7.3 g/t Au, and • 12 metres grading 10.99 g/t Au.
The primary focus for 2015 will be to complete an infill delineation drilling program to enable the estimation of an initial
NI-43-101-compliant resource estimate as results warrant.
IAMGOLD | Annual Report 2014 | 9
2 0 1 4 M I N E R A L R E S E R V E S A N D R E S O U R C E S
Mineral resources (“resources”) and mineral reserves (“reserves”) have been estimated as at December 31, 2014 pursuant to Canadian securities regulatory requirements, specifically the requirements of National Instrument 43-101 and the definitions of resources and reserves incorporated therein. Consistent with National Instrument 43-101, resources are divided into “inferred,” “indicated” and “measured” based on the level of geological confidence in the mineralization, and reserves, into “probable” and “proven” upon at least a pre-feasibility study having been undertaken on the indicated and measured resources. Measured and indicated resources are inclusive of proven and probable reserves. Mineral resources that are not mineral reserves do not have demonstrated economic viability and are not guaranteed to have economic viability. Inferred resources are too speculative geologically to have any economic considerations applied to them that would allow a translation into reserves.
Cautionary Notes to U.S. Investors
The United States Securities and Exchange Commission (“SEC”) limits disclosure for U.S. reporting purposes to mineral deposits that a company can economically and legally extract or produce. IAMGOLD uses certain terms in the Annual Report, such as “measured,” “indicated,” or “inferred,” which may not be consistent with the reserve definitions established by the SEC. U.S. investors are urged to consider closely the disclosure in the IAMGOLD Annual Reports on Forms 40-F filed with the SEC.
G O L D M I N E R A L R E S E R V E S
| 100% Basis Reserves | PROVEN | PROBABLE | ||||||||||||||||||||||
| As at December 31, 2014 | Tonnes (000s) |
Grade (g/t) |
Contained Ounces (000s) |
Tonnes (000s) |
Grade (g/t) |
Contained Ounces (000s) |
||||||||||||||||||
| Rosebel1 (95%) |
76,371 | 1.1 | 2,603 | 17,269 | 1.0 | 552 | ||||||||||||||||||
| Essakane1 (90%) |
— | — | — | 108,821 | 1.1 | 3,886 | ||||||||||||||||||
| Westwood2 (100%) |
301 | 7.3 | 71 | 2,070 | 7.0 | 468 | ||||||||||||||||||
| Sadiola3 (41%) |
— | — | — | 57,428 | 2.1 | 3,841 | ||||||||||||||||||
| Côté Gold (92.5%) |
— | — | — | — | — | — | ||||||||||||||||||
| Boto (100%) |
— | — | — | — | — | — | ||||||||||||||||||
| Pitangui (100%) |
— | — | — | — | — | — | ||||||||||||||||||
| Total proven reserves |
76,672 | 1.1 | 2,674 | |||||||||||||||||||||
| Total probable reserves |
185,588 | 1.5 | 8,747 | |||||||||||||||||||||
| Total proven and probable reserves |
262,260 | 1.4 | 11,421 | |||||||||||||||||||||
| Attributable Reserves | PROVEN | PROBABLE | ||||||||||||||||||||||
| As at December 31, 2014 | Tonnes (000s) |
Grade (g/t) |
Contained Ounces (000s) |
Tonnes (000s) |
Grade (g/t) |
Contained Ounces (000s) |
||||||||||||||||||
| Rosebel1 (95%) |
72,552 | 1.1 | 2,473 | 16,406 | 1.0 | 524 | ||||||||||||||||||
| Essakane1 (90%) |
— | — | — | 97,939 | 1.1 | 3,497 | ||||||||||||||||||
| Westwood2 (100%) |
301 | 7.3 | 71 | 2,070 | 7.0 | 468 | ||||||||||||||||||
| Sadiola3 (41%) |
— | — | — | 23,545 | 2.1 | 1,575 | ||||||||||||||||||
| Côté Gold (92.5%) |
— | — | — | — | — | — | ||||||||||||||||||
| Boto (100%) |
— | — | — | — | — | — | ||||||||||||||||||
| Pitangui (100%) |
— | — | — | — | — | — | ||||||||||||||||||
| Total proven reserves |
72,853 | 1.1 | 2,544 | |||||||||||||||||||||
| Total probable reserves |
139,960 | 1.3 | 6,065 | |||||||||||||||||||||
| Total proven and probable reserves |
212,814 | 1.3 | 8,608 | |||||||||||||||||||||
IAMGOLD | Annual Report 2014 | 11
2 0 1 4 M I N E R A L R E S E R V E S A N D R E S O U R C E S ( C O N T I N U E D )
G O L D M I N E R A L R E S O U R C E S
(inclusive of mineral reserves)
| 100% Basis Resources | MEASURED | INDICATED | INFERRED | |||||||||||||||||||||||||||||||||
| As at December 31, 2014 | Tonnes (000s) |
Grade (g/t) |
Contained Ounces (000s) |
Tonnes (000s) |
Grade (g/t) |
Contained Ounces (000s) |
Tonnes (000s) |
Grade (g/t) |
Contained Ounces (000s) |
|||||||||||||||||||||||||||
| Rosebel1 (95%) |
126,712 | 1.0 | 4,124 | 50,993 | 1.0 | 1,678 | 19,014 | 0.9 | 542 | |||||||||||||||||||||||||||
| Essakane1 (90%) |
– | – | – | 124,432 | 1.2 | 4,702 | 14,830 | 1.3 | 628 | |||||||||||||||||||||||||||
| Westwood2 (100%) |
199 | 11.7 | 75 | 1,455 | 11.1 | 520 | 9,729 | 10.9 | 3,397 | |||||||||||||||||||||||||||
| Sadiola3 (41%) |
12,971 | 0.8 | 320 | 102,146 | 1.9 | 6,275 | 5,523 | 1.6 | 291 | |||||||||||||||||||||||||||
| Côté Gold4 (92.5%) |
– | – | – | 278,600 | 0.9 | 7,716 | 52,300 | 0.7 | 1,241 | |||||||||||||||||||||||||||
| Boto4(100%) |
– | – | – | 22,796 | 1.7 | 1,232 | 10,957 | 1.8 | 635 | |||||||||||||||||||||||||||
| Pitangui4(100%) |
– | – | – | – | – | – | 4,070 | 4.9 | 638 | |||||||||||||||||||||||||||
| Total measured resources |
139,882 | 1.0 | 4,519 | |||||||||||||||||||||||||||||||||
| Total indicated resources |
580,422 | 1.2 | 22,123 | |||||||||||||||||||||||||||||||||
| Total measured and indicated resources5,6 |
720,304 | 1.2 | 26,642 | |||||||||||||||||||||||||||||||||
| Total inferred resources |
116,423 | 2.0 | 7,373 | |||||||||||||||||||||||||||||||||
| Attributable Resources | MEASURED | INDICATED | INFERRED | |||||||||||||||||||||||||||||||||
| As at December 31, 2014 | Tonnes (000s) |
Grade (g/t) |
Contained Ounces (000s) |
Tonnes (000s) |
Grade (g/t) |
Contained Ounces (000s) |
Tonnes (000s) |
Grade (g/t) |
Contained Ounces (000s) |
|||||||||||||||||||||||||||
| Rosebel1 (95%) |
120,376 | 1.0 | 3,918 | 48,443 | 1.0 | 1,594 | 18,063 | 0.9 | 515 | |||||||||||||||||||||||||||
| Essakane1 (90%) |
– | – | – | 111,989 | 1.2 | 4,232 | 13,347 | 1.3 | 565 | |||||||||||||||||||||||||||
| Westwood2 (100%) |
199 | 11.7 | 75 | 1,455 | 11.1 | 520 | 9,729 | 10.9 | 3,397 | |||||||||||||||||||||||||||
| Sadiola3 (41%) |
5,318 | 0.8 | 131 | 41,880 | 1.9 | 2,573 | 2,264 | 1.6 | 119 | |||||||||||||||||||||||||||
| Côté Gold4 (92.5%) |
– | – | – | 257,705 | 0.9 | 7,137 | 48,378 | 0.7 | 1,148 | |||||||||||||||||||||||||||
| Boto4(100%) |
– | – | – | 22,796 | 1.7 | 1,232 | 10,957 | 1.8 | 635 | |||||||||||||||||||||||||||
| Pitangui4(100%) |
– | – | – | – | – | – | 4,070 | 4.9 | 638 | |||||||||||||||||||||||||||
| Total measured resources |
125,894 | 1.0 | 4,124 | |||||||||||||||||||||||||||||||||
| Total indicated resources |
484,268 | 1.1 | 17,287 | |||||||||||||||||||||||||||||||||
| Total measured and indicated resources5,6 |
610,161 | 1.1 | 21,412 | |||||||||||||||||||||||||||||||||
| Total inferred resources |
106,809 | 2.0 | 7,018 | |||||||||||||||||||||||||||||||||
| 1 | Rosebel and Essakane mineral reserves have been estimated as of December 31, 2014 using a $1,300/oz. gold price and mineral resources have been estimated as of December 31, 2014 using a $1,500/oz. gold price and have been estimated in accordance with NI 43-101. |
| 2 | Westwood mineral reserves have been estimated as of December 31, 2014 using a $1,300/oz. gold price and mineral resources have been estimated as of December 31, 2014 using a 6.0 g/t Au cut-off over a minimum width of 2 metres and have been estimated in accordance with NI 43-101. |
| 3 | Mineral reserves at Sadiola have been estimated as of December 31, 2014 using an average $1,100/oz. gold price and mineral resources have been estimated as of December 31, 2014 using a $1,600/oz. gold price and have been estimated in accordance with JORC code. |
| 4 | Côté Gold and Boto Gold mineral resources have been estimated as of December 31, 2014 using a $1,500/oz. gold price. Pitangui mineral resources have been estimated as of January 9, 2014 using a $1,500/oz. gold price. All three resources have been estimated in accordance with NI 43-101. |
| 5 | In mining operations, measured and indicated resources that are not mineral reserves are considered uneconomic at the price used for reserve estimations but are deemed to have a reasonable prospect of economic extraction. |
| 6 | Measured and indicated gold resources are inclusive of proven and probable reserves. |
D e s i g n e d b y b m i r B r y a n M i l l s I r a d e s s o w w w . b m i r . c o m
12 | IAMGOLD | Annual Report 2014

2014 FINANCIAL REVIEW
| Management’s Discussion and Analysis |
1 | |||||
| Management’s Responsibility for Financial Reporting |
38 | |||||
| Report of Independent Registered Public Accounting Firm |
40 | |||||
| Consolidated Financial Statements |
42 | |||||

MANAGEMENT’S DISCUSSION AND ANALYSIS OF FINANCIAL POSITION AND RESULTS OF OPERATIONS
YEAR ENDED DECEMBER 31, 2014
The following Management’s Discussion and Analysis (“MD&A”) of IAMGOLD Corporation (“IAMGOLD” or the “Company”), dated February 18, 2015, should be read in conjunction with IAMGOLD’s audited consolidated financial statements and related notes for December 31, 2014 thereto which appear elsewhere in this report. All figures in this MD&A are in U.S. dollars, unless stated otherwise. Additional information on IAMGOLD Corporation can be found at www.sedar.com or www.sec.gov.
CAUTIONARY STATEMENT ON FORWARD-LOOKING INFORMATION
All information included in this MD&A, including any information as to the Company’s future financial or operating performance, and other statements that express management’s expectations or estimates of future performance, other than statements of historical fact, constitute forward-looking information or forward-looking statements and are based on expectations, estimates and projections as of the date of this MD&A. For example, forward-looking statements contained in this MD&A are found under, but are not limited to being included under, the headings “2014 Summary”, “Outlook” and “Annual Updates”, and include, without limitation, statements with respect to: the Company’s guidance for production, total cash costs, all-in sustaining costs, depreciation expense, effective tax rate, capital expenditures, operations outlook, development and expansion projects, exploration, the future price of gold, the estimation of mineral reserves and mineral resources, the realization of mineral reserve and mineral resource estimates, the timing and amount of estimated future production, costs of production, permitting timelines, currency fluctuations, requirements for additional capital, government regulation of mining operations, environmental risks, unanticipated reclamation expenses, title disputes or claims and limitations on insurance coverage. Forward-looking statements are provided for the purpose of providing information about management’s current expectations and plans relating to the future. Forward-looking statements are generally identifiable by, but are not limited to, the use of the words “may”, “will”, “should”, “continue”, “expect”, “anticipate”, “estimate”, “believe”, “intend”, “plan”, “suggest”, “guidance”, “outlook”, “potential”, “prospects”, “seek”, “targets”, “strategy” or “project” or the negative of these words or other variations on these words or comparable terminology. Forward-looking statements are necessarily based upon a number of estimates and assumptions that, while considered reasonable by management, are inherently subject to significant business, economic and competitive uncertainties and contingencies. The Company cautions the reader that reliance on such forward-looking statements involve risks, uncertainties and other factors that may cause the actual financial results, performance or achievements of IAMGOLD to be materially different from the Company’s estimated future results, performance or achievements expressed or implied by those forward-looking statements, and the forward-looking statements are not guarantees of future performance. These risks, uncertainties and other factors include, but are not limited to, changes in the global prices for gold, copper, silver or certain other commodities (such as diesel and electricity); changes in U.S. dollar and other currency exchange rates, interest rates or gold lease rates; risks arising from holding derivative instruments; the level of liquidity and capital resources; access to capital markets, and financing; mining tax regimes; ability to successfully integrate acquired assets; legislative, political or economic developments in the jurisdictions in which the Company carries on business; operating or technical difficulties in connection with mining or development activities; laws and regulations governing the protection of the environment; employee relations; availability and increasing costs associated with mining inputs and labour; the speculative nature of exploration and development, including the risks of diminishing quantities or grades of reserves; adverse changes in the Company’s credit rating; contests over title to properties, particularly title to undeveloped properties; and the risks involved in the exploration, development and mining business. With respect to development projects, IAMGOLD’s ability to sustain or increase its present levels of gold production is dependent in part on the success of its projects. Risks and unknowns inherent in all projects include the inaccuracy of estimated reserves and resources, metallurgical recoveries, capital and operating costs of such projects, and the future prices for the relevant minerals. Development projects have no operating history upon which to base estimates of future cash flows. The capital expenditures and time required to develop new mines or other projects are considerable, and changes in costs or construction schedules can affect project economics. Actual costs and economic returns may differ materially from IAMGOLD’s estimates or IAMGOLD could fail to obtain the governmental approvals necessary for the operation of a project; in either case, the project may not proceed, either on its original timing or at all.
For a more comprehensive discussion of the risks faced by the Company, and which may cause the actual financial results, performance or achievements of IAMGOLD to be materially different from the Company’s estimated future results, performance or achievements expressed or implied by forward-looking information or forward-looking statements, please refer to the Company’s latest Annual Information Form (“AIF”), filed with the Canadian securities regulatory authorities at www.sedar.com, and filed under Form 40-F with the United States Securities Exchange Commission at www.sec.gov/edgar.html. The risks described in the AIF (filed and viewable on www.sedar.com and www.sec.gov/edgar.html, and is available upon request from the Company) are hereby incorporated by reference into this MD&A.
The Company disclaims any intention or obligation to update or revise any forward-looking statements whether as a result of new information, future events or otherwise except as required by applicable law.
IAMGOLD CORPORATION
ANNUAL MANAGEMENT’S DISCUSSION AND ANALYSIS – DECEMBER 31, 2014
PAGE 1
| 2 | ||||
| 2 | ||||
| 3 | ||||
| 6 | ||||
| 7 | ||||
| 8 | ||||
| 10 | ||||
| 16 | ||||
| 17 | ||||
| 20 | ||||
| 20 | ||||
| 22 | ||||
| 23 | ||||
| 23 | ||||
| 23 | ||||
| Disclosure Controls and Procedures and Internal Control over Financial Reporting |
23 | |||
| 24 | ||||
| 24 | ||||
| 26 | ||||
| 26 | ||||
| 30 |
IAMGOLD is a mid-tier mining company with four operating gold mines on three continents. A solid base of strategic assets in Canada, South America and Africa is complemented by development and exploration projects, and continued assessment of accretive acquisition opportunities. IAMGOLD is in a strong financial position with extensive management and operational expertise. IAMGOLD (www.iamgold.com) is listed on the Toronto Stock Exchange (trading symbol “IMG”) and the New York Stock Exchange (trading symbol “IAG”).
IAMGOLD’s commitment is to Zero Harm, in every aspect of its business. IAMGOLD is one of the companies on the JSI index1.
| • | Attributable gold production, inclusive of joint venture operations, was 844,000 ounces, up by 9,000 ounces from 2013 and within guidance. |
| • | Strong performance by Westwood in its first two quarters of commercial production, producing 70,000 ounces with all-in sustaining costs2 of $1,031 per ounce sold. |
| • | Gold production at Essakane continues to increase, up 33% from 2013. |
| • | Below guidance, all-in sustaining costs2,3 - gold mines5 was $1,101 per ounce sold, 10% lower than 2013. |
| • | Capital expenditures of $325 million were below guidance and 51% lower than 2013. |
| • | Total cash costs2,4 - gold mines were $848 per ounce produced and within guidance. |
| • | The Company’s initiative to convert a portion of its non-cash working capital contributed over $50 million in cash in 2014. |
| • | On January 22, 2015, the Company completed the sale of Niobec and received cash after tax of $500 million, increasing cash, cash equivalents and gold bullion (at market value) to approximately $800 million. |
| • | Continued positive assay results from the 2014 drill program at the 100% owned Boto Gold Project in eastern Senegal, West Africa. Highlights from further drilling include 9 metres grading 10.5 g/t Au, 44 metres grading 4.46 g/t Au and 40 metres grading 3.24 g/Au (refer to the news release dated February 3, 2015). |
| • | In February 2015, the Company issued flow-through shares for proceeds of Cd$50 million. |
| 1 | Jantzi Social Index (“JSI”). The JSI is a socially screened market capitalization-weighted common stock index modeled on the S&P/TSX 60. It consists of companies that pass a set of broadly based environmental, social and governance rating criteria. |
| 2 | This is a non-GAAP measure. Refer to the non-GAAP performance measures section of the MD&A. |
| 3 | The Company, in the third quarter 2014, began including the income from its Diavik royalty as an offset to operating costs in the calculation of this measure. Previous periods were revised for comparability. |
| 4 | The total cash costs computation does not include Westwood pre-commercial production for the year ended 2014 of 10,000 ounces. |
| 5 | Gold mines, as used with total cash costs and all-in sustaining costs, consist of Rosebel, Essakane, Westwood (commercial production), Mouska, Sadiola and Yatela on an attributable basis. |
IAMGOLD CORPORATION
ANNUAL MANAGEMENT’S DISCUSSION AND ANALYSIS – DECEMBER 31, 2014
PAGE 2
FINANCIAL
| • | Net cash from operating activities including discontinued operations for 2014 was $312.2 million, up $65.9 million or 27% from the prior year. The increase was mainly due to a reduction in inventory ($51.3 million), lower income taxes paid ($95.4 million) and managing vendor payment terms ($15.3 million), partially offset by lower earnings from operations. |
| • | Net cash from operating activities before changes in working capital1 including discontinued operations for 2014 was $317.3 million ($0.84 per share1), up $11.7 million ($0.03 per share) or 4% from the prior year. |
| • | Over the past 12 months, the initiative to convert non-cash working capital accounts to cash has contributed over $50 million to the Company’s cash position. In 2015, the Company will continue to manage working capital, effectively balancing its liquidity position, while maintaining appropriate inventory levels to support operations. |
| • | Cash, cash equivalents and gold bullion (at market value) from continuing operations was $321.0 million at December 31, 2014, down $63.6 million since December 31, 2013. The Company received cash from operating activities ($312.2 million), proceeds on sale and leaseback arrangements ($31.5 million) and net repayments from related parties ($14.7 million). The Company used cash for capital expenditures on property, plant and equipment and exploration and evaluation assets ($376.7 million), dividends to non-controlling interests and interest paid ($26.8 million). Cash held by the discontinued operations was $12.0 million. |
| • | Revenues from continuing operations for 2014 were $1,007.9 million, up $60.4 million or 6% from the prior year. The increase was a result of higher gold sales of 122,000 ounces ($163.3 million) primarily attributable to the completion of the expansion at Essakane and achievement of commercial production at Westwood, partially offset by lower sales from Mouska, as operations ceased in the third quarter 2014. This increase was partially offset by lower realized gold prices ($103.7 million). Revenues from continuing operations for the fourth quarter 2014 were $272.5 million, up $77.4 million or 40% from the same prior year period mainly due to higher gold ounces sold, partially offset by lower realized gold prices. |
| • | Cost of sales from continuing operations for 2014 were $892.9 million, up $224.4 million or 34% from the prior year as a result of increased production at Essakane ($102.5 million), the commencement of commercial production at Westwood ($50.9 million), higher operating costs for harder rock and lower capitalized stripping at Rosebel ($56.6 million) and higher depreciation expenses ($61.2 million). The increase was partially offset by the closure of Mouska ($40.6 million) and lower royalties driven by lower realized gold prices ($3.3 million). Cost of sales for the fourth quarter 2014 was up $77.7 million or 48% from the same prior year period mainly due to higher production volumes and depreciation. |
| • | The depreciation expense in 2014 was $205.0 million, up 43% from the prior year. This is primarily a result of the commencement of commercial production at Westwood in the third quarter 2014, Essakane’s commissioning of the expanded milling facilities and higher amortization of capitalized stripping at Essakane and Rosebel. |
| • | Income tax expense for the year was $117.9 million, of which $113.7 million was deferred. With losses from continuing operations prior to income taxes for the year, it would be reasonable to expect an income tax benefit rather than an income tax expense. However, the Company had significant loss carry forwards valued at $76.0 million that were recorded as a deferred tax asset, and with the sale of Niobec the Company no longer had the benefit of the projected future taxable income that would have offset taxable losses in Canada. Accordingly, the Company wrote off the entire asset in the third quarter in accordance with IFRS. This resulted in a non-cash deferred tax expense. In addition, the strengthening U.S. dollar reduced the tax base of mining assets in foreign jurisdictions that had the effect of lowering future tax deductions when translated into U.S. dollars, and higher mining duty tax rates and other tax related adjustments also contributed to the deferred tax expense totaling $113.7 million. These are non-cash items and the write off of the asset is not indicative of the economic value of the underlying tax pools that may be used to reduce cash income taxes in the future. |
| • | Net losses from continuing operations attributable to equity holders for 2014 were $269.5 million, or $0.72 per share, an improvement of $593.1 million, or $1.57 per share, from the prior year. This improvement mainly related to the non-recurrence of the prior year impairment charges on goodwill and mining assets ($888.1 million) and marketable securities and associates ($72.5 million), higher revenues ($60.4 million), lower write-down of receivables ($54.6 million), lower share of net losses from investments in associates and joint ventures ($41.2 million), and lower exploration expense ($26.5 million). This is partially offset by the increased cost in estimates of asset retirement obligations at closed sites ($57.5 million), net derivative losses ($48.5 million), and higher cost of sales and income tax expense as noted above. Net losses from continuing operations attributable to equity holders for the fourth quarter 2014 were $148.7 million, compared to net losses of $843.8 million for the same prior year period. This improvement mainly related to the drivers discussed above. |
| • | Adjusted net earnings including discontinued operations attributable to equity holders1 for 2014 were $32.8 million ($0.09 per share), down $104.5 million ($0.27 per share) from the prior year. Adjusted net earnings including discontinued operations attributable to equity holders for the fourth quarter 2014 were $10.2 million ($0.03 per share), down $9.5 million ($0.02 per share) from the same prior year period. |
| 1 | This is a non-GAAP measure. Refer to the non-GAAP performance measures section of the MD&A. |
IAMGOLD CORPORATION
ANNUAL MANAGEMENT’S DISCUSSION AND ANALYSIS – DECEMBER 31, 2014
PAGE 3
| • | Net earnings for Niobec were presented separately as net earnings from discontinued operations, net of tax in the consolidated statements of earnings. Comparative periods have been adjusted accordingly. Net earnings from discontinued operations for 2014 were $62.7 million, up $32.6 million or 108% from the prior year. The increase was a result of higher sales, improved grades, lower costs due to improved operational efficiencies and the favourable impact of a stronger U.S. dollar relative to the Canadian dollar at Niobec. |
OPERATIONS
| • | Regarding health and safety, the frequency of all types of serious injuries (measured as DART rate6) for 2014 was 0.66 compared to 1.01 for the prior year, representing a 35% improvement. The Company deeply regretted to report the death of an employee at the Rosebel operations during the second quarter 2014. |
GOLD
| • | In 2014, attributable gold production, inclusive of joint venture operations, was 844,000 ounces, up 9,000 ounces from the prior year. Gold production was higher mainly due to increased throughput of higher grade ore at Essakane as a result of the expanded plant (82,000 ounces) and the ramp-up of production at Westwood (7,000 ounces). This was partially offset by the closure of Mouska (51,000 ounces), winding down of operations at Yatela (16,000 ounces), lower grades at Rosebel (11,000 ounces), and lower grades at Sadiola (2,000 ounces). Attributable gold production, inclusive of joint venture operations, for the fourth quarter 2014, was up 46,000 ounces or 24% from the same prior year period mainly due to higher grades at Essakane and Rosebel. |
| • | Attributable gold sales, inclusive of joint venture operations, for 2014 was 835,000 ounces, compared to attributable gold commercial production of 834,000 ounces. The variance of 1,000 ounces is due to a decrease in the gold inventory at Rosebel (7,000 ounces), the depletion of remaining gold doré at Mouska (4,000 ounces) and timing of sales at Sadiola (1,000 ounces), partially offset by the timing of sales at Essakane (6,000 ounces) and Westwood (5,000 ounces). Attributable gold sales, inclusive of joint venture operations, for the fourth quarter 2014, was up 61,000 ounces or 35% from the same prior year period mainly due to the recognition of Westwood sales, increased production at Essakane and Rosebel, partially offset by the closure of Mouska in 2014 and the winding down of production from the joint venture operations. |
| • | Total cash costs1,2 - gold mines4 for 2014 were $848 per ounce produced, up 6% from the prior year. The increase was mainly due to the increased proportions of hard rock processed at Rosebel and Essakane. This was partially offset by the sustained benefits from the Company’s cost reduction program. Total cash costs - gold mines for the fourth quarter 2014 was $788 per ounce produced, down $40 or 5% from the same prior year period, mainly due to a higher proportion of production from the lower cost owner-operator sites. |
| • | All-in sustaining costs1,3 - gold mines for 2014 were $1,101 per ounce sold, down 10% from the prior year. The decrease was mainly a result of lower sustaining capital. All-in sustaining costs - gold mines for the fourth quarter 2014 were $1,021 per ounce sold, down 17% from the same prior year period. The decrease was mainly a result of lower sustaining capital. |
| • | All-in sustaining costs - total5 for 2014 were $992 per ounce sold, down 13% from the prior year. This measure includes the impact of the Niobec operating margin1 and its sustaining capital expenditures. |
NIOBIUM
| • | Niobium (disclosed as discontinued operations) production for 2014 was 5.6 million kilograms, up 6% from the prior year. The operating margin per kilogram of niobium1 for 2014 increased by 11% compared to the prior year to $20 per kilogram, as the operating costs benefited from increased production levels and the continued benefits of the cost reduction program and the favourable impact of a stronger U.S. dollar relative to the Canadian dollar. For the fourth quarter 2014, niobium production from discontinued operations was 6% lower than the same prior year period and there was no change in the operating margin. |
SUMMARY OF FINANCIAL AND OPERATING RESULTS
| Financial Position from continuing operations ($ millions) |
December 31, 2014 | December 31, 2013 | ||||||
| Cash, cash equivalents, and gold bullion |
||||||||
| at market value |
$ | 321.0 | $ | 384.6 | ||||
| at cost |
$ | 255.4 | $ | 319.2 | ||||
| Total assets |
$ | 4,222.8 | $ | 4,190.4 | ||||
| Long-term debt |
$ | 641.7 | $ | 640.3 | ||||
| Available credit facilities |
$ | 500.0 | $ | 750.0 | ||||
| 1 | This is a non-GAAP measure. Refer to the non-GAAP performance measures section of the MD&A. |
| 2 | The total cash costs computation does not include Westwood pre-commercial production for the year ended December 31, 2014 of 10,000 ounces, and for the three months and year ended December 31, 2013 of 20,000 and 73,000 ounces, respectively. |
| 3 | The Company, in the third quarter 2014, began including the income from its Diavik royalty as an offset to operating costs in the calculation of this measure. Previous periods were revised for comparability. |
| 4 | Gold mines, as used with total cash costs and all-in sustaining costs, consist of Rosebel, Essakane, Westwood (commercial production), Mouska, Sadiola and Yatela on an attributable basis. |
| 5 | Total, as used with all-in sustaining costs, includes the impact of niobium contribution, which is classified as discontinued operations, defined as the Niobec operating margin and its sustaining capital, on a per gold ounce sold basis. Refer to the all-in sustaining costs table in the non-GAAP performance measures section of the MD&A. |
| 6 | The DART rate refers to the number of days away, restricted duty or job transfer incidents that occur per 100 employees. |
IAMGOLD CORPORATION
ANNUAL MANAGEMENT’S DISCUSSION AND ANALYSIS – DECEMBER 31, 2014
PAGE 4
| Three months ended December 31, |
Years ended December 31, |
|||||||||||||||
| Financial Results ($ millions, except where noted) |
2014 | 2013 | 2014 | 2013 | ||||||||||||
| Continuing Operations |
||||||||||||||||
| Revenues |
$ | 272.5 | $ | 195.1 | $ | 1,007.9 | $ | 947.5 | ||||||||
| Cost of sales |
$ | 239.5 | $ | 161.8 | $ | 892.9 | $ | 668.5 | ||||||||
| Earnings from continuing mining operations1 |
$ | 33.0 | $ | 33.3 | $ | 115.0 | $ | 279.0 | ||||||||
|
|
|
|
|
|
|
|
|
|||||||||
| Net losses including discontinued operations attributable to equity holders of IAMGOLD |
$ | (122.0 | ) | $ | (840.3 | ) | $ | (206.8 | ) | $ | (832.5 | ) | ||||
| Net losses including discontinued operations attributable to equity holders of IAMGOLD per share ($/share) |
$ | (0.32 | ) | $ | (2.23 | ) | $ | (0.55 | ) | $ | (2.21 | ) | ||||
|
|
|
|
|
|
|
|
|
|||||||||
| Adjusted net earnings including discontinued operations attributable to equity holders of IAMGOLD1 |
$ | 10.2 | $ | 19.7 | $ | 32.8 | $ | 137.3 | ||||||||
| Adjusted net earnings including discontinued operations per share ($/share)1 |
$ | 0.03 | $ | 0.05 | $ | 0.09 | $ | 0.36 | ||||||||
|
|
|
|
|
|
|
|
|
|||||||||
| Net cash from operating activities including discontinued operations |
$ | 72.0 | $ | 44.0 | $ | 312.2 | $ | 246.3 | ||||||||
| Net cash from operating activities before changes in working capital including discontinued operations1 |
$ | 93.7 | $ | 54.7 | $ | 317.3 | $ | 305.6 | ||||||||
| Net cash from operating activities before changes in working capital including discontinued operations ($/share)1 |
$ | 0.25 | $ | 0.15 | $ | 0.84 | $ | 0.81 | ||||||||
|
|
|
|
|
|
|
|
|
|||||||||
| Net earnings from discontinued operations attributable to equity holders of IAMGOLD |
$ | 26.7 | $ | 3.5 | $ | 62.7 | $ | 30.1 | ||||||||
| Net earnings from discontinued operations attributable to equity holders of IAMGOLD ($/share) |
$ | 0.07 | $ | 0.01 | $ | 0.17 | $ | 0.08 | ||||||||
|
|
|
|
|
|
|
|
|
|||||||||
| Key Operating Statistics |
||||||||||||||||
| Gold sales - attributable (000s oz) |
234 | 173 | 835 | 740 | ||||||||||||
| Gold commercial production - attributable (000s oz) |
241 | 175 | 834 | 762 | ||||||||||||
| Gold production - attributable2 (000s oz) |
241 | 195 | 844 | 835 | ||||||||||||
|
|
|
|
|
|
|
|
|
|||||||||
| Average realized gold price1 ($/oz) |
$ | 1,201 | $ | 1,273 | $ | 1,259 | $ | 1,399 | ||||||||
| Total cash costs1,3,4 - gold mines5 ($/oz) |
$ | 788 | $ | 828 | $ | 848 | $ | 801 | ||||||||
| Gold margin1 ($/oz) |
$ | 413 | $ | 445 | $ | 411 | $ | 598 | ||||||||
|
|
|
|
|
|
|
|
|
|||||||||
| All-in sustaining costs1,4,6 - gold mines ($/oz) |
$ | 1,021 | $ | 1,230 | $ | 1,101 | $ | 1,222 | ||||||||
| All-in sustaining costs - total7 ($/oz) |
$ | 938 | $ | 1,113 | $ | 992 | $ | 1,143 | ||||||||
|
|
|
|
|
|
|
|
|
|||||||||
| Discontinued operations |
||||||||||||||||
| Niobium production (millions of kg Nb) |
1.5 | 1.6 | 5.6 | 5.3 | ||||||||||||
| Niobium sales (millions of kg Nb) |
1.5 | 1.3 | 5.8 | 4.9 | ||||||||||||
| Operating margin1 ($/kg Nb) |
$ | 20 | $ | 20 | $ | 20 | $ | 18 | ||||||||
|
|
|
|
|
|
|
|
|
|||||||||
| 1 | This is a non-GAAP measure. Refer to the non-GAAP performance measures section of the MD&A. |
| 2 | Attributable gold production includes Westwood pre-commercial production for the year ended December 31, 2014 of 10,000 ounces, and for the three months and year ended December 31, 2013 of 20,000 ounces and 73,000 ounces, respectively. |
| 3 | The total cash costs computation does not include Westwood pre-commercial production for the year ended December 31, 2014 of 10,000 ounces, and for the three months and year ended December 31, 2013 of 20,000 and 73,000 ounces, respectively. |
| 4 | By-product credits are included in the calculation of this measure; refer to the non-GAAP performance measures section of the MD&A for the reconciliation to GAAP. |
| 5 | Gold mines, as used with total cash costs and all-in sustaining costs, consist of Rosebel, Essakane, Westwood (commercial production), Mouska, Sadiola and Yatela on an attributable basis. |
| 6 | The Company, in the third quarter 2014, began including the income from its Diavik royalty as an offset to operating costs in the calculation of this measure. Previous periods were revised for comparability. |
| 7 | Total, as used with all-in sustaining costs, includes the impact of niobium contribution, which is classified as discontinued operations, defined as the Niobec operating margin and sustaining capital, on a per gold ounce sold basis. Refer to the all-in sustaining costs table in the non-GAAP performance measures section of the MD&A. |
IAMGOLD CORPORATION
ANNUAL MANAGEMENT’S DISCUSSION AND ANALYSIS – DECEMBER 31, 2014
PAGE 5
Effective at December 31, 2014, the Company reduced its gold price per ounce assumption for estimating mineral reserves by $100, as compared to 2013, to $1,300 in line with current industry trends and prudent business practices. This, along with other factors in the estimation process, has contributed to a decrease in total proven and probable mineral reserves.
| IAMGOLD’s Share1 |
2014 | 2013 | ||||||
| Gold (000s attributable oz contained) |
||||||||
| Total proven and probable mineral reserves |
8,608 | 10,127 | ||||||
| Total measured and indicated mineral resources2,3 |
21,412 | 23,408 | ||||||
| Total inferred resources |
7,018 | 6,299 | ||||||
|
|
|
|
|
|||||
| 1 | On January 22, 2015, the Company announced that it had closed the sale of Niobec, which included the total rare earth oxides (“TREO”). As such, the Company will no longer report niobium reserves or resources or TREO for Niobec. |
| 2 | Measured and indicated gold resources are inclusive of proven and probable reserves. |
| 3 | In mining operations, measured and indicated resources that are not mineral reserves are considered uneconomic at the price used for reserves estimations, but are deemed to have a reasonable prospect of economic extraction. |
Assumptions used to determine reserves and resources are as follows:
| 2014 | 2013 | |||||||
| Weighted average gold price used for: |
||||||||
| Gold reserves ($/oz) |
1,263 | 1 | 1,357 | 3 | ||||
| Gold resources ($/oz) |
1,510 | 2 | 1,540 | 4 | ||||
|
|
|
|
|
|||||
| Foreign exchange rate (C$/US$) |
1.10 | 1.10 | ||||||
|
|
|
|
|
|||||
| 1 | Mineral reserves have been estimated at December 31, 2014 using a gold price of $1,300 per ounce for Rosebel, Westwood and Essakane and $1,100 per ounce for Sadiola. |
| 2 | Mineral resources have been estimated at December 31, 2014, using a gold price of $1,500 per ounce for Côté Gold project, Boto project, Pitangui project, Essakane, Rosebel and Westwood, and $1,600 per ounce for Sadiola. A cut-off of 6.0 g/t Au over a minimum thickness of 2 meters was used for Westwood. |
| 3 | Mineral reserves have been estimated at December 31, 2013, using a gold price of $1,400 per ounce for Westwood, Rosebel and Essakane, $1,100 per ounce for Sadiola and $1,300 per ounce for Mouska. |
| 4 | Mineral resources have been estimated at December 31, 2013, using a gold price of $1,300 per ounce for Mouska with a foreign exchange rate of 1.10C$/U.S.$, $1,600 per ounce for Sadiola, Yatela and Doyon and $1,500 per ounce for Rosebel and Essakane. A cut-off of 6.0 g/t Au over a minimum thickness of 2 metres was used for Westwood. |
During 2014, reserves and resources changed as follows:
| • | Total attributable proven and probable gold reserves decreased by 15% or 1.5 million ounces (net of depletion) to 8.6 million ounces of gold at the end of 2014, mainly due to general mine depletion not compensated by the addition of new reserves at Rosebel, Essakane and Westwood (0.8 million ounces), economic and geotechnical parameters at Rosebel (0.7 million ounces), and the use of a lower gold price per ounce assumption to estimate reserves at owner-operated sites (0.4 million ounces). This was partially offset by positive economic parameters at Sadiola (0.3 million ounces) and a transfer of resources at Westwood (0.1 million ounces). The weighted average gold price assumption used to determine mineral reserves as at December 31, 2014 was $1,263 per ounce compared to $1,357 per ounce as at December 31, 2013. |
| • | Total attributable measured and indicated gold resources (inclusive of reserves) decreased by 9% or 2.0 million ounces to 21.4 million ounces of gold at the end of 2014, mainly due to the influence of economic parameters and depletion at Rosebel (1.6 million ounces) and Essakane (0.5 million ounces), partially offset by the addition of resources from the Boto project (0.1 million ounces) and Côté Gold project (0.1 million ounces). |
IAMGOLD CORPORATION
ANNUAL MANAGEMENT’S DISCUSSION AND ANALYSIS – DECEMBER 31, 2014
PAGE 6
| IAMGOLD Full Year Guidance3 |
2015 | |
| Rosebel (000s oz) |
290 - 300 | |
| Essakane (000s oz) |
360 - 370 | |
| Westwood (000s oz) |
110 - 130 | |
|
| ||
| Total owner-operated production (000s oz) |
760 - 800 | |
| Joint ventures (000s oz) |
60 | |
|
| ||
| Total attributable production (000s oz) |
820 - 860 | |
|
| ||
| Total cash costs1 - owner-operator ($/oz) |
$825 - $865 | |
| Total cash costs - gold mines2 ($/oz) |
$850 - $900 | |
|
| ||
| All-in sustaining costs1 - owner-operator ($/oz) |
$1,050 - $1,150 | |
| All-in sustaining costs - gold mines ($/oz) |
$1,075 - $1,175 | |
|
| ||
| 1 | This is a non-GAAP measure. Refer to the non-GAAP performance measures section of the MD&A. |
| 2 | Gold mines, as used with total cash costs and all-in sustaining costs, consist of Rosebel, Essakane, Westwood, Sadiola and Yatela on an attributable basis. |
| 3 | The outlook is based on 2015 full year assumptions with an average realized gold price of $1,250 per ounce, Canadian $/U.S.$ exchange rate of 1.15, U.S.$/€ exchange rate of 1.20 and average crude oil price of $73 per barrel. This considers consensus forecasted price and the Company’s hedging programs. |
GOLD PRODUCTION AND CASH COSTS
The Company expects 2015 attributable gold production to be in the range of 820,000 to 860,000 ounces. This reflects the ramp-up of production at Westwood and higher grades from hard rock ore processed at the expanded plant at Essakane, lower production at Rosebel due to a higher proportion of hard rock, and lower production at the joint ventures. Production is expected to be slightly lower in the first quarter and the fourth quarter compared to the second quarter and third quarter due to mine sequencing at Westwood. Total cash costs1 - gold mines for 2015 are expected to be within the range of $850 and $900 per ounce and total all-in sustaining costs1 - gold mines are expected to be in the range of $1,075 and $1,175 per ounce. This considers the positive impact from the reduction in the oil price and a stronger U.S. dollar. However, the growing proportion of harder ore at Rosebel and Essakane is expected to exert greater demand on crushing and grinding capacity, which in turn increases energy consumption and use of reagents.
ROSEBEL
The Company expects mining activity in 2015 to be comparable to 2014 with approximately 70% of the mining expected from the longer haul southern pits. Rosebel will continue to benefit from the use of engineered stockpiles which has provided significant improvements to the circuit stability and is resulting in reduced grinding media and reagent consumption, and stable power draw. Furthermore, the commissioning of the solar farm in 2014 will continue to yield power credits for Rosebel in 2015. Operational enhancements will continue and the Company will explore further opportunities to improve performance, manage grades and reduce unit production costs including initiatives in dilution reduction, mine-to-mill throughput enhancement, fuel and tire management through better road maintenance practices, and alternative processing such as heap leaching. Attributable production in 2015 is expected to be in the range of 290,000 to 300,000 ounces.
ESSAKANE
The Company expects production at Essakane to ramp up by approximately 10% in 2015 to achieve the designed capacity. The mining activity is expected to be higher with the mining of the Falagountou deposit to commence in 2015. In order to improve grades and maintain optimal throughput levels, Essakane will use one of its two processing lines to process 100% of the hard rock and the other for processing blended ore. The Company continues to implement operational enhancements to lower unit costs. Attributable production in 2015 is expected to be in the range of 360,000 and 370,000 ounces.
WESTWOOD
Production at Westwood will continue to ramp-up as the focus in 2015 continues to be on development activities and stope preparation. The Company plans to undertake approximately 18 km of lateral development and 5 km of vertical development in 2015. Although the mill is scheduled for continuous operation in 2015, production will be slightly lower in the first quarter and the fourth quarter compared to the second quarter and the third quarter due to mine development sequencing, which will offer flexibility to the mine over the ramp-up period. Total production in 2015 is expected to be in the range of 110,000 to 130,000 ounces.
DEPRECIATION EXPENSE
Depreciation expense, excluding Niobec, is expected to increase by about 40% in 2015 compared to 2014 as a result of a full year of commercial production at Westwood, higher amortization of capitalized stripping costs at Rosebel, lower reserves at Essakane and Rosebel, and expected timing of capital additions. Depreciation expense is expected to be in the range of $285 to $295 million.
| 1 | This is a non-GAAP measure. Refer to the non-GAAP performance measures section of the MD&A. |
IAMGOLD CORPORATION
ANNUAL MANAGEMENT’S DISCUSSION AND ANALYSIS – DECEMBER 31, 2014
PAGE 7
INCOME TAXES
The Company expects to pay cash taxes in the range of $17.0 million to $22.0 million for the twelve months ending December 31, 2015. In addition, adjustments to deferred tax assets and or liabilities may also be recorded during this period.
CAPITAL EXPENDITURES OUTLOOK1
The Company is budgeting capital expenditures of $230 million ± 10% in 2015. This represents an approximate 30% reduction from 2014.
| ($ millions) |
Sustaining | Development/ Expansion (Non-sustaining) |
Total | |||||||||
| Owner-operator |
||||||||||||
| Rosebel |
$ | 70 | $ | 10 | $ | 80 | ||||||
| Essakane |
55 | 5 | 60 | |||||||||
| Westwood |
30 | 50 | 80 | |||||||||
|
|
|
|
|
|
|
|||||||
| 155 | 65 | 220 | ||||||||||
| Côté Gold |
— | 5 | 5 | |||||||||
|
|
|
|
|
|
|
|||||||
| Total owner-operator |
155 | 70 | 225 | |||||||||
| Joint venture - Sadiola |
5 | — | 5 | |||||||||
|
|
|
|
|
|
|
|||||||
| Total (±10%) |
$ | 160 | $ | 70 | $ | 230 | ||||||
|
|
|
|
|
|
|
|||||||
| 1 | Capitalized borrowing costs are not included. |
GLOBAL FINANCIAL MARKET CONDITIONS
Macro divergences in the global economy created financial market instability in the global currency market in 2014. In the U.S., the Federal Reserve ended its $5 trillion in asset purchases in the fourth quarter 2014, as expected. However subsequently, there have been significant and surprising moves by other Central Banks. In January 2015, the Swiss National Bank reversed its policy to keep the Swiss Franc pegged at 1.20 to the Euro; the European Central Bank announced a greater than expected Euro 1.1 Trillion Quantitative Easing program beginning March 2015; and the Bank of Canada unexpectedly cut rates. Many of these moves were in response to falling commodity prices, led by the collapse of oil in late 2014 and the deflationary pressures this may cause. As a result, many key currencies including the Canadian dollar and the Euro fell drastically against the U.S. dollar.
Events and conditions in the global financial markets impact gold prices, commodity prices, interest rates and currency rates. These conditions and market volatilities may have a positive or negative impact on the Company’s revenues, operating costs, project development expenditures and project planning.
NIOBIUM MARKET
Demand for niobium has risen 12% year over year, mainly due to stronger steel production in developed countries. World steel production for 2014 was 1.2% higher than in 2013 due to rising production in North America, the European Union, the Middle East, China and Asia. The average realized sales price of $40.31/kg was stable in 2014 when compared to 2013.
GOLD MARKET
The consensus outlook on the price of gold for 2015 seems to have stabilized above $1,200 per ounce. During 2014, the price of gold traded within a $200 range through 2014, yet ended the year essentially unchanged from the end of 2013. The dominant view is that gold may react negatively to expected interest rates increases should the U.S. Federal Reserve begin to tighten monetary policy in 2015. However, the recent loosening of monetary policy by several Central Banks is countering this and lending support to a more constructive trend for the price of gold. Adding to this is the risk of geo-political events and the market response toward safe-haven assets like gold.
Another influencing factor on the price of gold is the cost of mining and producing gold. All-in sustaining costs (as defined by the World Gold Council) has averaged between $1,050 and $1,150 per ounce sold. It is becoming more expensive to mine gold and the price of gold is getting closer to the production cost for many companies. Eventually the supply demand dynamics will make it uneconomical to continue mining below this cost. As this happen, prices should recalibrate to reflect all-in sustaining costs for producers.
The market price of gold is a significant driver of the Company’s financial performance. Through 2014, the Company sold gold at an average price of $1,259 per ounce, just below the average market price of $1,266 per ounce.
IAMGOLD CORPORATION
ANNUAL MANAGEMENT’S DISCUSSION AND ANALYSIS – DECEMBER 31, 2014
PAGE 8
| Years ended December 31, | ||||||||
| 2014 | 2013 | |||||||
| Average market gold price ($/oz) |
$ | 1,266 | $ | 1,411 | ||||
| Average realized gold price1 ($/oz) |
$ | 1,259 | $ | 1,399 | ||||
| Closing market gold price ($/oz) |
$ | 1,206 | $ | 1,205 | ||||
| 1 | This is a non-GAAP measure. Refer to the non-GAAP performance measures section of the MD&A. |
CURRENCY AND OIL PRICE
The currency markets were relatively stable for most of 2014 until late in the year when currencies depreciated materially relative to the U.S. dollar. Some currencies like the Canadian dollar were vulnerable to the collapse in commodity prices - specifically oil - while others like the Euro were driven by more fundamental macro-economic conditions. The relative strength of the U.S. dollar accelerated in the early part of 2015 as several Central Banks eased domestic monetary policy.
The Company’s functional currency is the U.S. dollar. Substantially all of its revenue is in U.S. dollars as gold is priced in U.S. dollars. The Company’s main exposure is movements in the Canadian dollar and Euro against the U.S dollar, which have a direct impact on the Company’s Canadian mining activities and international operations. The Company anticipates $240 million of Canadian dollar exposure for 2015 related to its Canadian mining operation and corporate expenses. The Company forecasts an exposure of Euro 238 million for 2015 related to its mining operations in West Africa. The Company’s currency hedging strategy is designed to mitigate the exchange rate volatility of these currencies. Refer to financial condition - market risks section for more information.
The market price of oil fell dramatically in 2014. The average market price for West Texas Intermediate (WTI) crude oil was $93 per barrel in 2014, but closed the year at a price of $53 per barrel. In the fourth quarter 2014, prices fell as key producers like OPEC decided to not cut back on production while U.S. shale production contributed to the growing supply surplus. The increase in demand within the US market, due to an improving economic outlook, was not enough to off-set the supply surplus.
Oil is a key component of the Company’s cost structure. In 2014, the Company consumed an estimated 1.48 million barrels of oil and is expecting to consume approximately 1.48 million barrels of oil through 2015. The Company hedges the price volatility of its fuel costs by hedging the price of oil. Refer to financial condition - market risks section for more information.
| Years ended December 31, | ||||||||
| 2014 | 2013 | |||||||
| Average rates |
||||||||
| Canadian$ / U.S.$ |
1.1044 | 1.0299 | ||||||
| U.S.$ / € |
1.3284 | 1.3285 | ||||||
|
|
|
|
|
|||||
| Closing rates |
||||||||
| Canadian$ / U.S.$ |
1.1601 | 1.0636 | ||||||
| U.S.$ / € |
1.2101 | 1.3779 | ||||||
|
|
|
|
|
|||||
| Average market oil price ($/barrel) |
$ | 93 | $ | 98 | ||||
| Closing market oil price ($/barrel) |
$ | 53 | $ | 98 | ||||
|
|
|
|
|
|||||
SENSITIVITY IMPACT
The following table provides estimated sensitivities around certain inputs, excluding the impact of the Company’s hedging program that can affect the Company’s operating results, assuming expected 2015 production levels.
| Change of | Annualized impact on Total Cash Costs1 - Gold Mines3 by $/oz |
Annualized impact on All-in Sustaining Costs1 - Gold Mines3 by $/oz |
||||||||||
| Gold price2 |
$ | 100/oz | $ | 4/oz | $ | 4/oz | ||||||
| Oil price |
$ | 10/barrel | $ | 13/oz | $ | 14/oz | ||||||
| Canadian$ / U.S.$ |
$ | 0.10 | $ | 12/oz | $ | 19/oz | ||||||
| U.S.$ / € |
$ | 0.10 | $ | 12/oz | $ | 16/oz | ||||||
| 1 | This is a non-GAAP measure. Refer to the non-GAAP performance measures section of the MD&A. |
| 2 | Gold price sensitivities relate to royalty cost arrangements, which are included in total cash costs and all-in sustaining costs. |
| 3 | Gold mines, as used with total cash costs and all-in sustaining costs, consist of Rosebel, Essakane, Westwood (commercial production), Mouska, Sadiola and Yatela on an attributable basis. |
IAMGOLD CORPORATION
ANNUAL MANAGEMENT’S DISCUSSION AND ANALYSIS – DECEMBER 31, 2014
PAGE 9
| Attributable Gold Sales2 (000s oz) |
Average Realized Gold Price1 ($/oz) |
|||||||||||||||
| Years ended December 31, | Years ended December 31, | |||||||||||||||
| 2014 | 2013 | 2014 | 2013 | |||||||||||||
| Owner-operator |
739 | 627 | $ | 1,258 | $ | 1,397 | ||||||||||
| Joint ventures |
96 | 113 | $ | 1,263 | $ | 1,413 | ||||||||||
|
|
|
|
|
|
|
|
|
|||||||||
| 835 | 740 | $ | 1,259 | $ | 1,399 | |||||||||||
|
|
|
|
|
|
|
|
|
|||||||||
| 1 | This is a non-GAAP measure. Refer to the non-GAAP performance measures section of the MD&A. |
| 2 | Includes Rosebel and Essakane at 95% and 90%, respectively. |
The table below presents the gold production attributable to the Company along with the weighted average total cash costs per gold ounce produced and all-in sustaining costs per gold ounce sold.
| Gold Production (000s oz) |
Total Cash Costs1,2 ($ per gold ounce produced) |
All-in Sustaining Costs1 ($ per gold ounce sold) |
||||||||||||||||||||||
| Years ended December 31 |
2014 | 2013 | 2014 | 2013 | 2014 | 2013 | ||||||||||||||||||
| Continuing operations |
||||||||||||||||||||||||
| Owner-operator |
||||||||||||||||||||||||
| Rosebel (95%) |
325 | 336 | $ | 804 | $ | 718 | $ | 1,045 | $ | 1,063 | ||||||||||||||
| Essakane (90%) |
332 | 250 | 852 | 753 | 1,060 | 1,177 | ||||||||||||||||||
| Doyon division (100%) |
82 | 63 | 768 | 832 | 955 | 889 | ||||||||||||||||||
|
|
|
|
|
|
|
|
|
|
|
|
|
|||||||||||||
| 739 | 649 | 822 | 743 | 1,090 | 1,162 | |||||||||||||||||||
|
|
|
|
|
|
|
|
|
|
|
|
|
|||||||||||||
| Joint ventures |
||||||||||||||||||||||||
| Sadiola (41%) |
84 | 86 | 985 | 1,101 | 1,083 | 1,476 | ||||||||||||||||||
| Yatela (40%) |
11 | 27 | 1,590 | 1,243 | 1,929 | 1,789 | ||||||||||||||||||
|
|
|
|
|
|
|
|
|
|
|
|
|
|||||||||||||
| 95 | 113 | 1,055 | 1,136 | 1,182 | 1,551 | |||||||||||||||||||
|
|
|
|
|
|
|
|
|
|
|
|
|
|||||||||||||
| Total commercial operations |
834 | 762 | 848 | 801 | 1,101 | 1,222 | ||||||||||||||||||
|
|
|
|
|
|
|
|
|
|
|
|
|
|||||||||||||
| Doyon division (100%) |
10 | 73 | — | — | — | — | ||||||||||||||||||
|
|
|
|
|
|
|
|
|
|
|
|
|
|||||||||||||
| 844 | 835 | 848 | 801 | 1,101 | 1,222 | |||||||||||||||||||
|
|
|
|
|
|
|
|
|
|
|
|
|
|||||||||||||
| Cash costs, excluding royalties |
790 | 729 | ||||||||||||||||||||||
| Royalties |
58 | 72 | ||||||||||||||||||||||
|
|
|
|
|
|
|
|
|
|
|
|
|
|||||||||||||
| Total cash costs3 |
$ | 848 | $ | 801 | ||||||||||||||||||||
|
|
|
|
|
|
|
|
|
|
|
|
|
|||||||||||||
| All-in sustaining costs3,4 - gold mines5 |
1,101 | 1,222 | ||||||||||||||||||||||
| Including discontinued operations |
||||||||||||||||||||||||
| Niobium contribution6 |
(109 | ) | (79 | ) | ||||||||||||||||||||
|
|
|
|
|
|
|
|
|
|
|
|
|
|||||||||||||
| All-in sustaining costs - total7 |
$ | 992 | $ | 1,143 | ||||||||||||||||||||
|
|
|
|
|
|
|
|
|
|
|
|
|
|||||||||||||
| 1 | This is a non-GAAP measure. Refer to the non-GAAP performance measures section of the MD&A. |
| 2 | The total cash costs computation does not include Westwood pre-commercial production for the years ended December 31, 2014 and 2013 of 10,000 ounces and 73,000 ounces, respectively. |
| 3 | By-product credits are included in the calculation of this measure; refer to the non-GAAP performance measures section of the MD&A for the reconciliation to GAAP. |
| 4 | The Company, in the third quarter 2014, began including the income from its Diavik royalty as an offset to operating costs in the calculation of this measure. Previous periods were revised for comparability. |
| 5 | Gold mines, as used with total cash costs and all-in sustaining costs, consist of Rosebel, Essakane, Westwood (commercial production), Mouska, Sadiola and Yatela on an attributable basis. |
| 6 | Niobium contribution consists of the Niobec operating margin and sustaining capital on a per gold ounce sold basis. |
| 7 | Total, as used with all-in sustaining costs, includes the impact of niobium contribution, which is classified as discontinued operations, defined as the Niobec operating margin and sustaining capital, on a per gold ounce sold basis. Refer to the all-in sustaining costs table in the non-GAAP performance measures section of the MD&A. |
IAMGOLD CORPORATION
ANNUAL MANAGEMENT’S DISCUSSION AND ANALYSIS – DECEMBER 31, 2014
PAGE 10
CAPITAL EXPENDITURES1
| Three months ended December 31, |
Years ended December 31, |
|||||||||||||||
| ($ millions) |
2014 | 2013 | 2014 | 2013 | ||||||||||||
| Sustaining |
||||||||||||||||
| Continuing operations - Gold segments |
||||||||||||||||
| Rosebel2,3,7 |
$ | 11.5 | $ | 34.0 | $ | 58.9 | $ | 115.6 | ||||||||
| Essakane2,4 |
9.9 | 26.4 | 54.6 | 114.9 | ||||||||||||
| Westwood5 |
8.9 | — | 16.6 | — | ||||||||||||
|
|
|
|
|
|
|
|
|
|||||||||
| Total gold segments |
30.3 | 60.4 | 130.1 | 230.5 | ||||||||||||
| Corporate and other |
— | 1.2 | 1.8 | 4.9 | ||||||||||||
|
|
|
|
|
|
|
|
|
|||||||||
| Total capital expenditures, consolidated |
30.3 | 61.6 | 131.9 | 235.4 | ||||||||||||
| Joint ventures6 |
2.3 | 3.3 | 4.1 | 33.1 | ||||||||||||
|
|
|
|
|
|
|
|
|
|||||||||
| 32.6 | 64.9 | 136.0 | 268.5 | |||||||||||||
| Discontinued operations - Niobec |
10.9 | 5.8 | 22.8 | 30.8 | ||||||||||||
|
|
|
|
|
|
|
|
|
|||||||||
| $ | 43.5 | $ | 70.7 | $ | 158.8 | $ | 299.3 | |||||||||
|
|
|
|
|
|
|
|
|
|||||||||
| Development/Expansion (Non-sustaining) |
||||||||||||||||
| Continuing operations - Gold segments |
||||||||||||||||
| Rosebel |
$ | 6.3 | $ | 2.1 | $ | 20.7 | $ | 18.0 | ||||||||
| Essakane |
— | 30.0 | 32.7 | 171.0 | ||||||||||||
| Westwood |
9.6 | 15.4 | 73.9 | 118.1 | ||||||||||||
|
|
|
|
|
|
|
|
|
|||||||||
| Total gold segments |
15.9 | 47.5 | 127.3 | 307.1 | ||||||||||||
| Côté Gold |
2.7 | — | 10.9 | — | ||||||||||||
|
|
|
|
|
|
|
|
|
|||||||||
| Total capital expenditures, consolidated |
18.6 | 47.5 | 138.2 | 307.1 | ||||||||||||
| Joint ventures |
1.5 | 3.5 | 6.8 | 18.1 | ||||||||||||
|
|
|
|
|
|
|
|
|
|||||||||
| 20.1 | 51.0 | 145.0 | 325.2 | |||||||||||||
| Discontinued operations - Niobec |
2.6 | 9.7 | 21.2 | 44.1 | ||||||||||||
|
|
|
|
|
|
|
|
|
|||||||||
| $ | 22.7 | $ | 60.7 | $ | 166.2 | $ | 369.3 | |||||||||
|
|
|
|
|
|
|
|
|
|||||||||
| Total |
||||||||||||||||
| Continuing operations - Gold segments |
||||||||||||||||
| Rosebel |
$ | 17.8 | $ | 36.1 | $ | 79.6 | $ | 133.6 | ||||||||
| Essakane |
9.9 | 56.4 | 87.3 | 285.9 | ||||||||||||
| Westwood |
18.5 | 15.4 | 90.5 | 118.1 | ||||||||||||
|
|
|
|
|
|
|
|
|
|||||||||
| Total gold segments |
46.2 | 107.9 | 257.4 | 537.6 | ||||||||||||
| Corporate and other |
— | 1.2 | 1.8 | 4.9 | ||||||||||||
| Côté Gold |
2.7 | — | 10.9 | — | ||||||||||||
|
|
|
|
|
|
|
|
|
|||||||||
| Total capital expenditures, consolidated |
48.9 | 109.1 | 270.1 | 542.5 | ||||||||||||
| Joint ventures |
3.8 | 6.8 | 10.9 | 51.2 | ||||||||||||
|
|
|
|
|
|
|
|
|
|||||||||
| 52.7 | 115.9 | 281.0 | 593.7 | |||||||||||||
| Discontinued operations - Niobec |
13.5 | 15.5 | 44.0 | 74.9 | ||||||||||||
|
|
|
|
|
|
|
|
|
|||||||||
| $ | 66.2 | $ | 131.4 | $ | 325.0 | $ | 668.6 | |||||||||
|
|
|
|
|
|
|
|
|
|||||||||
| 1 | Capital expenditures are on the cash basis and capitalized borrowing costs are not included. |
| 2 | On an attributable basis, Rosebel (95%) and Essakane (90%) sustaining capital expenditures for the three months ended December 31, 2014 and 2013 were $10.9 million and $8.9 million, respectively, and for the years ended December 31, 2014 and 2013 were $56.0 million and $49.1 million, respectively. |
| 3 | Includes capitalized stripping at Rosebel for the three months ended December 31, 2014 and 2013 of $2.0 million and $21.7 million, respectively, and for the years ended December 31, 2014 and 2013 of $15.8 million and $28.9 million, respectively. |
| 4 | Includes capitalized stripping at Essakane for the three months ended December 31, 2014 and 2013 of $3.8 million and $17.5 million, respectively, and for the years ended December 31, 2014 and 2013 of $33.1 million and $78.6 million, respectively. |
| 5 | Excludes inventory and stockpile capitalized costs prior to commercial production. |
| 6 | Attributable capital expenditures of Sadiola (41%) and Yatela (40%). |
| 7 | Includes the impact of finance lease principal payments for the three months and year ended December 31, 2014. |
IAMGOLD CORPORATION
ANNUAL MANAGEMENT’S DISCUSSION AND ANALYSIS – DECEMBER 31, 2014
PAGE 11
CONTINUING OPERATIONS
Suriname – Rosebel Mine (IAMGOLD interest – 95%)
Summarized Results 100% Basis, unless otherwise stated
| Years ended December 31, | ||||||||
| 2014 | 2013 | |||||||
| Mine operating statistics |
||||||||
| Ore mined (000s t) |
13,851 | 13,508 | ||||||
| Waste mined (000s t) |
49,215 | 47,818 | ||||||
| Total material mined (000s t) |
63,066 | 61,326 | ||||||
| Strip ratio1 |
3.6 | 3.5 | ||||||
| Ore milled (000s t) |
13,050 | 12,349 | ||||||
| Head grade (g/t) |
0.86 | 0.94 | ||||||
| Recovery (%) |
95 | 95 | ||||||
| Gold production - 100% (000s oz) |
342 | 354 | ||||||
| Attributable gold production - 95% (000s oz) |
325 | 336 | ||||||
| Gold sales - 100% (000s oz) |
349 | 342 | ||||||
|
|
|
|
|
|||||
| Performance measures |
||||||||
| Average realized gold price2 ($/oz) |
$ | 1,256 | $ | 1,400 | ||||
| All-in sustaining costs2 ($/oz) |
$ | 1,045 | $ | 1,063 | ||||
| Cash costs2 excluding royalties ($/oz) |
$ | 732 | $ | 639 | ||||
| Royalties ($/oz) |
$ | 72 | $ | 79 | ||||
| Total cash costs2 ($/oz) |
$ | 804 | $ | 718 | ||||
|
|
|
|
|
|||||
| 1 | Strip ratio is calculated as waste mined divided by ore mined. |
| 2 | This is a non-GAAP measure. Refer to the non-GAAP performance measures section of the MD&A. |
Gold production for 2014 was 3% lower than the prior year primarily due to the impact of lower grades, partially offset by higher throughput. Gold grades were 9% lower than the prior year as a result of pit sequencing and due to differences compared to the block model. A grade control audit conducted in 2014 identified opportunities to improve grades. As a result of technical measures implemented from the aforementioned grade control audit, grades realized in the second half of the year improved 11% relative to the first half of 2014.
Gold sales were higher compared to the prior year despite lower gold production due to a decrease in gold inventory achieved through improved carbon handling and high elution strip efficiencies. Despite the proportion of soft rock decreasing to 38% in 2014 from 42% in 2013, throughput was 6% higher as the mine benefited from the optimization and stabilization of mill feed through the implementation of an engineered stockpile ahead of the primary crusher.
Total cash costs per ounce produced were 12% higher than the prior year primarily due to lower capitalized stripping and a favorable prior period adjustment recorded in the second quarter of 2013 to the power accrual reflecting updated contract parameters, partially offset by lower mine site administration costs, lower royalties resulting from a lower realized gold price and the positive contributions realized from achieving sustainable operational efficiencies. All-in sustaining costs per ounce sold in 2014 were 2% lower from 2013 mainly due to lower sustaining capital expenditures and higher sales volume partially offset by higher cash costs. Sustaining capital expenditures for 2014 were $58.9 million, a decrease of $56.7 million from 2013 primarily due to lower spending on mining equipment and capitalized stripping.
During 2014, sustaining capital expenditures of $58.9 million included capitalized stripping costs ($15.8 million), capital spares ($13.2 million), tailings dam raise ($6.9 million), mining equipment ($5.5 million), resource development ($5.1 million), geotechnical engineering ($4.2 million), pit optimization ($3.2 million), and various other sustaining capital ($5.0 million).
Outlook
Rosebel’s attributable production in 2015 is expected to be between 290,000 and 300,000 ounces due to the processing of lower proportions of soft rock with a lower average grade. Capital expenditures are expected to be approximately $80.0 million, comprised of $70.0 million for sustaining capital and $10.0 million for non-sustaining. Sustaining capital includes capitalized stripping ($20.0 million), capital spares ($18.0 million), mobile equipment ($9.0 million), tailings dam raise ($6.0 million), resource development ($4.0 million) and other sustaining capital ($13.0 million). Non-sustaining capital includes the tailings dam expansion ($10.0 million).
IAMGOLD CORPORATION
ANNUAL MANAGEMENT’S DISCUSSION AND ANALYSIS – DECEMBER 31, 2014
PAGE 12
Burkina Faso – Essakane Mine (IAMGOLD interest – 90%)
Summarized Results 100% Basis, unless otherwise stated
| Years ended December 31, | ||||||||
| 2014 | 2013 | |||||||
| Mine operating statistics |
||||||||
| Ore mined (000s t) |
12,580 | 11,869 | ||||||
| Waste mined (000s t) |
34,118 | 33,263 | ||||||
| Total material mined (000s t) |
46,698 | 45,132 | ||||||
| Strip ratio1 |
2.7 | 2.8 | ||||||
| Ore milled (000s t) |
11,897 | 10,613 | ||||||
| Head grade (g/t) |
1.08 | 0.89 | ||||||
| Recovery (%) |
91 | 92 | ||||||
| Gold production - 100% (000s oz) |
369 | 277 | ||||||
| Attributable gold production - 90% (000s oz) |
332 | 250 | ||||||
| Gold sales - 100% (000s oz) |
363 | 270 | ||||||
|
|
|
|
|
|||||
| Performance measures |
||||||||
| Average realized gold price2 ($/oz) |
$ | 1,261 | $ | 1,408 | ||||
| All-in sustaining costs2 ($/oz) |
$ | 1,060 | $ | 1,177 | ||||
| Cash costs2 excluding royalties ($/oz) |
$ | 799 | $ | 687 | ||||
| Royalties ($/oz) |
$ | 53 | $ | 66 | ||||
| Total cash costs2 ($/oz) |
$ | 852 | $ | 753 | ||||
|
|
|
|
|
|||||
| 1 | Strip ratio is calculated as waste mined divided by ore mined. |
| 2 | This is a non-GAAP measure. Refer to the non-GAAP performance measures section of the MD&A. |
Gold production for 2014 was 33% higher than the prior year due to the completion of a plant expansion in early 2014, which allowed for increased throughput and higher grades realized from processing higher proportions of hard and transition rock. As a result, soft rock comprised of 25% of the mill feed in 2014 compared to 42% in 2013. Proportions of soft rock steadily declined over the year and represented 11% of the mill feed in the second half of 2014, down from 36% in the first half of the year.
Total cash costs per ounce produced in 2014 were 13% higher compared to the prior year mainly due to the impact of reduced capitalized stripping and an increased consumption of fuels, partially offset by lower royalties driven by lower gold prices. All-in sustaining costs per ounce sold during the current year were 10% lower compared to 2013 mainly due to lower sustaining capital spending and higher gold sales volumes partially offset by higher cash costs. Sustaining capital expenditures for 2014 were $54.6 million, a decrease of $60.3 million from 2013. The decrease is primarily due to lower capitalized stripping and a decrease in spending on mining equipment and resource development.
During 2014, sustaining capital expenditures of $54.6 million included capitalized stripping costs ($33.1 million), capital spares ($7.7 million), resource development ($6.5 million), mine equipment ($2.3 million) and various other sustaining capital expenditures ($5.0 million).
Outlook
Essakane’s attributable production in 2015 is expected to be between 360,000 and 370,000 ounces due to the benefit of a full year of production from the expanded plant allowing for increased processing of higher grade hard rock. Capital expenditures are expected to be approximately $60.0 million in total, which includes sustaining capital of $55.0 million and non-sustaining capital of $5.0 million. Sustaining capital includes capitalized stripping ($20.0 million), capital spares ($10.0 million), generator overhaul ($5.0 million), mobile equipment ($4.0 million), resource development ($3.0 million) and other sustaining capital ($13.0 million).
IAMGOLD CORPORATION
ANNUAL MANAGEMENT’S DISCUSSION AND ANALYSIS – DECEMBER 31, 2014
PAGE 13
Canada – Doyon Division (IAMGOLD interest – 100%)
Summarized Results
| Years ended December 31, | ||||||||
| 2014 | 2013 | |||||||
| Westwood operating statistics |
||||||||
| Ore mined (000s t) |
327 | 233 | ||||||
| Ore milled (000s t) |
328 | 326 | ||||||
| Head grade (g/t) |
7.98 | 7.45 | ||||||
| Recovery (%) |
95 | 94 | ||||||
| Pre-commercial gold production - 100% (000s oz) |
10 | 73 | ||||||
| Pre-commercial gold sales - 100% (000s oz) |
11 | 66 | ||||||
| Commercial gold production - 100% (000s oz) |
70 | — | ||||||
| Commercial gold sales - 100% (000s oz) |
65 | — | ||||||
|
|
|
|
|
|||||
| Westwood performance measures |
||||||||
| Average realized gold price1 ($/oz) |
$ | 1,237 | — | |||||
| All-in sustaining costs1 ($/oz) |
$ | 1,031 | — | |||||
| Cash costs1 excluding royalties ($/oz) |
$ | 822 | — | |||||
| Royalties ($/oz) |
$ | — | — | |||||
| Total cash costs1 ($/oz) |
$ | 822 | — | |||||
|
|
|
|
|
|||||
Westwood achieved commercial production effective July 1, 2014. Mine production continued to ramp-up in 2014. Gold production in 2014 increased to 80,000 ounces compared to 73,000 ounces in the prior year. Production in the second half of 2014 of 70,000 ounces were considered commercial production compared to none in 2013. During 2014, sustaining capital expenditures of $16.6 million included underground development ($9.8 million), fixed equipment ($2.3 million), resource development ($1.2 million) and various other sustaining capital expenditures ($3.3 million).
On January 22, 2015, Westwood experienced a localized rock burst. A news release was issued to assure the local community and investors that there were no injuries and that there was no impact to current and future production.
Outlook
Westwood’s production in 2015 is expected to be between 110,000 and 130,000 ounces which represents a full year of mining and milling operations. Capital expenditures are expected to be approximately $80.0 million, comprised of capitalized development ($57.0 million), mobile and underground equipment ($11.0 million), underground construction ($9.0 million) and development drilling ($3.0 million). Non-sustaining capital of $50.0 million included above relates to the ramp-up to full production design levels in mining blocks that are not expected to be in production in the near term.
| Years ended December 31, | ||||||||
| 2014 | 2013 | |||||||
| Mouska operating statistics |
||||||||
| Ore mined (000s t) |
27 | 76 | ||||||
| Ore milled (000s t) |
27 | 150 | ||||||
| Head grade (g/t) |
15.10 | 14.39 | ||||||
| Recovery (%) |
92 | 92 | ||||||
| Gold production - 100% (000s oz) |
12 | 63 | ||||||
| Gold sales - 100% (000s oz) |
16 | 59 | ||||||
|
|
|
|
|
|||||
| Mouska performance measures |
||||||||
| Average realized gold price1 ($/oz) |
$ | 1,303 | $ | 1,330 | ||||
| All-in sustaining costs1 ($/oz) |
$ | 645 | $ | 889 | ||||
| Cash costs1 excluding royalties ($/oz) |
$ | 425 | $ | 802 | ||||
| Royalties ($/oz) |
$ | 28 | $ | 30 | ||||
| Total cash costs1 ($/oz) |
$ | 453 | $ | 832 | ||||
|
|
|
|
|
|||||
| 1 | This is a non-GAAP measure. Refer to the non-GAAP performance measures section of the MD&A. |
IAMGOLD CORPORATION
ANNUAL MANAGEMENT’S DISCUSSION AND ANALYSIS – DECEMBER 31, 2014
PAGE 14
Mining and milling operations at Mouska ceased in 2014 as the mine reached end of life. All ore stockpiles have been depleted, the balance of the gold doré inventory was sold and the assets derecognized in the third quarter 2014.
Mali – Sadiola Mine (IAMGOLD interest – 41%)
Summarized Results 41% Basis
| Years ended December 31, | ||||||||
| 2014 | 2013 | |||||||
| Mine operating statistics |
||||||||
| Total material mined (000s t) |
5,044 | 13,344 | ||||||
| Ore milled (000s t) |
2,061 | 1,991 | ||||||
| Head grade (g/t) |
1.32 | 1.38 | ||||||
| Recovery (%) |
93 | 91 | ||||||
| Attributable gold production - (000s oz) |
84 | 86 | ||||||
| Attributable gold sales - (000s oz) |
85 | 86 | ||||||
|
|
|
|
|
|||||
| Performance measures |
||||||||
| Average realized gold price1 ($/oz) |
$ | 1,263 | $ | 1,404 | ||||
| All-in sustaining costs1 ($/oz) |
$ | 1,083 | $ | 1,476 | ||||
| Total cash costs1 ($/oz) |
$ | 985 | $ | 1,101 | ||||
|
|
|
|
|
|||||
| 1 | This is a non-GAAP measure. Refer to the non-GAAP performance measures section of the MD&A. |
Attributable gold production for 2014 was 2% lower compared to the prior year, driven by lower grades and partially offset by higher throughput and recoveries.
Total cash costs per ounce produced were 11% lower compared to the prior year, primarily as a result of a significant decrease in mining activity compared to the prior year. All-in sustaining costs per ounce sold were 27% lower compared to the prior year due to lower cash costs and lower sustaining capital expenditures. During 2014 attributable sustaining capital expenditures were $3.9 million, a decrease of $26.2 million from prior year mainly due to a decrease in capitalized stripping.
Mali – Yatela Mine (IAMGOLD interest – 40%)
Summarized Results 40% Basis
The Yatela mine produced and sold 11,000 ounces in 2014, compared to 27,000 ounces in the prior year as operations continue to wind down. Minimal stacking activity took place in the fourth quarter 2014.
DISCONTINUED OPERATIONS
Canada – Niobec Mine (IAMGOLD interest – 100%)
Summarized Results
| Years ended December 31, | ||||||||
| 2014 | 2013 | |||||||
| Mine operating statistics |
||||||||
| Ore mined (000s t) |
2,355 | 2,381 | ||||||
| Ore milled (000s t) |
2,374 | 2,348 | ||||||
| Grade (% Nb205) |
0.58 | 0.56 | ||||||
| Niobium production (millions of kg Nb) |
5.6 | 5.3 | ||||||
| Niobium sales (millions of kg Nb) |
5.8 | 4.9 | ||||||
| Operating margin1($/kg Nb) |
$ | 20 | $ | 18 | ||||
| 1 | This is a non-GAAP measure. Refer to the non-GAAP performance measures section of the MD&A. |
Niobec is presented as an asset held for sale based on the Company’s announcement on October 3, 2014 that an agreement to divest of the mine had been reached. Net earnings of Niobec are disclosed as discontinued operations in the consolidated statements of earnings. The assets and liabilities are classified as held for sale in the consolidated balance sheets since the relevant criteria has been met.
IAMGOLD CORPORATION
ANNUAL MANAGEMENT’S DISCUSSION AND ANALYSIS – DECEMBER 31, 2014
PAGE 15
Niobium production in 2014 was a record 5.6 million kilograms, 6% higher than the prior year mainly as a result of improved grades and recoveries.
Niobium revenues in 2014 were 17% higher than the prior year due to an 18% increase in sales volume. The operating margin in 2014 was 11% higher than prior year as a result of the benefit of improved grades as well as decreased costs due to improved operational efficiencies and the impact of a stronger U.S. dollar relative to the Canadian dollar.
During 2014, sustaining capital expenditures were $22.8 million, including underground infrastructure ($9.0 million), underground development ($8.7 million), surface maintenance ($3.0 million) and other sustaining capital ($2.1 million).
DEVELOPMENT AND EXPANSION PROJECTS
| Years ended December 31, | ||||||||
| ($ millions) |
2014 | 2013 | ||||||
| Continuing operations |
||||||||
| Rosebel |
$ | 20.7 | $ | 18.0 | ||||
| Essakane |
32.7 | 171.0 | ||||||
| Westwood |
73.9 | 118.1 | ||||||
|
|
|
|
|
|||||
| Total gold segments |
127.3 | 307.1 | ||||||
| Joint venture - expansion - Sadiola sulphide project (41%) |
6.8 | 18.1 | ||||||
|
|
|
|
|
|||||
| 134.1 | 325.2 | |||||||
| Discontinued operations |
||||||||
| Niobec |
21.2 | 44.1 | ||||||
|
|
|
|
|
|||||
| Total capitalized development and expansion expenditures |
$ | 155.3 | $ | 369.3 | ||||
|
|
|
|
|
|||||
ROSEBEL
On January 21, 2014, the Company announced that the full expansion of Rosebel was deferred.
The 5 megawatt solar farm project started during the first quarter 2014 was connected to the Suriname grid during the third quarter 2014 and is now operational. During the year $9.5 million of costs were capitalized and designated as expansion capital as the project was necessary to fulfill the energy strategy of the Company and ensure sufficient power to supply the planned future mine expansion.
During the year a total of $11.2 million was spent on the tailings pond expansion related to earthworks on the northeast dam, ongoing pumping and piping upgrades required to transfer tailings to the new containment area. Over the past ten years of operations, increasing ore reserves and a series of expansions that have increased the throughput capacity of the processing plant have resulted in the need to expand the storage capacity of the tailings containment facility.
The drilling program at Rosebel continues to target higher-grade, softer rock. Refer to the exploration section for information.
ESSAKANE
In the first quarter 2014, the expanded plant was commissioned at a final cost of $330 million compared to a budgeted cost of $369 million. During the year, additional expansion costs relating to the river diversion project of $12.8 million and the village resettlement of $1.0 million were incurred.
WESTWOOD
Underground development costs associated with the ramp-up to full-production design levels are designated as development capital. This includes underground development related to mining blocks that are not expected to be in production before 2017. Resource and underground development related to these blocks will start in 2015.
JOINT VENTURE - SADIOLA SULPHIDE PROJECT
The Company is working with its joint venture partner to finalize a strategy for the project. The focus is on optimizing the economic model to generate attractive project returns. Any future expansion at Sadiola requires securing a long-term supply of lower-cost, reliable and uninterrupted power.
NIOBEC
Underground exploration drilling initiated in March 2014 continued during the year with just over 16,900 metres completed.
IAMGOLD CORPORATION
ANNUAL MANAGEMENT’S DISCUSSION AND ANALYSIS – DECEMBER 31, 2014
PAGE 16
The Company was active at brownfield and greenfield exploration projects in nine countries located in West Africa and the Americas.
In 2014, expenditures for exploration and project studies totaled $68.9 million, of which $42.7 million was expensed and $26.2 million was capitalized. The decrease of $24.7 million in total exploration expenditures compared to the prior year reflects a smaller planned exploration program and project prioritization. Drilling activities on projects and mine sites totaled approximately 350,000 metres for the year.
| Years ended December 31, | ||||||||
| ($ millions) |
2014 | 2013 | ||||||
| Exploration projects - greenfield |
$ | 34.6 | $ | 28.2 | ||||
| Exploration projects - brownfield1 |
22.0 | 41.2 | ||||||
|
|
|
|
|
|||||
| 56.6 | 69.4 | |||||||
| Côté Gold studies, including feasibility |
12.0 | 23.3 | ||||||
| Other studies |
0.3 | 0.9 | ||||||
|
|
|
|
|
|||||
| $ | 68.9 | $ | 93.6 | |||||
|
|
|
|
|
|||||
| 1 | Exploration projects - brownfield for 2014 and 2013 exclude expenditures related to joint ventures of $0.9 million and $2.3 million, respectively, and includes near-mine exploration and resource development of $14.7 million and $26.4 million, respectively. |
OUTLOOK - 2015
In 2015, the planned program spending will total $56 million, comprised of brownfield and the greenfield exploration programs and ongoing project studies. The brownfield programs will focus on the discovery and delineation of soft oxide resources at Rosebel and Essakane, and resource conversion at Westwood. Greenfield programs will continue to delineate resource ounces at advanced exploration projects at Boto in Senegal, Siribaya in Mali and Pitangui in Brazil as well as focusing on the discovery of new ounces at other select projects. Ongoing project studies totaling $10 million will continue at Côté Gold, Ontario and the Boto gold project in Senegal.
| ($ millions) |
Capitalized | Expensed | Total | |||||||||
| Exploration projects - greenfield |
$ | — | $ | 26 | $ | 26 | ||||||
| Exploration projects - brownfield1 |
11 | 9 | 20 | |||||||||
|
|
|
|
|
|
|
|||||||
| 11 | 35 | 46 | ||||||||||
|
|
|
|
|
|
|
|||||||
| Côté Gold studies, including feasibility |
5 | — | 5 | |||||||||
| Other studies |
— | 5 | 5 | |||||||||
|
|
|
|
|
|
|
|||||||
| 5 | 5 | 10 | ||||||||||
|
|
|
|
|
|
|
|||||||
| $ | 16 | $ | 40 | $ | 56 | |||||||
|
|
|
|
|
|
|
|||||||
| 1 | Exploration projects - brownfield exclude planned expenditures related to Sadiola of $1 million and include planned near-mine exploration and resource development of $11 million. |
The outlook for 2015 is lower by $13 million compared to the 2014 full year exploration and project spend due to overall reduced program spending. The 2015 resource development and exploration program includes approximately 220,000 to 240,000 metres of reverse circulation and diamond drilling.
CÔTÉ GOLD PROJECT, ONTARIO, CANADA
Just over 20,400 metres of delineation diamond drilling have been completed during the year on the Côté Gold deposit. The program was completed on 25 x 25 metre and 25 x 50 metre drill spacing over selected areas of the deposit by the end of third quarter 2014. The objective was to provide detailed information on the local continuity and controls on mineralization in order to improve the resource model.
During the fourth quarter 2014, a core re-logging program and mapping of recently stripped outcrops in the deposit area were completed to compliment the above mentioned delineation drilling program. Results from these activities are currently being integrated into the geological model. The re-logging program will continue in 2015.
Regional exploration activities to develop and assess exploration targets within the 516 square kilometre property holdings surrounding the Côté Gold deposit continued to advance during the year. An exploration diamond drilling program totaling nearly 2,270 metres was completed during the fourth quarter, for just over 4,800 metres for the year, to evaluate several prioritized targets. The results are currently being validated and assessed and will be used to guide future exploration programs.
The Company approved a $25.1 million feasibility study on the Côté Gold deposit, which is anticipated to be completed by 2017. Côté Gold is an attractive long-term asset that is expected to strengthen the Company’s production pipeline.
IAMGOLD CORPORATION
ANNUAL MANAGEMENT’S DISCUSSION AND ANALYSIS – DECEMBER 31, 2014
PAGE 17
BROWNFIELD EXPLORATION PROJECTS
The Company’s mine and regional exploration teams continued to conduct brownfield exploration and resource development work during 2014 at the Rosebel, Essakane and Westwood operations.
Rosebel, Suriname
Nearly 36,500 metres of reverse circulation drilling and diamond drilling were completed on the Rosebel mine lease and surrounding mineral concessions during the year, including just over 22,700 metres on exploration drilling, 12,230 metres focused on resource drilling and 1,500 metres directed towards geotechnical drilling programs. In the fourth quarter, just over 12,400 metres were drilled with some 3,300 metres directed to resource development and expansion drilling, and just over 9,100 metres as exploration drilling. Results are being assessed as they are received to help guide further drilling programs.
The objective of the ongoing drilling program remains focused on increasing resources of, and identifying and evaluating high potential areas for near-surface, soft and transitional mineralization. On the mine lease, resource development and expansion drilling was completed at the Rosebel, Mayo and Royal Hill deposits. Geological interpretations and resource models continue to be updated to incorporate the new drill results.
During the fourth quarter 2014, drilling activities continued at the Sarafina Option property on which IAMGOLD’s subsidiary, Rosebel Gold Mines may earn a 100% interest, located 25 kilometres from the Rosebel gold mine. This 10,000 hectare mining concession lies within the Unincorporated Joint Venture area that was negotiated with the Government of Suriname in 2013. By year-end, almost 5,100 metres of diamond and reverse circulation drilling were completed as part of a program evaluating priority target areas identified in the first half of 2014. Assay results are incomplete and will be assessed as they are received to help guide future programs.
The Company continues to evaluate possible transactions for other prospective properties with the potential for higher grade, softer rock, and lower stripping ratios.
Essakane, Burkina Faso
Just over 70,000 metres of reverse circulation drilling and diamond drilling were completed on the mine lease and surrounding exploration concessions during the year. In the fourth quarter, just over 26,750 metres were drilled including approximately 16,850 metres directed to resource development and expansion drilling and just over 9,900 metres on exploration targets.
On the mine lease, nearly 47,700 metres of reverse circulation and diamond drilling were completed during the year to evaluate potential extensions of, and to upgrade existing inferred resources, at both the Essakane Main Zone (“EMZ”), slightly below and east of the pit, and the Falagountou deposits. Results were positive on EMZ with continuity of mineralization demonstrated at depth along the east limb of the deposit in the northern sector of the pit, as well as in the south east end of the pit. The results will be incorporated into the updated resource model.
An infill drilling program conducted at the Falagountou satellite deposit has confirmed lateral continuity of mineralization as well as an extension down-dip which remains open. Drilling also identified a second mineralized structure, located 250 metres west of the main zone. The results are being compiled and will be incorporated into an updated resource model.
On the surrounding exploration concessions, follow-up drilling campaigns have been completed on the Tassiri and Sokadie prospects and on several new prospective areas delineated by regional aircore drilling results. The drill results, along with the results derived from geological mapping and geochemical sampling programs completed during the year are being assessed and compiled to continue to identify prospective targets for follow-up exploration programs.
Westwood, Canada
In the fourth quarter 2014, underground excavation totaled 5,500 metres of lateral and vertical development for a total of nearly 18,850 metres for the year. Some 20,920 metres of underground diamond drilling were completed during the quarter for a total of just over 73,100 metres in resource development drilling in 2014. The diamond drill program continues to focus on infill drilling to upgrade the existing Inferred mineral resources to the Indicated mineral category, as well as continuing definition work on ore zones that are scheduled to be mined. An additional 700 metres of diamond drilling was also completed as part of ongoing geotechnical studies to support the design of mine infrastructure.
GREENFIELD EXPLORATION PROJECTS
In addition to the mine site and brownfield exploration programs described above, the Company was active on twelve early to advanced stage greenfield exploration projects during the year. Highlights include:
Boto, Senegal
The Boto Gold Project hosts an indicated resource of 22.0 million tonnes averaging 1.62 grams of gold per tonne for 1.14 million ounces and an inferred resource of 1.9 million tonnes averaging 1.35 grams of gold per tonne for 81,000 ounces (refer to news release dated July 29, 2013). During the year, approximately 15,800 metres of diamond drilling was completed with over 5,200 metres drilled during the fourth quarter 2014. The drilling program was focused on resource delineation and expansion of the Malikoundi deposit, specifically targeting potential strike and depth extensions.
IAMGOLD CORPORATION
ANNUAL MANAGEMENT’S DISCUSSION AND ANALYSIS – DECEMBER 31, 2014
PAGE 18
On October 20, 2014 and subsequent to the reporting period on February 3, 2015, the Company reported assay results from its ongoing drilling program. Reported highlights included intersections of 64 metres grading 3.37 g/t gold and 16 metres grading 7.73 g/t gold, 9 metres grading 10.5g/t gold and 44 metres 4.46 g/t gold. The results continue to confirm continuity of mineralization within the current Malikoundi resource area, including significant intersections from the projected strike and depth extensions. An updated resource estimate will be reported in the Company’s year-end reserves and resources statements.
In 2015, some 13,000 to 15,000 metres of diamond drilling is planned to complete the ongoing 50m x 50m infill program. The program aims to further upgrade resources at the Malikoundi deposit in support on ongoing technical studies.
During the year, a scoping study was completed to examine a range of potential development options.
Siribaya Joint Venture, Mali
The Siribaya exploration project in Mali is operated by IAMGOLD under a 50:50 joint venture with Merrex Gold Inc. (“Merrex”). During the year, nearly 11,500 metres of diamond and reverse circulation drilling was completed, including 1,200 metres during the fourth quarter, targeting the newly discovered Diakha prospect. The drilling program has confirmed the presence of multiple zones of gold mineralization over significant widths and grades, in association with disseminated sulphide and albite-hematite-chlorite alteration in sandstone host rocks. Although final assay results are pending, Merrex provided regular exploration updates during the year as assay results were received, validated and compiled (refer to Merrex news releases dated April 30, July 2, August 28, October 8, and December 16, 2014). Reported highlights include: 34 metres grading 4.85 g/t Au, including 19 metres grading 7.31 g/t Au from diamond drill hole 148 and 12 metres grading 10.99 g/t Au from diamond drill hole 146.
In 2015, approximately 15,000 to 20,000 of reverse circulation and diamond drilling are planned to delineate the Diakha discovery and advance to the completion of a maiden resource estimate as warranted.
Pitangui, Brazil
Resource delineation drilling proceeded as planned throughout the year on the newly discovered São Sebastião deposit on the Company’s wholly-owned Pitangui project in Minas Gerais state, Brazil. On April 9, 2014, the Company announced the first National Instrument 43-101 compliant mineral resource estimate for the deposit which incorporated assay results from 57 diamond drill holes totaling 19,600 metres. Resources comprised an inferred resource of 4.07 million tonnes grading 4.88 grams of gold per tonne for 0.64 million contained ounces. The estimate is based on an underground mining scenario, a long-term gold price of $1,500 per ounce and is reported at a cut-off grade of 3.0 grams of gold per tonne.
During the fourth quarter 2014, just over 7,812 metres of diamond drilling was completed, for a total of approximately 24,500 metres completed during the year. The program continued to focus on upgrading resources within the core area of the São Sebastião resource and testing for extensions. Although final assay results are pending, results released during the year included highlights such as 9.73 g/t Au over 7.5 metres from diamond drill hole FJG-072 and 10.16 g/t Au over 4.9 metres from diamond drill hole FJG-073 (see New Release dated June 23, 2014). The new results will be incorporated in an updated resource model once they all received and validated. Also during the fourth quarter, a 660 line kilometre heli-borne VTEM survey was flown which has identified a number of conductive targets similar to that associated with the São Sebastião deposit. These targets will be prioritized for evaluation in future drilling programs.
Monster Lake Joint Venture, Quebec
The Monster Lake project is held under an earn-in option to joint venture with TomaGold Corporation (“TomaGold”), signed on November 11th, 2013, whereby the Company may earn a 50% interest in TomaGold’s Monster Lake, Winchester and Lac à l´eau Jaune properties by completing scheduled cash payments and exploration expenditures totaling $17.6 million over five and a half years.
In the fourth quarter 2014, 2,596 metres (4 holes) of diamond drilling were completed, for a total of 12,761 metres for the year. The phased drill programs targeted the direct down-dip and lateral extensions of the 325-Megane high-grade zone previously drilled by TomaGold, as well as prioritized areas along strike. On February 5, 2015, the Company reported the assay results from the final 17 holes of the 26 drill hole program. Highlights include 9.18 metres, grading 46.33 g/t Au (including 2.2 metres grading 182.8 g/t Au), 3.42 metres grading 18.68 g/t Au and 7.1 metres grading 6.74 g/t Au.
Eastern Borosi Joint Venture, Nicaragua
The 176 square kilometre Eastern Borosi project is located in the Golden Triangle of Northeast Nicaragua and is held under an earn-in option to joint venture agreement with Calibre Mining Corporation (“Calibre”). Signed on May 26, 2014, the Company may earn a 51 to 70% interest in Calibre’s Eastern Borosi project by completing scheduled cash payments and exploration work expenditures totaling $10.9 million over six years.
In 2014, a 40 hole diamond drilling program totaling just over 5,500 metres, including 16 drill holes for just over 2,330 metres in the fourth quarter, was completed under the management of Calibre Mining. The program was designed to test a combined 3 kilometres of strike-length of various vein systems identified on the property at shallow depths with drill holes spaced on 100 metre sections. Assay results reported (see Calibre News Releases dated: September 2 and 24, October 16, November 4, 2014 and January 21, 2015) are considered encouraging and have returned a number of high grade gold-silver intersections including: 12.9 metres grading 8.73 g/t Au, 11.43 g/t Ag, (includes 6.5 metres grading 16.88 g/t Au and 20.95 g/t Ag) from diamond drill hole GP14-010;
IAMGOLD CORPORATION
ANNUAL MANAGEMENT’S DISCUSSION AND ANALYSIS – DECEMBER 31, 2014
PAGE 19
and 4.8 metres grading 25.66 g/t Au and 35.19 g/t Ag from diamond drill hole GP14-030. The 2015 exploration program budget of $1.5 million, will continue to test, at shallow depths, additional veins and will also target the depth extent of higher grade intervals identified from the 2014 program.
Caramanta Joint Venture, Colombia
Under the terms of an option in the joint venture agreement signed with Solvista Gold Corporation (“Solvista”) during the fourth quarter 2013, the Company can earn an initial 51% interest in Solvista’s Caramanta Project, located in Colombia’s Mid-Cauca Belt, by investing a total of $18.0 million in qualifying expenditures, including $0.9 million of cash payments, over a maximum five year period commencing December 15, 2013, and can earn an additional 19% interest in the project, for a total 70% interest, by investing a further $18.0 million in qualifying expenditures over an additional three year period.
During the fourth quarter 2014, nearly 2,100 metres of diamond drilling was completed, for a total of just under 3,850 metres in fourteen diamond drill holes for the year. The drilling program was designed to test a number of Au-Cu porphyry targets identified within Caramanta Porphyry Cluster system (the “CPC”) which hosts Solvista’s El Reten and Ajiaco Sur discoveries. Assay results from the program are being validated and assessed as they come to hand.
In 2015, work continues to obtain permitting approval to allow drilling on the El Reten and Ajiaco Sur discoveries which are located in an integrated land management district (“the DMI”) and are subject to a longer permitting process. Although the application has been filed, it is uncertain when drill permits will be granted.
| 2014 | 2013 | |||||||||||||||||||||||||||||||
| ($ millions, except where noted) |
Q4 | Q3 | Q2 | Q1 | Q4 | Q3 | Q2 | Q1 | ||||||||||||||||||||||||
| Revenues from continuing operations |
$ | 272.5 | $ | 286.7 | $ | 231.5 | $ | 217.3 | $ | 195.1 | $ | 245.5 | $ | 251.3 | $ | 255.6 | ||||||||||||||||
| Net earnings (losses) from continuing operations |
(147.8 | ) | (79.3 | ) | (21.4 | ) | (13.1 | ) | (883.6 | ) | 17.4 | (33.7 | ) | 9.2 | ||||||||||||||||||
| Net earnings from discontinued operations |
$ | 26.7 | $ | 12.0 | $ | 6.2 | $ | 17.8 | $ | 3.5 | $ | 10.1 | $ | 8.4 | $ | 8.1 | ||||||||||||||||
|
|
|
|
|
|
|
|
|
|
|
|
|
|
|
|
|
|||||||||||||||||
| Net earnings (losses) |
$ | (121.1 | ) | $ | (67.3 | ) | $ | (15.2 | ) | $ | 4.7 | $ | (880.1 | ) | $ | 27.5 | $ | (25.3 | ) | $ | 17.3 | |||||||||||
| Net earnings (losses) including discontinued operations attributable to equity holders of IAMGOLD |
$ | (122.0 | ) | $ | (72.5 | ) | $ | (16.0 | ) | $ | 3.7 | $ | (840.3 | ) | $ | 25.3 | $ | (28.4 | ) | $ | 10.9 | |||||||||||
|
|
|
|
|
|
|
|
|
|
|
|
|
|
|
|
|
|||||||||||||||||
| Basic earnings (losses) including discontinued operations attributable to equity holders of IAMGOLD per share ($/share) |
$ | (0.32 | ) | $ | (0.19 | ) | $ | (0.04 | ) | $ | 0.01 | $ | (2.23 | ) | $ | 0.07 | $ | (0.08 | ) | $ | 0.03 | |||||||||||
| Diluted earnings (losses) including discontinued operations attributable to equity holders of IAMGOLD per share ($/share) |
$ | (0.32 | ) | $ | (0.19 | ) | $ | (0.04 | ) | $ | 0.01 | $ | (2.23 | ) | $ | 0.07 | $ | (0.08 | ) | $ | 0.03 | |||||||||||
|
|
|
|
|
|
|
|
|
|
|
|
|
|
|
|
|
|||||||||||||||||
LIQUIDITY AND CAPITAL RESOURCES
At December 31, 2014, the Company had $321.0 million in cash, cash equivalents and gold bullion at market value.
| Gold Bullion |
December 31, 2014 | December 31, 2013 | ||||||||||
| Ounces held |
(oz | ) | 134,737 | 134,737 | ||||||||
| Weighted average acquisition cost |
($/oz | ) | $ | 720 | $ | 720 | ||||||
| Acquisition cost |
($ millions | ) | $ | 96.9 | $ | 96.9 | ||||||
| Spot price for gold, end of the period |
($/oz | ) | $ | 1,206 | $ | 1,205 | ||||||
| Market value, end of the period |
($ millions | ) | $ | 162.5 | $ | 162.3 | ||||||
In February 2015, the Company raised Cd$50 million by issuing 13.8 million of flow-through shares. Refer to the shareholder’s equity section of the MD&A.
IAMGOLD CORPORATION
ANNUAL MANAGEMENT’S DISCUSSION AND ANALYSIS – DECEMBER 31, 2014
PAGE 20
Working capital1 as of December 31, 2014 was $789.6 million, up $268.3 million compared to December 31, 2013 due to the impact of the net assets held for sale ($461.5 million), partially offset by the lower current assets ($180.4 million).
Current assets as of December 31, 2014 was $1,184.7 million, up $448.1 million compared to December 31, 2013 mainly due to the assets held for sale included in the current assets ($628.5 million).
The Company’s initiative to convert a portion of its non-cash working capital to cash produced positive results in 2014. In addition, process changes have been made in supplies inventory by increasing turnovers, the timely collection of receivables, and managing vendor payment terms. In 2015, the Company will continue to assess the appropriate account balances to ensure that it is effectively managing liquidity, while maintaining an appropriate level of risk to its operations.
| Working Capital |
December 31, 2014 | December 31, 2013 | ||||||||||
| Working capital1 |
($ millions | ) | $ | 789.6 | $ | 521.3 | ||||||
| Current working capital ratio2 |
3.0 | 3.4 | ||||||||||
| 1 | Working capital is defined as current assets less current liabilities. |
| 2 | Current working capital ratio is defined as current assets divided by current liabilities. |
As of December 31, 2014, no funds were drawn against the Company’s $500.0 million total unsecured revolving credit facilities. At December 31, 2014, the Company has committed $61.4 million of its $75.0 million letters of credit facility for the guarantee of certain asset retirement obligations.
On January 15, 2014, the Company filed a renewal of its existing short form base shelf prospectus qualifying the distribution of securities up to $1.0 billion. This renewal has a life of 25 months and may be utilized to fund ongoing operations and/or capital requirements, reduce the level of indebtedness outstanding from time to time, fund capital programs, potential future acquisitions and for general corporate purposes. The renewal is subject to compliance with the covenants of the unsecured revolving credit facilities. The issuance of securities in the public markets or to private investors for liquidity enhancement on acceptable terms could be affected by many factors, including but not limited to general market conditions and then prevailing metals prices.
The indenture governing the Company’s $650.0 million senior unsecured debt, contains a restriction on the use of proceeds from the sale of Niobec. This restriction requires the Company to invest the net proceeds back into the business within 365 days, with the option to extend another 180 days in certain cases. Investments include acquisitions and capital expenditures.
CONTRACTUAL OBLIGATIONS
Contractual obligations as of December 31, 2014 were $1,010.9 million and include contractual cash flows on senior unsecured notes, finance leases and capital. These obligations will be met through available cash resources and net cash from operating activities.
The Company holds hedging contracts that are included in the summary of outstanding derivative contracts in the market risks section.
| Payments due by period | ||||||||||||||||||||
| At December 31, 2014 |
Total | Less than 1 Year |
2-3 Years | 4-5 years | Thereafter | |||||||||||||||
| Long-term debt |
$ | 913.4 | $ | 43.9 | $ | 87.8 | $ | 87.8 | $ | 693.9 | ||||||||||
| Purchase obligations |
44.9 | 38.9 | 5.2 | 0.8 | — | |||||||||||||||
| Capital expenditures obligations |
7.8 | 7.8 | — | — | — | |||||||||||||||
| Finance leases |
38.8 | 8.9 | 14.2 | 15.4 | 0.3 | |||||||||||||||
| Operating leases |
6.0 | 4.0 | 1.9 | 0.1 | — | |||||||||||||||
|
|
|
|
|
|
|
|
|
|
|
|||||||||||
| Total contractual obligations |
$ | 1,010.9 | $ | 103.5 | $ | 109.1 | $ | 104.1 | $ | 694.2 | ||||||||||
| Asset retirement obligations |
316.1 | 7.5 | 9.3 | 14.6 | 284.7 | |||||||||||||||
|
|
|
|
|
|
|
|
|
|
|
|||||||||||
| $ | 1,327.0 | $ | 111.0 | $ | 118.4 | $ | 118.7 | $ | 978.9 | |||||||||||
|
|
|
|
|
|
|
|
|
|
|
|||||||||||
MARKETABLE SECURITIES
Investments in marketable securities are recorded at fair value. The Company adopted IFRS 9 - Financial Instruments, as amended November 2013 (“IFRS 9 (2013)”) in the second quarter 2014 and all previously recognized impairments were reclassified to other comprehensive income (“OCI”) as an adjustment to opening components of equity as at January 1, 2014. Refer to note 4 in the Company’s consolidated financial statements.
IAMGOLD CORPORATION
ANNUAL MANAGEMENT’S DISCUSSION AND ANALYSIS – DECEMBER 31, 2014
PAGE 21
INVESTMENTS IN ASSOCIATES AND JOINT VENTURES
Associates (Galane Gold Ltd. and INV Metals Inc.) and joint ventures (Sadiola and Yatela) are included in the consolidated balance sheets as investments in associates and joint ventures. The Company’s share of earnings (losses) from associates and joint ventures is included in the consolidated statements of earnings as share of net earnings (losses) from investments in associates and joint ventures, net of income taxes.
In the fourth quarter 2014, the Company reviewed its investments in associates for objective evidence of impairment and determined that no impairments exist. The Company has no ability to control these investments, therefore, the Company is not permitted to utilize an alternate valuation method. For investments in joint ventures, if the Company is made aware of significant events or transactions that were not reflected in the Company’s share of net earnings (losses) from its joint ventures, adjustments are made to the consolidated financial statements.
Market risk is the risk that the fair value or future cash flows of a financial instrument will fluctuate because of changes in market prices. For hedging activities, it is the risk that the fair value of a derivative might be adversely affected by a change in underlying commodity prices or currency exchange rates and that this in turn affects the Company’s financial condition. The Company mitigates market risk by establishing and monitoring parameters that limit the types and degree of market risk that may be undertaken, and establishing trading agreements with counterparties under which there is no requirement to post any collateral or make any margin calls on derivatives. Counterparties cannot require settlement solely because of an adverse change in the fair value of a derivative.
CURRENCY EXCHANGE RATE RISK
The Company’s objective is to hedge a portion of its exposure to Canadian dollars and Euros resulting from operating and capital expenditure requirements at Niobec, Rosebel, Essakane and Westwood and corporate. In addition, the Company has a strategy to hedge its exposure to the Euro resulting from forecasted foreign-denominated sales of ferroniobium produced by the Niobec mine.
OIL OPTION CONTRACTS AND FUEL MARKET PRICE RISK
Diesel is a key input to extract tonnage and, in some cases, to wholly or partially power operations. Since diesel is produced by the refinement of crude oil, changes in the price of oil directly impact diesel costs. The Company believes there is a strong relationship between prices for crude oil and diesel.
Company’s 2015 outlook for the average crude oil price is $73 per barrel. This considers the hedged price of derivative contracts associated with our estimated hedge ratio of 77% of oil consumption, along with the remaining consumption at forecasted prices. Depending upon the terms of contractual supply agreements for oil with select host countries, the Company may experience a lag in recognizing the effect of a change in oil prices as compared to spot oil prices. This is due to the timing of pricing reviews over which the Company has no control.
For further information regarding risks associated with financial instruments, refer to the risks and uncertainties section of the MD&A.
SUMMARY OF OUTSTANDING HEDGE AND NON-HEDGE DERIVATIVE CONTRACTS
In the fourth quarter 2014, the Company entered into derivative contracts to limit the impact of fluctuations as a result of significant volatility in global markets by hedging a portion of its expected consumption of Canadian dollars and oil.
The Company adopted IFRS 9 (2013) in the second quarter 2014 and hedge accounting was applied for certain designated derivative contracts from April 1, 2014. Refer to note 4 of the Company’s consolidated financial statements.
At December 31, 2014, the Company’s outstanding hedge and non-hedge derivative contracts from continuing operations were as follows:
| Contracts |
2015 | 2016 | 2017 | 2018 | ||||||
| Foreign Currency |
||||||||||
| Canadian dollar contracts (millions of C$) |
145.0 | 60.0 | — | — | ||||||
| Contract rate range (C$/$) |
1.10 - 1.17 | 1.12 - 1.18 | — | — | ||||||
| Hedge ratio1 |
60% | 29% | — | — | ||||||
| Euro contracts (millions of €) |
126.0 | — | — | — | ||||||
| Contract rate range ($/€) |
1.21 - 1.26 | — | — | — | ||||||
| Hedge ratio1 |
53% | — | — | — | ||||||
| Commodities |
||||||||||
| Crude oil contracts (barrels) |
1,080,000 | 1,101,000 | 786,000 | — | ||||||
| Contract price range ($/barrel of crude oil) |
75 - 95 | 68 - 95 | 71 -95 | — | ||||||
| Hedge ratio1 |
77% | 76% | 51% | — | ||||||
| 1 | Hedge ratio is calculated by dividing the amount (in foreign currency or commodity units) of outstanding derivative contracts by total foreign exchange and commodity exposures. |
IAMGOLD CORPORATION
ANNUAL MANAGEMENT’S DISCUSSION AND ANALYSIS – DECEMBER 31, 2014
PAGE 22
| Number issued and outstanding (millions) |
December 31, 2014 | February 17, 2015 | ||||||
| Shares |
376.9 | 391.0 | ||||||
| Share options |
5.4 | 5.4 | ||||||
| Years ended December 31, | ||||||||
| ($ millions) |
2014 | 2013 | ||||||
| Net cash from (used in) per consolidated financial statements: |
||||||||
| Operating activities |
$ | 312.2 | $ | 246.3 | ||||
| Investing activities |
(319.7 | ) | (688.3 | ) | ||||
| Financing activities |
(35.1 | ) | (132.5 | ) | ||||
| Effects of exchange rate fluctuation on cash and cash equivalents |
(9.2 | ) | (0.5 | ) | ||||
|
|
|
|
|
|||||
| Decrease in cash and cash equivalents |
(51.8 | ) | (575.0 | ) | ||||
| Cash and cash equivalents held for sale |
(12.0 | ) | — | |||||
| Cash and cash equivalents, beginning of the period |
222.3 | 797.3 | ||||||
|
|
|
|
|
|||||
| Cash and cash equivalents, end of the period |
$ | 158.5 | $ | 222.3 | ||||
|
|
|
|
|
|||||
OPERATING ACTIVITIES
Net cash from operating activities for 2014 was $312.2 million, up $65.9 million or 27% from the prior year. The increase was mainly due to reducing inventory levels ($51.3 million), paying less income taxes ($95.4 million) and managing vendor payment terms ($15.3 million), partially offset by lower earnings from operations.
INVESTING ACTIVITIES
Net cash used in investing activities for 2014 was lower than the prior year by $368.6 million mainly due to lower spend on property, plant and equipment ($273.7 million), proceeds received on sale of assets for finance leases ($31.5 million) and lower advances to related parties ($62.4 million).
FINANCING ACTIVITIES
Net cash used in financing activities for 2014 was lower than the prior year by $97.4 million, mainly due to lower dividend payments ($98.3 million).
DISCONTINUED OPERATIONS AND ASSETS HELD FOR SALE
On January 22, 2015, the Company completed the sale of Niobec to a group of companies led by Magris Resources Inc. On closing, the Company received $500 million in cash after tax. The sale of Niobec included the adjacent rare earth element deposit.
As of December 31, 2014, net earnings of the Niobec disposal group were disclosed as discontinued operations in the consolidated statements of earnings. The assets and liabilities were classified as assets held for sale in the consolidated balance sheets and presented within current assets and current liabilities, respectively.
The Company recorded a non-cash deferred tax expense of $60.0 million for the year ended December 31, 2014 related to a deferred tax asset that was de-recognized due to the sale of Niobec. The de-recognition of the deferred tax asset is a non-cash item and is not indicative of the economic value of the underlying tax pools that may be used to reduce cash income taxes in the future.
DISCLOSURE CONTROLS AND PROCEDURES AND INTERNAL CONTROL OVER FINANCIAL REPORTING
DISCLOSURE CONTROLS AND PROCEDURES
The Company’s disclosure controls and procedures are designed to provide reasonable assurance that all relevant information is communicated to senior management to allow timely decisions regarding required disclosure. An evaluation of the effectiveness of the Company’s disclosure controls and procedures, as defined under the rules of the Canadian Securities Administration, was conducted as of December 31, 2014 under the supervision of the Company’s Disclosure Committee and with the participation of management. Based on the results of that evaluation, the Chief Executive Officer and Chief Financial Officer concluded that the Company’s disclosure controls and procedures were effective as of the end of the period covered by this report in providing reasonable
IAMGOLD CORPORATION
ANNUAL MANAGEMENT’S DISCUSSION AND ANALYSIS – DECEMBER 31, 2014
PAGE 23
assurance that the information required to be disclosed in the Company’s annual filings, interim filings or other reports filed or submitted by it under securities legislation is recorded, processed, summarized and reported in accordance with securities legislation.
INTERNAL CONTROL OVER FINANCIAL REPORTING
Internal control over financial reporting is designed to provide reasonable assurance regarding the reliability of the Company’s financial reporting and the preparation of financial statements in compliance with IFRS. The Company’s internal control over financial reporting includes policies and procedures that:
| • | pertain to the maintenance of records that accurately and fairly reflect the transactions of the Company; |
| • | provide reasonable assurance that transactions are recorded as necessary to permit preparation of financial statements in accordance with IFRS; |
| • | ensure the Company’s receipts and expenditures are made only in accordance with authorization of management and the Company’s directors; and |
| • | provide reasonable assurance regarding prevention or timely detection of unauthorized transactions that could have a material effect on the consolidated financial statements. |
An evaluation of the effectiveness of the Company’s internal control over financial reporting including an evaluation of material changes that may have materially affected or are reasonably likely to have materially affected the internal controls over financial reporting based on the criteria established in Internal Control - Integrated Framework (2013) issued by the Committee of Sponsoring Organizations of the Treadway Commission, was conducted as of December 31, 2014 by the Company’s management, including the Chief Executive Officer and Chief Financial Officer. Based on this evaluation, management has concluded that the Company’s internal control over financial reporting was effective as of December 31, 2014.
LIMITATIONS OF CONTROLS AND PROCEDURES
The Company’s management, including the Chief Executive Officer and Chief Financial Officer believe that any disclosure controls and procedures and internal controls over financial reporting, no matter how well designed, can have inherent limitations. Therefore, even those systems determined to be effective can provide only reasonable assurance that the objectives of the control system are met.
CRITICAL JUDGMENTS, ESTIMATES AND ASSUMPTIONS
The Company’s management makes judgments in its process of applying the Company’s accounting policies in the preparation of its consolidated financial statements. In addition, the preparation of financial data requires that the Company’s management make assumptions and estimates of effects of uncertain future events on the carrying amounts of the Company’s assets and liabilities at the end of the reporting period and the reported amounts of revenue and expenses during the reporting period. Actual results may differ from those estimates as the estimation process is inherently uncertain. Estimates are reviewed on an ongoing basis based on historical experience and other factors that are considered to be relevant under the circumstances. Revisions to estimates and the resulting effects on the carrying amounts of the Company’s assets and liabilities are accounted for prospectively.
The critical judgments, estimates and assumptions applied in the preparation of the Company’s are reflected in note 3 of the Company’s consolidated financial statements for the year ended December 31, 2014.
NOTES TO INVESTORS REGARDING THE USE OF RESOURCES
Cautionary Note to Investors Concerning Estimates of Measured and Indicated Resources
This report uses the terms “measured resources” and “indicated resources”. The Company advises investors that while those terms are recognized and required by Canadian regulations, the United States Securities and Exchange Commission (“the SEC”) does not recognize them. Investors are cautioned not to assume that any part or all of mineral deposits in these categories will ever be converted into reserves.
Cautionary Note to Investors Concerning Estimates of Inferred Resources
This report also uses the term “inferred resources”. The Company advises investors that while this term is recognized and required by Canadian regulations, the SEC does not recognize it. “Inferred resources” have a great amount of uncertainty as to their existence, and great uncertainty as to their economic and legal feasibility. It cannot be assumed that all or any part of an inferred mineral resource will ever be upgraded to a higher category. Under Canadian rules, estimates of inferred mineral resources may not form the basis of feasibility or pre-feasibility studies, except in rare cases. Investors are cautioned not to assume that part or all of an inferred resource exists, or is economically or legally mineable.
Scientific and Technical Disclosure
IAMGOLD is reporting mineral resource and reserve estimates in accordance with the CIM guidelines for the estimation, classification and reporting of resources and reserves.
IAMGOLD CORPORATION
ANNUAL MANAGEMENT’S DISCUSSION AND ANALYSIS – DECEMBER 31, 2014
PAGE 24
Cautionary Note to U.S. Investors
The United States Securities and Exchange Commission limits disclosure for U.S. reporting purposes to mineral deposits that a company can economically and legally extract or produce. IAMGOLD uses certain terms in this report, such as “measured,” “indicated,” or “inferred,” which may not be consistent with the reserve definitions established by the SEC. U.S. investors are urged to consider closely the disclosure in the IAMGOLD Annual Reports on Forms 40-F. Investors can review and obtain copies of these filings from the SEC’s website at http://www.sec.gov/edgar.shtml or by contacting the Investor Relations department.
The Canadian Securities Administrators’ National Instrument 43-101 (“NI 43-101”) requires mining companies to disclose reserves and resources using the subcategories of “proven” reserves, “probable” reserves, “measured” resources, “indicated” resources and “inferred” resources. Mineral resources that are not mineral reserves do not demonstrate economic viability.
A mineral reserve is the economically mineable part of a measured or indicated mineral resource demonstrated by at least a preliminary feasibility study. This study must include adequate information on mining, processing, metallurgical, economic and other relevant factors that demonstrate, at the time of reporting, that economic extraction can be justified. A mineral reserve includes diluting materials and allows for losses that may occur when the material is mined. A proven mineral reserve is the economically mineable part of a measured mineral resource demonstrated by at least a preliminary feasibility study. A probable mineral reserve is the economically mineable part of an indicated, and in some circumstances, a measured mineral resource demonstrated by at least a preliminary feasibility study.
A mineral resource is a concentration or occurrence of natural, solid, inorganic material, or natural, solid fossilized organic material including base and precious metals in or on the Earth’s crust in such form and quantity and of such a grade or quality that it has reasonable prospects for economic extraction. The location, quantity, grade, geological characteristics and continuity of a mineral resource are known, estimated or interpreted from specific geological evidence and knowledge. A measured mineral resource is that part of a mineral resource for which quantity, grade or quality, densities, shape and physical characteristics are so well established that they can be estimated with confidence sufficient to allow the appropriate application of technical and economic parameters, to support production planning and evaluation of the economic viability of the deposit. The estimate is based on detailed and reliable exploration, sampling and testing information gathered through appropriate techniques from locations such as outcrops, trenches, pits, workings and drill holes that are spaced closely enough to confirm both geological and grade continuity. An indicated mineral resource is that part of a mineral resource for which quantity, grade or quality, densities, shape and physical characteristics can be estimated with a level of confidence sufficient to allow the appropriate application of technical and economic parameters, to support mine planning and evaluation of the economic viability of the deposit. The estimate is based on detailed and reliable exploration and testing information gathered through appropriate techniques from locations such as outcrops, trenches, pits, workings and drill holes that are spaced closely enough for geological and grade continuity to be reasonably assumed. An inferred mineral resource is that part of a mineral resource for which quantity and grade or quality can be estimated on the basis of geological evidence and limited sampling and reasonably assumed, but not verified, geological and grade continuity. The estimate is based on limited information and sampling gathered through appropriate techniques from locations such as outcrops, trenches, pits, workings and drill holes. Mineral resources which are not mineral reserves do not have demonstrated economic viability.
Investors are cautioned not to assume that part or all of an inferred resource exists, or is economically or legally mineable.
A feasibility study is a comprehensive technical and economic study of the selected development option for a mineral project that includes appropriately detailed assessments of realistically assumed mining, processing, metallurgical, economic, marketing, legal, environmental, social and governmental considerations together with any other relevant operational factors and detailed financial analysis, that are necessary to demonstrate at the time of reporting that extraction is reasonably justified (economically mineable). The results of the study may reasonably serve as the basis for a final decision by a proponent or financial institution to proceed with, or finance, the development of the project. The confidence level of the study will be higher than that of a Pre-Feasibility Study.
A pre-feasibility study is a comprehensive study of a range of options for the technical and economic viability of a mineral project that has advanced to a stage where a preferred mining method, in the case of underground mining, or the pit configuration, in the case of an open pit, is established and an effective method of mineral processing is determined. It includes a financial analysis based on reasonable assumptions on mining, processing, metallurgical, economic, marketing, legal, environmental, social and governmental considerations and the evaluation of any other relevant factors which are sufficient for a qualified person, acting reasonably, to determine if all or part of the Mineral Resource may be classified as a Mineral Reserve.
Gold Technical Information and Qualified Person/Quality Control Notes
The mineral resource estimates contained in this MD&A have been prepared in accordance with National Instrument 43-101 Standards of Disclosure for Mineral Projects (“NI 43-101”) and JORC. The “Qualified Person” responsible for the supervision of the preparation and review of all resource and reserve estimates for IAMGOLD is Lise Chénard, Eng., Director, Mining Geology.
She is a “Qualified Person” for the purposes of NI 43-101 with respect to the mineralization being reported on. The technical information has been included herein with the consent and prior review of the above noted Qualified Person. The Qualified person has verified the data disclosed, and data underlying the information or opinions contained herein.
IAMGOLD CORPORATION
ANNUAL MANAGEMENT’S DISCUSSION AND ANALYSIS – DECEMBER 31, 2014
PAGE 25
For a discussion of future accounting policies that may impact the Company, refer to note 5 of the Company’s consolidated financial statements for the year ended December 31, 2014.
The Company is subject to various business, financial and operational risks that could materially adversely affect the Company’s future business, operations and financial condition and could cause such future business, operations and financial condition to differ materially from the forward-looking statements and information contained in this MD&A and as described in the Cautionary Statement on Forward-Looking Information found in this document.
IAMGOLD’s vision challenges it to generate superior value for its stakeholders through accountable mining. The Company’s business activities expose it to significant risks due to the nature of mining, exploration and development activities. The ability to manage these risks is a key component of the Company’s business strategy and is supported by a risk management culture and an effective enterprise risk management (“ERM”) approach.
These practices ensure management is forward looking in its assessment of risks. Identification of key risks occurs in the course of business activities, while pursuing business approved strategies and as part of the execution of risk oversight responsibilities at the Management and Board level.
The Company’s view of risks is not static. An important component of its ERM approach is to ensure that key risks which are evolving or emerging are appropriately identified, managed, and incorporated into existing ERM assessment, measurement, monitoring and reporting processes.
The following is a summary of the key risks that the Company is facing.
For a more comprehensive discussion of the risks faced by the Company, refer to the Company’s latest AIF, filed with Canadian securities regulatory authorities at www.sedar.com, and filed under Form 40-F with the United States Securities Exchange Commission at www.sec.gov/edgar.html. The AIF, is incorporated by reference into this MD&A and in addition to being viewable on www.sedar.com and www.sec.gov/edgar.html, is available upon request from the Company.
Financial Risks
Gold and Commodity Prices and Currency
All of the factors that determine commodity prices such as prices for gold or certain other commodities (for example oil and electricity) and currencies (U.S. dollar and other currency exchange rates) are beyond the Company’s control. A significant decrease of the Canadian dollar can negatively impact IAMGOLD’s operating costs and consumables priced in Canadian dollars. In addition, a substantial increase in the price of oil can also have a negative impact on the Company’s operating costs due to the higher cost of fuel. For more details, refer to the market trends section of this MD&A.
In particular, the financial viability of the Company is closely linked to the price of gold. Fluctuations in gold prices materially affect the Company’s financial performance and results of operations. The Company does not hedge its gold sales. Gold prices fluctuate widely and are affected by numerous factors beyond the Company’s control, including political stability and general economic conditions.
A sustained decline in the price of gold has required the Company to reduce its costs. Any further significant decline in the price of gold would have an adverse effect on the profitability of the Company and cash flow would be negatively affected.
General Economic Conditions
Events and conditions in the global financial markets during past years have had a profound impact on the global economy, leading to a loss of confidence in global credit and financial markets, restricted access to capital and credit, and increased counterparty risk. Some of the key impacts of the financial market conditions include contraction in credit markets resulting in a widening of credit risk, devaluations and high volatility in global equity, commodity, foreign exchange and precious metal markets, and a lack of market liquidity.
Impairment Assessment
The Company performs impairment testing for its property, plant and equipment when indications of potential impairment are identified. Factors assessed in the determination of whether there is any indication of impairment include, but are not limited to, the carrying amount of the Company’s net assets exceeding its market capitalization, significant declines in gold prices, significant increases in input costs, significant adverse changes in the life of mine (“LOM”) plan or mineral reserves and resources and observable indications that the asset’s value has declined significantly more than expected, including through obsolescence or damage. If any such indicator exists, then the Company will perform an impairment review.
If the carrying amount of the cash generating unit (“CGU”), asset or group of assets being tested is greater than its recoverable amount, an impairment loss is recorded in the given period. The recoverable amount is determined as the higher of the CGU’s fair value less costs of disposal (“FVLCD”) and value in use (“VIU”). The assumptions used in the present value calculation are typically
IAMGOLD CORPORATION
ANNUAL MANAGEMENT’S DISCUSSION AND ANALYSIS – DECEMBER 31, 2014
PAGE 26
LOM plans, long-term commodity prices, discount rates, foreign exchange rates, values of un-modeled mineralization and net asset value multiples. Management’s assumptions and estimate of future cash flows are subject to risks and uncertainties, particularly in market conditions where higher volatility exists, and may be partially or totally outside of the Company’s control. Therefore, it is reasonably possible that changes could occur with evolving economic conditions, which may affect the recoverability of the Company’s long-lived assets. If the Company fails to achieve its valuation assumptions or if any of its long-lived assets or CGUs experience a decline in its fair value, an impairment charge may result in future periods causing a reduction of the Company’s earnings.
Hedging Activities
Derivative products can be used to manage the risks associated with, among other things, changes in commodity prices and foreign currency exchange rates. The Company regularly enters into such arrangements in the prescribed manner. The Company enters into hedging contracts to limit the impact of fluctuations as a result of volatilities in the world markets by hedging a portion of its requirement of Canadian dollars and Euros, and its expected consumption of oil. For more details, refer to the financial condition section of this MD&A.
Liquidity and Capital Resources
The adequacy of the Company’s capital structure is assessed on an ongoing basis and adjusted as necessary after taking into consideration its strategy, the forward gold prices, the mining industry, economic conditions and the associated risks. In order to maintain or adjust its capital structure, the Company may adjust its capital spending, issue new shares, purchase shares for cancellation pursuant to normal course issuer bids, extend/amend or renew its senior credit facility, issue new debt, reimburse existing debt, if any, or purchase or sell gold bullion. For more details, refer to the financial condition section of the MD&A.
Credit Risk Related to Financial Instruments and Cash Deposits
Investments of surplus funds are made only with approved counterparties and within credit limits assigned to each counterparty. Counterparty credit limits are reviewed by IAMGOLD management on an annual basis, and may be updated throughout the year with appropriate approval. The limits are set to minimize the concentration of risks and therefore mitigate the potential for financial loss resulting from counterparty failure. No material exposure is considered to exist by virtue of the possible non-performance of the counterparties to financial instruments.
Indebtedness and Fulfilling Obligations Under the Terms of Indebtedness
Following the offering of the Company’s $650.0 million senior unsecured notes in September 2012, the Company has a significant amount of indebtedness.
The high level of indebtedness could have important consequences to the holders of the notes and other stakeholders, including: making it more difficult to satisfy obligations with respect to the notes and other debt; limiting the ability to obtain additional financing to fund future working capital, capital expenditures, acquisitions or other general corporate requirements, or requiring the Company to make non-strategic divestitures; requiring a substantial portion of cash flows to be dedicated to debt service payments instead of other purposes, thereby reducing the amount of cash flows available for working capital, capital expenditures, acquisitions and other general corporate purposes; increasing the vulnerability to general adverse economic and industry conditions; exposing the Company to the risk of increased interest rates as borrowings under the senior credit facility are at variable rates of interest; limiting the flexibility in planning for and reacting to changes in the industry in which the Company competes; placing the Company at a disadvantage compared to other less leveraged competitors who may be able to take advantage of opportunities that the Company’s indebtedness would prevent it from pursuing; and increasing the cost of borrowing.
In addition, the credit facility and the indenture governing the notes contain restrictive covenants that limit the Company’s ability to engage in activities that may be in its long-term best interest. The Company’s failure to comply with those covenants could result in an event of default which, if not cured or waived, could result in the acceleration of all its debt.
The bond indenture contains a restriction on the use of proceeds from the sale of Niobec. This restriction requires the Company to invest the net proceeds back into the business within 365 days, with the option to extend another 180 days in certain cases. Investments include acquisitions and capital expenditures.In the event that the Company does not invest the full amount of the Niobec proceeds within the defined period, the Company will be required to repurchase bonds with the shortfall.
Access to Capital Markets, Financing and Interest Rates
To fund growth, the Company may need to secure the necessary capital through loans or permanent capital. The availability of this capital is subject to general economic conditions and lenders’ and investors’ interest in the Company and its projects. There is a risk in obtaining financing as and when required, and on commercially acceptable terms, for exploration, development, acquisitions and general corporate purposes. The Company is subject to movements in interest rates.
Debt Rating
The Company’s debt currently has a non-investment grade rating, and any rating assigned could be lowered or withdrawn entirely by a rating agency if, in that rating agency’s judgment, future circumstances relating to the basis of the rating, such as adverse changes, so warrant. Consequently, real or anticipated changes in the Company’s credit ratings will generally affect the market value of the 2012 senior unsecured notes. Credit ratings are not recommendations to purchase, hold or sell the 2012 senior unsecured notes. Additionally, credit ratings may not reflect the potential effect of risks relating to the structure of the 2012 senior unsecured
IAMGOLD CORPORATION
ANNUAL MANAGEMENT’S DISCUSSION AND ANALYSIS – DECEMBER 31, 2014
PAGE 27
notes. Any future lowering of the Company’s ratings likely would make it more difficult or more expensive for the Company to obtain additional debt financing.
Taxation
Mining tax regimes in foreign jurisdictions are subject to change and may not include fiscal stability guarantees. The Company’s interpretation of taxation law as applied to its transactions and activities may not coincide with that of the tax authorities. As a result, transactions may be challenged by tax authorities and the Company’s operations may be assessed, which could result in significant additional taxes, penalties and interest.
Cost Management
Capital and operational costs have escalated in the gold mining industry over the last several years. Additionally, a sustained decline in the price of gold has required the Company to reduce its costs. The Company has undertaken a number of initiatives to manage costs more efficiently, including a focus on continuous improvement, negotiations to lower energy and power costs and pursuing advantageous pricing with suppliers.
Capital Allocation
Declining gold prices may result in a declining production profile due to the lack of capital investment. Declining cash flow limits the Company’s ability to allocate expenditures for capital and other projects. Constructing mining facilities and new mining operations, as well as exploring for new and expanding resources at the Company’s existing properties, requires substantial capital expenditures. Capital investments require prioritization, which may result in decisions focused on short-term cash preservation.
Internal Controls Over Financial Reporting
The Company documented and tested, during its 2014 fiscal year, its internal control procedures in order to satisfy the requirements of Section 404 of Sarbanes-Oxley Act (“SOX”). SOX requires an annual assessment by management of the effectiveness of the Company’s internal control over financial reporting and an attestation report by the Company’s independent auditors. The Company has implemented and is in conformity with the COSO 2013 internal controls framework. The Company may fail to achieve and maintain the adequacy of its internal control over financial reporting as such standards are modified, supplemented, or amended from time to time, and the Company may not be able to ensure that it can conclude on an ongoing basis that it has effective internal controls over financial reporting in accordance with Section 404 of SOX. The Company’s failure to satisfy the requirements of Section 404 of SOX on an ongoing and timely basis could result in the loss of investor confidence in the reliability of its financial statements, which in turn could harm the Company’s business and negatively impact the trading price of its common shares or market value of its other securities. In addition, any failure to implement required internal control framework, new or improved controls, or difficulties encountered in their implementation, could harm the Company’s operating results or cause it to fail to meet its reporting obligations.
No evaluation can provide complete assurance that the Company’s internal control over financial reporting will detect or uncover all failures of persons within the Company to disclose material information required to be reported. The effectiveness of the Company’s controls and procedures could also be limited by simple errors or faulty judgments. Accordingly, the Company’s management does not expect that its internal control over financial reporting will prevent or detect all errors and all fraud.
Operational Risks
Mineral Reserves, Mineral Resources and Extraction
The Company’s mineral reserves and mineral resources are estimates, and no assurance can be given that the estimated reserves and resources are accurate or that the indicated level of metal will be produced. Such estimates are, in large part, based on geological interpretations and statistical inferences drawn from drilling and other data, and require estimates of the future price for the commodity in question and the future cost of operations. Actual mineralization or geologic conditions may be different from those predicted. In addition to gold market price fluctuations, it may take many years from the initial phase of drilling before production is possible, and during that time the economic feasibility of exploiting a discovery may change. The mineral reserve and resource estimates are subject to uncertainty and actual results may vary from these estimates. Results from drilling, testing and production, as well as material changes in metal prices and operating costs subsequent to the date of an estimate, may justify revision of such estimates.
The Company must continually replace reserves depleted by production to maintain production levels over the long term. Reserves can be replaced by expanding known ore bodies, locating new deposits or making acquisitions. There is no assurance that current or future exploration programs will be successful. There is a risk that depletion of reserves will not be offset by expansions, discoveries or acquisitions.
Production and Cost Estimates
The cost of production, development and exploration varies depending on factors outside the Company’s control. Failure to achieve production or cost estimates or material increases in costs could have an adverse impact on the Company’s future cash flows, profitability, results of operations and financial condition. Actual production and costs may vary from estimates for a variety of reasons, including: actual ore mined varying from estimates of grade, tonnage, dilution and metallurgical and other characteristics; revisions to mine plans; risks and hazards associated with mining; natural phenomena, such as inclement weather conditions, and unexpected labour shortages or strikes. Costs of production may also be affected by a variety of factors such as changing strip
IAMGOLD CORPORATION
ANNUAL MANAGEMENT’S DISCUSSION AND ANALYSIS – DECEMBER 31, 2014
PAGE 28
ratios, ore grade metallurgy, labour costs, the cost of supplies and services, general inflationary pressures and currency exchange rates.
Projects
The Company’s ability to sustain or increase its present levels of production is dependent in part on the success of its projects. Risks and unknowns inherent in all projects include the inaccuracy of estimated reserves, metallurgical recoveries, capital and operating costs of such projects, integration of technologies and personnel and the future prices of the relevant minerals. Project delays and cost overruns may significantly impact project delivery.
Acquisitions and Integration
Any acquisition that the Company may choose to complete may be of a significant size, may change the scale of the Company’s business and operations, and may expose the Company to new geographic, political, operational, financial and geological risks. The Company’s success in its acquisition activities depends on its ability to identify suitable acquisition candidates, negotiate acceptable terms for any such acquisition and integrate the acquired operations successfully and in a timely manner with the operations of the Company.
Title to Properties
The validity of mining interests held by the Company, which constitute most of the Company’s property holdings, can be uncertain and may be contested. Acquisition of a title to mineral properties is a very detailed and time-consuming process, and the Company’s title to its properties may be affected by prior unregistered agreements or transfers, or undetected defects.
Insurance
Where economically feasible and based on availability of coverage, a number of operational and financial risks are transferred to insurance companies. Available insurance does not cover all the potential risks associated with a mining company’s operations. The Company may also be unable to maintain insurance to cover insurable risks at economically feasible premiums, and the ability to claim under existing policies may be contested.
Key Personnel
The success of the Company is heavily dependent on its key personnel and on its ability to motivate, retain and attract highly skilled persons. There can be no assurance that the Company will successfully retain current key personnel or attract additional qualified personnel to manage its current needs and anticipated growth.
Geographical Areas
Some of the operations of the Company are carried out in geographical areas which lack adequate infrastructure and are subject to various other risk factors. Reliable roads, bridges, power sources and water supply are important determinants which affect capital and operating costs.
Environment, Health and Safety
The Company’s mining and processing operations and exploration activities are subject to extensive laws and regulations governing the protection of the environment, waste disposal, worker safety, mine development and protection of endangered and other special status species. The Company’s ability to obtain permits and approvals and to successfully operate in particular communities may be adversely impacted by real or perceived detrimental events associated with the Company’s activities or those of other mining companies affecting the environment, human health and safety or the surrounding communities. The Company’s legal and/or constructive commitments to rectify disturbance caused by mining, development and exploration activities may change due to new laws or regulations, updated reclamation plans or new environmental requirements.
Exposure to Pandemic
The outbreak of Ebola in West Africa is deadly, wide-ranging and is placing significant pressure on local governments, health authorities and on international efforts to stop the spread. Cases have been confirmed in neighboring countries of Mali and Senegal. Other than the direct effect on the Company’s employees, there is an indirect impact on the Company’s operations, including supply lines and movement of individuals. By staying informed on the latest development, maintaining contingency plans and educating employees to prevent the contracting and spreading of the disease, the impact of this outbreak has been reduced.
Security - Organized Illegal Miners Impact on Operations
The Company is exposed to artisanal and illegal mining activities in close proximity to our operations that may cause disruptions to the operations, environmental issues and relationship conflicts with governments and local communities. The Company is working with local governments, and law enforcement agencies to curb and prevent illegal mining activities.
Political Risk
Mining investments are subject to the risks normally associated with any conduct of business in foreign countries including uncertain political and economic environments; war, terrorism and civil disturbances; nationalization; changes in laws or policies of particular countries, including those relating to imports, exports, duties and currency; cancellation or renegotiation of contracts; and royalty fees, net profits payments and tax increases or other claims by government entities, including retroactive claims.
IAMGOLD CORPORATION
ANNUAL MANAGEMENT’S DISCUSSION AND ANALYSIS – DECEMBER 31, 2014
PAGE 29
Non-controlled Assets
Some of the Company’s assets are controlled and managed by other companies, who may have a higher interest in the assets than the interest of the Company. Such companies may have divergent business objectives that may impact the Company’s business and financial results.
Joint Venture Operations
The Company has joint ventures with other mining companies and therefore the Company’s operations are subject to the risks normally associated with the conduct of joint ventures. Such risks include: reduced ability to exert control over strategic decisions made in respect of properties operated jointly; disagreement with partners on how to develop and operate mines efficiently; inability of partners to meet their obligations to the joint venture or third parties; and litigation between partners regarding joint venture matters. Any failure of such venture partners to meet their obligations to the Company or to third parties, or any disputes with respect to the parties’ respective rights and obligations, could have a material adverse effect on the joint ventures or their respective properties, which could have a material adverse effect on the Company’s operations and financial condition.
Evolving Legislation and Corporate Governance Regulations
The Company is subject to continuously evolving legislation in the areas of labour, environment, land titles, mining practices and taxation. Any amendment to current laws and regulations governing the rights of leaseholders, or the payment of royalties, net profits interests or similar amounts, or a more stringent enforcement thereof in countries where the Company has operations, could have a material adverse impact on the Company’s financial condition and/or results of operations. The Company is unable to predict what legislation or revisions may be proposed that might affect its business or when any such proposals, if enacted, might become effective. Such changes, however, could require increased capital and operating expenditures and could prevent, delay or prohibit certain operations of the Company.
The Company is also subject to changing rules and regulations promulgated by a number of United States and Canadian governmental and self-regulated organizations, including the U.S. Securities and Exchange Commission, the Canadian Securities Administrators, the New York Stock Exchange, the Toronto Stock Exchange, and the International Accounting Standards Board. These rules and regulations continue to evolve in scope and complexity and many new requirements have been created in response to laws enacted by the United States Congress, making compliance more difficult and uncertain. The result of increased compliance is potentially higher general and administration expenses and a diversion of management time and attention from revenue-generating activities to compliance activities.
Litigation
The Company is subject to litigation arising in the normal course of business and may be involved in disputes with other parties in the future which may result in litigation. The causes of potential future litigation cannot be known and may arise from, among other things, business activities, environmental laws, volatility in stock price or failure to comply with disclosure obligations. The results and costs of litigation cannot be predicted with certainty.
Labour Disruption
The Company is dependent on its workforce to extract and process minerals. Relations between the Company and its employees may be impacted by changes in labour relations which may be introduced by, among other things, employee groups, unions and the relevant governmental authorities in whose jurisdictions the Company carries on business. Labour disruptions at any of the Company’s material properties could have a material adverse impact on its business, results of operations and financial condition. A number of the Company’s employees are represented by labour unions under various collective labour agreements. In addition, existing labour agreements may not prevent a strike or work stoppage at the Company’s facilities in the future, and any such work stoppage could have a material adverse effect on the Company’s results of operations and financial condition.
NON-GAAP1 PERFORMANCE MEASURES
The Company uses certain non-GAAP financial performance measures in its MD&A, which are described in the following section.
EARNINGS FROM CONTINUING MINING OPERATIONS
This measure is intended to enable management to better understand the earnings generated by operating mine sites and royalties before adjustments for corporate costs and non-operating charges and income. The measure is the difference between IFRS reported revenues and cost of sales, which includes revenues from all metals and royalties, direct costs, and production related allocated costs and depreciation.
| 1 | GAAP – Generally accepted accounting principles. |
IAMGOLD CORPORATION
ANNUAL MANAGEMENT’S DISCUSSION AND ANALYSIS – DECEMBER 31, 2014
PAGE 30
| Years ended December 31, | ||||||||
| ($ millions) |
2014 | 2013 | ||||||
| Continuing operations |
||||||||
| Revenues |
$ | 1,007.9 | $ | 947.5 | ||||
| Cost of sales |
892.9 | 668.5 | ||||||
|
|
|
|
|
|||||
| Earnings from continuing mining operations |
$ | 115.0 | $ | 279.0 | ||||
|
|
|
|
|
|||||
GOLD MARGIN
The Company’s MD&A refers to gold margin per ounce, a non-GAAP performance measure, in order to provide investors with information about the measure used by management to monitor the performance of its gold assets. The information allows management to assess how well the gold mines are performing relative to the plan and to prior periods, as well as, assess the overall effectiveness and efficiency of gold operations.
In periods of volatile gold prices, profitability changes with altering cut-off gold grades. Such a decision to alter the cut-off gold grade will typically result in a change to total cash costs per ounce, but it is equally important to recognize that gold margins also change at a similar rate. While mining lower-grade ore results in less gold being processed in any given period, over the long-run it allows the Company to optimize the production of profitable gold, thereby maximizing the Company’s total financial returns over the life of the mine. IAMGOLD’s exploitation strategy, including managing cut-off grades, mine sequencing, and stockpiling practices, is designed to maximize the total value of the asset going forward. At the same time, the site operating teams seek to achieve the best performance in terms of cost per tonne mined, cost per tonne processed and overheads.
The gold margin per ounce does not have any standardized meaning prescribed by IFRS, is unlikely to be comparable to similar measures presented by other issuers, and should not be considered in isolation or a substitute for measures of performance prepared in accordance with IFRS.
| Years ended December 31, | ||||||||
| ($/oz of gold) |
2014 | 2013 | ||||||
| Average realized gold price1 |
$ | 1,259 | $ | 1,399 | ||||
| Total cash costs - gold mines2,3 |
848 | 801 | ||||||
|
|
|
|
|
|||||
| Gold margin |
$ | 411 | $ | 598 | ||||
|
|
|
|
|
|||||
| 1 | Refer to page 32 for calculation. |
| 2 | Refer to page 34 for calculation. |
| 3 | Gold mines, as used with total cash costs and all-in sustaining costs, consist of Rosebel, Essakane, Westwood (commercial production), Mouska, Sadiola and Yatela on an attributable basis. |
UNIT OPERATING MARGIN PER KILOGRAM OF NIOBIUM
The Company’s MD&A refers to operating margin per kilogram of niobium at Niobec from discontinued operations, a non-GAAP performance measure, in order to provide investors with information about the measure used by management to monitor the performance of its non-gold asset. The information allows management to assess how well Niobec is performing relative to the plan and to prior periods, as well as to assess the overall effectiveness and efficiency of the operation. The operating margin per kilogram of niobium does not have any standardized meaning prescribed by IFRS. Therefore, it is unlikely to be comparable to similar measures presented by other issuers and should not be considered in isolation or be a substitute for measures of performance prepared in accordance with IFRS.
The following table provides a reconciliation of the unit operating margin per kilogram of niobium to revenues and cost of sales as per the consolidated financial statements for Niobec.
| Years ended December 31, | ||||||||
| ($ millions, except where noted) |
2014 | 2013 | ||||||
| Discontinued operations |
||||||||
| Revenues1 |
$ | 233.8 | $ | 199.6 | ||||
| Cost of sales excluding depreciation expense1 |
(118.7 | ) | (110.5 | ) | ||||
| Other items |
(2.0 | ) | 0.3 | |||||
|
|
|
|
|
|||||
| Operating margin |
$ | 113.1 | $ | 89.4 | ||||
|
|
|
|
|
|||||
| Sales volume (millions of kg Nb) |
5.8 | 4.9 | ||||||
|
|
|
|
|
|||||
| Operating margin2 ($/kg Nb) |
$ | 20 | $ | 18 | ||||
|
|
|
|
|
|||||
| 1 | Refer to note 36 of the consolidated financial statements. |
| 2 | Operating margin per kilogram sold may not calculate based on amounts presented in this table due to rounding. |
IAMGOLD CORPORATION
ANNUAL MANAGEMENT’S DISCUSSION AND ANALYSIS – DECEMBER 31, 2014
PAGE 31
AVERAGE REALIZED GOLD PRICE PER OUNCE SOLD
This measure is intended to enable management to understand the average realized price of gold sold to third parties in each reporting period after removing the impact of non-gold revenues and by-product credits.
The average realized gold price per ounce sold does not have any standardized meaning prescribed by IFRS, is unlikely to be comparable to similar measures presented by other issuers, and should not be considered in isolation or a substitute for measures of performance prepared in accordance with IFRS.
The following table provides a reconciliation of average realized gold price per ounce sold to revenues as per the consolidated financial statements.
| Years ended December 31, | ||||||||
| ($ millions, except where noted) |
2014 | 2013 | ||||||
| Continuing operations |
||||||||
| Revenues |
$ | 1,007.9 | $ | 947.5 | ||||
| Royalty revenues |
(8.6 | ) | (8.7 | ) | ||||
| By-product credits |
(2.5 | ) | (1.5 | ) | ||||
|
|
|
|
|
|||||
| Gold revenue - owner-operator |
$ | 996.8 | $ | 937.3 | ||||
| Gold sales - owner-operator (000s oz) |
793 | 671 | ||||||
|
|
|
|
|
|||||
| Average realized gold price per ounce1 - owner-operator ($/oz) |
$ | 1,258 | $ | 1,397 | ||||
|
|
|
|
|
|||||
| Gold revenue - joint venture mines |
$ | 121.2 | $ | 160.5 | ||||
| Gold sales - joint venture mines (000s oz) |
96 | 113 | ||||||
|
|
|
|
|
|||||
| Average realized gold price per ounce1 - joint venture mines ($/oz) |
$ | 1,263 | $ | 1,413 | ||||
|
|
|
|
|
|||||
| Average realized gold price per ounce1 - gold mines2 ($/oz) |
$ | 1,259 | $ | 1,399 | ||||
|
|
|
|
|
|||||
| 1 | Average realized price per ounce sold may not calculate based on amounts presented in this table due to rounding. |
| 2 | Gold mines, as used with average realized gold price per ounce sold, consist of Rosebel, Essakane, Westwood (commercial production), Mouska, Sadiola and Yatela on an attributable basis. |
NET CASH FROM OPERATING ACTIVITIES BEFORE CHANGES IN WORKING CAPITAL
The Company makes reference to a non-GAAP performance measure for net cash from operating activities before changes in working capital and net cash from operating activities before changes in working capital per share. Working capital can be volatile due to numerous factors including a build-up or reduction of inventories. Management believes that, by excluding these items, this non-GAAP measure provides investors with the ability to better evaluate the cash flow performance of the Company.
The following table provides a reconciliation of net cash from operating activities before changes in working capital.
| Years ended December 31, | ||||||||
| ($ millions, except where noted) |
2014 | 2013 | ||||||
| Net cash from operating activities per consolidated financial statements |
$ | 312.2 | $ | 246.3 | ||||
| Adjusting items from non-cash working capital items and non-current ore stockpiles |
||||||||
| Receivables and other current assets |
2.4 | (10.0 | ) | |||||
| Inventories and non-current ore stockpiles |
(0.3 | ) | 51.0 | |||||
| Accounts payable and accrued liabilities |
3.0 | 18.3 | ||||||
|
|
|
|
|
|||||
| Net cash from operating activities before changes in working capital including discontinued operations |
$ | 317.3 | $ | 305.6 | ||||
| Basic weighted average number of common shares outstanding (millions) |
376.8 | 376.6 | ||||||
|
|
|
|
|
|||||
| Net cash from operating activities before changes in working capital including discontinued operations ($/share) |
$ | 0.84 | $ | 0.81 | ||||
|
|
|
|
|
|||||
IAMGOLD CORPORATION
ANNUAL MANAGEMENT’S DISCUSSION AND ANALYSIS – DECEMBER 31, 2014
PAGE 32
ADJUSTED NET EARNINGS ATTRIBUTABLE TO EQUITY HOLDERS
Adjusted net earnings attributable to equity holders of IAMGOLD and adjusted net earnings attributable to equity holders of IAMGOLD per share are non-GAAP performance measures. Management believes that these measures better reflect the Company’s performance for the current period and are better indications of its expected performance in future periods. Adjusted net earnings attributable to equity holders of IAMGOLD and adjusted net earnings attributable to equity holders of IAMGOLD per share are intended to provide additional information, but are unlikely to be comparable to similar measures presented by other issuers. These measures do not have any standardized meaning prescribed by IFRS and should not be considered in isolation or a substitute for measures of performance prepared in accordance with IFRS. Adjusted net earnings attributable to equity holders of IAMGOLD represents net earnings attributable to equity holders excluding certain impacts, net of taxes, such as write-down of assets, gains or losses on sales of assets, unrealized non-hedge derivative gains or losses, interest expense that is unrelated to financing working capital, foreign exchange gains or losses, restructuring charges, and changes in estimates of asset retirement obligations at closed sites. These measures are not necessarily indicative of net earnings or cash flows as determined under IFRS.
The following table provides a reconciliation of earnings before income taxes of IAMGOLD as per the consolidated statements of earnings, to adjusted net earnings attributable to equity holders of IAMGOLD.
| Years ended December 31, | ||||||||
| ($ millions, except where noted) |
2014 | 2013 | ||||||
| Losses from continuing operations before income taxes and non-controlling interests |
$ | (143.7 | ) | $ | (925.6 | ) | ||
|
|
|
|
|
|||||
| Adjusted items: |
||||||||
| Impairment |
— | 888.1 | ||||||
| Changes in estimates of asset retirement obligations at closed sites |
48.7 | (7.8 | ) | |||||
| Unrealized derivative losses |
56.2 | 22.3 | ||||||
| Write-down of assets |
7.3 | 126.7 | ||||||
| Restructuring and other charges |
8.1 | 1.8 | ||||||
| Interest expense on senior unsecured note |
0.3 | 17.6 | ||||||
| Foreign exchange losses (gains) |
(1.0 | ) | 4.5 | |||||
| Losses (gains) on sale of assets |
3.7 | (12.8 | ) | |||||
| Yatela closure provision |
7.7 | — | ||||||
| (Impairment reversal) impairment of investments |
(3.4 | ) | 69.1 | |||||
|
|
|
|
|
|||||
| 127.6 | 1,109.5 | |||||||
|
|
|
|
|
|||||
| Adjusted earnings (losses) from continuing operations before income taxes and non-controlling interests |
(16.1 | ) | 183.9 | |||||
| Income taxes |
(117.9 | ) | 34.9 | |||||
| Tax impact of adjusted items and effective tax rate adjustment |
126.0 | (104.0 | ) | |||||
| Non-controlling interest |
(7.9 | ) | (12.3 | ) | ||||
|
|
|
|
|
|||||
| Adjusted net earnings (losses) from continuing operations attributable to equity holders of IAMGOLD |
$ | (15.9 | ) | $ | 102.5 | |||
|
|
|
|
|
|||||
| Basic weighted average number of common shares outstanding (millions) |
376.8 | 376.6 | ||||||
|
|
|
|
|
|||||
| Adjusted net earnings (losses) from continuing operations attributable to equity holders of IAMGOLD per share ($/share) |
$ | (0.04 | ) | $ | 0.27 | |||
|
|
|
|
|
|||||
| Including discontinued operations |
||||||||
| Adjusted net earnings (losses) from continuing operations |
(15.9 | ) | 102.5 | |||||
| Net earnings from discontinued operations attributable to equity holders of IAMGOLD |
62.7 | 30.1 | ||||||
| Effective tax rate adjustment on discontinued operations |
(14.0 | ) | 4.7 | |||||
|
|
|
|
|
|||||
| Adjusted net earnings including discontinued operations |
$ | 32.8 | $ | 137.3 | ||||
|
|
|
|
|
|||||
| Basic weighted average number of common shares outstanding (millions) |
376.8 | 376.6 | ||||||
|
|
|
|
|
|||||
| Adjusted net earnings including discontinued operations per share |
$ | 0.09 | $ | 0.36 | ||||
|
|
|
|
|
|||||
| Effective adjusted tax rate (%) |
50 | % | 38 | % | ||||
|
|
|
|
|
|||||
IAMGOLD CORPORATION
ANNUAL MANAGEMENT’S DISCUSSION AND ANALYSIS – DECEMBER 31, 2014
PAGE 33
TOTAL CASH COSTS PER OUNCE PRODUCED
The Company’s MD&A often refers to total cash costs per ounce produced, a non-GAAP performance measure, in order to provide investors with information about the measure used by management to monitor performance. This information is used to assess how well the producing gold mines are performing compared to plan and prior periods, and also to assess their overall effectiveness and efficiency.
Total cash costs are calculated in accordance with a standard developed by the Gold Institute, which was a worldwide association of gold and gold product suppliers, including leading North American gold producers. The Gold Institute ceased operations in 2002, but the standard is still an accepted measure of reporting cash costs of gold production in North America. Adoption of the standard is voluntary, and the cost measures presented herein may not be comparable to other similarly titled measures of other companies. Costs include mine site operating costs such as mining, processing, administration, royalties and production taxes, and realized hedge and non-hedge derivative gains or losses, but are exclusive of depreciation, reclamation, capital, and exploration and evaluation costs. These costs are then divided by the Company’s attributable ounces of gold produced by mine sites in commercial production to arrive at the total cash costs per ounce produced.
The measure, along with revenues, is considered to be one of the key indicators of a Company’s ability to generate operating earnings and cash flow from its mining operations. These total cash costs do not have any standardized meaning prescribed by IFRS and differ from measures determined in accordance with IFRS. They are intended to provide additional information and should not be considered in isolation or as a substitute for measures of performance prepared in accordance with IFRS. These measures are not necessarily indicative of net earnings or cash flow from operating activities as determined under IFRS.
The following table provides a reconciliation of total cash costs per ounce produced for gold mines to cost of sales, excluding depreciation expense as per the consolidated financial statements.
| Years ended December 31, | ||||||||
| ($ millions, except where noted) |
2014 | 2013 | ||||||
| Continuing operations |
||||||||
| Cost of sales1, excluding depreciation expense |
$ | 687.9 | $ | 524.7 | ||||
| Less: cost of sales for non-gold segments2, excluding depreciation expense |
2.0 | 4.9 | ||||||
|
|
|
|
|
|||||
| Cost of sales for gold segments, excluding depreciation expense |
685.9 | 519.8 | ||||||
| Adjust for: |
||||||||
| By-product credit (excluded from cost of sales) |
(2.5 | ) | (1.5 | ) | ||||
| Stock movement |
(3.8 | ) | 24.7 | |||||
| Other mining costs |
(27.6 | ) | (27.5 | ) | ||||
| Cost attributed to non-controlling interests3 |
(45.2 | ) | (33.6 | ) | ||||
|
|
|
|
|
|||||
| (79.1 | ) | (37.9 | ) | |||||
|
|
|
|
|
|||||
| Total cash costs - owner-operator |
606.8 | 481.9 | ||||||
| Attributable commercial gold production4 - owner-operator (000s oz) |
739 | 649 | ||||||
|
|
|
|
|
|||||
| Total cash costs5 - owner-operator ($/oz) |
$ | 822 | $ | 743 | ||||
|
|
|
|
|
|||||
| Total cash costs5 - joint venture mines |
100.8 | 128.9 | ||||||
| Attributable gold production - joint venture mines (000s oz) |
95 | 113 | ||||||
|
|
|
|
|
|||||
| Total cash costs - joint venture mines ($/oz) |
$ | 1,055 | $ | 1,136 | ||||
|
|
|
|
|
|||||
| Total cash costs - gold mines6 |
707.6 | 610.8 | ||||||
| Total attributable gold commercial production4 (000s oz) |
834 | 762 | ||||||
|
|
|
|
|
|||||
| Total cash costs5 - gold mines ($/oz) |
$ | 848 | $ | 801 | ||||
|
|
|
|
|
|||||
| 1 | As per note 36 of the Company’s consolidated financial statements. |
| 2 | Non-gold segments consist of Exploration and evaluation and Corporate. |
| 3 | Adjustments for the consolidation of Rosebel (95%) and Essakane (90%) to their attributable portion of cost of sales. |
| 4 | Gold commercial production does not include Westwood pre-commercial production for the year ended December 31, 2014 and 2013 of 10,000 ounces and 73,000 ounces, respectively. |
| 5 | Total cash costs per ounce produced may not calculate based on amounts presented in this table due to rounding. |
| 6 | Gold mines, as used with total cash costs, consist of Rosebel, Essakane, Westwood (commercial production), Mouska, Sadiola and Yatela, on an attributable basis. |
IAMGOLD CORPORATION
ANNUAL MANAGEMENT’S DISCUSSION AND ANALYSIS – DECEMBER 31, 2014
PAGE 34
ALL-IN SUSTAINING COSTS PER OUNCE SOLD
The Company believes that, although relevant, the current total cash costs measure commonly used in the gold industry does not capture the sustaining expenditures incurred in producing gold, and therefore, may not present a complete picture of a Company’s operating performance or its ability to generate free cash flow from its current operations. For these reasons, members of the World Gold Council (“WGC”) defined an all-in sustaining costs measure that better represents the costs associated with producing gold. The WGC is a non-profit association of the world’s leading gold mining companies, established in 1987 to promote the use of gold.
The all-in sustaining costs (“AISC”) per ounce sold measure better meets the needs of analysts, investors and other stakeholders of the Company in assessing its operating performance and its ability to generate free cash flow. The definition of AISC, on an attributable basis, commences with cost of sales, excluding depreciation expense, and includes sustaining capital expenditures, sustaining exploration and evaluation expenses, environmental rehabilitation accretion and depreciation, by-product credits, corporate general and administrative costs and the Diavik royalty. The corporate general and administrative costs offset by the Diavik royalty (as the Company utilizes the royalty income for corporate costs) are not allocated to mine sites, but are reflected in the AISC - owner operated mines, AISC - gold mines and AISC - total.
This measure seeks to represent the cost of selling gold from current operations, and therefore does not include capital expenditures attributable to development projects or mine expansions, greenfield exploration expenses, income tax payments, working capital defined as current assets less current liabilities (except for inventory adjustments), items needed to normalize earnings, interest costs or dividend payments.
Consequently, this measure is not representative of all of the Company’s cash expenditures and is not indicative of the Company’s overall profitability. The calculation of AISC per ounce sold is based on the Company’s attributable interest in sales from its gold mines. The usage of an attributable interest presentation is a fairer and more accurate way to measure economic performance than using a consolidated basis. The Company reports the AISC per ounce sold measures on an attributable sales basis, compared with the Company’s current total cash costs presentation, which is on an attributable production basis.
The Company reports the measure with and without a deduction for by-product credits and reports the measure for its owner-operator mines (includes Rosebel, Essakane, Mouska, Westwood-commercial production), gold mines (includes owner-operator mines, Sadiola and Yatela) and in total (includes gold mines offset by the niobium contribution which is classified as discontinued operations). The niobium contribution consists of Niobec’s operating margin1 less sustaining capital expenditures. The Company considers the contribution it receives from Niobec when making capital allocation decisions for its gold mines.
AISC measures do not have any standardized meaning prescribed by IFRS and differs from measures determined in accordance with IFRS. It is intended to provide additional information and should not be considered in isolation or as a substitute for measures of performance prepared in accordance with IFRS. This measure is not necessarily indicative of net earnings or cash flow from operating activities as determined under IFRS.
| 1 | Refer to unit operating margin per kilogram of niobium for the Niobec mine section. |
IAMGOLD CORPORATION
ANNUAL MANAGEMENT’S DISCUSSION AND ANALYSIS – DECEMBER 31, 2014
PAGE 35
| Years ended December 31, | ||||||||
| ($ millions, attributable, except where noted) |
2014 | 2013 | ||||||
| Continuing operations |
||||||||
| AISC - owner-operator mines |
||||||||
| Cost of sales1, excluding depreciation expense |
$ | 638.4 | $ | 485.2 | ||||
| Sustaining capital expenditures1 |
123.5 | 218.1 | ||||||
| Write-down of non-current inventories |
— | (9.5 | ) | |||||
| By-product credit, excluded from cost of sales |
(2.4 | ) | (1.5 | ) | ||||
| Diavik royalty2 |
(8.1 | ) | (7.7 | ) | ||||
| Corporate general and administrative costs3 |
40.6 | 47.4 | ||||||
| Realized (gains) losses on derivatives |
0.7 | (11.0 | ) | |||||
| Environmental rehabilitation accretion and depreciation |
10.9 | 6.9 | ||||||
|
|
|
|
|
|||||
| 803.6 | 727.9 | |||||||
|
|
|
|
|
|||||
| AISC - joint venture mines |
||||||||
| Cost of sales for joint ventures, excluding depreciation expense |
117.2 | 139.9 | ||||||
| Adjustments to cost of sales4 - joint venture mines |
(4.0 | ) | 36.5 | |||||
|
|
|
|
|
|||||
| 113.2 | 176.4 | |||||||
|
|
|
|
|
|||||
| AISC from continuing operations - gold mines5 |
916.8 | 904.3 | ||||||
|
|
|
|
|
|||||
| Including discontinued operations |
||||||||
| AISC contribution - niobium |
||||||||
| Sustaining capital expenditures - niobium |
22.8 | 30.8 | ||||||
| Less: Operating margin, excluding depreciation - niobium |
(113.1 | ) | 89.4 | |||||
|
|
|
|
|
|||||
| (90.3 | ) | (58.6 | ) | |||||
|
|
|
|
|
|||||
| AISC including discontinued operations - total |
$ | 826.5 | $ | 845.7 | ||||
|
|
|
|
|
|||||
| Continuing operations |
||||||||
| Attributable gold sales - owner-operator (000s oz) |
739 | 627 | ||||||
| AISC - owner-operator6 ($/oz) |
$ | 1,090 | $ | 1,162 | ||||
| AISC - owner-operator, excluding by-product credit6 ($/oz) |
$ | 1,093 | $ | 1,169 | ||||
|
|
|
|
|
|||||
| Attributable gold sales - gold mines (000s oz) |
835 | 740 | ||||||
| AISC - gold mines6 ($/oz) |
$ | 1,101 | $ | 1,222 | ||||
| AISC - gold mines, excluding by-product credit ($/oz) |
$ | 1,103 | $ | 1,224 | ||||
| Including discontinued operations |
||||||||
| Impact of niobium contribution6 ($/oz) |
$ | (109 | ) | $ | (79 | ) | ||
|
|
|
|
|
|||||
| AISC including discontinued operations - total6 ($/oz) |
$ | 992 | $ | 1,143 | ||||
| AISC including discontinued operations - total, excluding by-product credit6 ($/oz) |
$ | 994 | $ | 1,145 | ||||
|
|
|
|
|
|||||
| 1 | Includes Rosebel and Essakane at their attributable amounts of 95% and 90% respectively. Refer to note 36 of the consolidated financial statements for cost of sales at 100% basis and refer to the capital expenditures table of the MD&A on page 11 for 2014 sustaining capital expenditures at 100% basis. |
| 2 | Diavik royalty income is used by the Company to offset corporate costs. |
| 3 | Corporate general and administrative costs exclude depreciation expense. |
| 4 | Adjustments to cost of sales consist of sustaining capital expenditures, by-product credit and environmental rehabilitation and depreciation. |
| 5 | Gold mines consist of Rosebel, Essakane, Westwood (commercial production), Mouska, Sadiola and Yatela on an attributable basis. |
| 6 | AISC per ounce sold may not calculate based on amounts presented in this table due to rounding. |
IAMGOLD CORPORATION
ANNUAL MANAGEMENT’S DISCUSSION AND ANALYSIS – DECEMBER 31, 2014
PAGE 36

CONSOLIDATED FINANCIAL STATEMENTS
AS AT DECEMBER 31, 2014
MANAGEMENT’S RESPONSIBILITY FOR FINANCIAL REPORTING
To the Shareholders and Directors of IAMGOLD Corporation
The accompanying consolidated financial statements of IAMGOLD Corporation (“the Company”), their presentation and the information contained in Management’s Discussion and Analysis including information determined by specialists, are the responsibility of management. The consolidated financial statements have been prepared in accordance with International Financial Reporting Standards as issued by the International Accounting Standards Board.
The financial information of the Company presented in Management’s Discussion and Analysis is consistent with that in the consolidated financial statements.
The integrity of the consolidated financial reporting process is the responsibility of management. Management maintains systems of internal controls designed to provide reasonable assurance that transactions are authorised, assets are safeguarded, and reliable financial information is produced. Management selects accounting principles and methods that are appropriate to the Company’s circumstances, and makes certain determinations of amounts reported in which estimates or judgments are required.
The Board of Directors is responsible for ensuring that management fulfils its responsibility for financial reporting. The Board of Directors carries out this responsibility principally through its Audit Committee which consists of independent directors. The Board of Directors has also designated the Chairman of the Audit Committee as the Company’s financial expert. The Audit Committee meets periodically with management and the external auditors to discuss internal controls, auditing matters and financial reporting requirements. The Audit Committee satisfies itself that each party is properly discharging its responsibilities; reviews the quarterly and annual consolidated financial statements and any reports by the external auditors; and recommends the appointment of the external auditors for review by the Board of Directors and approval by the shareholders.
The external auditors audit the consolidated financial statements annually on behalf of the shareholders. The external auditors have full and free access to management and the Audit Committee.

|
| |
| Stephen J. J. Letwin | Carol T. Banducci | |
| Chief Executive Officer | Chief Financial Officer | |
| February 18, 2015 | February 18, 2015 |
IAMGOLD CORPORATION
2014 CONSOLIDATED FINANCIAL STATEMENTS
PAGE 38
MANAGEMENT’S REPORT ON INTERNAL CONTROL OVER FINANCIAL REPORTING
The Company’s management is responsible for establishing and maintaining adequate internal control over financial reporting. The Company’s internal control over financial reporting is a process designed to provide reasonable assurance regarding the reliability of financial reporting and the preparation of financial statements for external purposes in accordance with generally accepted accounting principles.
Because of its inherent limitations, internal control over financial reporting may not prevent or detect misstatements. Projections of any evaluation of effectiveness to future periods are subject to the risk that controls may become inadequate because of changes in conditions, or that the degree of compliance with the policies or procedures may deteriorate.
Management conducted an evaluation of the design and operation of the Company’s internal control over financial reporting as of December 31, 2014, based on the criteria set forth in Internal Control - Integrated Framework (2013) issued by the Committee of Sponsoring Organizations of the Treadway Commission. This evaluation included review of the documentation of controls, evaluation of the design effectiveness of controls, testing of the operating effectiveness of controls and a conclusion on this evaluation. Based on this evaluation, management has concluded that the Company’s internal control over financial reporting was effective as of December 31, 2014 and no material weaknesses were discovered.
The effectiveness of the Company’s internal control over financial reporting as of December 31, 2014 has been audited by KPMG LLP, Chartered Professional Accountants, as stated in their report located on page 41 of the consolidated financial statements.
IAMGOLD CORPORATION
2014 CONSOLIDATED FINANCIAL STATEMENTS
PAGE 39
REPORT OF INDEPENDENT REGISTERED PUBLIC ACCOUNTING FIRM
To the Shareholders of IAMGOLD Corporation
We have audited the accompanying consolidated balance sheets of IAMGOLD Corporation as of December 31, 2014 and December 31, 2013 and the related consolidated statements of earnings, comprehensive income, changes in equity and cash flows for the years then ended. These consolidated financial statements are the responsibility of IAMGOLD Corporation’s management. Our responsibility is to express an opinion on these consolidated financial statements based on our audits.
We conducted our audits in accordance with Canadian generally accepted auditing standards and the standards of the Public Company Accounting Oversight Board (United States). Those standards require that we plan and perform the audit to obtain reasonable assurance about whether the financial statements are free of material misstatement. An audit includes examining, on a test basis, evidence supporting the amounts and disclosures in the financial statements. An audit also includes assessing the accounting principles used and significant estimates made by management, as well as evaluating the overall financial statement presentation. We believe that our audits provide a reasonable basis for our opinion.
In our opinion, the consolidated financial statements referred to above present fairly, in all material respects, the consolidated financial position of IAMGOLD Corporation as of December 31, 2014 and December 31, 2013, and its consolidated financial performance and its consolidated cash flows for the years then ended in conformity with International Financial Reporting Standards as issued by the International Accounting Standards Board.
We also have audited, in accordance with the standards of the Public Company Accounting Oversight Board (United States), IAMGOLD Corporation’s internal control over financial reporting as of December 31, 2014, based on the criteria established in Internal Control - Integrated Framework (2013) issued by the Committee of Sponsoring Organizations of the Treadway Commission (COSO), and our report dated February 18, 2015 expressed an unqualified opinion on the effectiveness of IAMGOLD Corporation’s internal control over financial reporting.

Chartered Professional Accountants, Licensed Public Accountants
February 18, 2015
Toronto, Canada
IAMGOLD CORPORATION
2014 CONSOLIDATED FINANCIAL STATEMENTS
PAGE 40
REPORT OF INDEPENDENT REGISTERED PUBLIC ACCOUNTING FIRM ON INTERNAL CONTROL OVER FINANCIAL REPORTING
To the Shareholders of IAMGOLD Corporation
We have audited IAMGOLD Corporation’s internal control over financial reporting as of December 31, 2014, based on criteria established in Internal Control - Integrated Framework (2013) issued by the Committee of Sponsoring Organizations of the Treadway Commission (COSO). IAMGOLD Corporation’s management is responsible for maintaining effective internal control over financial reporting and for its assessment of the effectiveness of internal control over financial reporting, included in the accompanying management’s report on internal control over financial reporting. Our responsibility is to express an opinion on the Company’s internal control over financial reporting based on our audit.
We conducted our audit in accordance with the standards of the Public Company Accounting Oversight Board (United States). Those standards require that we plan and perform the audit to obtain reasonable assurance about whether effective internal control over financial reporting was maintained in all material respects. Our audit included obtaining an understanding of internal control over financial reporting, assessing the risk that a material weakness exists, and testing and evaluating the design and operating effectiveness of internal control based on the assessed risk. Our audit also included performing such other procedures as we considered necessary in the circumstances. We believe that our audit provides a reasonable basis for our opinion.
A company’s internal control over financial reporting is a process designed to provide reasonable assurance regarding the reliability of financial reporting and the preparation of financial statements for external purposes in accordance with generally accepted accounting principles. A company’s internal control over financial reporting includes those policies and procedures that (1) pertain to the maintenance of records that, in reasonable detail, accurately and fairly reflect the transactions and dispositions of the assets of the company; (2) provide reasonable assurance that transactions are recorded as necessary to permit preparation of financial statements in accordance with generally accepted accounting principles, and that receipts and expenditures of the company are being made only in accordance with authorizations of management and directors of the company; and (3) provide reasonable assurance regarding prevention or timely detection of unauthorized acquisition, use, or disposition of the company’s assets that could have a material effect on the financial statements.
Because of its inherent limitations, internal control over financial reporting may not prevent or detect misstatements. Also, projections of any evaluation of effectiveness to future periods are subject to the risk that controls may become inadequate because of changes in conditions, or that the degree of compliance with the policies or procedures may deteriorate.
In our opinion, IAMGOLD Corporation maintained, in all material respects, effective internal control over financial reporting as of December 31, 2014, based on criteria established in Internal Control - Integrated Framework (2013) issued by the Committee of Sponsoring Organizations of the Treadway Commission (COSO).
We also have audited, in accordance with Canadian generally accepted auditing standards and the standards of the Public Company Accounting Oversight Board (United States), the consolidated balance sheets of IAMGOLD Corporation as of December 31, 2014 and December 31, 2013, and the related consolidated statements of earnings, comprehensive income, changes in equity and cash flows for the years then ended, and our report dated February 18, 2015 expressed an unqualified opinion on those consolidated financial statements.
Chartered Professional Accountants, Licensed Public Accountants
February 18, 2015
Toronto, Canada
IAMGOLD CORPORATION
2014 CONSOLIDATED FINANCIAL STATEMENTS
PAGE 41
| (In millions of U.S. dollars) |
Notes | December 31, 2014 |
December 31, 2013 |
|||||||
| Assets |
||||||||||
| Current assets |
||||||||||
| Cash and cash equivalents |
7 | $ | 158.5 | $ | 222.3 | |||||
| Gold bullion (market value - $162.5; December 31, 2013 - $162.3) |
8 | 96.9 | 96.9 | |||||||
| Income taxes receivable |
0.2 | 37.2 | ||||||||
| Receivables and other current assets |
9 | 55.5 | 80.0 | |||||||
| Inventories |
10 | 245.1 | 300.2 | |||||||
| Assets held for sale |
6(d) | 628.5 | — | |||||||
|
|
|
|
|
|||||||
| 1,184.7 | 736.6 | |||||||||
|
|
|
|
|
|||||||
| Non-current assets |
||||||||||
| Deferred income tax assets |
11 | — | 74.0 | |||||||
| Investments in associates and joint ventures |
12 | 56.4 | 65.5 | |||||||
| Property, plant and equipment |
13 | 2,152.9 | 2,520.4 | |||||||
| Exploration and evaluation assets |
15 | 544.8 | 533.3 | |||||||
| Income taxes receivable |
67.4 | 31.6 | ||||||||
| Other assets |
14 | 216.6 | 229.0 | |||||||
|
|
|
|
|
|||||||
| 3,038.1 | 3,453.8 | |||||||||
|
|
|
|
|
|||||||
| $ | 4,222.8 | $ | 4,190.4 | |||||||
|
|
|
|
|
|||||||
| Liabilities and Equity |
||||||||||
| Current liabilities |
||||||||||
| Accounts payable and accrued liabilities |
$ | 169.5 | $ | 185.6 | ||||||
| Income taxes payable |
8.7 | 12.1 | ||||||||
| Current portion of provisions |
16 | 13.7 | 11.4 | |||||||
| Other liabilities |
17 | 36.2 | 6.2 | |||||||
| Liabilities held for sale |
6(d) | 167.0 | — | |||||||
|
|
|
|
|
|||||||
| 395.1 | 215.3 | |||||||||
|
|
|
|
|
|||||||
| Non-current liabilities |
||||||||||
| Deferred income tax liabilities |
11 | 165.5 | 212.3 | |||||||
| Provisions |
16 | 297.7 | 247.0 | |||||||
| Long-term debt |
18(a) | 641.7 | 640.3 | |||||||
| Other liabilities |
17 | 59.2 | 3.0 | |||||||
|
|
|
|
|
|||||||
| 1,164.1 | 1,102.6 | |||||||||
|
|
|
|
|
|||||||
| 1,559.2 | 1,317.9 | |||||||||
|
|
|
|
|
|||||||
| Equity |
||||||||||
| Equity attributable to IAMGOLD Corporation shareholders |
||||||||||
| Common shares |
22 | 2,322.7 | 2,317.6 | |||||||
| Contributed surplus |
38.2 | 35.2 | ||||||||
| Retained earnings |
301.2 | 465.1 | ||||||||
| Accumulated other comprehensive income (loss) |
(43.6 | ) | 13.3 | |||||||
|
|
|
|
|
|||||||
| 2,618.5 | 2,831.2 | |||||||||
| Non-controlling interests |
23 | 45.1 | 41.3 | |||||||
|
|
|
|
|
|||||||
| 2,663.6 | 2,872.5 | |||||||||
|
|
|
|
|
|||||||
| Contingencies and commitments |
16(b), 34 | |||||||||
|
|
|
|
|
|||||||
| $ | 4,222.8 | $ | 4,190.4 | |||||||
|
|
|
|
|
|||||||
The accompanying notes are an integral part of these consolidated financial statements.
IAMGOLD CORPORATION
2014 CONSOLIDATED FINANCIAL STATEMENTS
PAGE 42
CONSOLIDATED STATEMENTS OF EARNINGS
| Years ended December 31, |
||||||||||
| (In millions of U.S. dollars, except per share amounts) |
Notes | 2014 | 2013 | |||||||
| Continuing Operations |
||||||||||
| Revenues |
$ | 1,007.9 | $ | 947.5 | ||||||
|
|
|
|
|
|||||||
| Cost of sales |
26 | 892.9 | 668.5 | |||||||
| General and administrative expenses |
27 | 44.8 | 48.4 | |||||||
| Exploration expenses |
42.7 | 69.2 | ||||||||
| Impairment charges |
33 | — | 888.1 | |||||||
| Other expenses |
28 | 70.1 | 1.6 | |||||||
|
|
|
|
|
|||||||
| Operating costs |
1,050.5 | 1,675.8 | ||||||||
|
|
|
|
|
|||||||
| Losses from operations |
(42.6 | ) | (728.3 | ) | ||||||
| Share of net losses from investments in associates and joint ventures, net of income taxes |
12 | (26.2 | ) | (67.4 | ) | |||||
| Finance costs |
29 | (26.5 | ) | (22.9 | ) | |||||
| Foreign exchange losses |
(8.2 | ) | (4.9 | ) | ||||||
| Interest income and derivatives and other investment losses |
30 | (40.2 | ) | (102.1 | ) | |||||
|
|
|
|
|
|||||||
| Losses before income taxes |
(143.7 | ) | (925.6 | ) | ||||||
| Income taxes |
11 | (117.9 | ) | 34.9 | ||||||
|
|
|
|
|
|||||||
| Net losses from continuing operations |
(261.6 | ) | (890.7 | ) | ||||||
| Net earnings from discontinued operations, net of income taxes |
6(a) | 62.7 | 30.1 | |||||||
|
|
|
|
|
|||||||
| Net losses |
$ | (198.9 | ) | $ | (860.6 | ) | ||||
|
|
|
|
|
|||||||
| Net losses from continuing operations attributable to |
||||||||||
| Equity holders of IAMGOLD Corporation |
$ | (269.5 | ) | $ | (862.6 | ) | ||||
| Non-controlling interests |
7.9 | (28.1 | ) | |||||||
|
|
|
|
|
|||||||
| Net losses from continuing operations |
$ | (261.6 | ) | $ | (890.7 | ) | ||||
|
|
|
|
|
|||||||
| Net losses attributable to |
||||||||||
| Equity holders of IAMGOLD Corporation |
$ | (206.8 | ) | $ | (832.5 | ) | ||||
| Non-controlling interests |
7.9 | (28.1 | ) | |||||||
|
|
|
|
|
|||||||
| Net losses |
$ | (198.9 | ) | $ | (860.6 | ) | ||||
|
|
|
|
|
|||||||
| Attributable to equity holders of IAMGOLD Corporation |
||||||||||
| Weighted average number of common shares outstanding (in millions) |
24 | |||||||||
| Basic and diluted |
376.8 | 376.6 | ||||||||
| Losses per share from continuing operations ($ per share) |
||||||||||
| Basic |
$ | (0.72 | ) | $ | (2.29 | ) | ||||
| Diluted |
$ | (0.72 | ) | $ | (2.29 | ) | ||||
| Earnings per share from discontinued operation ($ per share) |
||||||||||
| Basic |
$ | 0.17 | $ | 0.08 | ||||||
| Diluted |
$ | 0.17 | $ | 0.08 | ||||||
| Net losses per share including discontinued operations ($ per share) |
||||||||||
| Basic |
$ | (0.55 | ) | $ | (2.21 | ) | ||||
| Diluted |
$ | (0.55 | ) | $ | (2.21 | ) | ||||
The accompanying notes are an integral part of these consolidated financial statements.
IAMGOLD CORPORATION
2014 CONSOLIDATED FINANCIAL STATEMENTS
PAGE 43
CONSOLIDATED STATEMENTS OF COMPREHENSIVE INCOME
| Years ended December 31, |
||||||||||
| (In millions of U.S. dollars) |
Notes | 2014 | 2013 | |||||||
| Net losses |
$ | (198.9 | ) | $ | (860.6 | ) | ||||
|
|
|
|
|
|||||||
| Other comprehensive loss, net of income taxes |
||||||||||
| Items that will not be reclassified to profit or loss |
||||||||||
| Movement in marketable securities fair value reserve |
||||||||||
| Net unrealized change in fair value of marketable securities |
(9.1 | ) | (46.9 | ) | ||||||
| Net realized change in fair value of marketable securities |
19(b) | 5.2 | 13.5 | |||||||
| Tax impact |
(0.5 | ) | 4.6 | |||||||
|
|
|
|
|
|||||||
| (4.4 | ) | (28.8 | ) | |||||||
|
|
|
|
|
|||||||
| Items that may be reclassified to profit or loss |
||||||||||
| Movement in cash flow hedge fair value reserve from continuing operations |
||||||||||
| Effective portion of changes in fair value of cash flow hedges |
19(c) | (2.1 | ) | — | ||||||
| Time value of options and forward element of forward contracts excluded from hedge relationship |
19(c) | (5.1 | ) | — | ||||||
| Net change in fair value of cash flow hedge reclassified |
19(c) | (2.6 | ) | — | ||||||
| Net change in time value of options and forward element of forward contracts reclassified |
19(c) | 2.3 | — | |||||||
| Tax impact |
0.4 | — | ||||||||
| Movement in cash flow hedge fair value reserve from discontinued operations, net of tax |
(1.6 | ) | — | |||||||
|
|
|
|
|
|||||||
| (8.7 | ) | — | ||||||||
|
|
|
|
|
|||||||
| Currency translation adjustment |
(2.7 | ) | (0.3 | ) | ||||||
| Other from discontinued operations |
1.8 | 1.4 | ||||||||
|
|
|
|
|
|||||||
| Total other comprehensive loss |
(14.0 | ) | (27.7 | ) | ||||||
|
|
|
|
|
|||||||
| Comprehensive loss |
$ | (212.9 | ) | $ | (888.3 | ) | ||||
|
|
|
|
|
|||||||
| Comprehensive loss attributable to |
||||||||||
| Equity holders of IAMGOLD Corporation |
$ | (220.8 | ) | $ | (860.2 | ) | ||||
| Non-controlling interests |
7.9 | (28.1 | ) | |||||||
|
|
|
|
|
|||||||
| $ | (212.9 | ) | $ | (888.3 | ) | |||||
|
|
|
|
|
|||||||
| Total comprehensive loss attributable to equity holders arises from: |
||||||||||
| Comprehensive loss from continuing operations |
$ | (275.8 | ) | $ | (918.4 | ) | ||||
| Comprehensive income from discontinued operations |
62.9 | 30.1 | ||||||||
|
|
|
|
|
|||||||
| Comprehensive loss |
$ | (212.9 | ) | $ | (888.3 | ) | ||||
|
|
|
|
|
|||||||
The accompanying notes are an integral part of these consolidated financial statements.
IAMGOLD CORPORATION
2014 CONSOLIDATED FINANCIAL STATEMENTS
PAGE 44
CONSOLIDATED STATEMENTS OF CHANGES IN EQUITY
| Years ended December 31, | ||||||||||
| (In millions of U.S. dollars) |
Notes | 2014 | 2013 | |||||||
| Common shares |
||||||||||
| Balance, beginning of the year |
$ | 2,317.6 | $ | 2,315.8 | ||||||
| Issued shares for share based compensation |
5.1 | 1.8 | ||||||||
|
|
|
|
|
|||||||
| Balance, end of the year |
2,322.7 | 2,317.6 | ||||||||
|
|
|
|
|
|||||||
| Contributed surplus |
||||||||||
| Balance, beginning of the year |
35.2 | 26.7 | ||||||||
| Issued shares for share based compensation |
(5.1 | ) | (1.6 | ) | ||||||
| Share based compensation |
25 | 8.1 | 10.1 | |||||||
|
|
|
|
|
|||||||
| Balance, end of the year |
38.2 | 35.2 | ||||||||
|
|
|
|
|
|||||||
| Retained earnings |
||||||||||
| Balance, beginning of the year |
465.1 | 1,343.2 | ||||||||
| IFRS 9 transition adjustment, net of income taxes |
4 | 41.1 | — | |||||||
|
|
|
|
|
|||||||
| Adjusted balance, beginning of the year |
506.2 | 1,343.2 | ||||||||
| Net losses attributable to equity holders of IAMGOLD Corporation |
(206.8 | ) | (832.5 | ) | ||||||
| Dividends to equity holders of IAMGOLD Corporation |
— | (47.0 | ) | |||||||
| Other |
1.8 | 1.4 | ||||||||
|
|
|
|
|
|||||||
| Balance, end of the year |
301.2 | 465.1 | ||||||||
|
|
|
|
|
|||||||
| Accumulated other comprehensive income (loss) |
||||||||||
| Marketable securities fair value reserve |
||||||||||
| Balance, beginning of the year |
13.6 | 42.4 | ||||||||
| IFRS 9 transition adjustment, net of income taxes |
4 | (41.1 | ) | — | ||||||
|
|
|
|
|
|||||||
| Adjusted balance, beginning of the year |
(27.5 | ) | 42.4 | |||||||
| Net change in fair value of marketable securities, net of income taxes |
(4.4 | ) | (28.8 | ) | ||||||
|
|
|
|
|
|||||||
| Balance, end of the year |
(31.9 | ) | 13.6 | |||||||
|
|
|
|
|
|||||||
| Cash flow hedge fair value reserve |
||||||||||
| Balance, beginning of the year |
— | — | ||||||||
| Net change in fair value of cash flow hedges, net of income taxes |
(8.7 | ) | — | |||||||
|
|
|
|
|
|||||||
| Balance, end of the year |
(8.7 | ) | — | |||||||
|
|
|
|
|
|||||||
| Currency translation adjustment |
||||||||||
| Balance, beginning of the year |
(0.3 | ) | — | |||||||
| Change for the year |
(2.7 | ) | (0.3 | ) | ||||||
|
|
|
|
|
|||||||
| Balance, end of the year |
(3.0 | ) | (0.3 | ) | ||||||
|
|
|
|
|
|||||||
| Total accumulated other comprehensive income (loss) |
(43.6 | ) | 13.3 | |||||||
|
|
|
|
|
|||||||
| Equity attributable to IAMGOLD Corporation shareholders |
2,618.5 | 2,831.2 | ||||||||
|
|
|
|
|
|||||||
| Non-controlling interests |
||||||||||
| Balance, beginning of the year |
41.3 | 76.7 | ||||||||
| Net earnings (losses) attributable to non-controlling interests |
7.9 | (28.1 | ) | |||||||
| Dividends to non-controlling interests |
23 | (4.1 | ) | (7.3 | ) | |||||
|
|
|
|
|
|||||||
| Balance, end of the year |
45.1 | 41.3 | ||||||||
|
|
|
|
|
|||||||
| $ | 2,663.6 | $ | 2,872.5 | |||||||
|
|
|
|
|
|||||||
The accompanying notes are an integral part of these consolidated financial statements.
IAMGOLD CORPORATION
2014 CONSOLIDATED FINANCIAL STATEMENTS
PAGE 45
CONSOLIDATED STATEMENTS OF CASH FLOWS
| Years ended December 31, |
||||||||||
| (In millions of U.S. dollars) |
Notes | 2014 | 2013 | |||||||
| Operating activities |
||||||||||
| Net losses |
$ | (198.9 | ) | $ | (860.6 | ) | ||||
| Adjustments for: |
||||||||||
| Finance costs |
28.0 | 24.4 | ||||||||
| Depreciation expense |
231.2 | 175.2 | ||||||||
| Changes in estimates of asset retirement obligations at closed sites |
48.7 | (8.8 | ) | |||||||
| Income taxes |
155.1 | (9.2 | ) | |||||||
| Impairment charges (reversals) of investments in associates and marketable securities |
(3.4 | ) | 69.1 | |||||||
| Impairment charges |
— | 888.1 | ||||||||
| Share of net losses from investments in associates and joint ventures, net of income taxes |
12 | 26.2 | 83.9 | |||||||
| Effects of exchange rate fluctuation on cash and cash equivalents |
9.2 | 0.5 | ||||||||
| Other non-cash items |
32(a) | 68.3 | 63.6 | |||||||
| Adjustments for cash items |
32(b) | (14.5 | ) | 7.4 | ||||||
| Movements in non-cash working capital items and non-current ore stockpiles |
32(c) | (5.1 | ) | (59.3 | ) | |||||
|
|
|
|
|
|||||||
| Cash from operating activities, before income taxes paid |
344.8 | 374.3 | ||||||||
| Income taxes paid |
(32.6 | ) | (128.0 | ) | ||||||
|
|
|
|
|
|||||||
| Net cash from operating activities |
312.2 | 246.3 | ||||||||
|
|
|
|
|
|||||||
| Investing activities |
||||||||||
| Property, plant and equipment |
||||||||||
| Capital expenditures |
(343.7 | ) | (617.4 | ) | ||||||
| Capitalized borrowing costs |
(22.1 | ) | (19.5 | ) | ||||||
| Proceeds on sales and leaseback |
13 | 31.5 | — | |||||||
| Proceeds from disposals |
2.4 | 1.4 | ||||||||
| Advances to related parties |
35 | (10.1 | ) | (57.7 | ) | |||||
| Repayment from related parties |
35 | 24.8 | 10.0 | |||||||
| Capital expenditures for exploration and evaluation assets |
(10.9 | ) | — | |||||||
| Other investing activities |
32(d) | 8.4 | (5.1 | ) | ||||||
|
|
|
|
|
|||||||
| Net cash used in investing activities |
(319.7 | ) | (688.3 | ) | ||||||
|
|
|
|
|
|||||||
| Financing activities |
||||||||||
| Dividends paid |
(4.1 | ) | (102.4 | ) | ||||||
| Interest paid |
(22.7 | ) | (25.8 | ) | ||||||
| Other |
(8.3 | ) | (4.3 | ) | ||||||
|
|
|
|
|
|||||||
| Net cash used in financing activities |
(35.1 | ) | (132.5 | ) | ||||||
|
|
|
|
|
|||||||
| Effects of exchange rate fluctuation on cash and cash equivalents |
(9.2 | ) | (0.5 | ) | ||||||
|
|
|
|
|
|||||||
| Decrease in cash and cash equivalents |
(51.8 | ) | (575.0 | ) | ||||||
| Cash and cash equivalents, beginning of the year |
222.3 | 797.3 | ||||||||
| Cash and cash equivalents held for sale |
6(c) | (12.0 | ) | — | ||||||
|
|
|
|
|
|||||||
| Cash and cash equivalents, end of the year |
$ | 158.5 | $ | 222.3 | ||||||
|
|
|
|
|
|||||||
The accompanying notes are an integral part of these consolidated financial statements.
IAMGOLD CORPORATION
2014 CONSOLIDATED FINANCIAL STATEMENTS
PAGE 46
NOTES TO CONSOLIDATED FINANCIAL STATEMENTS
FOR THE YEAR ENDED DECEMBER 31, 2014
(Amounts in notes and in tables are in millions of U.S. dollars, except where otherwise indicated)
| 1. | CORPORATE INFORMATION |
IAMGOLD Corporation (“IAMGOLD” or “the Company”) is a corporation governed by the Canada Business Corporations Act and domiciled in Canada whose shares are publicly traded. The address of the Company’s registered office is 401 Bay Street, Suite 3200, Toronto, Ontario, Canada.
The principal activities of the Company are the exploration, development and operation of gold mining properties.
| 2. | BASIS OF PREPARATION |
| (a) | Statement of compliance |
These consolidated financial statements, as at and for the year ended December 31, 2014, have been prepared in accordance with International Financial Reporting Standards (“IFRS”) as issued by the International Accounting Standards Board (“IASB”).
These consolidated financial statements were prepared on a going concern basis. The significant accounting policies applied in these consolidated financial statements are presented in note 3 and are based on IFRS effective as at December 31, 2014.
The consolidated financial statements of IAMGOLD were authorized for issue in accordance with a resolution of the Board of Directors on February 18, 2015.
Certain 2013 comparative figures have been adjusted to conform to the consolidated financial statement presentation adopted in 2014. Refer to note 6.
| (b) | Basis of measurement |
The consolidated financial statements have been prepared on a historical cost basis, except for items measured at fair value as discussed in note 20.
| (c) | Basis of consolidation |
Subsidiaries and investments in associates and joint ventures related to significant properties of the Company are accounted for as outlined below.
| Name |
Property - Location |
December 31, 2014 |
December 31, 2013 |
Type of Arrangement |
Accounting Method | |||||||||||
| Rosebel Gold Mines N.V. |
Rosebel mine - Suriname |
95 | % | 95 | % | Subsidiary | Consolidation | |||||||||
| Essakane S.A. |
Essakane mine - Burkina Faso |
90 | % | 90 | % | Subsidiary | Consolidation | |||||||||
| Doyon division including the Westwood mine1 |
Doyon division - Canada |
100 | % | 100 | % | Division | Consolidation | |||||||||
| Niobec Inc.2 |
Niobec mine - Canada |
100 | % | 100 | % | Subsidiary | Consolidation | |||||||||
| Trelawney Mining and Exploration Inc.3 |
Côté Gold project - Canada |
100 | % | 100 | % | Subsidiary | Consolidation | |||||||||
| Société d’Exploitation des Mines d’Or de Sadiola S.A. |
Sadiola mine - Mali |
41 | % | 41 | % | Joint venture | Equity accounting | |||||||||
| Société d’Exploitation des Mines d’Or de Yatela S.A. |
Yatela mine - Mali |
40 | % | 40 | % | Joint venture | Equity accounting | |||||||||
| Galane Gold Ltd.4 |
Mupane mine - Botswana |
42 | % | 43 | % | Associate | Equity accounting | |||||||||
| INV Metals Inc.4 |
Loma Larga project - Ecuador |
47 | % | 47 | % | Associate | Equity accounting | |||||||||
| 1 | Division of IAMGOLD Corporation. |
| 2 | Niobec was classified as held for sale. Refer to note 6. |
| 3 | Trelawney Mining and Exploration Inc., owns a 92.5% interest in the Côté Gold project. |
| 4 | Galane Gold Ltd and INV Metals Inc. are incorporated in Canada. |
IAMGOLD CORPORATION
2014 CONSOLIDATED FINANCIAL STATEMENTS
PAGE 47
| (i) | Subsidiaries |
Subsidiaries are entities controlled by the Company. Control is achieved when the Company has the ability to direct the relevant activities, including financial and operating activities, of an entity to affect its returns. The Company has control over the consolidated entities through ownership of the voting power. Subsidiaries are consolidated from the acquisition date, which is the date on which the Company obtains control of the acquired entity. Where the Company’s interest in a subsidiary is less than 100%, the Company recognizes a non-controlling interest. All intercompany balances, transactions, income, expenses and profits and losses have been eliminated on consolidation.
| (ii) | Joint arrangements |
Joint arrangements are those arrangements over which the Company has joint control established by contractual agreement and requiring unanimous consent of the joint venture parties for financial and operating decisions. The Company’s significant joint arrangements consist of joint ventures, which are structured through separate legal entities. The financial results of joint ventures are accounted for using the equity method from the date that joint control commences until the date that joint control ceases, and are prepared for the same reporting period as the Company, using consistent accounting policies. There are no significant judgments and assumptions made in determining the existence of joint control of either Société d’Exploitation des Mines d’Or de Sadiola S.A. or Société d’Exploitation des Mines d’Or de Yatela S.A.
Losses from joint ventures are recognized in the consolidated financial statements until the carrying amount of the interest in the joint venture is reduced to nil. Thereafter, losses are recognized only to the extent that the Company has an obligation to fund the joint venture’s operations or has made payments on behalf of the joint venture.
| (iii) | Associates |
Associates are those entities over which the Company has significant influence and that are neither subsidiaries nor interests in joint arrangements, and are accounted for using the equity method. Significant influence is the ability to participate in the financial and operating policy decisions of the entity without having control or joint control over those policies. The Company’s share of net earnings (losses) from investments in associates is recognized in the consolidated statements of earnings and accounted for as an increase (decrease) in investments in associates in the consolidated balance sheets. The cash received from investments in associates is accounted for as a decrease of investments in associates in the consolidated balance sheets. The Company has concluded that it has significant influence over its investments in Galane Gold Ltd. (“Galane”) and INV Metals Inc. (“INV Metals”) through the level of ownership of voting rights. The Company has assessed additional facts and circumstances, including voting rights and board appointments, and concluded that there is no clear evidence of control of either Galane or INV Metals.
Losses from associates are recognized in the consolidated financial statements until the carrying amount of the interest in the associate is reduced to nil. Thereafter, losses are recognized only to the extent that the Company has an obligation to fund the associate’s operations or has made payments on behalf of the associate.
| (d) | Functional and presentation currency |
The functional currency of the Company’s subsidiaries, joint ventures and associates is the U.S. dollar, other than INV Metals whose functional currency is the Canadian dollar.
Transactions denominated in foreign currencies are translated into the U.S. dollar as follows:
| • | Monetary assets and liabilities are translated at the exchange rate in effect at the balance sheet date; |
| • | Non-monetary assets and liabilities are translated at historical exchange rates prevailing at each transaction date; and |
| • | Revenues and expenses are translated at the average exchange rates throughout the reporting period, except depreciation, depletion and amortization, which are translated at the rates of exchange applicable to the related assets, and share-based compensation expense, which is translated at the rates of exchange applicable at the date of grant of the share-based compensation. |
Exchange gains and losses on translation are included in the consolidated statements of earnings. When a gain or loss on certain non-monetary items, such as financial assets at fair value through other comprehensive income, is recognized in other comprehensive income (“OCI”), the translation differences are also recognized in OCI.
For any subsidiaries, joint ventures or associates whose functional currency is other than the U.S. dollar, foreign currency balances and transactions are translated into U.S. dollars. Assets and liabilities are translated at the exchange rate in effect at the balance sheet date. Revenues and expenses are translated at average exchange rates throughout the reporting period or at rates that approximate the actual exchange rates. Exchange gains and losses on translation are included in OCI. The cumulative amount of the exchange differences is presented as a separate component of equity until disposal of the foreign operation.
IAMGOLD CORPORATION
2014 CONSOLIDATED FINANCIAL STATEMENTS
PAGE 48
| 3. | SUMMARY OF SIGNIFICANT ACCOUNTING POLICIES |
The accounting policies set out below have been applied consistently by the Company, its subsidiaries, joint arrangements and associates in all periods presented in these consolidated financial statements.
| (a) | Financial instruments |
The Company recognizes financial assets and financial liabilities on the date the Company becomes a party to the contractual provisions of the instruments. A financial asset is derecognized either when the Company has transferred substantially all the risks and rewards of ownership of the financial asset or when cash flows expire. A financial liability is derecognized when the obligation specified in the contract is discharged, canceled or expired. Certain financial instruments are recorded at fair value in the consolidated balance sheets. Refer to note 20 on fair value determination.
| (i) | Non-derivative financial instruments |
Non-derivative financial instruments are recognized initially at fair value plus attributable transaction costs, where applicable for financial instruments not classified as fair value through profit or loss. Subsequent to initial recognition, non-derivative financial instruments are classified and measured as described below.
Financial assets at fair value through profit or loss
Cash and cash equivalents, restricted cash, short-term investments, bond fund investments and warrants are classified as financial assets at fair value through profit or loss and are measured at fair value. Cash equivalents and restricted cash are short-term investments with initial maturities of three months or less. Short-term investments have initial maturities of more than three months. The unrealized gains or losses related to changes in fair value are reported in interest income and derivatives and other investment gains (losses) in the consolidated statements of earnings.
Amortized cost
Trade and other receivables and fixed rate investments are classified as and measured at amortized cost using the effective interest rate method, less impairment losses, if any.
Financial assets at fair value through other comprehensive income
The Company’s investments in equity marketable securities are designated as financial assets at fair value through other comprehensive income and are recorded at fair value on the trade date with directly attributable transaction costs included in the recorded amount. Subsequent changes in fair value are recognized in other comprehensive income.
Non-derivative financial liabilities
Accounts payable, senior unsecured notes, and borrowings related to the credit facility are accounted for at amortized cost, using the effective interest rate method. The amortization of senior unsecured notes issue costs is calculated using the effective interest rate method, and the amortization of credit facility issue costs is calculated on a straight-line basis over the term of the credit facility.
| (ii) | Derivative financial instruments |
The Company may hold derivative financial instruments to hedge its risk exposure to fluctuations of other currencies compared to the U.S. dollar, and fluctuations in commodity prices such as for oil, aluminum and gold. All derivative instruments not designated in a hedge relationship that qualifies for hedge accounting are classified as financial instruments at fair value through profit or loss.
Derivative financial instruments at fair value through profit or loss, including embedded derivatives in financial liabilities measured at amortized cost, are recorded in the consolidated balance sheets at fair value. Subsequent to initial recognition, these derivatives are measured at fair value. The fair value of derivative financial instruments is based on forward rates considering the market price, rate of interest and volatility and takes into account the credit risk of the financial instrument.
Changes in estimated fair value at each reporting date are included in the consolidated statements of earnings as derivative gains or losses.
Embedded derivatives in financial liabilities measured at amortized cost are separated from the host contract and accounted for separately if the economic characteristics and risks of the host contract and the embedded derivative are not closely related.
| (iii) | Hedges |
The Company uses derivative financial instruments to hedge its exposure to exchange rate fluctuations on foreign currency denominated revenues, operating expenses and purchases of non-financial assets and its exposure to price fluctuations of consumable purchases.
IAMGOLD CORPORATION
2014 CONSOLIDATED FINANCIAL STATEMENTS
PAGE 49
The Company formally documents all relationships between hedging instruments and hedged items, as well as its risk management objectives and strategies for undertaking hedge transactions. This process includes linking all derivative hedging instruments to forecasted transactions. Hedge effectiveness is assessed based on the degree to which the cash flows from the derivative contracts are expected to offset the cash flows of the underlying transaction being hedged.
When a derivative is designated as a cash flow hedging instrument, the effective portion of changes in fair value is recognized in other comprehensive income, net of tax. For hedge items other than the purchase of non-financial assets, the amounts accumulated in other comprehensive income are classified to the consolidated statement of earnings when the underlying hedged transaction, identified at contract inception, affects profit or loss. When hedging a forecasted transaction results in the recognition of a non-financial asset, the amounts accumulated in other comprehensive income are classified to the carrying amount of the non-financial asset.
Any ineffective portion of a hedge relationship is recognized immediately in the consolidated statements of earnings. The Company has elected to exclude the time value component of options and the forward element of forward contracts from the hedging relationships, with these amounts recorded in other comprehensive income as a cost of hedging. For hedge items other than the purchase of non-financial assets, the cost of hedging amounts are classified to the consolidated statement of earnings when the underlying hedged transaction affects profit or loss. When hedging a forecasted transaction that results in the recognition of a non-financial asset, cost of hedging amounts are classified to the carrying amount of the non-financial asset.
When derivative contracts designated as cash flow hedges are terminated, expired, sold or no longer qualify for hedge accounting, hedge accounting is discontinued prospectively. Any amounts recorded in other comprehensive income up until the time the contracts do not qualify for hedge accounting remain in other comprehensive income. Amounts recognized in other comprehensive income are recognized in the consolidated statement of earnings in the period in which the underlying hedged transaction is completed. Gains or losses arising subsequent to the derivative contracts not qualifying for hedge accounting are recognized in the period incurred in the consolidated statement of earnings.
If the forecasted transaction is no longer expected to occur, then the amounts accumulated in other comprehensive income are reclassified to the consolidated statement of earnings immediately.
| (b) | Gold bullion |
Investments in gold bullion are measured at the lower of average cost and net realizable value.
| (c) | Inventories |
Gold and niobium production inventories, concentrate inventory, and ore stockpiles are measured at the lower of weighted average production cost and net realizable value. Mine supplies are measured at the lower of average purchase cost and net realizable value. Net realizable value is calculated as the difference between the estimated selling price and estimated costs to complete processing into a saleable form and variable selling expenses.
Production costs include the cost of materials, labour, mine site production overheads and depreciation to the applicable stage of processing.
The cost of ore stockpiles is increased based on the related current cost of production for the period, and decreases in stockpiles are charged to cost of sales using the weighted average cost per tonne. Stockpiles are segregated between current and non-current inventories in the consolidated balance sheets based on the period of planned usage.
Provisions are recorded to reduce the carrying amount of inventory to net realizable value to reflect changes in grades, quantity or other economic factors and to reflect current intentions for the use of redundant or slow-moving items. Provisions for redundant and slow-moving items are made by reference to specific items of inventory. The Company reverses write-downs where there is a subsequent increase in net realizable value and where the inventory is still on hand.
Spare parts, stand-by and servicing equipment held are generally classified as inventories. Major capital spare parts and stand-by equipment (insurance spares) are classified as a component of property, plant and equipment.
| (d) | Property, plant and equipment |
Property, plant and equipment are measured at cost less accumulated depreciation and accumulated impairment charges.
The initial cost of an asset comprises its purchase or construction cost, any costs directly attributable to bringing the asset to a working condition for its intended use, the initial estimate of the rehabilitation obligation, and for qualifying assets, borrowing costs. Qualifying assets are defined as assets that require more than six months to be brought to the location and condition intended by management. Capitalization of borrowing costs ceases when such assets are ready for their intended use.
The purchase price or the construction cost is the aggregate cash paid and the fair value of any other consideration given to acquire the asset.
IAMGOLD CORPORATION
2014 CONSOLIDATED FINANCIAL STATEMENTS
PAGE 50
Gains and losses on disposal of an item of property, plant and equipment are determined by comparing the proceeds from disposal with the carrying amount of property, plant and equipment, and are recognized in the consolidated statements of earnings in other operating costs.
The cost of replacing part of an item of property, plant and equipment is recognized in the carrying amount of the item if it is probable that the future economic benefits embodied within the part will flow to the Company and its cost can be measured reliably. The carrying amount of the replaced part is derecognized. Costs of the day-to-day servicing of property, plant and equipment are recognized in the consolidated statements of earnings as incurred.
Property, plant and equipment presented in the consolidated balance sheets represent the capitalized expenditures related to:
| • | Construction in progress, and |
| • | the operation of mineral properties in the production stage, including: |
| • | mining properties, which include expected economic conversions of resources to reserves, recorded in a business combination or an asset acquisition and capitalized stripping costs, and |
| • | plant and equipment, including corporate assets. |
| a. | Construction in progress |
Upon determination of technical feasibility and commercial viability of extracting a mineral resource, the related exploration and evaluation assets (refer to note 3(f) below), which include expected economic conversions of resources to reserves, recorded in a business combination or an asset acquisition, are transferred to construction in progress costs. These amounts plus all subsequent mine development costs are capitalized. Costs are not amortized until the project is ready for use as intended by management.
Mine construction costs include expenditures to develop new ore bodies, define further mineralization in existing ore bodies, and construct, install and complete infrastructure facilities.
Borrowing costs are capitalized to the project when funds have been borrowed, either to specifically finance a project or for general borrowings during the period of construction.
The date of transition from construction to production accounting is based on both qualitative and quantitative criteria such as substantial physical project completion, sustained level of mining, sustained level of processing activity, and passage of a reasonable period of time. Upon completion of mine construction activities (based on the determination of the commencement of production), costs are removed from construction in progress assets and incorporated into the appropriate categories of property, plant and equipment and supplies inventories.
| b. | Mining properties |
Capitalized costs for exploration and evaluation on or adjacent to sites where the Company has mineral deposits, are classified as mining properties within mining assets.
| c. | Stripping costs |
Costs associated with stripping activities in an open pit mine are expensed within cost of sales unless the stripping activity can be shown to improve access to further quantities of material that will be mined in future periods, in which case, the stripping costs are capitalized. Capitalized stripping costs are included in “mining properties” within mining assets.
| d. | Plant and equipment |
Plant and equipment located at corporate locations includes the following categories of assets: furniture and equipment, computer equipment, software, scientific instruments and equipment, vehicles and leasehold improvements.
| (e) | Depreciation and amortization |
Effective from the point an asset is available for its intended use, property, plant and equipment and royalty interests are depreciated or amortized, respectively, using either the straight line or units-of-production methods over the shorter of the estimated economic life of the asset or the mining operation. Depreciation and amortization are determined based on the method which best represents the use of the assets.
The reserve and resource estimates for each mining operation are the prime determinants of the life of a mine. In general, when the useful life of property, plant and equipment is akin to the life of the mining operating and the ore body’s mineralization is reasonably well defined, the asset is depreciated on a units-of-production basis over its proven and probable mineral reserves. Non-reserve material may be included in depreciation calculations in limited circumstances where there is a high degree of confidence in its economic extraction. The Company evaluates the estimate of mineral reserves and resources at least on an annual basis and adjusts the units-of-production calculation prospectively. In 2014 and 2013, the Company has not incorporated any non-reserve material in its depreciation calculations on a units-of-production basis. When property, plant and equipment are depreciated on a straight line basis, the useful life of the mining operation is determined based on the most recent life of mine (“LOM”) plan. LOM plans are typically developed annually and are based on management’s
IAMGOLD CORPORATION
2014 CONSOLIDATED FINANCIAL STATEMENTS
PAGE 51
current best estimates of optimized mine and processing plans, future operating costs and the assessment of capital expenditures of a mine site. Any change in the useful life is adjusted prospectively.
Estimated useful lives normally vary from three to fifteen years for items of plant and equipment to a maximum of twenty years for buildings.
Amounts related to expected economic conversions of resources to reserves recorded in a business combination or an asset acquisition, are not amortized until resources are converted into reserves. Amounts related to capitalized costs of exploration and evaluation assets and construction in progress are not amortized as the assets are not available for use.
Capitalized stripping costs are depreciated over the reserves that directly benefit from the specific stripping activity using the units-of-production method.
Capitalized borrowing costs are amortized over the useful life of the related asset.
Residual values, useful lives and amortization methods are reviewed at least annually and adjusted if appropriate. The impact of changes to the estimated useful lives, change in depreciation method or residual values is accounted for prospectively.
| (f) | Mineral exploration and evaluation costs |
Exploration activities relate to the collection of exploration data.
Exploration data consists of geological, geophysical, geochemical, sampling, drilling, trenching, analytical test work, assaying, mineralogical, metallurgical, and other similar information that is derived from activities undertaken to locate, investigate, define or delineate a mineral prospect or mineral deposit. Mineral exploration costs are expensed as incurred.
Evaluation costs are capitalized and relate to activities to evaluate the potential technical feasibility and commercial viability of extracting a mineral resource on sites where the Company does not have mineral deposits already being mined or constructed. The technical feasibility and commercial viability is based on management’s evaluation of the geological properties of an ore body based on information obtained through evaluation activities, including metallurgical testing, resource and reserve estimates and economic assessment whether the ore body can be mined economically. Exploration properties acquired through asset acquisitions or business combinations are also recognized as exploration and evaluation assets.
| (g) | Business combinations and goodwill |
Business combinations relate to the acquisition of an asset or a group of assets that constitute a business. For an integrated set of activities and assets to be considered a business, it needs to contain inputs, and processes. If the set of activities and assets acquired relate to an exploration stage property, the Company considers other factors to determine whether the set of activities and assets is a business such as the extent to which the acquired project has resources or reserves, and the extent and nature of the additional work to identify resources or convert resources into reserves. The Company also assesses whether the entity acquired has begun planned principal activities, has employees, necessary permits for production, intellectual property, and is pursuing a plan to produce outputs and will be able to obtain access to customers that will purchase the outputs.
Business combinations are accounted for using the acquisition method of accounting whereby identifiable assets acquired and liabilities assumed are recorded at fair value as of the date of acquisition. Mineral rights that can be reliably valued are recognized in the assessment of fair values on acquisition, including amounts attributable to expected economic conversions of resources to reserves. The excess of the purchase price over the fair value of net assets acquired is recorded as goodwill.
For non-wholly owned subsidiaries, non-controlling interests are initially recorded at the fair value of the non-controlling interests share holdings or the non-controlling interests’ proportion of the fair values of the assets and liabilities recognized at acquisition.
When a subsidiary is acquired in a number of stages, the carrying amount of interests prior to acquisition of control is re-measured to fair value on the date control is acquired. Amounts previously recognized in other comprehensive income in respect of the subsidiary are reversed, and the difference is recognized in earnings.
When the net of the amounts assigned to assets acquired and liabilities assumed exceeds the cost of purchase, the excess is recognized as negative goodwill and recorded in the consolidated statements of earnings at the date of acquisition.
Subsequent to initial recognition, goodwill is measured at cost less any accumulated impairment losses. For the purposes of impairment testing, goodwill acquired in a business combination is, from the acquisition date, allocated to cash generating units (“CGU”) that are expected to benefit from the synergies of the combination.
If a transaction does not meet the definition of a business under IFRS, the transaction is recorded as an asset acquisition. Accordingly, the net identifiable assets acquired and liabilities assumed are measured at the fair value consideration paid, based on their relative fair values at the acquisition date. Acquisition-related costs are included in the consideration paid and capitalized. No goodwill and no deferred tax asset or liability arising from the assets acquired and liabilities assumed are recognized upon the acquisition of assets.
IAMGOLD CORPORATION
2014 CONSOLIDATED FINANCIAL STATEMENTS
PAGE 52
| (h) | Other intangible assets |
Other intangible assets are related to the fair value of favourable supplier contracts accounted for on a prior acquisition. The fair value was determined using a differential cost method based on cost savings expected from favourable terms of supplier contracts. Other intangible assets are amortized under the straight-line method based on the terms of each contract, which range from 2 to 20 years. Other intangible assets are classified in other non-current assets in the consolidated balance sheets.
| (i) | Royalty interests |
The Company records its royalty interests at cost, net of accumulated depreciation and impairment charges. Royalty interests are classified in other non-current assets in the consolidated balance sheets.
| (j) | Impairment |
| (i) | Financial assets |
Financial assets measured at amortized cost are tested for impairment at each reporting date to determine whether there is any objective evidence of impairment. A financial asset is considered to be impaired if objective evidence, that can be estimated reliably, indicates that one or more events have had a negative effect on the estimated future cash flows of that asset.
An impairment loss in respect of a financial asset measured at amortized cost is calculated as the difference between its carrying amount and the present value of the estimated future cash flows discounted at the original effective interest rate.
A prior period impairment loss is tested for possible reversal of impairment whenever an event or change in circumstance indicates the impairment may have reversed. If it has been determined that the impairment has reversed, the carrying amount of the asset is increased to its recoverable amount to a maximum of the carrying amount that would have been determined had no impairment loss been recognized in prior periods. Impairment loss reversals are recognized in the consolidated statements of earnings.
The Company’s investments in equity marketable securities are designated as financial assets at fair value through other comprehensive income. Changes in fair value are recognized in other comprehensive income.
| (ii) | Non-financial assets |
The Company performs an annual impairment review on goodwill at December 31, and at any other time an indication of impairment of goodwill is identified. At December 31, 2014, the Company had no goodwill. The carrying amounts of the Company’s non-current assets, including mining assets, exploration and evaluation assets and royalty interests are reviewed at each reporting date to determine whether there is any indication of impairment. If any such indicator exists, the Company performs an impairment review.
An impairment review requires the Company to determine the recoverable amount. For goodwill, the recoverable amount is determined for the CGU to which the goodwill was allocated at the date of the business combination. For non-current assets, including mining assets, exploration and evaluation assets and royalty interests, the recoverable amount is determined for an individual asset, unless the asset does not generate cash inflows that are largely independent of those from other assets or groups of assets. If this is the case, the individual assets are grouped together into a CGU for impairment testing purposes. A CGU for impairment testing is typically considered to be an individual mine site or a development project.
The recoverable amount is determined as the higher of the CGU’s fair value less costs of disposal (“FVLCD”) and value in use (“VIU”). If the carrying amount of the asset or CGU exceeds its recoverable amount, an impairment loss is first recorded against goodwill allocated to the relevant CGU. If the impairment loss is greater than the attributable goodwill, the excess is then recorded to the other long-lived assets in the CGU on a pro rata basis.
A prior period impairment loss is tested for possible reversal of impairment whenever an event or change in circumstance indicates the impairment may have reversed. If it has been determined that the impairment has reversed, the carrying amount of the asset is increased to its recoverable amount to a maximum of the carrying amount that would have been determined had no impairment loss been recognized in prior periods. An impairment loss reversal is recognized in the consolidated statements of earnings. Impairment losses recognized in relation to goodwill are not reversed for subsequent increases in a CGU’s recoverable amount.
In the absence of market related comparative information, the FVLCD is determined based on the present value of estimated future cash flows from each long-lived asset or CGU. The assumptions used in determining the FVLCD for the CGU’s are typically LOM plans, long-term commodity prices, discount rates, foreign exchange rates, values of un-modeled mineralization and net asset value (“NAV”) multiples. Management’s assumptions and estimate of future cash flows are subject to risk and uncertainties, particularly in market conditions where higher volatility exists, and may be partially or totally outside of the Company’s control. Therefore, it is reasonably possible that changes could occur with evolving economic conditions, which may affect the recoverability of the Company’s long-lived assets and goodwill. If the Company fails to achieve its valuation assumptions or if any of its long-lived assets or CGUs experience
IAMGOLD CORPORATION
2014 CONSOLIDATED FINANCIAL STATEMENTS
PAGE 53
a decline in their fair value, this may result in an impairment charge in future periods, which would reduce the Company’s earnings.
| (k) | Asset retirement obligations |
The Company records the present value of estimated costs of legal and constructive obligations required to restore locations in the period in which the obligation is incurred with a corresponding increase in the carrying amount of the related mining asset. For locations where mining activities have ceased, changes to obligations are charged directly to the consolidated statement of earnings. The obligation is generally considered to have been incurred when mine assets are constructed or the ground environment is disturbed at the production location. The discounted liability is adjusted at the end of each period to reflect the passage of time, based on a risk-free real discount rate that reflects current market assessments, and changes in the estimated future cash flows underlying the obligation.
The Company also estimates the timing of the outlays, which is subject to change depending on continued operation or newly discovered reserves.
The periodic unwinding of the discount is recognized in earnings as a finance cost. Additional disturbances or changes in restoration costs or in discount rates are recognized as changes to the corresponding assets and asset retirement obligation when they occur. Environmental costs at operating mines, as well as changes to estimated costs and discount rates for closed sites, are charged to earnings in the period during which they occur.
| (l) | Other provisions |
Provisions are recognized when a legal or constructive present obligation exists as a result of a past event, for which it is probable that an outflow of economic resources will be required to settle the obligation, and a reliable estimate can be made of the amount of the obligation.
Provisions are determined based on management’s best estimate (refer to note 3(t)(7)).
Certain conditions may exist as of the date the financial statements are issued, which may result in a loss to the Company, but which will only be resolved when one or more future events will occur or fail to occur. If the assessment of a contingency suggests that a loss is probable, and the amount can be reliably estimated, then a provision is recorded. When a contingent loss is not probable but is reasonably possible then details of the contingent loss are disclosed. Legal fees incurred in connection with pending legal proceedings are expensed as incurred.
| (m) | Income taxes |
| (i) | Current income tax |
Current income tax assets and liabilities for the current and prior periods are measured at the amount expected to be recovered from or paid to the taxation authorities. The tax rates and tax laws used to compute the amount are those that are enacted or substantively enacted by the balance sheet date.
Current income tax assets and current income tax liabilities are only offset if a legally enforceable right exists to set off the amounts, and the Company intends to settle on a net basis, or to realize the asset and settle the liability simultaneously.
Current income taxes related to items recognized directly in equity are recognized directly in equity.
| (ii) | Deferred income tax |
Deferred income tax is recognized in respect of temporary differences between the carrying amounts of assets and liabilities in the consolidated balance sheets and its tax base.
Deferred income tax liabilities are recognized for all taxable temporary differences, except:
| • | Where the deferred income tax liability arises from the initial recognition of goodwill or of an asset or liability in a transaction that is not a business combination and, at the time of the transaction, affects neither the accounting profit nor taxable profit; and |
| • | In respect of taxable temporary differences associated with investments in subsidiaries, and interests in joint ventures, where the timing of the reversal of the temporary differences can be controlled by the parent, or venturer and it is probable that the temporary differences will not reverse in the foreseeable future. |
Deferred income tax assets are recognized for all deductible temporary differences, carry forward of unused tax credits and unused tax losses, to the extent that it is probable that taxable profit will be available against which the deductible temporary differences, and the carry forward of unused tax credits and unused tax losses can be utilized, except:
| • | When results from the initial recognition of an asset or liability in a transaction that is not a business combination and, at the time of the transaction, affects neither the accounting profit nor taxable profit or loss; and |
| • | In respect of deductible temporary differences associated with investments in subsidiaries, and interests in joint ventures, deferred income tax assets are recognized only to the extent that it is probable that the temporary differences will reverse in the foreseeable future and taxable profit will be available against which the temporary differences can be utilized. |
IAMGOLD CORPORATION
2014 CONSOLIDATED FINANCIAL STATEMENTS
PAGE 54
The carrying amount of deferred income tax assets is reviewed at each balance sheet date and reduced to the extent that it is no longer probable that sufficient taxable profit will be available to allow all or part of the deferred income tax asset to be utilized. Unrecognized deferred income tax assets are reassessed at each balance sheet date and are recognized to the extent that it has become probable that future taxable profit will be available to allow the deferred tax asset to be recovered.
A translation gain or loss will arise where the local tax currency is not the same as the functional currency. A deferred tax asset or liability is recognized on the difference between the carrying amount of the non-monetary assets and the underlying tax basis, translated to the functional currency using the current foreign exchange rate.
Deferred income tax assets and liabilities are measured at the tax rates that are expected to apply to the year when the asset is expected to be realized or the liability settled, based on tax rates (and tax laws) that have been enacted or substantively enacted at the balance sheet date.
Deferred income taxes related to items recognized directly in equity are recognized directly in equity.
Deferred income tax assets and deferred income tax liabilities are offset, if a legally enforceable right exists to set off current tax assets against current income tax liabilities and the deferred income taxes relate to the same taxable entity and the same taxation authority.
There is no certainty that future income tax rates will be consistent with current estimates. Changes in tax rates increase the volatility of the Company’s earnings.
| (n) | Earnings per share |
The Company presents basic and diluted earnings per share data for its common shares. Basic earnings per share is calculated by dividing earnings attributable to equity shareholders by the weighted average number of common shares outstanding during the period. Diluted earnings per share are determined by adjusting the weighted average number of common shares for the dilutive effect of share-based payments, employee incentive share units, and warrants using the treasury stock method. Under this method, stock options, whose exercise price is less than the average market price of the Company’s common shares, are assumed to be exercised and the proceeds used to repurchase common shares at the average market price for the period. The incremental number of common shares issued under stock options and repurchased from proceeds is included in the calculation of diluted earnings per share.
| (o) | Share-based payments |
The Company has the following share-based payment plans with related costs included in general and administrative expenses.
| (i) | Share options, share bonus plan, and deferred share plan |
The Company operates a number of equity-settled share-based payment plans in respect of its employees. Share-based compensation costs are measured based on the grant date fair value of the equity-settled instruments and recognized upon grant date over the related service period in the consolidated statement of earnings and credited to contributed surplus within shareholders’ equity. The Company uses the graded vesting method for attributing share option expense over the vesting period.
The grant date fair value is based on the underlying market price of the shares of the Company taking into account the terms and conditions upon which those equity-settled instruments were granted. The fair value of equity-settled instruments granted is estimated using the Black-Scholes model or other appropriate method and assumptions at grant date. Equity-settled awards are not re-measured subsequent to the initial grant date.
Determination of the grant date fair value requires management estimates such as risk-free interest rate, volatility and weighted average expected life. Share option expense incorporates an expected forfeiture rate which is estimated based on historical forfeiture rates and expectations of future forfeiture rates. The Company makes adjustments if the actual forfeiture rate differs from the expected rate.
The weighted average grant date fair value is the basis for which share-based payments are recognized in earnings.
Upon exercise of options and/or issuance of shares, consideration paid by employees, as well as the grant date fair value of the equity-settled instruments, are transferred to common shares.
| (ii) | Share purchase plan |
The Company provides a share purchase plan where the Company contributes towards the purchase of shares on the open market. The Company’s contribution vests on December 31 of each year and is charged to earnings in the year of contribution.
| (p) | Revenue recognition |
Revenues include sales of gold, niobium and by-product concentrate as well as royalty revenue.
Revenues from the sale of gold and by-products (silver and copper concentrate) are recognized when the metal is delivered to the counterparties.
IAMGOLD CORPORATION
2014 CONSOLIDATED FINANCIAL STATEMENTS
PAGE 55
Revenues from the sale of niobium (ferroniobium) are recognized when legal title (rights and obligations) to the ferroniobium is transferred to the buyer.
Royalty revenue is recognized when the Company has reasonable assurance with respect to measurement and collectability. Revenue based royalties such as Net Smelter Return or Gross Proceeds Royalties are determined based on the proceeds from the sale or other disposition of minerals recovered from the property on which the royalty interest is held. The form, manner and timing of the receipt of any specific royalty payment are governed by the corresponding royalty agreement with the owner of the royalty property.
| (q) | Assets held for sale and discontinued operations |
A discontinued operation is a component of the Company that either has been disposed of or is classified as held for sale, and: (i) represents a separate major line of business or geographical area of operation; (ii) is part of a single coordinated plan to dispose of a separate major line of business or geographical area of operation; or (iii) is a subsidiary acquired exclusively with a view to resell. A component of the Company comprises operations and cash flows that can be clearly distinguished, operationally and for financial reporting purposes, from the rest of the Company. Net earnings from operations and any gain or loss on the disposal are disclosed separately as net earnings from discontinued operations in the consolidated statements of earnings and comparative periods are reclassified accordingly.
Non-current assets and disposal groups are classified as held for sale from the date the qualifying criteria are met and are measured at the lower of the carrying amount and fair value less costs of disposal. If the fair value less costs of disposal is lower than the carrying amount, an impairment loss is recognized in the consolidated statements of earnings. Upon classification as held for sale, non-current assets are no longer depreciated.
| (r) | Leases |
The determination of whether an arrangement is, or contains, a lease is based on the substance of the contractual arrangement at inception date, including whether the arrangement contains the use of a specific asset and the right to use that asset. Where the Company receives substantially all the risks and rewards of ownership of the asset, these arrangements are classified as finance leases. Finance leases are recorded as an asset with a corresponding liability at an amount equal to the lower of the fair value of the leased asset and the present value of the minimum lease payments. Each lease payment is allocated between the liability and finance costs using the effective interest method, with the interest element of the lease charged to the consolidated statements of earnings as a finance cost. Property, plant and equipment acquired under finance leases are depreciated over the shorter of the useful life of the asset and the lease term.
All other leases are classified as operating leases. Operating lease payments are recognized in the consolidated statements of earnings on a straight-line basis over the lease term.
| (s) | Segmented information |
The Company’s operating segments are those operations whose operating results are reviewed by the Company’s chief operating decision maker to make resource allocation decisions and assess their performance. Operating segments whose revenues, earnings or losses or assets exceed 10% of the total consolidated revenue, earnings or losses or assets are reportable segments.
In order to determine the reportable operating segments, various factors are considered, including geographical location and managerial structure. It was determined that the Company’s gold segment is divided into reportable geographic segments. The Company’s other reportable segments have been determined to be the exploration and evaluation and Corporate operating segments, which includes royalty interests located in Canada and investments in associates and joint ventures. The Company discloses information for its joint ventures as it is reviewed regularly by the Company’s chief operating decision maker as part of the performance assessment and resource allocation decision making processes.
| (t) | Significant accounting judgments, estimates and assumptions |
The preparation of consolidated financial statements in conformity with IFRS requires management to make judgments, estimates and assumptions that affect the reported amounts of assets, liabilities and contingent liabilities at the date of the consolidated financial statements and reported amounts of revenues and expenses during the reporting period. Estimates and assumptions are continuously evaluated and are based on management’s experience and other factors, including expectations of future events that are believed to be reasonable under the circumstances.
Assumptions about the future and other major sources of estimation uncertainty at the end of the reporting period have a significant risk of resulting in a material adjustment to the carrying amounts of assets and liabilities, within the next financial year. The most significant judgments and sources of estimation uncertainty that the Company believes could have a significant impact on the amounts recognized in its consolidated financial statements are described below.
| (1) | Mineral reserves and resources |
Key sources of estimation uncertainty
Mineral reserves and resources have been estimated by qualified persons as defined in accordance with Canadian Securities Administrators’ National Instrument 43-101 Standards of Disclosure for Mineral Projects requirements. Mineral reserve and resource estimates include numerous uncertainties and depend heavily on geological
IAMGOLD CORPORATION
2014 CONSOLIDATED FINANCIAL STATEMENTS
PAGE 56
interpretations and statistical inferences drawn from drilling and other data, and require estimates of the future price for the commodity and the future cost of operations. The mineral reserve and resource estimates are subject to uncertainty and actual results may vary from these estimates. Results from drilling, testing and production, as well as material changes in metal prices and operating costs subsequent to the date of an estimate, may justify revision of such estimates.
A number of accounting estimates, as described in the following relevant accounting policy notes, are impacted by the reserve and resource estimates:
| • | Capitalization and amortization of stripping costs (note 3(d)c.); |
| • | Determination of the useful life of property, plant and equipment and measurement of the depreciation expense (note 3(e)); |
| • | Mineral exploration and evaluation of mineral resources and determination of technical feasibility and commercial viability (note 3(f)). The application of the Company’s accounting policy for exploration and evaluation expenditures requires judgment in determining whether future economic benefits may be realized, which are based on assumptions about future events and circumstances; |
| • | Fair value of mineral rights acquired in a business combination (note 3(h)); |
| • | Consideration of whether assets acquired meet the definition of a business or should be accounted for as an asset acquisition (note 3(g)); |
| • | Impairment analysis of non-financial assets including evaluation of estimated future cash flows of CGUs (note 3(j)(ii)); and |
| • | Estimates of the timing of the outlays for asset retirement obligations (note 3(k)). |
| (2) | Determination of the date of transition from construction to production accounting |
Judgments made in relation to accounting policies
Commencement of production is an important “point in time” determination, for accounting purposes, of when a constructed asset has reached a level of function indicative of its readiness to be considered a viable operation and accounted for as such, including accounting recognition of revenue and expenses from the operation. The date of transition from construction to production accounting is based on both qualitative and quantitative criteria such as substantial physical project completion, sustained level of mining, sustained level of processing activity, and passage of a reasonable period of time.
| (3) | Impairment analysis of non-financial assets |
Key sources of estimation uncertainty
Management’s assumptions and estimate of future cash flows used in the Company’s impairment assessment of goodwill and non-financial assets are subject to risk and uncertainties, particularly in market conditions where higher volatility exists, and may be partially or totally outside of the Company’s control. At December 31, 2014, the Company had no goodwill following the impairment recorded in the year ended December 31, 2013.
If an indication of impairment exists, and annually for CGUs with goodwill, an estimate of a CGU’s recoverable amount is calculated. The recoverable amount is based on the higher of FVLCD and VIU using a discounted cash flow methodology taking into account assumptions that would be made by market participants. Cash flows are for periods up to the date that mining is expected to cease which depends on a number of variables including recoverable mineral reserves and resources, expansion plans and the forecasted selling prices for such production.
In estimating the net realizable value of inventories, significant estimate is made regarding the quantities of saleable metals included in stockpiles based on the quantities of ore, the grade of ore and the estimated recovery percentage. There can be no assurance that actual quantities will not differ significantly from estimates used.
Judgments made in relation to accounting policies
Both internal and external sources of information are required to be considered when determining whether an impairment indicator or indicator of a previous impairment has reversed may be present. Judgment is required around significant adverse changes in the business climate which may be indicators for impairment such as a significant decline in the asset’s market value, decline in resources and/or reserves as a result of geological re-assessment or change in timing of extraction of resources and/or reserves which would result in a change in the discounted cash flow obtained from the site, and lower metal prices or higher input cost prices than would have been expected since the most recent valuation of the site. Judgment is also required when considering whether significant changes in any of these items indicate a previous impairment may have reversed.
| (4) | Determination of control by one entity over another |
Judgments made in relation to accounting policies
Subsidiaries are entities controlled by the Company and are consolidated. Investments in associates are those entities in which the Company has significant influence, but no control or joint control, and are accounted for using the equity method.
IAMGOLD CORPORATION
2014 CONSOLIDATED FINANCIAL STATEMENTS
PAGE 57
As at December 31, 2014, IAMGOLD owned 42% of the outstanding shares of Galane and 47% of the outstanding shares of INV Metals (refer to note 12). If an investor holds 20% or more of the voting power of the investee, it is presumed that the investor has significant influence, unless it can be clearly demonstrated that this is not the case. The Company used its judgment to determine that it has significant influence, and no control, over these entities and accounted for it as investments in associates using the equity method of accounting.
| (5) | Determination of fair values and impairment analysis of financial assets |
Key sources of estimation uncertainty
Certain financial instruments are recorded at fair value in the consolidated balance sheets. Current market conditions have an impact on these fair values. Management’s estimate of the fair value of financial instruments is subject to risks and uncertainties as disclosed in note 3(a).
Judgments made in relation to accounting policies
Financial assets such as equity accounted investments and financial assets classified as and measured at amortized cost are tested for impairment at each reporting date to determine whether there is any objective evidence of impairment. A financial asset is considered to be impaired if objective evidence, that can be estimated reliably, indicates that one or more events have had a negative effect on the estimated future cash flows of that asset. Fair values, impairment and sensitivity analyses for financial instruments are disclosed in note 19.
| (6) | Derivative financial instruments |
Key sources of estimation uncertainty
The Company monitors on a regular basis its hedge position for its risk exposure to fluctuations of the U.S. dollar compared to other currencies, and fluctuations in commodity prices such as for oil, aluminum and gold. Forecasts are based on estimates of future transactions. For its derivative contracts, valuations are based on forward rates considering the market price, rate of interest and volatility, and take into account the credit risk of the financial instrument. Refer to note 19 for more detailed information and sensitivity analyses based on changes in currencies and commodity prices.
| (7) | Provisions and recognition or not of a liability for loss contingencies |
Judgments made in relation to accounting policies
Judgments are required to determine if a present obligation exists at the end of the reporting period by considering all available evidence, including the opinion of experts.
Key sources of estimation uncertainty
Provisions related to present obligations are management’s best estimate of the amount of probable future outflow, expected timing of payments, and discount rates. Refer to note 16.
| (8) | Determination of deferred income tax including uncertain tax positions |
Key sources of estimation uncertainty
The carrying amount of deferred income tax assets is reviewed at each balance sheet date and reduced to the extent that it is no longer probable that sufficient taxable profit will be available to allow all or part of the deferred income tax asset to be utilized. Unrecognized deferred income tax assets are reassessed at each balance sheet date and are recognized to the extent that it has become probable that future taxable profit will be available to allow the deferred tax asset to be recovered. There is no certainty that income tax rates will be consistent with current estimates. Changes in tax rates increase the volatility of the Company’s earnings. For more information, refer to notes 3(m)(ii) and 11.
| 4. | NEW ACCOUNTING POLICIES |
These consolidated financial statements have been prepared following the same accounting policies and methods of computation as the annual audited consolidated financial statements for the year ended December 31, 2013, except for the following new accounting standards and amendment to standards and interpretations, which were effective January 1, 2014, and were applied in preparing these consolidated financial statements. These are summarized as follows:
IFRIC 21 - Levies
This interpretation provides guidance on accounting for levies in accordance with IAS 37, Provisions, Contingent Liabilities and Contingent Assets. It defines a levy as an outflow from an entity imposed by a government in accordance with legislation and confirms that an entity recognizes a liability for a levy only when the triggering event specified in the legislation occurs. Based on the Company’s review, there was no material impact on the Company’s consolidated financial statements upon the adoption of IFRIC 21 on January 1, 2014.
IAMGOLD CORPORATION
2014 CONSOLIDATED FINANCIAL STATEMENTS
PAGE 58
IFRS 9 - Financial Instruments
The Company early adopted all of the requirements of IFRS 9, Financial Instruments, as amended November 2013 (“IFRS 9 (2013)”) with a date of initial application of April 1, 2014. As a result of the early adoption of IFRS 9 (2013), the Company changed its accounting policy with respect to financial instruments. Refer to note 3(a).
The Company’s financial instruments are accounted for as follows under IFRS 9 (2013) as compared to the Company’s previous policy in accordance with IAS 39.
| April 1, 2014 | ||||
| IAS 39 |
IFRS 9 (2013) | |||
| Assets |
||||
| Cash and cash equivalents | Fair value through profit or loss | Fair value through profit or loss | ||
| Restricted cash | Fair value through profit or loss | Fair value through profit or loss | ||
| Trade and other receivables | Amortized cost | Amortized cost | ||
| Marketable securities | Available-for-sale | Fair value through other comprehensive income | ||
| Warrants | Fair value through profit or loss | Fair value through profit or loss | ||
| Fixed rate investments | Fair value through profit or loss | Amortized cost | ||
| Derivatives | Fair value through profit or loss | Fair value through profit or loss | ||
| Liabilities | ||||
| Accounts payable | Amortized cost | Amortized cost | ||
| Senior unsecured notes | Amortized cost | Amortized cost | ||
| Derivatives | Fair value through profit or loss | Fair value through profit or loss | ||
Under IFRS 9 (2013), the Company’s equity marketable securities are designated as financial assets at fair value through other comprehensive income. Fair value gains and losses on marketable securities are recognized in other comprehensive income with no reclassification to the consolidated statement of earnings.
IFRS 9 (2013) does not require restatement of comparative periods. Accordingly, the Company has reflected the retrospective impact of the adoption of IFRS 9 (2013) due to the change in accounting policy for equity marketable securities as an adjustment to opening components of equity as at January 1, 2014.
| January 1, 2014 | ||||||||||||
| As previously reported |
Adjustments | As restated | ||||||||||
| Equity |
||||||||||||
| Retained earnings |
$ | 465.1 | $ | 41.1 | $ | 506.2 | ||||||
| Accumulated other comprehensive income (loss) |
13.3 | (41.1 | ) | (27.8 | ) | |||||||
|
|
|
|
|
|
|
|||||||
| Impact on equity |
$ | — | ||||||||||
|
|
|
|
|
|
|
|||||||
The fair value of marketable securities was $51.8 million under both IAS 39 and IFRS 9 (2013) as at April 1, 2014, the date of initial application of IFRS 9 (2013), and was presented in receivables and other current assets and other non-current assets in the consolidated balance sheet.
| 5. | FUTURE ACCOUNTING POLICIES |
The following new standards were not yet effective for the year ended December 31, 2014, and have not been applied in preparing these consolidated financial statements.
IFRS 15 - Revenue from Contracts with Customers
The IASB has issued IFRS 15, Revenue from Contracts with Customers, which will replace IAS 11, Construction Contracts and IAS 18, Revenue. The mandatory effective date of IFRS 15 is January 1, 2017. The objective of IFRS 15 is to establish a single, principles based five-step model to be applied to all contracts with customers in determining how and when revenue is recognized. IFRS 15 also requires entities to provide users of financial statements with more informative and relevant disclosures. The Company will evaluate the impact of adopting IFRS 15 in its consolidated financial statements in future periods.
IAMGOLD CORPORATION
2014 CONSOLIDATED FINANCIAL STATEMENTS
PAGE 59
IFRS 9 - Financial Instruments
On July 24, 2014 the IASB issued the complete IFRS 9 (“IFRS 9 (2014)”). IFRS 9 (2014) differs in some regards from IFRS 9 (2013) which the Company early adopted effective April 1, 2014. IFRS 9 (2014) includes updated guidance on the classification and measurement of financial assets. The final standard also amends the impairment model by introducing a new ‘expected credit loss’ model for calculating impairment, and new general hedge accounting requirements. The mandatory effective date of IFRS 9 (2014) is for annual periods beginning on or after January 1, 2018 and must be applied retrospectively with some exemptions. Early adoption is permitted. The Company will evaluate the impact of adopting IFRS 9 (2014) in its consolidated financial statements in future periods.
| 6. | ASSETS HELD FOR SALE AND DISCONTINUED OPERATIONS |
Niobec mine
During the fourth quarter of 2014, the Company signed a definitive agreement to sell its Niobec mine and the adjacent rare earth element (“REE”) deposit for cash proceeds of $500 million as well as an additional $30 million when the adjacent REE deposit goes into commercial production, as defined. A 2% gross proceeds royalty will be payable on any REE production.
Regulatory approval for the transaction was received subsequent to year end on January 19, 2015 and the transaction was closed on January 22, 2015.
As of December 31, 2014, the Niobec disposal group met the criteria to be classified as held for sale per IFRS 5, Non-current Assets Held for Sale and Discontinued Operations.
(a) Net earnings from discontinued operations
| Years ended December 31, | ||||||||
| 2014 | 2013 | |||||||
| Niobec mine |
||||||||
| Revenues |
$ | 233.8 | $ | 199.6 | ||||
| Cost of sales |
(140.8 | ) | (138.5 | ) | ||||
| Other income (expenses) |
6.9 | (5.3 | ) | |||||
|
|
|
|
|
|||||
| 99.9 | 55.8 | |||||||
| Income taxes |
(37.2 | ) | (25.7 | ) | ||||
|
|
|
|
|
|||||
| $ | 62.7 | $ | 30.1 | |||||
|
|
|
|
|
|||||
| (b) | Cumulative income or losses included in OCI |
As at December 31, 2014, discontinued operations had accumulated other comprehensive income of $1.6 million (December 31, 2013 - nil) relating to the cash flow hedge fair value reserve and an accumulated loss of $1.1 million (December 31, 2013 - nil) relating to the marketable securities fair value reserve.
(c) Net cash flow from (used in) discontinued operations and cash held for sale
| Years ended December 31, | ||||||||
| Cash flow from (used in): |
2014 | 2013 | ||||||
| Operating activities |
$ | 42.1 | $ | 82.8 | ||||
| Investing activities |
(43.7 | ) | (74.6 | ) | ||||
| Financing activities |
(1.1 | ) | (0.8 | ) | ||||
|
|
|
|
|
|||||
| Net cash flow from (used in) discontinued operations |
$ | (2.7 | ) | $ | 7.4 | |||
|
|
|
|
|
|||||
| Cash and cash equivalents held for sale |
$ | 12.0 | $ | — | ||||
|
|
|
|
|
|||||
IAMGOLD CORPORATION
2014 CONSOLIDATED FINANCIAL STATEMENTS
PAGE 60
(d) Assets and liabilities classified as held for sale
| December 31, 2014 | ||||
| Assets classified as held for sale |
||||
| Cash and cash equivalents |
$ | 12.0 | ||
| Income taxes receivable |
0.8 | |||
| Receivables and other current assets |
30.1 | |||
| Inventories |
29.8 | |||
| Property, plant and equipment |
551.3 | |||
| Other non-current assets |
4.5 | |||
|
|
|
|||
| $ | 628.5 | |||
|
|
|
|||
| Liabilities classified as held for sale |
||||
| Accounts payable and accrued liabilities |
$ | 20.9 | ||
| Current portion of provisions |
7.7 | |||
| Deferred income tax liabilities |
111.9 | |||
| Provisions |
24.2 | |||
| Other liabilities |
2.3 | |||
|
|
|
|||
| $ | 167.0 | |||
|
|
|
|||
| 7. | CASH AND CASH EQUIVALENTS |
| December 31, | December 31, | |||||||
| 2014 | 2013 | |||||||
| Cash |
$ | 158.4 | $ | 211.9 | ||||
| Short-term deposits with initial maturities of three months or less |
0.1 | 10.4 | ||||||
|
|
|
|
|
|||||
| $ | 158.5 | $ | 222.3 | |||||
|
|
|
|
|
|||||
| 8. | GOLD BULLION |
| December 31, 2014 |
December 31, 2013 |
|||||||||
| Ounces held |
(oz) | 134,737 | 134,737 | |||||||
| Weighted average acquisition cost |
($/oz) | $ | 720 | $ | 720 | |||||
| Acquisition cost |
($ millions) | $ | 96.9 | $ | 96.9 | |||||
| Spot price for gold, end of the year |
($/oz) | $ | 1,206 | $ | 1,205 | |||||
| Market value, end of the year |
($ millions) | $ | 162.5 | $ | 162.3 | |||||
| 9. | RECEIVABLES AND OTHER CURRENT ASSETS |
| Note | December 31, 2014 |
December 31, 2013 |
||||||||
| Gold receivables |
$ | 1.7 | $ | 5.2 | ||||||
| Niobium receivables |
— | 18.2 | ||||||||
| Receivables from governments1 |
23.3 | 25.5 | ||||||||
| Receivables from related parties |
35 | 0.2 | 0.2 | |||||||
| Other receivables |
6.0 | 7.7 | ||||||||
|
|
|
|
|
|||||||
| Total receivables |
31.2 | 56.8 | ||||||||
| Marketable securities and warrants |
14.2 | 9.2 | ||||||||
| Prepaid expenses |
9.8 | 12.7 | ||||||||
| Other current assets |
0.3 | 1.3 | ||||||||
|
|
|
|
|
|||||||
| $ | 55.5 | $ | 80.0 | |||||||
|
|
|
|
|
|||||||
| 1 | Receivables from governments relate primarily to value added tax. |
IAMGOLD CORPORATION
2014 CONSOLIDATED FINANCIAL STATEMENTS
PAGE 61
For the year ended December 31, 2014, the Company recognized a net reversal of allowance for doubtful non-trade receivables of $5.3 million (December 31, 2013 - allowance of $13.3 million) and $4.1 million was written off. As at December 31, 2014, the allowance for doubtful non-trade receivables was $3.9 million (December 31, 2013 - $13.3 million).
| 10. | INVENTORIES |
| Note | December 31, 2014 |
December 31, 2013 |
||||||||
| Finished goods |
||||||||||
| Gold production inventories |
$ | 63.7 | $ | 69.1 | ||||||
| Niobium production inventories |
— | 21.5 | ||||||||
| Ore stockpiles |
10.3 | 16.1 | ||||||||
| Mine supplies |
171.1 | 193.5 | ||||||||
|
|
|
|
|
|||||||
| 245.1 | 300.2 | |||||||||
| Ore stockpiles included in other non-current assets |
14 | 127.6 | 103.8 | |||||||
|
|
|
|
|
|||||||
| $ | 372.7 | $ | 404.0 | |||||||
|
|
|
|
|
|||||||
For the year ended December 31, 2014, the Company recognized a write-down of non-current ore stockpiles to net realizable value of $10.4 million (December 31, 2013 - $10.6 million).
| 11. | INCOME TAXES |
The effective tax rates for the years ended December 31, 2014 and 2013 was (82.0%) and 3.8%, respectively.
The income taxes are made up of the following components:
| Years ended December 31, | ||||||||
| 2014 | 2013 | |||||||
| Current: |
||||||||
| Federal and provincial income taxes |
$ | (4.4 | ) | $ | (6.4 | ) | ||
| Provincial mining taxes |
(1.5 | ) | 1.4 | |||||
| Foreign income taxes |
10.1 | 71.3 | ||||||
|
|
|
|
|
|||||
| 4.2 | 66.3 | |||||||
|
|
|
|
|
|||||
| Deferred: |
||||||||
| Federal and provincial income tax - origination and reversal of temporary differences |
64.1 | (16.9 | ) | |||||
| Provincial mining taxes - origination and reversal of temporary differences |
9.5 | 6.9 | ||||||
| Foreign income taxes - origination and reversal of temporary differences |
27.3 | (95.9 | ) | |||||
| Changes in tax rates or imposition of new taxes |
12.8 | 4.7 | ||||||
|
|
|
|
|
|||||
| 113.7 | (101.2 | ) | ||||||
|
|
|
|
|
|||||
| Total income taxes |
$ | 117.9 | $ | (34.9 | ) | |||
|
|
|
|
|
|||||
IAMGOLD CORPORATION
2014 CONSOLIDATED FINANCIAL STATEMENTS
PAGE 62
The income taxes on OCI were made up of the following components:
| Years ended December 31, | ||||||||
| 2014 | 2013 | |||||||
| Unrealized change in fair value of marketable securities |
$ | 0.4 | $ | (6.4 | ) | |||
| Realized change in fair value and impairment of marketable securities |
0.1 | 1.8 | ||||||
| Hedges |
(0.4 | ) | — | |||||
| Other |
(0.3 | ) | 0.8 | |||||
|
|
|
|
|
|||||
| Total income taxes related to OCI |
$ | (0.2 | ) | $ | (3.8 | ) | ||
|
|
|
|
|
|||||
Income taxes differ from the amount that would have been computed by applying the combined Canadian federal and provincial statutory income tax rate of 26.6% for the year ended December 31, 2014, (December 31, 2013 - 26.6%) to earnings from continuing operations before income taxes. The reasons for the differences are as follows:
| Years ended December 31, | ||||||||
| 2014 | 2013 | |||||||
| Earnings (losses) from continuing operations before income taxes |
$ | (143.7 | ) | $ | (925.6 | ) | ||
|
|
|
|
|
|||||
| Income tax provision (recovery) calculated using the combined Canadian federal and provincial statutory income tax rate |
(38.2 | ) | (246.2 | ) | ||||
| Increase (reduction) in income taxes resulting from: |
||||||||
| Earnings not subject to taxation |
0.1 | 3.4 | ||||||
| Earnings in foreign jurisdictions subject to different tax rates |
2.6 | 38.6 | ||||||
| Tax benefits not recognized |
102.3 | 50.6 | ||||||
| Provincial mining duty tax |
1.4 | (1.7 | ) | |||||
| Non-deductible expenses |
19.2 | 28.0 | ||||||
| Tax impact of impairment charges |
— | 83.7 | ||||||
| Non-resident withholding taxes |
3.5 | 5.7 | ||||||
| Foreign exchange related to income taxes |
22.8 | (4.8 | ) | |||||
| Change in enacted tax rates |
12.8 | 4.7 | ||||||
| Under (over) provided in prior periods |
(8.5 | ) | 1.9 | |||||
| Other |
(0.1 | ) | 1.2 | |||||
|
|
|
|
|
|||||
| Total income taxes |
$ | 117.9 | $ | (34.9 | ) | |||
|
|
|
|
|
|||||
IAMGOLD CORPORATION
2014 CONSOLIDATED FINANCIAL STATEMENTS
PAGE 63
The components that give rise to deferred income tax assets and liabilities are as follows:
| December 31, | December 31, | |||||||
| 2014 | 2013 | |||||||
| Deferred income tax assets: |
||||||||
| Other assets |
$ | 8.0 | $ | 15.9 | ||||
| Exploration and evaluation assets |
73.6 | 105.4 | ||||||
| Share issue costs |
— | 0.4 | ||||||
| Non-capital losses |
83.3 | 94.5 | ||||||
| Net capital losses |
29.8 | — | ||||||
| Asset retirement obligations |
1.1 | 19.6 | ||||||
| Income tax benefit of mining duties |
— | 12.9 | ||||||
|
|
|
|
|
|||||
| 195.8 | 248.7 | |||||||
|
|
|
|
|
|||||
| Deferred income tax liabilities: |
||||||||
| Property, plant and equipment |
(220.8 | ) | (288.5 | ) | ||||
| Royalty interests |
(8.8 | ) | (9.8 | ) | ||||
| Other intangible assets |
(0.9 | ) | (1.2 | ) | ||||
| Mining duties |
(46.6 | ) | (48.3 | ) | ||||
| Marketable securities |
(0.4 | ) | (2.0 | ) | ||||
| Other |
(54.0 | ) | (37.2 | ) | ||||
| Investment in subsidiary |
(29.8 | ) | — | |||||
|
|
|
|
|
|||||
| (361.3 | ) | (387.0 | ) | |||||
|
|
|
|
|
|||||
| Net deferred income tax liabilities |
$ | (165.5 | ) | $ | (138.3 | ) | ||
|
|
|
|
|
|||||
| Classification |
||||||||
| Non-current assets |
$ | — | $ | 74.0 | ||||
| Non-current liabilities |
(165.5 | ) | (212.3 | ) | ||||
|
|
|
|
|
|||||
| $ | (165.5 | ) | $ | (138.3 | ) | |||
|
|
|
|
|
|||||
Unrecognized Deferred Tax Assets
Deferred tax assets have not been recognized in respect of the following deductible temporary differences in Canada:
| December 31, 2014 |
December 31, 2013 |
|||||||
| Non-capital losses |
$ | 278.4 | $ | 88.7 | ||||
| Net capital losses |
66.1 | 140.2 | ||||||
| Exploration and evaluation assets |
71.9 | 66.4 | ||||||
| Deduction for future mining duty taxes |
46.6 | — | ||||||
| Asset retirement obligations |
153.9 | 40.2 | ||||||
| Other deductible temporary differences |
35.2 | — | ||||||
|
|
|
|
|
|||||
| $ | 652.1 | $ | 335.5 | |||||
|
|
|
|
|
|||||
As at December 31, 2014 the Company did not recognize the benefit related to the deferred tax assets for the above related items in its consolidated financial statements as management did not consider it probable that the Company will be able to realize the deferred tax assets in the future.
The non-capital loss carry forwards begin to expire in 2015. The amount to expire in 2015 is approximately $0.9 million. The net capital loss carry forward may be carried forward indefinitely, but can only be used to reduce capital gains. The exploration and development expenses may be carried forward indefinitely.
IAMGOLD CORPORATION
2014 CONSOLIDATED FINANCIAL STATEMENTS
PAGE 64
The Company has not recognized tax benefits on loss carry forwards generated in countries other than Canada where the probable criteria for the recognition of deferred tax assets has not been met. Consequently, deferred tax assets have not been recognized on the loss carry forwards of $249.7 million in these jurisdictions as it is not probable that the deferred tax asset will be realized in the future.
The Company has not recognized a deferred tax liability on temporary differences of $353.9 million (December 31, 2013 - $341.1 million) related to investments in certain subsidiaries and joint ventures because the Company can control the reversal of the temporary differences and the temporary differences are not expected to reverse in the foreseeable future.
The Company designates all dividends paid to its shareholders to be eligible dividends.
The 2014 movement for deferred income taxes may be summarized as follows:
| From Continuing Operations | ||||||||||||||||||||||||
| Total December 31, 2013 |
Less Discontinued Operations at December 31, 2013 |
Statement of earnings |
Other comprehensive income |
Other | December 31, 2014 |
|||||||||||||||||||
| Deferred income tax assets: |
||||||||||||||||||||||||
| Other assets |
$ | 15.9 | $ | (20.8 | ) | $ | 12.2 | $ | 0.7 | $ | — | $ | 8.0 | |||||||||||
| Exploration and evaluation assets |
105.4 | (21.7 | ) | (10.1 | ) | — | — | 73.6 | ||||||||||||||||
| Share issue costs |
0.4 | (0.4 | ) | — | — | — | — | |||||||||||||||||
| Non-capital losses |
94.5 | — | (11.2 | ) | — | — | 83.3 | |||||||||||||||||
| Net capital losses |
— | — | 29.8 | — | — | 29.8 | ||||||||||||||||||
| Asset retirement obligations |
19.6 | (1.1 | ) | (17.4 | ) | — | — | 1.1 | ||||||||||||||||
| Income tax benefit on mining duties |
12.9 | (7.8 | ) | (5.1 | ) | — | — | — | ||||||||||||||||
| Deferred income tax liabilities: |
||||||||||||||||||||||||
| Property, plant and equipment |
(288.5 | ) | 108.8 | (41.1 | ) | — | — | (220.8 | ) | |||||||||||||||
| Royalty interests |
(9.8 | ) | — | 1.0 | — | — | (8.8 | ) | ||||||||||||||||
| Other intangible assets |
(1.2 | ) | — | 0.3 | — | — | (0.9 | ) | ||||||||||||||||
| Mining duties |
(48.3 | ) | 29.0 | (27.5 | ) | — | 0.2 | (46.6 | ) | |||||||||||||||
| Marketable securities |
(2.0 | ) | — | 2.1 | (0.5 | ) | — | (0.4 | ) | |||||||||||||||
| Other |
(37.2 | ) | 0.1 | (16.9 | ) | — | — | (54.0 | ) | |||||||||||||||
| Investment in subsidiary |
— | — | (29.8 | ) | — | — | (29.8 | ) | ||||||||||||||||
|
|
|
|
|
|
|
|
|
|
|
|
|
|||||||||||||
| $ | (138.3 | ) | $ | 86.1 | $ | (113.7 | ) | $ | 0.2 | $ | 0.2 | $ | (165.5 | ) | ||||||||||
|
|
|
|
|
|
|
|
|
|
|
|
|
|||||||||||||
IAMGOLD CORPORATION
2014 CONSOLIDATED FINANCIAL STATEMENTS
PAGE 65
The 2013 movement for deferred income taxes may be summarized as follows:
| From Continuing Operations | ||||||||||||||||||||||||
| Total December 31, 2012 |
Less Discontinued Operations for the year ended December 31, 2013 |
Statement of earnings |
Other comprehensive income |
Other | December 31, 2013 |
|||||||||||||||||||
| Deferred income tax assets: |
||||||||||||||||||||||||
| Other assets |
$ | 20.3 | $ | 0.8 | $ | (7.3 | ) | $ | (0.8 | ) | $ | 2.9 | $ | 15.9 | ||||||||||
| Exploration and evaluation assets |
76.6 | 7.1 | 21.7 | — | — | 105.4 | ||||||||||||||||||
| Share issue costs |
0.7 | 0.3 | (0.6 | ) | — | — | 0.4 | |||||||||||||||||
| Non-capital losses |
96.0 | (0.5 | ) | (1.0 | ) | — | — | 94.5 | ||||||||||||||||
| Asset retirement obligations |
28.3 | (0.1 | ) | (8.6 | ) | — | — | 19.6 | ||||||||||||||||
| Income tax benefit on mining duties |
7.9 | 3.2 | 1.8 | — | — | 12.9 | ||||||||||||||||||
| Deferred income tax liabilities: |
||||||||||||||||||||||||
| Property, plant and equipment |
(389.4 | ) | (21.2 | ) | 122.1 | — | — | (288.5 | ) | |||||||||||||||
| Royalty interests |
(15.9 | ) | — | 6.1 | — | — | (9.8 | ) | ||||||||||||||||
| Other intangible assets |
(1.4 | ) | — | 0.2 | — | — | (1.2 | ) | ||||||||||||||||
| Mining duties |
(29.3 | ) | (12.4 | ) | (6.6 | ) | — | — | (48.3 | ) | ||||||||||||||
| Marketable securities |
(6.6 | ) | — | — | 4.6 | — | (2.0 | ) | ||||||||||||||||
| Other |
(13.3 | ) | — | (26.6 | ) | — | 2.7 | (37.2 | ) | |||||||||||||||
|
|
|
|
|
|
|
|
|
|
|
|
|
|||||||||||||
| $ | (226.1 | ) | $ | (22.8 | ) | $ | 101.2 | $ | 3.8 | $ | 5.6 | $ | (138.3 | ) | ||||||||||
|
|
|
|
|
|
|
|
|
|
|
|
|
|||||||||||||
| 12. | INVESTMENTS IN ASSOCIATES AND JOINT VENTURES |
| Associates | Joint Ventures2 | |||||||||||||||||||
| Galane1 | INV Metals | Sadiola | Yatela | Total | ||||||||||||||||
| Balance, January 1, 2013 |
$ | 28.3 | $ | 27.8 | $ | 106.4 | $ | 1.6 | $ | 164.1 | ||||||||||
| Impairment charges |
(20.3 | ) | (19.7 | ) | — | — | (40.0 | ) | ||||||||||||
| Currency translation adjustment |
— | (0.3 | ) | — | — | (0.3 | ) | |||||||||||||
| Share of net earnings (losses), net of income taxes |
(8.0 | ) | (1.3 | ) | (47.4 | ) | (10.7 | ) | (67.4 | ) | ||||||||||
| Share of net losses applied to the loan receivable from Yatela |
— | — | — | 8.3 | 8.3 | |||||||||||||||
| Share of net losses provided for |
— | — | — | 0.8 | 0.8 | |||||||||||||||
|
|
|
|
|
|
|
|
|
|
|
|||||||||||
| Balance, December 31, 2013 |
— | 6.5 | 59.0 | — | 65.5 | |||||||||||||||
| Impairment reversal |
3.4 | — | — | — | 3.4 | |||||||||||||||
| Currency translation adjustment |
— | (2.7 | ) | — | — | (2.7 | ) | |||||||||||||
| Share of net earnings (losses), net of income taxes |
0.5 | (0.9 | ) | (9.4 | ) | (16.4 | ) | (26.2 | ) | |||||||||||
| Share of net losses provided for |
— | — | — | 16.4 | 16.4 | |||||||||||||||
|
|
|
|
|
|
|
|
|
|
|
|||||||||||
| Balance, December 31, 2014 |
$ | 3.9 | $ | 2.9 | $ | 49.6 | $ | — | $ | 56.4 | ||||||||||
|
|
|
|
|
|
|
|
|
|
|
|||||||||||
| 1 | The Company’s unrecognized share of Galane’s net losses for the year ended December 31, 2014 was $nil (December 31, 2013 - $4.3 million). |
| 2 | The Company’s joint ventures are not publicly listed entities and consequently quoted market prices are not available. |
IAMGOLD CORPORATION
2014 CONSOLIDATED FINANCIAL STATEMENTS
PAGE 66
The following table reconciles the summarized balance sheet to the carrying amount of the Company’s interest in joint ventures:
| December 31, 2014 | December 31, 2013 | |||||||||||||||
| Sadiola | Yatela | Sadiola | Yatela | |||||||||||||
| The Company’s equity percentage of net assets of joint ventures |
41 | % | 40 | % | 41 | % | 40 | % | ||||||||
|
|
|
|
|
|
|
|
|
|||||||||
| Share of net assets of joint ventures |
$ | 49.6 | $ | (29.0 | ) | $ | 59.0 | $ | (12.6 | ) | ||||||
| Losses applied to loans receivable |
— | 16.0 | — | 12.0 | ||||||||||||
| Losses recognized in provisions |
— | 13.2 | — | 0.8 | ||||||||||||
| Other |
— | (0.2 | ) | — | (0.2 | ) | ||||||||||
|
|
|
|
|
|
|
|
|
|||||||||
| Carrying amount of interest in joint ventures |
$ | 49.6 | $ | — | $ | 59.0 | $ | — | ||||||||
|
|
|
|
|
|
|
|
|
|||||||||
Financial information for investments in Sadiola and Yatela, not adjusted for the percentage held by the Company, is summarized below:
| December 31, 2014 | December 31, 2013 | |||||||||||||||
| Joint Ventures |
Sadiola | Yatela | Sadiola | Yatela | ||||||||||||
| Summarized statement of earnings |
||||||||||||||||
| Revenues |
$ | 261.0 | $ | 35.5 | $ | 294.9 | $ | 99.5 | ||||||||
| Depreciation expense |
(64.7 | ) | (6.0 | ) | (18.8 | ) | (10.7 | ) | ||||||||
| Other expenses |
(221.2 | ) | (70.8 | ) | (399.8 | ) | (123.7 | ) | ||||||||
| Income taxes |
2.0 | 0.3 | 8.1 | (0.8 | ) | |||||||||||
|
|
|
|
|
|
|
|
|
|||||||||
| Net loss and comprehensive loss |
$ | (22.9 | ) | $ | (41.0 | ) | $ | (115.6 | ) | $ | (35.7 | ) | ||||
|
|
|
|
|
|
|
|
|
|||||||||
| Summarized balance sheet |
||||||||||||||||
| Assets |
||||||||||||||||
| Cash and cash equivalents |
$ | 26.5 | $ | 3.7 | $ | 3.5 | $ | 2.1 | ||||||||
| Other current assets |
89.1 | 15.9 | 126.7 | 29.8 | ||||||||||||
| Non-current assets |
238.7 | 6.8 | 287.7 | 12.4 | ||||||||||||
|
|
|
|
|
|
|
|
|
|||||||||
| $ | 354.3 | $ | 26.4 | $ | 417.9 | $ | 44.3 | |||||||||
|
|
|
|
|
|
|
|
|
|||||||||
| Liabilities |
||||||||||||||||
| Current liabilities |
$ | 37.2 | $ | 54.4 | $ | 66.8 | $ | 18.7 | ||||||||
| Non-current liabilities |
196.0 | 44.4 | 207.1 | 57.0 | ||||||||||||
|
|
|
|
|
|
|
|
|
|||||||||
| $ | 233.2 | $ | 98.8 | $ | 273.9 | $ | 75.7 | |||||||||
|
|
|
|
|
|
|
|
|
|||||||||
| Net assets |
$ | 121.1 | $ | (72.4 | ) | $ | 144.0 | $ | (31.4 | ) | ||||||
|
|
|
|
|
|
|
|
|
|||||||||
The following table reconciles the summarized balance sheet to the carrying amount of the Company’s interest in associates:
| September 30, 2014 | September 30, 2013 | |||||||||||||||
| Galane | INV Metals | Galane | INV Metals | |||||||||||||
| The Company’s equity percentage of net assets of associates |
42 | % | 47 | % | 43 | % | 47 | % | ||||||||
|
|
|
|
|
|
|
|
|
|||||||||
| Share of net assets of associates |
$ | 11.8 | $ | 19.8 | $ | 9.8 | $ | 21.9 | ||||||||
| Impairment, net of reversal |
(16.9 | ) | (19.7 | ) | (20.3 | ) | (19.7 | ) | ||||||||
| Consolidation adjustments |
9.0 | 5.5 | 3.4 | 4.6 | ||||||||||||
| Cumulative translation adjustment |
— | (2.7 | ) | — | (0.3 | ) | ||||||||||
| Unrecognized losses and other |
— | — | 7.1 | — | ||||||||||||
|
|
|
|
|
|
|
|
|
|||||||||
| Carrying amount of interest in associates |
$ | 3.9 | $ | 2.9 | $ | — | $ | 6.5 | ||||||||
|
|
|
|
|
|
|
|
|
|||||||||
IAMGOLD CORPORATION
2014 CONSOLIDATED FINANCIAL STATEMENTS
PAGE 67
Financial information as reported by Galane and INV Metals, is summarized below:
| September 30, 2014 | September 30, 2013 | |||||||||||||||
| Associates |
Galane | INV Metals | Galane | INV Metals | ||||||||||||
| Revenues |
$ | 46.4 | $ | — | $ | 54.3 | $ | — | ||||||||
|
|
|
|
|
|
|
|
|
|||||||||
| Net earnings (losses) |
$ | 4.6 | $ | (1.9 | ) | $ | (34.3 | ) | $ | (2.8 | ) | |||||
| Other comprehensive income (loss) |
— | (5.8 | ) | — | (0.7 | ) | ||||||||||
|
|
|
|
|
|
|
|
|
|||||||||
| Comprehensive income (loss) |
$ | 4.6 | $ | (7.7 | ) | $ | (34.3 | ) | $ | (3.5 | ) | |||||
|
|
|
|
|
|
|
|
|
|||||||||
| Summarized balance sheet |
||||||||||||||||
| Assets |
||||||||||||||||
| Current assets |
$ | 17.8 | $ | 13.9 | $ | 13.2 | $ | 20.2 | ||||||||
| Non-current assets |
28.7 | 28.9 | 24.8 | 27.4 | ||||||||||||
|
|
|
|
|
|
|
|
|
|||||||||
| $ | 46.5 | $ | 42.8 | $ | 38.0 | $ | 47.6 | |||||||||
|
|
|
|
|
|
|
|
|
|||||||||
| Liabilities |
||||||||||||||||
| Current liabilities |
$ | 9.4 | $ | 0.3 | $ | 7.5 | $ | 0.4 | ||||||||
| Non-current liabilities |
9.1 | 0.3 | 7.6 | 0.5 | ||||||||||||
|
|
|
|
|
|
|
|
|
|||||||||
| $ | 18.5 | $ | 0.6 | $ | 15.1 | $ | 0.9 | |||||||||
|
|
|
|
|
|
|
|
|
|||||||||
| Net assets |
$ | 28.0 | $ | 42.2 | $ | 22.9 | $ | 46.7 | ||||||||
|
|
|
|
|
|
|
|
|
|||||||||
| 13. | PROPERTY, PLANT AND EQUIPMENT |
| Construction in progress |
Mining properties |
Plant and equipment |
Total | |||||||||||||
| Cost |
||||||||||||||||
|
|
|
|
|
|
|
|
|
|||||||||
| Balance, January 1, 2013 |
$ | 701.7 | $ | 1,794.9 | $ | 1,263.2 | $ | 3,759.8 | ||||||||
| Additions1 |
437.4 | 159.9 | 138.4 | 735.7 | ||||||||||||
| Changes in asset retirement obligations |
— | 29.3 | — | 29.3 | ||||||||||||
| Disposals |
— | (5.5 | ) | (25.3 | ) | (30.8 | ) | |||||||||
| Transfers within property, plant and equipment |
(154.7 | ) | 13.2 | 141.5 | — | |||||||||||
|
|
|
|
|
|
|
|
|
|||||||||
| Balance, December 31, 2013 |
984.4 | 1,991.8 | 1,517.8 | 4,494.0 | ||||||||||||
| Additions1 |
157.4 | 158.0 | 135.8 | 451.2 | ||||||||||||
| Changes in asset retirement obligations |
— | 24.0 | — | 24.0 | ||||||||||||
| Disposals |
— | (3.5 | ) | (63.7 | ) | (67.2 | ) | |||||||||
| Transfers within property, plant and equipment |
(980.5 | ) | 497.6 | 482.9 | — | |||||||||||
| De-recognition of assets due to Mouska closure |
— | (314.4 | ) | (45.5 | ) | (359.9 | ) | |||||||||
| Reclassification to assets held for sale |
(81.5 | ) | (421.1 | ) | (259.9 | ) | (762.5 | ) | ||||||||
|
|
|
|
|
|
|
|
|
|||||||||
| Balance, December 31, 2014 |
$ | 79.8 | $ | 1,932.4 | $ | 1,767.4 | $ | 3,779.6 | ||||||||
|
|
|
|
|
|
|
|
|
|||||||||
| 1 | Includes borrowing costs of $25.9 million capitalized for the year ended December 31, 2014 (December 31, 2013 - $27.6 million) at a weighted average interest rate of 6.99%. |
IAMGOLD CORPORATION
2014 CONSOLIDATED FINANCIAL STATEMENTS
PAGE 68
| Construction in progress |
Mining properties |
Plant and equipment |
Total | |||||||||||||
| Accumulated Depreciation |
||||||||||||||||
|
|
|
|
|
|
|
|
|
|||||||||
| Balance, January 1, 2013 |
$ | — | $ | 702.9 | $ | 433.1 | $ | 1,136.0 | ||||||||
| Depreciation expense1 |
— | 105.0 | 126.6 | 231.6 | ||||||||||||
| Impairment charges |
— | 631.4 | — | 631.4 | ||||||||||||
| Disposals |
— | (5.5 | ) | (19.9 | ) | (25.4 | ) | |||||||||
|
|
|
|
|
|
|
|
|
|||||||||
| Balance, December 31, 2013 |
— | 1,433.8 | 539.8 | 1,973.6 | ||||||||||||
| Depreciation expense1 |
— | 78.9 | 166.0 | 244.9 | ||||||||||||
| Disposals |
— | (0.1 | ) | (21.6 | ) | (21.7 | ) | |||||||||
| De-recognition of assets due to Mouska closure |
— | (314.3 | ) | (44.6 | ) | (358.9 | ) | |||||||||
| Reclassification to assets held for sale |
— | (136.0 | ) | (75.2 | ) | (211.2 | ) | |||||||||
|
|
|
|
|
|
|
|
|
|||||||||
| Balance, December 31, 2014 |
$ | — | $ | 1,062.3 | $ | 564.4 | $ | 1,626.7 | ||||||||
|
|
|
|
|
|
|
|
|
|||||||||
| Carrying amount, December 31, 2013 |
$ | 984.4 | $ | 558.0 | $ | 978.0 | $ | 2,520.4 | ||||||||
|
|
|
|
|
|
|
|
|
|||||||||
| Carrying amount, December 31, 2014 |
$ | 79.8 | $ | 870.1 | $ | 1,203.0 | $ | 2,152.9 | ||||||||
|
|
|
|
|
|
|
|
|
|||||||||
| 1 | Excludes depreciation expense relating to corporate assets, which is included in general and administrative expenses. |
Construction in progress at December 31, 2014 and 2013 included capital expenditures related to projects at the following: Rosebel (2014 - $24.5 million; 2013 - $5.3 million), Essakane (2014 - $0.2 million; 2013 - $287.0 million), Westwood (2014 - $nil; 2013 - $600.4 million) and Niobec - discontinued operations (2014 - $81.5 million; 2013 - $62.5 million). Westwood transitioned from construction to production accounting in the third quarter of 2014 and accordingly the assets were transferred from construction in progress to the specific asset classes at that time.
In 2014, borrowing costs attributable to qualifying assets associated with the Essakane, Westwood, Niobec (discontinued operations) mines capitalized in construction in progress totaled $25.9 million (2013 - $27.6 million) at a weighted average interest rate of 6.99% (2013 - 6.97%).
As at December 31, 2014, mining properties included capitalized stripping costs of $189.0 million (2013 - $170.5 million). Stripping costs of $59.1 million were capitalized during 2014 (2013 - $127.6 million), and $40.5 million were depreciated during 2014 (2013 - $39.7 million).
The carrying amount of plant and equipment includes $37.3 million (December 31, 2013 - $4.9 million) of equipment held under finance leases. The finance leases are each for a five-year term and contain purchase options that the Company has assessed as being reasonably certain to be exercised at maturity. Certain assets subject to the finance leases were previously owned by the Company and were sold to the lessor prior to being leased back, resulting in disposals of plant and equipment of $31.5 million.
| 14. | OTHER NON-CURRENT ASSETS |
| Notes | December 31, 2014 |
December 31, 2013 |
||||||||
| Ore stockpiles |
10 | $ | 127.6 | $ | 103.8 | |||||
| Marketable securities and warrants |
16.7 | 32.6 | ||||||||
| Receivables from related parties |
35 | 26.3 | 38.5 | |||||||
| Restricted cash |
8.7 | 8.6 | ||||||||
| Royalty interests |
18.8 | 21.3 | ||||||||
| Derivatives |
— | 0.1 | ||||||||
| Other |
18.5 | 24.1 | ||||||||
|
|
|
|
|
|||||||
| $ | 216.6 | $ | 229.0 | |||||||
|
|
|
|
|
|||||||
For the year ended December 31, 2014, the Company recognized an allowance for doubtful non-trade receivables of $nil (December 31, 2013 - $36.0 million). The outstanding allowance as at December 31, 2014 was $36.0 million (December 31, 2013 - $36.0 million).
IAMGOLD CORPORATION
2014 CONSOLIDATED FINANCIAL STATEMENTS
PAGE 69
| (a) | Royalty Interests |
| Cost | Accumulated Amortization |
Net Royalty Interest |
||||||||||
| December 31, 2013 |
||||||||||||
| Diavik1 |
$ | 49.4 | $ | 33.7 | $ | 15.7 | ||||||
| Paul Isnard concession2 |
5.6 | — | 5.6 | |||||||||
|
|
|
|
|
|
|
|||||||
| $ | 55.0 | $ | 33.7 | $ | 21.3 | |||||||
|
|
|
|
|
|
|
|||||||
| December 31, 2014 |
||||||||||||
| Diavik1 |
$ | 49.4 | $ | 36.2 | $ | 13.2 | ||||||
| Paul Isnard concession2 |
5.6 | — | 5.6 | |||||||||
|
|
|
|
|
|
|
|||||||
| $ | 55.0 | $ | 36.2 | $ | 18.8 | |||||||
|
|
|
|
|
|
|
|||||||
| 1 | The Company owns a 1% gross proceeds’ royalty on certain claims in the Lac de Gras region of the Northwest Territories, including the Diavik lands controlled by Dominion Diamond Corporation and Diavik Diamond Mines Inc. |
| 2 | Royalty on gold production from the Paul Isnard concessions. On December 5, 2011, the Company entered into an option agreement, which provided the third party an ability to purchase the existing royalty. The option was exercised and the royalty was sold on November 7, 2013 in exchange for C$4.2 million, 18.2 million shares in Columbus Gold Corp., and a net smelter return (“NSR”) royalty in the Paul Isnard concession with an estimated fair value at that time of $5.6 million. |
15. EXPLORATION AND EVALUATION ASSETS
| December 31, 2014 |
December 31, 2013 |
|||||||
| Balance, beginning of the year |
$ | 533.3 | $ | 533.3 | ||||
| Exploration and evaluation expenditures |
11.5 | — | ||||||
|
|
|
|
|
|||||
| Balance, end of the year |
$ | 544.8 | $ | 533.3 | ||||
|
|
|
|
|
|||||
| 16. | PROVISIONS |
| December 31, 2014 |
December 31, 2013 |
|||||||
| Asset retirement obligations |
$ | 293.7 | $ | 235.6 | ||||
| Yatela loss provision1 |
13.2 | 0.8 | ||||||
| Other |
4.5 | 22.0 | ||||||
|
|
|
|
|
|||||
| $ | 311.4 | $ | 258.4 | |||||
|
|
|
|
|
|||||
| Non-current provisions |
$ | 297.7 | $ | 247.0 | ||||
| Current portion of provisions |
13.7 | 11.4 | ||||||
|
|
|
|
|
|||||
| $ | 311.4 | $ | 258.4 | |||||
|
|
|
|
|
|||||
| 1 | The provision was reduced by a payment of $4.0 million during the year ended December 31, 2014 (December 31, 2013 - $nil). |
| (a) | Asset retirement obligations |
The Company’s activities are subject to various laws and regulations regarding environmental restoration and closure provisions for which the Company estimates future costs. These provisions may be revised on the basis of amendments to such laws and regulations and the availability of new information, such as changes in reserves corresponding to a change in the mine life and discount rates, changes in estimated costs of reclamation activities and acquisition or construction of a new mine. The Company makes a provision based on a best estimate of the future cost of rehabilitating mine sites and related production facilities on a discounted basis.
IAMGOLD CORPORATION
2014 CONSOLIDATED FINANCIAL STATEMENTS
PAGE 70
The following table presents the reconciliation of the provision for asset retirement obligations:
| Years ended December 31, | ||||||||||
| Notes | 2014 | 2013 | ||||||||
| Balance, beginning of year |
$ | 235.6 | $ | 218.5 | ||||||
| Reclassification of Niobec mine to liabilities held for sale |
(8.1 | ) | — | |||||||
| Revision of estimated cash flows and discount rates: |
||||||||||
| Capitalized in mining assets |
21.9 | 29.3 | ||||||||
| Expense (recovery) related to closed sites |
48.7 | (8.8 | ) | |||||||
| Accretion expense |
29 | 2.3 | 1.7 | |||||||
| Disbursements |
(6.7 | ) | (5.1 | ) | ||||||
|
|
|
|
|
|||||||
| Balance, end of year |
293.7 | 235.6 | ||||||||
| Less: current portion |
(6.5 | ) | (9.4 | ) | ||||||
|
|
|
|
|
|||||||
| Non-current portion |
$ | 287.2 | $ | 226.2 | ||||||
|
|
|
|
|
|||||||
As at December 31, 2014, the Company had letters of credit in the amount of $61.4 million to guarantee asset retirement obligations compared to $65.1 million at December 31, 2013. The Company also has legally restricted cash of $8.7 million (December 31, 2013 - $8.6 million) included in other non-current assets for the purposes of settling asset retirement obligations.
The schedule of estimated future disbursements for rehabilitation is as follows:
| 2015 |
$ | 7.5 | ||
| 2016 |
3.6 | |||
| 2017 |
5.7 | |||
| 2018 |
3.9 | |||
| 2019 |
10.7 | |||
| 2020 onwards |
284.7 | |||
|
|
|
|||
| $ | 316.1 | |||
|
|
|
As at December 31, 2014, estimated undiscounted amounts of cash flows required to settle the obligations, expected timing of payments and the average real discount rates assumed in measuring the asset retirement obligations were as follows:
| Undiscounted Amounts Required |
Expected Timing of Payments |
Average Real Discount Rate |
||||||||
| Rosebel mine |
$ | 79.0 | 2015 - 2031 | 0.6 | % | |||||
| Essakane mine |
64.1 | 2015 - 2028 | 0.1 | % | ||||||
| Doyon mine |
161.1 | 2015 - 2044 | 0.3 | % | ||||||
| Other Canadian sites |
11.9 | 2015 - 2109 | 0.3 | % | ||||||
|
|
|
|
|
|||||||
| 316.1 | ||||||||||
| Discontinued operations |
||||||||||
| Niobec mine |
12.3 | 2015 - 2063 | 0.3 | % | ||||||
|
|
|
|
|
|||||||
| (b) | Provisions for litigation claims and regulatory assessments |
By their nature, contingencies will only be confirmed by the occurrence or non-occurrence of one or more uncertain future events. The assessment of contingencies inherently involves the exercise of significant judgments and estimates of the outcome of future events.
The Company operates in various countries around the world and may be subject to assessments by the regulatory authorities in each of those countries, which can be complex and subject to interpretation. Assessments may relate to matters such as income and other taxes, duties and environmental matters. The Company is diligent and exercises informed judgment to interpret the provisions of applicable laws and regulations as well as their application and administration by regulatory authorities to reasonably determine and pay the amounts due. From time to time, the Company
IAMGOLD CORPORATION
2014 CONSOLIDATED FINANCIAL STATEMENTS
PAGE 71
may undergo a review by the regulatory authorities and in connection with such reviews, disputes may arise with respect to the Company’s interpretations about the amounts due and paid.
The Company is also subject to various litigation actions. In-house counsel, outside legal advisors, and other subject matter experts assess the potential outcome of litigation and regulatory assessments. Accordingly, the Company establishes provisions for future disbursements considered probable.
As at December 31, 2014, the Company did not have any material provisions for litigation claims or regulatory assessments. Further, the Company does not believe claims or regulatory assessments, for which no provision has been recorded, will have a material impact on the financial position of the Company.
| 17. | OTHER LIABILITIES |
| Notes | December 31, 2014 |
December 31, 2013 |
||||||||
| Finance lease obligations |
34(b) | $ | 34.9 | $ | — | |||||
| Cash flow hedges |
19(c) | 7.6 | — | |||||||
| Non-hedge derivatives |
19(d) | 52.9 | 5.2 | |||||||
| Other |
— | 4.0 | ||||||||
|
|
|
|
|
|||||||
| $ | 95.4 | $ | 9.2 | |||||||
|
|
|
|
|
|||||||
| Non-current other liabilities |
$ | 59.2 | $ | 3.0 | ||||||
| Current portion of other liabilities |
$ | 36.2 | $ | 6.2 | ||||||
|
|
|
|
|
|||||||
| 18. | LONG-TERM DEBT AND CREDIT FACILITIES |
| (a) | Senior unsecured notes |
On September 21, 2012, the Company issued at face value $650.0 million of senior unsecured notes (“Notes”) with an interest rate of 6.75% per annum. The Notes are denominated in U.S. dollars and mature on October 1, 2020. Interest is payable in arrears in equal semi-annual installments on April 1 and October 1.
Except as noted below, the Notes are not redeemable, in whole or part, by the Company until October 1, 2016. On and after October 1, 2016, the Company may redeem the Notes, in whole or in part, at the relevant redemption price (expressed as a percentage of the principal amount of the Notes) and accrued and unpaid interest on the Notes up to the redemption date. The redemption price for the Notes during the 12-month period beginning on October 1 of each of the following years is: 2016 - 103.375%; 2017 - 101.688%; and 2018 and thereafter - 100%.
Prior to October 1, 2016, the Company may redeem some or all of the Notes at a price equal to 100% of the principal amount of the Notes plus a “make-whole” premium for accrued and unpaid interest.
Prior to October 1, 2015, using the cash proceeds from an equity offering the Company may redeem up to 35% of the original aggregate principal amount of the Notes at a redemption price equal to 106.750% of the aggregate principal amount thereof, plus accrued and unpaid interest up to the redemption date.
The Company may from time to time seek to retire or purchase for cash its outstanding debt securities in open market purchases, privately negotiated transactions or otherwise. Such repurchases, if any, will depend on prevailing market conditions, our liquidity requirements, contractual restrictions and other factors. The amounts involved may be material.
The following are the contractual maturities related to the Notes, including interest payments.
| Payments due by period | ||||||||||||||||||||||||
| Notes, balance as at |
Carrying amount1 |
Contractual cash flows |
<1 yr | 1-2 yrs | 3-5 yrs | >5 yrs | ||||||||||||||||||
| December 31, 2014 |
$ | 650.0 | $ | 913.4 | $ | 43.9 | $ | 87.8 | $ | 87.8 | $ | 693.9 | ||||||||||||
| December 31, 2013 |
$ | 650.0 | $ | 957.3 | $ | 43.9 | $ | 87.8 | $ | 87.8 | $ | 737.8 | ||||||||||||
| 1 | The carrying amount of the long-term debt excludes unamortized deferred transaction costs of $8.3 million as at December 31, 2014 (December 31, 2013 - $9.7 million). |
| (b) | Credit facilities |
The Company has a four-year $500.0 million unsecured revolving credit facility. The maturity date of the credit facility is February 22, 2016 with a provision to extend the maturity date for a period of one year. No funds were drawn against the
IAMGOLD CORPORATION
2014 CONSOLIDATED FINANCIAL STATEMENTS
PAGE 72
credit facilities as at December 31, 2014 and December 31, 2013. The Company has complied with its credit facility covenants as at December 31, 2014.
The Company has a $75.0 million Canadian revolving facility for the issuance of letters of credit. The maturity date of this credit facility is July 23, 2015. The Company’s letters of credits guarantee certain asset retirement obligations and are revalued to U.S. dollars at the end of each reporting period. Refer to note 16(a).
Credit facility issue costs are capitalized in other non-current assets. Amortization is calculated on a straight-line basis over the term of the credit facility. The carrying amount of credit facilities issue costs, net of amortization as at December 31, 2014 was $0.8 million (December 31, 2013 - $2.5 million).
| 19. | FINANCIAL INSTRUMENTS |
| December 31, 2014 | December 31, 2013 | |||||||||||||||
| Financial assets (liabilities) |
Carrying Amount |
Fair Value |
Carrying Amount |
Fair Value |
||||||||||||
| Cash and cash equivalents |
$ | 158.5 | $ | 158.5 | $ | 222.3 | $ | 222.3 | ||||||||
| Current receivables |
7.7 | 7.7 | 31.1 | 31.1 | ||||||||||||
| Receivables from related parties |
26.5 | 26.5 | 38.7 | 38.7 | ||||||||||||
| Marketable securities and warrants |
30.9 | 30.9 | 41.8 | 41.8 | ||||||||||||
| Restricted cash |
8.7 | 8.7 | 8.6 | 8.6 | ||||||||||||
| Bond fund and fixed rate investments |
6.0 | 6.0 | 5.3 | 5.3 | ||||||||||||
| Net derivative liabilities |
(60.5 | ) | (60.5 | ) | (5.2 | ) | (5.2 | ) | ||||||||
| Accounts payable and accrued liabilities |
(169.5 | ) | (169.5 | ) | (185.6 | ) | (185.6 | ) | ||||||||
| Finance lease obligation |
(34.9 | ) | (34.9 | ) | — | — | ||||||||||
| Long-term debt1 |
$ | (650.0 | ) | $ | (490.0 | ) | $ | (650.0 | ) | $ | (569.6 | ) | ||||
| 1 | The carrying amount of the long-term debt excludes unamortized deferred transaction costs of $8.3 million as at December 31, 2014 (December 31, 2013 - $9.7 million). |
| (a) | Risks |
The Company is subject to various financial risks that could have a significant impact on profitability, levels of operating cash flow and financial conditions. Ongoing financial market conditions may have an impact on interest rates, gold prices and currency rates.
The Company is exposed to various liquidity, credit and market risks associated with its financial instruments, and manages those risks as follows:
| (i) | Liquidity risk |
Liquidity risk is the risk that an entity will encounter difficulty in meeting obligations associated with financial liabilities that are settled by delivering cash or another financial asset.
The Company’s approach to managing this risk is to ensure that there is sufficient liquidity to meet its liabilities when due, under both normal and stressed conditions, without incurring unacceptable losses or risking damage.
As at December 31, 2014, the Company’s cash, cash equivalents and gold bullion position at market value was $321.0 million (December 31, 2013 - $384.6 million). The Company had notes payable of $650.0 million as at December 31, 2014 (December 31, 2013 - $650.0 million).
As at December 31, 2014, no funds were drawn against the Company’s $500.0 million total unsecured revolving credit facilities. As at December 31, 2014, the Company has committed $61.4 million (December 31, 2013 - $65.1 million) of its $75.0 million letters of credit revolving facility for the guarantee of certain asset retirement obligations.
On January 15, 2014, the Company filed a renewal of its existing short form base shelf prospectus qualifying the distribution of securities of up to $1.0 billion. This renewal has a life of 25 months and may be utilized by the Company to fund ongoing operations and/or capital requirements, reduce the level of indebtedness outstanding from time to time, fund capital programs, potential future acquisitions and for general corporate purposes. The Company filed this base shelf prospectus to maintain financial flexibility. The value of the securities to be issued is subject to compliance with the covenants of the unsecured revolving credit facilities.
The Company has a treasury policy designed to support management of liquidity risk as follows:
| • | Invest in financial instruments in order to preserve capital, maintain required liquidity and realize a competitive rate of return while considering an appropriate and tolerable level of credit risk; |
| • | Evaluate, review and monitor on a periodic basis, credit ratings and limits for counterparties with whom funds are invested; |
IAMGOLD CORPORATION
2014 CONSOLIDATED FINANCIAL STATEMENTS
PAGE 73
| • | Invest or maintain investment in gold bullion until a combination of factors indicates that a sale or use of gold bullion is strategically advantageous for the Company, or as part of the overall treasury management; |
| • | Monitor cash balances within each operating entity; |
| • | Perform short- to medium-term cash flow forecasting, as well as medium and long-term forecasting incorporating relevant budget information; and |
| • | Determine market risks inherent in the business, including currency, fuel and other non-gold commodities and evaluate, implement and monitor hedging strategies through the use of derivative instruments. |
Under the terms of the Company’s derivative agreements, counterparties cannot require the immediate settlement of outstanding derivatives, except upon the occurrence of customary events of default such as covenant breaches, including financial covenants, insolvency or bankruptcy. The Company generally mitigates liquidity risk associated with these instruments by spreading out the maturity of its derivatives over time.
| (ii) | Credit risk |
Credit risk is the risk that one party to a financial instrument will cause a financial loss for the other party by failing to discharge an obligation. The maximum amount of credit risk is equal to the balance of cash and cash equivalents, receivables, derivative assets and restricted cash. Where applicable, the measurement of the fair value of derivatives accounts for counterparty credit risk.
The Company holds cash and cash equivalents in credit worthy financial institutions that comply with the Company’s investment policy and its credit risk parameters.
For derivatives, the Company mitigates credit risk by entering into derivatives with high quality counterparties, limiting the exposure per counterparty, and monitoring the financial condition of the counterparties.
The credit risk related to gold receivables is considered minimal as gold is sold to creditworthy major banks and settled promptly, usually within the following month.
The credit risk is also related to receivables from governments related primarily to value added tax and income tax.
| (iii) | Market risk |
Market risk is the risk that the fair value or future cash flows of a financial instrument will fluctuate because of changes in market prices. For hedging activities, it is the risk that the fair value of a derivative might be adversely affected by a change in underlying commodity prices or currency exchange rates, and that this in turn affects the Company’s financial condition.
The Company mitigates market risk by establishing and monitoring parameters that limit the types and degree of market risk that may be undertaken, establishing trading agreements with counterparties under which there are no requirement to post any collateral or make any margin calls on derivatives. Counterparties cannot require settlement solely because of an adverse change in the fair value of a derivative. Market risk comprises the following types of risks, share and commodity market price risk, currency risk, and interest rate risk.
| (b) | Financial assets measured at fair value through other comprehensive income |
Marketable securities fair value reserve
Share market price exposure risk is related to the fluctuation in the market price of marketable securities. The Company’s portfolio of marketable securities is not part of its core operations, and accordingly, gains and losses from these marketable securities are not representative of the Company’s performance during the period. Consequently, the Company has designated all of its investments in marketable securities to be measured at fair value through other comprehensive income. The Company’s portfolio of marketable securities is primarily focused on the mining sector and relates entirely to investments in equity securities.
During the period, the Company disposed of the following marketable securities as they were no longer considered to be strategic for the Company.
| Years ended December 31, | ||||||||
| 2014 | 2013 | |||||||
| Proceeds on sale of marketable securities |
$ | 9.0 | $ | — | ||||
| Acquisition date fair value of marketable securities sold |
(3.8 | ) | — | |||||
|
|
|
|
|
|||||
| Gain on sale of marketable securities recorded in other comprehensive income |
$ | 5.2 | $ | — | ||||
|
|
|
|
|
|||||
For the year ended December 31, 2013, realized gains of $0.8 million on the sale of marketable securities and impairment loss of $14.3 million were transferred from other comprehensive income to the consolidated statements of earnings.
At December 31, 2014, the impact of an increase of 10% in the fair value of marketable securities would have resulted in an increase in unrealized gains, net of tax of $2.5 million that would be included in other comprehensive income with no material change in net earnings. The impact of a decrease of 10% in the fair value of marketable securities would have resulted in a decrease in unrealized gains, net of tax, of $2.5 million that would be included in other comprehensive income with no change in net earnings.
IAMGOLD CORPORATION
2014 CONSOLIDATED FINANCIAL STATEMENTS
PAGE 74
| (c) | Cash flow hedge fair value reserve |
| (i) | Hedging gains (losses) |
| Hedging gains (losses) recognized in cash flow hedge reserve |
(Gains) losses reclassified from cash flow hedge reserve |
|||||||
| From continuing operations |
Year ended December 31, 2014 |
Year ended December 31, 2014 |
||||||
| Exchange rate risk |
||||||||
| Canadian dollar contracts |
||||||||
| Forward contracts |
$ | (0.7 | ) | $ | (3.3 | ) | ||
| Option contracts |
(0.5 | ) | 0.5 | |||||
| Euro contracts |
||||||||
| Forward contracts |
(0.2 | ) | 0.2 | |||||
| Option contracts |
(0.7 | ) | — | |||||
|
|
|
|
|
|||||
| (2.1 | ) | (2.6 | ) | |||||
| Time value excluded from hedge relationship |
(5.1 | ) | 2.3 | |||||
|
|
|
|
|
|||||
| $ | (7.2 | ) | $ | (0.3 | ) | |||
|
|
|
|
|
|||||
For year ended December 31, 2014, total net gains of $0.3 million were reclassified from the cash flow hedge reserve to the cost of sales in the consolidated statements of earnings. There was no hedge ineffectiveness for the year ended December 31, 2014.
| (ii) | Currency exchange rate risk |
Movements in the Canadian dollar (C$) and the Euro (€) against the U.S. dollar have a direct impact on the Company’s financial statements. The Company’s operations have exposure to these currencies; however, the Company’s functional currency and of its subsidiaries is the U.S. dollar.
The Company manages its exposure to the Canadian dollar and the Euro by executing a combination of forward and option contracts. The Company’s objective is to hedge its exposure to these currencies resulting from operating and capital expenditures requirements at some of its mine sites and corporate offices.
The Company has designated forward and option contracts as cash flow hedges for its highly probable forecasted Canadian dollar and Euro expenditure requirements. The Company has elected to only designate the spot element of forward contracts and the change in the intrinsic value of options in the hedging relationships.
An economic relationship exists between the hedged items and the hedging instruments as the fair values of both the hedged items and hedging instruments move in opposite directions in response to the same risk. The hedge ratio is determined by dividing the quantity of the forward and option contracts by the quantity of the forecasted Canadian dollar and Euro expenditure exposures.
As at December 31, 2014, the Company had outstanding derivative contracts, which qualified for hedge accounting. The periods in which the cash flows are expected to occur and the impact on the consolidated statements of earnings, are as follows:
| December 31, 2014 |
2015 | 2016 | Total | |||||
| Cash flow hedges |
||||||||
| Exchange rate risk |
||||||||
| Canadian dollar contracts (millions of C$) |
145.0 | 60.0 | 205.0 | |||||
| Forward contracts |
100.0 | — | 100.0 | |||||
| Contract rate range (C$/US$) |
$1.10 - $1.12 | |||||||
| Option contracts |
45.0 | 60.0 | 105.0 | |||||
| Contract rate range (C$/US$) |
$1.12 - $1.17 | $1.12 - $1.18 | ||||||
| Euro contracts (millions of €) |
126.0 | — | 126.0 | |||||
| Option contracts |
126.0 | — | 126.0 | |||||
| Contract rate range (€/US$) |
$1.21 - $1.26 | |||||||
IAMGOLD CORPORATION
2014 CONSOLIDATED FINANCIAL STATEMENTS
PAGE 75
The fair value as at December 31, 2014, and the fair value based on an increase or a decrease of 10% of the U.S. dollar exchange rate would have been as follows. The entire change in fair value would be recorded in the consolidated statements of comprehensive income.
| December 31, 2014 |
Increase of 10% |
Decrease of 10% |
||||||||||
| Canadian dollar (C$) |
$ | (4.9 | ) | $ | 14.7 | $ | (28.0 | ) | ||||
| Euro (€) |
$ | (2.7 | ) | $ | 7.9 | $ | (16.2 | ) | ||||
Additional information on hedging instruments and hedged forecast transactions related to exchange rate risk as at December 31, 2014 is as follows:
| Carrying amount | Fair value changes used for calculating hedge ineffectiveness |
|||||||||||||||||||
| Assets | Liabilities | Cash flow hedge fair value reserve |
Hedging instruments |
Hedged items |
||||||||||||||||
| Cash flow hedges |
||||||||||||||||||||
| Exchange rate risk |
||||||||||||||||||||
| Canadian dollar contracts |
||||||||||||||||||||
| Forward contracts |
$ | — | $ | (3.7 | ) | $ | (4.1 | ) | $ | (4.1 | ) | $ | 4.2 | |||||||
| Option contracts |
— | (1.2 | ) | — | — | — | ||||||||||||||
| Euro contracts |
||||||||||||||||||||
| Option contracts |
— | (2.7 | ) | (0.7 | ) | (0.7 | ) | 0.7 | ||||||||||||
|
|
|
|
|
|
|
|
|
|
|
|||||||||||
| $ | — | $ | (7.6 | ) | $ | (4.8 | ) | $ | (4.8 | ) | $ | 4.9 | ||||||||
|
|
|
|
|
|
|
|
|
|
|
|||||||||||
| (d) | Non-hedge derivatives |
| (i) | Currency exchange rate risk |
As at December 31, 2014, the Company did not have any outstanding currency derivative contracts which were not designated for hedge accounting (December 31, 2013 - liability of $4.4 million).
| (ii) | Oil contracts and fuel market price risk |
Diesel is a key input to extract tonnage and, in some cases, to wholly or partially power operations. Since fuel is produced by the refinement of crude oil, changes in the price of oil directly impact fuel costs. The Company believes there is a strong relationship between prices for crude oil and diesel.
As at December 31, 2014, the Company had outstanding option contracts, which were not designated for hedge accounting. The periods in which the cash flows are expected to occur are as follows:
| December 31, 2014 |
2015 | 2016 | 2017 | Total | ||||||
| Crude oil option contracts (barrels) |
1,080,000 | 1,101,000 | 786,000 | 2,967,000 | ||||||
| Contract price range ($/barrel) |
$75 - $95 | $68 - $95 | $71 - $95 | |||||||
The fair value as at December 31, 2014 was included in other current and non-current liabilities.
| December 31, 2014 |
December 31, 2013 |
|||||||
| Crude oil option contracts |
$ | (52.9 | ) | $ | (0.4 | ) | ||
The fair value of these contracts, based on an increase or a decrease of 10% of the price, would have been as follows. The entire change in fair value would be recorded in the consolidated statement of earnings.
| December 31, 2014 |
Increase of 10% |
Decrease of 10% |
||||||||||
| Crude oil option contracts |
$ | (52.9 | ) | $ | (39.3 | ) | $ | (72.8 | ) | |||
IAMGOLD CORPORATION
2014 CONSOLIDATED FINANCIAL STATEMENTS
PAGE 76
| (iii) | Non-hedge derivative gains (losses) |
Non-hedge derivative gains (losses) are included in interest income and derivatives and other investment gains (losses) in the consolidated statements of earnings. These gains (losses) relate to contracts associated with the mine sites, development projects and corporate.
| Years ended December 31, | ||||||||
| 2014 | 2013 | |||||||
| Unrealized losses on |
||||||||
| Derivatives - currency contracts |
$ | (0.9 | ) | $ | (18.4 | ) | ||
| Derivatives - oil contracts |
(52.5 | ) | (3.1 | ) | ||||
| Other |
(0.1 | ) | (0.6 | ) | ||||
|
|
|
|
|
|||||
| (53.5 | ) | (22.1 | ) | |||||
|
|
|
|
|
|||||
| Realized gains (losses) on |
||||||||
| Derivatives - currency contracts |
(2.7 | ) | 11.8 | |||||
| Derivatives - oil contracts |
— | 2.6 | ||||||
|
|
|
|
|
|||||
| (2.7 | ) | 14.4 | ||||||
|
|
|
|
|
|||||
| $ | (56.2 | ) | $ | (7.7 | ) | |||
|
|
|
|
|
|||||
| 20. | FAIR VALUE MEASUREMENTS |
The fair value hierarchy categorizes into three levels the inputs to valuation techniques used to measure fair value. The fair value hierarchy gives the highest priority to quoted prices (unadjusted) in active markets for identical assets or liabilities (Level 1 inputs) and the lowest priority to unobservable inputs (Level 3 inputs).
| • | Level 1 inputs are quoted prices (unadjusted) in active markets for identical assets or liabilities that the entity can access at the measurement date. |
| • | Level 2 inputs are inputs other than quoted prices included within Level 1 that are observable for the asset or liability, either directly or indirectly such as derived from prices. |
| • | Level 3 inputs are unobservable inputs for the asset or liability. |
There have been no changes in categories of financial instruments since December 31, 2013.
| (a) | Assets and liabilities measured at fair value on a recurring basis |
As at year ended December 31, 2014, the Company’s assets and liabilities recorded at fair value were as follows. The fair value hierarchy levels remain unchanged since December 31, 2013:
| Fair value, December 31, 2014 |
Level 1 | Level 2 | Level 3 | Total | December 31, 2013 |
|||||||||||||||
| Assets |
||||||||||||||||||||
| Cash and cash equivalents |
$ | 158.5 | $ | — | $ | — | $ | 158.5 | $ | 222.3 | ||||||||||
| Restricted cash |
8.7 | — | — | 8.7 | 8.6 | |||||||||||||||
| Marketable securities |
28.6 | — | 2.3 | 30.9 | 41.7 | |||||||||||||||
| Bond fund investments |
6.0 | — | — | 6.0 | 5.3 | |||||||||||||||
| Derivatives |
||||||||||||||||||||
| Oil contracts |
— | — | — | — | 0.1 | |||||||||||||||
|
|
|
|
|
|
|
|
|
|
|
|||||||||||
| $ | 201.8 | $ | — | $ | 2.3 | $ | 204.1 | $ | 278.0 | |||||||||||
|
|
|
|
|
|
|
|
|
|
|
|||||||||||
| Liabilities |
||||||||||||||||||||
| Derivatives |
||||||||||||||||||||
| Currency contracts |
$ | — | $ | (7.6 | ) | $ | — | $ | (7.6 | ) | $ | (4.4 | ) | |||||||
| Oil contracts |
— | (52.9 | ) | — | (52.9 | ) | (0.5 | ) | ||||||||||||
| Aluminum contracts |
— | — | — | — | 0.4 | |||||||||||||||
|
|
|
|
|
|
|
|
|
|
|
|||||||||||
| $ | — | $ | (60.5 | ) | $ | — | $ | (60.5 | ) | $ | (4.5 | ) | ||||||||
|
|
|
|
|
|
|
|
|
|
|
|||||||||||
IAMGOLD CORPORATION
2014 CONSOLIDATED FINANCIAL STATEMENTS
PAGE 77
| (b) | Valuation techniques |
Marketable securities
The fair value of marketable securities included in Level 1 is determined based on a market approach. The closing price is a quoted market price from the exchange market that is the principal active market for that particular security. Investments in equity instruments that are not actively traded use valuation techniques that require inputs that are both unobservable and significant, and therefore were categorized as Level 3 in the fair value hierarchy. The Company used the latest transaction price for these securities, obtained from the entity, to value these marketable securities.
| Marketable securities included in Level 3 |
||||
| Balance, January 1, 2014 |
$ | 11.2 | ||
| Change in fair value reported in other comprehensive income, net of income taxes |
(9.2 | ) | ||
| Shares received |
0.3 | |||
|
|
|
|||
| Balance, December 31, 2014 |
$ | 2.3 | ||
|
|
|
|||
Bond fund investments
The fair value of bond fund investments included in Level 1 is measured using quoted prices in active markets.
Derivatives
For derivative contracts, the Company obtains a valuation of the contracts from counterparties of those contracts. The Company assesses the reasonableness of these valuations through internal methods and third party valuations. The Company then calculates a debt valuation adjustment or a credit valuation adjustment by considering the risk of non-performance by the counterparties and the Company’s own credit risk. Valuations are based on forward rates considering the market price, rate of interest and volatility, and take into account the credit risk of the financial instrument, and are therefore classified within Level 2 of the fair value hierarchy.
Long-term debt
Long-term debt is accounted for at amortized cost, using the effective interest rate method. The fair value required to be disclosed is determined using quoted prices (unadjusted) in active markets, and is therefore classified within Level 1 of the fair value hierarchy. The fair value of long-term debt as at December 31, 2014 was $490.0 million (December 31, 2013 - $569.6 million).
Investments in associates
Investments in associates are measured at fair value on a non-recurring basis when an impairment charge or reversal is required to be recorded. After application of the equity method, the fair value of an investment in associate is determined for purposes of assessing whether an impairment charge or reversal of a previously recorded impairment charge is required. For publicly traded companies, the Company determines the fair value of its investment in associates based on a market approach reflecting the closing price of the investment in the associate’s shares at the balance sheet date. Since there is a quoted-market price, this is classified within Level 1 of the fair value hierarchy. As at December 31, 2014, investments in associates measured at fair value were $6.8 million (December 31, 2013 - $6.5 million).
Finance lease obligation
Finance lease obligation is accounted for at amortized cost, using the effective interest rate method. The fair value required to be disclosed is determined using known interest rate inputs and is therefore classified within Level 2 of the fair value hierarchy. As at December 31, 2014, the fair value of the finance lease obligation was $34.9 million (December 31, 2013 - $nil).
FVLCD of CGU’s
The FVLCD of CGU’s were determined for purposes of the impairment assessment. The FVLCD was largely determined by calculating the net present value (“NPV”) of the future cash flows expected to be generated by the CGU. FVLCD is classified within level 3 on the fair value hierarchy. Refer to note 33.
| 21. | CAPITAL MANAGEMENT |
IAMGOLD’s objectives when managing capital are to:
| • | Ensure the Company has sufficient financial capacity to support its operations, current mine development plans, and long-term growth strategy; |
| • | Ensure the Company complies with its long-term debt covenants; and |
| • | Protect the Company’s value with respect to market and risk fluctuations. |
IAMGOLD CORPORATION
2014 CONSOLIDATED FINANCIAL STATEMENTS
PAGE 78
The Company’s capital items are the following:
| December 31, 2014 |
December 31, 2013 |
|||||||
| Cash and cash equivalents |
$ | 158.5 | $ | 222.3 | ||||
| Gold bullion at market value |
162.5 | 162.3 | ||||||
| Credit facilities available for use |
500.0 | 750.0 | ||||||
| Long-term debt1 |
650.0 | 650.0 | ||||||
| Common shares |
2,322.7 | 2,317.6 | ||||||
| 1 | The carrying amount of the long-term debt excludes unamortized deferred transaction costs of $8.3 million as at December 31, 2014 (December 31, 2013 - $9.7 million). |
The Company is in a capital intensive industry that experiences lengthy development lead times as well as risks associated with capital costs and timing of project completion. Factors affecting these risks, which are beyond the Company’s control, include the availability of resources, the issuance of necessary permits, costs of various inputs and the volatility of the gold price.
The adequacy of the Company’s capital structure is assessed on an ongoing basis and adjusted as necessary after taking into consideration the Company’s strategy, the forward gold price, the mining industry, economic conditions and associated risks. In order to maintain or adjust its capital structure, the Company may adjust its capital spending, adjust the amount of dividend distributions, issue new shares, purchase shares for cancellation pursuant to normal course issuer bids, extend its credit facility, issue new debt, repay existing debt, or purchase or sell gold bullion.
In December 2013, the Company suspended future dividend payments in order to preserve its consolidated balance sheet, which is in line with its capital management strategy.
The Company’s cash and cash equivalents, and gold bullion position valued at the December 31, 2014 gold market price, was $321.0 million (December 31, 2013 - $384.6 million).
On January 15, 2014, the Company filed a renewal of its existing short form base shelf prospectus qualifying the distribution of securities of up to $1 billion. This renewal has a life of 25 months and may be utilized to fund ongoing operations and/or capital requirements, reduce the level of indebtedness outstanding from time to time, fund capital programs, potential future acquisitions and for general corporate purposes. The value of the securities to be issued is subject to compliance with the covenants of the unsecured revolving credit facilities.
The Notes indenture contains a restriction on the use of proceeds from the sale of Niobec. This restriction requires the Company to invest the net proceeds back into the business within 365 days, with the option to extend another 180 days in certain cases. Investments include acquisitions and capital expenditures.
| 22. | SHARE CAPITAL |
The Company is authorized to issue an unlimited number of common shares, first preference shares issuable in series and second preference shares issuable in series.
| Years ended December 31, | ||||||||
| Number of shares (in millions) |
2014 | 2013 | ||||||
| Outstanding, beginning of the year |
376.6 | 376.5 | ||||||
| Issuance of share capital |
0.3 | 0.1 | ||||||
|
|
|
|
|
|||||
| Outstanding, end of the year |
376.9 | 376.6 | ||||||
|
|
|
|
|
|||||
In December 2013, the Company suspended future dividend payments in order to preserve liquidity. As a result, for the year ended December 31, 2014, the Company did not pay dividends to its shareholders (December 31, 2013 - payment of $47.0 million).
IAMGOLD CORPORATION
2014 CONSOLIDATED FINANCIAL STATEMENTS
PAGE 79
| 23. | NON-CONTROLLING INTERESTS |
Financial information of subsidiaries that have material non-controlling interests are provided below:
| December 31, 2014 | December 31, 2013 | |||||||||||||||
| Rosebel | Essakane | Rosebel | Essakane | |||||||||||||
| Percentage of voting rights held by non-controlling interests |
5 | % | 10 | % | 5 | % | 10 | % | ||||||||
|
|
|
|
|
|
|
|
|
|||||||||
| Accumulated non-controlling interest |
$ | 22.0 | $ | 19.1 | $ | 20.3 | $ | 15.5 | ||||||||
| Net earnings (losses) attributable to non-controlling interests |
$ | 1.7 | $ | 3.6 | $ | (0.5 | ) | $ | (30.8 | ) | ||||||
| Dividends paid to material non-controlling interests1 |
$ | — | $ | — | $ | 3.1 | $ | 1.1 | ||||||||
|
|
|
|
|
|
|
|
|
|||||||||
| 1 | For the year ended December 31, 2014, dividends paid to other non-controlling interests amounted to $4.1 million (December 31, 2013 - $4.1 million). |
Selected summarized information relating to these subsidiaries are provided below, before any intercompany eliminations:
| December 31, 2014 | December 31, 2013 | |||||||||||||||
| Rosebel | Essakane | Rosebel | Essakane | |||||||||||||
| Current assets |
$ | 160.8 | $ | 196.0 | $ | 119.1 | $ | 208.0 | ||||||||
| Non-current assets |
593.6 | 897.3 | 533.1 | 835.1 | ||||||||||||
| Current liabilities |
(67.6 | ) | (55.1 | ) | (54.0 | ) | (59.1 | ) | ||||||||
| Non-current liabilities |
(193.6 | ) | (692.3 | ) | (139.7 | ) | (672.3 | ) | ||||||||
|
|
|
|
|
|
|
|
|
|||||||||
| Net assets |
$ | 493.2 | $ | 345.9 | $ | 458.5 | $ | 311.7 | ||||||||
|
|
|
|
|
|
|
|
|
|||||||||
| Revenues |
$ | 438.7 | $ | 457.8 | $ | 479.5 | $ | 379.9 | ||||||||
| Net earnings (losses) and comprehensive income (loss) |
$ | 34.6 | $ | 36.0 | $ | (148.5 | ) | $ | (308.3 | ) | ||||||
|
|
|
|
|
|
|
|
|
|||||||||
| Net cash from operating activities |
$ | 150.3 | $ | 163.8 | $ | 143.3 | $ | 77.3 | ||||||||
| Net cash used in investing activities |
(79.9 | ) | (96.9 | ) | (138.1 | ) | (295.8 | ) | ||||||||
| Net cash from (used in) financing activities |
(4.0 | ) | (47.1 | ) | (46.4 | ) | 167.0 | |||||||||
|
|
|
|
|
|
|
|
|
|||||||||
| Net increase (decrease) in cash and cash equivalents |
$ | 66.4 | $ | 19.8 | $ | (41.2 | ) | $ | (51.5 | ) | ||||||
|
|
|
|
|
|
|
|
|
|||||||||
The Company’s ability to access or use the assets of Rosebel and Essakane to settle its liabilities is not significantly restricted by known current contractual or regulatory requirements, or from the protective rights of non-controlling interests. Dividends payable by Rosebel must be approved by the Rosebel Supervisory Board, which includes representation from the non-controlling interest.
| 24. | LOSSES PER SHARE |
Basic losses per share computation
| Years ended December 31, | ||||||||
| 2014 | 2013 | |||||||
| Numerator |
||||||||
| Net losses from continuing operations attributable to equity shareholders of IAMGOLD |
$ | (269.5 | ) | $ | (862.6 | ) | ||
| Net earnings from discontinued operations attributable to equity shareholders of IAMGOLD |
62.7 | 30.1 | ||||||
| Net losses attributable to equity holders of IAMGOLD |
(206.8 | ) | (832.5 | ) | ||||
|
|
|
|
|
|||||
| Denominator (in millions) |
||||||||
| Weighted average number of common shares (basic) |
376.8 | 376.6 | ||||||
|
|
|
|
|
|||||
| Basic losses from continuing operations attributable to equity shareholders of IAMGOLD per share ($/share) |
$ | (0.72 | ) | $ | (2.29 | ) | ||
| Basic earnings from discontinued operations attributable to equity shareholders of IAMGOLD per share ($/share) |
$ | 0.17 | $ | 0.08 | ||||
| Basic losses attributable to equity holders of IAMGOLD per share ($/share) |
$ | (0.55 | ) | $ | (2.21 | ) | ||
|
|
|
|
|
|||||
IAMGOLD CORPORATION
2014 CONSOLIDATED FINANCIAL STATEMENTS
PAGE 80
Diluted losses per share computation
| Years ended December 31, | ||||||||
| 2014 | 2013 | |||||||
| Denominator (in millions) |
||||||||
| Weighted average number of common shares (basic) |
376.8 | 376.6 | ||||||
| Dilutive effect of share options |
— | — | ||||||
| Dilutive effect of restricted share units |
— | — | ||||||
|
|
|
|
|
|||||
| Weighted average number of common shares (diluted) |
376.8 | 376.6 | ||||||
|
|
|
|
|
|||||
| Diluted losses from continuing operations attributable to equity shareholders of IAMGOLD per share ($/share) |
$ | (0.72 | ) | $ | (2.29 | ) | ||
| Diluted losses from discontinued operations attributable to equity shareholders of IAMGOLD per share ($/share) |
$ | 0.17 | $ | 0.08 | ||||
| Diluted earnings attributable to equity holders of IAMGOLD per share ($/share) |
$ | (0.55 | ) | $ | (2.21 | ) | ||
|
|
|
|
|
|||||
Equity instruments excluded from the computation of diluted losses per share, which could be dilutive in the future, were as follows:
| Years ended December 31, | ||||||||
| (in millions) |
2014 | 2013 | ||||||
| Share options |
5.4 | 5.4 | ||||||
| Restricted share units |
2.0 | 1.1 | ||||||
| Performance share units |
0.1 | 0.4 | ||||||
|
|
|
|
|
|||||
| 7.5 | 6.9 | |||||||
|
|
|
|
|
|||||
25. SHARE-BASED COMPENSATION
| Years ended December 31, | ||||||||
| 2014 | 2013 | |||||||
| Share option award plan |
$ | 3.7 | $ | 4.3 | ||||
| Full value award plans |
4.4 | 5.8 | ||||||
|
|
|
|
|
|||||
| $ | 8.1 | $ | 10.1 | |||||
|
|
|
|
|
|||||
| (a) | Share option award plan |
The Company has a comprehensive share option plan for its full-time employees, directors and officers. The options vest over four to five years and expire no later than 7 years from the grant date.
The reserve for share options has a maximum allotment of 25,505,624 common shares. In 2014, the Company’s Board of Directors approved a reallocation of 500,000 shares from the share purchase plan reserve to the share option plan reserve. In addition, the Company’s shareholders approved an increase of 4,748,223 common shares in the share option plan reserve. As of December 31, 2014, the total number of shares in reserve was 11,751,824 of which 5,420,689 were outstanding and 6,331,135 were unallocated.
IAMGOLD CORPORATION
2014 CONSOLIDATED FINANCIAL STATEMENTS
PAGE 81
| Year ended December 31, 2014 |
Year ended December 31, 2013 |
|||||||||||||||
| Share options (in millions) |
Weighted average exercise price (C$)1 |
Share options (in millions) |
Weighted average exercise price (C$)1 |
|||||||||||||
| Outstanding, beginning of the year |
5.4 | $ | 12.37 | 4.1 | $ | 13.92 | ||||||||||
| Granted |
1.3 | 4.38 | 2.0 | 7.70 | ||||||||||||
| Forfeited |
(1.3 | ) | 11.80 | (0.7 | ) | 8.56 | ||||||||||
|
|
|
|
|
|
|
|
|
|||||||||
| Outstanding, end of the year |
5.4 | $ | 10.56 | 5.4 | $ | 12.37 | ||||||||||
|
|
|
|
|
|
|
|
|
|||||||||
| Exercisable, end of the year |
2.3 | $ | 13.42 | 1.9 | $ | 15.16 | ||||||||||
|
|
|
|
|
|
|
|
|
|||||||||
| 1 | Exercise prices are denominated in Canadian dollars. The exchange rate at December 31, 2014 between the U.S. dollar and Canadian dollar was $0.8620/C$. |
The following table summarizes information related to share options outstanding at December 31, 2014:
| Range of Prices C$/share |
Number Outstanding |
Weighted Average Remaining Contractual Life - years |
Weighted Average Exercise Price C$/share |
|||||||||
| 1.01 - 5.00 |
1.2 | 6.2 | 4.38 | |||||||||
| 5.01 - 10.00 |
1.7 | 5.2 | 7.67 | |||||||||
| 10.01 - 15.00 |
1.6 | 3.1 | 13.33 | |||||||||
| 15.01 - 20.00 |
0.7 | 3.1 | 18.39 | |||||||||
| 20.01 - 25.00 |
0.2 | 2.9 | 22.42 | |||||||||
|
|
|
|
|
|
|
|||||||
| 5.4 | 4.4 | 10.56 | ||||||||||
|
|
|
|
|
|
|
|||||||
The following were the weighted average inputs to the Black-Scholes model used in determining fair value of the options granted. The estimated fair value of the options is expensed over the options’ expected life.
| Years ended December 31, | ||||||||
| 2014 | 2013 | |||||||
| Weighted average risk-free interest rate |
2 | % | 1 | % | ||||
| Weighted average expected volatility1 |
50 | % | 46 | % | ||||
| Weighted average dividend yield |
0.00 | % | 3.35 | % | ||||
| Weighted average expected life of options issued (years) |
5.0 | 5.0 | ||||||
| Weighted average grant-date fair value (C$ per share) |
$ | 1.89 | $ | 2.34 | ||||
| Weighted average share price at grant date (C$ per share) |
$ | 4.29 | $ | 7.67 | ||||
| Weighted average exercise price (C$ per share) |
$ | 4.38 | $ | 7.70 | ||||
| 1 | Expected volatility is estimated by considering historic average share price volatility based on the average expected life of the options. |
| (b) | Full value award plans |
(i) Full value award reserve
The Company has a reserve for restricted share units and performance share units for employees and directors with a maximum allotment of 8,756,762 common shares. In 2014, the Company’s Board of Directors approved a reallocation of 1,100,000 shares from the share purchase plan reserve to the full value award reserve. In addition, the Company’s shareholders approved an increase of 4,556,762 common shares in the full value award reserve. As of December 31, 2014, the total number of shares in reserve was 7,979,297 of which 2,142,077 were outstanding and 5,837,220 were unallocated.
IAMGOLD CORPORATION
2014 CONSOLIDATED FINANCIAL STATEMENTS
PAGE 82
A summary of the status of the Company’s restricted share units and performance share units issued to employees and directors under the share bonus plan reserve and changes during the year is presented below.
| Years ended December 31, | ||||||||
| (in millions) |
2014 | 2013 | ||||||
| Outstanding, beginning of the year |
1.5 | 1.1 | ||||||
| Granted |
1.3 | 0.8 | ||||||
| Issued |
(0.3 | ) | (0.1 | ) | ||||
| Forfeited |
(0.4 | ) | (0.3 | ) | ||||
|
|
|
|
|
|||||
| Outstanding, end of the year |
2.1 | 1.5 | ||||||
|
|
|
|
|
|||||
(ii) Summary of awards granted
Restricted share units (“RSU”)
Executive officers, directors and certain employees are granted restricted share units from the full value award reserve on an annual basis.
Employee restricted share unit grants vest over twelve to thirty-five months, have no restrictions upon vesting and are equity settled. There are no cash settlement alternatives and no vesting conditions other than service.
Restricted share units are granted to employees based on performance objectives and criteria determined on an annual basis based on guidelines established by the Human Resources and Compensation Committee of the Board of Directors. The amount of shares granted is determined as part of the employees’ overall compensation.
Director restricted share units vest at the end of each year, have no restrictions upon vesting and are equity settled. There are no cash settlement alternatives and no vesting conditions other than service. Restricted share units are granted as part of their retainer compensation established by the Nominating and Corporate Governance Committee and approved by the Board of Directors.
The following are the weighted average inputs to the model used in determining fair value for restricted share units granted. The estimated fair value of the awards is expensed over their vesting period.
| Years ended December 31, | ||||||||
| 2014 | 2013 | |||||||
| Weighted average risk-free interest rate |
1 | % | 1 | % | ||||
| Weighted average expected volatility1 |
55 | % | 44 | % | ||||
| Weighted average dividend yield |
0.00 | % | 3.27 | % | ||||
| Weighted average expected life of RSUs issued (years) |
2.5 | 2.8 | ||||||
| Weighted average grant-date fair value (C$ per share) |
$ | 4.34 | $ | 7.22 | ||||
| Weighted average share price at grant date (C$ per share) |
$ | 4.34 | $ | 7.88 | ||||
| Model used |
Black-Scholes | Black-Scholes | ||||||
| 1 | Expected volatility is estimated by considering historic average share price volatility based on the average expected life of the options. |
| (c) | Share purchase plan |
The Company has a share purchase plan for employees with more than three months of continuous service. Participants determine their contribution as a whole percentage of their base salary from 1% to 10%. The Company matches 75% of the first 5% of employee contributions, to a maximum of 3.75% of the employee’s salary, towards the purchase of shares on the open market. No shares are issued from treasury under the current purchase plan. The Company’s contribution is expensed and is considered vested at the end of the day on December 31 of each calendar year.
IAMGOLD CORPORATION
2014 CONSOLIDATED FINANCIAL STATEMENTS
PAGE 83
| 26. | COST OF SALES |
Cost of sales includes mine production, transport and smelter costs, site administrative costs, royalty expenses, and depreciation expense.
| Years ended December 31, | ||||||||
| 2014 | 2013 | |||||||
| Operating costs - mines |
$ | 643.1 | $ | 476.6 | ||||
| Royalties |
44.8 | 48.1 | ||||||
| Depreciation expense1 |
205.0 | 143.8 | ||||||
|
|
|
|
|
|||||
| $ | 892.9 | $ | 668.5 | |||||
|
|
|
|
|
|||||
| 1 | Depreciation expense excludes depreciation related to corporate assets, which is included in general and administrative expenses. |
| 27. | GENERAL AND ADMINISTRATIVE EXPENSES |
| Years ended December 31, | ||||||||
| 2014 | 2013 | |||||||
| Salaries |
$ | 25.3 | $ | 23.8 | ||||
| Director fees and expenses |
1.6 | 1.6 | ||||||
| Professional and consulting fees |
6.8 | 8.2 | ||||||
| Other administration costs |
1.7 | 2.0 | ||||||
| Share-based compensation |
5.2 | 9.3 | ||||||
| Depreciation expense |
4.2 | 3.5 | ||||||
|
|
|
|
|
|||||
| $ | 44.8 | $ | 48.4 | |||||
|
|
|
|
|
|||||
| 28. | OTHER EXPENSES |
| Years ended December 31, | ||||||||
| 2014 | 2013 | |||||||
| Changes in asset retirement obligations at closed sites |
$ | 48.7 | $ | (8.8 | ) | |||
| Restructuring costs |
6.5 | 1.8 | ||||||
| Loss on disposal of assets |
8.5 | 1.6 | ||||||
| Other |
6.4 | 7.0 | ||||||
|
|
|
|
|
|||||
| $ | 70.1 | $ | 1.6 | |||||
|
|
|
|
|
|||||
| 29. | FINANCE COSTS |
| Years ended December 31, | ||||||||
| 2014 | 2013 | |||||||
| Interest expense |
$ | 19.6 | $ | 17.6 | ||||
| Credit facility fees |
3.7 | 3.3 | ||||||
| Accretion expense |
2.3 | 1.6 | ||||||
| Other |
0.9 | 0.4 | ||||||
|
|
|
|
|
|||||
| $ | 26.5 | $ | 22.9 | |||||
|
|
|
|
|
|||||
Total interest paid during the year was $44.8 million (December 31, 2013 - $45.3 million). Total interest paid includes the interest on the unsecured debt and interest on the finance leases.
IAMGOLD CORPORATION
2014 CONSOLIDATED FINANCIAL STATEMENTS
PAGE 84
| 30. | INTEREST INCOME AND DERIVATIVES AND OTHER INVESTMENT LOSSES |
| Years ended December 31, | ||||||||
| 2014 | 2013 | |||||||
| Interest income |
$ | 1.0 | $ | 3.4 | ||||
| Reversal (write-down) of investments in associates and marketable securities |
3.4 | (69.1 | ) | |||||
| Recovery of write-down (write-down) of accounts receivable |
5.3 | (49.3 | ) | |||||
| Non-hedge derivative losses |
(56.2 | ) | (7.7 | ) | ||||
| Gains on sale of royalties |
— | 14.1 | ||||||
| Other |
6.3 | 6.5 | ||||||
|
|
|
|
|
|||||
| $ | (40.2 | ) | $ | (102.1 | ) | |||
|
|
|
|
|
|||||
| 31. | EXPENSES BY NATURE |
The following employee benefits expenses are included in cost of sales, general and administrative expenses, and exploration expenses.
| Years ended December 31, | ||||||||
| 2014 | 2013 | |||||||
| Salaries, short-term incentives, and other benefits |
$ | 230.8 | $ | 207.3 | ||||
| Share-based compensation |
6.4 | 8.8 | ||||||
| Other |
10.6 | 3.7 | ||||||
|
|
|
|
|
|||||
| $ | 247.8 | $ | 219.8 | |||||
|
|
|
|
|
|||||
| 32. | CASH FLOW ITEMS |
The cash flow statement includes results and balances from discontinued operations.
| (a) | Adjustments for other non-cash items within operating activities |
| Years ended December 31, | ||||||||
| 2014 | 2013 | |||||||
| Share-based compensation |
$ | 8.1 | $ | 10.1 | ||||
| Gains on sale of royalties |
— | (14.1 | ) | |||||
| Write-down (reversal of write-down) of receivables |
(5.3 | ) | 49.3 | |||||
| Write-down of non-current ore stockpiles |
10.4 | 10.6 | ||||||
| Derivative losses |
54.1 | 8.9 | ||||||
| Other |
1.0 | (1.2 | ) | |||||
|
|
|
|
|
|||||
| $ | 68.3 | $ | 63.6 | |||||
|
|
|
|
|
|||||
| (b) | Adjustments for cash items within operating activities |
| Years ended December 31, | ||||||||
| 2014 | 2013 | |||||||
| Disbursements related to asset retirement obligations |
$ | (6.7 | ) | $ | (5.1 | ) | ||
| Settlement of derivatives |
(6.1 | ) | 13.5 | |||||
| Other |
(1.7 | ) | (1.0 | ) | ||||
|
|
|
|
|
|||||
| $ | (14.5 | ) | $ | 7.4 | ||||
|
|
|
|
|
|||||
IAMGOLD CORPORATION
2014 CONSOLIDATED FINANCIAL STATEMENTS
PAGE 85
| (c) | Movements in non-cash working capital items and non-current ore stockpiles |
| Years ended December 31, | ||||||||
| 2014 | 2013 | |||||||
| Receivables and other current assets |
$ | (2.4 | ) | $ | 10.0 | |||
| Inventories and non-current ore stockpiles |
0.3 | (51.0 | ) | |||||
| Accounts payable and accrued liabilities |
(3.0 | ) | (18.3 | ) | ||||
|
|
|
|
|
|||||
| $ | (5.1 | ) | $ | (59.3 | ) | |||
|
|
|
|
|
|||||
| (d) | Other investing activities |
| Years ended December 31, | ||||||||
| 2014 | 2013 | |||||||
| Acquisition of investments |
$ | (1.2 | ) | $ | (6.6 | ) | ||
| Proceeds from sale of investments |
8.5 | 1.0 | ||||||
| Net disposals of other assets |
1.1 | 0.5 | ||||||
|
|
|
|
|
|||||
| $ | 8.4 | $ | (5.1 | ) | ||||
|
|
|
|
|
|||||
| 33. | IMPAIRMENT |
| Years ended December 31, | ||||||||
| 2014 | 2013 | |||||||
| Goodwill |
$ | — | $ | 256.7 | ||||
| Property, plant and equipment |
— | 631.4 | ||||||
|
|
|
|
|
|||||
| $ | — | $ | 888.1 | |||||
|
|
|
|
|
|||||
The Company performs impairment testing for its property, plant and equipment when indications of potential impairment are identified.
At December 31, 2014, the carrying amount of the Company’s net assets exceeded its market capitalization which, together with the annual update to the Company’s LOM plan and mineral reserves and resources, was concluded to be an indication of potential impairment of the carrying amount of the Company’s property, plant and equipment. Accordingly, the Company performed an impairment assessment to determine the recoverable amount of its CGUs. The assessment indicated that the recoverable amounts of the Company’s CGUs exceeded their carrying amounts, with no impairment charge or reversal required to be recorded.
At December 31, 2013, the Company also performed an impairment assessment to determine the recoverable amount of its CGUs due to the annual goodwill impairment test and the decline in short-term and long-term gold price assumptions in the LOM plans which was considered to be an indicator of potential impairment. At December 31, 2014, the Company had no goodwill.
The recoverable amounts of certain CGU’s were determined by calculating the FVLCD, which has been determined to be greater than the value in use. The assumptions used in determining the FVLCD for the CGU’s are LOM plans, long-term commodity prices, discount rates, foreign exchange rates, values of un-modeled mineralization and net asset value (“NAV”) multiples.
The estimates of future cash flows were derived from the most recent LOM plans which range from 10 to 19 years. LOM plans are typically developed annually and are based on management’s current best estimates of optimized mine and processing plans, future operating costs and the assessment of capital expenditures of a mine site.
The Company used an estimated gold price of $1,250 per ounce for 2015 and $1,300 per ounce for 2016 and beyond based on observable market data including spot price and industry analyst consensus. For the 2013 assessment, the Company used a gold price of $1,250 per ounce for 2014 and $1,300 for 2015 and beyond.
The discount rate applied to present value the net future cash flows is based on a real weighted average cost of capital by country to account for geopolitical risk and other CGU specific risks, which have not been included in the cash flows such as project risk. Real discount rates of between 5.00% and 6.50% (December 31, 2013 - between 5.50% and 7.25%) were used to calculate the recoverable amounts of the Company’s CGUs.
Un-modeled mineralization was valued based on recent market transactions at $45 per ounce (December 31, 2013 - $45).
IAMGOLD CORPORATION
2014 CONSOLIDATED FINANCIAL STATEMENTS
PAGE 86
Revenues and costs incurred in currencies other than the U.S. dollar are translated to U.S. dollar equivalents based on long-term forecasts of foreign exchange rates, on a currency by currency basis, obtained from independent sources of economic data. Oil prices are a significant component of cash costs of production and are estimated based on the current price, forward prices, and forecasts of future prices from third party sources. An estimated oil price of $70 per barrel was used (December 31, 2013 - $95 per barrel).
At December 31, 2013, the Company recognized pre-tax impairment charges of $888.1 million. This was allocated to the Company’s CGUs as follows:
| Goodwill | Property, plant and equipment |
|||||||
| Suriname |
$ | 168.4 | $ | 190.5 | ||||
| Essakane |
— | 374.3 | ||||||
| Doyon division1 |
88.3 | 66.6 | ||||||
|
|
|
|
|
|||||
| $ | 256.7 | $ | 631.4 | |||||
|
|
|
|
|
|||||
| 1 | The Doyon division CGU consists of Doyon, Mouska and Westwood mines. |
| 34. | COMMITMENTS |
| (a) | Commitments |
| Years ended December 31, | ||||||||
| 2014 | 2013 | |||||||
| Purchase obligations |
$ | 44.9 | $ | 66.4 | ||||
| Capital expenditure obligations |
7.8 | 32.3 | ||||||
| Finance leases |
38.8 | — | ||||||
| Operating leases |
6.0 | 60.4 | ||||||
|
|
|
|
|
|||||
| $ | 97.5 | $ | 159.1 | |||||
|
|
|
|
|
|||||
Commitments - payments due by period
| Payments due by period | ||||||||||||||||||||
| At December 31, 2014 |
Total | <1 yr | 1-2 yrs | 3-5 yrs | >5 yrs | |||||||||||||||
| Purchase obligations |
$ | 44.9 | $ | 38.9 | $ | 5.2 | $ | 0.8 | $ | — | ||||||||||
| Capital expenditure obligations |
7.8 | 7.8 | — | — | — | |||||||||||||||
| Operating leases |
6.0 | 4.0 | 1.9 | 0.1 | — | |||||||||||||||
|
|
|
|
|
|
|
|
|
|
|
|||||||||||
| $ | 58.7 | $ | 50.7 | $ | 7.1 | $ | 0.9 | $ | — | |||||||||||
|
|
|
|
|
|
|
|
|
|
|
|||||||||||
| (b) | Finance lease commitments |
The gross finance lease liabilities are repayable as follows:
| Years ended December 31, | ||||||||
| 2014 | 2013 | |||||||
| Within one year |
$ | 8.9 | $ | — | ||||
| Between two and five years |
29.6 | — | ||||||
| After five years |
0.3 | — | ||||||
|
|
|
|
|
|||||
| 38.8 | — | |||||||
| Future interest |
(3.9 | ) | — | |||||
|
|
|
|
|
|||||
| Present value of finance lease liabilities |
$ | 34.9 | $ | — | ||||
|
|
|
|
|
|||||
IAMGOLD CORPORATION
2014 CONSOLIDATED FINANCIAL STATEMENTS
PAGE 87
The present values of finance lease liabilities are repayable as follows:
| Years ended December 31, | ||||||||
| 2014 | 2013 | |||||||
| Within one year |
$ | 8.9 | $ | — | ||||
| Between two and five years |
25.7 | — | ||||||
| After five years |
0.3 | — | ||||||
|
|
|
|
|
|||||
| $ | 34.9 | $ | — | |||||
|
|
|
|
|
|||||
| (c) | Royalties included in cost of sales |
Production from certain mining operations is subject to third party royalties (included in the cost of sales) based on various methods of calculation summarized as follows:
| Years ended December 31, | ||||||||
| 2014 | 2013 | |||||||
| Rosebel1 |
$ | 24.8 | $ | 28.0 | ||||
| Essakane2 |
19.7 | 18.2 | ||||||
| Mouska3 |
0.3 | 1.9 | ||||||
|
|
|
|
|
|||||
| $ | 44.8 | $ | 48.1 | |||||
|
|
|
|
|
|||||
| 1 | 2% in-kind royalty per ounce of gold production and price participation of 6.5% on the amount exceeding a market price of $425 per ounce when applicable, using for each calendar quarter the average market price determined by the London Gold Fix P.M. In addition, 0.25% of all minerals produced at Rosebel are payable to a charitable foundation for the purpose of promoting local development of natural resources within Suriname. |
| 2 | Royalty based on a percentage of gold sold applied to the gold market price the day before shipment; the royalty percentage varies according to the gold market price: 3% if the gold market price is lower or equal to $1,000 per ounce, 4% if the gold market price is between $1,000 and $1,300 per ounce, or 5% if the gold market price is above $1,300 per ounce. |
| 3 | Two royalties of 0.2% and 2.0% of gold production. |
| 35. | RELATED PARTY TRANSACTIONS |
The Company had the following related party transactions included in receivables and other current assets in the consolidated balance sheets.
| • | The Company has a non-interest bearing loan receivable from Sadiola for certain services rendered. As at December 31, 2014, the outstanding loan balance was $0.1 million (December 31, 2013 - $0.2 million). For the year ended December 31, 2014, the Company advanced $1.1 million and received a repayment of $1.2 million. |
| • | During the year ended December 31, 2014, the Company made a non-interest bearing loan to Yatela of $0.4 million for certain services rendered and received repayments totaling $0.3 million. As at December 31, 2014, the loan receivable from Yatela was $0.1 million. |
| • | On September 4, 2014, Galane Gold Ltd. paid the Company $2.7 million, which represents the outstanding loan of $2.5 million along with accrued interest to date of $0.2 million. |
The Company had the following significant related party transactions included in other non-current assets in the consolidated balance sheets.
| • | The Company loaned $20.0 million to its joint venture Sadiola in 2012 for operating expenses. During the year ended December 31, 2014, Sadiola repaid $20.8 million (December 31, 2013 - nil), representing the outstanding balance including accrued interest. |
| • | During the year ended December 31, 2014, the Company made advances of $8.6 million to Sadiola related to previous purchase commitments for the sulphide project (December 2013 - $nil). These advances are part of a loan agreement, which bears interest at LIBOR plus 2% and is to be repaid on the earlier of December 31, 2016 and, at such time as Sadiola has sufficient free cash flow to do so. As at December 31, 2014, the carrying amount was $26.3 million (December 31, 2013 - $17.7 million), including accrued interest income. |
IAMGOLD CORPORATION
2014 CONSOLIDATED FINANCIAL STATEMENTS
PAGE 88
| (a) | Compensation of key management personnel |
Compensation breakdown for key management personnel, comprising of the Company’s directors and executive officers, is as follows:
| Years ended December 31, | ||||||||
| 2014 | 2013 | |||||||
| Salaries and other benefits1 |
$ | 7.7 | $ | 7.6 | ||||
| Termination benefits |
3.6 | — | ||||||
| Share-based payments |
4.0 | 5.0 | ||||||
|
|
|
|
|
|||||
| $ | 15.3 | $ | 12.6 | |||||
|
|
|
|
|
|||||
| 1 | Salaries and other benefits include amounts paid to directors. |
| 36. | SEGMENTED INFORMATION |
The Company’s gold mine segment is divided into the following geographic segments:
| • | Suriname - Rosebel mine |
| • | Burkina Faso - Essakane mine |
| • | Canada - Doyon division includes the Mouska mine and the Westwood mine |
| • | Joint ventures (Mali) - Sadiola mine (41%) and Yatela mine (40%). |
The Company’s non-gold segments are divided into the following:
| • | Discontinued operations (Niobium) - the Niobec mine located in Canada |
| • | Exploration and evaluation |
| • | Corporate - includes royalty interests located in Canada and investments in associates and joint ventures. |
| December 31, 2014 | December 31, 2013 | |||||||||||||||||||||||
| Total non- current assets |
Total assets |
Total liabilities |
Total non- current assets |
Total assets |
Total liabilities |
|||||||||||||||||||
| Gold mines |
||||||||||||||||||||||||
| Suriname |
$ | 580.0 | $ | 740.9 | $ | 261.3 | $ | 518.2 | $ | 637.3 | $ | 193.7 | ||||||||||||
| Burkina Faso |
897.3 | 1,093.3 | 136.5 | 835.1 | 1,043.1 | 117.8 | ||||||||||||||||||
| Canada |
818.7 | 849.5 | 175.4 | 729.8 | 748.6 | 139.1 | ||||||||||||||||||
|
|
|
|
|
|
|
|
|
|
|
|
|
|||||||||||||
| Total gold mines |
2,296.0 | 2,683.7 | 573.2 | 2,083.1 | 2,429.0 | 450.6 | ||||||||||||||||||
| Discontinued operations (Niobium) |
— | 628.5 | 167.0 | 530.3 | 600.0 | 183.4 | ||||||||||||||||||
| Exploration and evaluation |
554.2 | 569.9 | 8.5 | 543.4 | 555.5 | 9.2 | ||||||||||||||||||
| Corporate1 |
187.9 | 340.7 | 810.5 | 297.0 | 605.9 | 674.7 | ||||||||||||||||||
|
|
|
|
|
|
|
|
|
|
|
|
|
|||||||||||||
| Total per consolidated financial statements |
$ | 3,038.1 | $ | 4,222.8 | $ | 1,559.2 | $ | 3,453.8 | $ | 4,190.4 | $ | 1,317.9 | ||||||||||||
|
|
|
|
|
|
|
|
|
|
|
|
|
|||||||||||||
| Joint ventures (Mali)2 |
$ | 100.6 | $ | 155.8 | $ | 135.1 | $ | 122.9 | $ | 189.1 | $ | 142.6 | ||||||||||||
|
|
|
|
|
|
|
|
|
|
|
|
|
|||||||||||||
| 1 | The carrying amount of the joint ventures is included in the corporate segment as non-current assets. |
| 2 | The breakdown of the financial information for the joint ventures has been disclosed above as it is reviewed regularly by the Company’s chief operating decision maker to assess performance of the joint ventures and to make resource allocation decisions. |
IAMGOLD CORPORATION
2014 CONSOLIDATED FINANCIAL STATEMENTS
PAGE 89
Year ended December 31, 2014
| Consolidated statement of earnings information | ||||||||||||||||||||||||||||||||||||
| Revenues | Cost of sales1 |
Depreciation expense |
General and administrative |
Exploration | Impairments | Other | Earnings (losses) from operations |
Net capital expenditures2 |
||||||||||||||||||||||||||||
| Gold mines |
||||||||||||||||||||||||||||||||||||
| Suriname |
$ | 438.7 | $ | 300.6 | $ | 71.1 | $ | — | $ | 5.4 | $ | — | $ | 3.4 | $ | 58.2 | $ | 80.3 | ||||||||||||||||||
| Burkina Faso |
457.8 | 325.5 | 100.6 | — | — | — | 5.3 | 26.4 | 98.0 | |||||||||||||||||||||||||||
| Canada |
102.9 | 59.8 | 27.5 | (0.4 | ) | — | — | 49.0 | (33.0 | ) | 108.5 | |||||||||||||||||||||||||
|
|
|
|
|
|
|
|
|
|
|
|
|
|
|
|
|
|
|
|||||||||||||||||||
| Total gold mines excluding joint ventures |
999.4 | 685.9 | 199.2 | (0.4 | ) | 5.4 | — | 57.7 | 51.6 | 286.8 | ||||||||||||||||||||||||||
| Exploration and evaluation3 |
— | — | 0.2 | 0.8 | 37.0 | — | 2.5 | (40.5 | ) | 10.9 | ||||||||||||||||||||||||||
| Corporate4 |
8.5 | 2.0 | 5.6 | 44.4 | 0.3 | — | 9.9 | (53.7 | ) | 5.2 | ||||||||||||||||||||||||||
|
|
|
|
|
|
|
|
|
|
|
|
|
|
|
|
|
|
|
|||||||||||||||||||
| Total per consolidated financial statements |
1,007.9 | 687.9 | 205.0 | 44.8 | 42.7 | — | 70.1 | (42.6 | ) | 302.9 | ||||||||||||||||||||||||||
| Joint ventures (Mali)5 |
121.2 | 117.2 | 28.9 | — | 0.6 | — | — | (25.5 | ) | 10.9 | ||||||||||||||||||||||||||
| Discontinued operations (Niobium) |
233.8 | 118.7 | 22.1 | 1.7 | — | — | 0.3 | 91.0 | 42.3 | |||||||||||||||||||||||||||
|
|
|
|
|
|
|
|
|
|
|
|
|
|
|
|
|
|
|
|||||||||||||||||||
| $ | 1,362.9 | $ | 923.8 | $ | 256.0 | $ | 46.5 | $ | 43.3 | $ | — | $ | 70.4 | $ | 22.9 | $ | 356.1 | |||||||||||||||||||
|
|
|
|
|
|
|
|
|
|
|
|
|
|
|
|
|
|
|
|||||||||||||||||||
Year ended December 31, 2013
| Consolidated statement of earnings information | Net capital expenditures2 |
|||||||||||||||||||||||||||||||||||
| Revenues | Cost of sales1 |
Depreciation expense |
General and administrative |
Exploration | Impairments | Other | Earnings (losses) from operations |
|||||||||||||||||||||||||||||
| Gold mines |
||||||||||||||||||||||||||||||||||||
| Suriname |
$ | 479.5 | $ | 247.2 | $ | 56.3 | $ | — | $ | 5.6 | $ | 315.5 | $ | 1.4 | $ | (146.5 | ) | $ | 133.6 | |||||||||||||||||
| Burkina Faso |
379.9 | 221.5 | 76.6 | — | 0.4 | 374.3 | — | (292.9 | ) | 296.6 | ||||||||||||||||||||||||||
| Canada |
79.3 | 51.1 | 3.2 | — | — | 154.9 | (6.9 | ) | (123.0 | ) | 126.0 | |||||||||||||||||||||||||
|
|
|
|
|
|
|
|
|
|
|
|
|
|
|
|
|
|
|
|||||||||||||||||||
| Total gold mines excluding joint ventures |
938.7 | 519.8 | 136.1 | — | 6.0 | 844.7 | (5.5 | ) | (562.4 | ) | 556.2 | |||||||||||||||||||||||||
| Exploration and evaluation3 |
— | — | 1.0 | 1.2 | 63.2 | — | 7.3 | (72.7 | ) | 0.3 | ||||||||||||||||||||||||||
| Corporate4 |
8.8 | 4.9 | 6.7 | 47.2 | — | 43.4 | (0.2 | ) | (93.2 | ) | 4.6 | |||||||||||||||||||||||||
|
|
|
|
|
|
|
|
|
|
|
|
|
|
|
|
|
|
|
|||||||||||||||||||
| Total per consolidated financial statements |
947.5 | 524.7 | 143.8 | 48.4 | 69.2 | 888.1 | 1.6 | (728.3 | ) | 561.1 | ||||||||||||||||||||||||||
| Joint ventures (Mali)5 |
160.7 | 139.9 | 12.0 | — | 1.9 | — | 63.8 | (56.9 | ) | 51.2 | ||||||||||||||||||||||||||
| Discontinued operations (Niobium) |
199.6 | 110.6 | 27.9 | 2.5 | — | — | 0.5 | 58.1 | 75.8 | |||||||||||||||||||||||||||
|
|
|
|
|
|
|
|
|
|
|
|
|
|
|
|
|
|
|
|||||||||||||||||||
| $ | 1,307.8 | $ | 775.2 | $ | 183.7 | $ | 50.9 | $ | 71.1 | $ | 888.1 | $ | 65.9 | $ | (727.1 | ) | $ | 688.1 | ||||||||||||||||||
|
|
|
|
|
|
|
|
|
|
|
|
|
|
|
|
|
|
|
|||||||||||||||||||
| 1 | Excludes depreciation expense. |
| 2 | Includes cash expenditures for property, plant and equipment, capitalized borrowing costs, exploration and evaluation assets, and is net of proceeds from finance leases. |
| 3 | Closed site costs on exploration and evaluation properties included in other operating costs. |
| 4 | Includes earnings from royalty interests. |
| 5 | Net earnings (losses) from joint ventures are included in a separate line in the consolidated statements of earnings. The breakdown of the financial information has been disclosed above as it is reviewed regularly by the Company’s chief operating decision maker to assess its performance and to make resource allocation decisions. |
IAMGOLD CORPORATION
2014 CONSOLIDATED FINANCIAL STATEMENTS
PAGE 90

IAMGOLD Corporation
401 Bay Street, Suite 3200, P.O. Box 153
Toronto, Ontario, Canada M5H 2Y4
Toll Free: 1 888 IMG 9999
www.iamgold.com
Serious News for Serious Traders! Try StreetInsider.com Premium Free!
You May Also Be Interested In
- IAMGOLD (IAG) PT Raised to $3.75 at Scotiabank
- Epique Realty Sets New Industry Standard with Epique PowerCON 2024 Event FREE For Epique Agents
- ROSEN, A LEADING LAW FIRM, Encourages Waldencast plc Investors to Inquire About Securities Class Action Investigation – WALD, WALDW
Create E-mail Alert Related Categories
SEC FilingsSign up for StreetInsider Free!
Receive full access to all new and archived articles, unlimited portfolio tracking, e-mail alerts, custom newswires and RSS feeds - and more!
