

Form 8-K W&T OFFSHORE INC For: Mar 25
 Tweet
Tweet Share
Share
UNITED STATES
SECURITIES AND EXCHANGE COMMISSION
Washington, D.C. 20549
FORM 8-K
CURRENT REPORT
PURSUANT TO SECTION 13 OR 15(D) OF THE
SECURITIES EXCHANGE ACT OF 1934
Date of Report (Date of earliest event reported) March 25, 2015
W&T Offshore, Inc.
(Exact name of registrant as specified in its charter)
1-32414
(Commission File Number)
| Texas | 72-1121985 | |
| (State or Other Jurisdiction of Incorporation) | (I.R.S. Employer Identification No.) |
Nine Greenway Plaza, Suite 300
Houston, Texas 77046
(Address of Principal Executive Offices)
713.626.8525
(Registrant's Telephone Number, Including Area Code)
N/A
(Former Name or Former Address, if Changed Since Last Report)
Check the appropriate box below if the Form 8-K filing is intended to simultaneously satisfy the filing obligation of the registrant under any of the following provisions (see General Instruction A.2. below):
| ¨ | Written communications pursuant to Rule 425 under the Securities Act (17 CFR 230.425) |
| ¨ | Soliciting material pursuant to Rule 14a-12 under the exchange Act (17 CFR 240.14a-12) |
| ¨ | Pre-commencement communications pursuant to Rule 14d-2(b) under the Exchange Act (17 CFR 240.14d-2(b)) |
| ¨ | Pre-commencement communications pursuant to Rule 13e-4(c) under the Exchange Act (17 CFR 240.13e-4(c)) |
| Item 7.01 | Regulation FD Disclosure |
On March 25, 2015, W&T Offshore, Inc. (the “Company”) posted an investor presentation about the Company on its website at www.wtoffshore.com. Information on the Company’s website or any other website is not incorporated by reference in this Current Report on Form 8-K and does not constitute a part of this Current Report on Form 8-K. The investor background materials are attached hereto as Exhibit 99.1 and are incorporated herein by reference.
In accordance with General Instruction B.2 of Form 8-K, the foregoing information, including Exhibit 99.1, shall not be deemed “filed” for the purposes of Section 18 of the Securities Exchange Act of 1934 or otherwise subject to the liabilities of that section, nor shall such information and Exhibit 99.1 be deemed incorporated by reference in any filing under the Securities Act of 1933 or the Exchange Act, except as shall be expressly set forth by specific reference in such a filing.
| Item 9.01 | Financial Statements and Exhibits. |
(d) Exhibits
| 99.1 | Investor Presentation dated March 25, 2015. |
SIGNATURES
Pursuant to the requirements of the Securities Exchange Act of 1934, the Registrant has duly caused this report to be signed on its behalf by the undersigned hereunto duly authorized.
| W&T OFFSHORE, INC. | ||
| (Registrant) | ||
| Dated: March 25, 2015 | By: | /s/ John D. Gibbons |
| John D. Gibbons | ||
| Senior Vice President and Chief Financial Officer | ||
Exhibit 99.1

March 25, 2015, New Orleans, LA Scotia Howard Weil Energy Conference
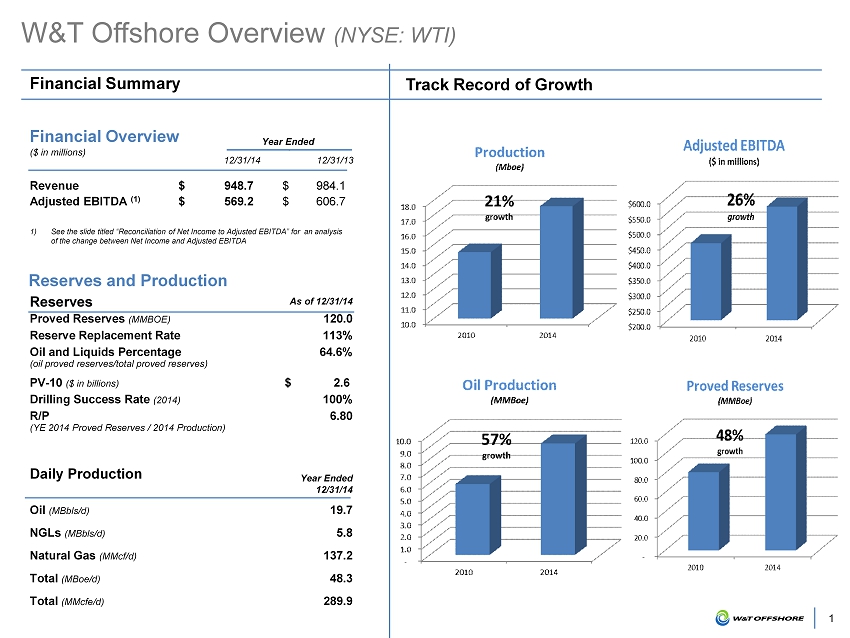
1 W&T Offshore Overview (NYSE: WTI) Financial Summary 1) See the slide titled “Reconciliation of Net Income to Adjusted EBITDA” for an analysis of the change between Net Income and Adjusted EBITDA Track Record of Growth Revenue $ 948.7 $ 984.1 Adjusted EBITDA (1) $ 569.2 $ 606.7 Financial Overview ($ in millions) 12/31/14 12/31/13 Reserves As of 12/31/14 Proved Reserves (MMBOE) 120.0 Reserve Replacement Rate 113% Oil and Liquids Percentage (oil proved reserves/total proved reserves) 64.6% PV - 10 ($ in billions) $ 2.6 Drilling Success Rate (2014) 100% R/P (YE 2014 Proved Reserves / 2014 Production) 6.80 Reserves and Production Daily Production Year Ended 12/31/14 Oil (MBbls/d) 19.7 NGLs (MBbls/d) 5.8 Natural Gas (MMcf/d) 137.2 Total (MBoe/d) 48.3 Total (MMcfe/d) 289.9 Year Ended

2 Premium Assets in Three Prolific Basins Permian Basin • ~ 40,900 gross acres (~31,700 net acres) • ~ 7 % of Daily Production • 1P reserves – 37.3 MMBoe • 2P reserves of 61.8 MMBoe • Over 90% of acreage is HBP from vertical program with horizontal program expanding to test multiple benches Gulf of Mexico Shelf • ~ 585,000 gross acres (~409,000 net acres) • ~ 54% of d aily production • 1P reserves – 53 .8 MMBoe • 2P reserves of 73.9 MMBoe • Future growth potential from sub - salt prospects identified with WAZ Seismic Deepwater Gulf of Mexico • ~ 539,000 gross acres (~289,000 net acres) • ~ 39% of daily production • 1P reserves of 28.9 MMBoe • 2P reserves of 5 0.9 MMBoe • Substantial upside from planned projects (Big Bend, Dantzler, Medusa, EW 910 and others) Notes: Reserves are as of 12/31/2014.
3 High Impact Projects Drive Long Term Growth Deepwater success will add significant value over next several years • Recent large discoveries yield multi - year reserve additions • Provides increased visibility of future growth • Current deepwater projects provide potential for production additions as soon as the first half of 2015. Recent success on GOM Shelf is creating further opportunities • Mahogany average daily net sales are up ~323% since 2011 and the field size continues to grow • Drilling success and advanced seismic data improves understanding of sub - salt targets on the shelf Expanded 2014 horizontal drilling program in the Permian Basin targeted the Wolfcamp “B” and Lower Spraberry Shale • Continued success in multiple benches will grow both the inventory of drilling locations and increase the overall value of the field. At the end of January 2015, we have 10 wells awaiting completion, of which six are horizontal and four are vertical. We are continuing to evaluate results to - date of our program and market conditions before resuming drilling activities

4 Incremental Cash Flow Associated with Probable and Possible Reserves (1) Probables and Possibles provide hidden value and significant upside (1) Figures reflect year - end 2014 SEC price case. (2) Probable and possible reserves with no direct CAPEX requirements that are largely associated with PNP and PUD reserves and therefore have associated future indirect CAPEX requirements. (3) Probable and possible cases that are largely associated with producing wellbores and require no additional future CAPEX requirements. Incremental Value Increases with CAPEX $774 Million PV - 10 Created with No Future CAPEX $1.2 Billion PV - 10 Created with Primarily PNP / PUD CAPEX $3.0 Billion Total $0 $0 $9 $13 $588 $957 Cumulative CAPEX

5 Proved Reserve Bookings Example
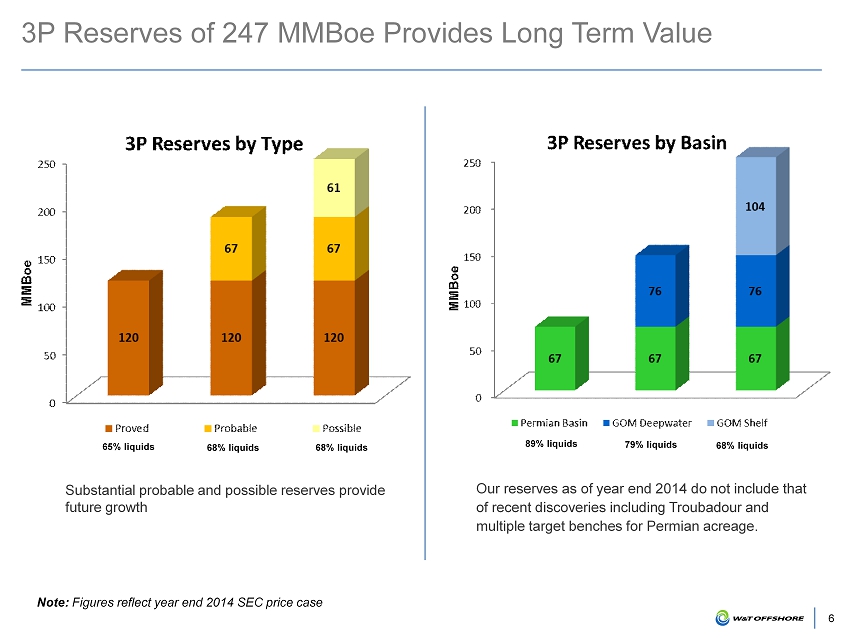
6 3P Reserves of 247 MMBoe Provides Long Term Value Substantial probable and possible reserves provide future growth Note: Figures reflect year end 2014 SEC price case Our reserves as of year end 2014 do not include that of recent discoveries including Troubadour and multiple target benches for Permian acreage. 65% liquids 68% liquids 68% liquids 89% liquids 79% liquids 68% liquids
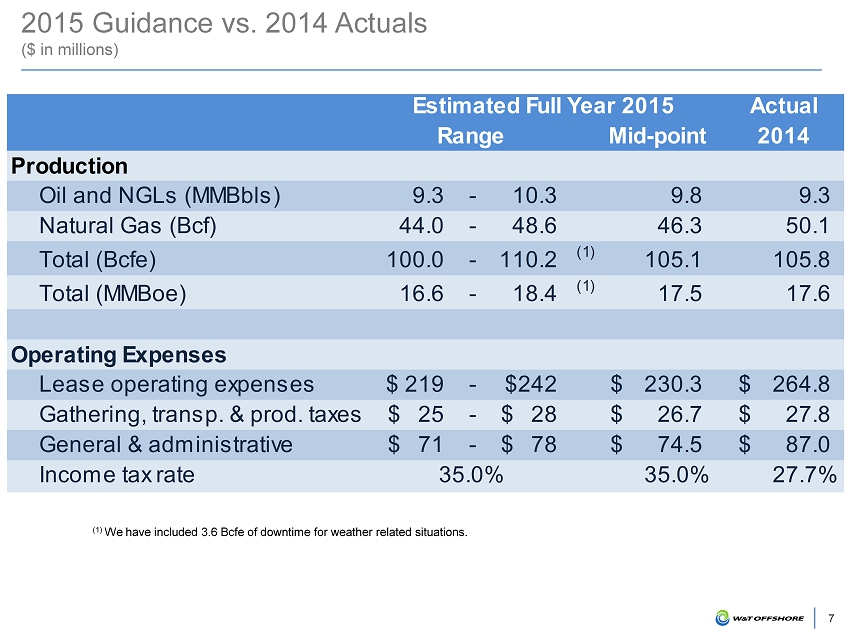
7 2015 Guidance vs. 2014 Actuals ($ in millions) (1) We have included 3.6 Bcfe of downtime for weather related situations. Actual Mid-point 2014 Production Oil and NGLs (MMBbls) 9.3 - 10.3 9.8 9.3 Natural Gas (Bcf) 44.0 - 48.6 46.3 50.1 Total (Bcfe) 100.0 - 110.2 (1) 105.1 105.8 Total (MMBoe) 16.6 - 18.4 (1) 17.5 17.6 Operating Expenses Lease operating expenses 219$ - 242$ 230.3$ 264.8$ Gathering, transp. & prod. taxes 25$ - 28$ 26.7$ 27.8$ General & administrative 71$ - 78$ 74.5$ 87.0$ Income tax rate 35.0% 27.7%35.0% Estimated Full Year 2015 Range

8 2015 Reduction Efforts ($ in millions) • The Company expects significant reductions in 2015 spending. Currently we see: • Capital Expenditures down by ~ 69% • Lease Operating Expenses down by ~ 15% • General & Administrative Expenses down by ~ 17% • Further reductions to LOE & G&A are likely Reduction Efforts

2015 Capital Budget Focused on GOM Deepwater GOM Deepwater: 84.5% $169.0 million GOM Shelf : 7.8% $ 15.5 million Onshore: 7.5 % $14.9 million Seismic, Leasehold & Other: 0.3% $.6 million 2015 Budget of ~$200 Million • Budget is designed for flexibility to respond to market conditions and fund key projects • Deepwater GOM development at Big Bend and Dantzler. Budget includes ~$100MM for the Rio Grande Loop system and Dantzler completion costs • Two - well exploration program at Deepwater Medusa includes ~$35MM to drill and complete the MC 538 SS7 and to complete the MC 538 SS6 • Two - well operated exploration program at Deepwater EW 910 for ~$31MM. Drilling and completion of ST 320 A - 5 ST and EW 954 A - 8 9 Current year budget conserves capital while focusing on high - impact projects.

DEEPWATER Gulf of Mexico

11 Deepwater Acquisitions Drive Growth 2010 2010 2013 2012 Newfield $206 million • 78 lease blocks • 65 deepwater blocks • 1P – 4.7 MMBoe • 2P – 6.9 MMBoe • 3P – 9.3 MMBoe Callon $82 million • Medusa (prod. is 88% oil) • 1P – 2.1 MMBoe • 2P – 4.3 MMBoe • 3P – 6.5 MMBoe • Currently completing the first of two exploratory wells Shell Deepwater $116 million • Tahoe • Droshky • 1P – 6.1 MMBoe • 3 P – 12.1 MMBoe • Paid out in November 2012 Total $115 million • Matterhorn • Virgo • 1P – 8.6 MMBoe • 2P – 15.3 MMBoe • 3P – 24.3 MMBoe • Paid out in August 2011 2014 Woodside $51 million • Neptune (prod. is 87% oil) • 27 deepwater blocks • 1P – 1.3 MMBoe • 2P – 2.9 MMBoe • Initial exploratory well placed into production in 2014 4 th Qtr Through acquisitions and lease sales, W&T now holds interests in ~ 539,000 gross / 289,000 net acres in the deepwater of the Gulf of Mexico, approximately 41% of total net offshore acres

Significant Growth in the Deepwater GOM Between 2009 and 2014, average deepwater production has grown nearly 700% and proved reserves (1) are up 800%. Gross Acres have increased 348 % from 2009 to now. (1) P roved reserves at year - end 2014 do not include unbooked potential reserves associated with the successful exploration well at MC 699 ‘ Troubadour’. Deepwater Acreage Deepwater Net Reserves Deepwater Net Daily Production
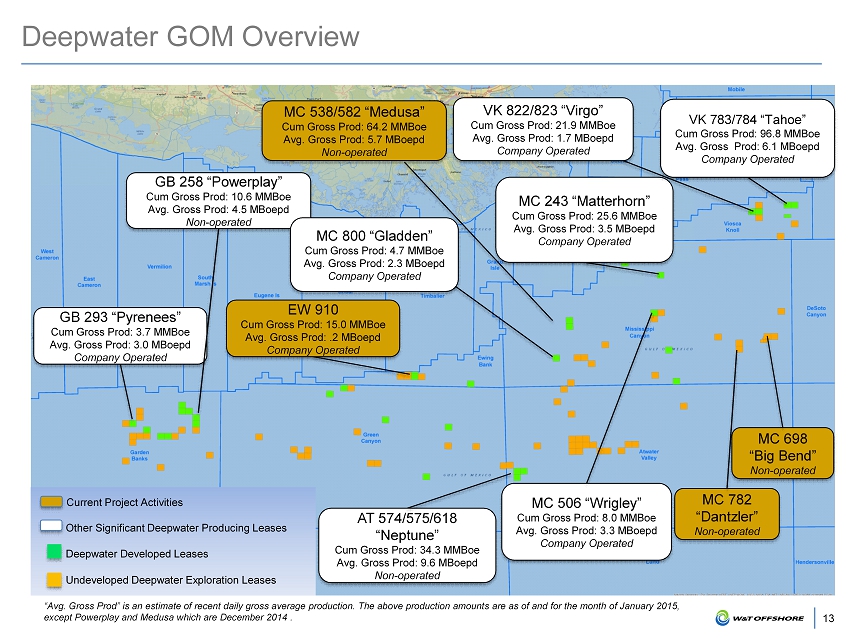
Deepwater GOM Overview 13 Current Project Activities Other Significant Deepwater Producing Leases Deepwater Developed Leases Undeveloped Deepwater Exploration Leases “Avg. Gross Prod” is an estimate of recent daily gross average production. T he above production amounts are as of and for the month of January 2015, except P owerplay and Medusa which are December 2014 . MC 538/582 “Medusa” Cum Gross Prod: 64.2 MMBoe Avg. Gross Prod: 5.7 MBoepd Non - operated MC 243 “Matterhorn” Cum Gross Prod: 25.6 MMBoe Avg. Gross Prod: 3.5 MBoepd Company Operated GB 293 “Pyrenees” Cum Gross Prod: 3.7 MMBoe Avg. Gross Prod: 3.0 MBoepd Company Operated VK 783/784 “Tahoe” Cum Gross Prod: 96.8 MMBoe Avg. Gross Prod: 6.1 MBoepd Company Operated GB 258 “Powerplay” Cum Gross Prod: 10.6 MMBoe Avg. Gross Prod: 4.5 MBoepd Non - operated VK 822/823 “Virgo” Cum Gross Prod: 21.9 MMBoe Avg. Gross Prod: 1 .7 MBoepd Company Operated MC 800 “Gladden” Cum Gross Prod : 4.7 MMBoe Avg. Gross Prod: 2.3 MBoepd Company Operated EW 910 Cum Gross Prod: 15.0 MMBoe Avg. Gross Prod: .2 MBoepd Company Operated MC 782 “Dantzler” Non - operated MC 698 “Big Bend” Non - operated MC 506 “Wrigley” Cum Gross Prod: 8.0 MMBoe Avg. Gross Prod: 3 .3 MBoepd Company Operated AT 574/575/618 “Neptune ” Cum Gross Prod: 34.3 MMBoe Avg. Gross Prod: 9.6 MBoepd Non - operated

14 Deepwater Success – MC 698 “Big Bend” MC 698 Big Bend (WI: 20%; NRI: 16.70%) • Located about 165 miles SSE of New Orleans, LA • Gross resource estimate of 30 to 65 MMBoe with potential additional 30 – 50 MMBoe (P75 – P25) (1) • Targeting first production in late 2015 • S ub - sea development with tie - back to Thunderhawk Platform MC 698 “Big Bend” oil discovery (1) Represents operator’s published gross production and reserve assumptions.

15 Deepwater Success – MC 782 “Dantzler” Dantzler #1 and Dantzler #2 o il discoveries MC 782 “Dantzler” (WI: 20%; NRI: 16.25 %) • Located about 160 miles SSE of New Orleans, LA • Two oil discovery wells o The Dantzler #2 appraisal well encountered 122 net feet of crude oil pay in two high - quality Miocene reservoirs. Finished completion operations of the Dantzler #2 in mid - January and the Dantzler #1 in early March. • Gross resource estimate of 65 to 100 MMBoe (P75 – P25 case) ( 1) • T ie - back with Big Bend to nearby “Thunder Hawk” host facility (1) Represents operator’s published gross production and reserve assumptions.

16 Deepwater Success – Rio Grande Loop System Dantzler #1 & #2 Big Bend • Subsea development tie - back from Big Bend and Dantzler wells • Connects to Thunder Hawk platform • Loop system is at ~ 7,000’ water d epth • Work is ongoing and we estimate first production: • Big Bend in late 2015 • D antzler #1 & #2 wells should follow in early 2016 Thunder Hawk Platform Rio Grande Loop System

17 Exploration Opportunities at MC 538 “Medusa” Medusa (MC 538/582) acquired via the Callon Transaction in 2013 ( WI: 15%; NRI: 15%*) – August average daily production of roughly 760 Boepd net to W&T (~86% oil) – Medusa spar is also the host facility for the W&T owned “Gladden” production at MC 800 Expansion activity underway at Medusa – Currently completing the first of two exploratory wells ▪ The SS 6 well reached TD at year - end encountering net pay in both primary zones. The well logged over 180’ of net pay. The SS 7 well was drilled to TD in early March and encountered over 100’ of net pay ▪ Completion operations of the Medusa SS 7 are expected to commence immediately after completing the SS 6 ▪ We expect these exploratory wells to move probable reserves into the proved category and have first production in mid - 2015 – A dditional wells are currently under evaluation * This provides for royalty suspension

18 Neptune Field Neptune Field (WI: 20.0%, NRI: 17.5% ) • Atwater Valley 574, 575 and 618 • January estimated gross average daily production rate of 9,618 Boe (1,683 Boe net to W&T’s interest) (~88% oil) • W ater depth of 6,200’; TLP is situated on Block 574 where the water depth is about 5,500’ • Additional exploration and development could substantially increase field size Completed AT 574 SB 03 • Successfully drilled to a depth of 20,650 feet and found over 300 feet of net pay • Well commenced production in December 2014 and is producing at a gross rate of ~1,200 Boe per day.
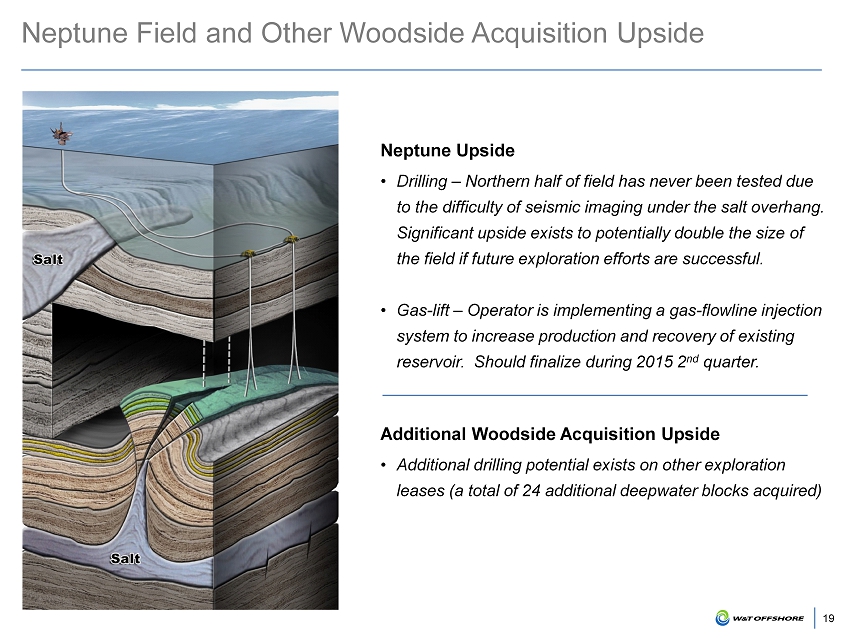
19 Neptune Field and Other Woodside Acquisition Upside Neptune Upside • Drilling – Northern half of field has never been tested due to the difficulty of seismic imaging under the salt overhang. Significant upside exists to potentially double the size of the field if future exploration efforts are successful. • Gas - lift – Operator is implementing a gas - flowline injection system to increase production and recovery of existing reservoir. Should finalize during 2015 2 nd quarter. Additional Woodside Acquisition Upside • Additional drilling potential exists on other exploration leases (a total of 24 additional deepwater blocks acquired)

20 Multi Well Potential at Ewing Bank 910 Current Drilling Plans • Initial two well drilling program in a 50% / 50% joint venture, with potential for third well thereafter, in 2015 (1) Net mean success rate. • T he first well (A - 5 ST) is currently drilling • First production expected in Second Quarter of 2015 for A - 5 ST and 2015 2 nd half for A - 8 Additional Upside with Improved Seismic • A dditional wells in inventory • Prospective 35 - 70 MMBoe (net) • A dditional drilling locations could be determined as a result of our ongoing G&G review EW 910 Field • Water depth of 560 feet • Cumulative field production of ~15 MMBoe (79% oil ) as of January 2015
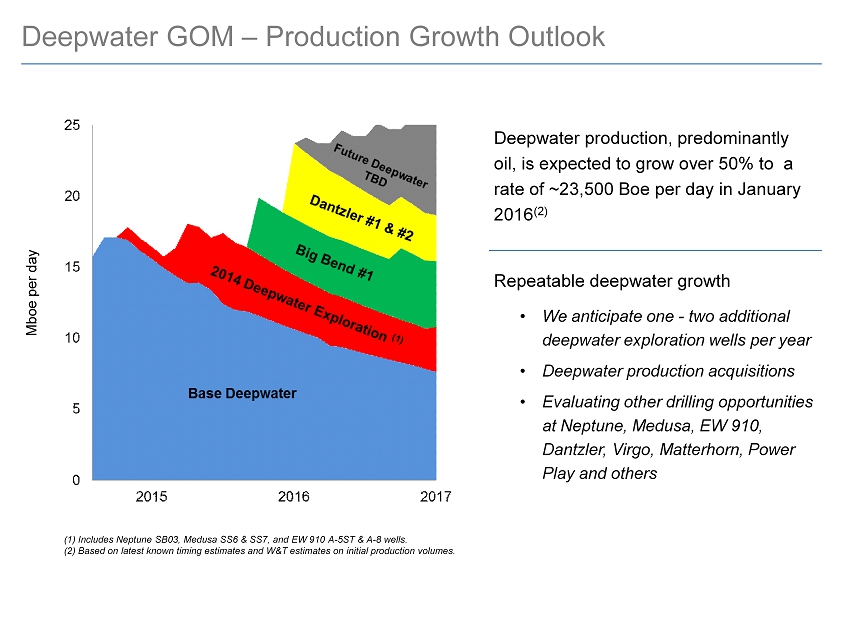
Deepwater production, predominantly oil, is expected to grow over 50% to a rate of ~23,500 Boe per day in January 2016 (2) R epeatable deepwater growth • We anticipate one - two additional deepwater exploration wells per year • D eepwater production acquisitions • Evaluating other drilling opportunities at Neptune, Medusa, EW 910, Dantzler, Virgo, Matterhorn, Power Play and others Deepwater GOM – Production Growth Outlook (1 ) Includes Neptune SB03, Medusa SS6 & SS7 , and EW 910 A - 5ST & A - 8 wells. (2) Based on latest known timing estimates and W&T estimates on initial production volumes. Mboe per day

SHELF Gulf of Mexico

Well Positioned on the Shelf 23 “ Avg. Gross Prod” is an estimate of recent daily gross average production . P roduction amounts are as and for the month of January 2015, except SS 222 which is Dec ember 2014. EC 321 Cum Gross Prod: 105.3 MMBoe Avg. Gross Prod: 1.3 MBoepd Company Operated HI 111 Cum Gross Prod: 80.3 MMBoe Avg. Gross Prod: 1.4 MBoepd Company Operated MP 98 & MP 108 Cum Gross Prod: 51.5 MMBoe Avg. Gross Prod: 3.0 MBoepd Company Operated MP 283 Cum Gross Prod: 13.9 MMBoe Avg. Gross Prod: 1.5 MBoepd Company Operated SS 208 Cum Gross Prod: 454.3 MMBoe Avg. Gross Prod: 5.9 MBoepd Company Operated SS 222 Cum Prod: 213.1 MMBoe Avg. Gross Prod: 1.0 MBoepd Non - operated SS 349/359 “Mahogany” Cum Gross Prod: 38.0 MMBoe Avg. Gross Prod: 10.6 MBoepd Company Operated ST 314 Cum Gross Prod: 21.9 MMBoe Avg. Gross Prod: 1.1 MBoepd Company Operated Fairway Field & Yellowhammer Plant Acquired remaining 35.7% WI for ~ $18.2MM in Sept. 2014 Significant Shelf Producing Leases Shelf Developed Leases Undeveloped Shelf Exploration Leases

24 2015 Seismic Data Reviews Driving Long Term GOM Shelf Offshore Program Seismic data reviews plus recent drilling success on GOM Shelf, especially at our Mahogany Field, are creating further opportunities • Eight wells have been drilled and completed by us at Mahogany since 2011. These wells, recompletions and selective remedial work have increased Mahogany average daily net sales by ~323% since 2011. During the near term, we are reviewing seismic and production data covering this area • Field growth from additional new wells will resume after we have completed our seismic data review and incorporated our improved understanding of sub - salt targets By applying the lessons of success from Mahogany and seismic data reviews on other targeted lease blocks, we anticipate Mahogany - like opportunities elsewhere on the Shelf as well as in the Deepwater • Mahogany has become an outstanding success that we are modeling i n other areas using the same technique • Substantially all of our reviews are on acreage that we hold by production or primary term

25 GOM Shelf – Exploration at Ship Shoal 349 in 2014 SS 349 A - 16 Development Well currently Producing at ~ 2,690 Boepd gross (2,240 Boepd net) (January 2015 Production) SS 349 A - 15 Multi - Sand Target Completed in 4/14; Logged ~ 65’ pay Producing ~ 908 Boepd gross (January 2015 Production) SS 349 A - 18 Exploration well targets new P - sand lobe and T - sand. Temporarily suspended SS 349 A - 6 Recomplete Up - hole to the N - sand 2014 Activity at SS 349 SS 349 “Mahogany” Continued Sub - Salt Exploration & Development Success ( WI: 100%, NRI: 83.3%) • Mahogany production ~ 76% oil • Multi - horizon production ‒ Primary Field Pay is P - Sand ‒ T - Sand 2013 discovery 3,000’ deeper from P - Sand extends the “known depth” of the oil column ‒ Multiple new producing horizons recently discovered • Average production rate for : ‒ January 2015 for the field ~8,900 Boepd net (~10,600 gross). • Reviewing seismic and production data to potentially create additional drilling locations, and / or to identify deeper targets

26 Mahogany’s Prolific “P” & “T” Sand • Mahogany's primary field pay “P” Sand has cumulatively produced approximately 30 million Boe since 1997 from multiple wells • “T” Sand is 3,000 feet deeper and better quality than “P” Sand • Upside potential up - dip from incremental probable reserves for the “T” Sand • Seismic and reservoir data may identify additional productive sands or expand potential size of T - Sand SS 349 A - 14 “T” Sand Log SS 349 A - 14 “P” Sand Log P1 P2 P3 P4
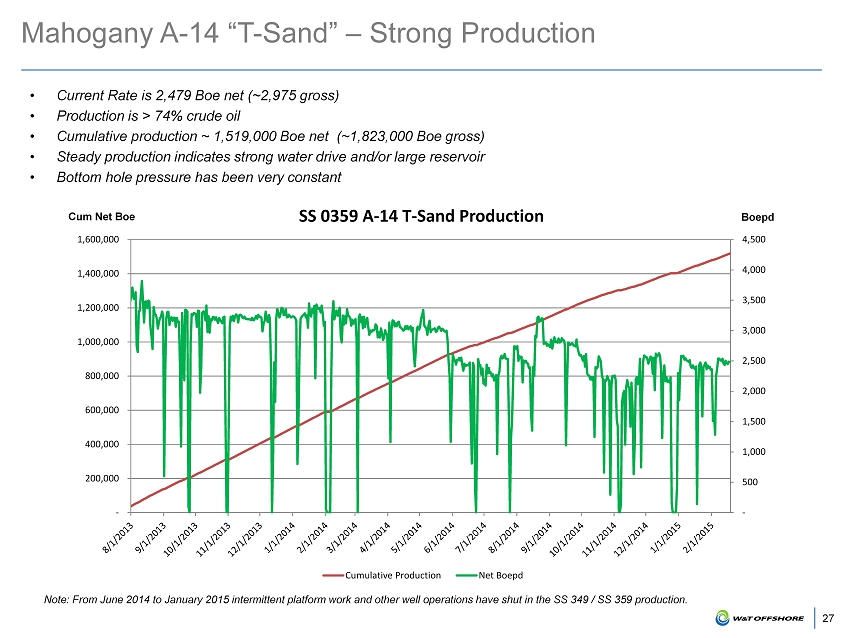
27 Mahogany A - 14 “T - Sand” – Strong Production • Current Rate is 2,479 Boe net (~2,975 gross) • Production is > 74% crude oil • Cumulative production ~ 1,519,000 Boe net (~1,823,000 Boe gross) • Steady production indicates strong water drive and/or large reservoir • Bottom hole pressure has been very constant - 500 1,000 1,500 2,000 2,500 3,000 3,500 4,000 4,500 - 200,000 400,000 600,000 800,000 1,000,000 1,200,000 1,400,000 1,600,000 SS 0359 A - 14 T - Sand Production Cumulative Production Net Boepd Cum Net Boe Boepd Note: From June 2014 to January 2015 intermittent platform work and other well operations have shut in the SS 349 / SS 359 producti on .

PERMIAN BASIN Onshore

29 Permian Basin: Overview of Asset and Activity Permian Basin (WI: 100%, NRI: ~78%) • ~32,000 net acres with 26,000 highly contiguous net acres in the heart of the Northern Midland Basin portion of the Permian Basin • Current drilling program is suspended pending improved commodity prices and lower cost of goods and services • Our Permian acreage is ~ 90% “held by production” Key Points for Permian Basin • Most recently, the UL Mason 2LS, a Lower Spraberry shale well in Andrews County drilled with a 7,619 foot lateral and completed with 33 stages, achieved a IP rate of 1,709 Boe/d (91% oil) on ESP. This well is one of the top wells in the basin • The Chablis 10H and Chablis 13H (two Wolfcamp B wells drilled from a common pad) reached 24 hr peak test rates of 968* Boepd (80% oil) and 1,125* Boepd (89% oil), respectively • Our f irst horizontal Lower Spraberry Shale well, Pinot 65 15H, reached a 24 hr test rate of 965* Boepd (86% oil) • Next Lower Spraberry Shale well, UL 7 - 10 6H, has been drilled and is waiting on completion (8700’ lateral length is our longest to date) • UL 6 - 2 4H Lower Spraberry Shale well is in early stages of flowback Midland Basin W&T Acreage *Rates normalized for 7500’ effective lateral length

30 Permian Basin – Northern Midland Basin Portion W&T’s Acreage Location W&T’s approximately 28,000 gross acre leasehold in the Yellow Rose Field is located in the Northern Midland Basin, slightly east of the basin axis. Deep position allows for higher thermal maturity and higher pressures to increase potential for hydrocarbon recovery, and potential for stacked horizontal targets multiplies the effective acreage. Currently seven potential horizontal targets have been identified.
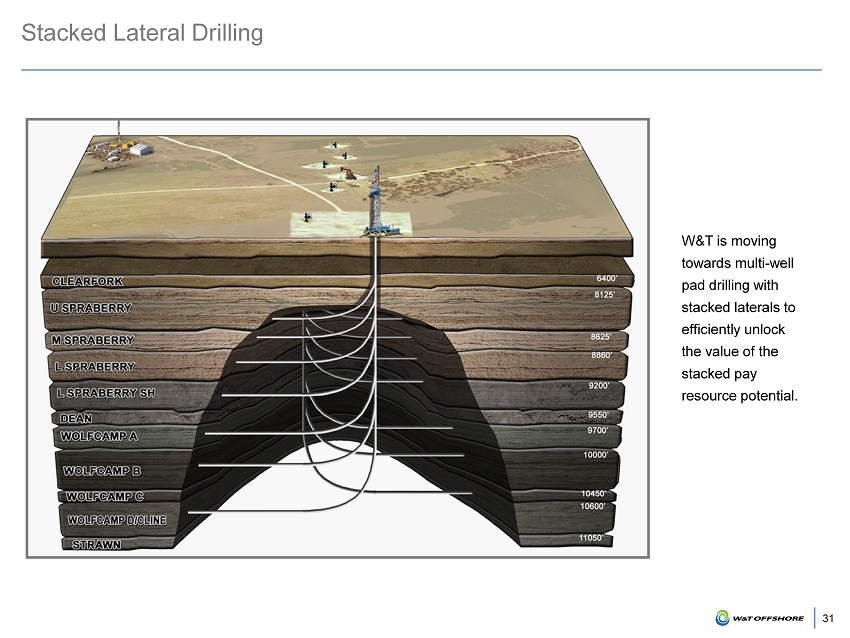
31 Stacked Lateral Drilling W&T is moving towards multi - well pad drilling with stacked laterals to efficiently unlock the value of the stacked pay resource potential.

32 Significant Activity Near W&T Acreage SM Energy Tatonka 1H 24hr: 549 Boepd (90% oil) FANG KCSL 1701H 24hr: 541 Boepd (92% oil) 1 2 3 FANG Estes 1602H 24hr: 541 Boepd (92% oil) 1 2 3 4 WTI UL 6 - 2 UNIT 4H Waiting on Results 4 5 6 SM UL 6 - 21 UNIT 6H 24hr: 663 Boepd SM UL 6 - 21 UNIT 5H Waiting on Results 7 8 9 WTI/QEP UL7 - 10 UNIT 6H Waiting on Completion FANG UL Tawny Unit 1H 24hr: 1,048 Boepd FANG UL Bumble Unit 1H 24hr: 296 Boepd FANG/WTI UL Mason 1H 24hr: 696 Boepd FANG/WTI UL Mason 2LS 24hr: 1,709 Boepd FANG UL III 7 - 4 1H 24hr: 613 Boepd PXD UL 7 - 43 Unit 16H 24hr: 1,660 Boepd (84% oil) PXD UL 7 - 43 Unit 10H 24hr: 3,605 Boepd (74% oil) PXD UL 7 - 38 28H 24hr: 1,866 Boepd (83% oil) 6 5 10 11 12 13 14 15 16 17 PXD UL 7 - 38 27H 24hr: 1,222 Boepd (82% oil) ATHL Dorothy Faye 2H 24hr: 1,279 Boepd (73% oil) WTI Beaujolais A Unit 1302H Waiting on Results FANG Brown - Martin 2101H 24hr: 136 Bopd RSPP Morgan 3601WB 24hr: 100 Bopd RSPP Morgan 3601LS 24hr: 320 Bopd WTI Pinot 65 15H 24hr: 1,016 Boepd WTI Chablis 13H 24hr: 1,125 Boepd FANG Mabee - BL 23 - 1H 24hr: 1,145 Boepd (94% oil) WTI Chablis 9H 24hr: 549 Boepd WTI Chablis 10H 24hr: 968 Boepd FANG Mabee - BL 22 - 1H 24hr: 1,029 Boepd (87% oil) QEP UL 7 - 27 Unit H 2WB 24hr: 522 Boepd QEP UL 7 - 27 Unit H 1WB 24hr: 671 Boepd QEP UL 7 - 27 Unit H 3WB Waiting on Results FANG Wolcott 253 1H 24hr: 501 Boepd ENG Jones - Holton 28H 24hr: 1,139 Boepd (96% oil) ENG Jones - Holton 401H 24hr: 2,128 Boepd (84% oil) ENG Jones - Holton 101H 24hr: 1,282 Boepd (72% oil) 30 2 9 28 24 33 34 32 31 27 26 25 23 22 19 18 21 20 7 8 9 10 11 12 13 14 15 16 17 A Lwr Spraberry Wolfcamp A Wolfcamp B Wolfcamp D Horizontal Legend 27 29 30 31 32 33 34 18 19 20 21 22 23 24 25 26 28 *Note: Locations not highlighted are either permits or drilling wells but do not have information available to determine targ et zone or production results
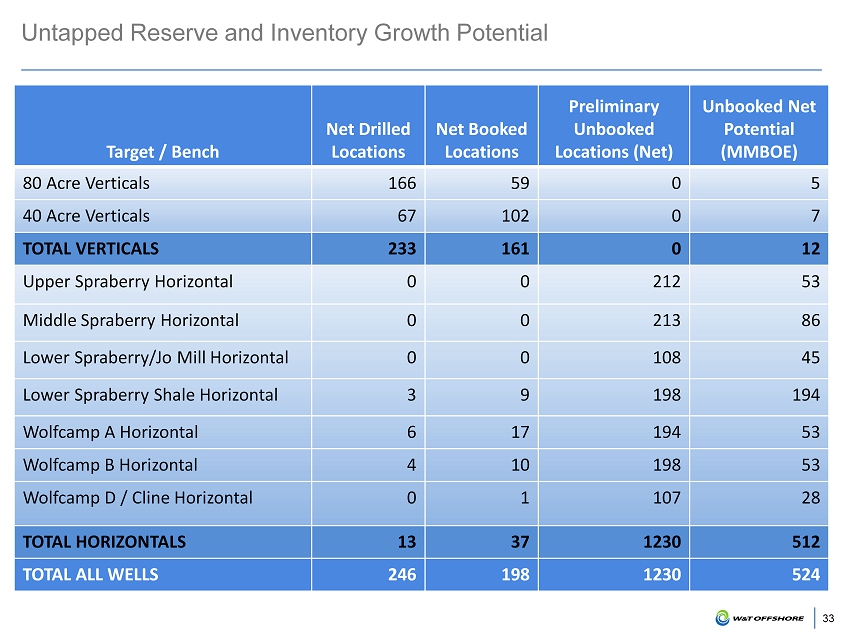
33 Untapped Reserve and Inventory Growth Potential Target / Bench Net Drilled Locations Net Booked Locations Preliminary Unbooked Locations (Net) Unbooked Net Potential (MMBOE) 80 Acre Verticals 166 59 0 5 40 Acre Verticals 67 102 0 7 TOTAL VERTICALS 233 161 0 12 Upper Spraberry Horizontal 0 0 212 53 Middle Spraberry Horizontal 0 0 213 86 Lower Spraberry/Jo Mill Horizontal 0 0 108 45 Lower Spraberry Shale Horizontal 3 9 198 194 Wolfcamp A Horizontal 6 17 194 53 Wolfcamp B Horizontal 4 10 198 53 Wolfcamp D / Cline Horizontal 0 1 107 28 TOTAL HORIZONTALS 13 37 1230 512 TOTAL ALL WELLS 246 198 1230 524
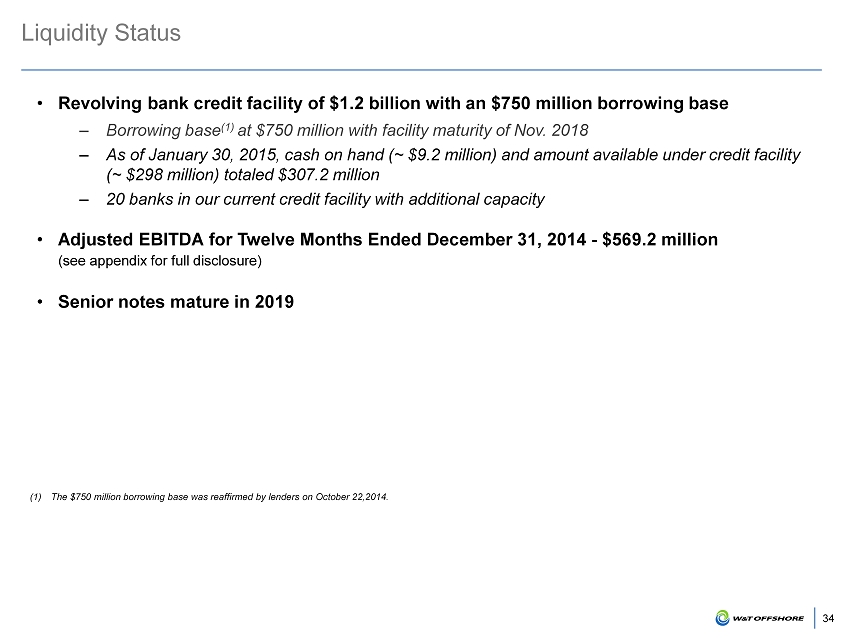
34 Liquidity Status • Revolving bank credit facility of $1.2 billion with an $750 million borrowing base – Borrowing base (1) at $750 million with facility maturity of Nov. 2018 – As of January 30, 2015, cash on hand (~ $9.2 million) and amount available under credit facility (~ $298 million) totaled $307.2 million – 20 banks in our current credit facility with additional capacity • Adjusted EBITDA for Twelve Months Ended December 31, 2014 - $569.2 million (see appendix for full disclosure) • Senior notes mature in 2019 (1) The $750 million borrowing base was reaffirmed by lenders on October 22,2014.

Appendix
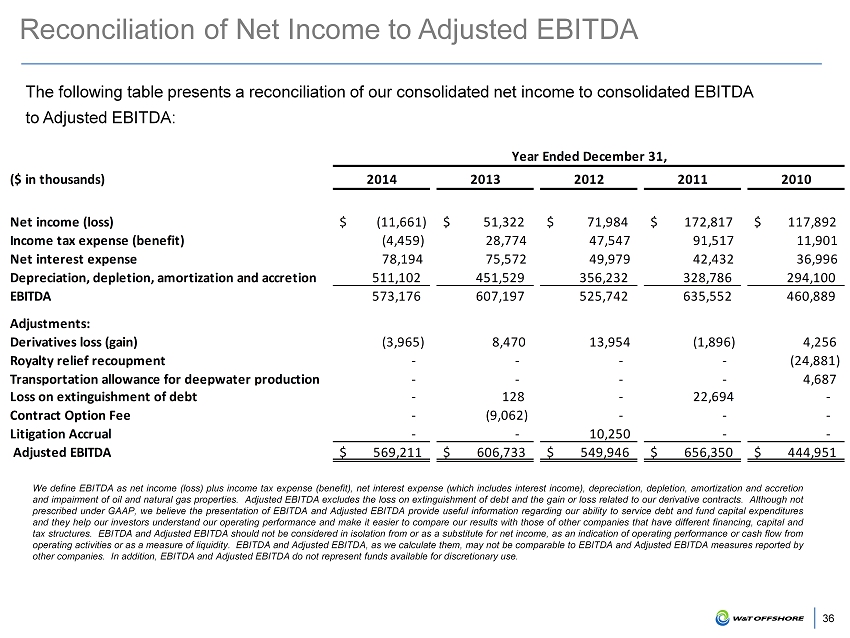
Reconciliation of Net Income to Adjusted EBITDA 36 The following table presents a reconciliation of our consolidated net income to consolidated EBITDA to Adjusted EBITDA: We define EBITDA as net income (loss) plus income tax expense (benefit), net interest expense (which includes interest income), depreciation, depletion, amortization and accretion and impairment of oil and natural gas properties . Adjusted EBITDA excludes the loss on extinguishment of debt and the gain or loss related to our derivative contracts . Although not prescribed under GAAP, we believe the presentation of EBITDA and Adjusted EBITDA provide useful information regarding our ability to service debt and fund capital expenditures and they help our investors understand our operating performance and make it easier to compare our results with those of other companies that have different financing, capital and tax structures . EBITDA and Adjusted EBITDA should not be considered in isolation from or as a substitute for net income, as an indication of operating performance or cash flow from operating activities or as a measure of liquidity . EBITDA and Adjusted EBITDA, as we calculate them, may not be comparable to EBITDA and Adjusted EBITDA measures reported by other companies . In addition, EBITDA and Adjusted EBITDA do not represent funds available for discretionary use . ($ in thousands) 2014 2013 2012 2011 2010 Net income (loss) $ (11,661) $ 51,322 $ 71,984 $ 172,817 $ 117,892 Income tax expense (benefit) (4,459) 28,774 47,547 91,517 11,901 Net interest expense 78,194 75,572 49,979 42,432 36,996 Depreciation, depletion, amortization and accretion 511,102 451,529 356,232 328,786 294,100 EBITDA 573,176 607,197 525,742 635,552 460,889 Adjustments: Derivatives loss (gain) (3,965) 8,470 13,954 (1,896) 4,256 Royalty relief recoupment - - - - (24,881) Transportation allowance for deepwater production - - - - 4,687 Loss on extinguishment of debt - 128 - 22,694 - Contract Option Fee - (9,062) - - - Litigation Accrual - - 10,250 - - Adjusted EBITDA $ 569,211 $ 606,733 $ 549,946 $ 656,350 $ 444,951 Year Ended December 31,

2014 Year End Proved Reserves 37 1) In accordance with guidelines established by the SEC, our proved reserves as of December 31, 2014 were determined to be economically producible under existing economic conditions, which requires the use of the unweighted arithmetic average of the first - day - of - the - month price for oil and gas for the period J anuary 2014 through December 2014. Also note that the PV - 10 value is a non - GAAP financial measure. We refer to PV - 10 as the present value of estimated future net revenues of estimated proved reserves as calculated by our indepe ndent petroleum consultant using a discount rate of 10%. This amount includes projected revenues, estimated production costs and estimated f utu re development costs and excludes ARO. For 2014, proved reserves and PV - 10 were calculated using average prices of $ 91.12 per barrel for oil, $ 34.63 per barrel for natural gas liquids and $4.265 per Mcf for natural gas, as adjusted for energy content for natural gas, quality, transportation fees and regional price differentials. Classification of Proved Reserves Oil (MMBbls) NGLs (MMBbls) Natural Gas (Bcf) Oil Equivalent (MMBoe) Natural Gas Equivalent (Bcfe) % of total reserves PV-10 (1) (Millions) Proved developed producing 29.8 9.2 177.7 68.6 411.7 57% 1,903.0$ Proved developed non-producing 5.9 1.5 43.4 14.6 87.8 12% 304.0 Total proved developed 35.7 10.7 221.1 83.3 499.5 69% 2,207.0 Proved undeveloped 26.0 5.1 33.8 36.7 220.4 31% 398.0 Total proved 61.7 15.8 254.9 120.0 719.9 100% $ 2,605.0

Forward - Looking Statement Disclosure 38 This presentation, contains “forward - looking statements” within the meaning of the Private Securities Litigation Reform Act of 1995 , Section 27 A of the Securities Act and Section 21 E of the Exchange Act . Forward - looking statements give our current expectations or forecasts of future events . They include statements regarding our future operating and financial performance . Although we believe the expectations and forecasts reflected in these and other forward - looking statements are reasonable, we can give no assurance they will prove to have been correct . They can be affected by inaccurate assumptions or by known or unknown risks and uncertainties . You should understand that the following important factors, could affect our future results and could cause those results or other outcomes to differ materially from those expressed or implied in the forward - looking statements relating to : ( 1 ) amount, nature and timing of capital expenditures ; ( 2 ) drilling of wells and other planned exploitation activities ; ( 3 ) timing and amount of future production of oil and natural gas ; ( 4 ) increases in production growth and proved reserves ; ( 5 ) operating costs such as lease operating expenses, administrative costs and other expenses ; ( 6 ) our future operating or financial results ; ( 7 ) cash flow and anticipated liquidity ; ( 8 ) our business strategy, including expansion into the deep shelf and the deepwater of the Gulf of Mexico, and the availability of acquisition opportunities ; ( 9 ) hedging strategy ; ( 10 ) exploration and exploitation activities and property acquisitions ; ( 11 ) marketing of oil and natural gas ; ( 12 ) governmental and environmental regulation of the oil and gas industry ; ( 13 ) environmental liabilities relating to potential pollution arising from our operations ; ( 14 ) our level of indebtedness ; ( 15 ) timing and amount of future dividends ; ( 16 ) industry competition, conditions, performance and consolidation ; ( 17 ) natural events such as severe weather, hurricanes, floods, fire and earthquakes ; and ( 18 ) availability of drilling rigs and other oil field equipment and services . We caution you not to place undue reliance on these forward - looking statements, which speak only as of the date of this presentation or as of the date of the report or document in which they are contained, and we undertake no obligation to update such information . The filings with the SEC are hereby incorporated herein by reference and qualifies the presentation in its entirety . Cautionary Note to U . S . Investors The United States Securities and Exchange Commission permits oil and gas companies, in their filings with the SEC, to disclose only proved reserves that a company has demonstrated by actual production or conclusive formation tests to be economically and legally producible under existing economic and operating conditions . U . S . Investors are urged to consider closely the disclosure in our Form 10 - K for the year ended December 31 , 2013 , available from us at Nine Greenway Plaza, Suite 300 , Houston, Texas 77046 . You can obtain these forms from the SEC by calling 1 - 800 - SEC - 0330 .
• Nine Greenway Plaza, Suite 300 • Houston, TX 77046 • Main line: 713 - 626 - 8525 • Fax: 713 - 626 - 8527 • Investor Relations: 713 - 297 - 8024 • www.wtoffshore.com • [email protected]
Serious News for Serious Traders! Try StreetInsider.com Premium Free!
You May Also Be Interested In
- W&T Offshore (WTI) PT Raised to $7.80 at Stifel
- Houston Will Host 2025 ACHE Congress Bringing More than 5,000 Healthcare Leaders to City
- ATV industry players unite on safer riding for youth; Ontario Quad Safety Council launches new online training program
Create E-mail Alert Related Categories
SEC FilingsSign up for StreetInsider Free!
Receive full access to all new and archived articles, unlimited portfolio tracking, e-mail alerts, custom newswires and RSS feeds - and more!
