

Form 6-K UBS Group AG For: Mar 24
 Tweet
Tweet Share
Share
UNITED STATES
SECURITIES AND EXCHANGE COMMISSION
Washington, D.C. 20549
FORM 6-K
REPORT OF FOREIGN PRIVATE ISSUER
PURSUANT TO RULE 13a-16 OR 15d-16
UNDER THE SECURITIES EXCHANGE ACT OF 1934
Date: March 24, 2015
Commission File Number: 1-15060
UBS Group AG
UBS AG
(Registrants’ Names)
Bahnhofstrasse 45, Zurich, Switzerland, and
Aeschenvorstadt 1, Basel, Switzerland
(Address of principal executive office)
Indicate by check mark whether the registrant files or will file annual reports under cover of Form 20-F or Form 40-F.
Form 20-F x Form 40-F ¨
This Form 6-K consists of materials presented by UBS Group AG at a conference on March 24, 2015, which appear immediately following this page.
Morgan Stanley conference Tom Naratil Group Chief Financial Officer and Group Chief Operating Officer March 24, 2015
Cautionary statement regarding forward-looking statements This presentation contains statements that constitute “forward-looking statements,” including but not limited to management’s outlook for UBS’s financial performance and statements relating to the anticipated effect of transactions and strategic initiatives on UBS’s business and future development. While these forward-looking statements represent UBS’s judgments and expectations concerning the matters described, a number of risks, uncertainties and other important factors could cause actual developments and results to differ materially from UBS’s expectations. These factors include, but are not limited to: (i) the degree to which UBS is successful in executing its announced strategic plans, including its cost reduction and efficiency initiatives and its planned further reduction in its Basel III risk-weighted assets (RWA) and leverage ratio denominator (LRD); (ii) developments in the markets in which UBS operates or to which it is exposed, including movements in securities prices or liquidity, credit spreads, currency exchange rates and interest rates and the effect of economic conditions and market developments on the financial position or creditworthiness of UBS’s clients and counterparties; (iii) changes in the availability of capital and funding, including any changes in UBS’s credit spreads and ratings, or arising from requirements for bail-in debt or loss-absorbing capital; (iv) changes in or the implementation of financial legislation and regulation in Switzerland, the US, the UK and other financial centers that may impose more stringent capital (including leverage ratio), liquidity and funding requirements, incremental tax requirements, additional levies, limitations on permitted activities, constraints on remuneration or other measures; (v) uncertainty as to when and to what degree the Swiss Financial Market Supervisory Authority (FINMA) will approve reductions to the incremental RWA resulting from the supplemental operational risk capital analysis mutually agreed to by UBS and FINMA, or will approve a limited reduction of capital requirements due to measures to reduce resolvability risk; (vi) the degree to which UBS is successful in executing the announced creation of a new Swiss banking subsidiary and a US intermediate holding company, the squeeze-out to complete the establishment of a holding company for the UBS Group, changes in the operating model of UBS Limited and other changes which UBS may make in its legal entity structure and operating model, including the possible consequences of such changes, and the potential need to make other changes to the legal structure or booking model of UBS Group in response to legal and regulatory requirements, including capital requirements, resolvability requirements and proposals in Switzerland and other countries for mandatory structural reform of banks; (vii) changes in UBS’s competitive position, including whether differences in regulatory capital and other requirements among the major financial centers will adversely affect UBS’s ability to compete in certain lines of business; (viii) the liability to which UBS may be exposed, or possible constraints or sanctions that regulatory authorities might impose on UBS, due to litigation, contractual claims and regulatory investigations; (ix) the effects on UBS’s cross-border banking business of tax or regulatory developments and of possible changes in UBS’s policies and practices relating to this business; (x) UBS’s ability to retain and attract the employees necessary to generate revenues and to manage, support and control its businesses, which may be affected by competitive factors including differences in compensation practices; (xi) changes in accounting or tax standards or policies, and determinations or interpretations affecting the recognition of gain or loss, the valuation of goodwill, the recognition of deferred tax assets and other matters; (xii) limitations on the effectiveness of UBS’s internal processes for risk management, risk control, measurement and modeling, and of financial models generally; (xiii) whether UBS will be successful in keeping pace with competitors in updating its technology, particularly in trading businesses; (xiv) the occurrence of operational failures, such as fraud, unauthorized trading and systems failures; and (xv) the effect that these or other factors or unanticipated events may have on our reputation and the additional consequences that this may have on our business and performance. The sequence in which the factors above are presented is not indicative of their likelihood of occurrence or the potential magnitude of their consequences. Our business and financial performance could be affected by other factors identified in our past and future filings and reports, including those filed with the SEC. More detailed information about those factors is set forth in documents furnished by UBS and filings made by UBS with the SEC, including UBS’s Annual Report on Form 20-F for the year ended 31 December 2014. UBS is not under any obligation to (and expressly disclaims any obligation to) update or alter its forward-looking statements, whether as a result of new information, future events, or otherwise. Disclaimer: This presentation and the information contained herein are provided solely for information purposes, and are not to be construed as a solicitation of an offer to buy or sell any securities or other financial instruments in Switzerland, the United States or any other jurisdiction. No investment decision relating to securities of or relating to UBS Group AG, or UBS AG, or its affiliates should be made on the basis of this document. Refer to UBS’s fourth quarter 2014 report and its Annual report on Form 20-F for the year ended 31 December 2014. No representation or warranty is made or implied concerning, and UBS assumes no responsibility for, the accuracy, completeness, reliability or comparability of the information contained herein relating to third parties, which is based solely on publicly available information. UBS undertakes no obligation to update the information contained herein. © UBS 2015. The key symbol and UBS are among the registered and unregistered trademarks of UBS. All rights reserved.
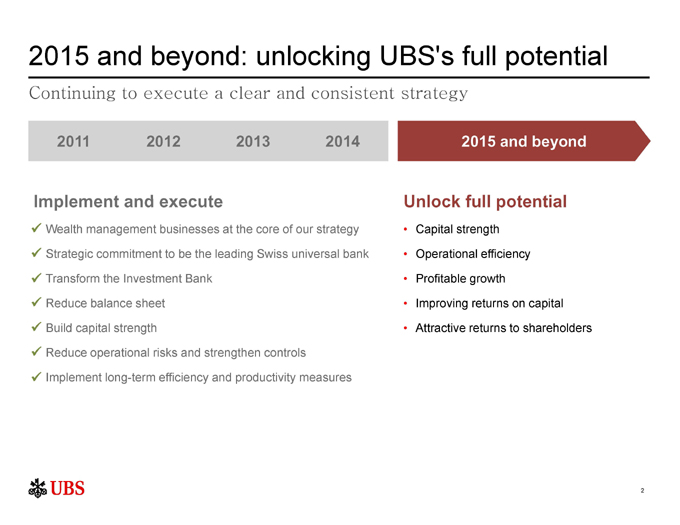
2015 and beyond: unlocking UBS’s full potential Continuing to execute a clear and consistent strategy 2011 2012 2013 2014 2015 and beyond Implement and execute Unlock full potential ü Wealth management businesses at the core of our strategy • Capital strength ü Strategic commitment to be the leading Swiss universal bank • Operational efficiency ü Transform the Investment Bank • Profitable growth ü Reduce balance sheet • Improving returns on capital ü Build capital strength • Attractive returns to shareholders ü Reduce operational risks and strengthen controls ü Implement long-term efficiency and productivity measures
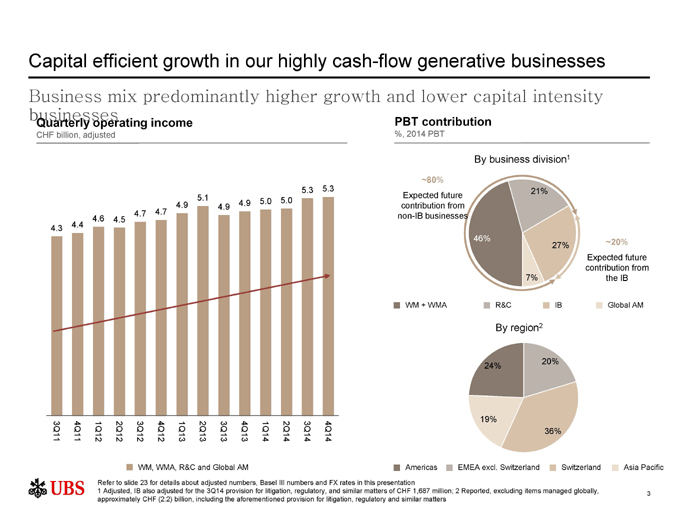
Capital efficient growth in our highly cash-flow generative businesses Business mix predominantly higher growth and lower capital intensity businesses PBT contribution Quarterly operating income CHF billion, adjusted %, 2014 PBT By business division1 ~80% 5.3 5.3 21% 5.1 Expected future 4.9 5.0 5.0 4.9 4.9 contribution from 4.7 4.7 4.6 4.5 non-IB businesses 4.3 4.4 46% ~20% 27% Expected future contribution from 7% the IB WM + WMA R&C IB Global AM By region2 20% 24% 19% 3Q11 4Q11 1Q12 2Q12 3Q12 4Q12 1Q13 2Q13 3Q13 4Q13 1Q14 2Q14 3Q14 4Q14 36% WM, WMA, R&C and Global AM Americas EMEA excl. Switzerland Switzerland Asia Pacific Refer to slide 23 for details about adjusted numbers, Basel III numbers and FX rates in this presentation 1 Adjusted, IB also adjusted for the 3Q14 provision for litigation, regulatory, and similar matters of CHF 1,687 million; 2 Reported, excluding items managed globally, 3 approximately CHF (2.2) billion, including the aforementioned provision for litigation, regulatory and similar matters
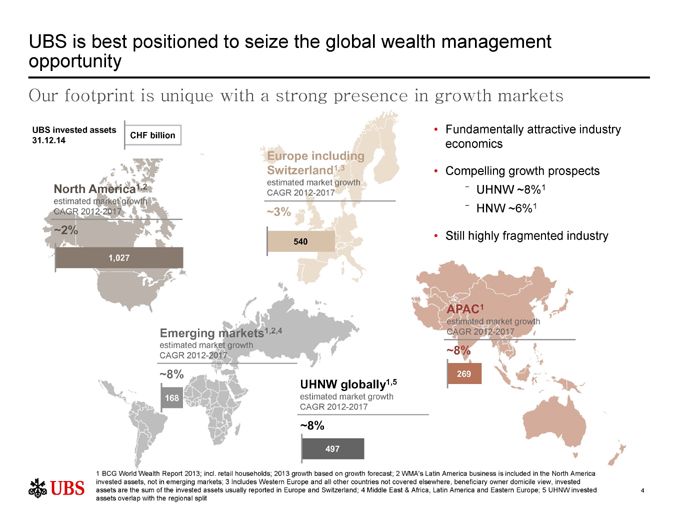
UBS is best positioned to seize the global wealth management opportunity Our footprint is unique with a strong presence in growth markets UBS invested assets • Fundamentally attractive industry CHF billion 31.12.14 economics Europe including Switzerland1,3 • Compelling growth prospects estimated market growth North America1,2 ? UHNW ~8%1 CAGR 2012-2017 estimated market growth ? HNW ~6%1 CAGR 2012-2017 ~3% ~2% • Still highly fragmented industry 540 1,027 APAC1 estimated market growth Emerging markets1,2,4 CAGR 2012-2017 estimated market growth ~8% CAGR 2012-2017 ~8% 269 UHNW globally1,5 168 estimated market growth CAGR 2012-2017 ~8% 497 1 BCG World Wealth Report 2013; incl. retail households; 2013 growth based on growth forecast; 2 WMA’s Latin America business is included in the North America invested assets, not in emerging markets; 3 Includes Western Europe and all other countries not covered elsewhere, beneficiary owner domicile view, invested assets are the sum of the invested assets usually reported in Europe and Switzerland; 4 Middle East & Africa, Latin America and Eastern Europe; 5 UHNW invested 4 assets overlap with the regional split
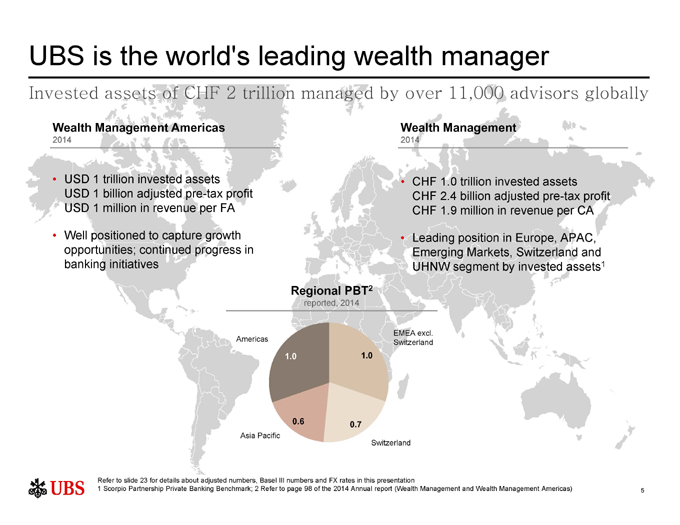
UBS is the world’s leading wealth manager Invested assets of CHF 2 trillion managed by over 11,000 advisors globally Wealth Management Americas Wealth Management 2014 2014 • USD 1 trillion invested assets • CHF 1.0 trillion invested assets USD 1 billion adjusted pre-tax profit CHF 2.4 billion adjusted pre-tax profit USD 1 million in revenue per FA CHF 1.9 million in revenue per CA • Well positioned to capture growth • Leading position in Europe, APAC, opportunities; continued progress in Emerging Markets, Switzerland and banking initiatives UHNW segment by invested assets1 Regional PBT2 reported, 2014 EMEA excl. Americas Switzerland 1.0 1.0 0.6 0.7 Asia Pacific Switzerland Refer to slide 23 for details about adjusted numbers, Basel III numbers and FX rates in this presentation 1 Scorpio Partnership Private Banking Benchmark; 2 Refer to page 98 of the 2014 Annual report (Wealth Management and Wealth Management Americas) 5
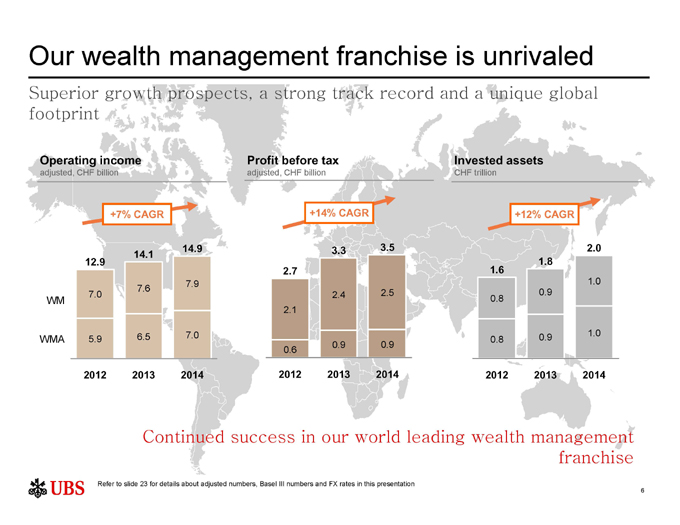
Our wealth management franchise is unrivaled Superior growth prospects, a strong track record and a unique global footprint Operating income Profit before tax Invested assets adjusted, CHF billion adjusted, CHF billion CHF trillion +7% CAGR +14% CAGR +12% CAGR 14.9 3.3 3.5 2.0 14.1 12.9 1.8 2.7 1.6 7.9 1.0 7.6 0.9 7.0 2.4 2.5 WM 0.8 2.1 6.5 7.0 1.0 WMA 5.9 0.8 0.9 0.9 0.9 0.6 2012 2013 2014 2012 2013 2014 2012 2013 2014 Continued success in our world leading wealth management franchise Refer to slide 23 for details about adjusted numbers, Basel III numbers and FX rates in this presentation 6
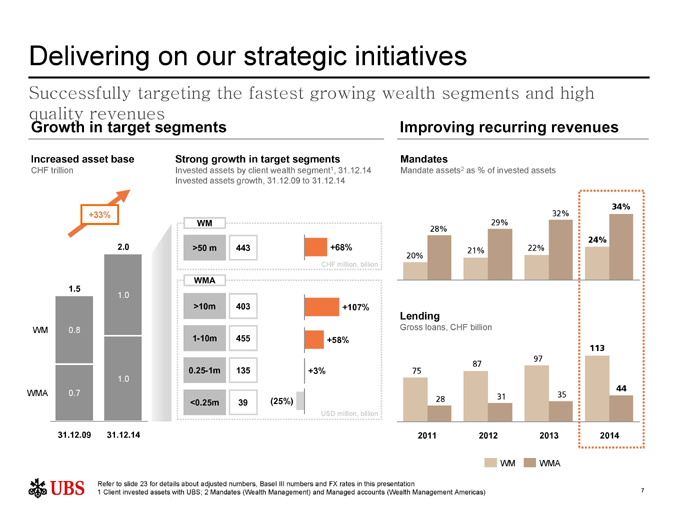
Delivering on our strategic initiatives Successfully targeting the fastest growing wealth segments and high quality revenues Growth in target segments Improving recurring revenues Increased asset base Strong growth in target segments Mandates CHF trillion Invested assets by client wealth segment1, 31.12.14 Mandate assets2 as % of invested assets Invested assets growth, 31.12.09 to 31.12.14 32% 34% +33% WM 29% 28% 24% 2.0 >50 m 443 +68% 22% 21% 20% CHF million, billion WMA 1.5 1.0 >10m 403 +107% Lending WM 0.8 Gross loans, CHF billion 1-10m 455 +58% 113 97 87 0.25-1m 135 +3% 75 1.0 44 WMA 0.7 35 28 31 <0.25m 39 (25%) USD million, billion 31.12.09 31.12.14 2011 2012 2013 2014 WM WMA Refer to slide 23 for details about adjusted numbers, Basel III numbers and FX rates in this presentation 1 Client invested assets with UBS; 2 Mandates (Wealth Management) and Managed accounts (Wealth Management Americas) 7
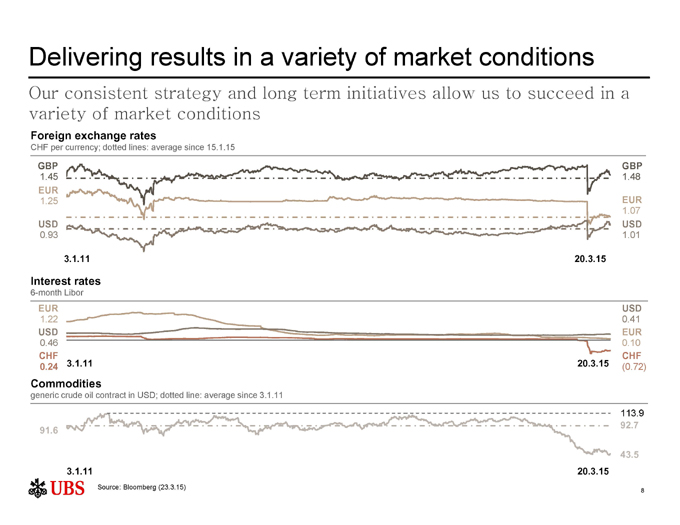
Delivering results in a variety of market conditions Our consistent strategy and long term initiatives allow us to succeed in a variety of market conditions Foreign exchange rates CHF per currency; dotted lines: average since 15.1.15 GBP GBP 1.45 1.48 EUR 1.25 EUR 1.07 USD USD 0.93 1.01 3.1.11 20.3.15 Interest rates 6-month Libor EUR USD 1.22 0.41 USD EUR 0.46 0.10 CHF CHF 0.24 3.1.11 20.3.15 (0.72) Commodities generic crude oil contract in USD; dotted line: average since 3.1.11 113.9 92.7 91.6 43.5 3.1.11 20.3.15 Source: Bloomberg (23.3.15) 8
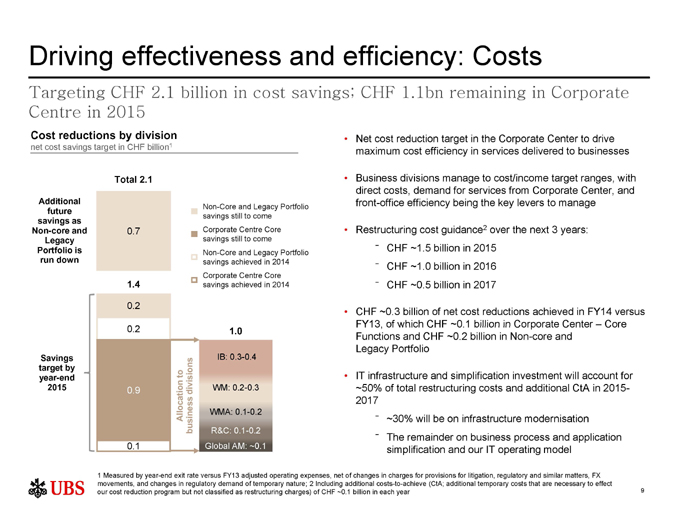
Driving effectiveness and efficiency: Costs Targeting CHF 2.1 billion in cost savings; CHF 1.1bn remaining in Corporate Centre in 2015 Cost reductions by division • Net cost reduction target in the Corporate Center to drive net cost savings target in CHF billion1 maximum cost efficiency in services delivered to businesses Total 2.1 • Business divisions manage to cost/income target ranges, with direct costs, demand for services from Corporate Center, and Additional front-office efficiency being the key levers to manage Non-Core and Legacy Portfolio future savings still to come savings as 2 Non-core and 0.7 Corporate Centre Core • Restructuring cost guidance over the next 3 years: Legacy savings still to come ? CHF ~1.5 billion in 2015 Portfolio is Non-Core and Legacy Portfolio run down savings achieved in 2014 ? CHF ~1.0 billion in 2016 Corporate Centre Core 1.4 savings achieved in 2014 ? CHF ~0.5 billion in 2017 0.2 • CHF ~0.3 billion of net cost reductions achieved in FY14 versus FY13, of which CHF ~0.1 billion in Corporate Center – Core 0.2 1.0 Functions and CHF ~0.2 billion in Non-core and Legacy Portfolio Savings IB: 0.3-0.4 target by to year-end • IT infrastructure and simplification investment will account for 2015 0.9 divisions WM: 0.2-0.3 ~50% of total restructuring costs and additional CtA in 2015- 2017 Allocation WMA: 0.1-0.2 ? ~30% will be on infrastructure modernisation business R&C: 0.1-0.2 ? The remainder on business process and application 0.1 Global AM: ~0.1 simplification and our IT operating model 1 Measured by year-end exit rate versus FY13 adjusted operating expenses, net of changes in charges for provisions for litigation, regulatory and similar matters, FX movements, and changes in regulatory demand of temporary nature; 2 Including additional costs-to-achieve (CtA; additional temporary costs that are necessary to effect our cost reduction program but not classified as restructuring charges) of CHF ~0.1 billion in each year 9
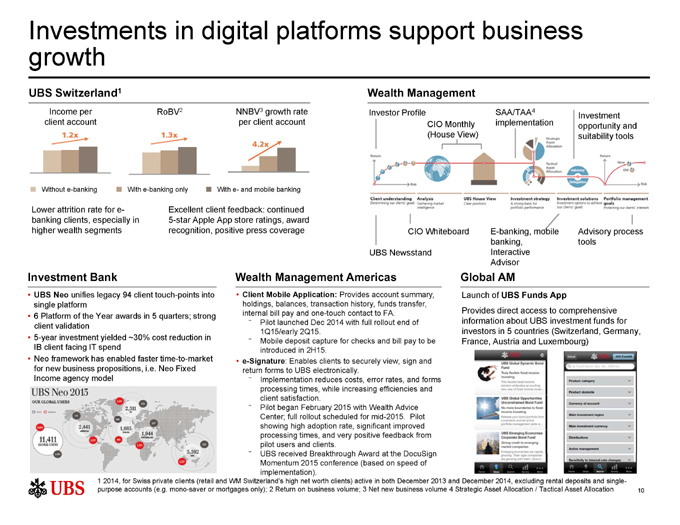
Investments in digital platforms support business growth UBS Switzerland1 Wealth Management Income per RoBV2 NNBV3 growth rate Investor Profile SAA/TAA4 Investment client account per client account CIO Monthly implementation opportunity and (House View) suitability tools 4.2x Without e-banking With e-banking only With e- and mobile banking Lower attrition rate for e- Excellent client feedback: continued banking clients, especially in 5-star Apple App store ratings, award higher wealth segments recognition, positive press coverage CIO Whiteboard E-banking, mobile Advisory process banking, tools UBS Newsstand Interactive Advisor Investment Bank Wealth Management Americas Global AM • UBS Neo unifies legacy 94 client touch-points into • Client Mobile Application: Provides account summary, Launch of UBS Funds App single platform holdings, balances, transaction history, funds transfer, internal bill pay and one-touch contact to FA. Provides direct access to comprehensive • 6 Platform of the Year awards in 5 quarters; strong ? Pilot launched Dec 2014 with full rollout end of information about UBS investment funds for client validation 1Q15/early 2Q15. investors in 5 countries (Switzerland, Germany, • 5-year investment yielded ~30% cost reduction in ? Mobile deposit capture for checks and bill pay to be France, Austria and Luxembourg) IB client facing IT spend introduced in 2H15. • Neo framework has enabled faster time-to-market • e-Signature: Enables clients to securely view, sign and for new business propositions, i.e. Neo Fixed return forms to UBS electronically. Income agency model ? Implementation reduces costs, error rates, and forms processing times, while increasing efficiencies and client satisfaction. ? Pilot began February 2015 with Wealth Advice Center; full rollout scheduled for mid-2015. Pilot showing high adoption rate, significant improved processing times, and very positive feedback from pilot users and clients. ? UBS received Breakthrough Award at the DocuSign Momentum 2015 conference (based on speed of implementation). 1 2014, for Swiss private clients (retail and WM Switzerland’s high net worth clients) active in both December 2013 and December 2014, excluding rental deposits and single-purpose accounts (e.g. mono-saver or mortgages only); 2 Return on business volume; 3 Net new business volume 4 Strategic Asset Allocation / Tactical Asset Allocation 10
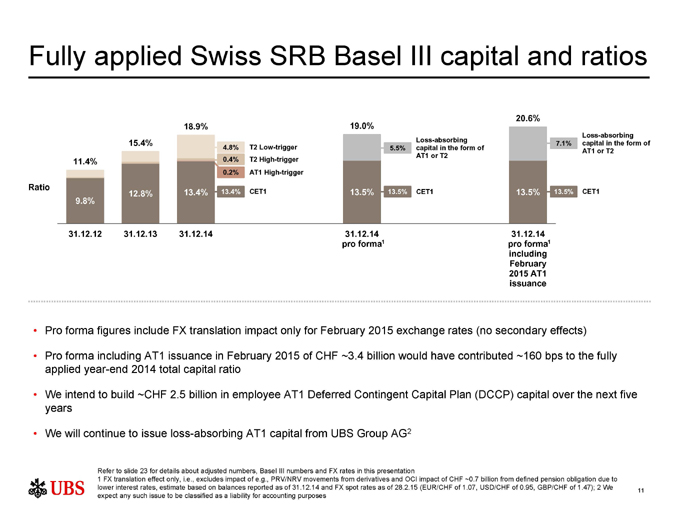
Fully applied Swiss SRB Basel III capital and ratios 19.0% 20.6% 18.9% Loss-absorbing Loss-absorbing 15.4% 7.1% capital in the form of 4.8% T2 Low-trigger 5.5% capital in the form of AT1 or T2 AT1 or T2 11.4% 0.4% T2 High-trigger 0.2% AT1 High-trigger Ratio 12.8% 13.4% 13.4% CET1 13.5% 13.5% CET1 13.5% 13.5% CET1 9.8% 31.12.12 31.12.13 31.12.14 31.12.14 31.12.14 pro forma1 pro forma1 including February 2015 AT1 issuance • Pro forma figures include FX translation impact only for February 2015 exchange rates (no secondary effects) • Pro forma including AT1 issuance in February 2015 of CHF ~3.4 billion would have contributed ~160 bps to the fully applied year-end 2014 total capital ratio • We intend to build ~CHF 2.5 billion in employee AT1 Deferred Contingent Capital Plan (DCCP) capital over the next five years • We will continue to issue loss-absorbing AT1 capital from UBS Group AG2 Refer to slide 23 for details about adjusted numbers, Basel III numbers and FX rates in this presentation 1 FX translation effect only, i.e., excludes impact of e.g., PRV/NRV movements from derivatives and OCI impact of CHF ~0.7 billion from defined pension obligation due to lower interest rates, estimate based on balances reported as of 31.12.14 and FX spot rates as of 28.2.15 (EUR/CHF of 1.07, USD/CHF of 0.95, GBP/CHF of 1.47); 2 We 11 expect any such issue to be classified as a liability for accounting purposes
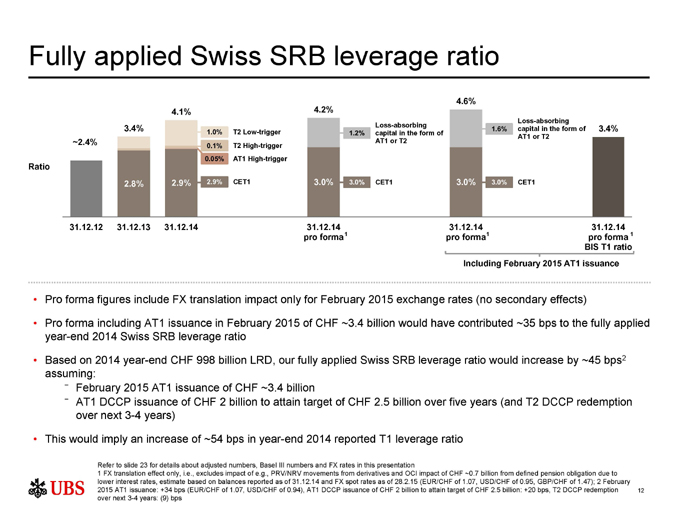
Fully applied Swiss SRB leverage ratio 4.6% 4.1% 4.2% Loss-absorbing Loss-absorbing 3.4% 1.6% capital in the form of 3.4% 1.0% T2 Low-trigger 1.2% capital in the form of AT1 or T2 ~2.4% AT1 or T2 0.1% T2 High-trigger 0.05% AT1 High-trigger Ratio 2.8% 2.9% 2.9% CET1 3.0% 3.0% CET1 3.0% 3.0% CET1 31.12.12 31.12.13 31.12.14 31.12.14 31.12.14 31.12.14 pro forma 1 pro forma1 pro forma 1 BIS T1 ratio Including February 2015 AT1 issuance • Pro forma figures include FX translation impact only for February 2015 exchange rates (no secondary effects) • Pro forma including AT1 issuance in February 2015 of CHF ~3.4 billion would have contributed ~35 bps to the fully applied year-end 2014 Swiss SRB leverage ratio • Based on 2014 year-end CHF 998 billion LRD, our fully applied Swiss SRB leverage ratio would increase by ~45 bps2 assuming: ? February 2015 AT1 issuance of CHF ~3.4 billion ? AT1 DCCP issuance of CHF 2 billion to attain target of CHF 2.5 billion over five years (and T2 DCCP redemption over next 3-4 years) • This would imply an increase of ~54 bps in year-end 2014 reported T1 leverage ratio Refer to slide 23 for details about adjusted numbers, Basel III numbers and FX rates in this presentation 1 FX translation effect only, i.e., excludes impact of e.g., PRV/NRV movements from derivatives and OCI impact of CHF ~0.7 billion from defined pension obligation due to lower interest rates, estimate based on balances reported as of 31.12.14 and FX spot rates as of 28.2.15 (EUR/CHF of 1.07, USD/CHF of 0.95, GBP/CHF of 1.47); 2 February 2015 AT1 issuance: +34 bps (EUR/CHF of 1.07, USD/CHF of 0.94), AT1 DCCP issuance of CHF 2 billion to attain target of CHF 2.5 billion: +20 bps, T2 DCCP redemption 12 over next 3-4 years: (9) bps
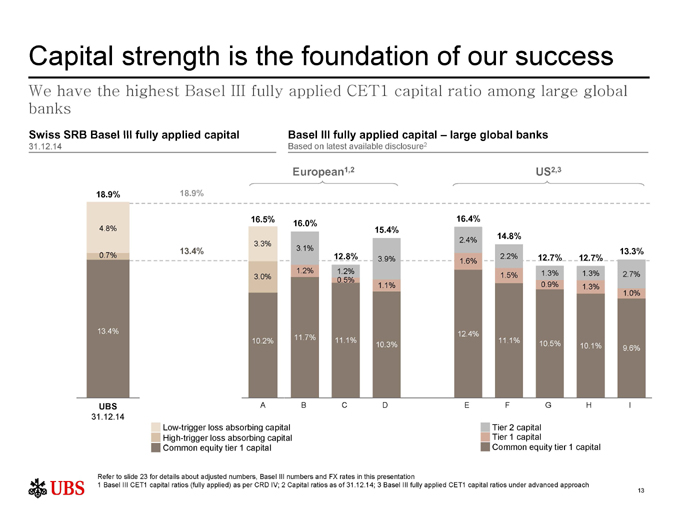
Capital strength is the foundation of our success We have the highest Basel III fully applied CET1 capital ratio among large global banks Swiss SRB Basel III fully applied capital Basel III fully applied capital – large global banks 31.12.14 Based on latest available disclosure2 European1,2 US2,3 18.9% 18.9% 16.5% 16.4% 16.0% 4.8% 15.4% 14.8% 2.4% 3.3% 13.4% 3.1% 13.3% 0.7% 0.4% 12.8% 2.2% 12.7% 12.7% 3.9% 1.6% 1.2% 1.2% 1.3% 1.3% 3.0% 1.5% 2.7% 0.5% 1.1% 0.9% 1.3% 1.0% 13.5% 13.4% 12.4% 11.7% 11.1% 11.1% 10.2% 10.5% 10.3% 10.1% 9.6% UBS A B C D E F G H I 31.12.14 Low-trigger loss absorbing capital Tier 2 capital High-trigger loss absorbing capital Tier 1 capital Common equity tier 1 capital Common equity tier 1 capital Refer to slide 23 for details about adjusted numbers, Basel III numbers and FX rates in this presentation 1 Basel III CET1 capital ratios (fully applied) as per CRD IV; 2 Capital ratios as of 31.12.14; 3 Basel III fully applied CET1 capital ratios under advanced approach 13
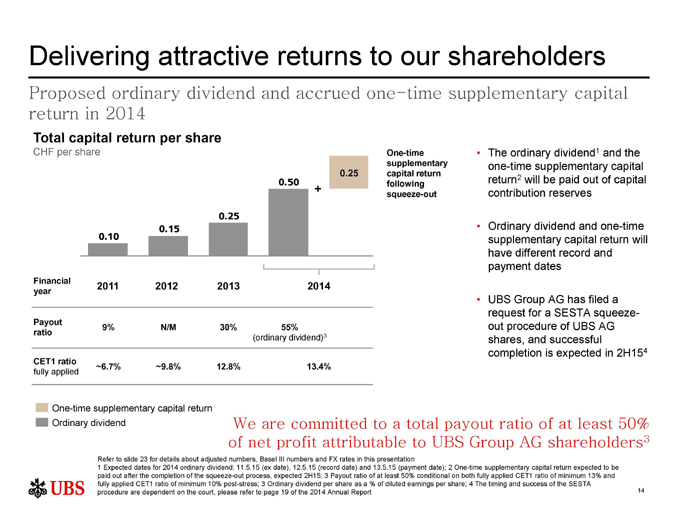
Delivering attractive returns to our shareholders Proposed ordinary dividend and accrued one-time supplementary capital return in 2014 Total capital return per share CHF per share One-time • The ordinary dividend1 and the supplementary one-time supplementary capital 0.25 capital return return2 will be paid out of capital 0.50 following + contribution reserves squeeze-out 0.25 0.15 • Ordinary dividend and one-time 0.10 supplementary capital return will have different record and payment dates Financial 2011 2012 2013 2014 year • UBS Group AG has filed a request for a SESTA squeeze-Payout out procedure of UBS AG 9% N/M 30% 55% ratio (ordinary dividend)3 shares, and successful completion is expected in 2H154 CET1 ratio ~6.7% ~9.8% 12.8% 13.4% fully applied One-time supplementary capital return Ordinary dividend We are committed to a total payout ratio of at least 50% of net profit attributable to UBS Group AG shareholders3 Refer to slide 23 for details about adjusted numbers, Basel III numbers and FX rates in this presentation 1 Expected dates for 2014 ordinary dividend: 11.5.15 (ex date), 12.5.15 (record date) and 13.5.15 (payment date); 2 One-time supplementary capital return expected to be paid out after the completion of the squeeze-out process, expected 2H15; 3 Payout ratio of at least 50% conditional on both fully applied CET1 ratio of minimum 13% and fully applied CET1 ratio of minimum 10% post-stress; 3 Ordinary dividend per share as a % of diluted earnings per share; 4 The timing and success of the SESTA procedure are dependent on the court, please refer to page 19 of the 2014 Annual Report 14
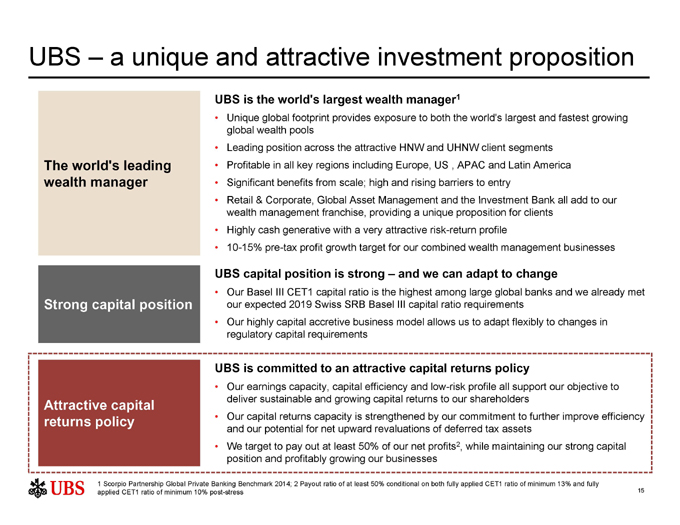
UBS – a unique and attractive investment proposition UBS is the world’s largest wealth manager1 • Unique global footprint provides exposure to both the world’s largest and fastest growing global wealth pools • Leading position across the attractive HNW and UHNW client segments The world’s leading • Profitable in all key regions including Europe, US , APAC and Latin America wealth manager • Significant benefits from scale; high and rising barriers to entry • Retail & Corporate, Global Asset Management and the Investment Bank all add to our wealth management franchise, providing a unique proposition for clients • Highly cash generative with a very attractive risk-return profile • 10-15% pre-tax profit growth target for our combined wealth management businesses UBS capital position is strong – and we can adapt to change • Our Basel III CET1 capital ratio is the highest among large global banks and we already met Strong capital position our expected 2019 Swiss SRB Basel III capital ratio requirements • Our highly capital accretive business model allows us to adapt flexibly to changes in regulatory capital requirements UBS is committed to an attractive capital returns policy • Our earnings capacity, capital efficiency and low-risk profile all support our objective to deliver sustainable and growing capital returns to our shareholders Attractive capital returns policy • Our capital returns capacity is strengthened by our commitment to further improve efficiency and our potential for net upward revaluations of deferred tax assets • We target to pay out at least 50% of our net profits2, while maintaining our strong capital position and profitably growing our businesses 1 Scorpio Partnership Global Private Banking Benchmark 2014; 2 Payout ratio of at least 50% conditional on both fully applied CET1 ratio of minimum 13% and fully applied CET1 ratio of minimum 10% post-stress 15
Appendix
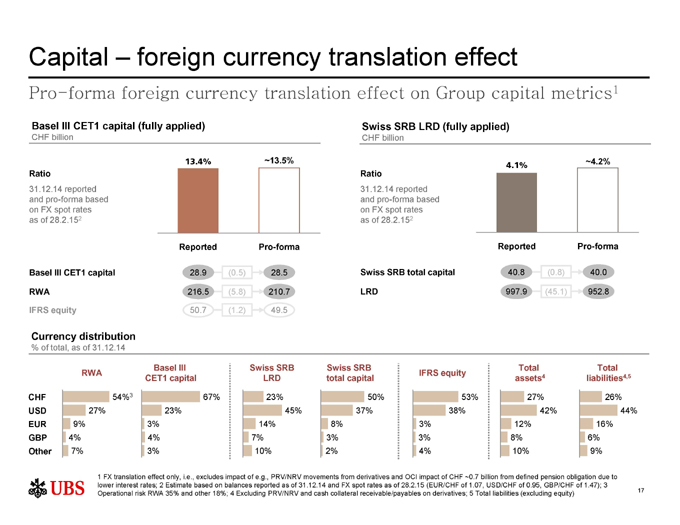
Capital – foreign currency translation effect Pro-forma foreign currency translation effect on Group capital metrics1 Basel III CET1 capital (fully applied) Swiss SRB LRD (fully applied) CHF billion CHF billion 13.4% ~13.5% 6% ~4.2% 4.1% Ratio Ratio 31.12.14 reported 31.12.14 reported and pro-forma based and pro-forma based on FX spot rates on FX spot rates as of 28.2.152 as of 28.2.152 Reported Pro-forma Reported Pro-forma Basel III CET1 capital 28.9 (0.5) 28.5 Swiss SRB total capital 40.8 (0.8) 40.0 RWA 216.5 (5.8) 210.7 LRD 997.9 (45.1) 952.8 IFRS equity 50.7 (1.2) 49.5 Currency distribution % of total, as of 31.12.14 Basel III Swiss SRB Swiss SRB Total Total RWA CET1 capital LRD total capital IFRS equity assets4 liabilities4,5 CHF 54%3 67% 23% 50% 53% 27% 26% USD 27% 23% 45% 37% 38% 42% 44% EUR 9% 3% 14% 8% 3% 12% 16% GBP 4% 4% 7% 3% 3% 8% 6% Other 7% 3% 10% 2% 4% 10% 9% 1 FX translation effect only, i.e., excludes impact of e.g., PRV/NRV movements from derivatives and OCI impact of CHF ~0.7 billion from defined pension obligation due to lower interest rates; 2 Estimate based on balances reported as of 31.12.14 and FX spot rates as of 28.2.15 (EUR/CHF of 1.07, USD/CHF of 0.95, GBP/CHF of 1.47); 3 17 Operational risk RWA 35% and other 18%; 4 Excluding PRV/NRV and cash collateral receivable/payables on derivatives; 5 Total liabilities (excluding equity)
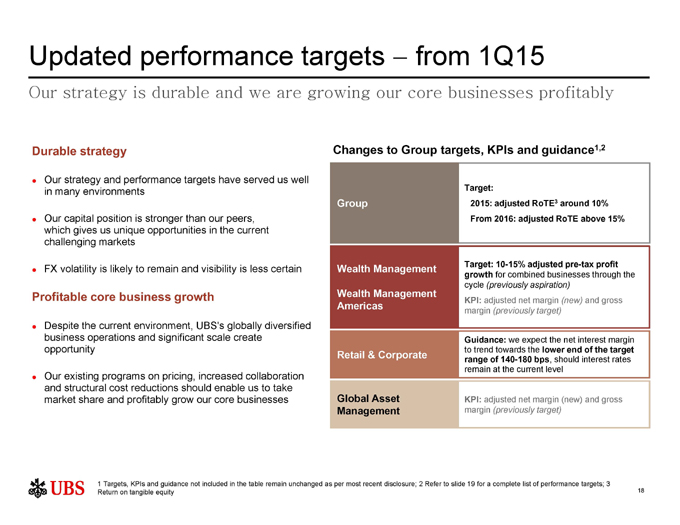
Updated performance targets ? from 1Q15 Our strategy is durable and we are growing our core businesses profitably Durable strategy Changes to Group targets, KPIs and guidance1,2 Our strategy and performance targets have served us well Target: in many environments Group • 2015: adjusted RoTE3 around 10% Our capital position is stronger than our peers, • From 2016: adjusted RoTE above 15% which gives us unique opportunities in the current challenging markets Wealth Management Target: 10-15% adjusted pre-tax profit FX volatility is likely to remain and visibility is less certain growth for combined businesses through the cycle (previously aspiration) Profitable core business growth Wealth Management KPI: adjusted net margin (new) and gross Americas margin (previously target) Despite the current environment, UBS’s globally diversified business operations and significant scale create Guidance: we expect the net interest margin opportunity to trend towards the lower end of the target Retail & Corporate range of 140-180 bps, should interest rates remain at the current level Our existing programs on pricing, increased collaboration and structural cost reductions should enable us to take market share and profitably grow our core businesses Global Asset KPI: adjusted net margin (new) and gross Management margin (previously target) 1 Targets, KPIs and guidance not included in the table remain unchanged as per most recent disclosure; 2 Refer to slide 19 for a complete list of performance targets; 3 Return on tangible equity 18
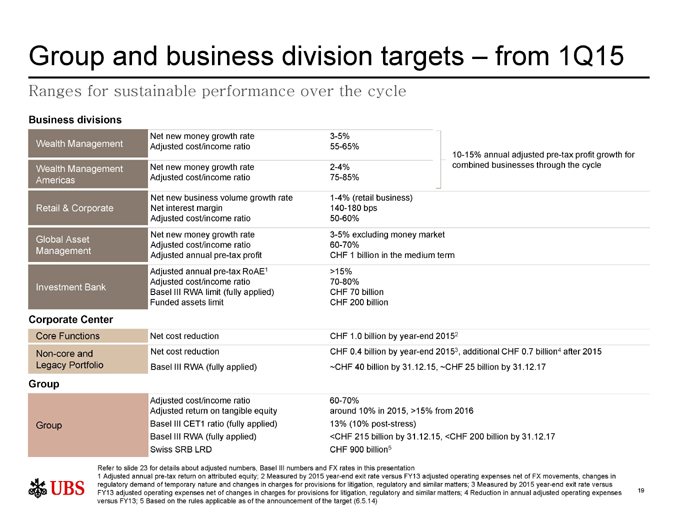
Group and business division targets – from 1Q15 Ranges for sustainable performance over the cycle Business divisions Net new money growth rate 3-5% Wealth Management Adjusted cost/income ratio 55-65% 10-15% annual adjusted pre-tax profit growth for Wealth Management Net new money growth rate 2-4% combined businesses through the cycle Americas Adjusted cost/income ratio 75-85% Net new business volume growth rate 1-4% (retail business) Retail & Corporate Net interest margin 140-180 bps Adjusted cost/income ratio 50-60% Net new money growth rate 3-5% excluding money market Global Asset Adjusted cost/income ratio 60-70% Management Adjusted annual pre-tax profit CHF 1 billion in the medium term Adjusted annual pre-tax RoAE1 >15% Adjusted cost/income ratio 70-80% Investment Bank Basel III RWA limit (fully applied) CHF 70 billion Funded assets limit CHF 200 billion Corporate Center Core Functions Net cost reduction CHF 1.0 billion by year-end 20152 Non-core and Net cost reduction CHF 0.4 billion by year-end 20153, additional CHF 0.7 billion4 after 2015 Legacy Portfolio Basel III RWA (fully applied) ~CHF 40 billion by 31.12.15, ~CHF 25 billion by 31.12.17 Group Adjusted cost/income ratio 60-70% Adjusted return on tangible equity around 10% in 2015, >15% from 2016 Group Basel III CET1 ratio (fully applied) 13% (10% post-stress) Basel III RWA (fully applied) <CHF 215 billion by 31.12.15, <CHF 200 billion by 31.12.17 Swiss SRB LRD CHF 900 billion5 Refer to slide 23 for details about adjusted numbers, Basel III numbers and FX rates in this presentation 1 Adjusted annual pre-tax return on attributed equity; 2 Measured by 2015 year-end exit rate versus FY13 adjusted operating expenses net of FX movements, changes in regulatory demand of temporary nature and changes in charges for provisions for litigation, regulatory and similar matters; 3 Measured by 2015 year-end exit rate versus FY13 adjusted operating expenses net of changes in charges for provisions for litigation, regulatory and similar matters; 4 Reduction in annual adjusted operating expenses 19 versus FY13; 5 Based on the rules applicable as of the announcement of the target (6.5.14)
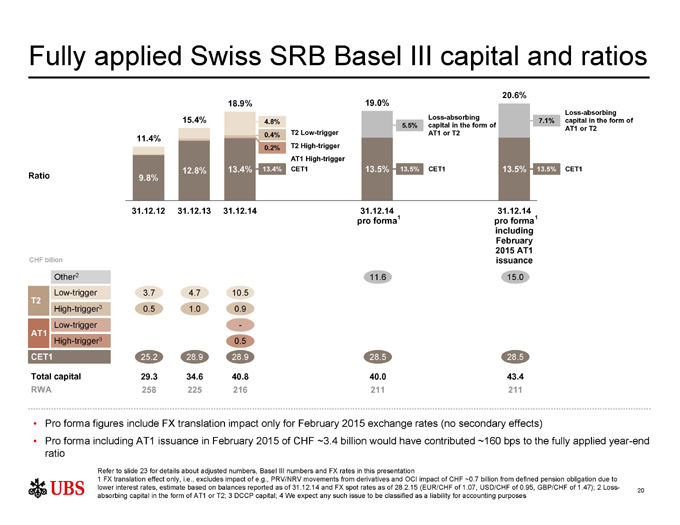
Fully applied Swiss SRB Basel III capital and ratios 19.0% 20.6% 18.9% Loss-absorbing Loss-absorbing 15.4% 4.8% 5.5% capital in the form of 7.1% capital in the form of AT1 or T2 0.4% T2 Low-trigger AT1 or T2 11.4% 0.2% T2 High-trigger AT1 High-trigger 12.8% 13.4% 13.4% CET1 13.5% 13.5% CET1 13.5% 13.5% CET1 Ratio 9.8% 31.12.12 31.12.13 31.12.14 31.12.14 31.12.14 pro forma1 pro forma 1 including February 2015 AT1 CHF billion issuance Other2 11.6 15.0 Low-trigger 3.7 4.7 10.5 T2 High-trigger3 0.5 1.0 0.9 Low-trigger—AT1 High-trigger3 0.5 CET1 25.2 28.9 28.9 28.5 28.5 Total capital 29.3 34.6 40.8 40.0 43.4 RWA 258 225 216 211 211 • Pro forma figures include FX translation impact only for February 2015 exchange rates (no secondary effects) • Pro forma including AT1 issuance in February 2015 of CHF ~3.4 billion would have contributed ~160 bps to the fully applied year-end ratio Refer to slide 23 for details about adjusted numbers, Basel III numbers and FX rates in this presentation 1 FX translation effect only, i.e., excludes impact of e.g., PRV/NRV movements from derivatives and OCI impact of CHF ~0.7 billion from defined pension obligation due to lower interest rates, estimate based on balances reported as of 31.12.14 and FX spot rates as of 28.2.15 (EUR/CHF of 1.07, USD/CHF of 0.95, GBP/CHF of 1.47); 2 Loss- 20 absorbing capital in the form of AT1 or T2; 3 DCCP capital; 4 We expect any such issue to be classified as a liability for accounting purposes
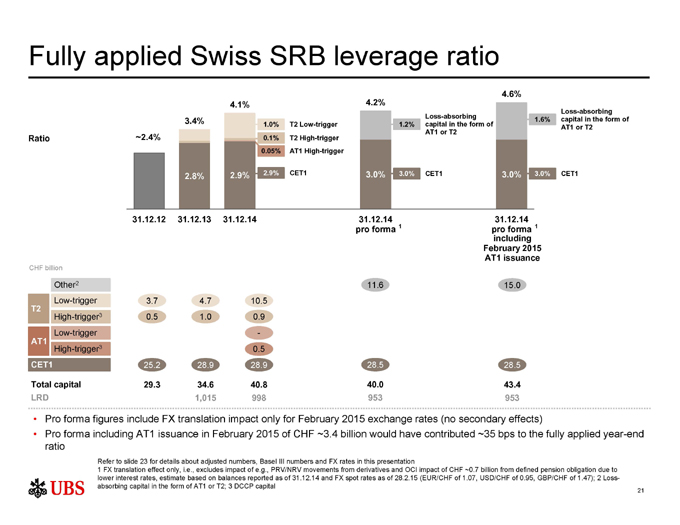
Fully applied Swiss SRB leverage ratio 4.6% 4.1% 4.2% Loss-absorbing Loss-absorbing capital in the form of 3.4% 1.6% 1.0% T2 Low-trigger 1.2% capital in the form of AT1 or T2 AT1 or T2 Ratio ~2.4% 0.1% T2 High-trigger 0.05% AT1 High-trigger 2.9% 2.9% CET1 3.0% 3.0% CET1 3.0% 3.0% CET1 2.8% 31.12.12 31.12.13 31.12.14 31.12.14 31.12.14 pro forma 1 pro forma 1 including February 2015 AT1 issuance CHF billion Other2 11.6 15.0 Low-trigger 3.7 4.7 10.5 T2 High-trigger3 0.5 1.0 0.9 Low-trigger—AT1 High-trigger3 0.5 CET1 25.2 28.9 28.9 28.5 28.5 Total capital 29.3 34.6 40.8 40.0 43.4 LRD 1,015 998 953 953 • Pro forma figures include FX translation impact only for February 2015 exchange rates (no secondary effects) • Pro forma including AT1 issuance in February 2015 of CHF ~3.4 billion would have contributed ~35 bps to the fully applied year-end ratio Refer to slide 23 for details about adjusted numbers, Basel III numbers and FX rates in this presentation 1 FX translation effect only, i.e., excludes impact of e.g., PRV/NRV movements from derivatives and OCI impact of CHF ~0.7 billion from defined pension obligation due to lower interest rates, estimate based on balances reported as of 31.12.14 and FX spot rates as of 28.2.15 (EUR/CHF of 1.07, USD/CHF of 0.95, GBP/CHF of 1.47); 2 Loss-absorbing capital in the form of AT1 or T2; 3 DCCP capital 21
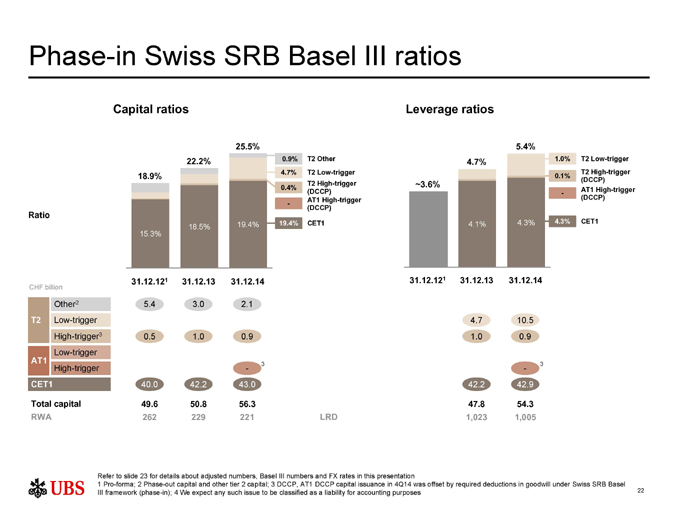
Phase-in Swiss SRB Basel III ratios Capital ratios Leverage ratios 25.5% 5.4% 22.2% 0.9% T2 Other 1.0% T2 Low-trigger 4.7% 4.7% T2 Low-trigger T2 High-trigger 18.9% 0.1% (DCCP) T2 High-trigger ~3.6% 0.4% AT1 High-trigger (DCCP)—(DCCP) AT1 High-trigger—Ratio (DCCP) 19.4% CET1 4.3% 4.3% CET1 18.5% 19.4% 4.1% 15.3% 31.12.121 31.12.13 31.12.14 31.12.121 31.12.13 31.12.14 CHF billion Other2 5.4 3.0 2.1 T2 Low-trigger 4.7 10.5 High-trigger3 0.5 1.0 0.9 1.0 0.9 Low-trigger AT1 3 3 High-trigger — CET1 40.0 42.2 43.0 42.2 42.9 Total capital 49.6 50.8 56.3 47.8 54.3 RWA 262 229 221 LRD 1,023 1,005 Refer to slide 23 for details about adjusted numbers, Basel III numbers and FX rates in this presentation 1 Pro-forma; 2 Phase-out capital and other tier 2 capital; 3 DCCP, AT1 DCCP capital issuance in 4Q14 was offset by required deductions in goodwill under Swiss SRB Basel III framework (phase-in); 4 We expect any such issue to be classified as a liability for accounting purposes 22
Important information related to this presentation Use of adjusted numbers Unless otherwise indicated, “adjusted” figures exclude the adjustment items listed on the previous slide, to the extent applicable, on a Group and business division level. Adjusted results are a non-GAAP financial measure as defined by SEC regulations. Refer to pages 89-90 of the 2014 Annual Report and pages 20-21 of the 4Q14 financial report for an overview of adjusted numbers. Basel III RWA, Basel III capital and Basel III liquidity ratios Basel III numbers are based on the BIS Basel III framework, as applicable for Swiss Systemically relevant banks (SRB). Numbers in the presentation are SRB Basel III numbers unless otherwise stated. Our fully applied and phase-in Swiss SRB Basel III and BIS Basel III capital components have the same basis of calculation, except for differences disclosed on page 257 of the 2014 Annual Report. Basel III risk-weighted assets in the presentation are calculated on the basis of Basel III fully applied unless otherwise stated. Our RWA under BIS Basel III are the same as under Swiss SRB Basel III. Leverage ratio and leverage ratio denominator in this presentation are calculated on the basis of fully applied Swiss SRB Basel III, unless otherwise stated. From 1Q13, Basel III requirements apply. All Basel III numbers prior to 1Q13 are on a pro-forma basis. Some of the models applied when calculating pro-forma information required regulatory approval and included estimates (discussed with our primary regulator) of the effect of these new capital charges. Refer to the “Capital Management” section in the 2014 Annual Report for more information. Currency translation Monthly income statement items of foreign operations with a functional currency other than Swiss francs are translated with month-end rates into Swiss francs. Refer to “Note 36 Currency translation rates” in the 2014 Annual Report for more information. Rounding Numbers presented throughout this presentation may not add up precisely to the totals provided in the tables and text. Percentages, percent changes and absolute variances are calculated based on rounded figures displayed in the tables and text and may not precisely reflect the percentages, percent changes and absolute variances that would be derived based on figures that are not rounded.
This Form 6-K is hereby incorporated by reference into (1) each of the registration statements of UBS AG on Form F-3 (Registration Number 333-200212) and of UBS Group AG on Form S-8 (Registration Numbers 333-200634; 333-200635; 333-200641; and 333-200665) and into each prospectus outstanding under any of the foregoing registration statements, (2) any outstanding offering circular or similar document issued or authorized by UBS AG that incorporates by reference any Form 6-K’s of UBS AG that are incorporated into its registration statements filed with the SEC, and (3) the base prospectus of Corporate Asset Backed Corporation (“CABCO”) dated June 23, 2004 (Registration Number 333-111572), the Form 8-K of CABCO filed and dated June 23, 2004 (SEC File Number 001-13444), and the Prospectus Supplements relating to the CABCO Series 2004-101 Trust dated May 10, 2004 and May 17, 2004 (Registration Number 033-91744 and 033-91744-05).
SIGNATURES
Pursuant to the requirements of the Securities Exchange Act of 1934, the registrant has duly caused this report to be signed on its behalf by the undersigned, thereunto duly authorized.
| UBS Group AG | ||||
| By: | /s/ David Kelly | |||
| Name: | David Kelly | |||
| Title: | Managing Director | |||
| By: | /s/ Sarah M. Starkweather | |||
| Name: | Sarah M. Starkweather | |||
| Title: | Executive Director | |||
| UBS AG | ||||
| By: | /s/ David Kelly | |||
| Name: | David Kelly | |||
| Title: | Managing Director | |||
| By: | /s/ Sarah M. Starkweather | |||
| Name: | Sarah M. Starkweather | |||
| Title: | Executive Director | |||
Date: March 24, 2015
Serious News for Serious Traders! Try StreetInsider.com Premium Free!
You May Also Be Interested In
- UBS AG (UBSG:SW) (UBS) PT Lowered to CHF28 at RBC Capital
- Exane BNP Paribas Downgrades UBS Group AG (UBSG:SW) (UBS) to Neutral
- Citi Downgrades UBS AG (UBSG:SW) (UBS) to Neutral
Create E-mail Alert Related Categories
SEC FilingsRelated Entities
UBSSign up for StreetInsider Free!
Receive full access to all new and archived articles, unlimited portfolio tracking, e-mail alerts, custom newswires and RSS feeds - and more!
