

Form 10-K Ultra Clean Holdings, For: Dec 26
 Tweet
Tweet Share
ShareTable of Contents
UNITED STATES
SECURITIES AND EXCHANGE COMMISSION
Washington, D.C. 20549
FORM 10-K
(Mark One)
| x | ANNUAL REPORT PURSUANT TO SECTION 13 OR 15(d) OF THE SECURITIES EXCHANGE ACT OF 1934 |
For the fiscal year ended December 26, 2014
or
| ¨ | TRANSITION REPORT PURSUANT TO SEC TION 13 OR 15(d) OF THE SECURITIES EXCHANGE ACT OF 1934 |
For the transition period from to
Commission file number 000-50646
Ultra Clean Holdings, Inc.
(Exact name of Registrant as specified in its charter)
| Delaware | 61-1430858 | |
| (State or other jurisdiction of incorporation or organization) |
(IRS Employer Identification No.) | |
| 26462 Corporate Avenue Hayward, California |
94545 | |
| (Address of principal executive offices) | (Zip Code) | |
Registrant’s telephone number, including area code:
(510) 576-4400
Securities registered pursuant to Section 12(b) of the Act:
| Title of Each Class |
Name of Each Exchange on Which Registered | |
| Common Stock, $0.001 par value | The NASDAQ Global Market LLC |
Securities registered pursuant to Section 12(g) of the Act:
None
Indicate by check mark if the registrant is a well-known seasoned issuer, as defined in Rule 405 of the Securities Act. Yes ¨ No x
Indicate by check mark if the registrant is not required to file reports pursuant to Section 13 or Section 15(d) of the Act. Yes ¨ No x
Indicate by check mark whether the registrant (1) has filed all reports required to be filed by Section 13 or 15(d) of the Securities Exchange Act of 1934 during the preceding 12 months (or for such shorter period that the registrant was required to file such reports), and (2) has been subject to such filing requirements for the past 90 days. Yes x No ¨
Indicate by check mark whether the registrant has submitted electronically and posted on its corporate Web site, if any, every Interactive Data File required to be submitted and posted pursuant to Rule 405 of Regulation S-T (§ 232.405 of this chapter) during the preceding 12 months (or for such shorter period that the registrant was required to submit and post such files). Yes x No ¨
Indicate by check mark if disclosure of delinquent filers pursuant to Item 405 of Regulation S-K is not contained herein, and will not be contained to the best of registrant’s knowledge, in definitive proxy or information statements incorporated by reference in Part III of this Form 10-K or any amendment to this Form 10-K. ¨
Indicate by check mark whether the registrant is a large accelerated filer, an accelerated filer, a non-accelerated filer, or a smaller reporting company. See the definitions of “large accelerated filer,” “accelerated filer” and “smaller reporting company” in Rule 12b-2 of the Exchange Act. (Check one):
| Large accelerated filer | ¨ | Accelerated filer | x | |||
| Non-accelerated filer | ¨ (Do not check if a smaller reporting company) | Smaller reporting company | ¨ | |||
Indicate by check mark whether the registrant is a shell company (as defined by Rule 12b-2 of the Act). Yes ¨ No x
The aggregate market value of the voting and non-voting stock held by non-affiliates of the Registrant, based on the closing sale price of the Registrant’s common stock on June 27, 2014 as reported on the NASDAQ Global Market, was approximately $251.0 million. Shares of common stock held by each executive officer and director have been excluded from this computation. The determination of affiliate status for this purpose is not necessarily a conclusive determination for other purposes.
Number of shares of the registrant’s common stock outstanding as of February 27, 2015: 31,771,376
DOCUMENTS INCORPORATED BY REFERENCE
Portions of the registrant’s definitive proxy statement to be delivered to stockholders in connection with the 2015 annual meeting of stockholders are incorporated by reference in Part III of this Form 10-K where indicated. Such proxy statement will be filed with the Securities and Exchange Commission within 120 days of the registrant’s fiscal year ended December 26, 2014.
Table of Contents
2
Table of Contents
This Annual Report on Form 10-K contains forward-looking statements within the meaning of the Private Securities Litigation Reform Act of 1995. Words such as “expects,” “anticipates,” “targets,” “goals,” “projects,” “intends,” “plans,” “believes,” “seeks,” “estimates,” “continues,” “may,” “will be,” “will continue,” “will likely results,” variations of such words, and similar expressions are intended to identify such forward-looking statements, but the absence of these words does not necessarily mean that a statement is not forward-looking. These forward-looking statements include, but are not limited to, statements concerning the following: projections of our financial performance, our anticipated growth and trends in our business, levels of capital expenditures, the adequacy of our capital resources to fund operations and growth, our ability to compete effectively with our competitors, our strategies and ability to protect our intellectual property, future acquisitions, customer demand, our manufacturing and procurement process, employee matters, supplier relations, foreign operations (including our operations in China and Singapore), the legal and regulatory backdrop (including environmental regulation), our exposure to market risks and other characterizations of future events or circumstances described in this Annual Report. Readers are cautioned that these forward-looking statements are only predictions and are subject to risks, uncertainties, and assumptions that are difficult to predict, including those identified below, under “Risk Factors,” and elsewhere herein. Therefore, actual results may differ materially and adversely from those expressed in any forward-looking statements. We undertake no obligation to revise or update any forward-looking statements for any reason, except as required by law.
| Item 1. | Business |
Overview
Ultra Clean Holdings, Inc. (“UCT”) was founded in November 2002 for the purpose of acquiring Ultra Clean Technology Systems and Service Inc. Ultra Clean Technology Systems and Service, Inc. was founded in 1991 by Mitsubishi Corporation and was operated as a subsidiary of Mitsubishi until November 2002, when it was acquired by UCT. UCT became a publicly traded company in March 2004. In June 2006, we completed the acquisition of Sieger Engineering, Inc. to better enhance our position as a subsystem supplier to the semiconductor, research, flat panel, energy and medical equipment industries. Ultra Clean Technology (Shanghai) Co., Ltd and Ultra Clean Micro-Electronics Equipment (Shanghai) Co., Ltd. were established in 2005 and 2007, respectively, to facilitate our operations in China. Ultra Clean Asia Pacific, Pte, Ltd. (Singapore), was established in fiscal year 2008 to facilitate our operations in Singapore. In July 2012, we acquired American Integration Technologies LLC (“AIT”) to immediately add to our customer base in the semiconductor and medical spaces and to provide additional manufacturing capabilities. In November 2014, we launched our 3D printing business in Singapore through a $40,000 acquisition of a privately held company, Prototype Asia, to develop additive manufacturing capability for our customer base. In February 2015, we acquired substantially all of the assets of Marchi Thermal Systems, Inc. (“Marchi”), a designer and manufacturer of specialty heaters, thermocouples and temperature controllers, for approximately $30.0 million in cash and 1,437,500 shares of newly issued common stock for a total purchase price of approximately $44.0 million. Our primary reason for this acquisition was to expand our capabilities with our existing semiconductor equipment customers, increase our footprint in this market and bring about earlier engagement of new products and next generation equipment. We financed the cash portion of the acquisition by borrowing a total of $29.7 million under a new senior secured credit facility, under which we also borrowed $46.5 million to pay off the total outstanding loan balance from our existing credit facility. Following the acquisition of Marchi, our cash and cash equivalents totaled approximately $77.4 million and total debt was approximately $76.2 million. See further discussion of the new borrowing arrangements in Note 5 to the Notes to Consolidated Financial Statements.
We are a leading developer and supplier of critical subsystems for Original Equipment Manufacturers (OEMs) primarily in the semiconductor capital equipment industry. We also leverage the specialized skill sets required to support semiconductor equipment to serve technologically similar markets in the consumer, medical, energy, industrial, flat panel and research industries collectively referred to as “Other Addressed Industries”. We develop, design, prototype, engineer, manufacture and test systems and subsystems which are highly specialized and integral to our customers products.
3
Table of Contents
We provide our customers with complete solutions that combine our expertise in design, scan, assembly, test, component characterization and highly flexible global manufacturing operations with excellence in quality control and financial stability. Our global footprint helps us to drive down total manufacturing costs, reduce design-to-delivery cycle times and maintain high quality standards for our customers. We believe these characteristics provide global solutions for our customers’ growing product demands. We have shipped a majority of our products to U.S. registered customers with locations both in and outside the U.S. In addition to U.S. manufacturing, we manufacture products in our Asian facilities to support local and U.S. based customers. We conduct our operating activities primarily through our wholly owned subsidiaries, Ultra Clean Technology Systems and Service, Inc., AIT LLC, Ultra Clean Technology (Shanghai) Co., Ltd., Ultra Clean Micro-Electronics Equipment (Shanghai) Co., Ltd., Ultra Clean Asia Pacific, Pte Ltd. (Singapore), and subsequent to February 2015, Marchi. Our international sales represented 29.6%, 28.5% and 22.2% of sales for fiscal years 2014, 2013 and 2012, respectively. See Note 10 to the Notes to Consolidated Financial Statements for further information about our geographic areas.
The newly acquired company, Marchi, is a leader in custom design and manufacture of heaters, sensors, and controllers. Marchi delivers flexible heating elements and thermal solutions to our customers. Heaters are a critical component in many types of semiconductor capital equipment. We believe heaters are increasingly critical in equipment design for the most advanced semiconductor nodes.
Our Solution
We are a global leader in the design, engineering, and manufacture of production tools, modules and subsystems for the semiconductor capital equipment industry and industry segments with similar requirements including consumer, medical and flat panel display. Our focus is on providing specialized engineering and manufacturing solutions for these applications. We enable our customers to realize lower manufacturing costs and reduced design-to-delivery cycle times while maintaining high quality standards. We offer our customers:
| • | A vertically integrated outsourced solution for complex highly configurable systems. We provide our OEM customers a complete outsourced solution for the development, design, component sourcing, prototyping, engineering, turnkey manufacturing and testing of advanced systems. We utilize our machining, sheet metal, and frame fabrication capabilities with highly specialized engineering, global supply chain management, and assembly capabilities to produce high performance products that are customized to meet the needs of our customers, as well as their respective end users. We minimize the overall number of suppliers and manage our global supply chain logistics to reduce inventory levels that our customers would otherwise be required to manage. |
| • | Improved design-to-delivery cycle times. Our strong relationships with our customers and familiarity with their product requirements and the ever changing needs of their customer base, helps us reduce their design-to-delivery cycle times. We have optimized our supply chain management, design and manufacturing coordination and controls to respond rapidly to order requests enabling us to decrease design-to-delivery cycle times for our customers. Because our engineers work closely with our customers’ engineers and understand the fabrication, assembly and test of their products, we often can improve their design for manufacturability, thereby improving their cost, quality and consistency. |
| • | Component neutral design and manufacturing. We do not manufacture active components such as mass flow controllers. Our component neutral position enables us to recommend components on the basis of technology, performance and cost and to optimize our customers’ overall designs based on these criteria. Furthermore, our neutral approach allows us to maintain close relationships with a wide range of component suppliers. |
| • | Component testing capabilities. We utilize our technical expertise to test and characterize key components and subsystems. We have made significant investments in advanced analytical and automated test equipment enabling us to test and qualify key components. We can perform diagnostic tests, design verification and failure analysis for our customers and suppliers. Our analytical and testing |
4
Table of Contents
| capabilities of supplier components provide us the ability to recommend to our customers a wide range of appropriate component and design choices for their products. |
| • | Increased integration with OEMs through local presence. Our local presence in close proximity to the facilities of most of our OEM customers enables us to remain closely integrated with their design, development and implementation teams. This level of integration enables us to respond quickly and efficiently to customer changes and requests. |
| • | Precision machining capabilities. We manufacture high quality, precision machined parts using equipment capable of efficiently providing complex parts with exacting tolerance. Our diverse precision fabrication equipment enables us to manufacture a broad range of machined parts using a broad range of materials, from exotic metals to basic plastics. Our manufacturing capabilities include horizontal and vertical milling, turning and welding, amongst numerous others. We own and operate advanced machining and fabrication systems at multiple sites in the U.S. and Asia. |
| • | Precision Frame Fabrication. We design and manufacture frames using tubing or sheet metal in all sizes with exacting standards to meet and exceed our customers’ needs. We utilize over 25 years of experience in the fabrication of complex frames to provide the cost competitive edge in our vertical integration model. |
| • | Precision Sheet Metal Fabrication. Our ability to provide complete sheet metal solutions for our customers enables us to support prototype to volume production, from brackets to sheet metal frames, and from structural to high quality cosmetic finishing of the final product. Our automated equipment and design capabilities allow us to develop accurate prototype and final production products for our customers. |
| • | 3D Printing of Prototype Parts for Engineers. Our acquisition of Prototype Asia enables us to produce molds and fixtures for quick-turn production and to provide complex parts that cannot otherwise be manufactured. |
| • | Custom Fabricated Heaters. Our acquisition of Marchi, enables us to design and manufacture heaters, sensors, and controllers for precise temperature control. These products are complementary to our gas delivery systems. |
Our Strategy
Our objective is to maintain our position as a leading solutions provider in the markets we serve, primarily the semiconductor capital equipment market while expanding Other Addressed Industries. Our strategy is comprised of the following key elements:
| • | Expand our market share with Semiconductor Capital Equipment OEMs. We believe that outsourcing among OEMs creates a significant market opportunity for us to grow our business with existing and new customers. We believe our customers will continue to outsource critical subsystems and that we are well positioned to capture a significant portion of these outsourcing opportunities. We believe that our continued focus on efficient manufacturing, reduced design-to-delivery cycle times, and quality and reliability will also allow us to gain market share. |
| • | Develop solutions that allow our customer’s customers to succeed at the latest 2x or 1x nanometer semiconductor processing nodes. We are expanding the number and type of subsystems that we offer into this advanced semiconductor market. |
| • | Expand our market share in Other Addressed Industries. We believe we can leverage the attributes and skill sets, which allow us to succeed in the semiconductor capital equipment industry, to increase our market share in technologically similar markets including medical, flat panel and research equipment. |
| • | Leverage our geographic presence in lower cost manufacturing regions. In March 2005, we completed construction of a manufacturing facility in Shanghai, China, allowing us to expand production in a low |
5
Table of Contents
| cost region. In November 2007, we completed construction of a second manufacturing facility in Shanghai, China to house our precision machined parts and subsystem assembly operations. These facilities put us in close proximity to the manufacturing facilities of existing and potential customers and their end users. In Singapore, we opened a procurement office in October 2008 and we expanded our operations by opening manufacturing facilities in November 2009 and in October 2014. Our manufacturing facilities are all using the same processes and procedures, enabling us to respond to rapid demand changes by employing as much and as little manufacturing capabilities as required. |
| • | Drive profitable growth with our flexible cost structure. We implement cost containment and capacity enhancement initiatives throughout the semiconductor capital equipment demand cycle and benefit greatly from the global presence and efficiencies of our supply chain. In addition, we believe our Shanghai and Singapore facilities position us to respond effectively to future business demands. We employ a core engineering strategy with flexible partnering to augment our staff during the steep rise and fall associated with the semiconductor industry. |
| • | Continue to selectively pursue strategic acquisitions. We may choose to further grow our business by selectively pursuing strategic acquisitions. We will continue to consider acquisitions that will enable us to expand our geographic presence, secure new customers and diversify into complementary products and markets as well as broaden our technological capabilities in the markets we serve. |
| • | Develop unique solutions to enhance our customer’s manufacturing. With the acquisition of Marchi, we will be able to provide additional thermal products, leveraging our core capability in heaters, thermocouples and controllers. |
| • | Identify markets that require rapid “Art to Part” capability. Through our Asian additive manufacturing facility and our new Fremont rapid prototyping facility, we can provide both fast-turn machining as well as 3D parts that could not otherwise be made and provide our customers with a new level of design freedom. |
Products
We design, develop, prototype, manufacture and test subsystems, primarily for the semiconductor capital equipment, consumer, medical, energy, industrial, flat panel and research industries. Our products include precision robotic solutions, gas delivery systems, a variety of industrial and automation production equipment products; subsystems that includes chemical mechanical planarization modules, chemical delivery modules, top-plate assemblies, frame assemblies, and process modules.
| • | Precision robotics: Precision robotic systems are used when accurate controlled motion is required. Some of the systems that employ robotic systems are: robotic surgery, semiconductor wafer and chip handling, wire bonding and industrial equipment. |
| • | Robotic Surgery Products: Robotic surgery is the process of performing a minimally invasive operation on a patient with the help of robotic equipment operated by a physician. This procedure is intended to minimize traumas on the body, scarring and recovery time. |
| • | Gas delivery systems: A typical OEM gas delivery system consists of one or more gas lines, comprised of small diameter internally polished stainless steel tubing, filters, mass flow controllers, regulators, pressure transducers and valves, and an integrated electronic and/or pneumatic control system. These systems are mounted on a pallet and are typically enclosed in a sheet metal encasing. Our gas delivery system designs are developed in collaboration with our customers and are customized to meet the needs of specific processing requirement for OEMs. Our customers either specify the particular brands of components they want incorporated into a particular system or rely on our design expertise and component characterization capabilities to help them select the appropriate components for their particular system. |
6
Table of Contents
| • | Chemical delivery modules: Chemical delivery modules deliver gases and reactive chemicals in a liquid or gaseous form from a centralized subsystem to the reaction chamber. The module may include gas delivery systems in combination with liquid and vapor delivery systems. |
| • | Frame assemblies: Frame assemblies are support structures fabricated from steel tubing or folded sheet metal and form the backbone to which all other assemblies are attached. The complexity of the frames includes pneumatic harnesses and cables that connect other critical subsystems together. |
| • | Process modules: Process modules refer to the larger subsystems of semiconductor manufacturing tools that process integrated circuits onto wafers. Process modules include several smaller subsystems such as the frame assembly, top-plate assembly and gas and chemical delivery modules, as well as the chamber and electronic, pneumatic and mechanical subsystems. |
| • | Other high level assemblies: Other high level assemblies refer to large subsystems used in semiconductor manufacturing, medical, energy, industrial, flat panel and research industries. |
Customers
We sell our products to customers in the semiconductor capital equipment, consumer, medical, energy, industrial, flat panel and research industries. The majority of our revenue is in the semiconductor capital equipment industry, which is highly concentrated, and we are therefore highly dependent upon a small number of customers. Our three largest customers in fiscal year 2014 and 2013 were Applied Materials, Inc., Lam Research Corporation and ASM International, Inc., each of which accounted for more than 10% of our total sales in fiscal year 2014 and 2013. Our three largest customers in fiscal year 2012 were Applied Materials, Inc., Lam Research Corporation and Intuitive Surgical Inc. (ISI), each of which accounted for more than 10% of our total sales in fiscal year 2012. As a group, the respective year’s top three customers accounted for 76%, 81% and 80% of the Company’s sales for fiscal years 2014, 2013 and 2012, respectively.
The composition of our most significant customers has changed from time to time based on various factors, including acquisition activity by our customers. For example, in June 2012, Lam Research Corporation completed its acquisition of Novellus Systems, Inc. As a result, our customer concentration has increased. In addition, we announced in the third quarter of fiscal 2012 that one of our larger semiconductor equipment customers decided to in-source a portion of their gas panel business. We also terminated our manufacturing services to FEI Company (“FEI”) at the beginning of our second quarter of fiscal 2012. Effective February 2015, UCT came to an agreement with ISI to transition to insourced manufacturing for their next generation robot. UCT will continue to manufacture previous generation robots and also assist with machined components and spare parts for current and future ISI production.
We have successfully qualified as a supplier with each of our customers who require it. This lengthy qualification process involves the inspection and audit of our facilities and evaluation by our customers of our engineering, documentation, manufacturing and quality control processes and procedures before that customer places orders for our products. Our customers generally place orders with suppliers who have met and continue to meet their qualification criteria.
Sales and Support
We sell our products through our direct sales force which, as of December 26, 2014, consisted of a total of approximately 83 sales directors, account managers and sales support staff. Our sales directors are responsible for establishing sales strategy and setting the objectives for specific customer accounts. Each account manager is dedicated to a specific customer account and is responsible for the day-to-day management of that customer. Account managers work closely with customers and in many cases provide on-site support. Account managers often attend customers’ internal meetings related to production and engineering design and quality to ensure that customer expectations are interpreted and communicated properly to our operations group. Account managers also work with our customers to identify and meet their cost and design-to-delivery cycle time objectives.
7
Table of Contents
We have dedicated business development managers responsible for new business development for gas delivery systems and other critical subsystems. Our new business development managers initiate and develop long-term, multilevel relationships with customers and work closely with customers on new business opportunities throughout the design-to-delivery cycle. Our sales force includes technical sales support for order placement, spare parts quotes and production status updates. We have a technical sales representative located at each of our manufacturing facilities. In addition, we have developed a service and support infrastructure to provide our customers with service and support 24 hours a day, seven days a week. Our dedicated global field service engineers provide customer support through the performance of on-site installation, servicing and repair of our subsystems.
Technology Development
We engage in ongoing technology development efforts in order to remain a technology leader for gas delivery systems and to further develop our expertise in other critical subsystems. In addition, our design engineering and new product engineering groups support our technology development activities. Our technology development group works closely with our customers to identify and anticipate changes and trends in next-generation equipment. Our technology development group participates in customer technology partnership programs that focus on process application requirements for gas delivery systems and other critical subsystems. These development efforts are designed to meet specific customer requirements in the areas of subsystem design, materials, component selection and functionality. Our technology development group also works directly with our suppliers to help them identify new component technologies and make necessary changes in, and enhancements to, the components that we integrate into our products. Our analytical and testing capabilities enable us to evaluate multiple supplier component technologies and provide customers with a wide range of appropriate component and design choices for their gas delivery systems and other critical subsystems.
Our analytical and testing capabilities also help us anticipate technological changes and the requirements in component features for next-generation gas delivery systems and other critical subsystems. We are also developing additional features to improve the performance and functionality of our gas delivery systems and other critical subsystems. Our technology development and new product engineering expenses were approximately $7.1 million, $5.5 million and $5.1 million for the 2014, 2013 and 2012 fiscal years, respectively. We perform our technology development activities principally at our facilities in Hayward, California.
Intellectual Property
Our success depends in part on our ability to maintain and protect our proprietary technology and to conduct our business without infringing the proprietary rights of others. Our business is largely dependent upon our design, engineering, manufacturing and testing know-how. We also rely on a combination of trade secrets and confidentiality provisions, and to a much lesser extent, patents, copyrights and trademarks, to protect our proprietary rights. As of December 26, 2014, we have no issued U.S. patent and no U.S. patent applications pending. In February 2015, we acquired four patents from Marchi with various expiration dates ranging from 2016 to 2026. Intellectual property that we develop on behalf of our customers is generally owned exclusively by those customers.
We routinely require our employees, suppliers and potential business partners to enter into confidentiality and non-disclosure agreements before we disclose to them any sensitive or proprietary information regarding our products, technology or business plans. We require employees to assign to us proprietary information, inventions and other intellectual property they create, modify or improve.
Competition
Our industry is highly fragmented. When we compete for new business, we face competition from other suppliers of gas delivery systems and other critical subsystems as well as the internal manufacturing groups of
8
Table of Contents
our customers. In addition, customers that have elected to outsource their gas delivery systems and other critical subsystems could elect in the future to develop and manufacture these subsystems internally, leading to further competition. Our principal competitor for our gas delivery systems is Ichor Systems, Inc., and our principal competitors for other critical subsystems are Flextronics International Ltd., Foxsemicon Integrated Technology Inc. and Celestica. Some of these competitors have substantially greater financial, technical, manufacturing and marketing resources than we do. We expect our competitors to continue to improve the performance of their current products and to introduce new products or new technologies that could adversely affect sales of our current and future products. In addition, the limited number of potential customers in our industry further intensifies competition. The primary competitive factors in our industry are price, technology, quality, design-to-delivery cycle time, reliability in meeting product demand, service and historical customer relationships. We anticipate that increased competitive pressures will cause intensified price-based competition and we may have to reduce the prices of our products. In addition, we expect to face new competitors as we enter new markets.
Employees
As of December 26, 2014, we had 1,546 employees, of which 88 were temporary. Of our total employees, there were 96 in engineering, 13 in technology development, 83 in sales and support, 889 in direct manufacturing, 346 in indirect manufacturing and 119 in executive and administrative functions. These figures include 480 employees in Shanghai, China; 100 employees in Singapore; and 22 employees in Cebu, Philippines. None of our employees are represented by a labor union and we have not experienced any work stoppages.
Governmental Regulation and Environmental Matters
Our operations are subject to federal, state and local regulatory requirements and foreign laws relating to environmental, waste management and health and safety matters, including measures relating to the release, use, storage, treatment, transportation, discharge, disposal and remediation of contaminants, hazardous substances and waste, as well as practices and procedures applicable to the construction and operation of our facilities.
Our past or future operations may result in exposure to injury or claims of injury by employees or the public which may result in material costs and liabilities to us. Although some risk of costs and liabilities related to these matters is inherent in our business, we believe that our business is operated in substantial compliance with applicable regulations. However, new, modified or more stringent requirements or enforcement policies could be adopted, which could adversely affect us.
Available Information
We file with the Securities and Exchange Commission (“SEC”) annual reports on Form 10-K, quarterly reports on Form 10-Q and current reports on Form 8-K pursuant to Section 13(a) or 15(d) of the Securities Exchange Act of 1934, as amended, or the Exchange Act. You may read and copy any materials we file with the SEC at the Public Reference Room maintained by the SEC at 100 F Street, N.E., Washington, D.C. 20549. You may also request copies of all or any portion of such material from the SEC at prescribed rates. Please call the SEC at 1-800-SEC-0330 for further information on the operation of the public reference room. In addition, materials filed electronically with the SEC are available at the SEC’s website at http://www.sec.gov.
In addition, we make available free of charge, on or through our website at http://www.uct.com, our annual, quarterly and current reports and any amendments to those reports, as soon as reasonably practicable after electronically filing such reports with, or furnishing them to, the SEC. This website address is intended to be an inactive textual reference only; none of the information contained on our website is part of this report or is incorporated by reference herein.
9
Table of Contents
Executive Officers
Set forth below is information concerning our executive officers as of February 27, 2015.
| Name |
Age | Position | ||||
| James P. Scholhamer* |
48 | Chief Executive Officer & Director | ||||
| Kevin C. Eichler |
55 | Executive Vice President, Chief Financial Officer and Secretary | ||||
| Bruce Wier |
66 | Senior Vice President of Engineering | ||||
| Deborah Hayward |
53 | Senior Vice President of Global Account Management | ||||
| Lavi A. Lev |
58 | Senior Vice President of Asia | ||||
| Mark G. Bingaman |
59 | Senior Vice President of Global Materials and Supply Chain Management | ||||
| * | As reported on the Company’s Current Report on Form 8-K filed with the SEC on January 5, 2015, Mr. Scholhamer accepted the position as the Company’s Chief Executive Officer and Director effective January 19, 2015, succeeding Mr. Granger, who retired as the Company’s Chief Executive Officer on such date but remains as non-executive Chairman of the Board of Directors. |
James P. Scholhamer joined UCT as Chief Executive Officer and a member of the Board of Directors of UCT in January 2015. Prior to joining UCT, Mr. Scholhamer served in various capacities with Applied Materials Inc., most recently as corporate vice president and general manager of the Equipment Products Group and Display Services Group within its Global Service Division from February 2011 to January 2015. Mr. Scholhamer was the corporate vice president and general manager of the Display Business Group from December 2008 to February 2011 and vice president of Operations-Energy for the Environmental and Display Products Division from July 2006 to December 2008 at Applied Materials, Inc. Mr. Scholhamer held various positions at Applied Films Corporation from August 1997 to July 2006, including chief operating officer, chief technology officer and executive vice president as well as vice president of Operations, Engineering and Research & Development. In addition to managing Applied Films Germany and Taiwan sites, Mr. Scholhamer served as vice president and general manager of the Thin Film Coating Division and the Thin Film Equipment Division in the company’s Colorado office from July 2000 to September 2004. Prior to that, Mr. Scholhamer held various operational and technical positions in several companies related to the design and fabrication of optical components such as Visible, UV and X-ray optics. Mr. Scholhamer holds a Bachelor of Science degree in materials and metallurgical engineering from the University of Michigan.
Kevin C. Eichler has served as our Executive Vice President and Chief Financial Officer since July 2009. Prior to joining UCT, Mr. Eichler served on the Board of Directors of UCT from February 2004 to July 2009. Mr. Eichler was the senior vice president and chief financial officer of Credence Systems from January 2008 to November 2008, and the executive vice president of operations and chief financial officer of MarketTools from March 2006 to December 2007. He served as the vice president and chief financial officer of MIPS Technologies from June 1998 to February 2006. Prior to that, he held management positions with several technology companies including Visigenic Software, NeXT Software and Microsoft. Mr. Eichler holds a Bachelor of Science degree in accounting from St. John’s University.
Bruce Wier has served as our Senior Vice President of Engineering since January 2007 and Vice President of Engineering since February 2000. Mr. Wier served as our Director of Design Engineering from July 1997 to February 2000. Prior to joining UCT in July 1997, Mr. Wier was the engineering manager for the Oxide Etch Business Unit at Lam Research from April 1993 to June 1997. Prior to that, Mr. Wier was the senior project engineering manager at Genus from May 1990 to April 1993, the mechanical engineering manager Varian Associates from November 1985 to May 1990, and the principal engineer/project manager at Eaton Corporation from February 1981 to November 1985. Mr. Wier holds a Bachelor of Science degree cum laude in mechanical engineering from Syracuse University.
10
Table of Contents
Deborah Hayward has served as our Senior Vice President of Global Account Management since January 2007 and Vice President of Sales since October 2002. Ms. Hayward served as our Senior Sales Director from May 2001 to October 2002, as Sales Director from February 1998 to May 2001 and as a major account manager from October 1995 to February 1998. Prior to joining UCT in 1995, she was a customer service manager and account manager at Brooks Instruments from 1985 to 1995.
Lavi A. Lev has served as our Senior Vice President of Asia since November 2011. Prior to joining UCT, Mr. Lev served in 2008 as a director and executive chairman of the Board of LTX-Credence Corporation, a provider of automated test equipment for the semiconductor industry. Mr. Lev was chief executive officer and president of Credence Systems Corporation from 2006 to 2008. Prior to that, Mr. Lev served as executive vice president and general manager of the products and solution business at Cadence Design Systems, Inc. from 2000. Mr. Lev has 30 years of business, research and development and operational management experience in the Microprocessor Chip Design, Electronic Design Automation Software (EDA), Test Equipment and Contract Manufacturing industries. Mr. Lev holds a Bachelor of Science degree in electrical engineering from Technion, Israel Institute of Technology and also graduated from the Jerusalem Rubin Academy of Music.
Mark G. Bingaman has served as our Senior Vice President of Global Materials and Supply Chain Management since February 2010. Prior to joining UCT, Mr. Bingaman was the managing director at Applied Materials, Inc. in charge of the site in Tainan, Taiwan which manufactured equipment for solar, glass and display industries. He held additional senior management positions at Applied Materials, Inc. starting from 2000. From 1999 to 2000, Mr. Bingaman was the director for supply chain management integration for Eaton Corporation. Mr. Bingaman held multiple positions at Aeroquip-Vickers, Inc. from 1995 to 1999 including vice president for global supply chain management for Vickers, Incorporated. He held various positions at McDonnell Douglas from 1977 to 1994 including vice president of operations for the McDonnell Douglas Helicopter Company from 1990 to 1994. Mr. Bingaman holds a Bachelor of Science degree in accounting from the University of Missouri and a Master of Science degree in management information systems from Southern Illinois University.
| ITEM 1A. | Risk Factors |
The cyclical and highly volatile nature of the industries we serve could harm our operating results.
Our business and operating results depend in significant part upon capital expenditures by manufacturers in the semiconductor capital equipment, consumer, medical, energy, industrial, flat panel and research industries, which in turn depend upon the current and anticipated market demand for such products. Historically, the industries we serve (in particular the semiconductor industry) have been highly cyclical, with recurring periods of over-supply of products that have had a severe negative effect on the demand for capital equipment used to manufacture such products. We have experienced and anticipate that we will continue to experience significant fluctuations in customer orders for our products through such cycles. Slowdowns in the industries we serve have had, and future slowdowns may also have, a material adverse effect on our operating results. During periods of decreasing demand for our products, we must be able to appropriately align our cost structure with prevailing market conditions, effectively manage our supply chain and motivate and retain employees. During periods of increased demand, we must increase manufacturing capacity and inventory to meet customer demands, effectively manage our supply chain and attract, retain and motivate a sufficient number of employees. If the industries we serve experience downturns, or if we are not able to timely and appropriately adapt to the changes in our business environment, our results of operations will be harmed. Also, the cyclical and volatile nature of the industries we serve make future revenues, results of operations and net cash flows difficult to estimate.
We rely on a small number of original equipment manufacturing customers for a significant portion of our sales, and any adverse change in our relationships with these customers, including a decision by such customers not to continue to outsource critical subsystems or to give market share to one of our competitors, would adversely affect our business, results of operation and financial condition. Our customers also exert a significant amount of negotiating leverage over us, which may require us to accept lower operating margins, increased liability risk or changes in our operations in order to retain or expand our market share with them.
11
Table of Contents
A relatively small number of OEM customers have historically accounted for a significant portion of our sales, and we expect this trend to continue. As a group, the respective year’s top three customers accounted for 76%, 81% and 80% of our sales for fiscal years 2014, 2013 and 2012, respectively, and we expect that our sales will continue to be concentrated among a small number of customers. In addition, our customer contracts generally do not require customers to place any orders. Accordingly, the success of our business depends on OEMs continuing to outsource the manufacturing of critical subsystems to us. Because of the small number of OEMs in the markets we serve, most of which are already our customers, it would be difficult to replace lost revenue resulting from the loss of, or the reduction, cancellation or delay in purchase orders by, any one of these customers, whether due to their decision to not continue to outsource all or a portion of their critical subsystems for their capital equipment, their giving market share to our competitors or for other reasons, such as customer’s bankruptcy or insolvency or decreased demand for such customer’s products. We have in the past lost business from customers who have taken the manufacturing of our products in-house or given market share to our competitors. For example, we terminated our manufacturing services to FEI at the beginning of our second quarter of fiscal 2012. In addition, we announced in the third quarter of fiscal 2012 that one of our larger semiconductor equipment customers has decided to in-source a portion of their gas panel business and in February 2015 UCT came to an agreement with ISI to transition to insourced manufacturing for their next generation robot. UCT will continue to manufacture previous ISI’s generation robots and also assist with machined components and spare parts for current and future ISI production. Further, since our customers generally own the designs and other intellectual property to the products we manufacture, we cannot prevent them from licensing such designs and other intellectual property to our competitors for the manufacture of such products. If we are unable to replace revenue from customers who determine to take subsystem assembly in-house or give market share to our competitors, such events could have a material adverse impact on our financial position and results of operation.
In addition, consolidation among our customers, or a decision by any one or more of our customers to outsource all or most manufacturing and assembly work to a single equipment manufacturer, may further concentrate our business in a limited number of customers and expose us to increased risks relating to dependence on an even smaller number of customers. For example, one of our former largest customers, Novellus Systems, Inc., was acquired by another one of our largest customers, Lam Research Corporation, in June 2012.
In addition, by virtue of our largest customers’ size and the significant portion of revenue that we derive from them, as well as the competitive landscape, our customers are able to exert significant influence and pricing pressure in the negotiation of our commercial agreements and individual purchase orders and on the conduct of our business with them. Our customers often require reduced prices or other pricing, quality or delivery commitments as a condition to their awarding of market share to us or the placement of orders with us in any given period, which may, among other things, result in reduced operating margins in order to maintain or expand our market share. Our customers’ negotiating leverage also can result in customer agreements or terms and conditions that may contain significant liability risk to us. For example, some of our customers insist that we provide them indemnification against certain liabilities in our agreements with them, including claims of losses by their customers caused by our products, which may be uncapped. In some cases, we have determined to self-insure against liability risk in our customer agreements, meaning that we may be directly responsible for high magnitude liability claims by our customers without recourse to insurance proceeds from third-party insurers. Our customers may also pressure us to make other concessions in order to preserve or expand our market share with them, which may harm our business. For example, one or more of our customers may require us to move the manufacture of our products from lower-cost geographies or locations such as China to higher-cost geographies or locations that are closer to such customer’s facilities, such as Singapore, which could result in reduced margins and a sub-optimal cost structure . If we are unable to retain and expand our business with our customers on favorable terms, or at all, our business and operating results will be adversely affected, or we may be susceptible to increased liability risk which, if realized, may have a material adverse effect on our business, cash flows, results of operation and financial condition.
12
Table of Contents
We have also had to qualify, and are required to maintain our status, as a supplier for each of our customers. This is often a lengthy process that involves the inspection and approval by a customer of our engineering, documentation, manufacturing and quality control procedures before that customer will place volume orders. Our ability to lessen the adverse effect of any loss of, or reduction in sales to, an existing customer through the rapid addition of one or more new customers is limited because of these qualification requirements. Consequently, the risk that our business, operating results and financial condition would be adversely affected by the loss of, or any reduction in orders by, any of our significant customers is increased. Moreover, if we lost our existing status as a qualified supplier to any of our customers, such customer could cancel its orders from us or otherwise terminate its relationship with us, which could have a material adverse effect on our results of operation and financial condition.
We are exposed to risks associated with weakness in the global economy.
We rely to a significant extent on OEM customers, whose business, in turn, depends largely on consumer spending and capital expenditures by businesses. Continuing uncertainty regarding the global economy continue to pose challenges to our business. Economic uncertainty and related factors, including current unemployment levels, uncertainty in European debt markets, fiscal uncertainty in the U.S. economy, market volatility and the slow rate of recovery of many countries from recent recessions, exacerbate negative trends in business and consumer spending and may cause certain of our customers to push out, cancel, or refrain from placing orders for products or services, which may reduce sales and materially affect our results of operation and financial condition. Difficulties in obtaining capital, uncertain market conditions, or reduced profitability may also cause some customers to scale back operations, exit businesses, merge with other manufacturers, or file for bankruptcy protection and potentially cease operations, leading to customers’ reduced research and development funding and/or capital expenditures and, in turn, lower orders from our customers and/or additional slow moving or obsolete inventory or bad debt expense for us. These conditions may also similarly affect key suppliers, which could impair their ability to deliver parts and result in delays for our products or require us to either procure products from high-cost suppliers, or if no additional suppliers exist, to reconfigure the design and manufacture of our products, and we may be unable to fulfill some customer orders. For example, on October 6, 2014, one of our new customers GT Advanced Technologies (GTAT), filed for bankruptcy under chapter 11 of the Bankruptcy Code in the United States Bankruptcy Court for the District of New Hampshire which impaired the collectability of our outstanding accounts receivable as well as the value of our on-hand inventory related to GTAT and also resulted in a charge for non-cancelable vendor commitments.
We have significant existing indebtedness; the restrictive covenants under our credit agreement or other limitations on financing may limit our ability to expand or pursue our business strategy or make capital expenditures; if we are forced to pay some or all of our indebtedness prior to its maturity, our financial position could be severely and adversely affected.
We have significant outstanding indebtedness. On July 3, 2012, we refinanced our prior credit facility and entered into our credit agreement as of December 26, 2014 with Silicon Valley Bank, U.S. Bank National Association and HSBC Bank. The current credit agreement provides for a term loan in an aggregate principal amount of $40.0 million and a revolving credit facility in an aggregate principal amount of $40.0 million. On July 3, 2012, we borrowed $40.0 million under the term loan and $39.8 million under the revolving credit facility to finance our acquisition of AIT and repay Silicon Valley Bank as lender under our prior credit facility. As of December 26, 2014, the long-term portion of our outstanding indebtedness, net of debt issuance costs, under our credit facility was $38.6 million, and the short-term portion was $9.5 million.
On February 2, 2015, we entered into a new credit agreement by and among us, certain of our subsidiaries, East West Bank and Citi National Bank. This credit agreement provides for a term loan in an aggregate principal amount of $40.0 million and a revolving credit facility in an aggregate principal amount of $40.0 million, a letter of credit facility in the aggregate availability amount of $20.0 million and a swingline sub-facility in the aggregate availability amount of $5.0 million. On February 2, 2015, we borrowed an aggregate of $46.5 million
13
Table of Contents
under this new credit agreement from East West Bank and Citi National Bank to repay the remaining outstanding balance from the loan obtained from Silicon Valley Bank, U.S. Bank National Association and HSBC Bank. On February 5, 2015, we borrowed an additional $29.7 million under this new credit agreement from East West Bank and Citi National Bank to finance the acquisition of Marchi.
Our new credit agreement contains certain covenants that restrict our ability to take certain actions, including our ability to:
| • | incur additional debt, including guarantees, or create liens; |
| • | pay dividends and make distributions in respect of our capital stock; |
| • | repurchase capital stock; |
| • | make investments or other restricted payments; |
| • | engage in transactions with stockholders and affiliates; |
| • | sell or otherwise dispose of assets; |
| • | make payments on subordinated indebtedness; and |
| • | engage in certain mergers and acquisitions, new lines of business or make other fundamental changes. |
The restrictive covenants in our credit agreement may therefore limit our strategic and financing options and our ability to return capital to our stockholders through dividends or stock buybacks.
Our new credit agreement also requires us to maintain certain financial and other covenants. We cannot assure you that we will be able to maintain compliance with such financial or other covenants. Our failure to comply with these covenants could result in an event of default which, if not cured or waived, could result in the acceleration of all of our indebtedness, which would materially adversely affect our financial health if we are unable to access sufficient funds to repay all the outstanding amounts. Moreover, if we are unable to meet our debt obligations as they come due, we could be forced to restructure or refinance such obligations, seek additional equity financing or sell assets, which we may not be able to do on satisfactory terms, or at all.
In addition, the credit agreement has certain mandatory prepayment provisions, including annual prepayments of excess cash flow above certain thresholds. As long as our indebtedness remains outstanding, the restrictive covenants and mandatory prepayment provisions could impair our ability to expand or pursue our business strategies or obtain additional funding.
Our dependence on our suppliers may prevent us from delivering an acceptable product on a timely basis.
We rely on both single-source and sole-source suppliers, some of whom are relatively small, for many of the components we use in our products. In addition, our customers often specify components of particular suppliers that we must incorporate into our products. Our suppliers are under no obligation to provide us with components. As a result, the loss of or failure to perform by any of these suppliers could adversely affect our business and operating results. In addition, the manufacturing of certain components and subsystems is a complex process. Therefore, if a supplier were unable to provide the volume of components we require on a timely basis and at acceptable prices and quality, we would have to identify and qualify replacements from alternative sources. However, the process of qualifying new suppliers for complex components is also lengthy and could delay our production, which would adversely affect our business, operating results and financial condition.
We may also experience difficulty in obtaining sufficient supplies of components and raw materials in times of significant growth in our business. For example, we have in the past experienced shortages in supplies of various components, such as mass flow controllers, valves and regulators, and certain prefabricated parts, such as sheet metal enclosures, used in the manufacture of our products. In addition, one of our competitors
14
Table of Contents
manufactures mass flow controllers that may be specified by one or more of our customers. If we are unable to obtain these particular mass flow controllers from our competitor or convince a customer to select alternative mass flow controllers, we may be unable to meet that customer’s requirements, which could result in a loss of market share.
If we, or our suppliers, are unable to procure sufficient quantities of components or raw materials from suppliers, it could influence decisions by our customers to delay or cancel orders and decisions by our vendors to fulfill our purchase orders and, consequently, have a material adverse effect on our results of operations.
We may not be able to respond quickly enough to changes in demand for our products.
Demand shifts in the industries we serve are rapid and difficult to predict, and we may not be able to anticipate or respond quickly enough to changes in demand. Our ability to increase sales of our products in periods of increasing demand depends, in part, upon our ability to:
| • | mobilize our supply chain in order to maintain component and raw material supply; |
| • | optimize the use of our design, engineering and manufacturing capacity in a timely manner; |
| • | deliver our products to our customers in a timely fashion; |
| • | expand, if necessary, our manufacturing capacity; and |
| • | maintain our product quality as we increase production. |
If we are unable to respond to rapid increases in demand for our products on a timely basis or to manage any corresponding expansion of our manufacturing capacity effectively, our customers could increase their purchases from our competitors, which would adversely affect our business.
Our ability to remain profitable and mitigate the impact on our business in periods of decreasing demand depends, in part, upon our ability to:
| • | optimize our inventory levels and reduce or cancel orders to our suppliers without compromising our relationships with such suppliers; |
| • | reduce our variable costs through a reduction of our manufacturing workforce; |
| • | continue to motivate our employees; and |
| • | maintain the prices, quality and delivery cycles of our products in order to retain our customers’ business. |
We may not be able to fund our future capital requirements or strategic acquisitions from our operations, and financing from other sources may not be available on favorable terms or at all.
We made capital expenditures of approximately $5.5 million in fiscal 2014 and $3.0 million in fiscal 2013 related to our manufacturing facilities in the United States, China and Singapore. In February 2015, we paid approximately $30.0 million and issued 1,437,500 shares of our common stock in connection with our acquisition of Marchi. The cash portion of the merger consideration was financed through the new credit facility described above; of which an aggregate of $76.2 million was outstanding as of February 28, 2015. The amount of our future capital requirements or strategic acquisitions will depend on many factors, including:
| • | the cost required to ensure access to adequate manufacturing capacity; |
| • | the timing and extent of spending to support product development efforts; |
| • | the timing of introductions of new products and enhancements to existing products; |
15
Table of Contents
| • | the cost required to complete AIT and Marchi’s enterprise resource planning implementation and to migrate AIT and its subsidiaries and Marchi to our enterprise resource planning system; |
| • | changing manufacturing capabilities to meet new customer requirements; |
| • | market acceptance of our products; and |
| • | our ability to identify appropriate acquisition opportunities and successfully negotiate the terms of such acquisitions. |
We had $79.0 million in cash and cash equivalents as of December 26, 2014 of which $57.9 million was held by our foreign subsidiaries. On February 5, 2015, after consummation of our acquisition of Marchi, the refinancing of our existing credit facility and payment of transaction expenses, we had $77.4 million in cash and cash equivalents and no amounts available under our new revolving credit facility for future borrowings. If the cash and cash equivalents held by our foreign subsidiaries is needed for our operations or to fund capital expenditures or other strategic acquisitions in the U.S., we would be required to accrue and pay U.S. taxes to repatriate these funds.
Given our significant existing leverage, limited availability under our new revolving line of credit and the potential tax effects of repatriating foreign cash or other factors, we may need to raise additional funds through public or private equity or debt financing if our current domestic cash and cash flow from operations are insufficient to fund our future activities. We may not be able to obtain additional debt financing when and if necessary in a timely manner. Access to capital markets has, in the past, been unavailable to companies such as ours and there can be no assurance that we would be able to complete an equity or other financing with terms satisfactory to us or at all. In addition, equity financings could be dilutive to holders of our common stock, and debt financings would likely involve additional covenants that restrict our business operations. Any potential strategic acquisition or significant capital expenditure may also require the consent of our existing lenders. If we cannot raise funds on acceptable terms, if and when needed, we may not be able to develop or enhance our products, take advantage of future opportunities, including potential acquisitions, grow our business or respond to competitive pressures or unanticipated requirements, any of which could adversely affect our business, operating results and financial condition.
Our quarterly revenue and operating results fluctuate significantly from period to period, and this may cause volatility in our common stock price.
Our quarterly revenue and operating results, including our gross margin, have fluctuated significantly in the past, and we expect them to continue to fluctuate in the future for a variety of reasons which may include:
| • | demand for and market acceptance of our products as a result of the cyclical nature of the industries we serve or otherwise, often resulting in reduced sales during industry downturns and increased sales during periods of industry recovery or growth; |
| • | overall economic conditions; |
| • | changes in the timing and size of orders by our customers; |
| • | loss of business from one or more significant customers due to strategic decisions by our customers to terminate their outsourcing relationship with us or give market share to our competitors, or due to decreased demand for our customers’ products by end customers; |
| • | strategic consolidation by our customers; |
| • | cancellations and postponements of previously placed orders; |
| • | pricing pressure from either our competitors or our customers, resulting in the reduction of our product prices, margins or loss of market share; |
16
Table of Contents
| • | disruptions or delays in the manufacturing of our products or in the supply of components or raw materials that are incorporated into or used to manufacture our products, thereby causing us to delay the shipment of products; |
| • | decreased margins for several or more quarters following the introduction of new products, especially as we introduce new subsystems; |
| • | delays in ramp-up in production, low yields or other problems experienced at our manufacturing facilities in China; |
| • | changes in design-to-delivery cycle times; |
| • | inability to reduce our costs quickly in step with reductions in our prices or in response to decreased demand for our products; |
| • | changes in our mix of products sold; |
| • | write-offs of excess or obsolete inventory due to a customer’s bankruptcy or insolvency; |
| • | one-time expenses or charges associated with failed acquisition negotiations or completed acquisitions; |
| • | inability to control our operating costs consistent with target levels; |
| • | announcements by our competitors of new products, services or technological innovations, which may, among other things, render our products less competitive; and |
| • | geographic mix of customer orders or worldwide earnings. |
As a result of the foregoing, we believe that quarter-to-quarter comparisons of our revenue and operating results may not be meaningful and that these comparisons may not be an accurate indicator of our future performance. Changes in the timing or terms of a small number of transactions could disproportionately affect our operating results in any particular quarter. Moreover, our operating results in one or more future quarters may fail to meet our guidance or the expectations of securities analysts or investors. If this occurs, we would expect to experience an immediate and significant decline in the trading price of our common stock.
We have established, and as markets will allow, intend to expand our operations in Asia, which exposes us to risks associated with operating in a foreign country.
We generated approximately 29.6% and 28.5% of our sales in international markets for fiscal 2014 and 2013, respectively. Depending on market conditions, we intend to expand our operations in Asia, principally in China and Singapore. In addition, through our acquisition of AIT, we acquired a manufacturing facility in Cebu, Philippines. The carrying amount of our fixed assets in Asia was $5.8 million as of December 26, 2014.
We are exposed to political, economic, legal and other risks associated with operating in Asia, including:
| • | foreign currency exchange fluctuations; |
| • | political, civil and economic instability; |
| • | tariffs and other barriers; |
| • | timing and availability of export licenses; |
| • | disruptions to our and our customers’ operations due to increased risk of outbreak of diseases, such as SARS and avian flu; |
| • | disruptions in operations due to China’s developing domestic infrastructure, including transportation and energy; |
17
Table of Contents
| • | difficulties in developing relationships with local suppliers; |
| • | difficulties in attracting new international customers; |
| • | difficulties in accounts receivable collections; |
| • | difficulties in staffing and managing distant international subsidiary and branch operations; |
| • | the burden of complying with foreign and international laws and treaties; |
| • | legal systems potentially subject to undue influence or corruption; |
| • | difficulties in transferring funds to other geographic locations; and |
| • | potentially adverse tax consequences, including restrictions on the repatriation of earnings to the United States. |
In addition, due to generally lower labor and materials costs in the Asian markets in which we currently operate, a shift in the mix of orders from our customers away from such Asian markets could adversely affect our operating margins.
Our operations in Asia are also subject us to U.S. laws governing the export of equipment. These laws are complex and require us to obtain clearances for the export to Asia of certain equipment. We may fail to comply with these laws and regulations, which could require us to cease the export of certain equipment and expose us to fines or penalties.
Over the past several years, the Chinese government has pursued economic reform policies, including the encouragement of private economic activity and greater economic decentralization. The Chinese government may not continue these policies or may significantly alter them to our detriment from time to time without notice. Changes in laws and regulations or their interpretation, the imposition of confiscatory taxation policies, new restrictions on currency conversion or limitations on sources of supply could materially and adversely affect our Chinese operations, which could result in the partial or total loss of our investment in that country and materially and adversely affect our future operating results.
We are subject to order and shipment uncertainties and any significant reductions, cancellations or delays in customer orders could cause our revenue to decline and our operating results to suffer.
Our revenue is difficult to forecast because we generally do not have a material backlog of unfilled orders and because of the short time frame within which we are often required to design, produce and deliver products to our customers. Most of our revenue in any quarter depends on customer orders for our products that we receive and fulfill in the same quarter. We do not have long-term purchase orders or contracts that contain minimum purchase commitments from our customers. Instead, we receive non-binding forecasts of the future volume of orders from our customers. Occasionally, we order and build component inventory in advance of the receipt of actual customer orders. Customers may cancel order forecasts, change production quantities from forecasted volumes or delay production for reasons beyond our control. Furthermore, reductions, cancellations or delays in customer order forecasts, which may occur for various reasons, including reduced demand for our customer’s products, customer bankruptcies or customer insolvency, usually occur without penalty to, or compensation from, the customer. Reductions, cancellations or delays in forecasted orders could cause us to hold inventory longer than anticipated, which could reduce our gross profit, restrict our ability to fund our operations and cause us to incur unanticipated reductions or delays in revenue. Moreover, most of the products we manufacture are custom built for our customers and are therefore not fungible with products we sell to other customers. If we do not obtain orders as we anticipate, we could have excess component inventory for a specific product that we would not be able to sell to another customer, likely resulting in inventory write-offs, which could have a material adverse effect on our business, financial condition and operating results. In addition, because many of our costs are fixed in the short term, we could experience deterioration in our gross profit and operating margins when our production volumes decline.
18
Table of Contents
The manufacturing of our products is highly complex, and if we are not able to manage our manufacturing and procurement process effectively, our business and operating results will suffer.
The manufacturing of our products is a highly complex process that involves the integration of multiple components and requires effective management of our supply chain while meeting our customers’ design-to-delivery cycle time requirements. Through the course of the manufacturing process, our customers may modify design and system configurations in response to changes in their own customers’ requirements. In order to rapidly respond to these modifications and deliver our products to our customers in a timely manner, we must effectively manage our manufacturing and procurement process. If we fail to manage this process effectively, we risk losing customers and damaging our reputation. We may also be subject to liability under our agreements with our customers if we or our suppliers fail to re-configure manufacturing processes or components in response to these modifications, which may lead to product defect claims by our customers. In addition, if we acquire inventory in excess of demand or that does not meet customer specifications, we could incur excess or obsolete inventory charges. These risks are even greater during the current extended period of macroeconomic uncertainty, and as we continue to expand our business beyond gas delivery systems into new subsystems. In the current economic environment, certain of our suppliers may be forced out of business, which could require us to either procure products from higher-cost suppliers or, if no additional suppliers exist, reconfigure the design and manufacture of our products. This could limit our growth and have a material adverse effect on our business, financial condition and operating results.
If our new products are not accepted by OEMs or other customers or if we are unable to obtain historical margins on our new products, our operating results would be adversely impacted.
We design, develop and market critical systems and subsystems to OEMs and other customers. The introduction of new products is inherently risky because it is difficult to foresee the adoption of new standards, coordinate our technical personnel and strategic relationships and win acceptance of new products by OEMs and other customers. We may not be able to recoup design and development expenditures if our new products are not accepted by OEMs or other customers. Newly introduced products typically carry lower gross margins than existing products for several or more quarters following their introduction. If any of our new systems or subsystems are not successful in the market, or if we are unable to obtain gross margins on new products that are similar to the gross margins we have historically achieved, our business, operating results and financial condition could be adversely affected.
Interruption or failure of our information technology and communications systems could impair our ability to effectively deliver our products, which could cause us to lose customers and harm our results of operations.
The manufacture and delivery of our products depends on the continuing operation of our technology infrastructure and systems, particularly our data center located in California. Any damage to or failure of our systems could result in interruptions in our ability to manufacture or deliver products on agreed upon lead times, or at all, on a local or worldwide basis. Interruptions could reduce our sales and profits, and our reputation could be damaged if people believe our systems are unreliable. Our systems and operations are vulnerable to damage or interruption from earthquakes, terrorist attacks, floods, fires, power loss, break-ins, hardware or software failures, telecommunications failures, computer viruses or other attempts to harm our systems, and similar events. The critical components of the system are not redundant and we currently do not have a backup data center. Accordingly, while we are in the process of creating a backup data center outside California which is estimated to be completed in the second quarter of 2015, the risk associated with earthquakes, fire, power loss, telecommunications failure, and other events beyond our control is heightened.
Any unscheduled interruption in our manufacturing or deliveries would result in an immediate loss of sales and could have a material adverse effect on our results of operation and financial position. If we experience frequent or persistent system failures, the attractiveness of our products to customers could be permanently harmed. Any steps we take to increase the reliability and redundancy of our systems may be expensive, reduce
19
Table of Contents
our operating margin and may not be successful in reducing the frequency or duration of unscheduled interruptions.
Acquisitions could result in operating and integration difficulties, dilution, margin deterioration and other consequences that may adversely impact our business and results of operations.
We have made, and may in the future make, acquisitions of, or significant investments in, businesses that offer complementary products, services, technologies or market access. We expect that management will evaluate potential strategic transactions regularly with its advisors and our board of directors in the ordinary course of business. We may not be successful in negotiating the terms of potential acquisitions or financing potential acquisitions, and our due diligence may fail to identify all of the problems, liabilities or other challenges associated with an acquired business, product or technology, including issues related to intellectual property, product quality or product architecture, regulatory compliance practices, revenue recognition or other accounting practices or employee or customer retention issues. In addition, we may not be successful in effectively integrating the acquired business, product or technology into our existing business and operations. The areas where we face risks include:
| • | Management of the larger, more complex, combined business, including integrating supply and distribution channels, computer and accounting systems, and other aspects of operations; |
| • | Deterioration of gross margins due to the acquisition of the same customer base resulting in reduced pricing leverage; |
| • | Integration of the capabilities of the acquired businesses while maintaining focus on providing consistently high quality products; |
| • | Incorporation of different financial and reporting controls, processes, systems and technologies into our existing business environment; |
| • | Unknown liabilities and unforeseen expenses, delays or regulatory conditions associated with the acquisitions for which we do not have recourse under their respective agreements; |
| • | Performance shortfalls as a result of the diversion of management’s attention from the companies’ operations; |
| • | Cultural challenges associated with integrating employees from the acquired business into our organization, and retention of employees from the businesses we acquire; |
| • | Retention of customers and partners of acquired business; and/or |
| • | Difficulties associated with the transition of customers into our existing business. |
Our failure to address these risks or other problems encountered in connection with our past or future acquisitions and investments could cause us to fail to realize the anticipated benefits of such acquisitions or investments, incur unanticipated liabilities and substantial costs, and materially harm our business generally.
Our acquisitions could also result in dilutive issuances of our equity securities, the incurrence of debt, contingent liabilities, or amortization expenses, impairment charges and restructuring charges, any of which could harm our financial condition or results. Also, the anticipated benefits or value of our acquisitions or investments may not materialize. Even if an acquisition or other investment is not completed, we may incur significant management time and effort and financial cost in evaluating such acquisition or investment, which could have an adverse effect on our results of operations. Furthermore, due to limited liquidity in the credit market and our existing leverage, the financing of any such acquisition may be difficult to obtain, and the terms of such financing may not be favorable.
20
Table of Contents
If we were required to write down all or part of our goodwill, our net income and net worth could be materially adversely affected.
We had $55.9 million of goodwill recorded on our consolidated balance sheet as of December 26, 2014. This amount is likely to increase with our acquisition of Marchi in February 2015. Goodwill represents the excess of cost over the fair market value of net tangible and finite lived, identifiable intangible assets acquired in business combinations. If our market capitalization drops significantly below the amount of net equity recorded on our balance sheet, it could indicate a decline in our value and would require us to further evaluate whether our goodwill has been impaired. During the fourth quarter of each year, we perform an annual review of our goodwill to determine if it has become impaired, in which case we would write down the impaired portion of our goodwill. We also evaluate goodwill for impairment whenever events or changes in circumstances indicate that the carrying amount may not be recoverable. If we were required to write down all or a significant part of our goodwill, our financial results and net worth could be materially adversely affected.
Our business is largely dependent on the know-how of our employees, and we generally do not have an intellectual property position that is protected by patents.
Our business is largely dependent upon our design, engineering, manufacturing and testing know-how. We rely on a combination of trade secrets and contractual confidentiality provisions and, to a much lesser extent, patents, copyrights and trademarks to protect our proprietary rights. Accordingly, our intellectual property position is more vulnerable than it would be if it were protected primarily by patents. If we fail to protect our proprietary rights successfully, our competitive position could suffer, which could harm our operating results. We may be required to spend significant resources to monitor and protect our proprietary rights, and, in the event infringement or breach of our proprietary rights occurs, our competitive position in the market may be harmed. In addition, competitors may design around our technology or develop competing technologies and know-how. Further, since our customers generally own the designs and other intellectual property to the products we manufacture, we cannot prevent them from licensing such designs and other intellectual property to our competitors for the manufacture of such products.
Third parties have claimed and may in the future claim we are infringing their intellectual property, which could subject us to litigation or licensing expenses, and we may be prevented from selling our products if any such claims prove successful.
We have in the past and may in the future receive claims that our products, processes or technologies infringe the patents or other proprietary rights of third parties. In addition, we may be unaware of intellectual property rights of others that may be applicable to our products. Any litigation regarding our patents or other intellectual property could be costly and time-consuming and divert our management and key personnel from our business operations, any of which could have a material adverse effect on our business and results of operations. The complexity of the technology involved in our products and the uncertainty of intellectual property litigation increase these risks. Claims of intellectual property infringement may also require us to enter into costly license agreements. However, we may not be able to obtain licenses on terms acceptable to us, or at all. We also may be subject to significant damages or injunctions against the development, manufacture and sale of certain of our products if any such claims prove successful. We also rely on design specifications and other intellectual property of our customers in the manufacture of products for such customers. While our customer agreements generally provide for indemnification of us by our customers if we are subjected to litigation for third-party claims of infringement of such customer intellectual property, such indemnification provisions may not be sufficient to fully protect us from such claims, or our customers may breach such indemnification obligations to us, which could result in costly litigation to defend against such claims or enforce our contractual rights to such indemnification.
21
Table of Contents
If we do not keep pace with developments in the industries we serve and with technological innovation generally, our products may not be competitive.
Rapid technological innovation in the markets we serve requires us to anticipate and respond quickly to evolving customer requirements and could render our current product offerings and technology obsolete. Technological innovations are inherently complex. We must devote resources to technology development in order to keep pace with such rapidly evolving technologies. We believe that our future success will depend upon our ability to design, engineer and manufacture products that meet the changing needs of our customers. This requires that we successfully anticipate and respond to technological changes in design, engineering and manufacturing processes in a cost-effective and timely manner. If we are unable to integrate new technical specifications into competitive product designs, develop the technical capabilities necessary to manufacture new products or make necessary modifications or enhancements to existing products, our business prospects could be harmed.
The timely development of new or enhanced products is a complex and uncertain process which requires that we:
| • | design innovative and performance-enhancing features that differentiate our products from those of our competitors; |
| • | identify emerging technological trends in the industries we serve, including new standards for our products; |
| • | accurately identify and design new products to meet market needs; |
| • | collaborate with OEMs to design and develop products on a timely and cost-effective basis; |
| • | ramp-up production of new products, especially new subsystems, in a timely manner and with acceptable yields at acceptable costs; |
| • | successfully manage development production cycles; and |
| • | respond effectively to technological changes or product announcements by others. |
If we are unsuccessful in keeping pace with technological developments for the reasons above or other reasons, our business prospects, results of operations and financial condition could be materially and adversely affected.
The industries in which we participate are highly competitive and rapidly evolving, and if we are unable to compete effectively, our operating results will be harmed.
We face intense competition from subsystem and component manufacturers in the industries we serve. Increased competition has in the past resulted, and could in the future result, in price reductions, reduced gross margins or loss of market share, any of which would harm our operating results. We are subject to significant pricing pressure as we attempt to maintain and increase market share with our existing customers. Competitors may offer reduced prices or introduce new products for the markets currently served by our products. These products may have better performance, lower prices and achieve broader market acceptance than our products. Further, OEMs typically own the design rights to their products and may provide these designs to other subsystem manufacturers. If our competitors obtain proprietary rights to these designs such that we are unable to obtain the designs necessary to manufacture products for our OEM customers, our business, financial condition and operating results could be adversely affected.
Our competitors may have greater financial, technical, manufacturing and marketing resources than we do. As a result, they may be able to respond more quickly to new or emerging technologies and changes in customer requirements, devote greater resources to the development, promotion, sale and support of their products, and reduce prices to increase market share. Moreover, there may be merger and acquisition activity among our
22
Table of Contents
competitors and potential competitors that may provide our competitors and potential competitors an advantage over us by enabling them to expand their product offerings and service capabilities to meet a broader range of customer needs. Further, if one of our customers develops or acquires the internal capability to develop and produce critical systems or subsystems that we produce, the loss of that customer could have a material adverse effect on our business, financial condition and operating results. The introduction of new technologies and new market entrants may also increase competitive pressures.
We must achieve design wins to retain our existing customers and to obtain new customers.
New capital equipment typically has a lifespan of several years, and OEMs frequently specify which systems, subsystems, components and instruments are to be used in their equipment. Once a specific system, subsystem, component or instrument is incorporated into a piece of capital equipment, it will likely continue to be incorporated into that piece of equipment for at least several months before the OEM would be in a position to switch to the product of another supplier. Accordingly, it is important that our products are designed into the new capital equipment of OEMs, which we refer to as a design win, in order to retain our competitive position with existing customers and to obtain new customers.
We incur technology development and sales expenses with no assurance that our products will ultimately be designed into an OEM’s capital equipment. Further, developing new customer relationships, as well as maintaining and increasing our market share at existing customers, requires a substantial investment of our sales, engineering and management resources without any assurance from prospective customers that they will place significant orders. We believe that OEMs often consider long-term relationships in selecting and placing orders with suppliers. Accordingly, we may have difficulty achieving design wins from OEMs that are not currently our customers. Our operating results and potential growth could be adversely affected if we fail to achieve design wins with leading OEMs.
Defects in our products could damage our reputation, decrease market acceptance of our products, cause the unintended release of hazardous materials and result in potentially costly litigation or indemnification liability.
A number of factors, including design flaws, material and component failures, workmanship issues, contamination in the manufacturing environment, impurities in the materials used and unknown sensitivities to process conditions, such as temperature and humidity, as well as equipment failures, may cause our products to contain undetected errors or defects. Problems with our products may:
| • | cause delays in product introductions and shipments for us or our customers; |
| • | result in increased costs and diversion of development resources; |
| • | cause us to incur increased charges due to unusable inventory; |
| • | require design modifications; |
| • | result in liability for the unintended release of hazardous materials or other damages to our or our customers’ property; |
| • | create claims for rework, replacement and/or damages under our contracts with customers, as well as indemnification claims from customers; |
| • | decrease market acceptance of, or customer satisfaction with, our products, which could result in decreased sales and product returns; or |
| • | result in lower yields for semiconductor manufacturers. |
If any of our products contain defects or have reliability, quality or compatibility problems, our reputation might be damaged and customers might be reluctant to buy our products. We may also face a higher rate of
23
Table of Contents
product defects as we increase our production levels. Product defects could result in warranty and indemnification liability, the loss of existing customers or impair our ability to attract new customers. In addition, we may not find defects or failures in our products until after they are installed in a manufacturer’s fabrication facility. We may have to invest significant capital and other resources to correct these problems. Our current or potential customers also might seek to recover from us any losses resulting from defects or failures in our products. Hazardous materials flow through and are controlled by our products and an unintended release of these materials could result in serious injury or death. Liability claims could require us to spend significant time and money in litigation or pay significant damages or indemnification claims.
The technology labor market is very competitive, and our business will suffer if we are unable to hire and retain key personnel.
Our future success depends in part on the continued service of our key executive officers, as well as our research, engineering, sales, manufacturing and administrative personnel, most of whom are not subject to employment or non-competition agreements. In addition, competition for qualified personnel in the technology industry is intense, and we operate in geographic locations in which labor markets are particularly competitive.
Our business is particularly dependent on expertise which only a limited number of engineers possess. The loss of any of our key employees and officers, including our Chief Executive Officer (CEO), our Chief Financial Officer, any of our Senior Vice Presidents or any of the senior managers, or the failure to attract and retain new qualified employees, could adversely affect our business, operating results and financial condition. Further, our Chairman and Chief Executive Officer, Clarence L. Granger retired as our CEO effective January 19, 2015. If our transition of Mr. Granger’s roles and responsibilities to our new CEO, James P Scholhamer is not successful, our business, financial results and financial position could be materially adversely affected.
The challenges of employee retention has also increased during the integration process with AIT because of the necessity of combining personnel with varied business backgrounds and combining different corporate cultures and objectives, and several AIT employees, including members of AIT’s senior management, have left our company. The process of integrating operations and making such adjustments could cause an interruption of, or loss of momentum in, the activities of one or more of our businesses and the loss of key personnel. Employee uncertainty, lack of focus or turnover during the integration process may also disrupt our businesses. We may experience similar challenges with the integration of Marchi’s employees and business.
If we fail to maintain an effective system of internal controls, we might not be able to report our financial results accurately or prevent fraud; in that case, our stockholders could lose confidence in our financial reporting, which would harm our business and could negatively impact the price of our stock.
Effective internal controls are necessary for us to provide reliable financial reports and prevent fraud. In addition, Section 404 of the Sarbanes-Oxley Act of 2002 requires us and our independent registered public accounting firm to evaluate and report on our internal control over financial reporting. The process of designing, implementing, maintaining and updating our internal controls and complying with Section 404 is expensive and time consuming, and requires significant attention from management and company resources. In addition, beginning in fiscal year 2013, we were required to evaluate and report on AIT’s internal controls and the attestation report we are required to obtain from our independent registered public accounting firm must include AIT’s internal control over financial reporting. Integrating AIT’s internal control framework into the Company and upgrading AIT’s controls to comply with the Sarbanes-Oxley Act has required substantial resources, and we cannot assure you that we will be able to successfully or effectively maintain adequate controls over our financial processes at AIT or for our consolidated business. In addition, even though we have concluded, and our independent registered public accounting firm has concurred, that our internal control over financial reporting provides reasonable assurance regarding the reliability of financial reporting and the preparation of financial statements for external purposes in accordance with generally accepted accounting principles as of December 26, 2014, because of its inherent limitations, internal control over financial reporting may not prevent or detect fraud
24
Table of Contents
or misstatements, and our internal control may not be effective as of future periods. Failure to maintain existing or implement new or improved controls, or difficulties encountered in their implementation, could harm our results of operations or cause us to fail to meet our reporting obligations. If we or our independent registered public accounting firm discover a material weakness, the disclosure of that fact, even if quickly remedied, could reduce the market’s confidence in our financial statements and harm our stock price.
Fluctuations in currency exchange rates may adversely affect our financial condition and results of operations.
Our international sales are denominated primarily, though not entirely, in U.S. dollars. Many of the costs and expenses associated with our Chinese subsidiaries and Singapore subsidiary are paid in Chinese Renminbi and Singapore dollars, respectively, and we expect our exposure to Chinese Renminbi and Singapore dollars to increase as we increase production in those facilities. In addition, purchases of some of our components are denominated in Japanese Yen and Euros. Changes in exchange rates among other currencies in which our revenue or costs are denominated and the U.S. dollar may affect our revenue, cost of sales and operating margins. While fluctuations in the value of our revenue, cost of sales and operating margins as measured in U.S. dollars have not materially affected our results of operations historically, we do not currently hedge our foreign exchange exposure, and exchange rate fluctuations could have an adverse effect on our financial condition and results of operations in the future.
If environmental contamination were to occur in one of our manufacturing facilities, we could be subject to substantial liabilities.
We use substances regulated under various foreign, domestic, federal, state and local environmental laws in our manufacturing facilities. In addition, we may not be aware of or in compliance with all environmental laws or regulations that could subject us to liability in the U.S. or internationally. Our failure or inability to comply with existing or future environmental laws could result in significant remediation liabilities, the imposition of fines or the suspension or termination of the production of our products, and thus a material adverse impact on our business.
Our business is subject to the risks of earthquakes, fire, power outages, floods, and other catastrophic events, and to interruption by man-made disruptions, such as terrorism.
Our facilities could be subject to a catastrophic loss caused by natural disasters, including fires and earthquakes. We have facilities in areas with above average seismic activity, such as our manufacturing facility in South San Francisco, California and our manufacturing and headquarters facilities in Hayward, California. If any of our facilities were to experience a catastrophic loss, it could disrupt our operations, delay production and shipments, reduce revenue and result in large expenses to repair or replace the facility. In addition, we have in the past experienced, and may in the future experience, extended power outages at our facilities. We do not carry insurance policies that cover potential losses caused by earthquakes or other natural disasters or power loss.
In addition, disruption in supply resulting from natural disasters or other causalities or catastrophic events, such as earthquakes, severe weather such as storms or floods, fires, labor disruptions, power outages, terrorist attacks or political unrest, may result in certain of our suppliers being unable to deliver sufficient quantities of components or raw materials at all or in a timely manner, disruptions in our operations or disruptions in our customers’ operations. For example, in 2011, the northern region of Japan experienced a severe earthquake followed by a tsunami. These geological events caused significant damage in that region and adversely affected Japan’s infrastructure and economy. Some of our suppliers are located in Japan and they have experienced, and may experience in the future, shutdowns or disruptions as a result of these types of events, and their operations may be negatively impacted by these events. Many of our customers and suppliers are also located in California, and may be subject to the same risk of seismic activity as described for us above.
25
Table of Contents
To the extent that natural disasters or other calamities or causalities should result in delays or cancellations of customer orders, or the delay in the manufacture or shipment of our products or services, our business, financial condition and operating results would be adversely affected.
Changes in tax rates or tax assets and liabilities could affect results of operations.
As a global company, we are subject to taxation in the United States and various other countries. Significant judgment is required to determine and estimate worldwide tax liabilities. Our future annual and quarterly tax rates could be affected by numerous factors, including changes in the: (1) applicable tax laws; (2) amount and composition of pre-tax income in countries with differing tax rates; or (3) valuation of our deferred tax assets and liabilities.
In addition, we are subject to regular examination by the Internal Revenue Service and other tax authorities, and from time to time we initiate amendments to previously filed tax returns. We regularly assess the likelihood of favorable or unfavorable outcomes resulting from these examinations and amendments to determine the adequacy of our provision for income taxes, which requires estimates and judgments. Although we believe our tax estimates are reasonable, there can be no assurance that the tax authorities will agree with such estimates. We may have to engage in litigation to achieve the results reflected in the estimates, which may be time-consuming and expensive. There can be no assurance that we will be successful or that any final determination will not be materially different from the treatment reflected in our historical income tax provisions and accruals, which could materially and adversely affect our financial condition and results of operations.
We are currently enjoying a zero rate tax holiday in Singapore that is scheduled to expire at the end of fiscal year 2015. This tax rate is subject to achieving certain commitments agreed to with the Singapore tax authorities, including investment and employment thresholds, and our tax rate could be significantly affected if we are unable to meet these commitments or if we are unable to favorably renegotiate the commitment requirements.
The market for our stock is subject to significant fluctuation.
The size of our public market capitalization is relatively small, and the average volume of our shares that are traded is relatively low. The market price of our common stock could be subject to significant fluctuations. Among the factors that could affect our stock price are:
| • | quarterly variations in our operating results; |
| • | our ability to successfully introduce new products and manage new product transitions; |
| • | changes in revenue or earnings estimates or publication of research reports by analysts; |
| • | speculation in the press or investment community; |
| • | strategic actions by us, our customers or our competitors, such as acquisitions or restructurings; |
| • | announcements relating to any of our key customers, significant suppliers or the semiconductor manufacturing and capital equipment industry generally; |
| • | general market conditions; |
| • | the effects of war and terrorist attacks; and |
| • | domestic and international economic factors unrelated to our performance. |
The stock markets in general, and the markets for technology stocks in particular, have experienced extreme volatility that has often been unrelated to the operating performance of particular companies. These broad market fluctuations may adversely affect the trading price of our common stock.
26
Table of Contents
New regulations related to conflict minerals could adversely impact our business.
The Dodd-Frank Wall Street Reform and Consumer Protection Act contains provisions to improve transparency and accountability concerning the supply of certain minerals, known as conflict minerals, originating from the Democratic Republic of Congo (DRC) and adjoining countries. As a result, in August 2012 the SEC adopted annual disclosure and reporting requirements for those companies who use conflict minerals mined from the DRC and adjoining countries in their products. These new requirements will require us to perform on-going due diligence efforts on our supply chain and require public disclosure of the nature and results of these efforts. There will be costs associated with complying with these disclosure requirements to determine the sources of conflict minerals used in our products and other potential changes to products, processes or sources of supply as a consequence of such verification activities. Complying with these rules could adversely affect the sourcing, supply and pricing of materials used in our products and result in substantial additional costs. As there may be only a limited number of suppliers offering “conflict free” conflict minerals, we cannot be sure that we will be able to obtain necessary conflict minerals from such suppliers in sufficient quantities or at competitive prices. Also, we may face reputational challenges if we determine that certain of our products contain minerals not determined to be conflict free or if we are unable to sufficiently verify the origins for all conflict minerals used in our products through the procedures we may implement. In addition, if we are unable to comply with these rules, we could be subject to enforcement actions by the Securities and Exchange Commission and liability under the Securities Exchange Act of 1934, as amended, which could result in material adverse consequences to our business, as well as significant fines and penalties.
If securities or industry analysts do not publish research or reports about our business, or if they issue an adverse opinion regarding our stock, our stock price and trading volume could decline.
The trading market for our common stock is influenced by the research and reports that industry or securities analysts publish about us or our business. If any of the analysts who cover us issue an adverse opinion regarding our stock, our stock price would likely decline. If one or more of these analysts ceases coverage of our company or fails to publish reports on us regularly, we could lose visibility in the financial markets, which in turn could cause our stock price or trading volume to decline.
We do not currently intend to pay dividends on our common stock and, consequently, your ability to achieve a return on your investment will depend on appreciation in the price of our common stock.
We do not intend to declare and pay dividends on our capital stock for the foreseeable future. We currently intend to invest our future earnings, if any, to fund our growth. Additionally, the terms of the credit agreements we entered into in July 2012 and in February 2015 restrict our ability to pay dividends. Therefore, you are not likely to receive any dividends on your common stock for the foreseeable future.
| Item 1B. | Unresolved Staff Comments |
None.
| Item 2. | Properties |
Our headquarters is located in a 104,000 square foot facility in Hayward, California. This is our principal administrative, sales and support, engineering and technology development and manufacturing facility. This lease expires in 2022. We also have manufacturing and engineering facilities in South San Francisco and Fremont, California, and Austin, Texas. In South San Francisco we lease approximately 72,000 square feet under several leases which expire in 2018. In Fremont, we lease approximately 9,000 square feet under a lease that expires in 2015. In Austin, we lease an aggregate of approximately 56,400 square feet of commercial space under leases that expire in August 2016 with extension provisions. Approximately 14,400 square feet in Austin is a clean room manufacturing facility. We also have manufacturing facilities in Pflugerville, Texas, Chandler,
27
Table of Contents
Arizona, Shanghai, China, Singapore, and the Philippines. In Pflugerville, we lease 30,500 square feet under a lease that expires in June 2018. In Arizona, we lease approximately 120,000 square feet under leases that mostly expire in September 2017. In Shanghai, we lease approximately 132,000 square feet of commercial space under two leases which expire in 2016. Approximately 37,200 square feet of this space is a clean room facility. In Singapore, we lease approximately 8,200 square feet under two leases that expire in 2017 and 2020 with extension provisions. In the Philippines, we lease approximately 16,000 square feet under leases that expire in 2016.
The table below lists our properties as of March 8, 2015:
| Location |
Principal Use |
Square Footage | Ownership | |||||||
| Hayward, California |
Headquarters, manufacturing, sales, engineering, technology development | 104,000 | Leased | |||||||
| South San Francisco, California |
Manufacturing, engineering | 72,000 | Leased | (1) | ||||||
| Fremont, California |
Manufacturing, engineering | 9,000 | Leased | |||||||
| Austin, Texas |
Manufacturing, engineering | 56,400 | Leased | |||||||
| Pflugerville, Texas |
Manufacturing | 30,500 | Leased | |||||||
| Chandler, Arizona |
Manufacturing | 120,000 | Leased | (2) | ||||||
| Cebu, Philippines |
Manufacturing | 16,000 | Leased | |||||||
| Singapore |
Manufacturing, customer support | 8,200 | Leased | (3) | ||||||
| Shanghai, China |
Manufacturing | 132,000 | Leased | |||||||
| (1) | We lease this facility from an entity controlled by one of our directors. We incurred rent expense resulting from the lease of this facility of $0.3 million for each of fiscal years 2014 and 2013. |
| (2) | Consists of seven separate properties under seven separate leases. |
| (3) | Consists of two spaces in one building under the same lessor. |
| Item 3. | Legal Proceedings |
From time to time, we are subject to various legal proceedings and claims, either asserted or unasserted, that arise in the ordinary course of business. Although the outcome of the various legal proceedings and claims cannot be predicted with certainty, we have not had a history of outcomes to date that have been material to our statement of operations and do not believe that any of these proceedings or other claims will have a material adverse effect on our consolidated financial condition or results of operations.
| Item 4. | Mine Safety Disclosures |
Not applicable.
28
Table of Contents
PART II
| Item 5. | Market for Registrant’s Common Equity, Related Stockholder Matters, and Issuer Purchases of Equity Securities |
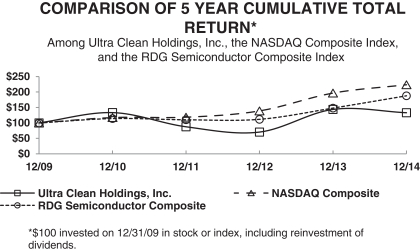
Our common stock has been traded on the NASDAQ Global Market under the symbol “UCTT” since March 25, 2004. The following table sets forth for the periods indicated the high and low sales prices per share of our common stock as reported by the NASDAQ Global Market:
| High | Low | |||||||
| Fiscal year 2013 |
||||||||
| First quarter |
$ | 6.57 | $ | 4.58 | ||||
| Second quarter |
$ | 6.45 | $ | 4.52 | ||||
| Third quarter |
$ | 7.11 | $ | 6.00 | ||||
| Fourth quarter |
$ | 10.66 | $ | 6.53 | ||||
| Fiscal year 2014 |
||||||||
| First quarter |
$ | 15.00 | $ | 9.51 | ||||
| Second quarter |
$ | 13.89 | $ | 7.62 | ||||
| Third quarter |
$ | 10.29 | $ | 8.58 | ||||
| Fourth quarter |
$ | 9.51 | $ | 7.32 | ||||
To date, we have not declared or paid cash dividends to our stockholders and we do not intend to do so for the foreseeable future in order to retain earnings for use in our business. Our credit facility also limits our ability to pay dividends. As of February 27, 2015, we had four stockholders of record. As of March 5, 2015, our closing stock price on the NASDAQ Global Market was $8.31.
Unregistered Sales of Equity Securities
On February 5, 2015, we entered into an Asset Purchase Agreement (the “Purchase Agreement”) in connection with the acquisition of substantially all of the assets of Marchi. Upon completion of the acquisition on February 5, 2015 and pursuant to the Purchase Agreement, we issued 1,437,500 shares of our common stock to Marchi as part of the consideration we gave to Marchi in connection with the acquisition. The shares were issued in a private placement in reliance on the exemption from registration pursuant to Section 4(a)(2) of the Securities Act of 1933, as amended. No general solicitation was involved in connection with the offer and sale of such shares, and we relied upon the representations made by Marchi pursuant to the Purchase Agreement in determining that such exemption was available.
29
Table of Contents
| Item 6. | Selected Consolidated Financial Data |
You should read the following tables in conjunction with other information contained under “Management’s Discussion and Analysis of Financial Condition and Results of Operations,” our consolidated financial statements and related notes and other financial information contained elsewhere in this Annual Report on Form 10-K.
Statements of Operations Data (in thousands, except per share amounts):
| Years Ended | ||||||||||||||||||||
| 12/26/2014 | 12/27/2013 | 12/28/2012* | 12/30/2011 | 12/31/2010 | ||||||||||||||||
| Consolidated Statements of Operations Data: |
||||||||||||||||||||
| Sales |
$ | 513,957 | $ | 444,022 | $ | 403,430 | $ | 452,639 | $ | 443,134 | ||||||||||
| Cost of goods sold |
440,824 | 376,693 | 347,642 | 393,647 | 383,993 | |||||||||||||||
|
|
|
|
|
|
|
|
|
|
|
|||||||||||
| Gross profit |
73,133 | 67,329 | 55,788 | 58,992 | 59,141 | |||||||||||||||
| Operating expenses, excluding acquisition costs |
54,949 | 51,421 | 45,012 | 35,446 | 33,664 | |||||||||||||||
| Acquisition costs |
— | — | 2,431 | — | — | |||||||||||||||
|
|
|
|
|
|
|
|
|
|
|
|||||||||||
| Income from operations |
18,184 | 15,908 | 8,345 | 23,546 | 25,477 | |||||||||||||||
|
|
|
|
|
|
|
|
|
|
|
|||||||||||
| Interest and other income (expense), net |
(1,854 | ) | (3,309 | ) | (1,648 | ) | (1,106 | ) | (667 | ) | ||||||||||
|
|
|
|
|
|
|
|
|
|
|
|||||||||||
| Income before income taxes |
16,330 | 12,599 | 6,697 | 22,440 | 24,810 | |||||||||||||||
| Income tax provision (benefit) |
4,973 | 2,175 | 1,544 | (1,294 | ) | 4,713 | ||||||||||||||
|
|
|
|
|
|
|
|
|
|
|
|||||||||||
| Net income |
$ | 11,357 | $ | 10,424 | $ | 5,153 | $ | 23,734 | $ | 20,097 | ||||||||||
|
|
|
|
|
|
|
|
|
|
|
|||||||||||
| Net income per share: |
||||||||||||||||||||
| Basic |
$ | 0.39 | $ | 0.37 | $ | 0.20 | $ | 1.05 | $ | 0.92 | ||||||||||
| Diluted |
$ | 0.38 | $ | 0.36 | $ | 0.20 | $ | 1.01 | $ | 0.87 | ||||||||||
| Shares used in computation: |
||||||||||||||||||||
| Basic |
29,301 | 28,346 | 25,698 | 22,689 | 21,799 | |||||||||||||||
| Diluted |
29,936 | 29,037 | 26,261 | 23,437 | 22,975 | |||||||||||||||
Consolidated Balance Sheet Data (in thousands):
| 12/26/2014 | 12/27/2013 | 12/28/2012* | 12/30/2011 | 12/31/2010 | ||||||||||||||||
| Cash & cash equivalents |
$ | 78,997 | $ | 60,415 | $ | 54,311 | $ | 52,155 | $ | 34,654 | ||||||||||
| Working capital |
142,279 | 100,415 | 85,883 | 117,378 | 96,745 | |||||||||||||||
| Total assets |
296,142 | 292,543 | 265,929 | 178,299 | 170,385 | |||||||||||||||
| Bank borrowings and long-term debt |
48,155 | 55,126 | 75,640 | 24,733 | 28,652 | |||||||||||||||
| Short-and long-term rent obligations |
2,948 | 3,302 | 2,818 | 3,223 | 3,993 | |||||||||||||||
| Total stockholders’ equity |
188,552 | 171,929 | 156,780 | 117,285 | 87,509 | |||||||||||||||
| * | Includes the results of operations of AIT for the period July 3, 2012 through December 28, 2012. |
30
Table of Contents
| Item 7. | Management’s Discussion and Analysis of Financial Condition and Results of Operations |
This section and other parts of this Annual Report on Form 10-K contain forward-looking statements that involve risks and uncertainties. Forward-looking statements can also be identified by words such as “anticipate,” “believe,” “estimate,” “expect,” “intend,” “may,” “might,” “plan,” “project,” “will,” “would,” “should,” “could,” “can,” “predict,” “potential,” “continue,” “objective,” and similar terms. Forward-looking statements are not guarantees of future performance and our actual results may differ significantly from the results discussed in the forward-looking statements. Factors that might cause such differences include, but are not limited to, those discussed in “Item 1A — Risk Factors” above. The following discussion should be read in conjunction with the consolidated financial statement and notes thereto included in Item 8 of this report. We assume no obligation to revise or update any forward-looking statements for any reason, except as required by law.
Overview
We are a leading developer and supplier of critical subsystems, primarily for the semiconductor capital equipment industry. We also leverage the specialized skill sets required to support semiconductor capital equipment to serve the technologically similar markets in the medical, energy, industrial, flat panel and research industries, collectively referred to as “Other Addressed Industries”. We develop, design, prototype, engineer, manufacture and test subsystems which are highly specialized and tailored to specific steps in the semiconductor manufacturing process as well as the manufacturing process in Other Addressed Industries. Our revenue is derived primarily from the sale of gas delivery systems and other critical subsystems including chemical mechanical planarization subsystems, chemical delivery modules, top-plate assemblies, frame assemblies, process modules and other high level assemblies.
In July 2012, we acquired AIT to add customer base in the semiconductor and medical spaces and to provide additional manufacturing capabilities. In November 2014, we acquired a privately held company, Prototype Asia, to support our 3D printing business. In February 2015, we acquired substantially all of the assets of Marchi to expand our capabilities with our existing customers and bring us closer to the customer in the design stage of new products and next generation equipment.
In October 2014, a relatively new customer, GTAT, filed for bankruptcy. This event had an impact on the Company’s earnings for fiscal year 2014. As a result, approximately $2.8 million of revenue that would have otherwise been recorded for shipments to GTAT was not recognized, $1.6 million of account receivables was written off to bad debt expense for shipments made prior to October of 2014, and approximately $4.6 million of on-hand and non-cancelable inventory commitments was written off to cost of goods sold.
Our sales were $514.0 million for fiscal year 2014, $444.0 million for fiscal year 2013, and $403.4 million for fiscal year 2012. Our three largest customers in fiscal year 2014 and 2013 were Applied Materials, Inc., Lam Research Corporation and ASM International, Inc., each of which accounted for more than 10% of our total sales in fiscal year 2014 and 2013. Our three largest customers in 2012 were Applied Materials, Inc., Lam Research Corporation and Intuitive Surgical, two of which each accounted for 10% or more of our total sales for fiscal year 2012. As a group, these customers accounted for 76%, 81% and 80% of the Company’s sales for fiscal years 2014, 2013 and 2012, respectively.
Effective as of the end of the first quarter of 2012, we agreed to terminate our arrangement with FEI, whereby FEI would take back the manufacturing process they had been outsourcing to us since 2008. As part of an arrangement, we agreed to assist FEI during the transition period through our third quarter of fiscal 2012 and, as a result, recorded revenue totaling $2.1 million related to these efforts during that timeframe, offset by associated costs.
Effective February 2015, we came to an agreement with ISI to transition to insourced manufacturing for their next generation robot. We will continue to manufacture previous generation robots and also assist with
31
Table of Contents
machined components and spare parts for current and future ISI production. The impact of this change is approximately $5.0 to $6.0 million in revenue per quarter.
Results of Operations
The following table sets forth income statement data for the periods indicated as a percentage of revenue:
| Year Ended | ||||||||||||
| December 26, 2014 |
December 27, 2013 |
December 28, 2012 |
||||||||||
| Sales |
100.0 | % | 100.0 | % | 100.0 | % | ||||||
| Cost of goods sold |
85.8 | 84.8 | 86.2 | |||||||||
|
|
|
|
|
|
|
|||||||
| Gross profit |
14.2 | 15.2 | 13.8 | |||||||||
| Operating expenses: |
||||||||||||
| Research and development |
1.4 | 1.2 | 1.3 | |||||||||
| Sales and marketing |
2.0 | 2.2 | 1.7 | |||||||||
| General and administrative |
7.3 | 8.1 | 8.1 | |||||||||
| Acquisition costs |
— | — | 0.6 | |||||||||
|
|
|
|
|
|
|
|||||||
| Total operating expenses |
10.7 | 11.5 | 11.8 | |||||||||
|
|
|
|
|
|
|
|||||||
| Income from operations |
3.5 | 3.6 | 2.1 | |||||||||
| Interest and other income (expense), net |
(0.3 | ) | (0.7 | ) | (0.4 | ) | ||||||
|
|
|
|
|
|
|
|||||||
| Income before provision for income taxes |
3.2 | 2.8 | 1.7 | |||||||||
| Income tax provision |
1.0 | 0.5 | 0.4 | |||||||||
|
|
|
|
|
|
|
|||||||
| Net income |
2.2 | % | 2.3 | % | 1.3 | % | ||||||
|
|
|
|
|
|
|
|||||||
Fiscal Year 2014 Compared With Fiscal Year 2013
Sales
Sales for fiscal year 2014 increased $69.9 million, or 15.8% to $514.0 million from $444.0 million for fiscal year 2014. The increase in sales for the fiscal year ended 2014 when compared to the same period of 2013 reflects an increase in semiconductor sales of $33.2 million and an increase in non-semiconductor sales of $36.8 million. The increase in overall sales for fiscal year 2014 compared to the same period in fiscal year 2013 is due primarily to an increase in the volume of products shipped, which is attributable to some recovery in customer demand from 2013 levels and, to a lesser degree, to the addition of a relatively new non-semiconductor customer, GTAT, who declared bankruptcy in October of 2014. On a geographic basis, sales in the U.S. increased by $44.1 million to $361.7 million, or 70.4% of sales, for the year ended December 26, 2014 as compared to $317.6 million, or 71.5% of sales for the same period of 2013. Foreign sales increased by $25.9 million to $152.3 million, or 29.6% of sales, for the year ended December 26, 2014 as compared to $126.4 million, or 28.5% of sales, for the same period of 2013. The increase in foreign sales is due in part to the recovery in customer demand as well as to the addition of the new customer discussed above in Asia (that subsequently declared bankruptcy in October 2014). We expect sales to increase modestly in the first quarter of 2015 as compared to the fourth quarter of 2014 as we consolidate results for our newly-acquired company, Marchi.
Gross Profit
Cost of goods sold consists primarily of purchased materials, inventory reserves and labor and overhead, including depreciation, associated with the design and manufacture of products sold. Gross profit for fiscal year 2014 increased to $73.1 million or 14.2% of sales, from $67.3 million, or 15.2% of sales, for fiscal year 2013. Our gross margin percentage decreased in fiscal 2014 from the comparable period in 2013 due primarily to the
32
Table of Contents
declaration of bankruptcy of GTAT whereby the cost of sales associated with the goods shipped to GTAT during the third quarter of fiscal 2014 did not have corresponding revenues and the on-hand and non-cancelable inventory commitments related to this customer of $4.6 million was charged to cost of goods sold. The increase in absolute dollars of gross profit when comparing fiscal year 2014 with 2013 is primarily due to higher sales volume, a sales mix which included higher margin products and certain improvements in operational efficiencies at our manufacturing locations in the U.S., which typically deliver lower margins due to higher labor and overhead costs, offset to a degree by the charges in the third quarter as described above related to the declaration of bankruptcy of GTAT. We expect gross profit to be slightly higher in the first quarter of 2015, as compared to the fourth quarter of fiscal 2014, primarily as a result of modestly higher expected sales in the first quarter of 2015.
Research and Development Expense
Research and development expense consists primarily of activities related to new component testing and evaluation, test equipment and fixture development, product design, and other product development activities. Research and development expense for fiscal year 2014 was $7.1 million or 1.4% of sales, compared to $5.5 million, or 1.2% of sales, for fiscal year 2013. The increase in research and development expense in absolute dollars was due primarily to the timing of reassignment of existing resources to research and development activities and, to a lesser degree, to an increase in headcount.
Sales and Marketing Expense
Sales and marketing expense consists primarily of salaries and commissions paid to our sales and service employees, salaries paid to our engineers who work with the sales and service employees to help determine the components and configuration requirements for new products and other costs related to the sales of our products. Sales and marketing expense increased $0.6 million, or 6.1%, to $10.4 million, or 2.0% of sales, compared to $9.8 million, or 2.2% of sales, in the comparable period of 2013. The increase in the sales and marketing expense was primarily due to higher salaries and commissions resulting from higher headcount and revenues.
General and Administrative Expense
General and administrative expense consists primarily of salaries and overhead associated with our administrative staff and professional fees. General and administrative expense increased $1.4 million, or 3.9%, to $37.5 million, or 7.3% of sales, for fiscal year 2014 compared to $36.0 million, or 8.1% of sales, for fiscal year 2013. The increase is primarily due to headcount related costs, including salaries, bonuses and stock compensation, and by the write-off of $1.6 million of accounts receivable as a result of the bankruptcy of GTAT in October 2014, offset by a decrease in the amortization of finite-lived intangibles associated with the AIT acquisition.
Interest and Other Income (Expense), net
Interest and other income (expense), net for fiscal year 2014 was $(1.9) million compared to $(3.3) million for fiscal year 2013. The decrease in net expense was primarily due to the decrease in outstanding debt in fiscal year 2014.
Income Tax Provision
Our effective tax rate for fiscal year 2014 was 30.5% compared to 17.3% for fiscal year 2013. The change in respective rates reflects, primarily, a charge in the third quarter of fiscal 2014 related to recording a valuation allowance on our California and Oregon deferred tax assets, and to a lesser degree, a change in the geographic mix of worldwide earnings and financial results for fiscal year 2014 compared to fiscal year 2013. Our effective tax rate was lower than the statutory rates for fiscal year 2014 primarily due to the geographic distribution of our
33
Table of Contents
world-wide earnings in foreign jurisdictions with lower tax rates or tax holidays, such as the tax holiday we are currently enjoying in Singapore, offset by a valuation allowance against our California and Oregon deferred tax assets. Our effective tax rate was lower than the statutory rates for fiscal year 2013 primarily due to the geographic distribution of our world-wide earnings in foreign jurisdictions with lower tax rates or tax holidays.
Our ability to realize deferred tax assets depends on our ability to generate sufficient taxable income within the carryback or carry forward periods. In assessing our future taxable income, we have considered all sources of future taxable income available to realize our deferred tax assets, including the taxable income from future reversal of existing temporary differences, carry forwards, taxable income in carryback years and tax-planning strategies.
In the third quarter of 2014, we weighed both positive and negative evidence and concluded that a full valuation allowance on our California and Oregon deferred tax assets was appropriate. Among the negative evidence was the declaration of bankruptcy of GTAT during the third quarter of 2014 and its impact on our ability to generate enough future taxable income in California and Oregon to fully utilize net operating loss carryforwards in those states before they expire. As such, management concluded that it was not more likely than not that the California and Oregon deferred tax assets will be realized and recorded a tax charge of $2.8 million in fiscal year 2014.
As of December 26, 2014, we continue to maintain a full valuation allowance on the deferred assets of one of our China subsidiaries in the amount of $1.4 million as we believe it is more likely than not that the deferred tax asset will not be realized. In order to reverse a valuation allowance, accounting principles generally accepted in the United States of America suggests that we review both positive and negative evidence, including our recent cumulative income/loss to determine if we are more likely than not to generate sufficient future taxable income to realize our net deferred tax assets.
We performed a twelve quarter analysis of our U.S. cumulative pretax profit position as of December 26, 2014 and, weighing both positive and negative evidence, determined that it is more likely than not that we will have the ability to generate sufficient taxable income over the foreseeable future to realize our U.S. federal deferred tax assets. Therefore, we concluded that a valuation allowance on our U.S. federal tax assets was not required. If changes occur in the assumptions underlying our tax planning strategies or in the scheduling of the reversal of our deferred tax liabilities, the valuation allowance may need to be adjusted in the future.
Beginning 2013, we determined that a portion of the current year annual earnings of one of our China subsidiaries may be remitted in the future to one of our foreign subsidiaries outside of mainland China and, accordingly, we provided for the related withholding taxes in our consolidated financial statements. Accordingly, no provisions for U.S. taxes have been provided thereon. In addition, if we change our intent to reinvest our undistributed foreign earnings indefinitely or if a greater amount of undistributed earnings are needed than the previously anticipated remaining unremitted foreign earnings, we could be required to accrue or pay U.S. taxes on some or all of these undistributed earnings.
Fiscal Year 2013 Compared With Fiscal Year 2012
Sales
Sales for fiscal year 2013 increased $40.6 million, or 10.1% to $444.0 million from $403.4 million for fiscal year 2012. The increase in sales during the fiscal year 2013 was due primarily to our acquisition of AIT in July 2012 which resulted in the inclusion of sales of $122.4 million from AIT, compared to $63.8 million of sales from AIT for fiscal year 2012. Sales for UCT when excluding sales from AIT were lower during the twelve months ended December 27, 2013 when compared to fiscal year 2012 due to factors including the termination of our arrangement with FEI at the end of the first quarter of 2012, the determination by one of our larger semiconductor equipment customers to in-source a portion of their gas panel business, as well as an overall
34
Table of Contents
downturn in the semiconductor industry beginning in the third quarter of 2012 which did not impact AIT until the beginning of the fourth quarter of 2012.
Gross Profit
Gross profit for fiscal year 2013 increased to $67.3 million or 15.2% of sales, from $55.8 million, or 13.8% of sales, for fiscal year 2012. Our gross margin increased in fiscal 2013 from the comparable period in 2012 due primarily to sales mix which included higher margin products, certain improvements in operational efficiencies at our manufacturing locations, favorable work order variances and a reduction in floor stock costs, partially offset by in an increase in inventory reserves.
Research and Development Expense
Research and development expense for fiscal year 2013 was $5.5 million or 1.2% of sales, compared to $5.1 million, or 1.3% of sales, for fiscal year 2012. The increase in research and development expense in absolute dollars was primarily attributable to an increase in headcount and related payroll expenses.
Sales and Marketing Expense
Sales and marketing expense increased $2.8 million, or 39.8%, to $9.8 million, or 2.2% of sales, compared to $7.0 million, or 1.7% of sales, in the comparable period of 2012. The increase in the sales and marketing expense was primarily due to the inclusion of sales and marketing expenses generated from AIT for the full twelve months ended December 27, 2013 compared to six months in the previous year ended December 28, 2012. We also incurred additional costs during the year ended December 27, 2013 related to an increase in headcount and headcount related costs, including salaries, commissions and bonuses due to increased revenues and operating income in the fiscal year 2013 compared to the fiscal year 2012.
General and Administrative Expense
General and administrative expense increased $3.2 million, or 9.7%, to $36.0 million, or 8.1% of sales, for fiscal year 2013 compared to $32.9 million, or 8.1% of sales, for fiscal year 2012. The increase is primarily due to amortization of finite-lived intangibles associated with the AIT acquisition and incremental costs associated with the AIT acquisition for a full year in fiscal year 2013 compared to a six month period in fiscal year 2012 which include headcount related costs, including salaries, bonuses and stock compensation.
Acquisition Costs
There were no acquisition costs in fiscal 2013 compared to approximately $2.4 million in fiscal 2012. These costs were associated with our purchase of AIT and consisted primarily of professional fees and services in connection with the acquisition.
Interest and Other Income (Expense), net
Interest and other income (expense), net for fiscal year 2013 was $(3.3) million compared to $(1.6) million for fiscal year 2012. The increase in net expense was primarily due to the increase in outstanding debt beginning in the third quarter of 2012 resulting from the acquisition of AIT.
Income Tax Provision
Our effective tax rate for fiscal year 2013 was 17.3% compared to 23.1% for fiscal year 2012. The change in respective rates reflects, primarily, a change in the geographic mix of worldwide earnings and financial results for fiscal year 2013 compared to fiscal year 2012 as well as changes in our deferred tax assets and our accrual for
35
Table of Contents
uncertain tax positions. Our effective tax rate was lower than the statutory rates for fiscal years 2013 and 2012 primarily due to the geographic distribution of our world-wide earnings in foreign jurisdictions with lower tax rates or tax holidays.
As of December 27, 2013, we maintained a full valuation allowance on the deferred assets of one of our China subsidiaries in the amount of $0.7 million as we believed it was more likely than not that the deferred tax asset would not be realized.
Critical Accounting Policies, Significant Judgments and Estimates
Our consolidated financial statements have been prepared in accordance with accounting principles generally accepted in the United States, which requires us to make estimates and judgments that affect the reported amounts of assets, liabilities, revenue and expenses and related disclosure at the date of our consolidated financial statements. On an on-going basis, we evaluate our estimates and judgments, including those related to sales, inventories, goodwill and intangible assets, stock compensation and income taxes. We base our estimates and judgments on historical experience and on various other factors that we believe to be reasonable under the circumstances, the results of which form the basis of our judgments about the carrying values of assets and liabilities that are not readily apparent from other sources. Actual results may differ from these estimates. We consider certain accounting policies related to revenue recognition, inventory valuation, accounting for income taxes, business combinations, valuation of intangible assets and goodwill, and equity incentives to employees to be critical policies due to the estimates and judgments involved in each.
Revenue Recognition
Our revenue for fiscal years 2014, 2013 and 2012 was highly concentrated in a small number of OEM customers in the semiconductor capital equipment, consumer, medical, energy, industrial, flat panel and research industries. Our standard arrangement for our customers includes a signed purchase order or contract, no right of return of delivered products and no customer acceptance provisions. Revenue from sales of products is recognized when:
| • | we enter into a legally binding arrangement with a customer; |
| • | we ship the products; |
| • | customer payment is deemed fixed or determinable and free of contingencies or significant uncertainties; and |
| • | collection is reasonably assured. |
Revenue is recognized upon shipment of the product. In arrangements which specify title transfer upon delivery, revenue is not recognized until the product is delivered. In addition, if we have not fulfilled the terms of the agreement at the time of shipment, revenue recognition is deferred until fulfillment.
We assess collectability based on the creditworthiness of the customer and past transaction history. We perform on-going credit evaluations of, and do not require collateral from, our customers. We have not experienced significant collection losses in the past. A significant change in the liquidity or financial position of any one customer could make it more difficult for us to assess collectability.
Inventory Valuation
We write down the carrying value of our inventory to net realizable value for estimated obsolescence or unmarketable inventory in an amount equal to the difference between the cost of inventory and its estimated realizable value based upon assumptions about future demand and market conditions. We assess the valuation of all inventories, including raw materials, work-in-process, finished goods and spare parts on a periodic basis.
36
Table of Contents
Obsolete inventory or inventory in excess of our estimated usage is written down to its estimated market value less costs to sell, if less than its cost. The inventory write-downs are recorded as an inventory valuation allowance established on the basis of obsolete inventory or specific identified inventory in excess of established usage. Inherent in our estimates of demand and market value in determining inventory valuation are estimates related to economic trends, future demand for our products and technological obsolescence of our products. If actual demand and market conditions are less favorable than our projections, additional inventory write-downs may be required. If the inventory value is written down to its net realizable value, and subsequently there is an increased demand for the inventory at a higher value, the increased value of the inventory is not realized until the inventory is sold either as a component of a subsystem or as separate inventory. For fiscal years 2014, 2013 and 2012, we wrote down $4.6 million, including $2.6 million of inventory written off as part of the GTAT bankruptcy in the third quarter of 2014, $1.5 million and $1.2 million in inventory determined to be obsolete, respectively.
Accounting for Income Taxes
The determination of our tax provision is highly dependent upon the geographic composition of worldwide earnings and tax regulations governing each region and is subject to judgments and estimates. Management carefully monitors the changes in many factors and adjusts the effective tax rate as required. The carrying value of our net deferred tax assets, which consist primarily of future tax deductions, assumes we will be able to generate sufficient future income to fully realize these deductions. In determining whether the realization of these deferred tax assets may be impaired, we make judgments with respect to whether we are likely to generate sufficient future taxable income to realize these assets. In order to reverse a valuation allowance, accounting principles generally accepted in the United States of America suggest that we review our recent cumulative income/loss as well as determine our ability to generate sufficient future taxable income to realize our net deferred tax assets. As of December 26, 2014, the Company maintained full valuation allowances on the deferred tax assets of one of its China subsidiaries in the amount of $1.4 million and for California and Oregon deferred tax assets in the amount of $2.8 million as we believe it is more likely than not that these deferred tax assets will not be realized.
In addition, the calculation of tax liabilities involves significant judgment in estimating the impact of uncertainties in the application of complex tax laws. Resolution of these uncertainties in a manner inconsistent with our expectations could have a material impact on our results of operations and financial position. We believe we have adequately reserved for our uncertain tax positions, however, no assurance can be given that the final tax outcome of these matters will not be different than what we expect. We adjust these reserves in light of changing facts and circumstances, such as the closing of a tax audit or the refinement of an estimate. To the extent that the final tax outcome of these matters is different than the amounts recorded, such differences will impact the provision for income taxes in the period in which such determination is made. The provision for income taxes includes the impact of reserve provisions and changes to reserves that are considered appropriate, as well as the related net interest.
We file income tax returns in the U.S. federal jurisdiction, various states and foreign jurisdictions. Our 2011 through 2013 federal income tax returns are open to audit through the statute of limitations by the Internal Revenue Service. The Company’s 2010 through 2013 state income tax returns are open to audit by the California Franchise Tax Board. The Company is also subject to examination in various other jurisdictions for various periods. We are currently enjoying a zero rate tax holiday in Singapore that is scheduled to expire at the end of fiscal year 2015. This tax rate is subject to achieving certain commitments agreed to with the Economic Development Board of Singapore including investment and employment thresholds. Our tax rate could be significantly affected if we are unable to meet these commitments or if we are unable to favorably renegotiate the commitment requirements.
37
Table of Contents
Business Combinations
In accordance with business combination accounting, we allocate the purchase price of acquired companies to the tangible and intangible assets acquired and liabilities assumed based on their estimated fair values. We may engage third-party valuation firms to assist management in reviewing management’s determination of the fair values of acquired intangible assets such as trade name and customer relationships. Such valuations require management to make significant estimates and assumptions. Management makes estimates of fair value based upon assumptions believed to be reasonable. These estimates are based on historical experience and information obtained from the management of the acquired companies and are inherently uncertain.
Goodwill, Intangibles Assets, and Long-lived Assets
Goodwill is measured as the excess of the cost of an acquisition over the sum of the amounts assigned to identifiable assets acquired less liabilities assumed.
We evaluate our goodwill and indefinite life trade name for impairment on an annual basis, and whenever events or changes in circumstances indicate that the carrying value may not be fully recoverable. In addition, we evaluate our identifiable intangible assets and other long-lived assets for impairment whenever events or changes in circumstances indicate that the carrying amount of an asset may not be recoverable. Factors we consider important which could trigger an impairment review include the following:
| • | Significant changes in the manner of our use of the acquired assets or the strategy of our overall business; |
| • | Significant negative changes in revenue of specific products or services; |
| • | Significant negative industry or economic trends; |
| • | Significant decline in our stock price for a sustained period; and |
We continually apply judgment when performing these evaluations and continuously monitor for events and circumstances that could negatively impact the key assumptions in determining fair value, including long-term revenue growth projections, undiscounted net cash flows, discount rates, recent market valuations from transactions by comparable companies, volatility in our market capitalization and general industry, market and macroeconomic conditions. It is possible that changes in such circumstances, or in the variables associated with the judgments, assumptions and estimates used in assessing fair value, would require us to record a non-cash impairment charge.
Equity Incentives to Employees
We issue stock options and restricted stock units to our employees and outside directors and provide our employees the right to purchase common stock under our employee stock purchase plan. Under current accounting guidance, stock-based compensation cost is measured at the grant date based on the fair value of the award and is recognized as expense over the service (vesting) period.
The Black-Scholes option-pricing model that we use was developed for use in estimating the fair value of short-lived exchange traded options that have no vesting restrictions and are fully transferable. In addition, option-pricing models require the input of highly subjective assumptions, including the option’s expected life and the price volatility of underlying stock. Our expected stock price volatility assumption was determined using the historical volatility of our common stock. We determined that historical volatility reflects market conditions and is a good indicator of future volatility. Our expected term represents the period that our stock-based awards are expected to be outstanding and was determined based on our historical experience with similar awards, giving consideration to the contractual terms of the stock-based awards and vesting schedules. See Note 8 to the Notes to Consolidated Financial Statements for a detailed description
38
Table of Contents
Unaudited Quarterly Financial Results
The following table sets forth statement of operations data for the periods indicated. The information for each of these periods is unaudited and has been prepared on the same basis as our audited consolidated financial statements included herein and includes all adjustments, consisting only of normal recurring adjustments that we consider necessary for a fair presentation of our unaudited operations data for the periods presented. Historical results are not necessarily indicative of the results to be expected in the future (in thousands, except per share data):
| First Quarter |
Second Quarter |
Third Quarter |
Fourth Quarter |
Fiscal Year (1) |
||||||||||||||||
| 2014 |
||||||||||||||||||||
| Sales |
$ | 144,224 | $ | 132,677 | $ | 117,041 | $ | 120,015 | $ | 513,957 | ||||||||||
| Gross profit |
$ | 23,311 | $ | 21,152 | $ | 10,307 | $ | 18,363 | $ | 73,133 | ||||||||||
| Net income (loss) |
$ | 7,056 | $ | 6,031 | $ | (5,262 | ) | $ | 3,532 | $ | 11,357 | |||||||||
| Earnings (loss) per share — basic |
$ | 0.24 | $ | 0.20 | $ | (0.18 | ) | $ | 0.12 | $ | 0.39 | |||||||||
| Earnings (loss) per share — diluted |
$ | 0.24 | $ | 0.20 | $ | (0.18 | ) | $ | 0.12 | $ | 0.38 | |||||||||
| 2013 |
||||||||||||||||||||
| Sales |
$ | 100,464 | $ | 110,107 | $ | 107,183 | $ | 126,268 | $ | 444,022 | ||||||||||
| Gross profit |
$ | 13,823 | $ | 16,103 | $ | 15,833 | $ | 21,570 | $ | 67,329 | ||||||||||
| Net income (loss) |
$ | (311 | ) | $ | 2,316 | $ | 2,048 | $ | 6,371 | $ | 10,424 | |||||||||
| Earnings (loss) per share — basic |
$ | (0.01 | ) | $ | 0.08 | $ | 0.07 | $ | 0.22 | $ | 0.37 | |||||||||
| Earnings (loss) per share — diluted |
$ | (0.01 | ) | $ | 0.08 | $ | 0.07 | $ | 0.22 | $ | 0.36 | |||||||||
| (1) | Earnings per share is calculated independently each quarter and for the full year based upon their respective weighted average shares outstanding. Therefore, the sum of the quarterly earnings per share may not equal the annual earnings per share reported. |
Liquidity and Capital Resources
We have required capital principally to fund our acquisitions and working capital needs, satisfy our debt obligations, maintain our equipment and purchase new capital equipment. As of December 26, 2014, we had cash and cash equivalents of $79.0 million compared to $60.4 million as of December 27, 2013. Our cash and cash equivalents, as well as cash generated from operations, was our principal source of liquidity as of December 26, 2014.
For the twelve months ended December 26, 2014, we generated cash from operating activities of $30.4 million, an increase of $0.5 million when compared to $29.9 million for fiscal 2013. Cash generated from operating activities for fiscal 2013 represented an increase of $2.6 million when compared to $27.3 million for fiscal 2012. Operating cash flows generated in the twelve months ended December 26, 2014, were from $11.4 million of net income; net non-cash activity, including depreciation of equipment and leasehold improvements and amortization of intangibles and debt issuance costs of a total $8.4 million and stock-based compensation of $4.4 million; and decreases in accounts receivable, inventory and deferred income of $5.6 million and $7.1 million and $2.2 million, respectively. The decrease in inventory reflects, in part, improvement in inventory management over the previous year and, in part, the write-off related to the GTAT bankruptcy. These were offset by a net decrease in accounts payable, accrued compensation and related benefits and other current liabilities of $6.2 million, and an increase in prepaid expenses and other assets of $2.5 million. Operating cash flows generated in the twelve months ended December 27, 2013, were from $10.4 million of net income; net non-cash activity, including depreciation of equipment and leasehold improvements and amortization of intangibles and debt issuance costs of a total $9.6 million and stock-based compensation of $4.7 million; and decreases in accounts receivable and inventory of $17.4 million and $9.1 million, respectively. The decrease in inventory reflects the substantial improvement in inventory management over the previous year. These were offset by a net increase in accounts payable and other current liabilities of $31.0 million, and an
39
Table of Contents
increase in accrued compensation and related benefits of $1.1 million. Our cash flows from operations in any given period are largely driven by the timing of sales, the collection of accounts receivable and the payment of accounts payable.
Net cash used in investing activities for the twelve months ended December 26, 2014, was $5.1 million, consisting mainly of $5.3 million capital equipment expenditures in Asia similar to the capital expenditures in 2013 which reflects our continued investment in our Asian subsidiaries. Net cash used in investing activities for fiscal 2013 was $2.9 million. The net cash used in investing activities in 2013 consisted mainly of purchases of equipment of $3.0 million.
Net cash used in financing activities for the twelve months ended December 26, 2014, was $6.6 million, a decrease of $14.3 million when compared to net cash used by financing activities of $21.0 million for the comparable period of 2013. For the twelve months ended December 26, 2014, our cash provided by financing activities was due primarily to proceeds of $48.5 million from our revolving line of credit, offset by payments of $46.0 million to the same revolving line of credit. We also made payments of $10.0 million to our facility term loan. Net cash used in financing activities for fiscal 2013 represented a change of $71.3 million when compared to cash provided of $50.4 million for fiscal 2012. The decrease in cash from financing activities in 2013 was due primarily to $84.0 million of principal payments offset by cash proceeds of $63.0 million from our revolving line of credit. See “— Borrowing Arrangements” below for information regarding our new borrowing arrangements entered into to refinance amounts outstanding under our existing credit facility and fund the cash portion of the purchase price in connection with our acquisition of Marchi on February 5, 2015.
We anticipate that our existing cash and cash equivalents balance and operating cash flow will be sufficient to service our indebtedness and meet our working capital requirements and technology development projects for at least the next twelve months. The adequacy of these resources to meet our liquidity needs beyond that period will depend on our growth, the state of the worldwide economy, our ability to meet our financial covenants with our credit facility, the cyclical expansion or contraction of the semiconductor capital equipment industry and the other industries we serve and capital expenditures required to meet possible increased demand for our products.
In order to expand our business or acquire additional complementary businesses or technologies, we may need to raise additional funds through equity or debt financings. If required, additional financing may not be available on terms that are favorable to us, if at all. If we raise additional funds through the issuance of equity or convertible debt securities, our stockholders’ equity interest will be diluted and these securities might have rights, preferences and privileges senior to those of our current stockholders. We may also require the consent of our new lenders to raise additional funds through equity or debt financings. No assurance can be given that additional financing will be available or that, if available, such financing can be obtained on terms favorable to our stockholders and us.
Beginning in 2013, we determined that a portion of the current year and future year earnings of one of our China subsidiaries may be remitted in the future to one of our foreign subsidiaries outside of mainland China and, accordingly, we provided for the related withholding taxes in our consolidated financial statements. Accordingly, no provisions for U.S. income taxes have been provided thereon. In addition, if we change our intent to reinvest our undistributed foreign earnings indefinitely or if a greater amount of undistributed earnings are needed than the previous anticipated remaining unremitted foreign earnings, we could be required to accrue or pay U.S. taxes on some or all of these undistributed earnings. As of December 26, 2014, we had undistributed earnings of foreign subsidiaries that are indefinitely invested outside of the U.S. of approximately $57.6 million. It is not practicable to determine the income tax liability that might be incurred if these earnings were to be distributed. We anticipate that we have adequate liquidity and capital resources and would not need to repatriate earnings to the U.S. As of December 26, 2014, we have cash of approximately $57.9 million in our foreign subsidiaries.
40
Table of Contents
Borrowing Arrangements
As of December 26, 2014, we had borrowing arrangements with Silicon Valley Bank under a Loan and Security Agreement (the “Loan Agreement”) which included a $40.0 million revolving credit facility (“revolver”), maturing on July 3, 2016, and a $40.0 million term loan (“term loan”), maturing on July 3, 2016. The aggregate amount of the revolver was secured by substantially all of our assets. As of December 26, 2014, the outstanding balances of the term loan and revolver were $17.5 million and $31.3 million, respectively.
The interest rate on the revolver during the twelve months ended December 26, 2014 was 3.75%. Pursuant to the Loan Agreement, the term loan bears interest per annum at a variable rate equal to the greater of prime rate, as defined per the loan agreement, plus a margin of 75 basis points. During the twelve months ended and as of December 26, 2014, the interest rate on the outstanding term loan was 3.75%. The Loan Agreement contains a number of financial and reporting covenants. We were in compliance with all of such covenants as of December 26, 2014.
In February 2015, we entered into a new credit agreement (the “Credit Agreement”) by and among us, certain of our subsidiaries, East West Bank and Citi National Bank (collectively, the “Lenders”). The Credit Agreement provides for a term loan in an aggregate principal amount of $40.0 million (the “New Term Loan”) and a revolving credit facility in an aggregate principal amount of $40.0 million (the “New Revolving Credit Facility”), a letter of credit facility in the aggregate availability amount of $20.0 million (as a sublimit of such New Revolving Credit Facility) (the “L/C Facility”) and a swingline sub-facility in the aggregate availability amount of $5.0 million (as a sublimit of the New Revolving Credit Facility) (together with the Term Loan, the Revolving Credit Facility and the L/C Facility, the “Senior Secured Credit Facility”). On February 2, 2015, we borrowed an aggregate of $40.0 million under the New Term Loan and approximately $6.5 million under the New Revolving Credit Facility. The borrowed funds were used to repay the outstanding balance to Silicon Valley Bank as lender under our prior Loan Agreement. The prior Loan Agreement was terminated in connection with this transaction and, as a result, the outstanding balance of the revolver of $31.3 million was classified as long-term debt as of December 26, 2014 in accordance with the terms of the new debt agreement. In addition, we will expense the unamortized debt issuance costs of approximately $0.7 million in the first quarter of 2015. On February 5, 2015, in connection with the acquisition of Marchi, we borrowed $29.7 million under the New Revolving Credit Facility. The borrowed funds were used to finance the acquisition.
The New Term Loan must be repaid in consecutive quarterly installments of $2.5 million, with the first payment due on March 31, 2015, and with the balance of the outstanding principal amount of the New Term Loan due at the final maturity, which is February 2, 2019. The New Revolving Credit Facility is available for the four-year period beginning on February 2, 2015. The Credit Agreement includes customary representations, warranties, covenants and events of default. We and certain of our subsidiaries have agreed to secure all of their obligations under the Credit Agreement by granting a first priority lien in substantially all of our respective personal property assets (subject to certain exceptions and limitations).
At our option, borrowings under the New Term Loan and New Revolving Credit Facility (subject to certain limitations) bear interest at either a base rate or at the London Interbank Offered Rate (“LIBOR”) (with the LIBOR being adjusted for certain Eurocurrency reserve requirements, if any, as described in the Credit Agreement), plus, in each case, an applicable margin based on our consolidated leverage ratio. All loans described above made on February 2, 2015 and February 5, 2015 were initially base rate loans, carrying interest of 3.25%. We expect, however, that the effective interest rate will be higher due to the incurrence of certain loan-related costs that will be treated as debt discount and amortized over the life of the loan.
The Credit Agreement requires us to maintain certain financial covenants including a consolidated fixed charge coverage ratio (as defined in the Credit Agreement) of at least 1.25 to 1.00 starting with the end of the first quarter of fiscal 2015 and a consolidated leverage ratio (as defined in the Credit Agreement) no greater than 3.5 to 1.00 starting with the end of the first quarter of fiscal 2015. The Credit Agreement also includes other customary affirmative and negative covenants.
41
Table of Contents
The Credit Agreement also contains provisions requiring the following mandatory prepayments (subject to certain exceptions and limitations): annual prepayments in an amount equal to (a) 33% of excess cash flow (as defined in the Credit Agreement) if the aggregate outstanding principal amount of the New Term Loan equals or exceeds $20.0 million and (b) 25% of excess cash flow if the aggregate outstanding principal amount of the New Term Loan equals or exceeds $10.0 million but is less than $20.0 million.
The Credit Agreement also restricts us from declaring or paying any cash dividends.
Capital Expenditures
Capital expenditures were $5.5 million for the year ended December 26, 2014.
Off-Balance Sheet Arrangements
During the periods presented, we did not have any relations with unconsolidated entities or financial partnerships, such as entities often referred to as structured finance or special purpose entities, which would have been established for the purpose of facilitating off-balance sheet arrangements or other contractually narrow or limited purposes.
Contractual Obligations
Other than operating leases for certain equipment and real estate and purchase order commitments primarily for inventory, we have no off-balance sheet transactions, unconditional purchase obligations or similar instruments and, other than the arrangements described under “Borrowing Arrangements” above, are not a guarantor of any other entities’ debt or other financial obligations. The following table summarizes our future minimum lease payments, principal payments under debt obligations and our purchase obligations for the purchase of inventory as of December 26, 2014 (in thousands):
| 2015 | 2016 | 2017 | 2018 | 2019 and thereafter |
Total | |||||||||||||||||||
| Operating leases (1) |
$ | 5,710 | 5,021 | 4,388 | 3,241 | 9,818 | 28,178 | |||||||||||||||||
| Borrowing Arrangement (2) |
10,000 | 38,844 | — | — | — | 48,844 | ||||||||||||||||||
| Purchase order commitments |
31,223 | — | — | — | — | 31,223 | ||||||||||||||||||
|
|
|
|
|
|
|
|
|
|
|
|
|
|||||||||||||
| Total |
$ | 46,933 | $ | 43,865 | $ | 4,388 | $ | 3,241 | $ | 9,818 | $ | 108,245 | ||||||||||||
|
|
|
|
|
|
|
|
|
|
|
|
|
|||||||||||||
| (1) | Operating lease obligations reflects (a) the lease for our headquarters facility in Hayward, California that expires in 2022; (b) the leases for manufacturing facilities in South San Francisco that expire in 2018; (c) the leases for manufacturing facilities in China, Singapore and the Philippines that expire in 2015 thru 2016; (d) the lease for a manufacturing facility in Singapore that was entered into in October 2014 that expires in 2017; (e) the leases for manufacturing facilities in Austin, Texas that expire in 2016; (f) the leases for manufacturing facilities in Chandler, Arizona that expire in 2017; and (g) the leases for manufacturing facilities in Pflugerville, Texas that expire in 2018. We have options to renew certain of the leases in South San Francisco, Hayward, Austin and Singapore which we expect to exercise. |
| (2) | Amounts reflect obligations under our Credit Facility gross of $0.7 million of unamortized debt issuance costs, under which $17.5 million is outstanding under the Term Loan and approximately $31.3 million under the Revolving Credit Facility as of December 26, 2014. The Term Loan must be repaid in consecutive quarterly installments of $2.5 million and with the balance of the outstanding principal amount of the Term Loan due at the final maturity, which is July 3, 2016. The Revolving Credit Facility is available for the four-year period beginning on July 3, 2012. In February 2015, the Company entered into a new credit agreement (the “Credit Agreement”) by and among the Company, certain of its subsidiaries, East West Bank and Citi National Bank (collectively, the “Lenders”). On February 2, 2015, we borrowed an aggregate of $40.0 |
42
Table of Contents
| million under the New Term Loan and approximately $6.5 million under the New Revolving Credit Facility. The borrowed funds were used to repay the outstanding balance to Silicon Valley Bank as lender under our prior Loan Agreement. The prior Loan Agreement was terminated in connection with this transaction and, as a result, the outstanding balance of the revolver of $31.3 million was classified as long-term debt as of December 26, 2014. In addition, we will expense the unamortized debt issuance costs of approximately $0.7 million in the first quarter of 2015. See Note 5 to the Notes to Consolidated Financial Statements for further discussion. |
| Item 7A. | Quantitative and Qualitative Disclosures About Market Risk |
We are exposed to financial market risks, including changes in currency exchange rates and interest rates.
Foreign Exchange Rates
Currently, a significant majority of our sales and arrangements with third-party suppliers provide for pricing and payment in US dollars, and, therefore, are not subject to material exchange rate fluctuations. Therefore, we do not expect foreign currency exchange rate fluctuations to have a material effect on our results of operations. However, increases in the value of the U.S. dollar relative to other currencies would make our products more expensive relative to competing products priced in such other currencies, which could negatively impact our ability to compete. Conversely, decreases in the value of the U.S. dollar relative to other currencies could result in our foreign suppliers raising their prices in order to continue doing business with us.
Chinese authorities recently relaxed controls of China’s currency, the Renminbi, and allowed the currency to strengthen against other world currencies, including the U.S. dollar. We continue to monitor any potential impact of the appreciation of the Renminbi on our operations in China as well as globally. Changes in the value of the Renminbi did not have a material impact on our results of operations for any period presented in this Form 10-K.
Interest Rates
Our interest rate risk relates primarily to our debt which totals $48.2 million (net of debt issuance costs) as of December 26, 2014, and carries interest rates pegged to either the prime rate or LIBOR. An immediate increase in interest rates of 100 basis points would increase our interest expense by approximately $0.1 million per quarter. This would be partially offset by increased interest income on our invested cash. Conversely, an immediate decline of 100 basis points in interest rates would decrease our interest expense by approximately $0.1 million per quarter. This would be partially offset by decreased interest income on our invested cash.
43
Table of Contents
| Item 8. | Financial Statements and Supplementary Data |
INDEX TO CONSOLIDATED FINANCIAL STATEMENTS
| 45 | ||||
| Consolidated Balance Sheets as of December 26, 2014 and December 27, 2013 |
46 | |||
| 47 | ||||
| 48 | ||||
| 49 | ||||
| 50 |
44
Table of Contents
REPORT OF INDEPENDENT REGISTERED PUBLIC ACCOUNTING FIRM
To the Board of Directors and Stockholders of
Ultra Clean Holdings, Inc.
Hayward, California
We have audited the accompanying consolidated balance sheets of Ultra Clean Holdings, Inc. and subsidiaries (the “Company”) as of December 26, 2014 and December 27, 2013, and the related consolidated statements of operations, stockholders’ equity, and cash flows for each of the three years in the period ended December 26, 2014. These financial statements are the responsibility of the Company’s management. Our responsibility is to express an opinion on these financial statements based on our audits.
We conducted our audits in accordance with the standards of the Public Company Accounting Oversight Board (United States). Those standards require that we plan and perform the audit to obtain reasonable assurance about whether the financial statements are free of material misstatement. An audit includes examining, on a test basis, evidence supporting the amounts and disclosures in the financial statements. An audit also includes assessing the accounting principles used and significant estimates made by management, as well as evaluating the overall financial statement presentation. We believe that our audits provide a reasonable basis for our opinion.
In our opinion, such consolidated financial statements present fairly, in all material respects, the financial position of Ultra Clean Holdings, Inc. and subsidiaries as of December 26, 2014 and December 27, 2013, and the results of their operations and their cash flows for each of the three years in the period ended December 26, 2014, in conformity with accounting principles generally accepted in the United States of America.
We have also audited, in accordance with the standards of the Public Company Accounting Oversight Board (United States), the Company’s internal control over financial reporting as of December 26, 2014, based on the criteria established in Internal Control — Integrated Framework (2013) issued by the Committee of Sponsoring Organizations of the Treadway Commission and our report dated March 11, 2015, expressed an unqualified opinion on the Company’s internal control over financial reporting.
/s/ Deloitte & Touche LLP
San Jose, California
March 11, 2015
45
Table of Contents
Consolidated Balance Sheets
| December 26, 2014 |
December 27, 2013 |
|||||||
| (In thousands, except share and per share amounts) |
||||||||
| ASSETS | ||||||||
| Current assets: |
||||||||
| Cash and cash equivalents |
$ | 78,997 | $ | 60,415 | ||||
| Accounts receivable, net of allowance of $81 and $5, respectively |
61,817 | 67,450 | ||||||
| Inventory |
56,850 | 63,942 | ||||||
| Deferred tax assets |
3,777 | 4,071 | ||||||
| Prepaid expenses and other |
7,006 | 4,581 | ||||||
|
|
|
|
|
|||||
| Total current assets |
208,447 | 200,459 | ||||||
|
|
|
|
|
|||||
| Equipment and leasehold improvements, net |
10,841 | 8,534 | ||||||
| Goodwill |
55,918 | 55,918 | ||||||
| Purchased intangibles, net |
16,824 | 21,708 | ||||||
| Deferred tax assets |
3,445 | 5,341 | ||||||
| Other non-current assets |
667 | 583 | ||||||
|
|
|
|
|
|||||
| Total assets |
$ | 296,142 | $ | 292,543 | ||||
|
|
|
|
|
|||||
| LIABILITIES AND STOCKHOLDERS’ EQUITY | ||||||||
| Current liabilities: |
||||||||
| Bank borrowings |
$ | 9,541 | $ | 37,705 | ||||
| Accounts payable |
48,944 | 53,962 | ||||||
| Accrued compensation and related benefits |
5,308 | 5,730 | ||||||
| Deferred rent, current portion |
245 | 262 | ||||||
| Other current liabilities |
2,130 | 2,385 | ||||||
|
|
|
|
|
|||||
| Total current liabilities |
66,168 | 100,044 | ||||||
|
|
|
|
|
|||||
| Long-term debt |
38,614 | 17,421 | ||||||
| Deferred rent and other liabilities |
2,808 | 3,149 | ||||||
|
|
|
|
|
|||||
| Total liabilities |
107,590 | 120,614 | ||||||
|
|
|
|
|
|||||
| Commitments and contingencies (See Note 11) |
||||||||
| Stockholders’ equity: |
||||||||
| Preferred stock — $0.001 par value, 10,000,000 authorized; none outstanding |
— | — | ||||||
| Common stock — $0.001 par value, 90,000,000 authorized; 29,562,338 and 28,694,762 |
30 | 29 | ||||||
| Additional paid-in capital |
153,141 | 147,876 | ||||||
| Common shares held in treasury, at cost, 601,944 shares in 2014 and 2013, respectively |
(3,337 | ) | (3,337 | ) | ||||
| Retained earnings |
38,718 | 27,361 | ||||||
|
|
|
|
|
|||||
| Total stockholders’ equity |
188,552 | 171,929 | ||||||
|
|
|
|
|
|||||
| Total liabilities and stockholders’ equity |
$ | 296,142 | $ | 292,543 | ||||
|
|
|
|
|
|||||
(See notes to consolidated financial statements)
46
Table of Contents
Consolidated Statements of Operations
| Twelve Months Ended | ||||||||||||
| December 26, 2014 |
December 27, 2013 |
December 28, 2012 |
||||||||||
| (In thousands, except per share amounts) | ||||||||||||
| Sales |
$ | 513,957 | $ | 444,022 | $ | 403,430 | ||||||
| Cost of goods sold |
440,824 | 376,693 | 347,642 | |||||||||
|
|
|
|
|
|
|
|||||||
| Gross profit |
73,133 | 67,329 | 55,788 | |||||||||
|
|
|
|
|
|
|
|||||||
| Operating expenses: |
||||||||||||
| Research and development |
7,067 | 5,543 | 5,121 | |||||||||
| Sales and marketing |
10,432 | 9,831 | 7,033 | |||||||||
| General and administrative |
37,450 | 36,047 | 32,858 | |||||||||
| Acquisition costs |
— | — | 2,431 | |||||||||
|
|
|
|
|
|
|
|||||||
| Total operating expenses |
54,949 | 51,421 | 47,443 | |||||||||
|
|
|
|
|
|
|
|||||||
| Income from operations |
18,184 | 15,908 | 8,345 | |||||||||
|
|
|
|
|
|
|
|||||||
| Interest and other income (expense), net |
(1,854 | ) | (3,309 | ) | (1,648 | ) | ||||||
|
|
|
|
|
|
|
|||||||
| Income before provision for income taxes |
16,330 | 12,599 | 6,697 | |||||||||
| Income tax provision |
4,973 | 2,175 | 1,544 | |||||||||
|
|
|
|
|
|
|
|||||||
| Net income |
$ | 11,357 | $ | 10,424 | $ | 5,153 | ||||||
|
|
|
|
|
|
|
|||||||
| Net income per share: |
||||||||||||
| Basic |
$ | 0.39 | $ | 0.37 | $ | 0.20 | ||||||
| Diluted |
$ | 0.38 | $ | 0.36 | $ | 0.20 | ||||||
| Shares used in computing net income per share: |
||||||||||||
| Basic |
29,301 | 28,346 | 25,698 | |||||||||
| Diluted |
29,936 | 29,037 | 26,261 | |||||||||
(See notes to consolidated financial statements)
47
Table of Contents
Consolidated Statements of Stockholders’ Equity
| Common Stock | Additional Paid-in Capital |
Retained Earnings |
Total Stockholders’ Equity |
|||||||||||||||||
| Shares | Amount | |||||||||||||||||||
| (in thousands, except share amounts) | ||||||||||||||||||||
| Balance December 30, 2011 |
22,910,649 | $ | 23 | $ | 105,478 | $ | 11,784 | $ | 117,285 | |||||||||||
| Issuance of restricted common stock |
30,000 | — | — | — | — | |||||||||||||||
| Issuance under employee stock plans |
514,889 | 1 | 326 | — | 327 | |||||||||||||||
| Amortization of stock-based compensation |
— | — | 5,069 | — | 5,069 | |||||||||||||||
| Excess tax benefit from stock-based compensation |
— | — | 62 | — | 62 | |||||||||||||||
| Employees’ taxes paid upon vesting of restricted stock units |
(44,687 | ) | — | (341 | ) | — | (341 | ) | ||||||||||||
| Common stock issued for acquisition of AIT, net of equity issuance costs |
4,500,000 | 4 | 29,221 | — | 29,225 | |||||||||||||||
| Net income |
— | — | — | 5,153 | 5,153 | |||||||||||||||
|
|
|
|
|
|
|
|
|
|
|
|||||||||||
| Balance December 28, 2012 |
27,910,851 | 28 | 139,815 | 16,937 | 156,780 | |||||||||||||||
| Issuance of restricted common stock |
30,000 | — | — | — | — | |||||||||||||||
| Issuance under employee stock plans |
849,368 | 1 | 773 | — | 774 | |||||||||||||||
| Amortization of stock-based compensation |
— | — | 4,685 | — | 4,685 | |||||||||||||||
| Excess tax benefit from stock-based compensation |
— | — | (140 | ) | — | (140 | ) | |||||||||||||
| Employees’ taxes paid upon vesting of restricted stock units |
(95,457 | ) | — | (594 | ) | — | (594 | ) | ||||||||||||
| Net income |
— | — | — | 10,424 | 10,424 | |||||||||||||||
|
|
|
|
|
|
|
|
|
|
|
|||||||||||
| Balance December 27, 2013 |
28,694,762 | $ | 29 | $ | 144,539 | $ | 27,361 | $ | 171,929 | |||||||||||
| Issuance of restricted common stock |
47,000 | — | — | — | — | |||||||||||||||
| Issuance under employee stock plans |
919,446 | 1 | 1,939 | — | 1,940 | |||||||||||||||
| Amortization of stock-based compensation |
— | — | 4,400 | — | 4,400 | |||||||||||||||
| Excess tax benefit from stock-based compensation |
— | — | 284 | — | 284 | |||||||||||||||
| Employees’ taxes paid upon vesting of restricted stock units |
(98,870 | ) | — | (1,358 | ) | — | (1,358 | ) | ||||||||||||
| Net income |
— | — | — | 11,357 | 11,357 | |||||||||||||||
|
|
|
|
|
|
|
|
|
|
|
|||||||||||
| Balance December 26, 2014 |
29,562,338 | $ | 30 | $ | 149,804 | $ | 38,718 | $ | 188,552 | |||||||||||
|
|
|
|
|
|
|
|
|
|
|
|||||||||||
(See notes to consolidated financial statements)
48
Table of Contents
Consolidated Statements of Cash Flows
| Twelve Months Ended | ||||||||||||
| December 26, 2014 |
December 27, 2013 |
December 28, 2012 |
||||||||||
| (In thousands) | ||||||||||||
| Cash flows from operating activities: |
||||||||||||
| Net income |
$ | 11,357 | $ | 10,424 | $ | 5,153 | ||||||
| Adjustments to reconcile net income to net cash provided by |
||||||||||||
| Loss from disposal of fixed assets |
— | 329 | — | |||||||||
| Depreciation |
3,004 | 3,119 | 3,195 | |||||||||
| Amortization of finite-lived intangibles |
4,884 | 5,994 | 3,786 | |||||||||
| Amortization of debt issuance costs |
529 | 487 | 236 | |||||||||
| Excess tax benefit from stock-based compensation |
(284 | ) | 140 | (62 | ) | |||||||
| Stock-based compensation |
4,400 | 4,685 | 5,069 | |||||||||
| Changes in assets and liabilities, net of AIT acquisition: |
||||||||||||
| Accounts receivable |
5,633 | (17,376 | ) | 8,047 | ||||||||
| Inventory |
7,092 | (9,133 | ) | 24,282 | ||||||||
| Prepaid expenses and other |
(2,425 | ) | (668 | ) | (175 | ) | ||||||
| Deferred income tax |
2,190 | 78 | (2,731 | ) | ||||||||
| Other non-current assets |
(84 | ) | (53 | ) | (114 | ) | ||||||
| Accounts payable |
(5,186 | ) | 30,644 | (19,498 | ) | |||||||
| Accrued compensation and related benefits |
(422 | ) | 1,119 | (1,055 | ) | |||||||
| Income taxes payable |
284 | (141 | ) | 63 | ||||||||
| Other liabilities |
(613 | ) | 283 | 1,143 | ||||||||
|
|
|
|
|
|
|
|||||||
| Net cash provided by operating activities |
30,359 | 29,931 | 27,339 | |||||||||
|
|
|
|
|
|
|
|||||||
| Cash flows from investing activities: |
||||||||||||
| Purchases of equipment and leasehold improvements |
(5,334 | ) | (2,963 | ) | (609 | ) | ||||||
| AIT acquisition, net of cash acquired |
— | — | (74,945 | ) | ||||||||
| Proceeds from sale of equipment |
191 | 96 | — | |||||||||
|
|
|
|
|
|
|
|||||||
| Net cash used in investing activities |
(5,143 | ) | (2,867 | ) | (75,554 | ) | ||||||
|
|
|
|
|
|
|
|||||||
| Cash flows from financing activities: |
||||||||||||
| Proceeds from revolving credit facilities |
48,500 | 63,000 | 96,824 | |||||||||
| Proceeds from long-term loans |
— | — | 40,000 | |||||||||
| Principal payments on revolving credit facilities |
(46,000 | ) | (74,000 | ) | (76,462 | ) | ||||||
| Principal payments on long-term debt and capital lease |
(10,000 | ) | (10,000 | ) | (7,758 | ) | ||||||
| Payments of debt issuance costs |
— | — | (1,940 | ) | ||||||||
| Payments of equity issuance costs |
— | — | (341 | ) | ||||||||
| Excess tax benefit from stock-based compensation |
284 | (140 | ) | 62 | ||||||||
| Employees’ taxes paid upon vesting of restricted stock units |
(1,358 | ) | (594 | ) | (341 | ) | ||||||
| Proceeds from issuance of common stock |
1,940 | 774 | 327 | |||||||||
|
|
|
|
|
|
|
|||||||
| Net cash provided by (used in) financing activities |
(6,634 | ) | (20,960 | ) | 50,371 | |||||||
|
|
|
|
|
|
|
|||||||
| Net increase in cash |
18,582 | 6,104 | 2,156 | |||||||||
| Cash and cash equivalents at beginning of year |
60,415 | 54,311 | 52,155 | |||||||||
|
|
|
|
|
|
|
|||||||
| Cash and cash equivalents at end of year |
$ | 78,997 | $ | 60,415 | $ | 54,311 | ||||||
|
|
|
|
|
|
|
|||||||
| Supplemental cash flow information: |
||||||||||||
| Income taxes paid |
$ | 3,525 | $ | 1,578 | $ | 5,311 | ||||||
| Income tax refunds |
$ | 1,356 | $ | 22 | $ | 682 | ||||||
| Interest paid |
$ | 2,035 | $ | 2,238 | $ | 1,551 | ||||||
| Non-cash investing and financing activities: |
||||||||||||
| Fair value of common shares issued for acquisition |
$ | — | $ | — | $ | 29,565 | ||||||
| Restricted stock issued |
$ | 7,190 | $ | 3,584 | $ | 4,763 | ||||||
| Fixed asset purchases included in accounts payable |
$ | 348 | $ | 180 | $ | 13 | ||||||
(See notes to consolidated financial statements)
49
Table of Contents
Ultra Clean Holdings, Inc.
Notes to Consolidated Financial Statements
1. Organization and Significant Accounting Policies
Organization — Ultra Clean Holdings, Inc. (UCT or the Company) was founded in November 2002 for the purpose of acquiring Ultra Clean Technology Systems and Service Inc. Ultra Clean Technology Systems and Service, Inc. was founded in 1991 by Mitsubishi Corporation and was operated as a subsidiary of Mitsubishi until November 2002, when it was acquired by UCT. UCT became a publicly traded company in March 2004. In June 2006, the Company completed the acquisition of Sieger Engineering, Inc. to better enhance its position as a subsystem supplier to the semiconductor, consumer, medical, energy, industrial, flat panel and research industries. Ultra Clean Technology (Shanghai) Co., Ltd and Ultra Clean Micro-Electronics Equipment (Shanghai) Co., Ltd. were established in 2005 and 2007, respectively, to facilitate the Company’s operations in China. Ultra Clean Asia Pacific, Pte, Ltd. (Singapore), was established in fiscal year 2008 to facilitate the Company’s operations in Singapore. In July 2012, the Company acquired American Integration Technologies LLC (“AIT”) to immediately add to the Company’s customer base in the semiconductor and medical markets. In November 2014, the Company launched its 3D printing business through a $40,000 acquisition of a privately held company, Prototype Asia, to develop additive manufacturing capability for the Company’s customer base. The Company operates in one reportable segment. See Note 10 to the Notes to Consolidated Financial Statements.
The Company is a leading developer and supplier of critical subsystems for Original Equipment Manufacturers primarily in the semiconductor, consumer, medical, energy, industrial, flat panel and research industries. The Company develops, designs, prototypes, engineers, manufactures and tests systems and subsystems which are highly specialized and integral to the Company’s customers products.
The Company provides its customers with complete solutions that combine its expertise in design, testing, component characterization and highly flexible global manufacturing operations with excellence in quality control and financial stability. The Company’s global presence and supply chain management helps the Company to drive down total manufacturing costs, reduce design-to-delivery cycle times and maintain high quality standards for the Company’s customers. The Company believes that these characteristics provide global solutions for the Company’s customers’ growing product demands.
The Company ships a majority of its products to U.S. registered customers with locations both in the U.S. and outside the U.S. In addition to U.S. manufacturing, the Company manufactures products in its Asian facilities to support local and U.S. based customers. The Company conducts its operating activities primarily through its wholly owned subsidiaries: Ultra Clean Technology Systems and Service, Inc., AIT LLC, Ultra Clean Technology (Shanghai) Co., Ltd., Ultra Clean Micro-Electronics Equipment (Shanghai) Co., Ltd. and Ultra Clean Asia Pacific, Pte Ltd. (Singapore). The Company’s international sales represented 29.6%, 28.5% and 22.2% of sales for fiscal years 2014, 2013 and 2012, respectively. See Note 10 to the Notes to Consolidated Financial Statements for further information about the Company’s geographic areas.
Principles of Consolidation — The Company’s consolidated financial statements include the accounts of the Company and its wholly-owned subsidiaries and all intercompany accounts and transactions have been eliminated in consolidation. The Company uses a 52-53 week fiscal year ending on the Friday nearest December 31. All references to quarters refer to fiscal quarters and all references to years refer to fiscal years.
In July 2012, the Company completed its acquisition of AIT. Beginning in the third quarter of fiscal 2012, the acquired business is included in the Company’s consolidated results of operations.
Foreign Currency Translation — The Company has reviewed its non-U.S. subsidiaries (of which all of its non-U.S. asset base resides in Asia) that operate in a local currency environment to determine their functional
50
Table of Contents
Ultra Clean Holdings, Inc.
Notes to Consolidated Financial Statements—(Continued)
currency by examining how and in what currency each subsidiary generates cash through billings and cash receipts and how and in what currency the subsidiary expends cash through payment of its vendors and payment of its workforce. Also, these subsidiaries’ individual assets and liabilities that are primarily denominated in the local foreign currency are examined for their impact on the Company’s cash flows. All have been determined to have the U.S. dollar as its functional currency. All balance sheet accounts of these local functional currency subsidiaries are translated at the fiscal period-end exchange rate, and income and expense accounts are translated using average rates in effect for the period, except for costs related to those balance sheet items that are translated using historical exchange rates. Foreign currency transaction gains and losses are recorded in other income (expense), net.
Use of Accounting Estimates — The presentation of financial statements in conformity with accounting principles generally accepted in the United States of America requires management to make estimates and assumptions that affect the reported amounts of assets and liabilities, and disclosures of contingent liabilities at the date of the financial statements and the reported amounts of revenues and expenses during the reporting period. Such estimates and assumptions include reserves on inventory, valuation of deferred tax assets and impairment of goodwill and other long-lived assets. The Company bases its estimates and judgments on historical experience and on various other assumptions that it believes are reasonable under the circumstances. However, future events are subject to change and the best estimates and judgments routinely require adjustment. Actual amounts may differ from those estimates.
Certain Significant Risks and Uncertainties — The Company operates in a dynamic industry and, accordingly, can be affected by a variety of factors. For example, any of the following areas could have a negative effect on the Company in terms of its future financial position, results of operations or cash flows: the general state of the U.S. and world economies, the highly cyclical nature of the industries the Company serves; the loss of any of a small number of customers; ability to obtain additional financing; inability to meet certain debt covenants; failure to successfully integrate completed acquisitions; ineffectiveness in pursuing acquisition opportunities; regulatory changes; fundamental changes in the technology underlying semiconductor, flat panel, solar and medical device manufacturing processes or manufacturing equipment; the hiring, training and retention of key employees; successful and timely completion of product design efforts; and new product design introductions by competitors.
Concentration of Credit Risk — Financial instruments which subject the Company to concentrations of credit risk consist principally of cash and cash equivalents and accounts receivable. The Company sells its products primarily to semiconductor capital equipment manufacturers in the United States. The Company performs credit evaluations of its customers’ financial condition and generally requires no collateral.
Significant sales to customers — The Company’s most significant customers (having accounted for 10% or more of annual sales) and their related sales as a percentage of total sales for each of the previous three years, were as follows:
| Fiscal Year Ended | ||||||||||||
| 2014 | 2013 | 2012 | ||||||||||
| Lam Research Corporation (1) |
38 | % | 33 | % | 33 | % | ||||||
| Applied Materials, Inc. |
23 | 35 | 38 | |||||||||
| ASM International, Inc. |
15 | 13 | — | |||||||||
|
|
|
|
|
|
|
|||||||
| Total |
76 | % | 81 | % | 71 | % | ||||||
|
|
|
|
|
|
|
|||||||
51
Table of Contents
Ultra Clean Holdings, Inc.
Notes to Consolidated Financial Statements—(Continued)
| (1) | In June 2012, Lam Research Corporation (Lam) completed the acquisition of Novellus Systems, Inc. (Novellus), one of the Company’s customers. The sales percentages for Lam for 2012 include sales to Novellus. |
Three customers’ accounts receivable balances: Lam Research Corporation, Applied Materials, Inc. and ASM International, Inc., were individually greater than 10% of accounts receivable as of December 26, 2014 and December 27, 2013 and, in the aggregate, represented approximately 74% and 82% of accounts receivable at December 26, 2014 and December 27, 2013, respectively.
Fair Value of Financial Instruments — The Company’s financial instruments consist of cash and cash equivalents, accounts receivable, accounts payable and bank borrowings. The carrying value of cash and cash equivalents, accounts receivable and accounts payable approximates their fair value because of their short-term nature.
The accounting guidance for fair value measurements prioritizes the inputs used in measuring fair value in the following hierarchy:
Level 1 — Quoted prices in active markets for identical assets or liabilities,
Level 2 — Observable inputs other than the Level 1 prices for similar assets or liabilities; quoted prices in active and inactive markets or other inputs that are observable or can be corroborated by observable market data for substantially the full term of assets or liabilities,
Level 3 — Unobservable inputs in which there is little or no market data, and that are significant to the fair value of the assets or liabilities.
The Company’s only financial asset measured at fair value on a recurring basis is an overnight sweep account invested in money market funds with maturities of less than 90 days from purchase and are thus classified as cash and cash equivalents on the Company’s balance sheet. These money market funds had a carrying value and fair value of $14.4 million at December 26, 2014, based on Level 2 inputs. The Company’s financial liabilities measured at fair value are related to the Company’s credit facility. Specifically, the fair value of the Company’s long term debt was based on level 2 inputs and fair value was determined using quoted prices for similar liabilities in inactive markets. The fair value of the Company’s outstanding borrowings under the Company’s revolving credit facility were based on level 2 inputs and fair value was determined using inputs other than quoted prices that are observable, specifically, discounted cash flows of expected payments at current borrowing rates. The Company’s carrying value approximates fair value for the Company’s long term debt and revolving credit facility.
Financial assets and liabilities measured at fair value as of December 26, 2014 and December 27, 2013 are summarized below (in thousands):
| Quoted Prices in Active Markets for Identical Assets (level 1) |
Significant Other Observable Inputs (level 2) |
Quoted Prices in Active Markets for Identical Assets (level 1) |
Significant Other Observable Inputs (level 2) |
|||||||||||||
| December 26, 2014 | December 27, 2013 | |||||||||||||||
| Money market fund deposits (1) |
$ | 14,396 | $ | — | $ | 13,414 | $ | — | ||||||||
| (1) | Included in cash and cash equivalents on the Consolidated Balance Sheet. The carrying amounts approximate fair value due to the short-term maturities of the cash equivalents. |
52
Table of Contents
Ultra Clean Holdings, Inc.
Notes to Consolidated Financial Statements—(Continued)
Inventories — Inventories are stated at the lower of standard cost (which approximates actual cost on a first-in, first-out basis) or market. The Company evaluates the valuation of all inventories, including raw materials, work-in-process, finished goods and spare parts on a periodic basis. Obsolete inventory or inventory in excess of management’s estimated usage is written-down to its estimated market value less costs to sell, if less than its cost. Inherent in the estimates of market value are management’s estimates related to economic trends, future demand for products, and technological obsolescence of the Company’s products.
Inventory write downs inherently involve judgments as to assumptions about expected future demand and the impact of market conditions on those assumptions. Although the Company believes that the assumptions it used in estimating inventory write downs are reasonable, significant changes in any one of the assumptions in the future could produce a significantly different result. There can be no assurances that future events and changing market conditions will not result in significant increases in inventory write downs.
At December 26, 2014 and December 27, 2013, inventory balances were $56.9 million and $63.9 million, respectively, net of reserves of $6.5 million and $6.8 million, respectively. The inventory write-downs are recorded as an inventory valuation allowance established on the basis of obsolete inventory or specific identified inventory in excess of estimated usage. Inventory write-downs were $4.6 million, including $2.6 million of inventory written off as part of the GTAT bankruptcy in the third quarter of 2014, $1.5 million and $1.2 million in the years ended December 26, 2014, December 27, 2013 and December 28, 2012, respectively.
Equipment and Leasehold Improvements — Equipment and leasehold improvements are stated at cost, or, in the case of equipment under capital leases, the present value of future minimum lease payments at inception of the related lease. Depreciation and amortization are computed using the straight-line method over the lesser of the estimated useful lives of the assets or the terms of the leases. Useful lives range from three to fifteen years.
Product Warranty — The Company provides a warranty on its products for a period of up to two years, and provides for warranty costs at the time of sale based on historical activity. Determination of the warranty reserve requires the Company to make estimates of product return rates and expected costs to repair or replace the products under warranty. If actual return rates and/or repair and replacement costs differ significantly from these estimates, adjustments to recognize additional cost of sales may be required in future periods. The warranty reserve is included in other current liabilities on the consolidated balance sheet. Product warranty cost activity consisted of the following (in thousands):
| Year Ended | ||||||||||||
| December 26, 2014 |
December 27, 2013 |
December 28, 2012 |
||||||||||
| Beginning Balance |
$ | 101 | $ | 152 | $ | 350 | ||||||
| Additions related to sales |
45 | 48 | 47 | |||||||||
| Warranty costs incurred |
(37 | ) | (99 | ) | (245 | ) | ||||||
|
|
|
|
|
|
|
|||||||
| Ending Balance |
$ | 109 | $ | 101 | $ | 152 | ||||||
|
|
|
|
|
|
|
|||||||
Income Taxes — The Company utilizes the asset and liability method of accounting for income taxes, under which deferred taxes are determined based on the temporary differences between the financial statement and tax basis of assets and liabilities using tax rates expected to be in effect during the years in which the basis differences reverse. Deferred income taxes arise from temporary differences between the tax basis of assets and liabilities and their reported amounts in the financial statements, which will result in taxable or deductible amounts in the future. In evaluating our ability to realize our deferred tax assets within the jurisdiction from which they arise, we consider all available positive and negative evidence, including scheduled reversals of
53
Table of Contents
Ultra Clean Holdings, Inc.
Notes to Consolidated Financial Statements—(Continued)
deferred tax liabilities, projected future taxable income, tax-planning strategies, and results of recent operations. In projecting future taxable income, we begin with historical results and incorporate assumptions about the amount of future state, federal, and foreign pretax operating income adjusted for items that do not have tax consequences. The assumptions about future taxable income require significant judgment and are consistent with the plans and estimates we are using to manage the underlying businesses. In evaluating the objective evidence that historical results provide, we consider recent cumulative income (loss). A valuation allowance is recorded when it is more likely than not that some of the deferred tax assets will not be realized.
The determination of the Company’s tax provision is subject to judgments and estimates. The Company assumes that it will be able to generate sufficient future income to fully realize the net deferred tax assets. In determining whether the realization of these deferred tax assets may be impaired, the Company makes judgments with respect to whether it is likely to generate sufficient future taxable income to realize these assets. In addition, the calculation of tax liabilities involves significant judgment in estimating the impact of uncertainties in the application of complex tax laws. Resolution of these uncertainties in a manner inconsistent with the Company’s expectations could have a material impact on the Company’s results of operations and financial position.
The Company performed a twelve quarter analysis of its U.S. cumulative pretax profit position as of December 26, 2014 and, weighing both positive and negative evidence, determined that it is more likely than not that it will have the ability to generate sufficient taxable income over the foreseeable future to realize its U.S. federal deferred tax assets. Therefore, the Company concluded that a valuation allowance on its U.S. federal deferred tax assets was not required.
In the third quarter of 2014, the Company weighed both positive and negative evidence and concluded that a full valuation allowance of $2.8 million on its California and Oregon deferred tax assets was appropriate. Among the negative evidence was the declaration of bankruptcy of a customer during the third quarter of 2014 and its impact on the Company’s ability to generate enough future table income in California and Oregon to fully utilize net operating losses carryforwards in those states before they expire.
As of December 26, 2014, the Company also maintained a full valuation allowance of $1.4 million on one of its China subsidiaries as the Company continues to believe it is not more likely than not that the deferred tax assets will be realized. In order to reverse a valuation allowance, accounting principles generally accepted in the United States of America suggest that the Company review the cumulative income/loss in recent years as well as determine the Company’s ability to generate sufficient future taxable income to realize the Company’s net deferred tax assets. The Company had a total valuation allowance on deferred tax assets in the amount of $4.2 million and $0.7 million as of December 26, 2014 and December 27, 2013, respectively.
Income tax positions must meet a more likely than not recognition threshold to be recognized. Income tax positions that previously failed to meet the more likely than not threshold are recognized in the first subsequent financial reporting period in which that threshold is met. Previously recognized tax positions that no longer meet the more likely than not threshold are derecognized in the first subsequent financial reporting period in which that threshold is no longer met. The Company recognizes potential accrued interest and penalties related to unrecognized tax benefits within the consolidated statements of income as income tax expense. The calculation of tax liabilities involves significant judgment in estimating the impact of uncertainties in the application of complex tax laws. Resolution of these uncertainties in a manner inconsistent with the Company’s expectations could have a material impact on its results of operations and financial position. Management believes that it has adequately provided for any adjustments that may result from these examinations; however, the outcome of tax audits cannot be predicted with certainty.
54
Table of Contents
Ultra Clean Holdings, Inc.
Notes to Consolidated Financial Statements—(Continued)
Revenue Recognition — Product revenue is generally recorded upon shipment. In arrangements which specify title transfer upon delivery, revenue is not recognized until the product is delivered. The Company recognizes revenue when persuasive evidence of an arrangement exists, shipment has occurred, price is fixed or determinable and collectability is reasonably assured. If the Company has not substantially completed a product or fulfilled the terms of a sales agreement at the time of shipment, revenue recognition is deferred until fulfillment. The Company’s standard arrangement for its customers includes a signed purchase order or contract, no right of return of delivered products and no customer acceptance provisions.
The Company assesses collectability based on the credit worthiness of the customer and past transaction history. The Company performs on-going credit evaluations of customers and generally does not require collateral from customers.
Research and Development Costs — Research and development costs are expensed as incurred.
Net Income per Share — Basic net income per share is computed by dividing net income by the weighted average number of shares outstanding for the period. Diluted net income per share is calculated by dividing net income by the weighted average number of common shares outstanding and common equivalent shares from dilutive stock options and restricted stock using the treasury stock method, except when such shares are anti-dilutive (see Note 9 to the Notes to Consolidated Financial Statements).
Comprehensive Income — The Company reports by major components and as a single total, the change in its net assets during the period from non-owner sources. Comprehensive income for all periods presented was the same as net income.
Segments — The Financial Accounting Standards Board’s (FASB) guidance regarding disclosure about segments in an enterprise and related information establishes standards for the reporting by public business enterprises of information about reportable segments, products and services, geographic areas, and major customers. The method for determining what information to report is based on the manner in which management organizes the reportable segments within the Company for making operational decisions and assessments of financial performance. The Company’s chief operating decision-maker is considered to be the Chief Executive Officer. The Company operates in one reporting segment.
Business Combinations — The Company recognizes assets acquired (including goodwill and identifiable intangible assets) and liabilities assumed at fair value on the acquisition date. Subsequent changes to the fair value of such assets acquired and liabilities assumed are recognized in earnings, after the expiration of the measurement period, a period not to exceed 12 months from the acquisition date. Acquisition-related expenses and acquisition-related restructuring costs are recognized in earnings in the period in which they are incurred.
Stock-based compensation
The Company maintains stock-based compensation plans which allow for the issuance of equity-based awards to executives and certain employees. These equity-based awards include stock options, restricted stock awards and restricted stock units. The Company also maintains an employee stock purchase plan (“ESPP”) that provides for the issuance of shares to all eligible employees of the Company at a discounted price.
Stock-based compensation expense includes compensation costs related to estimated fair values of stock options, units and awards granted. Stock-based compensation expense from stock options, restricted stock units and stock awards and the related income tax benefit recognized were $4.4 million and $1.3 million, respectively,
55
Table of Contents
Ultra Clean Holdings, Inc.
Notes to Consolidated Financial Statements—(Continued)
for fiscal year 2014, $4.7 million and $0.8 million, respectively, for fiscal year 2013 and $5.1 million and $1.2 million, respectively, for fiscal year 2012.
The estimated fair value of the Company’s equity-based awards, net of expected forfeitures, is amortized over the awards’ vesting period on a straight-line basis over a weighted average period of four years for stock options, three years for restricted stock units and one year for restricted stock awards and will be adjusted for subsequent changes in estimated forfeitures and future option grants.
The stockholders of the Company approved an increase in the number of shares available for issuance under our amended and restated stock incentive plan by 1,500,000 and 3,100,000 on June 10, 2010 and May 22, 2013, respectively.
Determining Fair Value for stock based compensation
Valuation and amortization method. The Company estimates the fair value of stock options granted using the Black-Scholes option valuation model and a single option award approach. All options are amortized over the requisite service periods of the awards, which are generally the vesting periods, and are amortized using the straight-line basis method.
Expected term. The expected term of options granted represents the period of time that they are expected to be outstanding. The Company estimates the expected term of options granted based on historical exercise patterns, which the Company believes are reasonably representative of future behavior.
Expected volatility. The Company estimates the volatility of its common stock at the date of grant based on historical volatility rates of the Company’s stock over the expected term.
Risk-free interest rate. The Company bases the risk-free interest rate on the implied yield in effect at the time of option grant on U.S. Treasury zero-coupon issues with equivalent remaining term.
Dividend yield. The Company has never paid any cash dividends on its common stock and does not anticipate paying any cash dividends in the foreseeable future. Consequently, the Company uses an expected dividend yield of 0.0%.
Forfeiture rate. The Company uses historical data to estimate pre-existing forfeitures, and records stock-based compensation for those awards that are expected to vest at the time of grant and revises those estimates in subsequent periods if actual forfeitures differ from those estimates.
The exercise price of each stock option equals the market price of the Company’s stock on the date of grant. There were no employee stock option grants by the Company for years 2014, 2013 and 2012. Generally, options vest over four years and expire no later than ten years from the grant date. During fiscal years 2014, 2013 and 2012, the Company recorded $3.1 million, $3.9 million and $3.9 million, respectively, of stock-based compensation expense, net of tax, associated with employee and director stock plans and employee stock purchase plan programs. As of December 26, 2014, there was $5.2 million, net of forfeitures of $1.2 million, of unrecognized compensation cost related to employee and director stock which is expected to be recognized on a straight-line basis over a weighted average period of approximately 1.6 years, and will be adjusted for subsequent changes in estimated forfeitures and future grants.
56
Table of Contents
Ultra Clean Holdings, Inc.
Notes to Consolidated Financial Statements—(Continued)
Total stock-based compensation during the fiscal years 2014, 2013 and 2012, respectively, to various expense categories was as follows (in thousands):
| Year Ended | ||||||||||||
| December 26, 2014 |
December 27, 2013 |
December 28, 2012 |
||||||||||
| Cost of goods sold (1) |
$ | 1,195 | $ | 1,197 | $ | 1,263 | ||||||
| Sales and marketing |
428 | 474 | 475 | |||||||||
| Research and development |
156 | 290 | 339 | |||||||||
| General and administrative |
2,621 | 2,724 | 2,992 | |||||||||
|
|
|
|
|
|
|
|||||||
| 4,400 | 4,685 | 5,069 | ||||||||||
| Income tax benefit |
(1,342 | ) | (810 | ) | (1,171 | ) | ||||||
|
|
|
|
|
|
|
|||||||
| Net stock-based compensation expense |
$ | 3,058 | $ | 3,875 | $ | 3,898 | ||||||
|
|
|
|
|
|
|
|||||||
| (1) | Stock-based compensation expenses capitalized in inventory for fiscal years 2014, 2013 and 2012 were considered immaterial. At the end of fiscal 2012, the Company began including stock compensation as a component of the absorption calculation for inventory. |
Intangible Assets
Goodwill and indefinite-lived intangible assets are not amortized, but are reviewed for impairment annually. Purchased intangible assets are presented at cost, net of accumulated amortization, and are amortized on either a straight-line method or on an accelerated method over their estimated future discounted cash flows. The Company accounts for intangible assets in accordance with ASC 360. The Company reviews goodwill and purchased intangible assets with indefinite lives for impairment annually and whenever events or changes in circumstances indicate the carrying value of an asset may not be recoverable, such as when reductions in demand or significant economic slowdowns in the semiconductor industry are present.
Intangible assets reviews are performed to determine whether the carrying value is impaired, based on comparisons to undiscounted expected future cash flows. If this comparison indicates that there is impairment, the impaired asset is written down to fair value, which is typically calculated using: (i) quoted market prices or (ii) discounted expected future cash flows utilizing a discount rate. See Note 4 to the Notes to Consolidated Financial Statements for further discussion.
Goodwill is recorded as the difference, if any, between the aggregate consideration paid for an acquisition and the fair value of the net tangible and intangible assets acquired. The Company tests goodwill for impairment at the reporting unit level (operating segment or one level below an operating segment) on an annual basis in the fourth quarter of each fiscal year or more frequently if the Company believes indicators of impairment exist. The performance of the test involves a two-step process. The first step of the impairment test involves comparing the fair values of the applicable reporting units with their aggregate carrying values, including goodwill. The Company generally determines the fair value of the Company’s reporting units using the income approach methodology of valuation that includes the discounted cash flow method as well as other generally accepted valuation methodologies. If the carrying amount of a reporting unit exceeds the reporting unit’s fair value, the Company performs the second step of the goodwill impairment test to determine the amount of impairment loss. The second step of the goodwill impairment test involves comparing the implied fair value of the affected reporting unit’s goodwill with the carrying value of that goodwill. The Company would then record a charge based on the results of the second step.
57
Table of Contents
Ultra Clean Holdings, Inc.
Notes to Consolidated Financial Statements—(Continued)
Long-lived Assets
The Company evaluates long-lived assets for impairment whenever events or changes in circumstances indicate the carrying value of an asset group may not be recoverable. The Company assesses the fair value of the assets based on the amount of the undiscounted future cash flows that the assets are expected to generate and recognizes an impairment loss when estimated undiscounted future cash flows expected to result from the use of the asset are less than the carrying value of the asset. If the Company identifies an impairment, the Company reduces the carrying value of the group of assets to comparable market values, when available and appropriate, or to its estimated fair value based on a discounted cash flow approach.
At the end of fiscal years 2014, 2013 and 2012, the Company assessed the useful lives of its long-lived assets, including property, plant and equipment as well as its intangible assets and concluded that no impairment was required.
Recently Issued Accounting Standards
In May 2014, the FASB issued Accounting Standards Update No. 2014-09 (ASU 2014-09) “Revenue from Contracts with Customers.” ASU 2014-09 amends the revenue recognition requirements in “Revenue Recognition (Topic 605)”, and requires entities to recognize revenue when it transfers promised goods or services to customers in an amount that reflects the consideration to which the entity expects to be entitled to in exchange for those goods or services. ASU 2014-09 is effective for annual reporting periods beginning after December 15, 2016, including interim periods within that reporting period. Early adoption is not permitted. The amendments may be applied retrospectively to each prior period presented or retrospectively with the cumulative effect recognized as of the date of initial application. The Company is currently in the process of evaluating the impact of the adoption of ASU 2014-09 on its consolidated financial statements.
2. Balance Sheet Information
Inventory consisted of the following (in thousands):
| December 26, 2014 |
December 27, 2013 |
|||||||
| Raw materials |
$ | 45,294 | $ | 49,515 | ||||
| Work in process |
14,103 | 19,437 | ||||||
| Finished goods |
3,922 | 1,815 | ||||||
|
|
|
|
|
|||||
| 63,319 | 70,767 | |||||||
| Reserve for excess and obsolete |
(6,469 | ) | (6,825 | ) | ||||
|
|
|
|
|
|||||
| Total |
$ | 56,850 | $ | 63,942 | ||||
|
|
|
|
|
|||||
58
Table of Contents
Ultra Clean Holdings, Inc.
Notes to Consolidated Financial Statements—(Continued)
Equipment and leasehold improvements, net, consisted of the following (in thousands):
| December 26, 2014 |
December 27, 2013 |
|||||||
| Computer equipment and software |
$ | 9,299 | $ | 8,280 | ||||
| Furniture and fixtures |
2,582 | 2,411 | ||||||
| Machinery and equipment |
10,774 | 9,249 | ||||||
| Leasehold improvements |
12,847 | 10,583 | ||||||
|
|
|
|
|
|||||
| 35,502 | 30,523 | |||||||
| Accumulated depreciation |
(24,661 | ) | (21,989 | ) | ||||
|
|
|
|
|
|||||
| Total |
$ | 10,841 | $ | 8,534 | ||||
|
|
|
|
|
|||||
3. Acquisitions
On July 3, 2012, the Company completed the acquisition of American Integration Technologies LLC (“AIT”), a supplier of critical subsystems to the semiconductor capital equipment, medical, energy, industrial and aerospace industries, for approximately $75.3 million in cash and 4.5 million shares of newly issued common stock valued at $29.6 million for a total purchase price of $104.9 million. The acquisition served to increase the Company’s competitive position and market share, as it resulted in an expansion and diversification of the Company’s customer base and product and service portfolio. By acquiring AIT’s complementary product and service portfolio and well established customers, the Company was able to immediately go to market with a more complete and integrated solution. The Company financed the cash portion of the merger, and repaid existing indebtedness, by borrowing a total of $79.8 million under a senior secured credit facility, of which $40.0 million represents borrowings under a term loan and $39.8 million represents borrowings under a revolving credit facility. See further discussion of the borrowing arrangements in Note 5 to the Notes to Consolidated Financial Statements.
The Company allocated the purchase price of AIT to tangible assets, liabilities and identifiable intangible assets acquired, based on their estimated fair values. The excess of purchase price over the aggregate fair values was recorded as goodwill. Goodwill associated with the acquisition is primarily attributable to the expected synergies and other benefits that the Company believes will result from combining operations of the Company and AIT. Although goodwill is not amortized for financial accounting purposes, it is amortized for tax purposes over fifteen years.
The results of operations of AIT are included in the Company’s consolidated results of operations beginning in the third quarter of fiscal 2012. For the six months ended December 28, 2012, net sales of approximately $63.8 million and net income of approximately $6.8 million attributable to AIT were included in the consolidated results of operations.
59
Table of Contents
Ultra Clean Holdings, Inc.
Notes to Consolidated Financial Statements—(Continued)
The following unaudited pro forma consolidated results for 2012 combine the historical results of the Company for fiscal year 2012 along with the historical results of AIT during 2012 as if AIT was acquired on December 31, 2011:
| 2012 (In thousands, except per share amounts) |
||||
| Net sales |
$ | 470,275 | ||
| Net income |
$ | 9,305 | ||
| Basic earnings per share |
$ | 0.34 | ||
| Diluted earnings per share |
$ | 0.33 | ||
The unaudited pro forma results above include adjustments related to the purchase price allocation and financing of the acquisition, primarily to increase amortization for the identifiable intangible assets, to increase interest expense for the additional debt incurred to complete the acquisition, to reflect the related income tax effect and to adjust weighted shares issued as part of the acquisition. The pro forma results for the year ended December 30, 2011 include acquisition costs of $2.4 million which are not expected to occur in future quarters. The unaudited pro forma condensed combined financial information was prepared by management for illustrative purposes only and are not necessarily indicative of the consolidated financial position or results of operations in future periods or the results that actually would have been realized had UCT and AIT been a combined company during the specified periods. The unaudited pro forma financial information does not reflect any operating efficiencies and/or cost savings that the Company may achieve with respect to the combined companies, or any liabilities that may result from integration activities.
In November 2014, the Company launched its 3D printing business through a $40,000 acquisition of a privately held company, Prototype Asia, to develop additive manufacturing capability for the Company’s customer base. This acquisition enables the Company to produce molds and fixtures for quick-turn production and to provide complex parts that cannot otherwise be manufactured. The proforma effects of this acquisition would not be material to the Company’s results of operations for the year ended December 26, 2014 and therefor is not presented.
4. Goodwill and Purchased Intangible Assets
The Company’s methodology for allocating the purchase price relating to purchase acquisitions is determined through established and generally accepted valuation techniques. Goodwill is measured as the excess of the cost of the acquisition over the sum of the amounts assigned to tangible and identifiable intangible assets acquired less liabilities assumed. Goodwill and purchased intangible assets with indefinite useful lives are not amortized, but are reviewed for impairment at least annually and whenever events or changes in circumstances indicate that the carrying value of an asset may not be recoverable. The process of evaluating the potential impairment of goodwill and intangible assets requires significant judgment. The Company regularly monitors current business conditions and other factors including, but not limited to, adverse industry or economic trends and lower projections of profitability that may impact future operating results.
As part of the Company’s annual testing of goodwill impairment, in the fourth quarter of fiscal 2014 the Company performed the two-step impairment test of AIT’s two reporting units for potential impairment. The Company utilized the discounted cash flow method of the income approach to estimate the fair values of each of the reporting units. The estimates used in the impairment testing were consistent with the discrete forecasts that the Company uses to manage its business, and, additionally, considered the developments that occurred during
60
Table of Contents
Ultra Clean Holdings, Inc.
Notes to Consolidated Financial Statements—(Continued)
the eighteen months since the date of the acquisition. Under the discounted cash flow method, cash flows beyond the discrete forecasts were estimated using a terminal growth rate of 4.0%, which is considered to be the long-term earnings growth rate specific to the Company and to AIT’s two reporting units. The estimated future cash flows were discounted to present value using a discount rate of 15% that was the value-weighted average of the reporting unit’s estimated cost of equity and debt derived using both known and estimated market metrics, and was adjusted to reflect risk factors that considered both the timing and risks associated with the estimated cash flows. The tax rate used in the discounted cash flow method reflected the international structure currently in place, which is consistent with the market participant perspective. The Company then allocated the fair values of the reporting units to the assets and liabilities of each of the reporting units. Based on the Company’s analyses, the Company concluded that the fair value of the reporting units was greater than their carrying amounts, including goodwill. The estimated fair value for AIT as of December 26, 2014, was $104.3 million, a slight decrease of $0.6 million, or 0.6%, over the estimated fair value of $104.9 million of AIT as of the date of the acquisition. Goodwill allocated to AIT’s reporting unit A was $27.6 million. The percentage of fair value over the carrying value of AIT’s reporting unit A was 12.0% as of December 26, 2014. Goodwill allocated to AIT’s reporting unit B was $28.3 million and the percentage of fair value over the carrying value of reporting unit B was 33.9% as of December 26, 2014. As a result, the Company determined that there was no impairment of goodwill.
Details of aggregate goodwill of the Company from inception through December 26, 2014 and December 27, 2013 are as follows (in thousands):
| Gross Amount |
Accumulated Impairment* |
Net Carrying Amount |
||||||||||
| Year Ended December 26, 2014 |
||||||||||||
| Goodwill |
$ | 89,961 | $ | (34,043 | ) | $ | 55,918 | |||||
| Year Ended December 27, 2013 |
||||||||||||
| Goodwill |
$ | 89,961 | $ | (34,043 | ) | $ | 55,918 | |||||
| * | Represents goodwill recorded for UCT in 2002 and Sieger Engineering in 2006, which was fully impaired in prior years. |
Details of goodwill and other intangible assets were as follows (in thousands):
| December 26, 2014 | December 27, 2013 | |||||||||||||||||||||||
| Goodwill | Intangible Assets |
Total | Goodwill | Intangible Assets |
Total | |||||||||||||||||||
| Carrying amount |
$ | 55,918 | $ | 16,824 | $ | 72,742 | $ | 55,918 | $ | 21,708 | $ | 77,626 | ||||||||||||
During the quarter ended June 28, 2013, the Company completed the purchase price allocation for the acquisition of AIT on July 2, 2012. During the six months ended June 28, 2013, the Company reduced its goodwill balance by $0.7 million due to a change in the provisional measurement of acquired inventory and sales and use tax balances.
Purchased Intangible Assets
Intangible assets are generally recorded in connection with a business acquisition. The value assigned to the intangible assets purchased as part of the acquisition of AIT was based on estimates and judgments regarding expectations for the success and life cycle of intellectual property/know-how acquired, tradename recognition and developed customer relationships. The Company evaluates the useful lives of its intangible assets each
61
Table of Contents
Ultra Clean Holdings, Inc.
Notes to Consolidated Financial Statements—(Continued)
reporting period to determine whether events and circumstances require revising the remaining period of amortization. In addition, the Company reviews indefinite lived intangible assets for impairment when events or changes in circumstances indicate their carrying value may not be recoverable and tests definite lived intangible assets annually for impairment. Management considers such indicators as significant differences in actual product acceptance from the estimates, changes in the competitive and economic environment, technological advances, and changes in cost structure.
Details of purchased intangible assets were as follows (in thousands):
| As of December 26, 2014 | As of December 27, 2013 | |||||||||||||||||||||||||||
| Gross Carrying Amount |
Accumulated Amortization |
Carrying Value |
Gross Carrying Amount |
Accumulated Amortization |
Carrying Value |
Useful Life (in years) |
||||||||||||||||||||||
| Customer relationships |
$ | 19,000 | $ | (13,011 | ) | $ | 5,989 | $ | 19,000 | $ | (8,764 | ) | $ | 10,236 | 7 | |||||||||||||
| Tradename (AIT ) |
1,900 | (1,081 | ) | 819 | 1,900 | (672 | ) | 1,228 | 6 | |||||||||||||||||||
| Intellectual property |
1,600 | (571 | ) | 1,029 | 1,600 | (343 | ) | 1,257 | 7 | |||||||||||||||||||
| Tradenames (UCT ) |
8,987 | — | 8,987 | 8,987 | — | 8,987 | * | |||||||||||||||||||||
|
|
|
|
|
|
|
|
|
|
|
|
|
|||||||||||||||||
| $ | 31,487 | $ | (14,663 | ) | $ | 16,824 | $ | 31,487 | $ | (9,779 | ) | $ | 21,708 | |||||||||||||||
|
|
|
|
|
|
|
|
|
|
|
|
|
|||||||||||||||||
The Company amortizes its tradename and customer relationships intangible assets using an accelerated method over the estimated economic life of the assets, ranging from 5 to 7 years. The Company amortizes its intellectual property/know-how intangible asset on a straight-line basis with an estimated economic life of seven years. Amortization expense was approximately $4.9 million for the year ended December 26, 2014, $6.0 million for the year ended December 27, 2013 and $3.8 for the year ended December 28, 2012.
As of December 26, 2014, future estimated amortization expense is expected to be as follows:
| Amortization Expense |
||||
| (in thousands) | ||||
| 2015 |
$ | 2,813 | ||
| 2016 |
2,293 | |||
| 2017 |
1,386 | |||
| 2018 |
848 | |||
| 2019 |
497 | |||
|
|
|
|||
| Total |
$ | 7,837 | ||
|
|
|
|||
In addition to the AIT tradename intangible of $1.9 million, the Company is also carrying a UCT trade-name intangible asset of $9.0 million as a result of a previous acquisition. The Company concluded that the UCT trade-name intangible asset life is indefinite and is therefore not amortized. The Company tested the UCT trade-name for impairment as of December 26, 2014, using the applied relief-from-royalty method under the income approach and concluded that the trade-name was not impaired.
5. Borrowing Arrangements
As of December 26, 2014, the Company had borrowing arrangements with Silicon Valley Bank under a Loan and Security Agreement (the “Loan Agreement”) which included a $40.0 million revolving credit facility (“Revolver”), maturing on July 3, 2016, and a $40.0 million term loan (“Term Loan”), maturing on July 3, 2016.
62
Table of Contents
Ultra Clean Holdings, Inc.
Notes to Consolidated Financial Statements—(Continued)
The aggregate amount of the Revolver was secured by substantially all of the Company’s assets. As of December 26, 2014, the outstanding balances of the Term Loan and Revolver were $17.5 million and $31.3 million, respectively.
The interest rate on the Revolver during the twelve months ended December 26, 2014 was 3.75%. Pursuant to the Loan Agreement, the Term Loan bears interest per annum at a variable rate equal to the greater of prime rate, as defined per the Loan Agreement, plus a margin of 75 basis points. During the twelve months ended and as of December 26, 2014, the interest rate on the outstanding Term Loan was 3.75%. The Loan Agreement contains a number of financial and reporting covenants. The Company was in compliance with all of such covenants as of December 26, 2014.
In February 2015, the Company entered into a new credit agreement (the “Credit Agreement”) by and among the Company, certain of its subsidiaries, East West Bank and Citi National Bank (collectively, the “Lenders”). The Credit Agreement provides for a term loan in an aggregate principal amount of $40.0 million (the “New Term Loan”) and a revolving credit facility in an aggregate principal amount of $40.0 million (the “New Revolving Credit Facility”), a letter of credit facility in the aggregate availability amount of $20.0 million (as a sublimit of such New Revolving Credit Facility) (the “L/C Facility”) and a swingline sub-facility in the aggregate availability amount of $5.0 million (as a sublimit of the New Revolving Credit Facility) (together with the Term Loan, the Revolving Credit Facility and the L/C Facility, the “Senior Secured Credit Facility”). On February 2, 2015, the Company borrowed an aggregate of $40.0 million under the New Term Loan and approximately $6.5 million under the New Revolving Credit Facility. The borrowed funds were used to repay the outstanding balance to Silicon Valley Bank as lender under our prior Loan Agreement. The prior Loan Agreement was terminated in connection with this transaction and, as a result, the outstanding balance of the revolver of $31.3 million was classified as long-term debt as of December 26, 2014 in accordance with the terms of the new debt agreement. In addition, we will expense the unamortized debt issuance costs of approximately $0.7 million in the first quarter of 2015. On February 5, 2015, in connection with the acquisition of Marchi Thermal Systems, Inc. (“Marchi”), the Company borrowed $29.7 million under the New Revolving Credit Facility. The borrowed funds were used to finance the acquisition.
The New Term Loan must be repaid in consecutive quarterly installments of $2.5 million, with the first payment due on March 31, 2015, and with the balance of the outstanding principal amount of the New Term Loan due at the final maturity, which is February 2, 2019. The New Revolving Credit Facility is available for the four-year period beginning on February 2, 2015. The Credit Agreement includes customary representations, warranties, covenants and events of default. The Company and certain of its subsidiaries have agreed to secure all of their obligations under the Credit Agreement by granting a first priority lien in substantially all of their respective personal property assets (subject to certain exceptions and limitations).
At the Company’s option, borrowings under the New Term Loan and New Revolving Credit Facility (subject to certain limitations) bear interest at either a base rate or at the London Interbank Offered Rate (“LIBOR”) (with the LIBOR being adjusted for certain Eurocurrency reserve requirements, if any, as described in the Credit Agreement), plus, in each case, an applicable margin based on the Company’s consolidated leverage ratio. All loans described above made on February 2, 2015 were initially base rate loans, carrying interest of 3.25%. The Company expects, however, that the effective interest rate will be higher due to the incurrence of certain loan-related costs that will be treated as discount on the debt and amortized over the life of the loan.
The Credit Agreement requires the Company to maintain certain financial covenants including a consolidated fixed charge coverage ratio (as defined in the Credit Agreement) of at least 1.25 to 1.00 starting with the end of the first quarter of fiscal 2015 and a consolidated leverage ratio (as defined in the Credit
63
Table of Contents
Ultra Clean Holdings, Inc.
Notes to Consolidated Financial Statements—(Continued)
Agreement) no greater than 3.5 to 1.00 starting with the end of the first quarter of fiscal 2015. The Credit Agreement also includes other customary affirmative and negative covenants.
The Credit Agreement also contains provisions requiring the following mandatory prepayments (subject to certain exceptions and limitations): annual prepayments in an amount equal to (a) 33% of excess cash flow (as defined in the Credit Agreement) if the aggregate outstanding principal amount of the New Term Loan equals or exceeds $20.0 million and (b) 25% of excess cash flow if the aggregate outstanding principal amount of the New Term Loan equals or exceeds $10.0 million but is less than $20.0 million. The Credit Agreement also restricts us from declaring or paying any cash dividends.
6. Income Taxes
U.S. and foreign components of income before income taxes were (in thousands):
| Year Ended | ||||||||||||
| December 26, 2014 |
December 27, 2013 |
December 28, 2012 |
||||||||||
| U.S. operations |
$ | (452 | ) | $ | (906 | ) | $ | (5,546 | ) | |||
| Foreign operations |
16,782 | 13,505 | 12,243 | |||||||||
|
|
|
|
|
|
|
|||||||
| Total pretax income |
$ | 16,330 | $ | 12,599 | $ | 6,697 | ||||||
|
|
|
|
|
|
|
|||||||
The provision for income taxes consisted of the following (in thousands):
| Year Ended | ||||||||||||
| December 26, 2014 |
December 27, 2013 |
December 28, 2012 |
||||||||||
| Current: |
||||||||||||
| Federal |
$ | (451 | ) | $ | 201 | $ | 537 | |||||
| State |
118 | 89 | 139 | |||||||||
| Foreign |
2,839 | 1,675 | 3,608 | |||||||||
|
|
|
|
|
|
|
|||||||
| Total current |
2,506 | 1,965 | 4,284 | |||||||||
|
|
|
|
|
|
|
|||||||
| Deferred: |
||||||||||||
| Federal |
(404 | ) | (252 | ) | (2,141 | ) | ||||||
| State |
2,722 | 28 | (418 | ) | ||||||||
| Foreign |
149 | 434 | (181 | ) | ||||||||
|
|
|
|
|
|
|
|||||||
| Total deferred |
2,467 | 210 | (2,740 | ) | ||||||||
|
|
|
|
|
|
|
|||||||
| Total provision |
$ | 4,973 | $ | 2,175 | $ | 1,544 | ||||||
|
|
|
|
|
|
|
|||||||
64
Table of Contents
Ultra Clean Holdings, Inc.
Notes to Consolidated Financial Statements—(Continued)
Significant components of net deferred tax assets and deferred tax liabilities for federal and state income taxes were as follows (in thousands):
| Year Ended | ||||||||
| December 26 2014 |
December 27 2013 |
|||||||
| Net current deferred tax asset: |
||||||||
| Inventory valuation and basis difference |
$ | 3,243 | $ | 2,601 | ||||
| Other accrued expenses |
2,324 | 2,153 | ||||||
| State taxes |
42 | (198 | ) | |||||
|
|
|
|
|
|||||
| 5,609 | 4,556 | |||||||
| Valuation allowance |
(1,582 | ) | (85 | ) | ||||
|
|
|
|
|
|||||
| Net current deferred tax asset |
4,027 | 4,471 | ||||||
| Net non-current deferred tax asset: |
||||||||
| Deferred rent |
15 | 20 | ||||||
| Other accrued expenses |
2,622 | 3,085 | ||||||
| Depreciation |
1,465 | 1,491 | ||||||
| Net operating losses |
1,934 | 2,029 | ||||||
| State taxes |
— | (715 | ) | |||||
|
|
|
|
|
|||||
| 6,036 | 5,910 | |||||||
| Valuation allowance |
(2,590 | ) | (569 | ) | ||||
|
|
|
|
|
|||||
| Net non-current deferred tax asset |
3,446 | 5,341 | ||||||
|
|
|
|
|
|||||
| Total deferred tax asset |
7,473 | 9,812 | ||||||
| Current deferred tax liability: |
||||||||
| Undistributed earnings |
(526 | ) | (400 | ) | ||||
|
|
|
|
|
|||||
| Net deferred tax assets |
$ | 6,947 | $ | 9,412 | ||||
|
|
|
|
|
|||||
The effective tax rate differs from the U.S. federal statutory tax rate as follows:
| Year Ended | ||||||||||||
| December 26, 2014 |
December 27, 2013 |
December 28, 2012 |
||||||||||
| Federal income tax provision at statutory rate |
34.0 | % | 34.0 | % | 34.0 | % | ||||||
| State income taxes, net of federal benefit |
0.2 | % | 0.6 | % | (2.8 | )% | ||||||
| Effect of foreign operations |
(19.8 | )% | (18.7 | )% | (15.8 | )% | ||||||
| Valuation allowance |
11.3 | % | (1.6 | )% | 6.1 | % | ||||||
| Other |
4.8 | % | 3.0 | % | 1.6 | % | ||||||
|
|
|
|
|
|
|
|||||||
| Effective Tax Rate |
30.5 | % | 17.3 | % | 23.1 | % | ||||||
|
|
|
|
|
|
|
|||||||
The provision for the year ended December 26, 2014, includes a charge of $2.8 million and $0.7 million related to the valuation allowance on deferred tax assets for California and Oregon and one of the Company’s subsidiaries in China, respectively, as the Company believes it is more likely than not that these deferred tax assets will not be realized. The provision for the year ended December 27, 2013, includes a decrease of $0.2
million to the valuation allowance on the deferred tax assets of one of its China subsidiaries as a result of a decrease in deferred tax assets for which there is a full valuation allowance. The provision for the year ended December 28, 2012, includes an increase of $0.4 million to the valuation allowance on the deferred tax assets of
65
Table of Contents
Ultra Clean Holdings, Inc.
Notes to Consolidated Financial Statements—(Continued)
one of its China subsidiaries as a result of an increase in deferred tax assets for which there is a full valuation allowance.
The Company earns a significant amount of its operating income outside the United States, which is deemed to be indefinitely reinvested in foreign jurisdictions. As a result, most of the Company’s cash and cash equivalents is held by foreign subsidiaries. The Company currently does not intend nor foresee a need to repatriate these funds to the U.S. The Company expects existing domestic cash and cash flows from operations to continue to be sufficient to fund its domestic operating activities and cash commitments for investing and financing activities, such as debt repayment and capital expenditures, for at least the next 12 months and thereafter for the foreseeable future. If the Company should require more capital in the U.S. than is generated by its domestic operations, for example to fund significant discretionary activities such as business acquisitions, the Company could elect to repatriate future earnings from foreign jurisdictions or raise capital in the United States through debt or equity issuances. These alternatives could result in higher effective tax rates, increased interest expense, or dilution of our earnings. The Company has borrowed funds domestically and continues to believe it has the ability to do so at reasonable interest rates. The Company does not provide for U.S. taxes on its undistributed earnings of foreign subsidiaries that it intends to invest indefinitely outside the U.S., unless such taxes are otherwise required under U.S. tax law. In 2014, the Company determined that a portion of the current year earnings of one its China subsidiaries may be remitted in the future to one of its foreign subsidiaries outside of mainland China and, accordingly, the Company provided for the related withholding taxes in its consolidated financial statements. If the Company changes its intent to reinvest its undistributed foreign earnings indefinitely or if a greater amount of undistributed earnings are needed than the previous anticipated remaining unremitted foreign earnings, the Company could be required to accrue or pay U.S. taxes on some or all of these undistributed earnings. As of December 26, 2014, the Company had undistributed earnings of foreign subsidiaries that are indefinitely invested outside of the U.S. of approximately $57.6 million. It is not practicable to determine the income tax liability that might be incurred if these earnings were to be distributed.
The following table summarizes the activity related to the Company’s unrecognized tax benefits (in thousands):
| Balance as of December 28, 2012 |
$ | 109 | ||
| Increases related to prior year tax positions |
— | |||
| Increases related to current year tax positions |
79 | |||
| Releases due to settlements |
(23 | ) | ||
|
|
|
|||
| Balance as of December 27, 2013 |
165 | |||
| Increases related to prior year tax positions |
— | |||
| Increases related to current year tax positions |
205 | |||
| Expiration of the statute of limitations for the assessment of taxes |
(14 | ) | ||
|
|
|
|||
| Balance as of December 26, 2014 |
$ | 356 | ||
|
|
|
The Company’s gross liability for unrecognized tax benefits as of December 26, 2014 and December 27, 2013 was $0.4 million and $0.2 million, respectively. Increases or decreases to interest and penalties on uncertain tax positions are included in the income tax provision in the Consolidated Statements of Operations. Interest related to uncertain tax positions for the periods ended December 26, 2014, December 27, 2013 and December 28, 2012 was considered to be diminimus. Although it is possible some of the unrecognized tax benefits could be settled within the next twelve months, the Company cannot reasonably estimate the outcome at this time.
66
Table of Contents
Ultra Clean Holdings, Inc.
Notes to Consolidated Financial Statements—(Continued)
Tax attributes related to equity award windfall deductions are not recorded until they result in a reduction of cash tax payable. As of December 26, 2014, the benefit of the federal net operating losses from windfall deductions were excluded from the deferred tax asset balance as of December 26, 2014. As of December 26, 2014, the benefit of federal and California net operating loss deductions of $1.3 and $0.2 million, respectively, will be recorded to additional paid-in capital when it reduces cash taxes payable.
The Company files income tax returns in the U.S. federal jurisdiction, various states and foreign jurisdictions. The Company’s 2011 through 2013 federal income tax returns are open to audit through the statute of limitations by the Internal Revenue Service. The Company’s 2010 through 2013 state income tax returns are open to audit by the California Franchise Tax Board. The statute of limitations remains open back to 2008 for California and Oregon to the extent of the unutilized net operating losses. The Company is also subject to examination in various other jurisdictions for various periods.
The Company is currently experiencing a zero rate tax holiday related to its Singapore subsidiary that will expire for tax years beginning January 2016. This tax rate is subject to achieving certain commitments agreed to with the Economic Development Board of Singapore including investment and employment thresholds. The Company’s Singapore subsidiary recorded a net profit of $7.1 million for the year ended December 26, 2014.
7. Stockholders’ Equity
Stock Repurchase Plan — On July 24, 2008, the Board of Directors approved a stock repurchase program for up to $10.0 million. The Company commenced the repurchase of its common stock on August 4, 2008. The total number of shares repurchased and related cost of the stock repurchase program were 601,994 shares at a cost of $3,337,000, or an average cost of $5.54 per share. The Company has not repurchased stock during any of the fiscal years after 2008.
8. Employee Benefit Plans
Stock Options — On February 20, 2003, the Company adopted the 2003 Stock Incentive Plan (the “2003 Incentive Plan”) which was subsequently amended and restated. The Company has reserved 4,515,239 shares of its common stock for issuance under the 2003 Incentive Plan. The 2003 Incentive Plan provides for the issuance of options and other stock-based awards. Options are generally granted at fair value at the date of grant as determined by the Board of Directors and have terms up to ten years and generally vest over four years.
The stockholders of the Company approved amendments to the Company’s 2003 Stock Incentive Plan, which included an increase in shares available for issuance by 1,500,000 and 3,100,000 common shares which are more fully described in the Company’s definitive proxy statements filed on April 23, 2010 and May 27, 2013, respectively. At December 26, 2014, 2,110,644 shares were available for future grants under the 2003 Incentive Plan.
67
Table of Contents
Ultra Clean Holdings, Inc.
Notes to Consolidated Financial Statements—(Continued)
Option activity under the 2003 Incentive Plan is as follows:
| Shares | Weighted Average Exercise Price |
Weighted Average Remaining Contractual Life |
Aggregate Intrinsic Value (in thousands) |
|||||||||||||
| Outstanding, December 30, 2011 |
1,654,691 | $ | 6.54 | 5.02 | $ | 2,776 | ||||||||||
| Exercised |
(127,904 | ) | 1.28 | |||||||||||||
| Cancelled |
(12,674 | ) | 7.55 | |||||||||||||
|
|
|
|||||||||||||||
| Outstanding, December 28, 2012 |
1,514,113 | $ | 6.98 | 4.02 | $ | 1,445 | ||||||||||
| Exercised |
(266,296 | ) | 2.28 | |||||||||||||
| Cancelled |
(38,698 | ) | 11.76 | |||||||||||||
|
|
|
|||||||||||||||
| Outstanding, December 27, 2013 |
1,209,119 | $ | 7.86 | 2.86 | $ | 3,976 | ||||||||||
| Exercised |
(343,947 | ) | 5.11 | |||||||||||||
| Cancelled |
(11,621 | ) | 14.40 | |||||||||||||
|
|
|
|||||||||||||||
| Outstanding, December 26, 2014 |
853,551 | $ | 8.87 | 1.35 | $ | 1,798 | ||||||||||
|
|
|
|||||||||||||||
| Options exercisable and expected to vest, December 26, 2014 |
853,551 | $ | 8.87 | 1.35 | $ | 1,798 | ||||||||||
The following table summarizes information with respect to options outstanding and exercisable at December 26, 2014:
| Range of Exercise Price |
Shares Outstanding |
Weighted Average Remaining Average Life (Years) |
Weighted Average Exercise Price |
Shares Exercisable |
Weighted Average Exercise Price |
|||||||||||||||
| $1.17 – 3.96 |
122,025 | 4.45 | $ | 3.46 | 122,025 | $ | 3.46 | |||||||||||||
| $6.14 – 6.55 |
337,157 | 0.37 | 6.55 | 337,157 | 6.55 | |||||||||||||||
| $6.76 – 8.61 |
117,500 | 1.35 | 8.44 | 117,500 | 8.44 | |||||||||||||||
| $8.94 – 14.08 |
59,594 | 1.85 | 12.01 | 59,594 | 12.01 | |||||||||||||||
| $14.31 – 14.99 |
217,275 | 2.32 | 14.89 | 217,275 | 14.89 | |||||||||||||||
|
|
|
|
|
|||||||||||||||||
| Grand Total |
853,551 | 1.35 | $ | 8.87 | 853,551 | $ | 8.87 | |||||||||||||
|
|
|
|
|
|||||||||||||||||
For the fiscal years 2014, 2013 and 2012, the intrinsic value of the Company’s exercised stock options was $1.8 million, $1.6 million and $0.7 million respectively. For the fiscal years 2014, 2013 and 2012, the Company’s vested share recognized expense was zero, $0.3 million and $0.2 million, respectively. There was no stock-based compensation expense for fiscal year 2014 attributable to stock options as all outstanding options were fully vested at the beginning of the fiscal year.
Restricted Stock Units and Restricted Stock Awards — In fiscal years 2014, 2013 and 2012, the Company granted 47,000, 30,000 and 30,000 shares, respectively, of common stock to its board members under the 2003 Incentive Plan. These Restricted Share Awards (RSAs) vest on the earlier of 1) the next Annual Shareholder Meeting, or 2) 365 days from date of grant. The total unamortized expense of the Company’s unvested RSAs as of December 26, 2014, is approximately $0.1 million. During the first quarter of fiscal year 2008, the Company began granting stock awards in the forms of Restricted Stock Units (RSUs) and Performance Stock Units (PSUs) to its employees as part of the Company’s long term equity compensation plan. These stock awards are granted to employees with a unit purchase price of zero dollars and typically vest over three years, subject to the employee’s continued service with the Company and, in the case of PSUs, subject to achieving certain
68
Table of Contents
Ultra Clean Holdings, Inc.
Notes to Consolidated Financial Statements—(Continued)
performance goals. The expected cost of the grant is recognized over the service period, and is reduced for estimated forfeitures and, in the case of PSUs, is reduced based on estimated achievement of performance goals. During the year ended December 26, 2014, the Company approved and granted 578,650 RSU’s to employees with a weighted average grant date fair value of $11.38 per share and 160,625 PSUs with a weighted average grant date fair value of $13.33 per share. Nine percent of the PSUs granted in fiscal 2014 were cancelled as some of the performance criteria for vesting was not met. As of December 26, 2014, $5.2 million of unrecognized stock-based compensation cost, net of estimated forfeitures, related to RSUs remains to be amortized and is expected to be recognized over an estimated period of 1.6 years. The unvested amount is subject to forfeiture, until fully vested. At December 26, 2014, 1,078,279 shares were subject to forfeiture.
The following table summarizes the Company’s restricted stock unit and restricted stock award activity thru the year ended December 26, 2014:
| Number of Shares |
Aggregate Intrinsic Value (in thousands) |
|||||||
| Unvested restricted stock units and restricted stock awards at December 28, 2012 |
1,312,706 | $ | 6,143 | |||||
| Granted |
794,650 | |||||||
| Vested |
(590,104 | ) | ||||||
| Forfeited |
(260,322 | ) | ||||||
|
|
|
|||||||
| Unvested restricted stock units and restricted stock awards at December 27, 2013 |
1,256,930 | $ | 12,632 | |||||
| Granted |
786,275 | |||||||
| Vested |
(577,528 | ) | ||||||
| Forfeited |
(387,398 | ) | ||||||
|
|
|
|||||||
| Unvested restricted stock units and restricted stock awards at December 26, 2014 |
1,078,279 | $ | 9,673 | |||||
|
|
|
|
|
|||||
| Vested and expected to vest restricted stock units and restricted stock awards |
939,341 | $ | 8,370 | |||||
|
|
|
|
|
|||||
Employee Stock Purchase Plan — In 2004 the Company adopted an Employee Stock Purchase Plan (“ESPP”) and is authorized to issue 555,343 shares of common stock under the ESPP. The ESPP permits employees to purchase common stock at a discount through payroll withholdings at certain specified dates (purchase period) within a defined offering period. The purchase price is 95% of the fair market value of the common stock at the end of the purchase period and is intended to qualify as an “employee stock purchase plan” under Section 423 of the Internal Revenue Code. There were 22,971 shares issued under the ESPP during the year ended December 26, 2014.
Employee Savings and Retirement Plan — The Company sponsors a 401(k) savings and retirement plan (the “401(k) Plan”) for all employees who meet certain eligibility requirements. Participants could elect to contribute to the 401(k) Plan, on a pre-tax basis, up to 25% of their salary to a maximum of $17,500. The Company may make matching contributions of up to 3% of employee contributions based upon eligibility. The Company made approximately $0.9 million, $0.7 million, and $0.7 million discretionary employer contributions to the 401(k) Plan in the years ended December 26, 2014, December 27, 2013 and December 28, 2012, respectively.
69
Table of Contents
Ultra Clean Holdings, Inc.
Notes to Consolidated Financial Statements—(Continued)
9. Net Income Per Share
The following is a reconciliation of the numerators and denominators used in computing basic and diluted net income per share (in thousands):
| Year Ended | ||||||||||||
| December 26, 2014 |
December 27, 2013 |
December 28, 2012 |
||||||||||
| Numerator: |
||||||||||||
| Net income |
$ | 11,357 | $ | 10,424 | $ | 5,153 | ||||||
| Denominator: |
||||||||||||
| Shares used in computation — basic: |
||||||||||||
| Weighted average common shares outstanding |
29,301 | 28,346 | 25,698 | |||||||||
|
|
|
|
|
|
|
|||||||
| Shares used in computation — diluted: |
||||||||||||
| Weighted average common shares outstanding |
29,301 | 28,346 | 25,698 | |||||||||
| Dilutive effect of common shares outstanding subject to repurchase |
396 | 456 | 244 | |||||||||
| Dilutive effect of options outstanding |
239 | 235 | 319 | |||||||||
|
|
|
|
|
|
|
|||||||
| Shares used in computing diluted net income per share |
29,936 | 29,037 | 26,261 | |||||||||
|
|
|
|
|
|
|
|||||||
| Net income per share — basic |
$ | 0.39 | $ | 0.37 | $ | 0.20 | ||||||
| Net income per share — diluted |
$ | 0.38 | $ | 0.36 | $ | 0.20 | ||||||
The Company had securities outstanding which could potentially dilute basic earnings per share in the future, but the incremental shares from the assumed exercise of these securities were excluded in the computation of diluted net income per share, as their effect would have been anti-dilutive. Such outstanding securities consist of the following (in thousands):
| Year Ended | ||||||||||||
| December 26, 2014 |
December 27, 2013 |
December 28, 2012 |
||||||||||
| Outstanding options |
266 | 1,209 | 1,514 | |||||||||
10. Segment Information
The Company operates in one reportable segment and is engaged in the development, manufacture and supply of critical subsystems for the semiconductor capital equipment, consumer, medical, energy, industrial, flat panel and research industries. Multiple operating segments were aggregated into one reportable segment as the nature of the Company’s products and production processes, as well as type of customers and distribution methods, is consistent among all of the Company’s products. The Company’s foreign operations are conducted primarily through its wholly-owned subsidiaries in China and Singapore. The Company’s principal markets include North America, Asia and, to a lesser degree, Europe. Sales by geographic area represent sales to unaffiliated customers.
70
Table of Contents
Ultra Clean Holdings, Inc.
Notes to Consolidated Financial Statements—(Continued)
All information on sales by geographic area is based upon the location to which the products were shipped. The following table sets forth revenue by geographic area (in thousands):
| Year Ended | ||||||||||||
| Sales | December 26, 2014 |
December 27, 2013 |
December 28, 2012 |
|||||||||
| United States |
$ | 372,200 | $ | 331,351 | $ | 313,758 | ||||||
| China |
64,376 | 39,044 | 24,664 | |||||||||
| Singapore |
55,491 | 63,817 | 62,143 | |||||||||
| Others |
21,890 | 9,810 | 2,865 | |||||||||
|
|
|
|
|
|
|
|||||||
| Total |
$ | 513,957 | $ | 444,022 | $ | 403,430 | ||||||
|
|
|
|
|
|
|
|||||||
At December 26, 2014 and December 27, 2013, approximately $5.8 million and $4.6 million, respectively, of the Company’s long-lived assets were located in China and Singapore, and the remaining balances were located in the United States.
11. Commitments and Contingencies
The Company had commitments to purchase inventory totaling approximately $31.2 million at December 26, 2014.
The Company also leases properties domestically in Hayward and Fremont, California, Austin, Texas, Pflugerville, Texas, Chandler, Arizona, and South San Francisco California and internationally in China, Singapore and the Philippines. The Company leases certain of its facilities under non-cancelable leases, which expire on various dates through 2022.
As of December 26, 2014, future minimum payments under these operating leases were as follows (in thousands):
| Fiscal year | ||||
| 2015 |
5,710 | |||
| 2016 |
5,021 | |||
| 2017 |
4,388 | |||
| 2018 |
3,241 | |||
| 2019 |
2,396 | |||
| Thereafter |
7,422 | |||
|
|
|
|||
| Total minimum lease payments |
$ | 28,178 | ||
|
|
|
|||
From time to time, the Company is subject to various legal proceedings and claims, either asserted or unasserted, that arise in the ordinary course of business. Although the outcome of the various legal proceedings and claims individually or in the aggregate cannot be predicted with certainty, the Company has not had a history of outcomes to date that have been material to the statement of operations and does not believe that any of these proceedings or other claims will have a material adverse effect on its consolidated financial condition, results of operations or cash flows.
71
Table of Contents
Ultra Clean Holdings, Inc.
Notes to Consolidated Financial Statements—(Continued)
12. Subsequent Events
On January 5, 2015, the Company announced that James P. Scholhamer would become the Company’s Chief Executive Officer, effective January 19, 2015, succeeding Clarence L. Granger, who retired as the Company’s Chief Executive Officer on such date. Mr Granger will remain as non-executive Chairman of the Board of Directors. Mr. Scholhamer also joined the Company’s Board of Directors, effective as of his first day of employment with the Company.
In February 2015, the Company completed the acquisition of substantially all of the assets and certain liabilities of Marchi, a designer and manufacturer of specialty thermocouples, heaters and temperature controllers, for approximately $30.0 million in cash and 1,437,500 shares of newly issued common stock for a total purchase price of approximately $44.0 million. In addition, the Company incurred approximately $0.5 million of costs related to the acquisition. The Company’s primary reason for this acquisition is to expand its capabilities with its existing customers and bring the Company closer to the customer in the design stage of new products and next generation equipment. The Company financed the cash portion of the acquisition by borrowing a total of $29.7 million under the new Credit Agreement. Following the acquisition of Marchi, the Company’s cash totaled approximately $77.4 million and total debt was approximately $76.2 million. See further discussion of the new borrowing arrangements in Note 5 to the Notes to Consolidated Financial Statements. Due to the limited time since the acquisition date and limitations on access to Marchi’s information prior to the acquisition date, the initial accounting for the business combination is incomplete at this time. As a result, the Company is unable to provide amounts recognized as of the acquisition date for major classes of assets and liabilities acquired and resulting from the transaction, including the information required for indemnification assets, contingencies, non-controlling interests and goodwill. Also, because the initial accounting for the transaction is incomplete, the Company is unable to provide the supplemental pro forma revenue and earnings of the combined entity. The Company will include this information in its Quarterly Report on Form 10-Q for the three months ended March 27, 2015.
72
Table of Contents
| Item 9. | Changes in and Disagreements With Accountants on Accounting and Financial Disclosure |
Not Applicable
| Item 9A. | Controls and Procedures |
Evaluation of Disclosure Controls and Procedures
Our management, with the participation of our chief executive officer (“CEO”) and our chief financial officer (“CFO”), evaluated the effectiveness of our disclosure controls and procedures as defined in Rules 13a-15(e) and 15d-15(e) of the Securities Exchange Act of 1934, as amended (the “Exchange Act”) as of December 26, 2014. Based upon the evaluation, our management, including our CEO and our CFO, concluded that the design and operation of our disclosure controls and procedures were effective at the reasonable assurance level to ensure that information required to be disclosed by us in reports that we file or submit under the Exchange Act (i) is recorded, processed, summarized and reported within the time periods specified in Securities and Exchange Commission rules and forms and (ii) is accumulated and communicated to our management, including our CEO and CFO, as appropriate to allow timely decisions regarding required disclosure.
Changes in Internal Control Over Financial Reporting
As required by Rule 13a-15(d) of the Exchange Act, our management, including our CEO and CFO, conducted an evaluation of our “internal control over financial reporting” as defined in Exchange Act Rule 13a-15(f) to determine whether any changes in our internal control over financial reporting occurring during the fourth quarter of fiscal year 2014 that materially affected, or are reasonably likely to materially affect, our internal control over financial reporting. Based on that evaluation, there have been no such changes during the fourth quarter of fiscal year 2014.
Management’s Report on Internal Control Over Financial Reporting
Our management is responsible for establishing and maintaining adequate internal control over financial reporting, as such term is defined under Rule 13a-15(f) promulgated under the Exchange Act. Because of its inherent limitations, internal control over financial reporting may not prevent or detect misstatements. Also, projections of any evaluation of effectiveness to future periods are subject to the risk that controls may become inadequate because of changes in conditions, or that the degree of compliance with the policies or procedures may deteriorate.
Under the supervision and with the participation of our management, including our principal executive officer and principal financial officers, we conducted an evaluation of the effectiveness of our internal control over financial reporting based on the framework in Internal Control — Integrated Framework issued by the Committee of Sponsoring Organizations of the Treadway Commission (2013). The objective of this evaluation was to determine whether the Company’s internal control over financial reporting was effective as of December 26, 2014. Based on our evaluation under the framework set forth in Internal Control — Integrated Framework (2013), our management concluded that our internal control over financial reporting was effective as of December 26, 2014.
The effectiveness of our internal control over financial reporting as of December 26, 2014 has been audited by Deloitte & Touche LLP, an independent registered public accounting firm, as stated in their report which appears in this Form 10-K.
73
Table of Contents
REPORT OF INDEPENDENT REGISTERED PUBLIC ACCOUNTING FIRM
To the Board of Directors and Stockholders of
Ultra Clean Holdings, Inc.
Hayward, California
We have audited the internal control over financial reporting of Ultra Clean Holdings, Inc. and subsidiaries (the “Company”) as of December 26, 2014, based on criteria established in Internal Control — Integrated Framework (2013) issued by the Committee of Sponsoring Organizations of the Treadway Commission. The Company’s management is responsible for maintaining effective internal control over financial reporting and for its assessment of the effectiveness of internal control over financial reporting, included in the accompanying Management’s Report on Internal Control over Financial Reporting. Our responsibility is to express an opinion on the Company’s internal control over financial reporting based on our audit.
We conducted our audit in accordance with the standards of the Public Company Accounting Oversight Board (United States). Those standards require that we plan and perform the audit to obtain reasonable assurance about whether effective internal control over financial reporting was maintained in all material respects. Our audit included obtaining an understanding of internal control over financial reporting, assessing the risk that a material weakness exists, testing and evaluating the design and operating effectiveness of internal control based on the assessed risk, and performing such other procedures as we considered necessary in the circumstances. We believe that our audit provides a reasonable basis for our opinion.
A company’s internal control over financial reporting is a process designed by, or under the supervision of, the company’s principal executive and principal financial officers, or persons performing similar functions, and effected by the company’s board of directors, management, and other personnel to provide reasonable assurance regarding the reliability of financial reporting and the preparation of financial statements for external purposes in accordance with generally accepted accounting principles. A company’s internal control over financial reporting includes those policies and procedures that (1) pertain to the maintenance of records that, in reasonable detail, accurately and fairly reflect the transactions and dispositions of the assets of the company; (2) provide reasonable assurance that transactions are recorded as necessary to permit preparation of financial statements in accordance with generally accepted accounting principles, and that receipts and expenditures of the company are being made only in accordance with authorizations of management and directors of the company; and (3) provide reasonable assurance regarding prevention or timely detection of unauthorized acquisition, use, or disposition of the company’s assets that could have a material effect on the financial statements.
Because of the inherent limitations of internal control over financial reporting, including the possibility of collusion or improper management override of controls, material misstatements due to error or fraud may not be prevented or detected on a timely basis. Also, projections of any evaluation of the effectiveness of the internal control over financial reporting to future periods are subject to the risk that the controls may become inadequate because of changes in conditions, or that the degree of compliance with the policies or procedures may deteriorate.
In our opinion, the Company maintained, in all material respects, effective internal control over financial reporting as of December 26, 2014, based on the criteria established in Internal Control — Integrated Framework (2013 ) issued by the Committee of Sponsoring Organizations of the Treadway Commission.
We have also audited, in accordance with the standards of the Public Company Accounting Oversight Board (United States), the consolidated financial statements as of and for the year ended December 26, 2014 of the Company and our report dated March 11, 2015 expressed an unqualified opinion on those consolidated financial statements.
/s/ Deloitte & Touche LLP
San Jose, California
March 11, 2015
74
Table of Contents
| Item 9B. | Other Information |
None.
75
Table of Contents
PART III
Pursuant to Paragraph G(3) of the General Instructions to Form 10-K, portions of the information required by Part III of Form 10-K are incorporated by reference from our definitive Proxy Statement to be filed with the SEC in connection with our 2015 Annual Meeting of Stockholders.
| Item 10. | Directors and Executive Officers of the Registrant |
The information required by this item concerning directors, including our audit committee financial expert, is incorporated by reference to the section entitled, “Election of Directors” in our Proxy Statement for the 2015 Annual Meeting of Stockholders.
For information with respect to Executive Officers, see Part I, Item 1 of this Annual Report on Form 10-K, under “Executive Officers.”
The information required by this item with respect to Section 16(a) beneficial reporting compliance is incorporated by reference to the section entitled, “Section 16(a) Beneficial Ownership Reporting Compliance” in our Proxy Statement for the 2014 Annual Meeting of Stockholders.
We have adopted a code of ethics that is designed to qualify as a “code of ethics” within the meaning of Section 406 of the Sarbanes-Oxley Act of 2002 and the rules promulgated thereunder. This code of ethics is available on our website at www.uct.com. To the extent required by law, any amendments to, or waivers from, any provision of the code of ethics will be promptly disclosed to the public. To the extent permitted by such legal requirements, we intend to make such public disclosure by posting the relative material on our website in accordance with SEC rules.
| Item 11. | Executive Compensation |
The information required by this item regarding the security ownership of certain beneficial owners is incorporated by reference to the sections entitled “Executive Officer Compensation” and “Election of Directors” in our Proxy Statement for the 2015 Annual Meeting of Stockholders.
| Item 12. | Security Ownership of Certain Beneficial Owners and Management and Related Stockholder Matters |
The information required by this item is incorporated by reference to the sections entitled “Security Ownership of Certain Beneficial Owners and Management” in our Proxy Statement for the 2015 Annual Meeting of Stockholders.
76
Table of Contents
The table below summarizes our equity plan information as of December 26, 2014:
| Plan Category |
(a) Number of Securities to be Issued Upon Exercise/Vest of Outstanding Options, Awards Warrants and Rights |
(b) Weighted-Average Exercise Price of Outstanding Options, Warrants and Rights |
(c)(1) Number of Securities Remaining Available for Future Issuance Under Equity Compensation Plans (Excluding Securities Reflected in Column(a) |
|||||||||
| Equity compensation plans approved by security holders: |
2,025,254 | $ | 8.48 | 2,110,644 | ||||||||
| Equity compensation plans not approved by security holders |
— | — | — | |||||||||
|
|
|
|
|
|
|
|||||||
| Total |
2,025,254 | $ | 8.48 | 2,110,644 | ||||||||
|
|
|
|
|
|
|
|||||||
| (1) | Consists of the 2003 Stock Incentive Plan and, for purposes of column (c), the Employee Stock Purchase Plan. Since restricted stock units do not have an exercise price, they are excluded from the calculations in column (b) of the table above. |
| Item 13. | Certain Relationships and Related Transactions |
The information required by this item is incorporated by reference to the section entitled “Certain Relationships and Related Party Transactions” in our Proxy Statement for the 2015 Annual Meeting of Stockholders.
| Item 14. | Principal Accountant Fees and Services |
The information required by this item is incorporated by reference to the section entitled “Ratification of the Appointment of Our Independent Registered Public Accounting Firm” in our Proxy Statement for the 2015 Annual Meeting of Stockholders.
77
Table of Contents
Part IV
| Item 15. | Exhibits, Financial Statement Schedules |
(a) The following documents are filed as part of this Form 10-K:
1. Financial Statements:
| Form 10-K Page No. |
||||
| 45 | ||||
| 46 | ||||
| 47 | ||||
| 48 | ||||
| 49 | ||||
| 50 | ||||
2. Financial statement schedules not listed have been omitted because they are not applicable or required, or the information required to be set forth therein is included in the Consolidated Financial Statements or Notes thereto.
3. Exhibits
78
Table of Contents
Exhibit Index
| Exhibit |
Description |
Form |
File No. |
Filing Date |
Exhibit |
Filed | ||||||
| 2.1 | Agreement and Plan of Merger, dated as of May 18, 2012, among American Integration Technologies, LLC, AIT Holding Company LLC, Ultra Clean Holdings, Inc. and Element Merger Subsidiary, LLC | 8-K | 000-50646 | May 23, 2012 | 2.1 | |||||||
| 2.2 | Asset Purchase Agreement, dated as of February 5, 2015, among Ultra Clean Holdings, Inc., Drake Acquisition Subsidiary, Inc. and Marchi Thermal Systems, Inc. | 8-K | 000-50646 | February 6, 2015 | 2.1 | |||||||
| 3.1 | Amended and Restated Certificate of Incorporation of Ultra Clean Holdings, Inc. | S-1/A | 333-11904 | March 2, 2004 | 3.1 | |||||||
| 3.2 | Amended and Restated Bylaws of Ultra Clean Holdings, Inc. | 8-K | 000-50646 | August 3, 2009 | 3.01 | |||||||
| 4.1 | Specimen Stock Certificate | S-1/A | 333-11904 | March 8, 2004 | 4.1 | |||||||
| 10.1† | Ultra Clean Holdings, Inc. 2003 Amended and Restated Stock Incentive Plan (amended as of May 22, 2013) | 8-K | 000-50646 | May 24, 2013 | 10.1 | |||||||
| 10.2† | Form of Stock Option Agreement | S-1/A | 333-11904 | March 8, 2004 | 10.6 | |||||||
| 10.3 | Credit Agreement, dated as of July 3, 2012, among Ultra Clean Holdings, Inc., Ultra Clean Technology Systems and Service, Inc., American Integration Technologies LLC, Ultra Clean Asia Pacific Pte. Ltd., the several lenders from time to time party thereto, Silicon Valley Bank and U.S. Bank National Association | 8-K | 000-50646 | July 10, 2012 | 10.1 | |||||||
| 10.4 | Guarantee and Collateral Agreement in favor of Silicon Valley Bank, dated as of July 3, 2012, made by Ultra Clean Holdings, Inc., Ultra Clean Technology Systems and Service, Inc., American Integration Technologies LLC, Ultra Clean Asia Pacific Pte. Ltd., UCT Sieger Engineering LLC, Integrated Flow Systems LLC and the other Grantors referred to therein and from time to time party thereto | 8-K | 000-50646 | July 10, 2012 | 10.2 | |||||||
79
Table of Contents
| Exhibit |
Description |
Form |
File No. |
Filing Date |
Exhibit |
Filed | ||||||
| 10.5 | Amendment and Waiver Agreement, dated as of February 15, 2013, among the Company, certain of the Company’s subsidiaries, Silicon Valley Bank and the several other banks and financial institutions or entities party thereto | 8-K | 000-50646 | February 22, 2013 | 10.1 | |||||||
| 10.6 | Credit Agreement, dated as of February 2, 2015, among Ultra Clean Holdings, Inc., East West Bank, City National Bank and the several lenders from time to time party thereto | 8-K | 000-50646 | February 6, 2015 | 10.1 | |||||||
| 10.7 | Guarantee and Collateral Agreement in favor of East West Bank, dated as of February 2, 2015, made by Ultra Clean Holdings, Inc., Ultra Clean Technology Systems and Service, Inc., American Integration Technologies LLC, UCT Sieger Engineering LLC, Integrated Flow Systems LLC, Drake Acquisition Subsidiary, Inc. and the other Grantors referred to therein and from time to time party thereto | 8-K | 000-50646 | February 6, 2015 | 10.2 | |||||||
| 10.8† | Employee Stock Purchase Plan (Restated as of October 21, 2004) | 10-Q | 000-50646 | November 8, 2004 | 10.9.1 | |||||||
| 10.9† | Form of Indemnification Agreement between Ultra Clean Holdings, Inc. and each of its directors and executive officers | S-1/A | 333-11904 | March 2, 2004 | 10.1 | |||||||
| 10.10† | Form of Award Agreement | S-1/A | 333-111904 | March 8, 2004 | 10.13 | |||||||
| 10.11† | Severance Policy for Executive Officers (revised) | 10-K | 000-50646 | March 19, 2009 | 10.16 | |||||||
| 10.12† | Form of Restricted Stock Unit Award Agreement | 10-K | 000-50646 | March 12, 2008 | 10.18 | |||||||
| 10.13† | Separation Agreement dated as of December 31, 2007 between the Company and Leonid Mezhvinsky | 10-K | 000-50646 | March 19, 2009 | 10.18 | |||||||
| 10.14† | Change of control Severance Agreement dated as of July 21, 2009 by and between Ultra Clean Holdings, Inc. and Kevin C. Eichler | 10-K | 000-50646 | March 30, 2010 | 10.22 | |||||||
| 10.15† | Letter of Agreement between the Company and Lavi Lev dated November 18, 2011 | 10-Q | 000-50646 | May 3, 2013 | 10.1 | |||||||
| 10.16† | Transition Agreement between the Company and Clarence L. Granger, effective as of January 2, 2015 | 8-K | 000-50646 | January 5, 2015 | 99.2 | |||||||
80
Table of Contents
| Exhibit |
Description |
Form |
File No. |
Filing Date |
Exhibit |
Filed | ||||||
| 10.17† | Offer Letter between the Company and James P. Scholhamer dated January 3, 2015 | 8-K | 000-50646 | January 5, 2015 | 99.1 | |||||||
| 10.18† | Change in Control Severance Agreement dated as of January 19, 2015 by and between Ultra Clean Holdings, Inc. and James P. Scholhamer | X | ||||||||||
| 21.1 | Subsidiaries of Ultra Clean Holdings, Inc. | X | ||||||||||
| 23.1 | Consent of Independent Registered Public Accounting Firm | X | ||||||||||
| 24.1 | Power of Attorney (included on signature page) | X | ||||||||||
| 31.1 | Certification of Chief Executive Officer pursuant to Section 302 of the Sarbanes-Oxley Act of 2002. | X | ||||||||||
| 31.2 | Certification of Chief Financial Officer pursuant to Section 302 of the Sarbanes-Oxley Act of 2002. | X | ||||||||||
| 32.1 | Certification of Chief Executive Officer pursuant to 18 U.S.C. Section 1350, as adopted pursuant to Section 906 of the Sarbanes-Oxley Act of 2002 | X | ||||||||||
| 32.2 | Certification of Chief Financial Officer pursuant to 18 U.S.C. Section 1350, as adopted pursuant to Section 906 of the Sarbanes-Oxley Act of 2002 | X | ||||||||||
| 101.INS | XBRL Instance Document | X | ||||||||||
| 101.SCH | XBRL Taxonomy Extension Schema Document | X | ||||||||||
| 101.CAL | XBRL Taxonomy Calculation Linkbase Document | X | ||||||||||
| 101.DEF | XBRL Taxonomy Definition Linkbase Document | X | ||||||||||
| 101.LAB | XBRL Taxonomy Label Linkbase Document | X | ||||||||||
| 101.PRE | XBRL Taxonomy Extension Presentation Linkbase Document | X | ||||||||||
| † | Denotes management contract or compensatory plan. |
81
Table of Contents
SIGNATURES
Pursuant to the requirements of Section 13 or 15(d) of the Securities Exchange Act of 1934, the Registrant has duly caused this Report to be signed on its behalf by the undersigned, thereunto duly authorized.
| Ultra Clean Holdings, Inc. | ||
| By: | /S/ James P. Scholhamer | |
| James P. Scholhamer | ||
| Chief Executive Officer | ||
Date: March 11, 2015
KNOW ALL PERSONS BY THESE PRESENTS, that each person whose signature appears below constitutes and appoints James P. Scholhamer and Kevin C. Eichler, and each of them, as his true and lawful attorneys-in-fact and agents, with full power of substitution and re-substitution, for him in any and all capacities, to sign any and all amendments to this Annual Report on Form 10-K and to file the same, with all exhibits thereto, and other documents in connection therewith, with the Securities and Exchange Commission hereby ratifying and confirming that each of said attorneys-in-fact and agents, or his substitute or substitutes, may lawfully do or cause to be done by virtue hereof.
Pursuant to the requirements of the Securities Exchange Act of 1934, this Report has been signed below by the following persons on behalf of the Registrant and in the capacities and on the dates indicated.
| Signature |
Title |
Date | ||
| /S/ CLARENCE L. GRANGER Clarence L. Granger |
Chairman | March 11, 2015 | ||
| /S/ JAMES P. SCHOLHAMER James P. Scholhamer |
Chief Executive Officer | March 11, 2015 | ||
| /S/ KEVIN C. EICHLER Kevin C. Eichler |
Executive Vice President, Chief Financial Officer and Secretary (Principal Financial Officer and Principal Accounting Officer) | March 11, 2015 | ||
| /S/ LEONID MEZHVINSKY Leonid Mezhvinsky |
Director | March 11, 2015 | ||
| /S/ JOHN CHENAULT John Chenault |
Director | March 11, 2015 | ||
| /S/ SUSAN H. BILLAT Susan H. Billat |
Director | March 11, 2015 | ||
| /S/ DAVID T. IBNALE David T. IbnAle |
Director | March 11, 2015 | ||
82
Table of Contents
Exhibit Index
| Previously Filed | Filed Herewith | |||||||||||
| Exhibit |
Description |
Form |
File No. |
Filing Date |
Exhibit |
|||||||
| 2.1 |
Agreement and Plan of Merger, dated as of May 18, 2012, among American Integration Technologies, LLC, AIT Holding Company LLC, Ultra Clean Holdings, Inc. and Element Merger Subsidiary, LLC | 8-K | 000-50646 | May 23, 2012 | 2.1 | |||||||
| 2.2 |
Asset Purchase Agreement, dated as of February 5, 2015, among Ultra Clean Holdings, Inc., Drake Acquisition Subsidiary, Inc. and Marchi Thermal Systems, Inc. | 8-K | 000-50646 | February 6, 2015 | 2.1 | |||||||
| 3.1 |
Amended and Restated Certificate of Incorporation of Ultra Clean Holdings, Inc. | S-1/A | 333-11904 | March 2, 2004 | 3.1 | |||||||
| 3.2 |
Amended and Restated Bylaws of Ultra Clean Holdings, Inc. | 8-K | 000-50646 | August 3, 2009 | 3.01 | |||||||
| 4.1 |
Specimen Stock Certificate | S-1/A | 333-11904 | March 8, 2004 | 4.1 | |||||||
| 10.1† |
Ultra Clean Holdings, Inc. 2003 Amended and Restated Stock Incentive Plan (amended as of May 22, 2013) | 8-K | 000-50646 | May 24, 2013 | 10.1 | |||||||
| 10.2† |
Form of Stock Option Agreement | S-1/A | 333-11904 | March 8, 2004 | 10.6 | |||||||
| 10.3 |
Credit Agreement, dated as of July 3, 2012, among Ultra Clean Holdings, Inc., Ultra Clean Technology Systems and Service, Inc., American Integration Technologies LLC, Ultra Clean Asia Pacific Pte. Ltd., the several lenders from time to time party thereto, Silicon Valley Bank and U.S. Bank National Association | 8-K | 000-50646 | July 10, 2012 | 10.1 | |||||||
| 10.4 |
Guarantee and Collateral Agreement in favor of Silicon Valley Bank, dated as of July 3, 2012, made by Ultra Clean Holdings, Inc., Ultra Clean Technology Systems and Service, Inc., American Integration Technologies LLC, Ultra Clean Asia Pacific Pte. Ltd., UCT Sieger Engineering LLC, Integrated Flow Systems LLC and the other Grantors referred to therein and from time to time party thereto | 8-K | 000-50646 | July 10, 2012 | 10.2 | |||||||
| 10.5 |
Amendment and Waiver Agreement, dated as of February 15, 2013, among the Company, certain of the Company’s subsidiaries, Silicon Valley Bank and the several other banks and financial institutions or entities party thereto | 8-K | 000-50646 | February 22, 2013 | 10.1 | |||||||
83
Table of Contents
| Previously Filed | Filed Herewith |
|||||||||||||
| Exhibit |
Description |
Form |
File No. |
Filing Date |
Exhibit |
|||||||||
| 10.6 |
Credit Agreement, dated as of February 2, 2015, among Ultra Clean Holdings, Inc., East West Bank, City National Bank and the several lenders from time to time party thereto | 8-K | 000-50646 | February 6, 2015 | 10.1 | |||||||||
| 10.7 |
Guarantee and Collateral Agreement in favor of East West Bank, dated as of February 2, 2015, made by Ultra Clean Holdings, Inc., Ultra Clean Technology Systems and Service, Inc., American Integration Technologies LLC, UCT Sieger Engineering LLC, Integrated Flow Systems LLC, Drake Acquisition Subsidiary, Inc. and the other Grantors referred to therein and from time to time party thereto | 8-K | 000-50646 | February 6, 2015 | 10.2 | |||||||||
| 10.8† |
Employee Stock Purchase Plan (Restated as of October 21, 2004) | 10-Q | 000-50646 | November 8, 2004 | 10.9.1 | |||||||||
| 10.9† |
Form of Indemnification Agreement between Ultra Clean Holdings, Inc. and each of its directors and executive officers | S-1/A | 333-11904 | March 2, 2004 | 10.1 | |||||||||
| 10.10† |
Form of Award Agreement | S-1/A | 333-111904 | March 8, 2004 | 10.13 | |||||||||
| 10.11† |
Severance Policy for Executive Officers (revised) | 10-K | 000-50646 | March 19, 2009 | 10.16 | |||||||||
| 10.12† |
Form of Restricted Stock Unit Award Agreement | 10-K | 000-50646 | March 12, 2008 | 10.18 | |||||||||
| 10.13† |
Separation Agreement dated as of December 31, 2007 between the Company and Leonid Mezhvinsky | 10-K | 000-50646 | March 19, 2009 | 10.18 | |||||||||
| 10.14† |
Change of control Severance Agreement dated as of July 21, 2009 by and between Ultra Clean Holdings, Inc. and Kevin C. Eichler | 10-K | 000-50646 | March 30, 2010 | 10.22 | |||||||||
| 10.15† |
Letter of Agreement between the Company and Lavi Lev dated November 18, 2011 | 10-Q | 000-50646 | May 3, 2013 | 10.1 | |||||||||
| 10.16† |
Transition Agreement between the Company and Clarence L. Granger, effective as of January 2, 2015 | 8-K | 000-50646 | January 5, 2015 | 99.2 | |||||||||
| 10.17† |
Offer Letter between the Company and James P. Scholhamer dated January 3, 2015 | 8-K | 000-50646 | January 5, 2015 | 99.1 | |||||||||
| 10.18† |
Change in Control Severance Agreement dated as of January 19, 2015 by and between Ultra Clean Holdings, Inc. and James P. Scholhamer | X | ||||||||||||
84
Table of Contents
| Previously Filed | Filed Herewith |
|||||||||||||
| Exhibit |
Description |
Form |
File No. |
Filing Date |
Exhibit |
|||||||||
| 21.1 |
Subsidiaries of Ultra Clean Holdings, Inc. | X | ||||||||||||
| 23.1 |
Consent of Independent Registered Public Accounting Firm | X | ||||||||||||
| 24.1 |
Power of Attorney (included on signature page) | X | ||||||||||||
| 31.1 |
Certification of Chief Executive Officer pursuant to Section 302 of the Sarbanes-Oxley Act of 2002. | X | ||||||||||||
| 31.2 |
Certification of Chief Financial Officer pursuant to Section 302 of the Sarbanes-Oxley Act of 2002. | X | ||||||||||||
| 32.1 |
Certification of Chief Executive Officer pursuant to 18 U.S.C. Section 1350, as adopted pursuant to Section 906 of the Sarbanes-Oxley Act of 2002 | X | ||||||||||||
| 32.2 |
Certification of Chief Financial Officer pursuant to 18 U.S.C. Section 1350, as adopted pursuant to Section 906 of the Sarbanes-Oxley Act of 2002 | X | ||||||||||||
| 101.INS |
XBRL Instance Document | |||||||||||||
| 101.SCH |
XBRL Taxonomy Extension Schema Document | |||||||||||||
| 101.CAL |
XBRL Taxonomy Calculation Linkbase Document | |||||||||||||
| 101.DEF |
XBRL Taxonomy Definition Linkbase Document | |||||||||||||
| 101.LAB |
XBRL Taxonomy Label Linkbase Document | |||||||||||||
| 101.PRE |
XBRL Taxonomy Extension Presentation Linkbase Document | |||||||||||||
| † | Denotes management contract or compensatory plan. |
85
Exhibit 10.18

CHANGE IN CONTROL SEVERANCE AGREEMENT
CHANGE IN CONTROL SEVERANCE AGREEMENT (“Agreement”), dated as of January 19, 2015 by and between Ultra Clean Holdings, Inc., a Delaware corporation (the “Company”), and Jim Scholhamer (“Employee”).
WHEREAS, the Company and the Employee wish to enter into this Agreement specifying the benefits the Employee will receive in certain circumstances relating to a Change in Control of the Company in order to induce Employee to remain in the employ of the Company in the event of the possibility of a Change in Control;
NOW THEREFORE, in consideration of the foregoing and of the mutual covenants and agreements of the parties set forth in this Agreement, and for other good and valuable consideration, the receipt and sufficiency of which are hereby acknowledged, the parties hereto, intending to be legally bound, agree as follows:
ARTICLE 1
TERM AND NATURE OF AGREEMENT
Section 1.01. Term. This Agreement shall be in force until the second anniversary of the Effective Date, and thereafter renew for automatic one year terms, unless the Company shall give the Employee written notice of termination at least six (6) months before the expiration of the then current term provided that no Change in Control has occurred prior to such date. Notwithstanding the foregoing, this Agreement shall terminate (i) 12 months after a Change in Control (subject to satisfaction of any obligations hereunder as a result of a termination of employment prior to such expiration) and (ii) upon on a termination of employment prior to a Change in Control (other than a termination without Cause or for Good Reason that occurs during the three (3) month period prior to a Change in Control).
Section 1.02. At-Will Employment. Nothing in this Agreement shall change the at-will nature of Employee’s employment with the Company.
ARTICLE 2
CHANGE IN CONTROL TERMINATION
Section 2.01. Severance Benefits.
(a) If upon, or within 3 months prior to or 12 months following, a Change in Control, Employee is terminated by the Company without Cause or Employee resigns for Good Reason, Employee shall be entitled to the following (“Change in Control Severance Benefits”), provided that Employee executes and lets become effective a release of claims in the form attached hereto as Exhibit A (the “Release”) within 45 days following the termination of employment:
(i) a lump sum cash payment equal to 200% of the sum of (x) Employee’s then-existing annual base salary and (y) the average annual cash bonus as determined by the Company over the prior three years, which shall be paid as soon as administratively practicable after the date on which the Release becomes effective, and, in any event, no later than two and one-half (2 1/2) months after the end of the taxable year of the Employee in which the termination of employment occurs;
(ii) payment or reimbursement of health benefit continuation coverage under COBRA or otherwise from the termination date through the earlier of (A) 24 months following the termination date or (B) the date Employee becomes eligible for health benefits with another employer, which shall be paid no later than the month of such coverage, provided that if Employee is no longer eligible for COBRA continuation coverage, a lump sum payment calculated based on the monthly premiums immediately prior to the expiration of COBRA coverage; and
(iii) 100% of all of the Employee’s unvested and outstanding Equity Awards shall become vested.
(b) Definitions. For purposes of this Agreement, the following definitions shall have the following meanings:
(i) “Cause” shall exist if: (A) Employee is convicted of, or pleads guilty or no contest to, (i) a felony or (ii) a misdemeanor involving moral turpitude; (B) Employee engages in any act of fraud or material dishonesty in connection with his employment; (C) Employees materially breaches any agreement with the Company; (D) Employee commits any material violation of a written Company policy that has been provided to Employee; or (E) Employee willfully fails, refuses or neglects to perform the services reasonably required of his position at the Company;
2
provided, however, that notwithstanding the foregoing, with respect to clauses (C), (D) and (E) above, unless the condition is incapable of remedy by its nature or otherwise, Employee’s termination will not be for Cause unless the Company (x) notifies Employee in writing of the existence of the condition which the Company believes constitutes Cause within 60 days of the Company becoming aware of the existence of such condition (which notice specifically identifies such condition), (y) gives Employee at least 10 days following the date on which Employee receive such notice (and prior to termination) in which to remedy the condition, and (z) if Employee does not remedy such condition within such period, actually terminates Employee’s employment within 15 days after the expiration of such remedy period (and before Employee remedies such condition).
(ii) “Change in Control” means the occurrence of any one or more of the following:
(A) the consummation of a merger or consolidation of the Company with or into any other entity (other than with any entity or group in which Executive has not less than a 5% beneficial interest) pursuant to which the holders of outstanding equity of the Company immediately prior to such merger or consolidation hold directly or indirectly 50% or less of the voting power of the equity securities of the surviving entity;
(B) the sale or other disposition of all or substantially all of the Company’s assets (other than to any entity or group in which Executive has not less than a 5% beneficial interest); or
(C) any acquisition by any person or persons (other than any entity or group in which Executive has not less than a 5% beneficial interest) of the beneficial ownership of more than 50% of the voting power of the Company’s equity securities in a single transaction or series of related transactions; provided, however, that an underwritten public offering of the Company’s securities shall not be considered a Change in Control;
provided, however, that a transaction shall not constitute a Change in Control if its sole purpose is to change the state of the Company’s incorporation or to create a holding company that will be owned in substantially the same proportions by the persons who directly or indirectly held the Company’s securities immediately before such transaction.
(iii) “Good Reason” means:
(A) a reduction of Employee’s then-existing annual base salary (other than in connection with an action affecting a majority of the executive officers of the Company not to exceed 25%);
3
(B) relocation of the principal place of Employee’s employment to a location that is more than 50 miles from the principal place of Employee’s employment immediately prior to the date of such change; or
(C) a material reduction in Employee’s authority, duties or responsibilities;
provided, however, that notwithstanding the foregoing, Employee’s termination will not be for Good Reason unless Employee (x) notifies the Company in writing of the existence of the condition which Employee believes constitutes Good Reason within 60 days of the initial existence of such condition (which notice specifically identifies such condition), (y) gives the Company at least 10 days following the date on which the Company receives such notice (and prior to termination) in which to remedy the condition, and (z) if the Company does not remedy such condition within such period, actually terminates Employee’s employment within 15 days after the expiration of such remedy period (and before the Company remedies such condition);.
(iv) “Equity Awards” means all options to purchase shares of Company common stock as well as any and all other stock-based awards granted to the Employee, including but not limited to stock bonus awards, restricted stock, restricted stock units or stock appreciation rights, except for performance stock awards which remain subject to performance criteria as of the Effective Date.
Section 2.02. Resignation of Corporate Offices. In connection with any termination of employment following a Change in Control, Employee will resign Employee’s office, if any, as a director, officer or trustee of the Company, its subsidiaries or affiliates and of any other corporation or trust of which Employee serves as such at the request of the Company, effective as of the date of termination of employment.
Section 2.03. Accrued Compensation and Benefits. In connection with any termination of employment upon or following a Change in Control (whether or not under Section 2.01 above), the Company shall pay Employee’s earned but unpaid base salary and other vested but unpaid cash entitlements for the period through and including the termination of employment, including unused earned vacation pay and unreimbursed documented business expenses incurred by Employee prior to the date of termination (collectively “Accrued Compensation and Expenses”), as required by law and the applicable Company plan or policy. In addition, Employee shall be entitled to any other vested benefits earned by Employee for the period through and including the termination date of Employee’s employment under any other employee benefit plans and arrangements maintained by the Company, in accordance with the terms of such plans and arrangements, except as modified herein (collectively “Accrued Benefits”). Any Accrued Compensation and Expenses to which the Employee is entitled shall be paid to the Employee in cash as soon as administratively practicable after the termination, and, in
4
any event, no later than two and one-half (2-1/2) months after the end of the taxable year of the Employee in which the termination occurs. Any Accrued Benefits to which the Employee is entitled shall be paid to the Employee as provided in the relevant plans and arrangement.
Section 2.04. Continuing Obligations. Employee acknowledges his or her continuing obligations under the Confidential and Non-Disclosure Agreement with the Company, including but not limited to Employee’s obligations not to use or disclose, at any time, any trade secret, confidential or proprietary information of the Company.
Section 2.05. Limitation on Payments.
(a) If the Change in Control Severance Benefits together with any other payment or benefit Employee would receive pursuant to a Change in Control (collectively, “Payment”) would (i) constitute a “parachute payment” within the meaning of Section 280G of the Internal Revenue Code of 1986, as amended (the “Code”), and (ii) but for this sentence, be subject to the excise tax imposed by Section 4999 of the Code (the “Excise Tax”), then such Payment shall be equal to the Reduced Amount. The “Reduced Amount” shall be either (x) the largest portion of the Payment that would result in no portion of the Payment being subject to the Excise Tax or (y) the largest portion, up to and including the total, of the Payment, whichever amount, after taking into account all applicable federal, state and local employment taxes, income taxes, and the Excise Tax (all computed at the highest applicable marginal rate), results in Employee’s receipt, on an after-tax basis, of the greater amount of the Payment notwithstanding that all or some portion of the Payment may be subject to the Excise Tax. lf a reduction in payments or benefits constituting “parachute payments” is necessary so that the Payment equals the Reduced Amount, reduction shall occur in the following order unless Employee elects in writing a different order: reduction of cash payments; cancellation of acceleration of vesting; reduction of employee benefits. In the event that acceleration of vesting is to be reduced, it shall be cancelled in the reverse order of the date of grant of the Equity Awards unless Employee elects in writing a different order for cancellation.
(b) The Company may engage the accounting firm engaged by the Company for general audit purposes as of the day prior to the effective date of the Change in Control or another firm to perform the foregoing calculations. The Company shall bear all expenses with respect to the determinations by such firm required to be made hereunder.
(c) The accounting firm engaged to make the determinations hereunder shall provide its calculations, together with detailed supporting documentation, to Employee and the Company within fifteen (15) calendar days after the date on which Employee’s right to a Payment is triggered (if requested at that time by Employee or the Company) or such other time as requested by Employee or the Company.
5
ARTICLE 3
MISCELLANEOUS
Section 3.01. Assignment; Successors and Assigns. This Agreement shall inure to the benefit of and be enforceable by Employee’s personal or legal representatives, executors, administrators, successors, heirs, distributees, devisees, and legatees. If Employee should die or become subject to a permanent disability while any amount is owed but unpaid to Employee hereunder, all such amounts, unless otherwise provided herein, shall be paid to Employee’s devisee, legatee, legal guardian or other designee, or if there is no such designee, to Employee’s estate. Employee’s rights hereunder shall not otherwise be assignable. This Agreement shall be binding on the Company’s successors and assigns.
Section 3.02. Dispute Resolution. To ensure rapid and economical resolution of any and all disputes that might arise in connection with this Agreement, Employee and the Company agree that any and all disputes, claims, and causes of action, in law or equity, arising from or relating to this Agreement or its enforcement, performance, breach, or interpretation, will be resolved solely and exclusively by final, binding, and confidential arbitration, by a single arbitrator, in San Francisco, California, and conducted by Judicial Arbitration & Mediation Services, Inc. (“JAMS”) under its then-existing employment rules and procedures. Nothing in this section, however, is intended to prevent either party from obtaining injunctive relief in court to prevent irreparable harm pending the conclusion of any such arbitration. Each party to an arbitration or litigation hereunder shall be responsible for the payment of its own attorneys’ fees.
Section 3.03. Unfunded Agreement. The obligations of the Company under this Agreement represent an unsecured, unfunded promise to pay benefits to Employee and/or Employee’s beneficiaries, and shall not entitle Employee or such beneficiaries to a preferential claim to any asset of the Company.
Section 3.04. Non-Exclusivity of Benefits. Unless specifically provided herein, neither the provisions of this Agreement nor the benefits provided hereunder shall reduce any amounts otherwise payable, or in any way diminish Employee’s rights as an employee of the Company, whether existing now or hereafter, under any compensation and/or benefit plans (qualified or nonqualified), programs, policies, or practices provided by the Company, for which Employee may qualify; provided that the Change in Control Severance Benefits shall not be duplicative of any severance benefits under any such plans, programs, policies or practices. Vested benefits or other amounts which Employee is otherwise entitled to receive under any plan, policy, practice, or program of the Company (i.e., including, but not limited to, vested benefits under any qualified or nonqualified retirement plan), at or subsequent to the termination date shall be payable in accordance with such plan, policy, practice, or program except as expressly modified by this Agreement.
6
Section 3.05. Mitigation. In no event shall Employee be obligated to seek other employment or take any other action by way of mitigation of the amounts payable to Employee under any of the provisions of this Agreement nor shall the amount of any payment or benefit hereunder be reduced by any compensation earned by Employee as a result of employment by another employer.
Section 3.06. Entire Agreement. This Agreement represents the entire agreement between Employee and the Company and its affiliates with respect to Employee’s severance rights in a Change in Control situation, and supersedes all prior and contemporaneous discussions, negotiations, and agreements concerning such rights, provided, however, that any amounts payable to Employee hereunder shall be reduced by any amounts paid to Employee as required by any applicable federal, state or local law (including without limitation the WARN Act) in connection with any termination of Employee’s employment.
Section 3.07. Tax Withholding. Notwithstanding anything in this Agreement to the contrary, the Company shall withhold from any amounts payable under this Agreement all federal, state, city, or other taxes as are legally required to be withheld.
Section 3.08. Waiver of Rights. The waiver by either party of a breach of any provision of this Agreement shall not operate or be construed as a continuing waiver or as a consent to or waiver of any subsequent breach hereof.
Section 3.09. Severability. In the event any provision of the Agreement shall be held illegal or invalid for any reason, the illegality or invalidity shall not affect the remaining parts of the Agreement, and the Agreement shall be construed and enforced as if the illegal or invalid provision had not been included.
Section 3.10. Governing Law. This Agreement shall be governed by and construed in accordance with the laws of the State of California without reference to principles of conflict of laws.
Section 3.11. Counterparts. This Agreement may be signed in several counterparts, each of which shall be an original, with the same effect as if the signatures thereto and hereto were on the same instrument.
Section 3.12. Code Section 409A. This Agreement and the payments and benefits hereunder are intended to qualify for the short-term deferral exception to Section 409A of the Code, and all regulations, rulings and other guidance issued thereunder, all as amended and in effect from time to time (“Section 409A”), described in Treasury Regulation Section 1.409A-1(b)(4) to the maximum extent possible, and to the extent they do not so qualify, they are intended to qualify for the involuntary separation pay plan exception to Section 409A described in Treasury Regulation Section 1.409A-1(b)(9)(iii) to the maximum extent possible. To the extent Section 409A is applicable to this
7
Agreement, this Agreement is intended to comply with Section 409A. Without limiting the generality of the foregoing, if on the date of termination of employment Employee is a “specified employee” within the meaning of Section 409A as determined in accordance with the Company’s procedures for making such determination, to the extent required in order to comply with Section 409A, amounts that would otherwise be payable under this Agreement during the six-month period immediately following the termination date shall instead be paid on the first business day after the date that is six months following the termination date. All references herein to “termination date” or “termination of employment” shall mean separation from service as an employee within the meaning of Section 409A.
IN WITNESS WHEREOF, the Company and the Employee have executed this Agreement, to be effective as of the date and year first written above.
| ULTRA CLEAN HOLDINGS, INC. | ||
| By: | /s/ David ibnAle | |
| Name: | David ibnAle | |
| Title: | Member of the Board of Directors and duly authorized signatory | |
| EMPLOYEE: | ||
| /s/ James P. Scholhamer | ||
| James P. Scholhamer | ||
| Dated: January 3, 2015 | ||
8
Exhibit A – Form of Release
Reference is made in this Release (the “Release”) to the terms set forth in the Change in Control Severance Agreement dated January 19, 2015, (the “Agreement”) between Ultra Clean Holdings, Inc. (together with its successors and assigns, the “Company”) and the undersigned Jim Scholhamer (“Employee”).
1. Release. In consideration for the benefits outlined in the Agreement (the “Severance Benefits”), to which I am not otherwise entitled, I hereby generally and completely release the Company and its affiliated entities (collectively “Company Entities”) and their directors, officers, employees, shareholders, partners, agents, attorneys, predecessors, successors, parent and subsidiary entities, insurers, affiliates, and assigns from any and all claims, liabilities and obligations, both known and unknown, that arise out of or are in any way related to events, acts, conduct or omissions occurring prior to the time I sign this Release. This general release includes, but is not limited to: (1) all claims arising out of or in any way related to my employment with the Company or the termination of that employment; (2) all claims related to my compensation or benefits from the Company, including salary, bonuses, commissions, vacation pay, expense reimbursements, severance pay, fringe benefits, stock, stock options, or any other ownership interests in the Company; (3) all claims for breach of contract, wrongful termination or breach of the implied covenant of good faith and fair dealing; (4) all tort claims, including claims for fraud, defamation, emotional distress, and discharge in violation of public policy; and (5) all federal, state, and local statutory claims, including claims for discrimination, harassment, retaliation, attorneys’ fees, or other claims arising under the federal Civil Rights Act of 1964 (as amended), the federal Americans with Disabilities Act of 1990, the federal Age Discrimination in Employment Act of 1967 (as amended) (“ADEA”), or the California Fair Employment and Housing Act (as amended). This Release does not apply to (x) claims which cannot be released as a matter of law, (y) any right I may have to enforce the Agreement or (z) my eligibility for coverage under any D&O or other similar insurance policy or indemnification in accordance with applicable laws, the charter and bylaws of the Company or any indemnification agreement I have with the company.
2. ADEA Waiver. I acknowledge that I am knowingly and voluntarily waiving and releasing any rights you have under the ADEA and that the consideration given for the waiver and release is in addition to anything of value to which I was already entitled. I further acknowledge that I have been advised by this writing, as required by the ADEA, that:
(a) my waiver and release specified in this paragraph do not apply to any rights or claims that arise after the date I sign this Release;
A-1
(b) I have the right to consult with an attorney prior to signing this Release;
(c) I have 45 days to consider this Release (although I may choose voluntarily to sign this Release earlier);
(d) I have seven (7) days after I sign this Release to revoke the Release; and
(e) this Release will not be effective until the date on which the revocation period has expired, which will be the eighth day after I sign this Release, assuming I have returned it to the Company by such date.
3. Waiver of Unknown Claims. In granting the general release herein, I acknowledge that I have read and understand California Civil Code section 1542, which states:
A GENERAL RELEASE DOES NOT EXTEND TO CLAIMS WHICH THE CREDITOR DOES NOT KNOW OR SUSPECT TO EXIST IN HIS FAVOR AT THE TIME OF EXECUTING THE RELEASE, WHICH IF KNOWN BY HIM MUST HAVE MATERIALLY AFFECTED HIS SETTLEMENT WITH THE DEBTOR.
I expressly waive and relinquish all rights and benefits under that section and any law of any jurisdiction of similar effect.
This Release, together with the Agreement, constitutes the entire understanding of the parties on the subjects covered.
| EMPLOYEE: |
|
|
A-2
Exhibit 21.1
Ultra Clean Holdings, Inc.
List of Subsidiaries
Ultra Clean Technology Systems and Service, Inc. (a California corporation)
Ultra Clean International Holding Company (a Cayman Islands corporation)
Ultra Clean Technology (Shanghai) Co., LTD (a Chinese corporation)
Ultra Clean Micro-Electronics Equipment (Shanghai) Co., Ltd. (a Chinese corporation)
UCT Sieger Engineering LLC (a Delaware limited liability company)
Far East International Holding Ltd (a Hong Kong corporation)
Ultra Clean Asia Pacific, Pte Ltd (a Singapore corporation)
American Integration Technologies LLC (a Delaware limited liability company)
Integrated Flow Systems, LLC (a California limited liability company)
UCT Additive Manufacturing Center Pte Ltd (a Singapore corporation)
Marchi Thermal Systems, Inc. (a Delaware corporation)
Exhibit 23.1
CONSENT OF INDEPENDENT REGISTERED PUBLIC ACCOUNTING FIRM
We consent to the incorporation by reference in Registration Statements Nos. 333-188995, 333-167530, 333-165782, 333-158108, 333-151335, 333-141989, 333-135147, 333-123820 and 333-114051 on Form S-8 and Registration Statement No. 333-202211 on Form S-3 of our report dated March 11, 2015, relating to the consolidated financial statements of Ultra Clean Holdings, Inc. and subsidiaries (the “Company”), and the effectiveness of the Company and subsidiaries’ internal control over financial reporting, appearing in this Annual Report on Form 10-K of the Company for the year ended December 26, 2014.
/s/ Deloitte & Touche LLP
San Jose, California
March 11, 2015
EXHIBIT 31.1
CERTIFICATION
I, James P. Scholhamer, certify that:
| 1. | I have reviewed this annual report on Form 10-K of Ultra Clean Holdings, Inc.; |
| 2. | Based on my knowledge, this report does not contain any untrue statement of a material fact or omit to state a material fact necessary to make the statements made, in light of the circumstances under which such statements were made, not misleading with respect to the period covered by this report; |
| 3. | Based on my knowledge, the financial statements, and other financial information included in this report, fairly present in all material respects the financial condition, results of operations and cash flows of the registrant as of, and for, the periods presented in this report; |
| 4. | The registrant’s other certifying officer and I are responsible for establishing and maintaining disclosure controls and procedures (as defined in Exchange Act Rules 13a-15(e) and 15d-15(e)) and internal control over financial reporting (as defined in Exchange Act Rules 13a-15(f) and 15d-15(f)) for the registrant and have: |
| (a) | Designed such disclosure controls and procedures, or caused such disclosure controls and procedures to be designed under our supervision, to ensure that material information relating to the registrant, including its consolidated subsidiaries, is made known to us by others within those entities, particularly during the period in which this report is being prepared; |
| (b) | Designed such internal control over financial reporting, or caused such internal control over financial reporting to be designed under our supervision, to provide reasonable assurance regarding the reliability of financial reporting and the preparation of financial statements for external purposes in accordance with generally accepted accounting principles; |
| (c) | Evaluated the effectiveness of the registrant’s disclosure controls and procedures and presented in this report our conclusions about the effectiveness of the disclosure controls and procedures, as of the end of the period covered by this report based on such evaluation; and |
| (d) | Disclosed in this report any change in the registrant’s internal control over financial reporting that occurred during the registrant’s most recent fiscal quarter (the registrant’s fourth fiscal quarter in the case of an annual report) that has materially affected, or is reasonably likely to materially affect, the registrant’s internal control over financial reporting; and |
| 5. | The registrant’s other certifying officer and I have disclosed, based on our most recent evaluation of internal control over financial reporting, to the registrant’s auditors and the audit committee of the registrant’s board of directors (or persons performing the equivalent functions): |
| (a) | All significant deficiencies and material weaknesses in the design or operation of internal control over financial reporting which are reasonably likely to adversely affect the registrant’s ability to record, process, summarize and report financial information; and |
| (b) | Any fraud, whether or not material, that involves management or other employees who have a significant role in the registrant’s internal control over financial reporting. |
Date: March 11, 2015
| /s/ James P. Scholhamer |
| James P. Scholhamer |
| Chief Executive Officer |
EXHIBIT 31.2
CERTIFICATION
I, Kevin C. Eichler, certify that:
| 1. | I have reviewed this annual report on Form 10-K of Ultra Clean Holdings, Inc. |
| 2. | Based on my knowledge, this report does not contain any untrue statement of a material fact or omit to state a material fact necessary to make the statements made, in light of the circumstances under which such statements were made, not misleading with respect to the period covered by this report; |
| 3. | Based on my knowledge, the financial statements, and other financial information included in this report, fairly present in all material respects the financial condition, results of operations and cash flows of the registrant as of, and for, the periods presented in this report; |
| 4. | The registrant’s other certifying officer and I are responsible for establishing and maintaining disclosure controls and procedures (as defined in Exchange Act Rules 13a-15(e) and 15d-15(e)) and internal control over financial reporting (as defined in Exchange Act Rules 13a-15(f) and 15d-15(f)) for the registrant and have: |
| (a) | Designed such disclosure controls and procedures, or caused such disclosure controls and procedures to be designed under our supervision, to ensure that material information relating to the registrant, including its consolidated subsidiaries, is made known to us by others within those entities, particularly during the period in which this report is being prepared; |
| (b) | Designed such internal control over financial reporting, or caused such internal control over financial reporting to be designed under our supervision, to provide reasonable assurance regarding the reliability of financial reporting and the preparation of financial statements for external purposes in accordance with generally accepted accounting principles; |
| (c) | Evaluated the effectiveness of the registrant’s disclosure controls and procedures and presented in this report our conclusions about the effectiveness of the disclosure controls and procedures, as of the end of the period covered by this report based on such evaluation; and |
| (d) | Disclosed in this report any change in the registrant’s internal control over financial reporting that occurred during the registrant’s most recent fiscal quarter (the registrant’s fourth fiscal quarter in the case of an annual report) that has materially affected, or is reasonably likely to materially affect, the registrant’s internal control over financial reporting; and |
| 5. | The registrant’s other certifying officer and I have disclosed, based on our most recent evaluation of internal control over financial reporting, to the registrant’s auditors and the audit committee of the registrant’s board of directors (or persons performing the equivalent functions): |
| (a) | All significant deficiencies and material weaknesses in the design or operation of internal control over financial reporting which are reasonably likely to adversely affect the registrant’s ability to record, process, summarize and report financial information; and |
| (b) | Any fraud, whether or not material, that involves management or other employees who have a significant role in the registrant’s internal control over financial reporting. |
Date: March 11, 2015
| /s/ Kevin C. Eichler |
| Kevin C. Eichler |
| Executive Vice President, Chief Financial Officer and Secretary |
EXHIBIT 32.1
ULTRA CLEAN HOLDINGS, INC.
SARBANES-OXLEY ACT SECTION 906 CERTIFICATION
The certification set forth below is being submitted in connection with the annual report on Form 10-K of Ultra Clean Holdings, Inc. for the year ended December 26, 2014 (the “Report”) for the purpose of complying with Rule 13a-14(b) or Rule 15d-14(b) of the Securities Exchange Act of 1934 (the “Exchange Act”) and Section 1350 of Chapter 63 of Title 18 of the United States Code.
I, James P. Scholhamer, the Chief Executive Officer of Ultra Clean Holdings, Inc., certify that:
| 1. | the Report fully complies with the requirements of Section 13(a) or 15(d) of the Exchange Act; and |
| 2. | the information contained in the Report fairly presents, in all material respects, the financial condition and results of operations of Ultra Clean Holdings, Inc. |
Date: March 11, 2015
| /s/ James P. Scholhamer |
| James P. Scholhamer |
| Chief Executive Officer |
EXHIBIT 32.2
ULTRA CLEAN HOLDINGS, INC.
SARBANES-OXLEY ACT SECTION 906 CERTIFICATION
The certification set forth below is being submitted in connection with the annual report on Form 10-K of Ultra Clean Holdings, Inc. for the year ended December 26, 2014 (the “Report”) for the purpose of complying with Rule 13a-14(b) or Rule 15d-14(b) of the Securities Exchange Act of 1934 (the “Exchange Act”) and Section 1350 of Chapter 63 of Title 18 of the United States Code.
I, Kevin C. Eichler, the Chief Financial Officer of Ultra Clean Holdings, Inc., certify that:
| 1. | the Report fully complies with the requirements of Section 13(a) or 15(d) of the Exchange Act; and |
| 2. | the information contained in the Report fairly presents, in all material respects, the financial condition and results of operations of Ultra Clean Holdings, Inc. |
Date: March 11, 2015
| /s/ Kevin C. Eichler |
| Kevin C. Eichler |
| Executive Vice President, Chief Financial Officer and Secretary |
Serious News for Serious Traders! Try StreetInsider.com Premium Free!
You May Also Be Interested In
- U.S. Federal Magistrate Judge Recommends Invalidation of Jetaire Patents in Lawsuit Against AerSale
- Good Natured Products Inc. Announces Extension of Non-Brokered Private Placement
- FluroTech and GS Heli Announce Execution of Definitive Agreement
Create E-mail Alert Related Categories
SEC FilingsSign up for StreetInsider Free!
Receive full access to all new and archived articles, unlimited portfolio tracking, e-mail alerts, custom newswires and RSS feeds - and more!
