

Form 8-K Genesis Healthcare, Inc. For: Mar 10
 Tweet
Tweet Share
Share
UNITED STATES
SECURITIES AND EXCHANGE COMMISSION
WASHINGTON, D.C. 20549
FORM 8-K
CURRENT REPORT
Pursuant to Section 13 or 15(d) of the
Securities Exchange Act of 1934
Date of report (Date of earliest event reported): March 10, 2015
Genesis Healthcare, Inc.
(Exact Name of Registrant Specified in Charter)
|
Delaware |
|
001-33459 |
|
20-3934755 |
|
(State or Other |
|
(Commission File |
|
(I.R.S. Employer |
|
Jurisdiction of |
|
Number) |
|
Identification No.) |
|
Incorporation) |
|
|
|
|
|
101 East State Street |
|
|
|
Kennett Square, PA |
|
19348 |
|
(Address of Principal Executive Offices) |
|
(Zip Code) |
(610) 444-6350
(Registrant’s telephone number, including area code)
Not applicable
(Former Name or Former Address, if Changed Since Last Report)
Check the appropriate box below if the Form 8-K filing is intended to simultaneously satisfy the filing obligation of the registrant under any of the following provisions:
o Written communications pursuant to Rule 425 under the Securities Act (17 CFR 230.425)
o Soliciting material pursuant to Rule 14a-12 under the Exchange Act (17 CFR 240.14a-12)
o Pre-commencement communications pursuant to Rule 14d-2(b) under the Exchange Act (17 CFR 240.14d-2(b))
o Pre-commencement communications pursuant to Rule 13e-4(c) under the Exchange Act (17 CFR 240.13e-4(c))
Item 7.01. Regulation FD Disclosure
On March 10, 2015, Genesis Healthcare, Inc. (“Genesis”) made available on its web site the investor presentation materials attached to this report as Exhibit 99.1. The furnishing of these materials is not intended to constitute a representation that such furnishing is required by Regulation FD or other securities laws, or that the investor presentation materials include material information regarding Genesis that is not otherwise publicly available. In addition, Genesis does not assume any obligation to update such information in the future.
Item 9.01. Financial Statements and Exhibits
99.1 Investor presentation materials dated March 10, 2015.
SIGNATURE
Pursuant to the requirements of the Securities Exchange Act of 1934, the Company has duly caused this current report to be signed on its behalf by the undersigned hereunto duly authorized.
|
|
GENESIS HEALTHCARE, INC. | |
|
|
| |
|
|
| |
|
Date: March 10, 2015 |
By: |
/s/ Michael S. Sherman |
|
|
|
Michael S. Sherman |
|
|
|
Senior Vice President, General Counsel, |
|
|
|
Secretary and Assistant Treasurer |
Exhibit 99.1
|
|
Genesis HealthCare A Leading National Provider of Post-Acute Services March 2015 |
|
|
Safe Harbor Statement Certain statements in this presentation regarding the expected benefits of the Skilled Healthcare transaction, future opportunities for the Company and any other statements regarding the Company’s future expectations, beliefs, goals, strategies or prospects contained in this presentation constitute “forward-looking statements” under Section 27A of the Securities Act of 1933 and Section 21E of the Securities Exchange Act of 1934. Forward-looking statements may be preceded by, followed by or include the words “may,” “will,” “believe,” “expect,” “anticipate,” “intend,” “plan,” “estimate,” “could,” “might,” or “continue” or the negative or other variations thereof or comparable terminology. A number of important factors could cause actual events or results to differ materially from those indicated by such forward-looking statements, including changes in the Company’s reimbursement rates; healthcare reform legislation; the impact of government investigations and legal actions against the Company’s centers and other factors described in the most recent Annual Report on Form 10-K of the Company and elsewhere in the Company’s filings with the Securities and Exchange Commission. You should not place undue reliance on any of these forward- looking statements. Any forward-looking statement speaks only as of the date on which it is made, and the Company undertakes no obligation to update any such statement to reflect new information, or the occurrence of future events or changes in circumstances. References made in this presentation to "Genesis," "the Company," "we," "us" and "our" refer to Genesis HealthCare, Inc. and each of its wholly-owned companies. 1 |
|
|
Transaction Complete Genesis’ Growth Strategy Financial Summary AGENDA Genesis and Skilled Combined |
|
|
Transaction Complete On February 2nd, Skilled and Genesis combined in stock-for-stock transaction The Combined Company is now Genesis HealthCare The Combined Company will remain a public company (NYSE: GEN) Skilled shareholders own 25.75% and Genesis shareholders own 74.25% of the pro forma Combined Company Approximate pro forma ownership structure: Public investors (16%); Onex (10%); Formation Capital Principals (28%); Management (9%) Other Genesis shareholders (34%); Health Care REIT (3%) George Hager, CEO; Tom DiVittorio, CFO Board composition: CEO, George Hager 10 additional directors appointed or jointly appointed by Genesis/Skilled. 3 are independent. Governance Structure and Considerations 3 New Company |
|
|
Leading Post-Acute Platform Expands one of the largest providers of post acute care inpatient services Scale to drive local & national market efficiencies Accelerates revenue, earnings, free cash flow growth Enhances Rehab growth by introducing Genesis into new Skilled markets Rehab services provided to 1,600+ locations Complementary operating strategies Pioneers in the development of high acuity capabilities Focus on rehab intensive services Strategically & clinically well-positioned with payors and referral sources Strong management team with a demonstrated track record of integrating sizable acquisitions Genesis acquired/integrated 199 facilities in Sun acquisition in 2012 Targeted $50 mm of synergies & realized $60 mm+ Strategically – Attractive Partnership Financially – Compelling Transaction Long term growth opportunity across Skilled & Genesis platforms Strategic & organic growth Meaningful synergy opportunity Combined rehab platform better positioned to continue high-growth growth trajectory Genesis IT and operating model improves efficiency and margins for non-affiliated third party operators Significant Combined Company asset value Combined Company will own the real estate of 58 SNFs / 22 ALFs Sizeable home health / hospice platform and nurse / therapist staffing provider Attractive rate environment for skilled nursing providers Medicare’s 2.0% average increase for FY15 is the most attractive in recent years Improved state budgets have resulted in stable Medicaid environment 4 |
|
|
Transaction Update Genesis’ Growth Strategy Financial Summary AGENDA Genesis and Skilled Combined |
|
|
Broad Combined Geographic Scale Pro Forma Inpatient Services Footprint Genesis HealthCare Facilities Over 500 SNF and ALF facilities across 34 states Top 5 states by licensed beds: PA: 10.6% NJ: 8.9% MD: 7.7% MA: 7.4% CA: 7.0% ___________________________ Source: Company information. 6 |
|
|
195 Genesis Rehabilitation Services 12 16 7 8 6 13 33 46 142 6 4 2 19 37 69 111 90 90 69 13 25 16 46 15 45 28 28 103 14 9 57 8 DC 4 Hawaii 4 Expansive Service Contract Footprint 3 126 6 9 1 9 20 9 38 4 42 1 Hawaii 4 Genesis is the 2nd largest contract rehabilitation therapy provider in the U.S. 7 ___________________________ Note: Facility counts by state are for GRS Only. |
|
|
Genesis and Skilled Combined One of the largest post-acute and contract rehabilitation providers in the nation Combined revenues of approximately $5.6 billion (as of Dec 31, 2014) More than 500 facilities in 34 states Approximately 95,000 employees Estimated $25 million in identified synergies, with additional upside potential The Combined Company estimated Pro-forma Funded Net-Debt is approximately $970 million 8 |
|
|
Transaction Update Genesis’ Growth Strategy Financial Summary AGENDA Genesis and Skilled Combined |
|
|
Genesis Growth Strategy Develop specialized post-acute / long-term care services & buildings Grow through selective acquisitions and successful integration Leverage growth in rehab therapy segment including home-based services Position for success in a post-healthcare reform environment 10 |
|
|
Specialized Services & Buildings Transform existing facilities to focus 100% on short-term, post-acute care Accelerate growth in higher margin, higher skilled services 100% Short-Stay / Post-Acute Facilities 100% Long-Term Care Genesis’ Bifurcation Strategy Transform existing facilities to focus 100% on long-term care Increase occupancy and overall profitability of long-term care facilities 11 |

|
|
Acquisition & Development Strategy Experienced in executing transactions of scale December 2012, acquired Sun Healthcare with 199 facilities Strengthened existing presence on east coast & added west coast Marketed $50 million of synergies but realized $60+ million Monetized Sun’s hospice business at closing; continue to own and operate Sun’s staffing business Selectively divested non-core or underperforming facilities & exited certain rehab contracts Executing on Large Scale Acquisitions And Smaller Scale Opportunities Pursue smaller, attractive M&A and development opportunities Acquisitions Development Projects Beds Type Facility State Opening Date 124 SNF PowerBack NJ January 2013 120 SNF Replacement MA February 2013 124 SNF PowerBack NJ December 2014 120 SNF Replacement MD December 2014 100 SNF PowerBack CO February 2015 130 SNF Replacement MD October 2015 124 SNF PowerBack NJ October 2015 12 Beds Type State Acquisition Date 108 PowerBack CO Mar-14 120 SNF NJ May-14 104 SNF DE Aug-14 125 SNF AL Sep-14 32 ALF AL Sep-14 68 SNF NH Nov-14 140 SNF TX Feb-15 90 PowerBack TBA May-15 60 PowerBack TBA May-15 |
|
|
Bifurcation Case Study Assumptions: Convert 10 buildings to short-stay model Convert 10 buildings to long-term care model Build 6 new non-Medicaid certified short-stay facilities Assumed Operating Metrics: Conversions Current Portfolio 10 Short-Stay 10 Long-Term Care 6 New Builds Pro Forma Portfolio Number of SNFs 360 - - 6 366 SNF Beds 42,418 - - 720 43,138 Avg Beds / SNF 118 - - 120 118 Occupancy 88.5% 85.0% 97.0% 85.0% 88.6% Skilled Mix 22.0% 100.0% 10.0% 100.0% 24.8% 13 |
|
|
Growth Strategies: Genesis Rehab Services 14 Organic net location growth – 100 per year Genesis/Formation acquisition/development strategy Expand into new states post Skilled transaction Expansion of Outpatient Services Vitality @ Home National / regional Home Health collaboration |
|
|
Post-Healthcare Reform Environment Managed Care Strategy Build upon strong relationships with national and regional managed care plans Reduces readmissions Improves quality outcomes Creates efficiency in the healthcare delivery system Capture additional patient referrals resulting from expanded coverage through healthcare reform Readmission Incentive programs 15 |
|
|
Partnering Strategy With Providers Key Partners Key Strategies Develop SNFs in partnership with acute care providers Partner with hospitals to deliver COPD and CHF specialties to reduce re-hospitalization / re-admission rates Strategic partnerships to develop additional PowerBack centers Unique software solutions to identify a patient’s unique care requirements & match the patient with appropriate post-acute care setting Partner with provider of dialysis services Well positioned for inclusion in applicable ACO networks as well as bundled / episodic payment programs 16 |

|
|
Enhancing Skilled Mix through Focus on High Acuity Patients Specialty Care Units # of Specialty Units Short-Term Specialties PowerBack Rehabilitation 8 Transitional Care Units 103 Progression Orthopedic Units 4 Long-Term Specialties Alzheimer’s Units 53 Ventilator Care Units 8 Dialysis Units 11 17 Traditional Care Units A rapid recovery option for patients requiring post-acute rehab and medical services due to illness, surgery or injury. Offers enhanced clinical services in a designated unit with higher licensed clinical staffing Homestead (Alzheimer’s) Offers a safe, secure, home-like environment with consistent staff to promote relationships and stable family atmosphere Progression Unit A short stay option for patients requiring orthopedic rehabilitation after hospital discharge, but before going home Ventilator Care Designed for patients who need short-term or continuous ventilator care or rehab Dialysis On-site services for patients requiring treatment for end-stage renal disease along with skilled care PowerBack Aggressive, highly personalized care plans designed to get patients home sooner |
|
|
Genesis Physician Services (“GPS”) Group practice specializing in sub-acute, skilled nursing & long-term care Dedicated Medical Directors & full-/ part-time Attending Physicians, NPs and PAs Clinical care partners for the entire Genesis care team 73% of facility admissions are seen by GPS providers (where a GPS presence exists) 525,000 patient visits annually Leading the Direction of Post Acute Care Full-Time Provider Growth 18 |
|
|
Transaction Update Genesis’ Growth Strategy Financial Summary AGENDA Genesis and Skilled Combined |
|
|
Pro Forma 2014 Summary Financials ___________________________ Note: Figures represent Fiscal 2014. See GAAP to Non-GAAP reconciliation in the Appendix . Adj. Revenue Adj. EBITDAR Adj. EBITDA (1) (1) (1) (1) (1) (1) 20 $5,587 |
|
|
Significant Synergy Opportunity Skilled and Genesis estimate the Combined Company can achieve $25 million of synergies, with the potential for upside Category $ % of Total Vendor Repricing and Contract Consolidation $10 40% Duplicative Positions, Functions and Costs 6 24% Information System Integration 4 16% Rehab Business Development Opportunities 3 12% Best of Breed Managed Care Contracting 2 8% Total Estimated Synergies $25 100% ($ in millions) 21 |
|
|
2015 Guidance (As Included in Earnings Release Dated Feb 19, 2015) 22 Adjusted EBITDAR Guidance Range Bridge ($ in millions) Low End High End 2014 Genesis & Skilled pro forma combined Adjusted EBITDAR $ 688.6 $ 688.6 Combination synergies expected to be realized in 2015 13.0 13.0 Impact of cost reduction initiatives 30.0 40.0 Incremental earnings from completed new builds / acquisitions 9.0 11.0 Organic growth - rehabilitation therapy segment 7.0 9.0 Organic growth - inpatient segment 7.4 8.4 2015 Genesis Healthcare, Inc. Guidance $ 755.0 $ 770.0 ($ in millions) Low End High End Adjusted Revenue 5,718.4 $ 5,798.4 $ Adjusted EBITDAR 755.0 $ 770.0 $ Adjusted EBITDA 267.6 $ 282.6 $ Adjusted Diluted EPS from Continuing Operations 0.34 $ 0.39 $ 2015 Guidance Summary |
|
|
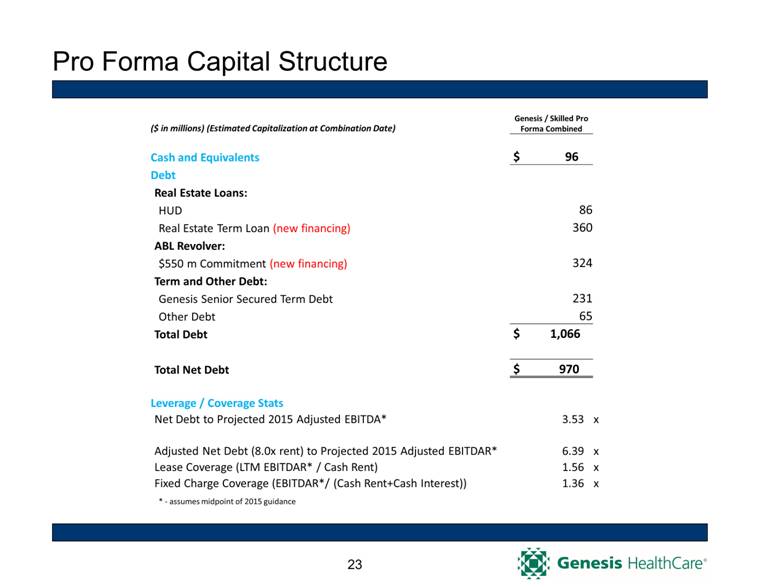
Pro Forma Capital Structure 23 ($ in millions) (Estimated Capitalization at Combination Date) Genesis / Skilled Pro Forma Combined Cash and Equivalents $ 96 Debt Real Estate Loans: HUD 86 Real Estate Term Loan (new financing) 360 ABL Revolver: $550 m Commitment (new financing) 324 Term and Other Debt: Genesis Senior Secured Term Debt 231 Other Debt 65 Total Debt $ 1,066 Total Net Debt $ 970 Leverage / Coverage Stats Net Debt to Projected 2015 Adjusted EBITDA* 3.53 x Adjusted Net Debt (8.0x rent) to Projected 2015 Adjusted EBITDAR* 6.39 x Lease Coverage (LTM EBITDAR* / Cash Rent) 1.56 x Fixed Charge Coverage (EBITDAR*/ (Cash Rent+Cash Interest)) 1.36 x * - assumes midpoint of 2015 guidance |
|
|
Capital Strengthening Initiatives 24 Refinance $360 m Real Estate Bridge with HUD financing Increase facility ownership Repay debt with proceeds of non-core asset sales Use free cash flow to reduce revolver borrowings |
|
|
2015 Strategic Focus Areas Integrate Skilled Healthcare Group & achieve synergies. Grow rehab therapy business, including development & expansion of outpatient service capabilities. Continue efforts to develop & acquire skilled nursing assets in attractive markets, with emphasis on short stay only facilities. Take steps to reduce cost of capital / fixed charges, including refinance Skilled facility real estate into HUD program. 25 |
|
|
Appendix |
|
|
Use of Non-GAAP Measures This presentation includes references to EBITDAR, Adjusted EBITDAR, EBITDA and Adjusted EBITDA, which are non-GAAP financial measures. For purposes of SEC Regulation G, a non-GAAP financial measure is a numerical measure of a registrant’s historical or future financial performance, financial position and cash flows that excludes amounts, or is subject to adjustments that have the effect of excluding amounts, that are included in the most directly comparable financial measure calculated and presented in accordance with GAAP in the statement of operations, balance sheet or statement of cash flows (or equivalent statements) of the registrant; or includes amounts, or is subject to adjustments that have the effect of including amounts, that are excluded from the most directly comparable financial measure so calculated and presented. In this regard, GAAP refers to generally accepted accounting principles in the United States. Pursuant to the requirements of Regulation G, Genesis has provided reconciliations of the non-GAAP financial measures to the most directly comparable GAAP financial measures. We believe that the presentation of EBITDA, EBITDAR, Adjusted EBITDA and Adjusted EBITDAR provides consistency in our financial reporting and provides a basis for the comparison of results of core business operations between our current, past and future periods. EBITDA, EBITDAR, Adjusted EBITDA and Adjusted EBITDAR are primary indicators management uses for planning and forecasting in future periods, including trending and analyzing the core operating performance of our business from period-to-period without the effect of expenses, revenues and gains (losses) that are unrelated to the day-to-day performance of our consolidated and segmented business but are required to reported in accordance with accounting principles generally accepted in the United States of America ("U.S. GAAP"). We also use EBITDA, EBITDAR, Adjusted EBITDA and Adjusted EBITDAR to benchmark the performance of our consolidated and segmented business against expected results, analyzing year-over-year trends as described below and to compare our operating performance to that of our competitors. Management uses EBITDA, EBITDAR, Adjusted EBITDA and Adjusted EBITDAR to assess the performance of our core business operations, to prepare operating budgets and to measure our performance against those budgets on a consolidated and segment level. Segment management uses these metrics to measure performance on a business unit by business unit basis. We typically use Adjusted EBITDA and Adjusted EBITDAR for these purposes on a consolidated basis as the adjustments to EBITDA and EBITDAR are not generally allocable to any individual business unit and we typically use EBITDA and EBITDAR to compare the operating performance of each skilled nursing and assisted living facility, as well as to assess the performance of our operating segments. EBITDA, EBITDAR, Adjusted EBITDA and Adjusted EBITDAR are useful in this regard because they do not include such costs as interest expense (net of interest income), income taxes, depreciation and amortization expense, rent cost of revenue (in the case of EBITDAR and Adjusted EBITDAR) and special charges, which may vary from business unit to business unit and period-to-period depending upon various factors, including the method used to finance the business, the amount of debt that we have determined to incur, whether a facility is owned or leased, the date of acquisition of a facility or business, the original purchase price of a facility or business unit or the tax law of the state in which a business unit operates. These types of charges are dependent on factors unrelated to the underlying business unit performance. As a result, we believe that the use of adjusted net income per share, EBITDA, EBITDAR, Adjusted EBITDA and Adjusted EBITDAR provides a meaningful and consistent comparison of our underlying business units between periods by eliminating certain items required by U.S. GAAP which have little or no significance to their day-to-day operations. The use of EBITDA, EBITDAR, Adjusted EBITDA, Adjusted EBITDAR and other non-GAAP financial measures has certain limitations. Our presentation of EBITDA, EBITDAR, Adjusted EBITDA, Adjusted EBITDAR or other non-GAAP financial measures may be different from the presentation used by other companies and therefore comparability may be limited. Depreciation and amortization expense, interest expense, income taxes and other items have been and will be incurred and are not reflected in the presentation of EBITDA, EBITDAR, Adjusted EBITDA or Adjusted EBITDAR. Each of these items should also be considered in the overall evaluation of our results. Additionally, EBITDA, EBITDAR, Adjusted EBITDA, Adjusted EBITDAR do not consider capital expenditures and other investing activities and should not be considered as a measure of our liquidity. We compensate for these limitations by providing the relevant disclosure of our depreciation and amortization, interest and income taxes, capital expenditures and other items both in our reconciliations to the U.S. GAAP financial measures and in our consolidated financial statements, all of which should be considered when evaluating our performance. EBITDA, EBITDAR, Adjusted EBITDA, Adjusted EBITDAR and certain other non-GAAP financial measures are used in addition to and in conjunction with results presented in accordance with U.S. GAAP. EBITDA, EBITDAR, Adjusted EBITDA, Adjusted EBITDAR and other non-GAAP financial measures should not be considered as an alternative to net income, operating income, or any other operating performance measure prescribed by U.S. GAAP, nor should these measures be relied upon to the exclusion of U.S. GAAP financial measures. EBITDA, EBITDAR, Adjusted EBITDA, Adjusted EBITDAR and other non-GAAP financial measures reflect additional ways of viewing our operations that we believe, when viewed with our U.S. GAAP results and the reconciliations to the corresponding U.S. GAAP financial measures, provide a more complete understanding of factors and trends affecting our business than could be obtained absent this disclosure. You are strongly encouraged to review our financial information in its entirety and not to rely on any single financial measure. |
|
|
2015 Guidance – Low End (with reconciliation) As reported As adjusted Twelve months ended December 31, 2015* Conversion to cash basis leases (a) Newly acquired or constructed businesses with start-up losses (b) Other adjustments (c) Total adjustments Twelve months ended December 31, 2015 (in 000s, except EPS) Net revenues 5,744,197 $ - $ (25,759) $ - $ (25,759) $ 5,718,438 $ Salaries, wages and benefits 3,566,752 - (16,175) - (16,175) 3,550,577 Other operating expenses 1,427,595 - (11,734) - (11,734) 1,415,861 Lease expense 157,874 334,941 (5,383) - 329,558 487,432 Depreciation and amortization expense 221,834 (126,525) - - (126,525) 95,309 Interest expense 507,203 (421,251) - - (421,251) 85,952 Investment income (2,000) - - - - (2,000) Transaction costs 88,989 - - (88,989) (88,989) - Equity in net income of unconsolidated affiliates (1,050) - - - - (1,050) (Loss) income before income tax expense (223,000) $ 212,835 $ 7,533 $ 88,989 $ 309,357 $ 86,357 $ Income tax expense (benefit) (48,521) 46,309 1,639 19,363 67,311 18,790 Income (loss) from continuing operations (174,479) $ 166,526 $ 5,894 $ 69,626 $ 242,046 $ 67,567 $ Less net (income) loss attributable to noncontrolling interests 101,698 (97,062) (3,435) (40,583) (141,080) (39,382) Net (loss) income attributable to Genesis HealthCare, Inc. (72,781) $ 69,464 $ 2,459 $ 29,043 $ 100,966 $ 28,185 $ Earnings (loss) per share, diluted: (0.87) $ 0.34 $ Weighted-average common shares outstanding, diluted 154,603 154,603 Adjustments to Compute EBITDAR / Adjusted EBITDAR Depreciation and amortization expense 221,834 (126,525) - - (126,525) 95,309 Interest expense 507,203 (421,251) - - (421,251) 85,952 Transaction costs 88,989 - - (88,989) (88,989) - Income tax expense (benefit) (48,521) 46,309 1,639 19,363 67,311 18,790 Net income (loss) attributable to noncontrolling interests (101,698) 97,062 3,435 40,583 141,080 39,382 EBITDA / Adjusted EBITDA 595,026 $ (334,941) $ 7,533 $ - $ (327,408) $ 267,618 $ Lease expense 157,874 334,941 (5,383) - 329,558 487,432 EBITDAR / Adjusted EBITDAR 752,900 $ - $ 2,150 $ - $ 2,150 $ 755,050 $ Adjustments |
|
|
2015 Guidance – High End (with reconciliation) As reported As adjusted Twelve months ended December 31, 2015* Conversion to cash basis leases (a) Newly acquired or constructed businesses with start-up losses (b) Other adjustments (c) Total adjustments Twelve months ended December 31, 2015 (in 000s, except EPS) Net revenues 5,824,197 $ - $ (25,759) $ - $ (25,759) $ 5,798,438 $ Salaries, wages and benefits 3,614,512 - (16,175) - (16,175) 3,598,337 Other operating expenses 1,446,798 - (11,734) - (11,734) 1,435,064 Lease expense 157,874 334,941 (5,383) - 329,558 487,432 Depreciation and amortization expense 222,554 (126,525) - - (126,525) 96,029 Interest expense 508,003 (421,251) - - (421,251) 86,752 Investment income (3,000) - - - - (3,000) Transaction costs 88,989 - - (88,989) (88,989) - Equity in net income of unconsolidated affiliates (2,000) - - - - (2,000) (Loss) income before income tax expense (209,533) $ 212,835 $ 7,533 $ 88,989 $ 309,357 $ 99,824 $ Income tax (benefit) expense (45,591) 46,309 1,639 19,363 67,311 21,720 Income (loss) from continuing operations (163,942) $ 166,526 $ 5,894 $ 69,626 $ 242,046 $ 78,104 $ Less net (income) loss attributable to noncontrolling interests 95,556 (97,062) (3,435) (40,583) (141,080) (45,524) Net (loss) income attributable to Genesis HealthCare, Inc. (68,386) $ 69,464 $ 2,459 $ 29,043 $ 100,966 $ 32,580 $ Earnings (loss) per share, diluted: (0.81) $ 0.39 $ Weighted-average common shares outstanding, diluted 154,603 154,603 Adjustments to Compute EBITDAR / Adjusted EBITDAR Depreciation and amortization expense 222,554 (126,525) - - (126,525) 96,029 Interest expense 508,003 (421,251) - - (421,251) 86,752 Transaction costs 88,989 - - (88,989) (88,989) - Income tax (benefit) expense (45,591) 46,309 1,639 19,363 67,311 21,720 Net income (loss) attributable to noncontrolling interests (95,556) 97,062 3,435 40,583 141,080 45,524 EBITDA / Adjusted EBITDA 610,013 $ (334,941) $ 7,533 $ - $ (327,408) $ 282,605 $ Lease expense 157,874 334,941 (5,383) - 329,558 487,432 EBITDAR / Adjusted EBITDAR 767,887 $ - $ 2,150 $ - $ 2,150 $ 770,037 $ Adjustments |
|
|
Genesis Consolidated Statement of Operations (In thousands) Year Etided December 31, 2014 2013 Net revenues $ 4,768,080 $ 4,710,341 Salaries, wages and benefits 3,006,914 2,998,658 Other operating expenses 1,231,612 1,130,605 Lease expense 131,898 131,231 Depreciation and amortization expense 193,675 188,726 Interest expense 442,724 426,975 Loss on extinguishment of debt 1,133 Investment income (3,399) (4,150) Other (income) loss (138) 450 Transaction costs 13,353 5,878 Long-lived asset impairment 31,399 9,399 Equity in net loss of unconsolidated affiliates 416 691 Loss before income tax benefit (281,507) (178,785) Income tax benefit (44,022) (9,179) Loss from continuing operations (237,485) (169,606) Loss from discontinued operations, net of taxes (14,044) (7,364) Net loss (251,529) (176,970) Less net income attributable to noncontrolling interests (2m456) (1,025) Net loss attributable to FC-GEN $ (253,985) $ (177,995) |
|
|
Genesis Consolidated Balance Sheet (In thousands) December 31, 2014 December 31, 2013 Assets: Current assets: Cash and equivalents 87,548 $ 61,413 $ Accounts receivable, net of allowances for doubtful accounts 605,830 659,164 Other current assets 202,808 206,450 Total current assets 896,186 927,027 Property and equipment, net of accumulated depreciation 3,493,250 3,550,950 Identifiable intangible assets, net of accumulated amortization 173,112 194,513 Goodwill 169,681 169,681 Other long-term assets 409,179 294,834 Total assets 5,141,408 $ 5,137,005 $ Liabilities and Members' Interest: Current liabilities: Accounts payable and accrued expenses 318,122 $ 342,986 $ Accrued compensation 192,838 185,099 Other current liabilities 149,622 157,598 Total current liabilities 660,582 685,683 Long-term debt 525,728 473,165 Capital lease obligations 1,002,762 972,760 Financing obligations 2,911,200 2,785,103 Other long-term liabilities 498,626 404,175 Members' interest (457,490) (183,881) Total liabilities and members' interest 5,141,408 $ 5,137,005 $ FC-GEN OPERATIONS INVESTMENT, LLC CONDENSED CONSOLIDATED BALANCE SHEETS (IN THOUSANDS) (UNAUDITED) |
|
|
Genesis Reconciliation of Net (Loss) Income to EBITDA, EBITDAR, Adjusted EBITDA, and Adjusted EBITDAR (In thousands) As reported As adjusted Year ended December 31, 2014 Conversion to cash basis leases (a) Newly acquired or constructed businesses with start-up losses (b) Other adjustments (c) Total adjustments Year ended December 31, 2014 Net revenues 4,768,080 $ - $ (18,526) $ 4,260 $ (14,266) $ 4,753,814 $ - Salaries, wages and benefits 3,006,914 - (16,233) (2,579) (18,812) 2,988,102 Other operating expenses 1,231,612 - (8,372) (44,361) (52,733) 1,178,879 Lease expense 131,898 320,306 (3,005) - 317,301 449,199 Depreciation and amortization expense 193,675 (132,326) (434) - (132,760) 60,915 Interest expense 442,724 (391,962) - - (391,962) 50,762 Loss (gain) on extinguishment of debt 1,133 - - (1,133) (1,133) - Other (income) loss (138) - - 138 138 - Investment income (3,399) - - - - (3,399) Transaction costs 13,353 - - (13,353) (13,353) - Long-lived asset impairment 31,399 - - (31,399) (31,399) - Equity in net income of unconsolidated affiliates 416 - - - - 416 Income tax (benefit) expense (44,022) 31,697 1,479 15,065 48,241 4,219 (Loss) income from continuing operations (237,485) $ 172,285 $ 8,039 $ 81,882 $ 262,206 $ 24,721 $ Loss (income) from discontinued operations, net of taxes 14,044 (2,041) - - (2,041) 12,003 Net income attributable to noncontrolling interests 2,456 - - - - 2,456 Net (loss) income attributable to FC-GEN Operations Investment, LLC (253,985) $ 174,326 $ 8,039 $ 81,882 $ 264,247 $ 10,262 $ Depreciation and amortization expense 193,675 (132,326) (434) - (132,760) 60,915 Interest expense 442,724 (391,962) - - (391,962) 50,762 Loss (gain) on extinguishment of debt 1,133 - - (1,133) (1,133) - Other (income) loss (138) - - 138 138 - Transaction costs 13,353 - - (13,353) (13,353) - Long-lived asset impairment 31,399 - - (31,399) (31,399) - Income tax (benefit) expense (44,022) 31,697 1,479 15,065 48,241 4,219 Loss (income) from discontinued operations, net of taxes 14,044 (2,041) - - (2,041) 12,003 Net income attributable to noncontrolling interests 2,456 - - - - 2,456 EBITDA / Adjusted EBITDA 400,639 $ (320,306) $ 9,084 $ 51,200 $ (260,022) $ 140,617 $ Lease expense 131,898 320,306 (3,005) - 317,301 449,199 EBITDAR / Adjusted EBITDAR 532,537 $ - $ 6,079 $ 51,200 $ 57,279 $ 589,816 $ FC-GEN OPERATIONS INVESTMENT, LLC RECONCILIATION OF NET (LOSS) INCOME TO EBITDA, EBITDAR, ADJUSTED EBITDA AND ADJUSTED EBITDAR (UNAUDITED) (IN THOUSANDS) Adjustments |
|
|
Footnotes (a) Our leases are classified as either operating leases, capital leases or financing obligations pursuant to applicable guidance under U.S. GAAP. We view the primary provisions and economics of these leases, regardless of their accounting treatment, as being nearly identical. Virtually all of our leases are structured with triple net terms, have fixed annual rent escalators and have long-term initial maturities with renewal options. Accordingly, in connection with our evaluation of the financial performance of the Company, we reclassify all of our leases to operating lease treatment and reflect lease expense on a cash basis. This approach allows us to better understand the relationship in each reporting period of our operating performance, as measured by EBITDAR and Adjusted EBITDAR, to the cash basis obligations to our landlords in that reporting period, regardless of the lease accounting treatment. This presentation and approach is also consistent with the financial reporting and covenant compliance requirements contained in all of our major lease and loan agreements. The following table summarizes the reclassification adjustments necessary to present all leases as operating leases on a cash basis. (b) The acquisition and construction of new businesses has become an important element of our growth strategy. Many of the businesses we acquire have a history of operating losses and continue to generate operating losses in the months that follow our acquisition. Newly constructed or developed businesses also generate losses while in their start-up phase. We view these losses as both temporary and an expected component of our long-term investment in the new venture. We adjust these losses when computing Adjusted EBITDAR and Adjusted EBITDA in order to better evaluate the performance of our core business. The activities of such businesses are adjusted when computing Adjusted EBITDAR and Adjusted EBITDA until such time as a new business generates positive Adjusted EBITDA. The operating performance of new businesses are no longer adjusted when computing Adjusted EBITDAR and Adjusted EBITDA beginning the period in which a new business generates positive Adjusted EBITDA and all periods thereafter. There were six and seven acquired or newly constructed businesses eliminated from our reported results when computing adjusted results for the three months and the year ended December 31, 2014, respectively; and six acquired or newly constructed businesses eliminated from our reported results when computing adjusted results for the three months and the year ended December 31, 2013. 2014 2013 2014 2013 Lease expense: Cash rent - capital leases 22,497 $ 21,604 $ 89,683 $ 88,549 $ Cash rent - financing obligations 61,911 58,229 242,918 229,452 Non-cash - operating lease arrangements (2,607) (3,649) (12,295) (14,673) Lease expense adjustments 81,801 $ 76,184 $ 320,306 $ 303,328 $ Depreciation and amortization expense: Captial lease accounting (8,257) $ (8,464) $ (35,385) $ (35,116) $ Financing obligation accounting (25,445) (23,706) (96,941) (96,723) Depreciation and amortization expense adjustments (33,702) $ (32,170) $ (132,326) $ (131,839) $ Interest expense: Captial lease accounting (26,350) $ (24,203) $ (100,846) $ (98,870) $ Financing obligation accounting (73,356) (71,848) (291,116) (278,686) Interest expense adjustments (99,706) $ (96,051) $ (391,962) $ (377,556) $ Total pre-tax lease accounting adjustments (51,607) $ (52,037) $ (203,982) $ (206,067) $ Three months ended December 31, Years ended December 31, (in thousands) |
|
|
Footnotes (c) Other adjustments represent costs or gains associated with transactions or events that we do not believe are reflective of our core recurring operating business. The following items were realized in the periods presented. (1) We incurred costs related to the termination, severance and restructuring of certain components of the Company’s business. (2) We incurred legal defense and other related costs in connection with certain matters in dispute or under appeal with regulatory agencies. (3) We incurred business development costs in connection with the evaluation and start-up of services outside our existing service offerings. (4) We incurred a paid time off obligation upon assumption of two significant rehabilitation therapy contracts. (5) We incurred a cumulative GLPL insurance adjustment for the development of prior period claims associated with the acquisition of Sun Healthcare Group, Inc. (6) We incurred costs associated with transactions including the acquisition of Sun Healthcare Group, Inc., the combination with Skilled Healthcare Group, Inc. and other transactions. (7) We incurred non-cash charges in connection with our annual long-lived impairment testing. * Reflects GAAP updates to amounts included in the February 19, 2015 Earnings Release. These updates do not result in changes to Non-GAAP guidance. 2014 2013 2014 2013 Severance and restructuring (1) 6,762 $ 2,743 $ 8,975 $ 3,254 $ Regulatory defense and related costs (2) 3,124 63 5,085 310 New business development costs (3) 511 - 1,641 - New contract obligation assumption (4) - - - 1,616 Prior period GLPL insurance adjustment (5) 35,499 - 35,499 - Transaction costs (6) 8,070 2,554 13,353 5,878 Long-lived asset impairments (7) 31,399 9,999 31,399 9,999 Loss (gain) on early extinguishment of debt 453 273 1,133 63 Other loss (income) 499 - (138) 450 Tax benefit from total adjustments (13,413) (2,429) (15,065) (3,352) Total other adjustments 72,904 $ 13,203 $ 81,882 $ 18,218 $ (in thousands) Three months ended December 31, Years ended December 31, |
|
|
Skilled Consolidated Statement of Operations (In thousands, except per share data) Year ended December 31, 2014 2013 Revenue: (Audited) Net patient service revenue $ 830,055 $ 839,150 Lease facility revenue 3,201 3,122 833,256 842,272 Expenses: Cost of services (exclusive of rent cost of revenue and depreciation and amortization shown below) 714,864 731,870 Rent cost of revenue 20,000 18,828 General and administrative 39,989 26,619 Governmental investigation expense 6,000 Change in fair value of contingent consideration (576) (3,702) Depreciation and amortization 24,322 23,771 Impairment of long-lived assets 82 19,000 Loss on disposal of assets 75 361 804,756 816,747 Other (expenses) income: Interest expense (31,977) (34,258) Interest income 737 335 Other (expense) income, net 1 188 Equity in earnings of joint venture 1,427 1,949 Debt modification/retirement costs (843) (2,828) Total other (expenses) income, net (30,655) (34,614) (Loss) income from continuing operations before (benefit) provision for income taxes (2,155) (9,089) (Benefit) provision for income taxes (1,248) (2,905) (Loss) income from continuing operations (907) (6,184) (Loss) from discontinued operations, net of tax — (4,300) Net loss (907) (10,484) (Loss) earnings per share, basic: Earnings (loss) per common share from continuing operations $ (0.02) $ (0.17) Loss per common share from discontinued operations — $ (0.11) (Loss) earnings per share $ (0.02) $ (0.28) (Loss) earnings per share, diluted: Earnings (loss) per common share from continuing operations $ (0.02) $ (0.17) Loss per common share from discontinued operations — $ (0.11) (Loss) earnings per share $ (0.02) $ (0.28) Weighted-average common shares outstanding, basic 38,125 37,533 Weighted-average common shares outstanding, diluted 38,125 37,533 |
|
|
Skilled Balance Sheet & Cash Flow (In thousands) December 31, 2014 2013 Balance Sheet Data: ASSETS Cash and cash equivalents $3,629 $4,177 Accounts receivable, less allowance for doubtful accounts of $17,930 and $16,665 at December 31, 2014 and December 31, 2013, respectively 124,103 107,215 Other current assets 33,651 31,025 Property and equipment and leased facility assets, net 340,074 351,238 Goodwill 68,833 69,065 Other assets 80,666 80,696 Total assets $650,956 $643,416 LIABILITIES AND STOCKHOLDERS’ EQUITY Current liabilities less current portion of long-term debt $115,292 $90,158 Other long-term liabilities 42,016 41,901 Long-term debt 398,389 419,125 Stockholders’ equity 95,259 92,232 Total liabilities and stockholders’ equity $650,956 $643,416 Year Ended December 31, 2014 2013 Cash Flows Data: Net cash provided by operating activities $26,321 $47,921 Net cash used in investing activities (11,825) (493) Net cash used in financing activities (15,044) (45,254) (Decrease) increase in cash and cash equivalents (548) 2,174 Cash and cash equivalents at beginning of period 4,177 2,003 Cash and cash equivalents at end of period $3,629 $4,177 |
|
|
Skilled Reconciliation of Net (Loss) Income to EBITDA, EBITDAR, Adjusted EBITDA, and Adjusted EBITDAR (In thousands) Year Ended December 31, 2014 2013 Net loss ($907) ($10,484) Interest expense, net of interest income 31,240 33,923 Provision (benefit) for income taxes (1,248) (2,905) Depreciation and amortization expense 24,322 23,771 EBITDA 53,407 44,305 Rent cost of revenue 20,000 18,828 EBITDAR 73,407 63,133 EBITDA 53,407 44,305 Discontinued operations — 4,300 Loss (gain) on sale of assets 68 — Impairment of long-lived assets 82 19,000 Governmental investigation expense 6,000 — Debt modification/retirement cost 843 2,828 Combination related expense 13,697 306 Legal expense for non-routine matters 2,285 2,531 Change in fair value of contingent consideration (576) (3,702) Organization restructure costs 1,592 2,343 Exit costs related to divested facilities 397 — Losses at skilled nursing facility not at full operation 1,025 — Closure of California home health agency — 419 Adjusted EBITDA 78,820 72,330 Rent cost of revenue 20,000 18,828 Adjusted EBITDAR $98,820 $91,158 |
|
|
Skilled Reconciliation of (Loss) Income Before (Benefit) Provision for Income Taxes to Adjusted Net Income (In thousands, except per share data) Year Ended December 31, 2014 2013 (Loss) income from continuing operations before provision (benefit) for income taxes ($2,155) ($9,089) Organization restructure costs 1,592 2,343 Exit costs related to divested facilities 397 — Legal expense for non-routine matters 2,285 2,531 Losses at skilled nursing facility not at full operation 1,025 — Governmental investigation expense 6,000 — Impairment of long lived assets 82 19,000 Closure of California home health agency — 419 Debt modification/retirement costs 843 2,828 Combination related expenses 13,697 306 Adjusted income before provision for income taxes 23,766 18,338 Tax expense (1,248) (2,905) Tax benefit from total adjustments 10,109 10,697 Tax difference from shares that vested at a lower price than the grant price (495) — California Enterprise Zone tax credit valuation allowance (124) (1,500) Adjusted tax expense 8,242 6,292 Adjusted net income from continuing operations $15,524 $12,046 Weighted-average common shares outstanding, diluted 38,595 37,964 Adjusted net income per share, diluted $ 0.40 $ 0.32 Effective tax rate 34.7% 34.3% |
Serious News for Serious Traders! Try StreetInsider.com Premium Free!
You May Also Be Interested In
- Gen to Announce Fiscal 2024 Fourth Quarter and Full-Year Results on May 9, 2024
- Grape Law Announces Feature in Manage HR Magazine's "Top 10 Rising Immigration Law Firms in America" List
- Cumulus Announces Selected Preliminary Operating Results for First Quarter 2024
Create E-mail Alert Related Categories
SEC FilingsSign up for StreetInsider Free!
Receive full access to all new and archived articles, unlimited portfolio tracking, e-mail alerts, custom newswires and RSS feeds - and more!
