

Form 8-K VALERO ENERGY PARTNERS For: Mar 03
 Tweet
Tweet Share
Share
UNITED STATES
SECURITIES AND EXCHANGE COMMISSION
Washington, D.C. 20549
FORM 8-K
CURRENT REPORT
Pursuant to Section 13 or 15(d)
of the Securities Exchange Act of 1934
Date of Report (Date of earliest event reported): March 3, 2015
VALERO ENERGY PARTNERS LP
(Exact name of registrant as specified in its charter)
| Delaware | 1-36232 | 90-1006559 | ||
| (State or other jurisdiction of incorporation) |
(Commission File Number) |
(IRS Employer Identification No.) |
| One Valero Way |
||
| San Antonio, Texas | 78249 | |
| (Address of principal executive offices) | (Zip Code) |
Registrant’s telephone number, including area code: (210) 345-2000
Check the appropriate box below if the Form 8-K filing is intended to simultaneously satisfy the filing obligation of the registrant under any of the following provisions (see General Instruction A.2. below):
| ¨ | Written communications pursuant to Rule 425 under the Securities Act (17 CFR 230.425) |
| ¨ | Soliciting material pursuant to Rule 14a-12 under the Exchange Act (17 CFR 240.14a-12) |
| ¨ | Pre-commencement communications pursuant to Rule 14d-2(b) under the Exchange Act (17 CFR 240.14d-2(b)) |
| ¨ | Pre-commencement communications pursuant to Rule 13e-4(c) under the Exchange Act (17 CFR 240.13e-4(c)) |
| Item 7.01 | Regulation FD Disclosure. |
Senior management of Valero Energy Partners LP (the “Partnership”) will make certain investor presentations beginning as early as March 3, 2015. The slides attached to this report were prepared for management’s presentations. The slides are included in Exhibit 99.01 to this report and are incorporated herein by reference. The slides will be available on the Partnership’s website at www.valeroenergypartners.com.
The information in this report is being furnished, not filed, pursuant to Regulation FD. Accordingly, the information in Items 7.01 and 9.01 of this report will not be incorporated by reference into any registration statement filed by the Partnership under the Securities Act of 1933, as amended, unless specifically identified therein as being incorporated therein by reference. The furnishing of the information in this report is not intended to, and does not, constitute a determination or admission by the Partnership that the information in this report is material or complete, or that investors should consider this information before making an investment decision with respect to any security of the Partnership or any of its affiliates.
Safe Harbor Statement
Statements contained in the exhibit to this report that state the Partnership’s or its management’s expectations or predictions of the future are forward-looking statements intended to be covered by the safe harbor provisions of the Securities Act of 1933, as amended, and the Securities Exchange Act of 1934, as amended. It is important to note that the Partnership’s actual results could differ materially from those projected in such forward-looking statements. Factors that could affect those results include those mentioned in the documents that the Partnership has filed with the Securities and Exchange Commission.
| Item 9.01 | Financial Statements and Exhibits. |
(d) Exhibits.
99.01 Slides from management presentation.
2
SIGNATURE
Pursuant to the requirements of the Securities Exchange Act of 1934, the Partnership has duly caused this report to be signed on its behalf by the undersigned hereunto duly authorized.
| VALERO ENERGY PARTNERS LP | ||||||
| by: | Valero Energy Partners GP LLC, its general partner | |||||
| Date: March 3, 2015 | by: | /s/ Jay D. Browning | ||||
| Jay D. Browning | ||||||
| Senior Vice President and General Counsel | ||||||
 Barclays MLP
Corporate Access Day March 2015
Exhibit 99.01 |
 Safe Harbor
Statement 2
This presentation contains forward-looking statements within the meaning of federal
securities laws. These statements discuss future expectations, contain projections of
results of operations or of financial condition or state other forward-looking
information. You can identify forward-looking statements by words such as
“anticipate,” “believe,” “estimate,” “expect,”
“forecast,” “project,” “could,” “may,” “should,” “would,” “will” or
other similar expressions that convey the uncertainty of future events or outcomes. These
forward-looking statements are not guarantees of future performance and are subject
to risks, uncertainties and other factors, some of which are beyond the Partnership's
control and are difficult to predict. These statements are often based upon various
assumptions, many of which are based, in turn, upon further assumptions, including examination of
historical operating trends made by the management of the Partnership. Although the
Partnership believes that these assumptions were reasonable when made, because
assumptions are inherently subject to significant uncertainties and contingencies,
which are difficult or impossible to predict and are beyond its control, the
Partnership cannot give assurance that it will achieve or accomplish these expectations,
beliefs or intentions. When considering these forward-looking statements, you
should keep in mind the risk factors and other cautionary statements contained in the
Partnership’s filings with the U.S. Securities and Exchange Commission, including
the Form S-1 and prospectus relating to the initial public offering of the Partnership’s common units,
and the Partnership’s annual reports on Form 10-K and quarterly reports on Form
10-Q, available on the Partnership’s website at
www.valeroenergypartners.com. These risks could cause the Partnership’s actual
results to differ materially from those contained in any forward-looking statement.
|
 3
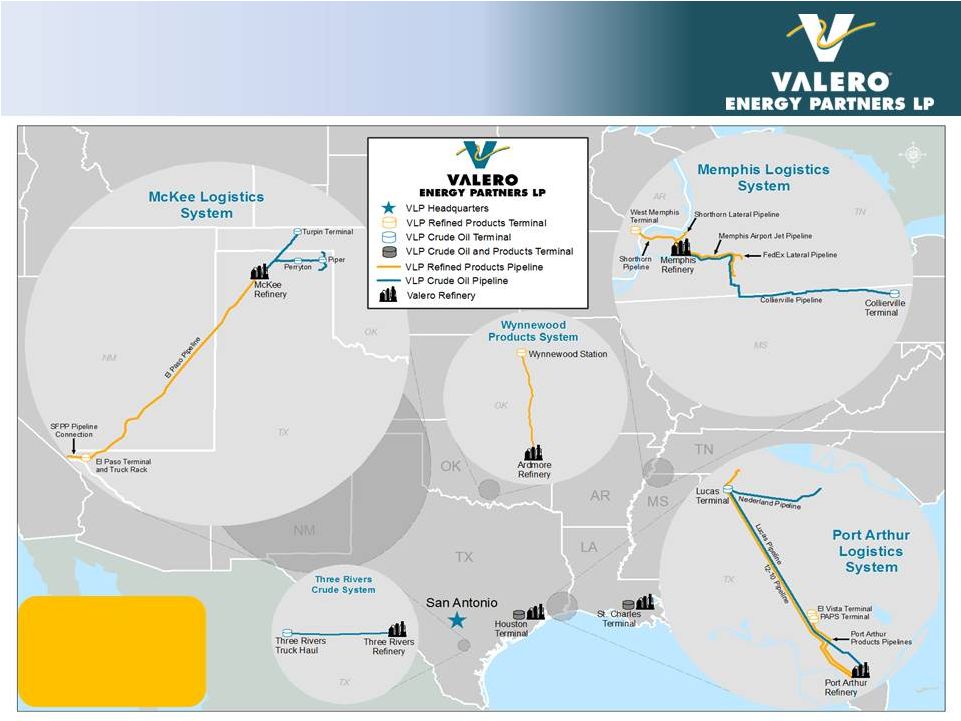
A Growth-Oriented Logistics MLP
with 100% Fee-Based Revenues
VLP
is
sponsored
by
Valero
Energy
Corp.
(NYSE: VLO),
the world’s largest
independent refiner |
 Our
Strategy •
Maintain safe and reliable operations in our high-quality asset base
•
Avoid direct commodity price risk
•
Target LP unit distribution compound annual growth rate (CAGR) in the range of 20% to
25% •
Executing on our plan to complete $1 billion of acquisition transactions from VLO in
2015 $671 million acquisition closed on March 1, 2015
•
Significant inventory of acquisition targets at VLO, which is focused on midstream
growth •
Opportunities to diversify business and develop third-party volumes as VLP matures
•
Target investment grade credit rating
4
Generate Stable, Predictable Cash Flows
Maintain Top-Tier Growth Profile
Demonstrate Financial Discipline |
 5
Long-Term Agreements Provide
Stable and Predictable Cash Flows
Terminals
•
All transportation and terminal
services agreements have 10
year initial terms and 5 year
renewal terms
Memphis refinery truck rack is
exception, without renewal term
•
Approximately 85% of revenues
contractually obligated by
minimum volume commitments
(MVCs)
•
No direct commodity price
exposure
•
2014 revenues were balanced
between pipelines and terminals
2014 Revenue
Pipelines
44%
56% |
 6
Delivering Growth
VLP is on target to acquire $1 billion of assets from VLO in 2015
•
1
st
acquisition –
Texas Crude
Systems Business in July 2014
for $154 million
•
2
nd
acquisition –
Houston and
St. Charles Terminal Services
Business in March 2015 for
$671 million
•
Plan to grow VLP’s 4Q15
annualized EBITDA to
approximately $200 million
•
Targeting nearly 25% CAGR
for LP distributions through
2017
See Appendix for reconciliation of estimated 2015 EBITDA to net income.
$95
$200
4Q14
Annualized
4Q15E
Annualized
Adjusted EBITDA Attributable to VLP
(millions) |
 7
Acquisition of Houston and St. Charles
Terminal Services Business from VLO
Operations
•
Crude oil, intermediates, and refined
petroleum product terminaling
services in Houston, Texas and Norco,
Louisiana
3.6 million barrels of storage capacity on the
Houston ship channel
10 million barrels of storage on the Mississippi
River
•
10-year terminaling agreements with
VLO subsidiaries
•
Over 85% of revenues contractually
obligated by MVCs
Transaction expected to be immediately accretive to VLP
Financing
•
$671 million transaction closed on
March 1, 2015
•
$411 million in cash to VLO
$211 million of cash from balance sheet
$200 million under revolving credit facility
•
$160 million 5-year subordinated loan
agreement with VLO
•
$100 million issuance of VLP units to
VLO
1,908,100 million common units
38,941 general partner units
Common and general partner units allocated
in proportion to allow general partner to
maintain its 2 percent interest
•
Expected to contribute $75 million of
EBITDA annually |
 Significant
Inventory of Logistics Assets at VLO to Fuel VLP’s Growth
(1)
Includes assets that have other joint venture or minority interests.
(2)
Includes approximately 4 million barrels of underground storage capacity.
Pipelines
(1)
Racks,
Terminals,
and
Storage
(1)
Rail
Marine
(1)
Fuels Distribution
8
•
VLO
is
evaluating
qualifying
volumes
and
commercial
structure
as
potential
drop-
down candidate
•
51 docks
•
Two Panamax class vessels
•
Three crude unloading facilities with estimated total capacity of 150 MBPD
•
Purchased CPC-1232 railcars expected to serve VLO’s long-term needs in ethanol
and asphalt
•
Approximately 100 million barrels
(2)
of active shell capacity for crude and products
•
139 truck rack bays
•
Over 1,200 miles of active pipelines
•
Expect start-up of 440-mile Diamond Pipeline from Cushing to Memphis refinery in
1H17 |
 9
Significant Inventory of Estimated MLP
Eligible EBITDA at VLO
Fuels distribution would provide incremental EBITDA if selected
$800
($15)
($75)
$24
$34
$46
$814
Dec 2013
Guidance (with
base + 2014-2015
projects)
July 2014 Drop
Down
March 2015 Drop
Down
2014 -
2015
Additional
Logisitics Projects
2016 -
2017
Logistics Projects
Diamond Pipeline Current Guidance
Option
millions |
 10
VLO’s Estimated Logistics Capital Spending
VLO’s logistics investments are expected to increase feedstock flexibility and
refined product export capability
Source: VLO management presentations
$510
$175
$45
$220
$180
$665
$185
$45
$5
$915
$400
$715
2014
2015E
2016E
(millions)
Marine, Docks, and Other
Logistics
Pipelines and Tanks
Railcars and Unloading |
 11
Strong Growth Driving VLP
Unit Performance
Source: Bloomberg prices through Feb 26, 2015
$0.2125
$0.2125
$0.2225
$0.2400
$0.2660
4Q13*
1Q14
2Q14
3Q14
4Q14
Distribution per LP Unit
$2.6
$13.6
$15.7
$21.1
$22.6
4Q13
1Q14
2Q14
3Q14
4Q14
Distributable Cash Flow
(millions)
130%
1%
10%
30%
50%
70%
90%
110%
130%
150%
VLP Unit Performance Since IPO
VLP Price
AMZ Index
-10%
*
Prorated minimum quarterly distribution (MQD) for period of Dec 16 – 31 |
 •
Strategic relationship with VLO, an investment-grade
sponsor
•
High-quality, well-maintained assets integrated with VLO’s
refineries and located in advantaged regions
•
Stable and predictable cash flows from long-term, fee-based
contracts
•
Executing on accelerated growth strategy with recent $671
million acquisition
•
Significant inventory of acquisition opportunities at VLO
•
Targeting LP unit distribution CAGR in the 20% to 25% range
over the next few years
12
VLP’s Competitive Strengths |
 Appendix
Topic
Page
VLP Alignment with VLO
14
Long Term Macro Market Expectations
15
VLO Asset Overview
16
Non-GAAP Reconciliations
17
IR Contact Information
18
13 |
 14
VLP Aligned with VLO
•
VLO remains invested in VLP
–
71% of LP ownership
comprised of common units
and subordinated units
–
100% GP ownership and all
associated IDRs
•
VLO continues to grow its
midstream business and
intends to use VLP as the
primary vehicle to facilitate
this growth
Certain wholly owned subsidiary of
Valero Energy Corporation
Common Units
Subordinated Units
Valero Energy
Corporation
(NYSE: VLO)
Public
Unitholders
Common Units
Valero Energy Partners GP LLC
(our General Partner)
General Partner Units
Incentive Distribution Rights
100.0% ownership interest
100.0% ownership interest
28.4% limited partner
interest
2.0% general partner interest
Valero Energy Partners LP
(NYSE: VLP)
(the Partnership)
100.0% ownership interest
Valero Partners Operating Co. LLC
Operating Subsidiaries
100.0% ownership interest
69.6% limited
partner interest |
 15
Our Long-Term Macro Market
Expectations
Global Outlook
U.S. Economy and
Petroleum Demand
North American
Resource
Advantage
International Export
Markets
•
Economic activity and total petroleum demand increases
•
Transportation fuels demand grows
•
Refining capacity growth slows after 2015; utilization stabilizes then
expected to increase
•
Refinery rationalization pressure continues in Europe, Japan, and Australia
•
Economic growth strengthens over next five years, which stimulates refined
product demand
•
Diesel and jet fuel demand continues to strengthen
•
Gasoline demand continues to recover moderately
•
Natural gas production growth still attractive and development continues
•
Crude production is economic; growth continues, but tempered with lower
prices
•
North American refiners maintain competitive advantage
•
Broad lifting of crude export ban not expected for several years, if ever
•
U.S. continues to be an advantaged net exporter of products
•
Atlantic Basin market continues to grow, with increasing demand from
Latin America and Africa
•
U.S. Gulf Coast is strategically positioned with globally competitive assets
|
 16
VLO’s Assets Concentrated in
Advantaged Locations
Refinery
Capacities (MBPD)
Nelson
Index
Throughput
Crude Oil
Corpus Christi
325
205
19.9
Houston
175
90
15.4
Meraux
135
125
9.7
Port Arthur
375
335
12.4
St. Charles
290
215
16.0
Texas City
260
225
11.1
Three Rivers
100
89
13.2
Gulf Coast
1,660
1,284
14.0
Ardmore
90
86
12.1
McKee
180
168
9.5
Memphis
195
180
7.9
Mid-Con
465
434
9.3
Pembroke
270
210
10.1
Quebec City
235
230
7.7
North Atlantic
505
440
8.9
Benicia
170
145
16.1
Wilmington
135
85
15.9
West Coast
305
230
16.0
Total or Avg.
2,935
2,388
12.4 |
 17
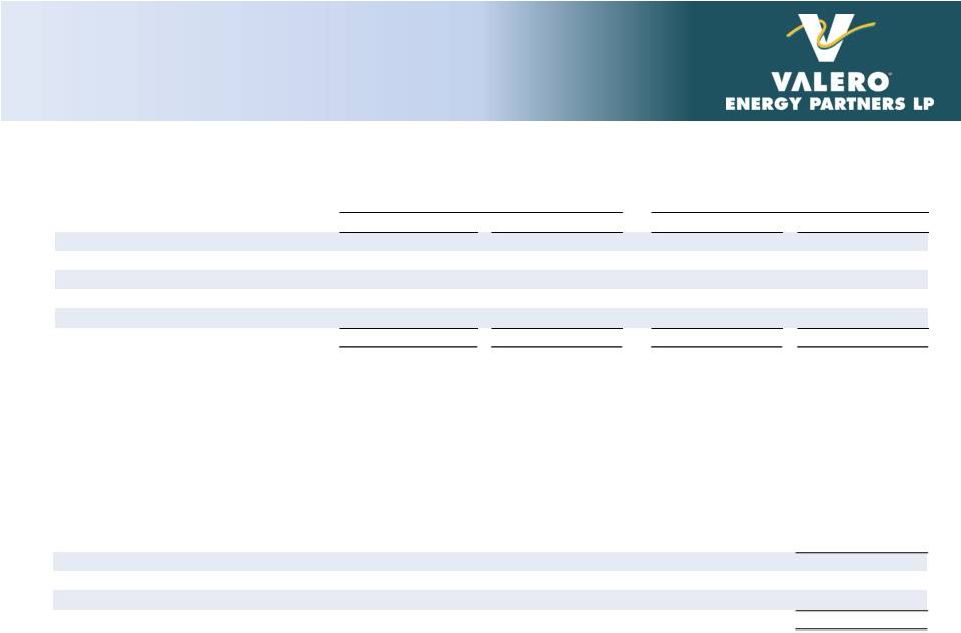
Non-GAAP Reconciliations
RECONCILIATION OF NET INCOME UNDER GAAP TO EBITDA
(in millions)
RECONCILIATION OF FORECASTED NET INCOME UNDER GAAP TO EBITDA
(in millions)
Full Year Beginning
March 1, 2015
Valero Partners
Houston and Louisiana
Forecasted net income
$
37
Add: Forecasted depreciation expense
20
Add: Forecasted interest expense
18
Forecasted EBITDA
$
75
(1)
Interest expense and cash interest paid both include commitment fees to be paid on our
revolving credit facility. Interest expense also includes the amortization of estimated deferred issuance
costs to be incurred in connection with establishing our revolving credit facility. Three Months Ended
Three Months Ended
December 31, 2014
December 31, 2015
As Reported
Annualized (x4)
Forecasted
Annualized (x4)
Net income
$
19
$
76
$
32
$
128
Plus:
Depreciation expense
5
18
11
44
Interest expense
(1)
-
1
7
28
Income tax expense
-
-
-
-
EBITDA
$
24
$
95
$
50
$
200 |
 18
Investor Relations Contacts
For more information, please contact:
John Locke
Executive Director, Investor Relations
210-345-3077
john.locke@valero.com
Karen Ngo
Manager, Investor Relations
210-345-4574
karen.ngo@valero.com |
Serious News for Serious Traders! Try StreetInsider.com Premium Free!
You May Also Be Interested In
- Valero Energy (VLO) PT Raised to $192 at Citi
- Share buybacks in Spar Nord Bank – transactions in week 16
- Danske Bank A/S, transactions by persons discharging managerial responsibilities
Create E-mail Alert Related Categories
SEC FilingsSign up for StreetInsider Free!
Receive full access to all new and archived articles, unlimited portfolio tracking, e-mail alerts, custom newswires and RSS feeds - and more!
