

Form 8-K MITEL NETWORKS CORP For: Feb 26
 Tweet
Tweet Share
Share
UNITED STATES
SECURITIES AND EXCHANGE COMMISSION
Washington, D.C. 20549
FORM 8-K
CURRENT REPORT
PURSUANT TO SECTION 13 OR 15(d)
OF THE SECURITIES EXCHANGE ACT OF 1934
Date of Report (Date of earliest event reported): February 26, 2015
MITEL NETWORKS CORPORATION
(Exact Name of Registrant as Specified in its Charter)
| Canada | 001-34699 | 98-0621254 | ||
| (State or Other Jurisdiction of Incorporation) |
(Commission File Number) |
(I.R.S. Employer Identification No.) |
350 Legget Drive
Ottawa, Ontario K2K 2W7
(Address of Principal Executive Offices) (Zip Code)
(613) 592-2122
(Registrant’s telephone number, including area code)
Not Applicable
(Former Name or Former Address, if Changed Since Last Report)
Check the appropriate box below if the Form 8-K filing is intended to simultaneously satisfy the filing obligation of the registrant under any of the following provisions:
| ¨ | Written communications pursuant to Rule 425 under the Securities Act (17 CFR 230.425) |
| ¨ | Soliciting material pursuant to Rule 14a-12 under the Exchange Act (17 CFR 240.14a-12) |
| ¨ | Pre-commencement communications pursuant to Rule 14d-2(b) under the Exchange Act (17 CFR 240.14d-2(b)) |
| ¨ | Pre-commencement communications pursuant to Rule 13e-4(c) under the Exchange Act (17 CFR 240.13e-4(c)) |
Item 2.02. Results of Operations and Financial Condition.
On February 26, 2015, Mitel Networks Corporation (the “Company”) issued the press release attached hereto as Exhibit 99.1 announcing its financial results for the three month period and full year ended December 31, 2014, which press release is incorporated by reference herein.
The information in this Current Report on Form 8-K under Item 2.02, including Exhibit 99.1 attached hereto, is being “furnished” and not “filed” with the Securities and Exchange Commission for purposes of Section 18 of the Securities Exchange Act of 1934, as amended, or otherwise subject to the liabilities under such section. Furthermore, such information shall not be deemed incorporated by reference in any filing under the Securities Act of 1933, as amended, unless specifically identified as being incorporated therein by reference.
Item 9.01 Financial Statements and Exhibits.
(d) Exhibits.
| 99.1 | Press Release dated February 26, 2015 |
SIGNATURE
Pursuant to the requirements of the Securities Exchange Act of 1934, the registrant has duly caused this report to be signed on its behalf by the undersigned hereunto duly authorized.
Date: February 26, 2015
| MITEL NETWORKS CORPORATION | ||
| By: | /s/ Greg Hiscock | |
| Name: | Greg Hiscock | |
| Title: | General Counsel & Corporate Secretary | |
Exhibit 99.1
|
|
NEWS RELEASE |

Mitel Reports Record Fourth Quarter Results
Integration synergies and strong cash flows are driven by solid execution
Total cloud seats installed stands at a milestone 1,039,000 – an increase of 83% year-over-year
OTTAWA, February 26, 2015 — Mitel® (Nasdaq: MITL) (TSX:MNW), a global leader in business communications, today announced financial results for the fourth quarter and full year ended December 31, 2014. As reported highlights include:
| • | Quarterly and annual revenue of $301.4 million and $1.1 billion, respectively |
| • | Record quarterly and annual adjusted EBITDA of $57.9 million and $166.9 million, respectively |
| • | Record non-GAAP quarterly and annual EPS of $0.36 and $0.99, respectively |
| As Reported | Pro-Forma* | |||||||||||
| Q4’14 | Q4’13 | Q4’13 | ||||||||||
| Revenue |
$ | 301.4 | $ | 144.8 | $ | 319.3 | ||||||
| Net Income (Loss) |
$ | 10.8 | $ | (2.8 | ) | $ | 0.8 | |||||
| Non-GAAP Net Income |
$ | 37.8 | $ | 11.3 | $ | 28.7 | ||||||
| Adjusted EBITDA |
$ | 57.9 | $ | 23.2 | $ | 47.8 | ||||||
All results are reported in millions of US dollars
See tables for reconciliation of non-GAAP measures to GAAP measures
| * | Consists of the combined results of Mitel and Aastra from October 1, 2013 through December 31, 2013 |
“2014 was a transformational year for Mitel in which we set new benchmarks for our financial results and emerged as a true global market share and industry leader. Our sales performance speaks to the fact that our broad portfolio of business communications solutions – premise, cloud and hybrid – is able to address the diverse and evolving needs of customers in markets around the world,” said Richard McBee, President and Chief Executive Officer, Mitel. “We have carried that momentum into 2015 with confirmation earlier this month that Mitel is now the fastest growing and #1 market share leader in cloud communications, with more than 1,000,000 total seats installed. Our foundation is solid, our growth initiatives are delivering, our team is running at full speed, and we are seeing the results of the full scale and power of the new Mitel.”
In the fourth quarter Mitel installed over 177,000 new cloud seats, including over 24,000 recurring cloud seats. Year-over-year, Mitel’s recurring cloud seats increased to 269,155, up 122% and its total installed cloud base increased to over 1,039,000 seats, up 83%. The table below highlights Mitel’s cloud operational metrics, as of December 31, 2014:
Cloud Operational Metrics *
| Q4’13 | Q1’14 | Q2’14 | Q3’14 | Q4’14 | ||||||||||||||||
| Total Cloud Seats |
566,562 | 625,699 | 754,045 | 861,624 | 1,039,032 | |||||||||||||||
| Recurring Cloud Seats |
121,314 | 142,600 | 195,673 | 244,889 | 269,155 | |||||||||||||||
| Retail Cloud Monthly Average Revenue Per User (ARPU) |
$ | 48 | $ | 48 | $ | 47 | $ | 46 | $ | 50 | ||||||||||
| Retail Cloud Average # of Seats per Customer |
31 | 32 | 34 | 39 | 37 | |||||||||||||||
| Retail Cloud Monthly Customer Churn |
0.5 | % | 0.6 | % | 0.6 | % | 0.7 | % | 0.4 | % | ||||||||||
| * | Information reflects results on a pro-forma basis, as if the Aastra acquisition had been completed on January 1, 2013. |
Financial Highlights
Mitel completed the acquisition of Aastra Technologies Limited on January 31, 2014. “As reported” results are referred to below and in the tables attached to this press release. Comparative pro-forma results reflect results of the company as if it had been fully combined with Aastra Technologies.
AS REPORTED:
| • | Total revenue increased 108% to $301.4 million for the fourth quarter of 2014 compared to the prior year, primarily as a result of the Aastra acquisition. |
| • | GAAP net income of $10.8 million, or $0.10 per diluted share, compared to a net loss of $2.8 million, or $0.05 per diluted share. |
| • | Non-GAAP net income for the fourth quarter of 2014 was $37.8 million, or $0.36 per diluted share, compared to $11.3 million, or $0.19 per diluted share in the fourth quarter of 2013. The number of non-GAAP weighted-average common shares outstanding was 103.8 million and 58.1 million, respectively. |
| • | Adjusted EBITDA for the fourth quarter of 2014 was $57.9 million compared to $23.2 million in the year ago period, due primarily to a combination of adjusted EBITDA growth from the legacy Mitel business and adjusted EBITDA resulting from the acquisition of Aastra. |
PRO-FORMA:
| • | Total revenue was down 5.6% from $319.3 million in fourth quarter 2013 largely as a result of currency effects experienced during the period. |
| • | Gross margins improved to 55.1% in the fourth quarter of 2014 compared to 51.5% in the prior year, as a result of integration synergies, cost reductions and improved product mix. |
| • | Non-GAAP net income improved to $37.8 million, or $0.36 per diluted share, compared to $28.7 million, or $0.28 per diluted share in the fourth quarter of 2013. The number of non-GAAP weighted-average common shares outstanding for the fourth quarter of 2013 was 102.3 million. |
| • | Adjusted EBITDA for the fourth quarter of 2014 increased to $57.9 million compared to $47.8 million in the year ago period, reflecting improved operating performance and synergy realization. |
“Profitability and integration continue to be high priorities. Our performance in the December quarter demonstrates the underlying strength of our investment in growth initiatives, M&A consolidation strategies and disciplined management approach. Synergies of $30 million were well ahead of upwardly revised targets and were a positive factor in delivering solid growth in gross margins, record adjusted EBITDA, record earnings per share and strong cash flows,” said Steve Spooner, Chief Financial Officer, Mitel. He added, “We were especially pleased to record such solid profitability during a period of significant currency volatility, which impacted our quarterly revenue by approximately $14 million on a constant currency basis.”
Recent Business Highlights
| • | Confirmed by Synergy Research as the global market share leader for cloud communications, with the fastest growing cloud communications business worldwide based on subscribers and seats. |
| • | Launch of the latest release of the MiCloud solution for service providers, with enhanced features designed to lower Total Cost of Ownership (TCO) and speed time to market. |
| • | Two major North American cloud customer wins accounting for just over 3,700 seats and contract values totaling approximately $6 million. |
Business Outlook
Mitel has set the following financial performance guidance for the first quarter of 2015 ending March 31, 2015.
| • | Revenue is expected to be in the range of $245 million to $265 million, reflecting continued volatility in foreign currency exchange markets. |
| • | Gross margin percentage is expected to be in the range of 52.5% to 54.0%. |
| • | Adjusted EBITDA margin percentage is expected to be in the range 11.5% to 13%; and |
| • | Non-GAAP earnings per share is expected to be in the range of $0.13 to $0.16. |
Conference Call Information
Mitel will host an investor conference call and live webcast today at 8:30 a.m. ET (5:30 a.m. PT) to discuss its financial results for the fourth quarter ended December 31, 2014. To access the conference call, dial 888-734-0328. Callers outside the U.S. and Canada should dial 678-894-3054. A replay of the conference call will be available through 5:00p ET on Monday, March 2, 2015. To access the replay, all callers should please dial 404-537-3406 and enter pass code 80160131. The live webcast will be accessible on Mitel’s investor relations website at http://investor.mitel.com/ and will be archived and available on this site for at least three months.
Non-GAAP Financial Measurements
This press release includes references to non-GAAP financial measures including adjusted EBITDA, non-GAAP net income and non-GAAP operating expenses. Non-GAAP financial measures do not have any standardized meaning and are therefore unlikely to be comparable to similar measures presented by other companies. We use these non-GAAP financial measures to assist management and investors in understanding our past financial performance and
prospects for the future, including changes in our operating results, trends and marketplace performance, exclusive of unusual events or factors which do not directly affect what we consider to be our core operating performance. Non-GAAP measures are among the primary indicators management uses as a basis for our planning and forecasting of future periods. Investors are cautioned that non-GAAP financial measures should not be relied upon as a substitute for financial measures prepared in accordance with generally accepted accounting principles. Please see the reconciliation of non-GAAP financial measures to the most directly comparable U.S. GAAP measure attached to this release.
About Mitel
Powering more than 2 billion connections every day, Mitel (Nasdaq: MITL) (TSX:MNW) helps businesses connect, collaborate and take care of their customers. That includes more than 33 million cloud connections daily, making Mitel the world’s fastest growing provider of cloud communications. Our business communications experts serve more than 60 million users with over 2500 channel partners in more than 100 countries. We have #1 market share in EMEA and have been identified by top industry analyst firms as a business communications leader. For more information, go to www.mitel.com and follow us on Twitter @Mitel.
Forward Looking Statements
Some of the statements in this press release are forward-looking statements (or forward-looking information) within the meaning of applicable U.S. and Canadian securities laws. These include statements using the words believe, target, outlook, may, will, should, could, estimate, continue, expect, intend, plan, predict, potential, project and anticipate, and similar statements which do not describe the present or provide information about the past. There is no guarantee that the expected events or expected results will actually occur. Such statements reflect the current views of management of Mitel and are subject to a number of risks and uncertainties. These statements are based on many assumptions and factors, including general economic and market conditions, industry conditions, operational and other factors. Any changes in these assumptions or other factors could cause actual results to differ materially from current expectations. All forward-looking statements attributable to Mitel, or persons acting on its behalf, and are expressly qualified in their entirety by the cautionary statements set forth in this paragraph. Undue reliance should not be placed on such statements. In addition, material risks that could cause results of operations to differ include the Mitel’s ability to achieve or sustain profitability in the future since its acquisition of Aastra; fluctuations in the quarterly and annual revenues and operating results; fluctuations in foreign exchange rates; current and ongoing global economic instability, political unrest and related sanctions, particularly in connection with the Ukraine and the Middle East; intense competition; reliance on channel partners for a significant component of sales; dependence upon a small number of outside contract manufacturers to manufacture products; the ability to successfully integrate the acquisition of Aastra and realize certain synergies; and, our ability to implement and achieve our business strategies successfully. Additional risks are described under the heading “Risk Factors” in Mitel’s Annual Report on Form 10-K for the year ended December 31, 2014, filed with the Securities and Exchange Commission on February 26, 2015. Forward-looking statements speak only as of the date they are made. Except as required by law, we do not have any intention or obligation to update or to publicly announce the results of any revisions to any of the forward-looking statements to reflect actual results, future events or developments, changes in assumptions or changes in other factors affecting the forward-looking statements.
Mitel is the registered trademark of Mitel Networks Corporation.
All other trademarks are the property of their respective owners.
MITL-F
Contact Information
Amy MacLeod (media), 613-592-2122 x71245, [email protected]
Cynthia Navarro (industry analysts), 469-574-8113, [email protected]
Michael McCarthy (investor relations), 469-574-8134, [email protected]
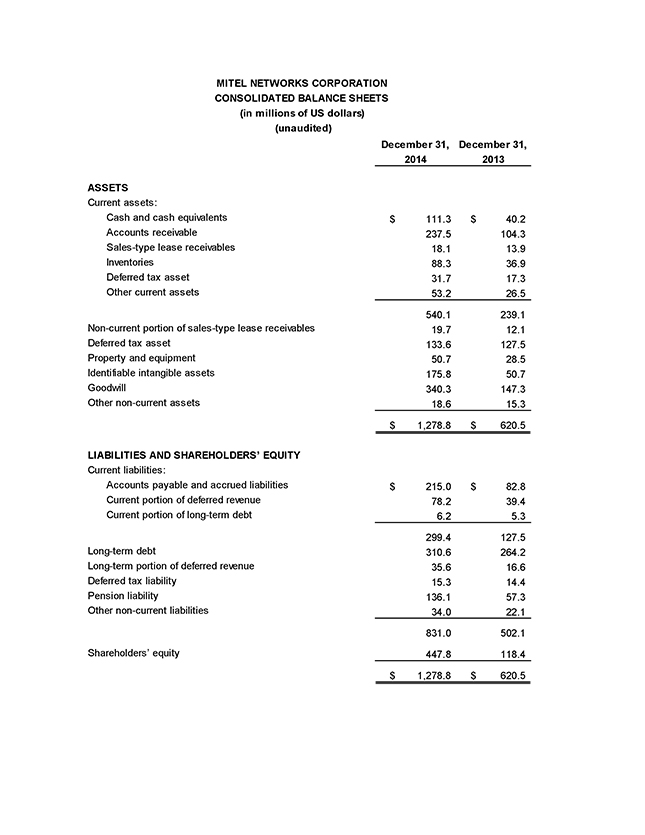
MITEL NETWORKS CORPORATION CONSOLIDATED BALANCE SHEETS (in millions of US dollars) (unaudited) December 31, December 31, 2014 2013 ASSETS Current assets: Cash and cash equivalents $ 111.3 $ 40.2 Accounts receivable 237.5 104.3 Sales-type lease receivables 18.1 13.9 Inventories 88.3 36.9 Deferred tax asset 31.7 17.3 Other current assets 53.2 26.5 540.1 239.1 Non-current portion of sales-type lease receivables 19.7 12.1 Deferred tax asset 133.6 127.5 Property and equipment 50.7 28.5 Identifiable intangible assets 175.8 50.7 Goodwill 340.3 147.3 Other non-current assets 18.6 15.3 $ 1,278.8 $ 620.5 LIABILITIES AND SHAREHOLDERS’ EQUITY Current liabilities: Accounts payable and accrued liabilities $ 215.0 $ 82.8 Current portion of deferred revenue 78.2 39.4 Current portion of long-term debt 6.2 5.3 299.4 127.5 Long-term debt 310.6 264.2 Long-term portion of deferred revenue 35.6 16.6 Deferred tax liability 15.3 14.4 Pension liability 136.1 57.3 Other non-current liabilities 34.0 22.1 831.0 502.1 Shareholders’ equity 447.8 118.4 $ 1,278.8 $ 620.5
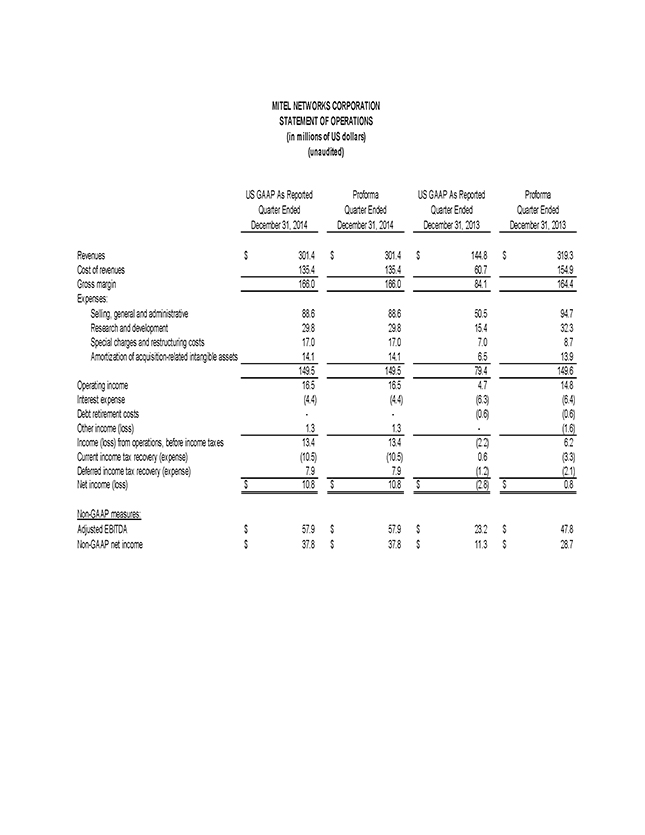
MITEL NETWORKS CORPORATION STATEMENT OF OPERATIONS (in millions of US dollars) (unaudited) US GAAP As Reported Proforma US GAAP As Reported Proforma Quarter Ended Quarter Ended Quarter Ended Quarter Ended December 31, 2014 December 31, 2014 December 31, 2013 December 31, 2013 Revenues $ 301.4 $ 301.4 $ 144.8 $ 319.3 Cost of revenues 135.4 135.4 60.7 154.9 Gross margin 166.0 166.0 84.1 164.4 Expenses: Selling, general and administrative 88.6 88.6 50.5 94.7 Research and development 29.8 29.8 15.4 32.3 Special charges and restructuring costs 17.0 17.0 7.0 8.7 Amortization of acquisition-related intangible assets 14.1 14.1 6.5 13.9 149.5 149.5 79.4 149.6 Operating income 16.5 16.5 4.7 14.8 Interest expense (4.4) (4.4) (6.3) (6.4) Debt retirement costs — (0.6) (0.6) Other income (loss) 1.3 1.3—(1.6) Income (loss) from operations, before income taxes 13.4 13.4 (2.2) 6.2 Current income tax recovery (expense) (10.5) (10.5) 0.6 (3.3) Deferred income tax recovery (expense) 7.9 7.9 (1.2) (2.1) Net income (loss) $ 10.8 $ 10.8 $ (2.8) $ 0.8 Non-GAAP measures: Adjusted EBITDA $ 57.9 $ 57.9 $ 23.2 $ 47.8 Non-GAAP net income $ 37.8 $ 37.8 $ 11.3 $ 28.7
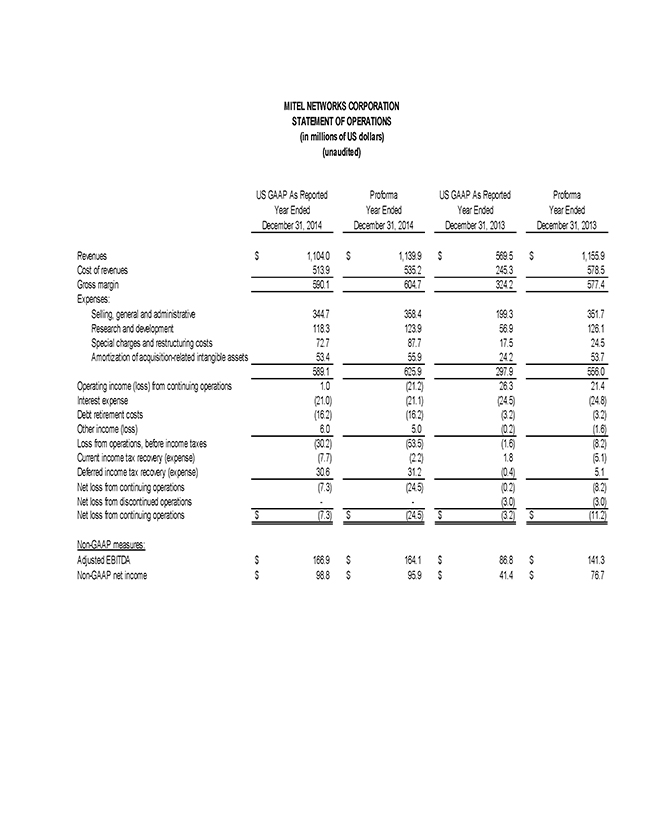
MITEL NETWORKS CORPORATION STATEMENT OF OPERATIONS (in millions of US dollars) (unaudited) US GAAP As Reported Proforma US GAAP As Reported Proforma Year Ended Year Ended Year Ended Year Ended December 31, 2014 December 31, 2014 December 31, 2013 December 31, 2013 Revenues $ 1,104.0 $ 1,139.9 $ 569.5 $ 1,155.9 Cost of revenues 513.9 535.2 245.3 578.5 Gross margin 590.1 604.7 324.2 577.4 Expenses: Selling, general and administrative 344.7 358.4 199.3 351.7 Research and development 118.3 123.9 56.9 126.1 Special charges and restructuring costs 72.7 87.7 17.5 24.5 Amortization of acquisition-related intangible assets 53.4 55.9 24.2 53.7 589.1 625.9 297.9 556.0 Operating income (loss) from continuing operations 1.0 (21.2) 26.3 21.4 Interest expense (21.0) (21.1) (24.5) (24.8) Debt retirement costs (16.2) (16.2) (3.2) (3.2) Other income (loss) 6.0 5.0 (0.2) (1.6) Loss from operations, before income taxes (30.2) (53.5) (1.6) (8.2) Current income tax recovery (expense) (7.7) (2.2) 1.8 (5.1) Deferred income tax recovery (expense) 30.6 31.2 (0.4) 5.1 Net loss from continuing operations (7.3) (24.5) (0.2) (8.2) Net loss from discontinued operations — (3.0) (3.0) Net loss from continuing operations $ (7.3) $ (24.5) $ (3.2) $ (11.2) Non-GAAP measures: Adjusted EBITDA $ 166.9 $ 164.1 $ 86.8 $ 141.3 Non-GAAP net income $ 98.8 $ 95.9 $ 41.4 $ 76.7
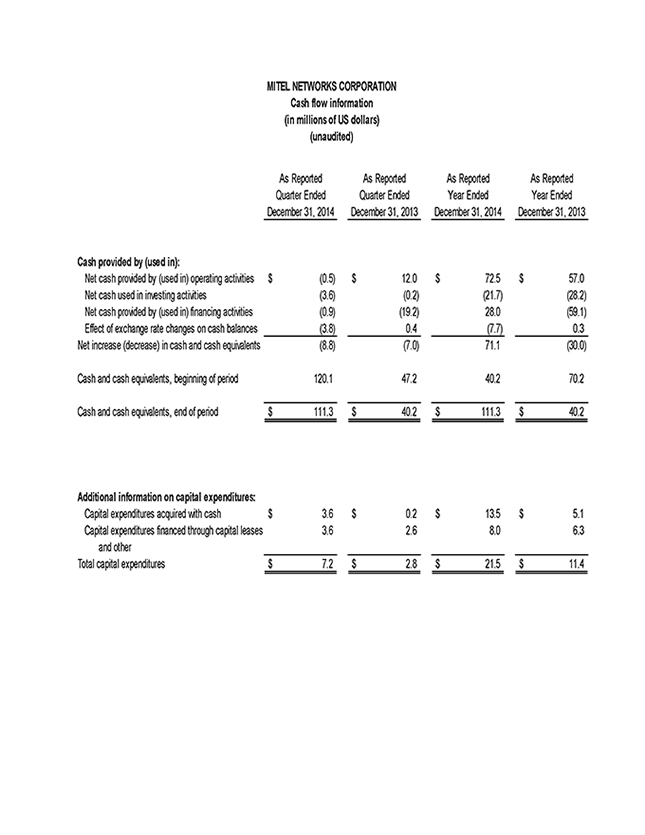
MITEL NETWORKS CORPORATION Cash flow information (in millions of US dollars) (unaudited) As Reported As Reported As Reported As Reported Quarter Ended Quarter Ended Year Ended Year Ended December 31, 2014 December 31, 2013 December 31, 2014 December 31, 2013 Cash provided by (used in): Net cash provided by (used in) operating activities $ (0.5) $ 12.0 $ 72.5 $ 57.0 Net cash used in investing activities (3.6) (0.2) (21.7) (28.2) Net cash provided by (used in) financing activities (0.9) (19.2) 28.0 (59.1) Effect of exchange rate changes on cash balances (3.8) 0.4 (7.7) 0.3 Net increase (decrease) in cash and cash equivalents (8.8) (7.0) 71.1 (30.0) Cash and cash equivalents, beginning of period 120.1 47.2 40.2 70.2 Cash and cash equivalents, end of period $ 111.3 $ 40.2 $ 111.3 $ 40.2 Additional information on capital expenditures: Capital expenditures acquired with cash $ 3.6 $ 0.2 $ 13.5 $ 5.1 Capital expenditures financed through capital leases 3.6 2.6 8.0 6.3 and other Total capital expenditures $ 7.2 $ 2.8 $ 21.5 $ 11.4
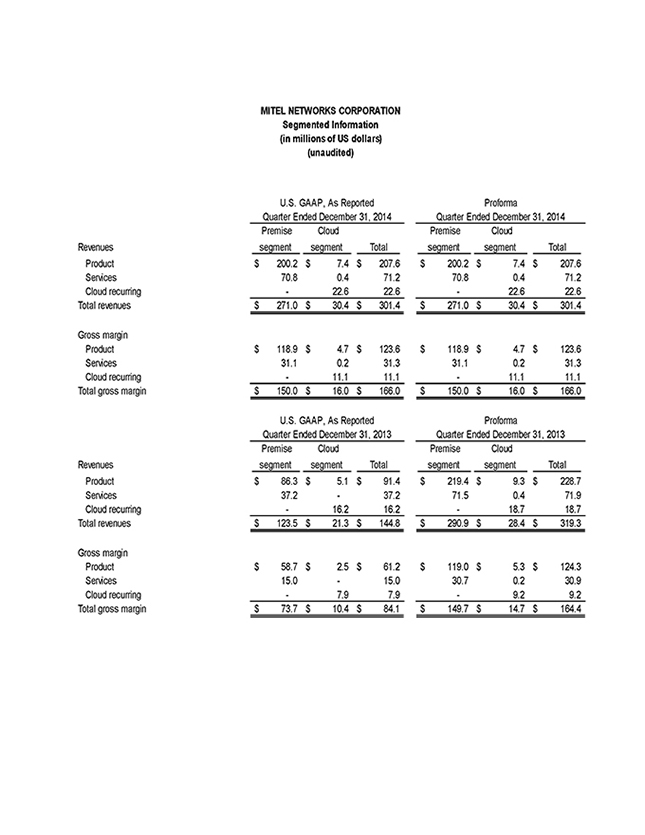
MITEL NETWORKS CORPORATION Segmented Information (in millions of US dollars) (unaudited) U.S. GAAP, As Reported Proforma Quarter Ended December 31, 2014 Quarter Ended December 31, 2014 Premise Cloud Premise Cloud Revenues segment segment Total segment segment Total Product $ 200.2 $ 7.4 $ 207.6 $ 200.2 $ 7.4 $ 207.6 Services 70.8 0.4 71.2 70.8 0.4 71.2 Cloud recurring—22.6 22.6—22.6 22.6 Total revenues $ 271.0 $ 30.4 $ 301.4 $ 271.0 $ 30.4 $ 301.4 Gross margin Product $ 118.9 $ 4.7 $ 123.6 $ 118.9 $ 4.7 $ 123.6 Services 31.1 0.2 31.3 31.1 0.2 31.3 Cloud recurring—11.1 11.1—11.1 11.1 Total gross margin $ 150.0 $ 16.0 $ 166.0 $ 150.0 $ 16.0 $ 166.0 U.S. GAAP, As Reported Proforma Quarter Ended December 31, 2013 Quarter Ended December 31, 2013 Premise Cloud Premise Cloud Revenues segment segment Total segment segment Total Product $ 86.3 $ 5.1 $ 91.4 $ 219.4 $ 9.3 $ 228.7 Services 37.2—37.2 71.5 0.4 71.9 Cloud recurring—16.2 16.2—18.7 18.7 Total revenues $ 123.5 $ 21.3 $ 144.8 $ 290.9 $ 28.4 $ 319.3 Gross margin Product $ 58.7 $ 2.5 $ 61.2 $ 119.0 $ 5.3 $ 124.3 Services 15.0—15.0 30.7 0.2 30.9 Cloud recurring—7.9 7.9—9.2 9.2 Total gross margin $ 73.7 $ 10.4 $ 84.1 $ 149.7 $ 14.7 $ 164.4
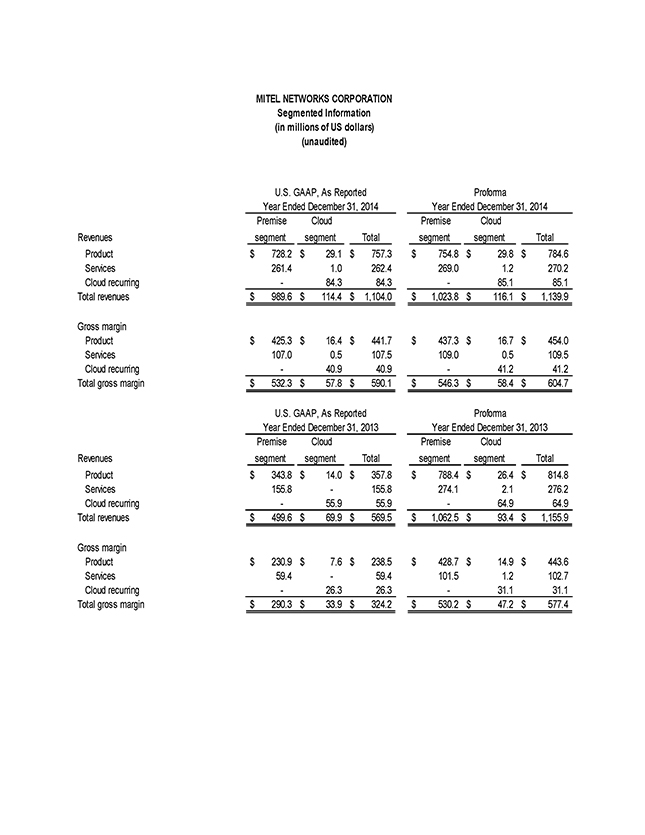
MITEL NETWORKS CORPORATION Segmented Information (in millions of US dollars) (unaudited) U.S. GAAP, As Reported Proforma Year Ended December 31, 2014 Year Ended December 31, 2014 Premise Cloud Premise Cloud Revenues segment segment Total segment segment Total Product $ 728.2 $ 29.1 $ 757.3 $ 754.8 $ 29.8 $ 784.6 Services 261.4 1.0 262.4 269.0 1.2 270.2 Cloud recurring—84.3 84.3—85.1 85.1 Total revenues $ 989.6 $ 114.4 $ 1,104.0 $ 1,023.8 $ 116.1 $ 1,139.9 Gross margin Product $ 425.3 $ 16.4 $ 441.7 $ 437.3 $ 16.7 $ 454.0 Services 107.0 0.5 107.5 109.0 0.5 109.5 Cloud recurring—40.9 40.9—41.2 41.2 Total gross margin $ 532.3 $ 57.8 $ 590.1 $ 546.3 $ 58.4 $ 604.7 U.S. GAAP, As Reported Proforma Year Ended December 31, 2013 Year Ended December 31, 2013 Premise Cloud Premise Cloud Revenues segment segment Total segment segment Total Product $ 343.8 $ 14.0 $ 357.8 $ 788.4 $ 26.4 $ 814.8 Services 155.8—155.8 274.1 2.1 276.2 Cloud recurring—55.9 55.9—64.9 64.9 Total revenues $ 499.6 $ 69.9 $ 569.5 $ 1,062.5 $ 93.4 $ 1,155.9 Gross margin Product $ 230.9 $ 7.6 $ 238.5 $ 428.7 $ 14.9 $ 443.6 Services 59.4—59.4 101.5 1.2 102.7 Cloud recurring—26.3 26.3—31.1 31.1 Total gross margin $ 290.3 $ 33.9 $ 324.2 $ 530.2 $ 47.2 $ 577.4
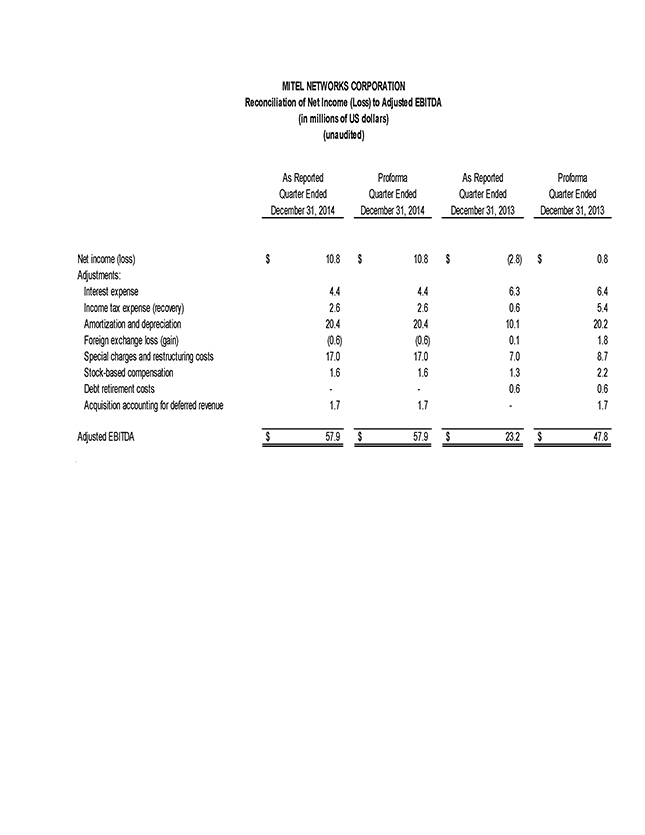
MITEL NETWORKS CORPORATION Reconciliation of Net Income (Loss) to Adjusted EBITDA (in millions of US dollars) (unaudited) As Reported Proforma As Reported Proforma Quarter Ended Quarter Ended Quarter Ended Quarter Ended December 31, 2014 December 31, 2014 December 31, 2013 December 31, 2013 Net income (loss) $ 10.8 $ 10.8 $ (2.8) $ 0.8 Adjustments: Interest expense 4.4 4.4 6.3 6.4 Income tax expense (recovery) 2.6 2.6 0.6 5.4 Amortization and depreciation 20.4 20.4 10.1 20.2 Foreign exchange loss (gain) (0.6) (0.6) 0.1 1.8 Special charges and restructuring costs 17.0 17.0 7.0 8.7 Stock-based compensation 1.6 1.6 1.3 2.2 Debt retirement costs — 0.6 0.6 Acquisition accounting for deferred revenue 1.7 1.7—1.7 Adjusted EBITDA $ 57.9 $ 57.9 $ 23.2 $ 47.8
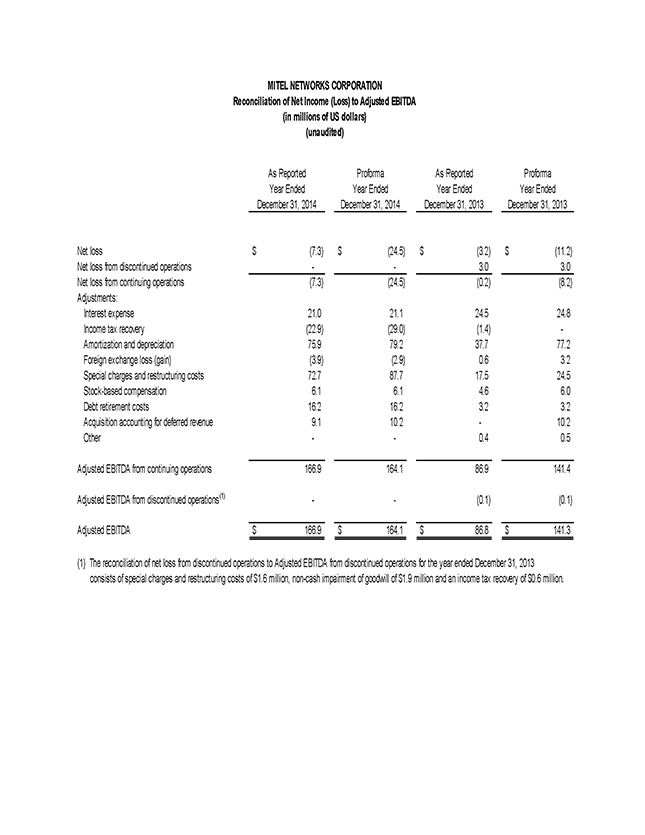
MITEL NETWORKS CORPORATION Reconciliation of Net Income (Loss) to Adjusted EBITDA (in millions of US dollars) (unaudited) As Reported Proforma As Reported Proforma Year Ended Year Ended Year Ended Year Ended December 31, 2014 December 31, 2014 December 31, 2013 December 31, 2013 Net loss $ (7.3) $ (24.5) $ (3.2) $ (11.2) Net loss from discontinued operations — 3.0 3.0 Net loss from continuing operations (7.3) (24.5) (0.2) (8.2) Adjustments: Interest expense 21.0 21.1 24.5 24.8 Income tax recovery (22.9) (29.0) (1.4) -Amortization and depreciation 75.9 79.2 37.7 77.2 Foreign exchange loss (gain) (3.9) (2.9) 0.6 3.2 Special charges and restructuring costs 72.7 87.7 17.5 24.5 Stock-based compensation 6.1 6.1 4.6 6.0 Debt retirement costs 16.2 16.2 3.2 3.2 Acquisition accounting for deferred revenue 9.1 10.2—10.2 Other — 0.4 0.5 Adjusted EBITDA from continuing operations 166.9 164.1 86.9 141.4 Adjusted EBITDA from discontinued operations(1) — (0.1) (0.1) Adjusted EBITDA $ 166.9 $ 164.1 $ 86.8 $ 141.3 (1) The reconciliation of net loss from discontinued operations to Adjusted EBITDA from discontinued operations for the year ended December 31, 2013 consists of special charges and restructuring costs of $1.6 million, non-cash impairment of goodwill of $1.9 million and an income tax recovery of $0.6 million.
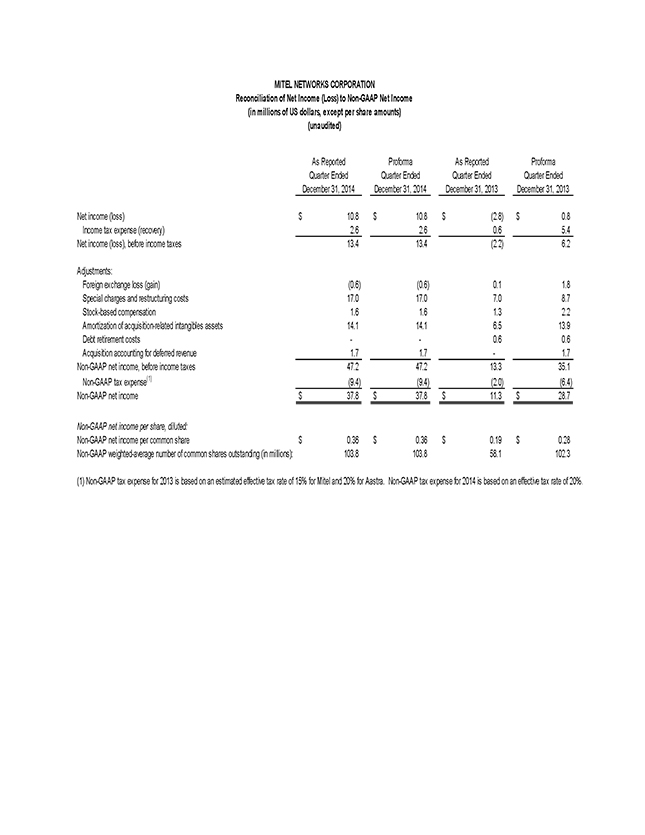
MITEL NETWORKS CORPORATION Reconciliation of Net Income (Loss) to Non-GAAP Net Income (in millions of US dollars, except per share amounts) (unaudited) As Reported Proforma As Reported Proforma Quarter Ended Quarter Ended Quarter Ended Quarter Ended December 31, 2014 December 31, 2014 December 31, 2013 December 31, 2013 Net income (loss) $ 10.8 $ 10.8 $ (2.8) $ 0.8 Income tax expense (recovery) 2.6 2.6 0.6 5.4 Net income (loss), before income taxes 13.4 13.4 (2.2) 6.2 Adjustments: Foreign exchange loss (gain) (0.6) (0.6) 0.1 1.8 Special charges and restructuring costs 17.0 17.0 7.0 8.7 Stock-based compensation 1.6 1.6 1.3 2.2 Amortization of acquisition-related intangibles assets 14.1 14.1 6.5 13.9 Debt retirement costs — 0.6 0.6 Acquisition accounting for deferred revenue 1.7 1.7—1.7 Non-GAAP net income, before income taxes 47.2 47.2 13.3 35.1 Non-GAAP tax expense(1) (9.4) (9.4) (2.0) (6.4) Non-GAAP net income $ 37.8 $ 37.8 $ 11.3 $ 28.7 Non-GAAP net income per share, diluted: Non-GAAP net income per common share $ 0.36 $ 0.36 $ 0.19 $ 0.28 Non-GAAP weighted-average number of common shares outstanding (in millions): 103.8 103.8 58.1 102.3 (1) Non-GAAP tax expense for 2013 is based on an estimated effective tax rate of 15% for Mitel and 20% for Aastra. Non-GAAP tax expense for 2014 is based on an effective tax rate of 20%
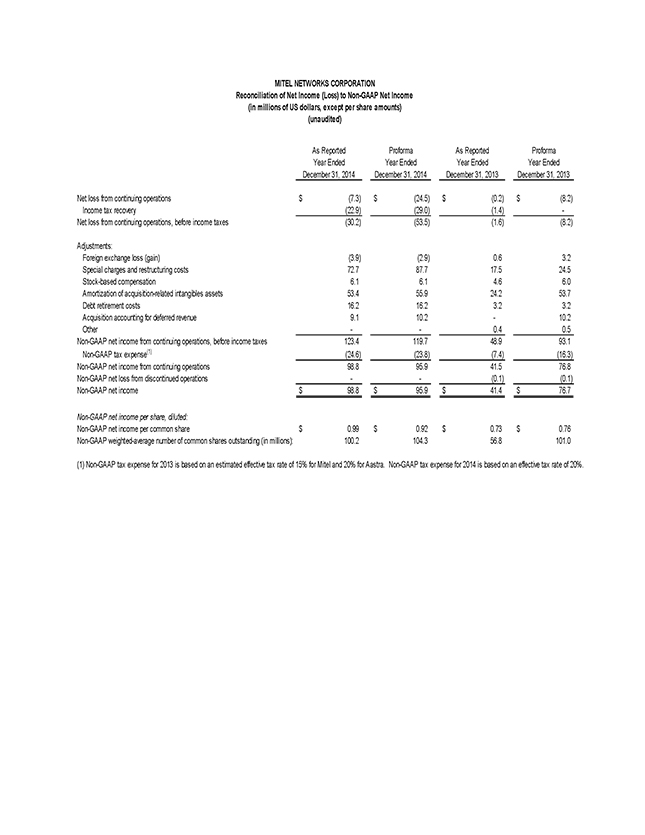
MITEL ETWORKS CORPORATIO Reco ciliatio of et I come (Loss) to o -GAAP et I come (i millio s of US dollars, except per share amou ts) (u audited) As Reported Proforma As Reported Proforma Year E ded Year E ded Year E ded Year E ded December 31, 2014 December 31, 2014 December 31, 2013 December 31, 2013 et loss from co ti ui g operatio s $ (7.3) $ (24.5) $ (0.2) $ (8.2) I come tax recovery (22.9) (29.0) (1.4) —et loss from co ti ui g operatio s, before i come taxes (30.2) (53.5) (1.6) (8.2) Adjustme ts: Foreig excha ge loss (gai ) (3.9) (2.9) 0.6 3.2 Special charges a d restructuri g costs 72.7 87.7 17.5 24.5 Stock-based compe satio 6.1 6.1 4.6 6.0 Amortizatio of acquisitio -related i ta gibles assets 53.4 55.9 24.2 53.7 Debt retireme t costs 16.2 16.2 3.2 3.2 Acquisitio accou ti g for deferred reve ue 9.1 10.2 — 10.2 Other —— 0.4 0.5 o -GAAP et i come from co ti ui g operatio s, before i come taxes 123.4 119.7 48.9 93.1 o -GAAP tax expe se(1) (24.6) (23.8) (7.4) (16.3) o -GAAP et i come from co ti ui g operatio s 98.8 95.9 41.5 76.8 o -GAAP et loss from disco ti ued operatio s —— (0.1) (0.1) o -GAAP et i come $ 98.8 $ 95.9 $ 41.4 $ 76.7 o -GAAP et i come per share, diluted: o -GAAP et i come per commo share $ 0.99 $ 0.92 $ 0.73 $ 0.76 o -GAAP weighted-average umber of commo shares outsta di g (i millio s): 100.2 104.3 56.8 101.0 (1) o -GAAP tax expe se for 2013 is based o a estimated effective tax rate of 15% for Mitel a d 20% for Aastra. o -GAAP tax expe se for 2014 is based o a effective tax rate of 20%.
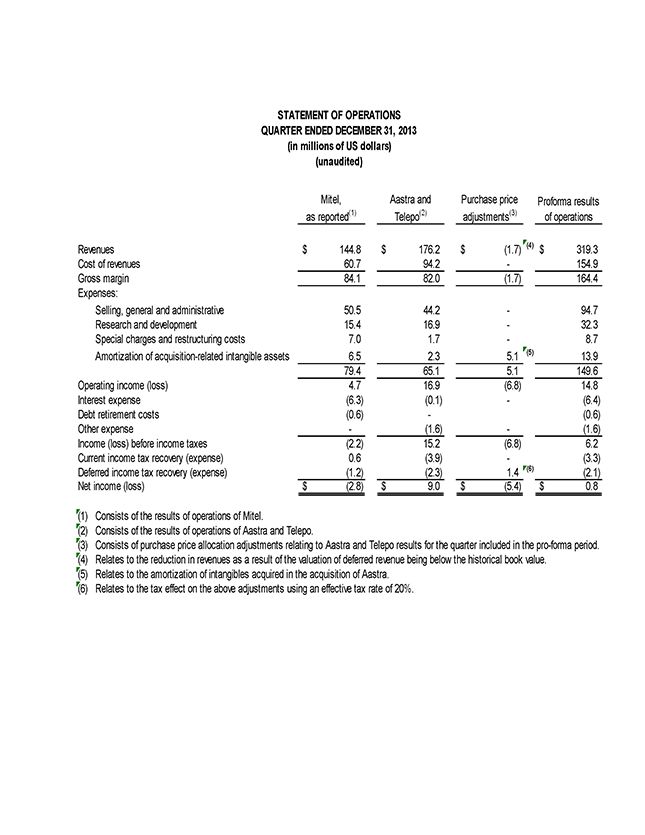
STATEMENT OF OPERATIONS QUARTER ENDED DECEMBER 31, 2013 (in millions of US dollars) (unaudited) Mitel, Aastra and Purchase price Proforma results as reported(1) Telepo(2) adjustments(3) of operations Revenues $ 144.8 $ 176.2 $ (1.7) (4) $ 319.3 Cost of revenues 60.7 94.2—154.9 Gross margin 84.1 82.0 (1.7) 164.4 Expenses: Selling, general and administrative 50.5 44.2—94.7 Research and development 15.4 16.9—32.3 Special charges and restructuring costs 7.0 1.7—8.7 Amortization of acquisition-related intangible assets 6.5 2.3 5.1 (5) 13.9 79.4 65.1 5.1 149.6 Operating income (loss) 4.7 16.9 (6.8) 14.8 Interest expense (6.3) (0.1)—(6.4) Debt retirement costs (0.6)—(0.6) Other expense—(1.6)—(1.6) Income (loss) before income taxes (2.2) 15.2 (6.8) 6.2 Current income tax recovery (expense) 0.6 (3.9)—(3.3) Deferred income tax recovery (expense) (1.2) (2.3) 1.4 (6) (2.1) Net income (loss) $ (2.8) $ 9.0 $ (5.4) $ 0.8 (1) Consists of the results of operations of Mitel. (2) Consists of the results of operations of Aastra and Telepo. (3) Consists of purchase price allocation adjustments relating to Aastra and Telepo results for the quarter included in the pro-forma period. (4) Relates to the reduction in revenues as a result of the valuation of deferred revenue being below the historical book value. (5) Relates to the amortization of intangibles acquired in the acquisition of Aastra. (6) Relates to the tax effect on the above adjustments using an effective tax rate of 20%.
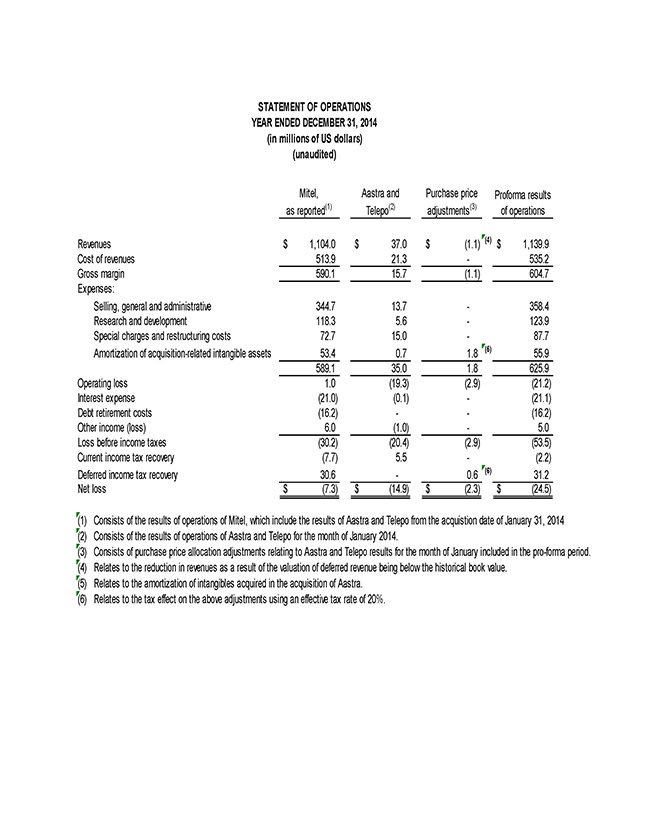
STATEMENT OF OPERATIONS YEAR ENDED DECEMBER 31, 2014 (in millions of US dollars) (unaudited) Mitel, Aastra and Purchase price Proforma results as reported(1) Telepo(2) adjustments(3) of operations Revenues $ 1,104.0 $ 37.0 $ (1.1) (4) $ 1,139.9 Cost of revenues 513.9 21.3—535.2 Gross margin 590.1 15.7 (1.1) 604.7 Expenses: Selling, general and administrative 344.7 13.7—358.4 Research and development 118.3 5.6—123.9 Special charges and restructuring costs 72.7 15.0—87.7 Amortization of acquisition-related intangible assets 53.4 0.7 1.8 (5) 55.9 589.1 35.0 1.8 625.9 Operating loss 1.0 (19.3) (2.9) (21.2) Interest expense (21.0) (0.1)—(21.1) Debt retirement costs (16.2) — (16.2) Other income (loss) 6.0 (1.0)—5.0 Loss before income taxes (30.2) (20.4) (2.9) (53.5) Current income tax recovery (7.7) 5.5—(2.2) Deferred income tax recovery 30.6—0.6 (6) 31.2 Net loss $ (7.3) $ (14.9) $ (2.3) $ (24.5) (1) Consists of the results of operations of Mitel, which include the results of Aastra and Telepo from the acquistion date of January 31, 2014 (2) Consists of the results of operations of Aastra and Telepo for the month of January 2014. (3) Consists of purchase price allocation adjustments relating to Aastra and Telepo results for the month of January included in the pro-forma period. (4) Relates to the reduction in revenues as a result of the valuation of deferred revenue being below the historical book value. (5) Relates to the amortization of intangibles acquired in the acquisition of Aastra. (6) Relates to the tax effect on the above adjustments using an effective tax rate of 20%.
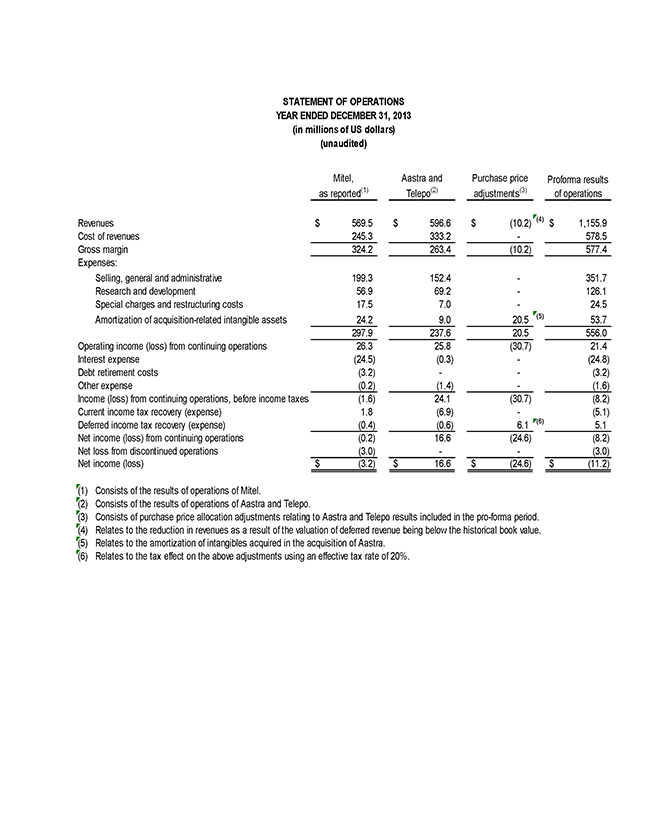
STATEMENT OF OPERATIONS YEAR ENDED DECEMBER 31, 2013 (in millions of US dollars) (unaudited) Mitel, Aastra and Purchase price Proforma results as reported(1) Telepo(2) adjustments(3) of operations Revenues $ 569.5 $ 596.6 $ (10.2) (4) $ 1,155.9 Cost of revenues 245.3 333.2—578.5 Gross margin 324.2 263.4 (10.2) 577.4 Expenses: Selling, general and administrative 199.3 152.4—351.7 Research and development 56.9 69.2—126.1 Special charges and restructuring costs 17.5 7.0—24.5 Amortization of acquisition-related intangible assets 24.2 9.0 20.5 (5) 53.7 297.9 237.6 20.5 556.0 Operating income (loss) from continuing operations 26.3 25.8 (30.7) 21.4 Interest expense (24.5) (0.3)—(24.8) Debt retirement costs (3.2) — (3.2) Other expense (0.2) (1.4)—(1.6) Income (loss) from continuing operations, before income taxes (1.6) 24.1 (30.7) (8.2) Current income tax recovery (expense) 1.8 (6.9)—(5.1) Deferred income tax recovery (expense) (0.4) (0.6) 6.1 (6) 5.1 Net income (loss) from continuing operations (0.2) 16.6 (24.6) (8.2) Net loss from discontinued operations (3.0) — (3.0) Net income (loss) $ (3.2) $ 16.6 $ (24.6) $ (11.2) (1) Consists of the results of operations of Mitel. (2) Consists of the results of operations of Aastra and Telepo. (3) Consists of purchase price allocation adjustments relating to Aastra and Telepo results included in the pro-forma period. (4) Relates to the reduction in revenues as a result of the valuation of deferred revenue being below the historical book value. (5) Relates to the amortization of intangibles acquired in the acquisition of Aastra. (6) Relates to the tax effect on the above adjustments using an effective tax rate of 20%.
Serious News for Serious Traders! Try StreetInsider.com Premium Free!
You May Also Be Interested In
- UPDATE - New Study Reveals Potential Treatment for Neurological Lyme Disease
- Weekly Report (April 12-18, 2024) on the First Tranche of Stellantis 2024 Share Buyback Program
- Fusion Academy Hosts Free Virtual College Week to Benefit High Schoolers Nationwide Navigating University Admissions
Create E-mail Alert Related Categories
SEC FilingsSign up for StreetInsider Free!
Receive full access to all new and archived articles, unlimited portfolio tracking, e-mail alerts, custom newswires and RSS feeds - and more!
