

Form 10-K AUTOLIV INC For: Dec 31
 Tweet
Tweet Share
ShareTable of Contents
UNITED STATES
SECURITIES AND EXCHANGE COMMISSION
Washington, D.C. 20549
FORM 10-K
ANNUAL REPORT PURSUANT TO SECTION 13 OR 15(d) OF THE
SECURITIES EXCHANGE ACT OF 1934
For the fiscal year ended December 31, 2014
Commission file number: 001-12933
AUTOLIV, INC.
(Exact name of registrant as specified in its charter)
| Delaware | 51-0378542 | |
| (State or other jurisdiction of | (I.R.S. Employer | |
| incorporation or organization) | Identification No.) |
Vasagatan 11, 7th Floor, SE-111 20
Box 70381, SE-107 24
Stockholm, Sweden
(Address of principal executive offices)
+46 8 587 20 600
(Registrant’s telephone number,
including area code)
Securities registered pursuant to Section 12(b) of the Act:
| Title of each class: |
Name of each exchange on which registered: | |
| Common Stock, par value $1.00 per share | New York Stock Exchange |
Indicate by check mark if the registrant is a well-known seasoned issuer, as defined in Rule 405 of the Securities Act. Yes x No ¨
Indicate by check mark if the registrant is not required to file reports pursuant to Section 13 or Section 15(d) of the Act. Yes ¨ No x
Indicate by check mark whether the registrant (1) has filed all reports required to be filed by Section 13 or 15(d) of the Securities Exchange Act of 1934 during the preceding 12 months (or for such shorter period that the registrant was required to file such reports); and (2) has been subject to such filing requirements for the past 90 days. Yes: x No: ¨
Indicate by check mark whether the registrant has submitted electronically and posted on its corporate Web site, if any, every Interactive Data File required to be submitted and posted pursuant to Rule 405 of Regulation S-T (§ 232.405 of this chapter) during the preceding 12 months (or for such shorter period that the registrant was required to submit and post such files).
Yes: x No: ¨
Indicate by check mark if disclosure of delinquent filers pursuant to Item 405 of Regulation S-K (§229.405 of this chapter) is not contained herein, and will not be contained, to the best of registrant’s knowledge, in definitive proxy or information statements incorporated by reference in Part III of this Form 10-K or any amendment to this Form 10-K. x
Indicate by check mark whether the registrant is a large accelerated filer, an accelerated filer, a non-accelerated filer, or a smaller reporting company. See the definitions of “large accelerated filer,” “accelerated filer” and “smaller reporting company” in Rule 12b-2 of the Exchange Act.
| Large accelerated filer: | x | Accelerated filer: | ¨ | |||
| Non-accelerated filer | ¨ | Smaller reporting company | ¨ | |||
Indicate by check mark whether the registrant is a shell company (as defined in Rule 12b-2 of the Act). Yes: ¨ No: x
The aggregate market value of the voting and non-voting common equity of Autoliv, Inc. held by non-affiliates as of the last business day of the second fiscal quarter of 2014 amounted to $9,894 million.
Number of shares of Common Stock outstanding as of February 16, 2015: 88,701,893.
DOCUMENTS INCORPORATED BY REFERENCE
1. Portions of the Annual Report to Stockholders for the fiscal year ended December 31, 2014 (the “Annual Report”) are incorporated by reference into Parts I and II.
2. Portions of the definitive Proxy Statement for the annual stockholders’ meeting to be held May 5, 2015, to be dated on or around March 23, 2015 (the “2015 Proxy Statement”), are incorporated by reference into Part III.
Table of Contents
Index
1
Table of Contents
General
Autoliv, Inc. (“Autoliv”, the “Company” or “we”) is a Delaware corporation with its principal executive offices in Stockholm, Sweden. It was created from the merger of Autoliv AB and the automotive safety products business of Morton International, Inc., in 1997. The Company functions as a holding corporation and owns two principal subsidiaries, AAB and Autoliv ASP, Inc.
Autoliv is a leading developer, manufacturer and supplier to the automotive industry of automotive safety systems with a broad range of product offerings, including passive safety systems and active safety systems. Passive safety systems include modules and components for passenger and driver-side airbags, side-impact airbag protection systems, seatbelts, steering wheels, passive safety electronics, whiplash protection systems and child seats, including components for such systems. Active safety systems include automotive radars, night driving assist, camera-based vision systems, brake controls and other active safety systems.
Autoliv’s filings with the United States Securities and Exchange Commission (the “SEC”), which include this Annual Report on Form 10-K, quarterly reports on Form 10-Q, current reports on Form 8-K, insider transaction reports on Forms 3 and 4 and all related amendments, are made available free of charge on our corporate website at www.autoliv.com and are available as soon as reasonably practicable after they are electronically filed with the SEC.
Shares of Autoliv common stock are traded on the New York Stock Exchange under the symbol “ALV”. Swedish Depository Receipts representing shares of Autoliv common stock (“SDRs”) trade on NASDAQ OMX Stockholm under the symbol “ALIV SDB”, and options in SDRs trade on the same exchange under the name “Autoliv SDB”. Options in Autoliv shares are traded on NASDAQ OMX Philadelphia and NYSE Amex Options under the symbol “ALV”. Our fiscal year ends on December 31.
* Safe Harbor Statement
This Form 10-K contains statements that are not historical facts but rather forward-looking statements within the meaning of the Private Securities Litigation Reform Act of 1995. Such forward-looking statements include those that address activities, events or developments that Autoliv or its management believes or anticipates may occur in the future. For example, forward-looking statements include, without limitation, statements relating to industry trends (including light vehicle production), business opportunities, sales contracts, sales backlog, and on-going commercial arrangements and discussions, as well as any statements about estimated sales, estimated operating margin, effective tax rate or other future operating performance or financial results.
In some cases, you can identify these statements by forward-looking words such as “estimates,” “expects,” “anticipates,” “projects,” “plans,” “intends,” “believes,” “may,” “likely,” “might,” “will,” “should,” “could,” or the negative of these terms and other comparable terminology, although not all forward-looking statements contain such words.
All forward-looking statements, including without limitation, management’s examination of historical operating trends and data, are based upon our current expectations, various assumptions and data available from third parties. Our expectations and assumptions are
2
Table of Contents
expressed in good faith and we believe there is a reasonable basis for them. However, there can be no assurance that such forward-looking statements will materialize or prove to be correct as forward-looking statements are inherently subject to known and unknown risks, uncertainties and other factors which may cause actual future results, performance or achievements to differ materially from the future results, performance or achievements expressed in or implied by such forward-looking statements.
Because these forward-looking statements involve risks and uncertainties, the outcome could differ materially from those set out in the forward-looking statements for a variety of reasons, including without limitation, changes in light vehicle production, fluctuation in vehicle production schedules for which the Company is a supplier; market acceptance of our new products; changes in general industry market conditions or regional growth or declines; changes in and the successful execution of our capacity alignment, restructuring and cost reduction initiatives discussed herein and the market reaction thereto; loss of business from increased competition; higher raw material, fuel and energy costs; changes in consumer and customer preferences for end products; customer losses; changes in regulatory conditions; customer bankruptcies; consolidations or restructuring; divestiture of customer brands; unfavorable fluctuations in currencies or interest rates among the various jurisdictions in which we operate; component shortages; costs or difficulties related to the integration of any new or acquired businesses and technologies; continued uncertainty in program awards and performance; the financial results of companies in which Autoliv has made technology investments or joint-venture arrangements; pricing negotiations with customers; our ability to be awarded new business; product liability, warranty and recall claims and investigations and other litigation and customer reactions thereto; higher expenses for our pension and other postretirement benefits including higher funding requirements of our pension plans; work stoppages or other labor issues at our facilities or at the facilities of our customers or suppliers; possible adverse results of pending or future litigation or infringement claims; negative impacts of antitrust investigations or other governmental investigations and associated litigation relating to the conduct of our business; tax assessments by governmental authorities and changes in our effective tax rate, dependence on key personnel; legislative or regulatory changes limiting our business; political conditions; dependence on and relationships with customers and suppliers; and other risks and uncertainties identified in Item 1A “Risk Factors” and Item 7 “Management’s Discussion and Analysis of Financial Condition and Results of Operations” in this Form 10-K for the year ended December 31, 2014. The Company undertakes no obligation to update publicly or revise any forward-looking statements in light of new information or future events.
For any forward-looking statements contained in this or any other document, we claim the protection of the safe harbor for forward-looking statements contained in the Private Securities Litigation Reform Act of 1995, and we assume no obligation to update any such statement.
Business
Autoliv is the world’s leading supplier of automotive safety systems, with a broad range of product offerings, including passive safety systems and active safety systems. Passive safety systems are primarily meant to improve vehicle safety, and include modules and components for passenger and driver-side airbags, side-impact airbag protection systems, seatbelts, steering wheels, passive safety electronics, whiplash protection systems and child seats, and components for such systems. Active safety systems are designed to make driving easier and more comfortable and to intervene before a collision in order to make accidents avoidable or reduce the impact. Active safety products include automotive radars, night driving assist, camera-based vision systems, brake controls and other active safety systems.
3
Table of Contents
Including joint venture operations, Autoliv has approximately 80 production facilities in 27 countries and our customers include the world’s largest car manufacturers. Autoliv’s sales in 2014 were $9.2 billion, approximately 65% of which consisted of airbags and associated products, approximately 30% of which consisted of seatbelts and associated products, and approximately 5% of which consisted of active safety and associated products. Our geographical regions are Europe, the Americas, China, Japan and the Rest of Asia (ROA).
Autoliv’s head office is located in Stockholm, Sweden, where we currently employ 54 people. Autoliv had approximately 50,800 employees worldwide at December 31, 2014, and a total headcount, including temporary personnel, of approximately 60,000.
The information required by Item 1 regarding developments in the Company’s business during 2014 is contained in the Annual Report on pages 28-31 and 39-43 and is incorporated herein by reference. The Annual Report is available on Autoliv’s website, www.autoliv.com and is filed as Exhibit 13 to this Form 10-K.
Financial Information on Segments
Autoliv considers its products to be components of integrated automotive safety systems, which fall within a single industry segment. Autoliv had two main operating segments throughout 2014: (i) Passive Safety products (airbags, seatbelts, steering wheels, restraint electronics, crash sensors) and (ii) Active Safety products (camera-based vision systems, night driving assist, automotive radars, brake controls and other active safety systems). For financial reporting purposes these two operating segments have been combined into a single reportable segment in accordance with the provisions of Accounting Standards Codification (ASC) 280 Segment Reporting. The financial data relating to Autoliv’s business in this segment over the last three fiscal years is contained in the Consolidated Financial Statements on pages 56 through 59 of the Annual Report and is incorporated herein by reference. A statement of net sales by product group and region for the last three years is contained in Note 19 of the Notes to the Consolidated Financial Statements on page 80 of the Annual Report and is incorporated herein by reference.
Products, Market and Competition
Information concerning products, markets and competition is included in the sections “Active Safety for Prevention and Assistance”, “Passive Safety for Protection” and “Innovations to Save Lives” on pages 14-21 and “Our Market and Competitors” on pages 28 and 29, and in the Management Discussion and Analysis sections “Dependence on Customers”, “New Competition” and “Patents and Proprietary Technology” on pages 52 and 53 of the Annual Report and is incorporated herein by reference.
Manufacturing and Production
Including joint venture operations, Autoliv has approximately 80 production facilities located in 27 countries, consisting of both component factories and assembly factories. See “Item 2. Properties” for a description of Autoliv’s principal properties. The component factories manufacture inflators, gas generants, initiators, textile cushions, webbing materials, electronics, pressed steel parts, springs and overmoulded steel parts used in seatbelt and airbag assembly, steering wheels and our active safety, vision and night vision systems and our other safety electronic systems. The assembly factories source components from a number of parties, including Autoliv’s own component factories, and assemble complete restraint systems for “just-in-time” delivery to customers. These factories also assemble our active safety, vision and night vision systems. The products manufactured by Autoliv’s consolidated subsidiaries in 2014 consisted of approximately 143 million complete seatbelt systems (of which approximately 62 million were fitted with pretensioners), approximately 84 million side-impact airbags (including curtain airbags), approximately 46 million frontal airbag modules, approximately 16 million steering wheels, approximately 17 million electronic units (airbag control), and approximately 5 million active safety units.
4
Table of Contents
Autoliv’s “just-in-time” delivery systems have been designed to accommodate the specific requirements of each customer for low levels of inventory and rapid stock delivery service. “just-in-time” deliveries require final assembly, or at least, distribution centers in geographic areas close to customers to facilitate rapid delivery. The fact that the major automobile manufacturers are continually expanding production activities into more countries and require the same or similar safety systems as those produced in Europe, Japan or the U.S. increases the importance to suppliers of having assembly capacity in several countries. Consolidation among our customers also supports this trend.
If the supply of raw materials and components is not disrupted, Autoliv’s assembly operations generally are not constrained by capacity considerations. When dramatic shifts in light vehicle production occur, Autoliv can generally adjust capacity in response to changes in demand within a few weeks by adding or removing work shifts and within a few months by adding or removing standardized production and assembly lines. Most of Autoliv’s assembly factories can make sufficient space available to accommodate additional production lines to satisfy foreseeable increases in capacity. As a result, Autoliv can usually adjust its manufacturing capacity faster than its customers can adjust their capacity to fluctuations in the general demand for vehicles or in the demand for a specific vehicle model, provided that customers notify Autoliv when they become aware of such changes in demand.
When dramatic shifts in light vehicle production occur or when there is a shift in the regional light vehicle production, the capacity adjustments can take more time and be more costly. Additionally, when there is a significant demand for a given product due to a major recall of a competitor’s product, such as our customers are experiencing now, capacity adjustments may take time.
We could experience disruption in our supply or delivery chain, which could cause one or more of our customers to halt or delay production. For more information, see Item 1A – Risk Factors.
Quality Management
Autoliv believes that superior quality is a prerequisite to it being considered a leading global supplier of automotive safety systems and is key to its financial performance, because quality excellence is critical for winning new orders, preventing recalls and maintaining low scrap rates. Autoliv has for many years emphasized a “zero-defect” proactive quality policy and continues to strive to improve its working methods. This means both that Autoliv’s products must always meet performance expectations, and that Autoliv’s products must be delivered to its customers at the right times and in the right amounts. Furthermore, our continued quality improvements further enhance our image among customers, employees and authorities.
Although quality has always been paramount in the automotive industry, especially for safety products, vehicle manufacturers have become increasingly quality focused with even less tolerance for any deviations. This intensified quality focus is partially due to an increase in the number of vehicle recalls for a variety of reasons (not just safety), including a few high-profile vehicle recalls. This trend is likely to continue as vehicle manufacturers introduce even stricter quality requirements. We have not been immune to the recalls that have been impacting the entire automobile industry.
In response to this trend and to improve our own quality, we launched in the summer of 2010 the next step in our strategy of shaping a proactive quality culture of zero defects. It is called “Q5” because it addresses quality in five dimensions: products, customers, growth, behavior and suppliers. The goal of Q5 is to firmly tie together quality with value within all of our processes and for all of our employees, thereby leading to the best value for our customers. Since 2010, we have continually expanded this quality initiative to provide additional skills training to more employees and suppliers. These activities have made a significant contribution to the improvement in non-conforming events.
5
Table of Contents
In our pursuit of excellence, we have developed a chain of four “defense lines” against quality issues. These defense lines consist of: 1) robust product designs, 2) flawless components from suppliers and our own in-house component companies, 3) manufacturing flawless products with a system for verifying that our products conform with specifications and 4) an advanced traceability system in the event of a recall.
Our pursuit of excellence extends from the earliest phases of product development to the proper disposal of a product following many years of use in a vehicle. Autoliv’s comprehensive Autoliv Product Development System (“APDS”) process includes several key check points during the development of new products that are designed to ensure that new products are well-built and have no hidden defects. Through this process, we work closely with our suppliers to set clear standards that help to ensure robust component design and lowest cost for function in order to proactively prevent problems and ensure we deliver only the best designs to the market.
The Autoliv Production System (“APS”), based on the goals of improving quality and efficiency, is at the core of Autoliv’s manufacturing philosophy. APS integrates essential quality elements, such as mistake proofing, statistical process control and operator involvement, into the manufacturing processes so all Autoliv associates are aware of and understand the critical connection between themselves and our lifesaving products. This “zero-defect” principle extends beyond Autoliv to the entire supplier base. All of our suppliers must accept the strict quality standards in the global Autoliv Supplier Manual, which defines our quality requirements and focuses on preventing bad parts from being produced by our suppliers and helps eliminate bad intermediate products in our assembly lines as early as possible. In addition, Autoliv’s One Product One Process (“1P1P”) initiative is its strategy for developing and managing standardization of both core products and customer-specific features, leading not only to improved quality, but also greater cost efficiency and more efficient management of the supply chain.
Autoliv continues to execute its plan to have all subsidiaries certified to ISO/TS 16949, a global automotive quality management standard.
Additional information on quality management is included in the section “Quality” on pages 10 and 11 of the Annual Report and is incorporated herein by reference.
Environmental and Safety Regulations
For information on how environmental and safety regulations impact our business, see “Risk Factors – Our business may be adversely affected by environmental and safety regulations or concerns” in Item 1A and “Environmental” and “Regulations” under the section “Risks and Risk Management” on page 52 of the Annual Report, which is incorporated herein by reference.
Raw materials
For information on the sources and availability of raw materials, see “Risk Factors - Changes in the source, cost, availability of and regulations pertaining to raw materials and components may adversely affect our profit margins” in Item 1A.
Intellectual Property
For information on our use of intellectual property and its importance to us, see “Risk Factors - If our patents are declared invalid or our technology infringes on the proprietary rights of others, our ability to compete may be impaired” in Item 1A.
6
Table of Contents
Seasonality and Backlog
Autoliv’s business is not subject to significant seasonal fluctuations. Autoliv has frame contracts with car manufacturers and such contracts are typically entered into up to three years before the start of production of the relevant car model or platform and provide for a term covering the life of said car model or platform. However, typically these contracts do not provide minimum quantities, firm prices or exclusivity but instead permit the manufacturer to resource the relevant products at given intervals (or at any time) from other suppliers.
Dependence on Customers
For information on our dependence on customers, see “Risk Factors - Our business could be materially and adversely affected if we lost any of our largest customers or if they were unable to pay their invoices” in Item 1A and “Dependence on Customers” under the section “Risks and Risk Management” on page 52 of the Annual Report which is incorporated herein by reference.
Research, Development and Engineering
Expenses incurred for research, development and engineering activities, net were $536 million, $489 million and $455 million for the years ended December 31, 2014, 2013 and 2012, respectively. Additional information on research, development and engineering is included in the sections titled “Innovations to Save Lives” on page 14, and “Patents and Proprietary Technology” on page 53 of the Annual Report and is incorporated herein by reference.
Regulatory Costs
The fitting of seatbelts in most types of motor vehicles is mandatory in almost all countries and many countries have strict laws regarding the use of seatbelts while in vehicles. In addition, most developed countries require that seats in intercity buses and commercial vehicles be fitted with seatbelts. In the U.S., federal legislation requires frontal airbags, both on the driver-side and the passenger-side, in all new passenger cars and in all new light vehicles, which are defined as unloaded vehicle weight of 5,500 pounds or less.
For information concerning the material effects on our business relating to our compliance with government safety regulations, see “Risk Factors - Our business may be adversely affected by environmental, occupational health and safety or other governmental regulations” in Item 1A and “Regulations” under the section “Risks and Risk Management” on page 52 of the Annual Report, which is incorporated herein by reference.
Autoliv Personnel
As of December 31, 2014, Autoliv and its subsidiaries had approximately 50,800 employees and approximately 9,200 temporary personnel. Autoliv considers its relationship with its personnel to be good and while there have been a small number of minor labor disputes there has been no significant or lasting impact to the employee relationship, customer perception or business results.
Important unions to which some of Autoliv’s employees belong in Europe include: IG Metall in Germany; Unite the union in the United Kingdom; Confédération Générale des Travailleurs, Confédération Française Démocratique du Travail, Confédération Française de l’Encadrement et des cadres, Force Ouvrière and Confédération Française des travailleurs Chrétiens in France; Federacion Minerometalurgica, Union General de Trabajadores, Union Sindical Obrera, Comisiones Obereras and Confederacion General de Trabajadores in Spain; and Swedish Metal Workers Union and the Swedish Association of Graduated Engineers in Sweden.
In addition, Autoliv’s employees in other regions are represented by the following unions: Unifor and the International Association of Machinists and Aerospace Workers (IAM) in Canada; Sindicato Nacional de Trabajadores de la Industria Metalurgica y Similares,
7
Table of Contents
Sindicato de Trabajadores de la Pequena y Mediana Industria and Sindicato de Jornaleros y Obreros Industiales de la Industria Maquiladora in Mexico; Sindicato dos Trabalhadores nas industrias Metalurgicas, Mecanicas e de Material eletrico e Eletronico, Siderurgicas, Automobilsticas e de Autopecas de Taubate in Brazil; and the Korean Metal Workers Union in Korea.
In many European countries, Canada, Mexico, Brazil and Korea wages, salaries and general working conditions are negotiated with local unions and/or are subject to centrally negotiated collective bargaining agreements. The terms of our various agreements with unions typically range between 1-3 years. Some subsidiaries in Europe, Canada, Brazil and Korea must negotiate with the applicable local unions important changes in operations, working and employment conditions. Twice a year, the Company’s management conducts a meeting with the European Work Council (EWC) to provide employee representatives with important information about the Company and a forum for the exchange of ideas and opinions.
In many Asia Pacific countries, the central or regional governments provide guidance each year for salary adjustments or statutory minimum wage for workers.
Autoliv’s employees may join associations in accordance with local legislation and rules, although the level of unionization varies significantly throughout our operations.
For more information concerning Autoliv’s personnel and restructuring initiatives, see “Price Erosion and Cost Challenges” and “Operational Initiatives” on page 40 and “Personnel” on pages 47 and 48 in the Management Discussion and Analysis of the Annual Report, which is incorporated herein by reference.
Financial Information on Geographic Areas
Financial information concerning Autoliv’s geographic areas is included in the sections “Superior Global Presence” and “Our Market and Competitors” on pages 26-29, “One Product One Process” on pages 12 and 13 and in Note 19 of the Notes to Consolidated Financial Statements on page 80 of the Annual Report, which is incorporated herein by reference. See also “Risk Factors – Our business is exposed to risks inherent in global operations” in Item 1A.
Joint Ventures
An important element of Autoliv’s strategy has been to establish joint ventures to promote its geographical expansion and technological development and to gain assistance in marketing Autoliv’s full product line to local automobile manufacturers. Autoliv is not currently involved in any joint ventures that have been formed for the purpose of developing technology, but it is possible that strategic alliances combining Autoliv’s technologies and expertise with that of others may expand business opportunities in the future.
Autoliv typically contributes design and production knowledge to joint ventures, with the local partner providing sales support and manufacturing facilities. Some of these local partners manufacture and sell standardized seatbelt systems, and will, through the joint venture with Autoliv, be able to upgrade their technology to meet specific customer demands and/or expand their product offerings.
For information on how these joint ventures are accounted for, including the name and Autoliv’s percentage of ownership, see Note 7 of the Notes to Consolidated Financial Statements on page 68 of the Annual Report, which is incorporated herein by reference.
Available information
The public may read and copy any materials Autoliv files with the SEC at the SEC’s Public Reference Room at 100 F Street, NE, Washington, DC 20549. The public may obtain information on the operation of the Public Reference Room by calling the SEC at 1-800-732-0330. Additional information regarding the Company’s filings with the SEC is included in the sections “Readers Guide” and “Financial Information” on page 2 of the Annual Report and is incorporated herein by reference.
8
Table of Contents
Our business, financial condition, operating results and cash flows may be impacted by a number of factors. A discussion of the risks associated with these factors is included below.
RISKS RELATED TO OUR INDUSTRY
The cyclical nature of automotive sales and production can adversely affect our business
Our business is directly related to light vehicle production (“LVP”) in the global market and by our customers and LVP is the most important driver for our sales. LVP is highly cyclical and depends on general economic conditions as well as other factors, including consumer spending and preferences and changes in interest rate levels and credit availability, consumer confidence, fuel costs, fuel availability, environmental impact, governmental incentives, and political volatility, especially in energy producing countries and growth markets. In addition, light vehicle sales and production can be affected by our customers’ ability to continue operating in response to challenging economic conditions and in response to changing labor relations issues, regulatory requirements, trade agreements and other factors. Any significant (adverse) change in any of these factors, including, but not limited to, general economic conditions and the resulting bankruptcy of a customer or the closure of a customer manufacturing facility, may result in a reduction in automotive sales and production by our customers, and thus have a material adverse effect on our business, results of operations and financial condition.
Our sales are also affected by inventory levels of our customers. We cannot predict when our customers will decide to either increase or reduce inventory levels or whether new inventory levels will approximate historical inventory levels. This may exacerbate variability in our sales and financial condition. Uncertainty regarding inventory levels may be exacerbated by consumer financing programs initiated or terminated by our customers or governments as such changes may affect the timing of their sales.
Changes in LVP and/or customers’ inventory levels will have an impact on our earnings guidance and estimates and any significant reduction in automotive sales and/or light vehicle production by our customers, whether due to general economic conditions or any other fact(s) relevant to LVP, will likely have a material adverse effect on our business, results of operations and financial condition.
Change in consumer trends, political decisions affecting vehicle sales and growth in different markets could adversely affect our results in the future
The average global content of safety systems per light vehicle (airbags, seatbelts, steering wheels and related electronics, radar, night vision systems and cameras) remained relatively flat at around $300 during the period 2012-2014. However, vehicles produced in different markets may have various safety content values. For example, in Western Europe
9
Table of Contents
and North America many of the cars in the large-size segment have safety content values of more than $500 per vehicle while the average safety content of light vehicles in China and India was only approximately $220 and $60, respectively. Due to the fact that growth in global LVP is highly concentrated in markets such as China and India our operating results may suffer if the safety content per vehicle remains low in our growth markets. As safety content per vehicle is also an indicator of our sales development, should the current trends continue, the average value of safety systems per vehicle could decline.
We operate in highly competitive markets
The markets in which we operate are highly competitive. The market for occupant restraint systems continues to consolidate while the market for active safety has not yet consolidated. We compete with a number of other manufacturers that produce and sell similar products. Among other factors, our products compete on the basis of price, product quality, manufacturing and distribution capability, product design, product delivery and product service. Some of our competitors are subsidiaries (or divisions, units or similar) of companies that are larger and have greater financial and other resources than us. Some of our competitors may also have a “preferred status” as a result of special relationships with certain customers. Our active safety products may require significant resources to develop both hardware and software solutions. Our products may not be able to compete successfully with the products of our competitors. In addition, our competitors may predict the course of market development more accurately than we do, develop products that are superior to our products, have the ability to produce similar products at a lower cost than we can, or adapt more quickly than we do to new technologies or evolving regulatory, industry or customer requirements. We may also encounter increased competition in the future from existing or new competitors. As a result, our products may not be able to compete successfully with their products. Should this happen, we will suffer material adverse effects on our business, results of operations and financial condition.
The competitive factors noted above are especially present in the field of active safety. This is a new and developing segment in the automotive industry and inherently includes a higher level of uncertainty than more mature markets. The number of competitors shows risk of increasing as mega-suppliers from outside the automotive industry, such as Microsoft and Google, consider the business opportunities presented by automated driving. The high development cost in active safety limits the number of technical solutions that can be pursued by most Tier 1 suppliers, leading to risk of exposure to a disruptive technology different than those being developed by the Company.
The discontinuation, lack of commercial success, or loss of business with respect to a particular vehicle model for which we are a significant supplier could reduce our sales and harm our profitability
Although we have frame contracts with many of our customers, these frame contracts generally provide for the supply of a customer’s annual requirements for a particular model and assembly plant, rather than for the purchase of a specific quantity of products. Furthermore, these frame contracts are often subject to renewal/re-quotation at the customer’s option at periodic intervals, sometimes as frequent as on a year-to-year basis. Therefore, the discontinuation of, the loss of business with respect to, or a lack of commercial success of a particular vehicle model or a particular vehicle brand for which we are a significant supplier could reduce our sales and harm our profitability. Although our sales are split over several hundred contracts covering approximately 1,400 vehicle platforms or vehicle models, a significant decline in overall demand for such vehicles, or a dramatic change in vehicle preferences, could have a material adverse effect on our sales.
10
Table of Contents
RISKS RELATED TO OUR BUSINESS
Escalating pricing pressures from our customers may adversely affect our business
The automotive industry has been characterized by increasingly aggressive pricing pressure from customers for many years. This trend is partly attributable to the major automobile manufacturers’ strong purchasing power. As with other automotive component manufacturers, we are often expected to quote fixed prices or are forced to accept prices with annual price reduction commitments for long-term sales arrangements or discounted reimbursements for engineering work. Our future profitability will depend upon, among other things, our ability to continuously reduce our cost per unit and maintain our cost structure, enabling us to remain cost-competitive.
Our profitability is also influenced by our success in designing and marketing technological improvements in automotive safety systems which help us offset price reductions by the Original Equipment Manufacturers (“OEMs”). If we are unable to offset continued price reductions through improved operating efficiencies and reduced expenditures, these price reductions may have a material adverse effect on our business, results of operations and financial condition.
We could experience disruption in our supply or delivery chain, which could cause one or more of our customers to halt or delay production
We, as with other component manufactures in the automotive industry, ship products to vehicle assembly plants throughout the world so they are delivered on a “just-in-time” basis in order to maintain low inventory levels. Our suppliers (external suppliers as well as our own production sites) also use a similar method. However, this “just-in-time” method makes the logistics supply chain in our industry very complex and very vulnerable to disruptions.
The potential loss of, or loss of access to, one of our suppliers or our own production sites could be caused by a myriad of potential problems, such as closures of one of our own or one of our suppliers’ plants or critical manufacturing lines due to strikes, mechanical failures, electrical outages, fires, explosions, critical pollution levels, political upheaval, as well as logistical complications due to weather, volcanic eruptions, earthquakes, flooding or other natural disasters, acts of terrorism, mechanical failures, delayed customs processing and more. Additionally, as we expand in growth markets, the risk for such disruptions is heightened. The lack of even a small single subcomponent necessary to manufacture one of our products, for whatever reason, could force us to cease production, possibly for a prolonged period. Similarly, a potential quality issue could force us to halt deliveries while we validate the products. Even where products are ready to be shipped or have been shipped, delays may arise before they reach our customer. Our customers may halt or delay their production for the same reason if one of their other suppliers fails to deliver necessary components. This may cause our customers to suspend their orders or instruct us to suspend delivery of our products, which may adversely affect our financial performance.
When we cease timely deliveries, we have to absorb our own costs for identifying and resolving the ultimate problem as well as expeditiously producing replacement components or products. Generally, we must also carry the costs associated with “catching up,” such as overtime and premium freight.
Additionally, if we are the cause of a customer being forced to halt production the customer may seek to recoup all of its losses and expenses from us. These losses and expenses could be very significant and may include consequential losses such as lost profits. Thus, any supply-chain disruption, however small, could potentially cause the complete shutdown
11
Table of Contents
of an assembly line of one of our customers, and any such shutdown could expose us to material claims of compensation. Where a customer halts production because of another supplier failing to deliver on time, we may not be fully compensated, if at all.
Disruptions in our supply chain, whether caused by a volcano, earthquake, flooding, other natural disaster, or act of terrorism, could cause significant delays and complications to our ability to ship our products to customers, as well as receive shipments from our suppliers. Also, similar difficulties for other suppliers may force our customers to halt production, which may in turn impact our sales shipments to such customers. It is impossible for us to predict if and when disruptions of air, ground and sea transport will occur again and, if so, what impact such disruptions will have. Any such disruptions could severely impact our operations and/or those of our customers and force us to halt production for prolonged periods of time and/or to absorb very significant costs to avoid disruption of our customers’ operations.
Changes in the source, cost, availability of and regulations pertaining to raw materials and components may adversely affect our profit margins
Our business uses a broad range of raw materials and components in the manufacture of our products, nearly all of which are generally available from a number of qualified suppliers. Strong worldwide demand for certain raw materials has had a significant impact on raw material prices and short-term availability in recent years. Increases in the price of the raw materials and components in our products could materially increase our operating costs and materially and adversely affect our profit margin, as direct material costs amounted to approximately 54% of our net sales in 2014, of which approximately half is the raw material cost portion.
Commercial negotiations with our customers and suppliers may not always offset all of the adverse impact of higher raw material, energy and commodity costs. In addition, no assurances can be given that the magnitude and duration of such cost increases or any future cost increases could not have a larger adverse impact on our profitability and consolidated financial position than currently anticipated.
Additionally, there will be costs associated with complying with the SEC disclosure requirements regarding conflict minerals, including for diligence to determine the sources of conflict minerals used in our products and other potential changes to products, processes or sources of supply as a consequence of such verification activities. These rules could adversely affect the sourcing, supply and pricing of materials used in our products. As there may be only a limited number of suppliers offering “conflict free” conflict minerals, we cannot be sure that we will be able to obtain necessary conflict minerals from such suppliers in sufficient quantities or at competitive prices. Also, we may face reputational challenges if we determine that certain of our products contain minerals not determined to be conflict free or if we are unable to sufficiently verify the origins for all conflict minerals used in our products through the procedures we may implement.
Adverse developments affecting one or more of our major suppliers could harm our profitability
Any significant disruption in our supplier relationships, particularly relationships with single-source suppliers, could harm our profitability. Furthermore, some of our suppliers may not be able to sufficiently manage the currency commodity cost volatility and/or sharply changing volumes while still performing as we expect. For example, large recall or field actions from OEMs can stress the capacity of our supply chain and may inhibit our ability to timely deliver order volumes. Over time, more of our suppliers are located in growth markets. As such, there is a risk for delivery delays, production delays, production issues or delivery of non-conforming products by our suppliers. Even where these risks do not materialize, we may incur costs as we try to make contingency plans for such risks.
12
Table of Contents
Our business could be materially and adversely affected if we lost any of our largest customers or if they were unable to pay their invoices
We are dependent on a relatively few number of automobile manufacturers with strong purchasing power, as a result of high market concentration that has developed due to customer consolidation during the last few decades. Our five largest customers represented 52% of our consolidated sales for 2014. Our largest contract accounted for approximately 3.7% of our total fiscal 2014 sales and expires in 2019. Although business with any given customer is typically split into several contracts (either on the basis of one contract per vehicle model or on a broader platform basis), the loss of all of the business from any of our primary customers (whether by cancellation of existing contracts or the failure to award us new business) could have a material adverse effect on our business, results of operations and financial position. Customers may put us on a “new business hold” which would limit our ability to quote or be awarded all or part of their future vehicle contracts if quality or other issues arise in the vehicles for which we were a supplier. Such new business holds range in length and scope and are generally accompanied by a certain set of remedial conditions that are required to be met prior to being eligible to bid for new business. Meeting any such conditions within the prescribed timeframe may require additional Company resources. A failure to satisfy such remedial conditions may have a materially adverse impact on our financial results in the long term.
There is a risk that one or more of our major customers could be unable to pay our invoices as they become due or that a customer will simply refuse to make such payments given its financial difficulties. If a major customer would enter into bankruptcy proceedings or similar proceedings whereby contractual commitments are subject to stay of execution and the possibility of legal or other modification, or if a major customer otherwise successfully procures protection against us legally enforcing its obligations, it is likely that we will be forced to record a substantial loss.
Information concerning our major customers is included in the Annual Report in a graph and in the section headed “Our Customers” on page 30 and in Note 19 of the Consolidated Financial Statements on page 80 of the Annual Report.
We are involved from time to time in legal proceedings and our business may suffer as a result of adverse outcomes of current or future legal proceedings
We are, from time to time, involved in litigation, regulatory proceedings and commercial or contractual disputes that may be significant. These matters may include, without limitation, disputes with our suppliers and customers, intellectual property claims, shareholder litigation, government investigations, class action lawsuits, personal injury claims, and environmental issues, antitrust, customs and VAT disputes, employment and tax issues. In such matters, government agencies or private parties may seek to recover from us very large, indeterminate amounts in penalties or monetary damages (including, in some cases, treble or punitive damages) or seek to limit our operations in some way. The possibility exists that claims may be asserted against us and their magnitude may remain unknown for long periods of time. A substantial legal liability or adverse regulatory outcome and the substantial cost to defend the litigation or regulatory proceedings may have an adverse effect on our business, operating results, financial condition, cash flows and reputation. No assurances can be given that such proceedings and claims will not have a material adverse impact on our profitability and consolidated financial position or that reserves or insurance will mitigate such impact.
See Note 16 of the Consolidated Financial Statements on page 74 of the Annual Report.
13
Table of Contents
We are currently undergoing an antitrust investigation by the European Commission and it is probable that the Company’s operating results and cash flows will be materially adversely impacted
The European Commission (“EC”) is engaged in a long-running investigation into possible anti-competitive behavior among certain suppliers to the automotive vehicle industry, including Autoliv. From June 7 to June 9, 2011, representatives of the EC visited two facilities of Autoliv BV & Co KG, a Company subsidiary in Germany, to gather information for such inquiry. The EC’s investigation is still ongoing. It is the Company’s policy to cooperate with governmental investigations. Although the duration or ultimate outcome of the EC investigation cannot be predicted or estimated, it is probable that the Company’s operating results and cash flows will be materially adversely impacted for the reporting periods in which the EC investigation is resolved or becomes estimable. The Company remains unable to estimate the impact the EC investigation will have or predict the reporting periods in which such impact may be recorded. However, the EC investigation may still require significant management time and attention and could result in significant expenses as well as unfavorable outcomes that could have a material adverse impact on our customer relationships, business prospects, reputation, operating results, cash-flows or financial results, and our insurance may not mitigate such impact.
We may be subject to litigation in the U.S. or elsewhere that could negatively impact our business
The Company may be subject to litigation in the future, including claims relating to antitrust or other issues. These types of lawsuits could require significant management time and attention and could result in significant expenses as well as unfavorable outcomes that could have a material adverse impact on our customer relationships, business prospects, reputation, operating results, cash-flows or financial results, and our insurance may not mitigate such impact.
We are subject to civil antitrust litigation in the U.S. and Canada following the DOJ settlement and may be subject to additional civil antitrust litigation in the U.S. or elsewhere that could negatively impact our business
Following the Company’s guilty plea as part of the DOJ settlement, the Company and its competitors were sued in multiple purported class action lawsuits in the U.S. and Canada alleging violations of antitrust and related laws and seeking to recover treble damages for the alleged classes of direct purchasers, auto dealers and vehicle purchasers/lessees. The Company, without admitting any liability, entered into separate settlement agreements with representatives of each of the three classes of plaintiffs. The direct purchaser settlement has been approved by the court while the other settlement agreements await court approval. The Company is in discussions with certain OEMs regarding the possible resolution of potential claims for purchases not covered by the U.S. direct purchaser settlement. The outcome of these discussions is uncertain and any potential loss contingencies resulting from these discussions with these OEMs, individually or in the aggregate are not at this time reasonably estimable but could negatively impact the Company’s results in the period in which they are resolved or become estimable. The Company may also be subject to additional civil antitrust lawsuits in the future in the U.S., Canada or in other countries that permit such civil claims, including lawsuits or other actions by our customers. These types of lawsuits require significant management time and attention and could result in significant expenses as well as unfavorable outcomes that could have a material adverse impact on our customer relationships, business prospects, reputation, operating results, cash-flows or financial results, and our insurance may not mitigate such impact.
14
Table of Contents
We are, and have been, subject to investigations by other competition authorities and may be subject to investigations by additional competition authorities that could negatively impact our business
Competition authorities in Canada, South Korea and South Africa have previously initiated investigations of certain suppliers to the automotive vehicle industry, including Autoliv. Competition authorities in additional countries, including Japan, may initiate similar investigations. These types of investigations require significant management time and attention, as the EC and DOJ investigations already have. These investigations could also result in significant expenses as well as unfavorable outcomes that could have a material adverse impact on our customer relationships, business prospects, reputation, operating results, cash flows or financial results, and our insurance may not mitigate such impact.
We may incur material losses and costs as a result of product liability and warranty and recall claims that may be brought against us or our customers
We face an inherent business risk of exposure to product liability and warranty claims in the event that our products actually or allegedly fail to perform as expected or the use of our products results, or is alleged to result, in bodily injury and/or property damage. Increasing regulation and reporting requirements regarding potentially defective products, particularly in the United States, may increase the possibility that we become involved in product liability or recall investigations or claims. Although we carry product liability and product recall insurance at levels that management believes to be sufficient to cover our risk, such insurance may not always be available in appropriate amounts or in all markets. Accordingly, we could experience material warranty or product liability losses in the future and incur significant costs to process and defend these claims.
Product recalls in our industry, even if they do not involve our products, can harm the reputations of our customers, competitors, and us, particularly if those recalls cause consumers to question the safety or reliability of products similar to those we produce.
In addition, if any of our products are, or are alleged to be, defective, we may be required to participate in a recall involving such products. Every vehicle manufacturer has its own practices regarding product recalls and other product liability actions relating to its suppliers, and the performance and remedial requirements vary between jurisdictions. Due to recent recall activity in the automotive industry, some vehicle manufactures have become even more sensitive to product recall risks. As suppliers become more integrally involved in the vehicle design process and assume more of the vehicle assembly functions, vehicle manufacturers are increasingly looking to their suppliers for contribution when faced with recalls and product-liability claims. In addition, with global platforms and procedures, vehicle manufacturers are increasingly evaluating our quality performance on a global basis; any one or more quality, warranty or other recall issue(s) (including issues affecting few units and/or having a small financial impact) may cause a vehicle manufacturer to implement measures which may have a severe impact on our operations, such as a global temporary or prolonged suspension of new orders. In addition, as our products more frequently use global designs and are based on or utilize the same or similar parts, components or solutions, there is a risk that the number of vehicles affected globally by a failure or defect will increase significantly and hence also our costs. A warranty, recall or product-liability claim brought against us in excess of our available insurance may have a material adverse effect on our business. Vehicle manufacturers are also increasingly requiring their outside suppliers to guarantee or warrant their products and bear the costs of repair and replacement of such products under new vehicle warranties. A vehicle manufacturer may attempt to hold us responsible for some or the entire repair or replacement costs of defective products under new vehicle warranties, when the product supplied did not perform as represented. Accordingly, the future costs of warranty claims by our customers may be material. However, the final amounts determined to be due related to these matters could differ materially from our recorded warranty estimates and our financial results may be materially impacted as a result.
15
Table of Contents
Work stoppages or other labor issues at our customers’ facilities or at our facilities could adversely affect our operations
The economically challenging conditions in the automotive industry and actions taken by our customers and other suppliers to address negative industry trends may have the side effect of causing labor relations problems at those companies. If any of our customers experience a material work stoppage, that customer may halt or limit the purchase of our products. Similarly, a work stoppage at another supplier could interrupt production at one of our customers’ plants which would have the same effect. This could cause us to shut down production facilities supplying these products, which could have a material adverse effect on our business, results of operations and financial condition. While labor contract negotiations at our locations historically have rarely resulted in work stoppages, we cannot assure that we will be able to negotiate acceptable contracts with these unions or that our failure to do so will not result in work stoppages. A work stoppage at one or more of our plants or our customers’ facilities could have a material adverse effect on our business.
Our ability to operate our company effectively could be impaired if we fail to attract and retain key personnel
Our ability to operate our business and implement our strategies effectively depends, in part, on the efforts of our executive officers and other key employees. In addition, our future success will depend on, among other factors, our ability to attract and retain other qualified personnel, particularly engineers and other employees with electronics and software expertise, which may be difficult if the workforce loses interest in the automotive industry in favor of other technological fields. The loss of the services of any of our key employees or the failure to attract or retain other qualified personnel could have a material adverse effect on our business.
Similarly, we are committed to safeguarding our employees as well as our production facilities by employing several policies, standards and procedures related to site risk management. We cannot be certain that our efforts to protect against potential natural hazards and political events throughout the areas and countries where Autoliv is active will be successful in protecting our employees. If we fail to adequately protect against these hazards, it could have a material adverse effect on our business.
Restructuring initiatives and capacity alignments are complex and difficult and at any time additional restructuring steps may be necessary, possibly on short notice and at significant cost
Our restructuring initiatives and capacity alignments include efforts to adjust our manufacturing capacity, including plant closures, transfer of sourcing to low-cost countries, consolidation of our supplier base and standardization of products, to reduce our overhead costs and consolidate our tech centers. The successful implementation of our restructuring activities and capacity alignments will require us to involve sourcing, logistics, technology and employment arrangements. The complex nature of our various restructuring initiatives could cause difficulties or delays in the implementation of any such initiative or it may not be immediately effective, resulting in an adverse material impact on our performance. In addition, there is a risk that inflation, high-turnover rates and increased competition may reduce the efficiencies now available in low-cost countries to levels that no longer allow for cost-beneficial restructuring opportunities.
16
Table of Contents
A prolonged recession and/or another downturn in our industry could result in us having insufficient funds to continue our operations without additional financing activities
Our ability to generate cash from our operations is highly dependent on sales and therefore on light vehicle production, the global economy and especially the economies of our important markets. If light vehicle production were to remain on low levels for an extended period of time, this would result in a significantly negative cash flow. Similarly, if cash losses for customer defaults rise sharply, this would also result in a negative cash flow. Such negative cash flow could result in our having insufficient funds to continue our operations unless we can procure external financing, which may not be possible.
A prolonged recession and/or another downturn in our industry could result in external financing not being available to us or available only on materially different terms than what has historically been available
Our current credit rating could be lowered as a result of us experiencing significant negative cash flows or a dire financial outlook. This may affect our ability to procure financing. We may also for the same, or other reasons, find it difficult to secure new long-term credit facilities, at reasonable terms, when our principal credit facility expires in 2018. These risks are exacerbated by the current instability in the global credit markets and global economic pressure. Further, even our existing unutilized credit facilities may not be available to us as agreed, or only at additional cost, if participating banks are unable to raise the necessary funds, where, for instance, financial markets are not functioning as expected or one or more banks in our Revolving Credit Facility syndicate were to default. If external financing is unavailable to us when necessary, we may have insufficient funds to continue our operations.
Information concerning our credit facilities and other financings are included in the Annual Report on page 48 in the section headed “Treasury Activities” and in Note 12 to the Consolidated Financial Statements on pages 70 and 71 of the Annual Report.
Our indebtedness may harm our financial condition and results of operations
As of December 31, 2014, we have outstanding debt of $1.60 billion, including $165 million in privately placed debt issued in 2007 and $1.25 billion in privately placed debt issued in April 2014. We may incur additional debt for a variety of reasons. Although our significant credit facilities and debt agreements do not have any financial covenants, our level of indebtedness will have several important effects on our future operations, including, without limitation:
| • | a portion of our cash flows from operations will be dedicated to the payment of any interest or could be used for amortization required with respect to outstanding indebtedness; |
| • | increases in our outstanding indebtedness and leverage will increase our vulnerability to adverse changes in general economic and industry conditions, as well as to competitive pressure; |
| • | depending on the levels of our outstanding debt, our ability to obtain additional financing for working capital, acquisitions, capital expenditures, general corporate and other purposes may be limited; and |
| • | potential future tightening of the availability of capital both from financial institutions and the debt markets may have an adverse effect on our ability to access additional capital. |
17
Table of Contents
Governmental restrictions may impact our business adversely
Some of our customers are owned by a governmental entity, receive various forms of governmental aid or support or are subject to governmental influence in other forms. As a result, they may be required to procure components from local suppliers to achieve a specific local content or be subject to other restrictions regarding localized content. The nature and form of any such restrictions or protections, whatever their basis, is very difficult to predict as is their potential impact. However, they are likely to be based on political rather than economical or operational considerations and may materially impact our business.
We periodically review the carrying value of our assets for possible impairment; the value of one or more of our assets may not be realized if one or more of our customers cease production or decrease their production volumes and we could be required to write down amounts of certain assets and record impairment charges
If one or more of our customers’ plants cease production or decrease their production volumes, the assets we carry related to our plants serving such customers may decrease in value because we may no longer be able to utilize or realize them as intended. Where such decreases are significant, such impairments may have a materially adverse impact on our financial results.
We periodically review the carrying value of our goodwill and other intangible assets for possible impairment; if future circumstances indicate that goodwill or other intangible assets are impaired, we could be required to write down amounts of goodwill or other intangible assets and record impairment charges
We monitor the various factors that impact the valuation of our goodwill and other intangible assets, including expected future cash flow levels, global economic conditions, market price for our stock, and trends with our customers. Impairment of goodwill and other identifiable intangible assets may result from, among other things, deterioration in our performance and especially the cash-flow performance of these goodwill assets, adverse market conditions and adverse changes in applicable laws or regulations. If there are changes in these circumstances or the other variables associated with the estimates, judgments and assumptions relating to the valuation of goodwill, when assessing the valuation of our goodwill items, we may determine that it is appropriate to write down a portion of our goodwill or intangible assets and record related non-cash impairment charges. In the event that we determine that we are required to write-down a portion of our goodwill items and other intangible assets and thereby record related non-cash impairment charges, our financial position and results of operations would be adversely affected.
We face risks related to our defined benefit pension plans or employee benefit plans, including the need for additional funding as well as higher costs and liabilities
Our defined benefit pension plans or employee benefit plans may require additional funding or give rise to higher related costs and liabilities which, in some circumstances, could reach material amounts and negatively affect our results of operations. We are required to make certain year-end assumptions regarding our pension plans. Our pension obligations are dependent on several factors, including factors outside our control such as changes in interest rates, the market performance of the diversified investments underlying the pension plans, actuarial data and adjustments and an increase in the minimum funding requirements or other regulatory changes governing the plans. Adverse equity market conditions and volatility in the credit market may have an unfavorable impact on the value of our pension assets and our future estimated pension liabilities. Internal factors such as an adjustment to the level of benefits provided under the plans may also lead to an increase in our pension liability. If these or other internal and external risks were to occur,
18
Table of Contents
alone or in combination, our required contributions to the plans and the costs and net liabilities associated with the plans could increase substantially and have a material effect on our business.
Information concerning our defined benefit and postretirement plans is included in Note 18 of the Consolidated Financial Statements on pages 76 through 79 of the Annual Report.
You should not anticipate or expect the payment of cash dividends on our common stock
Our dividend policy is subject to the discretion of our Board of Directors and depends upon a number of factors, including our earnings, financial condition, cash and capital needs and general economic or business conditions. Although we currently use dividends as a way to return value to our stockholders, in the past our Board of Directors suspended our quarterly dividend after determining that a suspension was necessary in light of the decline in global light vehicle production, the uncertainty surrounding the recession at the time and the inherent risk of customer defaults. While we have resumed the payment of dividends on our common stock, in the future, there can be no assurance that the Board of Directors will continue to declare dividends.
Increases in IT security threats, the sophistication of computer crime and our reliance on global data centers could expose our systems, networks, solutions and services to risks
As the world’s largest automotive safety system supplier with worldwide facilities, we rely extensively on information technology (“IT”) systems and the use of our global data centers. These IT systems and data centers are vulnerable to disruptions, including those resulting from natural disasters, cyber-attacks or failures in third-party-provided services. Disruptions and attacks on our IT systems pose a risk to the security of our systems and our ability to protect our networks and the confidentiality, availability and integrity of our and our customers’ data. As a result, such attacks or disruptions could potentially lead to the leakage of our or our customers’ confidential information, including our financial data and intellectual property, improper use of our systems and networks, manipulation and destruction of data, production downtimes and both internal and external supply shortages, which could have an adverse effect on our results of operations.
RISKS RELATED TO INTERNATIONAL OPERATIONS
Our business is exposed to risks inherent in global operations
Due to our global operations, we are subject to many laws governing international relations (including but not limited to the Foreign Corrupt Practices Act and the U.S. Export Administration Act), which prohibit improper payments to government officials and restrict where and how we can do business, what information or products we can supply to certain countries and what information we can provide to authorities in governmental organizations.
Although we have procedures and policies in place that should mitigate the risk of violations of these laws, there is no guarantee that they will be sufficiently effective. If and when we acquire new businesses, we may not be able to ensure that the pre-existing controls and procedures meant to prevent violations of the rules and laws were effective, and violations may occur if we are unable to timely implement corrective and effective controls and procedures when integrating newly acquired businesses.
19
Table of Contents
We also have manufacturing and distribution facilities in many countries. Some of these countries are growth markets. International operations, especially in growth markets, are subject to certain risks inherent in doing business abroad, including:
| • | exposure to local economic conditions; |
| • | inability to collect, or delays in collecting, VAT and/or other receivables associated with remittances and other payments by subsidiaries; |
| • | exposure to local political turmoil; |
| • | expropriation and nationalization; |
| • | enforcing legal agreements or collecting receivables through foreign legal systems; |
| • | currency controls, including lack of liquidity in foreign currency due to governmental restrictions, trade protection policies and currency controls, which may create difficulty in repatriating profits or making other remittances; |
| • | investment restrictions or requirements; and |
| • | export and import restrictions. |
Increasing our manufacturing footprint in the growth markets and our business relationships with automotive manufacturers in these markets are particularly important elements of our strategy. As a result, our exposure to the risks described above may be greater in the future, and our exposure to risks associated with developing countries, such as the risk of political upheaval and reliability of local infrastructure, may increase. The likelihood of such occurrences and their potential impact on us vary from country to country and are unpredictable. In particular, the current situation in Russia, including ongoing sanctions and regional military and political instability may adversely impact our business and operations in that country. Economic sanctions imposed by the United States and some members of the European Union have targeted Russian companies and restricted trade and access to capital markets. In response, Russia announced its own trading sanctions against nations that implemented such sanctions. Due to these restrictions, it may become more difficult for some of our customers in the region to obtain financing or access U.S. currency and our customers’ ability to pay could be impacted, which could have a material adverse impact on our business and results. Moreover, the prevailing economic and political situation in Russia has led to significant devaluation of the Ruble.
We operate in the highly competitive automotive supply market in China and face competition from both international and smaller domestic manufacturers. As the size of the Chinese market increases, we anticipate that additional competitors, both international and domestic, may seek to enter the Chinese market resulting in increased competition. In addition, our business is sensitive to economic and market conditions that drive sales volume in China. If we are unable to maintain our position in the Chinese market or if vehicle sales in China decrease or do not continue to increase, our business, results of operations and financial condition could be materially adversely affected.
Additionally, growth markets, like China, have a tendency to demonstrate greater uncertainty and volatility as customer demand may be unpredictable and OEMs may not have sufficient experience in predicting customer demand, which can result in erratic production schedules which in turn may have a negative impact on our operating results.
Global integration may result in additional risks
Because of our efforts to integrate our operations globally to manage cost, we face the additional risk that, should any of the other risks discussed herein materialize, the negative effects could be more pronounced. For example, while supply delays of a component have
20
Table of Contents
typically only affected a few customer models, such a delay could now affect several models of several customers in several geographic areas. Similarly, should we face a recall or warranty issue due to a defective product, such a recall or warranty issue is now more likely to involve a larger number of units in several geographic areas.
Exchange rate risks
In addition, as a result of our global presence, a significant portion of our revenues and expenses are denominated in currencies other than the U.S. dollar. We are therefore subject to foreign currency risks and foreign exchange exposure. Such risks and exposures include:
| • | transaction exposure, which arises because the cost of a product originates in one currency and the product is sold in another currency; |
| • | revaluation effects, which arises from valuation of assets denominated in other currencies than the reporting currency of each unit; |
| • | translation exposure in the income statement, which arises when the income statements of non-U.S. subsidiaries are translated into U.S. dollars; |
| • | translation exposure in the balance sheet, which arises when the balance sheets of non-U.S. subsidiaries are translated into U.S. dollars; and |
| • | changes in the reported U.S. dollar amounts of cash flows. |
For example, the financial crisis during 2008-2009 caused extreme and unprecedented volatility in foreign currency exchange rates. More recently, there has been significant volatility in certain currency pairs during 2012-2015, and particularly in the early part of 2015. Such fluctuations may occur again and may impact our financial results. We cannot predict when, or if, this volatility will cease or the extent of its impact on our future financial results. We typically denominate foreign transactions in foreign currencies to achieve a natural hedge. However, a natural hedge cannot be achieved for all our currency flows therefore a net transaction exposure remains within the group. The net exposure can be significant and creates a transaction exposure risk for the Company. We have not engaged in hedging transactions, although we may engage in hedging transactions from time to time in the future relating to foreign currency exchange rates. Additionally, our electronics business is particularly vulnerable to a strong U.S. dollar as raw materials and components are sourced in U.S. dollars while sales are also currently in other currencies, like the Euro. The Company does not hedge translation exposure.
Furthermore, growth markets are more likely to utilize foreign currency restrictions that govern the transfer of funds out of such countries.
RISKS RELATED TO ACQUISITIONS
We face risks in connection with completed or potential acquisitions
Our growth has been enhanced through acquisitions of businesses, products and technologies that we believe will complement our business. We regularly evaluate acquisition opportunities, frequently engage in acquisition discussions, conduct due diligence activities in connection with possible acquisitions, and, where appropriate, engage in acquisition negotiations. We may not be able to successfully identify suitable acquisition candidates, complete acquisitions, integrate acquired operations into our existing operations or expand into new markets.
In addition, we compete for acquisitions and expansion opportunities with companies that have substantially greater resources, and competition with these companies for acquisition targets could result in increased prices for possible targets. Acquisitions also involve numerous additional risks to us and our investors, including:
| • | risk in retaining acquired management and employees; |
21
Table of Contents
| • | difficulties in the assimilation of the operations, services and personnel of the acquired company; |
| • | diversion of our management’s attention from other business concerns; |
| • | assumption of known and unknown or contingent liabilities; |
| • | adverse financial impact from the amortization of expenses related to intangible assets; |
| • | incurrence of indebtedness; |
| • | potential adverse financial impact from failure of acquisitions to meet internal revenue and earnings expectations; |
| • | integration of internal controls; |
| • | entry into markets in which we have little or no direct prior experience; and |
| • | potentially dilutive issuances of equity securities. |
In the future, the best growth opportunities may be in passive safety electronics and active safety systems markets, which include and are likely to include other and often larger companies than our traditional competitors. If we fail to adequately manage these acquisition risks, the acquisitions may not result in revenue growth, operational synergies or service or technology enhancements, which could adversely affect our financial results.
RISKS RELATED TO INTELLECTUAL PROPERTY
If our patents are declared invalid or our technology infringes on the proprietary rights of others, our ability to compete may be impaired
We have developed a considerable amount of proprietary technology related to automotive safety systems and rely on a number of patents to protect such technology. At present, we hold more than 6,600 patents covering a large number of innovations and product ideas, mainly in the fields of seatbelt and airbag technologies. Our patents expire on various dates during the period 2015 to 2034. We do not expect the expiration of any single patent to have a material adverse effect on our business, results of operations and financial condition. Although we believe that our products and technology do not infringe the proprietary rights of others, third parties may assert infringement claims against us in the future. Also, any patents now owned by us may not afford protection against competitors that develop similar technology.
We primarily protect our innovations with patents and vigorously protect and defend our patents, trademarks and know-how against infringement and unauthorized use. If we are not able to protect our intellectual property and our proprietary rights and technology, we could lose those rights and incur substantial costs policing and defending those rights. Our means of protecting our intellectual property, proprietary rights and technology may not be adequate, and our competitors may independently develop similar or competitive technologies. In addition, the laws of some foreign countries do not protect our proprietary rights to as great an extent as the laws of the U.S. We may not be able to protect our proprietary technology and intellectual property rights, which could result in the loss of our rights or increased costs. If claims alleging patent, copyright or trademark infringement are brought against us and successfully prosecuted against us, they could result in substantial costs. If a successful claim is made against us and we fail to develop non-infringing technology, our business, financial condition and results of operation could be materially adversely affected.
22
Table of Contents
We may not be able to respond quickly enough to changes in technology and technological risks and to develop our intellectual property into commercially viable products
Changes in legislative, regulatory or industry requirements or in competitive technologies may render certain of our products obsolete or less attractive. Our ability to anticipate changes in technology and regulatory standards and to successfully develop and introduce new and enhanced products on a timely basis will be a significant factor in our ability to remain competitive. We cannot provide assurance that we will be able to achieve the technological advances that may be necessary for us to remain competitive or that certain of our products will not become obsolete. We are also subject to the risks generally associated with new product introductions and applications, including lack of market acceptance, delays in product development and failure of products to operate properly.
To compete effectively in the automotive supply industry, we must be able to launch new products to meet our customers’ demand in a timely manner. We cannot provide assurance, however, that we will be able to install and certify the equipment needed to produce products for new product programs in time for the start of production, or that the transitioning of our manufacturing facilities and resources to full production under new product programs will not impact production rates or other operational efficiency measures at our facilities. In addition, we cannot provide assurance that our customers will execute on schedule the launch of their new product programs, for which we might supply products. Our failure to successfully launch new products, a delay by our customers in introducing our new products, or a failure by our customers to successfully launch new programs, could adversely affect our results.
RISKS RELATED TO GOVERNMENT REGULATIONS AND TAXES
Our business may be adversely affected by environmental, occupational health and safety or other governmental regulations
We are subject to the requirements of environmental, occupational health and safety and other governmental regulations in the United States and other countries.
Our facilities in the United States are subject to regulation by the Occupational Safety and Health Administration (“OSHA”), which regulates the protection of the health and safety of workers. In addition, the OSHA hazard communication standard requires that we maintain information about hazardous materials used or produced in our operations and that we provide this information to employees, state and local governmental authorities and local residents. We are also subject to occupational safety regulations in other countries. Our failure to comply with government occupational safety regulations, including OSHA requirements, or general industry standards relating to employee health and safety, keep adequate records or monitor occupational exposure to regulated substances could expose us to liability, enforcement, and fines and penalties, and could have a material adverse effect on our operating results and financial position.
Although we employ safety procedures in the design and operation of our facilities, there is a risk that an accident or injury to one of our employees could occur in one of our facilities. Any accident or injury to our employees that occurs as a result or could result in litigation, manufacturing delays, and harm to our reputation, which could negatively affect our business, financial condition or results of operations.
23
Table of Contents
Although we have no known pending material environmental issues, we have made and will continue to make capital and other expenditures to comply with environmental requirements. To reduce our exposure to environmental risk, we implemented an environmental plan in 1996. According to the plan, we sought to certify according to ISO 14001, an international standard for environmental management systems, all of our plants and units. As of December 31, 2014, 92% of our facilities representing 99% of our consolidated sales have been certified according to ISO 14001 (most of our remaining plants are new facilities which have not been certified yet). However, we cannot assure you that we have been or will be at all times in complete compliance with all of these requirements or that we will not incur material costs or liabilities in connection with these requirements in excess of amounts that we, at each time, may have reserved.
In addition, environmental and occupational health and safety and other requirements are complex, subject to change and have become more and more stringent. Accordingly, such requirements may change or become more stringent in the future. Any material environmental issues or changes in environmental or other governmental regulations may have an adverse impact on our operating results and financial condition.
Our business may be adversely affected by automotive safety regulations or concerns that drive further regulation of the automobile safety market and concerns about vehicle emission standards
Government vehicle safety regulations are a key driver in our business. Historically, these regulations have imposed ever more stringent safety regulations for vehicles. These more stringent safety regulations often require vehicles with more safety content per vehicle and more advanced safety products, which has thus been a driver of growth in our business.
However, these regulations are subject to change based on a number of factors that are not within our control, including new scientific or medical data, adverse publicity regarding the industry recalls and safety risks of airbags or seatbelts (for instance, to children and small adults), domestic and foreign political developments or considerations, and litigation relating to our products and our competitors’ products and more. Changes in government regulations in response to these and other considerations could have a severe impact our business.
The regulatory obligation of complying with safety regulations could increase as federal and local regulators impose more stringent compliance and reporting requirements in response to product recalls and safety issues in our industry. We are subject to the existing Transportation Recall Enhancement, Accountability and Documentation (TREAD) Act, which requires manufacturers to comply with “Early Warning” requirements by reporting to the National Highway Traffic Safety Administration (“NHTSA”) information related to defects or reports of injury related to its products. TREAD imposes criminal liability for violating such requirements if a defect subsequently causes death or bodily injury. In addition, the National Traffic and Motor Vehicle Safety Act authorizes NHTSA to require a manufacturer to recall and repair vehicles that contain safety defects or fail to comply with federal motor vehicle safety standards. Sales into foreign countries may be subject to similar regulations.
Due to the recent record recall of airbag inflators of one of our competitors, additional legislation has been proposed in the U.S. Congress regarding the reporting requirements for product recalls. NHTSA has also become more active in requesting information from suppliers and vehicle manufactures regarding potential product defects. If the regulatory obligation of complying with safety regulations increases it could require increased resources and have a material impact on our business.
24
Table of Contents
Additionally, governments have different regulatory agendas at different times. An increased focus on environmental regulations relating to automobiles such as green-house gas emissions or gas mileage instead of safety regulations may impact the safety content of vehicles. Although we believe that over time safety will continue to be a regulatory priority, if government priorities shift and we are unable to adapt to changing regulations our business may suffer material adverse effects.
Additional information relating to our environmental management is included in the Annual Report in the “Management’s Discussion and Analysis” section “Environmental” on page 52 of the Annual Report.
Negative or unexpected tax developments could adversely affect our effective tax rate, operating results and financial condition
Our annual tax rate is based on our income and the tax laws in the jurisdictions in which we operate. Significant judgment is required in determining our effective tax rate and in evaluating our tax positions. Although we believe that our tax estimates are reasonable, the final determination of our tax liability may be different from what is reflected in our historical income tax provisions and accruals.
We are subject to tax audits by governmental authorities in the U.S. and numerous non-U.S. jurisdictions, which are inherently uncertain. Although we periodically assess the likelihood of adverse outcomes, negative or unexpected results from one or more such audits, including any related interest or penalties by governmental authorities, could increase our effective tax rate and adversely impact our operating results.
A number of factors may increase our effective tax rate, which could have an adverse impact on our profitability and results of operations. Due to our numerous foreign operations, our tax rate may be impacted by our global mix of earnings if our pre-tax income is lower than anticipated in countries with lower statutory tax rates and/or is higher than anticipated in countries with higher statutory tax rates. Based on U.S. regulatory rules, we do not record current or deferred tax liabilities on permanent investments in our foreign subsidiaries and our foreign earnings that are indefinitely reinvested. However, if our non-U.S. subsidiaries were to distribute cash to our U.S. parent or make a cash outlay, such transactions may result in an increase to the Company’s effective tax rate.
Changes in, or changes in the application of, U.S. or foreign laws, regulations or accounting principles with respect to matters such as tax rates, transfer pricing, dividends, and restrictions on certain forms of tax relief or limitations on favorable tax treatment could affect the carrying value of our deferred tax assets and/or our effective tax rate. For example, our ability to take advantage of tax planning strategies or expected favorable tax treatments (including those associated with R&D credits and loss carry forwards) may be significantly impaired as a result of changes to the conditions associated with such strategies or favorable treatments. Such changes may be the result of general attempts to remedy fiscal deficits or implement shifts in social policies, such as discouraging headcount reductions or similar actions.
We may not be able to fully realize our deferred tax assets
We currently carry deferred tax assets, net of valuation allowances, resulting from deductible temporary differences and tax loss carry forwards, both of which will reduce taxable income in the future. However, deferred tax assets may only be realized against taxable income. The amount of deferred tax assets could be reduced, from time to time, due to adverse changes in operations or in estimates of future taxable income from operations during the carry-forward period as a result of a deterioration in market conditions or other circumstances. Any such reduction would adversely affect income in the period of the adjustment.
Additional information on our deferred tax assets is included in Note 4 to the Consolidated Financial Statements on pages 66 and 67 of the Annual Report.
25
Table of Contents
Item 1B. Unresolved Staff Comments.
Not applicable.
Autoliv’s principal executive offices are located at Vasagatan 11, 7th floor, SE-111 20, Stockholm, Sweden. Autoliv’s various businesses operate in a number of production facilities and offices. Autoliv believes that its properties are adequately maintained and suitable for their intended use and that the Company’s production facilities have adequate capacity for the Company’s current and foreseeable needs. All of Autoliv’s production facilities and offices are owned or leased by operating (either subsidiary or joint venture) companies.
AUTOLIV MANUFACTURING FACILITIES
| Country/ Company |
Location of Facility |
Items Produced at Facility |
Owned/ | |||
| Brazil | ||||||
| Autoliv do Brasil Ltda. | Taubaté | Seatbelts, airbags, steering wheels and seatbelt webbing | Owned | |||
| Canada | ||||||
| Autoliv Canada, Inc. | Tilbury | Airbag cushions | Owned | |||
| Autoliv Electronics Canada, Inc. | Markham, Ontario | Airbag electronics, radar sensors | Leased | |||
| VOA Canada, Inc. | Collingwood | Seatbelt webbing | Owned | |||
| China | ||||||
| Autoliv (Beijing) Vehicle Safety Systems Co., Ltd. | Beijing | Seatbelts | Owned | |||
| Autoliv (Changchun) Vehicle Safety Systems Co., Ltd. | Changchun | Airbags and seatbelts | Owned | |||
| Autoliv (China) Electronics Co., Ltd. | Shanghai | Airbag electronics | Owned | |||
| Autoliv (China) Inflator Co., Ltd. | Shanghai | Airbag inflators | Owned | |||
| Autoliv (China) Steering Wheel Co., Ltd. | Shanghai | Steering wheels | Owned | |||
| Autoliv (Guangzhou) Vehicle Safety Systems Co., Ltd. | Guangzhou | Airbags and seatbelts | Owned | |||
| Autoliv (Nanjing) Vehicle Safety Systems Co., Ltd. | Nanjing | Seatbelts | Owned | |||
26
Table of Contents
| Autoliv Shenda (Nanjing) Automotive Components Co., Ltd. | Nanjing | Seatbelt webbing | Owned | |||
| Autoliv (Shanghai) Vehicle Safety Systems Co., Ltd. | Shanghai | Airbags, and airbag cushions | Owned | |||
| Changchun Hongguang-Autoliv Vehicle Safety System Co., Ltd. | Changchun | Seatbelts | Leased | |||
| Autoliv Shenda (Tai Cang) Automotive Safety Systems Co., Ltd. | Shanghai | Seatbelt webbing | Owned | |||
| Autoliv (Jiangsu) Automotive Safety Components Co., Ltd. | Jintan/Changzhou City | Gas generant, Airbag Initiators and Airbag inflators | Owned | |||
| Autoliv (China) Automotive Safety Systems Co., Ltd. | Nantong/Jiangsu | Airbag cushions | Owned | |||
| Estonia | ||||||
| AS Norma | Tallinn | Seatbelts and belt components | Owned | |||
| France | ||||||
| Autoliv Electronic SAS | Saint-Etienne du Rouvray | Airbag electronics | Owned | |||
| Autoliv France SNC | Gournay-en-Bray | Seatbelts and airbags | Owned | |||
| Autoliv Isodelta SAS | Chiré-en-Montreuil | Steering wheels and covers | Owned | |||
| Livbag SAS | Pont-de-Buis | Airbag inflators | Owned | |||
| N.C.S. Pyrotechnie et Technologies SAS | Survilliers | Airbag initiators and seatbelt micro gas generators | Owned | |||
| Germany | ||||||
| Autoliv B.V. & Co. KG | Dachau | Airbags | Leased | |||
| Elmshorn | Seatbelts | Owned | ||||
| Hungary | ||||||
| Autoliv Kft. | Sopronkovesd | Seatbelts | Owned | |||
| India | ||||||
| Autoliv India Private Ltd. | Bangalore | Seatbelts, airbags and steering wheels | Leased | |||
| Mysore | Seatbelt webbing | Owned | ||||
| Delhi | Seatbelts, airbags and steering wheels | Leased | ||||
| Chennai | Seatbelts | Leased | ||||
| Rudrapur, Uttarakhand | Seatbelts | Leased | ||||
| Indonesia | ||||||
| P.T. Autoliv Indonesia | Jakarta | Seatbelts | Owned | |||
27
Table of Contents
| Japan | ||||||
| Autoliv Japan Ltd. | Atsugi | Steering wheels | Owned | |||
| Hiroshima | Airbags and steering wheels | Owned | ||||
| Taketoyo | Airbag inflators | Owned | ||||
| Tsukuba | Airbags and seatbelts | Owned | ||||
| Malaysia | ||||||
| Autoliv-Hirotako Sdn Bhd | Kuala Lumpur | Seatbelts, airbags and steering wheels | Owned | |||
| Mexico | ||||||
| Autoliv Mexico East S.A. de C.V. | Matamoros | Steering wheels | Owned | |||
| Autoliv Mexico S.A. de C.V. | Lerma | Seatbelts | Owned | |||
| Autoliv Safety Technology de Mexico S.A. de C.V. | Tijuana | Seatbelts | Leased | |||
| Autoliv Steering Wheels Mexico S. de R.L. de C.V. | Querétaro Querétaro |
Airbag cushions Airbags |
Leased Leased | |||
| Netherlands | ||||||
| Van Oerle Alberton B.V. | Boxtel | Seatbelt webbing | Owned | |||
| Philippines | ||||||
| Autoliv Cebu Safety Manufacturing, Inc. | Cebu | Steering wheels | Owned | |||
| Poland | ||||||
| Autoliv Poland Sp. zo.o. | Olawa | Airbag cushions | Owned | |||
| Jelcz-Laskowice | Airbags and seatbelts | Owned | ||||
| Romania | ||||||
| Autoliv Romania S.R.L. | Brasov | Seatbelts, seatbelt webbing, airbags, airbag inflators, springs for retractors and height adjusters | Owned | |||
| Lugoj | Airbag cushions | Owned | ||||
| Covasna | Steering wheel | Owned | ||||
| Russia | ||||||
| OOO Autoliv | Togliatti | Airbags and seatbelts | Leased | |||
| South Africa | ||||||
| Autoliv Southern Africa (Pty) Ltd. | Gauteng | Seatbelts, airbags and steering wheels | Owned | |||
| South Korea | ||||||
| Autoliv Corporation | Seoul | Airbags and seatbelts | Owned | |||
| Wonju | Airbags and seatbelts | Owned | ||||
| Spain | ||||||
| Autoliv BKI S.A.U. | Valencia | Airbags | Owned | |||
| Autoliv KLE S.A.U. | Barcelona | Seatbelts | Owned | |||
28
Table of Contents
| Sweden | ||||||
| Autoliv Electronics AB | Motala | Airbag electronics | Leased | |||
| Autoliv Sverige AB | Vårgårda | Airbags, seatbelt, airbag inflators and airbag electronics | Owned | |||
| Taiwan | ||||||
| Mei-An Autoliv Co., Ltd. | Taipei | Seatbelts and airbags | Leased | |||
| Thailand | ||||||
| Autoliv Thailand Ltd. | Chonburi | Seatbelts | Owned | |||
| Chonburi | Airbags and airbag cushions | Leased | ||||
| Tunisia | ||||||
| SWT1 SARL | El Fahs | Leather wrapping of steering wheels | Owned | |||
| SWT2 SARL and ASW3 SARL | Nadhour | Leather wrapping of steering wheels | Owned | |||
| SWTF SARL | El Fahs | Leather wrapping of steering wheels | Owned | |||
| Turkey | ||||||
| Autoliv Cankor Otomotiv Emniyet Sistemleri Sanayi Ve Ticaret A.S. | Gebze-Kocaeli | Seatbelts and airbags | Owned | |||
| Autoliv Teknoloji Urunleri Sanyai Ve Ticaret A.S. | Gebze-Kocaeli | Leather wrapping of steering wheels | Leased | |||
| Autoliv Metal Pres Sanayi Yi Ve Ticaret A.S. | Gebze-Kocaeli | Seatbelt components | Owned | |||
| United Kingdom | ||||||
| Airbags International Ltd | Congleton | Airbag cushions | Owned | |||
| USA | ||||||
| Autoliv ASP, Inc. | Brigham City, Utah | Airbag inflators | Owned | |||
| Goleta, California | Night vision | Leased | ||||
| Lowell, Massachusetts | Radar sensors | Leased | ||||
| Ogden, Utah | Airbags | Owned | ||||
| Promontory, Utah | Gas generant | Owned | ||||
| Tremonton, Utah | Airbag initiators and seatbelt micro gas generators | Owned | ||||
29
Table of Contents
TECHNICAL CENTERS AND CRASH TEST LABORATORIES
| Location |
Function | |
| China | ||
| Autoliv (Shanghai) Vehicle Safety System Technical Center Co., Ltd., Shanghai | Technical center for airbags and seatbelts with full-scale test laboratory | |
| France | ||
| Autoliv France SNC., Gournay-en-Bray | Technical center for airbags and seatbelts with full-scale test laboratory | |
| Autoliv Electronics SAS, Cergy-Pontoise | Technical center for electronics | |
| Livbag SAS, Pont-de-Buis | Technical center for inflator and pyrotechnic development | |
| Germany | ||
| Autoliv B.V. & Co. KG, Dachau | Technical center for airbags with full-scale test laboratory | |
| Elmshorn |
Technical center for seatbelts with full-scale test laboratory | |
| India | ||
| Autoliv India Private Ltd., Bangalore | Technical center for airbags and seatbelts with sled testing | |
| Japan | ||
| Autoliv Japan Ltd., Tsukuba | Technical center for airbags with sled test laboratory | |
| Hiroshima |
Technical center for electronics | |
| Romania | ||
| Autoliv Romania S.R.L., Brasov | Technical center for seatbelts with sled test laboratory | |
| Timisoara |
Technical center for electronics | |
| South Korea | ||
| Autoliv Corporation, Seoul | Technical center with sled test laboratory | |
| Sweden | ||
| Autoliv Development AB, Vårgårda | Research center | |
| Autoliv Sverige AB, Vårgårda | Technical center for airbags with full-scale test laboratory | |
| Autoliv Electronics AB, Motala/Linköping | Technical center for electronics and active safety | |
| USA | ||
| Autoliv ASP Inc., Auburn Hills, Michigan | Technical center for airbags, seatbelts with full-scale test laboratory | |
| Ogden, Utah |
Technical center for airbags, inflators and pyrotechnics | |
| Southfield, Michigan |
Technical center for electronics and active safety | |
| Lowell, Massachusetts |
Technical center for active safety | |
Additional information relating to the Company’s properties is included in the section titled “Superior Global Presence” on pages 26 and 27 of the Annual Report and is incorporated herein by reference.
30
Table of Contents
Various claims, lawsuits and proceedings are pending or threatened against the Company or its subsidiaries, covering a range of matters that arise in the ordinary course of its business activities with respect to commercial, product liability and other matters. Litigation is subject to many uncertainties, and the outcome of any litigation cannot be assured. After discussions with counsel, and with the exception of losses resulting from the antitrust matters described below, it is the opinion of management that the various legal proceedings and investigations to which the Company currently is a party will not have a material adverse impact on the consolidated financial position of Autoliv, but the Company cannot provide assurance that Autoliv will not experience material litigation, product liability or other losses in the future.
The Company is subject to ongoing antitrust investigations by governmental authorities as well as related civil litigation in the United States and Canada. For further discussion of these antitrust matters and other legal proceedings see Note 16 Contingent Liabilities to the Consolidated Financial Statements on pages 74 and 75 of the Annual Report for the year ended December 31, 2014.
Item 4. Mine Safety Disclosures
Not applicable.
Item 5. Market for Registrant’s Common Equity, Related Stockholder Matters and Issuer Purchases of Equity Securities
Information concerning the market for Autoliv’s common stock including the relevant trading market, and approximate number of shareholders is included in the section titled “Share Performance and Shareholder Information” on pages 34 and 35 of the Annual Report and is incorporated herein by reference.
Share price and dividends
Information on the Company’s quarterly share prices and dividends declared and paid for the two most recent years, 2014 and 2013, is included in the “Share Price and Dividends” table on page 35 of the Annual Report and is incorporated herein by reference.
Equity and Equity Units Offering
Information concerning the Company’s Equity and Equity Units Offering is included in the section titled “Equity and Equity Units Offering” on page 72 of the Annual Report and is incorporated herein by reference.
31
Table of Contents
Stock repurchase program
The following table provides information with respect to Common Stock purchases by the Company during the fiscal fourth quarter of 2014 and number of shares available under the repurchase program as of December 31, 2014.
| Nasdaq
OMX Stockholm (“OMX”) |
New York
Stock Exchange (“NYSE”) |
OMX and NYSE | ||||||||||||||||||||||||||
| Period |
Total Number of Shares Purchased |
Average Price Paid per Share (USD) |
Total Number of Shares Purchased |
Average Price Paid per Share (USD) |
Total Number of Shares Purchased as Part of Publicly Announced Plans or Programs |
Average Price Paid per Share (USD) |
Maximum Number (or Approximate Dollar Value) of Shares that May Yet Be Purchased Under the Plans or Programs |
|||||||||||||||||||||
| October 1, 2014 through October 31, 2014 |
128,982 | 90.7050 | 181,850 | 90.8869 | 310,832 | 90.8114 | 6,975,759 | |||||||||||||||||||||
| November 1, 2014 through November 30, 2014 |
549,397 | 96.0919 | 837,775 | 96.3371 | 1,387,172 | 96.2400 | 5,588,587 | |||||||||||||||||||||
| December 1, 2014 through December 31, 2014 |
78,259 | 100.2409 | 160,402 | 101.0825 | 238,661 | 100.8065 | 5,349,926 | |||||||||||||||||||||
|
|
|
|
|
|
|
|
|
|
|
|
|
|
|
|||||||||||||||
| Total |
756,638 | 95.6028 | 1,180,027 | 96.1422 | 1,936,665 | 95.9315 | 5,349,926 | |||||||||||||||||||||
|
|
|
|
|
|
|
|
|
|
|
|
|
|
|
|||||||||||||||
Autoliv initiated its repurchase program in 2000 with 10 million shares and subsequently expanded the authorization three times between 2000 and 2007 to 37.5 million shares.
Share repurchases were suspended September 15, 2008 as a result of the financial crisis to preserve cash. During the fourth quarter 2013, the Company reactivated its share repurchase program.
On January 30, 2014, the Board of Directors of the Company approved an additional 10 million shares for repurchase under the existing authorization for share repurchases. Such purchases may be made from time to time on the open market or otherwise at the discretion of management. There is no expiration date for the share repurchase authorization to provide management flexibility in the Company’s repurchases.
The maximum number of shares that may yet be purchased under the Stock Repurchase Program amounted to 5,349,926 shares at December 31, 2014.
In total, Autoliv has repurchased 42.2 million shares between May 2000 and December 2014 for cash of $2,237 million, including commissions. Of the total number of repurchased shares, 14.7 million shares were utilized for the equity offering in 2009, 3.1 million and 5.8 million shares were utilized for the repurchase of equity units in the second quarter of 2010 and the settlement of the equity units in the second quarter of 2012 respectively. In addition, 4.5 million shares have been utilized by the Stock Incentive Plan, whereof 0.5 million, 0.5 million and 0.4 million were utilized during 2014, 2013 and 2012, respectively. At December 31, 2014, 14.1 million of the repurchased shares remain in treasury stock.
Additional information concerning the repurchase of Autoliv stock is included on pages 32 and 33 in the section “Creating Shareholder Value” of the Annual Report, and is incorporated herein by reference.
32
Table of Contents
Item 6. Selected Financial Data
Selected financial data for the five years ended December 31, 2014 is included on page 89 of the Annual Report and is incorporated herein by reference.
Item 7. Management’s Discussion and Analysis of Financial Condition and Results of Operations
Management’s Discussion and Analysis of Financial Condition and Results of Operations for the three years ended December 31, 2014 is included on pages 39 through 54 of the Annual Report and is incorporated herein by reference.
Item 7A. Quantitative and Qualitative Disclosures about Market Risk
The Quantitative and Qualitative Disclosures about market risk are included in the Management’s Discussion and Analysis section “Risks and Risk Management” on pages 51 through 54 of the Annual Report and are incorporated herein by reference. See also Note 1 of the Notes to Consolidated Financial Statements on pages 60 through 63 of the Annual Report.
Item 8. Financial Statements and Supplementary Data
The Consolidated Balance Sheets of Autoliv as of December 31, 2014 and 2013 and the Consolidated Statements of Net Income, Comprehensive Income, Cash Flows and Total Equity for each of the three years in the period ended December 31, 2014, the Notes to the Consolidated Financial Statements, and the Reports of the Independent Registered Public Accounting Firm are included on pages 56 through 82 of the Annual Report and are incorporated herein by reference.
All of the schedules specified under Regulation S-X to be provided by Autoliv have been omitted either because they are not applicable, are not required or the information required is included in the financial statements or notes thereto.
Item 9. Changes in and Disagreements with Accountants on Accounting and Financial Disclosure
There have been no changes to and no disagreements with our independent auditors regarding accounting or financial disclosure matters in our two most recent fiscal years.
Item 9A. Controls and Procedures
(a) Evaluation of Disclosure Controls and Procedures
An evaluation has been carried out by the Company’s management, under the supervision and with the participation of the Company’s Chief Executive Officer and Chief Financial Officer, of the effectiveness of the design and operation of our disclosure controls and procedures (as such term is defined in Rules 13a-15(e) and 15d-15(e) under the Securities Exchange Act of 1934, as amended (the “Exchange Act”)) as of the end of the period covered by this report. Based on such evaluation, the Company’s Chief Executive Officer and Chief Financial Officer have concluded that, as of the end of such period, the Company’s disclosure controls and procedures are effective.
33
Table of Contents
(b) Management’s Report on Internal Control Over Financial Reporting
The Management Report on Internal Control over Financial Reporting (as defined in Section 240.13a-15(f) or 240.15d-15(f) of the Exchange Act) is included on page 55 of the Annual Report immediately preceding the audited financial statements and is incorporated herein by reference.
The Company’s internal control over financial reporting as of December 31, 2014 has been audited by our independent registered public accounting firm, as stated in their report that is included on page 82 of the Annual Report and is incorporated herein by reference.
(c) Changes in Internal Control over Financial Reporting
There have not been any changes in the Company’s internal control over financial reporting (as such term is defined in Rules 13a-15(f) and 15d-15(f) under the Exchange Act) during the quarter ended December 31, 2014 that have materially affected, or are reasonably likely to materially affect, the Company’s internal control over financial reporting.
All events required to be disclosed on form 8-K during the fourth quarter have been reported.
34
Table of Contents
Item 10. Directors, Executive Officers and Corporate Governance
The information required by Item 10 regarding executive officers, directors and nominees for re-election as directors of Autoliv, Autoliv’s Audit Committee, Autoliv’s code of ethics, and compliance with Section 16(A) of the Securities Exchange Act is incorporated by reference from the information under the captions “Executive Officers of the Company” and “Item 1: Election of Directors”, “Committees of the Board” and “Audit Committee Report”, “Corporate Governance Guidelines and Codes of Conduct and Ethics”, and “Section 16(a) Beneficial Ownership Reporting Compliance”, respectively, in the Company’s 2015 Proxy Statement, which will be filed within 120 days after December 31, 2014. Information on Board meeting attendance is provided under the caption “Board Meetings” in the 2015 Proxy Statement and incorporated herein by reference.
Item 11. Executive Compensation
The information required by Item 11 regarding executive compensation for the year ended December 31, 2014 is included under the captions “Compensation Discussion and Analysis” and “Executive Compensation” in the 2015 Proxy Statement and is incorporated herein by reference. The information required by the same item regarding Compensation Committee is included in the sections “Compensation Committee Interlocks and Insider Participation” and “Compensation Committee Report” in the 2015 Proxy Statement and is incorporated herein by reference.
Item 12. Security Ownership of Certain Beneficial Owners and Management and Related Stockholder Matters
The information required by Item 12 regarding beneficial ownership of Autoliv’s common stock is included under the caption “Security Ownership of Certain Beneficial Owners and Management” in the 2015 Proxy Statement and is incorporated herein by reference.
35
Table of Contents
Shares Previously Authorized for Issuance Under the Amended and Restated 1997 Stock Incentive Plan
The following table provides information as of December 31, 2014, about the common stock that may be issued under the Autoliv, Inc. Amended and Restated 1997 Stock Incentive Plan, as amended. The Company does not have any equity compensation plans that have not been approved by its stockholders.
| Plan Category |
(a) Number of Securities to be issued upon exercise of outstanding options, warrants and rights |
(b) Weighted- average exercise price of outstanding options, warrants and rights(2) |
(c) Number of securities remaining available for future issuance under equity compensation plans (excluding securities reflected in column (a))(3) |
|||||||||
| Equity compensation plans approved by security holders (1) |
737,110 | $ | 70.38 | 3,639,991 | (3) | |||||||
| Equity compensation plans not approved by security holders |
— | — | — | |||||||||
|
|
|
|
|
|
|
|||||||
| Total |
737,110 | $ | 70.38 | 3,639,991 | ||||||||
|
|
|
|
|
|
|
|||||||
| (1) | Autoliv, Inc. Amended and Restated 1997 Stock Incentive Plan, as amended and restated on May 6, 2009, as amended by Amendment No. 1 dated December 17, 2010 and Amendment No. 2 dated May 8, 2012. |
| (2) | Excludes RSUs, which convert to shares of common stock for no consideration. |
| (3) | All such shares are available for issuance pursuant to grants of full-value stock awards. |
Item 13. Certain Relationships and Related Transactions, and Director Independence
In 2014, no transactions took place that the Company deemed to require disclosure under Item 13. Further information regarding the Company’s policy and procedures concerning related party transactions is included under caption “Related Person Transactions” in the 2015 Proxy Statement and is incorporated herein by reference. Information regarding director independence can be found under the caption “Board Independence” in the 2015 Proxy Statement and is incorporated herein by reference.
Item 14. Principal Accounting Fees and Services
The information required by Item 9 (e) of Schedule 14A regarding principal accounting fees and the information required by Item 14 regarding the pre-approval process of services provided to Autoliv is included under the caption “Ratification of Appointment of Independent Auditors” in the 2015 Proxy Statement and is incorporated herein by reference.
36
Table of Contents
Item 15. Exhibits and Financial Statement Schedules
(a) Documents Filed as Part of this Report
| (1) | Financial Statements |
The following consolidated financial statements are included on pages 56 through 81 of the Annual Report and Selected Financial Data is included on page 89 of the Annual Report and are incorporated herein by reference:
| (i) | Consolidated Statements of Net Income - Years ended December 31, 2014, 2013 and 2012 (page 56); |
| (ii) | Consolidated Statements of Comprehensive Income - Years ended December 31, 2014, 2013 and 2012 (page 56); |
| (iii) | Consolidated Balance Sheets - as of December 31, 2014 and 2013 (page 57); |
| (iv) | Consolidated Statements of Cash Flows - Years ended December 31, 2014, 2013 and 2012 (page 58); |
| (v) | Consolidated Statements of Total Equity – as of December 31, 2014, 2013 and 2012 (page 59); |
| (vi) | Notes to Consolidated Financial Statements (pages 60-81); |
| (vii) | Reports of Independent Registered Public Accounting Firm (page 82). |
| (2) | Financial Statement Schedules |
All of the schedules specified under Regulation S-X to be provided by Autoliv have been omitted either because they are not applicable, they are not required, or the information required is included in the financial statements or notes thereto.
| (b) | Exhibits |
Exhibits marked with an asterisk (*) are filed or furnished herewith. All other exhibits are incorporated by reference to exhibits previously filed with the SEC, as indicated.
37
Table of Contents
Index to Exhibits
| Exhibit No. |
Description | |
| 3.1 | Autoliv’s Restated Certificate of Incorporation incorporated herein by reference to Exhibit 3.1 to the Quarterly Report on Form 10-Q, filed on May 14, 1997. | |
| 3.2 | Autoliv’s Restated By-Laws incorporated herein by reference to Exhibit 3.2 on Form 10-K (File No. 001-12933, filing date February 23, 2012). | |
| 4.1 | Senior Indenture, dated March 30, 2009, between Autoliv, Inc. and U.S. Bank National Association, as trustee, incorporated herein by reference to Exhibit 4.1 to Autoliv’s Registration Statement on Form 8-A (File No. 001-12933, filing date March 30, 2009). | |
| 4.2 | First Supplemental Indenture, dated March 30, 2009, between Autoliv, Inc. and U.S. Bank National Association, as trustee, incorporated herein by reference to Exhibit 4.2 to Autoliv’s Registration Statement on Form 8-A (File No. 001-12933, filing date March 30, 2009). | |
| 4.3 | Purchase Contract and Pledge Agreement, dated March 30, 2009, among Autoliv, Inc. and U.S. Bank National Association, as Stock Purchase Contract Agent, and U.S. Bank National Association, as Collateral Agent, Custodial Agent and Securities Intermediary, incorporated herein by reference to Exhibit 4.3 to Autoliv’s Registration Statement on Form 8-A (File No. 001-12933, filing date March 30, 2009). | |
| 4.4 | General Terms and Conditions for Swedish Depository Receipts in Autoliv, Inc. representing common shares in Autoliv, Inc., effective as of August 1, 2011, with Skandinaviska Enskilda Banken AB (publ) serving as custodian, incorporated herein by reference to Exhibit 4.11 to Autoliv’s Registration Statement on Form S-3 (File No. 333-179948, filing date March 7, 2012). | |
| 4.5 | Second Supplemental Indenture (including Form of Global Note), dated March 15, 2012, between Autoliv, Inc. and U.S. Bank National Association, as trustee, incorporated herein by reference to Exhibit 4.1 to the Current Report on Form 8-K (File No. 001-12933, filing date March 15, 2012). | |
| 4.6 | Note Purchase and Guaranty Agreement dated April 23, 2014, among Autoliv ASP, Inc., Autoliv, Inc. and the purchasers named therein, incorporated herein by reference to Exhibit 4.6 to the Quarterly Report on Form 10-Q (File No. 001-12933 filing date April 25, 2014). | |
38
Table of Contents
| 10.1 | Autoliv, Inc. 1997 Stock Incentive Plan, incorporated herein by reference to Autoliv’s Registration Statement on Form S-8 (File No. 333-26299, filing date May 1, 1997). | |
| 10.2 | Amendment No. 1 to Autoliv, Inc. Stock Incentive Plan, is incorporated herein by reference to Exhibit 10.3 on Form 10-K/A (File No. 001-12933, filing date July 2, 2002). | |
| 10.3 | Form of Employment Agreement between Autoliv, Inc. and certain of its executive officers, is incorporated herein by reference to Exhibit 10.4 on Form 10-K/A (File No. 001-12933, filing date July 2, 2002). | |
| 10.4 | Form of Supplementary Agreement to the Employment Agreement between Autoliv, Inc. and certain of its executive officers, is incorporated herein by reference to Exhibit 10.5 on Form 10-K/A (File No. 001-12933, filing date July 2, 2002). | |
| 10.5 | Form of Severance Agreement between Autoliv, Inc. and certain of its executive officers, is incorporated herein by reference to Exhibit 10.7 on Form 10-K/A (File No. 001-12933, filing date July 2, 2002). | |
| 10.6 | Form of Amendment to Employment Agreement between Autoliv, Inc. and certain of its executive officers – notice, is incorporated herein by reference to Exhibit 10.9 on Form 10-K (File No. 001-12933, filing date March 14, 2003). | |
| 10.7 | Form of Amendment to Employment Agreement between Autoliv, Inc. and certain of its executive officers – pension, is incorporated herein by reference to Exhibit 10.10 on Form 10-K (File No. 001-12933, filing date March 14, 2003). | |
| 10.8 | Form of Agreement between Autoliv, Inc. and certain of its executive officers – additional pension, is incorporated herein by reference to Exhibit 10.11 on Form 10-K (File No. 001-12933, filing date March 14, 2003). | |
| 10.9 | Amendment No. 2 to the Autoliv, Inc. 1997 Stock Incentive Plan, is incorporated herein by reference to Exhibit 10.12 on Form 10-K (File No. 001-12933, filing date March 11, 2004). | |
| 10.10 | Employment Agreement, dated March 31, 2007, between Autoliv, Inc. and Mr. Jan Carlson, is incorporated herein by reference to Exhibit 10.13 on Form 10-Q (File No. 001-12933, filing date October 25, 2007). | |
| 10.11 | Retirement Benefits Agreement, dated August 14, 2007, between Autoliv AB and Mr. Jan Carlson, is incorporated herein by reference to Exhibit 10.14 on Form 10-Q (File No. 001-12933, filing date October 25, 2007). | |
| 10.12 | Amended and Restated Autoliv, Inc. 1997 Stock Incentive Plan, filed as Appendix A of the Definitive Proxy Statement of the Company on Schedule 14A filed on March 23, 2009 and is incorporated herein by reference. | |
39
Table of Contents
| 10.13 | Facility Agreement, dated June 22, 2010, between Autoliv AB, a 100% owned Swedish subsidiary of Autoliv, Inc., and Nordea, is incorporated herein by reference to Exhibit 10.21 on Form 10-Q (File No. 001-12933, filing date July 23, 2010). | |
| 10.14 | Facility Agreement, dated June 22, 2010, between Autoliv AB, a 100% owned Swedish subsidiary of Autoliv, Inc., and Swedish Export Credit Corporation and SEB, is incorporated herein by reference to Exhibit 10.22 on Form 10-Q (File No. 001-12933, filing date July 23, 2010). | |
| 10.15 | Amendment No. 1 to the Autoliv, Inc. 1997 Stock Incentive Plan as Amended and Restated on May 6, 2009, dated December 17, 2010, is incorporated herein by reference to Exhibit 10.24 on Form 10-K (File No. 001-12933, filing date February 23, 2011). | |
| 10.16 | Amendment, dated July 15, 2011, to Financing commitment agreement, dated December 18, 2009, between Autoliv AB and the European Investment Bank (EIB), is incorporated herein by reference to Exhibit 99.l on Form 10-Q (File No. 001-12933, filing date July 21, 2011). | |
| 10.17 | Facilities Agreement of $1,100,000,000, dated April 16, 2011, among Autoliv, Inc. and the lenders named therein, is incorporated herein by reference to Exhibit 99.j on Form 10-Q (File No. 001-12933, filing date April 20, 2011). | |
| 10.18 | Form of Amendment to Employment Agreement between Autoliv, Inc. and certain of its executive officers – pension, is incorporated herein by reference to Exhibit 10.26 on Form 10-K (File No. 001-12933, filing date February 23, 2012). | |
| 10.19 | Form of Amendment to Employment Agreement between Autoliv, Inc. and certain of its executive officers – non-equity incentive award, is incorporated herein by reference to Exhibit 10.27 on Form 10-K (File No. 001-12933, filing date February 23, 2012). | |
| 10.20 | Amendment to Employment Agreement, dated March 31, 2007, between Autoliv, Inc. and Mr. Jan Carlson (pension), is incorporated herein by reference to Exhibit 10.28 on Form 10-K (File No. 001-12933, filing date February 23, 2012). | |
| 10.21 | General Terms and Conditions for Swedish Depository Receipts in Autoliv, Inc. representing common shares in Autoliv, Inc., effective as of August 1, 2011, with Skandinaviska Enskilda Banken AB (publ) serving as custodian, is incorporated by reference to Exhibit 4.11 to Autoliv’s Registration Statement on Form S-3 (File No. 333-179948, filing date March 7, 2012). | |
| 10.22 | Remarketing Agreement, dated as of February 9, 2012 incorporated herein by reference to Exhibit 1.1 to the Current Report on Form 8-K (File No. 001-12933, filing date March 15, 2012). | |
40
Table of Contents
| 10.23 | Plea Agreement, dated June 6, 2012, is incorporated herein by reference to Exhibit 10.30 on Form 10-Q (File No. 001-12933, filing date July 20, 2012). | |
| 10.24 | Amendment No. 2 to the Autoliv, Inc. 1997 Stock Incentive Plan as Amended and Restated on May 6, 2009, dated May 8, 2012, is incorporated herein by reference to Exhibit 10.29 on Form 10-Q (File No. 001-12933, filing date July 20, 2012). | |
| 10.25 | Amendment, dated January 18, 2013 to Employment Agreement, dated March 31, 2007, between Autoliv, Inc. and Mr. Jan Carlson – additional pension is incorporated herein by reference to Exhibit 10.33 on Form 10-K (File No. 001-12933, filing date February 22, 2012). | |
| 10.26 | Form of Employment Agreement between Autoliv, Inc. and certain of its executive officers (with Change-in-Control Severance Agreement) is incorporated herein by reference to Exhibit 10.34 on Form 10-K (File No. 001-12933, filing date February 22, 2012). | |
| 10.27 | Form of Employment Agreement between Autoliv, Inc. and certain of its executive officers (without Change-in-Control Severance Agreement) is incorporated herein by reference to Exhibit 10.35 on Form 10-K (File No. 001-12933, filing date February 22, 2012). | |
| 10.28 | Form of Change-in-Control Severance Agreement between Autoliv, Inc. and certain of its executive officers is incorporated herein by reference to Exhibit 10.36 on Form 10-K (File No. 001-12933, filing date February 22, 2012). | |
| 10.29 | Form of Indemnification Agreement between Autoliv, Inc. and its Directors and certain of its executive officers is incorporated herein by reference to Exhibit 99.i on Form 10-K (File No. 001-12933, filing date February 23, 2009). | |
| 10.30 | Finance Contract, dated July 16, 2013, among European Investment Bank, Autoliv AB (publ) and Autoliv, Inc. incorporated herein by reference to Exhibit 10.1 on Form 10-Q (File No. 001-12933, filing date October 24, 2013). | |
| 10.31 | Guarantee Agreement, dated July 16, 2013, between European Investment Bank and Autoliv, Inc. incorporated herein by reference to Exhibit 10.12 on Form 10-Q (File No. 001-12933, filing date October 24, 2013). | |
| 10.32 | Autoliv, Inc. Non-employee Director Compensation Policy is incorporated herein by reference to Exhibit 10.38 on Form 10-K (File No. 001-12933, filing date February 22, 2012). | |
| 10.33 | Note Purchase and Guaranty Agreement dated April 23, 2014, among Autoliv ASP, Inc., Autoliv, Inc. and the purchasers named therein, incorporated herein by reference to Exhibit 4.6 to the Quarterly Report on Form 10-Q (File No. 001-12933 filing date April 25, 2014). | |
41
Table of Contents
| 10.34 | Autoliv, Inc. Non-employee Director Compensation Policy, incorporated herein by reference to Exhibit 10.2 to the Quarterly Report on Form 10-Q (File No. 001-12933, filing date July 18, 2014). | |
| 10.35 | Form of Supplement to Employment Agreement for certain executive officers, dated August 13, 2014 and effective September 1, 2014, incorporated herein by reference to Exhibit 10.1 to the Quarterly Report on Form 10-Q (File No. 001-12933, filing date October 23, 2014). | |
| 10.36* | Amendment, dated January 27, 2015 to the Finance Contract, dated July 16, 2013, among European Investment Bank, Autoliv AB (publ) and Autoliv, Inc. | |
| 11 | Information concerning the calculation of Autoliv’s earnings per share is included in Note 1 of the Consolidated Notes to Financial Statements contained in the Annual Report and is incorporated herein by reference. | |
| 12.1* | Ratio of Earnings to Fixed Charges. | |
| 13* | Autoliv’s Annual Report to Shareholders for the fiscal year ended December 31, 2014. | |
| 21* | Autoliv’s List of Subsidiaries. | |
| 23* | Consent of Independent Registered Public Accounting Firm. | |
| 31.1* | Certification of Chief Executive Officer, pursuant to Rule 13a-14(a) promulgated under the Securities Exchange Act of 1934, as amended. | |
| 31.2* | Certification of Chief Financial Officer, pursuant to Rule 13a-14(a) promulgated under the Securities Exchange Act of 1934, as amended. | |
| 32.1* | Certification of Chief Executive Officer, pursuant to 18 U.S.C. Section 1350, as adopted pursuant to section 906 of the Sarbanes-Oxley Act of 2002. | |
| 32.2* | Certification of Chief Financial Officer, pursuant to 18 U.S.C. Section 1350, as adopted pursuant to section 906 of the Sarbanes-Oxley Act of 2002. | |
| 101* | The following financial information from the Annual Report on Form 10-K for the fiscal year ended December 31, 2014, formatted in XBRL (Extensible Business Reporting Language) and furnished electronically herewith: (i) the Consolidated Statements of Net Income; (ii) the Consolidated Statements of Comprehensive Income: (iii) the Consolidated Balance Sheets; (iv) the Consolidated Statements of Cash Flows; (v) the Consolidated Statements of Total Equity; and (vi) the Notes to the Consolidated Financial Statements. | |
42
Table of Contents
SIGNATURES
Pursuant to the requirements of Section 13 or 15(d) of the Securities Exchange Act of 1934, the registrant has duly caused this report to be signed on its behalf by the undersigned, thereunto duly authorized, as of February 19, 2015.
AUTOLIV, INC.
(Registrant)
By /s/ Mats Wallin
Mats Wallin
Vice President and Chief Financial Officer
Pursuant to the requirements of the Securities Exchange Act of 1934, this report has been signed below by the following persons on behalf of the registrant and in the capacities indicated, as of February 19, 2015.
| Title | Name | |||
| Chairman of the Board of Directors, Chief Executive Officer and President (Principal Executive Officer) |
/s/ Jan Carlson |
|||
| Jan Carlson
|
||||
| Vice President and Chief Financial Officer (Principal Financial and Principal Accounting Officer) |
/s/ Mats Wallin |
|||
| Mats Wallin | ||||
| Director |
/s/ Robert W. Alspaugh |
|||
| Robert W. Alspaugh | ||||
| Director |
/s/ Xiaozhi Liu |
|||
| Xiaozhi Liu | ||||
| Director |
/s/ George A. Lorch |
|||
| George A. Lorch | ||||
| Director |
/s/ James M. Ringler |
|||
| James M. Ringler | ||||
| Director |
/s/ Kazuhiko Sakamoto |
|||
| Kazuhiko Sakamoto | ||||
| Director |
/s/ Franz-Josef Kortüm |
|||
| Franz-Josef Kortüm | ||||
| Director |
|
|||
| Aicha Evans |
||||
| Director |
|
|||
| David E. Kepler |
||||
43
Exhibit 10.36
Autoliv AB (publ) / Autoliv Inc.
Vasagatan 11
111 20 Stockholm
Sweden
Attention: Treasurer
DHL
| Luxembourg, 14th January 2015 | JUOPS/MB/CAJ/jw/2015-91 |
| Subject: | AUTOLIV SAFETY SYSTEMS R&D II (SWEDEN, GERMANY AND FRANCE) (Serapis Nº 2012-0517, FI N° 82.624) | |
| Finance contract between the European Investment Bank (the “Bank”) and Autoliv AB (publ) as borrower (the “Borrower”) and Autoliv Inc. as guarantor (the “Guarantor”) dated 16 July 2013 (the “Finance Contract”). | ||
| - Amendment | ||
|
| ||
Dear Sirs,
Reference is made to your request to extend the final availability date for disbursements up to 16 January 2016.
Unless otherwise defined in this letter, defined terms used in the Finance Contract shall have the same meaning when used herein.
| 1. | Amendments |
The Bank and the Borrower and the Guarantor agree that:
| (a) | the definition of the Final Availability Date in the Finance Contract shall be amended to be no later than 16 January 2016. |
| (b) | The wording under indent (a) of Article 1.09 (Non-utilisation fee) shall be deleted and be replaced with the following new wording: |
“On 20 December 2013, 20 June 2014, 16 January 2015 and 20 June 2015; and”
| 2. | Governing law |
Articles 11.01 and 11.02 of the Finance Contract shall apply to this letter, mutatis mutandis, as if they were set out herein.
In order to indicate your agreement to the above, we kindly request you to initial each page of the four originals of this Letter (other than the signatory page) and to date and duly sign each of the four originals. Please return to us two originals at your earliest convenience, including evidence of authorisation of the signatories of the Borrower and the Guarantor to sign and execute this letter. Please retain two originals for your records.
Yours faithfully,
EUROPEAN INVESTMENT BANK
| /s/ Hanna Karczewska |
/s/ Liisa Raasakka | |||
| Hanna Karczewska | Liisa Raasakka | |||
| Head of Division | Loan Officer |
Agreed and accepted for and on behalf of:
Autoliv AB (publ) as borrower
| Name: | /s/ Fredrik Peyron |
/s/ Mats Wallin | ||
| Fredrik Peyron | Mats Wallin | |||
| Title: | ||||
| Date: | 27 January 2015 | 27 January 2015 | ||
| Agreed and accepted for and on behalf of: Autoliv Inc. as guarantor | ||||
| Name: | /s/ Fredrik Peyron |
/s/ Mats Wallin | ||
| Fredrik Peyron | Mats Wallin | |||
| Title: | ||||
| Date: | 27 January 2015 | 27 January 2015 | ||
Exhibit 12.1
Autoliv, Inc.
Computation of Ratio of Earnings to Fixed Charges
| (Dollars in millions) | Year Ended December 31, | |||||||||||||||||||
| Fixed charges | 2010 | 2011 | 2012 | 2013 | 2014 | |||||||||||||||
| Interest expense |
$ | 66.6 | $ | 68.2 | $ | 41.7 | $ | 32.9 | $ | 63.4 | ||||||||||
| Interest portion of rental expense (1) |
9.7 | 12.0 | 11.7 | 15.1 | 14.7 | |||||||||||||||
|
|
|
|
|
|
|
|
|
|
|
|||||||||||
| Total |
$ | 76.3 | $ | 80.2 | $ | 53.4 | $ | 48.0 | 78.1 | |||||||||||
| Earnings |
||||||||||||||||||||
| Income before income taxes |
$ | 805.5 | $ | 828.3 | $ | 668.6 | $ | 734.0 | $ | 667.1 | ||||||||||
| Earnings in Affiliates |
(5.5 | ) | (6.8 | ) | (8.1 | ) | (7.3 | ) | (6.9 | ) | ||||||||||
| Fixed charges + |
76.3 | 80.2 | 53.4 | 48.0 | 78.1 | |||||||||||||||
| Cash from Affiliates + |
9.2 | 6.4 | 4.8 | 4.6 | 5.7 | |||||||||||||||
|
|
|
|
|
|
|
|
|
|
|
|||||||||||
| Total |
$ | 885.5 | $ | 908.1 | $ | 718.7 | $ | 779.3 | $ | 744.0 | ||||||||||
|
|
|
|
|
|
|
|
|
|
|
|||||||||||
| Ratios of Earnings to Fixed Charges |
12x | 11x | 13x | 16x | 10X | |||||||||||||||
(1) One-third of all rental expense is deemed to be interest.
For the purpose of computing these ratios, (i) “earnings” consists of the sum of pre-tax income from continuing operations before adjustment for non-controlling interests in our consolidated subsidiaries or income or loss from equity investees; fixed charges; amortization of capitalized interest; and distributed income of equity investees; and (ii) “fixed charges” consists of the sum of interest expense (which includes amortization of premiums, discounts, and capitalized expenses related to debt issue costs, when applicable); capitalized interest; and one-third of rental expense which we believe to be a reasonable estimate of an interest factor in our leases.
CONTENT1)
| 03 |
Who we are, what we do | |
| 04 |
Targets | |
| 05 |
2014 in Summary | |
| 06 |
President’s Letter | |
| 08 |
How we do it | |
| 09 |
Our Strategies | |
| 10 |
Quality | |
| 12 |
One Product One Process | |
| 14 |
Innovations | |
| 16 |
Safety Systems | |
| 22 |
Active Safety | |
| 24 |
People | |
| 26 |
Global Presence | |
| 28 |
Market & Competitors | |
| 30 |
Customers | |
| 32 |
Shareholders | |
| 34 |
Share Performance | |
| 36 |
Sustainability | |
| 39 |
Management’s Discussion and Analysis | |
| 56 |
Consolidated Statements of Net Income | |
| 56 |
Consolidated Statements of Comprehensive Income | |
| 57 |
Consolidated Balance Sheets | |
| 58 |
Consolidated Statements of Cash Flows | |
| 59 |
Consolidated Statements of Total Equity | |
| 60 |
Notes to Consolidated Financial Statements | |
| 82 |
Auditor’s Reports | |
| 83 |
Glossary and Definitions | |
| 84 |
Corporate Governance | |
| 86 |
Board of Directors | |
| 87 |
Executive Management | |
| 88 |
Contact Information & Calendar | |
| 89 |
Selected Financial Data |
1) See page in Annual Report.
READER’S GUIDE
Autoliv, Inc. is incorporated in Delaware, USA, and follows Generally Accepted Accounting Principles in the United States (U.S. GAAP). This annual report also contains certain non-U.S. GAAP measures, see page 42 and page 54 in the Annual Report. All amounts in this annual report are in U.S. dollars unless otherwise indicated.
“We”, “the Company” and “Autoliv” refer to “Autoliv Inc.” as defined in Note 1 “Principles of Consolidation” on page 60. For forward-looking information, refer to the “Safe Harbor Statement” on page 55 in the Annual Report.
Data on markets and competitors are Autoliv’s estimates (unless otherwise indicated). The estimates are based on orders awarded to us or our competitors or other information put out by third parties as well as plans announced by vehicle manufacturers and regulatory agencies.
FINANCIAL INFORMATION
Every year, Autoliv publishes an annual report and a proxy statement prior to the Annual General Meeting of Shareholders, see page 34 in the Annual Report.
The proxy statement provides information not only on the agenda for the meeting, but also on the work of the Board of Directors and its committees as well as on compensation paid to and presentation of directors and certain senior executive officers.
For financial information, please also refer to the Form 10-K and Form 10-Q reports and Autoliv’s other filings with the Securities and Exchange Commission (SEC). These filings are available at www.autoliv.com under Investors/Filings.
The annual and quarterly reports, the proxy statement and Autoliv’s filings with the SEC as well as the Company’s Corporate Governance Guidelines, Charters, Code of Conduct and other documents governing the Company can be downloaded from the Company’s corporate website. Hard copies of the above-mentioned documents can be obtained free of charge from the Company at the addresses on page 88 in the Annual Report.
Who we are, what we do
While human suffering cannot be measured, monetary costs to society from automobile accidents are estimated in the hundreds of billions of dollars each year for health care, rehabilitation and loss of income.
Innovation, quality and focus on Saving Lives have been the hallmarks for Autoliv from its inception more than 60 years ago. Now our products save over 30,000 lives every year and prevent ten times as many severe injuries. The next step is to further reduce road traffic accidents with active safety systems that assist the driver to avoid an accident or, at least, reduce the speed of impact, thereby substantially mitigating the severity of injuries. In the future, these active safety systems will form the basis for automated driving.
Autoliv, Inc. is incorporated in the state of Delaware, and its global headquarter is located in Stockholm, Sweden.
We are a Fortune 500 Company and the world’s largest automotive safety supplier with sales to all of the leading car manufacturers in the world. We develop, manufacture and market protective systems such as airbags, seatbelts, steering wheels, passive safety electronics and active safety systems including radar, night vision and camera vision systems. We also produce anti-whiplash systems, pedestrian protection systems and child seats.
In 2014 we maintained our global passive safety market share at 37%. We produced around 140 million seatbelts and around 130 million airbags in 2014. Statistically, there were almost two seatbelts and more than 1.5 airbags from Autoliv in every vehicle produced globally, despite many vehicles not having airbags.
AUTOLIV IN NUMBERS
| OUR PRODUCTS SAVE | AIRBAGS | SEATBELTS | ||
| >30,000 | ~130 | ~140 | ||
| lives annually | Million units in 2014 | Million units in 2014 | ||
| PREVENT/REDUCE SEVERE INJURIES | FACILITIES | OPERATIONS IN | ||
| 300,000 | ~80 | 28 | ||
| annually | globally | countries | ||
| CRASH TEST TRACKS | ASSOCIATES | TECH CENTERS IN | ||
| 20 | >60,000 | 18 | ||
| worldwide | worldwide | locations | ||
Autoliv’s Targets
Autoliv’s long-term targets, updated in 2013, reflect the key performance measures through which we execute our key strategies. The targets cover the areas of sales growth, capital structure, sustainable margins and earnings growth. Discussions of the other important performance measures through which we manage and measure our performance, including quality, sourcing, productivity and sustainability, are found in other sections of this annual report.
Organic Sales
Grow at least in line with our market.
Definition on page 42 in the Annual Report.
(Non-U.S. GAAP measure).
In 2014, Autoliv’s organic sales grew by more than 6%, in line with our underlying automotive safety market. Sales growth was particularly strong in the rapidly growing active safety area and in China where organic sales growth was 45% and 8% respectively. Both Europe and Americas also reported solid growth of over 6%.
Leverage Ratio
Around 1 time within the range of 0.5 to 1.5 times. Definition on page 83 in the Annual Report.
(Non-U.S. GAAP measure)
In 2013, we revised our leverage ratio (see page 54 in the Annual Report) target to the level we deem most effective to handle the inherent risks and cyclicality of our business. Our target ratio is around one time, within a range of 0.5 to 1.5 times. By the end of 2014, Autoliv had net debt of $62 million. The leverage ratio was 0.3. In 2014, we repurchased shares for $616 million.
Operating Margin
8 – 9% over the business cycles
(Non-U.S. GAAP excluding antitrust matters)
In 2014, Autoliv achieved an adjusted operating margin according to our long-term targets, which includes capacity alignment, but excludes antitrust related costs, of 8.6%. The main positive factor affecting the operating margin was strong sales growth.
Earnings Per Share
Grow adjusted EPS faster than organic sales growth.
(Non-U.S. GAAP excluding antitrust matters).
This target was achieved in 2014 as adjusted EPS (excluding antitrust related costs) grew 9%, which was approximately 3 percentage points more than the organic sales increase. The target was reached mainly as a result of higher operating profit, lower tax expense, and fewer outstanding shares. These positive effects were partly offset by higher interest expense, net.
2014 in Summary
>6% organic sales growth1)
45% organic growth in active safety
$713m in operational cash flow
$453m of CAPEX, supporting growth
$811m in direct shareholder returns
37% market share in the global passive safety market
1) Non-U.S. GAAP measure, see page 42 in the Annual Report for reconciliation
Strong Sales Growth
In 2014, consolidated sales were $9,240 million with more than 6% organic sales growth, marking the fifth consecutive year of sales growth.
Dear Shareholder,
2014 was another year of solid and consistent execution of our core strategies. We exceeded our expectations from the beginning of the year and delivered solid growth and margins as well as record shareholder returns. Last but not least we estimate that our products saved more than 30,000 people’s lives.
Organic sales grew by over 6% in a year in which the global light vehicle production grew by just over 3%. This was the second consecutive year in which Autoliv outgrew the global light vehicle production two-to-one. Active safety had very strong growth of 45%, virtually reaching our 2015 sales target of $500 million one year ahead of the plan announced in late 2011. We returned a record $811 million to our shareholders through our regular quarterly dividends and share buybacks. Our common stock reached all-time high levels on both the New York Stock Exchange and the Swedish NASDAQ OMX. On an adjusted basis, we had record operating income and an adjusted operating margin of more than 9%.
The ability to show this type of steady performance in uncertain times is a result of the dedication, teamwork and commitment to quality shown by our 60,000 Autoliv associates. I would like to thank every member of our global team for the strong contributions to a successful year in the Company’s history.
QUALITY IS OUR FIRST PRIORITY
During 2014, quality has been more in focus than ever before in the automotive industry. A record number of recalls have led to a situation where the need for replacement parts has challenged the whole industry.
In one particular case there is a need to replace millions of airbag inflators from another manufacturer over the coming years. We are supporting the industry in this effort, increasing our capacity for airbag inflator production.
For Autoliv quality has always been our number one priority and we continue to sharpen our focus in this area. We are proud of our quality track record. With a 37% market share in passive safety we have been part of only about 2% of recalls related to our part of the market since 2010. This makes us number one in quality in our market, but we can always do more. For 2015, our particular quality focus is on zero defects, executing on the details that allow further steps in process and production excellence.
OUR GROWTH STRATEGY
Our organic growth in 2014 and the two previous years shows that our strategy of investing for growth is paying off.
China and active safety have been our growth engines in the previous three years. A specific characteristic for 2014 was the fact that growth did not only come from these areas. We also reported solid regional growth of over 6% for both Europe and the Americas. The ability to grow in a balanced way is a strength for the Company and a result of having one third of the Company’s sales in Europe, Asia and the Americas each. This is the effect of a long-term globalization strategy for Autoliv that historically had a strong home base in Europe.
In active safety, we have now grown by more than 40% for three consecutive years, outperforming the underlying market. We have communicated our intention to have $1 billion in active safety sales in 2019, indicating further growth in this area. The technological development in active safety will over the coming years lead to increased automation and ultimately at some point in the future, safety for autonomously driven cars. We intend to be one of the leaders of this development.
In 2014, we also increased our efforts in research and development, where for the first time spending passed the $0.5 billion mark. This is largely a reflection of the strategy to continue to further build our position and create new solutions in the area of active safety, but also of the clear ambition to continue to be the innovation leader in passive safety.
In passive safety, we also keep investing in production capacity for growth and vertical integration. We need to support the future growth of the Company while increasing the amount of vertical integration in China in particular. The Company’s two largest investments to date, the propellant plant and textile center in China, both started production in 2014 and will both gradually increase their output during 2015.
In China, we have over the last few years grown our market share for our core products to over 35%. Our current market position together with our continued investments gives us confidence in our long-term market leadership in the world’s number one car manufacturing country.
RECORD SHAREHOLDER RETURNS
In 2014, we took significant steps in the execution of the plan originally outlined in May 2013. During the year we repurchased 6.2 million of the Company’s own shares for a total of $616 million. In addition, we paid regular dividends of $195 million, an increase of 8% per share. In total this led to record direct shareholder returns of $811 million. These actions were also significant steps towards our target leverage ratio range of 0.5 to 1.5 times net debt including pension liabilities to EBITDA. By the end of 2014, we were at a leverage ratio of 0.3 times after having a net cash position in the period from 2011 to 2013. We continue to adjust toward our target range in order to achieve an effective capital structure, and we strive to deliver solid returns to our owners.
FOCUS ON EXECUTION
At the beginning of the year we labelled 2014 a transition year. This included executing to address margin challenges from operations, particularly in Europe and Brazil, continuing to align our capacity footprint according to the market and continued vertical integration activities in China.
I am pleased to say that, although there is more to be done, we have been able to address most areas of transition according to plan. The exception is Brazil, where rapidly declining light vehicle production in 2014 made operational improvements a challenge. During this transition year we also kept our operating margin above 9% on an adjusted basis while also increasing our R&D spending with more than $45 million.
For 2015, we expect operating margin to improve, while at the same time we are again able to increase R&D spending in order to support further growth and innovation.
In August 2014, we took the next step in the Company’s development by launching a new operating structure in order to more effectively manage our business operations. The new structure, which became fully operational on January 1, 2015, consists of two business segments: passive safety (including airbags and seatbelts) and electronics (including passive safety electronics and active safety). In addition to creating the right operational structure for the future, this change also reflects the increased importance of electronics for the Company’s future.
OUTLOOK FOR 2015
In 2015, global LVP is expected by the market institute IHS to grow by more than 2%.
The expectation for Autoliv’s full year is for organic sales growth of more than 6%, which would mark the third consecutive year of our organic sales growth being at least double that of the global LVP. Consolidated sales are expected to grow by less than 1% as effects from currency translations are expected to be negative by almost 6%. The expectation for the adjusted operating margin is around 9.5%, excluding costs for capacity alignments and antitrust matters.
We look forward to a year with quality as our number one priority, solid execution as our daily focus and the rapid development in active safety as our most exciting challenge.
Our future ambition is to save 150,000 people’s lives every year.
For us, it’s all about saving lives and creating value.
Yours sincerely,
Jan Carlson
Stockholm, February 19, 2015
For a discussion of the non-U.S. GAAP measure discussed above, see page 42 in the Annual Report.
How we do it
OUR VISION
To substantially reduce traffic accidents, fatalities and injuries.
OUR MISSION
To create, manufacture and sell state-of-the-art automotive safety systems.
OUR VALUES
Life
We have a passion for saving lives.
Customers
We are dedicated to providing satisfaction for our customers and value for the driving public.
Innovation
We are driven for innovation and continuous improvement.
Employees
We are committed to the development of our employees’ skills, knowledge and creative potential.
Ethics
We adhere to the highest level of ethical and social behavior.
Culture
We are founded on global thinking and local actions.
Our Strategies
With a passion for Saving Lives, we strive to create value in everything we do. We look at our Company in a number of different aspects in order to build a long-term, robust, sustainable operation. Our core strategies support our vision of saving more lives and to generate solid returns to our shareholders and act as a market leader.
Quality
As peoples’ lives depend on our safety products, quality is the base in all we do.
Our quality initiative Q5, aims to achieve zero defects in customer deliveries as well as eliminate our internal defects. The objective of our Q5 quality improvement program is to change our behaviors and to reset the quality mind-set that zero defects are achievable.
One Product – One Process
One Product – One Process (1P1P) is our strategy towards global standardization of products and processes for customer excellence, profitability and product robustness. The strategy aims at reducing production complexity by decreasing the number of variants and processes without losing customer focus.
Innovation
By boosting the innovative spirit among all employees, Autoliv will continue to be the undisputed leader in our industry. Autoliv’s innovation process aims to foster a culture of innovation and curiosity based on our long history of life saving products. Our innovation process is also about realizing larger as well as smaller ideas into improvements of existing products and processes.
Quality
Autoliv’s primary goal is to Save Lives. Our products never get a second chance. This is why we can never compromise on quality.
IN ADDITION TO OUR PRIMARY GOAL of Saving Lives, quality is key to our financial performance and future success. Quality excellence is critical for winning new orders, preventing recalls and maintaining low scrap rates. The unprecedented number of recalls during 2014 shows that our strategy of being the quality leader in all aspects of our business is the right and only choice.
This pursuit of excellence is a continuous improvement process, driven by our ability to anticipate and respond to the challenges of a rapidly changing automotive industry.
Related to the airbag inflator quality issues with another supplier, we now have agreements with several OEMs for new supply capacity. We see this as a vote of confidence from our customers for our quality track record.
Q5 – OUR ZERO DEFECT CULTURE
Although quality has always been paramount in the automotive industry, vehicle manufacturers and car buyers have become even more quality focused with no tolerance for deviations. As people’s lives depend on our safety products, we strive towards zero defects in all we do.
To continue to improve our own quality, we are running a program called “Q5” for shaping a proactive quality culture of zero defects. It is called “Q5” because it addresses quality in five dimensions: customers, products, suppliers, growth and behavior.
The goal of Q5 is to firmly tie together quality with value in all our processes and for all our employees, thereby leading to the best value for all our customers. It is our people that drive our Company’s success at all levels. By developing the right skills and abilities of our employees, we create a proactive culture that enables zero defects.
FLAWLESS PRODUCTS AND DELIVERIES
In our pursuit of excellence we have developed a chain of four “defense lines” against quality issues that consist of 1) robust product designs, 2) flawless components from internal and external suppliers, 3) manufacturing flawless products with a systems for verifying that our products conform with specifications and 4) an advanced traceability system in the event of a recall together with a “lessons learned” system to avoid any repeat of mistakes. These “defense lines”, in combination with our Q5 behaviors, should ensure deliveries of flawless products on-time to our customers.
When quality deviations occur, they very rarely affect the protection provided by our products. Most of the deviations are due to other requirements, such as flawless labeling, precise delivery of the right parts at the right moment, color and texture nuance on steering wheels as well as other products where the look and feel is important to the car buyer.
OUR QUALITY PERFORMANCE
We always challenge ourselves to achieve even better quality performance. In our product conformity verifications, we register all deviations of customer deliveries and include them in our quality measure – the number of non-conforming events. Thanks to our Q5 program, we have successfully reduced the number of non-conforming events since 2010 by 44% despite much higher sales volumes. The less favorable development in 2014, compared to previous years, is explained by a higher number of non-safety related events related to visual aspects of steering wheels.
To totally eliminate customer complaint, scrap and rework of our products we strive towards zero defects in our production. In 2014, we started to see some of our production lines achieving zero defects, showing that our zero defects philosophy is real and achievable. The organization is now focused on resolving the issues related to visual parts according to the zero defect philosophy.
SUPPLY BASE QUALITY IMPROVEMENTS
In our pursuit of zero defects, it is critical to prevent non-conforming components from entering our manufacturing plants. This is one of the most important “lines of defense” against quality issues.
With the Autoliv Sourcing and Purchasing Process (ASPP) we have a common method of interacting with our suppliers. It strengthens our performance by working closely together and sets clear targets. An important part of ASPP is the early involvement of suppliers in projects to ensure robust component designs and lowest cost for function.
All requirements, policies and procedures for the collaboration between us and our suppliers are specified in the Autoliv Supplier Manual (ASM). As part of the qualification of suppliers, they are required to sign and accept the ASM. The ASM has a strong focus on quality, ranging from the supplier pre-qualification requirements, to supplier development, component quality assurance and regular supplier status reviews. It also encourages suppliers to maintain continuous improvement programs.
Suppliers are trained to comply with the ASM and all suppliers are rated in terms of quality and delivery performance on a monthly basis. The focus on quality in managing our supply base is necessary not only to ensure flawless parts but also to improve efficiency and cost in our operations.
OUR CONTINUOUS PROACTIVE QUALITY WORK
1. PRODUCT AND PROCESS DEVELOPMENT
Autoliv’s Product Development System (APDS) ensures that all new products pass five mandatory checkpoints: 1) project planning, 2) concept definition, 3) product and process development, 4) product and process validation, and 5) product launch. In this way, we proactively prevent problems and ensure we deliver only the best designs to the market.
2. SUPPLIER MANAGEMENT
By involving and training our suppliers early in projects we ensure robust component designs and processes. This prevents non-conforming parts from being produced by our in-house and external suppliers and from reaching our manufacturing lines. We actively phase-out any supplier that does not adhere to our quality principles or strict business conduct and ethics rules.
3. PRODUCTION
Through the Autoliv Production System (APS), we all work according to the continuous improvement philosophy. Our associates are also trained to react to anomalies and to understand the critical connection between themselves and our lifesaving products. To prevent us from delivering non-conforming products we verify quality by using mistake-proofing methods such as Poka-Yoke, in-line inspections, and cameras and sensors.
4. AFTER DELIVERY
As we maintain an advanced product traceability system we are able to trace and limit batches of potentially defect parts in an effective way. We also maintain an effective change-management system as any change of a product or process can potentially create problems. Through lessons learned we can take advantage of experiences to make difference on future projects and help them to succeed.
One Product One Process
Through effective standardization we create customer and shareholder value. It is driven by total cost management in engineering, manufacturing and purchasing.
1P1P is Autoliv’s strategy towards global standardization of products and processes for customer excellence, profitability and product robustness:
| • | Profitability – Improve total cost by reduction of complexity; |
| • | Robustness – Prevent incidents by reduction of complexity and through global management of lessons learned and knowledge; |
| • | Customer excellence – Provide higher value for our customers. |
With 1P1P we manage standardization of both core products and customer specific features together with their production process without sacrificing customer expectations for product variations. The standardization is driven by a global cross functional team with the authority and responsibility to manage one or several product families. This also enables us to ensure that best practices, lessons learned and other product related knowledge is properly and efficiently applied into product and production for both existing products and new customer developments. The standardization decision is based on the total cost of the lifetime business case, which includes direct material, direct labor, engineering, process equipment, quality, investments, packaging, logistic costs, etc. The reduced complexity also allows us to optimize management of supply chain and logistics.
Besides translating Autoliv’s vision into reality, 1P1P supports our annual cost efficiency targets:
| • | Reduce direct material costs by at least 3%. |
| • | Improve labor productivity by at least 5%. |
| • | Consolidate the supply base by reducing the number of suppliers in order to optimize it in size, geography, service and knowledge. |
CONSOLIDATE THE SUPPLY BASE
We are continuously consolidating purchase volumes to fewer suppliers to help them reduce their prices to us. For instance, in 2014, we reduced the number of suppliers by nearly 5% after a 6% reduction in the prior year (see graph). The 2011 increase was due to acquisitions and the need to add new suppliers in Asia and other Low Cost Countries (LCC). We target to reduce the number of supplier groups to 1,000 by the end of 2016 from the peak of 1,600.
Thanks to the 1P1P strategy we can more efficiently focus on global components to gain leverage and optimize our footprint in order to improve quality, and reduce risk and cost.
REDUCE DIRECT MATERIAL COSTS
Approximately half of our revenues are spent on direct materials (DM) from external suppliers. The raw material content in these components costs currently represents 50% of the direct material cost, while the other 50% represents the value added by our supply base (for more details, see “Component Costs” on page 51 in this Annual Report).
Our strategy to mitigate higher commodity prices is to develop new more cost-efficient designs and components than the existing ones, for example, by replacing steel with reinforced plastics. This often reduces weight which is an important added advantage in the permanent pursuit for more fuel-efficient vehicles.
Through 1P1P we standardize products and components, and phase out older, more complex products with low volumes to help suppliers reduce their costs and, consequently, our prices.
By standardizing components, we also reduce complexity and gain leverage, thereby cutting costs. Through the above-mentioned strategies we have met our direct material cost reduction target of at least 3% every year, except in 2011 when steel prices in particular, sky-rocketed. In 2014, the estimated net savings for direct materials were 3.6%.
LABOR PRODUCTIVITY IMPROVEMENTS
The second most important type of cost is wages, salaries and other labor costs. In 2014, these costs corresponded to 22.4% of sales, which was a slight increase from 21.8% in 2010.
Despite higher vertical integration and R,D&E spending this ratio has remained virtually flat thanks to reduction achieved by continuous productivity improvements, restructuring of operations and by expansion as well as transfer of production and R,D&E to LCC.
We measure direct labor productivity improvements in LMPU (labor minutes per produced unit). This measure is often affected by shifts of production to LCC where typically more labor-intensive manufacturing processes are used (although the productivity in individual LCC may improve rapidly). Despite this, we have achieved LMPU reductions of approximately 6% every year during the last five-year period. Consequently, we managed to reach our productivity improvement target of at least 5% each year, despite erratic volumes in several regions.
Manufacturing in LCC could offer significant cost saving opportunities, since our average headcount cost in LCC is only 20% of the same cost in HCC for direct personnel. However, we already have over 80% of our direct workers in LCC, and the offsetting costs required for producing in one country and selling in another (such as freight and duty costs) should also be considered in addition to the labor cost difference. As a reflection of the mix in the expected LVP growth, we expect our headcount to continue to increase more in LCC than in HCC. By increasing our investments in vertical integration of strategic important components, particularly in LCC, we are also able to achieve long-term cost savings.
In addition, through automation and the introduction of new higher value-added products (for instance in active safety) we should continue to be competitive in HCC and support our customers with manufacturing close to their assembly plants in North America, Western Europe and Japan. Going forward we also foresee a higher degree of automation in LCC to compensate for increasing labor and component costs.
Innovations to Save Lives
Thanks to the innovative spirit among all our employees, Autoliv continues to be the undisputed leader in our industry. Today, Autoliv has 5,500 people, or 9% of all its associates, engaged in Research, Development and Engineering (R,D&E).
SAFETY is one of the strongest sales drivers for new cars. In virtually all inquiries about what consumers want in their next vehicle, new safety products rank very high or at the top of their list of priorities.
Autoliv assists vehicle manufacturers in meeting these evolving safety trends by staying at the forefront of technology, crash-testing more vehicles than any other safety company and working as a development partner for new vehicles.
We have 5,500 people in Research, Development and Application Engineering (R,D&E), an increase of close to 500 compared to 2013. The increase is mainly related to active safety engineering to support continued growth and to develop new life saving products.
In support of our strategy of being a leader in active safety, leading into autonomous driving, we will further increase our investments in research and development of electronics. Later in 2015 we will launch our first mono and stereo vision cameras utilizing our internally developed algorithms. We will also launch our new 77GHz radar and our next generation Safety Domain Controller which will host the sensor fusion data used for vehicle control. These are examples that we are making good progress with our RD&E investments for growth.
Research (R) is conducted at our Swedish Safety Center. We also provide funding for a number of scientists at universities and independent research institutes to work on special projects. We use accident databases (such as NASS-CDS in the U.S., as well as GIDAS in Europe and CIDAS in China) to identify the types of traffic accidents and injuries to which we might apply Autoliv’s safety expertise. We also draw on our crash tests and trials, as well as on the vast expertise our specialists have gathered over many years.
Corporate passive safety development projects (D) are assigned to our leading tech centers in China, France, Germany, Japan, South Korea, Sweden and the United States.
For electronics and active safety development projects, we have technical centers in the U.S., Sweden, France, Germany, Romania and Japan.
Application engineering projects are completed in our tech centers in close cooperation with the manufacturing units.
In total, Autoliv currently has thousands of R,D&E projects with the vast majority of the projects (and the associated costs) in application engineering to support the development of new vehicle models. No single customer project accounts for more than 2% of Autoliv’s total R,D&E spending.
BOOSTING INNOVATIONS
We have developed a program to drive and capture the innovative spirit among all employees. The program does not only focus on new products but more on capturing “small” innovations from the people most familiar with the company’s products and processes.
INVESTMENTS
During 2014, we increased R,D&E expenses, net by $46 million, mainly to increase our engineering capability in Asia and to further accelerate our efforts in active safety, thereby reinforcing our long-term commitment to innovation and technology.
Gross expenditures for R,D&E amounted to $682 million in 2014, compared to $634 million in 2013, which corresponded to 7.4% of sales in 2014 and 7.2% in 2013.
Of these amounts, $147 million in 2014 and $145 million in 2013 related to engineering projects and crash tests that were paid by vehicle manufacturers, safety authorities, auto magazines and other external customers.
Net of this income, R,D&E expenditures amounted to $536 million in 2014 and $489 million in 2013, or 5.8% and 5.6% of sales.
Of the gross R,D&E expense in 2014, 77% was for projects and programs for which we have customer orders, typically related to vehicle models in development. The remaining 23% was not only for completely new innovations but also for improvements of existing products, standardization and cost reduction projects.
PATENTS
Our commitment to technological leadership is evidenced by our strong patent position.
In 2012, (the latest year with official statistics) Autoliv accounted for 3% of all new patent filings in passive automotive safety filed in more than one country. Autoliv holds more than 6,600 patents covering a wide range of innovations and products in automotive safety and key supporting technologies.
TO BOOST INNOVATION, WE NEED TO:
LOOK AHEAD
Plan the destination, route and check conditions ahead.
MEANING:
Best available knowledge of our market: consumer behavior, accident research, trends, customer needs, competitor actions, new legislation, infrastructure development.
FUEL OUR CAR
Make sure we never run out of high quality fuel.
MEANING:
Drive a constant flow of the right new ideas, bred by our curiosity, proactive mindset, go & see spirit, and a good business sense.
DRIVE OUR CAR
Use the capabilities of our car to get us to our destination.
MEANING:
Deliver the potential of the ideas through our development processes. Continuously improve methods based on what we’ve learned and market needs.
ADAPT OUR DRIVING
Strengthen our ability get to the right destination safely and efficiently.
MEANING:
Ensure fast and accurate feedback that helps us manage and refine our innovation activities toward the right opportunities.
The Road to Saving More Lives
PROTECTION
Passive safety products, such as airbags and seatbelts, are there to help protect you from injury if a crash is unavoidable. More than a million human beings owe their life to them.
PREVENTION
The major advancement from active safety systems is to reduce the crash severity and avoid the crash altogether by warning the driver or automatically braking the car.
AUTOMATION
Allowing the car to respond automatically is crucial when moving towards our vision of saving 150,000 lives per year.
AUTONOMOUS DRIVING
In the future, self driving cars will ultimately provide the third level of automotive safety, significantly reducing the element of human error.
Active Safety for Prevention and Assistance
Our active safety systems are designed to intervene before a crash by adjusting engine output, steering and braking. These systems can create a “Virtual Crash Zone” using our radar and vision technologies to monitor the environment around the vehicle. In addition, these technologies make driving easier and more comfortable.
Thanks to passive safety systems such as seatbelts and airbags, vehicle safety has substantially improved. Although these systems are effective in mitigating the human consequences of an accident, they can never prevent the accident from occurring.
With the introduction of active safety systems, many accidents and collisions will become avoidable or at least less severe by reducing the speed of impact. This will also result in significant improvements in the protection provided by the passive safety system.
NIGHT DRIVING ASSIST
The night driving assist displays an image of the road scene ahead to make night-driving easier and safer. The image generated in the heat-sensing device is processed using different filters to obtain a black and white image with sharp light or dark outlines, in which shapes are easily detected. The system also analyzes the scene content with respect to the motion of the vehicle to determine if a pedestrian or an object is at risk of being hit by the vehicle. It can detect pedestrians and animals up to two times further away than the typical headlight range and, if a threat exists, the driver is warned. The latest generation of our night vision, called Dynamic Spot Light, has a revolutionary function that selectively illuminates pedestrians and animals with a separate marking headlight.
RADAR SYSTEMS
Short and medium range radar system provides all-weather object detection and can be used effectively in all directions around the vehicle. By scanning up to 30 meters, the system can provide an advanced warning of an imminent collision. The radar is also used for detecting objects in the blind spots of a vehicle and to control stop-and-go functions in queue assist systems. Our long range radars are utilized for adaptive cruise control systems (ACC) that automatically adjusts the vehicle speed to maintain a safe distance to vehicles ahead.
Autoliv’s radar product portfolio includes 25GHz ultra wide band, 24GHz narrow band and 77GHz multi-mode sensors that cover a broad range of market applications. The 77GHz radar will launch at the of 2015.
VISION SYSTEMS
Autoliv’s pioneering work with camera-based vision systems gives the driver, in effect, an additional pair of eyes scanning the road ahead for danger. The camera gathers a richer amount of data that requires substantial computer power and sophisticated software to be interpreting and used for advanced driver assistance systems (ADAS). The advanced algorithms enable the camera to recognize and track visible objects such as vehicles, speed signs and lane markings. They can also warn the driver when the car is in danger of colliding with pedestrians, other vehicles or straying out of lane.
Autoliv has developed two forward-looking vision technologies; mono vision and stereo vision systems. The stereo vision system provides more information about the surrounding environment which offers increased functionality and a higher level of detection, robustness and accuracy for object detection compared to mono vision systems. The performance of vision systems is reduced by poor weather and darkness. Therefore, some car manufacturers choose to combine cameras with radars to achieve all-weather capability.
To provide a free view, the camera is typically located at the upper edge of the wind shield.
ACTIVE SEATBELTS
An active seatbelt has an electrically driven pretensioner that tightens the belt as a precaution in hazardous situations. The belt system then releases some webbing if the driver manages to avoid the traffic hazard.
This function also warns the driver by letting the pretensioner vibrate the seatbelt webbing.
This technology also offers improved comfort to the occupants while using the seatbelt.
BRAKE CONTROL/ESC
Autoliv has developed the world’s first Integrated Inertial Measurement Unit that combines the controls of the vehicle’s restraint system with those controls for the vehicle’s brakes that can provide Electronic Stability Control (ESC), Anti-locking Brakes (ABS) and Automatic Traction Control (ATC). This merger of the control systems, that was first launched in 2014, provides significant savings and enhanced performance.
ACTIVE AND PASSIVE SAFETY INTEGRATION
To monitor the environment around the vehicle and control the vehicle motion, Autoliv is developing the next generation of electronic integration.
This Electronic Safety Domain Controller (ESDC) links all safety sensors (including the environmental sensor) and all actuators that control vehicle motion (brakes, steering, and engine/transmission) as well as the passive safety system. Autoliv will launch its first ESDC at the end of 2015.
EXAMPLES OF ACTIVE SAFETY FEATURES
Autonomous Emergency Braking (Radar or Vision)
Continuously monitors the area in front of the vehicle to detect slow moving vehicles and other objects.
Function: Alerts the driver, tightens the active seatbelt, puts the brakes in an alert mode and applies the brakes autonomously.
Traffic Sign Recognition (Vision)
The system keeps the driver informed of the speed limit and other traffic signs on the road.
Function: A symbol is displayed in the instrument cluster or on the Head-up Display (on the inside of the vehicle’s windshield) showing the current speed limit or other important road signs.
High/Low Beam Assist (Vision)
The system identifies on-coming vehicles and determines when the head lights need to be dipped in order not to blind the on-coming driver.
Function: Automatically switches between high and low beams.
Blind Spot Detection (Radar)
Monitors the presence, direction and velocity of vehicles in adjacent lanes.
Function: Alerts the driver by lighting a warning indicator on the appropriate side.
Road/Lane Departure Assist (Vision)
Monitors the lane markings on the road and checks that the vehicle stays within its lane to avoid dangerous situations.
Function: Alerts the driver with acoustical or haptic warnings and/or a symbol on the head-up display.
Queue Assist (Radar or Vision)
In slow-moving traffic and congestion it makes driving easy and comfortable.
Function: Maintains a set speed/distance to a vehicle ahead down to a standstill.
Pedestrian Detection/Warning (Vision)
Detects pedestrians who might be about to step into the road.
Function: Warns the driver or even autonomously brakes the vehicle.
Adaptive Cruise Control (Radar)
Automatically adjusts the vehicle speed to maintain a safe distance from vehicles ahead.
Function: Maintains a set speed/distance to a vehicle ahead.
Cross-Traffic Assist (Radar)
Helps detect cross traffic when reversing out of a parking space.
Function: Acoustic alert.
Passive Safety for Protection
Autoliv has accounted for virtually all major technological breakthroughs within passive safety over the last 60 years.
SEATBELT SYSTEMS
Modern seatbelts can reduce the overall risk of serious injuries in frontal crashes by as much as 60% thanks to advanced seatbelt technologies such as pretensioners and load limiters.
Retractor and buckle pretensioners tighten the belt at the onset of a frontal crash, using a small pyrotechnic charge. Slack is eliminated and the occupant is restrained as early as possible, thereby reducing the risk of rib fractures.
Lap pretensioners further tighten the webbing to avoid sliding under the belt which improves lower-leg protection and prevents abdominal injuries from a loose belt. In an accident, load limiters release some webbing in a controlled way to avoid the load on the occupant’s chest from becoming too high. When used in combination, pretensioners, load limiters, lap pretensioners and frontal airbags, have a 75% reduction of the risk of life-threatening head or chest injuries in frontal crashes.
Supplemental belts prevent occupants from sliding out of the “open side” of the regular 3-point belt in roll overs and far-side collisions.
AIRBAGS AND STEERING WHEELS
Driver and the passenger airbags deploy in 50 milliseconds, half the time of the “blink of an eye”, and can be “smart”, i.e. the power of the airbags can be tuned to the severity of the crash and the size of the occupant, using adaptive output airbag inflators. The driver airbag reduces fatalities in frontal crashes by approximately 25% (for belted drivers) and reduces serious head injuries by over 60%. The airbag for the front-seat passenger reduces fatalities in frontal crashes by approximately 20% (for belted occupants).
Side curtain airbags reduce the risk of life-threatening head injuries in side impacts by approximately 50% for occupants who are sitting on the side of the vehicle that is struck. Curtain airbags cover the whole upper side of the vehicle.
Single-chamber side airbags reduce the risk for chest injuries by approximately 25%. With dual-chamber side airbags, both the pelvis and the chest areas are protected which further reduces the risk of serious injuries in side-impact crashes.
Rear side airbags reduce injuries for rear occupants.
Knee airbags significantly reduce the risk of injuries to the knee, thigh and hip. These injuries today represent 23% of the active-life years lost to injury in frontal crashes involving motor vehicles.
Anti-sliding airbags are installed in the seat cushion. In a crash, the airbag raises the front end of the seat cushion to prevent the occupant from sliding under the seatbelt. This reduces significantly the risk for knee, thigh, and hip injuries for belted occupants. In addition, by keeping the occupant in an upright position, the protection from the frontal airbag becomes more efficient.
Steering wheels offer a variety of control switches and different designs. Some of our steering wheels have an integrated electrical motor that can vibrate the steering wheel, thereby alerting the driver of a dangerous situation. To improve comfort in cold climate, the steering wheel can have a heated rim.
Far-side airbags that inflate between the seats can significantly reduce injuries by preventing the occupants to move sideways. Studies have shown that 30% of all serious injuries in side-impact collisions are related to the far-side occupant hitting the other occupant or hard objects.
Bag-in-belt is a combination of a seatbelt and an airbag to further reduce the load on the occupant’s rib cage in a frontal collision.
CRASH ELECTRONICS
The ECU (Electronic Control Unit) is the “brain” of the car’s safety system. It decides not only if, but also exactly when, the seatbelt pretensioners should be triggered and each airbag system should be deployed. The ECU contains crash sensors and a microprocessor, as well as back-up electricity in the event the connection to the car battery is cut off in the crash. The ECU is located in the middle of the vehicle where it is well protected during a crash. Autoliv’s latest ECU also contains sensors for the Electronic Stability Control System (see “Brake Control/ESC” on the previous page).
Satellite sensors are mounted in the door beam, the pillar between the doors, the rocker panel, and/or in various locations at the front of the vehicle, to quickly provide the ECU with acceleration data to enable appropriate deployment of the airbags and seatbelt pretensioners.
ANTI-WHIPLASH
Anti-whiplash systems are based on a yieldable backrest that tilts in a controlled way in a rear-end collision, thereby reducing the risk for neck injuries.
BATTERY DISCONNECT SAFETY SWITCH
The Pyrotechnic Safety Switch utilizes a pyrotechnic initiator to cut the electrical power to a designated portion of the vehicle in a crash. This minimizes the potential for a fire in a crash. It is especially important in electrical vehicles to automatically and safely cut-off the connection to the electrical power.
PEDESTRIAN PROTECTION
To protect the head, the hood needs to be able to act as a cushion. This can be achieved by using pyrotechnic hood-lifters that raise the rear end of the hood to create clearance above the rigid engine structure beneath. However, in many smaller vehicles, the hood is too short, and the head of a pedestrian will most likely hit the hard area between the hood and the windscreen or one of the windshield pillars. In this case an outside pedestrian protection airbag can be used to create a cushion effect.
Pedestrian protection systems are deployed either by contact sensors in the bumper or by an active safety system. The latter system has the advantage of being able to brake the car, thereby reducing the speed and the severity of impact.
The World’s First Full- scale Test Environment for Future Road Safety
AstaZero’s test environments comprise a 5.7 kilometer rural road lane, a City Area with four districts of buildings and streets, a Multilane Road for multi-lane traffic and a High Speed Area for high speed tests. What is unique about the facility is that the different traffic environments make it possible to test advanced safety systems and their functions for all kinds of traffic and driving situations. It is also unique in its simulation possibilities for increasing safety for pedestrians, cyclists and other vulnerable road users. Autoliv has partnered with Volvo AB, Volvo Car Corporation, Scania, as well as several Swedish institutions to create AstaZero. AstaZero is short for Active Safety Test Area Zero, where “zero” is the Swedish government’s stated vision of zero traffic fatalities.
A Passion for Saving Lives
Dr. Katarina Bohman, Principal Research Engineer at Autoliv. To prevent fatalities and severe injuries for rear seat passengers, we are developing robust restraint systems that address real life situations including pre-crash maneuvers as well as the sitting postures of young and small rear seated occupants, who does not always sit like crash dummies. Our development is based on research of all injuries, also minor, and injuries resulting in long-term consequences.
An Additional Pair of Eyes
Technology that makes a difference for life.
At Autoliv, it’s not enough to help people survive a collision – we want to help them avoid accidents altogether. This means taking action before accidents occur. Future automotive safety technology will need to recognize potentially dangerous situations before they happen, and then react quickly and intelligently.
We have developed our radar and vision technology to make driving easier and safer by monitoring the environment around the vehicle, giving our active safety systems a chance to adjust engine output, steering or braking to avoid a crash even if the driver is not observant or attentive.
Autonomous Emergency Braking (AEB) will provide great advancement in road safety and we certainly believe this is one of the future technologies that will make a significant difference. The AEB can be based on radar, lidar or vision sensors, or a combination of them. Various AEB systems have been on the market for a couple of years, though mainly on high end luxury models as optional equipment. Real world performance data suggests that such crash avoidance systems can reduce accidents by up to 27% and can lead to a significant reduction in injuries. Therefore, regulation bodies and crash rating institutes are starting to encourage the installation of AEB systems and other active safety products in more vehicles. One example is Euro NCAP that has included AEB for city and Inter-Urban driving into their crash rating of new vehicles. In 2016, Euro NCAP will make Pedestrian-AEB part of its test protocol and intends to include Cyclist-AEB systems beginning in 2018.
AEB systems, which provide protection in all types of weather and light conditions for vehicle occupant, pedestrians as well as cyclist, will be a key enabler for the self-driving car. Estimate shows that over 90% of all car accidents are caused by human error. By using our sensor as another set of eyes autonomous driving cars have great potential to prevent these accidents by eliminating the role of human error in driving.
People Drive Success
Our people are the foundation of our success. To attract, develop and retain highly skilled people is a top priority for Autoliv. With motivated and talented people, we drive success at all levels.
Autoliv provides an international environment with varied work assignments and career opportunities and a culture that supports creativity, entrepreneurial behavior and result oriented actions. By boosting the innovative spirit among all employees, Autoliv will continue to be the undisputed safety system provider. Ideas and initiatives from our personnel are key elements of our continuous improvement work. The number of suggestions per associate is one of our key performance indicators. During 2014, we implemented more than 880,000 suggestions, which is a significant increase compared to 2013.
Autoliv is committed to creating a positive and diverse work environment. We do not tolerate any form of discrimination or harassment in our workplace. Our people are entrusted with ensuring that their actions reflect responsible business practices and support the ethical standards of the Company. We seek the highest quality, safety and performance at all times and strive for a Company culture that exemplifies these principles. Autoliv’s Quality Culture Survey measures a broad range of aspects that encompass our Company culture and work environment. The survey results in a number of improvement actions with appointed project owners and the Executive Management Team monitors the progress.
A NEW OPERATING STRUCTURE
In 2014, Autoliv announced a new operating structure to become one global and greater Company saving more lives. It will continue to build on our strengths; being a world leader in quality and innovation with customer focus and strong local presence. The new structure includes two business segments: Passive Safety and Electronics, and two functional units: Sales & Engineering and Product & Process Development.
The organization has more than 60,000 associates in total. We have close to 5,500 of our people working in Research, Development and Application Engineering. During 2014, 72% of the associates were direct workers in manufacturing, 74% were in Growth Markets and 15% were temporary personnel. The majority of the increase in personnel derived from employments in Growth Markets to fuel the expansion in the business.
At the end of 2014, 54% of Autoliv’s total workforce were men and 46% were women and 14% of senior management positions were held by women. We are committed to ensure a diverse working environment in our Company. This is one of the focus areas in our talent management work.
INVESTING IN PEOPLE
The development of future leaders and other key personnel is a top priority for Autoliv. We have a talent management process to identify and develop employees to meet long-term business requirements. Our approach allows us to support the business strategy and reduce risk, provide targeted career and development opportunities for employees, improve organizational capabilities and foster a culture of people development. Autoliv is committed to connecting talent management and succession planning processes to employee development activities to make sure that we focus on optimizing the allocation of resources in the best possible way for the business.
Our learning and development efforts focus on ensuring that we have the right people with the right set of skills ready for the right jobs. Building key skills and competencies is a priority through a combination of local and global programs.
The Performance & Development Dialogue, the PDD, is the platform for individual discussions on performance and competence needs, where employees and managers identify and agree on individual targets, development plans and activities. During 2014, 90% (97%) of targeted employees had conducted a PDD with their managers. Internal recruitment is a part of our culture that enables us to benefit from internal experience and provide development opportunities for the individual. Our global footprint supports international openings and challenges.
Autoliv has a strong and long tradition of providing opportunities for employees to work in other countries. We encourage job rotation and mobility across functions, facilities and regions. This practice not only increases the employees’ understanding of how to conduct business in cultures different from their own but also strengthens our leadership skills, global networks and overall knowledge sharing. In 2014, 149 employees worked on international assignments in 19 countries.
HEALTH & SAFETY
In both the marketplace and the workplace, safety is more than an element of our business – it is our business. We will continually strive to protect human health, safety and company assets while maintaining compliance with all applicable regulatory requirements. In 2014, we reinforced our commitment to Health & Safety with the introduction of a global Health & Safety Management System.
| NO. OF ASSOCIATES PER REGION |
||||
| Asia |
16,610 | |||
| Americas |
18,931 | |||
| Europe (incl. Africa, Russia & Turkey) |
24,475 | |||
|
|
|
|||
| Total |
60,016 | |||
|
|
|
|||
Anna Jacobsson,
Test Manager at Autoliv
Electronics in Linköping.
“At Autoliv Electronics, we develop the next generation of products for active safety. Our solutions contribute to making roads safer and saving lives. As a test manager, I verify that our products meet our customer requirements and high quality standards. At Autoliv, I do have a meaningful work with many development opportunities and great colleagues around the world.”
Superior Global Presence
With operations in 28 countries and one of the broadest customer bases of any automotive supplier, Autoliv has the best global footprint in its industry.
Europe 33% of sales, Americas 34% of sales, Japan 7% of sales, China 16% of sales and Rest of Asia 10% of sales.
Locations and Capabilities
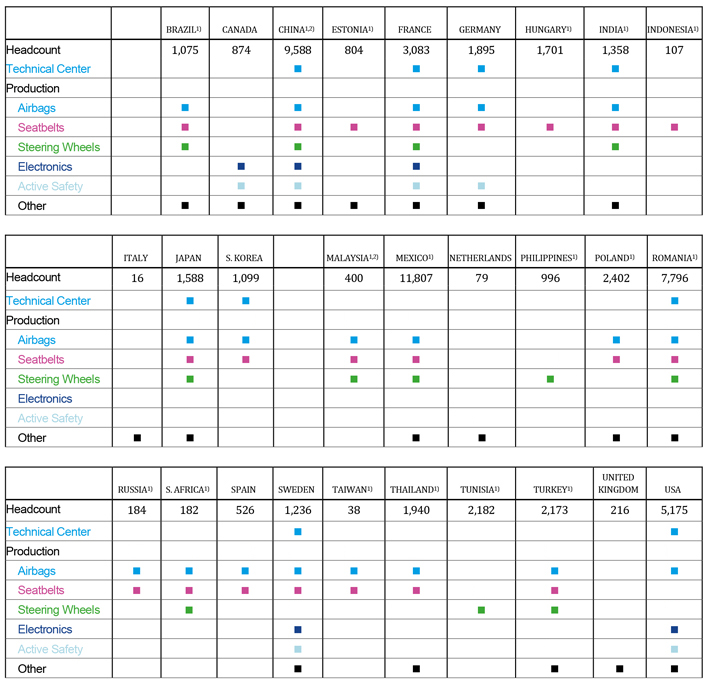
1) Defined as Low Cost Country. 2) Includes headcount in joint ventures.
Our Market and Competitors
Autoliv’s market is expected to grow with a CAGR of around 5% over the next three years.
OUR MARKET is driven by two primary factors: light vehicle production (LVP) and content per vehicle (CPV).
The first growth driver, LVP, has increased at an average annual growth rate of around 3.6% over the past decade despite the cyclical nature of the automotive industry. Over the next five years, LVP is expected to continue to grow to 99 million light vehicles in 2019 from approximately 86 million in 2014, according to IHS. Almost all of this expansion will be in the “Growth Markets”, predominantly China, India, Thailand as well as Indonesia.
Unlike LVP, where Autoliv can target to be on the best-selling platforms, Autoliv can influence the other growth driver of our market, CPV, by continuously developing and introducing new technologies with higher value-added features. Over the long-term, this increases the average safety content per vehicle and has caused the automotive safety market to grow faster than the LVP. A steady flow of new technologies to the market has also enabled Autoliv to outpace the market and increase its market share. For instance, since the start of Autoliv, Inc. in 1997, the Company’s sales have increased at a CAGR of more than 7% compared to 5% for the market of which LVP was 3%.
Historically, the CPV has been driven by passive safety (mainly seatbelt, airbag and steering wheel products) in the developed markets of Western Europe, North America and Japan. Looking ahead, the CPV in these regions will primarily be driven by active safety systems while new passive safety systems such as knee airbags, far-side impact airbags and improved protection for pedestrians and rear-seat occupants are expected to have a modest effect. However, in the Growth Markets, passive safety systems are likely to still be the dominant growth driver for CPV for the next several years. The average CPV in the Growth Markets is slightly more than $200, which is roughly one half of the average in the Developed Markets, which remains close to $400.
Several significant trends will continue to positively influence the overall safety content per vehicle. These include:
1) Evolution of collision avoidance technologies to reduce the enormous cost of traffic accidents and fatalities on the roads, with an industry direction to achieve automated driving and ultimately reaching some form of autonomous driving,
2) Traffic fatalities as a cause of death will almost double to 2.4 million people by 2030, according to the World Health Organization (WHO),
3) Demographic trends of increased safety conscious consumers, aging driver population and higher LVP in the Growth Markets,
4) Government regulations and test rating systems to improve the safety of vehicles in the various markets, for instance the new Euro- NCAP, and
5) Trends toward lighter and alternative fuel vehicles.
MARKET GROWTH BY REGION
Our core global addressable market of passive and active safety, including steering wheels, grew by around 6% to a new record of $25 billion in 2014. This was mostly due to record-high LVP. The other main reasons were above average LVP growth in the developed markets, with high CPV vehicles, and a slightly higher CPV in China.
From 2014 to 2017, LVP is expected to increase with an average growth rate of slightly more than 3% according to IHS. The growth is predominantly expected to come in the Growth Markets where it takes two vehicles to equal the same resulting sales as from one vehicle in the Developed Markets.
Despite this negative CPV mix effect, our core addressable market is expected to grow at a CAGR of approximately 5% over the next three years to about $29 billion, based on the current macro-economic outlook and business awarded.
Most of the increase from $25 billion to $29 billion will be in the Growth Markets, which are expected to increase at a 9% CAGR to $12 billion. This strong growth will be mitigated by an expected decline of the Japanese market of almost 1% per year. This expected geographical mix will result in a favorable effect for Autoliv since our market share in the Growth Markets is roughly one third and increasing, while our market share in Japan is approximately 20%. Looking to the remainder of the Developed Markets, the Western European market is expected to see strong growth of around 7% per year mainly due the rapid development of the active safety market. However, the growth in North America is expected to be more moderate or around 2% per year.
MARKET GROWTH BY PRODUCT
The passive safety market, excluding passive electronics, is expected to grow at a CAGR of a little more than 3% over the next three years with the highest growth rate expected in seatbelts.
This product line is expected to grow at a CAGR of 4% or by $0.9 billion to $7.6 billion. In seatbelts, Autoliv has reached a global market share of approximately 40%, primarily due to being the technology leader with several important innovations such as pretensioners and load limiters. Our strong market position is also a reflection of our superior global footprint. Seatbelts are the primary life-saving safety product and are also an important requirement in low-end vehicles for the Growth Markets. This provides us with an excellent opportunity to benefit from the expected growth in this segment of the market.
The market for airbags, where Autoliv has a market share of around 39%, is expected to grow at an annual rate of 2% to $11 billion. The lower growth rate than seatbelts is related to the dilutive effect from new low-end vehicles in the Growth Markets, with relatively low installation rates for airbags.
Our steering wheel market is expected to increase by roughly 4%, to $3.0 billion in 2017, which is approximately 1 percentage point higher than the underlying LVP. This growth is a result of the trend towards higher-value steering wheels with leather and additional features.
The passive safety electronics market is expected to grow by 4% annually. Our market share in passive safety electronics has more than doubled over the last decade to around 22%. Our latest electronic control unit (ECU) for airbags is very competitive as it integrates active and passive safety (see page 21 in the Annual Report).
Our newest core market, active safety (radar, night vision and front-view cameras), is expected to grow at a rate of 26%, essentially doubling in size to $3.9 billion by 2017. Through acquisitions and technology partnerships with our customers, Autoliv holds a leading market position in our active safety market with a share of 20-25%.
In addition to our core addressable in active safety market, brake controls, rear-view and surround-view cameras could potentially add $13 billion to today’s $2.0 billion active safety market. Autoliv entered the brake control market with a new product offering, the Safety Domain Controller during the first quarter of 2014 and will launch a second contract during 2015.
In summary, the winners in the automotive safety market during the next several years are likely to be companies that have built a strong position in active safety along with a strong position in the Growth Markets, which is in line with Autoliv’s strategy.
OUR COMPETITORS
In passive safety, Autoliv’s major competitors are Takata and TRW, where we estimate that they account for roughly one fifth and one sixth of the market, respectively, while Autoliv leads the market with an approximate share of 37%.
Takata is a family-controlled Japanese company with its shares listed on the Tokyo Stock Exchange. They have their strongest market positions in Japan and North America. During the past years Takata has experienced severe issues related to malfunctioning airbag inflators which is expected to lead to significant costs for them. TRW is currently a U.S. listed company on the New York Stock Exchange, with strong market positions in Europe and North America. During 2014, German private company ZF announced plans to acquire TRW. This transaction is expected to be completed during the first quarter in 2015 when TRW currently plan to be delisted from the stock exchanges.
In Japan, South Korea and China there are a number of local manufacturers that have close ties with the domestic vehicle manufacturers. For instance, Toyota has the “keiretsu” (in-house) suppliers Tokai Rika for seatbelts, Denso for electronics and Toyoda Gosei for airbags and steering wheels. These suppliers generally receive the majority of the Toyota business in Japan for these products, as does Mobis, a major supplier to Hyundai-Kia, in South Korea.
Other passive safety system competitors include Chinese private equity owned KSS, Nihon Plast and Ashimori of Japan, Jinheng of China, Samsong in South Korea and Chris in South America. Collectively, these competitors account for the majority of the remaining 18% global market share in passive safety.
The active safety market remains relatively fragmented with more, larger competitors than in the passive safety market and includes Continental, Bosch, Delphi, Valeo, Gentex, Magna, Hella, TRW, Denso and Panasonic, of which we believe Continental has a strong position today. In algorithms for vision systems, Mobileye currently has a dominant market position. They are both a supplier and a competitor to Autoliv at present. Continental, Bosch and Denso are also major competitors in passive safety electronics.
Our Customers
Due to our technological leadership and superior global footprint, our diversified customer base includes virtually every vehicle manufacturer in the world. This has also allowed us to gain market share with growing customers.
In 2014, OUR TOP FIVE CUSTOMERS represented 52% of sales and the ten largest represented 82%. This reflects the concentration in the automotive industry. The five largest vehicle manufacturers (OEMs) in 2014 accounted for 54% of global light vehicle production (LVP) and the ten largest for 79%.
GM, RENAULT/NISSAN, FORD
General Motors is our largest customer, accounting for 14% of our sales in 2014, while Renault/Nissan and Ford each accounted for 11%. This concentration is partly due to historical relationships since we have cooperated with these OEMs for many years. Autoliv’s strong global presence and our broad product offering also fits these global OEMs very well. Additionally, we have previously acquired assets from Delphi and Visteon, which are spin-offs from GM and Ford, respectively. Autoliv has historically also benefited from the global sourcing initiatives of these customers.
VOLKSWAGEN, TOYOTA
In relation to their share of the global LVP, Autoliv is “under-represented” with Volkswagen and Toyota. In 2014, Volkswagen and Toyota accounted for 12% of the global LVP each, while they accounted for roughly 8% and 5% of our sales, respectively. Historically, TRW has had close relationships with Volkswagen and previously acquired companies that had close ties to Volkswagen. Similarly, Toyota has in-house (“keiretsu”) suppliers like Toyoda Gosei, Tokai Rika and Denso who generally are awarded at least 50% of Toyota’s safety business.
BMW, DAIMLER, VOLVO
BMW, Daimler and Volvo accounted for 14% of our sales combined in 2014, despite the fact that they only accounted for 5% of global LVP. Our relatively high dependence on premium brand OEMs reflects the higher safety content in their vehicles. It is also due to their strong pursuit of new safety innovations to differentiate their new vehicle models, along with Autoliv’s well-established position of being the technology leader in the automotive safety industry.
HYUNDAI/KIA, HONDA
Hyundai/Kia (HKMC) has been one of our fastest growing customers over the last decade. HKMC now represented 9% of our sales versus 4% ten years ago. Our business with Honda has also grown significantly over the last ten years and accounted for 5% of our sales in 2014.
The reason for this strong growth is a combination of the success of these customers in the global LVP market and our long-term investments in their home markets, South Korea and Japan.
FIAT/CHRYSLER, PSA
Chrysler is an important customer for both our active and passive safety systems. At Fiat we have historical been under-represented, however the situation has improved in the last years.
Our dependence on PSA has declined, both as a reflection of our lower market share with them and their lower share of the global LVP market.
CHINESE LOCAL OEMs
Domestic Chinese manufacturers account for approximately 40% of the Chinese LVP, while the global manufacturers make up the rest.
The domestic OEMs’ share of Autoliv’s sales have grown rapidly from almost zero, five years ago, to close to 3% globally, or to 16% in China. Great Wall Motors is our largest domestic customer in China. The local Chinese manufactured cars have a lower than average CPV, explaining the high share of LVP compared to the lower share of our sales. With our strong position with these customers, and an increasing awareness of automotive safety in China, we see great opportunities for growth.
CUSTOMER SALES TRENDS
Asian vehicle producers have steadily become increasingly important to Autoliv, now representing 37% of global sales compared to 24% ten years ago (see graph). Of the Asian OEMs the Japanese today represent 23% of our sales compared to 19% in 2004. This reflects both their increasing share of the global LVP and our increasing share with them.
The D3 (General Motors, Ford and Chrysler) now accounts for 27% of our global sales after a temporary decline to 19% in 2008-2009. This swing primarily reflects their “comeback” after the financial crisis and our acquisition of the Delphi global occupant safety business in 2009-2010.
Our high dependence on European & Other customers has decreased significantly; from around 52% of sales in 2004 to 36% in 2014.
Significant Launches in 2014
Below are the most significant model launches for us by our customers in 2014. A delivery contract is typically for the lifetime of a vehicle model, which is normally between 5 and 7 years.
Our largest customer contract accounts for less than 4% of our sales.
Chrysler 200C: Driver airbag, side airbags, inflatable curtains, seatbelts with pretensioners and radar system.
Baojun 730: Driver airbag with steering wheel, passenger airbag, safety electronics and seatbelts with pretensioners.
Subaru Legacy/Outback: Side airbags and inflatable curtains.
Land Rover Discovery Sport: Driver airbag with steering wheel, passenger airbag, inflatable curtains, side airbags, pedestrian airbag, seatbelts with pretensioners and safety electronics.
Hyundai Sonata: Steering wheel and seatbelts with pretensioners.
Ford F-Series: Side airbags, inflatable curtains and safety electronics.
VW Passat: Driver airbag with steering wheel, passenger airbag, side airbags and active seatbelts with pretensioners.
Mazda 3/Axela: Driver airbag with steering wheel, side airbags, inflatable curtains and safety electronics.
KIA Sorento: Driver airbag, passenger airbag, inflatable curtains, side airbags, safety electronics and seatbelts with pretensioners.
Creating Shareholder Value
By creating customer satisfaction, maintaining tight cost control and developing new products, we generate cash for long-term growth, financial stability and competitive returns to our shareholders.
AUTOLIV HAS ALWAYS had a strong cash flow and cash generation focus. Our operating cash flow has always exceeded capital expenditures (see graph).
On average, operations have generated $784 million in cash per year over the last five years, while our capital expenditures, net have averaged $355 million. Since 1997 the Company has converted approximately 95% of its net income to free cash flow, i.e. cash flow after capital expenditures.
CAPITAL EFFICIENCY IMPROVEMENTS
Autoliv’s strong cash flow reflects both the Company’s earnings performance and improvements in capital efficiency. During 2010-2014, while sales increased by 29%, our average annual capital employed increased by only 14%. Therefore, our capital turnover rate improved by more than 13% to 2.6 times. Whether this trend will continue or not will depend on two competing trends. On one hand, the trend will be driven by continued organic sales growth where our market is expected to grow at a rate of around 5% per year until 2017. Consequently, we should be able to grow our sales and revenues without acquisitions (although we still view acquisitions as a useful mean of accelerating growth). During the last five years, goodwill and other intangibles declined slightly. Since 2010, the trend has been that capital expenditures have exceeded depreciation and amortization due to the need for additional manufacturing capacity in response to the growth of our sales and for vertical integration. This trend will continue in support of the future growth and new inflator replacement businesses. Our strategy for improving fixed asset utilization rate includes plant consolidations, expansion in low-cost countries and global standardization of manufacturing processes.
We will also need additional cash for working capital to support the expected organic sales growth. Our target is that working capital should be below 10% of sales. At the end of 2014, this ratio was 6.4%.
In summary, we still expect to generate strong cash flow, although we may be unable to improve on Autoliv’s already strong capital turnover rate.
CURRENCY EFFECTS
Autoliv is exposed to three types of currency effects that impact Net income and consequently operating cash flow; 1) Transaction effects stemming from purchases and sales in different currencies. We have a net transaction exposure corresponding to approximately 20% of our sales. 2) Revaluation effects stemming from valuation of assets denominated in other currencies than the reporting currency of each unit. 3) Translation effects stemming from the translation of locally reported financial statements into U.S. dollars. We estimate that approximately 75% of our sales are in currencies other than in U.S. dollars.
OUR CASH FLOW MODEL
When analyzing how to best use each year’s cash flows from operations, Autoliv’s Board of Directors uses the model depicted on the opposite page to identify shareholder value. The model takes important variables into account such as the marginal cost of borrowing, the return on marginal investments and the price of Autoliv shares. When evaluating the various uses of cash, the Board of Directors weighs these decisions against the need for flexibility due to the cyclical nature of the automotive industry, acquisitions and other potential settlements.
INVESTING IN OPERATIONS
To create long-term shareholder value, cash flow from operations should only be used to finance investments in operations until the point when the return on investment no longer exceeds the cost of capital. In Autoliv’s case, our historical pre-tax cost of capital has been approximately 12% before taxes. Autoliv’s return on capital employed has always exceeded this level, except during the financial crisis in 2008-2009. During the last three years, return on capital employed has varied between 21% and 22%, i.e. close to twice the level of cost of capital.
In 2014, $453 million was re-invested in the form of capital expenditures, net. This was almost 64% of the year’s operating cash flow of $713 million. It was also 48% more than depreciation and amortization due to our strong order intake and need for additional manufacturing capacity, primarily in Asia and other growth markets. Another reason for capital expenditures exceeding depreciation is our strategy to increase vertical integration (i.e. the level of in-house component sourcing) as a means to offset the continuous price erosion in our industry.
ACQUISITIONS
In order to accelerate the Company’s growth, we typically use some of the cash flow generated for acquisitions. However, in 2014, there were no major acquisitions or divestitures. This is not indicative of our expected long-term need of cash for acquisitions or our historical acquisition rate. During the last five years, we made acquisitions totaling $169 million.
These acquisitions were made to consolidate our industry, increase our vertical integration and expand into new markets. For instance, during the crisis, we acquired the passive safety assets of Delphi which added annual sales of more than half a billion dollars (for a purchase price of $115 million). We also expanded into a new market by acquiring Tyco’s radar business, which now is one of our core areas in active safety.
SHAREHOLDER RETURNS
Since Autoliv has historically used both dividend payments and share repurchases to create shareholder value, the Company does not have a set dividend policy. Instead, the Board of Directors regularly analyzes which method is most efficient, at each instance, to create shareholder value.
During 2014, the quarterly dividend was increased by $4 cents, or by 8%, to $54 cents. This corresponds to an annualized run rate of $192 million, which is 55% higher than the highest amount paid before the crisis in 2008-2009. In total $200 million or 77% of the year’s free cash flow was used to pay dividends to shareholders.
Historically, the dividend has represented a yield of 2-3% in relation to the Autoliv’s average share price. During 2014, this yield was 2.1%.
We also have the ability to return funds to shareholders using share repurchases. During 2014, the Company repurchased 6.2 million shares. The remaining board authorization is 5.3 million shares.
Repurchases of shares could create more value for shareholders than dividends, if the share price appreciates long-term. For Autoliv this has been the case as the Company’s existing 14.1 million treasury shares have been repurchased at an average cost of $53.07 per share, while the closing price at the end of 2014 was $106.12.
CAPITAL STRUCTURE
Our revised debt limitation policy is to maintain a financial leverage commensurate with a “strong investment grade credit rating” and our long-term target is to have a leverage ratio of around one time and to be within the range of 0.5 and 1.5 times (see page 83 for definitions). In addition to the above, the objective is to provide the Company sufficient flexibility to manage the inherent risks and cyclicality in Autoliv’s business and allow the Company to realize strategic opportunities and fund growth initiatives while creating shareholder value. During 2014 Autoliv has continued to adjust its leverage ratio towards the target through dividend and share repurchases. At December 31, 2014, the Company had a leverage ratio of 0.3 times.
Since December 2013, Autoliv has held an “A- with stable outlook” credit rating by Standard & Poor’s. The headroom between current capital structure and our long-term target range should provide flexibility to make further shareholder returns, opportunistic acquisitions and provide the means for an eventual resolution of the antitrust investigations and related matters, although the financial impact on Autoliv is not yet possible to estimate (see Note 16 to Consolidated Financial Statements included herein).
Share Performance and Shareholder Information
The price of the Autoliv stock recorded a 18% increase in 2014 and set a new all-time record at $108.03 on the New York Stock Exchange and 841.50 SEK on the NASDAQ OMX Nordic in Stockholm.
SHARE PERFORMANCE
On the primary market for the Autoliv securities, the NYSE, Autoliv’s stock increased by 18% to $106.12 during 2014 which compares favorably to the S&P 500 index, which increased 12%, and the S&P 1500 Auto Components Index, that increased by 5% during the same period.
From the beginning of 2010 to the end of 2014, Autoliv’s share price increased by 140% corresponding to an annual increase of 19%. This share performance of Autoliv compares favorably to our peer group as the S&P 1500 Auto Components index increased by 113%. The S&P 500 Index increased by 82% for during the same time period.
The average daily trading volume in Autoliv shares on the NYSE increased by 13% to 559,266 in 2014 from 494,332 in 2013.
STOCKHOLM
In Stockholm, the price of Autoliv Swedish Depository Receipts (SDR) increased by 44% to 837.50 SEK during 2014 compared to a 12% increase in the OMX All Share Index and a 36% increase in the OMX Automotive Index in Sweden.
In Stockholm, the average daily trading volume in Autoliv shares was 254,803 in 2014, virtually unchanged compared to 2013. In 2014, the Autoliv SDR was the 25th most traded security in Stockholm. Of the total exchange trading, the Autoliv stock accounted for 1.3% in 2014 compared to 1.1% during 2013.
In Stockholm, Autoliv’s SDRs are traded on the stock exchange’s list for large market cap companies.
NUMBER OF SHARES
During 2014, the number of shares outstanding decreased by 5.7 million to 88.7 million at year end. The number of shares outstanding decreased due to share repurchases which were re-activated in the fourth quarter 2013 (see Note 13 to Consolidated Financial Statements included herein). The weighted average number of shares outstanding for the full year 2014, assuming dilution, was reduced to 92.4 million from 95.9 million in 2013.
Stock options, if exercised, and granted Restricted Stock Units (RSUs) could increase the number of shares outstanding by 538,825 and 198,285, respectively, which would be a 0.8% increase in the current number of shares outstanding.
In January 2014, the Board of Directors authorized an increase in the Company’s share repurchase program, and 5.3 million shares remain available for repurchase. On December 31, 2014, the Company had 14.1 million treasury shares.
NUMBER OF SHAREHOLDERS
Autoliv estimates that there are around 50,000 beneficial Autoliv owners as of December 31, 2014, of which almost 30% of the Autoliv securities were held in the U.S. and close to 50% in Sweden. Most of the remaining Autoliv securities were held in the U.K., other Nordic countries, Central Europe, Japan and Canada.
On December 31, 2014, Autoliv’s U.S. stock registrar had around 2,000 holders of Autoliv stock, and according to our transfer agent, there were more than 22,000 beneficial holders that held Autoliv shares in a “street name” through a bank, broker or other nominee.
According to the depository bank in Sweden, there were more than 24,000 holders of record of the Autoliv SDRs of which around 21,000 “street names” of the SDRs. Many of these holders are nominees for other, non-Swedish nominees.
The largest shareholders known to the Company are shown in the table below.
STOCK INCENTIVE PLAN
Under the Autoliv, Inc. 1997 Stock Incentive Plan adopted by the shareholders and as further amended, awards have been made to selected executive officers of the Company and other key employees in the form of stock options and RSUs.
All options are granted for ten-year terms, have an exercise price equal to the fair market value of the share at the date of the grant, and become exercisable after one year of continued employment following the grant date.
Each RSU represents a promise to transfer one of the Company’s shares to the employee after three years of service following the date of grant or upon retirement (see Note 15 to Consolidated Financial Statements included herein).
Autoliv has adopted a Stock Ownership Policy for Executives requiring the Company’s CEO to accumulate and hold Autoliv shares having a value of twice his annual base salary. For other executives, the minimum requirement is, over time, a holding equal to each executive’s annual base salary.
DIVIDENDS
If declared by the Board of Directors, quarterly dividends are usually paid on the first Thursday in the last month of each quarter. The record date is typically two weeks before the payment day and the ex-date (when the stock trades without the right to the dividend) is two days before the record date for the securities and one day for the SDRs.
Quarterly dividends are declared separately by the Board of Directors, announced in press releases and published on Autoliv’s corporate website.
For the Preliminary Dividend Plan 2015, refer to page 88 in the Annual Report.
ANNUAL GENERAL MEETING
Autoliv’s next Annual General Meeting of Stockholders will be held on, May 5, 2015, at The Langham Hotel, Chicago, 330 North Wabash Avenue, Chicago, Illinois, 60611-3586, USA. Stockholders are encouraged to vote on the Internet regardless of whether they plan to attend the meeting.
PUBLIC INFORMATION DISCLOSURE
We report significant events to shareholders, analysts, media and interested members of the public in a timely and transparent manner and give all constituencies the information simultaneously.
All relevant public information is reported objectively. Information communicated by Investor Relations is authorized by management.
| KEY STOCK PRICE DATA | ||||
| New York |
Price ($) |
Date | ||
| Opening |
89.92 | Jan 2, 2014 | ||
| Year high |
108.03 | Jul 3, 2014 | ||
| Year low |
86.27 | Jan 27, 2014 | ||
| Closing |
106.12 | Dec 31, 2014 | ||
| All-time high |
108.03 | Jul 3, 2014 | ||
| All-time low |
12.33 | Mar 6, 2009 | ||
| Stockholm |
Price (SEK) |
Date | ||
| Opening |
583.00 | Jan 2, 2014 | ||
| Year high |
841.50 | Dec 29, 2014 | ||
| Year low |
554.50 | Jan 27, 2014 | ||
| Closing |
837.50 | Dec 30, 2014 | ||
| All-time high |
841.50 | Dec 29, 2014 | ||
| All-time low |
116.25 | Mar 9, 2009 | ||
| THE LARGEST SHAREHOLDERS | ||||
| % |
No. of Shares |
Holder Name1) | ||
| 8.9 |
7,862,500 | Alecta Pension Insurance Mutual | ||
| 7.9 |
6,992,729 | Swedbank Robur Fonder AB | ||
| 6.5 |
5,751,293 | AMF Pensionforsakring AB | ||
| 4.7 |
4,126,603 | Nordea Investment Funds | ||
| 3.0 |
2,630,685 | Henderson Investment Funds | ||
| 0.4 |
310,598 |
Management/Directors as a group2) | ||
| 100.0 |
88,726,543 | Total December 31, 2014 | ||
1) Known to the Company, out of around 50,000 shareholders. 2) As of February 17, 2015. Includes 76,026 shares issuable upon exercise of options that are exercisable within 60 days, 53,213 shares issuable upon exercise of options not exercisable within 60 days and 70,662 RSUs.
ANALYSTS (28)
| US (11) |
||
| BARCLAYS |
Brian Johnson | |
| BUCKINGHAM RESEARCH |
Joseph Amaturo | |
| CITIGROUP |
Itay Michaeli | |
| DEUTSCHE BANK | Rod Lache | |
| KEYBANC | Brett Hoselton |
| MORGAN STANLEY | Ravi Shanker | |
| RBC CAPITAL MARKETS | Joseph Spak | |
| RW BAIRD | David Leiker | |
| SIG | Matthew Stover | |
| SWEDEN (10) | ||
| ABG SUNDAL COLLIER | Olof Cederholm | |
| CARNEGIE | Agnieszka Vilela | |
| DANSKE BANK | Björn Enarson | |
| DNB | Christer Magnergård | |
| HANDELSBANKEN | Hampus Engellau | |
| NORDEA EQUITIES | Erik Golrang | |
| PARETO OHMAN | David Jacobson | |
| PENSER | Johan Dahl | |
| SEB ENSKILDA SECURITIES | Anders Trapp | |
| SWEDBANK | Fredrik Nilhov | |
| UK (5) | ||
| BANK OF AMERICA MERRILL LYNCH | Sheila Weekes | |
| CREDIT SUISSE | Alexander Haissl | |
| EXANE BNP PARIBAS | Edoardo Spina | |
| FRANCE (2) | ||
| CHEUVREUX KEPLER | Thomas Besson | |
| SOCIETE GENERALE | Philippe Barrier | |
| SHARE PRICE AND DIVIDENDS |
||||||||||||||||||||||||||||||||
| New York (US$) | Stockholm (SEK) | Dividend | Dividend | |||||||||||||||||||||||||||||
| PERIOD |
High | Low | Close | High | Low | Close | declared | paid | ||||||||||||||||||||||||
| Q1 2014 |
100.84 | 86.27 | 100.35 | 653.00 | 554.50 | 653.00 | $ | 0.52 | $ | 0.52 | ||||||||||||||||||||||
| Q2 2014 |
107.92 | 99.39 | 106.58 | 719.00 | 653.00 | 715.00 | $ | 0.54 | $ | 0.52 | ||||||||||||||||||||||
| Q3 2014 |
108.03 | 91.92 | 91.92 | 743.50 | 671.50 | 671.50 | $ | 0.54 | $ | 0.54 | ||||||||||||||||||||||
| Q4 2014 |
107.92 | 88.00 | 106.12 | 841.50 | 638.00 | 837.50 | $ | 0.54 | $ | 0.54 | ||||||||||||||||||||||
| Q1 2013 |
69.58 | 64.13 | 69.14 | 448.80 | 409.00 | 448.80 | $ | 0.50 | $ | 0.50 | ||||||||||||||||||||||
| Q2 2013 |
80.04 | 66.47 | 77.39 | 534.50 | 428.30 | 523.00 | $ | 0.50 | $ | 0.50 | ||||||||||||||||||||||
| Q3 2013 |
88.80 | 77.68 | 87.39 | 571.50 | 514.50 | 563.00 | $ | 0.50 | $ | 0.50 | ||||||||||||||||||||||
| Q4 2013 |
94.41 | 86.70 | 91.80 | 615.00 | 560.00 | 592.00 | $ | 0.52 | $ | 0.50 | ||||||||||||||||||||||
SUSTAINABILITY 2014
Creating Sustainable Value
To achieve sustainable growth and profitability, we recognize that every part of our business needs to be run with responsibility, integrity and operational excellence.
TODAY AROUND 80% of the value of a vehicle is created in the supply-chain, through outsourcing of innovation and production. Safety and fuel-economy standards are strong competitive drivers within the automotive industry. As suppliers we have an opportunity to contribute to the success of our customers. This entails meeting customer expectations on environmental, social and ethical standards in their supply-chain. Most of our major customers are, through regular assessments keeping track of our performance in these areas.
KEEPING PACE WITH GROWTH
Global thinking and local actions is one of our core values. As our Company grows, this principle becomes even more relevant and challenging. Our growth Markets are characterized by very high labor turnover. Although below market average, the turnover rate among Autoliv’s employees in China was 28% in 2014 and in India it was 18%. In such a changing and dynamic environment, we have to uphold a global standard of ethical behavior and integrity, without losing the power of local action and initiative. We need to ensure that all current and new co-workers are aware of and committed to the duties and rights that come with Autoliv employment and we accomplish this through education and communication.
Education is a critical aspect of supporting employees in understanding Company expectations and policies related to our Code. Autoliv requires employee education regarding our Standard of Business Conduct and Ethics (Code of Conduct) to ensure that all employees are aware of, understand, and adhere to the principles that we have established. The goals of the Business Conduct and Ethics Education are to provide a continuing communication channel for compliance matters, to deliver compliance messages to employees, to train and educate employees on their compliance responsibilities, and to support our Code of Conduct and the compliance program. Training is designed to facilitate employees’ understanding of compliance responsibilities and the importance of complying with laws, regulations, and our Code. It is delivered in various ways, including e-learning and face-to-face training.
SPEAK UP
We have a strong culture of communication and sharing of knowledge. At our plants each shift starts with a debriefing where concerns can be raised. We promote “Jidoka” (automation with a human touch) and have a culture where employees are empowered to bring up quality, operational, or any other issues that they observe immediately. The Autoliv Helpline is a multilingual third-party operated whistle blower service, where reports can be made confidentially about any suspected or known violations of law, policies, or other concerns. Reporting is followed up by legal and compliance functions. At Autoliv, we are committed to protecting individuals who make a report or participate in an investigation in good faith. Employees are entitled to voluntarily join associations in accordance with local legislation and rules, although the level of unionization varies significantly throughout our operations. The European Works Council meets with Management twice a year.
BUILDING A SUSTAINABLE INVESTMENT CASE
Our investors are increasingly focused on our ability to create value based on sustainable performance. We welcome this development as it provides us with the opportunity to present a broader view of our Company, revealing new or hidden value drivers. Over the coming years, we aim to further improve our communication in this respect, and strive for an effective integration of environmental, social and governance (ESG) issues that are material for our growth, profitability and risk management.
MANAGING OUR SUPPLY CHAIN
Autoliv has a strategy of consolidating its supply base by reducing the number of suppliers, alongside the standardization of components and raw materials, and a review of the sourcing of sub-components. We expect this to lead to reduced complexity and improved relations with preferred suppliers. Autoliv will further strengthen the supply base by the deployment of improvement programs, based on the Autoliv Production System (APS). Suppliers in emerging markets, with capability to deliver to broader regions matching the Company footprint, are especially targeted.
Autoliv has a global sourcing council and a common purchasing system for all units.
In the pre-qualification process new suppliers are required to acknowledge and follow the guidelines stated in the Autoliv Supplier Manual, including the Code of Conduct. For a full environmental commitment, our suppliers should implement an Environmental Management System, preferably based on ISO 14001. All substances used in production part materials shall be declared and comply with the Autoliv substance use restrictions, aligned with the European REACH and RoHS Directive, respectively. Assessments also include tracing of potential conflict minerals.
Current suppliers are frequently visited. Audits are performed by the Supplier Quality organization. The auditing framework includes items from the Code of Conduct, such as human rights and working conditions, environment and business conduct and ethics.
AUTOLIV PRODUCTION SYSTEM PERFORMANCE
Autoliv’s own operations generate modest environmental impact, compared to impacts upstream and downstream in the value chain. The Autoliv Production System (APS) is self-developed and based on the Lean philosophy of resource efficiency. Close to all Autoliv facilities are certified in accordance with ISO14001. We have launched several energy saving programs. Our total energy consumption corresponds to 268,000 metric tons CO2 (using the Greenhouse gas Protocol), which was an increase of 4% from 2013. This is mainly a consequence of expanding production in China and therefore increased quantity of purchased electricity (kWh). Other environmental data, such as water consumption and waste management, is not consolidated on a group-level.
In accordance with our manufacturing strategy, component production is concentrated in a few locations, while assembly plants are located close to customers. Final products are typically delivered “just-in-time” to vehicle manufacturers’ plants. With our strong global presence we can minimize the environmental impact imposed by logistics when procuring parts and supplying finished products, while also recognizing the financial benefits.
To keep pace with growth and manage risks, Autoliv has intensified plant auditing. Each year 50-60 risk audits, based on our internal risk management standards, are performed. A new global standard will be launched, focusing on the safe handling, use and storage of hazardous chemicals. Additionally, this will be complemented by a global health and safety management system standard formatted to align with well recognized global standards.
INNOVATION AND SUSTAINABLE PARTNERSHIPS
One environmental contribution we can make is to design and develop low-weight safety systems. Even a small reduction in weight can result in substantial improvements of a car’s fuel economy. Helping our customers in their efforts to meet the stringent CO2 and CAFE (Corporate Average Fuel Economy) requirements is important for them and a competitive tool for us.
Over the last several years our R,D&E has been focused on new materials and adaptions for new types of vehicles. We are now following many of our customers by introducing low weight plastic materials to substitute for steel in our components. The trend towards alternative-fuel vehicles may additionally create new safety challenges and opportunities for Autoliv. When the autonomous driving car trend takes off, there will be a need for very advanced sensor systems. Autonomously driven cars can also be fuel efficient by optimizing the driving under different circumstances and hence have the potential to be more environmentally friendly than conventional cars. Autoliv will have a competitive position in this market.
| MEASUREMENTS |
2010 | 2011 | 2012 | 2013 | 2014 | |||||||||||||||
| Number of supplier audits |
51 | 215 | 298 | 341 | 359 | |||||||||||||||
| Energy consumption, GWh |
666 | 680 | 715 | 771 | 792 | |||||||||||||||
| CO2 equivalents metric tons |
217,000 | 230,000 | 246,000 | 257,000 | 268,000 | |||||||||||||||
| No of plants with zero-injuries |
18 | 19 | 13 | 16 | 16 | |||||||||||||||
| Injuries/200,000h |
1.9 | 1.7 | 1.7 | 1.5 | 1.3 | |||||||||||||||
| Code of Conduct training, number of employees |
3,360 | 2,389 | 49,614 | 19,115 | 34,898 | |||||||||||||||
Content Financials
| PAGE1) |
||||
| 39 | Management’s Discussion and Analysis | |||
| 55 | Management’s Report on Internal Control over Financial Reporting | |||
| 56 | Consolidated Statements of Net Income | |||
| 56 | Consolidated Statements of Comprehensive Income | |||
| 57 | Consolidated Balance Sheets | |||
| 58 | Consolidated Statements of Cash Flows | |||
| 59 | Consolidated Statements of Total Equity | |||
| PAGE1) |
NOTES TO CONSOLIDATED FINANCIAL STATEMENTS | |||
| 60 | Note 1 |
Summary of Significant Accounting Policies | ||
| 63 | Note 2 |
Business Combinations | ||
| 63 | Note 3 |
Fair Value Measurements | ||
| 66 | Note 4 |
Income Taxes | ||
| 67 | Note 5 |
Receivables | ||
| 67 | Note 6 |
Inventories | ||
| 68 | Note 7 |
Investments and Other Non-current Assets | ||
| 68 | Note 8 |
Property, Plant & Equipment | ||
| 68 | Note 9 |
Goodwill and Intangible Assets | ||
| 69 | Note 10 |
Restructuring and Other Liabilities | ||
| 70 | Note 11 |
Product Related Liabilities | ||
| 70 | Note 12 | Debt and Credit Agreements | ||
| 72 | Note 13 | Shareholders’ Equity | ||
| 72 | Note 14 | Supplemental Cash Flow Information | ||
| 73 | Note 15 | Stock Incentive Plan | ||
| 74 | Note 16 | Contingent Liabilities | ||
| 76 | Note 17 | Lease Commitments | ||
| 76 | Note 18 | Retirement Plans | ||
| 80 | Note 19 | Segment Information | ||
| 80 | Note 20 | Earnings Per Share | ||
| 80 | Note 21 | Subsequent Events | ||
| 81 | Note 22 | Quarterly Financial Data (unaudited) | ||
| 82 | Auditor’s Reports | |||
1) See page in Annual Report.
Important Trends
Autoliv, Inc. (the “Company”) provides advanced safety technology products for the automotive safety market. In the three-year period from 2012-2014 a number of factors have influenced the Company’s operations. The most notable factors have been:
| • | Strong LVP growth in China, the world’s largest auto market |
| • | Rapid growth of active safety market |
| • | Pricing pressure from customers |
| • | Significant changes in competitive environment |
| • | Operational initiatives in support of growth and efficiencies |
| • | Adjustment of capital structure and long-term financing |
| 20141) | 20131) | 20121) | ||||||||||||||||||||||
| YEARS ENDED DEC. 31 (DOLLARS IN MILLIONS, EXCEPT EPS) |
Reported | change | Reported | change | Reported | change | ||||||||||||||||||
| Global light vehicle production (in thousands) |
85,559 | 3 | % | 82,801 | 4 | % | 79,740 | 7 | % | |||||||||||||||
| Consolidated net sales |
$ | 9,240 | 5 | % | $ | 8,803 | 6 | % | $ | 8,267 | 0 | % | ||||||||||||
| Operating income |
$ | 723 | (5 | )% | $ | 761 | 8 | % | $ | 705 | (21 | )% | ||||||||||||
| Operating margin, % |
7.8 | (0.8)pp | 8.6 | 0.1pp | 8.5 | (2.3)pp | ||||||||||||||||||
| Net income attributable to controlling interest |
$ | 468 | (4 | )% | $ | 486 | 1 | % | $ | 483 | (22 | )% | ||||||||||||
| Earnings per share, EPS2) |
$ | 5.06 | (0 | )% | $ | 5.07 | 0 | % | $ | 5.08 | (24 | )% | ||||||||||||
| Net cash provided by operating activities |
$ | 713 | (15 | )% | $ | 838 | 22 | % | $ | 689 | (9 | )% | ||||||||||||
| Return on capital employed, % |
20.5 | (1.6)pp | 22.1 | 0.8pp | 21.3 | (6.2)pp | ||||||||||||||||||
LVP AND MARKET SHIFTS
The most important driver for Autoliv’s sales is the light vehicle production (LVP). We have seen a shift in this growth driver. LVP accelerated to a year-over-year rate of nearly 7% in 2012 when LVP reached almost 80 million. In 2013, LVP growth continued but at a slower rate of 4%. In 2014, a growth rate of 3% was recorded for the global LVP.
The main markets contributing to the global LVP growth are China, North America and Western Europe. Between 2012 and 2014, Chinese LVP rose by 26% or 4.4 million light vehicles (LVs). China has become the world’s largest LV producing market and is expected to produce about one third of the global light vehicles in 2020. North America increased by 10% or 1.5 million LVs for the same period, upholding a year-over-year growth of around 5% for the period between 2012 and 2014. The growth in North America was evenly spread between the years. In Western Europe, which is an important market for automotive safety, LVP increased by almost 6% or by approximately 0.7 million LVs during the same three-year period, coming from a production level of 12.6 million LVs in 2012 with a minor growth in 2013 followed by an increase of more than 5% in 2014 driven rebound in light sales in the region. However the Western Europe LVP is still over 2.5 million units bellow pre-financial crisis volumes in 2006-2007.
As a result, China’s share of global LVP increased from 22% in 2012 to 25% in 2014, while North America’s share increased from 19% to 20% and Western Europe’s share was kept at 16% of the global LVP both in 2012 and 2014. Virtually all other markets decreased their share of global LV production and showed a decline in LV production ranging from 1% to 12% between 2012 and 2014. South America contracted the most.
These shifts have impacted our market – the global automotive safety market – as the average safety content per vehicle varies between the regions (see Safety Content per Vehicle on page 40 in the Annual Report).
AUTOLIV IS BETTER BALANCED
Autoliv’s regional sales mix continues to be balanced with 33% of sales in Europe, 34% in the Americas and 33% in Asia in 2014, virtually unchanged compared to 32%, 35% and 33%, respectively, in 2012. In Asia, our sales in the important Chinese market have increased to more than 16% of total sales in 2014 from 13% in 2012. The strong position in China is important as it makes the Company well positioned in the world’s largest auto producing market, which is expected to experience continued growth over the next several years.
The balanced regional sales mix has been achieved through: 1) timely investments and strengthening of technical and support capabilities in growth markets and 2) early introduction and execution of our restructuring and capacity alignment activities (see below). We have also made substantial investments in additional manufacturing capacity for vertical integration in China and Thailand, to further improve our competiveness.
In 2014, around 21.6 million light vehicles were produced in China, an increase of 26% from 2012. Due to our strong position both with local Chinese and global vehicle manufactures, our sales have grown by 39% during the same period. For Asia as whole, the effect of the higher production volumes in China was partly offset by lower growth rates for South Korean vehicle manufacturers following many years of strong growth. For additional information on Autoliv’s dependence on certain customers and vehicle models, see page 52 in the Annual Report.
Of the European OEMs both BMW and Daimler stands out, accounting for 5% and 7%, respectively of Autoliv’s sales. This represent more than two times their global market shares and is a result of our strong position within passive safety and to our successful introductions of Active Safety systems in BMW and Daimler vehicles (see below). However, sales to other customers that are more dependent on the European market have continued to decline. This has created a swing in our European customer sales mix that continues to impact our capacity utilization and the profitability of many of our European plants (see more below).
Five years after skyrocketing fuel prices and turmoil in the financial markets, the North American market has recovered to its former size and character, dominated largely by GM, Ford, Toyota, Chrysler, Honda and Nissan.
Autoliv has, during the three year period 2012-2014, been able to out-grow the global LVP almost two times due to strong presence in all regions and an attractive product offering.
ACTIVE SAFETY – THE NEXT CAR INDUSTRY REVOLUTION
In addition to our commitment to enhance passive safety, we are driving the rapid expansion of the market for active safety systems, currently mainly for mid and high-end vehicle models. The active safety market that we address grew by more than 40% during 2014 to $2.0 billion and are expected to continue to grow rapidly.
In Europe, the Euro NCAP continuously updates its test program to include more and more active safety technologies to help the European Union reach its target of cutting road fatalities by 50% by 2020. Also the U.S. National Highway Traffic Safety Administration (NHTSA) plans to ensure that its safety rating program continues to encourage both consumers and automakers to develop and adopt active safety technologies. These actions will help to further drive the market for technologies like Autonomous Emergency Braking, Lane departure warning and Blind spot detection.
To capitalize on the strong growth, we have increased our research, development and engineering (R,D&E) activities related to active safety. From the 2012 level, our overall R,D&E expense, net has been increased by 18% to $536 million, a significant portion of which is for active safety projects. As a result of these undertakings in R,D&E and as a result of our investments in additional manufacturing capacity, sales in active safety grew by 36% in 2012 to $218 million, by 58% in 2013 to $345 million and by 42% in 2014 to $489 million, essentially reaching the $500 million target originally set for 2015.
SAFETY CONTENT PER VEHICLE
In addition to the trend of more active safety systems being introduced, we also see vehicle manufacturers installing more airbags and more advanced seatbelt systems in their vehicles, generally when new models are introduced. Despite these positive worldwide trends, the average global safety content per LV (airbags, seatbelts, steering wheels and related electronics, radar, night vision systems and cameras) remained relatively flat at around $300 during the period 2012-2014. This is due to the fact that growth in global LVP is highly concentrated in markets such as China where the average safety content per vehicle is only approximately $220, which reduces the global average safety content per vehicle.
In addition, there is a negative effect from continued pricing pressure from vehicle manufacturers (see below). However, the safety standards of vehicles are increasing in China, India and other growth markets such as Brazil, partially due to new regulations and crash test rating programs. For instance, Latin America introduced a rating program for crash performance of new vehicles in 2010. Brazil mandated frontal airbags in all new vehicles sold beginning in 2014. In 2014 Global NCAP introduced the first crash test-rating program in India. Also the Indian government has proposed new traffic legalization that would mandate more rigid crash test standards of light vehicles. This could eventually lead to higher installation rates of airbags and more advanced seatbelts.
All of these trends, in combination with the introduction of various active safety systems, should enable our market, i.e. the global automotive safety market, to grow at least in line with global LVP during the next three years and, possibly faster than LVP as safety content per vehicle in growth markets improves, and as active safety content per vehicle increases primarily in the mature markets.
OPERATIONAL INITIATIVES
Despite a general strong demand for premium vehicle models produced in Europe, we have seen a depressed market for many other vehicle models in the volume market segments. This has resulted in uneven capacity utilization in several of our European plants. As a response to this situation, we launched a capacity alignment program in 2012 of $79 million to adapt our footprint. In 2013, we saw further cost saving opportunities and enlarged the program and the costs amounted to $40 million for 2013. Our capacity alignment program was expanded also in 2014 and the costs for the program amounted to $45 million. See also Note 10 to Consolidated Financial Statements included herein for further information on our restructuring activities. The current capacity alignment programs are expected to have a payback period of 2-4 years after cash-out.
In 2014, capital expenditure for the Company was at the high end of the historic range of 4-5%. This was primarily to support further growth and increase the degree of vertical integration in Asia. The Company’s two largest investments to date, the propellant facility in Jiangsu, China and the textile center in Nantong, China, both initiated production during 2014. The Company is adding manufacturing capacity to increase airbag inflator production capacity. This is a result of higher demand for airbag inflators following high number of inflator related recalls of another manufacturers products.
During the year the Company also decided to gradually increase the amount of R,D&E expenditure in active safety in order to meet demand from customers and accelerate the development of future products in this rapidly evolving and competitive market.
PRICE EROSION AND COST CHALLENGES
Pricing pressure is an inherent part of the automotive supplier business. Price reductions are generally higher on newer products with strong volume growth compared to older products, where both the possibilities to re-design the product to reduce costs and market growth are less. Price reductions also depend on the business cycle. For the 2012-2014 period, we estimate the average reduction in our market prices to have been in the range of 2-4% annually. To meet these price reductions we have several programs and actions addressing every item in our cost structure.
For instance, to reduce costs for components from external suppliers, we are continuously optimizing our supply base footprint, consolidating purchase volumes to fewer suppliers, improving productivity in our supply chain, standardizing components
and redesigning our products (which also reduces weight and raw material content of our products, further reducing costs). In 2012, raw material prices rose and Autoliv’s commodity costs increased by $6 million. In 2013-2014, raw material commodity costs were reduced resulting in around $35 million lower raw material costs than in the beginning of 2012.
To reduce labor costs while offsetting the price erosion on our products, we continuously implement productivity improvement programs, expand production in LCC and institute restructuring and capacity alignment activities. The productivity improvements in Autoliv’s manufacturing were approximately 6% for every year during the last three-year period. This is well in line with our productivity improvement target of at least 5% per year, which helps us to partly offset the price reductions to our customers. The level of employees in the low cost countries (LCC) has increased to 74% in 2014 from 69% in 2012. These changes, in combination with our restructuring activities and several other actions, were almost enough to offset the market price erosion during the three-year period. As a result, total personal costs in relation to sales were virtually unchanged at 22.4% in 2014 compared to 22.0% in 2012 despite a higher number of engineers and technicians to support investment in R,D&E and vertical integration.
CHANGES IN COMPETITIVE LANDSCAPE
2014 saw significant changes in Autoliv’s competitive landscape. TRW, a key competitor in passive safety, agreed to be acquired by German group ZF Friedrichafen which is expected to result in TRW delisting from the New York Stock Exchange during 2015. The new company will form the third largest automotive supplier globally. The other main competitor in passive safety, Takata, experienced severe issues related to malfunctioning airbag inflators which will lead to significant costs for them. The third largest competitor Key Safety Systems also saw a transfer of ownership during the year, being acquired by a Hong Kong based private equity group. In active safety the IPO of a tier 2 supplier at very high valuations put additional focus on the opportunities and limitations for M&A activities in that market.
ADJUSTING OUR CAPITAL STRUCTURE
Autoliv entered the three-year period 2012-2014 with a net cash position on January 1, 2012 of $92 million. At the end of the period, on December 31, 2014, the Company had a net debt position of $62 million including dividends of $564 million and share repurchases of $764 million over the three year period.
Operations generated $689 million in cash in 2012, $838 million in 2013 and $713 million in 2014, the decrease from 2013 to 2014 was mainly due to $65 million related to the settlement of the U.S. antitrust class actions in the second quarter of 2014 and $74 million in higher capital investments. Capital expenditures, net amounted to $360 million, $379 million and $453 million, respectively.
The declared dividend has been raised eight times since reinstatement in 2010. After the latest declared dividend increase to 54 cents per share, the annualized run rate of $192 million, based on number of shares outstanding at December 31, 2014, is 55% higher than the highest annualized dividend amount paid before the temporary dividend suspension in 2009.
In 2013, the Company began to adjust its capital structure and communicated a revised debt limitation policy which is to maintain a financial leverage commensurate with a “strong investment grade credit rating” and our long-term target is to have a leverage ratio (non-U.S. GAAP measure, see page 54 in the Annual Report) of around 1 time and to be within the range of 0.5 times to 1.5 times.
As part of the adjustment of the capital structure the Company has repurchased shares of common stock. During 2014, 6.2 million shares have been repurchased for approximately $616 million, including commissions. In the fourth quarter of 2013, the Company repurchased 1.6 million shares for approximately $148 million. At December 31, 2014, the remaining approved number of shares authorized by the board of directors for repurchase is 5.3 million shares.
We monitor our capital structure and the financial markets closely and intend to maintain a high level of financial flexibility.
CURRENCY IMPACTS
We are exposed to more than 40 currency pairs, with exposures in excess of $1 million each. We are monitoring the currency exposure but are not hedging any currency flows. Rather we strive to have sales and costs in the same currency to reduce the transaction exposure risk. The total net transaction exposure in 2014 was approximately $2.0 billion or 21% of sales. In 2014, the net currency transaction effect, including revaluation, is estimated to have had a 0.4 percentage points positive impact on our operating margin. Approximately 75% of our sales are denominated in other currencies than U.S. dollars, which is leading to translation effects. In 2014, the translation effect is estimated to have had a 0.1 pp positive impact on the operating margin due to mix.
1) Reported figures impacted by costs for capacity alignments and antitrust matters in 2012-2014 and a non-cash, non-recurring valuation allowance for deferred tax assets in 2013 that impacted net income and EPS. See table on page 41 in the Annual Report “Items affecting comparability” and Notes 4, 10 and 16 of the Notes to the Consolidated Financial Statements included herein. 2) Assuming dilution and net of treasury shares.
| ITEMS AFFECTING COMPARABILITY (DOLLARS IN MILLIONS, EXCEPT EPS) |
Reported | Adjustments | ||||||||||||||||||||||
| 2014 | 2013 | 2012 | 20141) | 20131, 2) | 20121) | |||||||||||||||||||
| Operating income |
$ | 723 | $ | 761 | $ | 705 | $ | (120 | ) | $ | (47 | ) | $ | (98 | ) | |||||||||
| Operating margin, % |
7.8 | 8.6 | 8.5 | (1.3 | ) | (0.6 | ) | (1.2 | ) | |||||||||||||||
| Income before income taxes |
$ | 667 | $ | 734 | $ | 669 | $ | (120 | ) | $ | (47 | ) | $ | (98 | ) | |||||||||
| Net income |
$ | 469 | $ | 490 | $ | 486 | $ | (80 | ) | $ | (72 | ) | $ | (71 | ) | |||||||||
| Earnings per share, EPS3) |
$ | 5.06 | $ | 5.07 | $ | 5.08 | $ | (0.87 | ) | $ | (0.75 | ) | $ | (0.74 | ) | |||||||||
| Net cash provided by operating activities |
$ | 713 | $ | 838 | $ | 689 | $ | (114 | ) | $ | (27 | ) | $ | (50 | ) | |||||||||
1) Adjustments for capacity alignments and antitrust matters during 2012-2014. 2) Adjustment for a non-cash, non-recurring valuation allowance for deferred tax assets of $39 on net income and $0.41 on EPS. 3) Assuming dilution and net of treasury shares.
Non-U.S. GAAP Performance Measures
In this annual report we sometimes refer to non-U.S. GAAP measures that we and securities analysts use in measuring Autoliv’s performance.
We believe that these measures assist investors in analyzing trends in the Company’s business for the reasons given below. Investors should not consider these non-U.S. GAAP measures as substitutes, but rather as additions to financial reporting measures prepared in accordance with U.S. GAAP.
These non-U.S. GAAP measures have been identified, as applicable, in each section of this annual report with tabular presentations on this page and page 54 in the Annual Report, reconciling them to U.S. GAAP.
It should be noted that these measures, as defined, may not be comparable to similarly titled measures used by other companies.
ORGANIC SALES
We analyze the Company’s sales trends and performance as changes in “organic sales growth”, because the Company currently generates approximately 75% of net sales in currencies other than the reporting currency (i.e. U.S. dollars) and currency rates have proven to be rather volatile. We also use organic sales to reflect the fact that the Company has made several acquisitions and divestitures.
Organic sales present the increase or decrease in the overall U.S. dollar net sales on a comparable basis, allowing separate discussions of the impact of acquisitions/divestitures and exchange rates.
The tabular reconciliation below presents changes in “organic sales growth” as reconciled to the change in total U.S. GAAP net sales.
| COMPONENTS IN SALES INCREASE/DECREASE (DOLLARS IN MILLIONS) |
||||||||||||||||||||||||||||||||||||||||||||||||
| China | Japan | RoA1) | Americas | Europe | Total | |||||||||||||||||||||||||||||||||||||||||||
| 2014 VS. 2013 |
% | $ | % | $ | % | $ | % | $ | % | $ | % | $ | ||||||||||||||||||||||||||||||||||||
| Organic change |
8.2 | $ | 115.6 | 7.7 | $ | 53.3 | (0.3 | ) | $ | (3.0 | ) | 6.6 | $ | 195.2 | 6.5 | $ | 188.2 | 6.2 | $ | 549.3 | ||||||||||||||||||||||||||||
| Currency effects2) |
0.1 | 0.5 | (7.8 | ) | (53.9 | ) | 1.2 | 11.2 | (1.3 | ) | (39.4 | ) | (1.0 | ) | (30.6 | ) | (1.2 | ) | (112.2 | ) | ||||||||||||||||||||||||||||
| Acquisitions/divestitures |
— | — | — | — | — | — | — | — | — | — | — | — | ||||||||||||||||||||||||||||||||||||
|
|
|
|
|
|
|
|
|
|
|
|
|
|
|
|
|
|
|
|
|
|
|
|
|
|||||||||||||||||||||||||
| Reported change |
8.3 | $ | 116.1 | (0.1 | ) | $ | (0.6 | ) | 0.9 | $ | 8.2 | 5.3 | $ | 155.8 | 5.5 | $ | 157.6 | 5.0 | $ | 437.1 | ||||||||||||||||||||||||||||
| China | Japan | RoA1) | Americas | Europe | Total | |||||||||||||||||||||||||||||||||||||||||||
| 2013 VS. 2012 |
% | $ | % | $ | % | $ | % | $ | % | $ | % | $ | ||||||||||||||||||||||||||||||||||||
| Organic change |
25.7 | $ | 281.9 | 1.1 | $ | 8.9 | 5.6 | $ | 46.3 | 3.4 | $ | 96.0 | 5.4 | $ | 143.8 | 7.0 | $ | 576.9 | ||||||||||||||||||||||||||||||
| Currency effects2) |
2.3 | 26.0 | (18.2 | ) | (151.2 | ) | 1.2 | 10.0 | 0.3 | 8.5 | 3.1 | 83.1 | (0.3 | ) | (23.6 | ) | ||||||||||||||||||||||||||||||||
| Acquisitions/divestitures |
— | — | — | — | — | — | — | — | (0.6 | ) | (16.6 | ) | (0.2 | ) | (16.6 | ) | ||||||||||||||||||||||||||||||||
|
|
|
|
|
|
|
|
|
|
|
|
|
|
|
|
|
|
|
|
|
|
|
|
|
|||||||||||||||||||||||||
| Reported change |
28.0 | $ | 307.9 | (17.1 | ) | $ | (142.3 | ) | 6.8 | $ | 56.3 | 3.7 | $ | 104.5 | 7.9 | $ | 210.3 | 6.5 | $ | 536.7 | ||||||||||||||||||||||||||||
1) Rest of Asia. 2) Effects from currency translations.
RECONCILIATION OF “OPERATING WORKING CAPITAL” TO U.S. GAAP MEASURE
(DOLLARS IN MILLIONS)
| DECEMBER 31 |
2014 | 2013 | 2012 | |||||||||
| Total current assets |
$ | 4,136.2 | $ | 3,700.4 | $ | 3,289.2 | ||||||
| Total current liabilities |
(2,138.6 | ) | (2,428.5 | ) | (1,849.8 | ) | ||||||
| Working capital |
$ | 1,997.6 | $ | 1,271.9 | $ | 1,439.4 | ||||||
| Cash and cash equivalents |
(1,529.0 | ) | (1,118.3 | ) | (977.7 | ) | ||||||
| Short-term debt |
79.6 | 339.4 | 69.8 | |||||||||
| Derivative (asset) and liability, current |
(0.8 | ) | 1.1 | 0.0 | ||||||||
| Dividends payable |
47.9 | 49.1 | 47.7 | |||||||||
|
|
|
|
|
|
|
|||||||
| Operating working capital |
$ | 595.3 | $ | 543.2 | $ | 579.2 | ||||||
RECONCILIATION OF “NET DEBT” TO U.S. GAAP MEASURE
(DOLLARS IN MILLIONS)
| DECEMBER 31 |
2014 | 2013 | 2012 | |||||||||
| Short-term debt |
$ | 79.6 | $ | 339.4 | $ | 69.8 | ||||||
| Long-term debt |
1,521.2 | 279.1 | 562.9 | |||||||||
| Total debt |
$ | 1,600.8 | $ | 618.5 | $ | 632.7 | ||||||
| Cash and cash equivalents |
(1,529.0 | ) | (1,118.3 | ) | (977.7 | ) | ||||||
| Debt-related derivatives |
(10.0 | ) | (11.5 | ) | (15.8 | ) | ||||||
|
|
|
|
|
|
|
|||||||
| Net debt (cash) |
$ | 61.8 | $ | (511.3 | ) | $ | (360.8 | ) | ||||
OPERATING WORKING CAPITAL
Due to the need to optimize cash generation to create value for our shareholders, management focuses on operating working capital as defined in the table to the left.
The reconciling items used to derive this measure are, by contrast, managed as part of our overall management of cash and debt, but they are not part of the responsibilities of day-to-day operations’ management.
NET DEBT (CASH)
As part of efficiently managing the Company’s overall cost of funds, we routinely enter into “debt-related derivatives” (DRD) as part of our debt management.
Creditors and credit rating agencies use net debt adjusted for DRD in their analyses of the Company’s debt and therefore we provide this non-U.S. GAAP measure. DRD are fair value adjustments to the carrying value of the underlying debt. Also included in the DRD is the unamortized fair value adjustment related to discontinued fair value hedges, which will be amortized over the remaining life of the debt. By adjusting for DRD, the total financial liability of net debt (cash) is disclosed without grossing debt up with currency or interest fair values.
ADJUSTED OPERATING MARGIN AND ADJUSTED EARNINGS PER SHARE (EPS)
Adjusted operating margin and adjusted EPS are non-GAAP measures our management uses to evaluate our business, because we believe they assist investors and analysts in comparing our performance across reporting periods on a consistent basis by excluding items that are non-operational or non-recurring in nature, (such as capacity alignments, costs related to antitrust matters and for EPS discrete tax items) and that we do not believe are indicative of our core operating performance and underlying business trends. Adjusted operating margin and adjusted EPS should be considered in addition to, but not as a substitute for, other measures of financial performance reported in accordance with GAAP, including operating margin and EPS.
| RECONCILIATION OF ADJUSTED “OPERATING MARGIN” AND ADJUSTED “EPS” |
||||||||||||||||||||||||||||||||||||
| Full year 2014 | Full year 2013 | Full year 2012 | ||||||||||||||||||||||||||||||||||
| Non-U.S. GAAP |
Adjustments1) | Reported U.S. GAAP |
Non-U.S. GAAP |
Adjustments1) | Reported U.S. GAAP |
Non-U.S. GAAP |
Adjustments1) | Reported U.S. GAAP |
||||||||||||||||||||||||||||
| Operating margin, % |
9.1 | (1.3 | ) | 7.8 | 9.2 | (0.6 | ) | 8.6 | 9.7 | (1.2 | ) | 8.5 | ||||||||||||||||||||||||
| Earnings per share, diluted2,3) |
$ | 5.93 | $ | (0.87 | ) | $ | 5.06 | $ | 5.82 | $ | (0.75 | ) | $ | 5.07 | $ | 5.82 | $ | (0.74 | ) | $ | 5.08 | |||||||||||||||
1) Capacity alignment and antitrust investigations (including settlements of class actions in the second and third quarter 2014). 2) Adjustments for a noncash, non-recurring valuation allowance for deferred tax assets in both the fourth quarter 2013 and full year 2013 of $39 million on net income and capital employed, and $0.41 on EPS and total parent shareholder equity per share. 3) Assuming dilution and net of treasury shares.
Outlook for 2015
Mainly based on our customer call-offs we expect organic sales for the first quarter of 2015 to grow by around 3% compared to the same quarter of 2014. Currency translations are expected to have a more than 7% negative effect, resulting in a consolidated sales decline of close to 5%. The adjusted operating margin, excluding costs for capacity alignments and antitrust matters, is expected to be around 8%.
The expectation for the full year is for organic sales growth of more than 6%. Consolidated sales are expected to grow by less than 1% as effects from currency translations are expected to be negative by almost 6%. The expectation for the adjusted operating margin is around 9.5%, excluding costs for capacity alignments and antitrust matters.
The recent volatility in the currency markets has led to a heightened uncertainty regarding the potential impact of currencies on the Company’s results.
Our capacity alignment program continues and the Company currently expects the costs for the program to be at least $60 million for the full year 2015.
The projected effective tax rate for the full year 2015 is currently expected to be around 31%, excluding any discrete items, and is subject to change due to any other discrete or nonrecurring events that may occur.
Operational cash flow is expected to remain strong and to be around $0.8 billion excluding any discrete items. Capital expenditures in support of our growth strategy are expected to be 5-6% of sales. Excluding capital expenditures for the inflator replacement business, capital expenditures would have been expected to be 4-5% of sales.
Significant Legal Matters
The Company is subject to ongoing antitrust investigations by governmental authorities as well as related civil litigation in the United States and Canada. For further discussion of these antitrust matters and other legal proceedings see Item 3. Legal Proceedings in our Form 10-K for the year ended December 31, 2014 and Note 16 Contingent Liabilities to the Consolidated Financial Statements included herein.
Year Ended December 31, 2014 Versus 2013
| Component Of Change In Net Sales | ||||||||||||||||
| Sales (MUSD) | Reported | Currency effects1) | Organic | |||||||||||||
| Airbags and associated products2) |
$ | 5,951 | 4.7 | % | (1.1 | )% | 5.8 | % | ||||||||
| Seatbelts and associated products |
2,800 | 1.0 | % | (1.3 | )% | 2.3 | % | |||||||||
| Active safety products |
489 | 41.9 | % | (2.7 | )% | 44.6 | % | |||||||||
|
|
|
|
|
|
|
|
|
|||||||||
| Global |
$ | 9,240 | 5.0 | % | (1.2 | )% | 6.2 | % | ||||||||
| Component Of Change In Net Sales | ||||||||||||||||
| Sales (MUSD) | Reported | Currency effects1) | Organic | |||||||||||||
| Asia |
$ | 3,098 | 4.2 | % | (1.4 | )% | 5.6 | % | ||||||||
| Whereof: China |
1,521 | 8.3 | % | 0.1 | % | 8.2 | % | |||||||||
| Japan |
688 | (0.1 | )% | (7.8 | )% | 7.7 | % | |||||||||
| Rest of Asia |
889 | 0.9 | % | 1.2 | % | (0.3 | )% | |||||||||
| Americas |
3,099 | 5.3 | % | (1.3 | )% | 6.6 | % | |||||||||
| Europe |
3,043 | 5.5 | % | (1.0 | )% | 6.5 | % | |||||||||
|
|
|
|
|
|
|
|
|
|||||||||
| Global |
$ | 9,240 | 5.0 | % | (1.2 | )% | 6.2 | % | ||||||||
1) Effects from currency translations. 2) Includes sales of steering wheels, passive safety electronics and inflators.
NET SALES
Consolidated sales increased to $9,240 million from $8,803 million in 2013. Excluding currency effects, the organic sales growth (non-U.S. GAAP measure, see page 42 in the Annual Report) was more than 6%. All regions of the Company showed organic sales growth in 2014.
Sales of airbag products (including steering wheels and passive safety electronics) were favorably impacted by higher volumes of steering wheels, side airbags, knee airbags and safety electronics.
Sales of seatbelt products were particularly strong in Europe and North America. The growth was partly offset by unfavorable model transitions in Asia. The global trend towards more advanced and higher value-added seatbelt systems continued globally.
The strong increase in sales of active safety products (automotive radars, night vision systems and cameras with driver assist systems) resulted from growth in all areas of this business. Sales of radar related products were particularly strong, largely as a result of Mercedes’ further roll-out of Collision Prevention Assist (CPA) across most of its platforms. Sales of vision systems to BMW and increased night vision sales to BMW and Mercedes also contributed to the growth.
In 2014, sales in the Americas represent 34% of total sales, Asia (China, Japan, RoA) 33% and Europe 33%. Sales continue to be balanced across the regions. Growth in 2014 was well distributed with the exception of South America and the Rest of Asia.
Sales from Autoliv’s companies in China grew by more than 8%. Models from Ford, VW, Baojun, Great Wall and Haima particularly contributed to the growth. The Company experienced a slowdown in growth in the second half of 2014 due to low demand for models with high Autoliv content.
Organic sales (non-U.S. GAAP measure, see page 42 in the Annual Report) from Autoliv’s companies in Japan showed strong growth in 2014. This was primarily a result of a favorable model mix, particularly with Mazda and Toyota and specifically for the Nissan/Mitsubishi co-developed Dayz Roox.
Organic sales (non-U.S. GAAP measure, see page 42 in the Annual Report) from Autoliv’s companies in the RoA were essentially flat.
Sales from Autoliv’s companies in the Americas were positively impacted by the ramp up of key launches with high safety content, primarily from Nissan, Jeep, Toyota and Hyundai. In general Japanese OEM’s were strong contributors to the growth.
Sales from Autoliv’s companies in Europe were driven by sales to Mercedes through its continued roll out of CPA across most platforms as well as higher installation rates for blind spot radar. Models from Ford, VW and Land Rover also contributed to the growth.
GROSS PROFIT
Gross profit increased by $99 million in 2014, primarily as a result of the higher sales. Gross margin increased by 0.1pp as a result of the organic sales growth (non-U.S. GAAP measure, see page 42 in the Annual Report), favorable currency effects and raw material savings. These positive effects were offset by our continued investments in production capacity and growth, including vertical integration.
OPERATING INCOME
Operating income decreased by $39 million to $723 million and the operating margin by 0.8pp to 7.8%. This decline in the operating margin was mainly due to the settlements of antitrust related class actions in the United States.
Research, Development and Engineering (R,D&E) net, was $46 million higher due to costs for growth and increased development and engineering costs in active safety.
Costs related to the capacity alignment program were $45 million and costs related to antitrust matters (including settlements of class actions) were $75 million compared to $40 million and $7 million, respectively, in 2013.
INTEREST EXPENSE, NET
Interest expense, net increased by $30 million to $59 million compared to 2013. The increase relates primarily to recent financing (see Note 12 to Consolidated Financial Statements included herein). In addition, during 2014, Autoliv had a net cash position of $260 million on average, compared to $437 million on average in 2013 (see Treasury Activities on page 48 in the Annual Report).
INCOME TAXES
Income before taxes decreased by $67 million to $667 million, mainly due to higher interest expense from the financing completed in 2014. Income tax expense was $198 million compared to $244 million in 2013. In 2014, discrete tax items, net, decreased the tax rate by 0.7pp. The effective tax rate was 29.7% compared to 33.2% for 2013 when discrete tax items net, increased the rate by 4.5pp. See Note 4 to Consolidated Financial Statements included herein.
NET INCOME AND EARNINGS PER SHARE
Net income attributable to controlling interest amounted to $468 million compared to $486 million in 2013.
EPS amounted to $5.06 assuming dilution compared to $5.07 for 2013. EPS assuming dilution was negatively affected by capacity alignments and legal costs by 53 cents, higher interest expense by 23 cents and higher underlying tax rate by 16 cents. These negative effects were offset by higher operating income by 32 cents and lower amount of shares outstanding by 18 cents. In addition, the 2013 EPS was negatively affected by 41 cents from a non-recurring allowance for deferred tax assets.
The weighted average number of shares outstanding assuming dilution decreased to 92.4 million compared to 95.9 million for the full year 2013.
Year Ended December 31, 2013 Versus 2012
| Component Of Change In Net Sales | ||||||||||||||||||||
| Sales (MUSD) | Reported | Acquisitions/divestitures | Currency effects1) | Organic | ||||||||||||||||
| Airbags and associated products2) |
$ | 5,686 | 5.5 | % | — | (0.7 | )% | 6.2 | % | |||||||||||
| Seatbelts and associated products |
2,772 | 4.4 | % | (0.6 | )% | 0.5 | % | 4.5 | % | |||||||||||
| Active safety products |
345 | 58.0 | % | — | 1.0 | % | 57.0 | % | ||||||||||||
|
|
|
|
|
|
|
|
|
|
|
|||||||||||
| Global |
$ | 8,803 | 6.5 | % | (0.2 | )% | (0.3 | )% | 7.0 | % | ||||||||||
| Component Of Change In Net Sales | ||||||||||||||||||||
| Sales (MUSD) | Reported | Acquisitions/divestitures | Currency effects1) | Organic | ||||||||||||||||
| Asia |
$ | 2,974 | 8.1 | % | — | (4.2 | )% | 12.3 | % | |||||||||||
| Whereof: China |
1,406 | 28.0 | % | — | 2.3 | % | 25.7 | % | ||||||||||||
| Japan |
688 | (17.1 | )% | — | (18.2 | )% | 1.1 | % | ||||||||||||
| Rest of Asia |
880 | 6.8 | % | — | 1.2 | % | 5.6 | % | ||||||||||||
| Americas |
2,943 | 3.7 | % | — | 0.3 | % | 3.4 | % | ||||||||||||
| Europe |
2,886 | 7.9 | % | (0.6 | )% | 3.1 | % | 5.4 | % | |||||||||||
|
|
|
|
|
|
|
|
|
|
|
|||||||||||
| Global |
$ | 8,803 | 6.5 | % | (0.2 | )% | (0.3 | )% | 7.0 | % | ||||||||||
1) Effects from currency translations. 2) Includes sales of steering wheels, passive safety electronics and inflators.
NET SALES
Consolidated sales increased to $8,803 million from $8,267 million in 2012. Excluding the effect from a 2012 divestiture and currencies, the organic sales growth (non-U.S. GAAP measure, see page 42 in the Annual Report) was 7%. All areas of the Company showed sales growth for the full year, with sales in China and of active safety products as the two individually most significant contributors. Together these two areas represented 70% of Autoliv’s organic sales growth in 2013.
Sales of airbag products (including steering wheels and passive safety electronics) were favorably impacted by higher volumes of steering wheels, knee air-bags, pedestrian protection airbags and passive safety electronics.
Sales of seatbelt products were particularly strong in China and South -America. The reported sales were negatively affected by 0.6% from the divestiture of -Autoliv Mekan AB in 2012. Additionally, the global trend towards more advanced and higher value-added seatbelt systems continued globally.
The strong increase in sales of active safety products (automotive radars, night vision systems and cameras with driver assist systems) resulted from growth in all areas of this business. Sales of radar related products were particularly strong, largely as a result of Mercedes’ decision to introduce CPA across most of its platforms. Sales of vision systems to BMW and night vision to Mercedes also contributed to the growth.
For the full year 2013, sales in Asia (China, Japan, RoA) represent 34% of total sales, the Americas 33% and Europe 33%. Sales continue to be balanced across the regions and 2013 marks the first time for Asia as the largest region in terms of sales.
Sales from Autoliv’s companies in China grew rapidly with both Chinese and global OEMs. A number of models contributed, most importantly Great Wall’s M4 and Haval’s H6, Wuling’s Hongguang, Geely’s Emgrand, Jianghuai’s Refine S5, Nissan’s Teana and Sylphy, Ford’s Kuga and Focus and Hyundai’s Santa Fe.
Sales from Autoliv’s companies in Japan had slight organic growth despite declining LVP, with sales of high content export vehicles increasing during the year.
Sales from Autoliv’s companies in the RoA grew primarily through strong sales growth in Thailand, with Mitsubishi’s Mirage, and in South Korea as a result of a favorable model mix with KIA.
Sales from Autoliv’s companies in the Americas were positively impacted by increases in a number of models from Ford, such as the Fusion, and Nissan’s Pathfinder and Altima.
Sales from Autoliv’s companies in Europe were driven by sales to Mercedes through its roll out of CPA across most platforms and high sales for the E- and S-Class models. Increasing market share and strong growth for premium brands such as BMW’s 3-series and Land Rover’s Range Rover models contributed to the increased sales in Europe.
GROSS PROFIT
Gross profit increased by $58 million, primarily as a result of the higher sales. Gross margin declined by 0.5pp compared to 2012 mainly as a result of a combination of operational inefficiencies in Europe and Brazil, as well as adverse currency effects, primarily from the Japanese Yen, Turkish Lira and Brazilian Real. Lower raw material costs had a positive impact.
OPERATING INCOME
Operating income increased by $56 million to $761 million and the operating margin by 0.1pp to 8.6%. R,D&E net, was $34 million higher due to costs for growth and high engineering costs in active safety. The increase was partly offset by higher engineering income.
Costs for capacity alignments and antitrust matters had a negative impact on the operating margin by 0.6pp in 2013 compared to 1.2pp in 2012 (see Note 16 to Consolidated Financial Statements included herein).
INTEREST EXPENSE, NET
Interest expense, net decreased by $9 million to $29 million compared to 2012. The decrease relates primarily to the $110 million US Private Placement note that matured in November 2012 and also to the remarketing in March 2012 of our senior notes due in 2014 (see Note 12 to Consolidated Financial Statements included herein). In addition, during 2013, Autoliv had a net cash position of $437 million on average, compared to $214 million on average in 2012 (see Treasury Activities on page 48 in the Annual Report).
INCOME TAXES
Income before taxes increased by $65 million to $734 million, $9 million more than the increase in operating income, mainly due to lower interest expense, net. Income tax expense was $244 million compared to $183 million in 2012. In 2013, discrete tax items, net of $33 million increased the rate by 4.5pp. The effective tax rate was 33.2% compared to 27.4% for 2012 when discrete tax items, net reduced the rate by 0.6pp. See Note 4 to Consolidated Financial Statements included herein.
NET INCOME AND EARNINGS PER SHARE
Net income attributable to controlling interest amounted to $486 million compared to $483 million in 2012.
EPS amounted to $5.07 assuming dilution compared to $5.08 for 2012. EPS assuming dilution was negatively affected by an increase in the valuation allowance related to deferred tax assets of $39 million or $0.41 per share. This non-cash, non-recurring allowance is related to the inefficiencies in Europe and capacity alignment due to depressed volumes in the region. These effects were partly offset by the positive effect from lower capacity alignment costs.
The weighted average number of shares outstanding assuming dilution increased to 95.9 million compared to 95.1 million for the full year 2012.
Liquidity, Resources and Financial Position
CASH FROM OPERATIONS
Cash flow from operations, together with available financial resources and credit facilities, are expected to be sufficient to fund Autoliv’s anticipated working capital requirements, capital expenditures and future dividend payments.
Cash provided by operating activities was $713 million in 2014, $838 million in 2013 and $689 million in 2012.
While management of cash and debt is important to the overall business, it is not part of the operational management’s day-to-day responsibilities. We there-fore focus on operationally derived working capital and have set a policy that the operating working capital should not exceed 10% of the last 12-month net sales.
At December 31, 2014, operating working capital (non-U.S. GAAP measure see page 42 in the Annual Report) stood at $595 million corresponding to 6.4% of net sales compared to $543 million and 6.2%, respectively, at December 31, 2013. This ratio was reduced by 0.9pp in 2014 and by 1.0pp in 2013 by provisions for capacity alignment and other restructuring charges, and favorably impacted by 0.9pp and 1.0pp, respectively, from the sale of receivables and discounting of notes totaling $79 million in 2014 and $93 million in 2013 (see “Treasury Activities” on page 48 in the Annual Report).
Days receivables outstanding (see page 83 in the Annual Report for definition) increased to 71 at December 31, 2014 from 70 days on December 31, 2013. Factoring agreements did not have any material effect on days receivables outstanding for 2014, 2013 or 2012.
Days inventory outstanding (definition on page 83 in the Annual Report) increased to 32 at December 31, 2014 from 31 one year earlier.
CAPITAL EXPENDITURES
Cash generated by operating activities continued to sufficiently cover capital expenditures for property, plant and equipment.
Capital expenditures, gross were $456 million in 2014, $386 million in 2013 and $365 million in 2012, corresponding to 4.9%, 4.4% and 4.4% of net sales, respectively.
Capital expenditures, net amounted to $453 million and depreciation and amortization totalled $305 million in 2014 compared to $379 million and $286 million, respectively, for the full year 2013.
Capital expenditures for 2015 are expected to be 5-6% of sales to support our growth strategy. Excluding capital expenditures for the inflator replacement business, capital expenditures would have been expected to be 4-5% of sales.
During 2014, major investments have been made to increase manufacturing capacity of inflators in Asia and America. The investments to increase inflator manufacturing capacity in Asia has primarily been done in China. In China larger investments also have been done to increase manufacturing capacity for Airbag cushions. Large investments has also been commenced to meet increase of demands in manufacturing of electronic products in all regions. In addition, expansion of five facilities in Europe were commenced for manufacturing of seatbelt, webbing, cushion sewing and steering wheel to meet increase in demand and to support the ongoing restructuring program.
During 2013, construction commenced on three new facilities in China to meet the need of additional manufacturing capacity for webbing manufacturing, cushion fabric weaving and cushion sewing, as well as an expansion of the existing steering wheel facility in China. In addition, major investments were made to increase manufacturing capacity of inflators in all the three regions Americas, Asia and Europe.
During 2012, construction was commenced on a new gas generant facility in China and on an expansion of the existing generant and initiator facilities in North America. These investments will allow us to increase, long-term, our airbag production capacity by up to 30%. In 2012, we also began the extension of our seatbelt assembly plant in Hungary and Autoliv’s technical center in China; completed a new assembly facility for seatbelts in Indonesia; a new steering wheel plant was brought into operations in Romania; and a new seatbelt assembly plant was brought into operations in Russia.
BUSINESS COMBINATIONS, ACQUISITIONS AND DIVESTMENTS
Historically, the Company has made many acquisitions. Generally, we focus on two principal growth areas around our core business with the greatest potential: active safety systems and growth markets.
No business combinations or acquisitions occurred in 2014, 2013 or 2012 although Autoliv did divest Autoliv Mekan AB in 2012, which manufactured seat components, primarily for seats in Volvo vehicles. This non-core subsidiary had sales of SEK 260 million (approximately $33 million) and slightly less than 200 employees.
FINANCING ACTIVITIES
In 2014, cash of $226 million was provided by financing activities. In 2013 and 2012, cash used in financing activities amounted to $318 million and $91 million, respectively. Gross debt increased by $982 million to $1,601 million at December 31, 2014 and decreased by $14 million to $619 million at December 31, 2013. In 2014, the Company repurchased common shares amounting to $616 million, see Note 13 to Consolidated Financial Statements included herein. Cash and cash equivalents increased by $411 million to $1,529 million in 2014 and by $141 million to $1,118 million in 2013.
The Company’s net cash (non-U.S. GAAP measure see page 42 in the Annual Report) position decreased by $573 million to a net debt position of $62 million at December 31, 2014. During 2013, net cash increased by $151 million to $511 million at December 31, 2013.
FOREIGN EARNINGS
Substantially all of the Company’s non-U.S. earnings are permanently reinvested outside the U.S. The permanently reinvested earnings are, therefore, not planned to be repatriated to the U.S. and are not necessary to fund our U.S. operations or requirements. The U.S. companies have sufficient liquidity to finance all currently projected funding needs in the U.S. for the foreseeable future. Total cash and cash equivalents as of December 31, 2014 was $1.5 billion, whereof $1.0 billion was in the U.S.
INCOME TAXES
The Company has reserves for taxes that may become payable in future periods as a result of tax audits.
At any given time, the Company is undergoing tax audits covering multiple years in several tax jurisdictions. Ultimate outcomes are uncertain but could, in future periods, have a significant impact on the Company’s cash flows. See discussions of income taxes under “Accounting Policies” on page 50 in the Annual Report and also Note 4 to Consolidated Financial Statements included herein.
PENSION ARRANGEMENTS
The Company has defined benefit pension plans covering nearly half of the U.S. employees. The Company froze participation in the U.S. plans to exclude employees hired after December 31, 2003. Many of the Company’s non-U.S. employees are also covered by pension arrangements.
At December 31, 2014, the Company’s pension liability (i.e. the actual funded status) for its U.S. and non-U.S. plans was $233 million and $147 million one year earlier. The plans had a net unamortized actuarial loss of $161 million recorded in Accumulated Other Comprehensive (Loss) Income in the Consolidated Statement of Equity at December 31, 2014, compared to $76 million at December 31, 2013. The amortization of this loss is expected to be $10 million in 2015.
The liability increase in 2014 of $85 million was mainly due to a decrease in the discount rate for all plans and changes in mortality assumptions for the U.S. plans, offset by foreign currency translation of the non-U.S. plans and increase in fair value of U.S. and non-U.S. plan assets. The liability decrease in 2013 of $108 million was mainly due to an increase in the discount rate for the U.S. plans and contributions of $50 million.
Pension expense associated with the defined benefit plans was $25 million in 2014, $40 million in 2013 and $36 million in 2012 and is expected to be $33 million in 2015. The decrease in pension expense associated with the defined benefit plans in 2014 of $15 million was mainly due to a prior year increase in discount rates. The increase in pension expense associated with the defined benefit plans in 2013 of $4 million was mainly due to a prior year decrease in discount rates. The increase in pension expense associated with the defined benefit plans in 2012 of $3 million was mainly due to a $7 million increase in the U.S. plans as a result of the decrease in discount rate, offset by a decrease in Japan due to the Japanese plan conversion in 2011.
The Company contributed $16 million to its defined benefit plans in 2014, $50 million in 2013 and $19 million in 2012. The increase in defined benefit plan contributions in 2013 was mainly due to an unscheduled voluntary contribution of $35 million to a U.S. pension plan in the fourth quarter. The Company expects to contribute $14 million to these plans in 2015 and is currently projecting a yearly funding at approximately the same level in the subsequent years.
For further information about retirement plans see Note 18 to Consolidated Financial Statements included herein.
SHAREHOLDER RETURNS
Total cash dividends paid were $195 million in 2014, $191 million in 2013 and $178 million in 2012. The Company has raised the dividend from 40 cents per share in 2011 to 54 cents per share in 2014, see table below. The Board of Directors has declared a dividend of 54 cents per share for the first quarter and 56 cents per share for the second quarter of 2015. The annualized dividend amount of $192 million, is based on 54 cents per share and the number of shares outstanding at December 31, 2014.
During the fourth quarter 2013, the Company reactivated its share repurchase program and repurchased 1.6 million shares for cash of $148 million, including commissions. During 2014, the Company repurchased 6.2 million shares for cash of $616 million, including commissions. In total, Autoliv has repurchased 42.2 million shares between May 2000 and December 2014 for cash of $2,237.0 million, including commissions. The maximum number of shares that are available to be purchased under the stock repurchase program at December 31, 2014 is 5.3 million. There is no expiration date for the share repurchase authorization in order to provide management flexibility in the Company’s share repurchases. For further information see Note 13 to Consolidated Financial Statements included herein.
| DIVIDENDS PAID |
2011 | 2012 | 2013 | 2014 | 2015 | |||||||||||||||
| 1st Quarter |
$ | 0.40 | $ | 0.45 | $ | 0.50 | $ | 0.52 | $ | 0.54 | 1) | |||||||||
| 2nd Quarter |
$ | 0.43 | $ | 0.47 | $ | 0.50 | $ | 0.52 | $ | 0.56 | 1) | |||||||||
| 3rd Quarter |
$ | 0.45 | $ | 0.47 | $ | 0.50 | $ | 0.54 | ||||||||||||
| 4th Quarter |
$ | 0.45 | $ | 0.50 | $ | 0.50 | $ | 0.54 | ||||||||||||
1) Declared.
EQUITY
During 2014, total equity decreased by 14% or $558 million to $3,442 million. Equity was reduced by $616 million due to share repurchases, $205 million due to negative currency effects, close to $199 million due to dividends and by $49 million due to changes in pension liabilities. These unfavorable effects were offset by net income of $469 million and a $41 million effect from the issuance of shares and other effects related to stock compensation.
During 2013, total equity increased by 6% or $224 million to $4,000 million. This was due to net income of $490 million, $59 million due to changes in pension liabilities and a $36 million effect from the issuance of shares and other effects related to stock compensation. Equity was reduced by $196 million due to dividends, by $17 million due to negative currency effects and by $148 million due to share repurchases.
IMPACT OF INFLATION
Inflation has generally not had a significant impact on the Company’s financial position or results of operations. The impact of raw material prices in 2013 and 2014 was positive by $23 million and $19 million, respectively. For 2015, we currently expect a favorable impact of more than $30 million from declining raw material prices.
Changes in most raw material prices affect the Company with a time lag, which is usually three to six months for most materials (see “Component Costs” on page 51 in the Annual Report).
In many growth markets, inflation is relatively high, especially labor inflation. We have managed to offset this negative effect mainly by labor productivity improvements. However, no assurance can be given that this will continue to be possible going forward.
PERSONNEL
During the past three years, total headcount (permanent employees and temporary personnel) has risen by 25% from the beginning of 2012 to 60,000 in 2014. This reflects the rebound in the cyclical automotive business as well as the combined effect of long-term growth of global LVP, strong demand for safer vehicles and Autoliv’s market share gains, which all drive the need for additional manufacturing personnel.
During 2014 and 2013, headcount increased by 3,500 and 5,500, respectively, with no impact from acquisitions or divestitures. During 2012, headcount increased by 3,000 despite a decrease of 200 due to divestitures and no impact from acquisitions. Excluding acquisitions and divestitures, headcount increased by 6% during 2014, 11% during 2013 and 7% during 2012, which should be compared to increases in organic sales of 6%, 7% and 4% for the same years. During 2014 and 2013, Autoliv’s vertical integration and manufacturing in low-cost-countries (LCC) increased as a means to offset price erosion in the automotive industry which caused headcount to increase faster than sales.
At the end of 2014, 74% of total headcount was in LCC compared to 66% at the beginning of 2012. Furthermore, 72% of total headcount at December 31, 2014 was direct workers in manufacturing compared to 71% at the beginning of 2012, while 15% of total headcount at December 31, 2014 were temporaries, compared to 20% at the beginning of 2012.
Compensation to directors and executive officers is reported, as is customary for U.S. public companies, in Autoliv’s proxy statement, which will be available to shareholders in March 2015.
Treasury Activities
CREDIT FACILITIES
In April 2012, Autoliv extended essentially all of its $1.1 billion Revolving Credit Facility (RCF) from April 2016 to April 2017 with unchanged terms and conditions. The RCF was refinanced in 2011 and is syndicated among 13 banks, has a margin of 0.45% on the applicable LIBOR or IBOR when utilized, given the rating of A- from Standard & Poor’s at December 31, 2014. In November 2012, a U.S. private placement note of $110 million matured, which had a fixed interest rate of 5.6%. A fixed-rate note was issued in December 2012 of 350 million SEK ($45 million equivalent). This 5-year note matures in December 2017 and carries a fixed interest rate of 2.49%. The remainder of EIB’s commitment was cancelled in December 2012.
In 2013, Autoliv extended essentially all of its $1.1 billion RCF from April 2017 to April 2018 with unchanged terms and conditions. In July 2013, Autoliv AB, entered into an 18-month financing commitment agreement with EIB, giving- Autoliv AB access to a loan of €200 million ($244 million equivalent).
In 2014, the Company issued and sold $1.25 billion of long-term debt securities in a U.S. Private Placement pursuant to a Note Purchase and Guaranty Agreement dated April 23, 2014, by and among Autoliv ASP Inc., the Company and the purchasers listed therein. The senior notes have an average interest rate of 3.84%, and consist of: $208 million aggregate principal amount of 5-year senior notes with an interest rate of 2.84%; $275 million aggregate principal amount of 7-year senior notes with an interest rate of 3.51%; $297 million aggregate principal amount of 10-year senior notes with an interest rate of 4.09%; $285 million aggregate principal amount of 12-year senior notes with an interest rate of 4.24%; and $185 million aggregate principal amount of 15-year senior notes with an interest rate of 4.44%. In January 2015, Autoliv AB amended the financing commitment agreement with EIB to extend the facility for a 12-month period until January 2016.
At December 31, 2014, Autoliv’s unutilized long-term credit facilities were $1.3 billion, represented by the RCF and the EIB credit facility. Neither of these facilities are subject to any financial covenants nor is any other substantial financing of Autoliv. The Company had a net debt position at year end 2014 of $62 million and had a net cash position at year end 2013 of $511 million. See Note 12 to Consolidated Financial Statements included herein for additional information.
During 2014 and 2013, the Company sold receivables and discounted notes related to selected customers. These factoring arrangements increase cash while reducing accounts receivable and customer risks. At December 31, 2014, the Company had received $79 million for sold receivables without recourse and discounted notes with a discount of $2 million during the year, compared to $93 million at year end 2013 with a discount of $2 million recorded in Other non-operating items, net.
Autoliv’s long-term credit rating from Standard and Poor’s was upgraded from BBB+ to A- with stable outlook in December 2013. Autoliv’s credit rating is in line with its objective of maintaining a strong investment grade rating.
EQUITY AND EQUITY UNITS
In March 2009, the Company sold approximately 14.7 million treasury shares at $16.00 and 6.6 million equity units at $25.00, which generated net proceeds of $377 million.
Originally, the face value of the debt related to the equity units amounted to $165 million, and the number of shares that would have been issued as a result of the equity units was between 8.6 million and 10.3 million. In 2010, Autoliv conducted various accelerated exchange transactions that reduced our debt by $54 million and increased equity by $57 million. The Company also recorded a debt extinguishment cost of $12 million related to these exchanges, but the transaction saved $16 million in interest expense through April 2012.
In March 2012, Autoliv completed the remarketing of the senior notes and the coupon on the notes was reset to 3.854% with a yield of 2.875% per annum. On April 30, 2012, Autoliv settled the purchase contracts underlying the 4,250,920 outstanding equity units by issuing approximately 5.8 million shares of common stock in exchange for approximately $106 million in cash. Following the settlement of the purchase contracts no equity units were outstanding. On April 30, 2014, the remarketed $106 million senior notes matured and are therefore no longer outstanding.
For dilution effects from these transactions, see “Number of Shares” below. For an additional description of our equity units, see Note 13 to Consolidated Financial Statements included herein.
NUMBER OF SHARES
At December 31, 2014, 88.7 million shares were outstanding (net of 14.1 million treasury shares), a 6% decrease from 94.4 million one year earlier mainly due to the share repurchase program, see below.
Due to the settlement of the remaining equity units, the number of shares outstanding increased on April 30, 2012 by 5.8 million. The number of shares out-standing is expected to further increase by 0.7 million when all Restricted Stock Units (RSU) vest and if all stock options to key employees are exercised, see Note 15 to Consolidated Financial Statements included herein.
For calculating earnings per share assuming dilution, Autoliv follows the Treasury Stock Method. As a result, the dilutive effect from the equity units varied with the price of Autoliv’s shares during 2012. For 2012, 1.3 million shares were included in the dilutive weighted average share amount related to the equity units. Due to the settlement in April 2012 there is no effect in 2013 and 2014, see Note 20 to Consolidated Financial Statements included herein.
During the fourth quarter of 2013, the Company reactivated its previously established share repurchase program. The maximum number of shares that may yet be purchased under the stock repurchase program amount to 5.3 million shares at December 31, 2014. In total, Autoliv has repurchased 42.2 million shares between May 2000 and December 2014 for cash of $2,237.0 million, including commissions. The average cost per share for all repurchased shares to date is $53.07. Purchases can be made from time to time as market and business conditions warrant in open market, negotiated or block transactions. There is no expiration date for the repurchase program in order to provide management flexibility in the Company’s share repurchases.
Contractual Obligations and Commitments
| AGGREGATE CONTRACTUAL OBLIGATIONS1) (DOLLARS IN MILLIONS) |
Payments due by Period | |||||||||||||||||||
| Total | Less than 1 year | 1-3 years | 3-5 years | More than 5 years | ||||||||||||||||
| Debt obligations including DRD2) |
$ | 1,591 | $ | 79 | $ | 202 | $ | 268 | $ | 1,042 | ||||||||||
| Fixed-interest obligations including DRD2) |
485 | 59 | 113 | 95 | 218 | |||||||||||||||
| Operating lease obligations |
115 | 38 | 44 | 23 | 10 | |||||||||||||||
| Pension contribution requirements3) |
14 | 14 | — | — | — | |||||||||||||||
| Other non-current liabilities reflected on the balance sheet |
22 | — | 15 | 3 | 4 | |||||||||||||||
|
|
|
|
|
|
|
|
|
|
|
|||||||||||
| Total |
$ | 2,227 | $ | 190 | $ | 374 | $ | 389 | $ | 1,274 | ||||||||||
|
|
|
|
|
|
|
|
|
|
|
|||||||||||
1) Excludes contingent liabilities arising from litigation, arbitration, income taxes or regulatory actions. 2) Debt-Related Derivatives (DRD), see Note 12 to the Consolidated Financial Statements included herein. 3) Expected contributions for funded and unfunded defined benefit plans exclude payments beyond 2015.
Contractual obligations include debt, lease and purchase obligations that are enforceable and legally binding on the Company. Non-controlling interest and restructuring obligations are not included in this table. The major employee obligations as a result of restructuring are disclosed in Note 10 to Consolidated Financial Statements included herein.
Debt obligations including Debt-Related Derivatives (DRD): For material contractual provisions, see Note 12 to Consolidated Financial Statements included herein. The debt obligations include capital lease obligations, which mainly relate to property and plants in Europe, as well as the impact of revaluation to fair value.
Fixed-interest obligations including DRD: These obligations include interest on debt and credit agreements relating to periods after December 31, 2014, as adjusted by DRD, excluding fees on the revolving credit facility and interest on debts with no defined amortization plan.
Operating lease obligations: The Company leases certain offices, manufacturing and research buildings, machinery, automobiles and data processing and other equipment. Such operating leases, some of which are non-cancelable and include renewals, expire on various dates. See Note 17 to Consolidated Financial Statements included herein.
Unconditional purchase obligations: There are no unconditional purchase obligations other than short-term obligations related to inventory, services, tooling, and property, plant and equipment purchased in the ordinary course of business.
Purchase agreements with suppliers entered into in the ordinary course of business do not generally include fixed quantities. Quantities and delivery dates are established in “call off plans” accessible electronically for all customers and suppliers involved. Communicated “call off plans” for production material from suppliers are normally reflected in equivalent commitments from Autoliv customers.
Pension contribution requirements: The Company sponsors defined benefit plans that cover a significant portion of our U.S. employees and certain non-U.S. employees. The pension plans in the U.S. are funded in conformity with the minimum funding requirements of the Pension Protection Act of 2006. Funding for our pension plans in other countries is based upon plan provisions, actuarial recommendations and/or statutory requirements.
In 2015, the expected contribution to all plans, including direct payments to retirees, is $14 million, of which the major contribution is $7 million for our U.S. pension plans. Due to volatility associated with future changes in interest rates and plan asset returns, the Company cannot predict with reasonable reliability the timing and amounts of future funding requirements, and therefore the above excludes payments beyond 2015. We may elect to make contributions in excess of the minimum funding requirements for the U.S. plans in response to investment performance and changes in interest rates, or when we believe that it is financially advantageous to do so and based on other capital requirements.
Excluded from the above are expected contributions of $1 million due in 2015 with respect to our other post-employment benefit (OPEB) plans, which represents the expected benefit payments to participants as costs are incurred. See Note 18 to Consolidated Financial Statements included herein.
Other non-current liabilities reflected on the balance sheet: These consist mainly of local governmental liabilities.
OFF-BALANCE SHEET ARRANGEMENTS
The Company does not have any off-balance sheet arrangements that have, or are reasonably likely to have, a material current or future effect on its financial position, results of operations or cash flows.
Accounting Policies
NEW ACCOUNTING PRONOUNCEMENTS
The Company has evaluated all applicable recently issued accounting guidance. None of these recently issued pronouncements have had, or are expected to have, a significant impact on the Company’s future Consolidated Financial Statements. See page 62 in the Annual Report for additional information.
APPLICATION OF CRITICAL ACCOUNTING POLICIES
The Company’s significant accounting policies are disclosed in Note 1 to the Consolidated Financial Statements included herein.
Senior management has discussed the development and selection of critical accounting estimates and disclosures with the Audit Committee of the Board of Directors. The application of accounting policies necessarily requires judgments and the use of estimates by a Company’s management. Actual results could differ from these estimates.
Management considers it important to assure that all appropriate costs are recognized on a timely basis. In cases where capitalization of costs is required (e.g., certain pre-production costs), stringent realization criteria are applied before capitalization is permitted. The depreciable lives of fixed assets are intended to reflect their true economic life, taking into account such factors as product life cycles and expected changes in technology. Assets are periodically reviewed for realizability and appropriate valuation allowances are established when evidence of impairment exists. Impairment of long-lived assets has generally not been significant.
REVENUE RECOGNITION
Revenues are recognized when there is evidence of a sales agreement, delivery of goods has occurred, the sales price is fixed and determinable and the collectability of revenue is reasonably assured. The Company records revenue from the sale of manufactured products upon shipment to customers and transfer of title and risk of loss under standard commercial terms.
Accruals are made for retroactive price adjustments if probable and can be reasonably estimated. Net sales exclude taxes assessed by a governmental authority that are directly imposed on revenue-producing transactions between the Company and its customers.
INVENTORY RESERVES
Inventories are evaluated based on individual or, in some cases, groups of inventory items. Reserves are established to reduce the value of inventories to the lower of cost or market, with market generally defined as net realizable value for finished goods and
replacement cost for raw materials and work-in-process. Excess inventories are quantities of items that exceed anticipated sales or usage for a reasonable period. The Company has guidelines for calculating provisions for excess inventories based on the number of months of inventories on hand compared to anticipated sales or usage. Management uses its judgment to forecast sales or usage and to determine what constitutes a reasonable period.
There can be no assurance that the amount ultimately realized for receivables and inventories will not be materially different than that assumed in the calculation of the reserves.
GOODWILL IMPAIRMENT
The Company performs an annual impairment review of goodwill in the fourth quarter of each year following the Company’s annual forecasting process. The estimated fair market value of goodwill is determined by the discounted cash flow method. The Company discounts projected operating cash flows using its weighted average cost of capital.
To supplement this analysis, the Company compares the market value of its equity, calculated by reference to the quoted market prices of its shares, with the book value of its equity. There were no goodwill impairments in 2012-2014. See “Goodwill and Intangible Assets” in Note 1 to Consolidated Financial Statements included herein.
RECALL PROVISIONS
The Company records liabilities for product recalls when probable claims are identified and when it is possible to reasonably estimate costs. Recall costs are costs incurred when the customer decides to formally recall a product due to a known or suspected safety concern. Product recall costs typically include the cost of the product being replaced as well as the customer’s cost of the recall, including labor to remove and replace the defective part.
RESTRUCTURING PROVISIONS
The Company defines restructuring expense to include costs directly associated with capacity alignment programs, exit or disposal activities. Estimates of restructuring charges are based on information available at the time such charges are recorded. In general, management anticipates that restructuring activities will be completed within a time frame such that significant changes to the exit plan are not likely.
Due to inherent uncertainty involved in estimating restructuring expenses, actual amounts paid for such activities may differ from amounts initially estimated. See Note 10 to the Consolidated Financial Statements included herein.
DEFINED BENEFIT PENSION PLANS
The Company has defined benefit pension plans in thirteen countries. The most significant plans exist in the U.S. These plans represent 60% of the Company’s total pension benefit obligation. See Note 18 to Consolidated Financial Statements included herein.
The Company, in consultation with its actuarial advisors, determines certain key assumptions to be used in calculating the projected benefit obligation and annual pension expense. For the U.S. plans, the assumptions used for calculating the 2014 pension expense were a discount rate of 5.00%, expected rate of increase in compensation levels of 3.50%, and an expected long-term rate of return on plan assets of 7.08%.
The assumptions used in calculating the U.S. benefit obligations disclosed as of December 31, 2014 were a discount rate of 4.00% and an expected age-based rate of increase in compensation levels of 3.50%. The discount rate for the U.S. plans has been set based on the rates of return of high-quality fixed-income investments currently available at the measurement date and are expected to be available during the period the benefits will be paid. The expected rate of increase in compensation levels and long-term return on plan assets are determined based on a number of factors and must take into account long-term expectations and reflect the financial environment in the respective local markets. At December 31, 2014, 54% of the U.S. plan assets were invested in equities, which is in line with the target of 55%.
The table below illustrates the sensitivity of the U.S. net periodic benefit cost and projected U.S. benefit obligation to a 1pp change in the discount rate, decrease in return on plan assets and increase in compensation levels for the U.S plans (in millions). The use of actuarial assumptions is an area of managements estimate.
INCOME TAXES
Significant judgment is required in determining the worldwide provision for income taxes. In the ordinary course of a global business, there are many transactions for which the ultimate tax outcome is uncertain. Many of these uncertainties arise as a consequence of inter-company transactions and arrangements.
Although the Company believes that its tax return positions are supportable, no assurance can be given that the final outcome of these matters will not be materially different than that which is reflected in the historical income tax provisions and accruals. Such differences could have a material effect on the income tax provisions or benefits in the periods in which such determinations are made. See Note 4 to Consolidated Financial Statements included herein.
CONTINGENT LIABILITIES
Various claims, lawsuits and proceedings are pending or threatened against the Company or its subsidiaries, covering a range of matters that arise in the ordinary course of its business activities with respect to commercial, product liability or other matters. See Note 16 to the Consolidated Financial Statements included herein and Item 3 – “Legal Proceedings” in our Form 10-K for the year ended December 31, 2014.
The Company diligently defends itself in such matters and, in addition, carries insurance coverage to the extent reasonably available against insurable risks.
The Company records liabilities for claims, lawsuits and proceedings when they are identified and it is possible to reasonably estimate the cost of such liabilities. Legal costs expected to be incurred in connection with a loss contingency are expensed as such costs are incurred.
| Assumption (in millions) |
Change | 2015 net periodic benefit cost (decrease) |
2014 projected benefit obligation increase (decrease) |
|||||||||
| Discount rate |
1pp increase | $ | (3 | ) | $ | (64 | ) | |||||
| 1pp decrease | $ | 6 | $ | 85 | ||||||||
| Compensation levels |
1pp increase | $ | 3 | $ | 27 | |||||||
| Return on plan assets |
1pp decrease | $ | 2 | n/a | ||||||||
Risks and Risk Management
The Company is exposed to several categories of risks. They can broadly be categorized as operational risks, strategic risks and financial risks. Some of the major risks in each category are described below. There are also other risks that could have a material effect on the Company’s results and financial position and the description below is not complete but should be read in conjunction with the discussion of risks in our 10-K filed with the SEC, which contains a description of our material risks.
As described below, the Company has taken several mitigating actions, applied many strategies, adopted policies, and introduced control and reporting systems to reduce and mitigate these risks. In addition, the Company from time to time identifies and evaluates emerging or changing risks to the Company in order to ensure that identified risks and related risk management are updated in this fast moving environment.
Operational Risks
LIGHT VEHICLE PRODUCTION
Since nearly 30% of Autoliv’s costs are relatively fixed, short-term earnings are highly dependent on capacity utilization in the Company’s plants and are, there-fore, sales dependent.
Global LVP is an indicator of the Company’s sales development. Ultimately, however, sales are determined by the production levels for the individual vehicle models for which Autoliv is a supplier (see Dependence on Customers). The Company’s sales are split over several hundred contracts covering approximately 1,400 vehicle models which generally moderates the effect of changes in vehicle demand of individual countries and regions or stops in production, due to, for instance, natural disasters. The risk in fluctuating sales has also been mitigated by Autoliv’s rapid expansion in Asia and other growth markets, which has reduced the Company’s former high dependence on Europe from more than 50% of sales to a diversified mix with Europe, the Americas and Asia each accounting for about one third of 2014 sales.
It is also the Company’s strategy to reduce this risk in fluctuating sales by using a high number of temporary employees instead of permanent employees. During 2012-2014, the level of temporary personnel in relation to total headcount varied between 15% and 20%.
However, when there is a dramatic reduction in the production of vehicle models supplied by the Company such as occurred during the financial crisis in 2008 and 2009 and during 2012 when Western European LVP declined by 8% followed by a flat development in 2013, it takes time to reduce the level of permanent employees and even longer to reduce fixed production capacity. As a result, our sales and margins could drop significantly and materially impact earnings and cash flow. Therefore, it is our strategy to have a strong financial position and high level of manufacturing in low-cost countries where more flexible labor-intensive production lines can be used than highly automated lines with fixed costs in high-cost countries.
PRICING PRESSURE
Pricing pressure from customers is an inherent part of the automotive components business. The extent of price reductions varies from year to year, and takes the form of reductions in direct sales prices as well as discounted reimbursements for engineering work.
In response, Autoliv is continuously engaged in efforts to reduce costs and to provide customers added value by developing new products. Generally, the speed by which these cost-reduction programs generate results will, to a large extent, determine the future profitability of the Company. The various cost-reduction programs are, to a considerable extent, interrelated. This interrelationship makes it difficult to isolate the impact on costs of any single program. Therefore, we monitor key measures such as costs in relation to sales and geographical employee mix.
COMPONENT COSTS
Changes in these component costs and raw material prices could have a major impact on margins, since the cost of direct materials is approximately 54.3% of sales.
Autoliv does not generally buy raw materials, but rather purchases manufactured components (such as stamped steel parts and sewn airbag cushions). In spite of this, raw material price changes in Autoliv’s supply chain could have a major impact on our profitability since approximately 50% of the Company’s component costs (corresponding to 27% of net sales) are comprised of raw materials. The remaining 50% are value added by the supply chain.
Currently, 34% of the raw material cost (or 17% of net sales) is based on steel prices; 31% on oil based prices (i.e. nylon, polyester and engineering plastics) (15% of net sales); 17% on electronic components, such as circuit boards (9% of net sales); and 7% on zinc, aluminum and other non-ferrous metals (3% of net sales).
Changes in most raw material prices affect the Company with a time lag. This lag used to be six to twelve months, but now more often three to six months. For non-ferrous industrial metals like aluminum and zinc, we have quarterly and sometimes monthly price adjustments.
The Company’s strategy is to offset price increases on cost of materials by taking several actions such as re-design of products to reduce material content (as well as weight), material standardization to globally available raw materials, consolidating volumes to fewer suppliers and moving components sourcing to low-cost countries. However, should these actions not be sufficient to offset component price increases, our earnings could be materially impacted.
LEGAL
The Company is involved from time to time in regulatory, commercial and contractual legal proceedings that may be significant, and the Company’s business may suffer as a result of adverse outcomes of current or future legal proceedings. These claims may include, without limitation, commercial or contractual disputes, including disputes with the Company’s suppliers and customers, intellectual property matters, regulatory matters and governmental investigations, personal injury claims, environmental issues, tax and customs matters, and employment matters.
The Company is currently subject to ongoing antitrust investigations by governmental authorities, as well as related civil litigation in the United States and Canada alleging anti-competitive conduct. In addition, management believes that additional antitrust authorities are evaluating whether to commence investigations. Such legal proceedings, including regulatory actions and government investigations, may seek recovery of very large indeterminate amounts or limit the Company’s operations, and the possibility that such proceedings may arise and their magnitude may remain unknown for substantial periods of time.
A substantial legal liability or adverse regulatory outcome and the substantial cost to defend the litigation or regulatory proceedings may have an adverse effect on the Company’s business, operating results, financial condition, cash flows and reputation.
No assurances can be given that such proceedings and claims will not have a material adverse impact on the Company’s profitability and consolidated financial position or that reserves or insurance will mitigate such impact. See Note 16 Contingent Liabilities to the Consolidated Financial Statements included herein and Item 3 – “Legal Proceedings” in our Form 10-K for the year ended December 31, 2014.
PRODUCT WARRANTY AND RECALLS
The Company is exposed to various claims for damages and compensation, if our products fail to perform as expected. Such claims can be made, and result in costs and other losses to the Company, even where the relevant product is eventually found to have functioned properly. If a product (actually or allegedly) fails to perform as expected, we may face warranty and recall claims. If such actual or alleged failure results in bodily injury and/or property damage, we may in addition face product liability and other claims. The Company may experience material warranty, recall or product liability claims or losses in the future, and the Company may incur significant cost to defend against such claims. The Company may also be required to participate in a recall involving its products. Each vehicle manufacturer has its own practices regarding product recalls and other product liability actions relating to its suppliers. As suppliers become more integrally involved in the vehicle design process and assume more vehicle assembly functions, vehicle manufacturers are increasingly looking to their suppliers for contribution when faced with recalls and product liability claims. In addition, with global platforms and procedures, vehicle manufacturers are increasingly evaluating our quality performance on a global basis. Any one or more quality, warranty or other recall issue(s) (also the ones affecting few units and/or having a small financial impact) may cause a vehicle manufacturer to implement measures which may have a severe impact on the Company’s operations, such as a temporary or prolonged suspension of new orders or the Company’s ability to bid for new business.
In addition, there is a risk that the number of vehicles affected by a failure or defect will increase significantly (as would the Company’s costs), since our products more frequently use global designs and are increasingly based on or utilize the same or similar parts, components or solutions.
A warranty, recall or a product liability claim brought against the Company in excess of the Company’s insurance may have a material adverse effect on its business and/or financial results. Vehicle manufacturers are also increasingly requiring their external suppliers to guarantee or warrant their products and bear the costs of repair and replacement of such products under new vehicle warranties. A vehicle manufacturer may attempt to hold the Company responsible for some or all of the repair or replacement costs of defective products under new vehicle warranties when the product supplied did not perform as represented. Additionally, a customer may not allow us to bid for expiring or new business until certain remedial steps have been taken. Accordingly, the future costs of warranty claims by the Company’s customers may be material. We believe our established reserves are adequate to cover potential warranty settlements typically seen in our business.
The Company’s warranty reserves are based upon management’s best estimates of amounts necessary to settle future and existing claims. Management regularly evaluates the appropriateness of these reserves, and adjusts them when we believe it is appropriate to do so. However, the final amounts determined to be due could differ materially from the Company’s recorded estimates.
The Company’s strategy is to follow a stringent procedure when developing new products and technologies and to apply a proactive “zero-defect” quality policy (see page 8 in the Annual Report). In addition, the Company carries product-liability and product-recall insurance at levels that management believes are generally sufficient to cover the risks. However, such insurance may not always be available in appropriate amounts or in all markets. Management’s decision regarding what insurance to procure is also impacted by the cost for such insurance. As a result, the Company may face material losses in excess of the insurance coverage procured. A substantial recall or liability in excess of coverage levels could therefore have a material adverse effect on the Company.
ENVIRONMENTAL
Most of the Company’s manufacturing processes consist of the assembly of components. As a result, the environmental impact from the Company’s plants is generally modest. While the Company’s businesses from time to time are subject to environmental investigations, there are no material environmental-related cases pending against the Company. Therefore, Autoliv does not incur (or expect to incur) any material costs or capital expenditures associated with maintaining facilities compliant with U.S. or non-U.S. environmental requirements. To reduce environmental risk, the Company has implemented an environmental management system and has adopted an environmental policy (see corporate website -www.autoliv.com) that requires, for instance, that all plants should be ISO-14001 certified.
However, environmental requirements are complex and are generally becoming more stringent over time. Accordingly, there can be no assurance that these requirements will not change in the future, or that we will at all times be in compliance with all such requirements and regulations, despite our intention to be. The Company may also find itself subject, possibly due to changes in legislation or other regulation, to environmental liabilities based on the activities of its predecessor entities or of businesses acquired. Such liability could be based on activities which are not at all related to the Company’s current activities.
Strategic Risks
REGULATIONS
In addition to vehicle production, the Company’s market is driven by the safety content per vehicle, which is affected by new regulations and new vehicle rating programs, in addition to consumer demand for new safety technologies.
The most important regulation is the U.S. federal law that, since 1997, requires frontal airbags for both the driver and the front-seat passenger in all new vehicles sold in the U.S. Seatbelt installation laws exist in all vehicle-producing countries. Many countries also have strict enforcement laws on the wearing of seatbelts. In 2007, the U.S. adopted new regulations for side-impact protection to be phased-in by 2015. China introduced a vehicle rating program in 2006, and Latin America introduced a similar program in 2010. The United States upgraded its vehicle rating program in 2010 and Europe completed an upgrade of its Euro NCAP rating system in 2012 and has initiated a further upgrade, which will be fully implemented by 2017. There are also other plans for improved automotive safety, both in these countries and many other countries that could affect the Company’s market.
However, there can be no assurance that changes in regulations will not adversely affect the demand for the Company’s products or, at least, result in a slower increase in the demand for them.
DEPENDENCE ON CUSTOMERS
In 2014 the five largest vehicle manufacturers account for 54% of global LVP and the ten largest manufacturers for 79%.
As a result of this highly consolidated market, the Company is dependent on a relatively small number of customers with strong purchasing power.
In 2014, the Company’s five largest customers accounted for 52% of revenues and the ten largest customers for 82% of revenues. For a list of the largest customers, see Note 19 to the Consolidated Financial Statements on page 80 in the Annual Report.
Our largest customer contract accounted for less than 4% of sales in 2014.
Although business with every major customer is split into several contracts (usually one contract per vehicle platform) and although the customer base has become more balanced and diversified as a result of Autoliv’s significant expansion in China and other rapidly-growing markets, the loss of all business from a major customer (whether by a cancellation of existing contracts or not awarding us new business), the consolidation of one or more major customers or a bankruptcy of a major customer could have a material adverse effect on the Company. In addition, a quality issue, shortcomings in our service to a customer or un-competitive prices or products could result in the customer not awarding us new business, which will gradually have a negative impact on our sales when current contracts start to expire.
CUSTOMER PAYMENT RISK
Another risk related to our customers is the risk that one or more customers will be unable to pay invoices that become due. We seek to limit this customer payment risk by invoicing major customers through their local subsidiaries in each country, even for global contracts. We thus try to avoid having the receivables with a multinational customer group exposed to the risk that a bankruptcy or similar event in one country puts all receivables with the customer group at risk. In each country, we also monitor invoices becoming overdue.
Even so, if a major customer would be unable to fulfill its payment obligations, it is likely that we would be forced to record a substantial loss on such receivables.
DEPENDENCE ON SUPPLIERS
Autoliv, at each stage of production, relies on internal or external suppliers in order to meet its delivery commitments. In some cases, customers require that the suppliers are qualified and approved by them. Autoliv’s supplier consolidation program seeks to reduce costs but increases our dependence on the remaining suppliers. As a result, the Company is dependent, in several instances, on a single supplier for a specific component. However, this dependence is mitigated by the fact that we seldom are dependent on a specific manufacturing technology. Consequently, we can often change suppliers, albeit with some costs and time for validation and customer approval.
Consequently, there is a risk that disruptions in the supply chain could lead to the Company not being able to meet its delivery commitments and, as a consequence, to extra costs. This risk increases as suppliers are being squeezed between higher raw material prices and the continuous pricing pressure in the automotive industry. This risk also increases when our internal and external suppliers are to a higher degree located in countries which have a higher political risk.
The Company’s strategy is to reduce these supplier risks by seeking to maintain an optimal number of suppliers in all significant component technologies, by standardization and by developing alternative suppliers around the world.
However, for various reasons including costs involved in maintaining alternative suppliers, this is not always possible. As a result, difficulties with a single supplier could impact more than one customer and product, and thus materially impact our earnings.
NEW COMPETITION
The market for occupant restraint systems has undergone a significant consolidation during the past ten years and Autoliv has strengthened its position in this passive safety market.
However, in the future, the most attractive growth opportunities may be in the active safety systems markets, which include and are likely to include other and often larger companies than Autoliv’s traditional competitors. Additionally, there is no guarantee our customers will adopt our new products or technologies.
Autoliv is reducing the risk of this trend by utilizing its leadership in passive safety to develop a strong position in active safety (see page 18 in the Annual Report).
PATENTS AND PROPRIETARY TECHNOLOGY
The Company’s strategy is to protect its innovations with patents, and to vigorously protect and defend its patents, trademarks and
know-how against infringement and unauthorized use. At the end of 2014, the Company held more than 6,600 patents. These patents expire on various dates during the period from 2015 to 2034. The expiration of any single patent is not expected to have a material adverse effect on the Company’s financial results.
Although the Company believes that its products and technology do not infringe upon the proprietary rights of others, there can be no assurance that third parties will not assert infringement claims against the Company in the future. Also, there can be no assurance that any patent now owned by the Company will afford protection against competitors that develop similar technology.
Financial Risks
The Company is exposed to financial risks through its international operations and normal debt-financed activities. Most of the financial risks are caused by variations in the Company’s cash flow generation resulting from, among other things, changes in exchange rates and interest rate levels, as well as from refinancing risk and credit risk.
In order to reduce the financial risks and to take advantage of economies of scale, the Company has a central treasury department supporting operations and management. The treasury department handles external financial transactions and functions as the Company’s in-house bank for its subsidiaries.
The Board of Directors monitors compliance with the financial risk policy on an on-going basis.
CURRENCY RISKS
1. Transaction Exposure and Revaluation effects
Transaction exposure arises because the cost of a product originates in one currency and the product is sold in another currency. Revaluation effects come from valuation of assets denominated in other currencies than the reporting currency of each unit.
The Company’s gross transaction exposure forecasted for 2015 is approximately $2.7 billion. A part of the currency flows have counter-flows in the same currency pair, which reduces the net exposure to approximately $2.1 billion per year. In the four largest net exposures, Autoliv expects to sell U.S. dollars against the Mexican Peso (17% of total net exposure), Euros against the Swedish Krona (17% of total net exposure), U.S. dollars against Korean won (8% of total net exposure) and buy Euros against the Chinese Renminbi (8% of total net exposure). Together these currencies are expected to account for almost 49% of the Company’s net currency transaction exposure.
Since the Company can only effectively hedge these currency flows in the short term, periodic hedging would only reduce the impact of fluctuations temporarily. Over time, periodic hedging would postpone but not reduce the impact of fluctuations. In addition, the net exposure is limited to less than one quarter of net sales and is made up of more than 40 different currency pairs with exposures in excess of $1 million each. Autoliv does not hedge these flows.
2. Translation Exposure in the Income Statement and Balance sheet
Another effect of exchange rate fluctuations arises when the income statements of non-U.S. subsidiaries are translated into U.S. dollars. Outside the U.S., the Company’s most significant currency is the Euro. We estimate that 31% of the Company’s net sales will be denominated in Euro or other European currencies during 2015, while approximately a quarter of net sales is estimated to be denominated in U.S. dollars.
The Company estimates that a 1% increase in the value of the U.S. dollar versus the European currencies will decrease reported U.S. dollar annual net sales in 2015 by $28 million or by 0.3% while operating income for 2015 will decline by approximately 0.3% or by about $2 million, assuming reported corporate average margin.
The Company’s policy is not to hedge this type of translation exposure since there is no cash flow effect to hedge.
A translation exposure also arises when the balance sheets of non-U.S. subsidiaries are translated into U.S. dollars. The policy of the Company is to finance major subsidiaries in the country’s local currency and to minimize the amounts held by subsidiaries in foreign currency accounts.
Consequently, changes in currency rates relating to funding and foreign currency accounts normally have a small impact on the Company’s income.
INTEREST RATE RISK
Interest rate risk refers to the risk that interest rate changes will affect the Company’s borrowing costs. Autoliv’s interest rate risk policy states that an increase in floating interest rates of one percentage point should not increase the annual net interest expense by more than $10 million in the following year and not by more than $15 million in the second year.
Given the Company’s current capital structure, we estimate that a one-percentage point interest rate increase would reduce net interest expense by approximately $12 million, both in 2015 and 2016. This is based on the capital structure at the end of 2014 when the gross fixed-rate debt was $1,474 million while the Company had a net debt position of $62 million (non-U.S. GAAP measure, see page 42 in the Annual Report).
Fixed interest rate debt is achieved both by issuing fixed rate notes and through interest rate swaps. The most notable debt carrying fixed interest rates is the $1.25 billion U.S. private placement notes issued in 2014, the remaining $165 million U.S. private placement notes issued in 2007, and the EIB note issued in December 2012 of SEK 350 million ($45 million equivalent), see Note 12 to Consolidated Financial Statements included herein.
REFINANCING RISK
Refinancing risk or borrowing risk refers to the risk that it could become difficult to refinance outstanding debt.
Autoliv’s refinancing risk policy requires the Company to maintain long-term facilities with an average maturity of at least three years (drawn or undrawn) cor-responding to 150% of total net debt (non-U.S. GAAP measure, see page 42 in the Annual Report). Meeting this policy can be achieved by raising long-term debt or debt commitments or by using cash flow to repay debt.
During the past four years, the Company has moved from a net debt position at December 31, 2010 and has been in a net cash position from December 2011 until September 30, 2014. At December 31, 2014, the Company is back in a net debt position
of $62 million. In addition to this net debt position, the Company had undrawn long-term debt facilities of $1.3 billion at the end of 2014 with an average remaining life of 3.2 years. Furthermore, the Company has no significant financing with financial covenants (i.e. performance-related restrictions).
DEBT LIMITATION POLICY
To manage the inherent risks and cyclicality in Autoliv’s business, the Company maintains a relatively conservative financial leverage.
Autoliv’s debt limitation policy is to maintain a financial leverage commensurate with a “strong investment grade credit rating” and our long-term target is to have a leverage ratio of around 1 time and to be within the range of 0.5 to 1.5 times.
The Company has had a strong investment grade rating during all periods since the Company was initially rated in 2000 except during February 2009 and July 2010 when the Company’s long-term credit rating was reduced by Standard and Poor’s (S&P) to BBB-. In July 2010, the rating was restored to investment grade, BBB+. In December 2013 Autoliv was upgraded to A- with stable outlook by S&P.
At December 31, 2014, the leverage ratio was 0.3 times. For calculation of leverage ratio, refer to the table below.
CREDIT RISK IN FINANCIAL MARKETS
Credit risk refers to the risk of a financial counterparty being unable to fulfill an agreed-upon obligation.
In the Company’s financial operations, this risk arises when cash is deposited with banks and when entering into forward exchange agreements, swap con-tracts or other financial instruments.
The policy of the Company is to work with banks that have a high credit rating and that participate in Autoliv’s financing.
In order to further reduce credit risk, deposits and financial instruments can only be entered into with core banks up to a calculated risk amount of $150 million per bank for banks rated A- or above and up to $50 million for banks rated BBB+. In addition, deposits can be made in U.S. and Swedish government short-term notes and certain AAA rated money market funds as approved by the Company’s Board of Directors. At year end 2014, the Company was compliant with this policy and held $429 million in AAA rated money market funds and $550 million directly in U.S. Treasury Bills.
IMPAIRMENT RISK
Impairment risk refers to the risk that the Company will write down a material amount of its goodwill of approximately $1.6 billion. This risk is assessed, at least, annually in the fourth quarter each year when the Company performs an impairment test. The impairment testing is based on two reporting units: 1) Passive safety systems to which virtually all of the goodwill is related; and 2) Active safety systems with $8 million in goodwill.
The discounted cash flow method is used for determining the fair value of these reporting units. The Company also compares the market value of its equity to the value derived from the discounted cash flow method. However, due to the combined effects of the cyclicality in the automotive industry and the volatility of stock markets, this method is only used as a supplement. The Company has concluded that presently none of its reporting units are “at risk” of failing the good-will impairment test. See also discussion under Goodwill and Intangible Assets in Note 1 to Consolidated Financial Statements included herein.
Not even during the unprecedented challenges for the global automotive industry in 2009 and 2008 was the Company required to record a goodwill impairment charge. However, there can be no assurance that goodwill will not be impaired due to future significant declines in LVP, due to our technologies or products becoming obsolete or for any other reason. We could also acquire companies where goodwill could turn out to be less resilient to deteriorations in external conditions.
CALCULATION OF LEVERAGE RATIO (DOLLARS IN MILLIONS)
| December 31 2014 | December 31 2013 | |||||||
| Net debt (cash)1) |
$ | 61.8 | $ | (511.3 | ) | |||
| Pension liabilities |
232.5 | 147.3 | ||||||
| Debt (cash) per the Policy |
$ | 294.3 | $ | (364.0 | ) | |||
| Income before income taxes |
$ | 667.0 | $ | 734.0 | ||||
| Plus: Interest expense, net2) |
58.6 | 28.9 | ||||||
| Depreciation and amortization of intangibles3) |
305.4 | 286.0 | ||||||
| EBITDA per the Policy |
$ | 1,031.0 | $ | 1,048.9 | ||||
| Leverage ratio4) |
0.3 | n/a | ||||||
1) Net debt (cash) is short- and long-term debt and debt-related derivatives less cash and cash equivalents. 2) Interest expense, net is interest expense including cost for extinguishment of debt, if any, less interest income. 3) Including impairment write-offs, if any. 4) Leverage ratio was not applicable in December 2013 due to net cash position.
Management’s Report on Internal Control over Financial Reporting
Management of the Company is responsible for establishing and maintaining adequate internal control over financial reporting.
Internal control over financial reporting is defined in Rules 13a-15(f) and 15d-15(f) under the Securities Exchange Act of 1934, as amended, as a process de-signed by, or under the supervision of, the Company’s principal executive and principal financial officers and effected by the Company’s board of directors, management and other personnel to provide reasonable assurance regarding the reliability of financial reporting and the preparation of financial statements for external purposes in accordance with generally accepted accounting principles and includes those policies and procedures that:
| • | pertain to the maintenance of records that in reasonable detail accurately and fairly reflect the transactions and dispositions of the assets of the Company; |
| • | provide reasonable assurance that transactions are recorded as necessary to permit preparation of financial statements in accordance with generally accepted accounting principles, and that receipts and expenditures of the Company are being made only in accordance with authorizations of management and directors of the Company; and provide reasonable assurance regarding prevention or timely detection of unauthorized acquisition, use or disposition of the Company’s assets that could have a material effect on the financial statements. |
Because of its inherent limitations, internal control over financial reporting may not prevent or detect misstatements. Projections of any evaluation of effective-ness to future periods are subject to the risks that controls may become inadequate because of changes in conditions, or that the degree of compliance with the policies or procedures may deteriorate.
Management assessed the effectiveness of Autoliv’s internal control over financial reporting as of December 31, 2014. In making this assessment, we used the criteria set forth by the Committee of Sponsoring Organizations of the Treadway Commission (COSO) in Internal Control – Integrated Framework (2013 framework).
Based on our assessment, we believe that, as of December 31, 2014, the Company’s internal control over financial reporting is effective.
The Company’s independent auditors – Ernst & Young AB, an independent registered public accounting firm – have issued an audit report on the effectiveness of the Company’s internal control over financial reporting, which is included herein, see page 82 in the Annual Report.
There have not been any changes in the Company’s internal control over financial reporting (as such term is defined in Rules 13a-15(f) and 15d-15(f) under the Exchange Act) during the quarter ended December 31, 2014 that have materially affected, or are reasonably likely to materially affect, the Company’s internal control over financial reporting.
“Safe Harbor Statement”
This Annual Report contains statements that are not historical facts but rather forward-looking statements within the meaning of the Private Securities Litigation Reform Act of 1995. Such forward-looking statements include those that address activities, events or developments that Autoliv, Inc. or its management believes or anticipates may occur in the future. For example, forward-looking statements include, without limitation, statements relating to industry trends (including light vehicle production), business opportunities, sales contracts, sales backlog, and on-going commercial arrangements and discussions, as well as any statements about estimated sales, operating margin, cash flow, effective tax rate, or other future operating performance or financial results.
In some cases, you can identify these statements by forward-looking words such as “estimates,” “expects,” “anticipates,” “projects,” “plans,” “intends,” “believes,” “could,” “may,” “likely,” “might,” “will,” “should,” or the negative of these terms and other comparable terminology, although not all forward-looking statements contain such words.
All forward-looking statements, including without limitation, management’s examination of historical operating trends and data, are based upon our current expectations, various assumptions and data available from third parties. Our expectations and assumptions are expressed in good faith and we believe there is a reasonable basis for them. However, there can be no assurance that such forward-looking statements will materialize or prove to be correct as forward-looking statements are inherently subject to known and unknown risks, uncertainties and other factors which may cause actual future results, performance or achievements to differ materially from the future results, performance or achievements expressed in or implied by such forward-looking statements.
Because these forward-looking statements involve risks and uncertainties, the outcome could differ materially from those set out in the forward-looking statements for a variety of reasons, including without limitation, changes in global light vehicle production; fluctuation in vehicle production schedules for which the Company is a supplier; market acceptance of our new products; changes in general -industry market conditions or regional growth or declines; changes in and the successful execution of our capacity alignment, restructuring and cost reduction initiatives discussed herein and the market reaction thereto; loss of business from increased competition; higher raw material, fuel and energy costs; changes in consumer and customer preferences for end products; customer losses; changes in regulatory conditions; customer bankruptcies; consolidations or restructuring; divestiture of customer brands; unfavorable fluctuations in currencies or interest rates among the various jurisdictions in which we operate; component shortages; costs or difficulties related to the integration of any new or acquired businesses and technologies; continued uncertainty in program awards and performance; the financial results of companies in which Autoliv has made technology investments or joint-venture arrangements; pricing negotiations with customers; our ability to be awarded new business; product liability, warranty and recall claims and investigations and other litigation and customer reactions thereto; higher expenses for our pension and other postretirement benefits including higher funding requirements of our pension plans; work stoppages or other labor issues at our facilities or at the facilities of our customers or suppliers; possible adverse results of pending or future litigation or infringement claims; negative impacts of antitrust investigations or other governmental investigations and associated litigation relating to the conduct of our business; tax assessments by governmental authorities and changes in our effective tax rate; dependence on key personnel; legislative or regulatory changes limiting our business; political conditions; dependence on and relationships with customers and suppliers; and other risks and uncertainties identified in Item 1A “Risk Factors” and Item 7 “Management’s Discussion and Analysis of Financial Condition and Results of Operations” in our 10-K for the year ended December 31, 2014. The Company undertakes no obligation to update publicly or revise any forward-looking statements in light of new information or future events.
For any forward-looking statements contained in this or any other document, we claim the protection of the safe harbor for forward-looking statements contained in the Private Securities Litigation Reform Act of 1995, and we assume no obligation to update any such statement.
Consolidated Statements of Net Income
| Years ended December 31 | ||||||||||||||||
| (DOLLARS AND SHARES IN MILLIONS, EXCEPT PER SHARE DATA) |
2014 | 2013 | 2012 | |||||||||||||
| Net sales |
Note 19 | $ | 9,240.5 | $ | 8,803.4 | $ | 8,266.7 | |||||||||
| Cost of sales |
(7,436.7) | (7,098.8) | (6,620.5) | |||||||||||||
| Gross profit |
1,803.8 | 1,704.6 | 1,646.2 | |||||||||||||
| Selling, general and administrative expenses |
(414.9 | ) | (389.9 | ) | (366.7 | ) | ||||||||||
| Research, development and engineering expenses, net |
(535.6 | ) | (489.3 | ) | (455.4 | ) | ||||||||||
| Amortization of intangibles |
Note 9 | (16.0 | ) | (20.4 | ) | (20.2 | ) | |||||||||
| Other income (expense), net |
Notes 10, 16 | (114.7) | (43.6) | (98.5) | ||||||||||||
| Operating income |
722.6 | 761.4 | 705.4 | |||||||||||||
| Income from equity method investments |
6.9 | 7.3 | 8.1 | |||||||||||||
| Interest income |
Note 12 | 4.8 | 3.9 | 3.4 | ||||||||||||
| Interest expense |
Note 12 | (63.4 | ) | (32.9 | ) | (41.7 | ) | |||||||||
| Other non-operating items, net |
(3.9) | (5.7) | (6.6) | |||||||||||||
| Income before income taxes |
667.0 | 734.0 | 668.6 | |||||||||||||
| Income tax expense |
Note 4 | (198.0) | (244.1) | (183.0) | ||||||||||||
| Net income |
$ | 469.0 | $ | 489.9 | $ | 485.6 | ||||||||||
| Less: Net income attributable to non-controlling interest |
1.2 | 4.1 | 2.5 | |||||||||||||
| Net income attributable to controlling interest |
$ | 467.8 | $ | 485.8 | $ | 483.1 | ||||||||||
| Earnings per common share |
||||||||||||||||
| – basic |
$ | 5.08 | $ | 5.09 | $ | 5.17 | ||||||||||
| – assuming dilution |
$ | 5.06 | $ | 5.07 | $ | 5.08 | ||||||||||
| Weighted average number of shares |
||||||||||||||||
| – basic |
92.1 | 95.5 | 93.5 | |||||||||||||
| – assuming dilution |
92.4 | 95.9 | 95.1 | |||||||||||||
| Cash dividend per share—declared |
$ | 2.14 | $ | 2.02 | $ | 1.94 | ||||||||||
| Cash dividend per share—paid |
$ | 2.12 | $ | 2.00 | $ | 1.89 | ||||||||||
See Notes to Consolidated Financial Statements.
Consolidated Statements of Comprehensive Income
| Years ended December 31 | ||||||||||||
| (DOLLARS IN MILLIONS) |
2014 | 2013 | 2012 | |||||||||
| Net income |
$ | 469.0 | $ | 489.9 | $ | 485.6 | ||||||
| Other comprehensive (loss) income before tax: |
||||||||||||
| Change in cumulative translation adjustment |
(204.9 | ) | (17.4 | ) | 28.1 | |||||||
| Net change in unrealized components of defined benefit plans |
(71.0 | ) | 97.1 | (40.6 | ) | |||||||
| Other comprehensive (loss) income, before tax |
(275.9 | ) | 79.7 | (12.5 | ) | |||||||
| Benefit (cost) for taxes related to defined benefit plans |
22.0 | (38.3 | ) | 14.5 | ||||||||
| Other comprehensive income, net of tax |
(253.9 | ) | 41.4 | 2.0 | ||||||||
| Comprehensive income |
215.1 | 531.3 | 487.6 | |||||||||
| Less: Comprehensive income attributable to non-controlling interest |
0.8 | 4.5 | 2.7 | |||||||||
| Comprehensive income attributable to controlling interest |
$ | 214.3 | $ | 526.8 | $ | 484.9 | ||||||
See Notes to Consolidated Financial Statements.
Consolidated Balance Sheets
| At December 31 | ||||||||||||
| (DOLLARS AND SHARES IN MILLIONS) |
2014 | 2013 | ||||||||||
| Assets |
||||||||||||
| Cash and cash equivalents |
$ | 1,529.0 | $ | 1,118.3 | ||||||||
| Receivables, net |
Note 5 | 1,706.3 | 1,688.0 | |||||||||
| Inventories, net |
Note 6 | 675.5 | 661.8 | |||||||||
| Income tax receivables |
Note 4 | 54.6 | 56.0 | |||||||||
| Prepaid expenses |
95.4 | 86.1 | ||||||||||
| Other current assets |
75.4 | 90.2 | ||||||||||
|
|
|
|
|
|||||||||
| Total current assets |
4,136.2 | 3,700.4 | ||||||||||
|
|
|
|
|
|||||||||
| Property, plant and equipment, net |
Note 8 | 1,390.2 | 1,336.2 | |||||||||
| Investments and other non-current assets |
Note 7 | 255.3 | 259.0 | |||||||||
| Goodwill |
Note 9 | 1,594.0 | 1,610.1 | |||||||||
| Intangible assets, net |
Note 9 | 67.2 | 77.3 | |||||||||
|
|
|
|
|
|||||||||
| Total assets |
$ | 7,442.9 | $ | 6,983.0 | ||||||||
|
|
|
|
|
|||||||||
| Liabilities and equity |
||||||||||||
| Short-term debt |
Note 12 | $ | 79.6 | $ | 339.4 | |||||||
| Accounts payable |
1,091.5 | 1,199.9 | ||||||||||
| Accrued expenses |
Notes 10, 11 | 720.1 | 633.9 | |||||||||
| Income tax payable |
Note 4 | 69.1 | 74.8 | |||||||||
| Other current liabilities |
178.3 | 180.5 | ||||||||||
|
|
|
|
|
|||||||||
| Total current liabilities |
2,138.6 | 2,428.5 | ||||||||||
|
|
|
|
|
|||||||||
| Long-term debt |
Note 12 | 1,521.2 | 279.1 | |||||||||
| Pension liability |
Note 18 | 232.5 | 147.3 | |||||||||
| Other non-current liabilities |
108.5 | 127.7 | ||||||||||
|
|
|
|
|
|||||||||
| Total non-current liabilities |
1,862.2 | 554.1 | ||||||||||
|
|
|
|
|
|||||||||
| Commitments and contingencies |
Notes 16, 17 | |||||||||||
| Common stock1) |
102.8 | 102.8 | ||||||||||
| Additional paid-in capital |
1,329.3 | 1,329.3 | ||||||||||
| Retained earnings |
3,240.0 | 2,965.9 | ||||||||||
| Accumulated other comprehensive (loss) income |
(253.0 | ) | 0.5 | |||||||||
| Treasury stock (14.1 and 8.4 shares, respectively) |
(992.0 | ) | (417.2 | ) | ||||||||
|
|
|
|
|
|||||||||
| Total parent shareholders’ equity |
3,427.1 | 3,981.3 | ||||||||||
|
|
|
|
|
|||||||||
| Non-controlling interest |
15.0 | 19.1 | ||||||||||
|
|
|
|
|
|||||||||
| Total equity |
Note 13 | 3,442.1 | 4,000.4 | |||||||||
|
|
|
|
|
|||||||||
| Total liabilities and equity |
$ | 7,442.9 | $ | 6,983.0 | ||||||||
|
|
|
|
|
|||||||||
| 1) | Number of shares: 350 million authorized, 102.8 million issued for both years, and 88.7 and 94.4 million outstanding, net of treasury shares, for 2014 and 2013, respectively. |
See Notes to Consolidated Financial Statements.
Consolidated Statements of Cash Flows
| Years ended December 31 | ||||||||||||||||
| (DOLLARS IN MILLIONS) |
2014 | 2013 | 2012 | |||||||||||||
| Operating activities |
||||||||||||||||
| Net income |
$ | 469.0 | $ | 489.9 | $ | 485.6 | ||||||||||
| Adjustments to reconcile net income to net cash provided by operating activities: |
||||||||||||||||
| Depreciation and amortization |
305.4 | 286.0 | 273.2 | |||||||||||||
| Deferred income taxes |
(0.8 | ) | 35.2 | (31.8 | ) | |||||||||||
| Undistributed income from equity method investments, net of dividends |
(3.4 | ) | (2.7 | ) | (3.3 | ) | ||||||||||
| Net change in: |
||||||||||||||||
| Receivables and other assets, gross |
(143.1 | ) | (245.5 | ) | (48.4 | ) | ||||||||||
| Inventories, gross |
(69.8 | ) | (63.6 | ) | 6.9 | |||||||||||
| Accounts payable and accrued expenses |
106.9 | 299.7 | (28.0 | ) | ||||||||||||
| Income taxes |
3.3 | 28.2 | (10.6 | ) | ||||||||||||
| Other, net |
45.2 | 10.7 | 44.9 | |||||||||||||
|
|
|
|
|
|
|
|||||||||||
| Net cash provided by operating activities |
712.7 | 837.9 | 688.5 | |||||||||||||
| Investing activities |
||||||||||||||||
| Expenditures for property, plant and equipment |
(456.0 | ) | (385.6 | ) | (365.4 | ) | ||||||||||
| Proceeds from sale of property, plant and equipment |
2.6 | 6.3 | 5.0 | |||||||||||||
| Acquisition of businesses, net of cash acquired |
Note 14 | (1.4 | ) | (2.0 | ) | (1.8 | ) | |||||||||
| Net proceeds from divestitures |
Note 14 | 2.4 | — | 5.2 | ||||||||||||
| Other |
(0.6) | 3.9 | (1.2) | |||||||||||||
| Net cash used in investing activities |
(453.0 | ) | (377.4 | ) | (358.2 | ) | ||||||||||
| Financing activities |
||||||||||||||||
| Net (decrease) increase in short-term debt |
(252.7 | ) | 272.8 | (119.8 | ) | |||||||||||
| Issuance of long-term debt |
1,263.0 | — | 98.5 | |||||||||||||
| Repayments and other changes in long-term debt |
(1.2 | ) | (277.3 | ) | (9.4 | ) | ||||||||||
| Dividends paid to non-controlling interest |
(4.9 | ) | (3.3 | ) | (0.8 | ) | ||||||||||
| Dividends paid |
(194.9 | ) | (191.0 | ) | (177.6 | ) | ||||||||||
| Shares repurchased |
(616.0 | ) | (147.9 | ) | — | |||||||||||
| Common stock and purchase contract issue |
— | — | 106.3 | |||||||||||||
| Common stock options exercised |
Note 15 | 32.5 | 27.0 | 12.9 | ||||||||||||
| Capital contribution from non-controlling interest |
— | 0.4 | — | |||||||||||||
| Other, net |
0.5 | 1.0 | (1.4 | ) | ||||||||||||
|
|
|
|
|
|
|
|||||||||||
| Net cash provided by (used in) financing activities |
226.3 | (318.3 | ) | (91.3 | ) | |||||||||||
| Effect of exchange rate changes on cash and cash equivalents |
(75.3) | (1.6) | (0.5) | |||||||||||||
| Increase in cash and cash equivalents |
410.7 | 140.6 | 238.5 | |||||||||||||
| Cash and cash equivalents at beginning of year |
1,118.3 | 977.7 | 739.2 | |||||||||||||
| Cash and cash equivalents at end of year |
$ | 1,529.0 | $ | 1,118.3 | $ | 977.7 | ||||||||||
See Notes to Consolidated Financial Statements.
Consolidated Statements of Total Equity
| (DOLLARS AND SHARES IN MILLIONS) |
Number of shares |
Common stock |
Additional paid in capital |
Retained earnings |
Accumulated other com- prehensive (loss) income |
Treasury stock |
Total parent shareholders’ equity |
Non- controlling interest |
Total equity1) |
|||||||||||||||||||||||||||
| Balance at December 31, 2011 |
102.8 | $ | 102.8 | $ | 1,472.8 | $ | 2,374.6 | $ | (42.3 | ) | $ | (574.5 | ) | $ | 3,333.4 | $ | 15.6 | $ | 3,349.0 | |||||||||||||||||
| Comprehensive Income: |
||||||||||||||||||||||||||||||||||||
| Net income |
483.1 | 483.1 | 2.5 | 485.6 | ||||||||||||||||||||||||||||||||
| Foreign currency translation |
27.9 | 27.9 | 0.2 | 28.1 | ||||||||||||||||||||||||||||||||
| Pension liability |
(26.1 | ) | (26.1 | ) | (26.1 | ) | ||||||||||||||||||||||||||||||
|
|
|
|
|
|
|
|||||||||||||||||||||||||||||||
| Total Comprehensive Income |
484.9 | 2.7 | 487.6 | |||||||||||||||||||||||||||||||||
|
|
|
|
|
|
|
|||||||||||||||||||||||||||||||
| Common stock incentives2) |
20.7 | 20.7 | 20.7 | |||||||||||||||||||||||||||||||||
| Cash dividends declared |
(185.2 | ) | (185.2 | ) | (185.2 | ) | ||||||||||||||||||||||||||||||
| Common stock issuance, net |
(143.5 | ) | 248.3 | 104.8 | 104.8 | |||||||||||||||||||||||||||||||
| Dividends paid to non-controlling interest on subsidiary shares |
(0.8 | ) | (0.8 | ) | ||||||||||||||||||||||||||||||||
|
|
|
|
|
|
|
|
|
|
|
|
|
|
|
|
|
|
|
|||||||||||||||||||
| Balance at December 31, 2012 |
102.8 | $ | 102.8 | $ | 1,329.3 | $ | 2,672.5 | $ | (40.5 | ) | $ | (305.5 | ) | $ | 3,758.6 | $ | 17.5 | $ | 3,776.1 | |||||||||||||||||
|
|
|
|
|
|
|
|
|
|
|
|
|
|
|
|
|
|
|
|||||||||||||||||||
| Comprehensive Income: |
||||||||||||||||||||||||||||||||||||
| Net income |
485.8 | 485.8 | 4.1 | 489.9 | ||||||||||||||||||||||||||||||||
| Foreign currency translation |
(17.8 | ) | (17.8 | ) | 0.4 | (17.4 | ) | |||||||||||||||||||||||||||||
| Pension liability |
58.8 | 58.8 | 58.8 | |||||||||||||||||||||||||||||||||
|
|
|
|
|
|
|
|||||||||||||||||||||||||||||||
| Total Comprehensive Income |
526.8 | 4.5 | 531.3 | |||||||||||||||||||||||||||||||||
|
|
|
|
|
|
|
|||||||||||||||||||||||||||||||
| Common stock incentives2) |
36.2 | 36.2 | 36.2 | |||||||||||||||||||||||||||||||||
| Cash dividends declared |
(192.4 | ) | (192.4 | ) | (192.4 | ) | ||||||||||||||||||||||||||||||
| Repurchased shares |
(147.9 | ) | (147.9 | ) | (147.9 | ) | ||||||||||||||||||||||||||||||
| Dividends paid to non-controlling interest on subsidiary shares |
(3.3 | ) | (3.3 | ) | ||||||||||||||||||||||||||||||||
| Investment in subsidiary by non-controlling interest |
0.4 | 0.4 | ||||||||||||||||||||||||||||||||||
|
|
|
|
|
|
|
|
|
|
|
|
|
|
|
|
|
|
|
|||||||||||||||||||
| Balance at December 31, 2013 |
102.8 | $ | 102.8 | $ | 1,329.3 | $ | 2,965.9 | $ | 0.5 | $ | (417.2 | ) | $ | 3,981.3 | $ | 19.1 | $ | 4,000.4 | ||||||||||||||||||
|
|
|
|
|
|
|
|
|
|
|
|
|
|
|
|
|
|
|
|||||||||||||||||||
| Comprehensive Income: |
||||||||||||||||||||||||||||||||||||
| Net income |
467.8 | 467.8 | 1.2 | 469.0 | ||||||||||||||||||||||||||||||||
| Foreign currency translation |
(204.5 | ) | (204.5 | ) | (0.4 | ) | (204.9 | ) | ||||||||||||||||||||||||||||
| Pension liability |
(49.0 | ) | (49.0 | ) | (49.0 | ) | ||||||||||||||||||||||||||||||
|
|
|
|
|
|
|
|||||||||||||||||||||||||||||||
| Total Comprehensive Income |
214.3 | 0.8 | 215.1 | |||||||||||||||||||||||||||||||||
|
|
|
|
|
|
|
|||||||||||||||||||||||||||||||
| Common stock incentives2) |
41.2 | 41.2 | 41.2 | |||||||||||||||||||||||||||||||||
| Cash dividends declared |
(193.7 | ) | (193.7 | ) | (193.7 | ) | ||||||||||||||||||||||||||||||
| Repurchased shares |
(616.0 | ) | (616.0 | ) | (616.0 | ) | ||||||||||||||||||||||||||||||
| Dividends paid to non-controlling interest on subsidiary shares |
(4.9 | ) | (4.9 | ) | ||||||||||||||||||||||||||||||||
|
|
|
|
|
|
|
|
|
|
|
|
|
|
|
|
|
|
|
|||||||||||||||||||
| Balance at December 31, 2014 |
102.8 | $ | 102.8 | $ | 1,329.3 | $ | 3,240.0 | $ | (253.0 | ) | $ | (992.0 | ) | $ | 3,427.1 | $ | 15.0 | $ | 3,442.1 | |||||||||||||||||
|
|
|
|
|
|
|
|
|
|
|
|
|
|
|
|
|
|
|
|||||||||||||||||||
| 1) | See Note 13 for further details – includes tax effects where applicable. |
| 2) | See Notes 1 and 15 for further details – includes tax effects. |
See Notes to Consolidated Financial Statements.
Notes to Consolidated Financial Statements
1. Summary of Significant Accounting Policies
(DOLLARS IN MILLIONS, EXCEPT PER SHARE DATA)
NATURE OF OPERATIONS
Through its operating subsidiaries, Autoliv is a supplier of automotive safety systems with a broad range of product offerings, including modules and components for passenger and driver airbags, side airbags, curtain airbags, seatbelts, steering wheels, safety electronics, whiplash protection systems and child seats, as well as active safety systems such as night vision, radar and other vision systems.
PRINCIPLES OF CONSOLIDATION
The consolidated financial statements have been prepared in accordance with United States (U.S.) Generally Accepted Accounting Principles (GAAP) and include Autoliv, Inc. and all companies over which Autoliv, Inc. directly or indirectly exercises control, which as a general rule means that the Company owns more than 50% of the voting rights.
Consolidation is also required when the Company has both the power to direct the activities of a variable interest entity (VIE) and the obligation to absorb losses or right to receive benefits from the VIE that could be significant to the VIE.
All intercompany accounts and transactions within the Company have been eliminated from the consolidated financial statements.
Investments in affiliated companies in which the Company exercises significant influence over the operations and financial policies, but does not control, are reported using the equity method of accounting, and therefore does not consolidate. Generally, the Company owns between 20 and 50 percent of such investments.
BUSINESS COMBINATIONS
Transactions in which the Company obtains control of a business are accounted for according to the acquisition method as described in Financial Accounting Standards Board (FASB) Accounting Standards Codification (ASC) 805, Business Combinations. The assets acquired and liabilities assumed are recognized and measured at their full fair values as of the date control is obtained, regardless of the percentage ownership in the acquired entity or how the acquisition was achieved. Acquisition related costs in connection with a business combination are expensed as incurred. Contingent considerations are recognized and measured at fair value at the acquisition date and classified as either liabilities or equity based on appropriate GAAP.
USE OF ESTIMATES
The preparation of consolidated financial statements in conformity with GAAP requires management to make estimates and assumptions that affect the reported amounts of assets and liabilities, disclosures of contingent assets and liabilities at the date of the consolidated financial statements, and the reported amounts of net sales and expenses during the reporting period. The accounting estimates that require management’s most significant judgments include the estimation of retroactive price adjustments, valuation of stock based payments, assessment of recoverability of goodwill and intangible assets, estimation of pension benefit obligations based on actuarial assumptions, estimation of accruals for warranty and product liabilities, restructuring charges, uncertain tax positions, valuation allowances and legal proceedings. Actual results could differ from those estimates.
REVENUE RECOGNITION
Revenues are recognized when there is evidence of a sales agreement, delivery of goods has occurred, the sales price is fixed and determinable and the collectability of revenue is reasonably assured. The Company records revenue from the sale of manufactured products upon shipment to customers and transfer of title and risk of loss under standard commercial terms (typically F.O.B. shipping point). In those limited instances where other terms are negotiated and agreed, revenue is recorded when title and risk of loss are transferred to the customer.
Accruals are made for retroactive price adjustments when probable and able to be reasonably estimated.
Net sales exclude taxes assessed by a governmental authority that are directly imposed on revenue-producing transactions between the Company and its customers.
COST OF SALES
Shipping and handling costs are included in Cost of sales in the Consolidated Statements of Net Income. Contracts to supply products which extend for periods in excess of one year are reviewed when conditions indicate that costs may exceed selling prices, resulting in losses. Losses on long-term supply contracts are recognized when probable and estimable.
RESEARCH, DEVELOPMENT AND ENGINEERING (R,D&E)
Research and development and most engineering expenses are expensed as incurred. These expenses are reported net of income from contracts to perform engineering design and product development services. Such income is not significant in any period presented.
Certain engineering expenses related to long-term supply arrangements are capitalized when the defined criteria, such as the existence of a contractual guarantee for reimbursement, are met. The aggregate amount of such assets is not significant in any period presented.
Tooling is generally agreed upon as a separate contract or a separate component of an engineering contract, as a pre-production project. Capitalization of tooling costs is made only when the specific criteria for capitalization of customer-funded tooling are met or the criteria for capitalization as Property, Plant & Equipment (P,P&E) for tools owned by the Company are fulfilled. Depreciation on the Company’s own tooling is recognized in the Consolidated Statements of Net Income as Cost of sales.
STOCK BASED COMPENSATION
The compensation costs for all of the Company’s stock-based compensation awards are determined based on the fair value method as defined in ASC 718, Compensation—Stock Compensation. The Company records the compensation expense for Restricted Stock Units (RSUs), awards under the Stock Incentive Plan, and stock options over the vesting period.
INCOME TAXES
Current tax liabilities and assets are recognized for the estimated taxes payable or refundable on the tax returns for the current year. In certain circumstances, payments or refunds may extend beyond twelve months, in such cases amounts would be classified as non-current taxes payable or refundable. Deferred tax liabilities or assets are recognized for the estimated future tax effects attributable to temporary differences and carryforwards that result from events that have been recognized in either the financial statements or the tax returns, but not both. The measurement of current and deferred tax liabilities and assets is based on provisions of enacted tax laws. Deferred tax assets are reduced by the amount of any tax benefits that are not expected to be realized. A valuation allowance is recognized if, based on the weight of all available evidence, it is more likely than not that some portion, or all, of the deferred tax asset will not be realized. Evaluation of the realizability of deferred tax assets is subject to significant judgment requiring careful consideration of all facts and circumstances. Current and non-current components of deferred tax balances are reported separately based on financial statement classification of the related asset or liability giving rise to the temporary difference. If a deferred tax asset or liability is not related to an asset or liability that exists for financial reporting purposes, including deferred tax assets related to carryforwards, the deferred tax asset or liability would be classified based on the expected reversal date of the temporary differences. Tax assets and liabilities are not offset unless attributable to the same tax jurisdiction and netting is possible according to law and expected to take place in the same period.
Tax benefits associated with tax positions taken in the Company’s income tax returns are initially recognized and measured in the financial statements when it is more likely than not that those tax positions will be sustained upon examination by the relevant taxing authorities. The Company’s evaluation of its tax bene-fits is based on the probability of the tax position being upheld if challenged by the taxing authorities (including through negotiation, appeals, settlement and litigation). Whenever a tax position does not meet the initial recognition criteria, the tax benefit is subsequently recognized and measured if there is a substantive change in the facts and circumstances that cause a change in judgment concerning the sustainability of the tax position upon examination by the relevant taxing authorities. In cases where tax benefits meet the initial recognition criterion, the Company continues, in subsequent periods, to assess its ability to sustain those positions. A previously recognized tax benefit is derecognized when it is no longer more likely than not that the tax position would be sustained upon examination. Liabilities for unrecognized tax benefits are classified as non-current unless the payment of the liability is expected to be made within the next 12 months.
EARNINGS PER SHARE
The Company calculates basic earnings per share (EPS) by dividing net income attributable to controlling interest by the weighted-average number of common shares outstanding for the period (net of treasury shares). When it would not be antidilutive (such as during periods of net loss), the diluted EPS also reflects the potential dilution that could occur if common stock were issued for awards under the Stock Incentive Plan and for common stock issued upon conversion of the equity units.
CASH EQUIVALENTS
The Company considers all highly liquid investment instruments purchased with a maturity of three months or less to be cash equivalents.
RECEIVABLES
The Company has guidelines for calculating the allowance for bad debts. In determining the amount of a bad debt allowance, management uses its judgment to consider factors such as the age of the receivables, the Company’s prior experience with the customer, the experience of other enterprises in the same industry, the customer’s ability to pay, and/or an appraisal of current economic conditions. Collateral is typically not required. There can be no assurance that the amount ultimately realized for receivables will not be materially different than that assumed in the calculation of the allowance.
FINANCIAL INSTRUMENTS
The Company uses derivative financial instruments, “derivatives”, as part of its debt management to mitigate the market risk that occurs from its exposure to changes in interest and foreign exchange rates. The Company does not enter into derivatives for trading or other speculative purposes. The use of such derivatives is in accordance with the strategies contained in the Company’s overall financial policy. The derivatives outstanding at year-end are foreign exchange swaps. All swaps principally match the terms and maturity of the underlying debt and no swaps have a maturity beyond 2015.
All derivatives are recognized in the consolidated financial statements at fair value. Certain derivatives are from time to time designated either as fair value hedges or cash flow hedges in line with the hedge accounting criteria. For certain other derivatives hedge accounting is not applied either because non-hedge accounting treatment creates the same accounting result or the hedge does not meet the hedge accounting requirements, although entered into applying the same rationale concerning mitigating market risk that occurs from changes in interest and foreign exchange rates.
When a hedge is classified as a fair value hedge, the change in the fair value of the hedge is recognized in the Consolidated Statements of Net Income along with the offsetting change in the fair value of the hedged item. When a hedge is classified as a cash flow hedge, any change in the fair value of the hedge is initially recorded in equity as a component of Other Comprehensive Income, (OCI), and reclassified into the Consolidated Statements of Net Income when the hedge transaction affects net earnings. There were no material reclassifications from OCI to the Consolidated Statements of Net Income in 2014 and, likewise, no material reclassifications are expected in 2015. Any ineffectiveness has been immaterial.
For further details on the Company’s financial instruments, see Note 3.
INVENTORIES
The cost of inventories is computed according to the first-in, first-out method (FIFO). Cost includes the cost of materials, direct labor and the applicable share of manufacturing overhead. Inventories are evaluated based on individual or, in some cases, groups of inventory items. Reserves are established to reduce the value of inventories to the lower of cost or market, with the market generally defined as net realizable value for finished goods and replacement cost for raw materials and work-in-process. Excess inventories are
quantities of items that exceed anticipated sales or usage for a reasonable period. The Company has guidelines for calculating provisions for excess inventories based on the number of months of inventories on hand compared to anticipated sales or usage. Management uses its judgment to forecast sales or usage and to determine what constitutes a reasonable period. There can be no assurance that the amount ultimately realized for inventories will not be materially different than that assumed in the calculation of the reserves.
PROPERTY, PLANT AND EQUIPMENT
Property, Plant and Equipment are recorded at historical cost. Construction in progress generally involves short-term projects for which capitalized interest is not significant. The Company provides for depreciation of property, plant and equipment computed under the straight-line method over the assets’ estimated useful lives. Depreciation on capital leases is recognized in the Consolidated Statements of Net Income over the shorter of the assets’ expected life or the lease contract terms. Repairs and maintenance are expensed as incurred.
The Company evaluates the carrying value of long-lived assets other than goodwill when indications of impairment are evident. Impairment testing is primarily done by using the cash flow method based on undiscounted future cash flows.
GOODWILL AND INTANGIBLE ASSETS
Goodwill represents the excess of the fair value of consideration transferred over the fair value of net assets of businesses acquired. Goodwill is not amortized, but is subject to at least an annual review for impairment. Other intangible assets, principally related to acquired technology and contractual relationships, are amortized over their useful lives which range from 3 to 25 years.
As of December 31, 2014 and 2013, the Company had goodwill of approximately $1.6 billion which nearly all is associated with the reporting unit Passive Safety Systems. Approximately $1.2 billion is goodwill associated with the 1997 merger of Autoliv AB and the Automotive Safety Products Division of Morton International, Inc. The Company performs its annual impairment testing in the fourth quarter of each year. Impairment testing is required more often than annually if an event or circumstance indicates that an impairment, or decline in value, may have occurred. The impairment testing of goodwill is based on two different reporting units: 1) Passive Safety Systems and 2) Active Safety Systems.
In conducting its impairment testing, the Company compares the estimated fair value of each of its reporting units to the related carrying value of the reporting unit. If the estimated fair value of a reporting unit exceeds its carrying value, goodwill is considered not to be impaired. If the carrying value of a reporting unit exceeds its estimated fair value, an impairment loss is measured and recognized by the amount which the carrying amount of the goodwill exceeds the implied fair value of the goodwill determined by assigning the fair value of the reporting unit to all of the assets and liabilities of that unit.
The estimated fair value of the reporting unit is determined by the discounted cash flow method taking into account expected long-term operating cash-flow performance. The Company discounts projected operating cash flows using its weighted average cost of capital, including a risk premium to adjust for market risk. The estimated fair value is based on automotive industry volume projections which are based on third-party and internally developed forecasts and discount rate assumptions. Significant assumptions include terminal growth rates, terminal operating margin rates, future capital expenditures and working capital requirements.
To supplement this analysis, the Company compares the market value of its equity, calculated by reference to the quoted market prices of its shares, to the book value of its equity.
There were no impairments of goodwill from 2012 through 2014.
INSURANCE DEPOSITS
The Company has entered into liability and recall insurance contracts to mitigate the risk of costs associated with product recalls. These are accounted for under the deposit method of accounting based on the existing contractual terms.
WARRANTIES AND RECALLS
The Company records liabilities for product recalls when probable claims are identified and when it is possible to reasonably estimate costs. Recall costs are costs incurred when the customer decides to formally recall a product due to a known or suspected safety concern. Product recall costs typically include the cost of the product being replaced as well as the customer’s cost of the recall, including labor to remove and replace the defective part.
Provisions for warranty claims are estimated based on prior experience, likely changes in performance of newer products and the mix and volume of products sold. The provisions are recorded on an accrual basis.
RESTRUCTURING PROVISIONS
The Company defines restructuring expense to include costs directly associated with rightsizing, exit or disposal activities.
Estimates of restructuring charges are based on information available at the time such charges are recorded. In general, management anticipates that re-structuring activities will be completed within a timeframe such that significant changes to the exit plan are not likely. Due to inherent uncertainty involved in estimating restructuring expenses, actual amounts paid for such activities may differ from amounts initially estimated.
PENSION OBLIGATIONS
The Company provides for both defined contribution plans and defined benefit plans. A defined contribution plan generally specifies the periodic amount that the employer must contribute to the plan and how that amount will be allocated to the eligible employees who perform services during the same period. A defined benefit pension plan is one that contains pension benefit formulas, which generally determine the amount of pension benefit that each employee will receive for services performed during a specified period of employment.
The amount recognized as a defined benefit liability is the net total of projected benefit obligation (PBO) minus the fair value of plan assets (if any) (see Note 18). The plan assets are measured at fair value. The inputs to the fair value measurement of the plan assets are mainly level 2 inputs (see Note 3).
CONTINGENT LIABILITIES
Various claims, lawsuits and proceedings are pending or threatened against the Company or its subsidiaries, covering a range of matters that arise in the ordinary course of its business activities with respect to commercial, product liability or other matters (see Note 16).
The Company diligently defends itself in such matters and, in addition, carries insurance coverage to the extent reasonably available against insurable risks.
The Company records liabilities for claims, lawsuits and proceedings when they are probable and it is possible to reasonably estimate the cost of such liabilities. Legal costs expected to be incurred in connection with a loss contingency are expensed as such costs are incurred.
The Company believes, based on currently available information, that the resolution of outstanding matters, other than the antitrust matters described in Note 16, after taking into account recorded liabilities and available insurance coverage, should not have a material effect on the Company’s financial position or results of operations.
However, due to the inherent uncertainty associated with such matters, there can be no assurance that the final outcomes of these matters will not be materially different than currently estimated.
TRANSLATION OF NON-U.S. SUBSIDIARIES
The balance sheets of subsidiaries with functional currency other than U.S. dollars are translated into U.S. dollars using year-end rates of exchange.
The statement of operations of these subsidiaries is translated into U.S. dollars at the average rates of exchange for the year. Translation differences are reflected in equity as a component of OCI.
RECEIVABLES AND LIABILITIES IN NON-FUNCTIONAL CURRENCIES
Receivables and liabilities not denominated in functional currencies are converted at year-end rates of exchange. Net transaction gains/(losses), reflected in the Consolidated Statements of Net Income amounted to $(3.8) million in 2014, $(26.3) million in 2013 and $(5.6) million in 2012, and are recorded in operating income if they relate to operational receivables and liabilities or are recorded in other financial items, net if they relate to financial receivables and liabilities.
RECENTLY ISSUED ACCOUNTING PRONOUNCEMENTS
In May 2014, the Financial Accounting Standards Board (FASB) issued the Accounting Standards Update (ASU) No. 2014-09, Revenue from Contracts with Customers (Topic 606), that will supersede nearly all existing revenue recognition guidance under US GAAP. The core principle of the guidance is that an entity should recognize revenue when it transfers promised goods or services to customers in an amount that reflects the consideration to which the company expects to be entitled in exchange for those goods or services. The standard will be effective for public entities for annual and interim periods beginning after December 15, 2016. Entities can choose to apply the standard using either the full retrospective approach or a modified retrospective approach. Entities electing the full retrospective adoption will apply the standard to each period presented in the financial statements. This means that entities will have to apply the new guidance as if it had been in effect since the inception of all its contracts with customers presented in the financial statements. Entities that elect the modified retrospective approach will apply the guidance retrospectively only to the most current period presented in the financial statements. This means that entities will have to recognize the cumulative effect of initially applying the new standard as an adjustment to the opening balance of retained earnings at the date of initial application. The new revenue standard will be applied to contracts that are in progress at the date of initial application. The Company plans to adopt the new standard from January 1, 2017. The Company is in process of evaluating which adoption method it plans to use and the potential effect the new standard will have on its consolidated financial statements.
In August 2014, the FASB issued the ASU No. 2014-15, Presentation of Financial Statements—Going Concern (Subtopic 205-40), Disclosure of Uncertainties about an Entity’s Ability to Continue as a Going Concern, that requires management to evaluate whether there are conditions and events that raise substantial doubt about an entity’s ability to continue as a going concern. The standard will be effective for annual periods after December 15, 2016 and for annual periods and interim periods thereafter. Early adoption is permitted. The Company has early adopted the standard in its interim reporting for September 30, 2014; however the adoption of ASU 2014-15 had no impact on the Company’s disclosures in the unaudited condensed consolidated financial statements.
RECLASSIFICATIONS
Certain prior-year amounts have been reclassified to conform to current year presentation.
2. Business Combinations
Business combinations generally take place to either gain key technology or strengthen Autoliv’s position in a certain geographical area or with a certain customer.
No significant business combinations have taken place during 2014 or 2013.
3. Fair Value Measurements
ASSETS AND LIABILITIES MEASURED AT FAIR VALUE ON A RECURRING BASIS
The carrying value of cash and cash equivalents, accounts receivable, accounts payable, other current liabilities and short-term debt approximate their fair value because of the short term maturity of these instruments.
The Company uses derivative financial instruments, “derivatives”, as part of its debt management to mitigate the market risk that occurs from its exposure to changes in interest and foreign exchange rates. The Company does not enter into derivatives for trading or other speculative purposes. The Company’s use of derivatives is in accordance with the strategies contained in the Company’s overall financial policy. The derivatives outstanding at December 31, 2014 were foreign exchange swaps. All swaps principally match the terms and maturity of the underlying debt and no swaps have a maturity beyond six months. All derivatives are recognized in the consolidated financial statements at fair value. Certain derivatives are from time to time designated either as fair value hedges or cash flow hedges in line with the hedge accounting criteria. For certain other derivatives hedge accounting is not applied either because non-hedge accounting treatment creates the same accounting result or the hedge does not meet the hedge accounting requirements, although entered into applying the same rationale concerning mitigating market risk that occurs from changes in interest and foreign exchange rates.
When a hedge is classified as a fair value hedge, the change in the fair value of the hedge is recognized in the Consolidated Statements of Net Income along with the off-setting change in the fair value of the hedged item. When a hedge is classified as a cash flow hedge, any change in the fair value of the hedge is initially recorded in equity as a component of Other Comprehensive Income (OCI) and reclassified into the Consolidated Statements of Net Income when the hedge transaction affects net earnings.
The Company records derivatives at fair value. Any gains and losses on derivatives recorded at fair value are reflected in the Consolidated Statements of Net Income with the exception of cash flow hedges where an immaterial portion of the fair value is reflected in OCI. The degree of judgment utilized in measuring the fair value of the instruments generally correlates to the level of pricing observability. Pricing observability is impacted by a number of factors, including the type of asset or liability, whether the asset or liability has an established market and the characteristics specific to the transaction. Derivatives with readily active quoted prices or for which fair value can be measured from actively quoted prices generally will have a higher degree of pricing observability and a lesser degree of judgment utilized in measuring fair value. Conversely, assets rarely traded or not quoted will generally have less, or no, pricing observability and a higher degree of judgment utilized in measuring fair value.
Under existing GAAP, there is a disclosure framework hierarchy associated with the level of pricing observability utilized in measuring assets and liabilities at fair value. The three broad levels defined by the hierarchy are as follows:
Level 1 – Quoted prices are available in active markets for identical assets or liabilities as of the reported date.
Level 2 – Pricing inputs are other than quoted prices in active markets, which are either directly or indirectly observable as of the reported date. The nature of these assets and liabilities include items for which quoted prices are available but traded less frequently, and items that are fair valued using other financial instruments, the parameters of which can be directly observed.
Level 3 – Assets and liabilities that have little to no pricing observability as of the reported date. These items do not have two-way markets and are measured using management’s best estimate of fair value, where the inputs into the determination of fair value require significant management judgment or estimation.
The Company’s derivatives are all classified as Level 2 and there have been no transfers during this or comparable periods.
The table below presents information about the Company’s financial assets and liabilities measured at fair value on a recurring basis as of December 31, 2014 and December 31, 2013. The carrying value is the same as the fair value. Although the Company is party to close-out netting agreements (ISDA agreements) with all derivative counterparties, the fair values in the tables below and in the Consolidated Balance Sheets at December 31, 2014 and 2013, have been presented on a gross basis. The net amounts subject to netting agreements that the Company choose not to offset are presented in footnotes. According to the close-out netting agreements, transaction amounts payable to a counterparty on the same date and in the same currency can be netted.
| DECEMBER 31, 2014 | DECEMBER 31, 2013 | |||||||||||||||||||||||
| Fair Value Measurements | Fair Value Measurements | |||||||||||||||||||||||
| DERIVATIVES NOT DESIGNATED AS HEDGING INSTRUMENTS |
Nominal volume |
Derivative asset (Other current assets) |
Derivative liability (Other current liabilities) |
Nominal volume |
Derivative asset (Other current assets) |
Derivative liability (Other current liabilities) |
||||||||||||||||||
| Foreign exchange swaps, less than 6 months |
$ | 459.1 | 1) | $ | 1.3 | 2) | $ | 0.4 | 3) | $ | 504.1 | 4) | $ | 1.7 | 5) | $ | 2.8 | 6) | ||||||
|
|
|
|
|
|
|
|
|
|
|
|
|
|||||||||||||
| TOTAL |
$ | 459.1 | $ | 1.3 | $ | 0.4 | $ | 504.1 | $ | 1.7 | $ | 2.8 | ||||||||||||
|
|
|
|
|
|
|
|
|
|
|
|
|
|||||||||||||
| 1) | Net nominal amount after deducting for offsetting swaps under ISDA agreements is $390.9 million. |
| 2) | Net amount after deducting for offsetting swaps under ISDA agreements is $1.3 million. |
| 3) | Net amount after deducting for offsetting swaps under ISDA agreements is $0.4 million. |
| 4) | Net nominal amount after deducting for offsetting swaps under ISDA agreements is $425.4 million. |
| 5) | Net amount after deducting for offsetting swaps under ISDA agreements is $1.5 million. |
| 6) | Net amount after deducting for offsetting swaps under ISDA agreements is $2.6 million. |
DERIVATIVES DESIGNATED AS HEDGING INSTRUMENTS
There were no derivatives designated as hedging instruments outstanding as of December 31, 2014 and December 31, 2013. During 2014 there were no derivatives designated as hedging instruments. During the first quarter of 2013 the Company closed a $60 million interest rate swap which was designated as a hedging instrument. For 2013 the gains and losses recognized in other non-operating items, net were immaterial. For 2013 the Company recognized a loss of $1.3 million as interest expense related to this closed interest rate swap. The hedged item related to the closed interest rate swap consists of a $60 million debt note which matures in 2019. The fair value related to this note declined by $1.3 million decreasing interest expense and thus fully offsetting the loss related to the hedging instrument.
DERIVATIVES NOT DESIGNATED AS HEDGING INSTRUMENTS
All amounts recognized in the Consolidated Statements of Net Income related to derivatives, not designated as hedging instruments, relate to economic hedges and thus have been materially off-set by an opposite Consolidated Statements of Net Income effect of the related financial liabilities or financial assets. The derivatives not designated as hedging instruments outstanding at December 31, 2014 were foreign exchange swaps. For 2014 the gains and losses recognized in other non-operating items, net were a gain of $2.0 million for derivative instruments not designated as hedging instruments. For 2013 the Company recognized a loss of $1.1 million in other non-operating items, net for derivative instruments not designated as hedging instruments. For 2014 and 2013, the gains and losses recognized as interest expense were immaterial.
FAIR VALUE OF DEBT
The fair value of long-term debt is determined either from quoted market prices as provided by participants in the secondary market or for long-term debt without quoted market prices, estimated using a discounted cash flow method based on the Company’s current borrowing rates for similar types of financing. The fair value of derivatives is estimated using a discounted cash flow method based on quoted market prices. The fair value and carrying value of debt is summarized in the table below. The Company has determined that each of these fair value measurements of debt reside within Level 2 of the fair value hierarchy. The discount rates for all derivative contracts are based on bank deposit or swap interest rates. Credit risk has been considered when determining the discount rates used for the derivative contracts.
| DECEMBER 31, 2014 CARRYING VALUE1) |
DECEMBER 31, 2014 FAIR VALUE |
DECEMBER 31, 2013 CARRYING VALUE1) |
DECEMBER 31, 2013 FAIR VALUE |
|||||||||||||
| LONG-TERM DEBT |
||||||||||||||||
| U.S. Private placement |
$ | 1,424.2 | $ | 1,510.2 | $ | 177.6 | $ | 187.7 | ||||||||
| Medium-term notes |
83.2 | 86.3 | 99.9 | 100.5 | ||||||||||||
| Other long-term debt |
13.8 | 13.8 | 1.6 | 1.6 | ||||||||||||
|
|
|
|
|
|
|
|
|
|||||||||
| TOTAL |
$ | 1,521.2 | $ | 1,610.3 | $ | 279.1 | $ | 289.8 | ||||||||
|
|
|
|
|
|
|
|
|
|||||||||
| SHORT-TERM DEBT |
||||||||||||||||
| Overdrafts and other short-term debt |
$ | 57.8 | $ | 57.8 | $ | 65.6 | $ | 65.6 | ||||||||
| Short-term portion of long-term debt |
21.8 | 21.8 | 167.2 | 172.6 | ||||||||||||
| Notes2) |
— | — | 106.6 | 107.6 | ||||||||||||
|
|
|
|
|
|
|
|
|
|||||||||
| TOTAL |
$ | 79.6 | $ | 79.6 | $ | 339.4 | $ | 345.8 | ||||||||
|
|
|
|
|
|
|
|
|
|||||||||
| 1) | Debt as reported in balance sheet. |
| 2) | Notes issued as part of the equity units offering were remarketed in April 2012, and matured on April 30, 2014. The notes were repaid and are no longer outstanding. |
ASSETS AND LIABILITIES MEASURED AT FAIR VALUE ON A NON-RECURRING BASIS
In addition to assets and liabilities that are measured at fair value on a recurring basis, the Company also has assets and liabilities in its balance sheet that are measured at fair value on a non-recurring basis. Assets and liabilities that are measured at fair value on a non-recurring basis include long-lived assets, including investments in affiliates, and restructuring liabilities (see Note 10).
The Company has determined that the fair value measurements included in each of these assets and liabilities rely primarily on Company-specific inputs and the Company’s assumptions about the use of the assets and settlements of liabilities, as observable inputs are not available. The Company has determined that each of these fair value measurements reside within Level 3 of the fair value hierarchy. To determine the fair value of long-lived assets, the Company utilizes the projected cash flows expected to be generated by the long-lived assets, then discounts the future cash flows over the expected life of the long-lived assets. For restructuring obligations, the amount recorded represents the fair value of the payments expected to be made, and such provisions are discounted if the payments are expected to extend beyond one year.
As of December 31, 2014, the Company had $79.8 million of restructuring reserves which were measured at fair value upon initial recognition of the associated liability (see Note 10). For 2014 the Company did not record any impairment charges on its long-lived assets.
4. Income Taxes
| INCOME BEFORE INCOME TAXES |
2014 | 2013 | 2012 | |||||||||
| U.S. |
$ | 59.5 | $ | 169.4 | $ | 171.2 | ||||||
| Non-U.S. |
607.5 | 564.6 | 497.4 | |||||||||
|
|
|
|
|
|
|
|||||||
| Total |
$ | 667.0 | $ | 734.0 | $ | 668.6 | ||||||
|
|
|
|
|
|
|
|||||||
| PROVISION FOR INCOME TAXES |
2014 | 2013 | 2012 | |||||||||
| Current |
||||||||||||
| U.S. federal |
$ | 32.2 | $ | 42.7 | $ | 62.8 | ||||||
| Non-U.S. |
166.2 | 164.7 | 146.2 | |||||||||
| U.S. state and local |
0.4 | 1.6 | 5.8 | |||||||||
| Deferred |
||||||||||||
| U.S. federal |
(3.2 | ) | 11.7 | 0.2 | ||||||||
| Non-U.S. |
2.9 | 22.2 | (29.6 | ) | ||||||||
| U.S. state and local |
(0.5 | ) | 1.2 | (2.4 | ) | |||||||
|
|
|
|
|
|
|
|||||||
| Total income tax expense (benefit) |
$ | 198.0 | $ | 244.1 | $ | 183.0 | ||||||
|
|
|
|
|
|
|
|||||||
| EFFECTIVE INCOME TAX RATE |
2014 | 2013 | 2012 | |||||||||
| U.S. federal income tax rate |
35.0 | % | 35.0 | % | 35.0 | % | ||||||
| Foreign tax rate variances |
(8.5 | ) | (8.2 | ) | (7.6 | ) | ||||||
| Tax credits |
(4.9 | ) | (4.5 | ) | (3.2 | ) | ||||||
| Change in Valuation Allowances |
0.6 | 5.3 | (1.1 | ) | ||||||||
| Current year losses with no benefit |
5.9 | 4.0 | 3.2 | |||||||||
| Net operating loss carry-forwards |
(0.0 | ) | (0.1 | ) | (0.2 | ) | ||||||
| Changes in tax reserves |
(0.1 | ) | 1.1 | (0.0 | ) | |||||||
| Cost of double taxation |
2.1 | 0.6 | 0.9 | |||||||||
| Earnings of equity investments |
(0.4 | ) | (0.4 | ) | (0.4 | ) | ||||||
| Withholding taxes |
0.6 | 1.0 | 1.6 | |||||||||
| State taxes, net of federal benefit |
0.0 | 0.2 | 0.3 | |||||||||
| Statutory Investment Allowances |
0.0 | 0.0 | (2.3 | ) | ||||||||
| Antitrust Settlement |
0.0 | 0.0 | 0.9 | |||||||||
| Other, net |
(0.6 | ) | (0.8 | ) | 0.3 | |||||||
|
|
|
|
|
|
|
|||||||
| Effective income tax rate |
29.7 | % | 33.2 | % | 27.4 | % | ||||||
Deferred income taxes reflect the net tax effects of temporary differences between the carrying amounts of assets and liabilities for financial reporting purposes and the amounts used for income tax purposes. On December 31, 2014, the Company had net operating loss carryforwards (NOL’s) of approximately $319 million, of which approximately $248 million have no expiration date. The remaining losses expire on various dates through 2029. The Company also has $37 million of U.S. Foreign Tax Credit carry forwards, which begin to expire in 2021. The Company also has Investment Tax Credit carry forwards of $2.3 million, which expire on various dates through 2021.
Valuation allowances have been established which partially offset the related deferred assets. Such allowances are primarily provided against NOL’s of companies that have perennially incurred losses, as well as the NOL’s of companies that are start-up operations and have not established a pattern of profitability. The Company assesses all available evidence, both positive and negative, to determine the amount of any required valuation allowance. In the fourth quarter of 2013 the Company recorded a valuation allowance against deferred tax assets of $39 million which was related to the inefficiencies in Europe and capacity alignment due to depressed volumes in the region.
The Company has benefited from “tax holidays” in certain of its subsidiaries, principally in China. The foreign tax rate variance includes the effect of these tax holidays. These tax holidays typically take the form of reduced rates of tax on income for a period of several years following the establishment of an eligible company. These tax holidays have resulted in income tax savings of approximately $12 million ($0.13 per share) in 2012. These special holiday rates expired at the end of 2012. The foreign tax rate variance reflects the fact that approximately two-thirds of the Company’s non-U.S. pre-tax income is generated by business operations located in tax jurisdictions where the tax rate is between 25%-30%.
The Company has reserves for income taxes that may become payable in future periods as a result of tax audits. These reserves represent the Company’s best estimate of the potential liability for tax exposures. Inherent uncertainties exist in estimates of tax exposures due to changes in tax law, both legislated and concluded through the various jurisdictions’ court systems. The Company files income tax returns in the United States federal jurisdiction, and various states and foreign jurisdictions.
At any given time, the Company is undergoing tax audits in several tax jurisdictions, covering multiple years. The Company is no longer subject to income tax examination by the U.S. Federal tax authorities for years prior to 2009. With few exceptions, the Company is no longer subject to income tax examination by U.S. state or local tax authorities or by non-U.S. tax authorities for years before 2007. The Company is undergoing tax audits in several non-U.S. jurisdictions and several U.S. state jurisdictions, covering multiple years. As of December 31, 2014, as a result of those tax examinations, the Company is not aware of any proposed income tax adjustments that would have a material impact on the Company’s financial statements, however, other audits could result in additional increases or decreases to the unrecognized tax benefits in some future period or periods.
The Company recognizes interest and potential penalties accrued related to unrecognized tax benefits in tax expense. As of January 1, 2014, the Company had recorded $23.3 million for unrecognized tax benefits related to prior years, including $2.1 million of accrued interest and penalties. During 2014, the Company recorded a net decrease of $1.9 million to income tax reserves for unrecognized tax benefits based on tax positions related to the current and prior years. The Company had $1.6 million accrued for the payment of interest and penalties as of December 31, 2014. Of the total unrecognized tax benefits of $21.4 million recorded at December 31, 2014, $2.8 million is classified as current income tax payable, and $18.6 million is classified as non-current tax payable included in Other Non-Current Liabilities on the Consolidated Balance Sheet. Substantially all of these reserves would impact the effective tax rate if released into income.
| TABULAR PRESENTATION OF TAX BENEFITS UNRECOGNIZED |
2014 | 2013 | 2012 | |||||||||
| Unrecognized tax benefits at beginning of year |
$ | 22.7 | $ | 14.7 | $ | 14.0 | ||||||
| Gross amounts of increases and decreases: |
||||||||||||
| Increases as a result of tax positions taken during a prior period |
0.6 | 7.2 | 1.3 | |||||||||
| Decreases as a result of tax positions taken during a prior period |
(0.0 | ) | (0.3 | ) | (0.3 | ) | ||||||
| Increases as a result of tax positions taken during the current period |
3.1 | 2.9 | 0.6 | |||||||||
| Decreases as a result of tax positions taken during the current period |
0.0 | 0.0 | 0.0 | |||||||||
| Decreases relating to settlements with taxing authorities |
(2.4 | ) | (0.8 | ) | (0.3 | ) | ||||||
| Decreases resulting from the lapse of the applicable statute of limitations |
(1.2 | ) | (0.6 | ) | (1.3 | ) | ||||||
| Translation Difference |
(1.3 | ) | (0.4 | ) | 0.7 | |||||||
|
|
|
|
|
|
|
|||||||
| Total unrecognized tax benefits at end of year |
$ | 21.5 | $ | 22.7 | $ | 14.7 | ||||||
|
|
|
|
|
|
|
|||||||
| DEFERRED TAXES DECEMBER 31 |
2014 | 2013 | 2012 | |||||||||
| Assets |
||||||||||||
| Provisions |
$ | 90.6 | $ | 97.2 | $ | 105.9 | ||||||
| Costs capitalized for tax |
12.0 | 18.5 | 11.5 | |||||||||
| Property, plant and equipment |
18.9 | 20.9 | 26.1 | |||||||||
| Retirement Plans |
73.6 | 49.9 | 99.7 | |||||||||
| Tax receivables, principally NOL’s |
166.2 | 136.6 | 104.9 | |||||||||
| Deferred tax assets before allowances |
$ | 361.3 | $ | 323.1 | $ | 348.1 | ||||||
| Valuation allowances |
(150.1 | ) | (115.5 | ) | (44.8 | ) | ||||||
|
|
|
|
|
|
|
|||||||
| Total |
$ | 211.2 | $ | 207.6 | $ | 303.3 | ||||||
|
|
|
|
|
|
|
|||||||
| Liabilities |
||||||||||||
| Acquired intangibles |
$ | (22.0 | ) | $ | (25.3 | ) | $ | (29.2 | ) | |||
| Statutory tax allowances |
(0.7 | ) | (1.3 | ) | (1.5 | ) | ||||||
| Insurance deposit |
(5.0 | ) | (6.4 | ) | (7.5 | ) | ||||||
| Distribution taxes |
(34.0 | ) | (38.1 | ) | (43.0 | ) | ||||||
| Other |
(2.6 | ) | (3.0 | ) | (2.5 | ) | ||||||
|
|
|
|
|
|
|
|||||||
| Total |
$ | (64.3 | ) | $ | (74.1 | ) | $ | (83.7 | ) | |||
|
|
|
|
|
|
|
|||||||
| Net deferred tax asset |
$ | 146.9 | $ | 133.5 | $ | 219.6 | ||||||
| VALUATION ALLOWANCES AGAINST DEFERRED TAX ASSETS DECEMBER 31 |
2014 | 2013 | 2012 | |||||||||
| Allowances at beginning of year |
$ | 115.5 | $ | 44.8 | $ | 41.7 | ||||||
| Benefits reserved current year |
55.2 | 76.1 | 15.7 | |||||||||
| Benefits recognized current year |
(0.7 | ) | (1.8 | ) | (11.7 | ) | ||||||
| Write-offs and other changes |
(3.0 | ) | (0.0 | ) | (0.0 | ) | ||||||
| Translation difference |
(16.9 | ) | (3.6 | ) | (0.9 | ) | ||||||
|
|
|
|
|
|
|
|||||||
| Allowances at end of year |
$ | 150.1 | $ | 115.5 | $ | 44.8 | ||||||
U.S. federal income taxes have not been provided on $4.0 billion of undistributed earnings of non-U.S. operations, which are considered to be permanently reinvested. Most of these undistributed earnings are not subject to withholding taxes upon distribution to intermediate holding companies. However, when appropriate, the Company provides for the cost of such distribution taxes. The Company has determined that it is not practicable to calculate the deferred tax liability if the entire $4.0 billion of earnings were to be distributed to the United States.
5. Receivables
| DECEMBER 31 |
2014 | 2013 | 2012 | |||||||||
| Receivables |
$ | 1,713.2 | $ | 1,692.6 | $ | 1,516.6 | ||||||
| Allowance at beginning of year |
$ | (4.6 | ) | $ | (7.3 | ) | $ | (8.3 | ) | |||
| Reversal of allowance |
0.9 | 4.1 | 2.1 | |||||||||
| Addition to allowance |
(4.1 | ) | (2.2 | ) | (2.1 | ) | ||||||
| Write-off against allowance |
0.6 | 0.9 | 1.2 | |||||||||
| Translation difference |
0.3 | (0.1) | (0.2) | |||||||||
| Allowance at end of year |
$ | (6.9 | ) | $ | (4.6 | ) | $ | (7.3 | ) | |||
|
|
|
|
|
|
|
|||||||
| Total receivables, net of allowance |
$ | 1,706.3 | $ | 1,688.0 | $ | 1,509.3 | ||||||
|
|
|
|
|
|
|
|||||||
6. Inventories
| DECEMBER 31 |
2014 | 2013 | 2012 | |||||||||
| Raw material |
$ | 312.2 | $ | 314.8 | $ | 287.7 | ||||||
| Work in progress |
240.6 | 232.9 | 225.9 | |||||||||
| Finished products |
206.0 | 201.9 | 180.9 | |||||||||
| Inventories |
$ | 758.8 | $ | 749.6 | $ | 694.5 | ||||||
| Inventory reserve at beginning of year |
$ | (87.8 | ) | $ | (83.5 | ) | $ | (76.1 | ) | |||
| Reversal of reserve |
5.1 | 5.1 | 5.3 | |||||||||
| Addition to reserve |
(10.9 | ) | (20.8 | ) | (22.9 | ) | ||||||
| Write-off against reserve |
4.0 | 10.5 | 10.4 | |||||||||
| Translation difference |
6.3 | 0.9 | (0.2) | |||||||||
| Inventory reserve at end of year |
$ | (83.3 | ) | $ | (87.8 | ) | $ | (83.5 | ) | |||
|
|
|
|
|
|
|
|||||||
| Total inventories, net of reserve |
$ | 675.5 | $ | 661.8 | $ | 611.0 | ||||||
|
|
|
|
|
|
|
|||||||
7. Investments and Other Non-current Assets
As of December 31, 2014, the Company had invested in three affiliated companies, which it currently does not control, but in which it exercises significant influence over operations and financial position. These investments are accounted for under the equity method, which means that a proportional share of the equity method investments’ net income increases the investment, and a proportional share of losses and payment of dividends decreases it. In the Consolidated Statements of Net Income, the proportional share of the net income (loss) is reported as “Income from equity method investments”. In 2013, the Company is applying deposit accounting for an insurance arrangement. In 2014, this arrangement is now a short-term receivable. For additional information on derivatives see Note 3.
| DECEMBER 31 |
2014 | 2013 | ||||||
| Equity method investments |
$ | 26.8 | $ | 26.6 | ||||
| Deferred tax assets |
139.0 | 122.4 | ||||||
| Income tax receivables |
54.7 | 54.7 | ||||||
| Long-term interest bearing deposit (insurance arrangement) |
— | 20.2 | ||||||
| Other non-current assets |
34.8 | 35.1 | ||||||
|
|
|
|
|
|||||
| Investments and other non-current assets |
$ | 255.3 | $ | 259.0 | ||||
The most significant equity method investments and the respective percentage of ownership are as follows:
| COUNTRY |
Ownership % | Company name | ||||
| France |
49 | % | EAK SNC Composants pour L’Industrie Automobile | |||
| Malaysia |
49 | % | Autoliv-Hirotako Safety Sdn Bhd (parent and subsidiaries) | |||
| China |
30 | % | Changchun Hongguang-Autoliv Vehicle Safety Systems Co. Ltd. | |||
In 2014, EAKSA Composants pour L’Industrie Automobile, where the Company owned 49%, was liquidated.
8. Property, Plant and Equipment
| DECEMBER 31 |
2014 | 2013 | Estimated life |
|||||||||
| Land and land improvements |
$ | 106.0 | $ | 114.8 | n/a to 15 | |||||||
| Machinery and equipment |
3,160.0 | 3,199.2 | 3-8 | |||||||||
| Buildings |
813.2 | 801.1 | 20-40 | |||||||||
| Construction in progress |
263.2 | 253.2 | n/a | |||||||||
| Property, plant and equipment |
$ | 4,342.4 | $ | 4,368.3 | ||||||||
| Less accumulated depreciation |
(2,952.2) | (3,032.1) | ||||||||||
| Net of depreciation |
$ | 1,390.2 | $ | 1,336.2 | ||||||||
| DEPRECIATION INCLUDED IN |
2014 | 2013 | 2012 | |||||||||
| Cost of sales |
$ | 258.7 | $ | 237.2 | $ | 225.4 | ||||||
| Selling, general and administrative expenses |
8.0 | 8.2 | 8.2 | |||||||||
| Research, development and engineering expenses |
22.7 | 20.2 | 19.4 | |||||||||
|
|
|
|
|
|
|
|||||||
| Total |
$ | 289.4 | $ | 265.6 | $ | 253.0 | ||||||
|
|
|
|
|
|
|
|||||||
No significant fixed asset impairments were recognized during 2014, 2013 or 2012.
The net book value of machinery and equipment under capital lease contracts recorded as of December 31, 2014 and 2013 amounted to $0.3 million and $0.7 million, respectively. The net book value of buildings and land under capital lease contracts recorded as of December 31, 2014 and 2013 amounted to $1.1 million and $1.5 million, respectively.
9. Goodwill and Intangible Assets
| UNAMORTIZED INTANGIBLES |
2014 | 2013 | ||||||
| Goodwill |
||||||||
| Carrying amount at beginning of year |
$ | 1,610.1 | $ | 1,610.8 | ||||
| Acquisitions and purchase price adjustments |
— | — | ||||||
| Translation differences |
(16.1) | (0.7) | ||||||
| Carrying amount at end of year |
$ | 1,594.0 | $ | 1,610.1 | ||||
| AMORTIZED INTANGIBLES |
2014 | 2013 | ||||||
| Gross carrying amount |
$ | 394.6 | $ | 398.9 | ||||
| Accumulated amortization |
(327.4) | (321.6) | ||||||
| Carrying value |
$ | 67.2 | $ | 77.3 | ||||
No significant impairments were recognized during 2014, 2013 or 2012.
At December 31, 2014, goodwill assets include $1.2 billion associated with the 1997 merger of Autoliv AB and the Automotive Safety Products Division of Morton International, Inc.
At December 31, 2014, intangible assets subject to amortization mainly relate to acquired technology and contractual relationships. The aggregate amortization expense on intangible assets was $16.0 million in 2014, $20.4 million in 2013 and $20.2 million in 2012. The estimated amortization expense is as follows (in millions): 2015: $13.2; 2016: $11.5; 2017: $11.3; 2018: $11.3 and 2019: $11.2.
10. Restructuring and Other Liabilities
RESTRUCTURING
Restructuring provisions are made on a case-by-case basis and primarily include severance costs incurred in connection with headcount reductions and plant consolidations. The Company expects to finance restructuring programs over the next several years through cash generated from its ongoing operations or through cash available under existing credit facilities. The Company does not expect that the execution of these programs will have an adverse impact on its liquidity position. The tables below summarize the change in the balance sheet position of the restructuring reserves from December 31, 2011 to December 31, 2014. The changes in the employee-related reserves have been charged against Other income (expense), net in the Consolidated Statements of Net Income.
2014
In 2014, the employee-related restructuring provisions, made on a case-by-case basis, relate mainly to headcount reductions in Europe. The cash payments mainly relate to high-cost countries in Europe. The table below summarizes the change in the balance sheet position of the restructuring reserves from December 31, 2013 to December 31, 2014.
| December 31 2013 |
Provision/ Charge |
Provision/ Reversal |
Cash payments |
Translation difference |
December 31 2014 |
|||||||||||||||||||
| Restructuring employee-related |
$ | 93.9 | $ | 42.6 | $ | (2.3 | ) | $ | (44.2 | ) | $ | (10.4 | ) | $ | 79.6 | |||||||||
| Other |
0.3 | 0.2 | (0.0 | ) | (0.3 | ) | 0.0 | 0.2 | ||||||||||||||||
|
|
|
|
|
|
|
|
|
|
|
|
|
|||||||||||||
| Total reserve |
$ | 94.2 | $ | 42.8 | $ | (2.3 | ) | $ | (44.5 | ) | $ | (10.4 | ) | $ | 79.8 | |||||||||
|
|
|
|
|
|
|
|
|
|
|
|
|
|||||||||||||
2013
In 2013, the employee-related restructuring provisions, made on a case-by-case basis, relate mainly to headcount reductions in Europe. The cash payments mainly relate to high-cost countries in Europe. The table below summarizes the change in the balance sheet position of the restructuring reserves from December 31, 2012 to December 31, 2013.
| December 31 2012 |
Provision/ Charge |
Provision/ Reversal |
Cash payments |
Translation difference |
December 31 2013 |
|||||||||||||||||||
| Restructuring employee-related |
$ | 74.9 | $ | 40.4 | $ | (4.7 | ) | $ | (20.0 | ) | $ | 3.3 | $ | 93.9 | ||||||||||
| Other |
0.9 | — | (0.2 | ) | (0.4 | ) | — | 0.3 | ||||||||||||||||
|
|
|
|
|
|
|
|
|
|
|
|
|
|||||||||||||
| Total reserve |
$ | 75.8 | $ | 40.4 | $ | (4.9 | ) | $ | (20.4 | ) | $ | 3.3 | $ | 94.2 | ||||||||||
|
|
|
|
|
|
|
|
|
|
|
|
|
|||||||||||||
2012
In 2012, the employee-related restructuring provisions, made on a case-by-case basis, relate mainly to headcount reductions in Europe. The cash payments mainly relate to high-cost countries in Europe. The table below summarizes the change in the balance sheet position of the restructuring reserves from December 31, 2011 to December 31, 2012.
| December 31 2011 |
Provision/ Charge |
Provision/ Reversal |
Cash payments |
Translation difference |
December 31 2012 |
|||||||||||||||||||
| Restructuring employee-related |
$ | 31.4 | $ | 76.6 | $ | (1.8 | ) | $ | (33.3 | ) | $ | 2.0 | $ | 74.9 | ||||||||||
| Other |
0.9 | 0.3 | (0.3 | ) | (0.0 | ) | — | 0.9 | ||||||||||||||||
|
|
|
|
|
|
|
|
|
|
|
|
|
|||||||||||||
| Total reserve |
$ | 32.3 | $ | 76.9 | $ | (2.1 | ) | $ | (33.3 | ) | $ | 2.0 | $ | 75.8 | ||||||||||
|
|
|
|
|
|
|
|
|
|
|
|
|
|||||||||||||
11. Product Related Liabilities
Autoliv is exposed to product liability and warranty claims in the event that the Company’s products fail to perform as represented and such failure results, or is alleged to result, in bodily injury, and/or property damage or other loss. The Company has reserves for product risks. Such reserves are related to product per-formance issues including recall, product liability and warranty issues.
The Company records liabilities for product-related risks when probable claims are identified and when it is possible to reasonably estimate costs. Provisions for warranty claims are estimated based on prior experience, likely changes in performance of newer products, and the mix and volume of the products sold. The provisions are recorded on an accrual basis.
The increases in reserve in 2014 and 2013 mainly relate to recall related issues, and in 2012 the increase mainly related to warranty related issues. Cash payments in 2014, 2013 and 2012 mainly relate to warranty related issues. The table below summarizes the change in the balance sheet position of the product-related liabilities.
| DECEMBER 31 |
2014 | 2013 | 2012 | |||||||||
| Reserve at beginning of the year |
$ | 36.4 | $ | 29.9 | $ | 33.0 | ||||||
| Change in reserve |
37.9 | 21.3 | 19.3 | |||||||||
| Cash payments |
(20.9 | ) | (15.2 | ) | (22.7 | ) | ||||||
| Translation difference |
(2.1 | ) | 0.4 | 0.3 | ||||||||
| Reserve at end of the year |
$ | 51.3 | $ | 36.4 | $ | 29.9 | ||||||
12. Debt and Credit Agreements
As part of its debt management, the Company enters into derivatives to achieve economically effective hedges and to minimize the cost of its funding. In this note, short-term debt and long-term debt are discussed including Debt-Related Derivatives (DRD), i.e. debt including fair value adjustments from hedges. Included in the DRD is also the unamortized fair value adjustment related to discontinued fair value hedges which will be amortized over the remaining life of the debt. The Debt Profile table also shows debt excluding DRD, i.e. reconciled to debt as reported in the balance sheet.
SHORT-TERM DEBT
As of December 31, 2014, total short-term debt including DRD was $79 million including $22 million of short-term portion of long-term loans. On April 30, 2014, the senior notes related to the equity units with a value of approximately $106.3 million matured and are no longer outstanding. On April 30, 2012, Autoliv settled the purchase contracts underlying the equity units by issuing approximately 5.8 million shares of common stock in exchange for $106 million in proceeds generated by the maturity of the U.S. Treasury securities purchased following the remarketing.
In November 2014, $125 million of senior notes matured. These notes were issued in 2007 as U.S. private placements by Autoliv ASP Inc. (a 100% owned subsidiary), carrying fixed interest rate of 5.8%. Short-term portion of long-term loans consists of financing at the subsidiary level, primarily $18 million of loans borrowed by Autoliv do Brazil Ltda. (a 100% owned subsidiary), which carry an interest rate of 13.0%, $2 million equivalent loans borrowed locally in Russia by OOO Autoliv (a 100% owned subsidiary), which carry an interest rate of 25% and of $1 million equivalent of loans borrowed from Japanese banks by Autoliv KK (a 100% owned subsidiary), which carry an interest rate of 1.6%.
The Company’s subsidiaries also have credit agreements, principally in the form of overdraft facilities, with a number of local banks. Total available short-term facilities, as of December 31, 2014, excluding commercial paper facilities as described below, amounted to $307 million, of which $57 million was utilized. The aggregate amount of unused short-term lines of credit at December 31, 2014 was $250 million. The weighted average interest rate on total short-term debt outstanding at December 31, 2014 and 2013 excluding the short-term portion of long-term debt was 4.1% and 3.5%, respectively.
LONG-TERM DEBT – OUTSTANDING LOANS
As of December 31, 2014, total long-term debt including DRD was $1,512 million. On April 25, 2014, the Company issued and sold $1.25 billion of long term debt securities in a U.S. Private Placement pursuant to a Note Purchase and Guaranty Agreement dated April 23, 2014, by and among Autoliv ASP Inc., the Company and the purchasers listed therein. The $1.25 billion in senior notes have an average interest rate of 3.84%, and consist of: $208 million aggregate principal amount of 5-year senior notes with an interest rate of 2.84%; $275 million aggregate principal amount of 7-year senior notes with an interest rate of 3.51%; $297 million aggregate principal amount of 10-year senior notes with an interest rate of 4.09%; $285 million aggregate principal amount of 12-year senior notes with an interest rate of 4.24%; and $185 million aggregate principal amount of 15-year senior notes with an interest rate of 4.44%.
In addition to the $1.25 billion senior notes issued in 2014, long-term debt including DRD of $262 million consists of $165 million of senior notes issued in 2007 as private placements by Autoliv ASP Inc. (a 100% owned subsidiary). The notes issued in 2007 were guaranteed by the Company and consist of two remaining long-term tranches maturing in 2017 and 2019, respectively, which carried fixed interest rates between 6.1% and 6.2%. The Company entered into swap arrangements with respect to part of the proceeds of the notes offering, most of which were cancelled in 2008 resulting in a mark-to-market gain. In March 2013 the remaining interest rate swap, with a nominal value of $60 million, was cancelled. This gain is amortized through interest expense over the life of the respective notes. Consequently, the remaining $165 million of the long-term notes carry fixed interest rates varying between 2.5% and 5.4%, when including the amortization of the cancelled swaps.
In 2011, the Company issued a SEK 300 million note ($38 million equivalent) maturing in 2017 carrying a floating interest rate of STIBOR + 0.95%.
A fixed-rate note was issued in December 2012 of 350 million SEK ($45 million equivalent). The 5-year note will mature in December 2017 and carries a fixed interest rate of 2.49%, which represents the European Investment Bank’s (EIB) cost of funds plus 0.3%.
The remaining other long-term debt of $14 million, consisted primarily of $9 million equivalent loans borrowed by Autoliv Cankor Otomotiv Emniyet Sistemleri Sanayi ve Ticavet A.S. (a 100% owned subsidiary), which carry an interest rate of 4.3% and $4 million equivalent loans borrowed by Autoliv do Brazil Ltda. (a 100% owned subsidiary), which carry an interest rate of 13.9%.
LONG-TERM DEBT—LOAN FACILITIES
In April 2011, the Company refinanced its revolving credit facility (RCF) of $1.1 billion. The facility is syndicated among 13 banks and originally had two extension options where Autoliv could request the banks to extend the maturity to 2017 and 2018, respectively, on the first and second anniversaries of the April 2011 loan facility, a so called 5+1+1 structure. In April 2012 and in April 2013, Autoliv extended essentially all of its $1.1 billion RCF, as noted above, with unchanged terms and conditions. The Company pays a commitment fee of 0.16% (given the rating of A- from Standard & Poor’s at December 31, 2014). Financing costs of $5 million were incurred in April 2011 and are amortized over the expected life of the facility. Borrowings under this facility are unsecured and bear interest based on the relevant LIBOR or IBOR rate. The commitment is available for general corporate purposes. Borrowings are pre-payable at any time and are due at the respective expiration date. The extension fees, incurred in April 2012 and April 2013, of $1 million in total are amortized over the remaining expected life of the facility.
In June 2009, Autoliv AB (a 100% owned subsidiary) entered into an 18-month financing commitment with EIB of €225 million ($274 million equivalent). In July 2011, this commitment was amended and extended. In December 2012, a portion of this loan commitment was utilized (a SEK denominated note was issued, see above) and the remainder of the total €225 million EIB commitment expired.
In July 2013, Autoliv AB entered into a financing commitment agreement with EIB, giving Autoliv AB access to a loan of €200 million ($244 million equivalent) to help finance R&D projects at Autoliv’s R&D facilities in Germany, France and Sweden. Under the financing commitment, Autoliv AB may, during the 18-month period following the agreement, draw loans with a maturity of up to 7 years at a cost of EIB’s cost of funding plus 0.26%. In addition to the interest payable on each tranche, Autoliv AB is required to pay a non-utilization fee of 0.13% on the undrawn, uncancelled balance of the credit. The financial obligations of the financing commitment agreement, including repayment of any funds, are guaranteed by the Company pursuant to a Guarantee Agreement between EIB and the Company.
In January, 2015 Autoliv AB signed an extension agreement with EIB whereby the facility is available for an additional 12 month period. There is no additional upfront fee associated with the extension, however the non-utilization fee of 0.13% on the undrawn, uncancelled balance of the credit will continue during the period the facility is available for drawdowns.
As a result, Autoliv has a total of $1.3 billion unutilized long-term debt facilities available. The Company is not subject to any financial covenants, i.e. perform-ance related restrictions, in any of its significant long-term borrowings or commitments.
The Company has two commercial paper programs: one SEK 7 billion (approx. $896 million) Swedish program and one $1.0 billion U.S. program. Both programs were unutilized at year-end. When notes have been outstanding under these programs, all of the notes have been classified as long-term debt because the Company has had the ability and intent to refinance these borrowings on a long-term basis either through continued commercial paper borrowings or utilization of the long-term credit facilities described above.
CREDIT RISK
In the Company’s financial operations, credit risk arises in connection with cash deposits with banks and when entering into forward exchange agreements, swap contracts or other financial instruments. In order to reduce this risk, deposits and financial instruments are only entered with a limited number of banks up to a calculated risk amount of $150 million per bank for banks rated A- or above and up to $50 million for banks rated BBB+. The policy of the Company is to work with banks that have a high credit rating and that participate in the Company’s financing. In addition to this, deposits can be placed in U.S. and Swedish government paper as well as up to $2.0 billion in certain AAA rated money market funds. As of December 31, 2014, the Company had placed $429 million in money market funds and $550 million in U.S. government paper.
The table below shows debt maturity as cash flow in the upper part which is reconciled with reported debt in the last row. For a description of hedging instruments used as part of debt management, see the Financial Instruments section of Note 1 and Note 3.
DEBT PROFILE
| PRINCIPAL AMOUNT BY EXPECTED MATURITY |
2015 | 2016 | 2017 | 2018 | 2019 | Thereafter | Total long-term |
Total | ||||||||||||||||||||||||
| U.S. private placement notes (incl. DRD1)) |
$ | — | $ | — | $ | 105.0 | $ | — | $ | 268.0 | $ | 1,042.0 | $ | 1,415.0 | $ | 1,415.0 | ||||||||||||||||
| Overdraft/Other short-term debt (incl. DRD1)) |
56.9 | — | — | — | — | — | — | 56.9 | ||||||||||||||||||||||||
| Medium-term notes |
— | — | 83.2 | — | — | — | 83.2 | 83.2 | ||||||||||||||||||||||||
| Other long-term loans, incl. current portion2) |
21.8 | 13.9 | — | — | — | — | 13.9 | 35.7 | ||||||||||||||||||||||||
|
|
|
|
|
|
|
|
|
|
|
|
|
|
|
|
|
|||||||||||||||||
| Total debt as cash flow, (incl. DRD1)) |
$ | 78.7 | $ | 13.9 | $ | 188.2 | $ | — | $ | 268.0 | $ | 1,042.0 | $ | 1,512.1 | $ | 1,590.8 | ||||||||||||||||
|
|
|
|
|
|
|
|
|
|
|
|
|
|
|
|
|
|||||||||||||||||
| DRD adjustment |
0.9 | — | 0.9 | — | 8.2 | — | 9.1 | 10.0 | ||||||||||||||||||||||||
|
|
|
|
|
|
|
|
|
|
|
|
|
|
|
|
|
|||||||||||||||||
| Total debt as reported |
$ | 79.6 | $ | 13.9 | $ | 189.1 | $ | — | $ | 276.2 | $ | 1,042.0 | $ | 1,521.2 | $ | 1,600.8 | ||||||||||||||||
|
|
|
|
|
|
|
|
|
|
|
|
|
|
|
|
|
|||||||||||||||||
1) Debt Related Derivatives (DRD), i.e. the fair value adjustments associated with hedging instruments as adjustments to the carrying value of the underlying debt. Included in the DRD is also the unamortized fair value adjustment related to discontinued fair value hedges which will be amortized over the remaining life of the debt. 2) Primarily external loans drawn locally in Brazil, Turkey and Russia.
13. Shareholders’ Equity
The number of shares outstanding as of December 31, 2014 was 88,726,543.
| DIVIDENDS |
2014 | 2013 | 2012 | |||||||||
| Cash dividend paid per share |
$ | 2.12 | $ | 2.00 | $ | 1.89 | ||||||
| Cash dividend declared per share |
$ | 2.14 | $ | 2.02 | $ | 1.94 | ||||||
| OTHER COMPREHENSIVE INCOME (LOSS)/ ENDING BALANCE1) |
2014 | 2013 | 2012 | |||||||||
| Cumulative translation adjustments |
$ | (155.1 | ) | $ | 49.4 | $ | 67.2 | |||||
| Net pension liability |
(97.9 | ) | (48.9 | ) | (107.7 | ) | ||||||
|
|
|
|
|
|
|
|||||||
| Total (ending balance) |
$ | (253.0 | ) | $ | 0.5 | $ | (40.5 | ) | ||||
|
|
|
|
|
|
|
|||||||
| Deferred taxes on the pension liability |
$ | 43.4 | $ | 21.4 | $ | 59.7 | ||||||
| 1) | The components of Other Comprehensive Income (Loss) are net of any related income tax effects. |
EQUITY AND EQUITY UNITS OFFERING
On March 30, 2009, the Company sold, in an underwritten registered public offering, approximately 14.7 million common shares from treasury stock and 6.6 million equity units (the Equity Units), listed on the NYSE as Corporate Units, for an aggregate stated amount and public offering price of $235 million and $165 million, respectively. “Equity Units” is a term that describes a security that is either a Corporate Unit or a Treasury Unit, depending upon what type of note is used by the holder to secure the forward purchase contract (either a Note or a Treasury Security, as described below). The Equity Units initially consisted of a Corporate Unit which is (i) a forward purchase contract obligating the holder to purchase from the Company for a price in cash of $25, on the purchase contract settlement date of April 30, 2012, subject to early settlement in accordance with the terms of the Purchase Contract and Pledge Agreement, a certain number (at the Settlement Rate outlined in the Purchase Contract and Pledge Agreement) of shares of Common Stock; and (ii) a 1/40, or 2.5%, undivided beneficial ownership interest in a $1,000 principal amount of the Company’s 8% senior notes due 2014 (the “Senior Notes”). The Company allocated proceeds received upon issuance of the Equity Units based on relative fair values at the time of issuance. The fees associated with the remarketing (described below) were allocated such that 1% of the 6% of underwriting commissions paid to the debt were allocated as deferred charges based on commissions paid for similar debt issuances, but including factors for market conditions at the time of the offering and the Company’s credit rating, and the deferred charges were amortized using the effective interest rate method over the life of the notes until April 30, 2014.
The Company successfully completed the remarketing of the Senior Notes in March 2012, pursuant to which the interest rate on the Senior Notes was reset and certain other terms of the Senior Notes were modified. On March 15, 2012, the coupon was reset to 3.854% with a yield of 2.875% per annum. Autoliv did not receive any proceeds from the remarketing until the settlement of the forward stock purchase contracts on April 30, 2012. On April 30, 2012, Autoliv settled the 4,250,920 purchase contracts still outstanding following the repurchase of 2.3 million Equity Units in 2010. Autoliv settled the purchase contracts by issuing approximately 5.8 million shares of common stock in exchange for $106,273,000 in proceeds generated by the maturity of the U.S. Treasury securities purchased following the remarketing. The settlement of the purchase contracts concluded Autoliv’s equity obligations under the Equity Units. The Senior Notes that matured on April 30, 2014 were repaid and are no longer outstanding.
SHARE REPURCHASE PROGRAM
Autoliv initiated its repurchase program in 2000 with 10 million shares and subsequently expanded the authorization three times between 2000 and 2007 to 37.5 million shares. Share repurchases were suspended in September, 2008 as a result of the financial crisis to preserve cash. During the fourth quarter 2013, the Company reactivated its share repurchase program. In January, 2014, the Board of Directors of the Company approved an additional 10 million shares for repurchase under the existing authorization for share repurchases. There is no expiration date for the share repurchase. The maximum number of shares that may yet be purchased under the Stock Repurchase Program amounted to 5,349,926 shares at December 31, 2014.
| SHARES |
2014 | 2013 | 2012 | |||||||||
| Shares repurchased (shares in millions) |
6.2 | 1.6 | — | |||||||||
| Cash paid for shares |
$ | 616.0 | $ | 147.9 | $ | — | ||||||
In total, Autoliv has repurchased 42.2 million shares between May 2000 and December 2014 for cash of $2,237 million, including commissions. Of the total amount of repurchased shares, 14.7 million shares were utilized for the equity offering in 2009, 3.1 million and 5.8 million shares were utilized for the repurchase of equity units in the second quarter of 2010 and the settlement of the Equity Units in the second quarter of 2012, respectively. In addition, 4.5 million shares have been utilized by the Stock Incentive Plan whereof 0.5 million, 0.5 million and 0.4 million were utilized during 2014, 2013 and 2012, respectively. At December 31, 2014, 14.1 million of the repurchased shares remain in treasury stock.
14. Supplemental Cash Flow Information
The Company’s acquisitions and divestitures of businesses, net of cash acquired were as follows:
| 2014 | 2013 | 2012 | ||||||||||
| Acquisitions: |
||||||||||||
| Cash paid for prior year acquisitions |
$ | (1.4 | ) | $ | (2.0 | ) | $ | (1.8 | ) | |||
|
|
||||||||||||
| Acquisition of businesses, net of cash acquired |
$ | (1.4 | ) | $ | (2.0 | ) | $ | (1.8 | ) | |||
| 2014 | 2013 | 2012 | ||||||||||
| Divestitures of business, net of cash disposed |
$ | 2.4 | $ | — | $ | 5.2 | ||||||
| Payments for interest and income taxes were as follows: |
||||||||||||
| 2014 | 2013 | 2012 | ||||||||||
| Interest |
$ | 57 | $ | 33 | $ | 40 | ||||||
| Income taxes |
$ | 206 | $ | 206 | $ | 237 | ||||||
15. Stock Incentive Plan
Under the amended and restated Autoliv, Inc. 1997 Stock Incentive Plan (the Plan) adopted by the shareholders, awards have been made to selected executive officers of the Company and other key employees in the form of stock options and restricted stock units (RSUs). All stock options are granted for 10-year terms, have an exercise price equal to the fair value of the share at the date of grant, and become exercisable after one year of continued employment following the grant date. Each RSU represents a promise to transfer a share of the Company’s common stock to the employee after three years of service following the date of grant or upon retirement, whichever is earlier. The source of the shares issued upon share option exercise or lapse of RSU service period is generally from treasury shares. The Plan provides for the issuance of up to 9,585,055 common shares for awards. At December 31, 2014, 5,945,064 of these shares have been issued for awards. For stock options and RSUs outstanding and options exercisable at year end, see the following tables.
The fair value of the RSUs is calculated as the fair value of the shares at the RSU grant date. The grant date fair value for RSUs granted in 2011, 2010 and 2009 (vested in 2014, 2013 and 2012) was $4.4 million, $4.3 million and $3.3 million, respectively. The aggregate intrinsic value for RSUs outstanding at December 31, 2014 was $21.0 million. The average fair value of RSUs granted in 2014, 2013 and 2012 was $88.54, $64.59 and $61.58, respectively.
The average grant date fair value of stock options granted during 2014, 2013 and 2012 was estimated at $17.35, $15.61 and $18.01 per share, respectively, using the Black-Scholes option-pricing model based on the following assumptions:
| 2014 | 2013 | 2012 | ||||||||||
| Risk-free interest rate |
1.1 | % | 0.9 | % | 0.9 | % | ||||||
| Dividend yield |
2.3 | % | 2.3 | % | 2.8 | % | ||||||
| Expected life in years |
3.9 | 4.1 | 4.1 | |||||||||
| Expected volatility |
28.0 | % | 34.0 | % | 42.0 | % | ||||||
The Company uses historical exercise data for determining the expected life assumption. Expected volatility is based on historical and implied volatility.
The total stock (RSUs and stock options) compensation cost recognized in the Consolidated Statements of Net Income for 2014, 2013 and 2012 was $8.1 million, $8.3 million and $7.7 million, respectively.
The total compensation cost related to non-vested awards not yet recognized is $5.9 million for RSUs and the weighted average period over which this cost is expected to be recognized is approximately two years. There is no significant compensation cost not yet recognized for stock options.
Information on the number of RSUs and stock options related to the Plan during the period of 2012 to 2014 is as follows:
| RSUs |
2014 | 2013 | 2012 | |||||||||
| Outstanding at beginning of year |
204,277 | 211,618 | 320,122 | |||||||||
| Granted |
64,223 | 91,230 | 72,900 | |||||||||
| Shares issued |
(56,184 | ) | (84,342 | ) | (172,212 | ) | ||||||
| Cancelled/Forfeited/Expired |
(14,031 | ) | (14,229 | ) | (9,192 | ) | ||||||
|
|
||||||||||||
| Outstanding at end of year |
198,285 | 204,277 | 211,618 | |||||||||
| STOCK OPTIONS |
Number of options | Weighted average exercise price |
||||||
| Outstanding at Dec 31, 2011 |
1,073,002 | $ | 46.26 | |||||
| Granted |
218,695 | 67.00 | ||||||
| Exercised |
(254,440 | ) | 33.26 | |||||
| Cancelled/Forfeited/Expired |
(25,027 | ) | 50.59 | |||||
|
|
|
|||||||
| Outstanding at Dec 31, 2012 |
1,012,230 | $ | 53.91 | |||||
| Granted |
273,541 | 69.18 | ||||||
| Exercised |
(437,751 | ) | 53.58 | |||||
| Cancelled/Forfeited/Expired |
(16,319 | ) | 49.25 | |||||
|
|
|
|||||||
| Outstanding at Dec 31, 2013 |
831,701 | $ | 59.20 | |||||
| Granted |
192,665 | 94.87 | ||||||
| Exercised |
(471,732 | ) | 60.78 | |||||
| Cancelled/Forfeited/Expired |
(13,809 | ) | 66.23 | |||||
|
|
|
|||||||
| Outstanding at Dec 31, 2014 |
538,825 | $ | 70.38 | |||||
| OPTIONS EXERCISABLE |
||||||||
| At December 31, 2012 |
796,720 | $ | 50.37 | |||||
| At December 31, 2013 |
559,483 | $ | 54.34 | |||||
| At December 31, 2014 |
349,190 | $ | 57.08 | |||||
The following summarizes information about stock options outstanding and exercisable on December 31, 2014:
| RANGE OF EXERCISE PRICES |
Number outstanding |
Remaining contract life (in years) |
Weighted average exercise price |
|||||||||
| $16.31 - $19.96 |
41,950 | 4.14 | $ | 16.31 | ||||||||
| $40.26 - $49.60 |
63,182 | 3.65 | $ | 46.14 | ||||||||
| $51.67 - $59.01 |
45,150 | 2.64 | $ | 55.27 | ||||||||
| $67.00 - $69.18 |
148,326 | 7.79 | $ | 68.41 | ||||||||
| $72.95 - $94.87 |
240,217 | 8.51 | $ | 90.25 | ||||||||
|
|
|
|||||||||||
| 538,825 | 6.91 | $ | 70.38 | |||||||||
| RANGE OF EXERCISE PRICES |
Number exercisable |
Remaining contract life (in years) |
Weighted average exercise price |
|||||||||
| $16.31 - $19.96 |
41,950 | 4.14 | $ | 16.31 | ||||||||
| $40.26 - $49.60 |
63,182 | 3.65 | $ | 46.14 | ||||||||
| $51.67 - $59.01 |
45,150 | 2.64 | $ | 55.27 | ||||||||
| $67.00 - $69.18 |
148,326 | 7.79 | $ | 68.41 | ||||||||
| $72.95 - $94.87 |
50,582 | 6.14 | $ | 72.95 | ||||||||
|
|
|
|||||||||||
| 349,190 | 5.70 | $ | 57.08 | |||||||||
The total aggregate intrinsic value, which is the difference between the exercise price and $106.12 (closing price per share at December 31, 2014), for all “in the money” stock options outstanding and exercisable was $19.2 million and $17.1 million, respectively.
16. Contingent Liabilities
LEGAL PROCEEDINGS
Various claims, lawsuits and proceedings are pending or threatened against the Company or its subsidiaries, covering a range of matters that arise in the ordinary course of its business activities with respect to commercial, product liability and other matters. Litigation is subject to many uncertainties, and the outcome of any litigation cannot be assured. After discussions with counsel, and with the exception of losses resulting from the antitrust proceedings described below, it is the opinion of management that the various legal proceedings and investigations to which the Company currently is a party will not have a material adverse impact on the consolidated financial position of Autoliv, but the Company cannot provide assurance that Autoliv will not experience material litigation, product liability or other losses in the future.
In October 2014, one of the Company’s Brazilian subsidiaries received a notice of deficiency from the state tax authorities from the state of São Paulo, Brazil which, primarily, alleged violations of ICMS (VAT) payments and improper warehousing documentation. The aggregate assessment for all alleged violations was R$55 million (approximately $20.4 million), inclusive of fines, penalties and interest. The Company believes the full amount assessed is baseless, that it has reasonable legal and factual defenses to the assessment and, consequently, plans to defend its interests vigorously. The duration or ultimate outcome of the matter currently cannot be predicted or estimated at this time.
ANTITRUST MATTERS
Authorities in several jurisdictions are currently conducting broad, and in some cases, long-running investigations of suspected anti-competitive behavior among parts suppliers in the global automotive vehicle industry. These investigations include, but are not limited to, segments in which the Company operates. In addition to pending matters, authorities of other countries with significant light vehicle manufacturing or sales may initiate similar investigations. It is the Company’s policy to cooperate with governmental investigations.
On February 8, 2011, a Company subsidiary received a grand jury subpoena from the Antitrust Division of the U.S. Department of Justice (“DOJ”) related to its investigation of anti-competitive behavior among suppliers of occupant safety systems.
On June 6, 2012, the Company entered into a plea agreement with the DOJ and subsequently pled guilty to two counts of antitrust law violations involving a Japanese subsidiary and paid a fine of $14.5 million. Under the terms of the agreement, the Company will continue to cooperate with the DOJ in its investigation of other suppliers, but the DOJ will not otherwise prosecute Autoliv or any of its subsidiaries, present or former directors, officers or employees for the matters investigated (the DOJ did reserve the option to prosecute three specific employees, none of whom is a member of the senior management of the Company).
On June 7-9, 2011, representatives of the European Commission (“EC”), the European antitrust authority, visited two facilities of a Company subsidiary in Germany to gather information for a similar investigation. The investigation is still pending and the Company remains unable to estimate the financial impact such investigation will have or predict the reporting periods in which such financial impact may be recorded and has consequently not recorded a provision for loss as of December 31, 2014. However, management has concluded that it is probable that the Company’s operating results and cash flows will be materially adversely impacted for the reporting periods in which the EC investigation is resolved or becomes estimable.
On October 3, 2012, the Company received a letter from the Competition Bureau of Canada (“CBC”) related to the subjects investigated by the DOJ, seeking the voluntary production of certain corporate records and information related to sales of occupant safety systems in Canada. The Company has cooperated with the CBC’s investigation and believes that the investigation will not result in an adverse outcome for the Company.
On November 6, 2012, the Korean Fair Trade Commission visited one of the Company’s South Korean subsidiaries to gather information for a similar investigation. The Company has cooperated with this investigation and believes that the investigation will not result in an adverse outcome for the Company.
In August 2014, the Competition Commission of South Africa (the “CCSA”) contacted the Company regarding an investigation into the Company’s sales of occupant safety systems in South Africa. The Company is cooperating with the CCSA. The Company cannot predict the duration, scope or ultimate outcome of this investigation and is unable to estimate the financial impact it may have, or predict the reporting periods in which any such financial impacts may be recorded. Consequently, the Company has not recorded a provision for loss as of December 31, 2014 with respect to this investigation. Also, since the Company’s plea agreement with the DOJ involved the actions of employees of a Japanese subsidiary of the Company, the Japan Fair Trade Commission is evaluating whether to initiate an investigation.
The Company is also subject to civil litigation alleging anti-competitive conduct in the U.S. and Canada. Plaintiffs in these civil antitrust class actions generally allege that the defendant suppliers of occupant safety systems have engaged in long-running global conspiracies to fix the prices of occupant safety systems or components thereof in violation of various antitrust laws and unfair or deceptive trade practice statutes. Plaintiffs in these civil antitrust class actions make allegations that extend significantly beyond the specific admissions of the Company’s DOJ plea. The Company denies these overly broad allegations. Plaintiffs in the U.S. cases seek to represent purported classes of direct purchasers, auto dealers and end-payors (i.e. consumers) who purchased occupant safety systems or components either directly from a defendant or indirectly through purchases or leases of new vehicles containing such systems. Plaintiffs seek injunctive relief, treble damages, costs and attorneys’ fees. Plaintiffs in the Canadian cases seek to represent purported classes encompassing direct and indirect purchasers of such products and seek similar relief under applicable Canadian laws.
Specifically, the Company, several of its subsidiaries and its competitors are defendants in a total of eighteen purported antitrust class action lawsuits filed between July 2012 and May 2014. Fourteen of these lawsuits were filed in the U.S. and have been consolidated in the Occupant Safety Systems (OSS) segment of the Automobile Parts Antitrust Litigation, a Multi-District Litigation (MDL) proceeding in the United States District Court for the Eastern District of Michigan.
On May 30, 2014, the Company, without admitting any liability, entered into separate settlement agreements with representatives of each of the three classes of plaintiffs in the MDL, subject to final approval by the MDL court following notice to the settlement class, an opportunity to object or opt-out of the settlement, and a fairness hearing. Pursuant to the settlement agreements, the Company agreed to pay $40 million to the direct purchaser settlement class, $6 million to the auto dealer settlement class, and $19 million to the end-payor settlement class, for a total of $65 million. This amount was expensed during the second quarter of 2014. In exchange, the plaintiffs agreed that the plaintiffs and the settlement classes would release Autoliv from all claims regarding their U.S. purchases that were or could have been asserted on behalf of the class in the MDL. In July 2014, the three settlements received preliminary court approval. Following notice to the direct purchaser settlement class and the receipt of opt-out notices from members of that class, the class settlement amount was by the terms of the settlement agreement reduced to approximately $35.5 million. The amount by which the direct purchaser settlement was reduced remains accrued. Following a fairness hearing on December 3, 2014, the MDL court on January 7, 2015 entered an order granting final approval to the direct purchaser class settlement. Notices to the settlement classes and the fairness hearings for the other two class settlements have been deferred by the plaintiffs and the MDL court for processing with additional, future settlements due to the cost of giving notice to large settlement classes. The three class settlements will not resolve any claims of settlement class members who opt out of the settlements or the claims of any purchasers of occupant safety systems who are not otherwise included in a settlement class, such as states and municipalities. The Company is in discussions with certain OEMs regarding the possible resolution of potential claims for purchases not covered by the U.S. direct purchaser settlement. The outcome of these discussions is uncertain and any potential loss contingencies resulting from these discussions with these OEMs, individually or in the aggregate, are not at this time reasonably estimable (beyond the accrued amount noted above) but could negatively impact the Company’s results in the period in which they are resolved or become estimable.
The other four antitrust class action lawsuits are pending in Canada (Sheridan Chevrolet Cadillac Ltd. et al. v. Autoliv, Inc. et al., filed in the Ontario Superior Court of Justice on January 18, 2013; M. Serge Asselin v. Autoliv, Inc. et al., filed in the Superior Court of Quebec on March 14, 2013; Ewert v. Autoliv, Inc. et al., filed in the Supreme Court of British Columbia on July 18, 2013; and Cindy Retallick and Jagjeet Singh Rajput v. Autoliv ASP, Inc. et al., filed in the Queen’s Bench of the Judicial Center of Regina in the province of Saskatchewan on May 14, 2014). The Canadian cases assert claims on behalf of putative classes of both direct and indirect purchasers of occupant safety systems. The Company denies the overly broad allegations of these lawsuits and intends to defend itself in these cases. While it is probable that the Company will incur losses as a result of these Canadian antitrust cases, the duration or ultimate outcome of these cases currently cannot be predicted or estimated and no provision for a loss has been recorded as of December 31, 2014. There is currently no timeline for class certification or discovery in the Canadian cases.
On April 17, 2013, the Construction Laborers Pension Trust of Greater St. Louis (“CLPT”) filed a purported class action securities lawsuit against Autoliv and two of its officers in the United States District Court for the Southern District of New York (Civil Action File No. 13-CIV-2546) (the “Lawsuit”), and later added as a third individual defendant an employee of one of the Company’s subsidiaries. The amended complaint alleged, among other claims, misrepresentations or failures to disclose material facts that artificially inflated the Company’s stock price in violation of the federal securities laws, in particular Section 10(b) and Section 20(a) of the Securities Exchange Act of 1934, as amended. CLPT purported to bring the Lawsuit on behalf of a class of purchasers of common stock of the Company between October 26, 2010 and July 21, 2011. CLPT sought to recover damages in an unspecified amount.
In August 2014, the Company and CLPT entered into a definitive settlement agreement to settle the Lawsuit and the claims of the alleged class members for a payment of $22.5 million. This settlement was approved by the court in October 2014 and resolves the claims asserted in the Lawsuit against the Company and the individuals named in the complaint, including the claims of the settlement class members. The Company recorded a net expense of $4.5 million in the second quarter of 2014, and the balance of the settlement amount was paid by Autoliv’s insurance carrier. The agreement is not an admission of wrongdoing or acceptance of fault by the Company or any of the individuals named in the complaint.
On February 18, 2014, Henry Zwang, a purported stockholder of the Company, filed a putative derivative lawsuit against Autoliv and twelve of its current or former officers and directors in the Delaware Court of Chancery (Case No. 9359 — VCP). The complaint purported to allege claims against the individual defendants for breach of fiduciary duty, waste and unjust enrichment related to the Company’s antitrust issues and named the Company as a nominal defendant only, seeking monetary and other relief on behalf of Autoliv against the individual defendants. On December 15, 2014, the Delaware court approved a settlement dismissing all claims in the complaint with prejudice in exchange for certain corporate governance revisions.
PRODUCT WARRANTY, RECALLS AND INTELLECTUAL PROPERTY
Autoliv is exposed to various claims for damages and compensation if products fail to perform as expected. Such claims can be made, and result in costs and other losses to the Company, even where the product is eventually found to have functioned properly. Where a product (actually or allegedly) fails to perform as expected, the Company faces warranty and recall claims. Where such (actual or alleged) failure results, or is alleged to result, in bodily injury and/or property damage, the Company may also face product-liability claims. There can be no assurance that the Company will not experience material warranty, recall or product (or other) liability claims or losses in the future, or that the Company will not incur significant costs to defend against such claims. The Company may be required to participate in a recall involving its products. Each vehicle manufacturer has its own practices regarding product recalls and other product liability actions relating to its suppliers. As suppliers become more integrally involved in the vehicle design process and assume more of the vehicle assembly functions, vehicle manufacturers are increasingly looking to their suppliers for contribution when faced with recalls and product liability claims. Government safety regulators may also play a role in warranty and recall practices. A warranty, recall or product-liability claim brought against the Company in excess of its insurance may have a material adverse effect on the Company’s business. Vehicle manufacturers are also increasingly requiring their outside suppliers to guarantee or warrant their products and bear the costs of repair and replacement of such products under new vehicle warranties. A vehicle manufacturer may attempt to hold the Company responsible for some, or all, of the repair or replacement costs of products when the product supplied did not perform as represented by us or expected by the customer. Accordingly, the future costs of warranty claims by the customers may be material. However, the Company believes its established reserves are adequate. Autoliv’s warranty reserves are based upon the Company’s best estimates of amounts necessary to settle future and existing claims. The Company regularly evaluates the adequacy of these reserves, and adjusts them when appropriate. However, the final amounts determined to be due related to these matters could differ materially from the Company’s recorded estimates.
In addition, the global platforms and procedures used by vehicle manufacturers have led to quality performance evaluations being conducted on an increasingly global basis. Any one or more quality, warranty or other recall issue(s) (including those affecting few units and/or having a small financial impact) may cause a vehicle manufacturer to implement measures such as a temporary or prolonged suspension of new orders, which may have a material impact on the Company’s results of operations.
The Company believes that it is currently reasonably insured against recall and product liability risks, at levels sufficient to cover potential claims that are reasonably likely to arise in the Company’s businesses based on past experience. Autoliv cannot assure that the level of coverage will be sufficient to cover every possible claim that can arise in our businesses, now or in the future, or that such coverage always will be available should we, now or in the future, wish to extend, increase of otherwise adjust its insurance.
In its products, the Company utilizes technologies which may be subject to intellectual property rights of third parties. While the Company does seek to procure the necessary rights to utilize intellectual property rights associated with its products, it may fail to do so. Where the Company so fails, the Company may be exposed to material claims from the owners of such rights. Where the Company has sold products which infringe upon such rights, its customers may be entitled to be indemnified by the Company for the claims they suffer as a result thereof. Such claims could be material.
17. Lease Commitments
OPERATING LEASE
The Company leases certain offices, manufacturing and research buildings, machinery, automobiles, data processing and other equipment under operating lease contracts. The operating leases, some of which are non-cancellable and include renewals, expire at various dates through 2045. The Company pays most maintenance, insurance and tax expenses relating to leased assets. Rental expense for operating leases was $44.6 million for 2014, $45.8 million for 2013 and $35.5 million for 2012.
At December 31, 2014, future minimum lease payments for non-cancellable operating leases totaled $115.0 million and are payable as follows (in millions): 2015: $37.7; 2016: $26.2; 2017: $17.9; 2018: $13.3; 2019: $9.5; 2020 and thereafter: $10.4.
CAPITAL LEASE
The Company leases certain property, plant and equipment under capital lease contracts. The capital leases expire at various dates through 2017.
At December 31, 2014, future minimum lease payments for non-cancellable capital leases totaled $0.7 million and are payable as follows (in millions): 2015: $0.5; 2016: $0.2; 2017: $0.0; 2018: $0.0; 2019: $0.0; 2020 and thereafter: $0.0.
18. Retirement Plans
DEFINED CONTRIBUTION PLANS
Many of the Company’s employees are covered by government sponsored pension and welfare programs. Under the terms of these programs, the Company makes periodic payments to various government agencies. In addition, in some countries the Company sponsors or participates in certain non-governmental defined contribution plans. Contributions to defined contribution plans for the years ended December 31, 2014, 2013 and 2012 were $20.2 million, $19.7 million and $18.1 million, respectively.
MULTIEMPLOYER PLANS
The Company participates in multiemployer plans in Sweden, Canada, Spain and the Netherlands, which are all deemed insignificant. The largest of these plans is in Sweden, the ITP-2 pension plan, which is funded through Alecta. For employees born before 1979, the plan provides a final pay pension benefit based on all service with participating employers. The Company must pay for wage increases in excess of inflation on service earned with previous employers. The plan also provides disability and family benefits. The plan is more than 100% funded. The Company contributions to the multiemployer plan in Sweden for the years ended December 31, 2014, 2013 and 2012 were $2.4 million, $1.9 million and $2.3 million, respectively.
DEFINED BENEFIT PLANS
The Company has a number of defined benefit pension plans, both contributory and non-contributory, in the U.S., Canada, Germany, France, Japan, Mexico, Sweden, South Korea, India, Turkey, Thailand, Philippines and the United Kingdom. There are funded as well as unfunded plan arrangements which provide retirement benefits to both U.S. and non-U.S. participants.
The main plan is the U.S. plan for which the benefits are based on an average of the employee’s earnings in the years preceding retirement and on credited service. The Company has closed participation in the Autoliv ASP, Inc. Pension Plan to exclude those employees hired after December 31, 2003. Within the U.S. there is also a non-qualified restoration plan that provides benefits to employees whose benefits in the primary U.S. plan are restricted by limitations on the compensation that can be considered in calculating their benefits.
For the Company’s non-U.S. defined benefit plans the most significant individual plan resides in the U.K. The Company has closed participation in the U.K. defined benefit plan to exclude all employees hired after April 30, 2003 with few members accruing benefits.
CHANGES IN BENEFIT OBLIGATIONS AND PLAN ASSETS FOR THE PERIODS ENDED DECEMBER 31
| U.S. | Non-U.S. | |||||||||||||||
| 2014 | 2013 | 2014 | 2013 | |||||||||||||
| Benefit obligation at beginning of year |
$ | 265.8 | $ | 314.2 | $ | 205.0 | $ | 195.4 | ||||||||
| Service cost |
7.3 | 9.3 | 13.5 | 13.5 | ||||||||||||
| Interest cost |
13.0 | 12.8 | 8.2 | 7.3 | ||||||||||||
| Actuarial (gain) loss due to: |
||||||||||||||||
| Change in discount rate |
58.9 | (53.1 | ) | 40.4 | (8.3 | ) | ||||||||||
| Experience |
(0.5 | ) | (17.5 | ) | 1.0 | 2.3 | ||||||||||
| Other assumption changes |
18.4 | 7.1 | (1.9 | ) | 3.0 | |||||||||||
| Plan participants’ contributions |
— | — | 0.2 | 0.2 | ||||||||||||
| Plan amendments |
— | — | 0.9 | 0.5 | ||||||||||||
| Benefits paid |
(5.9 | ) | (7.0 | ) | (8.3 | ) | (7.7 | ) | ||||||||
| Curtailments |
— | — | 0.1 | 0.1 | ||||||||||||
| Special termination benefits |
— | — | — | 0.5 | ||||||||||||
| Other |
— | — | (0.5 | ) | (0.9 | ) | ||||||||||
| Translation difference |
— | — | (21.3 | ) | (0.9 | ) | ||||||||||
|
|
|
|
|
|
|
|
|
|||||||||
| Benefit obligation at end of year |
$ | 357.0 | $ | 265.8 | $ | 237.3 | $ | 205.0 | ||||||||
| Fair value of plan assets at beginning of year |
$ | 223.6 | $ | 159.4 | $ | 99.9 | $ | 94.8 | ||||||||
| Actual return on plan assets |
29.4 | 29.0 | 14.2 | 3.4 | ||||||||||||
| Company contributions |
6.7 | 42.2 | 9.4 | 8.0 | ||||||||||||
| Plan participants’ contributions |
— | — | 0.2 | 0.2 | ||||||||||||
| Benefits paid |
(5.9 | ) | (7.0 | ) | (8.3 | ) | (7.7 | ) | ||||||||
| Other |
— | — | (0.2 | ) | (0.2 | ) | ||||||||||
| Translation difference |
— | — | (7.2) | 1.4 | ||||||||||||
| Fair value of plan assets at year end |
$ | 253.8 | $ | 223.6 | $ | 108.0 | $ | 99.9 | ||||||||
| Funded status recognized in the balance sheet |
$ | (103.2 | ) | $ | (42.2 | ) | $ | (129.3 | ) | $ | (105.1 | ) | ||||
The U.S. plan provides that benefits may be paid in the form of a lump sum if so elected by the participant. In order to more accurately reflect a market-derived pension obligation, Autoliv adjusts the assumed lump sum interest rate to reflect market conditions as of each December 31. This methodology is consistent with the approach required under the Pension Protection Act of 2006, which provides the rules for determining minimum funding requirements in the U.S.
The short-term portion of the pension liability is not significant.
COMPONENTS OF NET PERIODIC BENEFIT COST ASSOCIATED WITH THE DEFINED BENEFIT RETIREMENT PLANS
| U.S. | ||||||||||||
| 2014 | 2013 | 2012 | ||||||||||
| Service cost |
$ | 7.3 | $ | 9.3 | $ | 8.3 | ||||||
| Interest cost |
13.0 | 12.8 | 12.3 | |||||||||
| Expected return on plan assets |
(15.4 | ) | (11.6 | ) | (10.2 | ) | ||||||
| Amortization of prior service credit |
(1.0 | ) | (1.0 | ) | (1.0 | ) | ||||||
| Amortization of actuarial loss |
1.9 | 10.0 | 8.5 | |||||||||
|
|
|
|
|
|
|
|||||||
| Net periodic benefit cost |
$ | 5.8 | $ | 19.5 | $ | 17.9 | ||||||
| Non-U.S. | ||||||||||||
| 2014 | 2013 | 2012 | ||||||||||
| Service cost |
$ | 13.5 | $ | 13.5 | $ | 12.0 | ||||||
| Interest cost |
8.2 | 7.3 | 7.1 | |||||||||
| Expected return on plan assets |
(4.5 | ) | (4.0 | ) | (3.9 | ) | ||||||
| Amortization of prior service costs |
0.3 | 0.2 | 0.1 | |||||||||
| Amortization of actuarial loss |
1.1 | 2.5 | 1.4 | |||||||||
| Settlement loss (gain) |
0.1 | 0.2 | 1.0 | |||||||||
| Curtailment loss (gain) |
0.1 | 0.1 | — | |||||||||
| Special termination benefits |
— | 0.5 | 0.1 | |||||||||
| Net periodic benefit cost |
$ | 18.8 | $ | 20.3 | $ | 17.8 | ||||||
The estimated prior service credit for the U.S. defined benefit pension plans that will be amortized from other comprehensive income into net benefit cost over the next fiscal year is $(1.0) million. Amortization of net actuarial losses is expected to be $7.0 million in 2015. Net periodic benefit cost associated with these U.S. plans was $5.8 million in 2014 and is expected to be around $11.3 million in 2015. The estimated prior service cost and net actuarial loss for the non-U.S. defined benefit pension plans that will be amortized from other comprehensive income into net benefit cost over the next fiscal year are $0.3 million and $3.2 million, respectively. Net periodic benefit cost associated with these non-U.S. plans was $18.8 million in 2014 and is expected to be around $21.8 million in 2015. The amortization of the net actuarial loss is made over the estimated remaining service lives of the plan participants, 10 years for U.S. and 6-22 years for non-U.S. participants, varying between the different countries depending on the age of the work force.
COMPONENTS OF ACCUMULATED OTHER COMPREHENSIVE INCOME BEFORE TAX AS OF DECEMBER 31
| U.S. | Non-U.S. | |||||||||||||||
| 2014 | 2013 | 2014 | 2013 | |||||||||||||
| Net actuarial loss (gain) |
$ | 106.6 | $ | 45.6 | $ | 53.8 | $ | 29.9 | ||||||||
| Prior service (credit) cost |
(1.9) | (2.9) | 2.6 | 2.2 | ||||||||||||
| Total accumulated other comprehensive income recognized in the balance sheet |
$ | 104.7 | $ | 42.7 | $ | 56.4 | $ | 32.1 | ||||||||
CHANGES IN ACCUMULATED OTHER COMPREHENSIVE INCOME BEFORE TAX FOR THE PERIODS ENDED DECEMBER 31
| U.S. | Non-U.S. | |||||||||||||||
| 2014 | 2013 | 2014 | 2013 | |||||||||||||
| Total retirement benefit recognized in accumulated other comprehensive income at beginning of year |
$ | 42.7 | $ | 132.7 | $ | 32.1 | $ | 35.6 | ||||||||
| Net actuarial loss (gain) |
62.8 | (81.0 | ) | 30.3 | (1.0 | ) | ||||||||||
| Prior service cost |
— | — | 0.9 | 0.5 | ||||||||||||
| Amortization of prior service credit (cost) |
1.0 | 1.0 | (0.3 | ) | (0.2 | ) | ||||||||||
| Amortization of actuarial loss |
(1.8 | ) | (10.0 | ) | (1.2 | ) | (2.7 | ) | ||||||||
| Translation difference |
— | — | (5.4 | ) | (0.1 | ) | ||||||||||
|
|
|
|
|
|
|
|
|
|||||||||
| Total retirement benefit recognized in accumulated other comprehensive income at end of year |
$ | 104.7 | $ | 42.7 | $ | 56.4 | $ | 32.1 | ||||||||
|
|
|
|
|
|
|
|
|
|||||||||
The accumulated benefit obligation for the U.S. non-contributory defined benefit pension plans was $278.5 million and $204.9 million at December 31, 2014 and 2013, respectively. The accumulated benefit obligation for the non-U.S. defined benefit pension plans was $195.4 million and $172.3 million at December 31, 2014 and 2013, respectively.
Pension plans for which the accumulated benefit obligation (ABO) is notably in excess of the plan assets reside in the following countries: U.S., France, Germany, Japan, South Korea and Sweden. At December 31, 2013, the U.S. plan assets exceeded the ABO by $18.7 million.
PENSION PLANS FOR WHICH ABO EXCEEDS THE FAIR VALUE OF PLAN ASSETS AS OF DECEMBER 31
| U.S. | Non-U.S. | |||||||||||||||
| 2014 | 2013 | 2014 | 2013 | |||||||||||||
| Projected Benefit Obligation (PBO) |
$ | 357.0 | n/a | $ | 155.4 | $ | 109.5 | |||||||||
| Accumulated Benefit Obligation (ABO) |
$ | 278.5 | n/a | $ | 124.1 | $ | 84.7 | |||||||||
| Fair value of plan assets |
$ | 253.8 | n/a | $ | 29.6 | $ | 4.9 | |||||||||
The Company, in consultation with its actuarial advisors, determines certain key assumptions to be used in calculating the projected benefit obligation and annual net periodic benefit cost.
ASSUMPTIONS USED TO DETERMINE THE BENEFIT OBLIGATIONS AS OF DECEMBER 31
| U.S. | Non-U.S.1) | |||||||||||||||
| % WEIGHTED AVERAGE |
2014 | 2013 | 2014 | 2013 | ||||||||||||
| Discount rate |
4.00 | 5.00 | 0.50 - 4.00 | 1.00 - 5.00 | ||||||||||||
| Rate of increases in compensation level |
3.50 | 3.50 | 2.25 - 5.00 | 2.25 - 5.00 | ||||||||||||
ASSUMPTIONS USED TO DETERMINE THE NET PERIODIC BENEFIT COST FOR YEARS ENDED DECEMBER 31
| U.S. | ||||||||||||
| % WEIGHTED AVERAGE |
2014 | 2013 | 2012 | |||||||||
| Discount rate |
5.00 | 4.05 | 4.60 | |||||||||
| Rate of increases in compensation level |
3.50 | 3.50 | 3.50 | |||||||||
| Expected long-term rate of return on assets |
7.08 | 7.50 | 7.50 | |||||||||
| Non-U.S.1) | ||||||||||||
| % WEIGHTED AVERAGE |
2014 | 2013 | 2012 | |||||||||
| Discount rate |
1.00 - 5.00 | 1.50 - 4.50 | 1.50 - 5.50 | |||||||||
| Rate of increases in compensation level |
2.25 - 5.00 | 2.25 - 5.00 | 2.25 - 5.00 | |||||||||
| Expected long-term rate of return on assets |
2.60 - 6.15 | 3.00 - 5.75 | 3.75 - 5.75 | |||||||||
| 1) | The Non-U.S. weighted average plan ranges in the tables above have been prepared using significant plans only, which in total represent more than 90% of the total Non-U.S. projected benefit obligation. |
The discount rate for the U.S. plans has been set based on the rates of return on high-quality fixed-income investments currently available at the measurement date and expected to be available during the period the benefits will be paid. The expected timing of cash flows from the plan has also been considered in select-ing the discount rate. In particular, the yields on bonds rated AA or better on the measurement date have been used to set the discount rate. The discount rate for the U.K. plan has been set based on the weighted average yields on long-term high-grade corporate bonds and is determined by reference to financial markets on the measurement date.
The expected rate of increase in compensation levels and long-term rate of return on plan assets are determined based on a number of factors and must take into account long-term expectations and reflect the financial environment in the respective local market. The expected return on assets for the U.S. and U.K. plans are based on the fair value of the assets as of December 31.
The level of equity exposure is currently targeted at approximately 55% for the primary U.S. plan. The investment objective is to provide an attractive risk-adjusted return that will ensure the payment of benefits while protecting against the risk of substantial investment losses. Correlations among the asset classes are used to identify an asset mix that Autoliv believes will provide the most attractive returns. Long-term return forecasts for each asset class using historical data and other qualitative considerations to adjust for projected economic forecasts are used to set the expected rate of return for the entire portfolio. The Company has assumed a long-term rate of return on the U.S. plan assets of 7.08% for calculating the 2014 expense and 7.08% for calculating the 2015 expense as a result of the decrease in U.S. plan asset equity exposure.
The Company has assumed a long-term rate of return on the non-U.S. plan assets in a range of 2.60-6.15% for 2014. The closed U.K. plan which has a tar-geted and actual allocation of almost 100% debt instruments accounts for approximately 58% of the total non-U.S. plan assets.
Autoliv made contributions to the U.S. plan during 2014 and 2013 amounting to $6.7 million and $42.2 million, respectively. The increase in 2013 was due to an unscheduled voluntary contribution of $35 million to a U.S. pension plan in the fourth quarter 2013. Contributions to the U.K. plan during 2014 and 2013 amounted to $1.5 million and $0.3 million, respectively. The Company expects to contribute $6.8 million to its U.S. pension plan in 2015 and is currently projecting a -yearly funding at approximately the same level in the years thereafter. For the UK plan, which is the most significant non-U.S. pension plan, the Company expects to contribute $1.5 million in 2015 and in the years thereafter.
FAIR VALUE OF TOTAL PLAN ASSETS FOR YEARS ENDED DECEMBER 31
| ASSETS CATEGORY IN % WEIGHTED AVERAGE |
U.S. | U.S. | Non-U.S. | |||||||||||||||||
| Target allocation |
2014 | 2013 | 2014 | 2013 | ||||||||||||||||
| Equity securities |
55 | 54 | 57 | 15 | 15 | |||||||||||||||
| Debt instruments |
45 | 46 | 43 | 63 | 59 | |||||||||||||||
| Other assets |
— | — | — | 22 | 26 | |||||||||||||||
|
|
|
|
|
|
|
|
|
|
|
|||||||||||
| Total |
100 | 100 | 100 | 100 | 100 | |||||||||||||||
|
|
|
|
|
|
|
|
|
|
|
|||||||||||
The following table summarizes the fair value of the Company’s plan assets:
| Fair value measurement at December 31, 2014 |
Fair value measurement at December 31, 2013 |
|||||||
| Assets |
||||||||
| US Equity |
||||||||
| Large Cap |
$ | 90.9 | $ | 82.5 | ||||
| Mid Cap |
10.7 | 9.8 | ||||||
| Small Cap |
10.7 | 9.7 | ||||||
| Non-US Equity |
42.2 | 40.4 | ||||||
| US Bonds |
||||||||
| Aggregate |
115.9 | 96.5 | ||||||
| Non-US Bonds |
||||||||
| Corporate |
62.6 | 52.8 | ||||||
| Aggregate |
5.7 | 5.7 | ||||||
| Insurance Contracts |
15.7 | 19.2 | ||||||
| Other Investments |
7.4 | 6.9 | ||||||
|
|
|
|
|
|||||
| Total |
$ | 361.8 | $ | 323.5 | ||||
|
|
|
|
|
|||||
The fair value measurement level within the fair value hierarchy (see note 3) is based on the lowest level of any input that is significant to the fair value measurement. After further analysis of the characteristics of certain investments (e.g. fair values based on net asset values held by common collective trusts) we have evaluated the fair value of plan assets should be reported as Level 2.
The estimated future benefit payments for the pension benefits reflect expected future service, as appropriate. The amount of benefit payments in a given year may vary from the projected amount, especially for the U.S. plan since historically this plan pays the majority of benefits as a lump sum, where the lump sum amounts vary with market interest rates.
| PENSION BENEFITS EXPECTED PAYMENTS |
U.S. | Non-U.S. | ||||||
| 2015 |
$ | 13.3 | $ | 6.6 | ||||
| 2016 |
$ | 15.0 | $ | 7.0 | ||||
| 2017 |
$ | 17.4 | $ | 7.8 | ||||
| 2018 |
$ | 18.5 | $ | 8.6 | ||||
| 2019 |
$ | 20.8 | $ | 9.2 | ||||
| Years 2020-2024 |
$ | 129.5 | $ | 61.1 | ||||
POSTRETIREMENT BENEFITS OTHER THAN PENSIONS
The Company currently provides postretirement health care and life insurance benefits to most of its U.S. retirees. Such benefits in other countries are included in the tables below, but are not significant.
In general, the terms of the plans provide that U.S. employees who retire after attaining age 55, with 15 years of service (5 years before December 31, 2006), are reimbursed for qualified medical expenses up to a maximum annual amount. Spouses for certain retirees are also eligible for reimbursement under the plan. Life insurance coverage is available for those who elect coverage under the retiree health plan. During 2014, the plan was amended to move from a self-insured model where employees were charged an estimated premium based on anticipated plan expenses for continued coverage, to a plan where retirees are provided a fixed contribution to a Health Retirement Account (HRA). Retirees can use the HRA funds to purchase insurance through a private exchange. The effect of this change was to decrease the benefit obligation related to the plan by $17.2 million as of December 31, 2014. Employees hired on or after January 1, 2004 are not eligible to participate in the plan.
The Company has reviewed the impact of the Medicare Prescription Drug, Improvement and Modernization Act of 2003 (Medicare Part D) on its financial statements. Although the Plan may currently qualify for a subsidy from Medicare, the amount of the subsidy is so small that the expenses incurred to file for the subsidy may exceed the subsidy itself. Therefore, the impact of any subsidy is ignored in the calculations as Autoliv will not be filing for any reimbursement from Medicare.
CHANGES IN BENEFIT OBLIGATIONS AND PLAN ASSETS FOR POSTRETIREMENT BENEFIT PLANS OTHER THAN PENSIONS AS OF DECEMBER 31
| 2014 | 2013 | 2012 | ||||||||||
| Benefit obligation at beginning of year |
$ | 34.3 | $ | 34.6 | $ | 30.8 | ||||||
| Service cost |
1.3 | 1.4 | 1.1 | |||||||||
| Interest cost |
1.6 | 1.4 | 1.3 | |||||||||
| Actuarial (gain) loss due to: |
||||||||||||
| Change in discount rate |
2.4 | (3.7 | ) | 1.9 | ||||||||
| Experience |
(1.1 | ) | 1.0 | (3.1 | ) | |||||||
| Other assumption changes |
0.4 | (1.0 | ) | 3.2 | ||||||||
| Plan amendments |
(17.2 | ) | — | — | ||||||||
| Benefits paid |
(0.8 | ) | (0.3 | ) | (0.5 | ) | ||||||
| Other |
0.1 | 0.9 | (0.1) | |||||||||
| Benefit obligation at end of year |
$ | 21.0 | $ | 34.3 | $ | 34.6 | ||||||
| Fair value of plan assets at beginning of year |
$ | — | $ | — | $ | — | ||||||
| Company contributions |
0.8 | 0.3 | 0.5 | |||||||||
| Benefits paid |
(0.8) | (0.3) | (0.5) | |||||||||
| Fair value of plan assets at end of year |
$— | $— | $— | |||||||||
| Accrued postretirement benefit cost recognized in the balance sheet |
$ | (21.0 | ) | $ | (34.3 | ) | $ | (34.6 | ) | |||
The liability for postretirement benefits other than pensions is classified as other non-current liabilities in the balance sheet. The short-term portion of the liability for postretirement benefits other than pensions is not significant.
COMPONENTS OF NET PERIODIC BENEFIT COST ASSOCIATED WITH THE POST-RETIREMENT BENEFIT PLANS OTHER THAN PENSIONS
| PERIOD ENDED DECEMBER 31 |
2014 | 2013 | 2012 | |||||||||
| Service cost |
$ | 1.3 | $ | 1.4 | $ | 1.1 | ||||||
| Interest cost |
1.6 | 1.4 | 1.3 | |||||||||
| Amortization of prior service cost |
(0.1 | ) | (0.1 | ) | (0.1 | ) | ||||||
| Amortization of actuarial loss |
(0.1) | (0.1) | (0.2) | |||||||||
| Net periodic benefit cost |
$ | 2.7 | $ | 2.6 | $ | 2.1 | ||||||
COMPONENTS OF ACCUMULATED OTHER COMPREHENSIVE INCOME BEFORE TAX ASSOCIATED WITH POSTRETIREMENT BENEFIT PLANS OTHER THAN PENSIONS AS OF DECEMBER 31
| U.S. | Non-U.S. | |||||||||||||||
| 2014 | 2013 | 2014 | 2013 | |||||||||||||
| Net actuarial loss (gain) |
$ | (0.7 | ) | $ | (2.4 | ) | $ | (1.7 | ) | $ | (1.8 | ) | ||||
| Prior service cost (credit) |
(17.3 | ) | (0.2 | ) | (0.0 | ) | (0.0 | ) | ||||||||
|
|
|
|
|
|
|
|
|
|||||||||
| Total accumulated other comprehensive income recognized in the balance sheet |
$ | (18.0 | ) | $ | (2.6 | ) | $ | (1.7 | ) | $ | (1.8 | ) | ||||
For measuring end-of-year obligations at December 31, 2014, health care trends are not needed due to the fixed-cost nature of the benefits provided in 2014 and beyond. After 2014, all retirees receive a fixed dollar subsidy toward the cost of their health benefits. This individual retiree subsidy will not increase in future years.
The weighted average discount rate used to determine the U.S. postretirement benefit obligation was 4.20% in 2014 and 5.05% in 2013. The average discount rate used in determining the postretirement benefit cost was 5.05% in 2014, 4.25% in 2013 and 4.60% in 2012.
A one percentage point increase or decrease in the annual health care cost trend rates would have had no impact on the Company’s net benefit cost for the current period or on the accumulated postretirement benefit obligation at December 31, 2014. This is due to the fixed-dollar nature of the benefits provided under the plan.
The estimated net gain and prior service credit for the postretirement benefit plans that will be amortized from other comprehensive income into net benefit cost over the next fiscal year are approximately $(2.3) million combined.
The estimated future benefit payments for the postretirement benefits reflect expected future service as appropriate.
| POSTRETIREMENT BENEFITS |
EXPECTED PAYMENTS |
|||
| 2015 |
$ | 0.6 | ||
| 2016 |
$ | 0.7 | ||
| 2017 |
$ | 0.7 | ||
| 2018 |
$ | 0.8 | ||
| 2019 |
$ | 0.9 | ||
| Years 2020 - 2024 |
$ | 5.3 | ||
19. Segment Information
The Company has two operating segments (also known internally as reporting units): Passive Safety products (mainly various airbag and seatbelt products and components, including common electronic and sensing systems) and Active Safety products (radars, night vision systems and cameras with driver assist systems). The Company’s Active Safety operating segment represents less than 6% of the Company’s total sales in 2014. Due to the relative size of the Active Safety operating segment the Company has concluded that its operating segments met the criteria for combination for reporting purposes into a single reportable segment in 2014.
The Company’s customers consist of all major European, U.S. and Asian automobile manufacturers. Sales to individual customers representing 10% or more of net sales were:
In 2014: GM 14% (incl. Opel, etc.), Ford 11% and Renault 11% (incl. Nissan).
In 2013: GM 14% (incl. Opel, etc.), Ford 11% and Renault 11% (incl. Nissan).
In 2012: GM 15% (incl. Opel, etc.), Ford 11% and Renault 11% (incl. Nissan).
| NET SALES |
2014 | 2013 | 2012 | |||||||||
| Asia |
$ | 3,097.9 | $ | 2,974.1 | $ | 2,752.2 | ||||||
| Whereof: China |
1,521.6 | 1,405.5 | 1,097.6 | |||||||||
| Japan |
687.7 | 688.2 | 830.5 | |||||||||
| Rest of Asia |
888.6 | 880.4 | 824.1 | |||||||||
| Americas |
3,099.4 | 2,943.6 | 2,839.1 | |||||||||
| Europe |
3,043.2 | 2,885.7 | 2,675.4 | |||||||||
| Total |
$ | 9,240.5 | $ | 8,803.4 | $ | 8,266.7 | ||||||
The Company has attributed net sales to the geographic area based on the location of the entity selling the final product. For 2012, the Company has reclassified approximately $31 million in sales of Active Safety products from the Americas to Europe which is reflected in the table above. This reclassification had no change to net sales or total sales of Active Safety products.
External sales in the U.S. amounted to $2,269 million, $2,122 million and $2,073 million in 2014, 2013 and 2012, respectively. Of the external sales, exports from the U.S. to other regions amounted to approximately $459 million, $488 million and $543 million in 2014, 2013 and 2012, respectively.
| SALES BY PRODUCT |
2014 | 2013 | 2012 | |||||||||
| Airbags and associated products1) |
$ | 5,951.3 | $ | 5,686.0 | $ | 5,392.0 | ||||||
| Seatbelts and associated products |
2,800.1 | 2,772.7 | 2,656.5 | |||||||||
| Active Safety products |
489.1 | 344.7 | 218.2 | |||||||||
| Total |
$ | 9,240.5 | $ | 8,803.4 | $ | 8,266.7 | ||||||
1) Includes sales of steering wheels, passive safety electronics and inflators.
| LONG-LIVED ASSETS |
2014 | 2013 | ||||||
| Asia |
$ | 696 | $ | 612 | ||||
| Whereof: China |
391 | 277 | ||||||
| Japan |
98 | 106 | ||||||
| Rest of Asia |
207 | 229 | ||||||
| Americas |
1,906 | 1,927 | ||||||
| Europe |
705 | 744 | ||||||
|
|
|
|
|
|||||
| Total |
$ | 3,307 | $ | 3,283 | ||||
Long-lived assets in the U.S. amounted to $1,733 million and $1,741 million for 2014 and 2013, respectively. For 2014, $1,476 million (2013, $1,485 million) of the long-lived assets in the U.S. refers to intangible assets, principally from acquisition goodwill.
20. Earnings Per Share
The weighted average shares used in calculating earnings per share were:
| 2014 | 2013 | 2012 | ||||||||||
| Weighted average shares basic |
92.1 | 95.5 | 93.5 | |||||||||
| Effect of dilutive securities: |
||||||||||||
| stock options/share awards |
0.3 | 0.4 | 0.3 | |||||||||
| equity units |
— | — | 1.3 | |||||||||
| Weighted average shares diluted | 92.4 | 95.9 | 95.1 | |||||||||
The number of shares outstanding increased on April 30, 2012 by 5.8 million due to the settlement of the remaining Equity Units. For 2012, 1.3 million shares were included in the dilutive weighted average share amount related to the Equity Units. Due to the settlement in April 2012 there is no effect in 2014 and 2013. For further information see Note 13.
There were no antidilutive shares outstanding for the years ended December 31, 2014 and 2013. In 2012 there were approximately 0.4 million common shares related to the Company’s Stock Incentive Plan, which were antidilutive and therefore not included in the computation of diluted EPS.
21. Subsequent Events
There were no other reportable events subsequent to December 31, 2014.
22. Quarterly Financial Data (unaudited)
| 2014 |
Q1 | Q2 | Q3 | Q4 | ||||||||||||
| Net sales |
$ | 2,295.8 | $ | 2,383.0 | $ | 2,208.0 | $ | 2,353.7 | ||||||||
| Gross profit |
445.3 | 464.2 | 426.4 | 467.9 | ||||||||||||
| Income before taxes |
184.3 | 122.9 | 156.5 | 203.3 | ||||||||||||
| Net income |
131.1 | 83.2 | 106.7 | 148.0 | ||||||||||||
| Net income attributable to controlling interest |
130.3 | 82.8 | 106.5 | 148.2 | ||||||||||||
| Earnings per share |
||||||||||||||||
| – basic |
$ | 1.39 | $ | 0.89 | $ | 1.16 | $ | 1.65 | ||||||||
| – diluted |
$ | 1.38 | $ | 0.89 | $ | 1.16 | $ | 1.65 | ||||||||
| Dividends paid |
$ | 0.52 | $ | 0.52 | $ | 0.54 | $ | 0.54 | ||||||||
| 2013 |
Q1 | Q2 | Q3 | Q4 | ||||||||||||
| Net sales |
$ | 2,135.0 | $ | 2,197.5 | $ | 2,119.0 | $ | 2,351.9 | ||||||||
| Gross profit |
414.3 | 430.5 | 404.9 | 454.9 | ||||||||||||
| Income before taxes |
170.1 | 192.7 | 176.6 | 194.6 | ||||||||||||
| Net income |
125.1 | 139.4 | 124.9 | 100.5 | ||||||||||||
| Net income attributable to controlling interest |
123.5 | 138.7 | 123.9 | 99.7 | ||||||||||||
| Earnings per share |
||||||||||||||||
| – basic |
$ | 1.29 | $ | 1.45 | $ | 1.29 | $ | 1.05 | ||||||||
| – diluted |
$ | 1.29 | $ | 1.44 | $ | 1.29 | $ | 1.04 | ||||||||
| Dividends paid |
$ | 0.50 | $ | 0.50 | $ | 0.50 | $ | 0.50 | ||||||||
EXCHANGE RATES FOR KEY CURRENCIES VS. U.S. DOLLAR
| 2014 | 2014 | 2013 | 2013 | 2012 | 2012 | 2011 | 2011 | 2010 | 2010 | |||||||||||||||||||||||||||||||
| Average | Year end | Average | Year end | Average | Year end | Average | Year end | Average | Year end | |||||||||||||||||||||||||||||||
| EUR |
1.327 | 1.218 | 1.328 | 1.374 | 1.285 | 1.322 | 1.390 | 1.292 | 1.321 | 1.323 | ||||||||||||||||||||||||||||||
| CNY |
0.162 | 0.161 | 0.162 | 0.165 | 0.159 | 0.160 | 0.155 | 0.159 | 0.148 | 0.151 | ||||||||||||||||||||||||||||||
| JPY/1000 |
9.452 | 8.367 | 10.256 | 9.494 | 12.538 | 11.607 | 12.570 | 12.881 | 11.411 | 12.268 | ||||||||||||||||||||||||||||||
| KRW/1000 |
0.950 | 0.913 | 0.914 | 0.949 | 0.888 | 0.937 | 0.904 | 0.863 | 0.864 | 0.883 | ||||||||||||||||||||||||||||||
| MXN |
0.075 | 0.068 | 0.078 | 0.077 | 0.076 | 0.077 | 0.080 | 0.071 | 0.079 | 0.081 | ||||||||||||||||||||||||||||||
| SEK |
0.146 | 0.128 | 0.153 | 0.154 | 0.148 | 0.153 | 0.154 | 0.144 | 0.139 | 0.147 | ||||||||||||||||||||||||||||||
Report of Independent Registered Public Accounting Firm
The Board of Directors and Shareholders of Autoliv, Inc.
We have audited the accompanying consolidated balance sheets of Autoliv, Inc. as of December 31, 2014 and 2013, and the related consolidated statements of net income, comprehensive income, total equity and cash flows for each of the three years in the period ended December 31, 2014. These financial statements are the responsibility of the Company’s management. Our responsibility is to express an opinion on these financial statements based on our audits.
We conducted our audits in accordance with the standards of the Public Company Accounting Oversight Board (United States). Those standards require that we plan and perform the audit to obtain reasonable assurance about whether the financial statements are free of material misstatement. An audit includes examining, on a test basis, evidence supporting the amounts and disclosures in the financial statements. An audit also includes assessing the accounting principles used and significant estimates made by management, as well as evaluating the overall financial statement presentation. We believe that our audits provide a reasonable basis for our opinion.
In our opinion, the financial statements referred to above present fairly, in all material respects, the consolidated financial position of Autoliv, Inc. at December 31, 2014 and 2013, and the consolidated results of its operations and its cash flows for each of the three years in the period ended December 31, 2014, in conformity with U.S. generally accepted accounting principles.
We also have audited, in accordance with the standards of the Public Company Accounting Oversight Board (United States), Autoliv, Inc.’s internal control over financial reporting as of December 31, 2014, based on criteria established in Internal Control–Integrated Framework issued by the Committee of Sponsoring Organizations of the Treadway Commission (2013 framework) and our report dated February 19, 2015 expressed an unqualified opinion thereon.
Stockholm, Sweden
February 19, 2015 /s/ Ernst & Young AB
Report of Independent Registered Public Accounting Firm on Internal Control Over Financial Reporting
The Board of Directors and Shareholders of Autoliv, Inc.
We have audited Autoliv, Inc.’s internal control over financial reporting as of December 31, 2014, based on criteria established in Internal Control—Integrated Framework issued by the Committee of Sponsoring Organizations of the Treadway Commission (2013 framework) (the COSO criteria). Autoliv, Inc.’s management is responsible for maintaining effective internal control over financial reporting, and for its assessment of the effectiveness of internal control over financial reporting included in the accompanying Management’s Report on Internal Control over Financial Reporting. Our responsibility is to express an opinion on the company’s internal control over financial reporting based on our audit.
We conducted our audit in accordance with the standards of the Public Company Accounting Oversight Board (United States). Those standards require that we plan and perform the audit to obtain reasonable assurance about whether effective internal control over financial reporting was maintained in all material respects. Our audit included obtaining an understanding of internal control over financial reporting, assessing the risk that a material weakness exists, testing and evaluating the design and operating effectiveness of internal control based on the assessed risk, and performing such other procedures as we considered necessary in the circumstances. We believe that our audit provides a reasonable basis for our opinion.
A company’s internal control over financial reporting is a process designed to provide reasonable assurance regarding the reliability of financial reporting and the preparation of financial statements for external purposes in accordance with generally accepted accounting principles. A company’s internal control over financial reporting includes those policies and procedures that (1) pertain to the maintenance of records that, in reasonable detail, accurately and fairly reflect the transactions and dispositions of the assets of the company; (2) provide reasonable assurance that transactions are recorded as necessary to permit preparation of financial statements in accordance with generally accepted accounting principles, and that receipts and expenditures of the company are being made only in accordance with authorizations of management and directors of the company; and (3) provide reasonable assurance regarding prevention or timely detection of unauthorized acquisition, use or disposition of the company’s assets that could have a material effect on the financial statements.
Because of its inherent limitations, internal control over financial reporting may not prevent or detect misstatements. Also, projections of any evaluation of effectiveness to future periods are subject to the risk that controls may become inadequate because of changes in conditions, or that the degree of compliance with the policies or procedures may deteriorate.
In our opinion, Autoliv, Inc. maintained, in all material respects, effective internal control over financial reporting as of December 31, 2014, based on the COSO criteria.
We have also audited, in accordance with the standards of the Public Company Accounting Oversight Board (United States), the consolidated balance sheets as of December 31, 2014 and 2013, and the related consolidated statements of net income, comprehensive income, total equity and cash flows for each of the three years in the period ended December 31, 2014 of Autoliv, Inc. and our report dated February 19, 2015 expressed an unqualified opinion thereon.
Stockholm, Sweden
February 19, 2015 /s/ Ernst & Young AB
Glossary and Definitions
Corporate Governance
This section should be read in conjunction with Autoliv’s proxy statement (the “Proxy Statement”), which contains a more complete explanation of the Company’s Corporate Governance, and will be available at www.autoliv.com in late March 2015. Please also refer to pages 51–54 about Risk Management and page 55 in the Annual Report about Internal Control in this Annual Report.
AUTOLIV IS A DELAWARE CORPORATION with its headquarters in Stockholm, Sweden. As a publicly traded U.S. corporation with its primary listing on the New York Stock Exchange (NYSE), the Company is subject primarily to U.S. state and federal regulations and NYSE corporate governance requirements. Autoliv also has a secondary listing of its Swedish Depository Receipts on the NASDAQ OMX Nordic. The Company has elected to primarily apply U.S. corporate governance rules, standards and best practices rather than those of Sweden, as further described in the Proxy Statement. In addition to, and consistent with, these statutory laws and regulations, Autoliv is governed by its own charter documents and internal standards and policies through its Restated Certificate of Incorporation, Second Restated By-laws, Corporate Governance Guidelines and Standards of Business Conduct and Ethics.
These charter documents and internal standards and policies guide and assist the Board of Directors (the “Board”) in the exercise of its responsibilities and reflect the Board’s commitment to fostering a culture of integrity and monitoring the effectiveness of policy and decision-making, both at the Board and management level. The Board views corporate governance as an integral part of the basic operations of the Company and a necessary element for long-term, sustainable growth in stockholder value.
STOCKHOLDERS’ MEETING
At the Annual Meeting of Stockholders, each stockholder is entitled to one vote for each share of common stock owned as of the record date specified in the Proxy Statement. Stockholders can vote via the Internet, telephone or by proxy cards.
Business to be conducted at an Annual Meeting of Stockholders shall only be that which has been properly brought before the Annual Meeting and in compliance with our Second Restated By-laws and Rule 14a-8 of the Exchange Act. For a stockholder proposal under Rule 14a-8 to be considered for inclusion in the proxy statement for our 2016 Annual Meeting, it must be received by us on or before November 24, 2015. If stockholders wish to present a proposal at our 2016 Annual Meeting but do not intend for the proposal to be included in our proxy statement, our Restated By-laws provide that we must receive the written notice at our principal executive offices no earlier than the close of business on February 5, 2016 and no later than the close of business on March 6, 2016.
THE BOARD
The Board is entrusted with, and responsible for, overseeing the business and affairs of the Company.
The Board monitors the performance of the Company in relation to its goals, strategy, competitors, and the performance of the Chief Executive Officer (CEO). The Board is allowed under our Corporate Governance Guidelines to choose its chairman in a way that it deems best for the Company. At this time, the Board believes that combining the CEO and Chairman roles facilitates the flow of information between the Board and the Company’s management and better enables the Board to fulfill its oversight role. In May 2014, the Board appointed George A. Lorch as Lead Independent Director. The duties of the Lead Independent Director can be found in the Company’s Corporate Governance Guidelines.
The Board has full access to management and to Autoliv’s outside advisors. The work of the Board is reported annually in the Proxy Statement.
The Board has adopted Corporate Governance Guidelines that reflect its commitment to monitoring the effectiveness of policies and decision-making both at the Board and management level. To ensure that the Company’s governing principles remain current and consistent with high standards of corporate governance, the Board periodically reviews the Company’s Corporate Governance Guidelines and amends them as necessary.
According to our Restated Certificate of Incorporation, the number of directors may be fixed from time to time exclusively by the Board. The Board believes that it should generally have no fewer than seven and no more than eleven directors. At the 2014 Annual Meeting of Stockholders, stockholders approved amendments to the Company’s Restated Certificate of Incorporation to declassify the Board and provide for the annual election of all directors. These amendments phase-in the declassification over a three-year period, as further explained in the Proxy Statement. Beginning with the 2015 Annual Meeting of Stockholders, directors will be elected to serve one-year terms and by the 2017 Annual Meeting of Stockholders, the entire Board will be elected annually.
DIRECTORS
Directors are expected to spend the time and effort necessary to properly discharge their duties and responsibilities. Accordingly, directors are expected to regularly attend meetings of the Board and committees on which they sit. Directors are also expected to attend the Annual Meeting of Stockholders.
The Board is responsible for filling vacancies on the Board that may occur between annual meetings of stockholders. The Nominating and Corporate Governance Committee is responsible for identifying, screening and recommending candidates to the Board. The Nominating and Corporate Governance Committee will consider stockholder nominees for election to the Board if timely advance written notice of such nominees is received by the Secretary of the Company, as detailed in the Proxy Statement.
Nominees for director are selected on the basis of many factors, including (i) positions of leadership attained in the candidate’s area of expertise, (ii) business and financial experience, (iii) possession of demonstrated sound business judgment, (iv) expertise relevant to the Company’s lines of business, (v) independence from management, (vi) the ability to serve on standing committees and (vii) the ability to serve the interests of all stockholders. The Nominating and Corporate Governance Committee routinely considers board candidates with a broad range of educational and professional experiences from a variety of countries. The Board must be comprised of a majority of directors who qualify as independent under the listing standards of the NYSE. Currently, all board members are independent, with the exception of the CEO. On an annual basis, the Board reviews the relationships that each director has with the Company to assess independence.
BOARD COMPENSATION
A director who is also an officer of the Company does not receive additional compensation for service as a director.
Board compensation is disclosed in the Proxy Statement together with the compensation of the CEO, CFO and other most highly-compensated executive officers, as required by SEC rules. Directors’ fees are the only compensation that the directors, including all of the members of the Audit Committee, can receive from Autoliv. Non-employee directors are required to hold one year’s annual fees worth of Autoliv’s common stock, and have a three year period to acquire such holdings.
BOARD MEETINGS
It is Autoliv’s policy to have five regularly scheduled meetings of the Board each year, with at least one regularly scheduled meeting each quarter.
The meetings of the Board generally follow a master agenda, which is discussed and agreed upon in coordination with the Lead Independent Director, but any director is able to raise any other issues or subjects. The Nominating and Corporate Governance Committee initiates an annual self-assessment of the Board’s and each committee’s performance. The results of such assessments are discussed with the full Board and each committee.
The independent directors normally meet in executive sessions in conjunction with each meeting of the Board and are required to meet at least four times a year. The Lead Independent Director normally leads the executive sessions of the independent directors.
COMMITTEE MATTERS
All directors serving on board committees have been determined by the Board to be independent directors under U.S. regulatory rules. The committees operate under written charters, which are available on the Company’s website, and the standing committees issue yearly reports that are disclosed in the Proxy Statement.
There are three standing committees of the Board: Audit Committee, Compensation Committee and Nominating and Corporate Governance Committee. In June 2011, the Board also formed a special Compliance Committee.
Audit Committee
The Audit Committee appoints, at its sole discretion (subject to stockholder ratification), the Company’s independent auditors to audit the Company’s annual financial statements. The Audit Committee is also responsible for the compensation, retention and oversight of the work of the external auditors as well as for any special assignments given to the auditors. Additionally, the Audit Committee:
| • | reviews the annual audit and its scope, including the independent auditors’ letter of comments and management’s responses thereto; |
| • | reviews the practices with regard to risk oversight and risk management as part of its obligations under the NYSE’s listing standards; |
| • | reviews possible violations of Autoliv’s business ethics and conflicts of interest policies; |
| • | reviews any major accounting changes made or contemplated; |
| • | approves any related person transaction; |
| • | reviews the effectiveness and efficiency of Autoliv’s internal audit function; and |
| • | confirms that no restrictions have been imposed by Company personnel on the scope of the independent auditors’ examinations. |
Each member of the Audit Committee possesses financial literacy and accounting or related financial management expertise.
Currently, one member, Robert W. Alspaugh (Chairman of the Audit Committee), has been determined to qualify as an audit committee financial expert.
Compensation Committee
The Compensation Committee advises the Board with respect to the compensation to be paid to the directors and senior executives and approves and advises the Board with respect to the terms of contracts to be entered into with the senior executives. The Committee also considers the advisory resolution at the Company’s annual meeting of stockholders to approve the compensation of the Company’s named executive officers, as detailed in the Proxy Statement.
The Compensation Committee also administers Autoliv’s incentive plans as well as perquisites and other benefits to the executive officers.
Nominating and Corporate Governance Committee
The Nominating and Corporate Governance Committee assists the Board in identifying potential candidates to the Board, reviewing the composition of the Board and its committees, monitoring a process to assess Board effectiveness and developing and implementing Autoliv’s Corporate Governance Guidelines.
Compliance Committee
The Compliance Committee was formed to assist the Board in overseeing the Company’s compliance program with respect to compliance with (i) the laws and regulations applicable to the Company’s business and (ii) the Company’s Standards of Business Conduct and Ethics and related policies designed to support lawful and ethical business conduct by the Company and its employees and promote a culture of compliance. The Compliance Committee also oversees the investigation of any alleged non-compliance with applicable laws or the Company’s compliance policies (except those relating to financial compliance which are overseen by the Audit Committee).
LEADERSHIP DEVELOPMENT
The Board is responsible for identifying potential candidates for, as well as selecting, the CEO. The Board is also responsible for an annual performance review of the CEO and succession planning for the CEO’s position. This is done with the assistance of the CEO, who also prepares and distributes to the Board an annual report on succession planning for senior officers.
The Board is also responsible for ensuring that satisfactory systems are in place for the education, development and succession of senior and mid-level management.
ETHICS CODES
To maintain the highest legal and ethical standards, the Board has adopted a set of Standards of Business Conduct and Ethics, which apply to all of the Company’s directors, officers and employees. Additionally, the Board has adopted a Code of Conduct and Ethics for Directors and Senior Officers.
Employees are encouraged to report any violations of law or of the Company’s ethical codes and policies, and policies are in place to prevent retaliation against any individual for reporting in good faith violations of law or the Company’s ethical codes and policies.
Reports can be made to Autoliv’s Compliance Officer or legal department (for contact information see page 88 in the Annual Report), or by using the Autoliv Helpline – a multilingual service where reports can be made anonymously, without fear of retaliation, 24 hours a day, 7 days a week, by phone or online at http://helpline.autoliv.com.
Board of Directors
| NAME |
SHARES1) | RSU’S1) | OPTIONS1) | TOTAL1) | ||||||||||||
| Board of Directors |
||||||||||||||||
| Jan Carlson |
77,861 | 20,152 | 26,562 | 124,575 | ||||||||||||
| Robert W. Alspaugh |
4,344 | – | – | 4,344 | ||||||||||||
| Aicha Evans |
– | – | – | – | ||||||||||||
| David E. Kepler |
– | – | – | – | ||||||||||||
| Franz-Josef Kortüm |
456 | – | – | 456 | ||||||||||||
| Xiaozhi Liu |
1,953 | – | – | 1,953 | ||||||||||||
| George A. Lorch |
2,366 | – | – | 2,366 | ||||||||||||
| James M. Ringler |
3,027 | – | – | 3,027 | ||||||||||||
| Kazuhiko Sakamoto |
1,953 | – | – | 1,953 | ||||||||||||
|
|
|
|
|
|
|
|
|
|||||||||
| SUBTOTAL |
91,960 | 20,152 | 26,562 | 138,674 | ||||||||||||
1) Number of shares, RSUs and stock options as of February 17, 2015. For any changes thereafter please refer to Autoliv’s corporate website or each director’s or manager’s filings with the SEC. Insider filings are also made with Finansinspektionen in Sweden.
For presentations of the Directors, please refer to our filings, including in our proxy statement, on file with the U.S. Securities and Exchange Commission (SEC) and available at www.sec.gov, or www.autoliv.com
Executive Management Team
| NAME |
SHARES1) | RSU’S1) | OPTIONS1) | TOTAL1) | ||||||||||||
| Executive Management Team |
||||||||||||||||
| Jan Carlson |
77,861 | 20,152 | 26,562 | 124,575 | ||||||||||||
| Henrik Arrland |
– | 5,699 | 7,383 | 13,082 | ||||||||||||
| George Chang |
1,162 | 6,745 | 9,362 | 17,269 | ||||||||||||
| Karin Eliasson |
150 | 1,139 | 3,418 | 4,707 | ||||||||||||
| Steven Fredin |
2,333 | 6,745 | 13,468 | 22,546 | ||||||||||||
| Thomas Jönsson |
– | 4,266 | 7,723 | 11,989 | ||||||||||||
| Johan Löfvenholm |
– | 5,699 | 8,817 | 14,516 | ||||||||||||
| Svante Mogefors |
6,869 | 5,699 | 21,205 | 33,773 | ||||||||||||
| Jonas Nilsson |
– | 2,851 | 8,551 | 11,402 | ||||||||||||
| Fredrik Peyron |
– | 1,139 | 3,418 | 4,557 | ||||||||||||
| Steve Rodé |
2,715 | 2,787 | 3,680 | 9,182 | ||||||||||||
| Mats Wallin |
5,508 | 7,741 | 15,652 | 28,901 | ||||||||||||
|
|
|
|
|
|
|
|
|
|||||||||
| SUBTOTAL |
96,598 | 70,662 | 129,239 | 296,499 | ||||||||||||
|
|
|
|
|
|
|
|
|
|||||||||
| GROSS TOTAL2) |
110,697 | 70,662 | 129,239 | 310,598 | ||||||||||||
1) Number of shares, RSUs and stock options as of February 17, 2015. For any changes thereafter please refer to Autoliv’s corporate website or each director’s or manager’s filings with the SEC. Insider filings are also made with Finansinspektionen in Sweden.
2) Gross total for all listed directors and executives.
For presentations of the Executive Management Team, please refer to our filings, including in our proxy statement, on file with the U.S. Securities and Exchange Commission (SEC) and available at www.sec.gov, or www.autoliv.com
Contact Information & Calendar
Selected Financial Data
| (DOLLARS IN MILLIONS, EXCEPT PER SHARE DATA) |
20141) | 20131,5) | 20121) | 20111) | 20101) | |||||||||||||||
| Sales and Income |
||||||||||||||||||||
| Net sales |
$ | 9,240 | $ | 8,803 | $ | 8,267 | $ | 8,232 | $ | 7,171 | ||||||||||
| Operating income |
723 | 761 | 705 | 889 | 869 | |||||||||||||||
| Income before income taxes |
667 | 734 | 669 | 828 | 806 | |||||||||||||||
| Net income attributable to controlling interest |
468 | 486 | 483 | 623 | 591 | |||||||||||||||
| Financial Position |
||||||||||||||||||||
| Current assets excluding cash |
2,607 | 2,582 | 2,312 | 2,261 | 2,101 | |||||||||||||||
| Property, plant and equipment, net |
1,390 | 1,336 | 1,233 | 1,121 | 1,026 | |||||||||||||||
| Intangible assets (primarily goodwill) |
1,661 | 1,687 | 1,707 | 1,716 | 1,722 | |||||||||||||||
| Non-interest bearing liabilities |
2,400 | 2,364 | 2,162 | 2,102 | 2,001 | |||||||||||||||
| Capital employed |
3,504 | 3,489 | 3,415 | 3,257 | 3,066 | |||||||||||||||
| Net debt (cash) |
62 | (511 | ) | (361 | ) | (92 | ) | 127 | ||||||||||||
| Total equity |
3,442 | 4,000 | 3,776 | 3,349 | 2,939 | |||||||||||||||
| Total assets |
7,443 | 6,983 | 6,570 | 6,117 | 5,665 | |||||||||||||||
| Long-term debt |
1,521 | 279 | 563 | 364 | 638 | |||||||||||||||
| Share data |
||||||||||||||||||||
| Earnings per share (US$) – basic |
5.08 | 5.09 | 5.17 | 6.99 | 6.77 | |||||||||||||||
| Earnings per share (US$) – assuming dilution |
5.06 | 5.07 | 5.08 | 6.65 | 6.39 | |||||||||||||||
| Total parent shareholders’ equity per share (US$) |
38.64 | 42.17 | 39.36 | 37.33 | 32.89 | |||||||||||||||
| Cash dividends paid per share (US$) |
2.12 | 2.00 | 1.89 | 1.73 | 0.65 | |||||||||||||||
| Cash dividends declared per share (US$) |
2.14 | 2.02 | 1.94 | 1.78 | 1.05 | |||||||||||||||
| Share repurchases |
616 | 148 | — | — | — | |||||||||||||||
| Number of shares outstanding (million)2) |
88.7 | 94.4 | 95.5 | 89.3 | 89.0 | |||||||||||||||
| Ratios |
||||||||||||||||||||
| Gross margin (%) |
19.5 | 19.4 | 19.9 | 21.0 | 22.2 | |||||||||||||||
| Operating margin (%) |
7.8 | 8.6 | 8.5 | 10.8 | 12.1 | |||||||||||||||
| Pretax margin (%) |
7.2 | 8.3 | 8.1 | 10.1 | 11.2 | |||||||||||||||
| Return on capital employed (%) |
21 | 22 | 21 | 28 | 28 | |||||||||||||||
| Return on total equity (%) |
12 | 13 | 14 | 20 | 22 | |||||||||||||||
| Total equity ratio (%) |
46 | 57 | 57 | 55 | 52 | |||||||||||||||
| Net debt to capitalization (%) |
2 | N/A | N/A | N/A | 4 | |||||||||||||||
| Days receivables outstanding |
71 | 70 | 66 | 67 | 69 | |||||||||||||||
| Days inventory outstanding |
32 | 31 | 30 | 32 | 32 | |||||||||||||||
| Other data |
||||||||||||||||||||
| Airbag sales3) |
5,951 | 5,686 | 5,392 | 5,393 | 4,723 | |||||||||||||||
| Seatbelt sales4) |
2,800 | 2,773 | 2,657 | 2,679 | 2,363 | |||||||||||||||
| Active safety sales |
489 | 345 | 218 | 160 | 85 | |||||||||||||||
| Net cash provided by operating activities |
713 | 838 | 689 | 758 | 924 | |||||||||||||||
| Capital expenditures, net |
453 | 379 | 360 | 357 | 224 | |||||||||||||||
| Net cash used in investing activities |
(453 | ) | (377 | ) | (358 | ) | (373 | ) | (297 | ) | ||||||||||
| Net cash provided by (used in) financing activities |
226 | (318 | ) | (91 | ) | (223 | ) | (529 | ) | |||||||||||
| Number of employees, December 31 |
50,800 | 46,900 | 41,700 | 38,500 | 34,600 | |||||||||||||||
1) Costs in 2014, 2013, 2012, 2011 and 2010 for capacity alignments and antitrust matters reduced operating income by (millions) $120, $47, $98, $19, and $21, respectively, and net income by (millions) $84, $33, $71, $14 and $16. This corresponds to 1.4%, 0.6%, 1.2%, 0.2% and 0.3% on operating margins and 0.9%, 0.4%, 0.9%, 0.2% and 0.2% on net margins. The impact on EPS was $0.91, $0.34, $0.74, $0.15 and $0.17 while return on total equity was reduced by 2.2%, 0.8 %, 1.8%, 0.4% and 0.6% and for the same five year period. 2) At year end, net of treasury shares. 3) Incl. passive electronics, steering wheels, inflators and initiators. 4) Incl. seat components until a June 2012 divestiture. 5) Includes adjustments for a non-cash, non-recurring valuation allowance for deferred tax assets of $39 million on net income and capital employed, and $0.41 on EPS and total parent shareholder equity per share.
EVERY YEAR, AUTOLIV’S PRODUCTS
SAVE OVER 30,000 LIVES
www.autoliv.com
EXHIBIT 21
LIST OF SUBSIDIARIES OF THE COMPANY
Brazil
Autoliv do Brasil Ltda.
Canada
Autoliv Canada, Inc.
Autoliv Electronics Canada, Inc.
VOA Canada, Inc.
China
Autoliv (Beijing) Vehicle Safety Systems Co., Ltd. (51%)
Autoliv (Changchun) Vehicle Safety Systems Co., Ltd.
Autoliv (China) Electronics Co., Ltd.
Autoliv (China) Inflator Co., Ltd.
Autoliv (China) Steering Wheel Co., Ltd.
Autoliv (China) Automotive Safety Systems Co., Ltd.
Autoliv (Guangzhou) Vehicle Safety Systems Co., Ltd.
Autoliv (Nanjing) Vehicle Safety Systems Co., Ltd.
Autoliv (Shanghai) Vehicle Safety Systems Co., Ltd.
Autoliv (Shanghai) Management Co., Ltd.
Autoliv (Shanghai) Vehicle Safety System Technical Center Co., Ltd.
Autoliv Shenda (Tai Cang) Automotive Safety Systems Co., Ltd. (60%)
Autoliv Shenda (Nanjing) Automotive Components Co., Ltd. (60%)
Autoliv (Jiangsu) Automotive Safety Components Co., Ltd.
Autoliv Asia Management (Shanghai) Co., Ltd.
Autoliv (Baoding) Vehicle Safety Systems Co., Ltd.
Estonia
AS Norma
France
Autoliv Electronics SAS
Autoliv France SNC
Autoliv Isodelta SAS
Livbag SAS
N.C.S. Pyrotechnie et Technologies SAS
OEA Europe SARL
Sociéte Franco Suédoise d’Investissement SAS
Germany
Autoliv Beteiligungsgesellschaft mbH
Autoliv BV & Co. KG
Autoliv Sicherheitstechnik GmbH
Hungary
Autoliv Kft.
India
Autoliv India Private Ltd.
Indonesia
P.T. Autoliv Indonesia
Italy
Autoliv Italia S.p.A.
Japan
Autoliv Japan Ltd.
Mexico
Autoliv Mexican Holdings S. de R.L. de C.V.
Autoliv Mexico East S.A. de C.V.
Autoliv Mexico S.A. de C.V.
Autoliv Safety Technology de Mexico S.A. de C.V.
Autoliv Steering Wheels Mexico S. de R.L. de C.V.
The Netherlands
Autoliv ASP B.V.
Autoliv Autosicherheitstechnik B.V.
Van Oerle Alberton B.V.
Philippines
Autoliv Cebu Safety Manufacturing, Inc.
Poland
Autoliv Poland Sp. z o.o.
Romania
Autoliv Romania S.R.L.
Russia
OOO Autoliv
ZAO Norma-Osvar
South Africa
Autoliv Southern Africa (Pty) Ltd
South Korea
Autoliv Corporation
Spain
Autoliv BKI S.A.U.
Autoliv KLE S.A.U.
Autosafety S.L.
Sweden
Autoliv AB
Autoliv Development AB
Autoliv East Europe AB
Autoliv Electronics AB
Autoliv Holding AB
Autoliv Sverige AB
Taiwan
Mei-An Autoliv Co., Ltd. (59%)
Thailand
Autoliv Thailand Ltd.
Tunisia
SWT1 SARL
SWT2 SARL
ASW3 SARL
SWTF SARL
Turkey
Autoliv Cankor Otomotiv Emniyet Sistemleri Sanayi Ve Ticaret A.S.
Autoliv Gebze Muhendislik Merkezi Ltd
Autoliv Metal Pres Sanayi Yi Ve Ticaret A.S.
Autoliv Teknoloji Ürünleri Sanayi Ve Ticaret A.S.
United Kingdom
Airbags International Ltd
Autoliv Spring Dynamics Ltd
Autoliv U.K. Holding Ltd
USA
Aerotest Operations, Inc (California)
Autoliv ASP, Inc. (Indiana)
Autoliv Holding, Inc. (Delaware)
Autoliv Safety Technology, Inc (Delaware)
OEA, Inc. (Delaware)
All subsidiaries are 100% owned unless otherwise indicated.
The names of certain subsidiaries, which considered in the aggregate would not constitute a “significant subsidiary” as such term is defined in the regulations under the federal securities laws, have been omitted from the foregoing list.
Exhibit 23
Consent of Independent Registered Public Accounting Firm
We consent to the incorporation by reference in this Annual Report on Form 10-K of Autoliv, Inc. of our reports dated February 19, 2015, with respect to the consolidated financial statements of Autoliv, Inc., and the effectiveness of internal control over financial reporting of Autoliv, Inc., included in the 2014 Annual Report to Shareholders of Autoliv, Inc.
We consent to the incorporation by reference in the following Registration Statements:
| (1) | Registration Statements (Form S-3 No. 333-179948) of Autoliv, Inc., and |
| (2) | Registration Statements (Form S-8 No. 333-160771, No. 333-117505 and No. 333-91768) pertaining to the Autoliv, Inc. amended and restated 1997 stock incentive plan; |
of our reports dated February 19, 2015, with respect to the consolidated financial statements of Autoliv, Inc., and the effectiveness of internal control over financial reporting of Autoliv, Inc., included in this Annual Report on Form 10-K of Autoliv, Inc. for the year ended December 31, 2014.
Ernst & Young AB
Stockholm, Sweden
February 19, 2015
Exhibit 31.1
CERTIFICATIONS of
the Chief Executive Officer
Pursuant to Section 302 of the Sarbanes-Oxley Act of 2002
I, Jan Carlson, certify that:
| 1. | I have reviewed this annual report on Form 10-K of AUTOLIV, INC.; |
| 2. | Based on my knowledge, this report does not contain any untrue statement of a material fact or omit to state a material fact necessary to make the statements made, in light of the circumstances under which such statements were made, not misleading with respect to the period covered by this report; |
| 3. | Based on my knowledge, the financial statements, and other financial information included in this report, fairly present in all material respects the financial condition, results of operations and cash flows of the registrant as of, and for, the periods presented in this report; |
| 4. | The registrant’s other certifying officer and I are responsible for establishing and maintaining disclosure controls and procedures (as defined in Exchange Act Rules 13a-15(e) and 15d-15(e)) and internal control over financial reporting (as defined in Exchange Act Rules 13a -15(f) and 15d-15(f)) for the registrant and have: |
| a. | Designed such disclosure controls and procedures, or caused such disclosure controls and procedures to be designed under our supervision, to ensure that material information relating to the registrant, including its consolidated subsidiaries, is made known to us by others within those entities, particularly during the period in which this report is being prepared; |
| b. | Designed such internal control over financial reporting, or caused such internal control over financial reporting to be designed under our supervision, to provide reasonable assurance regarding the reliability of financial reporting and the preparation of financial statements for external purposes in accordance with generally accepted accounting principles; |
| c. | Evaluated the effectiveness of the registrant’s disclosure controls and procedures and presented in this report our conclusions about the effectiveness of the disclosure controls and procedures, as of the end of the period covered by this report based on such evaluation; and |
| d. | Disclosed in this report any change in the registrant’s internal control over financial reporting that occurred during the registrant’s most recent fiscal quarter (the registrant’s fourth fiscal quarter in the case of an annual report) that has materially affected, or is reasonably likely to materially affect, the registrant’s internal control over financial reporting; and |
| 5. | The registrant’s other certifying officer(s) and I have disclosed, based on our most recent evaluation of internal control over financial reporting, to the registrant’s auditors and the audit committee of the registrant’s board of directors (or persons performing the equivalent functions): |
| a. | All significant deficiencies and material weaknesses in the design or operation of internal control over financial reporting which are reasonably likely to adversely affect the registrant’s ability to record, process, summarize and report financial information; and |
| b. | Any fraud, whether or not material, that involves management or other employees who have a significant role in the registrant’s internal control over financial reporting. |
| Date: February 19, 2015 |
| /s/ Jan Carlson |
| Jan Carlson |
| President and Chief Executive Officer |
Exhibit 31.2
CERTIFICATIONS of
the Chief Financial Officer
Pursuant to Section 302 of the Sarbanes-Oxley Act of 2002
I, Mats Wallin, certify that:
| 1. | I have reviewed this annual report on Form 10-K of AUTOLIV, INC.; |
| 2. | Based on my knowledge, this report does not contain any untrue statement of a material fact or omit to state a material fact necessary to make the statements made, in light of the circumstances under which such statements were made, not misleading with respect to the period covered by this report; |
| 3. | Based on my knowledge, the financial statements, and other financial information included in this report, fairly present in all material respects the financial condition, results of operations and cash flows of the registrant as of, and for, the periods presented in this report; |
| 4. | The registrant’s other certifying officer and I are responsible for establishing and maintaining disclosure controls and procedures (as defined in Exchange Act Rules 13a-15(e) and 15d-15(e)) and internal control over financial reporting (as defined in Exchange Act Rules 13a -15(f) and 15d-15(f)) for the registrant and have: |
| a. | Designed such disclosure controls and procedures, or caused such disclosure controls and procedures to be designed under our supervision, to ensure that material information relating to the registrant, including its consolidated subsidiaries, is made known to us by others within those entities, particularly during the period in which this report is being prepared; |
| b. | Designed such internal control over financial reporting, or caused such internal control over financial reporting to be designed under our supervision, to provide reasonable assurance regarding the reliability of financial reporting and the preparation of financial statements for external purposes in accordance with generally accepted accounting principles; |
| c. | Evaluated the effectiveness of the registrant’s disclosure controls and procedures and presented in this report our conclusions about the effectiveness of the disclosure controls and procedures, as of the end of the period covered by this report based on such evaluation; and |
| d. | Disclosed in this report any change in the registrant’s internal control over financial reporting that occurred during the registrant’s most recent fiscal quarter (the registrant’s fourth fiscal quarter in the case of an annual report) that has materially affected, or is reasonably likely to materially affect, the registrant’s internal control over financial reporting; and |
| 5. | The registrant’s other certifying officer(s) and I have disclosed, based on our most recent evaluation of internal control over financial reporting, to the registrant’s auditors and the audit committee of the registrant’s board of directors (or persons performing the equivalent functions): |
| a. | All significant deficiencies and material weaknesses in the design or operation of internal control over financial reporting which are reasonably likely to adversely affect the registrant’s ability to record, process, summarize and report financial information; and |
| b. | Any fraud, whether or not material, that involves management or other employees who have a significant role in the registrant’s internal control over financial reporting. |
| Date: February 19, 2015 |
| /s/ Mats Wallin |
| Mats Wallin |
| Vice President and Chief Financial Officer |
Exhibit 32.1
Certification of Chief Executive Officer and Chief Financial Officer
Pursuant to 18 U.S.C Section 1350,
as Adopted Pursuant to
Section 906 of the Sarbanes-Oxley Act of 2002
In connection with the annual report on Form 10-K of Autoliv, Inc. (the “Company”) for the period ended December 31, 2014, filed with the Securities and Exchange Commission on the date hereof (the “Report”), I, Jan Carlson, Chief Executive Officer of the Company, hereby certify, pursuant to 18 U.S.C. § 1350, as adopted pursuant to § 906 of the Sarbanes-Oxley Act of 2002, that, to the best of my knowledge:
| 1. | The Report fully complies with the requirements of Section 13(a) or 15(d) of the Securities Exchange Act of 1934; and |
| 2. | The information contained in the Report fairly presents, in all material respects, the financial condition and results of operations of the Company. |
| /s/ Jan Carlson | ||
| Name: | Jan Carlson | |
| Title: | President and Chief Executive Officer | |
| Date: | February 19, 2015 | |
This certification accompanies the Report pursuant to § 906 of the Sarbanes-Oxley Act of 2002 and shall not, except to the extent required by the Sarbanes-Oxley Act of 2002, be deemed filed by the Company for purposes of §18 of the Securities Exchange Act of 1934, as amended.
A signed original of this written statement required by Section 906 of the Sarbanes-Oxley Act of 2002 has been provided to the Company and will be retained by the Company and furnished to the Securities and Exchange Commission or its staff upon request.
Exhibit 32.2
Certification of Chief Executive Officer and Chief Financial Officer
Pursuant to 18 U.S.C Section 1350,
as Adopted Pursuant to
Section 906 of the Sarbanes-Oxley Act of 2002
In connection with the annual report on Form 10-K of Autoliv, Inc. (the “Company”) for the period ended December 31, 2014, filed with the Securities and Exchange Commission on the date hereof (the “Report”), I, Mats Wallin, Chief Financial Officer of the Company, hereby certify, pursuant to 18 U.S.C. § 1350, as adopted pursuant to § 906 of the Sarbanes-Oxley Act of 2002, that, to the best of my knowledge:
| 1. | The Report fully complies with the requirements of Section 13(a) or 15(d) of the Securities Exchange Act of 1934; and |
| 2. | The information contained in the Report fairly presents, in all material respects, the financial condition and results of operations of the Company. |
| /s/ Mats Wallin | ||
| Name: | Mats Wallin | |
| Title: | Vice President and Chief Financial Officer | |
| Date: | February 19, 2015 | |
This certification accompanies the Report pursuant to § 906 of the Sarbanes-Oxley Act of 2002 and shall not, except to the extent required by the Sarbanes-Oxley Act of 2002, be deemed filed by the Company for purposes of §18 of the Securities Exchange Act of 1934, as amended.
A signed original of this written statement required by Section 906 of the Sarbanes-Oxley Act of 2002 has been provided to the Company and will be retained by the Company and furnished to the Securities and Exchange Commission or its staff upon request.
Serious News for Serious Traders! Try StreetInsider.com Premium Free!
You May Also Be Interested In
- PIMCO California Municipal Income Fund, PIMCO California Municipal Income Fund II, PIMCO California Municipal Income Fund III, PIMCO Municipal Income Fund, PIMCO Municipal Income Fund II, PIMCO Munici
- Averill & Reaney Attorneys at Law Unveils New Community Recovery Initiative
- Celularity Inc. Announces Receipt of Nasdaq Notice Regarding Late Form 10-K Filing
Create E-mail Alert Related Categories
SEC FilingsSign up for StreetInsider Free!
Receive full access to all new and archived articles, unlimited portfolio tracking, e-mail alerts, custom newswires and RSS feeds - and more!
