

Form 8-K MITEL NETWORKS CORP For: Jan 16
 Tweet
Tweet Share
Share�
�
UNITED STATES
SECURITIES AND EXCHANGE COMMISSION
Washington, D.C. 20549
�
�
FORM 8-K
�
�
CURRENT REPORT
PURSUANT TO SECTION 13 OR 15(d)
OF THE SECURITIES EXCHANGE ACT OF 1934
Date of Report (Date of earliest event reported): January�16, 2015
�
�
MITEL NETWORKS CORPORATION
(Exact Name of Registrant as Specified in its Charter)
�
�
�
| Canada | � | 001-34699 | � | 98-0621254 |
| (State or Other Jurisdiction of Incorporation) |
� | (Commission File Number) |
� | (I.R.S. Employer Identification No.) |
350 Legget Drive
Ottawa, Ontario K2K 2W7
(Address of Principal Executive Offices) (Zip Code)
(613) 592-2122
(Registrant�s telephone number, including area code)
Not Applicable
(Former Name or Former Address, if Changed Since Last Report)
�
�
Check the appropriate box below if the Form 8-K filing is intended to simultaneously satisfy the filing obligation of the registrant under any of the following provisions:
�
| � | Written communications pursuant to Rule 425 under the Securities Act (17 CFR 230.425) |
�
| � | Soliciting material pursuant to Rule 14a-12 under the Exchange Act (17 CFR 240.14a-12) |
�
| � | Pre-commencement communications pursuant to Rule 14d-2(b) under the Exchange Act (17 CFR 240.14d-2(b)) |
�
| � | Pre-commencement communications pursuant to Rule 13e-4(c) under the Exchange Act (17 CFR 240.13e-4(c)) |
�
�
�
| Item�7.01 | Results of Operations and Financial Condition. |
Mitel Networks Corporation (the �Registrant�) is furnishing under this Item�7.01 a copy of a slide deck presentation (the �Presentation�) made at the 17th Annual Needham Growth Conference on January�14, 2015 in New York City, New York. The Presentation is attached as Exhibit 99.1 hereto.
The information in this Item�7.01, including Exhibit 99.1 attached hereto, is being �furnished� and not �filed� with the Securities and Exchange Commission for purposes of Section�18 of the Securities Exchange Act of 1934, as amended, or otherwise subject to the liabilities under such section. Furthermore, such information shall not be deemed incorporated by reference in any filing under the Securities Act of 1933, as amended, unless specifically identified as being incorporated therein by reference.
�
| Item�9.01 | Financial Statements and Exhibits. |
�
| � | (d) | Exhibits. |
99.1 ����Slide Deck Presentation, dated January�14, 2015
SIGNATURE
Pursuant to the requirements of the Securities Exchange Act of 1934, the registrant has duly caused this report to be signed on its behalf by the undersigned hereunto duly authorized.
Date: January�16, 2015
�
| MITEL NETWORKS CORPORATION | ||
| By: | � | /s/ Greg Hiscock |
| Name: | � | Greg Hiscock |
| Title: | � | General Counsel�& Corporate Secretary |
|
|

�
17th Annual Needham Growth Conference New York � The Palace Hotel
January�14, 2015
|
|
�
Safe Harbor Statement
Forward Looking Statements
Some of the statements in this presentation are forward-looking statements (or forward-looking information) within the meaning of applicable U.S. and Canadian securities laws. These include statements using the words target, outlook, may, will, should, could, estimate, continue, expect, intend, plan, predict, potential, project and anticipate, and similar statements which do not describe the present or provide information about the past. There is no guarantee that the expected events or expected results will actually occur. Such statements reflect the current views of management of Mitel and are subject to a number of risks and uncertainties. These statements are based on many assumptions and factors, including general economic and market conditions, industry conditions, operational and other factors. Any changes in these assumptions or other factors could cause actual results to differ materially from current expectations. All forward-looking statements attributable to Mitel, or persons acting on its behalf, and are expressly qualified in their entirety by the cautionary statements set forth in this paragraph. Undue reliance should not be placed on such statements. In addition, material risks that could cause results of operations to differ include the Mitel�s ability to achieve or sustain profitability in the future since its acquisition of Aastra; fluctuations in the quarterly and annual revenues and operating results; fluctuations in foreign exchange rates; current and ongoing global economic instability political unrest and related sanctions, particularly in connection with the Ukraine and the Middle East; intense competition; reliance on channel partners for a significant component of sales; dependence upon a small number of outside contract manufacturers to manufacture products; the ability to successfully integrate the acquisition of Aastra and realize certain synergies; and, our ability to implement and achieve our business strategies successfully. Additional risks are described under the heading �Risk Factors� in Mitel�s Transition Report on Form 10-K for the eight month period ended December�31, 2013, filed on with the Securities and Exchange Commission on March�31, 2014. Forward-looking statements speak only as of the date they are made. Except as required by law, we do not have any intention or obligation to update or to publicly announce the results of any revisions to any of the forward-looking statements to reflect actual results, future events or developments, changes in assumptions or changes in other factors affecting the forward-looking statements.
Non-GAAP Financial Measurements
This presentation includes references to non-GAAP financial measures including Adjusted EBITDA, non-GAAP income and non-GAAP operating expenses. Non-GAAP financial measures do not have any standardized meaning and are therefore unlikely to be comparable to similar measures presented by other companies. We use these non-GAAP financial measures to assist management and investors in understanding our past financial performance and prospects for the future, including changes in our operating results, trends and marketplace performance, exclusive of unusual events or factors which do not directly affect what we consider to be our core operating performance. Non-GAAP measures are among the primary indicators management uses as a basis for our planning and forecasting of future periods. Investors are cautioned that non-GAAP financial measures should not be relied upon as a substitute for financial measures prepared in accordance with generally accepted accounting principles. Please see the reconciliation of non-GAAP financial measures to the most directly comparable U.S. GAAP measure included in this presentation and, if not contained in this presentation, contained in Mitel�s Reports on Form 8-K which have been filed with the SEC on March�27, 2014,�April�2, 2014,�May�8, 2014,�August�7, 2014 and November�6, 2014.
| 2 |
� |
| �2014 Mitel. Proprietary and Confidential. |
|
|
�
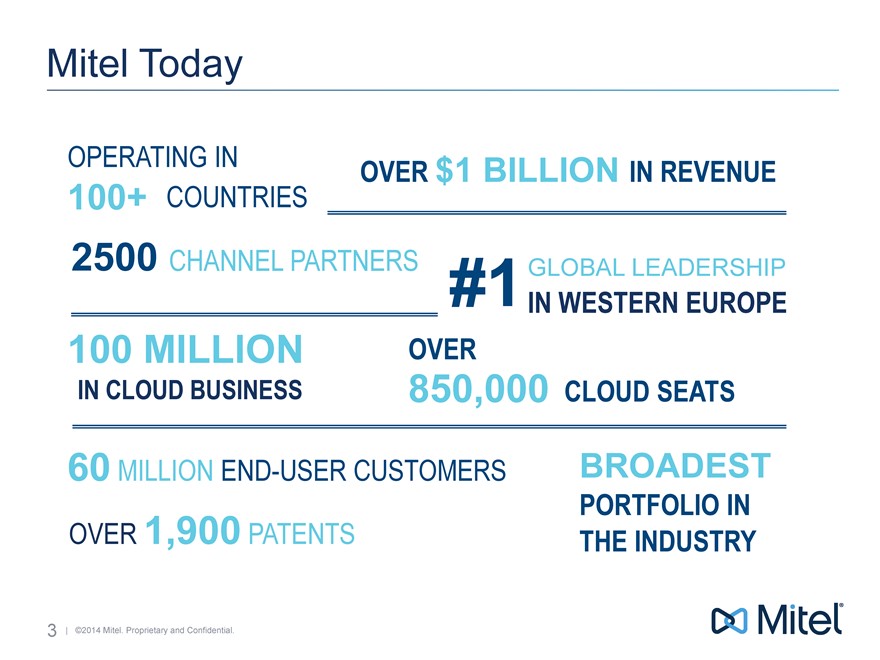
Mitel Today
OPERATING IN 100+ COUNTRIES
2500 CHANNEL PARTNERS
100 MILLION IN CLOUD BUSINESS
60 MILLION END-USER CUSTOMERS
OVER 1,900 PATENTS
OVER $1 BILLION IN REVENUE
#1 GLOBAL LEADERSHIP IN WESTERN EUROPE
OVER 850,000 CLOUD SEATS
BROADEST PORTFOLIO IN THE INDUSTRY
| 3 |
� |
| �2014 Mitel. Proprietary and Confidential. |
|
|
�
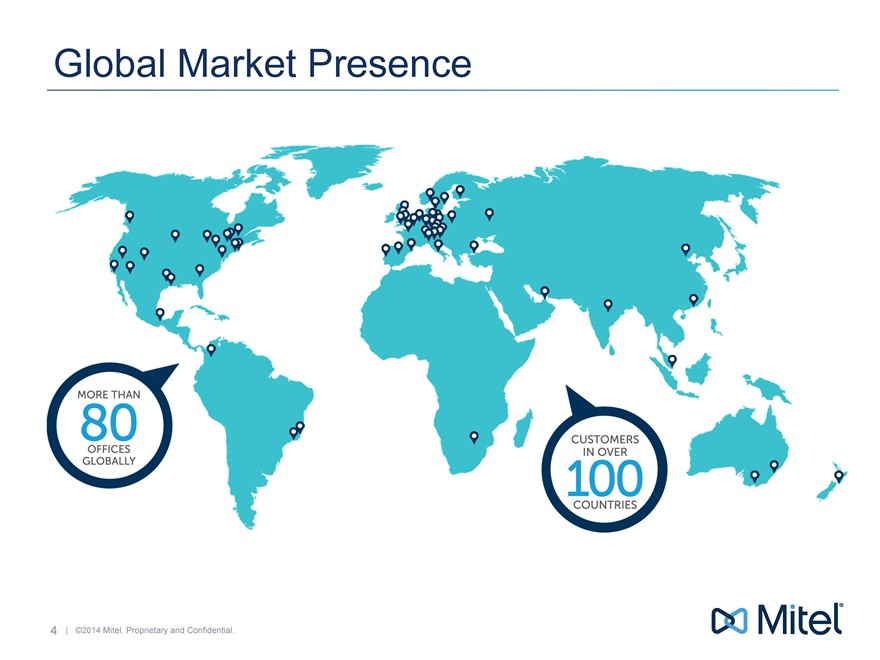
Global Market Presence
MORE THAN 80 OFFICES GLOBALLY
CUSTOMERS IN OVER 100 COUNTRIES
| 4 |
� |
| �2014 Mitel. Proprietary and Confidential. |
|
|
�
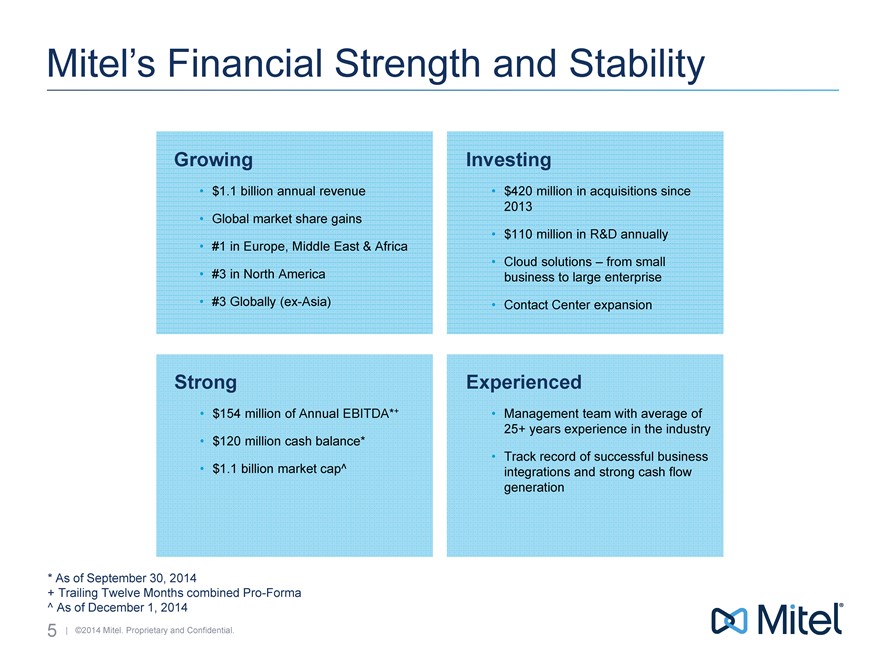
Mitel�s Financial Strength and Stability
Growing
$1.1 billion annual revenue
Global market share gains
#1 in Europe, Middle East�& Africa
#3 in North America
#3 Globally (ex-Asia)
Investing
$420 million in acquisitions since 2013
$110 million in R&D annually
Cloud solutions � from small business to large enterprise
Contact Center expansion
Experienced
Management team with average of 25+ years experience in the industry
Track record of successful business integrations and strong cash flow generation
Strong
$154 million of Annual EBITDA*+
$120 million cash balance*
$1.1 billion market cap^
* As of September�30, 2014
+ Trailing Twelve Months combined Pro-Forma
^ As of December�1, 2014
5 | �2014 Mitel. Proprietary and Confidential.
|
|
�
Broad Customer / Partner Base
Carriers
Education / Government
Financial Services
Health Care
Hospitality
Manufacturing
Professional Services
Media�& Entertainment
Retail
| 6 |
� |
| �2014 Mitel. Proprietary and Confidential. |
|
|
�
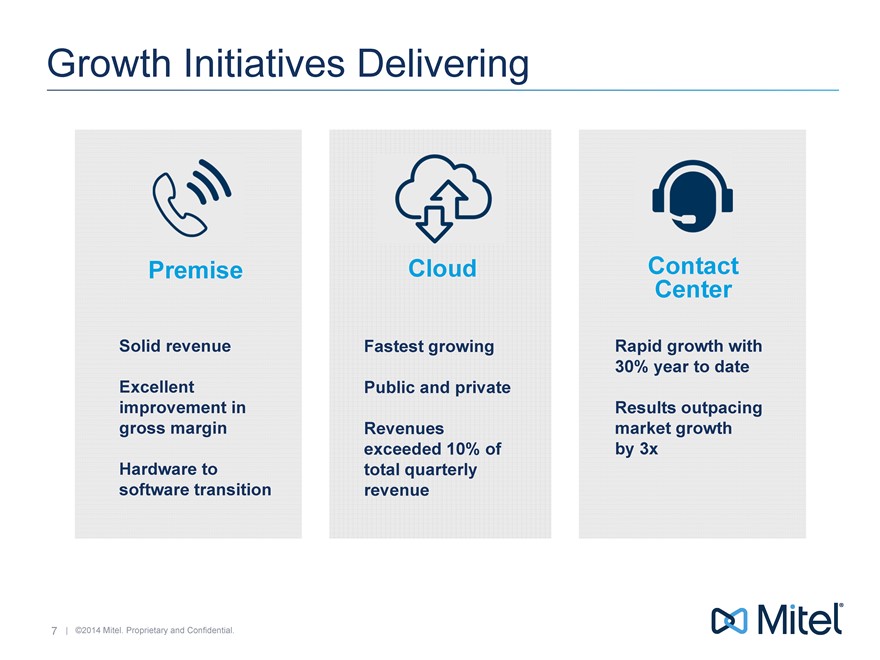
Growth Initiatives Delivering
Premise
Solid revenue
Excellent improvement in gross margin
Hardware to software transition
Cloud
Fastest growing
Public and private
Revenues exceeded 10% of total quarterly revenue
Contact Center
Rapid growth with 30% year to date
Results outpacing market growth by 3x
| 7 |
� |
| �2014 Mitel. Proprietary and Confidential. |
|
|
�
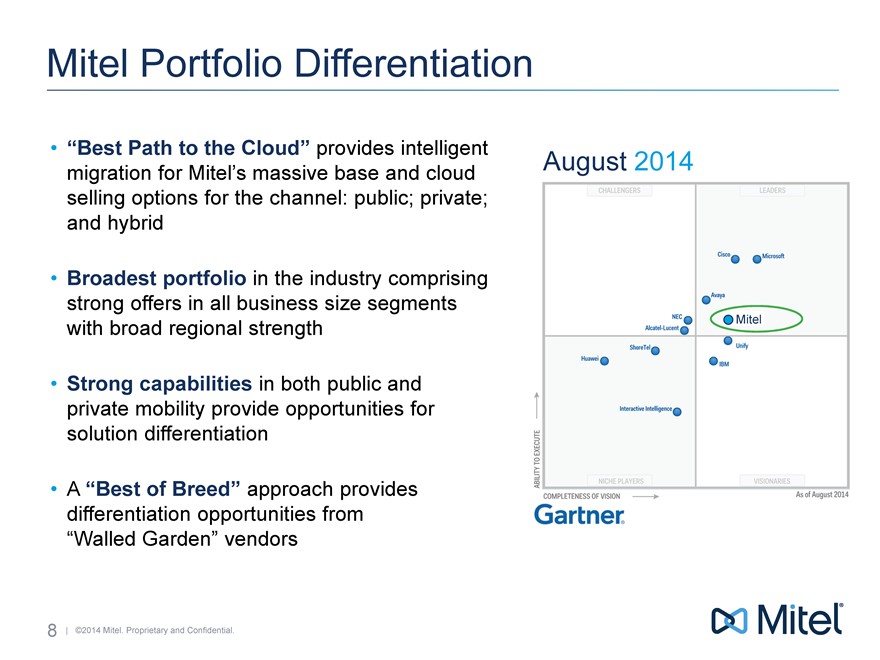
Mitel Portfolio Differentiation
�Best Path to the Cloud� provides intelligent migration for Mitel�s massive base and cloud selling options for the channel: public; private; and hybrid
Broadest portfolio in the industry comprising strong offers in all business size segments with broad regional strength
Strong capabilities in both public and private mobility provide opportunities for solution differentiation
A �Best of Breed� approach provides differentiation opportunities from �Walled Garden� vendors
August 2014
Mitel
8 | �2014 Mitel. Proprietary and Confidential.
|
|
�
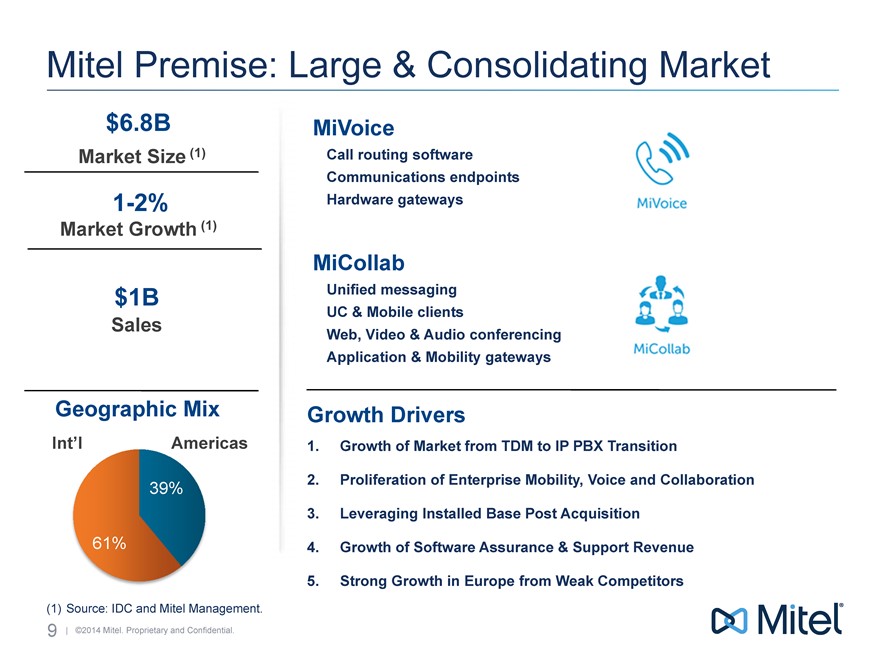
Mitel Premise: Large�& Consolidating Market
$6.8B
Market Size (1)
1-2%
Market Growth (1)
$1B
Sales
Geographic Mix
Int�l Americas
39%
61%
MiVoice
Call routing software
Communications endpoints
Hardware gateways
MiCollab
Unified messaging
UC�& Mobile clients
Web, Video�& Audio conferencing
Application�& Mobility gateways
Growth Drivers
1. Growth of Market from TDM to IP PBX Transition
2. Proliferation of Enterprise Mobility, Voice and Collaboration
3. Leveraging Installed Base Post Acquisition
4. Growth of Software Assurance�& Support Revenue
5. Strong Growth in Europe from Weak Competitors
| (1) |
� |
Source: IDC and Mitel Management. |
9 | �2014 Mitel. Proprietary and Confidential.
|
|
�
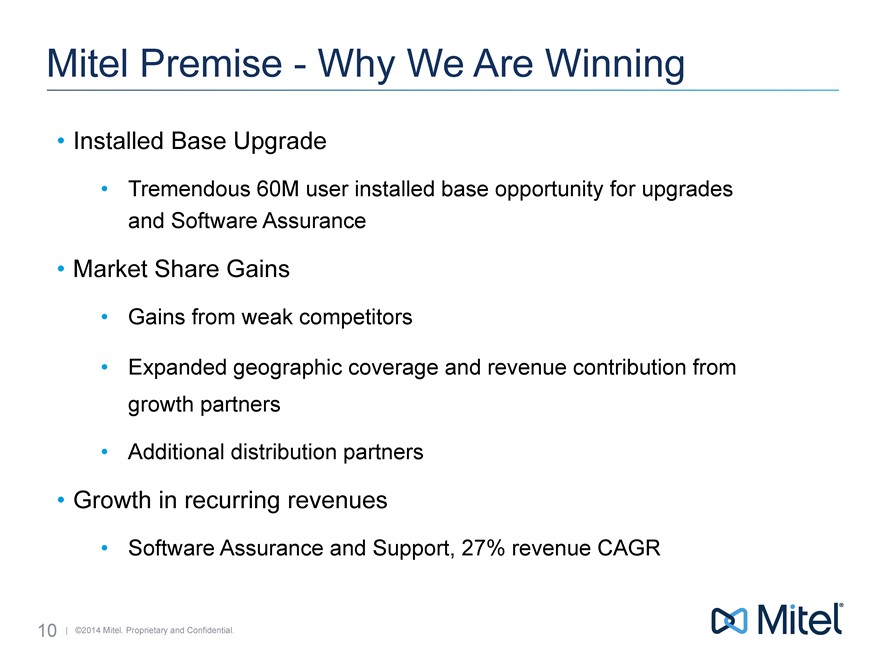
Mitel Premise�Why We Are Winning
Installed Base Upgrade
Tremendous 60M user installed base opportunity for upgrades and Software Assurance
Market Share Gains
Gains from weak competitors
Expanded geographic coverage and revenue contribution from growth partners
Additional distribution partners
Growth in recurring revenues
Software Assurance and Support, 27% revenue CAGR
10 | �2014 Mitel. Proprietary and Confidential.
|
|
�
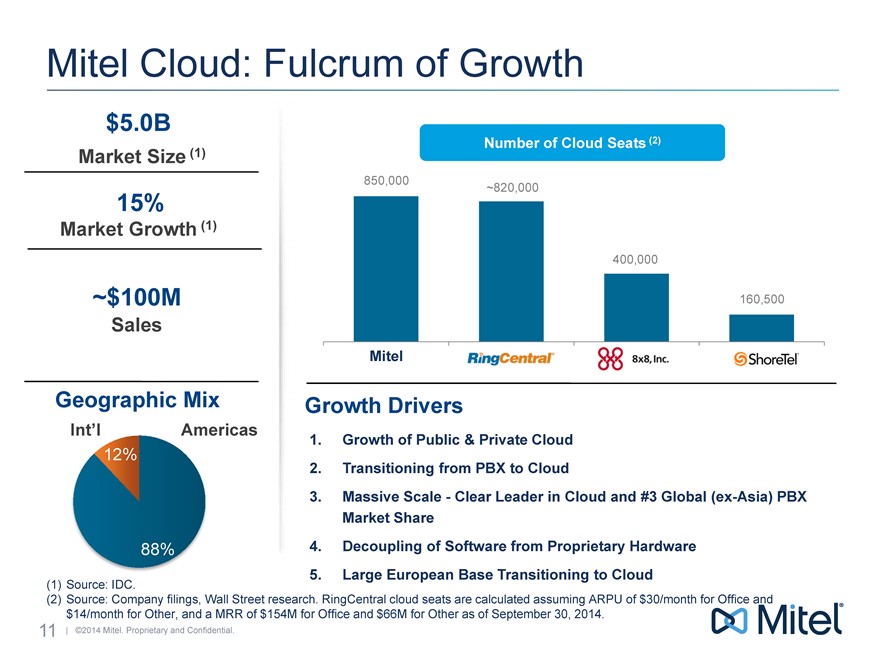
Mitel Cloud: Fulcrum of Growth
$5.0B
Market Size (1)
15%
Market Growth (1)
$100M
Sales
Geographic Mix
Number of Cloud Seats (2)
850,000
820,000
400,000
160,500
Mitel
mitel
Growth Drivers
1. Growth of Public�& Private Cloud
2. Transitioning from PBX to Cloud
3. Massive Scale�Clear Leader in Cloud and #3 Global (ex-Asia) PBX Market Share
4. Decoupling of Software from Proprietary Hardware
5. Large European Base Transitioning to Cloud
Int�l
Americas
12%
88%
| (1) |
� |
Source: IDC. |
(2) Source: Company filings, Wall Street research. RingCentral cloud seats are calculated assuming ARPU of $30/month for Office and $14/month for Other, and a MRR of $154M for Office and $66M for Other as of September�30, 2014.
11 | �2014 Mitel. Proprietary and Confidential.
|
|
�
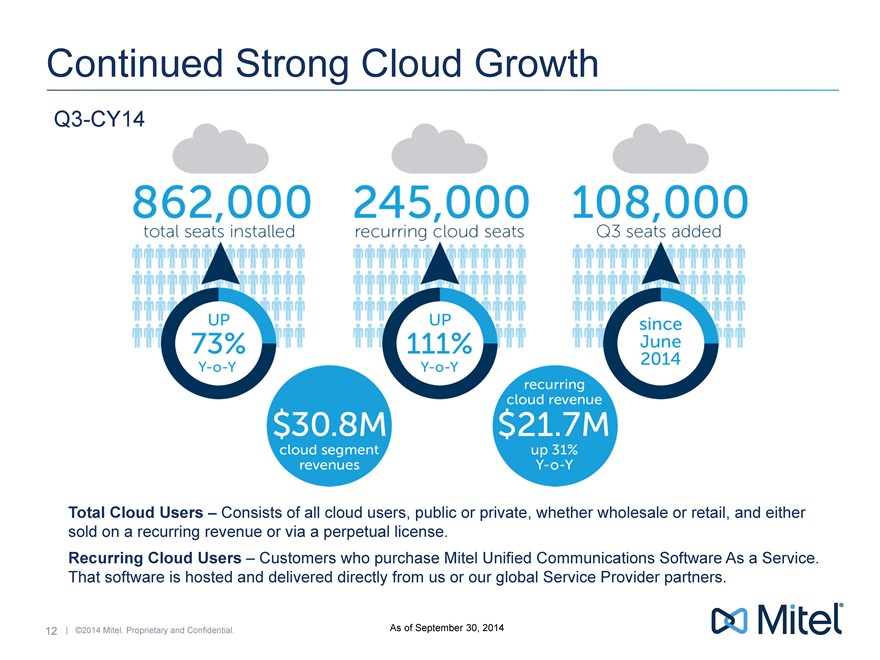
Continued Strong Cloud Growth
Q3-CY14
862,000
total seats installed
UP 73% Y-o-Y
245,000
recurring cloud seats
UP 111% Y-o-Y
108,000
Q3 seats added since June 2014
$30.8M cloud segment revenues
recurring cloud revenue $21.7M up 31% Y-o-Y
Total Cloud Users � Consists of all cloud users, public or private, whether wholesale or retail, and either sold on a recurring revenue or via a perpetual license.
Recurring Cloud Users � Customers who purchase Mitel Unified Communications Software As a Service. That software is hosted and delivered directly from us or our global Service Provider partners.
12 | �2014 Mitel. Proprietary and Confidential.
|
|
�
As of September�30, 2014
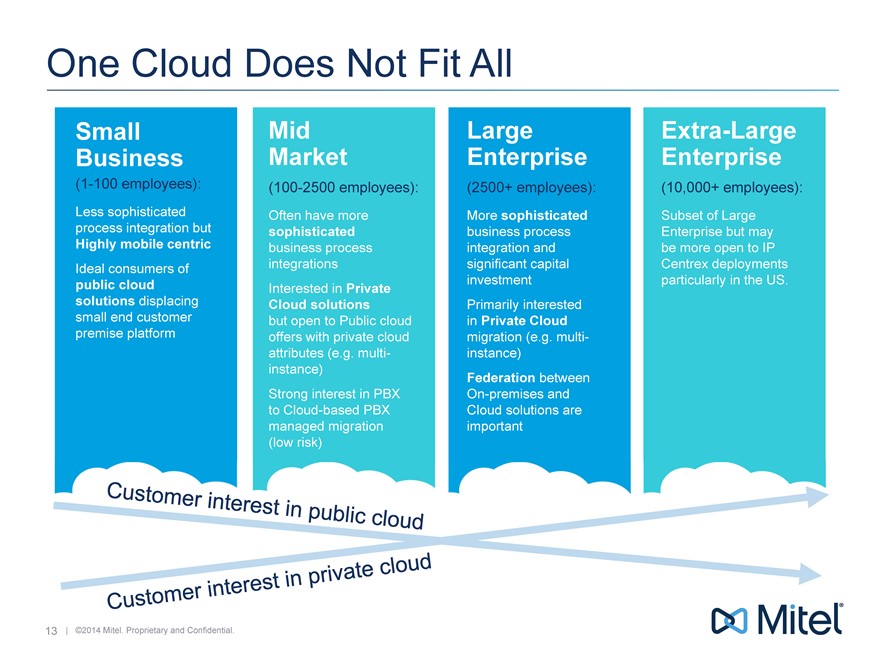
One Cloud Does Not Fit All
Small Business
(1-100 employees):
Less sophisticated process integration but
Highly mobile centric
Ideal consumers of public cloud solutions displacing small end customer premise platform
Mid Market
(100-2500 employees): Often have more sophisticated business process integrations
Interested in Private Cloud solutions but open to Public cloud offers with private cloud attributes (e.g. multi- instance)
Strong interest in PBX to Cloud-based PBX managed migration (low risk)
Large Enterprise
(2500+ employees):
More sophisticated business process integration and significant capital investment
Primarily interested in Private Cloud migration (e.g. multi- instance)
Federation between On-premises and Cloud solutions are important
Extra-Large Enterprise
(10,000+ employees): Subset of Large Enterprise but may be more open to IP Centrex deployments particularly in the US.
Customer interest in public cloud
Customer interest in private cloud
13 | �2014 Mitel. Proprietary and Confidential.
|
|
�
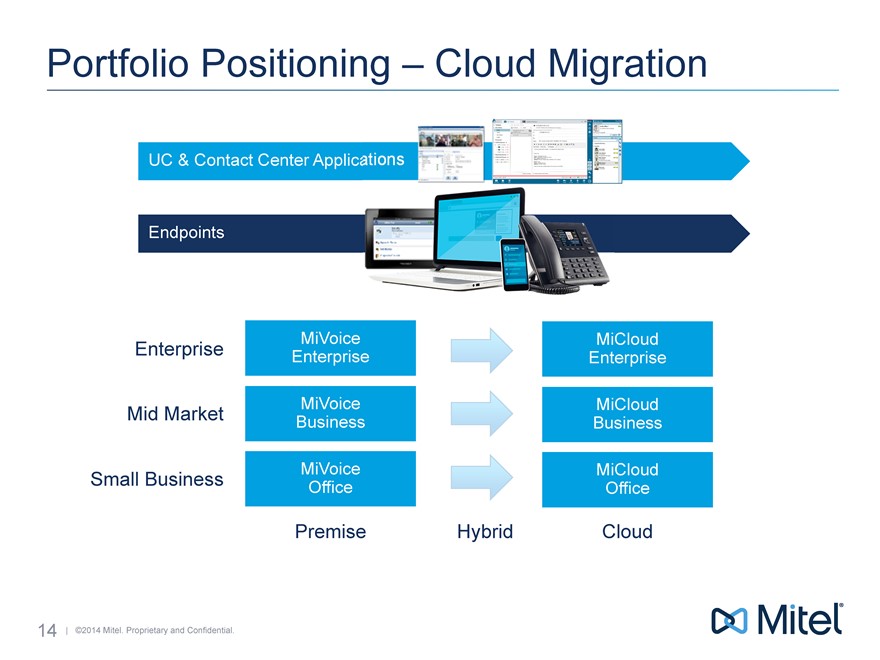
Portfolio Positioning � Cloud Migration
UC�& Contact Center Applications
Endpoints
Enterprise
Mid Market
Small Business
MiVoice Enterprise
MiVoice Business
MiVoice Office
Premise
Hybrid
MiCloud Enterprise
MiCloud Business
MiCloud Office
Cloud
14 | �2014 Mitel. Proprietary and Confidential.
|
|
�
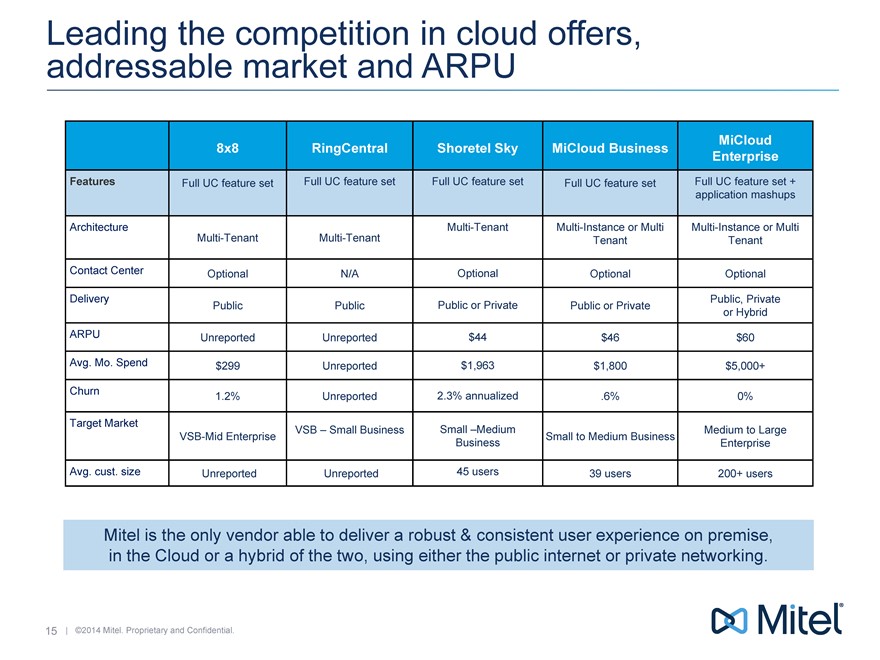
Leading the competition in cloud offers, addressable market and ARPU
Features
Architecture
Contact Center
Delivery
ARPU
Avg. Mo. Spend
Churn
Target Market
Avg. cust. size
8x8
Full UC feature set
Multi-Tenant
Optional
Public
Unreported
$299
1.2%
VSB-Mid Enterprise
Unreported
RingCentral
Full UC feature set
Multi-Tenant
N/A
Public
Unreported
Unreported
Unreported
VSB � Small Business
Unreported
Shoretel Sky
Full UC feature set
Multi-Tenant
Optional
Public or Private
$44
$1,963
2.3% annualized
Small �Medium Business
45 users
MiCloud Business
Full UC feature set
Multi-Instance or Multi Tenant
Optional
Public or Private
$46
$1,800
.6%
Small to Medium Business
39 users
MiCloud Enterprise
Full UC feature set + application mashups
Multi-Instance or Multi Tenant
Optional
Public, Private or Hybrid
$60
$5,000+
0%
Medium to Large Enterprise
200+ users
Mitel is the only vendor able to deliver a robust�& consistent user experience on premise, in the Cloud or a hybrid of the two, using either the public internet or private networking.
15 | �2014 Mitel. Proprietary and Confidential.
|
|
�
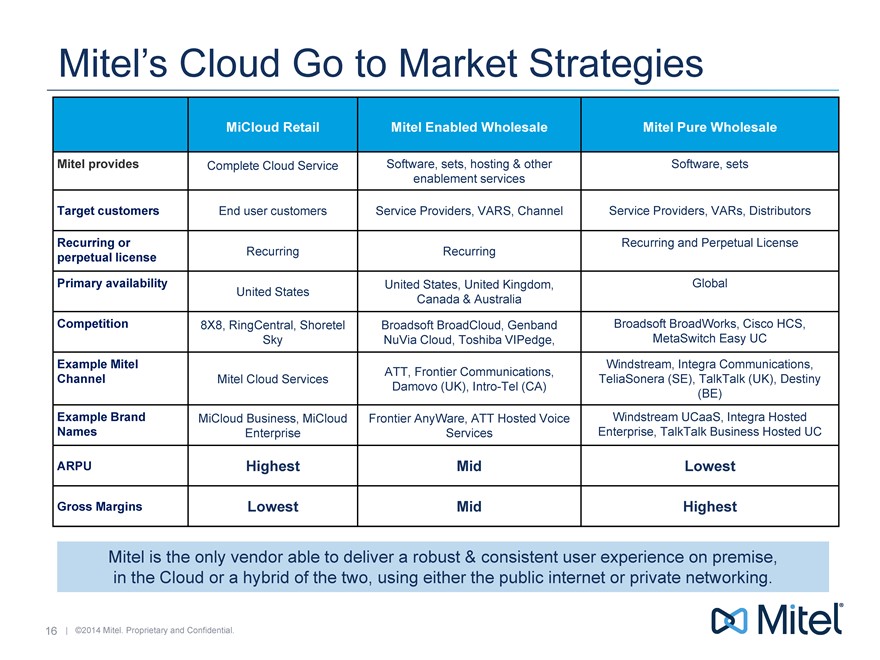
Mitel�s Cloud Go to Market Strategies
Mitel provides
Target customers
Recurring or perpetual license
Primary availability
Competition
Example Mitel
Channel
Example Brand Names
ARPU
Gross Margins
MiCloud Retail
Complete Cloud Service
End user customers
Recurring
United States
8X8, RingCentral, Shoretel Sky
Mitel Cloud Services
MiCloud Business, MiCloud Enterprise
Highest
Lowest
Mitel Enabled Wholesale
Software, sets, hosting�& other enablement services
Service Providers, VARS, Channel
Recurring
United States, United Kingdom, Canada�& Australia
Broadsoft BroadCloud, Genband NuVia Cloud, Toshiba VIPedge,
ATT, Frontier Communications,
Damovo (UK), Intro-Tel (CA)
Frontier AnyWare, ATT Hosted Voice Services
Mid
Mid
Mitel Pure Wholesale
Software, sets
Service Providers, VARs, Distributors
Recurring and Perpetual License
Global
Broadsoft BroadWorks, Cisco HCS, MetaSwitch Easy UC
Windstream, Integra Communications,
TeliaSonera (SE), TalkTalk (UK), Destiny (BE)
Windstream UCaaS, Integra Hosted Enterprise, TalkTalk Business Hosted UC
Lowest
Highest
Mitel is the only vendor able to deliver a robust�& consistent user experience on premise, in the Cloud or a hybrid of the two, using either the public internet or private networking.
16 | �2014 Mitel. Proprietary and Confidential.
|
|
�
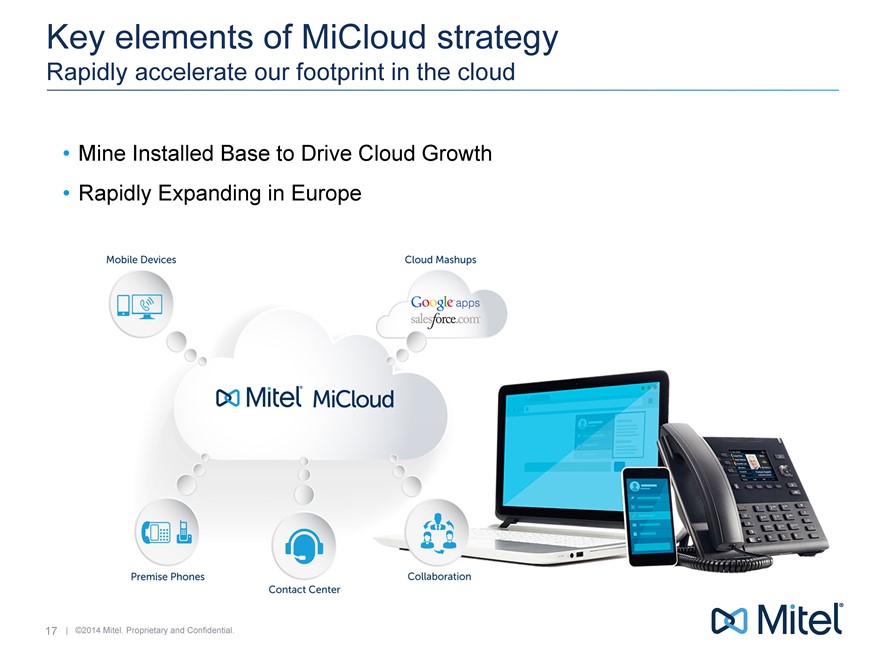
Key elements of MiCloud strategy
Rapidly accelerate our footprint in the cloud
| � |
� |
Mine Installed Base to Drive Cloud Growth |
| � |
� |
Rapidly Expanding in Europe |
17 | �2014 Mitel. Proprietary and Confidential.
|
|
�
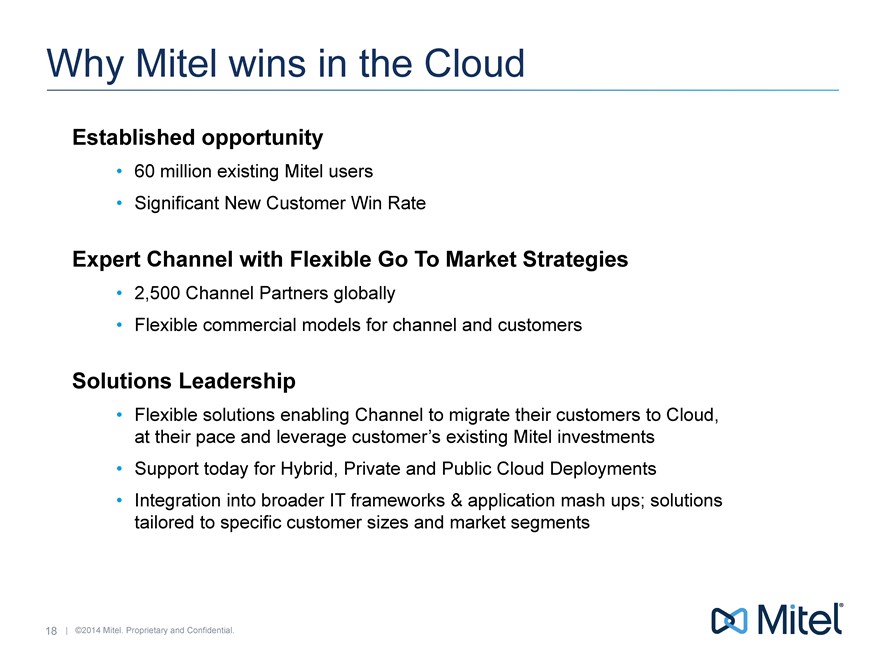
Why Mitel wins in the Cloud
Established opportunity
60�million existing Mitel users
Significant New Customer Win Rate
Expert Channel with Flexible Go To Market Strategies
2,500 Channel Partners globally
Flexible commercial models for channel and customers
Solutions Leadership
Flexible solutions enabling Channel to migrate their customers to Cloud, at their pace and leverage customer�s existing Mitel investments
Support today for Hybrid, Private and Public Cloud Deployments
Integration into broader IT frameworks�& application mash ups; solutions tailored to specific customer sizes and market segments
18 | �2014 Mitel. Proprietary and Confidential.
|
|
�
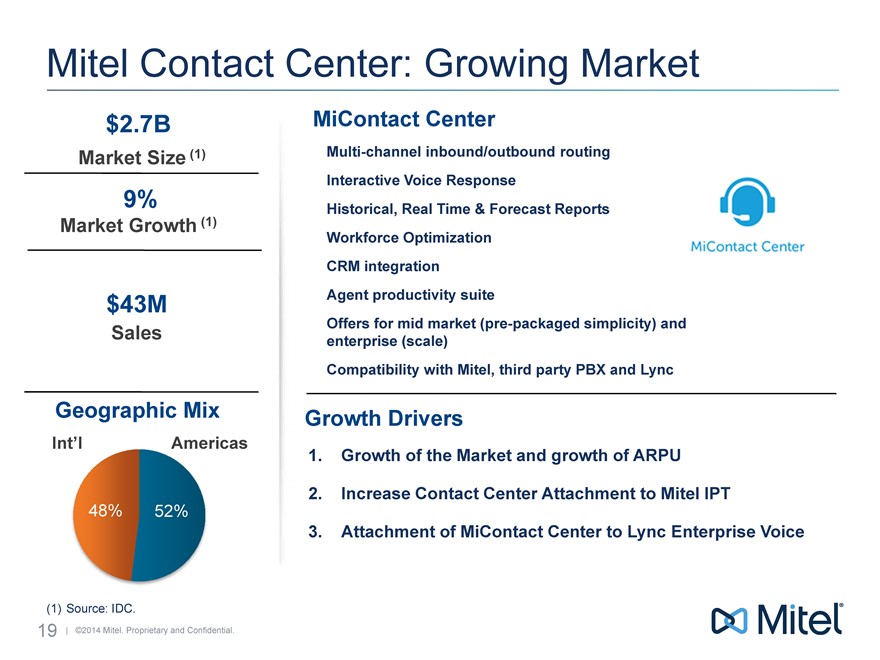
Mitel Contact Center: Growing Market
$2.7B
Market Size (1)
9%
Market Growth (1)
$43M
Sales
Geographic Mix
Int�l
Americas
48%
52%
MiContact Center
Multi-channel inbound/outbound routing Interactive Voice Response Historical, Real Time�& Forecast Reports Workforce Optimization CRM integration Agent productivity suite
Offers for mid market (pre-packaged simplicity) and enterprise (scale) Compatibility with Mitel, third party PBX and Lync
Growth Drivers
1. Growth of the Market and growth of ARPU
2. Increase Contact Center Attachment to Mitel IPT
3. Attachment of MiContact Center to Lync Enterprise Voice
(1) Source: IDC.
19 �2014 Mitel. Proprietary and Confidential.
|
|
�
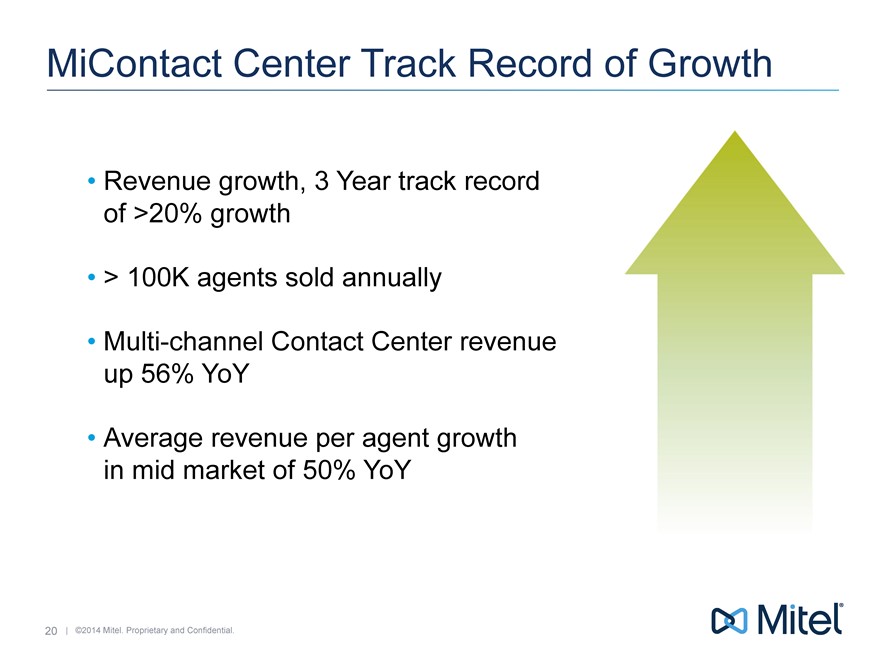
MiContact Center Track Record of Growth
Revenue growth, 3 Year track record of >20% growth
> 100K agents sold annually
Multi-channel Contact Center revenue up 56% YoY
Average revenue per agent growth in mid market of 50% YoY
20 | �2014 Mitel. Proprietary and Confidential.
|
|
�
Mitel
Powering connections
Financial Overview
|
|
�
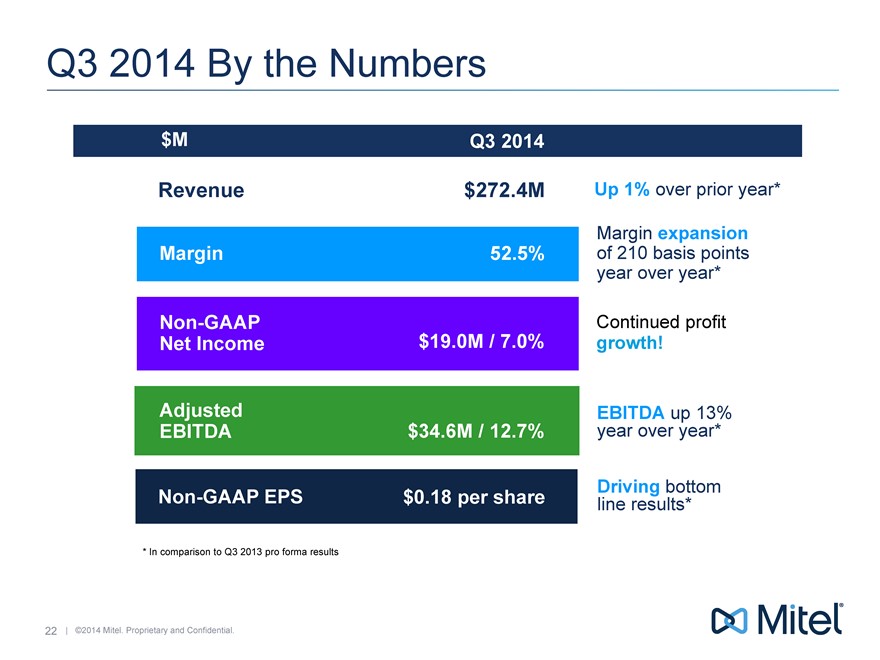
Q3 2014 By the Numbers
$M
Revenue Margin
Non-GAAP Net Income
Adjusted
EBITDA
Non-GAAP EPS
Q3 2014
$272.4M 52.5%
$19.0M / 7.0%
$34.6M / 12.7%
$0.18 per share
Up 1% over prior year* Margin expansion of 210 basis points year over year*
Continued profit growth!
EBITDA up 13%
year over year* Driving bottom
line results*
* In comparison to Q3 2013 pro forma results
22 | �2014 Mitel. Proprietary and Confidential.
|
|
�
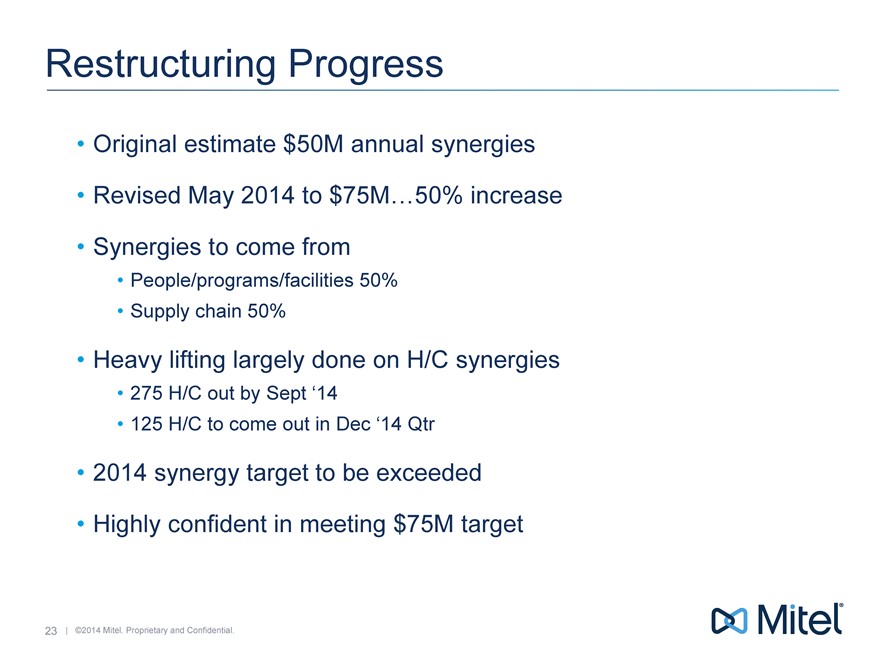
Restructuring Progress
Original estimate $50M annual synergies
Revised May 2014 to $75M�50% increase
Synergies to come from
People/programs/facilities 50%
Supply chain 50%
Heavy lifting largely done on H/C synergies
275 H/C out by Sept �14
125 H/C to come out in Dec �14 Qtr
2014 synergy target to be exceeded
Highly confident in meeting $75M target
23 | �2014 Mitel. Proprietary and Confidential.
|
|
�
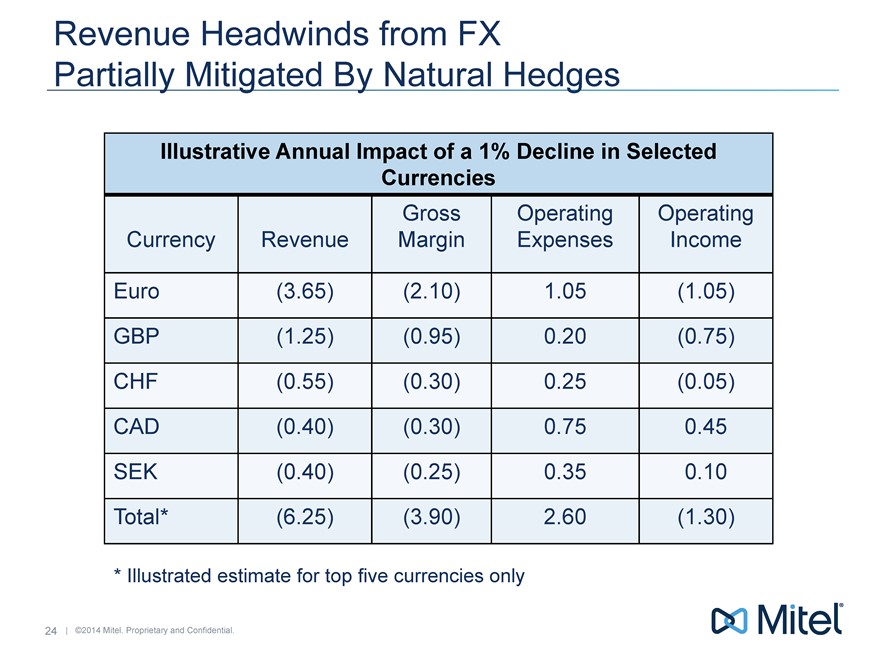
Revenue Headwinds from FX Partially Mitigated By Natural Hedges
Illustrative Annual Impact of a 1% Decline in Selected Currencies
Currency Revenue Gross Margin Operating Expenses Operating Income
Euro(3.65) (2.10) 1.05 (1.05)
GBP (1.25) (0.95) 0.20 (0.75)
CHF (0.55) (0.30) 0.25 (0.05)
CAD (0.40) (0.30) 0.75 0.45
SEK (0.40) (0.25) 0.35 0.10
Total* (6.25) (3.90) 2.60 (1.30)
* Illustrated estimate for top five currencies only
24 | �2014 Mitel. Proprietary and Confidential.
|
|
�
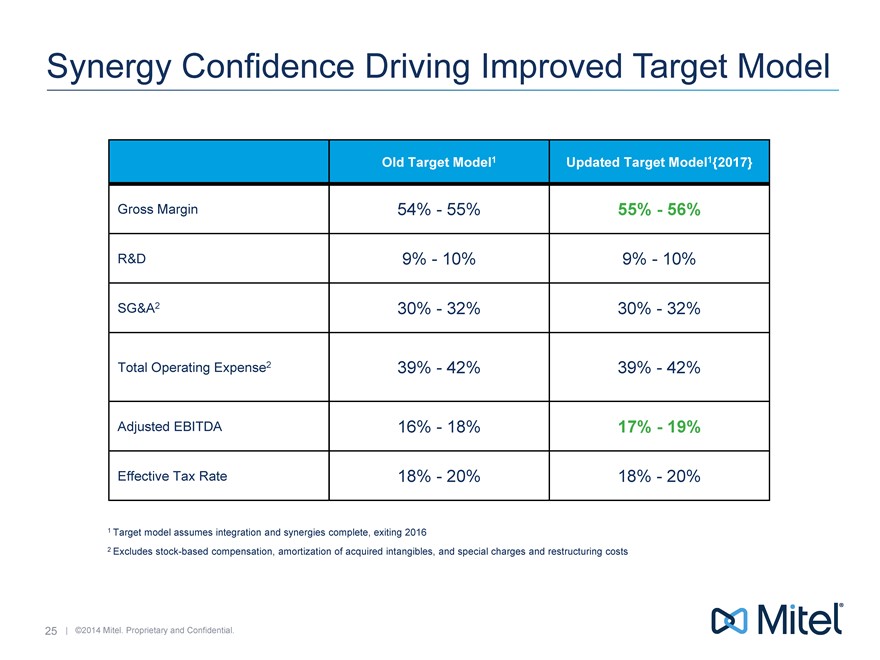
Synergy Confidence Driving Improved Target Model
Old Target Model1 Updated Target Model1{2017}
Gross Margin 54% - 55% 55% - 56%
R&D 9% - 10% 9% - 10%
SG&A2 30% - 32% 30% - 32%
Total Operating Expense2 39% - 42% 39% - 42%
Adjusted EBITDA 16% - 18% 17% - 19%
Effective Tax Rate 18% - 20% 18% - 20%
1 Target model assumes integration and synergies complete, exiting 2016
2 Excludes stock-based compensation, amortization of acquired intangibles, and special charges and restructuring costs
25 | �2014 Mitel. Proprietary and Confidential.
|
|
�
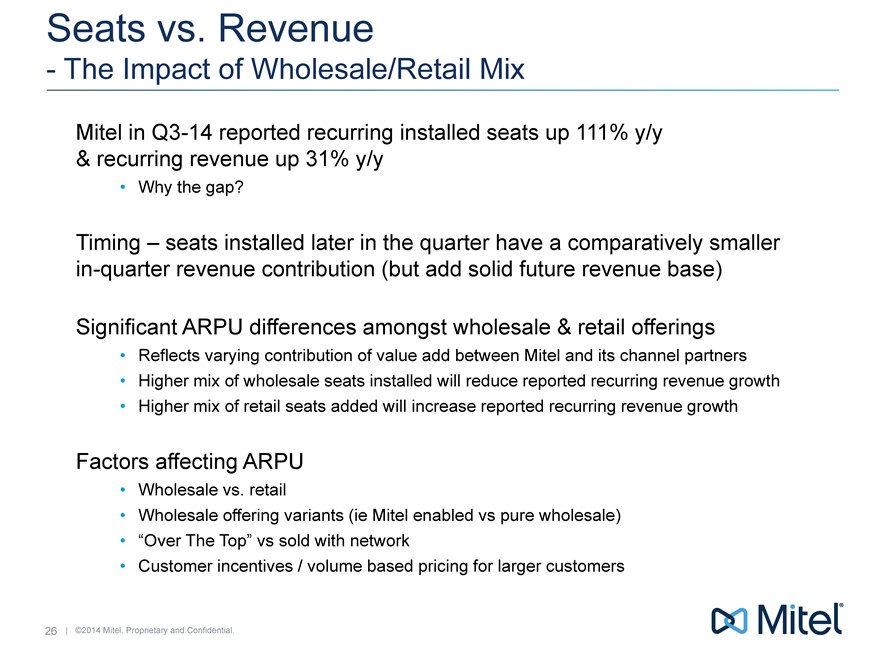
Seats vs. Revenue
- The Impact of Wholesale/Retail Mix
Mitel in Q3-14 reported recurring installed seats up 111% y/y
& recurring revenue up 31% y/y
Why the gap?
Timing � seats installed later in the quarter have a comparatively smaller in-quarter revenue contribution (but add solid future revenue base)
Significant ARPU differences amongst wholesale�& retail offerings
Reflects varying contribution of value add between Mitel and its channel partners
Higher mix of wholesale seats installed will reduce reported recurring revenue growth
Higher mix of retail seats added will increase reported recurring revenue growth
Factors affecting ARPU
Wholesale vs. retail
Wholesale offering variants (ie Mitel enabled vs pure wholesale)
�Over The Top� vs sold with network
Customer incentives / volume based pricing for larger customers
26 | �2014 Mitel. Proprietary and Confidential.
|
|
�
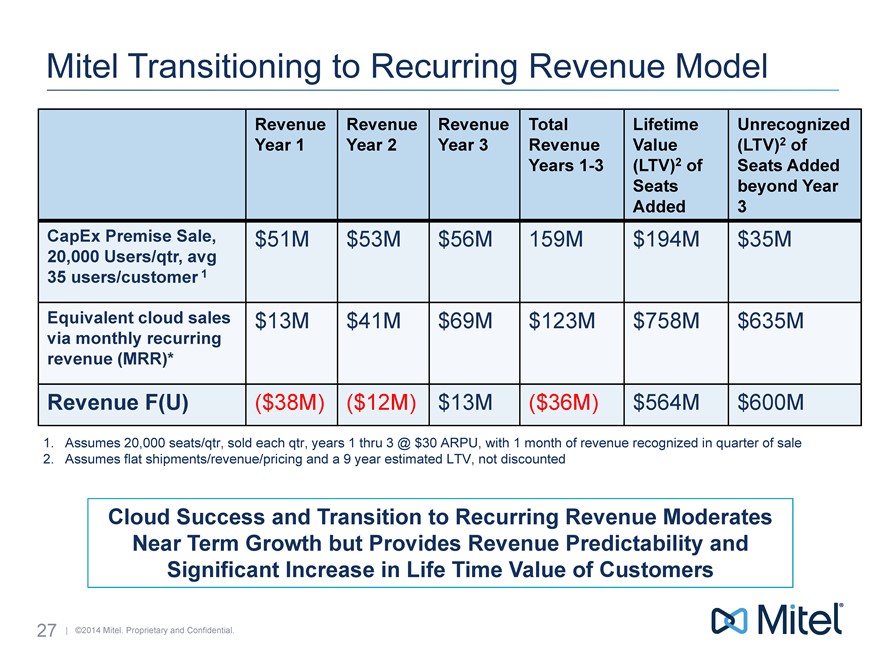
Mitel Transitioning to Recurring Revenue Model
Revenue Year 1 Revenue Year 2 Revenue Year 3 Total Revenue Years 1-3 Lifetime Value (LTV)2 of Seats Added Unrecognized (LTV)2 of Seats Added beyond Year 3
CapEx Premise Sale, 20,000 Users/qtr, avg 35 users/customer 1 $51M $53M $ 56M 159M $ 194M $ 35M
Equivalent cloud sales via monthly recurring revenue (MRR)* $13M $41M $ 69M $123M $ 758M $ 635M
Revenue F(U) ($38M) ($12M) $ 13M ($36M) $ 564M $ 600M
1. Assumes 20,000 seats/qtr, sold each qtr, years 1 thru 3 @ $30 ARPU, with 1 month of revenue recognized in quarter of sale
2. Assumes flat shipments/revenue/pricing and a 9 year estimated LTV, not discounted
Cloud Success and Transition to Recurring Revenue Moderates Near Term Growth but Provides Revenue Predictability and Significant Increase in Life Time Value of Customers
27 | �2014 Mitel. Proprietary and Confidential.
|
|
�
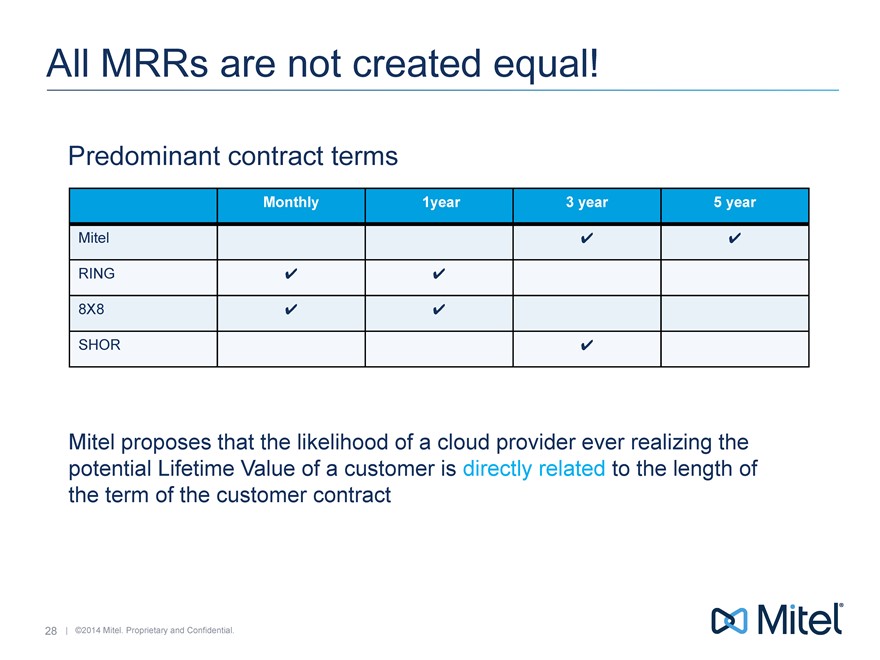
All MRRs are not created equal!
Predominant contract terms
Monthly 1year 3 year 5 year
Mitel
RING
8X8
SHOR
Mitel proposes that the likelihood of a cloud provider ever realizing the potential Lifetime Value of a customer is directly related to the length of the term of the customer contract
28 | �2014 Mitel. Proprietary and Confidential.
|
|
�
Why Mitel
We are business communications experts
We are a market leader
We offer clear customer choice with the best path to the cloud
We are powering connections and consolidating the market
29 | �2014 Mitel. Proprietary and Confidential.
|
|

�
17th Annual Needham Growth Conference New York � The Palace Hotel
January�14, 2015
Serious News for Serious Traders! Try StreetInsider.com Premium Free!
You May Also Be Interested In
- AUTODESK ALERT: Bragar Eagel & Squire, P.C. Announces that a Class Action Lawsuit Has Been Filed Against Autodesk, Inc. and Encourages Investors to Contact the Firm
- Marex Group plc Announces Pricing of Initial Public Offering
- BlackRock® Canada Announces Final April Cash Distributions for the iShares® Premium Money Market ETF
Create E-mail Alert Related Categories
SEC FilingsSign up for StreetInsider Free!
Receive full access to all new and archived articles, unlimited portfolio tracking, e-mail alerts, custom newswires and RSS feeds - and more!
