

Form 8-K NETFLIX INC For: Oct 16
 Tweet
Tweet Share
ShareExhibit 99.1
October 16, 2019
Fellow shareholders,
In Q3, we grew to $5.2 billion in revenue, up 31% over the prior year, and operating income doubled to $1.0 billion. Paid net adds totaled 6.8m compared to our 7.0m forecast and prior year Q3 of 6.1m. As we’ve improved the variety, diversity and quality of our content slate, member engagement has grown, revenue has increased, and we’re able to further fund our content investment.
(in millions except per share data and Streaming Content Obligations) | Q3'18 | Q4'18 | Q1'19 | Q2'19 | Q3'19 | Q4'19 Forecast | ||||||||||||
Revenue | $ | 3,999 | $ | 4,187 | $ | 4,521 | $ | 4,923 | $ | 5,245 | $ | 5,442 | ||||||
Y/Y % Growth | 34.0 | % | 27.4 | % | 22.2 | % | 26.0 | % | 31.1 | % | 30.0 | % | ||||||
Operating Income | $ | 481 | $ | 216 | $ | 459 | $ | 706 | $ | 980 | $ | 475 | ||||||
Operating Margin | 12.0 | % | 5.2 | % | 10.2 | % | 14.3 | % | 18.7 | % | 8.7 | % | ||||||
Net Income | $ | 403 | $ | 134 | $ | 344 | $ | 271 | $ | 665 | $ | 232 | ||||||
Diluted EPS | $ | 0.89 | $ | 0.30 | $ | 0.76 | $ | 0.60 | $ | 1.47 | $ | 0.51 | ||||||
Global Streaming Paid Memberships | 130.42 | 139.26 | 148.86 | 151.56 | 158.33 | 165.93 | ||||||||||||
Y/Y % Growth | 25.4 | % | 25.9 | % | 25.2 | % | 21.9 | % | 21.4 | % | 19.2 | % | ||||||
Global Streaming Paid Net Additions | 6.07 | 8.84 | 9.60 | 2.70 | 6.77 | 7.60 | ||||||||||||
Net cash (used in) operating activities | $ | (690 | ) | $ | (1,235 | ) | $ | (380 | ) | $ | (544 | ) | $ | (502 | ) | |||
Free Cash Flow* | $ | (859 | ) | $ | (1,315 | ) | $ | (460 | ) | $ | (594 | ) | $ | (551 | ) | |||
Adjusted EBITDA** | $ | 584 | $ | 328 | $ | 584 | $ | 836 | $ | 1,107 | ||||||||
Shares (FD) | 451.9 | 451.1 | 451.9 | 452.2 | 451.6 | |||||||||||||
Streaming Content Obligations*** ($B) | 18.6 | 19.3 | 18.9 | 18.5 | 19.1 | |||||||||||||
Note: Figures are consolidated, including DVD. | ||||||||||||||||||
* Free cash flow represents Net Cash (used in) operating activities adjusted for acquisition of DVD content assets, purchases of property and equipment and change in other assets | ||||||||||||||||||
** Adjusted EBITDA represents net income before interest expense and other income/expense, income taxes, depreciation and amortization of property and equipment and further adjusted to exclude other non-cash charges or non-recurring items | ||||||||||||||||||
*** Corresponds to our total known streaming content obligations as defined in our financial statements and related notes in our most recently filed SEC Form 10-K | ||||||||||||||||||
 | 1 |
Q3 Results and Q4 Forecast
In Q3’19, average streaming paid memberships and ARPU grew 22% and 9% year over year, respectively. Excluding a -$137m year over year impact from F/X, consolidated revenue growth was 35%, while streaming ARPU growth was 12%. Operating margin of 18.7% (up 670 bps year over year) was above our guidance due to timing of content and marketing spend, which will be more weighted to Q4’19. EPS amounted to $1.47 vs. $0.89 and included a $171 million non-cash unrealized gain from F/X remeasurement on our Euro denominated debt. Our Euro bonds provide us with a small natural hedge for our growing European revenues.
Total paid net adds of 6.8m increased 12% year over year and was an all-time Q3 record. As a reminder, the quarterly guidance we provide is our actual internal forecast at the time we report and we strive for accuracy. In Q3, our guidance forecast was our most accurate in recent history.
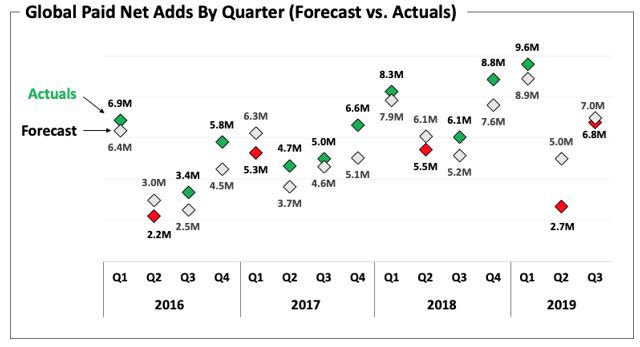
In the US, paid net adds totaled 0.5m in Q3 vs. our 0.8m forecast, and year to date paid net adds are 2.1m vs. 4.1m in the first nine months of 2018. Since our US price increase earlier this year, retention has not yet fully returned on a sustained basis to pre-price-change levels, which has led to slower US membership growth. On a member base of more than 60m, very small movements in churn can have a meaningful impact on paid net adds. However, revenue growth has been accelerating as US ARPU increased 16.5% year over year in Q3. With more revenue, we’ll continue to invest to improve our service to further strengthen our value proposition.
International paid net additions totaled 6.3m in Q3, a 23% increase vs. 5.1m in the year ago quarter, and slightly above our 6.2m guidance forecast. The US dollar strengthened vs. several key currencies over the course of the quarter, which resulted in the variance between our forecasted vs. actual international revenue. International ARPU, excluding the impact of F/X, rose 10% year over year. We’re making strides in our key markets and, while we have much more work to do in Asia in the coming years, we are seeing encouraging signs of progress.
| 2 |
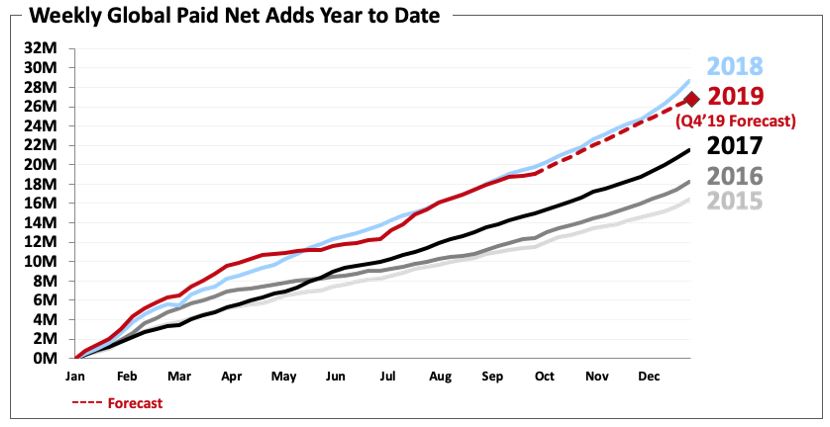
For Q4, we’re expecting consolidated revenue to increase 30% year over year with 9% streaming ARPU growth. We’re forecasting 7.6m global paid net adds (vs. 8.8m last Q4), with 0.6m in the US and 7.0m for the international segment. This implies full year 2019 paid net adds of 26.7m, down from 28.6m last year. While we had previously expected 2019 paid net adds to be up year over year, our current forecast reflects several factors including less precision in our ability to forecast the impact of our Q4 content slate, which consists of several new big IP launches (as opposed to returning seasons), the minor elevated churn in response to some price changes, and new forthcoming competition. As we outline in more detail below, our long term outlook on our business is unchanged.
We’re on track to achieve our full year 2019 operating margin goal of 13%. In 2020, we’ll be targeting another 300 basis points in operating margin expansion, consistent with the annual margin improvement we’ve delivered each year since 2017. As we’ve said previously, large swings in F/X could lead to some variations from our steady annual margin progression, partially because we don’t buy derivatives to hedge our F/X exposure and about half of our revenue is not in US dollars.
Content
We strive to program Netflix with the best variety of high quality content across many genres (scripted series, films, docs, comedy specials, unscripted TV, kids & family, anime, etc.). Our ambitious approach reflects our goal to satisfy the entertainment desires of our 158m-plus members and to attract as many of the hundreds of millions of non-members as we can. To accomplish this, we need great breadth of quality content because people have very diverse tastes.
If you think about your own habits, you’ll recognize that what you want to watch on a Friday night may differ from what you want to watch on Tuesday after a long day of work or what you want to watch with your family on Saturday morning or what you want to watch with your friends on Sunday afternoon. Now, multiply that by the billions of people on the planet and all the other factors that affect viewing preferences and you will have a sense of the breadth of programming necessary to be as successful as we desire.
| 3 |
We have been moving increasingly to original content both because of the anticipated pullback of second run content from some studios and because our original content is working in the form of member viewing and engagement. We started first with English scripted TV series more than six years ago to great success. We continued in Q3 with Stranger Things1 Season 3 (the most watched season to date with 64m member households in its first four weeks). We also introduced new limited series like Unbelievable2, one of our most thought provoking and highly viewed dramas (watched by 32m member households in its first 28 days).
We’re expanding our non-English language original offerings because they continue to help grow our penetration in international markets. In Q3, Season 3 of La Casa de Papel3 (aka Money Heist) became the most watched show on Netflix across our non-English language territories with 44m households watching the new season in the first four weeks of release. Sintonia4, our latest Brazilian original, was the second most watched inaugural season in Brazil. The Naked Director5 broke out as the biggest title launch for us in Japan and was also highly successful throughout Asia. Similarly, in India, we debuted the second season of Sacred Games6, our most watched show in India. To date, we have globally released 100 seasons of local language, original scripted series from 17 countries and have plans for over 130 more in 2020. We also plan to expand our investment in local language original films and unscripted series.
We’re also investing aggressively in original films and making great progress with improving results. Our original film slate in Q3 featured several solid hits like Secret Obsession7 (starring Brenda Song) and Otherhood8 (directed by Cindy Chupack in her feature directorial debut), which were watched by 40 million and 29 million households in their first four weeks, respectively. Tall Girl9, a new family film starring Ava Michelle, was also a success with 41m households watching in the first 28 days. We expect that our Q4 film releases will continue to build and strengthen our film effort. Q4 film releases include Martin Scorsese’s The Irishman10 (with Robert De Niro, Al Pacino, and Joe Pesci), Marriage Story11 (starring Scarlett Johansson and Adam Driver) and The Two Popes12 (featuring Anthony Hopkins and Jonathan Pryce), all of which have emerged as early Oscar frontrunners. We also have several big releases such as Dolemite is My Name13 (starring Eddie Murphy and featuring a breakout performance from Da'Vine Joy Randolph), 6 Underground14 (directed by Michael Bay and starring Ryan Reynolds), The Laundromat15, from director Steven Soderbergh and starring Meryl Streep and Gary Oldman and The King16 (starring Timothée Chalamet, Lily-Rose Depp and Joel Edgerton) as well as animated features Klaus17 and I Lost My Body18.
___________________________________
1 https://www.forbes.com/sites/lisettevoytko/2019/07/09/netflix-stranger-things-3-smashes-its-record/#7c52af0967c9
2 https://www.theatlantic.com/entertainment/archive/2019/09/netflix-unbelievable-sexual-assault-revolutionary-competence/598411/
3 https://variety.com/2019/digital/news/netflix-la-casa-de-papel-part-3-wows-madrid-world-premiere-1203265758/
4 https://variety.com/2019/tv/global/netflix-kond-losbragas-sintonia-synch-with-brazils-youtube-crowd-1203289251/
5 https://www.japantimes.co.jp/culture/2019/09/12/films/naked-director-japan-scores-global-netflix-hit/#.XaUbiOdKjOS
6 https://www.express.co.uk/showbiz/tv-radio/1185969/Sacred-Games-Netflix-Emmy-nomination-series-India-Lust-Stories
7 https://www.popsugar.com/entertainment/Netflix-Secret-Obsession-Review-Spoilers-46437478
8 https://www.glamour.com/story/otherhood-on-netflix
9 https://www.teenvogue.com/story/netflix-tall-girl-star-ava-michelle-learned-to-embrace-height
10 https://www.cnn.com/2019/07/31/entertainment/the-irishman-trailer/index.html
11 https://www.vanityfair.com/hollywood/2019/08/marriage-story-movie-review-adam-driver-scarlett-johansson
12 https://www.hollywoodreporter.com/review/two-popes-review-1235993
13 https://www.youtube.com/watch?v=Ws1YIKsuTjQ
14 https://www.youtube.com/watch?v=YLE85olJjp8
15 https://www.youtube.com/watch?v=wuBRcfe4bSo&feature=youtu.be
16 https://www.youtube.com/watch?v=yMJnsTx-TBg
17 https://deadline.com/video/klaus-director-sergio-pablos-netflix-featurette-news/
18 https://youtu.be/7EotTxCNtsA
| 4 |
Our goal is to have the quality of our slate rival the ambition of its scope. An example is Orange is the New Black, which wrapped its final new season in Q3. The show was celebrated by fans and the media for the groundbreaking role it played for Netflix and the culture at large; Time Magazine said “...’Orange is the New Black’ is the most important TV show of the decade.”19 Our very popular Ozark, Our Planet, Queer Eye, Black Mirror: Bandersnatch and When They See Us led 40 Netflix original series and films to a record 117 Emmy Nominations and 27 wins in 2019.
With so many firms now looking to provide premium video content to consumers, it’s a great time to be a creator of content. Amazing content can be expensive. We don’t shy away from taking bold swings if we think the business impact will also be amazing. We don’t close every deal we chase and we don’t chase every deal on the table. And while not all projects that we do pursue will work out, our large and growing subscription base helps enable us to try many approaches, while the size of our content budget (~$10 billion on P&L spend and ~$15 billion in cash content spend in 2019) insulates us from dependency on any single title. We’ll continue to learn as we go, while staying disciplined by assessing each opportunity individually, steadily marching up our operating margin and improving free cash flow.
Product and Partnerships
We seek to make it easier for future members to sign up and enjoy Netflix. To that end, we rolled out a lower priced mobile plan in India in July and we’re pleased with the results. Our approach with pricing is to grow revenue and so far, uptake and retention on our mobile plan in India has been better than our initial testing suggested. This will allow us to invest more in Indian content to further satisfy our members. While still only a very small percentage of our total subscriber base, we’re continuing to test mobile-only plans in other markets.
We continued to expand our partner-based bundle offerings, adding bundles with Sky Italia, Canal+ in France, KDDI in Japan and Izzi in Mexico this quarter. We just localized our service in Vietnamese, Hungarian and Czech so that more entertainment fans can enjoy thousands of hours of TV shows and films in their preferred language. We’ll continue to expand language coverage and accessibility.
Competition
We compete broadly for entertainment time. This means there are many competitive activities to Netflix (from watching linear TV to playing video games, for example). But there is also a very large market opportunity; today we believe we’re less than 10% of TV screen time in the US (our most mature market) and much less than that in mobile screen time. Many are focused on the “streaming wars,” but we’ve been competing with streamers (Amazon, YouTube, Hulu) as well as linear TV for over a decade. The upcoming arrival of services like Disney+, Apple TV+, HBO Max, and Peacock is increased competition, but we are all small compared to linear TV. While the new competitors have some great titles (especially catalog titles), none have the variety, diversity and quality of new original programming that we are producing around the world.
___________________________________
19 https://time.com/5631804/orange-is-the-new-black-season-7-legacy/
| 5 |
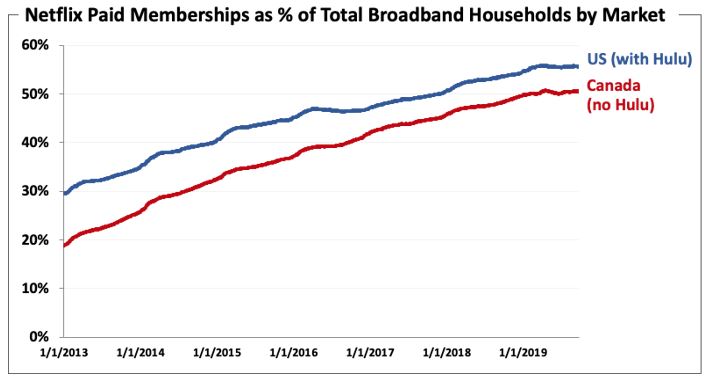
The launch of these new services will be noisy. There may be some modest headwind to our near-term growth, and we have tried to factor that into our guidance. In the long-term, though, we expect we’ll continue to grow nicely given the strength of our service and the large market opportunity. By way of example, our growth in Canada, where Hulu does not exist, is nearly identical to our growth in the US (where Hulu is very successful at about 30 million paid memberships). Our penetration in both markets below:
We believe this is due to the big factor of streaming growing into linear TV plus the fact that streaming video services have mostly exclusive content libraries that make them highly differentiated from one another. In our view, the likely outcome from the launch of these new services will be to accelerate the shift from linear TV to on demand consumption of entertainment. Just like the evolution from broadcast TV to cable, these once-in-a-generation changes are very large and open up big, new opportunities for many players. For example, for the first few decades of cable, networks like TBS, USA, ESPN, MTV and Discovery didn’t take much audience share from each other, but instead, they collectively took audience share from broadcast viewing.
Content creation is booming around the world and everyone is vying for consumer attention. Over the next 10 years, many streaming services will grow viewing as streaming replaces linear TV. Our focus will continue to be on pleasing our members and growing engagement because that approach has served us well since 1997. Total viewing, as measured by various 3rd parties, is the best indicator of our relative success since it’s a signal of customer satisfaction, and few of the services will disclose streaming video revenue, and subscriber figures are hard to interpret (given bundles, discounts and other promotions). Our focused approach to date has driven meaningful growth in our membership base and engagement.
We did well during the first decade of streaming. We’ve been preparing for this new wave of competition for a long time. It’s why we started investing in originals in 2012 and expanded aggressively ever since - across programming categories and countries with an ambition to share stories from the world to the world. In Q4, with The Crown, The Witcher, Klaus, The Irishman, The Two Popes, 6 Underground, and many other amazing titles launching, we’re ready to compete to earn consumers’ attention and viewing.
| 6 |
Cash Flow and Capital Structure
Net cash used in operating activities in Q3’19 was -$502 million vs. -$690 million in the prior year period. Free cash flow20 in Q3 totaled -$551 million vs. -$859 million in Q3’18. For the full year 2019, we’re still expecting FCF of approximately -$3.5 billion. With our quickly growing revenue base and expanding operating margins, we will be able to fund more of our content spending internally. As a result, we’re expecting free cash flow to improve in 2020 vs. 2019 and we expect to continue to improve annually beyond 2020. As we move slowly toward FCF positive, our plan is to continue to use the high yield market in the interim to finance our investment needs.
Next Year Reporting
Starting with our Q4’19 earnings report in January 2020, we plan to disclose revenue and membership by region, which is how we think about our business. Our four regions are Asia Pacific (APAC), Europe, Middle East & Africa (EMEA), Latin America (LATAM), and the US and Canada (UCAN). UCAN is roughly 90% US and 10% Canada. Under this new reporting format, we’ll only provide membership guidance for global paid memberships for the next quarter with each earnings report.
As we self-produce and license more original content that has global rights, we are finding US vs. international segment contribution margin reporting is becoming less useful internally. We’ll stop reporting on it in January 2020 and continue to focus on global operating margin as our primary profitability metric. As a reminder, we’ll no longer report free trial members beginning in 2020 as we informed you in our Q3’18 investor letter21.
___________________________________
20 For a reconciliation of free cash flow to net cash (used in) operating activities, please refer to the reconciliation in tabular form on the
attached unaudited financial statements and the footnotes thereto.
21 https://s22.q4cdn.com/959853165/files/doc_financials/quarterly_reports/2018/q3/FINAL-Q3-18-Shareholder-Letter.pdf
| 7 |
(in millions) | Q3'18 | Q4'18 | Q1'19 | Q2'19 | Q3'19 | Q4'19 Forecast | ||||||||||||
US Streaming: | ||||||||||||||||||
Revenue | $ | 1,937 | $ | 1,996 | $ | 2,074 | $ | 2,299 | $ | 2,413 | $ | 2,455 | ||||||
Contribution Profit* | $ | 688 | $ | 590 | $ | 713 | $ | 852 | $ | 991 | $ | 777 | ||||||
Contribution Margin* | 35.5 | % | 29.6 | % | 34.4 | % | 37.1 | % | 41.1 | % | 31.6 | % | ||||||
Paid Memberships | 56.96 | 58.49 | 60.23 | 60.10 | 60.62 | 61.22 | ||||||||||||
Paid Net Additions | 1.00 | 1.53 | 1.74 | (0.13 | ) | 0.52 | 0.60 | |||||||||||
Free Trials | 1.51 | 2.07 | 1.56 | 1.58 | 1.38 | |||||||||||||
International Streaming: | ||||||||||||||||||
Revenue | $ | 1,973 | $ | 2,106 | $ | 2,367 | $ | 2,548 | $ | 2,760 | $ | 2,918 | ||||||
Contribution Profit* | $ | 218 | $ | 82 | $ | 274 | $ | 416 | $ | 558 | $ | 309 | ||||||
Contribution Margin* | 11.0 | % | 3.9 | % | 11.6 | % | 16.3 | % | 20.2 | % | 10.6 | % | ||||||
Paid Memberships | 73.46 | 80.77 | 88.63 | 91.46 | 97.71 | 104.71 | ||||||||||||
Paid Net Additions | 5.07 | 7.31 | 7.86 | 2.83 | 6.26 | 7.00 | ||||||||||||
Free Trials | 5.17 | 7.13 | 5.00 | 4.48 | 4.22 | |||||||||||||
*Certain prior period amounts have been reclassified from G&A to Cost of revenues and Marketing and from Tech & Dev to Cost of revenues to conform to current period presentation | ||||||||||||||||||
Note: As announced in our Q3'18 investor letter, we will cease reporting end-of-quarter free trial count in January of 2020. | ||||||||||||||||||
Reference
For quick reference, our eight most recent investor letters are: July 2019,22 April 2019,23 January 2019,24 October 2018,25 July 2018,26 April 2018,27 January 2018,28 October 2017.29
___________________________________
22 https://s22.q4cdn.com/959853165/files/doc_financials/quarterly_reports/2019/q2/Q2-19-Shareholder-Letter-FINAL.pdf
23 https://s22.q4cdn.com/959853165/files/doc_financials/quarterly_reports/2019/q1/FINAL-Q1-19-Shareholder-Letter.pdf
24 https://s22.q4cdn.com/959853165/files/doc_financials/quarterly_reports/2018/q4/01/FINAL-Q4-18-Shareholder-Letter.pdf
25 https://s22.q4cdn.com/959853165/files/doc_financials/quarterly_reports/2018/q3/FINAL-Q3-18-Shareholder-Letter.pdf
26 https://s22.q4cdn.com/959853165/files/doc_financials/quarterly_reports/2018/q2/FINAL-Q2-18-Shareholder-Letter.pdf
27 https://s22.q4cdn.com/959853165/files/doc_financials/quarterly_reports/2018/q1/FINAL-Q1-18-Shareholder-Letter.pdf
28 https://s22.q4cdn.com/959853165/files/doc_financials/quarterly_reports/2017/q4/COMBINED-Q4-17-Shareholder-Letter-FINAL.pdf
29 https://s22.q4cdn.com/959853165/files/doc_financials/quarterly_reports/2017/q3/Q3_17_Shareholder_Letter_COMBINED.pdf
| 8 |
October 16, 2019 Earnings Interview, 3pm PST
Our video interview with Michael Morris of Guggenheim Securities will be on youtube/netflixir at 3pm PST today. Questions that investors would like to see asked should be sent to [email protected]. Reed Hastings, CEO, Spence Neumann, CFO, Ted Sarandos, Chief Content Officer, Greg Peters, Chief Product Officer and Spencer Wang, VP of IR/Corporate Development will all be on the video to answer Michael’s questions.
IR Contact: | PR Contact: |
Spencer Wang | Richard Siklos |
VP, Finance/IR & Corporate Development | VP, Corporate Communications |
408 809-5360 | 408 540-2629 |
| 9 |
Use of Non-GAAP Measures
This shareholder letter and its attachments include reference to the non-GAAP financial measure of free cash flow and adjusted EBITDA. Management believes that free cash flow and adjusted EBITDA are important liquidity metrics because they measure, during a given period, the amount of cash generated that is available to repay debt obligations, make investments and for certain other activities or the amount of cash used in operations, including investments in global streaming content. However, these non-GAAP measures should be considered in addition to, not as a substitute for or superior to, net income, operating income, diluted earnings per share and net cash provided by operating activities, or other financial measures prepared in accordance with GAAP. Reconciliation to the GAAP equivalent of these non-GAAP measures are contained in tabular form on the attached unaudited financial statements.
Forward-Looking Statements
This shareholder letter contains certain forward-looking statements within the meaning of the federal
securities laws, including statements regarding pricing; investments in our service; future content offerings and approach to accessing content; investment in local language original films and unscripted series; evolution of streaming video services; product tests and changes; impact of and reaction to competition; future capital raises; U.S. and international streaming paid memberships, paid net additions, revenue, contribution profit (loss) and contribution margin; consolidated revenue, revenue growth, operating income, operating margin, net income, and earnings per share; free cash flow; and changes to earnings reports. The forward-looking statements in this letter are subject to risks and uncertainties that could cause actual results and events to differ, including, without limitation: our ability to attract new members and retain existing members; our ability to compete effectively; maintenance and expansion of device platforms for streaming; fluctuations in consumer usage of our service; service disruptions; production risks; actions of Internet Service Providers; and, competition, including consumer adoption of different modes of viewing in-home filmed entertainment. A detailed discussion of these and other risks and uncertainties that could cause actual results and events to differ materially from such forward-looking statements is included in our filings with the Securities and Exchange Commission, including our Annual Report on Form 10-K, filed with the Securities and Exchange Commission (“SEC”) on January 29, 2019, as amended by Form 10-K/A, filed with the SEC on February 8, 2019. The Company provides internal forecast numbers. Investors should anticipate that actual performance will vary from these forecast numbers based on risks and uncertainties discussed above and in our Annual Report on Form 10-K, as amended by Form 10-K/A. We undertake no obligation to update forward-looking statements to reflect events or circumstances occurring after the date of this shareholder letter.
| 10 |
Netflix, Inc.
Consolidated Statements of Operations
(unaudited)
(in thousands, except per share data)
Three Months Ended | Nine Months Ended | ||||||||||||||||||
September 30, 2019 | June 30, 2019 | September 30, 2018 | September 30, 2019 | September 30, 2018 | |||||||||||||||
Revenues | $ | 5,244,905 | $ | 4,923,116 | $ | 3,999,374 | $ | 14,689,013 | $ | 11,607,500 | |||||||||
Cost of revenues | 3,097,919 | 3,005,657 | 2,531,128 | 8,974,190 | 7,234,138 | ||||||||||||||
Marketing | 553,797 | 603,150 | 510,330 | 1,773,525 | 1,639,114 | ||||||||||||||
Technology and development | 379,776 | 383,233 | 308,620 | 1,135,773 | 890,025 | ||||||||||||||
General and administrative | 233,174 | 224,657 | 168,628 | 659,783 | 454,764 | ||||||||||||||
Operating income | 980,239 | 706,419 | 480,668 | 2,145,742 | 1,389,459 | ||||||||||||||
Other income (expense): | |||||||||||||||||||
Interest expense | (160,660 | ) | (152,033 | ) | (108,862 | ) | (448,222 | ) | (291,686 | ) | |||||||||
Interest and other income (expense) | 192,744 | (53,470 | ) | 7,004 | 215,378 | 9,289 | |||||||||||||
Income before income taxes | 1,012,323 | 500,916 | 378,810 | 1,912,898 | 1,107,062 | ||||||||||||||
Provision for (benefit from) income taxes | 347,079 | 230,266 | (24,025 | ) | 632,952 | 29,754 | |||||||||||||
Net income | $ | 665,244 | $ | 270,650 | $ | 402,835 | $ | 1,279,946 | $ | 1,077,308 | |||||||||
Earnings per share: | |||||||||||||||||||
Basic | $ | 1.52 | $ | 0.62 | $ | 0.92 | $ | 2.93 | $ | 2.48 | |||||||||
Diluted | $ | 1.47 | $ | 0.60 | $ | 0.89 | $ | 2.83 | $ | 2.39 | |||||||||
Weighted-average common shares outstanding: | |||||||||||||||||||
Basic | 438,090 | 437,587 | 435,809 | 437,547 | 435,033 | ||||||||||||||
Diluted | 451,552 | 452,195 | 451,919 | 451,896 | 451,283 | ||||||||||||||
| 11 |
Netflix, Inc.
Consolidated Balance Sheets
(unaudited)
(in thousands)
As of | |||||||
September 30, 2019 | December 31, 2018 | ||||||
Assets | |||||||
Current assets: | |||||||
Cash and cash equivalents | $ | 4,435,018 | $ | 3,794,483 | |||
Current content assets, net | — | 5,151,186 | |||||
Other current assets | 892,740 | 748,466 | |||||
Total current assets | 5,327,758 | 9,694,135 | |||||
Non-current content assets, net | 23,234,994 | 14,960,954 | |||||
Property and equipment, net | 481,992 | 418,281 | |||||
Other non-current assets | 1,896,967 | 901,030 | |||||
Total assets | $ | 30,941,711 | $ | 25,974,400 | |||
Liabilities and Stockholders' Equity | |||||||
Current liabilities: | |||||||
Current content liabilities | $ | 4,860,542 | $ | 4,686,019 | |||
Accounts payable | 444,129 | 562,985 | |||||
Accrued expenses and other liabilities | 1,037,723 | 477,417 | |||||
Deferred revenue | 915,506 | 760,899 | |||||
Total current liabilities | 7,257,900 | 6,487,320 | |||||
Non-current content liabilities | 3,419,552 | 3,759,026 | |||||
Long-term debt | 12,425,746 | 10,360,058 | |||||
Other non-current liabilities | 977,008 | 129,231 | |||||
Total liabilities | 24,080,206 | 20,735,635 | |||||
Stockholders' equity: | |||||||
Common stock | 2,677,972 | 2,315,988 | |||||
Accumulated other comprehensive loss | (41,246 | ) | (19,582 | ) | |||
Retained earnings | 4,224,779 | 2,942,359 | |||||
Total stockholders' equity | 6,861,505 | 5,238,765 | |||||
Total liabilities and stockholders' equity | $ | 30,941,711 | $ | 25,974,400 | |||
| 12 |
Netflix, Inc.
Consolidated Statements of Cash Flows
(unaudited)
(in thousands)
Three Months Ended | Nine Months Ended | ||||||||||||||||||
September 30, 2019 | June 30, 2019 | September 30, 2018 | September 30, 2019 | September 30, 2018 | |||||||||||||||
Cash flows from operating activities: | |||||||||||||||||||
Net income | $ | 665,244 | $ | 270,650 | $ | 402,835 | $ | 1,279,946 | $ | 1,077,308 | |||||||||
Adjustments to reconcile net income to net cash used in operating activities: | |||||||||||||||||||
Additions to streaming content assets | (3,648,292 | ) | (3,325,103 | ) | (3,238,717 | ) | (9,971,141 | ) | (9,259,185 | ) | |||||||||
Change in streaming content liabilities | (95,548 | ) | (12,414 | ) | 65,868 | (122,660 | ) | 733,227 | |||||||||||
Amortization of streaming content assets | 2,279,977 | 2,231,915 | 1,911,767 | 6,636,578 | 5,478,428 | ||||||||||||||
Amortization of DVD content assets | 6,654 | 7,656 | 9,959 | 22,819 | 32,247 | ||||||||||||||
Depreciation and amortization of property, equipment and intangibles | 26,704 | 25,496 | 21,161 | 75,761 | 59,938 | ||||||||||||||
Stock-based compensation expense | 100,262 | 103,848 | 82,316 | 305,310 | 231,943 | ||||||||||||||
Other non-cash items | 51,280 | 53,039 | 8,962 | 141,518 | 31,092 | ||||||||||||||
Foreign currency remeasurement loss (gain) on long-term debt | (171,360 | ) | 61,284 | (7,670 | ) | (167,676 | ) | (52,000 | ) | ||||||||||
Deferred taxes | 52,105 | 35,519 | (39,453 | ) | 94,251 | (71,041 | ) | ||||||||||||
Changes in operating assets and liabilities: | |||||||||||||||||||
Other current assets | 145 | (24,231 | ) | (30,364 | ) | (56,162 | ) | (111,833 | ) | ||||||||||
Accounts payable | (7,643 | ) | (2,674 | ) | (4,449 | ) | (134,784 | ) | 77,367 | ||||||||||
Accrued expenses and other liabilities | 260,872 | (26,705 | ) | 134,000 | 391,814 | 200,198 | |||||||||||||
Deferred revenue | 22,729 | 84,085 | 18,983 | 154,607 | 98,101 | ||||||||||||||
Other non-current assets and liabilities | (44,923 | ) | (26,119 | ) | (25,609 | ) | (75,528 | ) | 28,803 | ||||||||||
Net cash used in operating activities | (501,794 | ) | (543,754 | ) | (690,411 | ) | (1,425,347 | ) | (1,445,407 | ) | |||||||||
Cash flows from investing activities: | |||||||||||||||||||
Acquisition of DVD content assets | (4,634 | ) | (7,798 | ) | (7,731 | ) | (21,602 | ) | (31,079 | ) | |||||||||
Purchases of property and equipment | (45,333 | ) | (39,584 | ) | (39,333 | ) | (145,298 | ) | (103,826 | ) | |||||||||
Change in other assets | 613 | (2,654 | ) | (121,630 | ) | (12,593 | ) | (123,857 | ) | ||||||||||
Net cash used in investing activities | (49,354 | ) | (50,036 | ) | (168,694 | ) | (179,493 | ) | (258,762 | ) | |||||||||
Cash flows from financing activities: | |||||||||||||||||||
Proceeds from issuance of debt | — | 2,243,196 | — | 2,243,196 | 1,900,000 | ||||||||||||||
Debt issuance costs | — | (18,192 | ) | — | (18,192 | ) | (16,992 | ) | |||||||||||
Proceeds from issuance of common stock | 11,989 | 21,896 | 29,781 | 56,857 | 113,052 | ||||||||||||||
Other financing activities | — | — | (544 | ) | — | (1,397 | ) | ||||||||||||
Net cash provided by financing activities | 11,989 | 2,246,900 | 29,237 | 2,281,861 | 1,994,663 | ||||||||||||||
Effect of exchange rate changes on cash, cash equivalents, and restricted cash | (29,325 | ) | 4,998 | (5,562 | ) | (29,341 | ) | (34,725 | ) | ||||||||||
Net increase (decrease) in cash, cash equivalents, and restricted cash | (568,484 | ) | 1,658,108 | (835,430 | ) | 647,680 | 255,769 | ||||||||||||
Cash, cash equivalents and restricted cash at beginning of period | 5,028,205 | 3,370,097 | 3,913,994 | 3,812,041 | 2,822,795 | ||||||||||||||
Cash, cash equivalents and restricted cash at end of period | $ | 4,459,721 | $ | 5,028,205 | $ | 3,078,564 | $ | 4,459,721 | $ | 3,078,564 | |||||||||
Three Months Ended | Nine Months Ended | ||||||||||||||||||
September 30, 2019 | June 30, 2019 | September 30, 2018 | September 30, 2019 | September 30, 2018 | |||||||||||||||
Non-GAAP free cash flow reconciliation: | |||||||||||||||||||
Net cash used in operating activities | $ | (501,794 | ) | $ | (543,754 | ) | $ | (690,411 | ) | $ | (1,425,347 | ) | $ | (1,445,407 | ) | ||||
Acquisition of DVD content assets | (4,634 | ) | (7,798 | ) | (7,731 | ) | (21,602 | ) | (31,079 | ) | |||||||||
Purchases of property and equipment | (45,333 | ) | (39,584 | ) | (39,333 | ) | (145,298 | ) | (103,826 | ) | |||||||||
Change in other assets | 613 | (2,654 | ) | (121,630 | ) | (12,593 | ) | (123,857 | ) | ||||||||||
Non-GAAP free cash flow | $ | (551,148 | ) | $ | (593,790 | ) | $ | (859,105 | ) | $ | (1,604,840 | ) | $ | (1,704,169 | ) | ||||
| 13 |
Netflix, Inc.
Segment Information
(unaudited)
(in thousands)
As of / Three Months Ended | As of/ Nine Months Ended | ||||||||||||||||||
September 30, 2019 | June 30, 2019 | September 30, 2018 | September 30, 2019 | September 30, 2018 | |||||||||||||||
Domestic Streaming | |||||||||||||||||||
Paid memberships at end of period | 60,620 | 60,103 | 56,957 | 60,620 | 56,957 | ||||||||||||||
Paid net membership additions (losses) | 517 | (126 | ) | 998 | 2,134 | 4,147 | |||||||||||||
Free trials | 1,375 | 1,575 | 1,507 | 1,375 | 1,507 | ||||||||||||||
Revenues | $ | 2,412,598 | $ | 2,299,189 | $ | 1,937,314 | $ | 6,785,342 | $ | 5,650,555 | |||||||||
Cost of revenues | 1,210,105 | 1,196,420 | 1,038,473 | 3,546,060 | 2,944,948 | ||||||||||||||
Marketing | 211,793 | 250,606 | 210,595 | 683,445 | 712,612 | ||||||||||||||
Contribution profit | 990,700 | 852,163 | 688,246 | 2,555,837 | 1,992,995 | ||||||||||||||
International Streaming | |||||||||||||||||||
Paid memberships at end of period | 97,714 | 91,459 | 73,465 | 97,714 | 73,465 | ||||||||||||||
Paid net membership additions | 6,255 | 2,825 | 5,070 | 16,941 | 15,631 | ||||||||||||||
Free trials | 4,215 | 4,481 | 5,170 | 4,215 | 5,170 | ||||||||||||||
Revenues | $ | 2,760,430 | $ | 2,547,727 | $ | 1,973,283 | $ | 7,674,906 | $ | 5,676,513 | |||||||||
Cost of revenues | 1,860,021 | 1,778,890 | 1,455,554 | 5,336,032 | 4,169,772 | ||||||||||||||
Marketing | 342,004 | 352,544 | 299,735 | 1,090,080 | 926,502 | ||||||||||||||
Contribution profit | 558,405 | 416,293 | 217,994 | 1,248,794 | 580,239 | ||||||||||||||
Domestic DVD | |||||||||||||||||||
Paid memberships at end of period | 2,276 | 2,411 | 2,828 | 2,276 | 2,828 | ||||||||||||||
Free trials | 16 | 17 | 24 | 16 | 24 | ||||||||||||||
Revenues | $ | 71,877 | $ | 76,200 | $ | 88,777 | $ | 228,765 | $ | 280,432 | |||||||||
Cost of revenues | 27,793 | 30,347 | 37,101 | 92,098 | 119,418 | ||||||||||||||
Contribution profit | 44,084 | 45,853 | 51,676 | 136,667 | 161,014 | ||||||||||||||
Consolidated | |||||||||||||||||||
Revenues | $ | 5,244,905 | $ | 4,923,116 | $ | 3,999,374 | $ | 14,689,013 | $ | 11,607,500 | |||||||||
Cost of revenues | 3,097,919 | 3,005,657 | 2,531,128 | 8,974,190 | 7,234,138 | ||||||||||||||
Marketing | 553,797 | 603,150 | 510,330 | 1,773,525 | 1,639,114 | ||||||||||||||
Contribution profit | 1,593,189 | 1,314,309 | 957,916 | 3,941,298 | 2,734,248 | ||||||||||||||
Other operating expenses | 612,950 | 607,890 | 477,248 | 1,795,556 | 1,344,789 | ||||||||||||||
Operating income | 980,239 | 706,419 | 480,668 | 2,145,742 | 1,389,459 | ||||||||||||||
Other income (expense) | 32,084 | (205,503 | ) | (101,858 | ) | (232,844 | ) | (282,397 | ) | ||||||||||
Provision for (benefit from) income taxes | 347,079 | 230,266 | (24,025 | ) | 632,952 | 29,754 | |||||||||||||
Net income | $ | 665,244 | $ | 270,650 | $ | 402,835 | $ | 1,279,946 | $ | 1,077,308 | |||||||||
| 14 |
Netflix, Inc.
Non-GAAP Information
(unaudited)
(in thousands)
September 30, 2018 | December 31, 2018 | March 31, 2019 | June 30, 2019 | September 30, 2019 | |||||||||||||||
Non-GAAP Adjusted EBITDA reconciliation: | |||||||||||||||||||
GAAP net income | $ | 402,835 | $ | 133,934 | $ | 344,052 | $ | 270,650 | $ | 665,244 | |||||||||
Add: | |||||||||||||||||||
Other expense (income) | 101,858 | 96,371 | 59,425 | 205,503 | (32,084 | ) | |||||||||||||
Provision for (benefit from) income taxes | (24,025 | ) | (14,538 | ) | 55,607 | 230,266 | 347,079 | ||||||||||||
Depreciation and amortization of property, equipment and intangibles | 21,161 | 23,219 | 23,561 | 25,496 | 26,704 | ||||||||||||||
Stock-based compensation expense | 82,316 | 88,714 | 101,200 | 103,848 | 100,262 | ||||||||||||||
Adjusted EBITDA | $ | 584,145 | $ | 327,700 | $ | 583,845 | $ | 835,763 | $ | 1,107,205 | |||||||||
| 15 |
Serious News for Serious Traders! Try StreetInsider.com Premium Free!
You May Also Be Interested In
- Netflix (NFLX) bonds retain Outperform rating at Gimme Credit amid strong content ROI
- Netflix (NFLX) raised to Buy at Needham & Company on revenue upside
- Netflix (NFLX) PT Lowered to $685 at DZ Bank
Create E-mail Alert Related Categories
SEC FilingsSign up for StreetInsider Free!
Receive full access to all new and archived articles, unlimited portfolio tracking, e-mail alerts, custom newswires and RSS feeds - and more!
