

Form 8-K B&G Foods, Inc. For: Sep 10
 Tweet
Tweet Share
Share
Exhibit 99.1

B&G Foods Announces Proposed Refinancing
— Issues Conditional Notice of Redemption for 4.625% Senior Notes due 2021 —
Parsippany, N.J., September 10, 2019—B&G Foods, Inc. (NYSE: BGS), announced today that it intends to refinance its 4.625% senior notes due 2021 and existing indebtedness under its revolving credit facility with new tranche B term loans under B&G Foods’ existing credit facility and/or the issuance of new senior notes. The consummation of the refinancing is subject to completion of definitive agreements as well as customary closing conditions, and is subject to market and other conditions. There can be no assurance that the refinancing will occur, or, if it does, as to the terms of the refinancing.
B&G Foods also announced that it has issued a notice of redemption for all $700.0 million principal amount of its outstanding 4.625% senior notes due 2021 at a cash redemption price of 100.0% of the principal amount of the notes being redeemed, plus accrued and unpaid interest on such amount, to, but excluding, the redemption date of October 10, 2019. The notice of redemption is conditioned on the completion by B&G Foods of the refinancing described above.
Interest on the redeemed notes will cease to accrue on and after October 10, 2019. The only remaining right of the holders of the redeemed notes will be to receive payment of the redemption price (together with the accrued and unpaid interest on such amount).
A conditional notice of redemption will be sent by The Bank of New York Mellon, the trustee for the notes, to the registered holders of the notes. Copies of the notice of redemption and additional information relating to the procedure for redemption may be obtained from The Bank of New York Mellon at 1.800.254.2826.
This press release is for informational purposes only and does not constitute a redemption notice with respect to the 4.625% senior notes and does not constitute an offer to sell or a solicitation of an offer to buy securities, and there shall not be any sale of securities in any state or jurisdiction in which the offer, solicitation or sale would be unlawful prior to registration or qualification under the securities laws of any such state or jurisdiction.
About B&G Foods, Inc.
Based in Parsippany, New Jersey, B&G Foods and its subsidiaries manufacture, sell and distribute high-quality, branded shelf-stable and frozen foods across the United States, Canada and Puerto Rico. With B&G Foods’ diverse portfolio of more than 50 brands you know and love, including Back to Nature, B&G, B&M, Cream of Wheat, Green Giant, Las Palmas, Le Sueur, Mama Mary’s, Maple Grove Farms, Mrs. Dash, New York Style, Ortega, Polaner, SnackWell’s, Spice Islands and Victoria, there’s a little something for everyone. For more information about B&G Foods and its brands, please visit www.bgfoods.com.
Forward-Looking Statements
Statements in this press release that are not statements of historical or current fact constitute “forward-looking statements.” The forward-looking statements contained in this press release include, without limitation, statements related to the proposed refinancing and notes redemption, including the prospects for consummating the proposed refinancing and the notes redemption. Such forward-looking statements involve known and unknown risks, uncertainties and other unknown factors that could cause the actual results of B&G Foods to be materially different from the historical results or from any future results expressed or implied by such forward-looking statements. In addition to statements that explicitly describe such risks and uncertainties, readers are urged to consider statements labeled with the terms “believes,” “belief,” “expects,” “projects,” “intends,” “anticipates,” “assumes,” “could,” “should,” “estimates,” “potential,” “seek,” “predict,” “may,” “will” or “plans” and similar references to future periods to be uncertain and forward-looking. Factors that may affect actual results include, without limitation: the Company’s substantial leverage; the effects of rising costs for the Company’s raw materials, packaging and ingredients; crude oil prices and their impact on distribution, packaging and energy costs; the Company’s ability to successfully implement sales price increases and cost saving measures to offset any cost increases; intense competition, changes in consumer preferences, demand for the Company’s products and local economic and market conditions; the Company’s continued ability to promote brand equity successfully, to anticipate and respond to new consumer trends, to develop new products and markets, to broaden brand portfolios in order to compete effectively with lower priced products and in markets that are consolidating at the retail and manufacturing levels and to improve productivity; the risks associated with the expansion of the Company’s business; the Company’s possible inability to identify new acquisitions or to integrate recent or future acquisitions or the Company’s failure to realize anticipated revenue enhancements, cost savings or other synergies; tax reform and legislation, including the effects of the U.S. Tax Cuts and Jobs Act; the Company’s ability to access the credit markets and the Company’s borrowing costs and credit ratings, which may be influenced by credit markets generally and the credit ratings of the Company’s competitors; unanticipated expenses, including, without limitation, litigation or legal settlement expenses; the effects of currency movements of the Canadian dollar and the Mexican peso as compared to the U.S. dollar; the effects of international trade disputes, tariffs, quotas, and other import or export restrictions on the Company’s international procurement, sales and operations; future impairments of the Company’s goodwill and intangible assets; the Company’s ability to successfully implement a new enterprise resource planning (ERP) system; the Company’s ability to protect information systems against, or effectively respond to, a cybersecurity incident or other disruption; the Company’s sustainability initiatives and changes to environmental laws and regulations; and other factors that affect the food industry generally. The forward-looking statements contained herein are also subject generally to other risks and uncertainties that are described from time to time in B&G Foods’ filings with the Securities and Exchange Commission, including under Item 1A, “Risk Factors” in the Company’s most recent Annual Report on Form 10-K and in its subsequent reports on Forms 10-Q and 8-K. Investors are cautioned not to place undue reliance on any such forward-looking statements, which speak only as of the date they are made. B&G Foods undertakes no obligation to publicly update or revise any forward-looking statement, whether as a result of new information, future events or otherwise.
Contacts:
| Investor Relations: ICR, Inc. Dara Dierks 866.211.8151 |
Media Relations: ICR, Inc. Matt Lindberg 203.682.8214 |
Exhibit 99.2

LENDER PRESENTATION 09.10.2019

Forward Looking Statements These materials and the oral statements made from time to time by executive officers of B&G Foods may contain “forward - looking” statements within the meaning of Section 21E of the Securities Exchange Act of 1934, as amended, and the Private Securities Litigation Reform Act of 1995, kno wn as the PSLRA. Statements in this presentation that are not statements of historical or current fact constitute “forward - looking statements.” The forward - looking statements contained in this presentation include, without limitation, statements related to future plans, strategies and operations; net sales, adjusted EBITDA, adjusted EBITDA margin, adjusted diluted earnings per share; the expected impact of acquisitions, including the recently completed Clabber Girl acquisition; the expected impac t o f cost savings initiatives and pricing actions; the adequacy of our net cash provided by operating activities and existing and future sources of liquidity to enable pa yments of interest and the repayment of debt and the payment of quarterly dividends; expectations regarding future purchases, if any, of our common stock under our e xis ting repurchase authorization; and B&G Foods’ overall expectations for fiscal 2019 and beyond. Such forward - looking statements involve known and unknown risks, uncertainties and other unknown factors that could cause the actual results of B&G Foods to be materially different from the historical results or from any future re sul ts expressed or implied by such forward - looking statements. In addition to statements that explicitly describe such risks and uncertainties readers are urged to cons ide r statements labeled with the terms “believes,” “belief,” “expects,” “projects,” “intends,” “anticipates,” ” assumes,” “could,” “should,” “estimates,” “potential,” “seek,” “predict,” “may,” “will” or “plans” and similar references to the future to be uncertain and forward - looking. Factors that may affect actual results include, without limitation: our substantial leverag e; the effects of rising costs for our raw materials, packaging, ingredients and distribution; crude oil prices and their impact on distribu tio n, packaging and energy costs; our ability to successfully implement sales price increases and cost saving measures to offset any cost increases; intense competition, chan ges in consumer preferences, demand for our products and local economic and market conditions; our continued ability to promote brand equity successfully, to anticipate and respond to new consumer trends, to develop new products and markets, to broaden brand portfolios in order to compete effectively with lower priced products and in markets that are consolidating at the retail and manufacturing levels and to improve productivity; the risks associated with the expansion of our business; our pos sib le inability to identify new acquisitions or to integrate recent or future acquisitions or our failure to realize anticipated revenue enhancements, cost savings or other syn erg ies; tax reform and legislation, including the effects of the U.S. Tax Cuts and Jobs Act; our ability to access the credit markets and our borrowing costs and credit ratings, which may be influenced by credit markets generally and the credit ratings of our competitors; unanticipated expenses, including, without limitation, litigation or leg al settlement expenses; the effects of currency movements of the Canadian dollar and the Mexican peso as compared to the U.S. dollar; the effects of international trade disp ute s, tariffs, quotas, and other import or export restrictions on our international procurement, sales and operations; future impairments of our goodwill and intangible as sets; our ability to successfully complete the implementation and operate a new enterprise resource planning (ERP) system; our ability to protect information systems against, or effectively respond to a cybersecurity incident or other disruption; our sustainability initiatives and changes to environmental laws and regulations; an d other factors that affect the food industry generally. The forward - looking statements contained herein are also subject generally to other risks and uncertainties that are described f rom time to time in B&G Foods’ filings with the Securities and Exchange Commission, including under Item 1A, “Risk Factors” in the Company’s Annu al Report on Form 10 - K for fiscal 2018 filed on February 26, 2019 and in B&G Foods’ subsequent reports on Forms 10 - Q and 8 - K. Investors are cautioned not to place undu e reliance on any such forward - looking statements, which speak only as of the date they are made. B&G Foods undertakes no obligation to publicly update or r evi se any forward - looking statement, whether as a result of new information, future events or otherwise. 1

About Non - GAAP Financial Measures This presentation includes “non - GAAP (Generally Accepted Accounting Principles) financial measures.” “Adjusted diluted earnings per share” (which we define as diluted earnings per share adjusted for certain items that affect comparability), “EBITDA” (which we define as net income before net interest expense, income taxes, depreciation and amortization and loss on extinguishment of debt), “adjusted EBITDA” (which we define as EBITDA, further adjusted for cash and non - cash acquisition - related expenses, gains and losses (which may include third party fees and expenses, integration, restructuring and consolidation expenses, amortization of acquired inventory fair value step - up, and gains and losses on sale of assets), non - recurring expenses, gains and losses and the non - cash accounting impact of the Company’s inventory reduction plan), and “base business net sales” (which we define as net sales excluding (1) the impact of acquisitions until at least one full quar ter of net sales from acquisitions are included in both comparable periods, and (2) net sales of discontinued or divested brands or businesses) are non - GAAP financial measures. A non - GAAP financial measure is a numerical measure of financial performance that excludes or includes amounts so as to be different than the most directly comparable measure calculated and presented in accordance with GAAP in B&G Foods’ consolidated balance sheets and related consolidated statements of operations, changes in stockholders’ equity and comprehensive income and cash flows. Non - GAAP financial measures should not be considered in isolation or as a substitute for the most directly comparable GAAP measures. The Company's non - GAAP financial measures may be different from non - GAAP financial measures used by other companies. 2

About Non - GAAP Financial Measures (cont’d) B&G Foods provides earnings guidance only on a non - GAAP basis and does not provide a reconciliation of our company’s forward - looking adjusted EBITDA and adjusted diluted earnings per share guidance to the most directly comparable GAAP financial measures because of the inherent difficulty in forecasting and quantifying certain amounts that are necessary for s uch reconciliations, including adjustments that could be made for deferred taxes; loss on extinguishment of debt; acquisition / divestiture - related and non - recurring expenses, gains and losses, including severance and other expenses primarily relating to a workforce reduction; the non - cash accounting impact of our inventory reduction plan; restructuring expenses; gains and losses on the sale of assets; and other charges reflected in our reconciliation of historic non - GAAP financial measures, the amounts of which, based on past experience, could be material. Additional information regarding these non - GAAP financial measures, including reconciliations of non - GAAP financial measures to the most directly comparable GAAP measures, is included elsewhere herein and in B&G Foods’ Current Reports on Form 8 - K filed with the SEC on February 26, 2019, May 2, 2019 and August 1, 2019; Quarterly Reports on Form 10 - Q for the quarter ended March 30, 2019 filed with the SEC on May 7, 2019 and for the quarter ended June 29, 2019 filed with the SEC on August 6, 2019, and Annual Report on Form 10 - K for fiscal 2018 filed with the SEC on February 26, 2019. Copies of these filings may be viewed at B&G Foods’ website at www.bgfoods.com under “Investors – SEC Filings.” 3

2 B&G Foods Bruce Wacha Exec. Vice President of Finance and Chief Finance Officer Ken Romanzi President and Chief Executive Officer 4

TRANSACTION OVERVIEW

Transaction Overview
B&G Foods, Inc. (“B&G Foods” or the “Company”) manufactures, sells and distributes a diverse portfolio of branded, high quality, shelf - stable and frozen foods across the United States, Canada and Puerto Rico. Diverse portfolio of 50+ brands, including frozen and canned vegetables, oatmeal and other hot cereals, fruit spreads, canned meats and beans, bagel chips, spices, seasonings, hot sauces, wine vinegar, maple syrup, molasses, salad dressings, pizza crusts, Mexican - style sauces, dry soups, taco shells and kits, salsas, pickles, peppers, tomato - based products, cookies and crackers, baking powder, baking soda, corn starch, nut clusters and other specialty products. Pro Forma Adj. EBITDA (before share - based compensation) of $308 million (1) . Company Overview Offering Overview 5 The Company is seeking to issue a new $450 million 7 - year Term Loan B. Together with a separately issued offering of Senior Notes, proceeds will be used to refinance its existing 4.625% Senior Notes due 2021 and for related fees and expenses (the “Transaction”). In order to allow for the prepayment of the Senior Notes due 2021, a majority consent is required from existing Revolver Lenders plus new Term Loan B Lenders. Barclays as sole fronting lender at closing will be signing the consent on behalf of all incoming new Term Loan B lenders committing and assigning into the Term Loan B post - closing (and new Term Loan B lenders are agreeing to this prepayment of the Senior Notes). In addition, the definition of Specified Change of Control is being modified to delete the continuing director clause. Existing Revolver lenders will be asked to submit their consent separately. Pro forma for the Transaction, Net Secured Debt / LTM PF Adj. EBITDA (1) of 1.5x and Net Total Debt / LTM PF Adj. EBITDA (1) of 5.9x. Seeking commitments by 12:00 pm ET Tuesday, September 17 th . 1. Reflects pro forma adjustments of approximately $8.4 million in the aggregate for the acquisition of McCann’s in July 2018 an d C labber Girl in May 2019 and divestiture of Pirate Brands in October 2018. Calculated to include add - back for $2.4 million of share - based compensation which conforms to the Adjusted EBITDA calculation pe r the Company’s covenant compliance method under its credit facility.

Pro Forma Capitalization Sources & Uses Pro Forma Capitalization Note: Leverage statistics based on debt at face value and excludes deferred financing costs and original issue discount. 1. Reflects pro forma adjustments of approximately $8.4 million in the aggregate for the acquisition of McCann’s in July 2018 an d C labber Girl in May 2019 and divestiture of Pirate Brands in October 2018. 2. Calculated to include add - back for $2.4 million of share - based compensation which conforms to the Adjusted EBITDA calculation pe r the Company’s covenant compliance method under its credit facility. 3. Reflects pro forma adjustments for revolving credit facility borrowings and term loan repayments in connection with the McCan n’s acquisition in July 2018 and Clabber Girl acquisition in May 2019 and divestiture of Pirate Brands in October 2018. 6 ($ in millions) Sources New Term Loan B $450.0 New Senior Notes 450.0 Total Sources $900.0 Uses Refinance 4.625% Senior Notes due 2021 $700.0 Repay RCF Draw 187.2 OID, Fees & Expenses 12.8 Total Uses $900.0 ($ in millions) LTM as of As Adj. LTM Capitalization 6/29/2019 Adj. 6/29/2019 Cash $20 $20 Revolving Credit Facility 215 (187) 28 New Term Loan B - 450 450 Total Secured Debt $215 $478 4.625% Senior Notes due 2021 700 (700) - 5.250% Senior Notes due 2025 900 900 New Senior Notes - 450 450 Total Debt $1,815 $1,828 Net Debt $1,795 $1,808 Operating Metrics LTM Adj. EBITDA $297 $297 PF Adj. EBITDA (1) 306 306 PF Adj. EBITDA (before share-based compensation) (1)(2) 308 308 PF Cash Interest Expense (3) 90 7 97 Credit Statistics Net Secured Debt / PF Adj. EBITDA (before share-based compensation) (2) 0.6x 1.5x Net Total Debt / PF Adj. EBITDA (before share-based compensation) (2) 5.8x 5.9x PF Adj. EBITDA (before share-based compensation) (2) / PF Cash Interest Expense 3.4x 3.2x
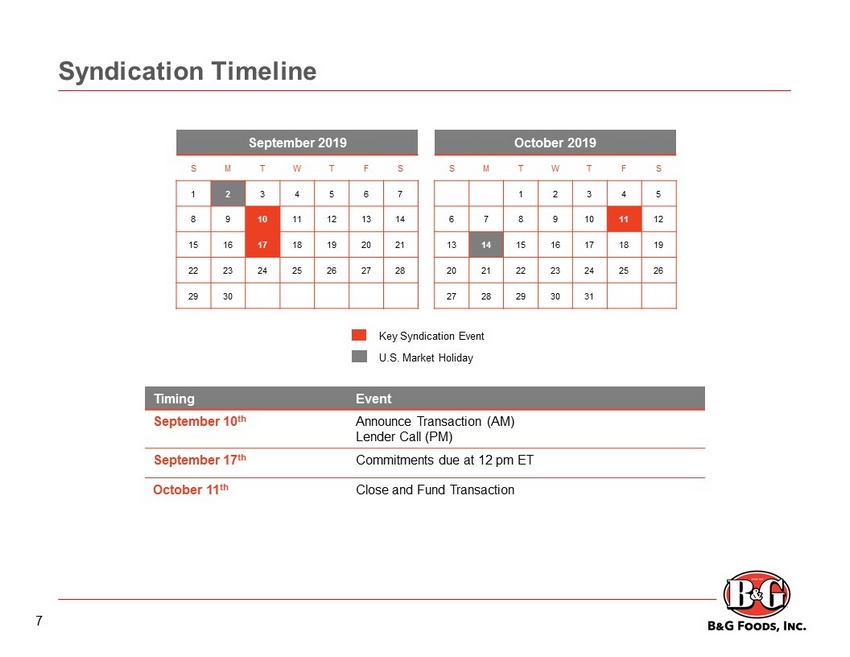
Syndication Timeline Timing Event September 10 th Announce Transaction (AM) Lender Call (PM) September 17 th Commitments due at 12 pm ET October 11 th Close and Fund Transaction September 2019 S M T W T F S 1 2 3 4 5 6 7 8 9 10 11 12 13 14 15 16 17 18 19 20 21 22 23 24 25 26 27 28 29 30 Key Syndication Event U.S. Market Holiday October 2019 S M T W T F S 1 2 3 4 5 6 7 8 9 10 11 12 13 14 15 16 17 18 19 20 21 22 23 24 25 26 27 28 29 30 31 7

Summary Terms – First Lien Term Loan 8 Borrower B&G Foods, Inc. (the “Borrower”) Description $450 million Term Loan B Maturity 7 years Guarantees Same as Existing Credit Agreement (“CA”): all present and future material, domestic subsidiaries of the Borrower Security Same as Existing CA: including, without limitation, substantially all of the tangible and intangible assets of the Company (o the r than real property) and a pledge of all of the equity interests in the Borrower’s material subsidiaries to the extent require d b y the terms of the Existing CA Incremental Facilities Same as Existing CA: unlimited amounts subject to 4.0x Senior Secured Leverage; 50 bps MFN MFN 50 bps; applicable for 24 months Mandatory Amortization 1.00% per annum, with bullet at maturity Optional Prepayments 101 soft call for 6 months on Term Loan B Affirmative Covenants Same as Existing CA: Customary for facilities of this type Negative Covenants Same as Existing CA: Customary for facilities of this type Financial Covenants None Note: Terms and conditions will primarily be unchanged from the Company’s existing Senior Secured Credit Facility due 2022. N ew proposed terms are subject to change prior to closing and funding of the Amendment.

Pro Forma Organizational Chart B&G Foods North America, Inc. Operating Company International Subsidiaries Domestic Subsidiaries Key: Borrower Guarantors Non - Guarantors 100% 100% B&G Foods, Inc. Holding Company • $700mm Revolving Credit Facility • New $450mm Term Loan B • $900mm Senior Notes due 2025 • New $450mm Senior Notes 9

COMPANY OVERVIEW

Key Investment Highlights We successfully acquire and operate established food brands and make them relevant for today’s consumer Drive growth of high potential brands while managing other brands for flat to moderate growth Cash flow driven M&A strategy focused on acquiring brands at accretive multiples Solid adjusted EBITDA margins and strong free cash flow generation Win with high quality products, strong customer service and differentiated innovation Manage brands for working capital and free cash flow efficiency Enduring commitment to deleveraging Commitment to returning a substantial portion of our cash to shareholders 10
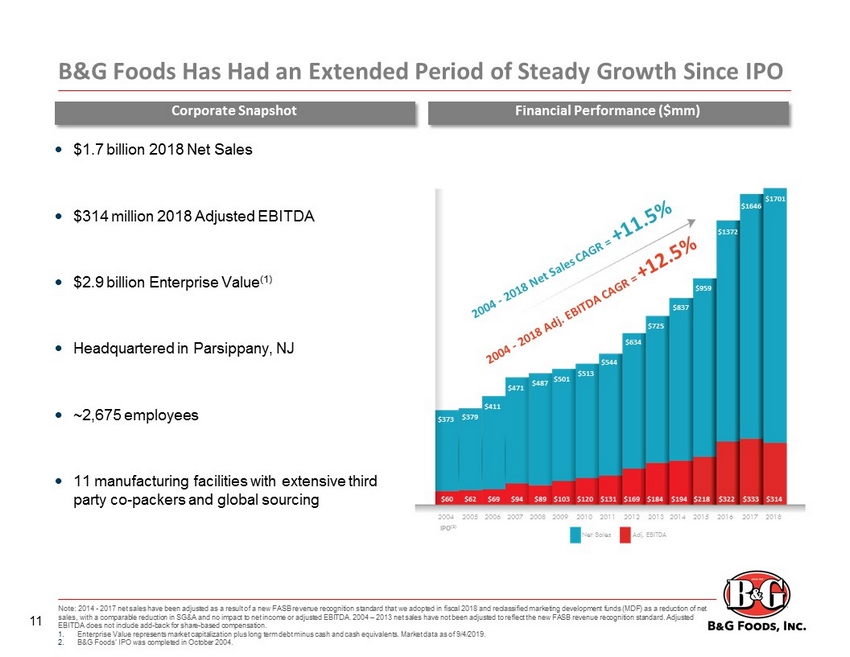
B&G Foods Has Had an Extended Period of Steady Growth Since IPO 11 $60 $218 $322 $333 $314 $1372 $1646 $1701 $62 $69 $94 $89 $103 $120 $131 $169 $184 $194 2004 IPO (2) 2015 2016 2017 2018 2005 2006 2007 2008 2009 2010 2011 2012 2013 2014 $373 $959 $837 $725 $634 $544 $513 $501 $487 $471 $411 $379 Net Sales Adj. EBITDA Note: 2014 - 2017 net sales have been adjusted as a result of a new FASB revenue recognition standard that we adopted in fiscal 2018 and reclassified marketing development funds (MDF) as a reduction of net sales, with a comparable reduction in SG&A and no impact to net income or adjusted EBITDA. 2004 – 2013 net sales have not been a djusted to reflect the new FASB revenue recognition standard. Adjusted EBITDA does not include add - back for share - based compensation. 1. Enterprise Value represents market capitalization plus long term debt minus cash and cash equivalents. Market data as of 9/4/ 201 9. 2. B&G Foods’ IPO was completed in October 2004. Financial Performance ($mm) $1.7 billion 2018 Net Sales $314 million 2018 Adjusted EBITDA $2.9 billion Enterprise Value (1) Headquartered in Parsippany, NJ ~2,675 employees 11 manufacturing facilities with extensive third party co - packers and global sourcing Corporate Snapshot

12 We Have Assembled a Portfolio of More than 50 Brands

1) Excludes net sales of Clabber Girl and Pirate Brands. SNACKS 7% PLANT BASED 33% SPICES 21% MEALS 17% CONDIMENTS 23% We Have a Diverse Portfolio Across 5 Core Pillars 13

plus Spices & Seasonings account for ~71% or $1.2 billion of net sales (1) 1. Pro forma for the sale of Pirate Brands on 10/17/2018 and the acquisition of Clabber Girl on 5/15/2019. 14 7 BRANDS $500+ Million $100+ Million $50 - $70 Million < $50 Million ANNUAL NET SALES BY BRAND A Portfolio of Large, Established & Defensible Niche Brands

Source: Ask Suzy Poll: General population consumers polled as of August 15, 2019. 15 Have at least 1 B&G Foods brand In their home 81 % of consumers We Have a Brand in Nearly Every Household

We Have a Brand in Every Aisle ENTRANCE FISH DAIRY & EGGS DAIRY DELI FROZEN FROZEN FLORAL PRODUCE POULTRY MEAT ENTRANCE PHARMACY BAKERY SOUPS HB&A DRESSINGS SEASONINGS MEXICAN BAKING CRACKERS SAUCES SNACKS CONDIMENTS BREAKFAST CANNED MEATS & VEGETABLES CHECKOUTS 16

75% of Our Brands Compete in Growing Categories Bagel Chips Baked Beans Baking Powder Baking Soda Meat Spreads Canned Tomatoes Enchilada Sauces Frozen Vegetables Fruit Juice Sweetened Preserves Full Service Mexican Grilling Spices Ingredient Beans Jarred Garlic Sugar Substitutes Sugar Free Syrup Shelf Stable Vegetables Specialty Nuts Specialty Granola Premium Spices Popcorn Seasoning Pizza Sauce Pure Maple Syrup Liquid Smoke Wine Vinegars Traditional Spices Super Premium Pasta Sauce 17

Sources: B&G Foods management estimates, AC Nielsen data. 18 Spices & Seasonings Brands Many of Our Brands are #1 or #2 Nationally or Regionally in the Categories or Markets Where They Compete BRAND IN CATEGORY OR MARKET

Our Largest Brands Are Driving Growth Source: Nielsen AOD – TTL US xAOC , 52 week data as of 7/27/19. Latest 52 – Weeks Retail Sales Growth 9.3% 8.9% 4.3% 3.9% 3.7% 1.9% 1.5% (1.0%) Spices & Seasonings Brands (1.9%) Total Company Sales 1.4% Frozen Shelf Stable 19

COMPANY VISION

Our Vision: To Be a Part of Every Eating Occasion BREAKFAST TRADITIONS SNACKING & ENTERTAINING GRILLING GREATNESS FAMILY GATHERINGS BAKING & COOKING 20

▪ Acquire and nurture undervalued brands ▪ Innovate to meet consumers’ needs ▪ Deliver shareholder value Our Mission 21

Our Strategic Imperatives BUILD A WINNING WORKPLACE ACQUIRE & INTEGRATE BUSINESS IMPROVE MARGINS DRIVE ORGANIC GROWTH 22

▪ Manage brand portfolio for 0% to 2% organic growth ▪ Drive growth on key brands ▪ Manage and maintain remaining brands for cash flow ▪ Focus on fewer, bigger, better innovations ▪ Invest in underdeveloped channels Drive Organic Growth 23

We Manage Our Brand Portfolio for 0% - 2% Organic Growth 24 Growth Potential Size Low High High Low BFY Snacks Seasonings Meals Medium Shelf Stable Frozen Pure Maple Molasses MAINTAIN MANAGE Profitability
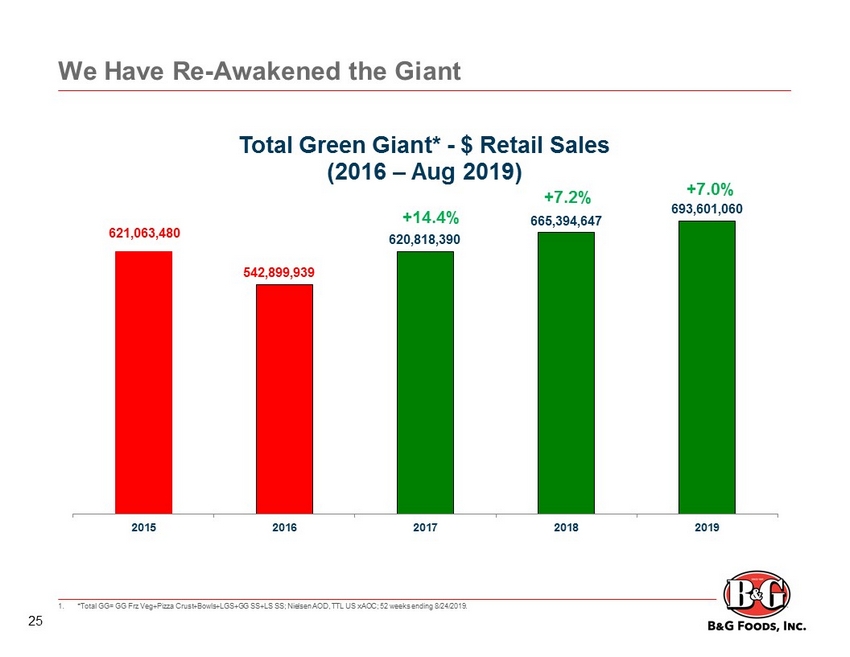
We Have Re - Awakened the Giant 1. *Total GG= GG Frz Veg+Pizza Crust+Bowls+LGS+GG SS+LS SS; Nielsen AOD, TTL US xAOC ; 52 weeks ending 8/24/2019. 25 621,063,480 542,899,939 620,818,390 665,394,647 693,601,060 2015 2016 2017 2018 2019 Total Green Giant* - $ Retail Sales (2016 – Aug 2019) +14.4% +7.2% +7.0%
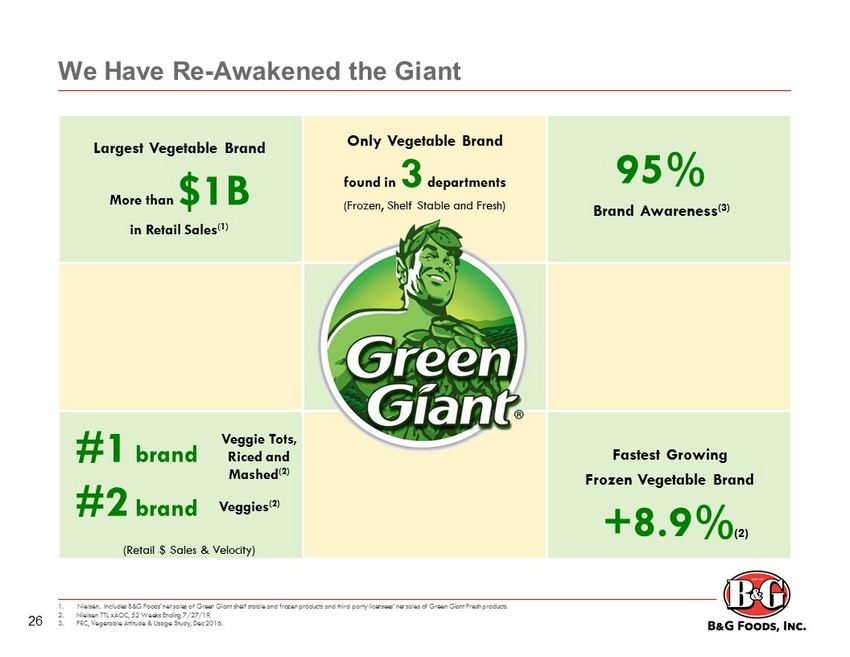
We Have Re - Awakened the Giant 1. Nielsen. Includes B&G Foods’ net sales of Green Giant shelf stable and frozen products and third party licensees’ net sales of Green Giant Fresh products. 2. Nielsen TTL xAOC , 52 Weeks Ending 7/27/19. 3. FRC, Vegetable Attitude & Usage Study, Dec 2016. 95% Brand Awareness (3) Largest Vegetable Brand More than $1B in Retail Sales (1) #1 brand #2 brand Veggie Tots, Riced and Mashed (2) Veggies (2) (Retail $ Sales & Velocity) Only Vegetable Brand found in 3 departments (Frozen, Shelf Stable and Fresh) Fastest Growing Frozen Vegetable Brand +8.9% (2) 26

Green Giant Innovation Drives Growth 27 Launched in 2018 $ 110mm $ 170mm $ 61mm $ 56mm $ 13mm $ 4mm $ 5mm $ 7mm Note: Represents sales at retail per Nielsen TTL xAOC , 52 Weeks Ending 7/27/19 Planned for in 2019 Innovation Renovation Over $423mm in Retail Sales Since Launch!

New Packaging! To be the leader in plant based snacks; new packaging and innovation coming in 2020 Back to Nature’s Restage 28

Additional Innovation Planned Throughout the Portfolio 29 Mama Mary’s Restage ▪ New: Premium Line of Cucina Di Casa Pizza Crust, Kits & Sauces Mrs. Dash Restage ▪ Re - introduce Mrs. Dash to core consumer and increase household penetration Enhance Brand Refresh Endorse Dieticians Engage Baby Boomers Joy Bauer, MS, RDN Ortega Restage ▪ Reinvent shelf stable Mexican Squeezable Bottles! Convenient Kits! New, Healthier Ingredients! New Packaging

Additional Levers for Planned Growth 30 ▪ Club ▪ Away from home ▪ E - Commerce ▪ Optimize logistics network ▪ Optimize manufacturing network ▪ Rationalize product and packages ▪ Optimize net pricing ▪ Leverage SG&A ▪ Branded food products with defensible market positions ▪ Acquire “like” products to facilitate sales, distribution and G&A synergies ▪ Cash flow driven M&A strategy focused on acquiring brands at accretive multiples Invest in Underdeveloped Channels Improve Margins Acquire and Integrate Businesses

RECENT PERFORMANCE

B&G Foods Has Had an Extended Period of Steady Growth Since IPO 31 $60 $218 $322 $333 $314 $1372 $1646 $1701 $62 $69 $94 $89 $103 $120 $131 $169 $184 $194 2004 IPO (1) 2015 2016 2017 2018 2005 2006 2007 2008 2009 2010 2011 2012 2013 2014 $373 $959 $837 $725 $634 $544 $513 $501 $487 $471 $411 $379 Net Sales Adj. EBITDA Note: 2014 - 2017 net sales have been adjusted as a result of a new FASB revenue recognition standard that we adopted in fiscal 2018 and reclassified marketing development funds (MDF) as a reduction of net sales, with a comparable reduction in SG&A and no impact to net income or adjusted EBITDA. 2004 – 2013 net sales have not been a djusted to reflect the new FASB revenue recognition standard. Adjusted EBITDA does not include add - back for share - based compensation. 1. B&G Foods’ IPO was completed in October 2004. Financial Performance ($mm)

We Doubled in Size From 2014 to 2018 Net Sales ($mm) Note: 2014 net sales have been adjusted as a result of a new FASB revenue recognition standard that we adopted in fiscal 2018 an d reclassified MDF as a reduction of net sales, with a comparable reduction in SG&A and no change to net income or adjusted EBITDA. Total Enterprise Value represents market capitalization plus long - term d ebt minus cash and cash equivalents. $837 20 14 20 18 x Increased net sales by $864 million x Increased adj. EBITDA by $120 million x Increased inventory by ~$295 million x Increased employees by ~1,700 x Added 15 manufacturing facilities, warehouses, and distribution facilities x Increased Total Enterprise Value by ~$900million Spices & Seasonings Brands 32 $1701

Growth Slowed, But Business Has Remained Resilient 33 Financial Performance ($mm) $322 2016 $1372 Note: 2016 and 2017 net sales have been adjusted as a result of a new FASB revenue recognition standard that we adopted in fi sca l 2018 and reclassified marketing development funds (MDF) as a reduction of net sales, with a comparable reduction in SG&A and no impact to net income or adjus ted EBITDA. 2017 2018 $333 $314 23.5% 20.2% 18.5% $1646 $1701 Net Sales Adj. EBITDA % Adj. EBITDA Margin × Grew net sales but margins declined × Increased inventory ~ $150 million in 2017 Reduced inventory ~ $100 million in 2018 × Unprecedented industry - wide freight inflation × Input cost and wage inflation × Sale of Pirate Brands in October 2018 negatively impacted Adj. EBITDA by ~$7 million in 2018 Generated $209.4 million in net cash provided by operating activities in 2018 – second highest in Company history Financial Performance ($mm)

20 18 20 19E $1665 - $1700 $1700 ($ in millions) Recent Initiatives Should Continue to Improve Performance ▪ Appointed first outside CEO in recent years ▪ Enhanced leadership structure & people ▪ Implemented price increases in 2018 and 2019 ▪ Initiated a comprehensive cost savings program ▪ Completed successful divestiture of Pirate Brands ▪ Reduced long - term debt by $415mm from YE 2017 to Q2 2019 ▪ Significantly reduced interest expense ▪ Acquired Clabber Girl 34 Divestiture of Acquisition of Net Sales ($mm) Note: 2018 net sales includes approximately $74.9 million in net sales generated by Pirate Brands which was sold on 10/17/201 8. 2019 net sales guidance includes approximately $8 million in net sales generated in the second quarter and $30 to 35 million in net sales expected to be generated in the third and fourth quarters of 2019 by Clabber Girl which was acquired on 5/15/2019.

#1 Baking Powder #2 Baking Soda #2 Corn Starch 35 Clabber Girl: A Perfect Fit

FINANCIAL UPDATE

$363 Q2 2018 Q2 2019 Net Sales Adj. EBITDA less CapEx Adj. Gross Profit (1) Adj. EBITDA ($ in millions) ($ in millions) ($ in millions) ($ in millions) ▪ B&G Foods generated net sales of $371.2 million for Q2 2019, a decrease of ($17 million), compared to Q2 2018 ▪ The decrease was primarily attributable to the Pirate Brands divestiture which represented $25.2 million in net sales, offset in part by the McCann’s and Clabber Girl acquisitions ▪ Base business net sales relatively flat (decreased 0.5%) ▪ Adjusted EBITDA margin remained strong at 19.1% of net sales ▪ B&G Foods experienced strong net sales performance in certain brands across our portfolio, including: ▪ Green Giant increased 7.9%, Maple Grove Farms increased 4.1% and New York Style increased 3.8% $388 $25mm Net Sales from Pirate Brands $101 $97 26.1% 26.0% Q2 2018 Q2 2019 $67 7 0 19.2% 19.1% Q2 2018 Q2 2019 Q2 2018 vs. Q2 2019 Performance $371 $57 $53 76.9% 74.4% Q2 2018 Q2 2019 % Margin % Margin Note: Adjusted EBITDA does not include add - back for share - based compensation. 1. Adjusted to exclude the negative impact of acquisition/divestiture - related and non - recurring expenses (which include expenses re lated to our inventory reduction plan) during the second quarters of 2019 and 2018 of $4.9 million and $20.1 million, respectively. Gross profit for the second quarters of 2019 and 201 8 was 24.7% and 20.9%, respectively. Includes $8mm and $2mm of Net Sales from Clabber Girl and McCann’s, respectively 36 ~$7mm contribution from Pirate Brands $74 $71 Adj. EBITDA less CapEx / Adj. EBITDA

$1,626 FY 2018 FY 2019E Net Sales Adj. EBITDA less CapEx Adj. EBITDA $1,665 - $1,700 ($ in millions) Note: FY 2019E bars represent the midpoint of previously stated guidance. We completed the Pirate Brands sale on October 17, 201 8. Adjusted EBITDA does not include add - back for share based compensation. FY 2018 vs. FY 2019E Performance ($ in millions) ($ in millions) ▪ B&G Foods expects steady performance for full year fiscal 2019, while being on track through the first 6 months of 2019 and i nli ne with our full year guidance ▪ Adjusted EBITDA margin expected to remain strong at ~18.5% of net sales and up year - over - year after adjusting for the divestitur e of Pirate Brands $1,701 $294 20 0 18.5% 18.6% FY 2018 FY 2019E $273 86.8% 84.8% FY 2018 FY 2019E $305 - $320 $255 - $275 % Margin $75mm Net Sales from Pirate Brands 37 $314 ~$20mm contribution from Pirate Brands Adj. EBITDA less CapEx / Adj. EBITDA

38 Note: Figures based on the midpoint of our previously stated fiscal 2019 guidance for adjusted EBTIDA of $305.0 to $320.0 mil lio n. 1. Our divestiture of Pirate Brands during the fourth quarter of 2018 resulted in a gain on sale during 2018. The gain on sale n ega tively impacted our income taxes for 2019. This negative impact is excluded from the calculation of cash taxes set forth in the table above. Excess Cash Generation Model ($ in millions) Projected 2019 Adjusted EBITDA $305-$320 % Margin 18.6% (+) Share-Based Compensation Expense 4 Adjusted EBITDA (before share-based compensation) $309-$324 (-) Cash Interest Expense (88) (-) Cash Taxes (1) 0 - (5) (-) Capital Expenditures (45) - (50) $166-$191 (-) Cash Dividends (125) $41-$66

APPENDIX
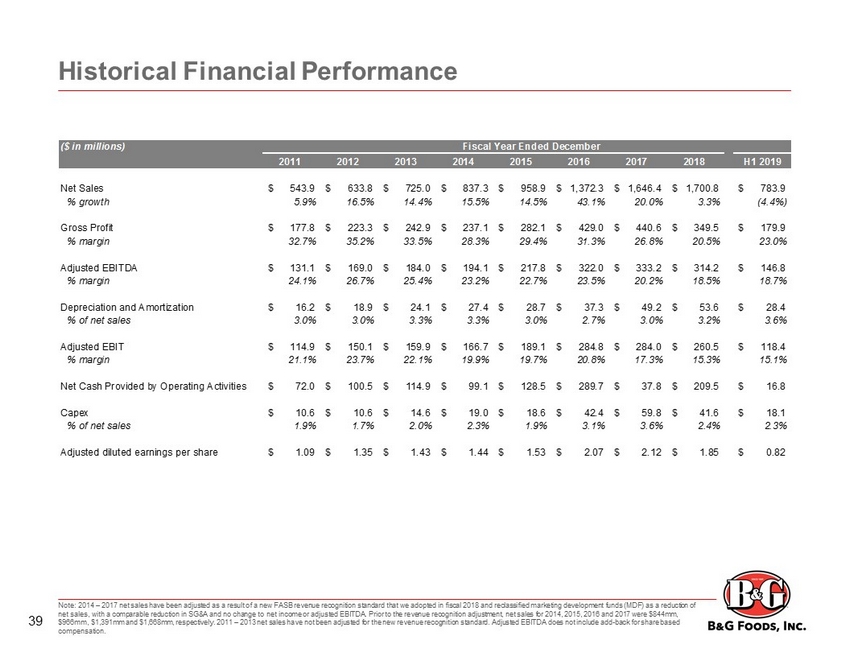
Historical Financial Performance Note: 2014 – 2017 net sales have been adjusted as a result of a new FASB revenue recognition standard that we adopted in fiscal 2018 and reclassified marketing development funds (MDF) as a reduction of net sales, with a comparable reduction in SG&A and no change to net income or adjusted EBITDA. Prior to the revenue recognit ion adjustment, net sales for 2014, 2015, 2016 and 2017 were $844mm, $966mm, $1,391mm and $1,668mm, respectively. 2011 – 2013 net sales have not been adjusted for the new revenue recognition standa rd. Adjusted EBITDA does not include add - back for share based compensation. ($ in millions) Fiscal Year Ended December 2011 2012 2013 2014 2015 2016 2017 2018 H1 2019 Net Sales 543.9$ 633.8$ 725.0$ 837.3$ 958.9$ 1,372.3$ 1,646.4$ 1,700.8$ 783.9$ % growth 5.9% 16.5% 14.4% 15.5% 14.5% 43.1% 20.0% 3.3% (4.4%) Gross Profit 177.8$ 223.3$ 242.9$ 237.1$ 282.1$ 429.0$ 440.6$ 349.5$ 179.9$ % margin 32.7% 35.2% 33.5% 28.3% 29.4% 31.3% 26.8% 20.5% 23.0% Adjusted EBITDA 131.1$ 169.0$ 184.0$ 194.1$ 217.8$ 322.0$ 333.2$ 314.2$ 146.8$ % margin 24.1% 26.7% 25.4% 23.2% 22.7% 23.5% 20.2% 18.5% 18.7% Depreciation and Amortization 16.2$ 18.9$ 24.1$ 27.4$ 28.7$ 37.3$ 49.2$ 53.6$ 28.4$ % of net sales 3.0% 3.0% 3.3% 3.3% 3.0% 2.7% 3.0% 3.2% 3.6% Adjusted EBIT 114.9$ 150.1$ 159.9$ 166.7$ 189.1$ 284.8$ 284.0$ 260.5$ 118.4$ % margin 21.1% 23.7% 22.1% 19.9% 19.7% 20.8% 17.3% 15.3% 15.1% Net Cash Provided by Operating Activities 72.0$ 100.5$ 114.9$ 99.1$ 128.5$ 289.7$ 37.8$ 209.5$ 16.8$ Capex 10.6$ 10.6$ 14.6$ 19.0$ 18.6$ 42.4$ 59.8$ 41.6$ 18.1$ % of net sales 1.9% 1.7% 2.0% 2.3% 1.9% 3.1% 3.6% 2.4% 2.3% Adjusted diluted earnings per share 1.09$ 1.35$ 1.43$ 1.44$ 1.53$ 2.07$ 2.12$ 1.85$ 0.82$ 39

Non - GAAP Reconciliations – Net Income to EBITDA and Adjusted EBITDA 40 ($ in millions) H1 2011 2012 2013 2014 2015 2016 2017 2018 2019 Net Income 50$ 59$ 52$ 41$ 69$ 109$ 217$ 172$ 35$ Income Tax Expense (Benefit) 27 32 29 23 52 68 (69) 50 12 Interest Expense, Net 37 48 42 47 51 74 92 108 46 Depreciation and Amortization 16 19 24 27 29 37 49 54 28 Loss on Extinguishment of Debt (1) - 10 31 6 - 3 1 13 - EBITDA 130$ 168$ 178$ 144$ 201$ 292$ 290$ 397$ 122$ Acquisition / Divestiture-Related Expenses 1 1 6 7 6 18 36 27 9 Impairment of Intangible Assets - - - 34 - 5 - - - Inventory Reduction Plan Impact (2) - - - - - - - 66 16 Loss on Disposal of Inventory - - - 5 - 1 3 - - Loss on Product Recall, Net of Insurance Recovery - - - 13 2 - - - - Loss / (Gain) on Sale of Assets - - - - - - 2 (176) - Distribution Restructuring Expenses - - - - 3 1 - - - Amortization of Acquisition-Related Inventory Step-Up - - - - 6 5 2 - - Gain on Change in Fair Value of Contingent Consideration - - - (8) - - - - - Adjusted EBITDA 131$ 169$ 184$ 194$ 218$ 322$ 333$ 314$ 147$ Fiscal Year ___________________________ Note: Numbers in this table may not foot due to rounding. Adjusted EBITDA does not include add - back for share - based compensation . 1) Fiscal 2018 loss on extinguishment of debt includes the write - off of deferred debt financing costs and unamortized discount of $ 11.1 million and $2.0 million, respectively, relating to the prepayment of outstanding borrowings under the tranche B term loans. Fiscal 2017 loss on extinguishment of debt includes the tax impact of the change in our effective t ax rate as a result of the U.S. Tax Act, the write - off of deferred debt financing costs and unamortized discount of $0.9 million and $0.2 million, respectively, relating to the repayment of all outstanding borrowings under the tr anc he A term loans and less than $0.1 million relating to the refinancing of our tranche B term loans. Fiscal 2016 loss on extinguishment of debt includes the write - off of deferred debt financing costs of $2.2 million and the write - off of unamortized discount of $0.6 million in connection with the repayment of $40.1 million aggregate principal amount of our tranche A term loans and $109.9 million aggregate principal amount of our tranche B term loans. 2014 loss on ex tin guishment of debt includes the write - off of deferred debt financing costs of $5.4 million and the write - off of unamortized discount of $0.3 million in connection with the termination of prior credit agreement and the repayment of al l outstanding obligations thereunder . 2013 loss on extinguishment of debt includes costs relating to the repurchase of $248.5 million aggregate principal amount of 7.625% senior notes and the repayment of $222.2 million aggregate pri ncipal amount of tranche B term loans, including the repurchase premium and other expenses of $20.2 million, the write - off of deferred debt financing costs of $8.3 million and the write - off of unamortized discount of $2.8 million. 2012 loss on extinguishment of debt includes costs relating to the partial redemption of $101.5 million aggregate principal amount of 7.625% senior notes, including the repurchase premium and other expenses of $7.7 million, the w rit e - off of deferred debt financing costs of $1.5 million and the write - off of unamortized discount of $0.5 million. Loss on extinguishment during fiscal 2012 also includes costs related to the amendment and restatement of the Compan y’s credit agreement, including the write - off of deferred debt financing costs of $0.4 million, unamortized discount of $0.1 million and other expenses of $0.2 million. 2) For the first two quarters of 2019, inventory reduction plan impact of $16.4 million includes the underutilization of the Com pan y’s manufacturing facilities as the Company reduced inventory during the implementation of an inventory reduction plan. For fiscal 2018, the inventory reduction plan impact of $66.3 million includes $51.1 million of fixed manufac tur ing, warehouse and other corporate overhead costs associated with inventory purchased and converted into finished goods in fiscal 2017 and sold in fiscal 2018 and $15.2 million for the underutilization of the Company’s manufa ctu ring facilities as the Company reduced inventory during the implementation of the inventory reduction plan.

LENDER PRESENTATION 09.10.2019
Serious News for Serious Traders! Try StreetInsider.com Premium Free!
You May Also Be Interested In
- Gaming and Leisure Properties (GLPI) Appoints Debra Martin Chase to Board of Directors
- Northfield Bancorp, Inc. Announces First Quarter 2024 Results
- Renesas Announces Consolidated Forecasts
Create E-mail Alert Related Categories
SEC FilingsSign up for StreetInsider Free!
Receive full access to all new and archived articles, unlimited portfolio tracking, e-mail alerts, custom newswires and RSS feeds - and more!
