Form 8-K VERINT SYSTEMS INC For: Dec 06
UNITED STATES
SECURITIES AND EXCHANGE COMMISSION
Washington, D.C. 20549
Form 8-K
Current Report
Pursuant to Section 13 or 15(d) of the
Securities Exchange Act of 1934
Date of Report (Date of earliest event reported): December 6, 2017
Verint Systems Inc.
(Exact name of registrant as specified in its charter)
001-34807
(Commission File Number)
Delaware | 11-3200514 | |
(State or other jurisdiction of incorporation) | (I.R.S. Employer Identification No.) | |
175 Broadhollow Road, Melville, New York | 11747 | |
(Address of principal executive offices) | (Zip code) | |
(631) 962-9600
(Registrant's telephone number, including area code)
Check the appropriate box below if the Form 8-K filing is intended to simultaneously satisfy the filing obligation of the registrant under any of the following provisions (see General Instruction A.2. below):
¨ | Written communications pursuant to Rule 425 under the Securities Act (17 CFR 230.425) |
¨ | Soliciting material pursuant to Rule 14a-12 under the Exchange Act (17 CFR 240.14a-12) |
¨ | Pre-commencement communications pursuant to Rule 14d-2(b) under the Exchange Act (17 CFR 240.14d-2(b)) |
¨ | Pre-commencement communications pursuant to Rule 13e-4(c) under the Exchange Act (17 CFR 240.13e-4(c)) |
Indicate by check mark whether the registrant is an emerging growth company as defined in Rule 405 of the Securities Act of 1933 (§230.405 of this chapter) or Rule 12b-2 of the Securities Exchange Act of 1934 (§240.12b-2 of this chapter).
Emerging growth company ¨ | |
If an emerging growth company, indicate by check mark if the registrant has elected not to use the extended transition period for complying with any new or revised financial accounting standards provided pursuant to Section 13(a) of the Exchange Act. ¨
Item 7.01 Regulation FD Disclosure.
On December 6, 2017, Verint Systems Inc. disclosed presentation slides that will be used in certain investor relations presentations beginning on and after that date. Copies of the presentation slides are attached as Exhibit 99.1 hereto and incorporated by reference into this Item 7.01 in their entirety.
The presentation slides attached as Exhibit 99.1 hereto are being furnished herewith and shall not be deemed to be "filed" for purposes of Section 18 of the Securities Exchange Act of 1934, as amended.
Item 9.01. Financial Statements and Exhibits.
(d) Exhibits.
Exhibit | ||
Number | Description | |
99.1 | Presentation Slides | |
SIGNATURES
Pursuant to the requirements of the Securities Exchange Act of 1934, the registrant has duly caused this report to be signed on its behalf by the undersigned hereunto duly authorized.
VERINT SYSTEMS INC. | ||||
Date: | December 6, 2017 | |||
By: | /s/ Douglas E. Robinson | |||
Name: | Douglas E. Robinson | |||
Title: | Chief Financial Officer | |||
EXHIBIT INDEX
Exhibit | ||
Number | Description | |
© 2014 Verint Systems Inc. All Rights Reserved Worldwide.
© 2017 Verint Systems Inc. All Rights Reserved Worldwide.
December 2017
Actionable Intelligence®
© 2017 Verint Systems Inc. All Rights Reserved Worldwide.
Disclaimers
Forward Looking Statements
This presentation contains "forward-looking statements," including statements regarding expectations, predictions, views,
opportunities, plans, strategies, beliefs, and statements of similar effect relating to Verint Systems Inc. These forward-
looking statements are not guarantees of future performance and they are based on management's expectations that
involve a number of known and unknown risks, uncertainties, assumptions, and other important factors, any of which could
cause our actual results to differ materially from those expressed in or implied by the forward-looking statements. The
forward-looking statements contained in this presentation are made as of the date of this presentation and, except as
required by law, Verint assumes no obligation to update or revise them, or to provide reasons why actual results may differ.
For a more detailed discussion of how these and other risks, uncertainties, and assumptions could cause Verint’s actual
results to differ materially from those indicated in its forward-looking statements, see Verint’s prior filings with the
Securities and Exchange Commission.
Non-GAAP Financial Measures
This presentation includes financial measures which are not prepared in accordance with generally accepted accounting
principles (“GAAP”), including certain constant currency measures. For a description of these non-GAAP financial
measures, including the reasons management uses each measure, and reconciliations of these non-GAAP financial
measures to the most directly comparable financial measures prepared in accordance with GAAP, please see the
appendices to this presentation, Verint’s earnings press releases, as well as the GAAP to non-GAAP reconciliation found
under the Investor Relations tab on Verint’s website www.verint.com.
2

© 2017 Verint Systems Inc. All Rights Reserved Worldwide. 3
Crucial insights that enable decision-makers to
anticipate, respond and take action
Actionable
Intelligence
© 2017 Verint Systems Inc. All Rights Reserved Worldwide. 4
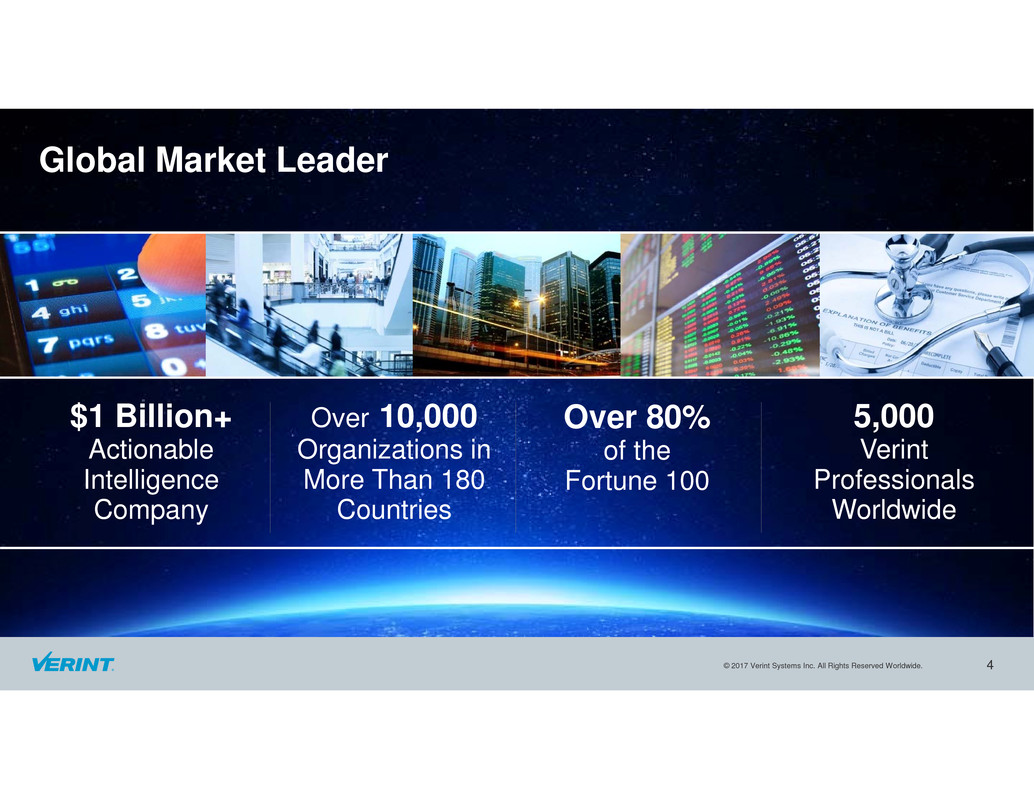
Global Market Leader
Over 10,000
Organizations in
More Than 180
Countries
$1 Billion+
Actionable
Intelligence
Company
5,000
Verint
Professionals
Worldwide
Over 80%
of the
Fortune 100
© 2017 Verint Systems Inc. All Rights Reserved Worldwide. 5
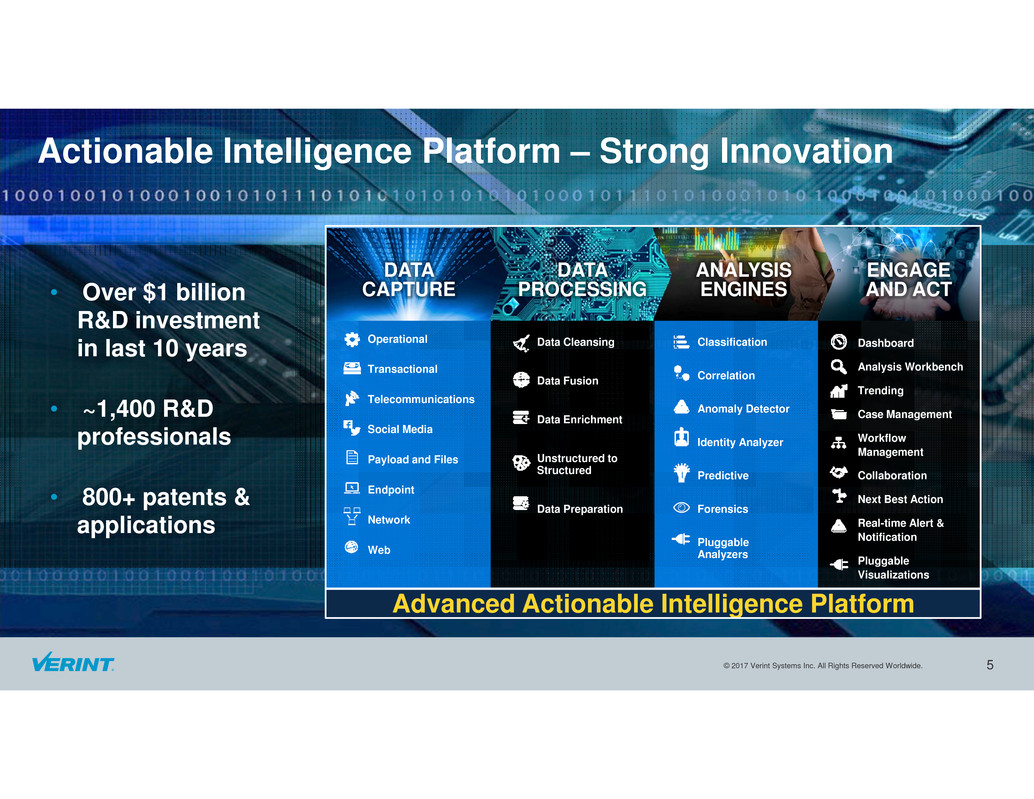
• Over $1 billion
R&D investment
in last 10 years
• ~1,400 R&D
professionals
• 800+ patents &
applications
Actionable Intelligence Platform – Strong Innovation
Classification
Correlation
Anomaly Detector
Identity Analyzer
Predictive
Forensics
Pluggable
Analyzers
Dashboard
Analysis Workbench
Trending
Case Management
Workflow
Management
Collaboration
Next Best Action
Real-time Alert &
Notification
Pluggable
Visualizations
Data Cleansing
Data Fusion
Data Enrichment
Unstructured to
Structured
Data Preparation
Operational
Transactional
Telecommunications
Social Media
Payload and Files
Endpoint
Network
Web
Advanced Actionable Intelligence Platform
ANALYSIS
ENGINES
ENGAGE
AND ACT
DATA
PROCESSING
DATA
CAPTURE
© 2017 Verint Systems Inc. All Rights Reserved Worldwide.
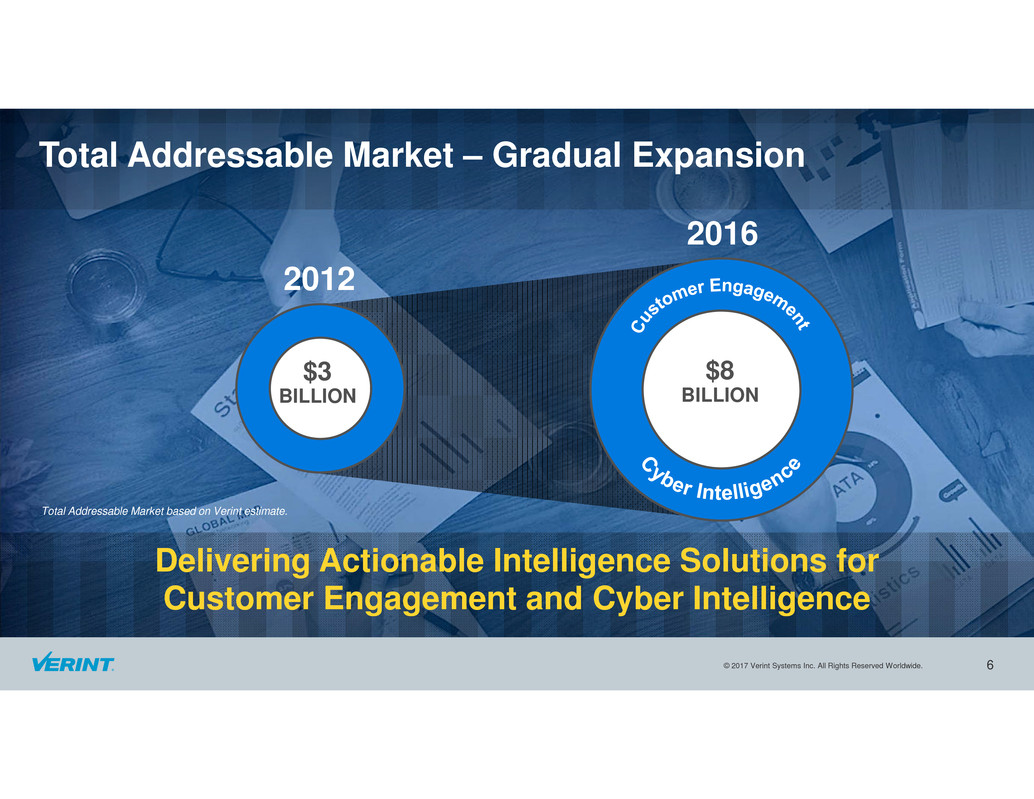
Total Addressable Market – Gradual Expansion
Delivering Actionable Intelligence Solutions for
Customer Engagement and Cyber Intelligence
Total Addressable Market based on Verint estimate.
$3
BILLION
2012
2016
$8
BILLION
6
© 2017 Verint Systems Inc. All Rights Reserved Worldwide.
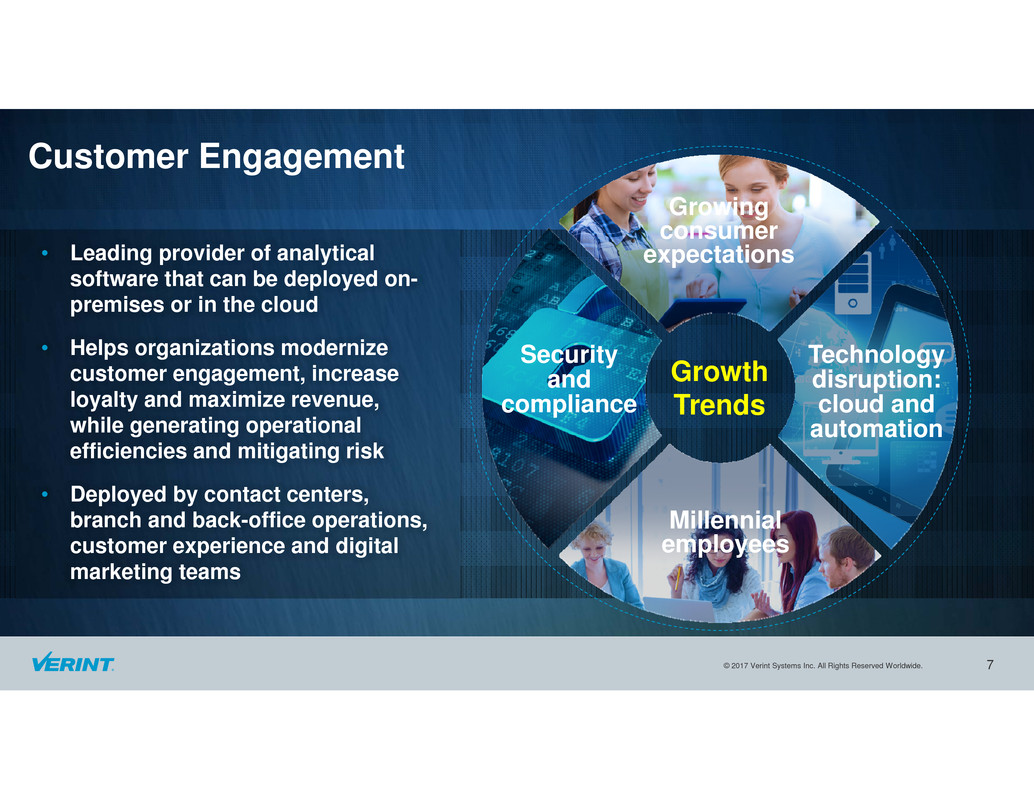
Customer Engagement
Growth
Trends
• Leading provider of analytical
software that can be deployed on-
premises or in the cloud
• Helps organizations modernize
customer engagement, increase
loyalty and maximize revenue,
while generating operational
efficiencies and mitigating risk
• Deployed by contact centers,
branch and back-office operations,
customer experience and digital
marketing teams
Security
and
compliance
Growing
consumer
expectations
Technology
disruption:
cloud and
automation
Millennial
employees
7
© 2017 Verint Systems Inc. All Rights Reserved Worldwide.
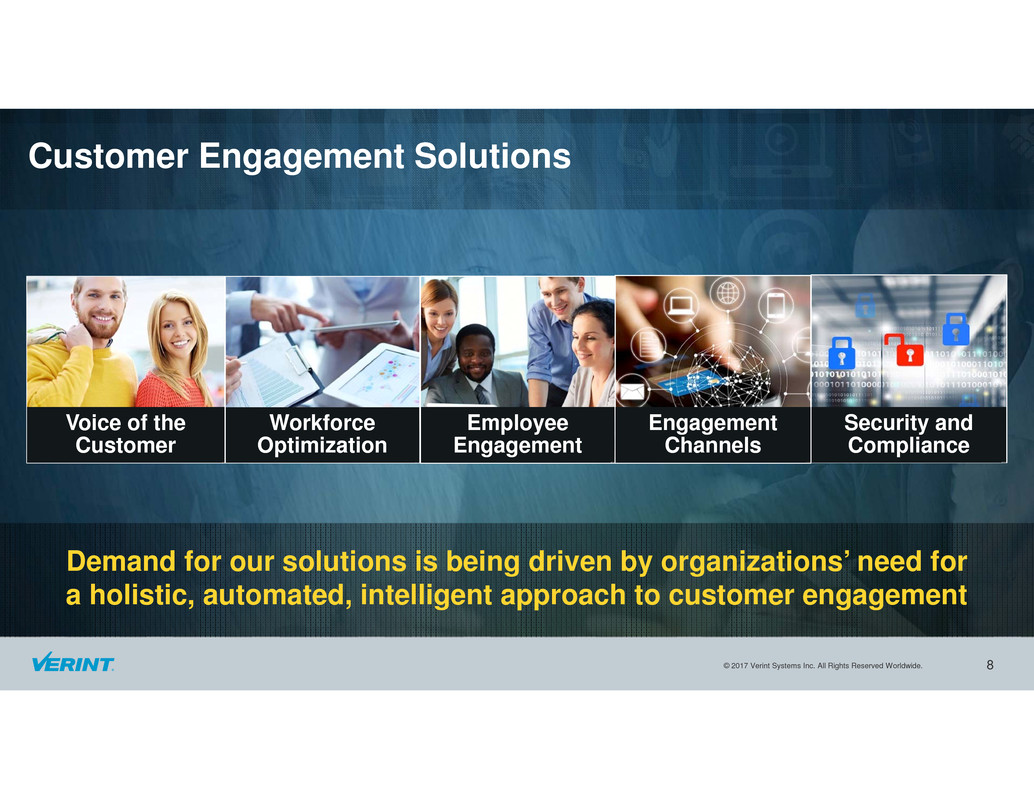
Demand for our solutions is being driven by organizations’ need for
a holistic, automated, intelligent approach to customer engagement
Customer Engagement Solutions
Workforce
Optimization
Security and
Compliance
Engagement
Channels
Employee
Engagement
Voice of the
Customer
8
© 2017 Verint Systems Inc. All Rights Reserved Worldwide.
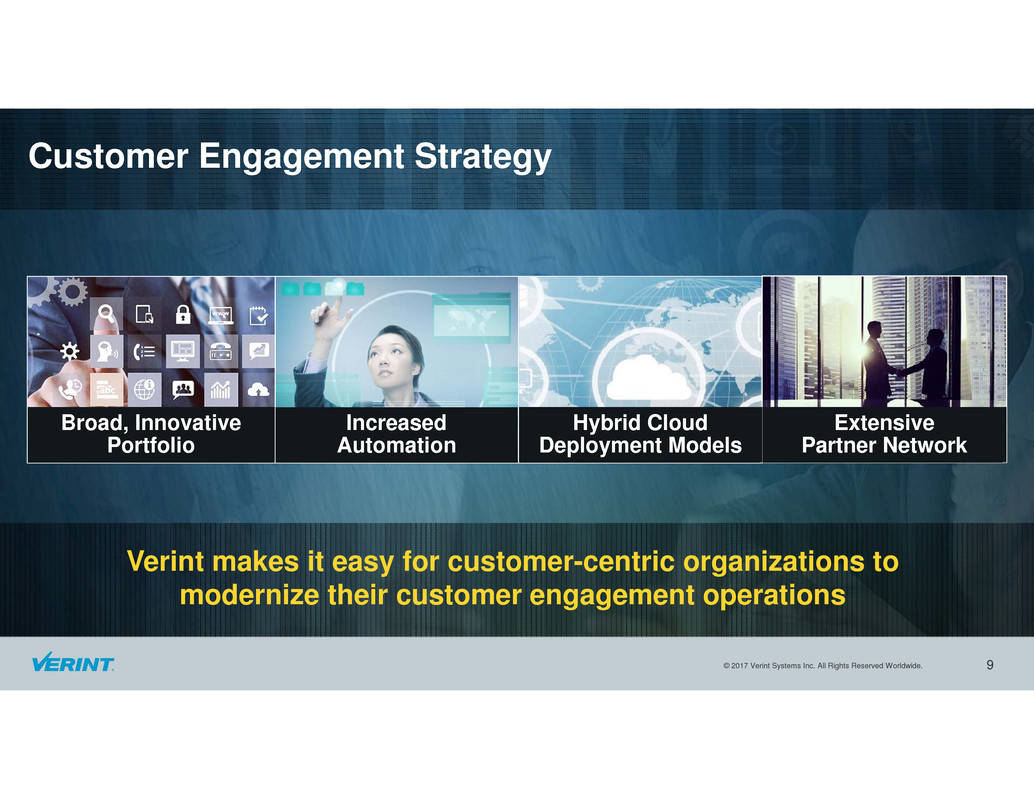
Verint makes it easy for customer-centric organizations to
modernize their customer engagement operations
Customer Engagement Strategy
Increased
Automation
Extensive
Partner Network
Hybrid Cloud
Deployment Models
Broad, Innovative
Portfolio
9
© 2017 Verint Systems Inc. All Rights Reserved Worldwide.
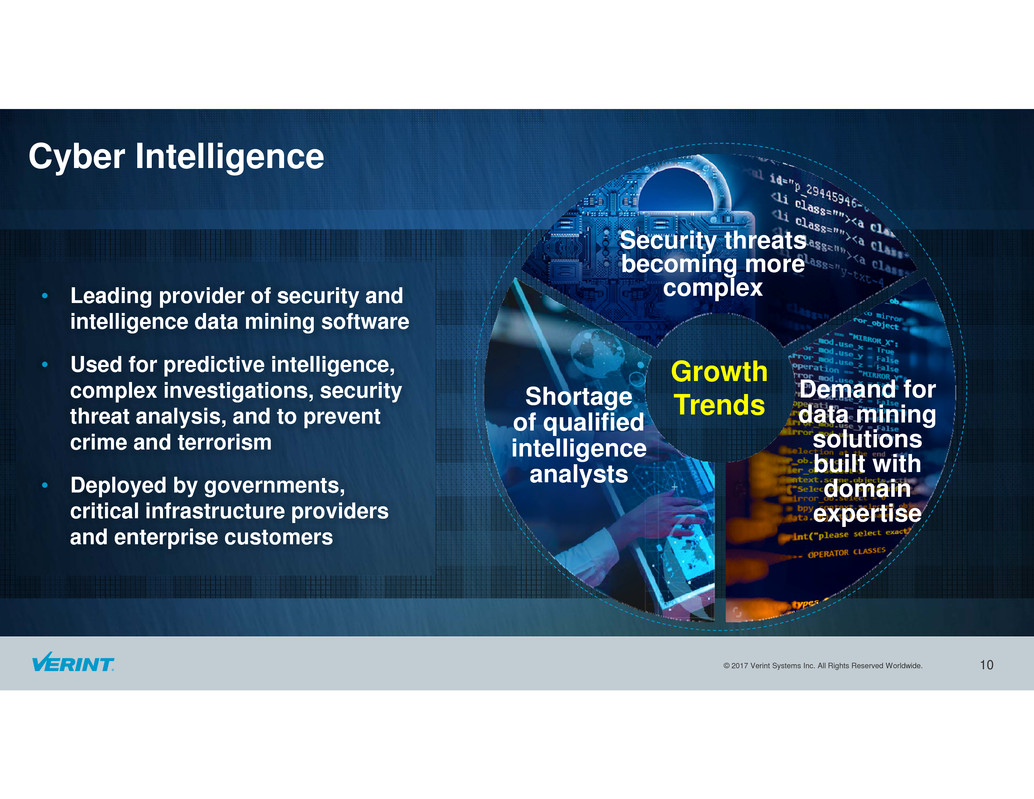
• Leading provider of security and
intelligence data mining software
• Used for predictive intelligence,
complex investigations, security
threat analysis, and to prevent
crime and terrorism
• Deployed by governments,
critical infrastructure providers
and enterprise customers
Cyber Intelligence
Growth
Trends
Security threats
becoming more
complex
Demand for
data mining
solutions
built with
domain
expertise
Shortage
of qualified
intelligence
analysts
10

© 2017 Verint Systems Inc. All Rights Reserved Worldwide.
Broad portfolio of data mining solutions addresses a wide
range of security and intelligence challenges
Cyber Intelligence Solutions
National Security Law Enforcement Cyber Security
Critical Infrastructure Enterprise Security Border Control
11
© 2017 Verint Systems Inc. All Rights Reserved Worldwide.
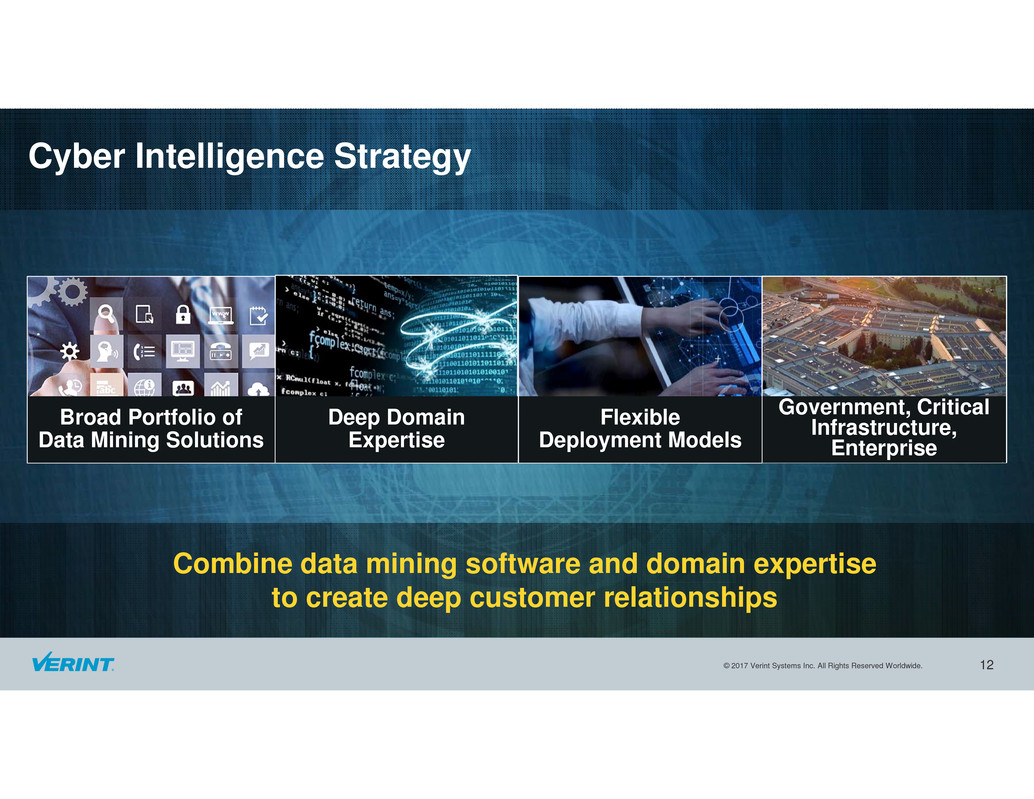
Combine data mining software and domain expertise
to create deep customer relationships
Cyber Intelligence Strategy
Deep Domain
Expertise
Government, Critical
Infrastructure,
Enterprise
Flexible
Deployment Models
Broad Portfolio of
Data Mining Solutions
12
© 2017 Verint Systems Inc. All Rights Reserved Worldwide.
Financial Highlights
13
© 2017 Verint Systems Inc. All Rights Reserved Worldwide. 14
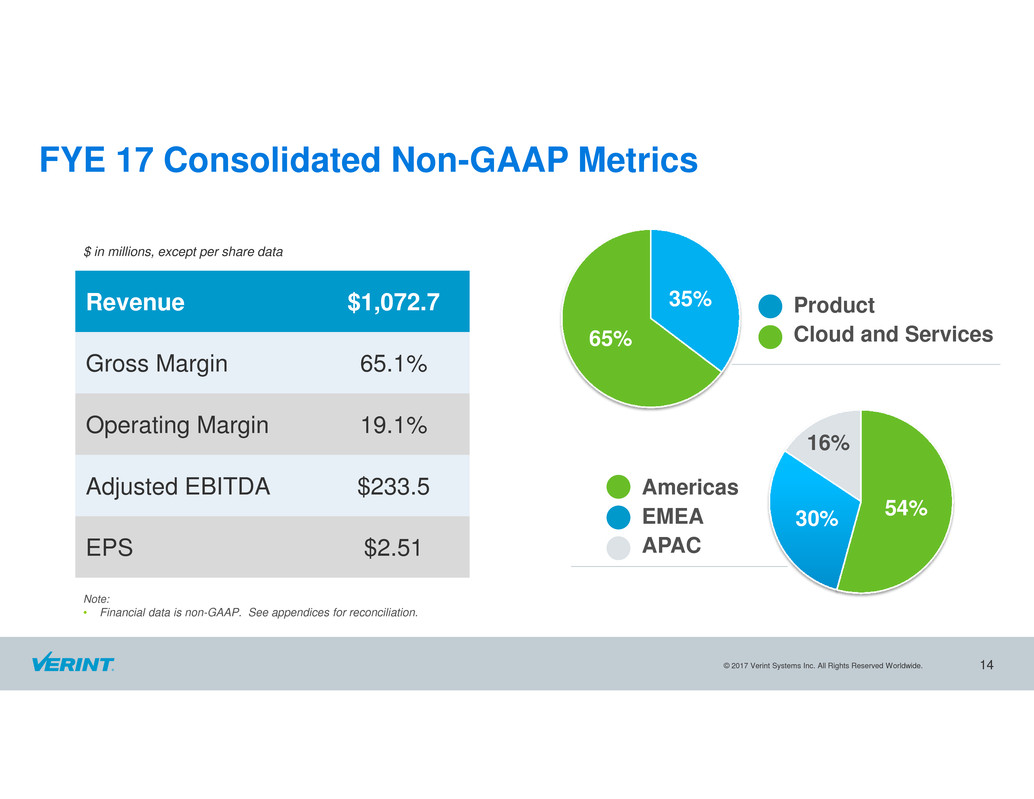
Revenue $1,072.7
Gross Margin 65.1%
Operating Margin 19.1%
Adjusted EBITDA $233.5
EPS $2.51
FYE 17 Consolidated Non-GAAP Metrics
35%
65%
54%30%
16%
Americas
EMEA
APAC
Product
Cloud and Services
$ in millions, except per share data
Note:
• Financial data is non-GAAP. See appendices for reconciliation.
© 2017 Verint Systems Inc. All Rights Reserved Worldwide. 15
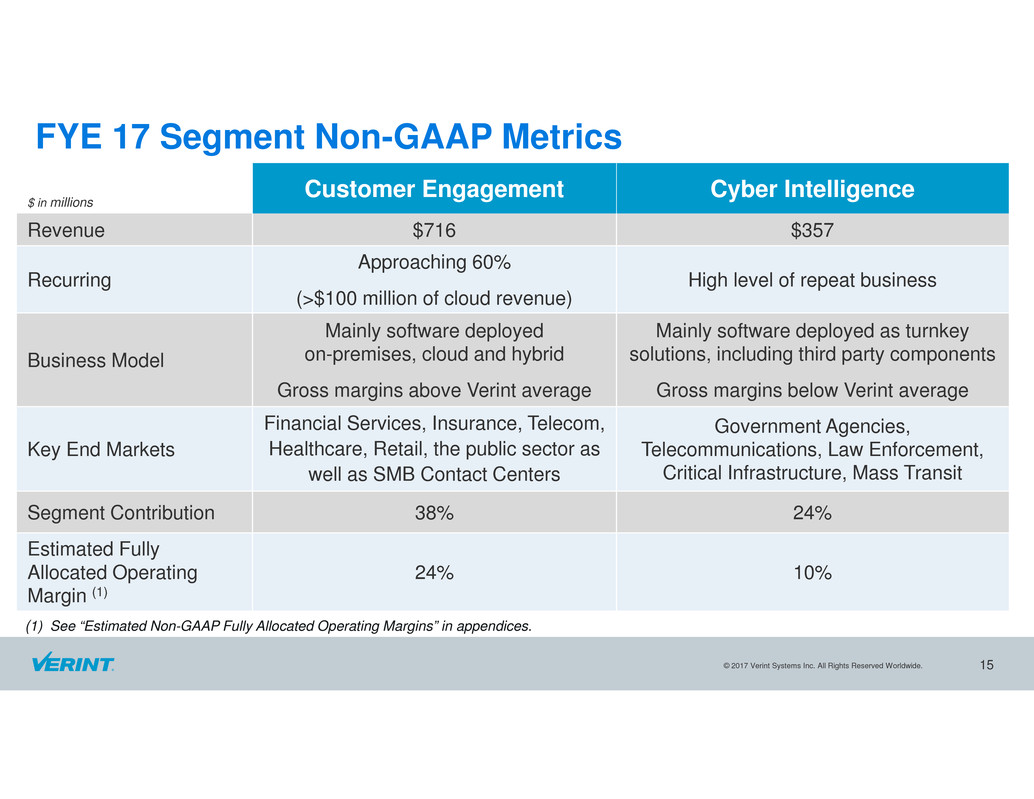
FYE 17 Segment Non-GAAP Metrics
$ in millions
Customer Engagement Cyber Intelligence
Revenue $716 $357
Recurring
Approaching 60%
(>$100 million of cloud revenue)
High level of repeat business
Business Model
Mainly software deployed
on-premises, cloud and hybrid
Gross margins above Verint average
Mainly software deployed as turnkey
solutions, including third party components
Gross margins below Verint average
Key End Markets
Financial Services, Insurance, Telecom,
Healthcare, Retail, the public sector as
well as SMB Contact Centers
Government Agencies,
Telecommunications, Law Enforcement,
Critical Infrastructure, Mass Transit
Segment Contribution 38% 24%
Estimated Fully
Allocated Operating
Margin (1)
24% 10%
(1) See “Estimated Non-GAAP Fully Allocated Operating Margins” in appendices.
© 2017 Verint Systems Inc. All Rights Reserved Worldwide. 16
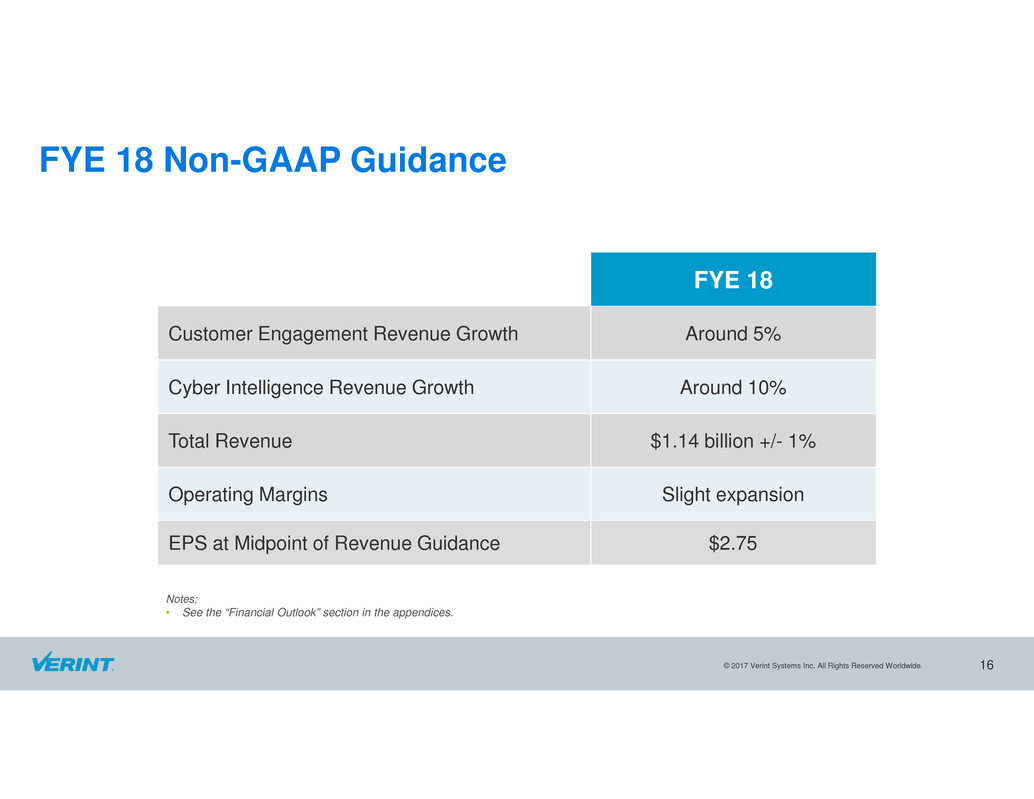
FYE 18 Non-GAAP Guidance
FYE 18
Customer Engagement Revenue Growth Around 5%
Cyber Intelligence Revenue Growth Around 10%
Total Revenue $1.14 billion +/- 1%
Operating Margins Slight expansion
EPS at Midpoint of Revenue Guidance $2.75
Notes:
• See the “Financial Outlook” section in the appendices.
© 2017 Verint Systems Inc. All Rights Reserved Worldwide. 17
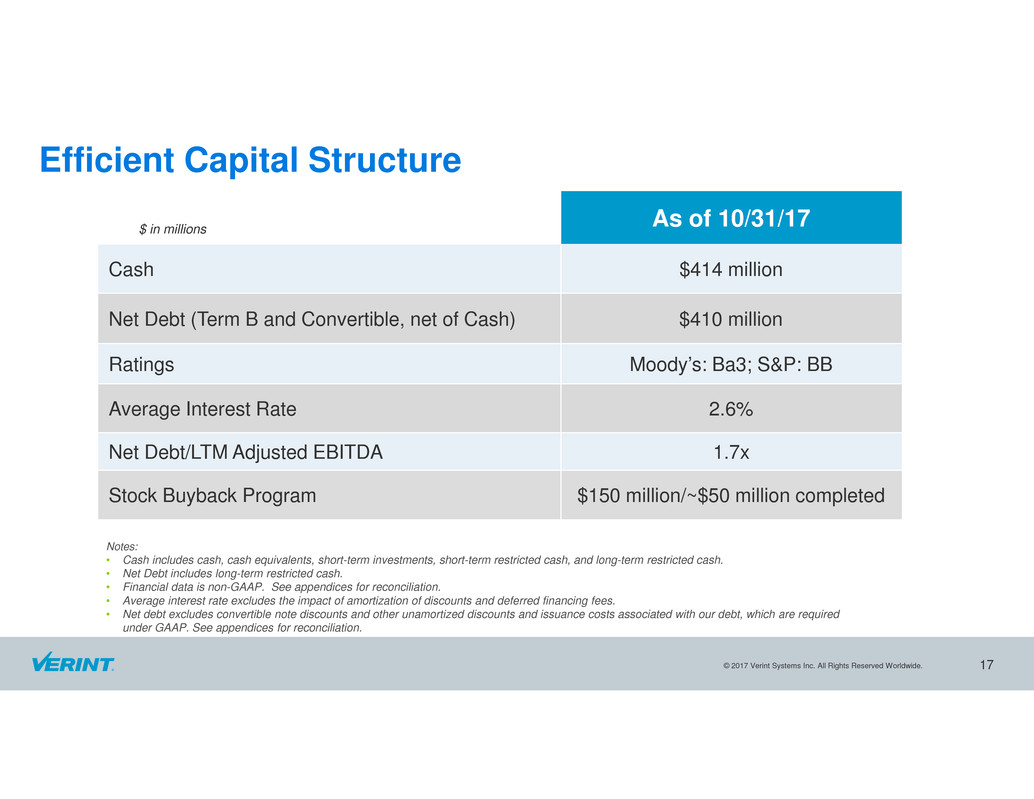
Efficient Capital Structure
As of 10/31/17
Cash $414 million
Net Debt (Term B and Convertible, net of Cash) $410 million
Ratings Moody’s: Ba3; S&P: BB
Average Interest Rate 2.6%
Net Debt/LTM Adjusted EBITDA 1.7x
Stock Buyback Program $150 million/~$50 million completed
Notes:
• Cash includes cash, cash equivalents, short-term investments, short-term restricted cash, and long-term restricted cash.
• Net Debt includes long-term restricted cash.
• Financial data is non-GAAP. See appendices for reconciliation.
• Average interest rate excludes the impact of amortization of discounts and deferred financing fees.
• Net debt excludes convertible note discounts and other unamortized discounts and issuance costs associated with our debt, which are required
under GAAP. See appendices for reconciliation.
$ in millions
© 2017 Verint Systems Inc. All Rights Reserved Worldwide.
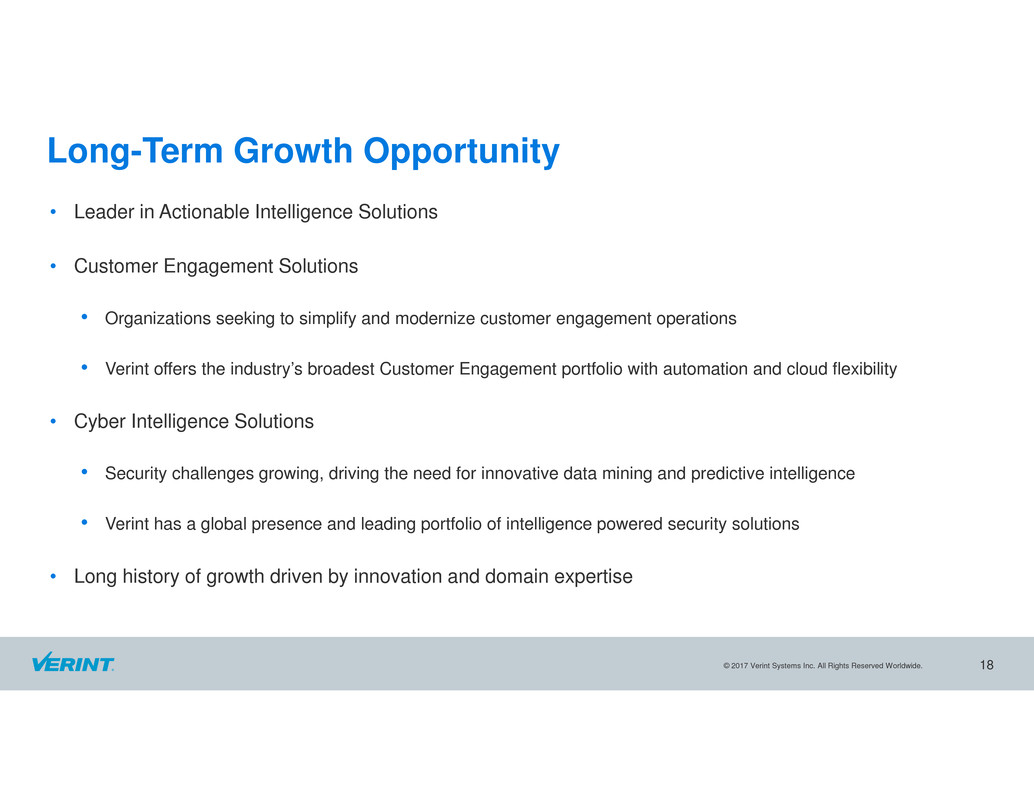
Long-Term Growth Opportunity
• Leader in Actionable Intelligence Solutions
• Customer Engagement Solutions
• Organizations seeking to simplify and modernize customer engagement operations
• Verint offers the industry’s broadest Customer Engagement portfolio with automation and cloud flexibility
• Cyber Intelligence Solutions
• Security challenges growing, driving the need for innovative data mining and predictive intelligence
• Verint has a global presence and leading portfolio of intelligence powered security solutions
• Long history of growth driven by innovation and domain expertise
18
© 2017 Verint Systems Inc. All Rights Reserved Worldwide.
Appendices
19
© 2017 Verint Systems Inc. All Rights Reserved Worldwide.
About Non-GAAP Financial Measures
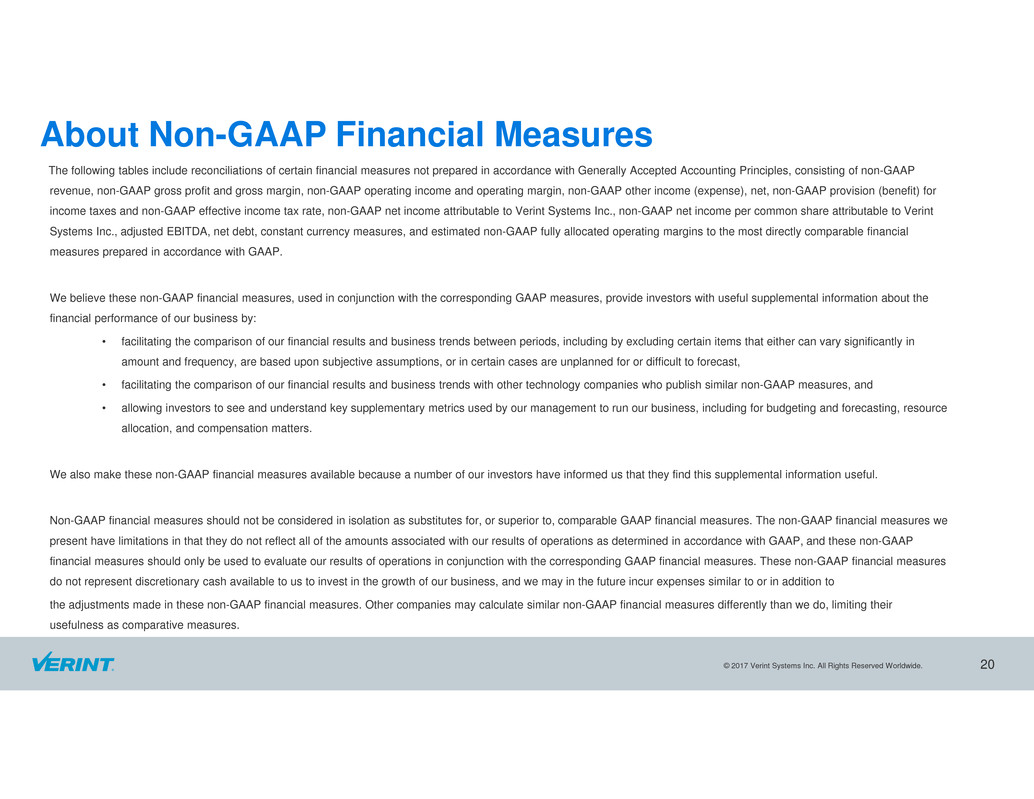
The following tables include reconciliations of certain financial measures not prepared in accordance with Generally Accepted Accounting Principles, consisting of non-GAAP
revenue, non-GAAP gross profit and gross margin, non-GAAP operating income and operating margin, non-GAAP other income (expense), net, non-GAAP provision (benefit) for
income taxes and non-GAAP effective income tax rate, non-GAAP net income attributable to Verint Systems Inc., non-GAAP net income per common share attributable to Verint
Systems Inc., adjusted EBITDA, net debt, constant currency measures, and estimated non-GAAP fully allocated operating margins to the most directly comparable financial
measures prepared in accordance with GAAP.
We believe these non-GAAP financial measures, used in conjunction with the corresponding GAAP measures, provide investors with useful supplemental information about the
financial performance of our business by:
• facilitating the comparison of our financial results and business trends between periods, including by excluding certain items that either can vary significantly in
amount and frequency, are based upon subjective assumptions, or in certain cases are unplanned for or difficult to forecast,
• facilitating the comparison of our financial results and business trends with other technology companies who publish similar non-GAAP measures, and
• allowing investors to see and understand key supplementary metrics used by our management to run our business, including for budgeting and forecasting, resource
allocation, and compensation matters.
We also make these non-GAAP financial measures available because a number of our investors have informed us that they find this supplemental information useful.
Non-GAAP financial measures should not be considered in isolation as substitutes for, or superior to, comparable GAAP financial measures. The non-GAAP financial measures we
present have limitations in that they do not reflect all of the amounts associated with our results of operations as determined in accordance with GAAP, and these non-GAAP
financial measures should only be used to evaluate our results of operations in conjunction with the corresponding GAAP financial measures. These non-GAAP financial measures
do not represent discretionary cash available to us to invest in the growth of our business, and we may in the future incur expenses similar to or in addition to
the adjustments made in these non-GAAP financial measures. Other companies may calculate similar non-GAAP financial measures differently than we do, limiting their
usefulness as comparative measures.
20
© 2017 Verint Systems Inc. All Rights Reserved Worldwide.
About Non-GAAP Financial Measures
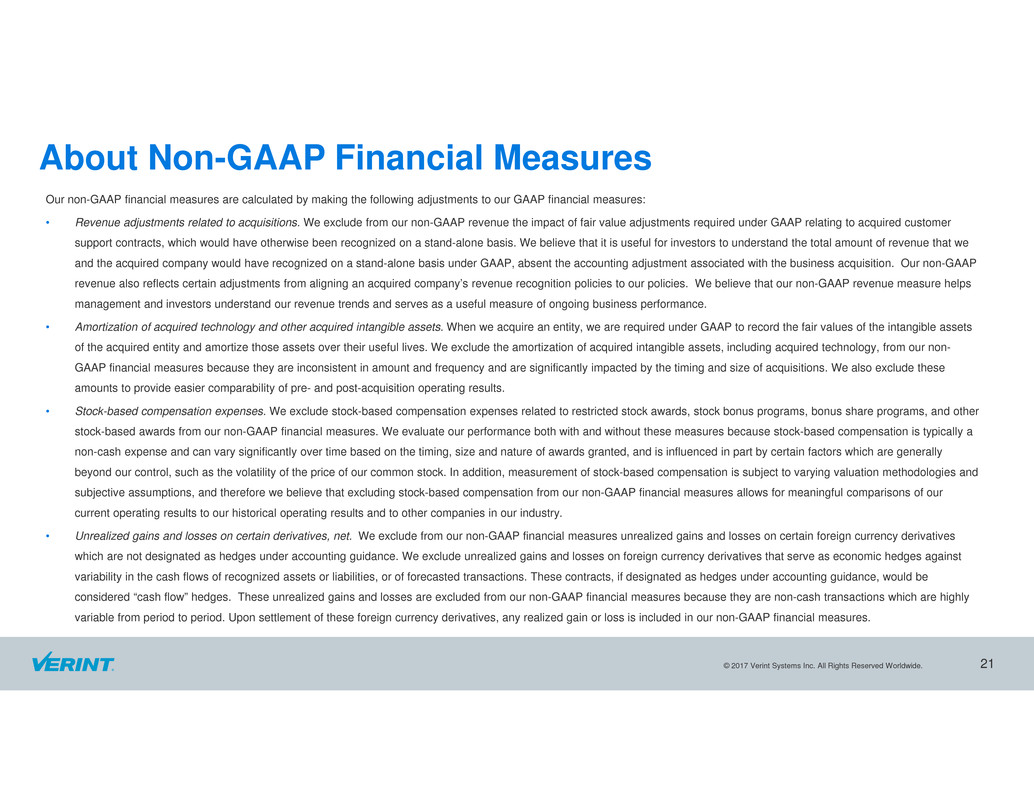
Our non-GAAP financial measures are calculated by making the following adjustments to our GAAP financial measures:
• Revenue adjustments related to acquisitions. We exclude from our non-GAAP revenue the impact of fair value adjustments required under GAAP relating to acquired customer
support contracts, which would have otherwise been recognized on a stand-alone basis. We believe that it is useful for investors to understand the total amount of revenue that we
and the acquired company would have recognized on a stand-alone basis under GAAP, absent the accounting adjustment associated with the business acquisition. Our non-GAAP
revenue also reflects certain adjustments from aligning an acquired company’s revenue recognition policies to our policies. We believe that our non-GAAP revenue measure helps
management and investors understand our revenue trends and serves as a useful measure of ongoing business performance.
• Amortization of acquired technology and other acquired intangible assets. When we acquire an entity, we are required under GAAP to record the fair values of the intangible assets
of the acquired entity and amortize those assets over their useful lives. We exclude the amortization of acquired intangible assets, including acquired technology, from our non-
GAAP financial measures because they are inconsistent in amount and frequency and are significantly impacted by the timing and size of acquisitions. We also exclude these
amounts to provide easier comparability of pre- and post-acquisition operating results.
• Stock-based compensation expenses. We exclude stock-based compensation expenses related to restricted stock awards, stock bonus programs, bonus share programs, and other
stock-based awards from our non-GAAP financial measures. We evaluate our performance both with and without these measures because stock-based compensation is typically a
non-cash expense and can vary significantly over time based on the timing, size and nature of awards granted, and is influenced in part by certain factors which are generally
beyond our control, such as the volatility of the price of our common stock. In addition, measurement of stock-based compensation is subject to varying valuation methodologies and
subjective assumptions, and therefore we believe that excluding stock-based compensation from our non-GAAP financial measures allows for meaningful comparisons of our
current operating results to our historical operating results and to other companies in our industry.
• Unrealized gains and losses on certain derivatives, net. We exclude from our non-GAAP financial measures unrealized gains and losses on certain foreign currency derivatives
which are not designated as hedges under accounting guidance. We exclude unrealized gains and losses on foreign currency derivatives that serve as economic hedges against
variability in the cash flows of recognized assets or liabilities, or of forecasted transactions. These contracts, if designated as hedges under accounting guidance, would be
considered “cash flow” hedges. These unrealized gains and losses are excluded from our non-GAAP financial measures because they are non-cash transactions which are highly
variable from period to period. Upon settlement of these foreign currency derivatives, any realized gain or loss is included in our non-GAAP financial measures.
21
© 2017 Verint Systems Inc. All Rights Reserved Worldwide.
About Non-GAAP Financial Measures
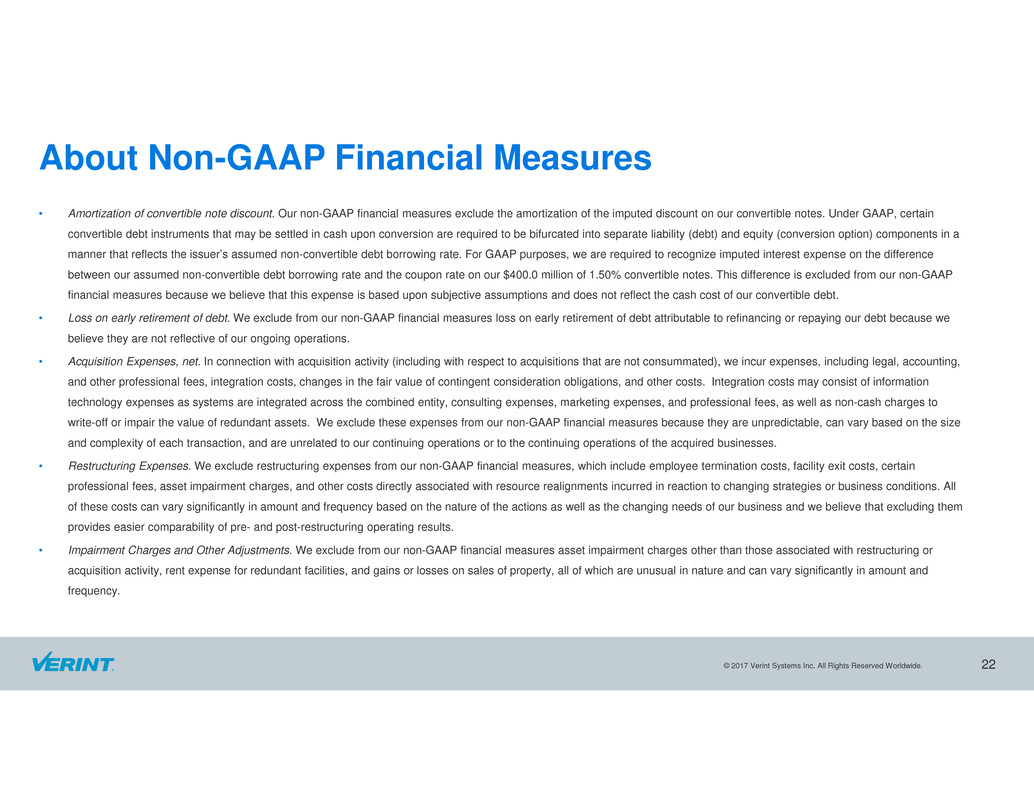
• Amortization of convertible note discount. Our non-GAAP financial measures exclude the amortization of the imputed discount on our convertible notes. Under GAAP, certain
convertible debt instruments that may be settled in cash upon conversion are required to be bifurcated into separate liability (debt) and equity (conversion option) components in a
manner that reflects the issuer’s assumed non-convertible debt borrowing rate. For GAAP purposes, we are required to recognize imputed interest expense on the difference
between our assumed non-convertible debt borrowing rate and the coupon rate on our $400.0 million of 1.50% convertible notes. This difference is excluded from our non-GAAP
financial measures because we believe that this expense is based upon subjective assumptions and does not reflect the cash cost of our convertible debt.
• Loss on early retirement of debt. We exclude from our non-GAAP financial measures loss on early retirement of debt attributable to refinancing or repaying our debt because we
believe they are not reflective of our ongoing operations.
• Acquisition Expenses, net. In connection with acquisition activity (including with respect to acquisitions that are not consummated), we incur expenses, including legal, accounting,
and other professional fees, integration costs, changes in the fair value of contingent consideration obligations, and other costs. Integration costs may consist of information
technology expenses as systems are integrated across the combined entity, consulting expenses, marketing expenses, and professional fees, as well as non-cash charges to
write-off or impair the value of redundant assets. We exclude these expenses from our non-GAAP financial measures because they are unpredictable, can vary based on the size
and complexity of each transaction, and are unrelated to our continuing operations or to the continuing operations of the acquired businesses.
• Restructuring Expenses. We exclude restructuring expenses from our non-GAAP financial measures, which include employee termination costs, facility exit costs, certain
professional fees, asset impairment charges, and other costs directly associated with resource realignments incurred in reaction to changing strategies or business conditions. All
of these costs can vary significantly in amount and frequency based on the nature of the actions as well as the changing needs of our business and we believe that excluding them
provides easier comparability of pre- and post-restructuring operating results.
• Impairment Charges and Other Adjustments. We exclude from our non-GAAP financial measures asset impairment charges other than those associated with restructuring or
acquisition activity, rent expense for redundant facilities, and gains or losses on sales of property, all of which are unusual in nature and can vary significantly in amount and
frequency.
22
© 2017 Verint Systems Inc. All Rights Reserved Worldwide.
About Non-GAAP Financial Measures
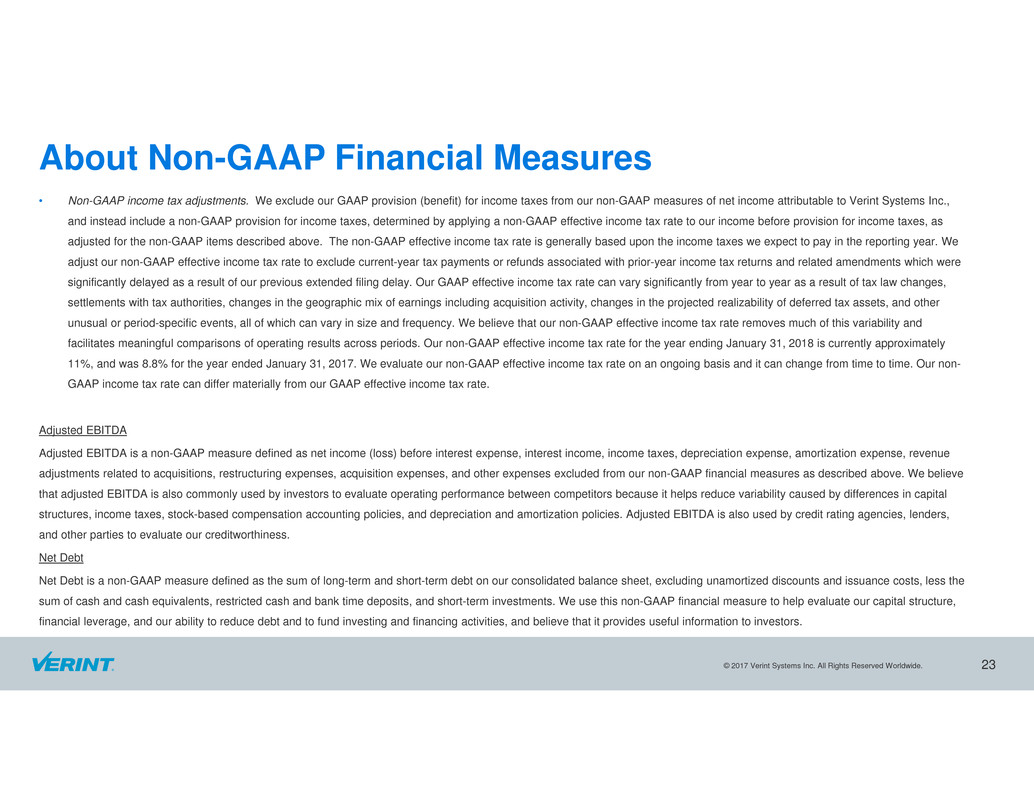
• Non-GAAP income tax adjustments. We exclude our GAAP provision (benefit) for income taxes from our non-GAAP measures of net income attributable to Verint Systems Inc.,
and instead include a non-GAAP provision for income taxes, determined by applying a non-GAAP effective income tax rate to our income before provision for income taxes, as
adjusted for the non-GAAP items described above. The non-GAAP effective income tax rate is generally based upon the income taxes we expect to pay in the reporting year. We
adjust our non-GAAP effective income tax rate to exclude current-year tax payments or refunds associated with prior-year income tax returns and related amendments which were
significantly delayed as a result of our previous extended filing delay. Our GAAP effective income tax rate can vary significantly from year to year as a result of tax law changes,
settlements with tax authorities, changes in the geographic mix of earnings including acquisition activity, changes in the projected realizability of deferred tax assets, and other
unusual or period-specific events, all of which can vary in size and frequency. We believe that our non-GAAP effective income tax rate removes much of this variability and
facilitates meaningful comparisons of operating results across periods. Our non-GAAP effective income tax rate for the year ending January 31, 2018 is currently approximately
11%, and was 8.8% for the year ended January 31, 2017. We evaluate our non-GAAP effective income tax rate on an ongoing basis and it can change from time to time. Our non-
GAAP income tax rate can differ materially from our GAAP effective income tax rate.
Adjusted EBITDA
Adjusted EBITDA is a non-GAAP measure defined as net income (loss) before interest expense, interest income, income taxes, depreciation expense, amortization expense, revenue
adjustments related to acquisitions, restructuring expenses, acquisition expenses, and other expenses excluded from our non-GAAP financial measures as described above. We believe
that adjusted EBITDA is also commonly used by investors to evaluate operating performance between competitors because it helps reduce variability caused by differences in capital
structures, income taxes, stock-based compensation accounting policies, and depreciation and amortization policies. Adjusted EBITDA is also used by credit rating agencies, lenders,
and other parties to evaluate our creditworthiness.
Net Debt
Net Debt is a non-GAAP measure defined as the sum of long-term and short-term debt on our consolidated balance sheet, excluding unamortized discounts and issuance costs, less the
sum of cash and cash equivalents, restricted cash and bank time deposits, and short-term investments. We use this non-GAAP financial measure to help evaluate our capital structure,
financial leverage, and our ability to reduce debt and to fund investing and financing activities, and believe that it provides useful information to investors.
23
© 2017 Verint Systems Inc. All Rights Reserved Worldwide.
Financial Outlook
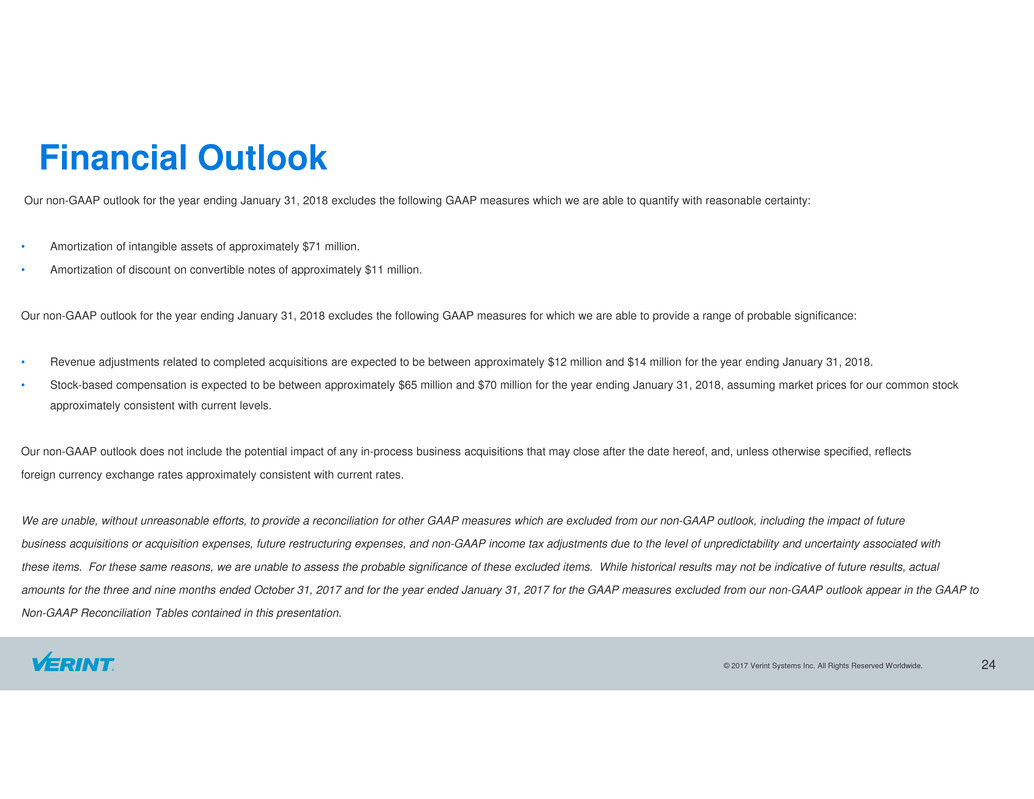
Our non-GAAP outlook for the year ending January 31, 2018 excludes the following GAAP measures which we are able to quantify with reasonable certainty:
• Amortization of intangible assets of approximately $71 million.
• Amortization of discount on convertible notes of approximately $11 million.
Our non-GAAP outlook for the year ending January 31, 2018 excludes the following GAAP measures for which we are able to provide a range of probable significance:
• Revenue adjustments related to completed acquisitions are expected to be between approximately $12 million and $14 million for the year ending January 31, 2018.
• Stock-based compensation is expected to be between approximately $65 million and $70 million for the year ending January 31, 2018, assuming market prices for our common stock
approximately consistent with current levels.
Our non-GAAP outlook does not include the potential impact of any in-process business acquisitions that may close after the date hereof, and, unless otherwise specified, reflects
foreign currency exchange rates approximately consistent with current rates.
We are unable, without unreasonable efforts, to provide a reconciliation for other GAAP measures which are excluded from our non-GAAP outlook, including the impact of future
business acquisitions or acquisition expenses, future restructuring expenses, and non-GAAP income tax adjustments due to the level of unpredictability and uncertainty associated with
these items. For these same reasons, we are unable to assess the probable significance of these excluded items. While historical results may not be indicative of future results, actual
amounts for the three and nine months ended October 31, 2017 and for the year ended January 31, 2017 for the GAAP measures excluded from our non-GAAP outlook appear in the GAAP to
Non-GAAP Reconciliation Tables contained in this presentation.
24
© 2017 Verint Systems Inc. All Rights Reserved Worldwide.
GAAP to Non-GAAP Reconciliations
25
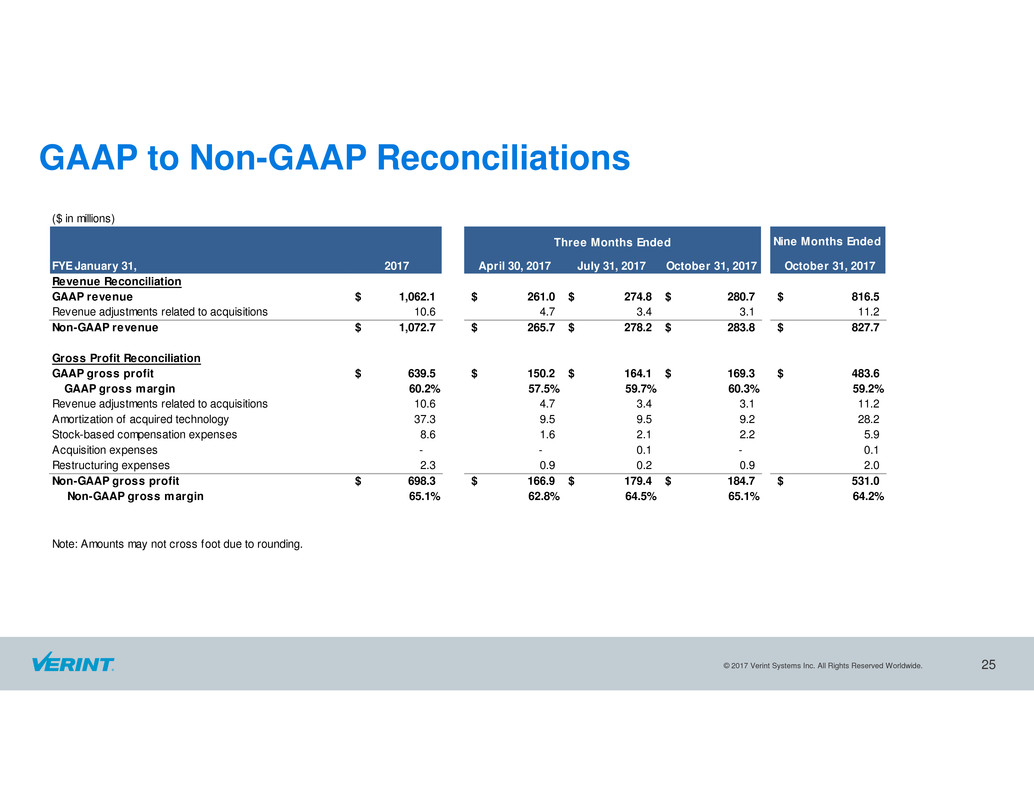
($ in millions)
Nine Months Ended
FYE January 31, 2017 April 30, 2017 July 31, 2017 October 31, 2017 October 31, 2017
Revenue Reconciliation
GAAP revenue 1,062.1$ 261.0$ 274.8$ 280.7$ 816.5$
Revenue adjustments related to acquisitions 10.6 4.7 3.4 3.1 11.2
Non-GAAP revenue 1,072.7$ 265.7$ 278.2$ 283.8$ 827.7$
Gross Profit Reconciliation
GAAP gross profit 639.5$ 150.2$ 164.1$ 169.3$ 483.6$
GAAP gross margin 60.2% 57.5% 59.7% 60.3% 59.2%
Revenue adjustments related to acquisitions 10.6 4.7 3.4 3.1 11.2
Amortization of acquired technology 37.3 9.5 9.5 9.2 28.2
Stock-based compensation expenses 8.6 1.6 2.1 2.2 5.9
Acquisition expenses - - 0.1 - 0.1
Restructuring expenses 2.3 0.9 0.2 0.9 2.0
Non-GAAP gross profit 698.3$ 166.9$ 179.4$ 184.7$ 531.0$
Non-GAAP gross margin 65.1% 62.8% 64.5% 65.1% 64.2%
Note: Amounts may not cross foot due to rounding.
Three Months Ended
© 2017 Verint Systems Inc. All Rights Reserved Worldwide.
GAAP to Non-GAAP Reconciliations
26
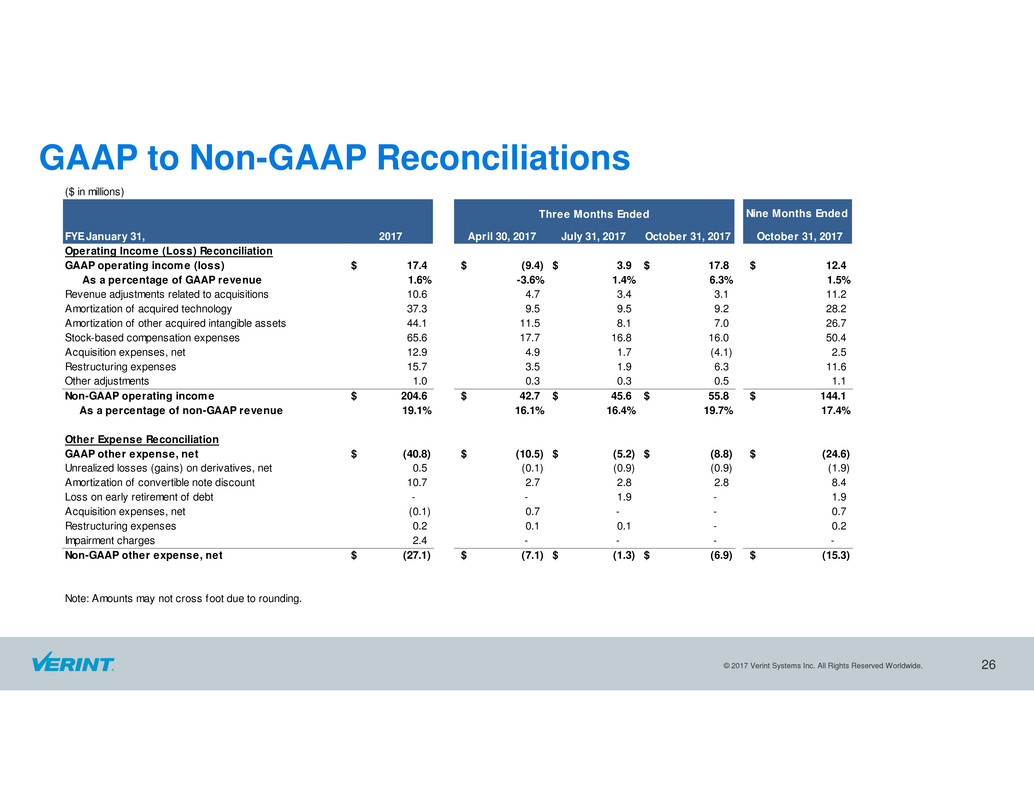
($ in millions)
Nine Months Ended
FYE January 31, 2017 April 30, 2017 July 31, 2017 October 31, 2017 October 31, 2017
Operating Income (Loss) Reconciliation
GAAP operating income (loss) 17.4$ (9.4)$ 3.9$ 17.8$ 12.4$
As a percentage of GAAP revenue 1.6% -3.6% 1.4% 6.3% 1.5%
Revenue adjustments related to acquisitions 10.6 4.7 3.4 3.1 11.2
Amortization of acquired technology 37.3 9.5 9.5 9.2 28.2
Amortization of other acquired intangible assets 44.1 11.5 8.1 7.0 26.7
Stock-based compensation expenses 65.6 17.7 16.8 16.0 50.4
Acquisition expenses, net 12.9 4.9 1.7 (4.1) 2.5
Restructuring expenses 15.7 3.5 1.9 6.3 11.6
Other adjustments 1.0 0.3 0.3 0.5 1.1
Non-GAAP operating income 204.6$ 42.7$ 45.6$ 55.8$ 144.1$
As a percentage of non-GAAP revenue 19.1% 16.1% 16.4% 19.7% 17.4%
Other Expense Reconciliation
GAAP other expense, net (40.8)$ (10.5)$ (5.2)$ (8.8)$ (24.6)$
Unrealized losses (gains) on derivatives, net 0.5 (0.1) (0.9) (0.9) (1.9)
Amortization of convertible note discount 10.7 2.7 2.8 2.8 8.4
Loss on early retirement of debt - - 1.9 - 1.9
Acquisition expenses, net (0.1) 0.7 - - 0.7
Restructuring expenses 0.2 0.1 0.1 - 0.2
Impairment charges 2.4 - - - -
Non-GAAP other expense, net (27.1)$ (7.1)$ (1.3)$ (6.9)$ (15.3)$
Note: Amounts may not cross foot due to rounding.
Three Months Ended
© 2017 Verint Systems Inc. All Rights Reserved Worldwide.
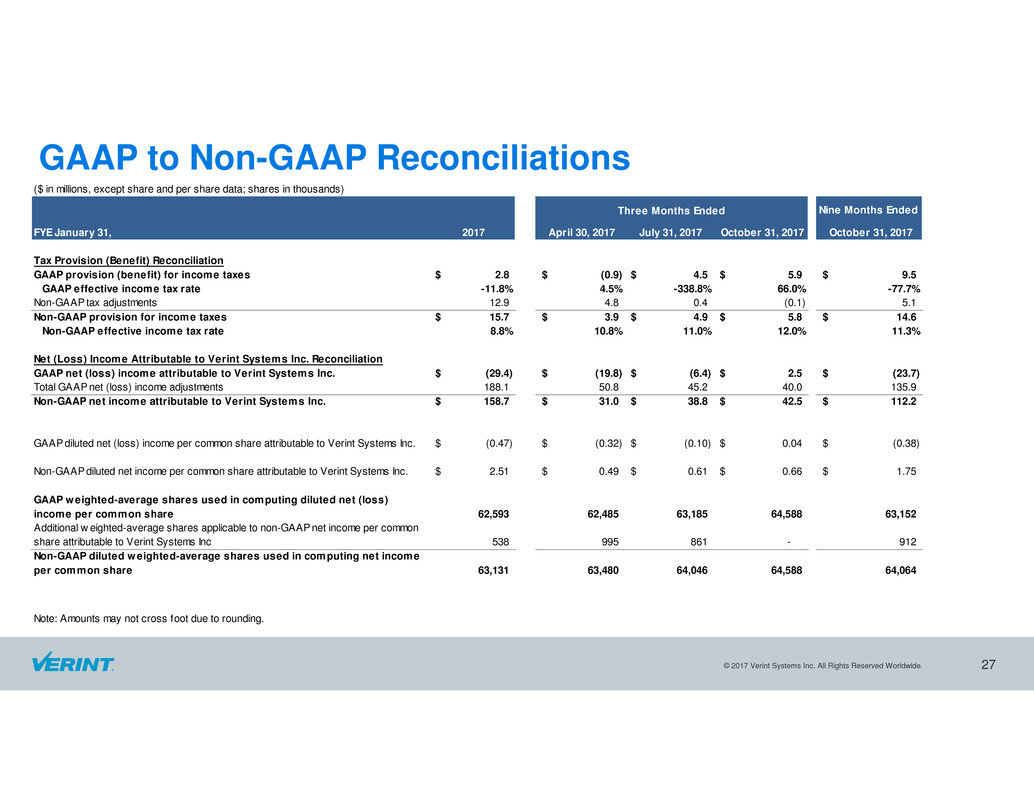
GAAP to Non-GAAP Reconciliations
27
($ in millions, except share and per share data; shares in thousands)
Nine Months Ended
FYE January 31, 2017 April 30, 2017 July 31, 2017 October 31, 2017 October 31, 2017
Tax Provision (Benefit) Reconciliation
GAAP provision (benefit) for income taxes 2.8$ (0.9)$ 4.5$ 5.9$ 9.5$
GAAP effective income tax rate -11.8% 4.5% -338.8% 66.0% -77.7%
Non-GAAP tax adjustments 12.9 4.8 0.4 (0.1) 5.1
Non-GAAP provision for income taxes 15.7$ 3.9$ 4.9$ 5.8$ 14.6$
Non-GAAP effective income tax rate 8.8% 10.8% 11.0% 12.0% 11.3%
Net (Loss) Income Attributable to Verint Systems Inc. Reconciliation
GAAP net (loss) income attributable to Verint Systems Inc. (29.4)$ (19.8)$ (6.4)$ 2.5$ (23.7)$
Total GAAP net (loss) income adjustments 188.1 50.8 45.2 40.0 135.9
Non-GAAP net income attributable to Verint Systems Inc. 158.7$ 31.0$ 38.8$ 42.5$ 112.2$
GAAP diluted net (loss) income per common share attributable to Verint Systems Inc. (0.47)$ (0.32)$ (0.10)$ 0.04$ (0.38)$
Non-GAAP diluted net income per common share attributable to Verint Systems Inc. 2.51$ 0.49$ 0.61$ 0.66$ 1.75$
GAAP weighted-average shares used in computing diluted net (loss)
income per common share 62,593 62,485 63,185 64,588 63,152
Additional w eighted-average shares applicable to non-GAAP net income per common
share attributable to Verint Systems Inc 538 995 861 - 912
Non-GAAP diluted weighted-average shares used in computing net income
per common share 63,131 63,480 64,046 64,588 64,064
Note: Amounts may not cross foot due to rounding.
Three Months Ended
© 2017 Verint Systems Inc. All Rights Reserved Worldwide.
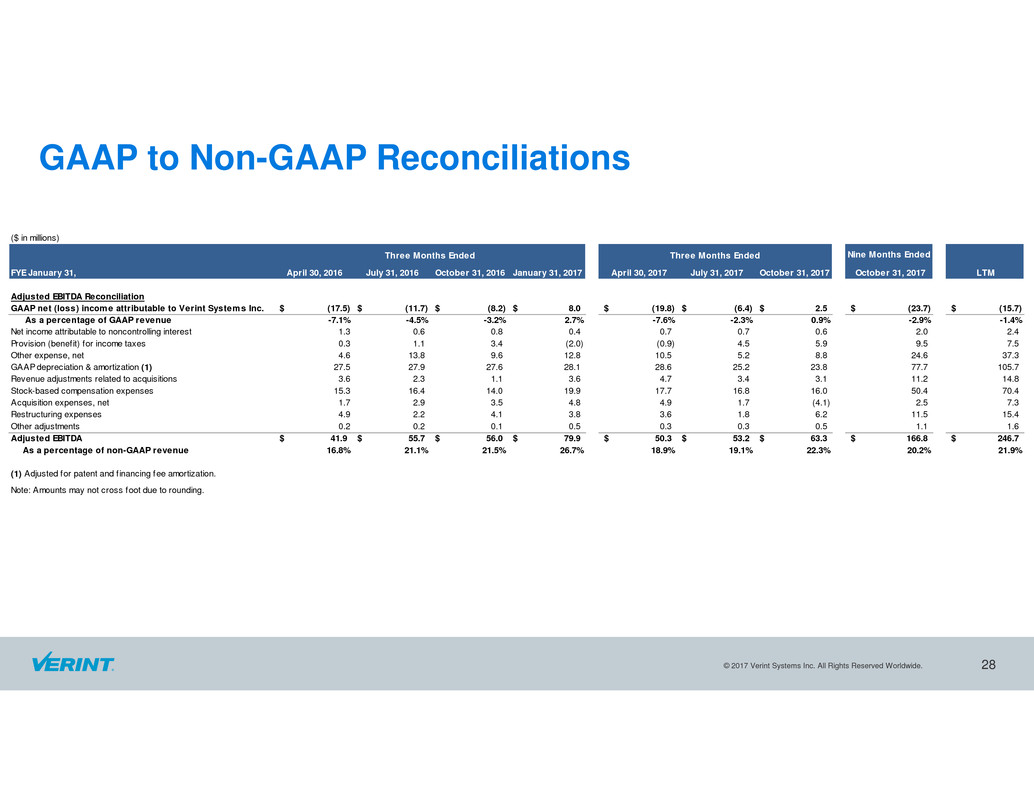
GAAP to Non-GAAP Reconciliations
28
($ in millions)
Nine Months Ended
FYE January 31, April 30, 2016 July 31, 2016 October 31, 2016 January 31, 2017 April 30, 2017 July 31, 2017 October 31, 2017 October 31, 2017 LTM
Adjusted EBITDA Reconciliation
GAAP net (loss) income attributable to Verint Systems Inc. (17.5)$ (11.7)$ (8.2)$ 8.0$ (19.8)$ (6.4)$ 2.5$ (23.7)$ (15.7)$
As a percentage of GAAP revenue -7.1% -4.5% -3.2% 2.7% -7.6% -2.3% 0.9% -2.9% -1.4%
Net income attributable to noncontrolling interest 1.3 0.6 0.8 0.4 0.7 0.7 0.6 2.0 2.4
Provision (benefit) for income taxes 0.3 1.1 3.4 (2.0) (0.9) 4.5 5.9 9.5 7.5
Other expense, net 4.6 13.8 9.6 12.8 10.5 5.2 8.8 24.6 37.3
GAAP depreciation & amortization (1) 27.5 27.9 27.6 28.1 28.6 25.2 23.8 77.7 105.7
Revenue adjustments related to acquisitions 3.6 2.3 1.1 3.6 4.7 3.4 3.1 11.2 14.8
Stock-based compensation expenses 15.3 16.4 14.0 19.9 17.7 16.8 16.0 50.4 70.4
Acquisition expenses, net 1.7 2.9 3.5 4.8 4.9 1.7 (4.1) 2.5 7.3
Restructuring expenses 4.9 2.2 4.1 3.8 3.6 1.8 6.2 11.5 15.4
Other adjustments 0.2 0.2 0.1 0.5 0.3 0.3 0.5 1.1 1.6
Adjusted EBITDA 41.9$ 55.7$ 56.0$ 79.9$ 50.3$ 53.2$ 63.3$ 166.8$ 246.7$
As a percentage of non-GAAP revenue 16.8% 21.1% 21.5% 26.7% 18.9% 19.1% 22.3% 20.2% 21.9%
(1) Adjusted for patent and f inancing fee amortization.
Note: Amounts may not cross foot due to rounding.
Three Months EndedThree Months Ended
© 2017 Verint Systems Inc. All Rights Reserved Worldwide.
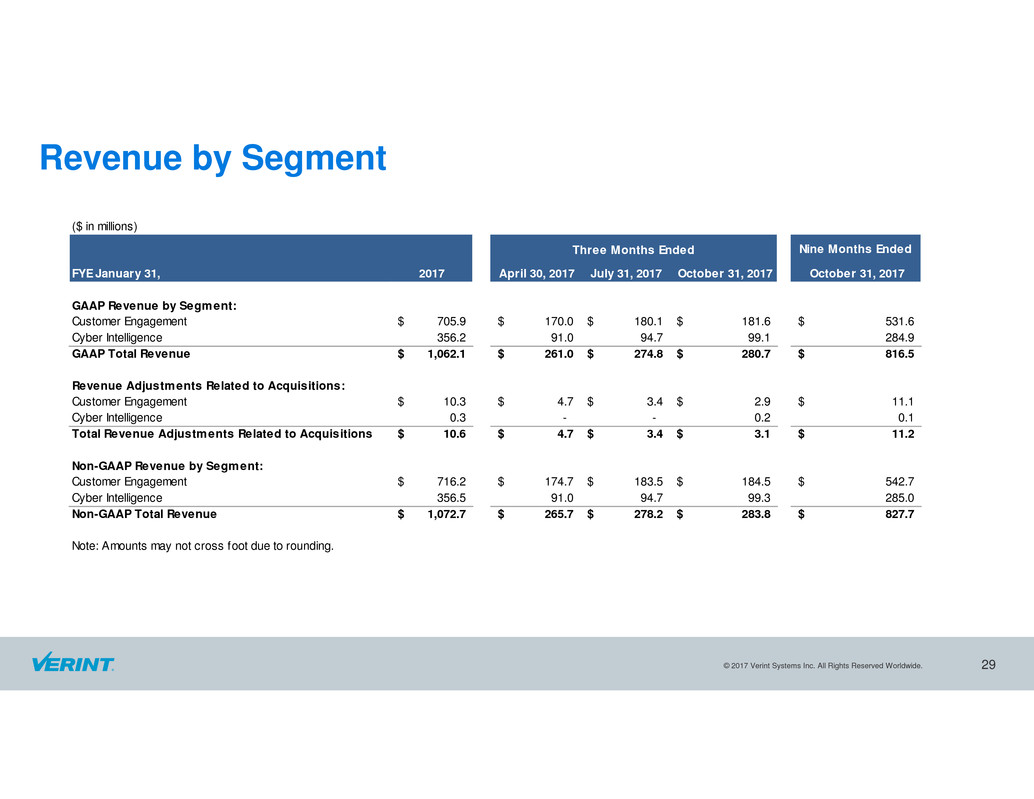
Revenue by Segment
29
($ in millions)
Nine Months Ended
FYE January 31, 2017 April 30, 2017 July 31, 2017 October 31, 2017 October 31, 2017
GAAP Revenue by Segment:
Customer Engagement 705.9$ 170.0$ 180.1$ 181.6$ 531.6$
Cyber Intelligence 356.2 91.0 94.7 99.1 284.9
GAAP Total Revenue 1,062.1$ 261.0$ 274.8$ 280.7$ 816.5$
Revenue Adjustments Related to Acquisitions:
Customer Engagement 10.3$ 4.7$ 3.4$ 2.9$ 11.1$
Cyber Intelligence 0.3 - - 0.2 0.1
Total Revenue Adjustments Related to Acquisitions 10.6$ 4.7$ 3.4$ 3.1$ 11.2$
Non-GAAP Revenue by Segment:
Customer Engagement 716.2$ 174.7$ 183.5$ 184.5$ 542.7$
Cyber Intelligence 356.5 91.0 94.7 99.3 285.0
Non-GAAP Total Revenue 1,072.7$ 265.7$ 278.2$ 283.8$ 827.7$
Note: Amounts may not cross foot due to rounding.
Three Months Ended
© 2017 Verint Systems Inc. All Rights Reserved Worldwide.
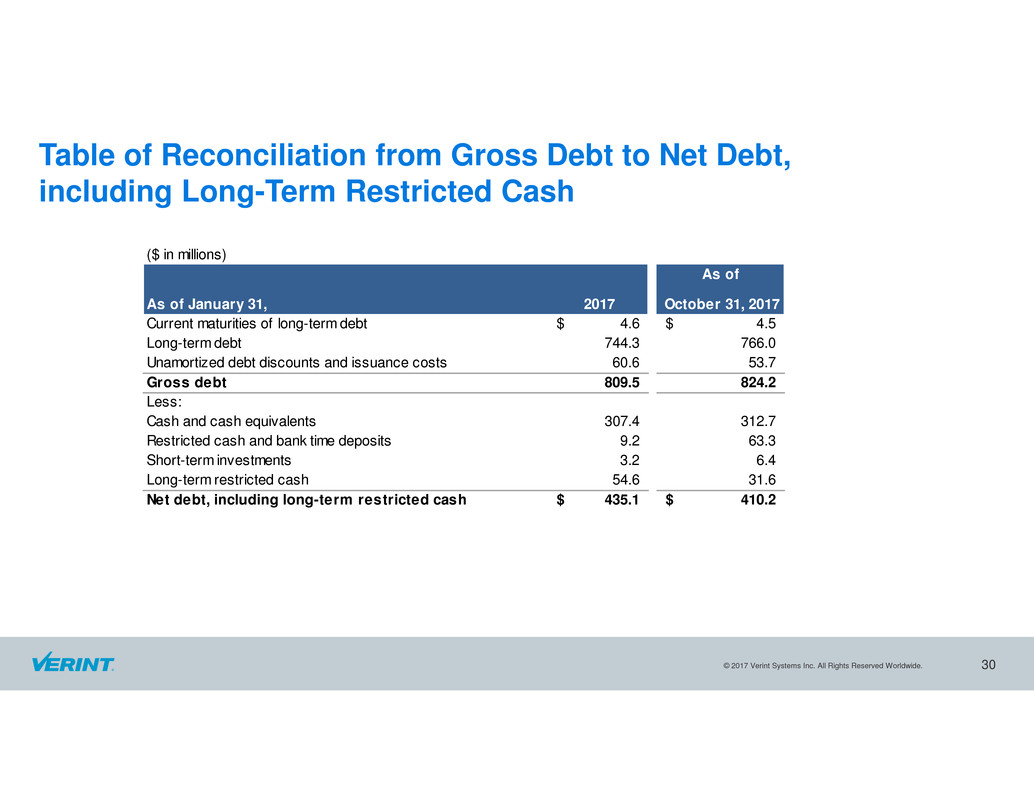
Table of Reconciliation from Gross Debt to Net Debt,
including Long-Term Restricted Cash
30
($ in millions)
As of
As of January 31, 2017 October 31, 2017
Current maturities of long-term debt 4.6$ 4.5$
Long-term debt 744.3 766.0
Unamortized debt discounts and issuance costs 60.6 53.7
Gross debt 809.5 824.2
Less:
Cash and cash equivalents 307.4 312.7
Restricted cash and bank time deposits 9.2 63.3
Short-term investments 3.2 6.4
Long-term restricted cash 54.6 31.6
Net debt, including long-term restricted cash 435.1$ 410.2$
© 2017 Verint Systems Inc. All Rights Reserved Worldwide.
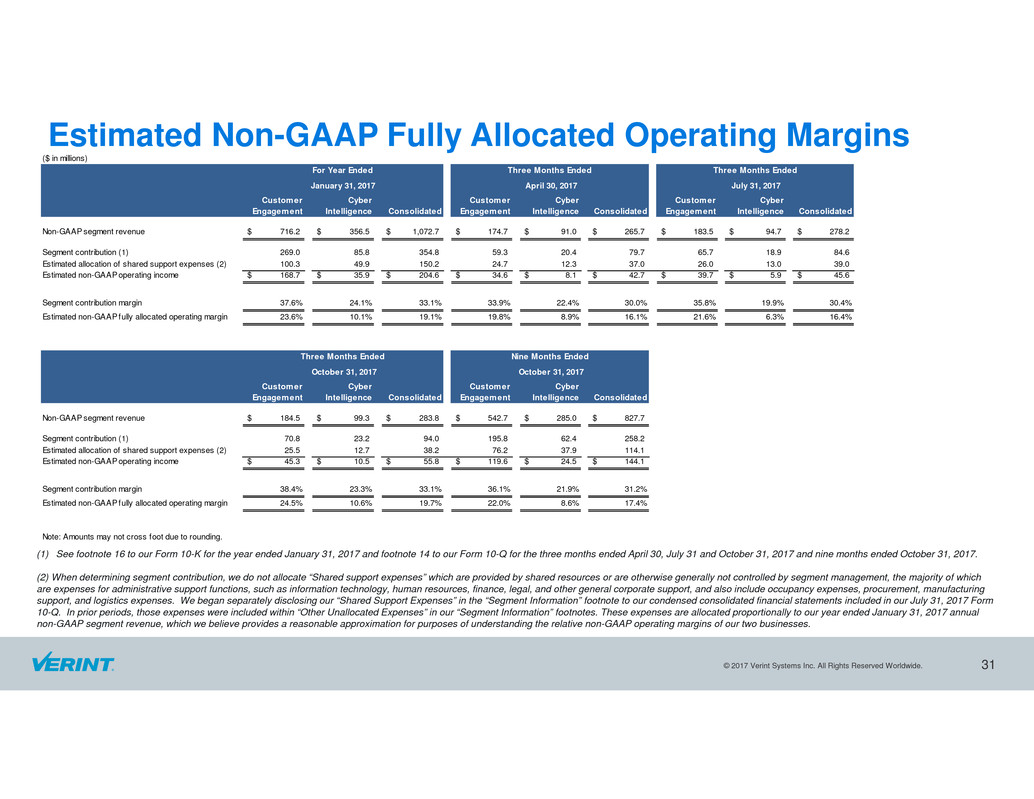
Estimated Non-GAAP Fully Allocated Operating Margins
31
(1) See footnote 16 to our Form 10-K for the year ended January 31, 2017 and footnote 14 to our Form 10-Q for the three months ended April 30, July 31 and October 31, 2017 and nine months ended October 31, 2017.
(2) When determining segment contribution, we do not allocate “Shared support expenses” which are provided by shared resources or are otherwise generally not controlled by segment management, the majority of which
are expenses for administrative support functions, such as information technology, human resources, finance, legal, and other general corporate support, and also include occupancy expenses, procurement, manufacturing
support, and logistics expenses. We began separately disclosing our “Shared Support Expenses” in the “Segment Information” footnote to our condensed consolidated financial statements included in our July 31, 2017 Form
10-Q. In prior periods, those expenses were included within “Other Unallocated Expenses” in our “Segment Information” footnotes. These expenses are allocated proportionally to our year ended January 31, 2017 annual
non-GAAP segment revenue, which we believe provides a reasonable approximation for purposes of understanding the relative non-GAAP operating margins of our two businesses.
($ in millions)
Customer
Engagement
Cyber
Intelligence Consolidated
Customer
Engagement
Cyber
Intelligence Consolidated
Customer
Engagement
Cyber
Intelligence Consolidated
Non-GAAP segment revenue 716.2$ 356.5$ 1,072.7$ 174.7$ 91.0$ 265.7$ 183.5$ 94.7$ 278.2$
Segment contribution (1) 269.0 85.8 354.8 59.3 20.4 79.7 65.7 18.9 84.6
Estimated allocation of shared support expenses (2) 100.3 49.9 150.2 24.7 12.3 37.0 26.0 13.0 39.0
Estimated non-GAAP operating income 168.7$ 35.9$ 204.6$ 34.6$ 8.1$ 42.7$ 39.7$ 5.9$ 45.6$
Segment contribution margin 37.6% 24.1% 33.1% 33.9% 22.4% 30.0% 35.8% 19.9% 30.4%
Estimated non-GAAP fully allocated operating margin 23.6% 10.1% 19.1% 19.8% 8.9% 16.1% 21.6% 6.3% 16.4%
Customer
Engagement
Cyber
Intelligence Consolidated
Customer
Engagement
Cyber
Intelligence Consolidated
Non-GAAP segment revenue 184.5$ 99.3$ 283.8$ 542.7$ 285.0$ 827.7$
Segment contribution (1) 70.8 23.2 94.0 195.8 62.4 258.2
Estimated allocation of shared support expenses (2) 25.5 12.7 38.2 76.2 37.9 114.1
Estimated non-GAAP operating income 45.3$ 10.5$ 55.8$ 119.6$ 24.5$ 144.1$
Segment contribution margin 38.4% 23.3% 33.1% 36.1% 21.9% 31.2%
Estimated non-GAAP fully allocated operating margin 24.5% 10.6% 19.7% 22.0% 8.6% 17.4%
Nine Months Ended
October 31, 2017
July 31, 2017
October 31, 2017
Note: Amounts may not cross foot due to rounding.
For Year Ended Three Months Ended
January 31, 2017 April 30, 2017
Three Months Ended
Three Months Ended

© 2014 Verint Systems Inc. All Rights Reserved Worldwide.
© 2017 Verint Systems Inc. All Rights Reserved Worldwide.
Thank You
Serious News for Serious Traders! Try StreetInsider.com Premium Free!
You May Also Be Interested In
- Cafely Releases 2024 Coffee Statistics - Breakdown by Country, Region, and Demographics
- Epazz, Inc.: CryObo, Inc. solar Bitcoin operations will issue tokens
- Ground-Breaking, Drug-Free, and Clinically Tested BackVive Patch Offers Long-Lasting Relief to Chronic Back Pain Sufferers
Create E-mail Alert Related Categories
SEC FilingsSign up for StreetInsider Free!
Receive full access to all new and archived articles, unlimited portfolio tracking, e-mail alerts, custom newswires and RSS feeds - and more!


 Tweet
Tweet Share
Share