
Form 10-K Meet Group, Inc. For: Dec 31
UNITED STATES
SECURITIES AND EXCHANGE COMMISSION
Washington, D.C. 20549
FORM 10-K
☑ | ANNUAL REPORT PURSUANT TO SECTION 13 OR 15(d) OF THE SECURITIES EXCHANGE ACT OF 1934 |
For the fiscal year ended: December 31, 2017
Or
☐ | TRANSITION REPORT PURSUANT TO SECTION 13 OR 15(d) OF THE SECURITIES EXCHANGE ACT OF 1934 |
For the transition period from: to
The Meet Group, Inc.
(Exact name of registrant as specified in its charter)
Delaware | 001-33105 | 86-0879433 |
(State or Other Jurisdiction of Incorporation or Organization | (Commission File Number) | (I.R.S. Employer Identification No.) |
100 Union Square Drive
New Hope, Pennsylvania 18938
(Address of Principal Executive Office) (Zip Code)
(215) 862-1162
(Registrant’s telephone number, including area code)
Securities registered pursuant to Section 12(b) of the Act: | ||
Title of each class | Name of each exchange on which registered | |
Common Stock, $0.001 par value | The NASDAQ Stock Market LLC | |
NASDAQ Capital Market | ||
Securities registered pursuant to Section 12(g) of the Act: None | ||
Indicate by check mark if the registrant is a well-known seasoned issuer, as defined in Rule 405 of the Securities Act. ☐ Yes ☑ No
Indicate by check mark if the registrant is not required to file reports pursuant to Section 13 or Section 15(d) of the Exchange Act. ☐ Yes ☑ No
Indicate by check mark whether the registrant (1) has filed all reports required to be filed by Section 13 or 15(d) of the Securities Exchange Act of 1934 during the preceding 12 months (or for such shorter period that the registrant was required to file such reports), and (2) has been subject to such filing requirements for the past 90 days. ☑ Yes ☐ No
Indicate by check mark whether the registrant has submitted electronically and posted on its corporate Web site, if any, every Interactive Data File required to be submitted and posted pursuant to Rule 405 of Regulation S-T during the preceding 12 months (or for such shorter period that the registrant was required to submit and post such files). ☑ Yes ☐ No
Indicate by check mark if disclosure of delinquent filers pursuant to Item 405 of Regulation S-K is not contained herein, and will not be contained, to the best of registrant's knowledge, in definitive proxy or information statements incorporated by reference in Part III of this Form 10-K or any amendment to this Form 10-K. ☐
Indicate by check mark whether the registrant is a large accelerated filer, an accelerated filer, a non-accelerated filer, a smaller reporting company or an emerging growth company. See the definitions of “large accelerated filer,” “accelerated filer,” “smaller reporting company” and “emerging growth company” in Rule 12b-2 of the Exchange Act.
Large accelerated filer ☐ | Accelerated filer ☒ |
Non-accelerated filer ☐ (Do not check if a smaller reporting company) | Smaller reporting company ☐ |
Emerging growth company ☐ | |
If an emerging growth company, indicate by check mark if the registrant has elected not to use the extended transition period for comply with any new or revised financial accounting standards provided pursuant to Section 13(a) of the Exchange Act. | ☐ |
Indicate by check mark whether the registrant is a shell company (as defined in Rule 12b-2 of the Act). ☐ Yes ☑ No
The aggregate market value of the voting and non-voting common equity held by non-affiliates computed by reference to the closing price as of the last business day of the registrant’s most recently completed second fiscal quarter, June 30, 2017, was approximately $356,085,000 based upon the last reported sale price of $5.05 per share on June 30, 2017 on the NASDAQ Capital Market.
The number of shares outstanding of the registrant’s common stock, par value $0.001, as of March 12, 2018, was 72,040,500.
THE MEET GROUP, INC. AND SUBSIDIARIES
TABLE OF CONTENTS
Page | ||||
PART I
ITEM 1. BUSINESS.
COMPANY OVERVIEW
The Meet Group, Inc. (the “Company,” “The Meet Group,” “us,” or “we”) is a portfolio of mobile social entertainment apps designed to meet the universal need for human connection. We leverage a powerful live-streaming video platform, empowering our global community to forge meaningful connections. Our primary apps are MeetMe®, LOVOO®, Skout®, and Tagged®.
We operate location-based social networks for meeting new people, primarily on mobile platforms, including on iPhone, Android, iPad and other tablets, that facilitate interactions among users and encourage users to connect, communicate and engage with each other. In 2017, we laid the foundation for and launched live video, which we believe is the most compelling product we have ever offered. Having historically generated revenue primarily through advertising, live video and other forms of user-pay monetization, including subscriptions and in-app purchases, are becoming an increasingly larger component of total revenue. We believe revenues from video are more sustainable, can grow faster, and are more aligned with the quality of the user experience than revenues from advertising.
We launched live video monetization on two of our apps in 2017 and have seen strong early interest from our users, including increasing engagement and revenue. We also added two additional apps to The Meet Group portfolio. On April 3, 2017, we completed our acquisition of Ifwe Inc. (“if(we)”), a leading global mobile network for meeting new people, and on October 19, 2017, we completed our acquisition of Lovoo GmbH (“Lovoo”), a leading dating app provider in Germany. We believe these acquisitions, in addition to our acquisition of Skout, Inc. (“Skout”) on October 3, 2016, provide significant scale for the future global growth of our social entertainment platform, and we are hard at work today integrating our video technology into both properties.
We also offer online marketing capabilities, which enable marketers to display their advertisements in different formats and in different locations. We offer significant scale to our advertising partners, with hundreds of millions of daily impressions across our active global user base, and sophisticated data science for highly effective hyper-targeting. We work with our advertisers and advertising networks to maximize the effectiveness of their campaigns by optimizing advertisement formats and placements.
Just as Facebook has established itself as the social network of friends and family, and LinkedIn as the social network of colleagues and business professionals, The Meet Group is creating the social entertainment network not of the people you know but of the people you want to know. Nimble and fast-moving, already in more than 100 countries, we are challenging the dominant player in our space, Match Group, and differentiating ourselves with live video, which is not offered by many of our direct competitors. Modeled after the video products offered by Chinese dating app providers, but enhanced in order to appeal to western audiences, our live video product is aimed at the nexus of entertainment and community, where we believe our apps exhibit natural strength.
Our vision extends beyond dating and entertainment. We focus on building quality products to satisfy the universal need for human connection among all people, everywhere--not just paying subscribers. We believe meeting new people is a basic human need, especially for users aged 18-34, when so many long-lasting relationships are made. We use advanced technology to engineer serendipitous connections among people who otherwise might never have met - a sort of digital coffeehouse where everyone belongs. Over the years, The Meet Group’s apps have originated untold numbers of chats, shares, good friendships, dates, romantic relationships - even marriages.
We believe that we have significant growth opportunities enabled through our social entertainment platform. We believe our scale provides unique advantages to grow video monetization, while also establishing a high density of users within the geographic regions we serve. As The Meet Group networks grow and the number of users in a location increases, we believe that users who are seeking to meet new people will incrementally benefit from the quantity of relevant connections.
1
BUSINESS OVERVIEW
How We Create Value for Users
We provide something we feel everyone craves: the magic of human connection. Our innovative apps have advantages the neighborhood pub can’t match. Through our social entertainment platform and pipeline of new products, such as live video streaming, gifting and monetization, we are helping to connect a portion of the over 50 million people aged 18-34 in the U.S. and the more than one billion worldwide. We offer free and subscription-based services to our users, monetizing through advertising, and increasingly, through direct user purchases including video, subscription and in-app purchase revenue. In 2017, we generated approximately 73% of our revenue from advertising.
Monetization of our video product is done through gifting. In our one-to-many livestreaming feature, a single broadcaster can entertain and interact with essentially unlimited viewers on the app. Gifting enables those viewers to use virtual credits purchased through iTunes or Google Play to send the broadcaster a virtual gift as a show of appreciation or interest for that entertainment.
People use The Meet Group apps to make friends, socialize, date, be entertained and chat. In fact, in our internal survey of MeetMe users conducted in November 2017, 84% of those responding said they preferred to start relationships as friends. We believe this comfort level drives higher engagement and retention.
We believe the multi-billion dollar social entertainment industry can meet users’ needs through a range of monetization paths, including both free and paid models. While free models —MeetMe, Skout, Tagged— reduce barriers to entry and accelerate the network effect, our Lovoo app has demonstrated ongoing success with its subscription-based model.
We believe we are well positioned to continue to grow user engagement and generate revenue with our social entertainment platform. We believe our success will depend in large part, as it does every year, on our ability to continue to execute against an aggressive product pipeline.
More than 4 million people use our apps, on average, every day to meet new people in their local communities and throughout the world. In many cases they are logging in multiple times per day in order to interact with people they have met on our apps. They are meeting friends, significant others, and potential spouses every day.
Additionally, more than 20% of our MeetMe, Skout and Tagged mobile users engage with video each day and we are seeing increasing monetization across those apps where video gifting is available.
Our applications offer a variety of ways for users to discover and interact with one another, with an increasing focus on live video as the medium of connection. The most popular feature has traditionally been one-on-one chat, and users spend much of their time with The Meet Group interacting with the connections they've made on our apps. Our primary "magic" is not the chat client itself, but the ease with which our users can find new people with whom to chat. Our chat service is generally provided free to all users. Lovoo limits the number of chats a user can send for free and provides for the ability to unlock additional chats with a paid subscription or in-app purchase.
There are four key types of features we use to facilitate connections between users, “Browse,” “Queue,” “Feed” and “Live”:
The most direct is a “Browse” feature, which allows users to peruse profiles and photos of potential connections nearby or around the world. We use sophisticated, data-backed algorithms to prioritize the most relevant recommendations for each user, optimizing for real connection as measured by each one’s likelihood to reply and engage in a lengthy conversation.
For users interested in a quicker, more gamified experience, each of our apps offers a “Queue” feature, which allows users to, in effect, swipe left and right on potential matches based on their photos and limited profile information. When two users express interest in one another in the queue, we notify each one of the match and encourage them to chat. We believe double-sided match requirement causes these conversations to be significantly more efficient, but somewhat less frequent, than those that come from a Browse feature.
We also enable users, on apps other than Lovoo, to discover and connect with one another around content, including both text and photo posts, within our “Feed” features. In this model, rather than browsing profiles, users are browsing content created by other users, either nearby or around the world. This content offers a compelling jumping-off point for extended conversation, both public (in the form of comments on that content) and private (in the form of one-on-one chats that subsequently develop).
2
In 2017, we began an aggressive push into “Live Video”, adding a new section called “Live”, which we believe to be both an engaging and highly monetizable format for communication and social entertainment on our MeetMe and Skout applications. We expect to add similar functionality to our Tagged and Lovoo applications in 2018. We also plan to add new features within Live and to infuse other areas of the apps with both live and recorded video functionality.
Live enables our users to become performers, gain an audience, cultivate relationships with their top fans, and even earn cash rewards if they produce engaging content and spend enough time on our platforms. The most popular livestreamers interact directly with their live audience on our apps, even allowing audience members to join their streams as guest streamers. Audience members can make in-app purchases to show their appreciation with gifts to livestreamers.
Users can make in-app purchases to access other features within the apps, typically either to unlock content or functionality or to prioritize their profiles or content within the applications. For example, users can spend Credits, Points or Gold for promotion within the Browse and Feed features, which garners them more attention with the goal of allowing them to find more connections more quickly. As another example, users in order to unlock the list of who viewed their profile or who expressed interest.
Finally, each of our apps also offers a subscription service for those users who want to have the very best experience and the most options available to them. Benefits for subscribers vary across the portfolio, but may include: additional advanced filters, suppression of advertisements, permanent access to information or features otherwise locked, and increased or eliminated limits on functionality like daily icebreakers or queue gameplay.
Our Strategy
We are executing on our core mission of meeting the universal need for human connection with a focus on live video products, while diversifying our revenue base towards user-pay revenue such as subscriptions and in-app purchases as we scale our business and strive to grow revenue and adjusted EBITDA.
Our strategy for 2018 and beyond is aimed at growing our audience, building out our video platform, engaging our active user base and delivering new products to drive monetization.
Key elements of our strategy include:
• | Build Great Products to Acquire, Engage, and Thrill Users: Our core focus is to create innovative social experiences using sophisticated data science that help our users meet new people in their local communities and throughout the world. We plan on continuing to invest in improving our core platform as technology advances and in devising new ways of engineering serendipity online. A key area of product focus in 2018 is the delivery, engagement and monetization of our live streaming video. |
• | Offer Innovative and Engaging Ad Products for Marketers: We consider it critical to continue improving our advertising products to create more value for our marketers, attract new customers, and display targeted advertisements that are more relevant for our users. We pursue these goals through a combination of internal innovation and rapid integration of advertising solutions that have been successful in the marketplace. |
• | Integrating our Recent Acquisitions to Drive Growth: Following our acquisitions of if(we) and Lovoo in 2017, we are focused on effectively integrating both companies, realizing synergies, and driving growth across our platform. |
3
Operating Metrics
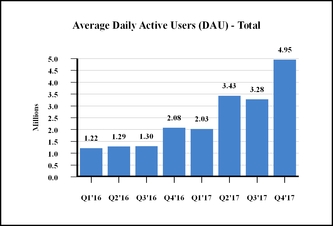
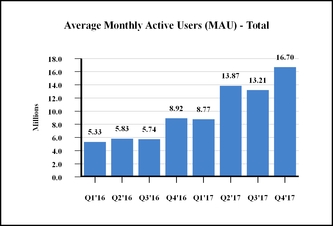
We measure website and application activity in terms of monthly active users (“MAUs”) and daily active users (“DAUs”). We define a MAU as a registered user of one of our platforms who has logged in and visited within the last month of measurement. We define a DAU as a registered user of one of our platforms who has logged in and visited within the day of measurement. For the quarters ended December 31, 2017, 2016 and 2015, total MAUs were approximately 16.70 million, 8.92 million and 4.97 million, respectively, and total DAUs were approximately 4.95 million, 2.08 million and 1.19 million, respectively.
Monthly Average for the Quarter Ended | ||||||||
December 31, | ||||||||
2017 | 2016 | 2015 | ||||||
MAU | 16,695,097 | 8,915,575 | 4,971,638 | |||||
For the Quarter Ended | ||||||||
December 31, | ||||||||
2017 | 2016 | 2015 | ||||||
DAU | 4,953,317 | 2,084,987 | 1,189,290 | |||||
Trends in Our Metrics
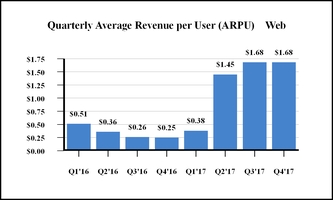
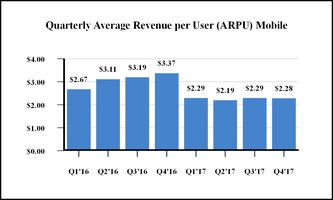
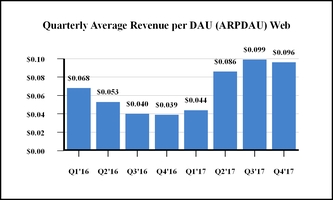
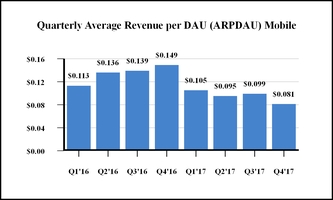
In addition to MAUs and DAUs, we measure activity on the Company’s apps in terms of average revenue per user (“ARPU”) and average daily revenue per daily active user (“ARPDAU”). We define ARPU as the quarterly revenue per average MAU. We define ARPDAU as the average daily revenue per DAU. We define mobile MAU as a user who accessed our sites by one of our mobile applications or by the mobile optimized version of our websites for MeetMe, Skout and Lovoo, whether on a mobile phone or tablet during the month of measurement. We define a mobile DAU as a user who accessed our sites by one of our mobile applications or by the mobile optimized version of our websites for MeetMe, Skout and Lovoo, whether on a mobile phone or tablet during the day of measurement.
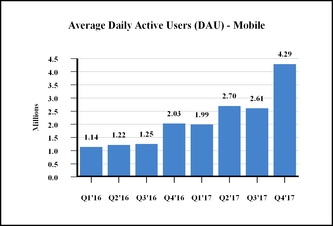
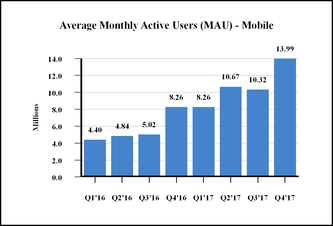
In the quarter ended December 31, 2017, the Company averaged 13.99 million mobile MAUs and 16.70 million total MAUs on average, as compared to 8.26 million mobile MAUs and 8.92 million total MAUs on average in the quarter ended December 31, 2016, a net increase of 5.73 million or 69% for mobile MAUs, and a net increase of 7.78 million or 87% for total MAUs. Mobile DAUs were 4.29 million for the quarter ended December 31, 2017, a 112% increase, from 2.03 million in the quarter ended December 31, 2016. For the quarter ended December 31, 2017, the Company averaged 4.95 million total DAUs, as compared to 2.08 million total DAUs on average for the quarter ended December 31, 2016, a net increase of approximately 2.87 million total DAUs, or 138%.
4
(1) | Tables above include active users from Skout, if(we) and Lovoo as of the acquisition dates of October 3, 2016, April 3, 2017 and October 19, 2017. |
In the quarter ended December 31, 2017, the Company earned an average of $1.68 ARPU on the web and $2.28 ARPU on our mobile applications, as compared to $0.25 ARPU on the web and $3.37 in mobile ARPU for the quarter ended December 31, 2016. In the quarter ended December 31, 2017, the Company earned an average of $0.096 ARPDAU on the web and $0.081 on mobile ARPDAU, as compared to $0.039 in web ARPDAU and $0.149 in mobile ARPDAU for the quarter ended December 31, 2016.
(1) | Tables above include active users from Skout, if(we) and Lovoo as of the acquisition dates of October 3, 2016, April 3, 2017 and October 19, 2017. |
As the business continues to evolve and as subscription and in-app purchases contribute to a larger portion of revenue, we may choose to report new or additional metrics that are more closely tied to key business drivers or stop reporting metrics that are no longer relevant.
5
PRODUCT DEVELOPMENT
We are continually developing new products, as well as optimizing our existing platforms and feature sets in order to meet the evolving needs of our user base and advertising partners.
We develop most of our software internally. We will, however, purchase technology and license intellectual property rights where it is strategically important, operationally compatible, or economically advantageous. For instance, we partner with third parties to further our internationalization efforts as we look to bring additional languages into our existing platforms. We are not materially dependent upon licenses and other agreements with third parties relating to product development.
Our technology team of 159 people consists of our product development and engineering team, our database administration team, our quality assurance team and our network system operators. These teams are responsible for feature enhancements and general maintenance across all of our platforms. Our technology team is headquartered in New Hope, Pennsylvania with additional offices in Philadelphia, Pennsylvania, San Francisco, California and Dresden, Germany.
SALES AND MARKETING
We have grown our user base through organic, viral channels as well as through our recent acquisitions. By encouraging members to invite their friends to join our apps and to share their activity across other external platforms, including Facebook and Twitter, and by providing members with easy-to-use tools, we believe we have successfully grown our user base while minimizing marketing costs. We focus primarily on creating a truly differentiated experience and compelling value proposition for new users in our markets and developing the technologies needed to facilitate their word-of-mouth marketing on our behalf in order to attract and retain new members.
Our paid customer acquisition strategy will focus on acquiring users in geographies where we believe we will see payback on our acquisition investment. We spent $15.8 million, $12.1 million and $3.3 million on paid direct user acquisition in 2017, 2016 and 2015, or 12.8%, 15.9% and 5.9% of our total revenue, respectively. The overall Company spend rate in 2018 is expected to be approximately 11% of revenue.
SALES AND OPERATIONS
Our advertising sales and operations team is comprised of 10 full-time employees in the U.S. and Germany and covers major brand agencies, direct response and cost-per-action engagement advertisers, advertising networks, and mobile agencies. Our advertising operations are headquartered in New Hope, Pennsylvania, with additional offices in New York, New York, San Francisco, California and Dresden, Germany.
Our operations and member services team consists of 28 full-time employees, 7 part-time employees, and 140 contractors split between Delhi and Bangalore, India and Cavite, Philippines. This team is responsible for reviewing images and other user-generated content, investigating and responding to member abuse reports, and providing general customer support.
INTELLECTUAL PROPERTY
Our intellectual property includes trademarks related to our brands, products, and services, copyrights in software and creative content, trade secrets, domain names, and other intellectual property rights and licenses of various kinds. We seek to protect our intellectual property through copyright, trade secret, trademark and other laws of the U.S. and other countries, and through contractual provisions.
We consider the MeetMe, Skout, Tagged, Hi5, Lovoo and Social Theater trademarks and our related trademarks to be valuable to the Company, and we have registered these trademarks in the U.S. and other countries throughout the world and aggressively seek to protect them.
6
COMPETITION
We believe we are challenging the dominant player in the dating space, Match Group, but we are not limited to dating. We operate at the forefront of nascent segments (social discovery and social entertainment) of a broader sector that is still being defined (social networking). As such, we face significant competition in every aspect of our business, both from established companies whose products help users meet new people, or are evolving to do so, and from smaller but well-funded startups that can quickly gain attention and compete with us for users. Examples of services that compete with us for users and advertiser interest include, but are not limited to:
• | Mobile applications and websites whose primary focus is to help users meet new people in their geographical area, including Badoo, Twoo and Meetup. |
• | Social networking mobile applications and websites with a focus on dating, which is a subset of the opportunity around meeting new people, such as Zoosk, Match, Happn, PlentyOfFish, OkCupid and Tinder. |
• | Other video platforms that provide one-to-many and one-to-one video services such as live.me, live.ly, musical.ly, Azar, Younow and Periscope. |
• | Broader social networks that currently offer or may evolve to offer services aimed at helping users meet new people in their area, such as Facebook, Twitter and LinkedIn. |
• | Significant competition for Social Theater comes from publishers including TrueX, Unruly Media, SuperSonic Advertising, Jun Group and Genesis Media. |
As we introduce new products, and as other companies introduce new products and services, we expect to become subject to additional competition. Additional information regarding certain risks related to our competition is included in Part I, Item 1A—Risk Factors of this report.
In addition to other online dating and social networking brands, we compete indirectly with offline dating services, such as matchmakers.
EMPLOYEES
As of December 31, 2017, we employed 286 full-time and 12 part-time employees in the U.S. and Germany. Our future success is substantially dependent on the performance of our senior management and key technical personnel, as well as our continuing ability to attract, maintain the caliber of, and retain highly qualified technical and managerial personnel. Additional information regarding certain risks related to our employees is included in Part I, Item 1A—Risk Factors of this report and is incorporated herein by reference.
GOVERNMENT REGULATION
In the U.S., advertising and promotional information presented to visitors on our mobile applications and websites and our other marketing activities are subject to federal and state consumer protection laws that regulate unfair and deceptive practices. There are a variety of state and federal restrictions on the marketing activities conducted by email, or over the Internet, including U.S. federal and state privacy laws and the Telephone Consumer Protection Act of 1991, or the TCPA, the Controlling the Assault of Non-Solicited Pornography and Marketing Act of 2001, or the CAN-SPAM Act. We may also be subject to laws in the various other countries in which we operate, including the General Data Protection Regulation which will come into effect in most of Europe on May 25, 2018. The rules and regulations are complex and may be subject to different interpretations by courts or other governmental authorities. We may unintentionally violate such laws, such laws may be modified, and new laws may be enacted in the future. Any such developments (or developments stemming from enactment or modification of other laws) or the failure to anticipate accurately the application or interpretation of these laws could create liability to us, result in adverse publicity, and negatively affect our businesses. Additional information regarding certain risks related to government regulations is included in Part I, Item 1A—Risk Factors of this report.
CORPORATE HISTORY
The Meet Group was incorporated in Nevada in June 1997, and merged with Insider Guides, Inc., doing business as myYearbook.com, on November 10, 2011. On December 6, 2011, the Company changed its legal domicile to Delaware. Effective June 1, 2012, the Company changed its name from Quepasa Corporation to MeetMe, Inc. and completed the transition of its website to meetme.com in the fourth quarter of 2012. On October 3, 2016 the Company completed its acquisition of Skout, and on April 3, 2017 the Company completed its acquisition of if(we), both of which owned leading global mobile networks for meeting
7
new people, and changed its name to The Meet Group, Inc. On October 19, 2017, the Company completed its acquisition of Lovoo to expand its global footprint, increase its scale and profitability, and diversify our business model by adding expertise in subscription and in-app purchasing. The Company owns and operates the MeetMe, Skout, Tagged, Hi5 and Lovoo mobile applications, and meetme.com, skout.com, tagged.com, hi5.com and lovoo.com.
Our executive offices and principal facilities are located at 100 Union Square Drive, New Hope, Pennsylvania, 18938. Our telephone number is (215) 862-1162. Our corporate website is www.themeetgroup.com. Investors can obtain copies of our SEC filings from our corporate website free of charge, as well as from the SEC website, www.sec.gov. The information contained on our corporate website and the SEC website is not incorporated herein.
AVAILABLE INFORMATION
Our Annual Report on Form 10-K, Quarterly Reports on Form 10-Q, Current Reports on Form 8-K and amendments to reports filed or furnished pursuant to Sections 13(a) and 15(d) of the Securities Exchange Act of 1934, are available free of charge on our Investor Relations website at http://ir.themeetgroup.com/docs as soon as reasonably practicable after we electronically file such material with, or furnish it to, the SEC. The SEC maintains a website that contains these filings at www.sec.gov. The information posted on our corporate website and the SEC website is not incorporated herein.
ITEM 1A. RISK FACTORS.
Investing in our common stock involves a high degree of risk. You should consider carefully the risks and uncertainties described below, together with all of the other information in this report, including the consolidated financial statements and the related notes included elsewhere in this report, before deciding whether to invest in shares of our common stock. The risks and uncertainties described below are not the only ones we face. Additional risks and uncertainties that we are unaware of, or that we currently believe are not material may also become important factors that adversely affect our business. If any of the following risks actually occurs, our business, financial condition, results of operations, and future prospects could be materially and adversely affected. In that event, the market price of our common stock could decline, and you could lose part or all of your investment.
Risks Related to Our Business
If we cannot effectively drive engagement and monetization on our newly-launched Live feature on our mobile applications, our future operating results may suffer.
Our long term strategy includes continued revenue growth from our Live feature that we launched only in 2017. We have not completed launch of Live on all of our apps and we cannot be certain that Live will perform as expected at scale. While we expect to continue to devote substantial resources to the launch and monetization of Live across our apps, we also cannot be certain that our early results on Live are predictive of future results and that Live will continue to grow in the future. Furthermore, Live represents a new and unproven form of revenue, and we do not have a long history of monetizing Live. Live may not monetize as we expect and revenues may be adversely affected. If we do not launch Live across all of our apps as expected, if Live does not grow as expected, or if Live does not perform or monetize as expected, our operating results could be materially and adversely affected.
If we cannot increase our daily and monthly active users and increase their engagement on our mobile applications, our future operating results may decline.
We offer applications that are free to use, with only a small percentage of our users paying for virtual goods. Our financial performance has been and will continue to be significantly determined by our success in adding, retaining, and engaging active users. We must continue to add new members to our user base and retain existing members by offering new and engaging features and products, such as Live, in order to generate revenue from the sale of in-app products and attract advertising investment. The challenges we face include, among other things, our ability to:
• | attract new users and retain existing users at a consistent rate; |
• | increase engagement by existing users; |
• | monetize our user base; |
• | anticipate changes in the social networking and social discovery industry; |
• | launch new products and release enhancements that become popular; |
• | develop and maintain a scalable, high-performance technology infrastructure that can efficiently and reliably handle increased member usage, fast load times and the deployment of new features and applications; |
• | process, store and use data in compliance with governmental regulation and other legal obligations related to privacy; |
8
• | compete with other companies that are currently in, or may in the future enter, the social networking or social discovery industry; |
• | hire, integrate and retain world class talent; and |
• | expand our business internationally and with respect to mobile devices. |
If we fail to retain existing users or add new users, or if our users decrease their level of engagement, our revenue, financial results, and business may be significantly harmed.
The size of our user base and our users’ level of engagement are critical to our success. Our financial performance is significantly affected by our success in adding, retaining, and engaging active users. If people do not perceive our products to be useful, reliable, and trustworthy, we may not be able to attract or retain users or otherwise maintain or increase the frequency and duration of their engagement. A number of other social networking companies that achieved early popularity have since seen their active user bases or levels of engagement decline, in some cases precipitously. There is no guarantee that we will not experience a similar erosion of our active user base or engagement levels. A decrease in user retention, growth, or engagement could render us less attractive to advertisers, which may have a material and adverse impact on our revenue, business, financial condition, and results of operations. Any number of factors could potentially negatively affect user retention, growth, and engagement, including if we fail to:
• | introduce new and improved products that are favorably received; |
• | identify and respond to emerging technological trends in the market; |
• | provide a compelling user experience with the decisions we make with respect to the frequency, prominence, and size of advertising and other commercial content we display; |
• | continue to develop features, such as our Live feature, for mobile devices that users find engaging, that work with a variety of mobile operating systems and networks, and that achieve a high level of market acceptance; |
• | acquire or license leading technologies; |
• | avoid technical or other problems that prevent us from delivering our services in a rapid and reliable manner or otherwise affect the user experience; or |
• | provide adequate customer service to users or advertisers. |
If we are unable to maintain and increase our user base and user engagement, our revenue, financial results, and future growth potential could be adversely affected.
We believe the number of our registered users is higher than the number of actual users.
We believe the number of our registered users is higher than the number of actual users because some members may have multiple registrations, other members may have died or may have become incapacitated, and others may have registered under fictitious names. Members also terminate their memberships and delete their profiles. Given the challenges inherent in identifying these accounts, we do not have a reliable system to accurately identify the number of our active members.
If our users do not interact with each other or our viral marketing strategy fails, our ability to attract new users may suffer and our revenue may decrease.
The majority of our users do not visit our mobile applications frequently and spend a limited amount of time when they do visit. The majority of our screen views are generated by a minority of our users. If we are unable to encourage our users to interact more frequently and to increase the amount of user generated content they provide, our ability to attract new users and our financial results may suffer. In addition, part of our success depends on our users interacting with our products and contributing to our viral advertising platform (Social Theater). If our Social Theater platform is unsuccessful and our users do not participate in Social Theater campaigns, our operating results could suffer.
We generate a significant portion of our revenue from advertising, and in particular, digital advertising. If we incur a loss of advertisers, or a reduction in spending by advertisers, our revenue could substantially decline, resulting in significant operating losses and negatively impacting our cash flows.
We generate a significant portion of our revenue from parties advertising on our platform, and, in particular, those advertisers in the digital advertising market. The digital advertising market has been subject to fluctuations and we have experienced declines in ad rates. In 2017 we experienced significant declines in advertising rates that materially and negatively impacted our operating results. Advertising rates may continue to decline relative to historical levels. Factors such as the lack of standard metrics in the digital advertising market may lead to varying and inconsistent ad rates and potentially demands for rebates.
9
As is common in the industry, our advertisers typically do not have long-term advertising commitments with us. Many of our advertisers spend only a relatively small portion of their overall advertising budget with us. Advertisers may not continue to do business with us, or they may reduce the prices they are willing to pay to advertise with us, if we do not deliver advertising and other commercial content in an effective manner, or if they do not believe that their investment in advertising with us will generate a competitive return relative to other alternatives. Our advertising revenue could be adversely affected by a number of other factors, including:
• | decreases in user engagement, including time spent on our mobile applications; |
• | product changes or inventory management decisions we may make that reduce the size, frequency, or relative prominence of advertising and other commercial content that we display; |
• | our inability to increase the rate at which our users “click through” on the ads we display; |
• | our inability to improve our analytics and measurement solutions that demonstrate the value of our advertising and other commercial content; |
• | loss of advertising market share to our competitors; |
• | adverse legal developments relating to advertising, including legislative and regulatory developments and developments in litigation; |
• | adverse media reports or other negative publicity involving us or other companies in our industry; |
• | objections to the content of our apps and websites; |
• | changes in the way online advertising is priced; |
• | changes in the digital advertising market, including the introduction of standard metrics; |
• | the impact of new technologies that could block or obscure the display of our advertising and other commercial content; and |
• | the impact of macroeconomic conditions and conditions in the advertising industry, and, in particular, the digital advertising industry, in general. |
The occurrence of any of these or other factors could result in a reduction in demand for our advertising and other commercial content, which could reduce the prices we receive for our advertising and other commercial content, or cause advertisers to stop advertising with us altogether. In turn, we could incur a substantial decline in revenue, increased operating losses, and a negative impact on cash flows.
If we fail to maintain and expand our base of advertisers, our revenue and our business could be harmed.
Our ability to grow our business depends in part on our ability to maintain and expand our advertiser base. To do so, we must ensure that existing and prospective advertisers know that our advertising products offer a material benefit and can generate a competitive return relative to other alternatives, including online, mobile and traditional advertising platforms. Advertisers may not continue to do business with us, or they may reduce the prices they are willing to pay to advertise with us, if we do not deliver ads in an effective manner, or if they do not believe that their investment in advertising with us will generate competitive returns. Our ability to do so depends on factors including:
• | Competitiveness of Our Products. We must deliver ads in an effective manner and provide accurate analytics and measurement solutions that demonstrate the value of our advertising products compared to those of our competitors. Similarly, if the pricing of our advertising products does not compare favorably to those of our competitors, advertisers may reduce their advertising with us or choose not to advertise with us at all. |
• | Traffic Quality. The success of our advertising program depends on delivering positive results to our advertising customers. Low-quality or invalid traffic, such as robots, spiders and the mechanical automation of clicking, may be detrimental to our relationships with advertisers and could adversely affect our advertising pricing and revenue. If we fail to detect and prevent click fraud or other invalid clicks on ads, the affected advertisers may experience or perceive a reduced return on their investments, which could lead to dissatisfaction with our products, refusals to pay, refund demands or withdrawal of future business. |
• | Perception of Our Platform. Our ability to compete effectively for advertiser budgets depends on our reputation and perceptions regarding our platform. |
• | Macroeconomic Conditions. Adverse macroeconomic conditions can have a negative impact on the demand for advertising, particularly with respect to online advertising products. Advertisers may have limited advertising budgets and may view online advertising as lower priority than offline advertising. |
As is typical in our industry, our advertisers generally do not have long-term obligations to purchase our products. Their decisions to renew depend on the degree of satisfaction with our products as well as a number of factors that are outside of our control. As a result, we may experience attrition in our advertisers in the ordinary course of business resulting from several factors, including objections to the content or reputation of our apps, losses to competitors or declining advertising budgets. The occurrence of any
10
of these or other factors could result in a reduction in demand for our ads, which may reduce the prices we receive for our ads, either of which would negatively affect our revenue and operating results.
Because we face significant competition from other social networks, video platforms and companies with greater resources, we may not be able to compete effectively.
We face significant competition from other companies that seek to connect members online. As we roll out the Live Video Feature across our applications, we expect to face significant competition from other video platforms that provide one-to-many and one-to-one video services. Our competitors include other companies providing portal and online community and one-to-many and one-to-one video services, such as Match, Facebook, Google, Badoo, PlentyOfFish, OkCupid, live.me, live.ly, musical.ly, Azar, Younow and Periscope. Many of our competitors have greater resources, more established reputations, a broader range of content and products and services, longer operating histories, and more established relationships with their users than we do. They can use their experience and resources against us in a variety of competitive ways, including developing ways to attract and maintain users. These factors may allow our competitors to respond more effectively than us to new or emerging technologies and changes in market requirements. Our competitors may develop products, features, or services that are similar to ours or that achieve greater market acceptance, may undertake more far-reaching and successful efforts at developing new services or marketing campaigns, or may adopt more aggressive pricing policies. Some of our competitors may enjoy better competitive positions in certain geographical regions or within certain user demographics that we currently serve or may serve in the future. These advantages could enable these competitors to offer products that are more appealing to users and potential users than our products or to respond more quickly and/or cost-effectively than us to new or changing opportunities. In addition, within the industry generally, costs for users to switch between products are low, and users have a propensity to try new approaches to connecting with people. As a result, new products, entrants and business models are likely to continue to emerge. It is possible that a new product could gain rapid scale at the expense of existing brands through harnessing a new technology or distribution channel, creating a new approach to connecting people or some other means.
We believe that our ability to compete effectively depends upon many factors both within and beyond our control, including:
• | the usefulness, ease of use, performance, and reliability of our services compared to our competitors; |
• | the size and composition of our user base; |
• | the engagement of our users with our services; |
• | the timing and market acceptance of services, including developments and enhancements to our or our competitors’ services; |
• | our ability to monetize our services; |
• | the frequency, size, and relative prominence of the advertising and other commercial content displayed by us or our competitors; |
• | customer service and support efforts; |
• | marketing and selling efforts; |
• | changes mandated by legislation, regulatory authorities, or litigation, including settlements and consent decrees, some of which may have a disproportionate effect on us; |
• | acquisitions or consolidation within our industry, which may result in more formidable competitors; |
• | our ability to attract, retain, and motivate talented employees, particularly software engineers; |
• | our ability to cost-effectively manage and grow our operations; and |
• | our reputation and brand strength relative to our competitors. |
If we are not able to effectively compete, our user base and level of user engagement may decrease, which could make us less attractive to advertisers and materially and adversely affect our revenue and results of operations.
Because we face competition from traditional media companies, we may not be included in the advertising budgets of large advertisers, which could harm our operating results.
Major brand and network advertising drives a significant portion of our revenue. We rely primarily on cost per thousand (“CPM”) advertising, where the price for advertising is based on the number of users who view it. In addition to mobile application developers and Internet companies, we face competition from companies that offer traditional media advertising opportunities. Most large advertisers have set advertising budgets, a portion of which is allocated to mobile advertising. If we fail to convince these companies to spend a portion of their advertising budgets on social media and specifically with us, however, our operating results could be harmed.
11
We have terminated agreements with our former advertising partner and may not be able to collect amounts due.
On June 2, 2015, we terminated two agreements with Beanstock relating to our advertising inventory on web and mobile: the Web Agreement and the Mobile Agreement. We terminated both agreements for non-payment, and in the third quarter of 2015, we wrote-off the accounts receivable balance under the agreements of $5.7 million as uncollectible. We have filed suit against Beanstock and its guarantor, Adaptive Medias, Inc., and we intend to pursue all available remedies to collect amounts due to us, including liquidated damages under the Mobile Agreement. We cannot guarantee if, when or how much outstanding will be paid to us. We also do not know the amount of time and effort that will be required from management to collect these amounts. On January 20, 2016, the Company received notice from the United States Bankruptcy Court, District of Delaware, that a Chapter 7 bankruptcy case against Beanstock had been filed on October 7, 2015. This action has been stayed by the courts as a result of the bankruptcy filing against Beanstock. For a description of the litigation, see Part I, Item 3-Legal Proceedings.
We rely on the Apple App Store and the Google Play Store to distribute our mobile applications. Our business may suffer if we are unable to maintain a good relationship with Apple and Google, if their terms and conditions or pricing change to our detriment, if we violate, or either company believes that we have violated, its terms and conditions, or if either of these platforms are unavailable for a prolonged period of time.
The Apple App Store and the Google Play Store are our primary distribution, marketing, promotion and payment platforms for our applications. In 2017, we derived 33% of our revenue from Apple and 43% of our revenue from Google. Any deterioration in our relationship with Google or Apple could harm our business and adversely affect the value of our stock.
We are subject to these platforms’ standard terms and conditions for application developers, which govern the promotion, distribution and operation of apps. These platforms have policies governing, for example, use of user data, personal and sensitive information, and advertising IDs, as well as ones relating to advertising (including deceptive, disruptive and inappropriate ads) and interference with app and device functionality. Each platform has broad discretion to change and interpret its terms of service and other policies with respect to us and those changes may be unfavorable to us. A platform provider may also change its fee structure, add fees associated with access to and use of its platform, alter how we are able to advertise on the platform, change how the personal information of its users is made available to application developers on the platform, or limit the use of personal information for advertising purposes. Our business could be harmed if a platform provider modifies its current terms of service or other policies, including fees, in a manner adverse to us.
If we violate, or if a platform provider believes we have violated, these terms and conditions (or if there is any change or deterioration in our relationship with these platform providers), the particular platform provider may discontinue or limit our access to that platform, which could prevent us from making our apps available to or otherwise from serving our mobile customers. Any limit or discontinuation of our access to any platform could adversely affect our business, financial condition or results of operations.
Apple has a policy of reviewing apps prior to making them available in the App Store. In the past, Apple has rejected submissions of specific builds of our apps, and we have had to modify those submissions in order to gain acceptance. On more than one occasion, for example, Apple has rejected our apps because of user generated content and other concerns. In response we devoted additional resources to image review, and changed some of our content allowance policies. Both the review process itself and any necessary resubmissions required in order to gain acceptance can cause delays in the availability of our releases. If this recurs on a prolonged or frequent basis, or other similar issues arise that impact users’ ability to download or use our apps, we may owe some of our customers rebates, which would increase our expenses and lower our gross margins. Delay or failure to gain Apple’s acceptance - and therefore availability in the App Store - could adversely affect our business, financial condition or results of operations.
We also rely on the continued operation and availability of these third-party platforms. In the past, platforms have been unavailable for short periods of time or there have been issues with the in-App purchasing functionality from the storefront. In the event that either the Apple App Store or the Google Play Store is unavailable or if in-App purchasing functionality from the storefront is non-operational for a prolonged period of time, it could have a material adverse effect on our business, financial condition or results of operations.
Furthermore, if Google or Apple loses its market position or otherwise falls out of favor with users, we would need to identify alternative channels for marketing, promoting and distributing our apps, which would consume substantial resources and may not be effective. In addition, Google and Apple have broad discretion to change their terms of service and other policies with respect to us and other developers, and those changes may be unfavorable to us.
12
If the Apple App Store or Google Play changes its search and rating algorithms, it could affect our ability to acquire new mobile members.
Our Apple and Google applications have ranked near the top of the “Free Social” categories and near the top of many key search terms. However, Apple and Google have changed their rating and search algorithms in the past without notice. Future changes to the rating and search algorithms by Apple or Google could impact our rating and search results, leading to a drop in new downloads, which could cause our business and operating results to suffer.
If we are unable to continue to develop or acquire successful applications for mobile platforms and standalone mobile applications, our growth prospects could suffer.
We have offered applications for mobile platforms since May 2010. We expect to continue to devote substantial resources to the development of our mobile applications and new features, such as Live Video, for our mobile applications, but there can be no assurances that we will continue to succeed in developing or acquiring applications and features that appeal to users or advertisers. We may encounter difficulty in attracting leading advertisers to our mobile applications. We may also face challenges working with wireless carriers, mobile platform providers and other mobile communications partners. Finally, we may face challenges converting mobile users into users that pay for in-app products, such as subscriptions and gifts on our Live Video feature. These and other uncertainties make it difficult to know whether we will continue to succeed in developing commercially viable applications for mobile platforms. If we do not succeed in doing so, our growth prospects could suffer.
If our efforts to attract and retain subscribers is not successful, our business could be adversely affected.
Our ability to continue to attract and retain users of our paid subscription services depends in part on our ability to consistently provide our subscribers with a quality experience. Subscribers may cancel their subscription to our service for many reasons, and if our efforts to attract and retain subscribers are not successful, our business, operating results and financial condition may be adversely affected.
If we cannot address technological change in our industry in a timely fashion and develop new services, our future results of operations could be adversely affected.
The Internet and electronic commerce industries are characterized by:
• | rapidly changing technology; |
• | evolving industry standards and practices that could render our platform and proprietary technology obsolete; |
• | changes in consumer tastes and demands; and |
• | frequent introductions of new services or products that embody new technologies. |
Our future performance depends, in part, on our ability to develop, license or acquire leading technologies and program formats, enhance our existing services, and respond to technological advances and consumer tastes and emerging industry standards and practices on a timely and cost-effective basis. Developing mobile and website technology involves significant technical and business risks. We may not be able to successfully use new technologies or adapt our platforms and technology to emerging industry standards. We may not be able to remain competitive or sustain growth if we do not adapt to changing market conditions or customer requirements.
Because we plan to continue expanding our operations abroad where we have limited operating experience, we may be subject to increased business, economic and regulatory risks that could affect our financial results.
We plan to continue the international expansion of our business operations. We may enter new international markets where we have limited or no experience in marketing, selling, and deploying our products. If we fail to deploy or manage our operations in international markets successfully, our business could suffer. In addition, we are subject to a variety of risks inherent in doing business internationally, including:
• | political, social, or economic instability; |
• | risks related to the legal and regulatory environment in foreign jurisdictions, including with respect to privacy, and changes in laws, regulatory requirements, and enforcement; |
• | burdens of complying with a variety of foreign laws; |
• | potential damage to our brands and reputation due to our compliance with local laws, including potential censorship or requirements to provide user information to local authorities, and/or potential penalties for failing to comply with such local laws; |
13
• | lack of familiarity with local customs; |
• | fluctuations in currency exchange rates; |
• | higher levels of credit risk and payment fraud; |
• | reduced protection for intellectual property rights in some countries; and |
• | difficulties in staffing and managing global operations and the increased travel, infrastructure. |
If we are unable to expand internationally and manage the complexity of our global operations successfully, our financial results could be adversely affected.
If we are unable to implement payment gateways to our users, our results of operations could be adversely affected.
We conduct our business in countries outside of the U.S. and depend on payment gateways that are not as well developed as those in the U.S., where most people have credit cards or bank debit cards to use in paying for virtual goods, products, and services. Users in some countries in which we operate do not always have access to credit and debit cards and other payment methods common in the U.S. If we are unable to implement payment gateways that provide our members with the ability to pay for goods, products and services easily, our future results could be adversely affected. Additionally, our inability to collect and receive payments from these other sources could have an adverse effect on our business and results of operations.
Because we rely on Facebook as a distribution, marketing, and promotion platform, if our relationship with Facebook changes or if Facebook loses market share, our business could be adversely affected.
Facebook is an important distribution, marketing and promotion platform for our content and applications. We generate a number of our new users through the Facebook platform and we expect to continue to do so for the foreseeable future. As such, we are subject to Facebook’s standard terms and conditions for Facebook Connect and for application developers, which govern the promotion, distribution and operation of applications on the Facebook platform.
Our ability to acquire new members and provide services to our existing members could be harmed if:
• | Facebook discontinues or limits access to its platform by us and other application developers; |
• | Facebook modifies its terms of service or other policies, including changing how the personal information of its users is made available to application developers on the Facebook platform or shared by users; |
• | Facebook develops its own competitive offerings; or |
• | Facebook disallows our advertising in its platforms. |
We have benefited from Facebook’s strong brand recognition and large user base. If Facebook loses its market position or otherwise falls out of favor with users, we would need to identify alternative channels for marketing, promoting and distributing our content and applications, which could consume substantial resources and may not be effective. In addition, Facebook has broad discretion to change its terms of service and other policies with respect to us and other developers, and any such changes could be unfavorable. Facebook may also change its fee structure or add fees associated with access to and use of the Facebook platform.
Because our business is subject to complex and evolving U.S. and foreign laws and regulations regarding privacy, data protection, and other matters, we could be subject to claims, changes to our business practices, increased cost of operations, or declines in user growth or engagement, or otherwise sustain harm to our business.
We are subject to a variety of laws and regulations in the U.S. and abroad that involve matters central to our business, including user privacy, rights of publicity, data protection, intellectual property, electronic contracts and other communications, competition, protection of minors, consumer protection, taxation, and online payment services. Foreign data protection, privacy, and other laws and regulations are often more restrictive than those in the U.S. federal, state and foreign laws and regulations are constantly evolving and can be subject to significant change. The application and interpretation of these laws and regulations are often uncertain, particularly in the new and rapidly evolving industry in which we operate. In addition, federal, state and foreign legislative or regulatory bodies may enact new or additional laws and regulations concerning data privacy and retention issues which could adversely impact our business. The interpretation and application of privacy, data protection and data retention laws and regulations are currently unsettled in the U.S. and internationally. These laws may be interpreted and applied inconsistently from country to country and inconsistently with our current data protection policies and practices. Complying with these varying state to state or international requirements could cause us to incur substantial costs or require us to change our business practices in a manner adverse to our business.
14
We are also subject to laws and regulations that dictate whether, how, and under what circumstances we can transfer, process and/or receive transnational data that is critical to our operations, including data relating to users, customers, or partners outside the U.S., and those laws and regulations are uncertain and subject to change.
Proposed legislation and regulations could also significantly affect our business. There currently are a number of proposals pending before federal, state, and foreign legislative and regulatory bodies, including the General Data Protection Regulation, a comprehensive privacy and data protection reform, adopted by the European Union in April 2016. It is effective May 2018, and may have impacts on the collection and processing of personal data of European Union individuals which may impact our ability to target ads and otherwise monetize user data, as well as significant penalties for non-compliance. Similarly, there are a number of legislative proposals in the U.S., at both the federal and state level, that could impose new obligations in areas affecting our business.
We use email, push notifications, and text message campaigns to drive user engagement. Disruptions in, restrictions on, and certain legal risks associated with the sending or receipt of emails, push notifications, or text messages or a decrease in user willingness to receive emails, push notifications, and text messages could adversely affect our revenues and business.
We use email, push notifications, and text message campaigns to drive user engagement. We send a large volume of emails, push notifications, and text messages to users notifying them of a variety of activities on our platform, such as new connections. We also rely on the use of email, push notifications, and text messages as a part of our registration and validation processes. Because of the importance of email, push notifications, and text messages to our business, if we are unable to successfully deliver emails, push notifications, or text messages to our users or if users consistently decline to open our emails, push notifications, or text messages, our business could be adversely affected.
We also face a risk that service providers or email applications may block bulk message transmissions or otherwise experience technical difficulties that result in our inability to successfully deliver emails, push notifications, or text messages to our users. Third parties may also block our emails as spam, impose restrictions on our emails, push notifications, or text messages, or start to charge for the delivery of emails through their email systems. In addition, changes in how webmail applications organize and prioritize email may reduce the number of users opening our emails. For example, Google’s Gmail service has a feature that organizes incoming emails into categories (for example, primary, social and promotions). Such categorization or similar inbox organizational features may result in our emails being delivered in a less prominent location in a user’s inbox or viewed as “spam” by our users and could reduce the likelihood of that user opening our emails.
Email communications may subject us to potential risks, such as liabilities or claims resulting from unsolicited email or spamming, lost or misdirected messages, security breaches, illegal or fraudulent use of email or personal information or interruptions or delays in email service. For example, in the U.S., the CAN-SPAM Act establishes certain requirements for the distribution of “commercial” email messages and provides for penalties for transmission of commercial email messages that are intended to deceive the recipient as to source or content. In addition, some countries and states have passed laws regulating commercial email practices that are, in some cases, significantly more punitive and difficult to comply with than the CAN-SPAM Act.
Push notifications and text messages may subject us to potential risks, including liabilities or claims relating to consumer protection laws. For example, the Telephone Consumer Protection Act of 1991, or the TCPA, restricts telemarketing and the use of automatic SMS text messages without proper consent. The Federal Trade Commission, or the FTC, has guidelines that impose responsibilities on companies with respect to communications with consumers, such as text messages, and impose fines and liability for failure to comply with rules with respect to advertising or marketing practices it may deem misleading or deceptive. Furthermore, a number of states and countries have enacted statutes that address telemarketing through SMS text messages. Restrictions on marketing through text messages are enforced in the U.S. by the FTC, the Federal Communications Commission, state agencies and through the availability of statutory damages and class action lawsuits for violations of the TCPA or similar laws. The scope and interpretation of the laws that are or may be applicable to our use of push notifications and text messages are continuously evolving and developing. If we do not comply with these laws or regulations, are named in a lawsuit involving these laws or regulations, or if we become liable under these laws or regulations, we could be harmed, and we could be forced to implement new marketing methods, which could be costly or ineffective.
Without the ability to deliver emails, push notifications, and text messages to our users we may have limited means of maintaining contact and inducing them to use our platform. Due to the importance of email, push notifications, and text messages to our business, any disruptions or restrictions on the distribution or receipt of emails, push notifications, or text messages or increase in the associated costs could have a material adverse effect on our business and operating results.
15
Technologies have been developed that can block the display of our ads, which could adversely affect our financial results.
We generate a significant portion of our revenue from advertising, and technologies have been developed, and will likely continue to be developed, that can block the display of our ads on our website and our mobile applications. These technologies could have had an adverse effect on our financial results and, if such technologies continue to proliferate, in particular with respect to mobile platforms, our future financial results may be harmed.
A failure in or breach of our operational or security systems or infrastructure, or those of third parties with which we do business, including as a result of cyber-attacks, could disrupt our businesses, result in the disclosure or misuse of confidential or proprietary information, damage our reputation, increase our costs and cause losses.
Our ability to attract, retain and serve our users and conduct business may be adversely affected by any significant and widespread disruption to our infrastructure or systems. The incidence of malicious technology-related events, such as cyber-attacks, computer hacking, computer viruses, worms or other destructive or disruptive software, distributed denial of service attacks or other malicious activities (or any combination of these events) are on the rise worldwide and constantly evolving. From time to time, we may become the victim of these types of attacks. Our technologies, systems, networks and our users’ devices have been subject to, and are likely to continue to be the target of, cyber-attacks, computer viruses, malicious code, phishing attacks or information security breaches that could result in the unauthorized release, gathering, monitoring, misuse, loss or destruction of confidential, proprietary and other information of the Company, our employees or sensitive information provided by our users, or otherwise disrupt our or our users’ or other third parties’ business operations.
Disruptions or failures in the physical infrastructure or operating systems that support our businesses and users, or cyber-attacks or security breaches of the networks, systems or devices that our users use to access our products and services could result in the loss of users and business opportunities, significant business disruption to the Company’s operations and business, misappropriation of the Company’s confidential information and/or that of its users, or damage to the Company’s computers or systems and/or those of its users and/or counterparties, and could result in violations of applicable privacy laws and other laws, litigation exposure, regulatory fines, penalties or intervention, loss of confidence in the Company’s security measures, reputational damage, and additional compliance costs. Furthermore, we may become a victim of security breaches, such as the misappropriation, misuse, leakage, falsification or accidental release or loss of user, customer or vendor data maintained in our information technology systems or those of third parties with whom we do business (or upon whom we otherwise rely in connection with our day to day operations). While we continuously develop and maintain systems to detect and prevent events of this nature from impacting our various businesses, these efforts are costly and require ongoing monitoring and updating as technologies change and efforts to overcome preventative security measures become more sophisticated. Furthermore, we may become a victim of security breaches, such as the misappropriation, misuse, leakage, falsification or accidental release or loss of user, customer or vendor data maintained in our information technology systems or those of third parties with whom we do business (or upon whom we otherwise rely in connection with our day to day operations).
If we experience computer malware, viruses, hacking and phishing attacks, and spamming, it could harm our business.
Security breaches, computer malware and computer hacking, and phishing attacks are prevalent in the social media industry, have occurred on our systems in the past and may occur on our systems in the future. Because the techniques used to obtain unauthorized access, disable or degrade service, or sabotage systems change frequently, we may be unable to anticipate these techniques or implement adequate preventative measures. Any security breach caused by hacking, which involves efforts to gain unauthorized access to information or systems, or to cause intentional malfunctions or loss or corruption of data, software, hardware or other computer equipment, or the inadvertent transmission of computer viruses could harm our business, financial condition and operating results. We have experienced and expect to continue to experience hacking attacks. Though it is difficult to determine what harm may directly result from any specific interruption or breach, any failure to maintain performance, reliability, security and availability of our network infrastructure to the satisfaction of our users could harm our reputation and our ability to retain existing users and attract new users. If an actual or perceived breach of our security occurs, the market perception of the effectiveness of our security measures could be harmed, we could lose users, and we could suffer financial exposure due to such events or in connection with remediation efforts, investigation costs, litigation, changed security, and system protection measures.
Increased government regulation could adversely affect our business.
Due to the rapid growth and widespread use of mobile applications and the Internet, national and local governments are enacting and considering various laws and regulations. In February of 2015, for example, the United States Federal Communication Commission announced its “net neutrality” intention of regulating broadband Internet providers as common carriers under Title II of the Communications Act of 1934 and Section 706 of the Telecommunications Act of 1996. We face uncertainty as to the impact of this decision and other government regulation on our business. New laws and regulations designed to protect consumers
16
could adversely affect our business and operations by exposing us to substantial compliance costs and liabilities and impeding growth in use of mobile applications or the Internet. Furthermore, the application of existing domestic laws and regulations remains somewhat unclear, and courts may apply these laws in unintended and unexpected ways. While online dating and social networking websites are not currently required to verify the age or identity of their members or to run criminal background checks on them, for example, any such requirements could increase our cost of operations or discourage use of our services.
As a provider of social networking products with a membership-based element, we are also subject to laws and regulations in certain U.S. states and other countries that apply to our automatically-renewing membership payment models. Certain U.S. states and certain countries in Asia also have laws that specifically govern dating services.
As we continue to expand internationally, both with our acquisition of Lovoo and our increased number of international users, we could also become increasingly subject to foreign laws and regulations which could be inconsistent from country to country. Foreign governments could restrict mobile applications or Internet social networking usage, pass laws that negatively impact our business, or prosecute us for our services. We could incur substantial liabilities for expenses necessary to comply with laws and regulations or penalties for any failure to comply. Additionally, restrictions and compliance costs associated with current and possible future laws and regulations could harm our business and operating results.
If laws that tax usage and sales on the Internet are enacted, increased taxes could adversely affect the commercial use of our marketing services and our financial results.
Due to the global nature of mobile applications and the Internet, it is possible that governments might attempt to tax our activities, including the sale of virtual currency. New or revised tax regulations may subject us to additional sales, use, income, and other taxes. We cannot predict the effect of current attempts to impose sales, income, or other taxes on commerce over the Internet. New or revised taxes and especially sales taxes would likely increase the cost of doing business online, reduce sales, and decrease the attractiveness of advertising on mobile applications or the Internet. Any of these events could have an adverse effect on our business and results of operations.
Our failure to comply with existing or future laws, regulations or user concerns regarding privacy and protection of user data could adversely affect our business.
We have posted our own privacy policies concerning the collection, use, and disclosure of user data. Any actual or perceived failure by us to comply with our privacy policies or with any data-related consent orders, Federal Trade Commission requirements or orders, or other federal, state or foreign privacy or consumer protection-related laws, regulations or industry self-regulatory principles, or any compromise of security that results in the unauthorized release or transfer of personally identifiable information or other user data, could result in proceedings or actions against us by governmental entities, consumer advocacy groups, individuals, or others, which could have an adverse effect on our business. In addition, there are numerous privacy laws in the countries in which we operate regarding privacy and the storage, sharing, use, processing, disclosure and protection of this kind of information, the scope of which are changing, inconsistent and conflicting and subject to differing interpretations. Our efforts to protect the information that our users have chosen to share may be unsuccessful due to the actions of third parties, software bugs or other technical malfunctions, employee error or malfeasance, or other factors. In addition, third parties may attempt to fraudulently induce employees or users to disclose information in order to gain access to our data or our users’ data. If any of these events occur, our users’ information could be accessed or disclosed improperly.
While we believe that we comply with industry standards and applicable laws and industry codes of conduct relating to privacy and data protection, there is no assurance that we will not be subject to claims that we have violated applicable laws or codes of conduct or that we will be able to successfully defend against such claims. Further, actual or perceived failure by us to comply with our policies, applicable requirements, or industry self-regulatory principles related to the collection, use, sharing or security of personal information, or other privacy or data protection-related matters could result in a loss of user confidence in us, damage to our brands, and ultimately in a loss of users and advertising partners, any of which could adversely affect our business.
We have been subject to regulatory investigations and governmental legal proceedings and we expect to be subject to the same in the future, which could cause us to incur substantial costs or require us to change our business practices in a manner materially adverse to our business.
From time to time, we receive inquiries from regulators and other governmental entities regarding our compliance with laws and other matters. On February 3, 2014, the San Francisco City Attorney filed a complaint against the Company in the Superior Court of the State of California, County of San Francisco, alleging that the Company engaged in unfair business practices with respect to its use of information relating to minors, and particularly with respect to location information and the Company’s disclosure of such use. On August 7, 2015, the Company entered into a Settlement and Mutual Release (the “Settlement and Release”") with
17
the People of the State of California (the “People”) resolving all claims relating to this case. Pursuant to the Settlement and Release, the Company agreed, inter alia, to (i) implement a number of privacy-related product changes, (ii) restate its Terms of Service and Privacy Policy, and (iii) pay $200,000 to the People. On August 19, 2015, the Court dismissed the litigation with prejudice.
We anticipate that we will continue to be a target for regulators and other governmental entity inquiry, particularly given the uptick in enforcement actions. Responding to or defending such actions could cause us to incur substantial expenses and divert our management’s attention. If we are unsuccessful, we could be subject to substantial monetary fines and other penalties that could negatively affect our financial condition and results of operations; furthermore, we could have to change our business practices which could impair our ability to obtain new users or provide service to our users. Any change in our business practices or defense of a legal action or regulatory investigation or action could reduce our future revenues and increase our costs and adversely affect our future operating results.
Violation of existing or future regulatory or judicial orders or consent decrees could subject us to substantial monetary fines and other penalties that could negatively affect our financial condition and results of operations. In addition, future orders issued by, or enforcement actions initiated by, regulatory authorities could cause us to incur substantial costs or require us to change our business practices in a manner adverse to our business.
If our users fail to comply with existing or future laws and regulations, it could adversely affect our business.
We provide platforms for meeting new people. Although we devote substantial resources to member services and safety, our users have in the past and will likely in the future commit crimes against other users or violate other laws in interacting with such users, which could impair our brands and raise the prospect of litigation that may be costly to defend. Additionally, any inappropriate content or behavior by our users could cause our mobile apps to be removed from the App Store and/or Google Play, which could adversely affect our business.
We face certain risks related to the physical and emotional safety of our users.
The nature of online services that connect new people is such that we cannot control the actions of our users in their communication or physical actions. There is a possibility that one or more of our users could be physically or emotionally harmed following interaction with another one of our users. This has happened in the past and we expect it will continue to happen in the future. Given our lack of physical presence, we do not take any action to ensure personal safety on a meeting between users arranged following contact initiated with our apps. If an unfortunate incident of this nature occurred in a meeting of two people following contact initiated on our app or on the platform of one of our competitors, any resulting negative publicity could materially and adversely affect us or our industry in general. Any such incident involving our apps could damage our reputation and our brands. In addition, the affected users could initiate legal action against us, which could cause us to incur significant expense, whether we were successful or not, and damage our reputation. Concerns for such harms and the use of dating products and social networking platforms for illegal conduct could produce future legislation or other governmental action that could require changes to our products, restrict or impose additional costs upon the conduct of our business or cause users to abandon our products.
Shareholder activism could cause a disruption to our business.
On June 27, 2017 and January 5, 2018, the Company entered into Cooperation Agreements with Harvest Small Cap Partners Master Ltd., Harvest Small Cap Partners, LP, Harvest Small Cap Partners GP, LLC, Harvest Capital Strategies, LLC, and Jeff Osher (collectively “Harvest”) and Kanen Wealth Management LLC and David L. Kanen (collectively, “Kanen”), respectively. Each of Harvest and Kanen own shares or had previously owned shares of the Company’s common stock. Pursuant to their respective Cooperation Agreements, we agreed to make certain changes to the composition of our Board in exchange for each of Harvest's and Kanen's agreement to certain customary standstill provisions. Activist investors may continue to attempt to effect changes in our strategic direction and how we are governed, or to acquire control. While we welcome varying opinions from all shareholders, activist campaigns that contest or conflict with our strategic direction could have an adverse effect on our results of operations and financial condition as responding to proxy contests and other actions by activist shareholders can disrupt our operations, be costly and time-consuming, and divert the attention of our board and senior management from the pursuit of business strategies.
The requirements of being a public company may strain our resources and divert management's attention.
We are subject to the reporting requirements of the Securities Exchange Act of 1934, as amended, the Sarbanes-Oxley Act, the Dodd-Frank Act, the listing requirements of the NASDAQ Capital Market, and other applicable securities rules and regulations. Compliance with these rules and regulations has increased and may continue to increase our legal and financial compliance costs, make some activities more difficult, time-consuming, or costly, and increase demand on our systems and resources. As a result,
18
management's attention may be diverted from other business concerns, which could harm our business and operating results. In addition, complying with public disclosure rules makes our business more visible, which could result in threatened or actual litigation, including by competitors and other third parties. If such claims are successful, our business and operating results could be harmed, and even if the claims do not result in litigation or are resolved in our favor, these claims, and the time and resources necessary to resolve them, could divert the resources of our management and harm our business and operating results.
If we do not attract and retain highly qualified employees, we may not be able to grow effectively.
Our ability to compete and grow depends in large part on the efforts and talents of our executive officers and other employees. Such employees, particularly product managers and engineers for both web and mobile applications, quality assurance personnel, graphic designers and salespeople, are in high demand, and we devote significant resources to identifying, hiring, training, successfully integrating and retaining these employees. We require certain key employees to enter into employment agreements, but in the U.S. employees are free to leave an employer at any time without penalties. The loss of key employees or the inability to hire additional skilled employees as necessary could result in significant disruptions of our business, and the integration of replacement personnel could be time-consuming and expensive and cause us additional disruptions.
If we experience any failure or significant interruption in our network, it could harm our business.
Our technology infrastructure is critical to the performance of our mobile applications and website and to user satisfaction. Any damage to or failure of our systems or our inability to scale our systems could result in interruptions in our service. We lease space for our data center and rely on a co-location partner for power, security, connectivity and other services. We also rely on cloud service providers for much of our data storage needs, and rely on third party providers for bandwidth and content delivery. We do not control these vendors and it would take significant time and effort to replace some of them. We have experienced, and may in the future experience, website disruptions, outages, and other performance problems due to a variety of factors, including infrastructure changes, human or software errors, and capacity constraints. Our systems are vulnerable to damage or interruption from terrorist attacks, floods, fires, power loss, telecommunications failures, hurricanes, computer viruses, computer denial of service attacks, hacker attacks, or other attempts to harm our systems. Our apps have experienced, for example, denial of service and other hacker attacks in the past, and we expect such attacks will continue to occur in the future. If our mobile applications or website are unavailable when users attempt to access them or navigation through an application is slower than they expect, users may stop using them and become less likely to return as often, if at all. We expect to continue to make significant investments in our technology infrastructure to maintain and improve all aspects of user experience. To the extent that our disaster recovery systems are not adequate, or we do not effectively address capacity constraints, upgrade our systems and continually develop our technology and network architecture to accommodate current and increasing traffic, our business and operating results could suffer.
Because our software is highly technical, undetected errors, if any, could adversely affect our business.
Our products incorporate software that is highly technical and complex. Our software has contained, and may now or in the future contain, undetected errors, bugs, flaws, corrupted data or vulnerabilities. Some errors in our software code may only be discovered after the code has been released. Any errors, bugs, flaws, corrupted data or vulnerabilities discovered in our code after release could result in damage to our reputation, loss of users, loss of revenue, or liability for damages, any of which could adversely affect our business and financial results.
If we cannot protect our intellectual property rights, we may be unable to compete with competitors developing similar products.
We regard the protection of our trademarks, trade dress, domain names, trade secrets, copyrights, and other intellectual property rights as critical to our success. We strive to protect our intellectual property by relying on federal, state, and common law rights, as well as foreign rights and contractual restrictions. We pursue the registration of domain names and trademarks in the U.S. and a number of foreign jurisdictions, a process that is expensive and time-consuming and may not be successful or inclusive enough. Our efforts may not prevent misappropriation of our intellectual property or deter the independent development of similar products by others. Failure to protect our intellectual property rights could harm our business and operating results and circumstances beyond our control could threaten our intellectual property rights. Although we have taken measures to protect our proprietary rights, there can be no assurance that others will not offer products or concepts that are substantially similar to ours and compete with our business. We regularly contribute software source code under open source licenses and have made other technology we developed available under other open licenses, and we include open source software in our products. As a result of our open source contributions and the use of open source in our products, we may license or be required to license innovations that could turn out to be material to our business and we could also be exposed to increased litigation risk. If the protection of our proprietary rights is inadequate to prevent unauthorized use or appropriation by third parties, the value of our brands and other intangible assets
19
could be diminished and competitors may be able to more effectively mimic our service and methods of operations. Any of these events could have an adverse effect on our business and financial results.
If we become subject to intellectual property infringement claims, it could cause us to incur significant expenses, pay substantial damages and prevent service delivery.
Companies in the mobile application, Internet, social media technology, and other industries, as well as individual artists and entertainers, own large numbers of patents, copyrights, and trademarks and frequently request license agreements, threaten litigation, or file suit based on allegations of infringement or other violations of intellectual property rights. From time to time, we face, and expect to face in the future, legal actions and other allegations that we have infringed the trademarks, copyrights, patents and other intellectual property rights of third parties, including competitors and non-practicing entities. As we face increasing competition and as our business grows and changes, we could face more claims of infringement. Any such claims, regardless of merit or outcome, could result in substantial costs, adverse publicity or diversion of management and technical resources, any of which could adversely affect our business and operating results. If we do not prevail against such claims, we could be required to pay substantial damages and/or be obligated to indemnify our business partners. Furthermore, we could be prevented from providing products and services unless we enter into license or other agreements. We may not be able to obtain such agreements at all or on terms acceptable to us, and as a result, we could be precluded from offering certain products and services.
Class action lawsuits or other litigation matters are expensive and time consuming, and could harm our business, financial condition, or results of operations.
In addition to intellectual property claims, we may also become involved in numerous other lawsuits, including putative class action lawsuits brought by users and marketers, or litigation relating to our business transactions or related third party transactions. We anticipate that we will continue to be a target for such lawsuits, particularly given the uptick in class action lawsuits. Defending such lawsuits or any negative outcomes from them could result in payments of substantial fees, monetary damages or fines, or changes to our products or business practices, and accordingly our business, financial condition, or results of operations could be adversely affected. Any litigation to which we are a party may result in an onerous or unfavorable judgment that may not be reversed upon appeal or in payments of substantial monetary damages or fines, or we may decide to settle lawsuits on similarly unfavorable terms, which could adversely affect our business, financial condition, or results of operations.
We utilize debt financing and such indebtedness could adversely affect our business, financial condition, results of operations and earnings per share. We may be unable to meet our payment obligations.
We incur indebtedness to finance our operations and we have substantial amounts of outstanding indebtedness and debt service requirements. Our credit facility contains customary affirmative, negative and financial covenants. Our ability to meet our payment and other obligations and covenants under our indebtedness depends on our ability to generate significant cash flow. This, to some extent, is subject to general economic, financial, competitive, legislative and regulatory factors as well as other factors that are beyond our control. There is no assurance that our business will generate cash flow from operations, or that future borrowings will be available to us under our existing (or any amended) credit facilities or otherwise, in an amount sufficient to enable us to meet payment obligations under any indebtedness we may incur from time to time. If we are not able to generate sufficient cash flow to service our debt obligations or meet required debt covenants, we may need to refinance or restructure our debt, sell assets, reduce or delay capital investments, or seek to raise additional capital. There is no assurance that we will be able to implement any of these alternatives on commercially reasonable terms, if at all. If we are unable to implement one or more of these alternatives, we may not be able to meet our payment obligations under any indebtedness we owe. In addition, an inability to meet our payment obligations under any indebtedness may trigger a default, and possible acceleration of payment terms, under the applicable debt financing agreements.
Risks Related to our Stock
Because our stock price may be volatile due to factors beyond our control, you could lose all or part of your investment.
Our operating results have been in the past, and in the future are likely to be, subject to quarterly and annual fluctuations as a result of numerous factors, including:
• | changes in the number of our daily and monthly active users; |
• | changes in visits by our active users; |
• | independent reports relating to the metrics of our mobile applications or website; |
• | our failure to generate increases in revenue; |
• | our failure to meet the challenges of monetizing our users; |
20
• | our failure to achieve or maintain profitability; |
• | actual or anticipated variations in our quarterly results of operations; |
• | announcements by us or our competitors of significant contracts, new services, or acquisitions; |
• | commercial relationships, joint ventures, or capital commitments; |
• | the loss of significant business relationships; |
• | changes in market valuations of social media companies; |
• | the loss of major advertisers; |
• | future acquisitions or combinations; |
• | the departure of key personnel; |
• | short selling activities; or |
• | regulatory developments. |
In the past, following periods of volatility in the market price of a company’s securities, securities class action litigation has often been instituted. A securities class action suit against us could result in substantial costs and divert our management’s time and attention, which could adversely affect our business, financial condition or results of operations.
Because we may issue preferred stock without the approval of our shareholders, it could be more difficult for a third party to acquire us and could depress our stock price.
Our Board of Directors, or Board, may issue, without a vote of our shareholders, one or more additional series of preferred stock that have more than one vote per share. This could permit our Board to issue preferred stock to investors who support our management and give effective control of our business to our management. Additionally, issuance of preferred stock could block an acquisition resulting in both a drop in our stock price and a decline in interest of our common stock. This could make it more difficult for shareholders to sell their common stock. This could also cause the market price of our common stock shares to drop significantly, even if our business is otherwise performing well.
Because most of our outstanding shares are freely tradable, sales of these shares could cause the market price of our common stock to drop significantly, even if our business is otherwise performing well.
As of March 12, 2018, we had 72,040,500 shares of common stock outstanding of which our directors and executive officers beneficially own approximately 5% which are subject to the limitations of Rule 144 under the Securities Act. Most of the remaining outstanding shares, including a substantial amount of shares issuable upon the exercise of warrants and options, are and will be freely tradable. Because most of our outstanding shares are freely tradable and a number of shares held by our affiliates may be freely sold (subject to Rule 144 limitation), sales of these shares could cause the market price of our common stock to drop significantly, even if our business is otherwise performing well.
If registration rights that we have previously granted are exercised, or if we grant additional registration rights in the future, the price of our common stock may be adversely affected.
We may be obligated to register with the Securities and Exchange Commission shares of common stock, which may then be sold in the open market. The sale of a significant amount of shares in the open market, or the perception that these sales may occur, could cause the trading price of our common stock to decline or become highly volatile.
If securities or industry analysts publish inaccurate or unfavorable research about our business, our stock price could decline.
The trading market for our common stock may depend in part on the research and reports that securities or industry analysts publish about us or our business. Because few securities or industry analysts currently cover our business, undue weight could be placed on any one analyst report. If one or more of the analysts who cover us downgrade our common stock or publish inaccurate or unfavorable research about our business, our common stock price could decline.
We may require additional capital to meet our financial obligations and support business growth, which might not be available on acceptable terms or at all.
We intend to continue to make significant investments to support our business growth and may require additional funds to respond to business challenges, including the need to develop new applications or enhance our existing applications with new or improved features such as Live Video, improve our operating infrastructure or acquire complementary businesses, personnel and technologies. Accordingly, we may need to engage in equity or debt financings to secure additional funds. If we raise additional funds through future issuances of equity or convertible debt securities, our existing shareholders could suffer significant dilution, and any new
21
equity securities we issue could have rights, preferences and privileges superior to those of holders of our common stock. Any debt financing we secure in the future could involve restrictive covenants relating to our capital raising activities and other financial and operational matters, which could make it more difficult for us to obtain additional capital and to pursue business opportunities, including potential acquisitions. Our ability to raise additional funds may be directly related to the strength of the capital and financial markets and the economy both in the U.S. and internationally. We may not be able to obtain additional financing on terms favorable to us, if at all. Additionally, if our existing resources are insufficient to satisfy our liquidity requirements, we may need to borrow money or sell additional equity or debt securities. If we are unable to obtain adequate financing or financing on terms satisfactory to us when we require it, our ability to continue to support our business growth and to respond to business challenges could be significantly impaired, and our business could be harmed.
If we default on our leasing and credit obligations, our operations may be interrupted and our business and financial results could be adversely affected.
We finance a portion of our expenditures through leasing arrangements, some of which are not required to be reflected on our balance sheet, and we may enter into additional similar arrangements in the future. In particular, we have used these types of arrangements to finance some of our equipment and data centers. If we default on these leasing and credit obligations, our leasing partners and lenders may, among other things:
• | require repayment of any outstanding lease obligations; |
• | terminate our leasing arrangements; |
• | stop delivery of ordered equipment; |
• | sell or require us to return our leased equipment; or |
• | require us to pay significant damages. |
If some or all of these events were to occur, our operations could be interrupted and our ability to fund our operations or obligations, as well as our business, financial results, and financial condition, could be adversely affected.
Our ability to use our net operating loss carry forwards to offset future taxable income for U.S. federal income tax purposes could be limited.
As of December 31, 2017, we had federal and state net operating loss carry forwards, or NOLs, of $68.6 million available to offset future taxable income, that we believe are not currently subject to an annual limitation under Section 382 of the Internal Revenue Code, or the Code. Our ability to use our NOLs may be limited if we undergo an “ownership change,” as defined in Section 382 of the Code. An ownership change could be triggered by substantial changes in the ownership of our outstanding stock. For example, an ownership change would occur if certain shareholders increase their aggregate percentage ownership of our stock by more than 50 percentage points over their lowest percentage ownership at any time during the testing period, which is generally the three-year period preceding any potential ownership change.
The Tax Cuts and Jobs Act imposes limitations on the utilization of NOLs generated after December 31, 2017 to 80% of taxable income. In addition, our ability to use any NOLs depends on the amount of taxable income that we generate in future periods. The NOLs may expire before we can generate sufficient taxable income to use them. The Company has provided a full valuation allowance on the deferred tax assets, consisting primarily of net operating losses, because evidence does not indicate that the deferred tax assets will more likely than not be realized. The NOLs, if not offset against future income, will begin to expire at various dates through 2035.
Short sellers of our stock may be manipulative and may drive down the market price of our common stock.
Short selling is the practice of selling securities that the seller does not own but rather has borrowed or intends to borrow from a third party with the intention of buying identical securities at a later date to return to the lender. A short seller hopes to profit from a decline in the value of the securities between the sale of the borrowed securities and the purchase of the replacement shares, as the short seller expects to pay less in that purchase than it received in the sale. As it is therefore in the short seller’s interest for the price of the stock to decline, some short sellers publish, or arrange for the publication of, opinions or characterizations regarding the relevant issuer, its business prospects and similar matters calculated to or which may create negative market momentum, which may permit them to obtain profits for themselves as a result of selling the stock short. Issuers, like us, whose securities have historically had limited trading volumes and/or have been susceptible to relatively high volatility levels can be particularly vulnerable to such short seller attacks. The publication of such commentary has, and may in the future, cause a temporary, or possibly long term, decline in the market price of our common stock. No assurances can be made that declines in the market price of our common stock will not occur in the future in connection with such commentary by short sellers or otherwise.
22
Risks Related to the Acquisitions of Skout, if(we) and Lovoo
We face additional risks as a result of our acquisitions of Skout, if(we) and Lovoo and may be unable to integrate our businesses successfully and realize the anticipated synergies and related benefits of the acquisition or do so within the anticipated timeframe.
We completed our acquisitions of Skout, if(we) and Lovoo (collectively, the “Acquired Companies”) on October 3, 2016, April 3, 2017 and October 19, 2017, respectively (individually, the “Skout Acquisition”, the “if(we) Acquisition” and the “Lovoo Acquisition” and, collectively, the “Acquisitions”). Each Acquisition involved a combination of two companies that previously operated as independent companies, and, as a result of the Acquisitions, the combined company faces various additional risks, including, among others, the following:
• | our inability to successfully evaluate and utilize the Acquired Companies’ products, technology or personnel; |
• | disruption to the Acquired Companies’ businesses and operations and relationships with service providers, advertisers, employees and other partners; |
• | negative effects on our products and product pipeline from the changes and potential disruption that may follow the Acquisitions; |
• | diversion of our management’s attention from other strategic activities; |
• | our inability to successfully combine the businesses in a manner that permits the combined company to achieve the cost savings anticipated to result from the Acquisitions; |
• | diversion of significant resources from the ongoing development of our existing operations; and |
• | greater than anticipated costs related to the integration of the Acquired Companies’ businesses and operations into ours. |
Our ability to execute all such plans will depend on various factors, many of which remain outside our control. Any of these risks could adversely affect our business and financial results.
The process of integrating the Acquired Companies’ operations into our operations could result in unforeseen operating difficulties and require significant resources.
The following factors, among others, could reduce our revenues and earnings, increase our operating costs, and result in a loss of projected synergies:
• | if we are unable to successfully integrate the benefit plans, duties and responsibilities, and other factors of interest to the management and employees of the Acquired Companies, we could lose employees to our competitors, which could significantly affect our ability to operate the business and complete the integration; |
• | if we are unable to implement and retain uniform standards, controls, policies, procedures and information system; and |
• | if the integration process causes any delays with the delivery of our services, or the quality of those services, we could lose users and ultimately advertisers, which would reduce our revenues and earnings. |
The process of integrating the Acquired Companies and their associated technologies involves numerous risks that could materially and adversely affect our results of operations or stock price.
The following factors, among others, could materially and adversely affect our results of operations or stock price:
• | expenses related to the acquisition process and impairment charges to goodwill and other intangible assets related to the Acquisitions; |
• | the dilutive effect on earnings per share as a result of issuances of stock and incurring operating losses; |
• | stock volatility due to investors' uncertainty regarding the values of the Acquired Companies; |
• | diversion of capital from other uses; |
• | failure to achieve the anticipated benefits of the Acquisitions in a timely manner, or at all; and |
• | adverse outcome of litigation matters or other contingent liabilities assumed in or arising out of the Acquisitions. |
23
Notwithstanding the due diligence investigations we performed in connection with the Acquisitions, the Acquired Companies may have liabilities, losses, or other exposures for which we do not have adequate insurance coverage, indemnification, or other protection.
While we performed significant due diligence on each of the Acquired Companies prior to the Acquisitions, we are dependent on the accuracy and completeness of statements and disclosures made or actions taken by Skout, if(we) and Lovoo and each of their respective representatives when conducting due diligence and evaluating the results of such due diligence. We did not control and may be unaware of activities of Skout, if(we) or Lovoo before the Acquisitions, including intellectual property and other litigation claims or disputes, information security vulnerabilities, violations of laws, policies, rules and regulations, commercial disputes, tax liabilities and other known and unknown liabilities.
Our post-closing recourse from the Acquired Companies is limited under their respective acquisition agreements.
Skout’s obligation to indemnify us is limited to, among others, breaches of specified representations and warranties and covenants included in the merger agreement for the Skout Acquisition (the “Skout Merger Agreement”) and other specific indemnities as set forth in the Skout Merger Agreement. Except in the event Skout breaches a Fundamental Representation (as defined in the Skout Merger Agreement), we cannot make a claim for indemnification pursuant to the Skout Merger Agreement unless and until the indemnifiable losses exceed $250,000 and we cannot make a claim for a breach of a non-Fundamental Representation after the date that is 18 months after the date of closing of the Skout Acquisition. If any issues arise post-closing, we may not be entitled to sufficient, or any, indemnification or recourse from Skout, which could have a material adverse impact on our business and results of operations.
if(we)’s obligation to indemnify us is limited to, among others, breaches of specified representations and warranties and covenants included in the merger agreement for the if(we) Acquisition (the “if(we) Merger Agreement”) and other specific indemnities as set forth in the if (we) Merger Agreement. Except in the event if(we) breaches a Fundamental Representation (as defined in the if(we) Merger Agreement), we cannot make a claim for indemnification pursuant to the if (we) Merger Agreement (i) for any individual Loss (as defined in the if(we) Merger Agreement) or group of related Losses until such Loss of group of related Losses exceeds $25,000 and (ii) unless and until the indemnifiable Losses exceed $300,000 and we cannot make a claim for a breach of a non-Fundamental Representation after the date that is 12 months after the date of closing of the if(we) Acquisition. If any issues arise post-closing, we may not be entitled to sufficient, or any, indemnification or recourse from if(we), which could have a material adverse impact on our business and results of operations.
Lovoo’s obligation to indemnify us is limited to, among others, breaches of specified representations and warranties and covenants included in the purchase agreement for the Lovoo Acquisition (the “Lovoo Purchase Agreement”) and other specific indemnities as set forth in the Lovoo Purchase Agreement. Except in the event Lovoo breaches a Fundamental Representation (as defined in the Lovoo Purchase Agreement), we cannot make a claim for indemnification pursuant to the Lovoo Purchase Agreement (i) for any Guarantee Claims (as defined in the Lovoo Purchase Agreement) resulting from an individual breach unless such breach exceeds $65,000 (provided that Guarantee Claims of the same or similar and nature shall be aggregated) and (ii) unless and until the aggregate amount of all Guarantee Claims resulting from all individual breaches exceeds $650,000, and we cannot make a claim for a breach of a non-Fundamental Guarantee after the date that is 24 months after the date of closing of the Lovoo Acquisition. If any issues arise post-closing, we may not be entitled to sufficient, or any, indemnification or recourse from Lovoo, which could have a material adverse impact on our business and results of operations.
Foreign currency exchange rate fluctuations may affect our results of operations and financial results, which we report in U.S. dollars.
We operate in various international markets, primarily in various jurisdictions within the European Union, and as result are exposed to foreign exchange risk. We translate international revenues into U.S. dollar-denominated operating results and during periods of a strengthening U.S. dollar, our international revenues will be reduced when translated into U.S. dollars. In addition, as foreign currency exchange rates fluctuate, the translation of our international revenues into U.S. dollar-denominated operating results affects the period-over-period comparability of such results.
We accept cryptocurrency, such as bitcoins, as a form of payment which may subject us to exchange risk and additional tax and regulatory requirements.
In 2017, we began accepting Bitcoins as a form of payment on the Lovoo app. Bitcoin is not considered legal tender or backed by any government, and it has experienced price volatility, technological glitches and various law enforcement and regulatory interventions. The use of cryptocurrency such as bitcoin has been prohibited or effectively prohibited by some countries. If we fail to comply with regulations and prohibitions applicable to us, we could face regulatory or other enforcement actions and
24
potential fines and other consequences. We may also hold bitcoin and other cryptocurrencies directly, and we have exchange rate risk in the amounts we hold as well as the risks that regulatory or other developments may adversely affect the value of the cryptocurrencies we hold. There is substantial uncertainty regarding legal and regulatory requirements relating to cryptocurrencies or transactions utilizing cryptocurrencies. These uncertainties, as well as potential accounting and tax issues, or other requirements relating to cryptocurrencies could have a material adverse effect on our business.
ITEM 1B. UNRESOLVED STAFF COMMENTS.
None.
ITEM 2. PROPERTIES.
Our headquarters and technical operations are located in New Hope, Pennsylvania and consist of approximately 19,000 square feet of office space, of which 17,000 square feet expires in March 2022 and 2,000 square feet expires in April 2020. We also lease office space in Philadelphia, Pennsylvania, New York, New York, San Francisco, California and Dresden and Berlin, Germany. Our data centers are leased and operated in Secaucus, New Jersey and Santa Clara and San Francisco, California and Nuremberg, Bavaria, Germany.
ITEM 3. LEGAL PROCEEDINGS.
From time to time, we are party to certain legal proceedings that arise in the ordinary course and are incidental to our business. We operate our business online, which is subject to extensive regulation by federal and state governments.
On September 29, 2015, the Company filed suit in the Court of Common Pleas of Philadelphia County, Pennsylvania, against Beanstock Media, Inc. (“Beanstock”) and Adaptive Medias, Inc. (“Adaptive”) for collection of approximately $10 million, in the aggregate, due under the Media Publisher Agreement (the “Web Agreement”) entered into on September 25, 2013 and the Advertising Agreement (the “Mobile Agreement”) entered into on December 23, 2014.
Pursuant to the Web Agreement, Beanstock had the exclusive right and obligation to fill all of the Company’s remnant desktop in-page display advertising inventory on www.meetme.com (the “Site”), excluding, (i) any inventory sold to a third party under an insertion order that was campaign or advertiser specific, (ii) any inventory the Company reserved in existing and future agreements with third parties for barter transactions and as additional consideration as part of larger business development transactions, and (iii) any inventory reserved for premium advertising for the Site. Pursuant to the Mobile Agreement, Beanstock had the right and obligation to fill substantially all of the Company’s advertising inventory on its MeetMe mobile app for iOS and Android, as well as the Site when accessed using a mobile device and as optimized for mobile devices (collectively, the “App”). The Mobile Agreement did not apply to interstitially placed advertisements, advertisements on versions of the App specific to the iPad and other Apple tablet devices, other mobile apps or in-app products or features on the App, including, without limitation, offer wall features and the Company’s Social Theater business.
On September 28, 2015, Adaptive filed suit in the Superior Court of California, County of Orange, against the Company, Beanstock, et al., alleging, in pertinent part, that the Company “aided and abetted” an individual who was an officer and director of Adaptive to breach his fiduciary duty to Adaptive with respect to Adaptive’s joining the Mobile Agreement. Adaptive’s complaint sought from the Company $600,000 plus unspecified punitive damages. On January 20, 2016, the Company received notice from the United States Bankruptcy Court, District of Delaware, that a Chapter 7 bankruptcy case against Beanstock had been filed on October 7, 2015. Both of the state court actions were stayed by the courts as a result of the bankruptcy filing against Beanstock. The matter remained stayed until Adaptive indicated that it no longer wanted to pursue the matter and, on or about November 20, 2017, filed a voluntary request for dismissal without prejudice of the action and all claims against the parties, including the Company, which dismissal was entered by the Court on the same day. The Company was not required to take any action or pay any sum in connection with the dismissal. The matter is, therefore, resolved.
Future events or circumstances, currently unknown to management, will determine whether the resolution of pending or threatened litigation or claims will ultimately have a material effect on our consolidated financial position, liquidity or results of operations in any future reporting periods.
ITEM 4. MINE SAFETY DISCLOSURES
Not applicable.
25
PART II
ITEM 5. MARKET FOR REGISTRANT’S COMMON EQUITY, RELATED STOCKHOLDER MATTERS AND ISSUER PURCHASES OF EQUITY SECURITIES.
Our common stock is listed on the NASDAQ Capital Market under the symbol “MEET”. The last reported sales price of our common stock as reported by the NASDAQ Capital Market on March 12, 2018 was $2.34 per share.
The following table sets forth the quarterly high and low sales price information for the periods indicated. The prices shown represent quotations between dealers, without adjustment for retail markups, markdowns or commissions, and may not represent actual transactions.
For the Year Ended December 31, 2017 | High | Low | |||||
First quarter | $ | 6.20 | $ | 4.51 | |||
Second quarter | $ | 6.45 | $ | 4.50 | |||
Third quarter | $ | 5.45 | $ | 3.41 | |||
Fourth quarter | $ | 3.82 | $ | 2.19 | |||
For the Year Ended December 31, 2016 | |||||||
First quarter | $ | 4.54 | $ | 2.57 | |||
Second quarter | $ | 5.57 | $ | 2.71 | |||
Third quarter | $ | 8.11 | $ | 4.68 | |||
Fourth quarter | $ | 6.19 | $ | 4.51 | |||
Shareholders
According to the records of our transfer agent, there were 629 holders of record of our common stock as of March 12, 2018. Because many of these shares are held by brokers and other institutions on behalf of shareholders, we are unable to estimate the total number of shareholders represented by these record holders.
Dividend Policy
We have not paid cash dividends on our common stock and do not plan to pay such dividends in the foreseeable future. Our Board of Directors will determine our future dividend policy on the basis of many factors, including results of operations, capital requirements and general business conditions.
Recent Sales of Unregistered Securities
None.
Purchases of Equity Securities
On August 29, 2016, the Board of Directors authorized a $15 million share repurchase program (the “2016 Repurchase Program”). Repurchases under the 2016 Repurchase Program will be made in the open market or through privately negotiated transactions intended to comply with SEC Rule 10b-18, subject to market conditions, applicable legal requirements, and other relevant factors. The 2016 Repurchase Program did not obligate the Company to acquire any particular amount of common stock, and it could be suspended at any time at the Company’s discretion. During the year ended December 31, 2016, the Company repurchased 848,145 shares for an aggregate purchase price of $5.0 million. These shares were immediately retired. The Company did not repurchase any shares during the year ended December 31, 2017. The 2016 Repurchase Program was terminated on August 29, 2017.
26
Stock Performance Graph
The graph below matches The Meet Group’s cumulative 5-Year total shareholder return on common stock with the cumulative total returns of the Russell 2000 index and the RDG Internet Composite index. The graph tracks the performance of a $100 investment in our common stock and in each index (with the reinvestment of all dividends) from December 31, 2012 to December 31, 2017. The stock price performance of the following graph is not necessarily indicative of future stock price performance.
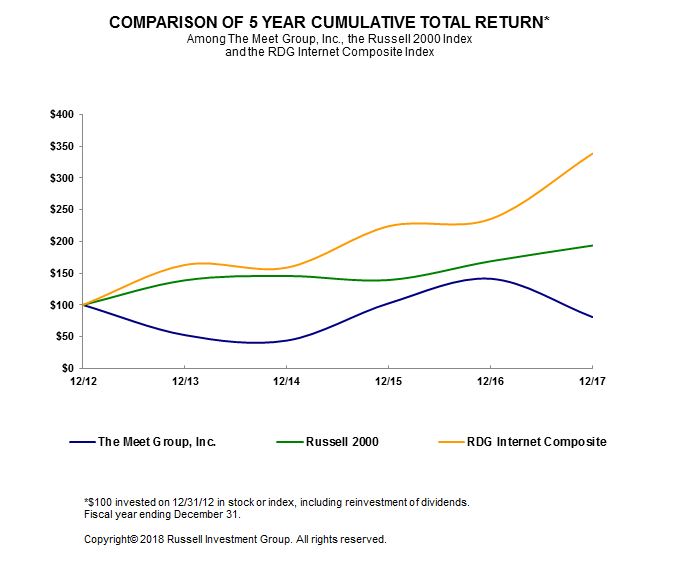
12/12 | 12/13 | 12/14 | 12/15 | 12/16 | 12/17 | |
The Meet Group, Inc. | 100.00 | 52.44 | 43.84 | 102.58 | 141.26 | 80.80 |
Russell 2000 | 100.00 | 138.82 | 145.62 | 139.19 | 168.85 | 193.58 |
RDG Internet Composite | 100.00 | 163.02 | 158.81 | 224.05 | 235.33 | 338.52 |
For information on securities authorized for issuance under our equity compensation see Part III, Item 12—Security Ownership of Certain Beneficial Owners and Management and Related Stockholder Matters.
27
ITEM 6. SELECTED FINANCIAL DATA.
The following table sets forth certain selected consolidated financial data. The information should be read in conjunction with Management’s Discussion and Analysis of Financial Condition and Results of Operations and our consolidated financial statements and notes thereto appearing elsewhere in this report.
For the Years Ended December 31, | |||||||||||||||||||
2017(1) | 2016(1) | 2015 | 2014 | 2013 | |||||||||||||||
Statements of Operations Data: | |||||||||||||||||||
Revenues | $ | 123,753,813 | $ | 76,124,109 | $ | 56,903,773 | $ | 44,817,436 | $ | 40,378,007 | |||||||||
Operating costs and expenses | 180,764,422 | 56,901,470 | 48,909,207 | 47,963,841 | 50,437,810 | ||||||||||||||
Income (loss) from operations | (57,010,609 | ) | 19,222,639 | 7,994,566 | (3,146,405 | ) | (10,059,803 | ) | |||||||||||
Net (loss) income | (64,591,727 | ) | 46,268,618 | 5,969,628 | (3,962,165 | ) | (10,898,325 | ) | |||||||||||
Basic and diluted net (loss) income per common stockholders: | |||||||||||||||||||
Basic net (loss) income per common stockholders | $ | (0.94 | ) | $ | 0.89 | $ | 0.13 | $ | (0.10 | ) | $ | (0.29 | ) | ||||||
Diluted net (loss) income per common stockholders | $ | (0.94 | ) | $ | 0.80 | $ | 0.12 | $ | (0.10 | ) | $ | (0.29 | ) | ||||||
Balance Sheet Data: | |||||||||||||||||||
Working capital | $ | 8,015,160 | $ | 32,678,157 | $ | 29,213,696 | $ | 17,482,116 | $ | 6,932,875 | |||||||||
Total assets | 275,344,771 | 209,489,484 | 111,490,673 | 103,213,759 | 95,576,240 | ||||||||||||||
Current portion of capital lease obligations | 254,399 | 221,302 | 366,114 | 872,761 | 928,181 | ||||||||||||||
Current portion of long-term debt | 15,000,000 | — | — | 2,068,326 | 2,333,966 | ||||||||||||||
Long-term capital lease obligations | 192,137 | — | 221,302 | 587,416 | 713,699 | ||||||||||||||
Long term debt | 40,637,106 | — | — | 556,612 | 2,102,842 | ||||||||||||||
Total stockholders' equity | 185,540,560 | 195,088,589 | 102,670,362 | 92,256,967 | 81,808,050 | ||||||||||||||
(1) | See Note 2— Acquisitions for further details on our Skout, if(we) and Lovoo Acquisitions. |
ITEM 7. MANAGEMENT’S DISCUSSION AND ANALYSIS OF FINANCIAL CONDITION AND RESULTS OF OPERATIONS
Cautionary Note Regarding Forward Looking Statements
This report includes forward-looking statements within the meaning of the Private Securities Litigation Reform Act of 1995 including statements regarding:
• | Liquidity; |
• | Capital expenditures; |
• | Opportunities for our business; |
• | Growth of our business; and |
• | Anticipations and expectations regarding mobile usage and monetization |
You should read the following discussion in conjunction with our audited historical consolidated financial statements, which are included elsewhere in this report. Management’s Discussion and Analysis of Financial Condition and Results of Operations contains forward-looking statements that reflect our plans, estimates, and beliefs. Our actual results could differ materially from those discussed in the forward-looking statements. Factors that could cause or contribute to these differences include those discussed elsewhere in this report, particularly in Part I, Item 1A—Risk Factors of this report.
All statements other than statements of historical facts contained in this report, including statements regarding our future financial position, liquidity, business strategy, plans and objectives of management for future operations, are forward-looking statements.
28
The words “believe,” “may,” “estimate,” “continue,” “anticipate,” “intend,” “should,” “plan,” “could,” “target,” “potential,” “is likely,” “expect,” and similar expressions, as they relate to us, are intended to identify forward-looking statements. We have based these forward-looking statements largely on our current expectations and projections about future events and financial trends that we believe may affect our financial condition, results of operations, business strategy and financial needs.
The results anticipated by any or all of these forward-looking statements might not occur. Important factors, uncertainties and risks that may cause actual results to differ materially from these forward-looking statements are contained in the Risk Factors contained herein. We undertake no obligation to publicly update any forward-looking statement, whether as a result of new information, future developments or otherwise. For more information regarding some of the ongoing risks and uncertainties of our business, see the Risk Factors set forth in Item 1A and our other filings with the SEC.
Company Overview
The Meet Group, Inc. (the “Company,” “The Meet Group,” “us,” or “we”) is a portfolio of mobile social entertainment apps designed to meet the universal need for human connection. We leverage a powerful live-streaming video platform, empowering our global community to forge meaningful connections. Our primary apps are MeetMe®, LOVOO®, Skout®, and Tagged®.
We operate location-based social networks for meeting new people, primarily on mobile platforms, including on iPhone, Android, iPad and other tablets, that facilitate interactions among users and encourage users to connect, communicate and engage with each other. In 2017, we laid the foundation for and launched live video, which we believe is the most compelling product we have ever offered. Having historically generated revenue primarily through advertising, live video and other forms of user-pay monetization, including subscriptions and in-app purchases, are becoming an increasingly larger component of total revenue. We believe revenues from video are more sustainable, can grow faster, and are more aligned with the quality of the user experience than revenues from advertising.
We launched live video monetization on two of our apps in 2017 and have seen strong early interest from our users, including increasing engagement and revenue. We also added two additional apps to The Meet Group portfolio. On April 3, 2017, we completed our acquisition of Ifwe Inc. (“if(we)”), a leading global mobile network for meeting new people, and on October 19, 2017, we completed our acquisition of Lovoo GmbH (“Lovoo”), a leading dating app provider in Germany. We believe these acquisitions, in addition to our acquisition of Skout, Inc. (“Skout”) on October 3, 2016, provide significant scale for the future global growth of our social entertainment platform, and we are hard at work today integrating our video technology into both properties.
We also offer online marketing capabilities, which enable marketers to display their advertisements in different formats and in different locations. We offer significant scale to our advertising partners, with hundreds of millions of daily impressions across our active global user base, and sophisticated data science for highly effective hyper-targeting. We work with our advertisers and advertising networks to maximize the effectiveness of their campaigns by optimizing advertisement formats and placements.
Just as Facebook has established itself as the social network of friends and family, and LinkedIn as the social network of colleagues and business professionals, The Meet Group is creating the social entertainment network not of the people you know but of the people you want to know. Nimble and fast-moving, already in more than 100 countries, we are challenging the dominant player in our space, Match Group, and differentiating ourselves with live video, which is not offered by many of our direct competitors. Modeled after the video products offered by Chinese dating app providers, but enhanced in order to appeal to western audiences, our live video product is aimed at the nexus of entertainment and community, where we believe our apps exhibit natural strength.
Our vision extends beyond dating and entertainment. We focus on building quality products to satisfy the universal need for human connection among all people, everywhere--not just paying subscribers. We believe meeting new people is a basic human need, especially for users aged 18-34, when so many long-lasting relationships are made. We use advanced technology to engineer serendipitous connections among people who otherwise might never have met - a sort of digital coffeehouse where everyone belongs. Over the years, The Meet Group’s apps have originated untold numbers of chats, shares, good friendships, dates, romantic relationships - even marriages.
We believe that we have significant growth opportunities enabled through our social entertainment platform. We believe our scale provides unique advantages to grow video monetization, while also establishing a high density of users within the geographic regions we serve. As The Meet Group networks grow and the number of users in a location increases, we believe that users who are seeking to meet new people will incrementally benefit from the quantity of relevant connections.
29
2017 Highlights
• | Total revenue was $123.8 million for 2017, up 62.6% from $76.1 million in 2016. |
• | Net loss was $64.6 million for 2017. Adjusted EBITDA was $31.6 million for 2017. For definition of Adjusted EBITDA, please refer to the Non-GAAP – Financial Measures included below in this filing. |
• | Cash and Cash Equivalents totaled $24.2 million at December 31, 2017, an increase of $2.3 million from $21.9 million at December 31, 2016. |
Factors Affecting Our Performance
We believe the following factors affect our performance:
• | Number of MAUs and DAUs: We believe our ability to grow web and mobile MAUs and DAUs affects our revenue and financial results by influencing the number of advertisements we are able to show, the value of those advertisements, and the volume of subscriptions and in-app purchases, as well as our expenses and capital expenditures. |
• | User Engagement: We believe changes in user engagement patterns affect our revenue and financial performance. Specifically, the number of visits and the amount of time spent by each MAU or DAU generates affects the number of advertisements we are able to display and therefore the rate at which we are able to monetize our active user base. In addition, the number of users that make in-app purchases and the amounts that they purchase directly impact our revenue. We continue to create new features and enhance existing features to drive additional engagement. The percent of MAU and DAU that engage with our video products and their conversion to paying users also affects the amount of in-app purchase revenue we are able to earn. |
• | Advertising Rates: We believe our revenue and financial results are materially dependent on industry trends, and any changes to the revenue we earn per thousand advertising impressions (CPM) could affect our revenue and financial results. In 2017 we experienced declining advertising rates, which negatively affected out revenue. We expect to continue investing in new types of advertising and new placements. Additionally, we are prioritizing initiatives that generate revenue directly from users, including new in-app purchases products and a premium subscription product, in part to reduce our dependency on advertising revenue. |
• | User Geography: The geography of our users influences our revenue and financial results because we currently monetize users in distinct geographies at varying average rates. For example, ARPU in the U.S. and Canada is significantly higher than in Latin America. |
• | New User Sources: The percentage of our new users that are acquired through inorganic, paid sources impacts our financial performance, specifically with regard to ARPU for web and mobile. Inorganically acquired users tend to have lower engagement rates, tend to generate fewer visits and ad impressions and to be less likely to make in-app purchases. When paid marketing campaigns are ongoing, our overall usage and traffic increases due to the influx of inorganically acquired users, but the rate at which we monetize the average active user overall declines as a result. |
• | Ad Inventory Management: Our revenue trends are affected by advertisement inventory management changes affecting the number, size, or prominence of advertisements we display. In general, more prominently displayed advertising units generate more revenue per impression. Our Social Theater campaign expenses are materially dependent on the percentage of Social Theater campaigns that run on MeetMe versus the percentage that run on other networks. We work to maximize the share of Social Theater campaigns that run on MeetMe and run campaigns on other networks only when necessary. |
• | Google and iTunes App Store: Our mobile applications are distributed through the Google Play Store and Apple App Our business will suffer if we are unable to maintain a good relationship with Google and Apple, if their terms and conditions or pricing change to our detriment, if we violate, or either company believes that we have violated, its terms and conditions, or if either of these platforms are unavailable for a prolonged period of time. |
• | Increased Social Theater Competition: A significant portion of the revenue generated by the Social Theater is derived from advertising campaigns, powered by Social Theater technology, that run on networks other than The Meet Group networks. A recent increase in competitors offering similar technology solutions, and in some cases their own cross-platform distribution networks, has made it more difficult to compete on price and win business. We expect this downward pressure on price to continue and impact our operating results in the future. |
30
• | Seasonality: Historically, advertising spending has traditionally been seasonal with a peak in the fourth quarter of each year. With the decline in advertising rates in 2017, we did not experience this seasonality consistent with prior years. We believe that this seasonality in advertising spending affects our quarterly results, which historically have reflected a growth in advertising revenue between the third and fourth quarters and a decline in advertising spending between the fourth and subsequent first and second quarters each year. Growth trends in web and mobile MAUs and DAUs affect our revenue and financial results by influencing the number of advertisements we are able to show, the value of those advertisements, the volume of payments transactions, as well as our expenses and capital expenditures. |
• | Business Combinations: Acquisitions have been an important part of our growth strategy. During the two years in the period ended December 31, 2017, we acquired three companies (Skout, if(we) and Lovoo) and four significant brands for our portfolio (Skout, Tagged, Hi5 and Lovoo). The ability to integrate these apps into our portfolio will impact our financial performance. As a consequence of the contributions of these businesses and acquisition-related expenses, our consolidated results of operations may not be comparable between periods. |
Growth trends in web and mobile MAUs and DAUs affect our revenue and financial results by influencing the number of advertisements we are able to show, the value of those advertisements, the volume of payments transactions, as well as our expenses and capital expenditures.
Changes in user engagement patterns from web to mobile and international diversification also affect our revenue and financial performance. We believe that overall engagement as measured by the percentage of users who create content (such as video broadcasts, status posts, messages, or photos) or generate feedback increases as our user base grows. We continue to create new and improved features to drive social sharing and increase monetization.
We believe our revenue trends are also affected by advertisement inventory management changes affecting the number, size, or prominence of the advertisements we display and traditional seasonality. Social Theater is a revenue product for the MeetMe platform and on third-party sites. Social Theater growth may be affected by large brand penetration, the ability to grow the advertiser base, and advertiser spending budgets.
U.S. Federal income tax reform could adversely affect us
On December 22, 2017, the U.S. government enacted comprehensive tax legislation commonly referred to as the Tax Cuts and Jobs Act (“Tax Act”). The Tax Act makes broad and complex changes to the U.S. tax code that will affect 2017, including, but not limited to, (1) requiring a one-time transition tax on certain unrepatriated earnings of foreign subsidiaries that is payable over eight years and (2) bonus depreciation that will allow for full expensing of qualified property.
The Tax Act also establishes new tax laws that will affect 2018, including, but not limited to, (1) reduction of the U.S. federal corporate tax rate; (2) elimination of the corporate alternative minimum tax (“AMT”); (3) the creation of the base erosion anti-abuse tax (“BEAT”), a new minimum tax; (4) a general elimination of U.S. federal income taxes on dividends from foreign subsidiaries; (5) a new provision designed to tax global intangible low-taxed income (“GILTI”), which allows for the possibility of using foreign tax credits (“FTC”) and a deduction of up to 50% to offset the income tax liability (subject to some limitations); (6) a new limitation on deductible interest expense; (7) limitations on the deductibility of certain executive compensation; (8) limitations on the use of FTCs to reduce the U.S. income tax liability; and (9) limitations on net operating losses (“NOL”) generated after December 31, 2017, to 80% of taxable income.
The SEC staff issued Staff Accounting Bulletin No. 118 (“SAB 118”), which provides guidance on accounting for the tax effects of the Tax Act. SAB 118 provides a measurement period that should not extend beyond one year from the Tax Act enactment date for companies to complete the accounting under ASC 740. In accordance with SAB 118, a company must reflect the income tax effects of those aspects of the Act for which the accounting under ASC 740 is complete. To the extent that a company’s accounting for certain income tax effects of the Tax Act is incomplete but it is able to determine a reasonable estimate, it must record a provisional estimate in the financial statements. If a company cannot determine a provisional estimate to be included in the financial statements, it should continue to apply ASC 740 on the basis of the provisions of the tax laws that were in effect immediately before the enactment of the Tax Act.
For various reasons we have not completed our accounting for the income tax effects of certain elements of the Tax Act. If we were able to make reasonable estimates of the effects of elements for which our analysis is not yet complete, we recorded provisional adjustments, as described above. If we were not yet able to make reasonable estimates of the impact of certain elements, we have not recorded any adjustments related to those elements and have continued accounting for them in accordance with ASC 740 on the basis of the tax laws in effect before the Tax Act. As we complete our accounting of the income tax effects of the Tax Act, we anticipate that we may record additional charges or benefits at such time as prescribed by ASC 740 and SAB 118, and as further
31
information becomes available regarding the Tax Act, we may make further adjustments to the provisions that have been recorded in our financial statements. We also continue to examine the impact this tax reform legislation may have on our business.
The future impacts of the Tax Act on holders of our common shares are uncertain and could, in certain instances, be adverse. We urge our stockholders to consult with their legal and tax advisors with respect to any such legislation and the potential tax consequences of investing in our common stock.
Comparison of the year ended December 31, 2017 to the year ended December 31, 2016
The following table sets forth our Consolidated Statements of Operations for the years ended December 31, 2017 and 2016 that is used in the following discussions of our results of operations:
Year Ended December 31, | Change From Prior Year | |||||||||||||
2017 | 2016 | ($) | % | |||||||||||
Revenues | $ | 123,753,813 | $ | 76,124,109 | $ | 47,629,704 | 62.6 | % | ||||||
Operating costs and expenses: | ||||||||||||||
Sales and marketing | 20,355,964 | 15,089,987 | 5,265,977 | 34.9 | % | |||||||||
Product development and content | 60,704,473 | 25,790,173 | 34,914,300 | 135.4 | % | |||||||||
General and administrative | 19,549,805 | 9,494,804 | 10,055,001 | 105.9 | % | |||||||||
Depreciation and amortization | 11,573,827 | 4,069,211 | 7,504,616 | 184.4 | % | |||||||||
Acquisition and restructuring | 12,151,492 | 2,457,295 | 9,694,197 | 394.5 | % | |||||||||
Goodwill impairment | 56,428,861 | — | 56,428,861 | 100.0 | % | |||||||||
Total operating costs and expenses | 180,764,422 | 56,901,470 | 123,862,952 | 217.7 | % | |||||||||
(Loss) income from operations | (57,010,609 | ) | 19,222,639 | (76,233,248 | ) | (396.6 | )% | |||||||
Other income (expense): | ||||||||||||||
Interest income | 5,731 | 21,185 | (15,454 | ) | (72.9 | )% | ||||||||
Interest expense | (860,392 | ) | (19,388 | ) | (841,004 | ) | (4,337.8 | )% | ||||||
Change in warrant liability | — | (864,596 | ) | 864,596 | 100.0 | % | ||||||||
(Loss) gain on foreign currency adjustment | (32,488 | ) | 33,416 | (65,904 | ) | (197.2 | )% | |||||||
Other | 9,631 | — | 9,631 | 100.0 | % | |||||||||
Total other expense | (877,518 | ) | (829,383 | ) | (48,135 | ) | (5.8 | )% | ||||||
(Loss) income before income tax (expense) benefit | (57,888,127 | ) | 18,393,256 | (76,281,383 | ) | (414.7 | )% | |||||||
Income tax (expense) benefit | (6,703,600 | ) | 27,875,362 | (34,578,962 | ) | (124.0 | )% | |||||||
Net (loss) income | $ | (64,591,727 | ) | $ | 46,268,618 | $ | (110,860,345 | ) | (239.6 | )% | ||||
Revenues
Our revenues were approximately $123.8 million in 2017, an increase of $47.6 million or 62.6% compared to $76.1 million in 2016. The increase in revenue is attributable to the increase in mobile revenue primarily due to increased mobile advertising impressions and increased in-app purchases resulting from the acquisitions.
Operating Costs and Expenses
Sales and Marketing: Sales and marketing expenses increased approximately $5.3 million, or 34.9%, to $20.4 million in 2017 from $15.1 million in 2016. The net increase in sales and marketing expenses, including the Skout, if(we) and Lovoo sales and marketing related expense, is due to increased advertising spend of approximately $3.8 million and increased employee expenses of approximately $1.1 million. The increase in employee expenses is primarily due to the acquisitions.
Product Development and Content: Product development and content expenses increased approximately $34.9 million, or 135.4%, to $60.7 million in 2017 from $25.8 million in 2016. The net increase in product development and content expense, including the Skout, if(we) and Lovoo product development related expense, is attributable to an increase of employee expenses of $13.6 million, mobile content and social theater cost of $7.4 million, data center and technical operations of $7.1 million, stock-based compensation of $2.5 million, rent of $2.2 million and safety moderation of $0.8 million. These increases are mainly attributable to the acquisitions.
32
General and Administrative: General and administrative expenses increased $10.0 million or 105.9%, to $19.5 million in 2017 from $9.5 million in 2016. The net increase in general and administrative expense, including the Skout, if(we) and Lovoo general and administrative related expense, is primarily due to an increase of employee expenses of $2.6 million, stock-based compensation of $2.3 million, professional fees of $1.3 million, office related expenses of $1.0 million, business, franchise and other taxes of $0.9 million, travel related costs of $0.7 million and insurance fees of $0.4 million. These increases are attributable primarily to the acquisitions.
Depreciation and Amortization: Depreciation and amortization expenses increased $7.5 million or 184.4%, to $11.6 million in 2017 from $4.1 million in 2016. The increase in depreciation and amortization expense is primarily attributable to the amortization of intangibles related to our acquisition of if(we) (the “if(we) Acquisition”), our acquisition of Lovoo (the “Lovoo Acquisition”) and a full year of amortization of the intangibles related to our acquisition of Skout (the “Skout Acquisition”).
Acquisition and Restructuring: Acquisition and restructuring costs increased $9.7 million or 394.5%, to $12.2 million in 2017 from $2.5 million in 2016. Acquisition and restructuring costs include the transaction costs including legal and diligence costs for the if(we) Acquisition and the Lovoo Acquisition, accounting fees, travel related costs, employee retention bonuses in connection with the acquisitions, the accrual of the exit cost of non-cancellable leases and employee exit and relocation costs. The Company paid approximately $1.7 million and $1.4 million in transaction costs in connection with the if(we) Acquisition and the Lovoo Acquisition, respectively, in 2017.
Goodwill Impairment: In the fourth quarter of 2017, through our annual testing of goodwill, we determined that a $56.4 million one-time, non-cash impairment was required for our U.S. reporting unit, due predominantly to the market-driven impacts on advertising revenue resulting from lower CPMs which negatively affected our results and outlook. This non-cash impairment charge does not impact our ability to generate cash flow in the future and it is not tax deductible.
Income Tax (Expense) Benefit
The income tax expense was $6.7 million in 2017 compared to an income tax benefit of $27.9 million in 2016. Our effective tax rate (“ETR”) of 11.6% in 2017 was lower than the 2016 rate of 151.6%. This difference is due mostly to the expense from the change in the tax effect of our net deferred tax assets being reduced from 35% to 21% as a result of the Tax Act in 2017, a nondeductible goodwill impairment in 2017, and the release of the entire valuation allowance in 2016.
Due to the change in tax law, we will owe U.S. federal taxes on our accumulated foreign earnings. Our 2017 income tax expense includes a provisional $0.1 million of expense related to the U.S. tax on accumulated foreign earnings net of related, previously unrecognized foreign tax credits. Additionally tax expense of $7.7 million is also included in our 2017 income tax expense related to the remeasurement of our net deferred tax assets at the new U.S. federal corporate tax rate of 21% as a result of the Tax Act. We expect our effective tax rate to decrease in 2018 as a result of the impact of the Tax Act. For further discussion of the Tax Act, see Note 11— Income Taxes in the accompanying notes to the consolidated financial statements.
33
Comparison of the year ended December 31, 2016 to the year ended December 31, 2015
The following table sets forth our Consolidated Statements of Operations for the years ended December 31, 2016 and 2015 that is used in the following discussions of our results of operations:
Year Ended December 31, | Change From Prior Year | |||||||||||||
2016 | 2015 | ($) | % | |||||||||||
Revenues | $ | 76,124,109 | $ | 56,903,773 | $ | 19,220,336 | 33.8 | % | ||||||
Operating costs and expenses: | ||||||||||||||
Sales and marketing | 15,089,987 | 6,618,837 | 8,471,150 | 128.0 | % | |||||||||
Product development and content | 25,790,173 | 24,615,304 | 1,174,869 | 4.8 | % | |||||||||
General and administrative | 9,494,804 | 14,534,861 | (5,040,057 | ) | (34.7 | )% | ||||||||
Depreciation and amortization | 4,069,211 | 3,140,205 | 929,006 | 29.6 | % | |||||||||
Acquisition and restructuring | 2,457,295 | — | 2,457,295 | 100.0 | % | |||||||||
Total operating costs and expenses | 56,901,470 | 48,909,207 | 7,992,263 | 16.3 | % | |||||||||
Income from operations | 19,222,639 | 7,994,566 | 11,228,073 | 140.4 | % | |||||||||
Other income (expense): | ||||||||||||||
Interest income | 21,185 | 21,037 | 148 | 0.7 | % | |||||||||
Interest expense | (19,388 | ) | (459,962 | ) | 440,574 | 95.8 | % | |||||||
Change in warrant liability | (864,596 | ) | (616,607 | ) | (247,989 | ) | (40.2 | )% | ||||||
(Loss) gain on foreign currency adjustment | 33,416 | — | 33,416 | 100.0 | % | |||||||||
Loss on cumulative foreign currency translation adjustment | — | (856,438 | ) | 856,438 | 100.0 | % | ||||||||
Gain on sale of asset | — | 163,333 | (163,333 | ) | (100.0 | )% | ||||||||
Total other expense | (829,383 | ) | (1,748,637 | ) | 919,254 | 52.6 | % | |||||||
Income before income tax benefit (expense) | 18,393,256 | 6,245,929 | 12,147,327 | 194.5 | % | |||||||||
Income tax benefit (expense) | 27,875,362 | (276,301 | ) | 28,151,663 | (10,188.8 | )% | ||||||||
Net income | $ | 46,268,618 | $ | 5,969,628 | $ | 40,298,990 | 675.1 | % | ||||||
Revenues
Our revenues were $76.1 million for the year ended December 31, 2016, an increase of $19.2 million or 33.8% compared to $56.9 million for the same period in 2015. The increase is attributable to an $18.2 million increase in mobile revenue and $7.2 million of revenue from Skout, which was acquired by merger on October 3, 2016. Offsetting these revenues was a $6.2 million decrease in web advertising and cross platform revenue. The increase in mobile advertising revenue is due to growth with our mobile traffic metrics, specifically DAUs on mobile devices, and increased advertising rates on mobile devices. The decrease in web advertising revenue is attributable to the decline in web DAUs.
Operating Costs and Expenses
Sales and Marketing: Sales and marketing expenses increased $8.5 million, or 128.0%, to $15.1 million for the year ended December 31, 2016 from $6.6 million in 2015. The net increase in sales and marketing expenses, including the Skout sales and marketing related expense from the date of the acquisition, is attributable to an increase in advertising spend of $8.8 million. The acquisition of Skout brought on five full-time sales and marketing staff located in the San Francisco office.
Product Development and Content: Product development and content expenses increased $1.2 million, or 4.8%, to $25.8 million for the year ended December 31, 2016 from $24.6 million in 2015. The net increase in product development and content expense, including the Skout product development related expense from the date of the acquisition, is attributable to an increase in employee expenses of $1.9 million, an increase in mobile content costs of $0.4 million, and a net decrease of $1.5 million of third party content costs for cross platform Social Theater affiliate campaigns. The acquisition of Skout brought on 19 full-time product development staff located in the San Francisco office and accounted for $0.9 million of increased employee expenses and $0.2 million of the increased mobile content costs. The additional increase in employee expense was attributable to annual salary increases and increased benefit costs. The decrease in third party content costs for cross platform Social Theater campaigns was due to lower cross platform revenue and an improvement on cost structures for those cross platform revenue products.
34
General and Administrative: General and administrative expenses decreased $5.0 million or 34.7%, to $9.5 million for the year ended December 31, 2016 from $14.5 million for the same period in 2015. The aggregate decrease in general and administrative costs is due to the bad debt write-off of an outstanding receivable balance of $5.7 million in the year ended December 31, 2015, partially offset by the inclusion of Skout general and administrative related expenses of $0.3 million. The acquisition of Skout brought on two full-time general and administrative staff located in the San Francisco office.
Depreciation and Amortization: Depreciation and amortization expense increased $1.0 million to $4.1 million for the year ended December 31, 2016 from $3.1 million in the year ended December 31, 2015. The increase in expense is primarily driven by an increase in intangible assets resulting from the Skout acquisition.
Acquisition and Restructuring Costs: Acquisition and restructuring costs were $2.5 million for the year ended December 31, 2016, due to professional fees and other one-time expenses incurred in connection with the Skout acquisition.
Income Tax Benefit (Expense): The income tax benefit was $27.9 million in 2016 compared to income tax expense of $0.3 million in 2015. The increase in income tax benefit is primarily due to a release of the entire valuation allowance in 2016.
Comparison of Stock-Based Compensation and Other Costs and Expenses
Stock-Based Compensation
Stock-based compensation expense, included in operating expense by category, increased approximately $4.9 million to $8.5 million in 2017 from $3.6 million in 2016. Stock-based compensation expense represented 6.8% and 6.3% of operating expenses, excluding a goodwill impairment charge of $56.4 million in 2017, in 2017 and 2016, respectively.
Stock-based compensation expense increased approximately $0.2 million to $3.6 million in 2016 from $3.3 million in 2015. Stock-based compensation expense represented 6.3% and 6.8% of operating expenses in 2016 and 2015, respectively.
As of December 31, 2017, there was $4.9 million and $10.6 million of unrecognized compensation cost related to stock options and unvested restricted stock awards, respectively, which is expected to be recognized over a period of approximately 2.1 years, respectively.
For the Years Ended December 31, | 2017 to 2016 | 2016 to 2015 | |||||||||||||||||
2017 | 2016 | 2015 | Changes ($) | Changes ($) | |||||||||||||||
Sales and marketing | $ | 439,797 | $ | 354,088 | $ | 309,708 | $ | 85,709 | $ | 44,380 | |||||||||
Product development and content | 4,008,545 | 1,528,547 | 1,197,696 | 2,479,998 | 330,851 | ||||||||||||||
General and administrative | 4,018,936 | 1,685,352 | 1,409,023 | 2,333,584 | 276,329 | ||||||||||||||
Total stock-based compensation for vesting of options and RSA's | 8,467,278 | 3,567,987 | 2,916,427 | 4,899,291 | 651,560 | ||||||||||||||
Warrant modification | — | — | 425,538 | — | (425,538 | ) | |||||||||||||
Total stock-based compensation expense | $ | 8,467,278 | $ | 3,567,987 | $ | 3,341,965 | $ | 4,899,291 | $ | 226,022 | |||||||||
Stock-based compensation expense is composed of the following:
For the Years Ended December 31, | |||||||||||
2017 | 2016 | 2015 | |||||||||
Vesting of stock options | $ | 3,377,286 | $ | 1,475,106 | $ | 1,389,554 | |||||
Vesting of restricted stock awards | 5,089,992 | 2,092,881 | 1,526,873 | ||||||||
Warrant modification | — | — | 425,538 | ||||||||
Total stock-based compensation expense | $ | 8,467,278 | $ | 3,567,987 | $ | 3,341,965 | |||||
The amortization of prepaid expenses includes compensation for professional services in which the related stock options vested prior to the performance of services. The amount of compensation is amortized over the lengths of the contracts.
35
Liquidity and Capital Resources
For the Years Ended December 31, | |||||||||||
2017 | 2016 | 2015 | |||||||||
Net cash provided by operating activities | $ | 31,270,666 | $ | 25,922,895 | $ | 7,209,245 | |||||
Net cash used in investing activities | (128,003,910 | ) | (30,941,011 | ) | (1,514,964 | ) | |||||
Net cash provided by (used in) financing activities | 99,924,461 | 7,939,271 | (3,298,640 | ) | |||||||
$ | 3,191,217 | $ | 2,921,155 | $ | 2,395,641 | ||||||
Net cash provided by operations was $31.3 million, $25.9 million and $7.2 million for the years ended December 31, 2017, 2016 and 2015, respectively.
For the year ended December 31, 2017, net cash provided by operations consisted primarily of net loss of approximately $64.6 million adjusted for certain non-cash expenses of approximately a $56.4 million goodwill impairment charge, $11.6 million of depreciation and amortization expense, $6.9 million related to deferred taxes, $8.5 million related to stock based compensation for the vesting of stock options. Additionally, changes in working capital increased the net cash provided by operations. These changes included decreases in accounts receivable of approximately $3.7 million resulting from collections, in prepaid expenses, other current assets and other assets of approximately $4.7 million and $1.6 million in deferred revenue and increases in accounts payable and accrued liabilities of $1.9 million.
For the year ended December 31, 2016, net cash provided by operations consisted primarily of net income of $46.3 million adjusted for certain non-cash expenses including $28.1 million related to deferred taxes, $4.1 million of depreciation and amortization expense, $3.6 million related to stock based compensation for the vesting of stock options, $0.2 million for bad debt expense and approximately $0.9 million for change in warrant liability. Changes in working capital decreased the net cash provided by operations. These changes included increases in accounts receivable of $3.2 million and approximately $0.2 million in prepaid expenses, other current assets and other assets, partially offset by an increase of approximately $2.6 million in accounts payable and accrued liabilities.
For the year ended December 31, 2015, net cash provided by operations consisted primarily of net income from operations of $6.0 million adjusted for certain non-cash expenses of $3.1 million of depreciation and amortization expense, $3.3 million related to stock based compensation for the vesting of stock options and warrant modifications, approximately $0.9 million related to loss on cumulative foreign currency translation adjustment, approximately $0.2 million for gain on sale of asset, and approximately $0.2 million in amortization of discounts on notes payable and debt issuance costs. Additionally, changes in working capital decreased the net cash provided by operations. These changes included increases in accounts receivable of $7.0 million resulting from increased sales, offset by increases in accounts payable and accrued expenses of approximately $0.7 million due to timing of vendor payments.
Net cash used in investing activities for the years ended December 31, 2017, 2016 and 2015 was $128.0 million, $30.9 million and $1.5 million, respectively.
For the year ended December 31, 2017, net cash used in investing activities was primarily due to the if(we) Acquisition and the Lovoo Acquisition.
For the year ended December 31, 2016, net cash used in investing activities was primarily due to the Skout acquisition and capital expenditures for computer equipment to increase capacity and improve performance.
For the year ended December 31, 2015, net cash used in investing activities was spent on capital expenditures of $1.8 million for computer equipment to increase capacity and improve performance, offset by proceeds of $0.3 million from the sale of an asset.
Net cash provided by financing activities in the years ended December 31, 2017 and 2016 was $99.9 million and $7.9 million, respectively. Net cash used in financing activities in the year ended December 31, 2015 was $3.3 million.
36
Net cash provided by financing activities for the year ended December 31, 2017 of approximately $99.9 million was due to approximately $43.0 million of proceeds from a common stock offering, $75.0 million of proceeds from debt, $2.8 million from the exercise of stock options and $2.4 million from the exercise of warrants. These increases in cash were partially offset by $18.8 million payments of debt, $0.5 million of payments for restricted stock awards withheld for taxes, $0.8 million of loan origination costs and $0.3 million of capital lease payments. In connection with the New Credit Facilities, we paid down $15.0 million related to the Term Loan Facility. See Note 7— Long-Term Debt for more information regarding our credit facilities.
For the year ended December 31, 2016, net cash provided by financing activities of $7.9 million was due to $8.8 million of proceeds from exercise of stock options and $4.5 million of proceeds from the exercise of warrants, partially offset by $5.0 million of stock repurchases and approximately $0.4 million of capital lease payments.
For the year ended December 31, 2015, net cash used in financing activities of $3.3 million was primarily spent on $2.8 million of debt payments, and approximately $0.9 million of capital lease payments, offset by approximately $0.4 million of proceeds from the exercise of stock options.
December 31, 2017 | December 31, 2016 | ||||||
Cash and cash equivalents | $ | 24,158,444 | $ | 21,852,531 | |||
Total assets | $ | 275,344,771 | $ | 209,489,484 | |||
Percentage of total assets | 8.8 | % | 10.4 | % | |||
Our cash balances are kept liquid to support our growing infrastructure needs for operational expansion. The majority of our cash is concentrated in two large financial institutions.
As of December 31, 2017 and 2016, we had positive working capital of $8.0 million and $32.7 million, respectively.
We entered into a Media Publisher Agreement with Beanstock Media, Inc. (“Beanstock”) on September 25, 2013 and an Advertising Agreement with Beanstock on December 23, 2014 (together, as amended, the “Beanstock Agreements”). On June 2, 2015 we terminated the Beanstock Agreements as a result of non-payment by Beanstock of amounts owed. In the third quarter of 2015, we wrote-off the accounts receivable balance under the Beanstock Agreements of $5.7 million as the amount was deemed to be uncollectible.
On April 29, 2013, we (i) entered into a loan and security agreement with a leading provider of debt financing to technology companies (the “Loan Agreement”) and (ii) issued two warrant agreements (“Warrants”), for the purchase of shares of our common stock to the lenders under the Loan Agreement. The Loan Agreement had an aggregate commitment of $8.0 million. We borrowed $5.0 million under the Loan Agreement on April 29, 2013. Had we achieved certain financial goals, we could have borrowed two additional tranches of loans, each in an aggregate principal amount of up to $1.5 million. All loans under the Loan Agreement had a term of 36 months and could not be re-borrowed after repayment. The lender under the Loan Agreement had a security interest in substantially all of our assets. The purchase price for the shares of common stock issuable upon exercise of the Warrants was equal to, at each Warrant holder’s option, the lower of (x) $1.96 and (y) the price per share of the stock issued in the next equity placement of our stock, subject to certain restrictions set forth in the Warrants. The Warrants could have been exercised until February 28, 2024. As of December 31, 2017, we did not have any outstanding indebtedness under the Loan Agreement. The remaining warrants were exercised in 2017.
On March 3, 2017, in connection with the if(we) Acquisition discussed in Note 2- Acquisitions, we entered into a credit agreement (the “Credit Agreement”) with the several banks and other financial institutions party thereto and JPMorgan Chase Bank, N.A., the Agent. The Credit Agreement provided for a $15.0 million revolving credit facility (the “Revolving Credit Facility”) and a $15.0 million term loan facility (the “Term Loan Facility,” and together with the “Revolving Credit Facility,” the “Credit Facilities”). On April 3, 2017, we drew down $15.0 million from its Term Loan Facility in connection with the if(we) Acquisition. On September 18, 2017, we paid in full the outstanding balance on the Term Loan Facility.
On September 18, 2017, in connection with the Lovoo Acquisition discussed in Note 2- Acquisitions, we entered into an amended and restated credit agreement (the “Amended and Restated Credit Agreement”) with the several banks and other financial institutions party thereto and JPMorgan Chase Bank, N.A., as administrative agent (the “Agent”), amending and restating the Credit Agreement, dated March 3, 2017. The Amended and Restated Credit Agreement provides for a $20.0 million revolving credit facility (the “New Revolving Credit Facility”) and a $60.0 million delayed draw term loan facility (the “New Term Loan Facility,” and together
37
with the “New Revolving Credit Facility”, the “New Credit Facilities”). On October 18, 2017, we drew down $60.0 million from its New Term Loan Facility in connection with the Lovoo Acquisition.
We have used the proceeds under the New Credit Facilities for general purposes, including the Lovoo Acquisition. We will also use proceeds of the New Revolving Credit Facility to finance working capital needs and for general corporate purposes. Amounts under the New Revolving Credit Facility may be borrowed, repaid and re-borrowed from time to time until the maturity date of the Credit Agreement on September 18, 2020. The New Term Loan Facility is subject to quarterly payments of principal in an amount equal to $3,750,000 commencing December 31, 2017 and continuing through maturity. At our election, loans made under the New Credit Facilities will bear interest at either (i) a base rate (“Base Rate”) plus an applicable margin or (ii) a London interbank offered rate (“LIBO Rate”) plus an applicable margin, subject to adjustment if an event of default under the Amended and Restated Credit Agreement has occurred and is continuing. The Base Rate means the highest of (a) the Agent’s “prime rate,” (b) the federal funds effective rate plus 0.50% and (c) the LIBO Rate for an interest period of one month plus 1%. Our present and future domestic subsidiaries (the “Guarantors”) will guarantee our obligations under the New Credit Facilities. Our obligations under the New Credit Facilities are secured by all of our assets and the Guarantors, subject to certain exceptions and exclusions as set forth in the Amended and Restated Credit Agreement and other loan documents.
As of December 31, 2017, we had an outstanding balance of $56.3 million on our New Term Loan Facility. The weighted average interest rate at December 31, 2017 was 4.05%. Remaining unamortized fees and direct costs incurred for the Company’s Credit Facilities were $0.5 million. As of December 31, 2017, the Company did not have an outstanding balance on its Revolving Credit Facility.
On March 7, 2018, we entered into a Second Amendment to Amended and Restated Credit Agreement (the “Second Amendment”) to that certain Amended and Restated Credit Agreement, dated as of September 18, 2017, among us, the several banks and other financial institutions party thereto, and JPMorgan Chase Bank, N.A., as administrative agent, as amended by that certain First Amendment to Amended and Restated Credit Agreement, dated as of October 18, 2017. Among other things, the Second Amendment amends the definition of “Applicable Rate” and “EBITDA” in the Credit Agreement and makes certain changes to the financial covenants.
We did not enter into any new capital lease agreements for the year ended December 31, 2017 other than the capital leases acquired as part of the Lovoo Acquisition. As of December 31, 2017, capital leases that were previously entered into had approximately $0.4 million in principal amount of capital lease indebtedness, all of which is due by 2021.
We believe that, with its current available cash, anticipated revenues and collections on its accounts receivables, and its access to capital through various financing options, it will have sufficient funds to meet its anticipated cash needs for at least the next 12 months.
We have budgeted capital expenditures of $1.4 million for 2018, which we believe will support our growth of domestic and international business through increased capacity, performance improvement, and expanded content.
Critical Accounting Policies and Estimates
To understand our financial statements, it is important to understand our critical accounting estimates. The preparation of our financial statements in conformity with generally accepted accounting principles in the U.S. requires us to make estimates and assumptions that affect the reported amounts of assets and liabilities and disclosure of contingent assets and liabilities at the date of the financial statements and the reported amounts of revenues and expenses during the reporting period. Significant estimates and assumptions are required in the determination of business combinations, revenue recognition, accounts receivable valuation, the fair value of financial instruments, the valuation of long-lived assets, valuation of deferred tax assets, income taxes, contingencies, goodwill and intangible assets, and stock-based compensation. Some of these judgments can be subjective and complex, and, consequently, actual results may differ from these estimates. Our estimates often are based on complex judgments, probabilities and assumptions that we believe to be reasonable but that are inherently uncertain and unpredictable. For any given individual estimate or assumption made by us, there may also be other estimates or assumptions that are reasonable.
We consider an accounting estimate to be critical if: (1) the accounting estimate requires us to make assumptions about matters that were highly uncertain at the time the accounting estimate was made; and (2) changes in the estimate that are reasonably likely to occur from period to period, or use of different estimates that we reasonably could have used in the current period, would have a material impact on our financial condition results of operations or cash flows. Our most critical accounting estimates are described below.
38
Business Acquisitions and Contingent Consideration Arrangements
We account for all business acquisitions at fair value and expenses acquisition costs as they are incurred. Any identifiable assets acquired and liabilities assumed are recognized and measured at their respective fair values on the acquisition date. If information about facts and circumstances existing as of the acquisition date is incomplete at the end of the reporting period in which a business acquisition occurs, we will report provisional amounts for the items for which the accounting is incomplete. The measurement period ends once we receive sufficient information to finalize the fair values; however, the period will not exceed one year from the acquisition date.
In connection with certain acquisitions, we entered into agreements to pay additional amounts in cash on the achievement of certain performance measures for up to 1 year ending after the acquisition date. We measure this contingent consideration at fair value at the acquisition date and record such contingent consideration as a liability our Consolidated Balance Sheets on the acquisition date. The fair value of each contingent consideration liability is remeasured at each reporting period with any change in fair value recognized as income or expense within operations in our consolidated statements of operations and comprehensive income (loss). See Note 2— Acquisitions for more information on our business acquisitions.
Revenue Recognition
Advertising Revenue
We recognize revenue when persuasive evidence of an arrangement exists, delivery has occurred or services have been rendered, the purchase price is fixed or determinable and collectability is reasonably assured. We earn revenue from the display of advertisements on our mobile apps and website, primarily based on a cost per thousand (“CPM”) model. We recognize revenue in accordance with ASC 605, “Revenue Recognition,” and ASC 605-45 “Principal Agent Considerations” (together, “the ASC Guidance”). Revenue from advertising on our mobile apps and website is generally recognized on a net basis, since the majority of our advertising revenues come from advertising agencies. The ASC guidance provides indicators for determining whether “gross” or “net” presentation is appropriate. While all indicators should be considered, we believe that whether we acted as a primary obligor in our agreements with advertising agencies is the strongest indicator of whether gross or net revenue reporting is appropriate.
During the years ended December 31, 2017, 2016 and 2015, we had transactions with several partners that qualify for principal agent considerations. We recognize revenue, net of amounts retained by third party entities, pursuant to revenue sharing agreements with advertising networks for advertising and with other partners for royalties on product sales. We considered two key factors when making our revenue recognition determinations: (1) whether we performed a service for a fee, similar to an agent or a broker; and (2) whether we were involved in the determination of product or service specifications. We focused on the substance of the agreements and determined that net presentation was representationally faithful to the substance, as well as the form of the agreements. The form of the agreements was such that we provided services in exchange for a fee. In addition, we have no latitude in establishing price, and the advertising agencies were solely responsible for determining pricing with third party advertisers. We determined only the fee for providing its services to advertising agencies.
In instances in which we work directly with an advertiser, revenue is recognized on a gross basis. We are the primary obligor in arrangements made with direct advertisers, as there is no third party facilitating or managing the sales process. We are solely responsible for determining price, product or service specifications, and which advertisers to use. We assume all credit risk in the sales arrangements made with direct advertisers.
Refer to Note 1 of our consolidated financial statements for consideration of the agreement in which Beanstock had the right and obligation during 2015 and 2014 to fill substantially all of our advertising inventory on its MeetMe mobile app for iOS and Android, as well as the meetme.com website when accessed using a mobile device and as optimized for mobile devices.
In-App Purchases
Revenue is earned from in-app purchase products sold to our mobile application and website users. We offer in-app products such as Credits, Points, Gold and Icebreakers. Users buy Credits, Points, Gold or Icebreakers to purchase our virtual products. These products allow users to engage with other users on the apps and in live video, and put users in the spotlight, helping users to get more attention from the community in order to meet more people faster. Revenue from these virtual products is recognized over time. Credits, Points, Gold and Icebreakers can be purchased using iTunes and Google checkout on mobile applications. Platform users do not own the Credits, Points, Gold or Icebreakers but have a limited right to use the Credits, Points, Gold or Icebreakers on virtual products offered for sale on our platforms. Credits, Points, Gold and Icebreakers are non-refundable, we may change the purchase price of Credits, Points, Gold or Icebreakers at any time and we reserve the right to stop issuing Credits, Points, Gold
39
and Icebreakers in the future. Our in-app products are not transferable, cannot be sold or exchanged outside our platform, are not redeemable for any sum of money and can only be used on our platforms. In-app products are recorded in deferred revenue when purchased and recognized as revenue when: (i) the Credits, Points, Gold or Icebreakers are used by the customer; or (ii) we determine the likelihood of the Credits, Points, Gold or Icebreakers being redeemed by the customer is remote (breakage) and there is not a legal obligation to remit the unredeemed Credits, Points, Gold or Icebreakers to the relevant jurisdiction. The determination of the breakage rate is based upon Company-specific historical redemption patterns. Breakage is recognized in revenue as the Credits, Points, Gold and Icebreakers are used on a pro rata basis over a three or six month period (life of the user) beginning at the date of the Credit, Point, Gold or Icebreakers’ sale and is included in revenue in the consolidated statements of operations and comprehensive (loss) income. For “MeetMe+” and other subscription based products, the Company recognizes revenue over the term of the subscription.
Accounts Receivable and Allowance for Doubtful Accounts
We extend credit on a non-collateralized basis to both domestic and international customers. We extend credit to customers in the normal course of business and maintain an allowance for doubtful accounts resulting from the inability or unwillingness of customers to make required payments. Management determines the allowance for doubtful accounts by evaluating individual customer receivables and considering a customer’s financial condition, credit history, and current economic conditions. We prepare an analysis of our ability to collect outstanding receivables that provides a basis for an allowance estimate for doubtful accounts.
Based on this evaluation, we maintain an allowance for potential credit losses and for potential discounts based on historical experience and other information available to management. Discounts historically represent less than 1% of the related revenues. The fees associated with display advertising are often based on “impressions,” which are created when the ad is loaded. The amount of impressions often differs between non-standardized tracking systems, resulting in discounts on some payments. Differences between ad serving platforms with respect to impressions is primarily due to lag time between serving of advertising and other technical differences.
Balance at Beginning of Period | Additions, Costs and Expenses | Deductions, Write-Offs | Balance at End of the Period | ||||||||||||
Allowance for Doubtful Accounts: | |||||||||||||||
Year Ended December 31, 2017 | $ | 283,000 | $ | 304,306 | $ | 59,348 | $ | 527,958 | |||||||
Year Ended December 31, 2016 | $ | 133,000 | $ | 152,587 | $ | 2,587 | $ | 283,000 | |||||||
Year Ended December 31, 2015 | $ | 586,000 | $ | 181,398 | $ | 634,398 | $ | 133,000 | |||||||
Fair Value Measurements
The fair values of our financial instruments reflect the amounts that would be received to sell an asset or paid to transfer a liability in an orderly transaction between market participants at the measurement date (exit price).
The carrying amounts of our financial instruments of cash, cash equivalents and restricted cash, accounts receivable, accounts payable, accrued liabilities and deferred revenue approximate fair value due to their short maturities. Certain common stock warrants were carried at fair value as disclosed in Note 3 of our consolidated financial statements. We have evaluated the estimated fair value of financial instruments using available market information and management’s estimates. The use of different market assumptions and/or estimation methodologies could have a significant effect on the estimated fair value amounts.
In addition, we carry our contingent consideration liabilities related to acquisitions at fair value. In accordance with the three-tier fair value hierarchy, we determined the fair value of our contingent consideration liabilities using the income approach with assumed discount rates and payment probabilities. The income approach uses Level 3, or unobservable inputs as defined under the accounting guidance for fair value measurements.
As part of the Lovoo Acquisition we amended and restated our term loan and revolving credit facility. The outstanding balance as of December 31, 2017 of the term loan approximates fair value due to the variable market interest rates and relatively short maturity associated with the Term Loan Facility. See Note 7— Long-Term Debt for more information regarding the our credit facilities.
40
We record all derivatives on the balance sheet at fair value. The accounting for changes in the fair value of derivatives depends on the intended use of the derivative, whether we have elected to designate a derivative in a hedging relationship and apply hedge accounting and whether the hedging relationship has satisfied the criteria necessary to apply hedge accounting. Derivatives designated and qualifying as a hedge of the exposure to changes in the fair value of an asset, liability, or firm commitment attributable to a particular risk, such as interest rate risk, are considered fair value hedges. Derivatives designated and qualifying as a hedge of the exposure to variability in expected future cash flows, or other types of forecasted transactions, are considered cash flow hedges. Derivatives may also be designated as hedges of the foreign currency exposure of a net investment in a foreign operation. Hedge accounting generally provides for the matching of the timing of gain or loss recognition on the hedging instrument with the recognition of the changes in the fair value of the hedged asset or liability that are attributable to the hedged risk in a fair value hedge or the earnings effect of the hedged forecasted transactions in a cash flow hedge. We may enter into derivative contracts that are intended to economically hedge certain of its risk, even though hedge accounting does not apply or we elect not to apply hedge accounting.
In accordance with the FASB’s fair value measurement guidance (ASU 2011-04), we made an accounting policy election to measure the credit risk of its derivative financial instruments that are subject to master netting agreements on a net basis by counterparty portfolio.
In 2013, we issued warrants on our common stock in conjunction with a term loan. These warrants meet the definition of a derivative and are reflected as a warrant liability at fair value in the consolidated balance sheets. In 2017, we entered into an interest rate swap, interest rate cap and a cross-currency interest rate swap. See Note 13— Derivatives and Hedging Activities for further details.
Income Taxes
We account for income taxes under the asset and liability method, which requires the recognition of deferred tax assets and liabilities for the expected future tax consequences of events that have been included in the consolidated financial statements. Under this method, deferred tax assets and liabilities are determined based on the differences between the financial statement and tax bases of assets and liabilities using enacted tax rates in effect for the year in which the differences are expected to reverse.
We record deferred tax assets to the extent we believe these assets will more likely than not be realized. In making such determination, we consider all available positive and negative evidence, including scheduled reversals of deferred tax liabilities, projected future taxable income, tax planning strategies and recent financial operations. In the event that we determine that we will not be able to realize our deferred income tax assets in the future in excess of our net recorded amount, we will make an adjustment to the valuation allowance, which will increase the provision for income taxes.
The Tax Cuts and Jobs Act (“Tax Act”) was enacted on December 22, 2017, most provisions of which will take effect starting in 2018. The Tax Act makes substantial changes to U.S. taxation of corporations, including, lowering the U.S. federal corporate income tax rate from 35% to 21%, and instituting a territorial tax system, along with a one-time tax on accumulated foreign earnings. The effect on deferred tax assets and liabilities of a change in law or tax rates is recognized in income in the period that includes the enactment date. We have adopted a policy with respect to the IRC Sec. 162(m) limiting deductions for compensation expense in excess of $1 million for certain high paid employees that we will consider stock based compensation as being earned first in determining whether any deferred tax asset will be limited.
For every tax-paying component and within each tax jurisdiction, all deferred tax liabilities and assets are offset and presented as a single net noncurrent asset or liability.
Our income tax returns are periodically audited by U.S. federal, state and local, and foreign tax authorities. These audits include questions regarding our tax filing positions, including the timing and amount of deductions and the allocation of income among various tax jurisdictions. At any one time, multiple tax years are subject to audit by the various tax authorities. In evaluating the tax benefits associated with our various tax filing positions, we record a tax benefit for uncertain tax positions using the highest cumulative tax benefit that is more likely than not to be realized. A number of years may elapse before a particular matter, for which a liability has been established, is audited and effectively settled. We adjust our liability for unrecognized tax benefits in the period in which we determine the issue is effectively settled with the tax authorities, the statute of limitations expires for the relevant taxing authority to examine the tax position or when more information becomes available.
41
Goodwill
Goodwill reflects the cost of an acquisition in excess of the fair values assigned to the identifiable net assets acquired. Goodwill is not amortized; rather, it is subject to a periodic assessment for impairment by applying a fair value based test. We perform our annual impairment test in conjunction with preparing our fourth quarter financial results immediately following the end of the calendar year, or more frequently if events or changes in circumstances indicate that the asset might be impaired. Goodwill is tested for impairment at a level of reporting referred to as a reporting unit. We have determined that there are two reporting units, The Meet Group, Inc. and Lovoo.
Accounting for acquisitions requires us to recognize, separately from goodwill, the assets acquired and the liabilities assumed at their acquisition-date fair values. Goodwill as of the acquisition date is measured as the excess of consideration transferred and the net of the acquisition-date fair values of the assets acquired and the liabilities assumed. While we use best estimates and assumptions to accurately value assets acquired and liabilities assumed at the acquisition date, the estimates are inherently uncertain and subject to refinement.
The impairment model permits, and we utilize, a simplified approach for determining goodwill impairment. In the first step, we evaluate the recoverability of goodwill by estimating the fair value of our reporting unit using multiple techniques, including an income approach using a discounted cash flow model and a market approach. Based on an equal weighting of the results of these two approaches, a conclusion of fair value is estimated. The fair value is then compared to the carrying value of our reporting unit. If the fair value of a reporting unit is less than its carrying value, the Company recognizes this amount as an impairment loss. Impairment losses, limited to the carrying value of goodwill, represent the excess of the carrying amount of goodwill over its implied fair value. See Note 1— Description of Business, Basis of Presentation and Summary of Significant Accounting Policies in the accompanying notes to the consolidated financial statements.
In the fourth quarter of 2017, through our annual testing of goodwill, we determined that a $56.4 million one-time, non-cash impairment was required for our U.S. reporting unit, due predominantly to the market-driven impacts on advertising revenue resulting from lower CPMs which negatively affected our results and outlook. We believe this non-cash impairment charge does not impact our ability to generate cash flow in the future; it is not tax deductible.
Stock-Based Compensation
The fair value of share-based payments is estimated on the grant date using the Black-Scholes option pricing model, based on weighted average assumptions. Expected volatility is based on historical volatility of our common stock. We elected to use the simplified method described in the Securities and Exchange Commission Staff Accounting Bulletin Topic 14C to estimate the expected term of employee stock options. The risk-free rate is based on the U.S. Treasury yield curve in effect at the time of grant. Compensation expense is recognized on a straight-line basis over the requisite service period of the award.
Contingencies
We accrue for contingent obligations, including legal costs and restructuring costs, when the obligation is probable and the amount can be reasonably estimated. As facts concerning contingencies become known, we reassess our position and make appropriate adjustments to the consolidated financial statements. Estimates that are particularly sensitive to future changes include those related to tax, legal, and other regulatory matters that are subject to change as events evolve and additional information becomes available.
Operating Expenses
Our principal operating expenses are divided into the following categories:
• | Sales and Marketing: Our sales and marketing expenses consist primarily of salaries, benefits, and non-cash share-based compensation for our employees engaged in sales, sales support, and marketing. |
• | Product Development and Content: Our product development and content expenses including costs incurred in the classification and organization of listings within our websites, including salaries, benefits, and non-cash share-based compensation for our employees, utility charges, occupancy and support for our offsite technology infrastructure, bandwidth and content delivery fees, and development and maintenance costs, are charged to expense as incurred. |
• | General and Administrative: Our general and administrative expenses consist primarily of salaries, benefits, and non-cash share-based compensation for our executives as well as our finance, legal, human resources, and other administrative employees. In addition, our general and administrative expenses include outside consulting, legal and accounting services, and facilities and other supporting overhead costs. |
42
• | Depreciation and Amortization: Our depreciation and amortization are non-cash expenses which have consisted primarily of depreciation and amortization related to our property and equipment, and intangible assets. Currently, the amortization expense is attributable to intangible assets associated with the acquisition of Skout, if(we) and Lovoo. |
• | Acquisition and Restructuring Costs: Acquisition costs include transactions costs including legal and diligence costs, accounting fees, employee retention bonuses in connection with the acquisitions and travel costs incurred by us during the acquisition process. Restructuring costs include costs incurred related to our business acquisitions, costs incurred in conjunction with the restructuring of our business processes, exit costs of non-cancellable leases, employee exit and relocation costs recorded as incurred. |
• | Other Income (Expense): Other income (expense) consists primarily of interest earned and interest expense. We have invested our cash in AAA rated, fully liquid money market accounts. Interest expense relates to our credit facilities as discussed in Note 7— Long-Term Debt of the accompanying notes to the consolidated financial statements. |
Contractual Obligations
Our principal commitments consist of obligations for capital and operating leases. The following table summarizes our commitments to settle contractual obligations in cash as of December 31, 2017.
Total | Less Than 1 Year | 1-3 Years | 3-5 Years | More than 5 Years | |||||||||||||||
Capital leases(1) | $ | 469,808 | $ | 271,829 | $ | 192,941 | $ | 5,038 | $ | — | |||||||||
Operating leases(2) | 8,888,225 | 4,573,691 | 3,418,613 | 895,921 | — | ||||||||||||||
Cloud data storage(3) | 4,645,218 | 126,331 | 1,160,835 | 2,130,486 | 1,227,566 | ||||||||||||||
New Term Loan Facility(4) | 56,250,000 | 15,000,000 | 41,250,000 | — | — | ||||||||||||||
Total | $ | 70,253,251 | $ | 19,971,851 | $ | 46,022,389 | $ | 3,031,445 | $ | 1,227,566 | |||||||||
(1) | The capital lease obligations relate to equipment lease agreements for equipment primarily used in our data centers. |
(2) | The operating lease obligations relate to equipment and facilities we lease in the U.S. |
(3) | The cloud data storage costs relate to Google Cloud costs from our Lovoo application. |
(4) | Interest rates on the New Term Loan Facility are variable in nature, however, we are party to a fixed-pay amortizing interest rate swap having a remaining notional amount of $41.3 million and a non-amortizing interest rate cap with a notional amount of $15.0 million. If interest rates were to remain at the December 31, 2017 level, we would make interest payments of $0.2 million in less than 1 year and 1 - 3 years, respectively, of net settlements on the fixed-pay amortizing interest rate swap. |
Off-Balance Sheet Arrangements
As of December 31, 2017, we did not have any relationships with unconsolidated entities or financial partners, such as entities often referred to as structured finance or special purpose entities, established for the purpose of facilitating off-balance sheet arrangements or other contractually narrow or limited purposes. As such, we are not materially exposed to any financing, liquidity, market or credit risk that could arise if we had engaged in such relationships.
Non-GAAP – Financial Measure
The following discussion and analysis includes both financial measures in accordance with GAAP, as well as Adjusted EBITDA, which is a non-GAAP financial measure. Generally, a non-GAAP financial measure is a numerical measure of a company’s performance, financial position or cash flows that either excludes or includes amounts that are not normally included or excluded in the most directly comparable measure calculated and presented in accordance with GAAP. Non-GAAP financial measures should be viewed as supplemental to, and should not be considered as alternatives to, net income, operating income, and cash flow from operating activities, liquidity or any other financial measures. They may not be indicative of our historical operating results nor are they intended to be predictive of potential future results. Investors should not consider non-GAAP financial measures in isolation or as substitutes for performance measures calculated in accordance with GAAP.
We believe that both management and stockholders benefit from referring to Adjusted EBITDA in planning, forecasting, and analyzing future periods. We use this non-GAAP financial measure in evaluating our financial and operational decision making and as a means to evaluate period-to-period comparison.
43
We define Adjusted EBITDA as earnings (or loss) from operations before interest expense, benefit or provision for income taxes, depreciation and amortization, stock-based compensation, changes in warrant obligations, nonrecurring acquisition, restructuring or other expenses, gain or loss on cumulative foreign currency translation adjustment, gains on sales of assets, bad debt expense outside the normal range, and goodwill and long-lived asset impairment charges, if any. We exclude stock-based compensation because it is non-cash in nature. We believe Adjusted EBITDA is an important measure of our operating performance because it allows management, investors, and analysts to evaluate and assess our core operating results from period to period after removing the impact of acquisition related costs, and other items of a non-operational nature that affect comparability. We recognize that Adjusted EBITDA has inherent limitations because of the excluded items.
We have included a reconciliation of our net (loss) income, which is the most comparable financial measure calculated in accordance with GAAP, to Adjusted EBITDA. We believe that providing this non-GAAP financial measure, together with the reconciliation from GAAP, helps investors make comparisons between us and other companies. In making any comparisons to other companies, investors need to be aware that companies use different non-GAAP measures to evaluate their financial performance. Investors should pay close attention to the specific definition being used and to the reconciliation between such measure and the corresponding GAAP measure provided by each company under applicable SEC rules.
The following table presents a reconciliation of net income, a GAAP financial measure, to Adjusted EBITDA:
For the Years Ended December 31, | |||||||||||
2017 | 2016 | 2015 | |||||||||
Net (loss) income | $ | (64,591,727 | ) | $ | 46,268,618 | $ | 5,969,628 | ||||
Interest expense | 860,392 | 19,388 | 459,962 | ||||||||
Change in warrant liability | — | 864,596 | 616,607 | ||||||||
Income tax expense (benefit) | 6,703,600 | (27,875,362 | ) | 276,301 | |||||||
Depreciation and amortization | 11,573,827 | 4,069,211 | 3,140,205 | ||||||||
Stock-based compensation expense | 8,467,278 | 3,567,987 | 3,341,965 | ||||||||
Goodwill impairment | 56,428,861 | — | — | ||||||||
Acquisition and restructuring | 12,151,492 | 2,457,295 | — | ||||||||
Bad debt expense outside normal range | — | — | 5,735,204 | ||||||||
Loss (gain) on foreign currency adjustment | 32,488 | (33,416 | ) | — | |||||||
Loss on cumulative foreign currency translation adjustment | — | — | 856,438 | ||||||||
Gain on sale of asset | — | — | (163,333 | ) | |||||||
Adjusted EBITDA | $ | 31,626,211 | $ | 29,338,317 | $ | 20,232,977 | |||||
Recent Accounting Pronouncements
For detailed information regarding recently issued accounting pronouncements and the expected impact on our financial statements, see Note 1— Description of Business, Basis of Presentation and Summary of Significant Accounting Policies in the accompanying notes to the consolidated financial statements included in this Annual Report on Form 10-K.
Item 7A. QUANTITATIVE AND QUALITATIVE DISCLOSURES ABOUT MARKET RISK
The primary objective of our investment activities is to preserve principal while at the same time maximizing yields without significantly increasing risk. Our cash balance as of December 31, 2017 was held in insured depository accounts, of which $17.0 million exceeded insurance limits.
44
ITEM 8. FINANCIAL STATEMENTS AND SUPPLEMENTARY DATA.
The Meet Group, Inc.
Index to Consolidated Financial Statements
Page | |
Reports of Independent Registered Public Accounting Firm | |
Consolidated Balance Sheets as of December 31, 2017 and 2016 | |
Consolidated Statements of Operations and Comprehensive (Loss) Income for the Years Ended December 31, 2017, 2016 and 2015 | |
Consolidated Statements of Changes in Stockholders’ Equity for the Years Ended December 31, 2017, 2016 and 2015 | |
Consolidated Statements of Cash Flows for the Years Ended December 31, 2017, 2016 and 2015 | |
Notes to Consolidated Financial Statements | |
45
REPORT OF INDEPENDENT REGISTERED PUBLIC ACCOUNTING FIRM
To the Stockholders and the Board of Directors of The Meet Group, Inc.
Opinion on the Financial Statements
We have audited the accompanying consolidated balance sheets of The Meet Group, Inc. and its subsidiaries (the Company) as of December 31, 2017 and 2016, the related consolidated statements of operations and other comprehensive (loss) income, changes in stockholders' equity and cash flows for each of the three years in the period ended December 31, 2017, and the related notes to the consolidated financial statements (collectively, the financial statements). In our opinion, the financial statements present fairly, in all material respects, the financial position of the Company as of December 31, 2017 and 2016, and the results of its operations and its cash flows for each of the three years in the period ended December 31, 2017, in conformity with accounting principles generally accepted in the United States of America.
We have also audited, in accordance with the standards of the Public Company Accounting Oversight Board (United States) (PCAOB), the Company's internal control over financial reporting as of December 31, 2017, based on criteria established in Internal Control - Integrated Framework issued by the Committee of Sponsoring Organizations of the Treadway Commission in 2013, and our report dated March 16, 2018 expressed an unqualified opinion on the effectiveness of the Company's internal control over financial reporting.
Basis for Opinion
These financial statements are the responsibility of the Company’s management. Our responsibility is to express an opinion on the Company’s financial statements based on our audits. We are a public accounting firm registered with the PCAOB and are required to be independent with respect to the Company in accordance with U.S. federal securities laws and the applicable rules and regulations of the Securities and Exchange Commission and the PCAOB.
We conducted our audits in accordance with the standards of the PCAOB. Those standards require that we plan and perform the audits to obtain reasonable assurance about whether the financial statements are free of material misstatement, whether due to error or fraud. Our audits included performing procedures to assess the risks of material misstatement of the financial statements, whether due to error or fraud, and performing procedures that respond to those risks. Such procedures included examining, on a test basis, evidence regarding the amounts and disclosures in the financial statements. Our audits also included evaluating the accounting principles used and significant estimates made by management, as well as evaluating the overall presentation of the financial statements. We believe that our audits provide a reasonable basis for our opinion.
We have served as the Company's auditor since 2013.
/s/ RSM US LLP
Blue Bell, Pennsylvania
March 16, 2018
46
REPORT OF INDEPENDENT REGISTERED PUBLIC ACCOUNTING FIRM
To the Stockholders and Board of Directors of The Meet Group, Inc.
Opinion on the Internal Control Over Financial Reporting
We have audited The Meet Group, Inc.'s (the Company) internal control over financial reporting as of December 31, 2017, based on criteria established in Internal Control - Integrated Framework issued by the Committee of Sponsoring Organizations of the Treadway Commission in 2013. In our opinion, the Company maintained, in all material respects, effective internal control over financial reporting as of December 31, 2017, based on criteria established in Internal Control - Integrated Framework issued by the Committee of Sponsoring Organizations of the Treadway Commission in 2013.
We have also audited, in accordance with the standards of the Public Company Accounting Oversight Board (United States) (PCAOB), the 2017 consolidated financial statements of the Company and our report dated March 16, 2018 expressed an unqualified opinion.
As described in Management’s Report on Internal Control Over Financial Reporting, management has excluded Ifwe, LLC and Lovoo GmbH from its assessment of internal control over financial reporting as of December 31, 2017, because they were acquired by the Company in purchase business combinations in the second and fourth quarter of 2017, respectively. We have also excluded Ifwe, LLC and Lovoo GmbH from our audit of internal control over financial reporting. Ifwe, LLC and Lovoo GmbH are wholly-owned subsidiaries whose total assets and net loss represent approximately 26% and (6%), and 31% and 1%, respectively, of the related consolidated financial statement amounts as of and for the year ended December 31, 2017.
Basis for Opinion
The Company’s management is responsible for maintaining effective internal control over financial reporting and for its assessment of the effectiveness of internal control over financial reporting in the accompanying Management’s Report on Internal Control Over Financial Reporting. Our responsibility is to express an opinion on the Company’s internal control over financial reporting based on our audit. We are a public accounting firm registered with the PCAOB and are required to be independent with respect to the Company in accordance with U.S. federal securities laws and the applicable rules and regulations of the Securities and Exchange Commission and the PCAOB.
We conducted our audit in accordance with the standards of the PCAOB. Those standards require that we plan and perform the audit to obtain reasonable assurance about whether effective internal control over financial reporting was maintained in all material respects. Our audit included obtaining an understanding of internal control over financial reporting, assessing the risk that a material weakness exists, and testing and evaluating the design and operating effectiveness of internal control based on the assessed risk. Our audit also included performing such other procedures as we considered necessary in the circumstances. We believe that our audit provides a reasonable basis for our opinion.
Definition and Limitations of Internal Control Over Financial Reporting
A company's internal control over financial reporting is a process designed to provide reasonable assurance regarding the reliability of financial reporting and the preparation of financial statements for external purposes in accordance with generally accepted accounting principles. A company's internal control over financial reporting includes those policies and procedures that (1) pertain to the maintenance of records that, in reasonable detail, accurately and fairly reflect the transactions and dispositions of the assets of the company; (2) provide reasonable assurance that transactions are recorded as necessary to permit preparation of financial statements in accordance with generally accepted accounting principles, and that receipts and expenditures of the company are being made only in accordance with authorizations of management and directors of the company; and (3) provide reasonable assurance regarding prevention or timely detection of unauthorized acquisition, use or disposition of the company's assets that could have a material effect on the financial statements.
Because of its inherent limitations, internal control over financial reporting may not prevent or detect misstatements. Also, projections of any evaluation of effectiveness to future periods are subject to the risk that controls may become inadequate because of changes in conditions, or that the degree of compliance with the policies or procedures may deteriorate.
/s/ RSM US LLP
Blue Bell, Pennsylvania
March 16, 2018
47
THE MEET GROUP, INC. AND SUBSIDIARIES
CONSOLIDATED BALANCE SHEETS
AS OF DECEMBER 31, 2017 and 2016
2017 | 2016 | ||||||
ASSETS | |||||||
CURRENT ASSETS: | |||||||
Cash and cash equivalents | $ | 24,158,444 | $ | 21,852,531 | |||
Accounts receivable, net of allowance of $527,958 and $283,000 at December 31, 2017 and 2016, respectively | 26,443,675 | 23,737,254 | |||||
Prepaid expenses and other current assets | 3,245,174 | 1,489,267 | |||||
Total current assets | 53,847,293 | 47,079,052 | |||||
Restricted cash | 894,551 | 393,484 | |||||
Goodwill | 150,694,135 | 114,175,554 | |||||
Property and equipment, net | 4,524,118 | 2,466,110 | |||||
Intangible assets, net | 48,719,428 | 17,010,565 | |||||
Deferred taxes | 15,521,214 | 28,253,827 | |||||
Other assets | 1,144,032 | 110,892 | |||||
Total assets | $ | 275,344,771 | $ | 209,489,484 | |||
LIABILITIES AND STOCKHOLDERS’ EQUITY | |||||||
CURRENT LIABILITIES: | |||||||
Accounts payable | $ | 6,277,846 | $ | 5,350,336 | |||
Accrued liabilities | 19,866,438 | 8,395,060 | |||||
Current portion of long-term debt | 15,000,000 | — | |||||
Current portion of capital lease obligations | 254,399 | 221,302 | |||||
Deferred revenue | 4,433,450 | 434,197 | |||||
Total current liabilities | 45,832,133 | 14,400,895 | |||||
Long-term capital lease obligations, less current portion, net | 192,137 | — | |||||
Long-term debt | 40,637,106 | — | |||||
Long-term derivative liability | 2,995,657 | — | |||||
Other liabilities | 147,178 | — | |||||
Total liabilities | $ | 89,804,211 | $ | 14,400,895 | |||
Commitments and Contingencies (see Note 8) | — | — | |||||
STOCKHOLDERS’ EQUITY: | |||||||
Preferred stock, $.001 par value; authorized - 5,000,000 shares; 0 shares issued and outstanding at December 31, 2017 and 2016 | $ | — | $ | — | |||
Common stock, $.001 par value; authorized - 100,000,000 shares; 71,915,018 and 58,945,607 shares issued and outstanding at December 31, 2017 and 2016, respectively | 71,918 | 58,949 | |||||
Additional paid-in capital | 408,029,068 | 351,873,801 | |||||
Accumulated deficit | (221,435,888 | ) | (156,844,161 | ) | |||
Accumulated other comprehensive loss | (1,124,538 | ) | — | ||||
Total stockholders’ equity | 185,540,560 | 195,088,589 | |||||
Total liabilities and stockholders’ equity | $ | 275,344,771 | $ | 209,489,484 | |||
See notes to consolidated financial statements.
48
THE MEET GROUP, INC. AND SUBSIDIARIES
CONSOLIDATED STATEMENTS OF OPERATIONS AND COMPREHENSIVE (LOSS) INCOME
FOR THE YEARS ENDED DECEMBER 31, 2017, 2016 and 2015
2017 | 2016 | 2015 | |||||||||
Revenues | $ | 123,753,813 | $ | 76,124,109 | $ | 56,903,773 | |||||
Operating costs and expenses: | |||||||||||
Sales and marketing | 20,355,964 | 15,089,987 | 6,618,837 | ||||||||
Product development and content | 60,704,473 | 25,790,173 | 24,615,304 | ||||||||
General and administrative | 19,549,805 | 9,494,804 | 14,534,861 | ||||||||
Depreciation and amortization | 11,573,827 | 4,069,211 | 3,140,205 | ||||||||
Acquisition and restructuring | 12,151,492 | 2,457,295 | — | ||||||||
Goodwill impairment | 56,428,861 | — | — | ||||||||
Total operating costs and expenses | 180,764,422 | 56,901,470 | 48,909,207 | ||||||||
(Loss) income from operations | (57,010,609 | ) | 19,222,639 | 7,994,566 | |||||||
Other income (expense): | |||||||||||
Interest income | 5,731 | 21,185 | 21,037 | ||||||||
Interest expense | (860,392 | ) | (19,388 | ) | (459,962 | ) | |||||
Change in warrant liability | — | (864,596 | ) | (616,607 | ) | ||||||
(Loss) gain on foreign currency adjustment | (32,488 | ) | 33,416 | — | |||||||
Loss on cumulative foreign currency translation adjustment | — | — | (856,438 | ) | |||||||
Gain on sale of asset | — | — | 163,333 | ||||||||
Other | 9,631 | — | — | ||||||||
Total other expense | (877,518 | ) | (829,383 | ) | (1,748,637 | ) | |||||
(Loss) income before income tax (expense) benefit | (57,888,127 | ) | 18,393,256 | 6,245,929 | |||||||
Income tax (expense) benefit | (6,703,600 | ) | 27,875,362 | (276,301 | ) | ||||||
Net (loss) income | $ | (64,591,727 | ) | $ | 46,268,618 | $ | 5,969,628 | ||||
Basic and diluted net (loss) income per common stockholders: | |||||||||||
Basic net (loss) income per common stockholders | $ | (0.94 | ) | $ | 0.89 | $ | 0.13 | ||||
Diluted net (loss) income per common stockholders | $ | (0.94 | ) | $ | 0.80 | $ | 0.12 | ||||
Weighted average shares outstanding: | |||||||||||
Basic | 68,743,956 | 51,963,702 | 45,419,175 | ||||||||
Diluted | 68,743,956 | 57,745,652 | 49,535,826 | ||||||||
Other comprehensive (loss) income: | |||||||||||
Net (loss) income | $ | (64,591,727 | ) | $ | 46,268,618 | $ | 5,969,628 | ||||
Other comprehensive income (loss): | |||||||||||
Reclassification of losses on derivative financial instruments, net of tax expense of $548,063 | 1,565,896 | — | — | ||||||||
Unrealized losses on derivative financial instruments, net of tax of benefit of $850,845 | (2,302,415 | ) | — | — | |||||||
Foreign currency translation adjustment | (388,019 | ) | — | — | |||||||
Comprehensive (loss) income | $ | (65,716,265 | ) | $ | 46,268,618 | $ | 5,969,628 | ||||
See notes to consolidated financial statements.
49
THE MEET GROUP, INC. AND SUBSIDIARIES
CONSOLIDATED STATEMENTS OF CHANGES IN STOCKHOLDERS' EQUITY
FOR THE YEARS ENDED DECEMBER 31, 2017, 2016 and 2015
Preferred Stock | Common Stock | Additional Paid-in | Accumulated | Accumulated Other Comprehensive | Total Stockholders' | ||||||||||||||||||||||||
Shares | Amount | Shares | Amount | Capital | Deficit | (Loss) Income | Equity | ||||||||||||||||||||||
Balance— December 31, 2014 | 1,000,000 | $ | 1,000 | 44,910,034 | $ | 44,914 | $ | 297,001,168 | $ | (204,072,240 | ) | $ | (717,875 | ) | $ | 92,256,967 | |||||||||||||
Vesting of stock options for compensation | — | — | — | — | 2,916,427 | — | 2,916,427 | ||||||||||||||||||||||
Stock compensation expense for warrant modification | — | — | — | — | 425,538 | — | 425,538 | ||||||||||||||||||||||
Issuance of common stock for vested RSAs | — | — | 557,603 | 557 | (557 | ) | — | — | |||||||||||||||||||||
Exercise of stock options | — | — | 231,900 | 232 | 383,695 | — | 383,927 | ||||||||||||||||||||||
Conversion of preferred stock to common stock | (1,000,000 | ) | (1,000 | ) | 1,479,949 | 1,480 | (480 | ) | — | — | |||||||||||||||||||
Foreign currency translation adjustment | — | — | — | — | — | (138,563 | ) | (138,563 | ) | ||||||||||||||||||||
Loss on cumulative currency translation adjustment | — | — | — | — | — | 856,438 | 856,438 | ||||||||||||||||||||||
Net income | — | — | — | — | — | 5,969,628 | — | 5,969,628 | |||||||||||||||||||||
Balance— December 31, 2015 | — | — | 47,179,486 | 47,183 | 300,725,791 | (198,102,612 | ) | — | 102,670,362 | ||||||||||||||||||||
Vesting of stock options for compensation | — | — | — | — | 3,567,987 | — | — | 3,567,987 | |||||||||||||||||||||
Exercise of stock options | — | — | 4,693,918 | 4,694 | 8,841,370 | — | — | 8,846,064 | |||||||||||||||||||||
Exercise of warrants | — | — | 1,763,340 | 1,763 | 6,368,305 | — | — | 6,370,068 | |||||||||||||||||||||
Issuance of common stock for Skout acquisition | — | — | 5,222,017 | 5,222 | 32,371,283 | — | — | 32,376,505 | |||||||||||||||||||||
Issuance of common stock for vested RSAs | — | — | 934,991 | 935 | (935 | ) | — | — | — | ||||||||||||||||||||
Repurchase and retirement of common stock | — | — | (848,145 | ) | (848 | ) | — | (5,010,167 | ) | — | (5,011,015 | ) | |||||||||||||||||
Net income | — | — | — | — | — | 46,268,618 | — | 46,268,618 | |||||||||||||||||||||
Balance— December 31, 2016 | — | — | 58,945,607 | 58,949 | 351,873,801 | (156,844,161 | ) | — | 195,088,589 | ||||||||||||||||||||
Vesting of stock options for compensation | — | — | — | — | 8,467,278 | — | — | 8,467,278 | |||||||||||||||||||||
Exercise of stock options | — | — | 2,080,648 | 2,081 | 2,814,654 | — | — | 2,816,735 | |||||||||||||||||||||
Exercise of warrants | — | — | 675,000 | 675 | 2,395,575 | — | — | 2,396,250 | |||||||||||||||||||||
Issuance of common stock | — | — | 9,200,000 | 9,200 | 42,986,171 | — | — | 42,995,371 | |||||||||||||||||||||
Issuance of common stock for vested RSAs | 1,013,763 | 1,013 | (1,013 | ) | — | — | — | ||||||||||||||||||||||
RSAs withheld to cover taxes | — | — | (507,398 | ) | — | — | (507,398 | ) | |||||||||||||||||||||
Other comprehensive loss | — | — | — | — | — | — | (1,124,538 | ) | (1,124,538 | ) | |||||||||||||||||||
Net loss | — | — | — | — | — | (64,591,727 | ) | — | (64,591,727 | ) | |||||||||||||||||||
Balance— December 31, 2017 | — | $ | — | 71,915,018 | $ | 71,918 | $ | 408,029,068 | $ | (221,435,888 | ) | $ | (1,124,538 | ) | $ | 185,540,560 | |||||||||||||
See notes to consolidated financial statements.
50
THE MEET GROUP, INC. AND SUBSIDIARIES
CONSOLIDATED STATEMENTS OF CASH FLOWS
FOR THE YEARS ENDED DECEMBER 31, 2017, 2016 and 2015
2017 | 2016 | 2015 | |||||||||
Cash flows from operating activities: | |||||||||||
Net (loss) income | $ | (64,591,727 | ) | $ | 46,268,618 | $ | 5,969,628 | ||||
Adjustments to reconcile net (loss) income to net cash provided by operating activities: | |||||||||||
Depreciation and amortization | 11,573,827 | 4,069,211 | 3,140,205 | ||||||||
Gain on sale of asset | — | — | (163,333 | ) | |||||||
Goodwill impairment | 56,428,861 | — | — | ||||||||
Vesting of stock options for compensation | 8,467,278 | 3,567,987 | 2,916,427 | ||||||||
Stock compensation expense for warrant modification | — | — | 425,538 | ||||||||
Deferred taxes | 6,927,513 | (28,096,716 | ) | — | |||||||
Loss on cumulative foreign currency translation adjustment | — | — | 856,438 | ||||||||
Loss (gain) on cumulative foreign currency (translation) | 2,413 | (33,416 | ) | — | |||||||
Bad debt expense | 262,848 | 150,000 | (453,000 | ) | |||||||
Amortization of loan origination costs | 192,825 | — | 184,868 | ||||||||
Revaluation of warrant liability | — | 864,596 | 616,607 | ||||||||
Change in contingent consideration obligations | 102,734 | — | — | ||||||||
Changes in operating assets and liabilities: | |||||||||||
Accounts receivable | 3,737,383 | (3,231,037 | ) | (7,023,840 | ) | ||||||
Prepaid expenses, other current assets and other assets | 4,734,521 | (171,277 | ) | (19,967 | ) | ||||||
Accounts payable and accrued liabilities | 1,880,304 | 2,583,211 | 684,745 | ||||||||
Deferred revenue | 1,551,886 | (48,282 | ) | 74,929 | |||||||
Net cash provided by operating activities | 31,270,666 | 25,922,895 | 7,209,245 | ||||||||
Cash flows from investing activities: | |||||||||||
Purchase of property and equipment | (1,798,051 | ) | (1,020,582 | ) | (1,769,964 | ) | |||||
Acquisition of business, net of cash and restricted cash acquired | (126,205,859 | ) | (29,910,929 | ) | — | ||||||
Purchase of trademarks and domain names | — | (9,500 | ) | — | |||||||
Proceeds from sale of asset | — | — | 255,000 | ||||||||
Net cash used in investing activities | (128,003,910 | ) | (30,941,011 | ) | (1,514,964 | ) | |||||
Cash flows from financing activities: | |||||||||||
Proceeds from exercise of stock options | 2,816,735 | 8,846,065 | 383,927 | ||||||||
Proceeds from issuance of common stock | 42,995,371 | — | — | ||||||||
Proceeds from exercise of warrants | 2,396,250 | 4,470,335 | — | ||||||||
Purchases of treasury stock | — | (5,011,015 | ) | — | |||||||
Payments of capital leases | (323,512 | ) | (366,114 | ) | (872,761 | ) | |||||
Proceeds from long-term debt | 75,000,000 | — | — | ||||||||
Payments for restricted stock awards withheld for taxes | (507,398 | ) | — | — | |||||||
Loan origination costs | (805,719 | ) | — | — | |||||||
Payments of contingent consideration | (2,897,266 | ) | — | — | |||||||
Payments on long-term debt | (18,750,000 | ) | — | (2,809,806 | ) | ||||||
Net cash provided by (used in) financing activities | 99,924,461 | 7,939,271 | (3,298,640 | ) | |||||||
Change in cash, cash equivalents, and restricted cash prior to effects of foreign currency exchange rate | 3,191,217 | 2,921,155 | 2,395,641 | ||||||||
Effect of foreign currency exchange rate (translation) | (384,237 | ) | 26,822 | (138,653 | ) | ||||||
Net increase in cash, cash equivalents, and restricted cash | 2,806,980 | 2,947,977 | 2,256,988 | ||||||||
Cash, cash equivalents, and restricted cash at beginning of period | 22,246,015 | 19,298,038 | 17,041,050 | ||||||||
Cash, cash equivalents, and restricted cash at end of period | $ | 25,052,995 | $ | 22,246,015 | $ | 19,298,038 | |||||
Supplemental disclosure of cash flow information: | |||||||||||
Cash paid for interest | $ | 645,372 | $ | 16,228 | $ | 275,094 | |||||
Supplemental disclosure of non-cash investing and financing activities: | |||||||||||
Equity consideration attributable to the acquisition of Skout, Inc. | $ | — | $ | 32,376,505 | $ | — | |||||
Warrant exercise settlement | $ | — | $ | 1,899,733 | $ | — | |||||
See notes to consolidated financial statements.
51
THE MEET GROUP, INC. AND SUBSIDIARIES
NOTES TO CONSOLIDATED FINANCIAL STATEMENTS
Note 1— Description of Business, Basis of Presentation and Summary of Significant Accounting Policies
The Meet Group, Inc. (the “Company,” “The Meet Group,” “us,” or “we”) is a portfolio of mobile social entertainment apps designed to meet the universal need for human connection. We leverage a powerful live-streaming video platform, empowering our global community to forge meaningful connections. Our primary apps are MeetMe®, LOVOO®, Skout®, and Tagged®.
We operate location-based social networks for meeting new people, primarily on mobile platforms, including on iPhone, Android, iPad and other tablets, that facilitate interactions among users and encourage users to connect, communicate and engage with each other. In 2017, we laid the foundation for and launched live video, which we believe is the most compelling product we have ever offered. Having historically generated revenue primarily through advertising, live video and other forms of user-pay monetization, including subscriptions and in-app purchases, are becoming an increasingly larger component of total revenue. We believe revenues from video are more sustainable, can grow faster, and are more aligned with the quality of the user experience than revenues from advertising.
We launched live video monetization on two of our apps in 2017 and have seen strong early interest from our users, including increasing engagement and revenue. We also added two additional apps to The Meet Group portfolio. On April 3, 2017, we completed our acquisition of Ifwe Inc. (“if(we)”), a leading global mobile network for meeting new people, and on October 19, 2017, we completed our acquisition of Lovoo GmbH (“Lovoo”), a leading dating app provider in Germany. We believe these acquisitions, in addition to our acquisition of Skout, Inc. (“Skout”) on October 3, 2016, provide significant scale for the future global growth of our social entertainment platform, and we are hard at work today integrating our video technology into both properties.
We also offer online marketing capabilities, which enable marketers to display their advertisements in different formats and in different locations. We offer significant scale to our advertising partners, with hundreds of millions of daily impressions across our active global user base, and sophisticated data science for highly effective hyper-targeting. We work with our advertisers and advertising networks to maximize the effectiveness of their campaigns by optimizing advertisement formats and placements.
Just as Facebook has established itself as the social network of friends and family, and LinkedIn as the social network of colleagues and business professionals, The Meet Group is creating the social entertainment network not of the people you know but of the people you want to know. Nimble and fast-moving, already in more than 100 countries, we are challenging the dominant player in our space, Match Group, and differentiating ourselves with live video, which is not offered by many of our direct competitors. Modeled after the video products offered by Chinese dating app providers, but enhanced in order to appeal to western audiences, our live video product is aimed at the nexus of entertainment and community, where we believe our apps exhibit natural strength.
Our vision extends beyond dating and entertainment. We focus on building quality products to satisfy the universal need for human connection among all people, everywhere--not just paying subscribers. We believe meeting new people is a basic human need, especially for users aged 18-34, when so many long-lasting relationships are made. We use advanced technology to engineer serendipitous connections among people who otherwise might never have met - a sort of digital coffeehouse where everyone belongs. Over the years, The Meet Group’s apps have originated untold numbers of chats, shares, good friendships, dates, romantic relationships - even marriages.
We believe that we have significant growth opportunities enabled through our social entertainment platform. We believe our scale provides unique advantages to grow video monetization, while also establishing a high density of users within the geographic regions we serve. As The Meet Group networks grow and the number of users in a location increases, we believe that users who are seeking to meet new people will incrementally benefit from the quantity of relevant connections.
Basis of Presentation
The Company’s consolidated financial statements are prepared in accordance with accounting principles generally accepted in the U.S. (“GAAP”). The consolidated financial statements include the accounts of all subsidiaries and affiliates in which the Company holds a controlling financial interest as of the date of the consolidated financial statements.
The consolidated financial statements include the accounts of The Meet Group and its wholly-owned subsidiaries. All intercompany accounts and transactions have been eliminated in consolidation.
52
Use of Estimates
The preparation of the Company’s consolidated financial statements in conformity with GAAP requires the Company to make estimates and assumptions that affect the reported amounts of assets and liabilities and disclosure of contingent assets and liabilities at the date of the consolidated financial statements and the reported amounts of revenues and expenses during the reporting period. Significant estimates and assumptions are required in the determination of business combinations, revenue recognition, accounting for business combinations, accounts receivable valuation, the fair value of financial instruments, the valuation of long-lived assets, valuation of deferred tax assets, income taxes, contingencies, goodwill and intangible assets, and stock-based compensation. Some of these judgments can be subjective and complex, and, consequently, actual results may differ from these estimates. The Company’s estimates often are based on complex judgments, probabilities and assumptions that it believes to be reasonable but that are inherently uncertain and unpredictable. For any given individual estimate or assumption made by the Company, there may also be other estimates or assumptions that are reasonable.
The Company regularly evaluates its estimates and assumptions using historical experience and other factors, including the economic environment. As future events and their effects cannot be determined with precision, the Company’s estimates and assumptions may prove to be incomplete or inaccurate, or unanticipated events and circumstances may occur that might cause it to change those estimates and assumptions. Market conditions, such as illiquid credit markets, volatile equity markets, dramatic fluctuations in foreign currency rates and economic downturn, can increase the uncertainty already inherent in its estimates and assumptions. The Company adjusts its estimates and assumptions when facts and circumstances indicate the need for change. Those changes generally will be reflected in the Company’s consolidated financial statements on a prospective basis unless they are required to be treated retrospectively under the relevant accounting standard. It is possible that other professionals, applying reasonable judgment to the same facts and circumstances, could develop and support a range of alternative estimated amounts. The Company is also subject to other risks and uncertainties that may cause actual results to differ from estimated amounts, such as changes in competition, litigation, legislation and regulations.
Revenue Recognition
The Company recognizes revenue when persuasive evidence of an arrangement exists, delivery has occurred or services have been rendered, the purchase price is fixed or determinable and collectability is reasonably assured. The Company earns revenue from the display of advertisements on its mobile apps and website, primarily based on a cost per thousand (“CPM”) model. The Company recognizes revenue in accordance with ASC 605, “Revenue Recognition,” and ASC 605-45 “Principal Agent Considerations” (together, the “ASC Guidance”). Revenue from advertising on the Company’s website and mobile apps is generally recognized on a net basis, since the majority of its advertising revenues come from advertising agencies. The guidance provides indicators for determining whether “gross” or “net” presentation is appropriate. While all indicators should be considered, the Company believes that whether it acted as a primary obligor in its agreements with advertising agencies is the strongest indicator of whether gross or net revenue reporting is appropriate.
During the years ended December 31, 2017, 2016 and 2015, the Company had transactions with several partners that qualify for principal agent considerations. The Company recognizes revenue, net of amounts retained by third party entities, pursuant to revenue sharing agreements with advertising networks for advertising and with other partners for royalties on product sales. The Company considered two key factors when making its revenue recognition determinations: (1) whether the Company performed a service for a fee, similar to an agent or a broker; and (2) whether the Company was involved in the determination of product or service specifications. The Company focused on the substance of the agreements and determined that net presentation was representationally faithful to the substance, as well as the form, of the agreements. The form of the agreements was such that the Company provided services in exchange for a fee. In addition, the Company has no latitude in establishing price, and the advertising agencies were solely responsible for determining pricing with third party advertisers. The Company determined only the fee for providing its services to advertising agencies.
In instances in which the Company works directly with an advertiser, revenue is recognized on a gross basis. The Company is the primary obligor in arrangements made with direct advertisers, as there is no third party facilitating or managing the sales process. The Company is solely responsible for determining price, product or service specifications, and which advertisers to use. The Company assumes all credit risk in the sales arrangements made with direct advertisers.
During the years ended December 31, 2017, 2016 and 2015, the Company’s revenue was generated from two principal sources: revenue earned from the sales of advertising on the Company’s mobile applications and website and revenue earned from in-app products.
53
Advertising Revenue
Advertising and custom sponsorship revenues consist primarily of advertising fees earned from the display of advertisements on the Company’s website and mobile applications. Revenue from advertising is generally recognized as advertisements are delivered. The Company recognizes advertising revenue from customers that are advertising networks on a net basis, while advertising revenues earned directly from advertisers are recognized on a gross basis. Approximately 73%, 94% and 93% of the Company’s revenue came from advertising during the years ended December 31, 2017, 2016 and 2015, respectively.
In-App Purchases
Revenue is earned from in-app purchase products sold to our mobile application and website users. The Company offers in-app products such as Credits, Points, Gold and Icebreakers. Users buy Credits, Points, Gold or Icebreakers to purchase the Company’s virtual products. These products allow users to engage with other users on the apps and in live video, and put users in the spotlight, helping users to get more attention from the community in order to meet more people faster. Revenue from these virtual products is recognized over time. Credits, Points, Gold and Icebreakers can be purchased using iTunes and Google checkout on mobile applications. Platform users do not own the Credits, Points, Gold or Icebreakers but have a limited right to use the Credits, Points, Gold or Icebreakers on virtual products offered for sale on the Company’s platforms. Credits, Points, Gold and Icebreakers are non-refundable, the Company may change the purchase price of Credits, Points, Gold or Icebreakers at any time, and the Company reserves the right to stop issuing Credits, Points, Gold and Icebreakers in the future. The Company’s in-app products are not transferable, cannot be sold or exchanged outside our platform, are not redeemable for any sum of money, and can only be used on the Company’s platforms. In-app products are recorded in deferred revenue when purchased and recognized as revenue when: (i) the Credits, Points, Gold or Icebreakers are used by the customer; or (ii) the Company determines the likelihood of the Credits, Points, Gold or Icebreakers being redeemed by the customer is remote (breakage) and there is not a legal obligation to remit the unredeemed Credits, Points, Gold or Icebreakers to the relevant jurisdiction. The determination of the breakage rate is based upon Company-specific historical redemption patterns. Breakage is recognized in revenue as the Credits, Points, Gold and Icebreakers are used on a pro rata basis over a three or six month period (life of the user) beginning at the date of the Credit, Point, Gold or Icebreakers’ sale and is included in revenue in the consolidated statements of operations and comprehensive (loss) income. Breakage recognized during the years ended December 31, 2017, 2016 and 2015 was $1.5 million, $1.3 million and $0.8 million, respectively. For “MeetMe+” and other subscription based products, the Company recognizes revenue over the term of the subscription.
The Company also earns revenue from advertisement products from currency engagement actions (i.e. sponsored engagement advertisements) by users on all of the Company’s platforms, including cost-per-action (“CPA”) currency incented promotions and sales on its proprietary cross-platform currency monetization product, “Social Theater.” The Company controls and develops the Social Theater product and CPA promotions and acts as a user’s principal in these transactions and recognizes the related revenue on a gross basis when collections are reasonably assured and upon delivery of the Credits to the user’s account. When a user performs an action, the user earns Credits and the Company earns product revenue from the advertiser.
Social Theater is a product that allows the Company to offer advertisers a way to leverage the third party platforms through guaranteed actions by their user bases. Social Theater is also hosted on the Company’s platform. Typical guaranteed actions available to advertisers are video views, fan page growth, quizzes and surveys. Social Theater revenue is recognized when persuasive evidence of an arrangement exists, the sales price is fixed or determinable, collectability is reasonably assured, and the service has been rendered. The Social Theater prices are both fixed and determinable based on the contract with the advertiser. The user completes an action and the electronic record of the transaction triggers the revenue recognition. The collection of the Social Theater revenue is reasonably assured by contractual obligation and historical payment performance. The delivery of virtual currency from the hosting platform to a user evidences the completion of the action required by the customer that the service has been rendered for Social Theater revenue recognition.
Beanstock Media Inc.
Web Agreement
On September 25, 2013, the Company entered into a Media Publisher Agreement (the “Web Agreement”) with Beanstock Media, Inc. (“Beanstock”). The Web Agreement was effective from September 23, 2013 until June 2, 2015 when the Company terminated the Web Agreement as a result of non-payment by Beanstock of amounts owed.
Pursuant to the Web Agreement, Beanstock had the exclusive right and obligation to fill all of the Company’s remnant desktop in-page display advertising inventory on www.meetme.com (the “Site”), excluding, (i) any inventory sold to a third party under an insertion order that was campaign or advertiser specific, (ii) any inventory the Company reserved in existing and future agreements with third parties for barter transactions and as additional consideration as part of larger business development
54
transactions, and (iii) any inventory reserved for premium advertising for the Site. The Company could have continued to place inventory outside of the Web Agreement in direct sales.
Beanstock was obligated to pay for all advertising requests that the Company delivered, whether or not Beanstock filled them. For the U.S., Beanstock was obligated to pay the Company specified CPM rates plus a percentage of revenue in excess of those rates; for the rest of the world, Beanstock was obligated to pay the Company 90% of its net ad revenue for the Site.
The Company could terminate the Web Agreement at any time without charge or penalty by providing written notice to Beanstock. Either party could terminate the Web Agreement if the other party was in material breach of its obligations and did not cure such breach, or if the other party filed a petition for bankruptcy, became insolvent, made an assignment for the benefit of its creditors, or a receiver is appointed for such party or its business.
For the year ended December 31, 2015, the Company recognized approximately $2.2 million under the terms of the Web Agreement. On June 2, 2015, the Company terminated the Web Agreement as a result of non-payment by Beanstock of amounts owed, and resumed managing its web advertising inventory in-house. In the third quarter of 2015, the Company determined that the $1.3 million receivable in connection with the Web Agreement was deemed uncollectible and as a result the Company incurred a bad debt expense of the entire amount. For the years ended December 31, 2017 and 2016, the Company did not recognize any revenue related to the Web Agreement.
Mobile Agreement
On December 23, 2014, the Company entered into an Advertising Agreement with Beanstock (the “Mobile Agreement”). On June 2, 2015, the Company terminated the Mobile agreement with Beanstock as a result of non-payment by Beanstock of amounts owed.
Pursuant to the Mobile Agreement, Beanstock had the right and obligation to fill substantially all of the Company’s advertising inventory on its MeetMe mobile app for iOS and Android, as well as the Site when accessed using a mobile device and as optimized for mobile devices (collectively, the “App”). The Mobile Agreement did not apply to interstitially placed advertisements, advertisements on versions of the App specific to the iPad and other Apple tablet devices, other mobile apps or in-app products or features on the App, including, without limitation, offer wall features and the Company’s Social Theater business.
Under the Mobile Agreement, the Company began placing ad calls (not including prior test calls) with Beanstock on March 1, 2015 (the “Effective Date”).
The Company could, on a basis substantially consistent with its advertising display logic (as set forth in the Mobile Agreement) (“Ad Logic”), (i) add additional sections or features to the App and provide them with ads, and (ii) change the locations and sizes of particular ad placements within the App; in any such case, all resulting ad placements would be subject to the Mobile Agreement. In addition, if the Company wished to increase the number, type, frequency or scope of placements in the Ad Logic, it would be required to first notify Beanstock and upon Beanstock’s written consent, such additional inventory would be added to the Ad Logic. If Beanstock withheld or denied said consent, then the additional inventory would remain outside of the scope of the Mobile Agreement and the Company could fill it otherwise.
Beanstock was required to pay for all ad requests that the Company delivered whether or not Beanstock filled them. Beanstock was required to pay specified CPM rates depending on the type of ad; provided, however, that if more than a stated percentage of impressions originated outside of the U.S. and Canada, then Beanstock was required to pay the Company a percentage of Beanstock’s gross revenue relating to such international ad impressions in excess of that percentage.
Beanstock was required to remit payments due to the Company within thirty days following the last day of each calendar month for that month regardless of advertiser campaign duration; provided, however, that if the balance owing under the Mobile Agreement exceeded a stated amount, then the Company could request Beanstock to accelerate payments so that the balance does not at any point exceed that amount, and Beanstock would be required do so within ten days and for so long as necessary to keep said balance under that amount. Beanstock assumed all risk with regards to collection of all applicable advertiser fees with respect to all of the advertising inventory and was not permitted to delay payment to the Company as a result of non-collection or delay of payment of fees by advertisers. Beanstock was not permitted to withhold or offset amounts owing the Mobile Agreement for any reason.
The Company determined the number of ad calls that it would place under the Mobile Agreement. If Beanstock determined that number to be less than 90% of the Company’s number for any particular month and the parties could not resolve the discrepancy, then the ad call number for that month would be 90% of the number that the Company originally determined.
55
Beanstock agreed to comply with the Company’s advertising editorial guidelines as in effect from time to time.
The Company could terminate the Mobile Agreement upon written notice (i) from the date thereof to the sixtieth day after the Effective Date, or (ii) if, in the Company’s sole discretion, the placement or running of ads on the App caused a diminution in user experience, including without limitation with respect to the crash rate.
In addition, the Mobile Agreement could be terminated upon written notice by (A) either party if the other party (i) was in material breach of its obligations and that party failed to cure said breach within ten days after receipt of written notice thereof from the non-breaching party, or (ii) filed a petition for bankruptcy, became insolvent, made an assignment for the benefit of its creditors, or a receiver was appointed for such other party or its business, or (B) the Company if Beanstock failed to pay any amount thereunder when due (any of the events in this sentence, “Cause”). If the Company terminated the Agreement for Cause or Beanstock terminated it wrongfully, then Beanstock would be required to pay the Company a stated amount as liquidated damages.
Effective March 26, 2015, the Company amended the Mobile Agreement with Beanstock (the “Amendment”). Pursuant to the Amendment, the Company provided certain price reductions on its invoices to Beanstock for the months of March, 2015 and April, 2015, contingent upon certain events to which Beanstock was required to certify. The Amendment provided that the Company would implement certain changes to the Ad Logic for the App by May 1, 2015 as well as make certain product changes with respect to the App by June 1, 2015. The Amendment increased the amount of liquidated damages payable by Beanstock under certain circumstances and provided the Company with a right to terminate the Mobile Agreement for convenience until September 1, 2015, and after such date with either sufficient advance notice or by paying a stated termination fee.
On May 6, 2015, the Company entered into a second amendment and joinder to the Mobile Agreement (the “Second Amendment”). Pursuant to the Second Amendment, Beanstock would pay in full (i) the invoice dated March 31, 2015, under the Mobile Agreement (a portion of which remained overdue) on or before June 30, 2015 and (ii) all other amounts under the Mobile Agreement and the Web Agreement as they became due. In addition, Adaptive Medias, Inc. (“Adaptive”) joined as a party to the Mobile Agreement to guarantee Beanstock’s payment obligations under both the Mobile Agreement and the Web Agreement. If Beanstock failed to pay any amounts due under either the Mobile Agreement or the Web Agreement, Adaptive would immediately, upon demand, pay all such owed amounts in full.
On June 2, 2015, the Company terminated the Mobile Agreement as a result of non-payment by Beanstock of amounts owed, and resumed managing its mobile advertising inventory in-house. In the third quarter of 2015, the Company determined that the $4.4 million receivable in connection with the Mobile Agreement was deemed uncollectible and as a result the Company incurred a bad debt expense of the entire amount. For the years ended December 31, 2017 and 2016, the Company did not recognize any revenue related to the Mobile Agreement.
In 2015, the accounts receivable balance written-off under both agreements was $5.7 million. In addition, Beanstock owes the Company $4.0 million under the Mobile Agreement of liquidated damages that have not been recorded in the financial statements and are not included in the $5.7 million bad debt write-off.
Pinsight Media
On October 31, 2013, the Company entered into an Advertising Agreement with Pinsight Media+, Inc. (“Pinsight”) (as amended, the “Pinsight Agreement”). The Pinsight Agreement was effective from October 31, 2013 through December 31, 2014, with a post-termination transition period that ended on March 1, 2015.
Pursuant to the Pinsight Agreement, Pinsight had the right and obligation to fill all of the Company’s advertising inventory on the App. The Pinsight Agreement did not apply to other mobile apps or virtual currency features on the App, including without limitation offer wall features and the Company’s Social Theater business.
Pinsight was obligated to pay for all ad requests that the Company delivered, whether or not Pinsight fills them. Pinsight paid specified CPM rates depending on the type of ad. The stated CPM rates for certain ads were subject to renegotiation under certain conditions; in such case, if the parties did not agree on a modified rate, then such ads would be excluded from the Agreement.
Pinsight assumed all risk with regards to collection of all applicable advertiser fees with respect to all advertising inventory and was not permitted to delay payment to the Company as a result of non-collection or delay of payment by the advertisers.
Pinsight was obligated to comply with the Company’s advertising editorial guidelines as in effect from time to time.
56
For the year ended December 31, 2015, the Company recognized $5.1 million in revenue under the terms of the Pinsight Agreement. For the years ended December 31, 2017 and 2016, the Company did not recognize any revenue related to the Pinsight Agreement.
Cash and Cash Equivalents
The Company considers all highly liquid instruments purchased with an original maturity of three months or less to be cash and cash equivalents. The Company continually monitors its positions with, and the credit quality of, the financial institutions with which it invests.
Restricted Cash
Restricted cash consists primarily of a certificates of deposit that are required as security for a letter of credit in connection with two of our facilities in California. The amount available under the letter of credit was $0.9 million and $0.4 million at December 31, 2017 and 2016, respectively.
Accounts Receivable and Allowance for Doubtful Accounts
The Company extends credit on a non-collateralized basis to both U.S. and international customers. The Company extends credit to customers in the normal course of business and maintains an allowance for doubtful accounts resulting from the inability or unwillingness of customers to make required payments. Management determines the allowance for doubtful accounts by evaluating individual customer receivables and considering a customer’s financial condition, credit history, and current economic conditions. The Company prepares an analysis of its ability to collect outstanding receivables that provides a basis for an allowance estimate for doubtful accounts.
Based on this evaluation, the Company maintains an allowance for potential credit losses and for potential discounts based on historical experience and other information available to management. Discounts historically represent less than 1% of the related revenues. The fees associated with display advertising are often based on “impressions,” which are created when the ad is viewed. The amount of impressions often differs between non-standardized tracking systems, resulting in discounts on some payments. Difference between ad serving platforms with respect to impressions is primarily due to lag time between serving of advertising and other technical differences.
Balance at Beginning of Period | Additions, Costs and Expenses | Deductions, Write-Offs | Balance at End of the Period | ||||||||||||
Allowance for Doubtful Accounts: | |||||||||||||||
Year Ended December 31, 2017 | $ | 283,000 | $ | 304,306 | $ | 59,348 | $ | 527,958 | |||||||
Year Ended December 31, 2016 | $ | 133,000 | $ | 152,587 | $ | 2,587 | $ | 283,000 | |||||||
Year Ended December 31, 2015 | $ | 586,000 | $ | 181,398 | $ | 634,398 | $ | 133,000 | |||||||
Business Acquisitions
The Company accounts for all business acquisitions at fair value and expenses acquisition costs as they are incurred. Any identifiable assets acquired and liabilities assumed are recognized and measured at their respective fair values on the acquisition date. If information about facts and circumstances existing as of the acquisition date is incomplete at the end of the reporting period in which a business acquisition occurs, the Company will report provisional amounts for the items for which the accounting is incomplete. The measurement period ends once the Company receives sufficient information to finalize the fair values; however, the period will not exceed one year from the acquisition date.
In connection with certain acquisitions, the Company enters into agreements to pay additional amounts in cash on the achievement of certain performance measures for up to 1 year ending after the acquisition date. The Company measures this contingent consideration at fair value at the acquisition date and records such contingent consideration as a liability or equity on the Company’s Consolidated Balance Sheets on the acquisition date. The fair value of each contingent consideration liability is remeasured at each reporting period with any change in fair value recognized as income or expense within operations in the Company’s consolidated statements of operations and comprehensive income (loss). See Note 2— Acquisitions for more information on the Company’s business acquisitions.
57
Goodwill
Goodwill reflects the cost of an acquisition in excess of the fair values assigned to identifiable the net assets acquired. Goodwill is not amortized; rather, it is subject to a periodic assessment for impairment by applying a fair value based test. The Company performs its annual impairment test in conjunction with preparing its fourth quarter financial results immediately following the end of the calendar year, or more frequently if events or changes in circumstances indicate that the asset might be impaired. Goodwill is tested for impairment at a level of reporting referred to as a reporting unit. The Company has determined that there are two reporting units, The Meet Group US and Lovoo.
Accounting for acquisitions requires the Company to recognize, separately from goodwill, the assets acquired and the liabilities assumed at their acquisition-date fair values. Goodwill as of the acquisition date is measured as the excess of consideration transferred and the net of the acquisition-date fair values of the assets acquired and the liabilities assumed. While the Company uses its best estimates and assumptions to accurately value assets acquired and liabilities assumed at the acquisition date, the estimates are inherently uncertain and subject to refinement.
The impairment model permits, and the Company utilizes, a simplified approach for determining goodwill impairment. In the first step, the Company evaluates the recoverability of goodwill by estimating the fair value of the Company’s reporting unit using multiple techniques, including an income approach using a discounted cash flow model and a market approach. Based on an equal weighting of the results of these two approaches, a conclusion of fair value is estimated. The fair value is then compared to the carrying value of the Company’s reporting unit. If the fair value of a reporting unit is less than its carrying value, the Company recognizes this amount as an impairment loss. Impairment losses, limited to the carrying value of goodwill, represent the excess of the carrying amount of goodwill over its implied fair value. See “New Accounting Pronouncements,” below for further details on the early adoption of ASU 2017-04.
In the fourth quarter of 2017, through the Company's annual testing of goodwill, the Company determined that a $56.4 million one-time, non-cash impairment was required for our U.S. reporting unit, due predominantly to the market-driven impacts on advertising revenue resulting from lower CPMs which negatively affected the Company's results and outlook. We believe this non-cash impairment charge does not impact the Company's ability to generate cash flow in the future; it is not tax deductible.
Intangible Assets
Intangible assets consist of acquired trademarks, domain names, advertising customer relationships and mobile applications and are initially recorded at fair value. Amortization is recorded using an accelerated method based on projected revenues related to each assets over the respective estimated useful lives.
Years | |||||
Trademarks | 5 | to | 10 | ||
Domain names | 5 | to | 10 | ||
Mobile applications, purchased and internally developed | 1 | to | 5 | ||
Customer relationships | 1 | to | 10 | ||
Property and Equipment
Property and equipment is stated at cost less accumulated depreciation and amortization. Property and equipment acquired in business combinations is stated at fair value. The cost of improvements that extend the life of property and equipment are capitalized. All ordinary repair and maintenance costs are expensed as incurred. When capitalized assets are retired or sold, the cost and related accumulated depreciation or amortization is removed from the accounts, with any gain or loss reflected in operations. Depreciation is recorded using the straight-line method over the estimated useful lives of the assets as follows:
Years | |||||
Servers, computer equipment and software | 1 | to | 3 | ||
Office furniture and equipment | 3 | to | 5 | ||
Leasehold improvements | 1 | to | 10 | ||
Leasehold improvements are amortized using the straight-line method over the lesser of the estimated useful life of the improvement or the lease term.
58
Long-Lived Assets and Intangibles with Finite Lives
Property and equipment and amortizable intangible assets are reviewed for impairment whenever events or changes in circumstances indicate that the carrying amount may not be recoverable. If an analysis is necessitated by the occurrence of a triggering event, the Company compares the carrying amount of the asset with the estimated future undiscounted cash flows expected to result from the use of the asset. If the carrying amount of the asset exceeds the estimated expected undiscounted future cash flows, the Company measures the amount of the impairment by comparing the carrying amount of the asset with its estimated fair value. Such analyses necessarily involve significant judgments and estimations on the part of the Company. For the years ended December 31, 2017, 2016 and 2015, the Company determined that no impairment charge was necessary.
Lease Accounting
The Company accounts for operating lease transactions by recording rent expense on a straight-line basis over the expected life of the lease, commencing on the date it gains possession of leased property. The Company includes tenant improvement allowances and rent holidays received from landlords and the effect of any rent escalation clauses as adjustments to straight-line rent expense over the expected life of the lease.
Capital lease transactions are reflected as a liability at the inception of the lease based on the present value of the minimum lease payments or, if lower, the fair value of the property. Assets under capital leases are recorded in Property and Equipment, net on the consolidated balance sheets and depreciated in a manner similar to other Property and Equipment.
Fair Value Measurements
The fair values of the Company’s financial instruments reflect the amounts that would be received to sell an asset or paid to transfer a liability in an orderly transaction between market participants at the measurement date (exit price).
The carrying amounts of the Company’s financial instruments of cash, cash equivalents, restricted cash, accounts receivable, accounts payable, accrued liabilities and deferred revenue approximate fair value due to their short maturities. Certain common stock warrants were carried at fair value as disclosed in Note 3— Fair Value Measurements. The Company has evaluated the estimated fair value of financial instruments using available market information and management's estimates. The use of different market assumptions and/or estimation methodologies could have a significant effect on the estimated fair value amounts.
In addition, the Company carries its contingent consideration liabilities related to acquisitions at fair value. In accordance with the three-tier fair value hierarchy, the Company determined the fair value of its contingent consideration liabilities using the income approach with assumed discount rates and payment probabilities. The income approach uses Level 3, or unobservable inputs as defined under the accounting guidance for fair value measurements. At December 31, 2017 and 2016, the Company’s contingent consideration liability had a fair value of $5.0 million and $3.0 million, respectively. See Note 2— Acquisitions for more information regarding the Company’s contingent consideration liabilities.
As part of the Lovoo Acquisition the Company amended and restated its term loan and revolving credit facility. The Company carries a term loan facility with an outstanding balance at December 31, 2017 of $56.3 million. The outstanding balance as of December 31, 2017 approximates fair value due to the variable market interest rates and relatively short maturity associated with the Term Loan Facility. See Note 7— Long-Term Debt for more information regarding the Company’s credit facilities. In 2013, the Company issued warrants on its common stock in conjunction with a term loan. These warrants meet the definition of a derivative and are reflected as a warrant liability at fair value in the consolidated balance sheets.
Foreign Currency
The functional currency of our foreign subsidiaries is the local currency. The financial statements of these subsidiaries are translated to U.S. dollars using period-end rates of exchange for assets and liabilities and average quarterly rates of exchange for revenues and expenses. Translation gains (losses) are recorded in accumulated other comprehensive income (loss) as a component of stockholders’ equity. Net gains and losses resulting from foreign exchange transactions are included in other income (expense).
Net (Loss) Income per Share
Basic net income (loss) per share is computed by dividing net income (loss) by the weighted-average number of common shares outstanding. Diluted net income (loss) per share is computed by dividing net income (loss) by the weighted-average number of
59
common shares and common stock equivalents outstanding, calculated on the treasury stock method for options and warrants using the average market prices during the period.
The following table shows the computation of basic and diluted net income (loss) per share for the following:
For the Year Ended December 31, | |||||||||||
2017 | 2016 | 2015 | |||||||||
Numerator: | |||||||||||
Net (loss) income | $ | (64,591,727 | ) | $ | 46,268,618 | $ | 5,969,628 | ||||
Denominator: | |||||||||||
Weighted-average shares outstanding— basic | 68,743,956 | 51,963,702 | 45,419,175 | ||||||||
Effect of dilutive securities | — | 5,781,950 | 4,116,651 | ||||||||
Weighted-average shares outstanding— diluted | 68,743,956 | 57,745,652 | 49,535,826 | ||||||||
Basic income per share | $ | (0.94 | ) | $ | 0.89 | $ | 0.13 | ||||
Diluted income per share | $ | (0.94 | ) | $ | 0.80 | $ | 0.12 | ||||
The following table summarizes the number of dilutive securities, which may dilute future earnings per share, outstanding for each of the periods presented, but not included in the calculation of diluted loss per share:
For the Year Ended December 31, | ||||||||
2017 | 2016 | 2015 | ||||||
Stock options | 5,653,141 | 2,832,961 | 8,052,962 | |||||
Unvested restricted stock awards | 3,534,558 | — | 184,954 | |||||
Warrants | — | 345,202 | 2,740,521 | |||||
Totals | 9,187,699 | 3,178,163 | 10,978,437 | |||||
Significant Customers and Concentration of Credit Risk
Financial instruments that potentially subject the Company to significant concentrations of credit risk consist primarily of cash, cash equivalents, restricted cash, and accounts receivable. The Company invests its excess cash in high-quality, liquid money market funds maintained by major U.S. banks and financial institutions. The Company has not experienced any losses on its cash equivalents.
The Company performs ongoing credit evaluations of its customers and generally does not require collateral. Except with respect to the Beanstock write-offs described above, the Company has no history of significant losses from uncollectible accounts. During the years ended December 31, 2017, 2016 and 2015, three customers, all of which were advertising aggregators, which represent thousands of advertisers, comprised approximately 46%, 50% and 41% of total revenues, respectively. Five and three customers, all of which were advertising aggregators, which represent thousands of advertisers, comprised approximately 61% and 49% of accounts receivable as of December 31, 2017 and 2016, respectively.
The Company does not expect its current or future credit risk exposure to have a significant impact on its operations. However, there can be no assurance that the Company’s business will not experience any adverse impact from credit risk in the future.
Income Taxes
The Company accounts for income taxes under the asset and liability method, which requires the recognition of deferred tax assets and liabilities for the expected future tax consequences of events that have been included in the consolidated financial statements. Under this method, deferred tax assets and liabilities are determined based on the differences between the financial statement and tax bases of assets and liabilities using enacted tax rates in effect for the year in which the differences are expected to reverse.
The Company records deferred tax assets to the extent it believes these assets will more likely than not be realized. In making such determination, the Company considers all available positive and negative evidence, including scheduled reversals of deferred tax liabilities, projected future taxable income, tax planning strategies and recent financial operations. In the event that the Company determines that it will not be able to realize its deferred income tax assets in the future in excess of its net recorded amount, the Company will make an adjustment to the valuation allowance, which will increase the provision for income taxes.
60
The Tax Cuts and Jobs Act (“Tax Act”) was enacted on December 22, 2017, most provisions of which will take effect starting in 2018. The Tax Act makes substantial changes to U.S. taxation of corporations, including, lowering the U.S. federal corporate income tax rate from 35% to 21%, and instituting a territorial tax system, along with a one-time tax on accumulated foreign earnings. The effect on deferred tax assets and liabilities of a change in law or tax rates is recognized in income in the period that includes the enactment date. The Company has adopted a policy with respect to the IRC Sec. 162(m) limiting deductions for compensation expense in excess of $1 million for certain high paid employees that it will consider stock based compensation as being earned first in determining whether any deferred tax asset will be limited.
For every tax-paying component and within each tax jurisdiction, all deferred tax liabilities and assets are offset and presented as a single net noncurrent asset or liability.
The Company’s income tax returns are periodically audited by U.S. federal, state and local, and foreign tax authorities. These audits include questions regarding the Company’s tax filing positions, including the timing and amount of deductions and the allocation of income among various tax jurisdictions. At any one time, multiple tax years are subject to audit by the various tax authorities. In evaluating the tax benefits associated with the Company’s various tax filing positions, the Company records a tax benefit for uncertain tax positions using the highest cumulative tax benefit that is more likely than not to be realized. A number of years may elapse before a particular matter, for which a liability has been established, is audited and effectively settled. The Company adjusts its liability for unrecognized tax benefits in the period in which it determines the issue is effectively settled with the tax authorities, the statute of limitations expires for the relevant taxing authority to examine the tax position or when more information becomes available.
Derivative Instruments and Hedging Activities
The Company records all derivatives on the balance sheet at fair value. The accounting for changes in the fair value of derivatives depends on the intended use of the derivative, whether the Company has elected to designate a derivative in a hedging relationship and apply hedge accounting and whether the hedging relationship has satisfied the criteria necessary to apply hedge accounting. Derivatives designated and qualifying as a hedge of the exposure to changes in the fair value of an asset, liability, or firm commitment attributable to a particular risk, such as interest rate risk, are considered fair value hedges. Derivatives designated and qualifying as a hedge of the exposure to variability in expected future cash flows, or other types of forecasted transactions, are considered cash flow hedges. Derivatives may also be designated as hedges of the foreign currency exposure of a net investment in a foreign operation. Hedge accounting generally provides for the matching of the timing of gain or loss recognition on the hedging instrument with the recognition of the changes in the fair value of the hedged asset or liability that are attributable to the hedged risk in a fair value hedge or the earnings effect of the hedged forecasted transactions in a cash flow hedge. The Company may enter into derivative contracts that are intended to economically hedge certain of its risk, even though hedge accounting does not apply or the Company elects not to apply hedge accounting.
In accordance with the FASB’s fair value measurement guidance (ASU 2011-04), the Company is measuring the credit risk of its derivative financial instruments that are subject to master netting agreements on a net basis by counterparty portfolio.
In 2013, the Company issued warrants on its own common stock in conjunction with the term loan discussed in Note 7— Long-Term Debt. These warrants meet the definition of a derivative and are reflected as a warrant liability at fair value in the consolidated balance sheets. In 2017, the Company entered into an interest rate swap, interest rate cap and a cross-currency interest rate swap. See Note 13— Derivatives and Hedging Activities for further details.
Product Development and Content Costs
Product development and content costs, including costs incurred in the classification and organization of listings within our websites, salaries, benefits, and stock-based compensation, utility charges, occupancy and support for our offsite technology infrastructure, bandwidth and content delivery fees, broadcaster rewards, app store fees, and development and maintenance costs, are charged to expense as incurred.
Stock-Based Compensation
The fair value of share-based payments is estimated on the grant date using the Black-Scholes option pricing model, based on weighted average assumptions. Expected volatility is based on historical volatility of our common stock. The Company has elected to use the simplified method described in the Securities and Exchange Commission Staff Accounting Bulletin Topic 14C to estimate the expected term of employee stock options. The risk-free rate is based on the U.S. Treasury yield curve in effect at the time of grant. Compensation expense is recognized on a straight-line basis over the requisite service period of the award.
61
Comprehensive (Loss) Income
Comprehensive (loss) income includes all changes in stockholders’ equity during a period from non-owner sources. Comprehensive income (loss) consists of foreign currency translation adjustments which are added to net (loss) income to compute total comprehensive (loss) income.
Contingencies
The Company accrues for contingent obligations, including legal costs and restructuring costs, when the obligation is probable and the amount can be reasonably estimated. As facts concerning contingencies become known the Company reassess their position and make appropriate adjustments to the consolidated financial statements. Estimates that are particularly sensitive to future changes include those related to tax, legal, and other regulatory matters that are subject to change as events evolve and additional information becomes available.
Segment Reporting
Operating segments are identified as components of an enterprise about which separate discrete financial information is available for evaluation by the chief operating decision maker, or decision-making group, in making decisions on how to allocate resources and assess performance. The Company's chief operating decision maker is the chief executive officer. The Company and the chief executive officer view the Company's operations and manage its business as one reportable segment with two operating segments, The Meet Group US and Lovoo.
Recently Issued Accounting Standards
In May 2014, the Financial Accounting Standards Board (“FASB”) issued Accounting Standards Update (“ASU”) 2014-09, Revenue from Contracts with Customers. ASU 2014-09 supersedes the revenue recognition requirements of FASB ASC Topic 605, Revenue Recognition and most industry-specific guidance throughout the ASC, resulting in the creation of FASB ASC Topic 606, Revenue from Contracts with Customers. ASU 2014-09 requires entities to recognize revenue in a way that depicts the transfer of promised goods or services to customers in an amount that reflects the consideration to which the entity expects to be entitled in exchange for those goods or services. Several amendments were issued subsequent to ASU 2014-09 to provide additional clarification and implementation instructions relating to (i) principal versus agent considerations, (ii) identifying performance obligations and licensing, (iii) narrow-scope improvements and practical expedients and (iv) technical corrections and improvements. However, none of the amendments change the core principle of the guidance in ASU 2014-09.
In August 2015, the FASB issued ASU 2015-14, Revenue from Contracts with Customers, Deferral of the Effective Date. ASU 2015-14 defers the effective date of ASU 2014-09 to annual reporting periods beginning after December 15, 2017 and interim periods within those reporting periods beginning after that date. ASU 2014-09 provides two methods of adoption: a full retrospective method or modified retrospective method (cumulative effect).
As part of its implementation plan executed by a working group, the Company developed a project plan and controls that allowed the Company to properly and timely adopt the new revenue recognition standard on its effective date. The phased implementation project plan included an assessment of the Company’s revenue streams and contracts disaggregated into categories in accordance with Topic 606. The Company also monitored modifications, clarifications and interpretations issued by the FASB during its implementation phase.
Significant assessment and implementation matters were addressed prior to adopting ASU 2014-09 including reviews of customer contracts and related policies and procedures, determining the impact of the new accounting standard on the Company’s financial statements and related disclosures, and updating, throughout the implementation efforts, the Company’s business policies, processes, and controls required to comply with ASU 2014-09 upon its effective date of January 1, 2018. The assessment and implementation procedures performed through December 31, 2017 include if(we) and Lovoo from the dates of acquisition of April 3, 2017 and October 19, 2017, respectively.
In adopting ASU 2014-09, the Company considered and determined the following:
• | Arrangements with Multiple Performance Obligations - ASU 2014-09 states that the transaction price for contracts with more than one performance obligation should be allocated to each performance obligation. The Company provides the service of publishing advertisements for its customers and evaluated these arrangements for multiple performance obligations. The advertisement publishing services are the same and transferred in the same pattern over a period of time. Therefore, the Company determined that these are a series of distinct performance obligations, which will be treated as one |
62
performance obligation. The Company expects to continue to account for these performance obligations on a monthly basis, as the customer simultaneously consumes and benefits from the service over time as it is provided.
• | Principal vs Agent Relationships - ASU 2014-09 modified some of the existing principal and agent considerations. The Company’s Social Theater contracts utilize third parties to publish customized advertisements for customers. The Company’s third-party arrangements are expected to remain unchanged where the Company will act as principal in these arrangements and gross revenue recognition will remain consistent with current policies. |
• | Contract Costs - The Company assessed the impact of ASU 2014-09 on the costs to acquire and fulfill its customer contracts, including whether the Company can apply the practical expedient of expensing contract costs to acquire when incurred if the amortization period of the asset that would have been recognized is one year or less. The Company’s existing accounting policy is to expense as incurred any costs to acquire contracts. Due to the amortization period of less than one year for the Company’s contracts, under ASU 2014-09, the Company has elected to continue to expense as incurred any costs to acquire contracts. |
• | Breakage - ASU 2014-09 guidance on breakage requires that an entity establish a liability for the full amount of the prepayment and recognize breakage on that liability into revenue proportionate to the pattern of rights exercised by the customer. The Company currently recognizes breakage in revenue as Credits, Points and Icebreakers are redeemed on a pro rata basis over a three or six month period (life of the user) beginning at the date of the sale. The Company has concluded that this treatment is consistent with the new guidance. |
The Company has finalized its assessment of ASU 2014-09 and adopted the standard using the modified retrospective method effective January 1, 2018. The Company concluded that the adoption will have an impact on the timing of its revenue recognition for subscription revenue. The cumulative effect of approximately $0.02 million from this change will be recorded to retained earnings as of January 1, 2018. Additionally, the adoption of ASU 2014-09 will have an impact on its financial reporting disclosures and internal controls over financial reporting (“ICFR”). The standard increased disclosure requirements to enhance the Company’s financial statements which will enable users to better understand the nature, amount, timing and uncertainty of revenues and cash flows arising from contracts with customers, including significant judgments and changes in judgments.
In February 2016, the FASB issued ASU No. 2016-2, Leases (Topic 842). The new standard establishes a right-of-use (ROU) model that requires a lessee to record an ROU asset and a lease liability on the balance sheet for all leases with terms longer than 12 months. Leases will be classified as either finance or operating, with classification affecting the pattern of expense recognition in the income statement. ASU 2016-2 is effective for annual periods beginning after December 15, 2018, and annual and interim periods thereafter, with early adoption permitted. A modified retrospective transition approach is required for lessees for capital and operating leases existing at, or entered into after, the beginning of the earliest comparative period presented in the financial statements, with certain practical expedients available. The Company is currently evaluating the impact that the adoption of this new standard will have on its consolidated financial statements.
In August 2016, the FASB issued ASU No. 2016-15, Statement of Cash Flows (Topic 230): Classification of Certain Cash Receipts and Cash Payments, providing additional guidance on several cash flow classification issues, with the goal of the update to reduce the current and potential future diversity in practice. The amendments in this update are effective for fiscal years beginning after December 15, 2017, and interim periods within those fiscal years. The Company is currently evaluating the impact that the adoption of this new standard will have on its consolidated financial statements.
In January 2017, the FASB issued ASU No. 2017-04, Intangibles - Goodwill and Other (Topic 350): Simplifying the Accounting for Goodwill Impairment. In October 2017, the Company early adopted ASU 2017-04 which simplifies how an entity is required to test goodwill for impairment by eliminating Step 2 from the goodwill impairment test. Step 2 measures a goodwill impairment loss by comparing the implied fair value of a reporting unit’s goodwill with the carrying amount of that goodwill, which is currently required if a reporting unit with goodwill fails a Step 1 test comparing the fair value of the reporting unit to its carrying value including goodwill. Under this new guidance, an entity should perform its annual, or interim, goodwill impairment test using just the Step 1 test of comparing the fair value of a reporting unit with its carrying amount. Any goodwill impairment, representing the amount by which the carrying amount exceeds the reporting unit’s fair value, is determined using this Step 1 test. Any goodwill impairment loss recognized would not exceed the total carrying amount of goodwill allocated to that reporting unit.
In May 2017, the FASB issued ASU No. 2017-09, Compensation - Stock Compensation (Topic 718) Scope of Modification Accounting, which provides guidance about which changes to the terms or conditions of a share-based payment award require an entity to apply modification accounting. ASU 2017-09 will be effective in fiscal years beginning after December 15, 2017, including interim periods within those fiscal years, and early adoption is permitted. The adoption of this standard is not expected to have a material impact on the Company’s consolidated financial statements.
63
In August 2017, the FASB issued ASU 2017-12, Derivatives and Hedging: Targeted Improvements to Accounting for Hedging Activities. The purpose of this updated guidance is to better align a company’s financial reporting for hedging activities with the economic objectives of those activities. The transition guidance provides companies with the option of early adopting the new standard using a modified retrospective transition method in any interim period after issuance of the Update, or alternatively requires adoption for fiscal years beginning on or after January 1, 2019. This adoption method will require the Company to recognize the cumulative effect of initially applying the ASU as an adjustment to accumulated other comprehensive income with a corresponding adjustment to the opening balance of retained earnings as of the most recent period presented in its financial statements. As allowed in the transition guidance, the Company has elected to adopt the standard on November 1, 2017 for its fiscal year beginning January 1, 2017 in connection with the accounting of the Company's derivative and hedging instruments. See Note 13— Derivatives and Hedging Activities for further details.
In February 2018, the FASB issued ASU 2018-02, Reclassification of Certain Tax Effects from Accumulated Other Comprehensive Income. The amendment allows an entity to elect to reclassify the stranded tax effects resulting from the change in income tax rate from the Tax Cuts and Jobs Act (“Tax Act”) from accumulated other comprehensive income to retained earnings. The amendments in this update are effective for periods beginning after December 15, 2018. Early adoption is permitted. The Company is currently evaluating the impact that the adoption of this new standard will have on its consolidated financial statements.
Note 2— Acquisitions
Lovoo
On September 18, 2017, the Company, TMG Holding Germany GmbH, a limited liability company organized under the laws of Germany and a wholly-owned subsidiary of the Company, entered into a Share Purchase Agreement (the “Purchase Agreement”) with Bawogo Ventures GmbH & Co. KG, a limited partnership organized under the laws of Germany and the seller guarantors, to purchase all of the outstanding shares of Lovoo, a limited liability company incorporated under the laws of Germany (the “Lovoo Acquisition”), for total consideration of $86.1 million including working capital. The Lovoo Acquisition closed on October 19, 2017. The Company does not expect goodwill to be deductible for tax purposes.
Included in the total consideration of $86.1 million is a $5.0 million contingent consideration in the form of an earn-out which is subject to certain conditions set forth in the Purchase Agreement, including the successful achievement of an Adjusted EBITDA target by Lovoo for the year ended December 31, 2017. The payment of the contingent consideration is due in the first half of 2018. Based on the probability of achieving the financial targets, the Company has determined that the fair value of the contingent consideration at the closing date and December 31, 2017 is $5.0 million. At the closing of the Lovoo Acquisition, the Company granted restricted stock awards representing an aggregate of 531,500 shares of common stock to 96 former Lovoo employees as an inducement material to becoming non-executive employees of the Company.
The Company funded the Lovoo Acquisition from cash on hand and from a $60.0 million term credit facility from several banks and other financial institutions party thereto and JP Morgan Chase Bank, N.A., as administrative agent. See Note 7— Long-Term Debt for more information regarding the Company’s credit facilities.
The acquisition-date fair value of the consideration transferred is as follows:
At October 19, 2017 | |||
Cash consideration (1) | $ | 65,000,000 | |
Contingent consideration | 5,000,000 | ||
Net working capital adjustment | 16,148,750 | ||
Total consideration | $ | 86,148,750 | |
(1) Cash consideration includes a $6.5 million and a $4.0 million escrow payment to be paid out 24 months and 36 months, respectively, from the date of the transaction.
64
The following is a purchase price allocation as of the October 19, 2017 acquisition date:
At October 19, 2017 | |||
Cash and cash equivalents | $ | 20,717,202 | |
Accounts receivable | 3,677,708 | ||
Prepaid expenses and other current assets | 843,930 | ||
Property and equipment | 1,014,716 | ||
Intangible assets | 16,970,000 | ||
Accounts payable | (1,100,837 | ) | |
Accrued expenses and other current liabilities | (4,652,757 | ) | |
Deferred revenue | (1,594,641 | ) | |
Deferred tax liability | (3,862,337 | ) | |
Capital leases | (542,112 | ) | |
Net assets acquired | $ | 31,470,872 | |
Goodwill | 54,677,878 | ||
Total consideration | $ | 86,148,750 | |
The fair values of the Lovoo trademarks were determined using an income approach, the fair value of software acquired, which represents the primary platform on which the Lovoo apps operate, was determined using a cost approach and the fair value of customer relationships was determined using an excess earnings approach. These values are subject to change based on the final assessment of the deferred taxes acquired. The amounts assigned to the identifiable intangible assets are as follows:
Fair Value | Weighted Average Amortization Period (Years) | ||||
Trademark | $ | 12,090,000 | 10.0 | ||
Software | 1,335,000 | 2.0 | |||
Customer relationships | 3,545,000 | 8.7 | |||
Total identifiable intangible assets | $ | 16,970,000 | 9.1 | ||
The operating results of Lovoo for the period from October 19, 2017 to December 31, 2017, including revenues of $8.0 million and net loss of $0.5 million, have been included in the Company’s consolidated statements of operations and comprehensive (loss) income for the year ended December 31, 2017. The Company incurred a total of $1.4 million in transaction costs in connection with the Lovoo Acquisition, which were included in acquisition and restructuring costs within the consolidated statement of operations and comprehensive (loss) income for the year ended December 31, 2017.
if(we)
On March 3, 2017, the Company, and its wholly-owned subsidiary, Two Sub One, Inc., a Delaware corporation, entered into a definitive agreement and plan of merger with if(we), a Delaware corporation and leading global mobile network for meeting new people, pursuant to which the Company agreed to acquire 100% of the outstanding shares of capital stock of if(we) for total consideration of $74.5 million in cash, subject to closing adjustments (the “if(we) Acquisition”). The if(we) Acquisition closed on April 3, 2017. The Company does not expect goodwill to be deductible for tax purposes.
The Company funded the if(we) Acquisition from cash on hand, and from a $15.0 million term credit facility from J.P. Morgan Chase Bank, N.A., pursuant to a Credit Agreement entered into on March 3, 2017. See Note 7— Long-Term Debt for further details.
At the closing of the if(we) Acquisition, the Company granted options to purchase an aggregate of up to 75,000 shares of its common stock and restricted stock awards representing an aggregate of 717,500 shares of common stock to 83 former if(we) employees as an inducement material to becoming non-executive employees of the Company.
65
The acquisition-date fair value of the consideration transferred is as follows:
At April 3, 2017 | |||
Cash consideration (1) | $ | 60,000,000 | |
Net working capital adjustment | 14,467,379 | ||
Total consideration | $ | 74,467,379 | |
(1) Cash consideration includes a $6.0 million escrow payment to be paid out 12 months from the date of the transaction.
The following is the purchase price allocation as of the April 3, 2017 acquisition date:
At April 3, 2017 | |||
Cash and cash equivalents | $ | 8,164,587 | |
Accounts receivable | 2,961,593 | ||
Prepaid expenses and other current assets | 5,588,308 | ||
Restricted cash | 500,000 | ||
Property and equipment | 1,476,010 | ||
Other assets | 394,037 | ||
Intangible assets | 23,830,000 | ||
Accounts payable | (1,632,306 | ) | |
Accrued expenses and other current liabilities | (783,096 | ) | |
Deferred revenue | (809,244 | ) | |
Deferred tax liability | (2,711,883 | ) | |
Net assets acquired | $ | 36,978,006 | |
Goodwill | 37,489,373 | ||
Total consideration | $ | 74,467,379 | |
The fair values of the if(we) trademarks were determined using an income approach, the fair value of software acquired, which represents the primary platform on which the if(we) apps operate, was determined using a cost approach and the fair value of customer relationships was determined using an excess earnings approach. The amounts assigned to the identifiable intangible assets are as follows:
Fair Value | Weighted Average Amortization Period (Years) | ||||
Trademark | $ | 9,895,000 | 10.0 | ||
Software | 13,205,000 | 5.0 | |||
Customer relationships | 730,000 | 9.8 | |||
Total identifiable intangible assets | $ | 23,830,000 | 7.2 | ||
The operating results of if(we) for the period from April 3, 2017 to December 31, 2017, including revenues of $36.9 million and net income of $3.5 million, have been included in the Company’s consolidated statements of operations and comprehensive (loss) income for the year ended December 31, 2017. The Company incurred a total of $1.7 million in transaction costs in connection with the if(we) Acquisition, which were included in acquisition and restructuring costs within the consolidated statement of operations and comprehensive (loss) income for the year ended December 31, 2017.
66
Skout
On June 27, 2016, The Meet Group, and its wholly-owned subsidiaries, MeetMe Sub I, Inc., a Delaware corporation, and MeetMe Sub II, LLC, a Delaware limited liability corporation, (together, “The Meet Group”) entered into a merger agreement with Skout, a California corporation, pursuant to which The Meet Group agreed to acquire 100% of the issued and outstanding shares of common stock of Skout for estimated cash consideration of $30.3 million, net of cash acquired of $2.9 million, 5,222,017 shares of The Meet Group common stock, and $3.0 million in contingent consideration liability (the “Skout Acquisition”). The Skout Acquisition closed October 3, 2016. Goodwill is not deductible for tax purposes.
The following is a summary of the consideration transferred:
At October 3, 2016 | |||
Cash consideration(1) | $ | 33,155,532 | |
Equity consideration | 32,376,505 | ||
Contingent consideration | 3,000,000 | ||
Total consideration | $ | 68,532,037 | |
(1) Cash consideration includes a $2.9 million escrow payment to be paid out 18 months from the date of the transaction.
The following is a purchase price allocation as of the October 3, 2016 acquisition date:
At October 3, 2016 | |||
Cash and cash equivalents | $ | 2,851,338 | |
Accounts receivable | 4,146,927 | ||
Prepaid expenses and other current assets | 280,379 | ||
Restricted cash | 393,261 | ||
Property and equipment | 396,998 | ||
Deferred tax asset | 157,111 | ||
Intangible assets | 18,230,000 | ||
Accounts payable | (1,055,802 | ) | |
Accrued expenses and other current liabilities | (208,628 | ) | |
Deferred revenue | (189,066 | ) | |
Net assets acquired | $ | 25,002,518 | |
Goodwill | 43,529,519 | ||
Total consideration | $ | 68,532,037 | |
The fair value of the Skout trademark was determined using an income approach, the fair value of software acquired, which represents the primary platform on which the Skout apps operate, was determined using a cost approach and the preliminary fair value of customer relationships was determined using an excess earnings approach. The amounts assigned to the identifiable intangible assets are as follows:
Fair Value | Weighted Average Amortization Period (Years) | ||||
Skout trademark | $ | 7,155,000 | 10.0 | ||
Software | 2,500,000 | 1.0 | |||
Customer relationships | 8,575,000 | 10.0 | |||
Total identifiable intangible assets | $ | 18,230,000 | 8.8 | ||
The acquisition of Skout calls for contingent consideration of up to $1.5 million for each founder, $3.0 million in total, based on the Company achieving certain financial targets. The Company paid $2.9 million to former founders of Skout in the fourth quarter of 2017 as final settlement of the contingent consideration.
The operating results of Skout for the period from October 3, 2016 to December 31, 2016, including revenues of $7.2 million and net income of $0.8 million, have been included in the Company’s consolidated statements of operations and comprehensive income
67
(loss) for the year ended December 31, 2016. The Company incurred a total of $2.5 million in transaction costs in connection with the acquisition, which were included in acquisition and restructuring costs within the consolidated statement of operations and comprehensive income (loss) for the year ended December 31, 2016.
Pro Forma Impact
The following unaudited pro forma condensed consolidated financial information has been prepared to illustrate the effects of the acquisition of Skout, if(we) and Lovoo as if all the acquisitions occurred on January 1, 2015. The historical consolidated financial information has been adjusted in the unaudited pro forma condensed combined financial statements to give effect to pro forma events that are directly attributable to the acquisition, factually supportable and, with respect to the statements of operations, expected to have a continuing impact on the results of operations.
The unaudited pro forma condensed consolidated statements of operations do not reflect future events that may occur after the completion of the acquisitions, including, but not limited to, the anticipated realization of ongoing savings from operating synergies and certain one-time charges the Company expects to incur in connection with the acquisition, including, but not limited to, costs in connection with integrating the operations of Skout, if(we) and Lovoo.
These unaudited pro forma condensed consolidated financial statements are for informational purposes only. They do not purport to indicate the results that would actually have been obtained had the acquisition been completed on the January 1, 2015 or which may be realized in the future. There can be no assurance that such finalization will not result in material changes from the preliminary accounting for the Skout, if(we) and Lovoo Acquisition included in the below pro forma condensed consolidated financial information.
Year Ended December 31, | |||||||||||
2017 | 2016 | 2015 | |||||||||
Revenues | $ | 162,803,658 | $ | 173,497,011 | $ | 165,244,333 | |||||
Net (loss) income | $ | (62,391,775 | ) | $ | 48,153,650 | $ | (3,296,998 | ) | |||
Basic (loss) earnings per share | $ | (0.91 | ) | $ | 0.93 | $ | (0.07 | ) | |||
Diluted (loss) earnings per share | $ | (0.91 | ) | $ | 0.83 | $ | (0.07 | ) | |||
Note 3— Fair Value Measurements
Accounting Standards Codification Topic 820, Fair Value Measurement (“ASC 820”), establishes a fair value hierarchy for instruments measured at fair value that distinguishes between assumptions based on market data (observable inputs) and the Company's own assumptions (unobservable inputs). Observable inputs are inputs that market participants would use in pricing the asset or liability based on market data obtained from sources independent of the Company. Unobservable inputs are inputs that reflect the Company's assumptions about the inputs that market participants would use in pricing the asset or liability, and are developed based on the best information available in the circumstances.
ASC 820 identifies fair value as the exchange price, or exit price, representing the amount that would be received to sell an asset or paid to transfer a liability in an orderly transaction between market participants. As a basis for considering market participant assumptions in fair value measurements, ASC 820 establishes a three-tier fair value hierarchy that distinguishes among the following:
Level 1—Valuations based on unadjusted quoted prices in active markets for identical assets or liabilities that the Company has the ability to access.
Level 2—Valuations based on quoted prices for similar assets or liabilities in active markets, quoted prices for identical or similar assets or liabilities in markets that are not active and models for which all significant inputs are observable, either directly or indirectly.
Level 3—Valuations based on inputs that are unobservable and significant to the overall fair value measurement.
To the extent that the valuation is based on models or inputs that are less observable or unobservable in the market, the determination of fair value requires more judgment. Accordingly, the degree of judgment exercised by the Company in determining fair value is greatest for instruments categorized in Level 3. A financial instrument's level within the fair value hierarchy is based on the lowest level of any input that is significant to the fair value measurement.
68
Derivative financial instruments
Currently, the Company uses interest rate swaps, cross currency swap and interest rate caps to manage its interest rate risk. The valuation of these instruments is determined using widely accepted valuation techniques, including discounted cash flow analysis on the expected cash flows of each derivative. This analysis reflects the contractual terms of the derivatives, including the period to maturity, and uses observable market-based inputs, including interest rate curves and implied volatilities. The fair values of interest rate swaps and the cross currency swap are determined using the market standard methodology of netting the discounted future fixed cash receipts (or payments) and the discounted expected variable cash payments (or receipts). The variable cash payments (or receipts) are based on an expectation of future interest rates (forward curves) derived from observable market interest rate curves.
The fair values of interest rate caps are determined using the market standard methodology of discounting the future expected cash receipts that would occur if variable interest rates rise above the strike rate of the caps. The variable interest rates used in the calculation of projected receipts on the cap are based on an expectation of future interest rates derived from observable market interest rate curves and volatilities.
To comply with the provisions of ASC 820, the Company incorporates credit valuation adjustments to appropriately reflect both its nonperformance risk and the respective counterparty’s nonperformance risk in the fair value measurements. In adjusting the fair value of the Company's derivative contracts for the effect of nonperformance risk, the Company has considered the impact of netting and any applicable credit enhancements, such as collateral postings, thresholds, mutual puts and guarantees. In accordance with the FASB’s fair value measurement guidance in (ASU 2011-04), the Company made an accounting policy election to measure the credit risk of its derivative financial instruments that are subject to master netting agreements on a net basis by counterparty portfolio.
Although the Company has determined that the majority of the inputs used to value its derivatives fall within Level 2 of the fair value hierarchy, the credit valuation adjustments associated with its derivatives utilize Level 3 inputs, such as estimates of current credit spreads to evaluate the likelihood of default by the Company and its counterparties. The Company has determined that the significance of the impact of the credit valuation adjustments made to its derivative contracts, which determination was based on the fair value of each individual contract, was not significant to the overall valuation. As a result, all of the Company's derivatives held as of December 31, 2017 and 2016 were classified as Level 2 of the fair value hierarchy. See Note 13— Derivatives and Hedging Activities for further discussion on derivative financial instruments.
69
Recurring Fair Value Measurements
Items measured at fair value on a recurring basis include money market mutual funds, restricted cash, derivatives and hedging instruments and contingent consideration. During the periods presented, the Company has not changed the manner in which it values assets and liabilities that are measured at fair value using Level 3 inputs. The following fair value hierarchy table presents information about each major category of the Company's financial assets and liabilities measured at fair value on a recurring basis:
Quoted Prices in Active Markets for Identical Items (Level 1) | Significant Other Observable Inputs (Level 2) | Significant Unobservable Inputs (Level 3) | Total | ||||||||||||
December 31, 2017 | |||||||||||||||
Assets | |||||||||||||||
Money market | $ | 1,390,714 | $ | — | $ | — | $ | 1,390,714 | |||||||
Restricted cash | 894,551 | — | — | 894,551 | |||||||||||
Derivative asset | — | 739,606 | — | 739,606 | |||||||||||
Total assets | $ | 2,285,265 | $ | 739,606 | $ | — | $ | 3,024,871 | |||||||
Liabilities | |||||||||||||||
Contingent consideration | $ | — | $ | — | $ | 5,000,000 | $ | 5,000,000 | |||||||
Derivative liability | — | 3,067,572 | — | 3,067,572 | |||||||||||
Total liabilities | $ | — | $ | 3,067,572 | $ | 5,000,000 | $ | 8,067,572 | |||||||
December 31, 2016 | |||||||||||||||
Assets | |||||||||||||||
Money market | $ | 7,586,810 | $ | — | $ | — | $ | 7,586,810 | |||||||
Restricted cash | 393,484 | — | — | 393,484 | |||||||||||
Total assets | $ | 7,980,294 | $ | — | $ | — | $ | 7,980,294 | |||||||
Liabilities | |||||||||||||||
Contingent consideration | $ | — | $ | — | $ | 3,000,000 | $ | 3,000,000 | |||||||
Total liabilities | $ | — | $ | — | $ | 3,000,000 | $ | 3,000,000 | |||||||
For non-recurring fair value measurements, see Note 4— Goodwill.
The following table sets forth a summary of changes in the fair value of the Company's Common Stock warrant liability and contingent consideration, which represent recurring measurements that are classified within Level 3 of the fair value hierarchy, wherein fair value is estimated using significant unobservable inputs:
Contingent Consideration | Convertible Common Stock Warrant Liability | ||||||
Balance as of December 31, 2015 | $ | — | $ | 1,035,137 | |||
Amounts acquired | 3,000,000 | — | |||||
Changes in estimated fair value | — | 864,596 | |||||
Warrant exercise | — | (1,899,733 | ) | ||||
Balance as of December 31, 2016 | $ | 3,000,000 | $ | — | |||
Amounts acquired | 5,000,000 | — | |||||
Changes in estimated fair value | (102,734 | ) | — | ||||
Payments | (2,897,266 | ) | — | ||||
Balance as of December 31, 2017 | $ | 5,000,000 | $ | — | |||
70
The Company recognizes transfers between levels of the fair value hierarchy as of the end of the reporting period. There were no transfers within the hierarchy during the years ended December 31, 2017 and 2016.
The Company determined the fair value of its contingent consideration liabilities using the income approach with assumed discount rates and payment probabilities. The income approach uses Level 3, or unobservable inputs as defined under the accounting guidance for fair value measurements. Based on the Company's projected results, the Company estimated the probability of success to be 100% for the contingent consideration related to the Lovoo Acquisition and Skout Acquisition as of December 31, 2017 and 2016, respectively.
The fair value of the warrants on the date of issuance and on each re-measurement date classified as liabilities was estimated using the Black-Scholes option pricing model. The change in the fair value of the warrant liability of each reporting period was recorded on the consolidated statements of operations and comprehensive income (loss). On June 30, 2016, Venture Lending & Leasing VI and VII provided notification of the surrender of their outstanding 341,838 liability-classified warrants, which were net settled into common shares in the third quarter of 2016. As a result of the warrant exercise, no remeasurement of the warrant liability occurred subsequent to the exercise, and no warrants were outstanding as of September 30, 2016.
Note 4— Goodwill
The Company assesses goodwill for impairment annually, or more frequently whenever events or changes in circumstances indicate that an impairment may exist. Goodwill is tested for impairment at the reporting unit level. Management believes the Company has two reporting units, The Meet Group US and Lovoo.
As of December 31, 2017, the Company completed its annual impairment test. The Company’s management considered both a market approach using comparable company method and income approach using a discounted cash flow method which it believes to be an appropriate valuation methodology.
The major assumptions in the market approach include the selected multiples applied to certain operating statistics, such as sales revenues as well as an estimated control premium. The Company’s discounted cash flow model is highly reliant on various assumptions, including estimates of future cash flows, growth rates, discount rate, and expectations about variations in the amount and timing of cash flows and the probability of achieving its estimated cash flow forecast. These assumptions are based on significant inputs not easily observable in the market and thus represent Level 3 measurements within the fair value hierarchy. A discount rate of 14.5% was used, as well as assumptions of a slight decrease in revenue of 2.8% in 2018 as compared to 2017 and subsequent increases in revenue growth of 27.4% and 20.2% in 2019 and 2020, respectively, before a terminal value was estimated. The discount rate was determined using the weighted average cost of capital for a typical market participant. The Company also notes that the conclusion of value was not overly sensitive to changes in the growth rates used in our analysis. Had the growth rates for the next 2 years been 1% lower, the aggregate valuation conclusion would have decreased by less than 2%. The Company believes the discount rate and other inputs and assumptions are reasonable and consistent with those that a market participant would use.
In the fourth quarter of 2017, through the Company's annual testing of goodwill, the Company determined that a $56.4 million one-time, non-cash impairment was required for our U.S. reporting unit, due predominantly to the market-driven impacts on advertising revenue resulting from lower cost per thousand (“CPM”) impressions which negatively affected the Company's results and outlook. This non-cash impairment charge does not impact the Company's ability to generate cash flow in the future and it is not tax deductible. As a result of this impairment charge, the fair value of goodwill for the US operations is $95.2 million. The Company classifies goodwill as a non-recurring Level 3 measurement.
71
The following table sets forth a summary of changes goodwill:
Goodwill | |||
Balance at December 31, 2015 | $ | 70,646,035 | |
Goodwill acquired from Skout Acquisition | 43,529,519 | ||
Balance at December 31, 2016 | 114,175,554 | ||
Goodwill acquired from if(we) Acquisition | 37,489,373 | ||
Goodwill acquired from Lovoo Acquisition | 54,677,878 | ||
Goodwill impairment | (56,428,861 | ) | |
Foreign currency translation adjustments | 780,191 | ||
Balance at December 31, 2017 | $ | 150,694,135 | |
Note 5— Intangible Assets
Intangible assets consist of the following:
December 31, 2017 | |||||||||||
Gross Carrying Amount | Accumulated Amortization | Net Carrying Amount | |||||||||
Trademarks and domain names | $ | 35,204,638 | $ | (8,952,725 | ) | $ | 26,251,913 | ||||
Customer relationships | 14,067,457 | (3,677,895 | ) | 10,389,562 | |||||||
Software | 18,784,755 | (6,706,802 | ) | 12,077,953 | |||||||
Total | $ | 68,056,850 | $ | (19,337,422 | ) | $ | 48,719,428 | ||||
December 31, 2016 | |||||||||||
Gross Carrying Amount | Accumulated Amortization | Net Carrying Amount | |||||||||
Trademarks and domain names | $ | 13,014,494 | $ | (6,157,445 | ) | $ | 6,857,049 | ||||
Customer relationships | 9,740,000 | (1,461,484 | ) | 8,278,516 | |||||||
Software | 4,225,000 | (2,350,000 | ) | 1,875,000 | |||||||
Total | $ | 26,979,494 | $ | (9,968,929 | ) | $ | 17,010,565 | ||||
Amortization expense was $9.4 million, $2.5 million and $1.5 million for the years ended December 31, 2017, 2016 and 2015, respectively.
Annual future amortization expense for the Company’s intangible assets is as follows:
Year ending December 31, | Amortization Expense | ||
2018 | $ | 11,556,173 | |
2019 | 9,586,767 | ||
2020 | 7,629,207 | ||
2021 | 6,608,856 | ||
2022 | 4,013,978 | ||
Thereafter | 9,324,447 | ||
Total | $ | 48,719,428 | |
72
Note 6— Property and Equipment
Property and equipment consist of the following:
December 31, 2017 | December 31, 2016 | ||||||
Servers, computer equipment and software | $ | 14,044,505 | $ | 10,273,823 | |||
Office furniture and equipment | 521,233 | 232,217 | |||||
Leasehold improvements | 663,356 | 443,123 | |||||
15,229,094 | 10,949,163 | ||||||
Less accumulated depreciation | (10,704,976 | ) | (8,483,053 | ) | |||
Property and equipment - net | $ | 4,524,118 | $ | 2,466,110 | |||
The above amounts as of December 31, 2017 and 2016 include certain leases accounted for as capital leases. The total cost, net of accumulated depreciation, of property and equipment recorded under capital leases at December 31, 2017 and 2016 was approximately $0.4 million and $0.2 million, respectively. See Note 8— Commitments and Contingencies for further details on capital leases.
Property and equipment depreciation and amortization expense was $2.2 million for the year ended December 31, 2017 and $1.6 million for the years ended December 31, 2016 and 2015, respectively.
Note 7— Long-Term Debt
Amended and Restated Credit Agreement
On September 18, 2017, in connection with the Lovoo Acquisition, as discussed in Note 2- Acquisitions, the Company entered into an Amended and Restated Credit Agreement with the several banks and other financial institutions party thereto and JPMorgan Chase Bank, N.A., as the Agent, amending and restating the Credit Agreement, dated March 3, 2017. The Amended and Restated Credit Agreement provides a New Revolving Credit Facility for $20.0 million and a New Term Loan Facility of $60.0 million. On October 18, 2017, the Company drew down $60.0 million from its New Term Loan Facility in connection with the Lovoo Acquisition. Fees and direct costs incurred for the New Credit Facilities were $0.6 million and are offset against long-term debt on the accompanying balance sheet as of December 31, 2017.
The Company will use proceeds of the New Revolving Credit Facility to finance working capital needs and for general corporate purposes. Amounts under the New Revolving Credit Facility may be borrowed, repaid and re-borrowed from time to time until the maturity date of the Credit Agreement on September 18, 2020. The New Term Loan Facility is subject to quarterly payments of principal in an amount equal to $3,750,000 commencing December 31, 2017 and continuing through maturity. At the Company’s election, loans made under the New Credit Facilities will bear interest at either (i) Base Rate plus an applicable margin or (ii) LIBO Rate plus an applicable margin, subject to adjustment if an event of default under the Amended and Restated Credit Agreement has occurred and is continuing. The Base Rate means the highest of (a) the Agent’s “prime rate,” (b) the federal funds effective rate plus 0.50% and (c) the LIBO Rate for an interest period of one month plus 1%. The Company’s Guarantors will guarantee the obligations of the Company and its subsidiaries under the New Credit Facilities. The obligations of the Company and its subsidiaries under the New Credit Facilities are secured by all of the assets of the Company and the Guarantors, subject to certain exceptions and exclusions as set forth in the Amended and Restated Credit Agreement and other loan documents. See Note 15— Subsequent Events for details on an amendment to the Amended and Restated Credit Agreement.
The New Term Loan Facility consisted of the following:
December 31, 2017 | December 31, 2016 | ||||||
Principal | $ | 56,250,000 | $ | — | |||
Less: Debt discount, net | (612,894 | ) | — | ||||
Net carrying amount | $ | 55,637,106 | $ | — | |||
Less: current portion | 15,000,000 | — | |||||
Long-term debt, net | $ | 40,637,106 | $ | — | |||
73
The weighted average interest rate at December 31, 2017 was 4.05%. As of December 31, 2017, the Company did not have an outstanding balance on its Revolving Credit Facility.
Credit Agreement
On March 3, 2017, in connection with the if(we) Acquisition discussed in Note 2- Acquisitions, the Company entered into a Credit Agreement with the several banks and other financial institutions party thereto and JPMorgan Chase Bank, N.A., the Agent. The Credit Agreement provided for a Revolving Credit Facility of $15.0 million and a Term Loan Facility of $15.0 million . On April 3, 2017, the Company drew down $15.0 million from its Term Loan Facility in connection with the if(we) Acquisition. On September 18, 2017, the Company paid in full the outstanding balance on the Term Loan Facility.
Note 8— Commitments and Contingencies
Capital Leases
The Company leases certain fixed assets under capital leases that expire through 2021. The capital leases are for the Company's data centers, printers and other furniture in the Company's German offices. The Company currently has lease agreements with Grenkeleasing AG, Commerzbank Real Mobilienleasing GmbH, BFL Leasing GmbH and Targo Leasing GmbH (former GE Capital Leasing GmbH). Principal and interest are payable monthly at interest rates ranging from 3.9% to 7.8% per annum, rates varying based on the type of leased asset. The Company did not enter into any new capital lease agreements for the year ended December 31, 2017 other than the capital leases acquired as part of the Lovoo Acquisition.
Operating Leases and Cloud Data Storage
The Company leases its operating facilities in the U.S. under certain noncancelable operating leases that expire through 2022. The Company also leases operating facilities in Germany under certain noncancelable operating leases that expire through 2020. These leases are renewable at the Company’s option. The German subsidiary of the Company also stores a majority of its user and business data in the Google Cloud Platform under a noncancelable minimum commitment agreement that expires through 2023.
A summary of minimum future rental payments required under capital and operating leases as of December 31, 2017 are as follows:
Capital Leases | Operating Leases | Cloud Data Storage | |||||||||
2018 | $ | 271,829 | $ | 4,573,691 | $ | 126,331 | |||||
2019 | 152,209 | 2,451,287 | 478,506 | ||||||||
2020 | 40,732 | 967,326 | 682,329 | ||||||||
2021 | 5,038 | 612,619 | 1,014,517 | ||||||||
2022 | — | 283,302 | 1,115,969 | ||||||||
2023 | — | — | 1,227,566 | ||||||||
Total minimum payments | $ | 469,808 | $ | 8,888,225 | $ | 4,645,218 | |||||
Less: Amount representing interest | 23,272 | ||||||||||
Total present value of minimum payments | 446,536 | ||||||||||
Less: Current portion of such obligations | 254,399 | ||||||||||
Long-term capital lease obligations | $ | 192,137 | |||||||||
Rent expense for the operating leases was $4.7 million, $2.0 million and $1.9 million for the years ended December 31, 2017, 2016 and 2015, respectively.
74
New Term Loan Facility
A summary of minimum future principal payments under our New Term Loan Facility as of December 31, 2017 are as follows:
New Term Loan Facility(1) | ||||
2018 | $ | 15,000,000 | ||
2019 | 15,000,000 | |||
2020 | 26,250,000 | |||
Total minimum loan payments | $ | 56,250,000 | ||
(1) | Interest rates on the New Term Loan Facility are variable in nature, however, the Company is party to a fixed-pay amortizing interest rate swap having a remaining notional amount of $41.3 million and a non-amortizing interest rate cap with a notional amount of $15.0 million. If interest rates were to remain at the December 31, 2017 level, we would make interest payments of $0.2 million in 2018 and 2019, respectively, of net settlements on the fixed-pay amortizing interest rate swap. |
Litigation
From time to time, we are party to certain legal proceedings that arise in the ordinary course and are incidental to our business. We operate our business online, which is subject to extensive regulation by federal and state governments.
On September 29, 2015, the Company filed suit in the Court of Common Pleas of Philadelphia County, Pennsylvania, against Beanstock Media, Inc. (“Beanstock”) and Adaptive Medias, Inc. (“Adaptive”) for collection of approximately $10 million, in the aggregate, due under the Media Publisher Agreement (the “Web Agreement”) entered into on September 25, 2013 and the Advertising Agreement (the “Mobile Agreement”) entered into on December 23, 2014.
Pursuant to the Web Agreement, Beanstock had the exclusive right and obligation to fill all of the Company’s remnant desktop in-page display advertising inventory on www.meetme.com (the “Site”), excluding, (i) any inventory sold to a third party under an insertion order that was campaign or advertiser specific, (ii) any inventory the Company reserved in existing and future agreements with third parties for barter transactions and as additional consideration as part of larger business development transactions, and (iii) any inventory reserved for premium advertising for the Site. Pursuant to the Mobile Agreement, Beanstock had the right and obligation to fill substantially all of the Company’s advertising inventory on its MeetMe mobile app for iOS and Android, as well as the Site when accessed using a mobile device and as optimized for mobile devices (collectively, the “App”). The Mobile Agreement did not apply to interstitially placed advertisements, advertisements on versions of the App specific to the iPad and other Apple tablet devices, other mobile apps or in-app products or features on the App, including, without limitation, offer wall features and the Company’s Social Theater business.
On September 28, 2015, Adaptive filed suit in the Superior Court of California, County of Orange, against the Company, Beanstock, et al., alleging, in pertinent part, that the Company “aided and abetted” an individual who was an officer and director of Adaptive to breach his fiduciary duty to Adaptive with respect to Adaptive’s joining the Mobile Agreement. Adaptive’s complaint sought from the Company $600,000 plus unspecified punitive damages. On January 20, 2016, the Company received notice from the United States Bankruptcy Court, District of Delaware, that a Chapter 7 bankruptcy case against Beanstock had been filed on October 7, 2015. Both of the state court actions were stayed by the courts as a result of the bankruptcy filing against Beanstock. The matter remained stayed until Adaptive indicated that it no longer wanted to pursue the matter and, on or about November 20, 2017, filed a voluntary request for dismissal without prejudice of the action and all claims against the parties, including the Company, which dismissal was entered by the Court on the same day. The Company was not required to take any action or pay any sum in connection with the dismissal. The matter is, therefore, resolved.
Future events or circumstances, currently unknown to management, will determine whether the resolution of pending or threatened litigation or claims will ultimately have a material effect on our consolidated financial position, liquidity or results of operations in any future reporting periods.
75
Retirement Plan
The Company maintains The Meet Group, Inc. 401(k) Retirement Plan (the “Plan”), which is a savings and investment plan intended to be qualified under of the Internal Revenue Code. The Plan covers the majority of the employees of the Company. In January 2014, the Company began providing company match contributions to the plan, based on a participant’s contribution. The Company’s 401(k) match expense totaled $0.7 million for the year ended December 31, 2017 and $0.4 million for the years ended December 31, 2016 and 2015. The expense is included in sales and marketing, product development and content, and general and administrative expenses in the consolidated statements of operations and comprehensive (loss) income.
Note 9— Stockholder’s Equity
Preferred Stock
The total number of shares of preferred stock, $.001 par value, that the Company is authorized to issue is 5,000,000.
The Board of Directors may, without further action by the stockholders, issue a series of Preferred Stock and fix the rights and preferences of those shares, including the dividend rights, dividend rates, conversion rights, exchange rights, voting rights, terms of redemption, redemption price or prices, liquidation preferences, the number of shares constituting any series and the designation of such series.
On March 1, 2017, the Company filed with the Secretary of State of the State of Delaware a Certificate of Elimination of the 1,000,000 shares of Series A-1 Preferred Stock that effectuated the elimination of the Series A-1 Preferred Stock, which then resumed the status of authorized but unissued shares of preferred stock. As of December 31, 2017, there were no longer any Series A-1 shares authorized or issued and outstanding.
Common Stock
The total number of shares of common stock, $0.001 par value, that the Company is authorized to issue is 100,000,000.
In March 2017, the Company completed the underwritten public offering and sale of 9,200,000 shares (the “Shares”) of common stock at a price to the public of $5.00 per share. The net proceeds from the sale of the Shares, after deducting the underwriters’ discount and other offering expenses, were approximately $43.0 million. The Offering was conducted pursuant to the Company’s shelf registration statement on Form S-3 (File No. 333-190535) filed with the SEC under the Securities Act of 1933, as amended (the “Securities Act”) and declared effective on April 18, 2014.
The Company issued shares of common stock of 2,080,648 and 4,693,918 related to exercises of stock options, 1,013,763 and 934,991 related to restricted stock awards and 675,000 and 1,763,340 related to the exercise of warrants during the year ended December 31, 2017 and 2016, respectively. During the year ended December 31, 2016, 200,000 warrants expired. No warrants expired during the year ended December 31, 2017.
In September 2015, the Board of Directors authorized a $1 million share repurchase program (the “2015 Repurchase Program”) relating to the Company’s common stock. In October 2015, the Board of Directors increased the authorized amount to $3 million. The 2015 Repurchase Program expired on April 30, 2016. The Company did not repurchase any of our common stock under the 2015 Repurchase Program.
On August 29, 2016, the Board of Directors authorized a $15 million share repurchase program (the “2016 Repurchase Program”). Repurchases under the 2016 Repurchase Program will be made in the open market or through privately negotiated transactions intended to comply with SEC Rule 10b-18, subject to market conditions, applicable legal requirements, and other relevant factors. The 2016 Repurchase Program does not obligate the Company to acquire any particular amount of common stock, and it may be suspended at any time at the Company’s discretion. During the year ended December 31, 2016, the Company repurchased 848,145 shares for an aggregate purchase price of $5.0 million. These shares were immediately retired.
Stock-Based Compensation
The fair values of share-based payments are estimated on the date of grant using the Black-Scholes option pricing model, based on weighted average assumptions. Expected volatility is based on historical volatility of the Company’s common stock. The risk-free rate is based on the U.S. Treasury yield curve in effect over the expected term at the time of grant. Compensation expense is recognized on a straight-line basis over the requisite service period of the award. During 2017, 2016 and 2015, the Company
76
continued to use the simplified method to determine the expected option term since the Company’s stock option exercise experience does not provide a reasonable basis upon which to estimate the expected option term.
The Company began granting restricted stock awards (“RSAs”) to its employees in April 2013. The cost of the RSAs is determined using the fair value of the Company’s common stock on the date of grant. Stock-based compensation expense for RSAs is amortized on a straight-line basis over the requisite service period. RSAs generally vest over a three-year period with 33% vesting at the end of one year and the remaining vesting annually thereafter.
The assumptions used in calculating the fair value of stock-based awards represent the Company’s best estimates, but these estimates involve inherent uncertainties and the application of management judgment. As a result, if factors change and the Company uses different assumptions, the Company’s stock-based compensation expense could be materially different in the future.
Stock-based compensation expense includes incremental stock-based compensation expense and is allocated on the consolidated statements of operations and comprehensive income (loss) as follows:
For the Years Ended December 31, | |||||||||||
2017 | 2016 | 2015 | |||||||||
Sales and marketing | $ | 439,797 | $ | 354,088 | $ | 309,708 | |||||
Product development and content | 4,008,545 | 1,528,547 | 1,197,696 | ||||||||
General and administrative | 4,018,936 | 1,685,352 | 1,409,023 | ||||||||
Total stock-based compensation for vesting of options and RSA's | 8,467,278 | 3,567,987 | 2,916,427 | ||||||||
Warrant modification | — | — | 425,538 | ||||||||
Total stock-based compensation expense | $ | 8,467,278 | $ | 3,567,987 | $ | 3,341,965 | |||||
As of December 31, 2017, the Company had $4.9 million of unrecognized compensation cost related to stock options, which will be recognized over the remaining weighted-average vesting period of approximately 2.1 years. As of December 31, 2017, the Company had $10.6 million of unrecognized stock-based compensation expense related to RSAs, which will be recognized over the remaining weighted-average vesting period of approximately 2.1 years.
Stock Option Plans
2012 Omnibus Incentive Plan
On December 16, 2016, the Company’s stockholders approved the Amended and Restated 2012 Omnibus Incentive Plan (the “2012 Plan”), providing for the issuance of up to 10.5 million shares of the Company’s common stock, including approximately 2.1 million shares previously approved by the Company’s stockholders under the Company’s Amended and Restated 2006 Stock Incentive Plan (the “2006 Stock Plan”), less one share of common stock for every one share of common stock that was subject to an option or other award granted after December 31, 2011 under the 2006 Stock Plan, plus an additional number of shares of common stock equal to the number of shares previously granted under the 2006 Stock Plan that either terminate, expire, or are forfeited after December 31, 2011. As of December 31, 2017, there were approximately 1.7 million shares of common stock available for grant. A summary of stock option activity under the 2012 Plan during the year ended December 31, 2017 is as follows:
Options | Number of Stock Options | Weighted- Average Exercise Price | Weighted- Average Remaining Contractual Life | Aggregate Intrinsic Value | |||||||||
Outstanding at December 31, 2016 | 2,822,855 | $ | 2.42 | ||||||||||
Granted | 1,227,851 | 4.74 | |||||||||||
Exercised | (100,015 | ) | 2.10 | ||||||||||
Forfeited or expired | (225,799 | ) | 4.37 | ||||||||||
Outstanding at December 31, 2017 | 3,724,892 | $ | 3.07 | 7.8 | $ | 1,582,812 | |||||||
Exercisable at December 31, 2017 | 2,384,981 | $ | 2.48 | 7.1 | $ | 1,385,939 | |||||||
The total intrinsic values of options under the 2012 Plan exercised during the years ended December 31, 2017, 2016 and 2015 were $0.2 million, $3.2 million and $0.1 million, respectively. The Company recorded stock-based compensation expense under
77
the 2012 Plan related to options of $2.5 million, $1.4 million and $1.5 million for the years ended December 31, 2017, 2016 and 2015, respectively.
The weighted-average grant-date fair value of stock options granted to employees in the years ended December 31, 2017, 2016 and 2015 was $4.74, $3.35 and $1.79 per share, respectively. The fair value of each stock option is estimated on the date of grant using the Black-Scholes option pricing model with the following weighted-average assumptions for the years ended December 31, 2017, 2016 and 2015:
For the Years Ended December 31, | ||||||||
2017 | 2016 | 2015 | ||||||
Risk-free interest rate | 1.90 | % | 1.39 | % | 1.37 | % | ||
Expected term (in years) | 6.0 | 6.0 | 5.9 | |||||
Expected dividend yield | — | — | — | |||||
Expected volatility | 83 | % | 84 | % | 87 | % | ||
Restricted Stock Awards
The Company granted 1,873,294 RSAs under the 2012 Plan during the year ended December 31, 2017. Shares are forfeited if not vested within three years from the date of grant, and vest in three equal annual increments. The Company recorded stock-based compensation expense related to RSAs under the 2012 Plan of $3.9 million, $2.1 million and $1.5 million for the years ended December 31, 2017, 2016 and 2015, respectively. A summary of RSA activity under the 2012 Plan during the year ended December 31, 2017 is as follows:
RSA's | Number of RSAs | Weighted-Average Stock Price | ||||
Outstanding at December 31, 2016 | 1,794,115 | $ | 2.46 | |||
Granted | 1,873,294 | 4.34 | ||||
Exercised | (1,100,401 | ) | 2.47 | |||
Forfeited or expired | (274,700 | ) | 4.27 | |||
Outstanding and unvested at December 31, 2017 | 2,292,308 | $ | 3.77 | |||
2006 Stock Incentive Plan
On June 27, 2007, the Company’s stockholders approved the 2006 Stock Plan, providing for the issuance of up to 3,700,000 shares of common stock plus an additional number of shares of common stock equal to the number of shares previously granted under the 1998 Stock Option Plan that either terminate, expire, or lapse after the date of the Board of Directors’ approval of the 2006 Stock Plan. All options granted and outstanding have been fully expensed prior to 2016.
A summary of stock option activity under the 2006 Stock Plan during the year ended December 31, 2017 is as follows:
Options | Number of Stock Options | Weighted-Average Exercise Price | Weighted-Average Remaining Contractual Life | Aggregate Intrinsic Value | |||||||||
Outstanding at December 31, 2016 | 3,041,686 | $ | 2.62 | ||||||||||
Granted | — | — | |||||||||||
Exercised | (1,664,177 | ) | 1.31 | ||||||||||
Forfeited or expired | (183,428 | ) | 4.94 | ||||||||||
Outstanding at December 31, 2017 | 1,194,081 | $ | 4.08 | 3.8 | $ | 3,768 | |||||||
Exercisable at December 31, 2017 | 1,149,902 | $ | 4.09 | 3.9 | $ | 3,768 | |||||||
The total intrinsic values of options under the 2006 Plan exercised during the years ended December 31, 2017, 2016 and 2015 were $6.3 million, $15.3 million and $0.1 million, respectively.
78
Amended and Restated 2016 Inducement Omnibus Incentive Plan
On October 3, 2016, in connection with the closing of the Skout Acquisition, the Company’s Board of Directors adopted the 2016 Inducement Omnibus Incentive Plan in accordance with NASDAQ Listing Rule 5635(c)(4). At the closing of the Skout Acquisition, the Company granted stock options to purchase an aggregate of up to 355,000 shares of its common stock to 25 former Skout employees as an inducement material to becoming non-executive employees of the Company. On February 27, 2017, the Company amended and restated the 2016 Inducement Omnibus Incentive Plan (as so amended and restated, the “2016 Stock Plan”) authorized an additional 2,000,000 shares of common stock under the 2016 Stock Plan. At the closing of the if(we) Acquisition, the Company granted options to purchase an aggregate of up to 75,000 shares of its common stock and restricted stock awards representing an aggregate of 717,500 shares of common stock to 83 former if(we) employees as an inducement material to becoming non-executive employees of the Company. At the closing of the Lovoo Acquisition, the Company granted restricted stock awards representing an aggregate of 531,500 shares of common stock to 96 former Lovoo employees as an inducement material to becoming non-executive employees of the Company.
Options under the 2016 Stock Plan
The Company recorded stock-based compensation expense related to options under the 2016 Stock Plan of approximately $0.8 million and $0.1 million for the year ended December 31, 2017 and 2016, respectively. A summary of stock option activity under the 2016 Stock Plan during the year ended December 31, 2017 is as follows:
Options | Number of Stock Options | Weighted- Average Exercise Price | Weighted- Average Remaining Contractual Life | Aggregate Intrinsic Value | |||||||||
Outstanding at December 31, 2016 | 310,000 | $ | 6.02 | ||||||||||
Granted | 575,000 | 4.95 | |||||||||||
Exercised | — | — | |||||||||||
Forfeited or expired | (150,832 | ) | 6.03 | ||||||||||
Outstanding at December 31, 2017 | 734,168 | $ | 5.18 | 9.1 | $ | — | |||||||
Exercisable at December 31, 2017 | 80,834 | $ | 6.04 | 8.8 | $ | — | |||||||
The fair value of each stock option is estimated on the date of grant using the Black-Scholes option pricing model with the following weighted-average assumptions for the year ended December 31, 2017:
Year Ended December 31, | |||||
2017 | 2016 | ||||
Risk-free interest rate | 1.89 | % | 1.21 | % | |
Expected term (in years) | 6.0 | 6.0 | |||
Expected dividend yield | — | — | |||
Expected volatility | 84 | % | 85 | % | |
79
Restricted Stock Awards under the 2016 Stock Plan
The Company granted 1,539,250 RSAs under the 2016 Stock Plan during the year ended December 31, 2017. Shares are forfeited if not vested within three years from the date of grant, and vest in three equal annual increments. The Company recorded stock-based compensation expense related to RSAs of approximately $1.1 million for the year ended December 31, 2017. A summary of RSA activity under the 2016 Stock Plan during the year ended December 31, 2017 is as follows:
RSAs | Number of RSAs | Weighted-Average Stock Price | |||||
Outstanding at December 31, 2016 | — | $ | — | ||||
Granted | 1,539,250 | 4.80 | |||||
Vested | — | — | |||||
Forfeited or expired | (297,000 | ) | 5.55 | ||||
Outstanding and unvested at December 31, 2017 | 1,242,250 | $ | 4.62 | ||||
Non-Plan Options
The Board of Directors has approved, and our stockholders have ratified, the issuance of stock options outside of our stock incentive plans. A summary of Non-Plan option activity during the year ended December 31, 2017 is as follows:
Options | Number of Stock Options | Weighted- Average Exercise Price | Weighted- Average Remaining Contractual Life | Aggregate Intrinsic Value | ||||||||||
Outstanding at December 31, 2016 | 316,456 | $ | 1.34 | |||||||||||
Granted | — | — | ||||||||||||
Exercised | (316,456 | ) | 1.34 | |||||||||||
Forfeited or expired | — | — | ||||||||||||
Outstanding at December 31, 2017 | — | $ | — | — | $ | — | ||||||||
The total intrinsic values of options exercised during the years ended December 31, 2017 and 2016 were $1.0 million and $0.4 million. There were no options exercised in 2015.
Note 10— Warrant Transactions
Below is a summary of the number of shares issuable upon exercise of outstanding warrants and the terms and accounting treatment for the outstanding warrants:
Warrants as of December 31, | Weighted-Average Exercise Price | Balance Sheet Classification as of | |||||||||||
2017 | 2016 | Expiration | 2016 | ||||||||||
Allen, F. Stephen Series 3 | — | 425,000 | $ | 3.55 | 6/21/2017 | Equity | |||||||
OTA LLC Series 2 | — | 250,000 | $ | 3.55 | 6/21/2017 | Equity | |||||||
All warrants | — | 675,000 | |||||||||||
In March 2006, the Company issued warrants to purchase 1,000,000 shares of common stock each at exercise prices of $4.00 and $7.00 as compensation for certain strategic initiatives. On February 19, 2010, the Company reduced the exercise price of the remaining 1,000,000 outstanding warrants to $3.55 per share. On December 22, 2015, in conjunction with a litigation settlement, the Company repurchased 50,000 Series 2 warrants and extended the warrant expiration date to June 21, 2017. The fair value of the warrant modification was determined by comparing the fair value of the modified warrant with the fair value of the unmodified warrant on the modification date. As a result of this modification, an additional expense of approximately $426,000 was recorded in general and administrative expense in 2015.
80
In 2016, F. Stephen Allen exercised 275,000 warrants with an exercise price of $3.55 per share, with the Company issuing 275,000 shares of common stock. He sold 250,000 warrants to Warberg WF IV LP (“Warberg”) and, as of December 31, 2016, Allen had 425,000 warrants remained outstanding. In March, April and May 2017, F. Stephen Allen exercised 425,000 warrants with an exercise price of $3.55 resulting in the Company issuing 425,000 shares of common stock.
In 2016, Warberg sold all of its 250,000 warrants to OTA LLC. In June 2017, OTA LLC exercised the remaining 250,000 warrants with an exercise price of $3.55 resulting in the Company issuing 250,000 shares of common stock.
A summary of warrant activity for the year ended December 31, 2017 is as follows:
Warrants | Number of warrants | Weighted-average exercise price | |||||
Outstanding at December 31, 2016 | 675,000 | $ | 3.55 | ||||
Granted | — | — | |||||
Exercised | (675,000 | ) | 3.55 | ||||
Forfeited or expired | — | — | |||||
Outstanding at December 31, 2017 | — | $ | — | ||||
Note 11— Income Taxes
The Company provides for income taxes under the liability method. Under this method, deferred tax assets and liabilities are determined based on differences between financial reporting and tax bases of assets and liabilities, and are measured using the enacted tax rates and laws that will be in effect when the differences are expected to reverse.
For the year ended December 31, 2017 the Company recorded a U.S. net expense for income taxes of $6.5 million. The expense for the revaluation of the deferred tax asset related to the change in the U.S. federal corporate tax rate from 35% to 21% was $7.7 million. With the purchase of Lovoo, GmbH in October 2017, the Company recorded a provision for German income taxes of $0.2 million.
The provision for income taxes for 2017, 2016 and 2015, consists of the following:
2017 | 2016 | 2015 | |||||||||
Federal: | |||||||||||
Current | $ | 20,870 | $ | 150,233 | $ | 224,980 | |||||
Deferred | 6,637,417 | (26,783,983 | ) | — | |||||||
Total federal | 6,658,287 | (26,633,750 | ) | 224,980 | |||||||
State: | |||||||||||
Current | (32,456 | ) | 71,120 | 51,321 | |||||||
Deferred | (74,368 | ) | (1,312,732 | ) | — | ||||||
Total state | (106,824 | ) | (1,241,612 | ) | 51,321 | ||||||
Foreign: | |||||||||||
Current | 293,331 | — | — | ||||||||
Deferred | (141,194 | ) | — | — | |||||||
Total foreign | 152,137 | — | — | ||||||||
Provision (benefit) for income taxes | $ | 6,703,600 | $ | (27,875,362 | ) | $ | 276,301 | ||||
81
Deferred taxes are recognized for temporary differences between the basis of assets and liabilities for financial statement and income tax purposes. The significant components of the Company's deferred tax assets are comprised of the following:
December 31, 2017 | December 31, 2016 | ||||||
Deferred tax assets: | |||||||
Net operating loss carryforward | $ | 18,092,988 | $ | 27,342,311 | |||
Property and equipment | 326,229 | — | |||||
Stock options and warrants | 2,796,366 | 4,999,444 | |||||
Federal and state tax credits | 6,208,362 | 823,914 | |||||
Accrued liabilities and other reserves | 1,514,995 | 1,231,073 | |||||
Other comprehensive income | 309,436 | — | |||||
Other | 476,910 | — | |||||
Total deferred tax assets | 29,725,286 | 34,396,742 | |||||
Valuation allowance | (2,512,045 | ) | — | ||||
Net deferred tax assets | 27,213,241 | 34,396,742 | |||||
Deferred tax liabilities | |||||||
Property and equipment | — | (212,327 | ) | ||||
Amortization of intangible assets | (11,692,027 | ) | (5,930,588 | ) | |||
Total deferred tax liabilities | (11,692,027 | ) | (6,142,915 | ) | |||
Net deferred tax assets | $ | 15,521,214 | $ | 28,253,827 | |||
As of each reporting date, management considers new evidence, both positive and negative, that could affect its view of the future realization of deferred tax assets (primarily federal and state net operating losses (NOLs). As of December 31, 2017, in part because in the current year the Company achieved three years of cumulative adjusted pretax income in the U.S. federal tax jurisdiction, management determined that there is sufficient positive evidence to conclude that it is more likely than not that net deferred tax assets, before valuation allowance, of $18.1 million are realizable, except for certain Pennsylvania NOLs that, starting in 2017, are limited to 30% of taxable income. Upon acquisition, the Company determined that a valuation allowance was required for certain if(we) California net operating loss and credits. The Company believes it is more likely than not that the foreign deferred tax assets are realizable.
82
A reconciliation of income tax expense computed at the statutory federal income tax rate of 35% to income taxes as reflected in the financial statements is as follows:
2017 | 2016 | 2015 | |||||||||
U.S. federal income tax at statutory rate | $ | (20,260,844 | ) | $ | 6,437,639 | $ | 2,123,616 | ||||
State tax benefit, net of federal provision (benefit) | (21,096 | ) | (1,266,504 | ) | 20,672 | ||||||
Effect of rates different than statutory | (311,304 | ) | — | — | |||||||
Goodwill impairment | 19,750,101 | — | — | ||||||||
Windfall tax benefit | (2,155,157 | ) | (2,957,837 | ) | — | ||||||
Fair market value adjustment for warrants | — | 302,609 | — | ||||||||
Transaction costs | 819,251 | 607,528 | 209,646 | ||||||||
Sec. 162(m) Excess Officer's Compensation | 283,351 | 476,339 | — | ||||||||
Nondeductible expenses | 825,169 | 56,018 | — | ||||||||
Stock compensation forfeitures and other | 562,155 | 1,195,454 | 34,334 | ||||||||
Loss on foreign investments | — | (649,998 | ) | ||||||||
Rate change | 7,670,606 | (909,045 | ) | — | |||||||
Other | (146,909 | ) | 72,184 | 20,347 | |||||||
Dissolution of foreign entity | (1,124,781 | ) | — | — | |||||||
Repatriation tax | 81,808 | — | — | ||||||||
Change in valuation allowance | 731,250 | (31,247,234 | ) | (2,168,528 | ) | ||||||
Foreign subsidiary loss with no tax benefit | — | 7,485 | 36,214 | ||||||||
(Benefit) provision for income taxes | $ | 6,703,600 | $ | (27,875,362 | ) | $ | 276,301 | ||||
The Tax Cuts and Jobs Act (“Tax Act”) was enacted on December 22, 2017, most provisions of which will take effect starting in 2018. The Tax Act makes substantial changes to U.S. taxation of corporations, including, lowering the U.S. federal corporate income tax rate from 35% to 21%, and instituting a territorial tax system, along with a one-time tax on accumulated foreign earnings. Upon enactment, the Company remeasured its deferred tax balances to reflect the new 21% U.S. federal tax rate, which resulted in a tax expense of $7.7 million in 2017. The Company also recorded a provisional liability for the one-time U.S. tax of $0.1 million, triggered by the Tax Act, on accumulated foreign earnings, net of no foreign tax credit. Another provision of the Tax Act subjects performance based compensation paid to certain covered employees to the limitation on the deductibility of executive compensation under Section 162(m) of the Internal Revenue Code. As a result of this provision the future payment of stock based compensation for which deferred tax assets exist as December 31, 2017 may be nondeductible in the future year in which it is paid. The Company’s accounting policy is to treat stock based compensation as deductible first and to apply the limitation to cash based compensation in the year of payment. Based on information available at this time it is assumed that these future payments will be deductible and that any limitation on the deductibility will be applied to other compensation paid in the year of payment.
On December 22, 2017, Staff Accounting Bulletin No. 118 (“SAB 118”) was issued to address the application of US GAAP in situations when a registrant does not have the necessary information available, prepared, or analyzed (including computations) in reasonable detail to complete the accounting for certain income tax effects of the Tax Act. In accordance with SAB 118, the Company has determined that the $0.1 million of current tax expense recorded in connection with the transition tax on the mandatory deemed repatriation of foreign earnings was a provisional amount and a reasonable estimate at December 31, 2017. As further guidance is issued by the Department of the Treasury, additional work may be necessary to ensure earnings as required by the calculations are properly determined. Additionally, as a result of the Tax Act, the Company has not completed its evaluation of its indefinite reinvestment assertion with regard to foreign earnings under ASC 740-30. As a result, deferred tax liabilities may be increased or decreased during the period allowed under SAB 118. Further, no estimate can currently be made and no provisional amounts were recorded in the financial statements for the impact of the Global Intangible Low-Taxed Income (“GILTI”) provision of the Tax Act. The GILTI provision imposes taxes on foreign earnings in excess of a deemed return on tangible assets. This tax is effective for the Company after the end of the current fiscal year. However, the Company is evaluating whether deferred taxes should be recorded in relation to the GILTI provisions or if the tax should be recorded in the period in which it occurs. Based on the current interpretation, the Company may choose either method as an accounting policy election. The Company has not yet decided on the accounting policy related to GILTI and will only do so after completion of an analysis. Any subsequent adjustment to any of these amounts will be recorded to current tax expense during the measurement period provided under SAB 118.
The deferred tax assets at both December 31, 2017 and 2016 are principally the result of federal and state net operating loss carryforwards of $68.6 million and $73.0 million, respectively, which substantially begin to expire in 2023 and through 2035.
83
The net operating loss carryforward at December 31, 2017 includes $16.9 million of Skout NOLs on which the Company performed an Internal Revenue Code Section 382 study which concluded that $1.3 million of a total of $18.2 million would be unusable due to annual limitation. Previously, the Company had completed an Internal Revenue Code Section 382 study to determine annual limitations on the usability of MeetMe’s net operating loss carryforwards due to historical changes in ownership. The amount of federal NOL carryforwards as of December 31, 2017 disclosed above do not include $63.3 million of The Meet Group, Inc. NOL carryforwards that are expected to expire unutilized pursuant to the Section 382 study.
In accordance with ASC 740-10, Accounting for Uncertainty in Income Taxes - an Interpretation of FASB Statement No. 109, the Company has analyzed its tax position in all jurisdictions where it is required to file an income tax return and the Company has not recognized a benefit for uncertain tax positions. With respect to purchase accounting associated with the if(we) acquisition, a liability for uncertain tax positions was established in the amount of $2.0 million. If the unrecognized tax benefit is recognized it will impact the effective tax rate of the Company. All of the uncertain tax position has been recorded as a reduction to the related deferred tax asset for the credit carryforward in accordance with Accounting Standards Update 2013-11, Presentation of an Unrecognized Tax Benefit When a Net Operating Loss Carryforward, a Similar Tax Loss, or a Tax Credit Carryforward Exists for all periods. The total amount of unrecognized tax benefits is not expected to increase or decrease within 12 months of the reporting date.
The following is a tabular reconciliation of total amounts of unrecognized tax benefits:
2017 | |||
Unrecognized tax liabilities— January 1 | $ | — | |
Gross increases— tax positions in prior year | 2,029,653 | ||
Unrecognized tax liabilities— December 31 | $ | 2,029,653 | |
The Company will recognize interest and penalties related to uncertain tax positions in income tax expense. As of December 31, 2017 and 2016, the Company had no accrued interest or penalties related to uncertain tax positions and no amounts have been recognized in the Company's statements of operations and comprehensive income (loss) for the years ended December 31, 2017, 2016 and 2015.
The Company files income tax returns in the U.S. and various state and foreign jurisdictions. The federal and state income tax returns are generally subject to tax examinations for the tax years ended December 31, 2013 through December 31, 2017. To the extent the Company has tax attribute carryforwards, the tax years in which the attribute was generated may still be adjusted upon examination by the Internal Revenue Service, state or foreign tax authorities to the extent utilized in a future period.
The Company does not expect to repatriate any earnings in foreign subsidiaries, and therefore no accrual for withholding or other taxes has been made. The Company will continue to monitor any excess financial reporting over tax basis in our investments in foreign subsidiaries that may arise in future periods, and withholding taxes or other taxes would be recorded for any amounts not considered permanently reinvested, if applicable.
Note 12— Transactions with Affiliates
In 2017, Catherine Connelly, VP Brand Strategy, earned a salary of $141,780, management incentive bonus of $19,970, $82,016 worth of restricted stock awards (RSAs), and $55,750 worth of stock options. Ms. Connelly is the sister of Geoffrey Cook, our CEO and Director. Matthew Eustice, VP Quality Assurance, earned a salary of $150,363, management incentive bonus of $20,278, $82,016 worth of RSAs, and $55,750 worth of stock options. Mr. Eustice is the brother-in-law of Geoffrey Cook. Andrew Connelly, Sr. Designer, earned a salary of $106,208 and $18,640 worth of RSAs. Mr. Connelly is the brother-in-law of Geoffrey Cook.
Note 13— Derivatives and Hedging Activities
Risk Management Objective of Using Derivatives
The Company is exposed to certain risk arising from both its business operations and economic conditions. The Company principally manages its exposures to a wide variety of business and operational risks through management of its core business activities. The Company manages economic risks, including interest rate, liquidity, and credit risk primarily by managing the amount, sources, and duration of its assets and liabilities and the use of derivative financial instruments. Specifically, the Company enters into derivative financial instruments to manage exposures that arise from business activities that result in the receipt or payment of future known and uncertain cash amounts, the value of which are determined by interest rates. The Company’s
84
derivative financial instruments are used to manage differences in the amount, timing, and duration of the Company’s known or expected cash receipts and its known or expected cash payments principally related to the Company’s borrowings.
Certain of the Company’s foreign operations expose the Company to fluctuations of foreign exchange rates. These fluctuations may impact the value of the Company’s cash receipts and payments in terms of the Company’s functional currency. The Company enters into derivative financial instruments to protect the value or fix the amount of certain liabilities in terms of its functional currency, the U.S. dollar.
Cash Flow Hedges of Interest Rate Risk
The Company’s objectives in using interest rate derivatives are to add stability to interest expense and to manage its exposure to interest rate movements. To accomplish this objective, the Company primarily uses interest rate swaps and caps as part of its interest rate risk management strategy. Interest rate swaps designated as cash flow hedges involve the receipt of variable amounts from a counterparty in exchange for the Company making fixed-rate payments over the life of the agreements without exchange of the underlying notional amount. Interest rate caps designated as cash flow hedges involve the receipt of variable amounts from a counterparty if interest rates rise above the strike rate on the contract in exchange for an up-front premium. During 2017, such derivatives were used to hedge the variable cash flows associated with existing variable-rate debt.
For derivatives designated and that qualify as cash flow hedges of interest rate risk, the gain or loss on the derivative is recorded in Accumulated Other Comprehensive Income and subsequently reclassified into interest expense in the same period(s) during which the hedged transaction affects earnings. Gains and losses on the derivative representing hedge components excluded from the assessment of effectiveness are recognized over the life of the hedge on a systematic and rational basis, as documented at hedge inception in accordance with the Company’s accounting policy election. The earnings recognition of excluded components is presented in interest expense. Amounts reported in accumulated other comprehensive income related to derivatives will be reclassified to interest expense as interest payments are made on the Company’s variable-rate debt. During 2018, the Company estimates that an additional $0.1 million will be reclassified as an increase to interest expense.
As of December 31, 2017, the Company had the following outstanding interest rate derivatives that were designated as cash flow hedges of interest rate risk:
Number of | At Inception | At December 31, 2017 | ||||
Interest Rate Derivative | Instruments | Notional | Notional | |||
Interest rate swaps | 1 | $45,000,000 | $41,250,000 | |||
Interest rate caps | 1 | $15,000,000 | $15,000,000 | |||
Cash Flow Hedges of Foreign Exchange Risk
The Company is exposed to fluctuations in various foreign currencies against its functional currency, the US dollar. The Company uses foreign currency derivatives including cross-currency interest rate swaps to manage its exposure to fluctuations in the USD-EUR exchange rate. Cross-currency interest rate swaps involve exchanging fixed rate interest payments for fixed rate interest receipts both of which will occur at the USD-EUR forward exchange rates in effect upon entering into the instrument. The Company designates these derivatives as cash flow hedges of foreign exchange risks.
For derivatives designated and that qualify as cash flow hedges of foreign exchange risk, the gain or loss on the derivative is recorded in Accumulated Other Comprehensive Income and subsequently reclassified in the period(s) during which the hedged transaction affects earnings within the same income statement line item as the earnings effect of the hedged transaction. During 2018, the Company estimates that an additional $0.7 million will be reclassified as a decrease to interest expense.
85
As of December 31, 2017, the Company had the following outstanding foreign currency derivatives that were used to hedge its foreign exchange risks:
Foreign Currency Derivative | Number of Instruments | Pay Fixed Notional | Receive Fixed Notional | |||
Cross-currency interest rate swap | 1 | €42,000,517 | $48,750,000 | |||
(amortizing to €41,138,968 as of December 31, 2017) | (amortizing to $47,750,000 as of December 31, 2017) | |||||
The table below presents the fair value of the Company’s derivative financial instruments as well as their classification on the Balance Sheet as of December 31, 2017 and 2016.
Fair Value of Derivative Instruments | ||||||||||||||||||
Asset Derivatives | Liability Derivatives | |||||||||||||||||
As of December 31, | As of December 31, | |||||||||||||||||
2017 | 2016 | 2017 | 2016 | |||||||||||||||
Derivatives Designated as Hedging Instruments | Balance Sheet Location | Fair Value | Fair Value | Fair Value | Fair Value | |||||||||||||
Interest rate products | Other assets/liabilities - current | $ | 243 | $ | — | $ | (71,915 | ) | $ | — | ||||||||
Interest rate products | Other assets - non-current | 84,058 | — | — | — | |||||||||||||
Cross currency contract | Other assets - current | 655,305 | — | — | — | |||||||||||||
Cross currency contract | Long-term derivative liability | — | — | (2,995,657 | ) | — | ||||||||||||
Total derivatives designated as hedging instruments | $ | 739,606 | $ | — | $ | (3,067,572 | ) | $ | — | |||||||||
The table below presents the effect of cash flow hedge accounting on Accumulated Other Comprehensive Income as of December 31, 2017 and 2016.
Derivatives in Subtopic 815-20 Hedging Relationships | Amount of Gain or (Loss) Recognized in OCI on Derivatives | Location of Gain or (Loss) Reclassified from Accumulated OCI into Income | Amount of Gain or (Loss) Reclassified from Accumulated OCI into Income | |||||||||||||||||||||||
2017 | 2016 | 2015 | 2017 | 2016 | 2015 | |||||||||||||||||||||
Derivatives in Cash Flow Hedging Relationships | ||||||||||||||||||||||||||
Interest rate products | $ | (75,604 | ) | $ | — | $ | — | Interest expense | $ | (37,427 | ) | $ | — | $ | — | |||||||||||
Cross currency contract | (2,226,811 | ) | — | — | Interest expense | 147,223 | — | — | ||||||||||||||||||
(Loss) gain on foreign currency adjustment | (1,675,692 | ) | — | — | ||||||||||||||||||||||
Total | $ | (2,302,415 | ) | $ | — | $ | — | $ | (1,565,896 | ) | $ | — | $ | — | ||||||||||||
86
The table below presents the effect of the Company’s derivative financial instruments on the Income Statement as of December 31, 2017 and 2016.
2017 | 2016 | |||||||||||||
Interest Expense | Loss on Foreign Currency Adjustment | Interest Expense | Gain on Foreign Currency Adjustment | |||||||||||
Total amounts of income and expense line items presented in the statement of financial performance in which the effects of fair value or cash flow hedges are recorded | (860,392 | ) | (32,488 | ) | (19,388 | ) | 33,416 | |||||||
Gain or (loss) on cash flow hedging relationships in Subtopic 815-20 | ||||||||||||||
Interest contracts | ||||||||||||||
Amount of gain or (loss) reclassified from accumulated other comprehensive income into income | $ | 109,796 | $ | (1,675,692 | ) | — | — | |||||||
Amount of gain or (loss) reclassified from accumulated other comprehensive income into income as a result that a forecasted transaction is no longer probable of occurring | $ | — | $ | — | — | — | ||||||||
As of December 31, 2017, the fair value of derivatives in a net liability position, which includes accrued interest but excludes any adjustment for nonperformance risk, related to these agreements was $2.4 million. As of December 31, 2017, the Company has not posted any collateral related to these agreements. If the Company had breached any of credit-risk related provisions at December 31, 2017, it could have been required to settle its obligations under the agreements at their termination value of $2.4 million.
87
Note 14— Quarterly Results of Operations Data (Unaudited)
The following tables set forth our unaudited quarterly consolidated statements of operations data for each of the eight quarters in the period ended December 31, 2017. In the opinion of management, the financial information reflects all adjustments, consisting only of normal recurring adjustments, which we consider necessary for a fair presentation of this data.
For the Quarters Ended, | |||||||||||||||
2017 | |||||||||||||||
December 31, | September 30, | June 30, | March 31, | ||||||||||||
Revenues | $ | 40,119,076 | $ | 32,246,472 | $ | 31,329,468 | $ | 20,058,797 | |||||||
Operating costs and expenses: | |||||||||||||||
Sales and marketing | 6,050,466 | 4,600,148 | 4,599,842 | 5,105,508 | |||||||||||
Product development and content | 19,698,097 | 16,021,977 | 16,526,905 | 8,457,494 | |||||||||||
General and administrative | 6,504,840 | 5,021,739 | 5,160,799 | 2,862,427 | |||||||||||
Depreciation and amortization | 3,954,243 | 2,969,570 | 2,965,175 | 1,684,839 | |||||||||||
Acquisition and restructuring | 3,502,800 | 3,378,838 | 3,769,425 | 1,500,429 | |||||||||||
Goodwill impairment | 56,428,861 | — | — | — | |||||||||||
Total operating costs and expenses | 96,139,307 | 31,992,272 | 33,022,146 | 19,610,697 | |||||||||||
(Loss) income from operations | (56,020,231 | ) | 254,200 | (1,692,678 | ) | 448,100 | |||||||||
Other income (expense): | |||||||||||||||
Interest income | 387 | 1,374 | 1,400 | 2,570 | |||||||||||
Interest expense | (438,445 | ) | (244,361 | ) | (175,254 | ) | (2,332 | ) | |||||||
(Loss) gain on foreign currency adjustment | (30,416 | ) | 9,357 | (9,229 | ) | (2,200 | ) | ||||||||
Other | 9,631 | — | — | — | |||||||||||
Total other expense | (458,843 | ) | (233,630 | ) | (183,083 | ) | (1,962 | ) | |||||||
(Loss) income before income tax (expense) benefit | (56,479,074 | ) | 20,570 | (1,875,761 | ) | 446,138 | |||||||||
Income tax (expense) benefit | (11,637,816 | ) | 2,202,152 | 2,732,356 | (292 | ) | |||||||||
Net (loss) income | $ | (68,116,890 | ) | $ | 2,222,722 | $ | 856,595 | $ | 445,846 | ||||||
Basic and diluted net (loss) income per common stockholders: | |||||||||||||||
Basic net (loss) income per common stockholders | $ | (0.95 | ) | $ | 0.03 | $ | 0.01 | $ | 0.01 | ||||||
Diluted net (loss) income per common stockholders | $ | (0.95 | ) | $ | 0.03 | $ | 0.01 | $ | 0.01 | ||||||
Weighted average shares outstanding: | |||||||||||||||
Basic | 71,808,179 | 71,800,274 | 70,122,234 | 61,093,810 | |||||||||||
Diluted | 71,808,179 | 76,078,563 | 74,885,903 | 66,204,620 | |||||||||||
88
For the Quarters Ended, | |||||||||||||||
2016 | |||||||||||||||
December 31, | September 30, | June 30, | March 31, | ||||||||||||
Revenues | $ | 29,222,186 | $ | 17,191,261 | $ | 16,388,991 | $ | 13,321,671 | |||||||
Operating costs and expenses: | |||||||||||||||
Sales and marketing | 6,313,958 | 3,228,262 | 3,226,344 | 2,321,423 | |||||||||||
Product development and content | 8,059,563 | 5,808,449 | 6,214,062 | 5,708,100 | |||||||||||
General and administrative | 3,063,319 | 2,215,727 | 1,867,590 | 2,348,168 | |||||||||||
Depreciation and amortization | 1,802,568 | 761,460 | 753,918 | 751,264 | |||||||||||
Acquisition and restructuring | 829,169 | 467,777 | 1,160,349 | — | |||||||||||
Total operating costs and expenses | 20,068,577 | 12,481,675 | 13,222,263 | 11,128,955 | |||||||||||
Income from operations | 9,153,609 | 4,709,586 | 3,166,728 | 2,192,716 | |||||||||||
Other income (expense): | |||||||||||||||
Interest income | 2,488 | 7,135 | 6,447 | 5,115 | |||||||||||
Interest expense | (3,160 | ) | (4,123 | ) | (5,360 | ) | (6,745 | ) | |||||||
Change in warrant liability | — | (318,983 | ) | (787,391 | ) | 241,777 | |||||||||
(Loss) gain on foreign currency adjustment | 69 | (1,206 | ) | 18,201 | 16,352 | ||||||||||
Total other (expense) income | (603 | ) | (317,177 | ) | (768,103 | ) | 256,499 | ||||||||
Income before income taxes | 9,153,006 | 4,392,409 | 2,398,625 | 2,449,215 | |||||||||||
Income tax benefit (expense) | 749,916 | — | 27,219,764 | (94,317 | ) | ||||||||||
Net income | $ | 9,902,922 | $ | 4,392,409 | $ | 29,618,389 | $ | 2,354,898 | |||||||
Basic and diluted net income per common stockholders: | |||||||||||||||
Basic net income per common stockholders | $ | 0.17 | $ | 0.08 | $ | 0.61 | $ | 0.05 | |||||||
Diluted net income per common stockholders | $ | 0.15 | $ | 0.07 | $ | 0.55 | $ | 0.04 | |||||||
Weighted average shares outstanding: | |||||||||||||||
Basic | 58,856,831 | 53,231,369 | 48,218,184 | 47,458,748 | |||||||||||
Diluted | 64,121,470 | 59,048,821 | 54,061,306 | 53,666,626 | |||||||||||
Note 15— Subsequent Events
On March 7, 2018, the Company entered into a Second Amendment to Amended and Restated Credit Agreement (the “Second Amendment”) to that certain Amended and Restated Credit Agreement, dated as of September 18, 2017 (as amended the “Credit Agreement”), among the Company, the several banks and other financial institutions party thereto, and JPMorgan Chase Bank, N.A., as administrative agent, as amended by that certain First Amendment to Amended and Restated Credit Agreement, dated as of October 18, 2017.
Among other things, the Second Amendment amends the definition of “Applicable Rate” and “EBITDA” in the Credit Agreement and makes certain changes to the financial covenants.
ITEM 9. CHANGES IN AND DISAGREEMENTS WITH ACCOUNTANTS ON ACCOUNTING AND FINANCIAL DISCLOSURE.
None.
ITEM 9A. CONTROLS AND PROCEDURES.
Disclosure Controls
We carried out an evaluation required by Rule 13a-15 of the Securities Exchange Act of 1934, as amended, or the Exchange Act, under the supervision and with the participation of our management, including our Chief Executive Officer and Chief Financial Officer, of the effectiveness of the design and operation of our disclosure controls and procedures, as such term is defined in Exchange Act Rule 13a–15(e). Disclosure controls and procedures are designed with the objective of ensuring that (i) information required to be disclosed in an issuer's reports filed under the Exchange Act is recorded, processed, summarized and reported within
89
the time periods specified in the SEC rules and forms and (ii) information is accumulated and communicated to management, including our Principal Executive Officer and Principal Financial Officer, as appropriate to allow timely decisions regarding required disclosures.
The evaluation of our disclosure controls and procedures included a review of our objectives and processes and effect on the information generated for use in this report. This type of evaluation is done quarterly so that the conclusions concerning the effectiveness of these controls can be reported in our periodic reports filed with the SEC. We intend to maintain these controls as processes that may be appropriately modified as circumstances warrant.
Based on their evaluation, our Principal Executive Officer and Principal Financial Officer have concluded that our disclosure controls and procedures are effective in timely alerting them to material information which is required to be included in our periodic reports filed with the SEC as of the end of the period covering this report.
Management’s Report on Internal Control Over Financial Reporting
Management of the Company is responsible for establishing and maintaining adequate internal control over financial reporting. Our system of internal control is designed under the supervision of management, including our Chief Executive Officer and Chief Financial Officer, to provide reasonable assurance regarding the reliability of our financial reporting and the preparation of the Company’s financial statements for external reporting purposes in accordance with U.S. generally accepted accounting principles. Based on the assessment, management has concluded that its internal control over financial reporting was effective as of December 31, 2017 to provide reasonable assurance regarding the reliability of financial reporting and the preparation of financial statements in accordance with U.S. GAAP. Our independent registered public accounting firm, RSM US LLP, has issued an audit report with respect to our internal control over financial reporting, which appears in Part II, Item 8 of this Annual Report on Form 10-K.
Our internal control over financial reporting includes policies and procedures that pertain to the maintenance of records that, in reasonable detail, accurately and fairly reflect transactions and dispositions of assets, provide reasonable assurances that transactions are recorded as necessary to permit preparation of financial statements in accordance with GAAP, and that receipts and expenditures are made only in accordance with the authorization of management and the Board of Directors and provide reasonable assurance regarding prevention or timely detection of unauthorized acquisition, use, or disposition of the Company’s assets that could have a material effect on our financial statements.
Because of its inherent limitations, internal control over financial reporting may not prevent or detect misstatements. Projections of any evaluation of effectiveness to future periods are subject to the risk that the controls may become inadequate because of changes in conditions or that the degree of compliance with policies and procedures may deteriorate.
As of December 31, 2017, management assessed the effectiveness of the Company’s internal control over financial reporting based upon the framework established in Internal Control — Integrated Framework issued in 2013, issued by the Committee of Sponsoring Organizations of the Treadway Commission (COSO). Based upon its assessment, management believes that the Company’s internal control over financial reporting as of December 31, 2017 was effective using these criteria.
Changes in Internal Control Over Financial Reporting
During the period covered by this report, there were no changes in the Company’s internal control over financial reporting as such term is defined in Exchange Act Rule 13a-15(f) that have materially affected, or is reasonably likely to materially affect, the Company’s internal control over financial reporting.
Limitations on Effectiveness of Controls and Procedures and Internal Control over Financial Reporting
In designing and evaluating the disclosure controls and procedures and internal control over financial reporting, management recognizes that any controls and procedures, no matter how well designed and operated, can provide only reasonable assurance of achieving the desired control objectives. In addition, the design of disclosure controls and procedures and internal control over financial reporting must reflect the fact that there are resource constraints and that management is required to apply judgment in evaluating the benefits of possible controls and procedures relative to their costs.
As permitted pursuant to the Securities and Exchange Commission’s guidance, management has excluded if(we) and Lovoo, the businesses acquired in April and October 2017, respectively, from management’s report on internal control over financial reporting. Based on the timing of the acquisition it was not possible to conduct an assessment of the acquired business’s internal control over financial reporting in the period between the consummation date of the acquisition and the date of management’s assessment.
90
Management believes this exclusion has no significant effect on the Company’s consolidated financial statements or any material changes on the Company’s internal control over financial reporting.
Based on our assessment, management concluded that, as of December 31, 2017, the Company’s internal control over financial reporting is effective based on those criteria.
ITEM 9B. OTHER INFORMATION.
The accompanying financial statements for the year end December 31, 2017, include an additional $0.4 million of acquisition and restructuring costs, not previously reported in the earnings press release, filed with Form 8-K on March 7, 2018. The change includes an increase to acquisition and restructuring costs and an increase to accrued liabilities, resulting in a $0.4 million increase to the Company’s net loss and a $0.01 increase to the basic and diluted net loss per common stockholders.
PART III
ITEM 10. DIRECTORS, EXECUTIVE OFFICERS AND CORPORATE GOVERNANCE.
The information required to be included in Item 10 of Part III of this Form 10-K is incorporated herein by reference to certain information contained in our definitive proxy statement for our 2017 Annual Meeting of Stockholders to be filed with the SEC not later than 120 days after the end of the fiscal year covered by this report.
ITEM 11. EXECUTIVE COMPENSATION.
The information required to be included in Item 11 of Part III of this Form 10-K is incorporated herein by reference to certain information contained in our definitive proxy statement for our 2017 Annual Meeting of Stockholders to be filed with the SEC not later than 120 days after the end of the fiscal year covered by this report.
ITEM 12. SECURITY OWNERSHIP OF CERTAIN BENEFICIAL OWNERS AND MANAGEMENT AND RELATED STOCKHOLDER MATTERS.
The information required to be included in Item 12 of Part III of this Form 10-K is incorporated herein by reference to certain information contained in our definitive proxy statement for our 2017 Annual Meeting of Stockholders to be filed with the SEC not later than 120 days after the end of the fiscal year covered by this report.
ITEM 13. CERTAIN RELATIONSHIPS AND RELATED TRANSACTIONS, AND DIRECTOR INDEPENDENCE.
The information required to be included in Item 13 of Part III of this Form 10-K is incorporated herein by reference to certain information contained in our definitive proxy statement for our 2017 Annual Meeting of Stockholders to be filed with the SEC not later than 120 days after the end of the fiscal year covered by this report.
ITEM 14. PRINCIPAL ACCOUNTING FEES AND SERVICES.
The information required to be included in Item 14 of Part III of this Form 10-K is incorporated herein by reference to certain information contained in our definitive proxy statement for our 2017 Annual Meeting of Stockholders to be filed with the SEC not later than 120 days after the end of the fiscal year covered by this report.
91
PART IV
ITEM 15. EXHIBITS, FINANCIAL STATEMENT SCHEDULES.
(a) Documents filed as part of this Annual Report on Form 10-K
(1) Financial Statements - see “Item 8. Financial Statements and Supplementary Data” of this report.
(2) Financial Statement Schedules.
All schedules have been omitted because they are not applicable, are immaterial or are not required because the information is included in the consolidated financial statements or the notes thereto.
(3) Item 601 Exhibits - see list of Exhibits below.
(b) Exhibits
The following is a list of exhibits filed as part of this annual report on Form 10-K.
Filed or | ||||||||||
Incorporated by Reference | Furnished | |||||||||
Exhibit No. | Exhibit Description | Form | Date | Number | Herewith | |||||
Agreement of Merger and Plan of Merger and Reorganization – Delaware Reincorporation | 8-K | 12/8/2011 | 2.1 | |||||||
Agreement and Plan of Merger among Quepasa, IG Acquisition Company and Insider Guides, Inc. dated July 19, 2011* | 8-K | 7/20/2011 | 2.1 | |||||||
Amendment to the Agreement and Plan of Merger among Quepasa Corporation, IG Acquisition Company and Insider Guides, Inc. dated July 19, 2011 | 8-K | 9/21/2011 | 2.1 | |||||||
Agreement and Plan of Merger among MeetMe, Inc., MeetMe Sub I, Inc., MeetMe Sub II, LLC, Skout, Inc. and Shareholder Representative Services LLC dated June 27, 2016. | 8-K | 6/28/2016 | 2.1 | |||||||
Agreement and Plan of Merger, dated as of March 3, 2017, by and among MeetMe, Inc. Two Sub One, Inc., Ifwe Inc. and Shareholder Representative Services LLC | 8-K | 3/6/2017 | 2.1 | |||||||
Share Purchase Agreement, dated as of September 18, 2017, by and among The Meet Group, Inc., TMG Holding Germany Gmbh, Bawogo Ventures Gmbh & Co. KG and the Shareholder guarantors set forth therein | 8-K | 9/20/2017 | 2.1 | |||||||
Certificate of Incorporation | 8-K | 12/8/2011 | 3.1 | |||||||
Certificate of Amendment to the Certificate of Incorporation – Name Change | 10-Q | 8/9/2012 | 3.2 | |||||||
Amended and Restated Bylaws | 8-K | 12/23/2016 | 3.1 | |||||||
Amended and Restated 2006 Stock Incentive Plan** | 10-Q | 8/9/2010 | 10.1 | |||||||
Amendment to the Amended and Restated 2006 Stock Incentive Plan** | S-8 | 7/1/2011 | 4.1 | |||||||
Amended and Restated 2012 Omnibus Incentive Plan** | 10-K | 3/9/2017 | 10.3 | |||||||
2012 Management Bonus Plan** | 8-K | 8/21/2012 | 10.1 | |||||||
John Abbott Employment Agreement** | 8-K | 10/30/2007 | 10.2 | |||||||
Abbott Employment Agreement Amendment No. 1** | 10-KSB | 3/31/2008 | 10.18 | |||||||
Abbott Employment Agreement Amendment No. 2** | S-1 | 12/29/2010 | 10.6 | |||||||
Abbott Employment Agreement Amendment No. 3** | 10-K | 3/13/2015 | 10.8 | |||||||
92
Filed or | ||||||||||
Incorporated by Reference | Furnished | |||||||||
Exhibit No. | Exhibit Description | Form | Date | Number | Herewith | |||||
Michael Matte Employment Agreement** | 8-K | 10/30/2007 | 10.3 | |||||||
Matte Employment Agreement Amendment No. 1** | 10-KSB | 3/31/2008 | 10.21 | |||||||
Matte Employment Agreement Amendment No. 2** | S-1 | 12/29/2010 | 10.9 | |||||||
Matte Employment Agreement Amendment No. 3** | 10-K | 3/14/2013 | 10.11 | |||||||
Geoffrey Cook Employment Agreement** | 8-K | 7/20/2011 | 10.5 | |||||||
Cook Employment Agreement Amendment No. 1** | 10-Q | 5/10/2013 | 10.2 | |||||||
Cook Employment Agreement Amendment No. 2** | 10-Q | 8/9/2013 | 10.1 | |||||||
David Clark Employment Agreement ** | 10-Q | 5/10/2013 | 10.3 | |||||||
David Clark Transition Services and Separation Agreement | 8-K | 11/9/2017 | 10.1 | |||||||
Form of Amended and Restated Employment Agreement (William Alena, Frederic Beckley, and Jonah Harris)** | 10-Q | 11/9/2016 | 10.2 | |||||||
Niklas Lindstrom Offer Letter | Filed | |||||||||
Form of Media Publisher Agreement with Beanstock Media Inc.# | 10-Q | 11/8/2013 | 10.3 | |||||||
Advertising Agreement with Beanstock Media, Inc.# | 10-K | 3/13/2015 | 10.23 | |||||||
Amendment No. 1 to Advertising Agreement with Beanstock Media, Inc.# | 10-Q | 5/8/2015 | 10.1 | |||||||
Amendment of and Joinder to Advertising Agreement with Beanstock Media, Inc. | 10-Q | 5/8/2015 | 10.2 | |||||||
Notice of Termination, dated June 2, 2015 | 8-K | 6/3/2015 | 10.1 | |||||||
Amendment No. 2 to Advertising Agreement with Beanstock Media, Inc. | 10-Q | 8/4/2015 | 10.1 | |||||||
RSI LLC Promissory Note | 8-K | 1/30/2008 | 10.12 | |||||||
MeetMoi LLC Promissory Note | 10-Q | 5/10/2013 | 10.4 | |||||||
Form of Employee Option Agreement | 10-K | 3/14/2012 | 10.22 | |||||||
Form of Director Option Agreement** | 10-K | 3/14/2013 | 10.27 | |||||||
Form of Indemnification Agreement | S-4 | 8/11/2011 | 10.29 | |||||||
Form of Indemnification Agreement – Lewis | S-4 | 8/11/2011 | 10.30 | |||||||
Form of Indemnification Agreement | 8-K | 12/6/2013 | 10.1 | |||||||
Amended and Restated Common Stock Purchase Warrant – Series 2 with F. Stephan Allen dated December 22, 2015 | 8-K | 12/24/2015 | 10.1 | |||||||
Amended and Restated Common Stock Purchase Warrant – Series 3 with F. Stephan Allen dated December 22, 2015 | 8-K | 12/24/2015 | 10.2 | |||||||
Credit Agreement, dated as of March 3, 2017, with the several banks and other financial institutions party thereto and JPMorgan Chase Bank, N.A., as administrative agent | 8-K | 3/6/2017 | 10.1 | |||||||
Amended and Restated Credit Agreement, dated as of September 18, 2017, with the several banks and other financial institutions party thereto and JPMorgan Chase Bank, N.A., as administrative agent | 8-K | 9/20/2017 | 10.1 | |||||||
First Amendment to Amended and Restated Credit Agreement, dated as of October 18, 2017, with the several banks and other financial institutions party thereto and JPMorgan Chase Bank, N.A., as administrative agent | 8-K | 10/20/2017 | 10.1 | |||||||
Second Amendment to Amended and Restated Credit Agreement, dated as of March 7, 2018, with the several banks and other financial institutions party thereto and JPMorgan Chase Bank, N.A., as administrative agent | 8-K | 3/8/2018 | 10.1 | |||||||
93
Filed or | ||||||||||
Incorporated by Reference | Furnished | |||||||||
Exhibit No. | Exhibit Description | Form | Date | Number | Herewith | |||||
Cooperation Agreement dated June 27, 2017 by and among The Meet Group, Inc. and Harvest Small Cap Partners Master Ltd., Harvest Small Cap Partners, LP, Harvest Small Cap Partners GP, LLC, Harvest Capital Strategies LLC, and Jeffrey B. Osher. | 8-K | 6/29/2017 | 10.1 | |||||||
Cooperation Agreement dated January 5, 2018 by and among The Meet Group, Inc. and Kanen Wealth Management LLC and David L. Kanen | 8-K | 1/9/2018 | 10.1 | |||||||
List of Subsidiaries | Filed | |||||||||
Consent of RSM US LLP | Filed | |||||||||
Certification of Principal Executive Officer (Section 302) | Filed | |||||||||
Certification of Principal Financial Officer (Section 302) | Filed | |||||||||
Certification of Principal Executive Officer (Section 906) | Furnished | |||||||||
Certification of Principal Financial Officer (Section 906) | Furnished | |||||||||
101.INS | XBRL Instance Document | **** | ||||||||
101.SCH | XBRL Taxonomy Extension Schema Document | **** | ||||||||
101.CAL | XBRL Taxonomy Extension Calculation Linkbase Document | **** | ||||||||
101.DEF | XBRL Taxonomy Extension Definition Linkbase Document | **** | ||||||||
101.LAB | XBRL Taxonomy Extension Label Linkbase Document | **** | ||||||||
101.PRE | XBRL Taxonomy Extension Presentation Linkbase Document | **** | ||||||||
* The confidential disclosure schedules are not filed in accordance with SEC Staff policy, but will be provided to the Staff upon request. The agreement contains representations and warranties, which are qualified by the following factors:
(i) | the representations and warranties contained in the agreement were made for the purposes of allocating contractual risk between the parties and not as a means of establishing facts; |
(ii) | the agreement may have different standards of materiality than standards of materiality under applicable securities laws; |
(iii) | the representations are qualified by a confidential disclosure schedule that contains nonpublic information that is not material under applicable securities laws; |
(iv) | facts may have changed since the date of the agreement; and |
(v) | only parties to the agreement and specified third-party beneficiaries have a right to enforce the agreement. |
Notwithstanding the above, any information contained in a schedule that would cause a reasonable investor (or that a reasonable investor would consider important in making a decision) to buy or sell our common stock has been included. We have been further advised by our counsel that in all instances the standard of materiality under the federal securities laws will determine whether or not information has been omitted; in other words, any information that is not material under the federal securities laws may be omitted. Furthermore, information which may have a different standard of materiality would nonetheless have been disclosed if material under the federal securities laws.
** Management contract or compensatory plan or arrangement.
*** This exhibit is being furnished rather than filed and shall not be deemed incorporated by reference into any filing, in accordance with Item 601 of Regulation S-K.
**** Attached as Exhibit 101 to this report are the Company’s financial statements for the year ended December 31, 2017 formatted in XBRL (eXtensible Business Reporting Language). The XBRL-related information in Exhibit 101 to this report shall not be deemed “filed” or a part of a registration statement or prospectus for purposes of Sections 11 or 12 of the Securities Act of 1933, and is not filed for purposes of Section 18 of the Securities Exchange Act of 1934, or otherwise subject to the liabilities of those sections.
94
# Confidential treatment requested under 17 C.P.R. §§200.80(b)(4) and 240.24b-2. The confidential portions of this exhibit have been omitted and are marked accordingly. The confidential portions have been filed separately with the Securities and Exchange Commission.
ITEM 16. FORM 10-K SUMMARY
None
95
SIGNATURES
Pursuant to the requirements of Section 13 or 15(d) of the Securities Exchange Act of 1934, the registrant has duly caused this report to be signed on its behalf by the undersigned, thereunto duly authorized, on March 16, 2018.
THE MEET GROUP, INC. | ||
By: | /s/Geoffrey Cook | |
Geoffrey Cook | ||
Chief Executive Officer | ||
Pursuant to the requirements of the Securities Exchange Act of 1934, this report has been signed below by the following persons on behalf of the registrant and in the capacities and on the dates indicated.
Signatures | Title | Date | ||
/s/Geoffrey Cook | Director and Chief Executive Officer | March 16, 2018 | ||
Geoffrey Cook | (Principal Executive Officer) | |||
/s/James Bugden | Chief Financial Officer | March 16, 2018 | ||
James Bugden | (Principal Financial Officer) | |||
/s/Michael Johnson | Chief Accounting Officer | March 16, 2018 | ||
Michael Johnson | (Principal Accounting Officer) | |||
/s/Spencer Rhodes | Director, Chairman of the Board of Directors | March 16, 2018 | ||
Spencer Rhodes | ||||
/s/Jean Clifton | Director | March 16, 2018 | ||
Jean Clifton | ||||
/s/Christopher Fralic | Director | March 16, 2018 | ||
Christopher Fralic | ||||
Director | March 16, 2018 | |||
Spencer Grimes | ||||
/s/Jim Parmalee | Director | March 16, 2018 | ||
Jim Parmalee | ||||
/s/Bedi Singh | Director | March 16, 2018 | ||
Bedi Singh | ||||
/s/Jason Whitt | Director | March 16, 2018 | ||
Jason Whitt | ||||
96
February 10, 2017
Re: Offer of Employment
Dear Nik:
We are pleased to offer you the position of Chief Technology Officer of MeetMe, Inc. Your position will be based at our office in San Francisco, and you will spend time in New Hope as necessary. You will report directly to Geoff Cook, Chief Executive Officer. This offer is contingent upon your execution of a written employment agreement, approval of the Compensation Committee of our Board of Directors, and our satisfactory completion of a criminal background check.
Your employment will begin on or about February 22, 2017. We will enter into the standard Employment Agreement that we use for our C-level officers, and we will amend your Consulting Agreement dated June 27, 2016 to eliminate the provisions that do not relate to your $1.5 million Consulting Bonus as described on Exhibit A thereto; you will continue to be eligible to receive your Consulting Bonus according to the terms of your Consulting Agreement.
Here are the general terms and conditions of your proposed employment with the Company.
Schedule, Pay, & Benefits:
This is an exempt position and not eligible for overtime compensation. Our normal payroll pay cycle is semimonthly on the 15th and the last day of each month.
a. | BASE SALARY. You will be paid a base salary of $337,000 per year, to be reviewed at least annually. |
b. | BONUS. You will be eligible for an annual bonus with a target of 50% of your base salary, payable upon achievement of goals to be set by the Compensation Committee; your bonus for 2017 will be pro-rated to your start date. |
c. | EQUITY. |
• | 250,000 stock options (1/3 to vest on the first anniversary of your employment, and then monthly after that for the next two years). |
• | 150,000 RSAs (1/3 to vest on each anniversary of your employment). |
• | Your stock options and RSAs will vest fully if you are terminated as a result of a change of control. |
d. | SEVERANCE. If you are terminated for a reason other than cause, or if you resign for good reason (both to be defined in your employment agreement), you will be paid one year of base salary. |
e. | FRINGE BENEFITS. You will be entitled to receive the fringe benefits generally available to our employees, including medical, dental, vision, disability insurance, life insurance, and a 401(k) match. You will be eligible for all benefits on the first of the month following your date of hire. We may amend, terminate, or enhance the benefits provided to you and our other employees from time to time as we deem appropriate. |
f. | PAID TIME OFF. You are entitled to 160 hours of vacation time and 80 hours of personal/sick days per year. Vacation is accrued monthly. All time off is prorated in your first year of employment. In addition, you will receive 10 paid holidays each calendar year or such other number as we may adopt, as well as a paid day off on your birthday. |
g. | PARTICIPATION IN NEW DEAL TEAM POOL – The total pool size is anticipated to be 10% of the target’s Stay Pool, minimum of 0.3% of the valuation of the Target with a cap of $500K; paid in one-year vest RSAs on same payout date as stay awards. You will participate in the Deal Team Pool along with other executives and at the discretion of the CEO. |
Internal Policies:
During your employment, you will be required to follow all of our internal policies and conduct your business activities at all times in accordance with the highest legal, ethical and professional standards.
No Conflicting Obligation/Conflicts of Interest:
You hereby represent and warrant to the Company that you are not presently under and will not hereafter become subject to any obligation to any person or entity which is inconsistent or in conflict with this offer or which would prevent, limit or impair in any way your performance of your duties to the Company as described herein. Specifically, you represent and warrant that you will not bring with you any confidential or proprietary information of any former employer, and you are not subject to any agreement or obligation with a former employer that would prohibit or limit your employment by the Company. Further, during your employment with the Company, you will not engage in any activity on behalf of, nor accept any salary, commission, fee or compensation of any kind (other than investment income) from any person, firm or corporation competing with the Company.
Non-Solicitation Agreement, Non-Disclosure and Inventions Agreement:
As a condition to your employment, you will be required to enter into the Company’s standard Non-Solicitation, Non-Disclosure and Inventions Agreement. Among other things, that agreement will provide that the Company owns your work product and all developments made by you in the course of your employment; that you will hold all non-public information regarding the Company confidential; and that you will not solicit, hire, divert or take away any employee, contractor, customer or supplier of the Company.
Entire Understanding:
This letter (together with the Non-Solicitation, Non-Disclosure and Inventions Agreement referenced herein) contains our entire understanding regarding the terms and conditions of your employment and supersedes any prior statements regarding your employment made to you at any time by any representative of the Company. Your signature below acknowledges your understanding that your employment shall be on an at-will basis. Your signature below further acknowledges your understanding that neither this letter, Company practice, nor other oral or written policies or statements of the Company or its agents shall create an employment contract, guarantee a definite term of employment, or otherwise modify in any way the agreement and understanding that employment with the Company, if commenced, shall be at-will. No representative of the Company other than an officer of the Company has any authority to enter into any agreement contrary to the foregoing, and then only in writing signed by both you and the Company.
If the foregoing offer is acceptable to you, please acknowledge your acceptance by signing below and returning to me one fully executed copy of this letter, either in the original or by electronic transmission.
Very truly yours,
MeetMe, Inc.
By: /s/ Geoffrey Cook
Geoffrey Cook
Chief Executive Officer
AGREED AND ACCEPTED:
/s/ Niklas Lindstrom | |
Niklas Lindstrom | |
Date: 2/13/17 | |
Exhibit 21.1
Subsidiaries
Entity | Country |
Quepasa.com de Mexico | Mexico |
MeetMe Online Brasil S/S Ltda | Brazil |
Skout, LLC | United States |
If(we), Inc. | United States |
Lovoo GmbH | Germany |
TMG Holding Germany GmbH | Germany |
Exhibit 23.1
Consent of Independent Registered Public Accounting Firm
We consent to the incorporation by reference in the Registration Statement (Nos. 333-177021, 333-178063, 333-190535, 333-190689 and 333-216589) on Form S-3 and Registration Statement (Nos. 333-146486, 333-167795, 333-175310, 333-182195 and 333-217820) on Form S-8 of The Meet Group, Inc. of our report dated March 16, 2018, relating to the consolidated financial statements and the effectiveness of internal control over financial reporting of The Meet Group, Inc., appearing in this Annual Report on Form 10-K of The Meet Group, Inc. for the year ended December 31, 2017.
/s/ RSM US LLP |
Blue Bell, Pennsylvania |
March 16, 2018 |
Exhibit 31.1
CERTIFICATION OF PRINCIPAL EXECUTIVE OFFICER
I, Geoffrey Cook, certify that:
1. | I have reviewed this quarterly report on Form 10-K of The Meet Group, Inc.; |
2. | Based on my knowledge, this report does not contain any untrue statement of a material fact or omit to state a material fact necessary to make the statements made, in light of the circumstances under which such statements were made, not misleading with respect to the period covered by this report; |
3. | Based on my knowledge, the financial statements, and other financial information included in this report, fairly present in all material respects the financial condition, results of operations and cash flows of the registrant as of, and for, the periods presented in this report; |
4. | The registrant’s other certifying officer(s) and I are responsible for establishing and maintaining disclosure controls and procedures (as defined in Exchange Act Rules 13a-15I and 15d-15(e)) and internal control over financial reporting (as defined in Exchange Act Rules 13a-15(f) and 15d-15(f)) for the registrant and have: |
a) | Designed such disclosure controls and procedures, or caused such disclosure controls and procedures to be designed under our supervision, to ensure that material information relating to the registrant, including its consolidated subsidiaries, is made known to us by others within those entities, particularly during the period in which this report is being prepared; |
b) | Designed such internal control over financial reporting, or caused such internal control over financial reporting to be designed under our supervision, to provide reasonable assurance regarding the reliability of financial reporting and the preparation of financial statements for external purposes in accordance with generally accepted accounting principles; |
c) | Evaluated the effectiveness of the registrant’s disclosure controls and procedures and presented in this report our conclusions about the effectiveness of the disclosure controls and procedures, as of the end of the period covered by this report based on such evaluation; and |
d) | Disclosed in this report any change in the registrant’s internal control over financial reporting that occurred during the registrant’s most recent fiscal quarter (the registrant’s fourth fiscal quarter in the case of an annual report) that has materially affected, or is reasonably likely to materially affect, the registrant’s internal control over financial reporting; and |
5. | The registrant’s other certifying officer(s) and I have disclosed, based on our most recent evaluation of internal control over financial reporting, to the registrant’s auditors and the audit committee of the registrant’s board of directors (or persons performing the equivalent functions): |
a) | All significant deficiencies and material weaknesses in the design or operation of internal control over financial reporting which are reasonably likely to adversely affect the registrant’s ability to record, process, summarize and report financial information; and |
b) | Any fraud, whether or not material, that involves management or other employees who have a significant role in the registrant’s internal control over financial reporting. |
Date: March 16, 2018
/s/ Geoffrey Cook |
Geoffrey Cook Chief Executive Officer (Principal Executive Officer) |
Exhibit 31.2
CERTIFICATION OF PRINCIPAL FINANCIAL OFFICER
I, James Bugden, certify that:
1. | I have reviewed this quarterly report on Form 10-K of The Meet Group, Inc.; |
2. | Based on my knowledge, this report does not contain any untrue statement of a material fact or omit to state a material fact necessary to make the statements made, in light of the circumstances under which such statements were made, not misleading with respect to the period covered by this report; |
3. | Based on my knowledge, the financial statements, and other financial information included in this report, fairly present in all material respects the financial condition, results of operations and cash flows of the registrant as of, and for, the periods presented in this report; |
4. | The registrant’s other certifying officer(s) and I are responsible for establishing and maintaining disclosure controls and procedures (as defined in Exchange Act Rules 13a-15(e) and 15d-15(e)) and internal control over financial reporting (as defined in Exchange Act Rules 13a-15(f) and 15d-15(f)) for the registrant and have: |
a) | Designed such disclosure controls and procedures, or caused such disclosure controls and procedures to be designed under our supervision, to ensure that material information relating to the registrant, including its consolidated subsidiaries, is made known to us by others within those entities, particularly during the period in which this report is being prepared; |
b) | Designed such internal control over financial reporting, or caused such internal control over financial reporting to be designed under our supervision, to provide reasonable assurance regarding the reliability of financial reporting and the preparation of financial statements for external purposes in accordance with generally accepted accounting principles; |
c) | Evaluated the effectiveness of the registrant’s disclosure controls and procedures and presented in this report our conclusions about the effectiveness of the disclosure controls and procedures, as of the end of the period covered by this report based on such evaluation; and |
d) | Disclosed in this report any change in the registrant’s internal control over financial reporting that occurred during the registrant’s most recent fiscal quarter (the registrant’s fourth fiscal quarter in the case of an annual report) that has materially affected, or is reasonably likely to materially affect, the registrant’s internal control over financial reporting; and |
5. | The registrant’s other certifying officer(s) and I have disclosed, based on our most recent evaluation of internal control over financial reporting, to the registrant’s auditors and the audit committee of the registrant’s board of directors (or persons performing the equivalent functions): |
a) | All significant deficiencies and material weaknesses in the design or operation of internal control over financial reporting which are reasonably likely to adversely affect the registrant’s ability to record, process, summarize and report financial information; and |
b) | Any fraud, whether or not material, that involves management or other employees who have a significant role in the registrant’s internal control over financial reporting. |
Date: March 16, 2018
/s/ James Bugden |
James Bugden Chief Financial Officer (Principal Financial Officer) |
Exhibit 32.1
CERTIFICATION PURSUANT TO 18 U.S.C. SECTION 1350,
AS ADOPTED PURSUANT TO SECTION 906 OF THE SARBANES-OXLEY ACT OF 2002
In connection with the annual report of The Meet Group, Inc. (the “Company”) on Form 10-K for the period ended December 31, 2017, as filed with the Securities and Exchange Commission on the date hereof, I, Geoffrey Cook, pursuant to 18 U.S.C. §1350, as adopted pursuant to §906 of the Sarbanes-Oxley Act of 2002, that to my knowledge:
1. | The annual report fully complies with the requirements of section 13(a) or 15(d) of the Securities Exchange Act of 1934 and |
2. | The information contained in the annual report fairly presents, in all material respects, the financial condition and results of operations of the Company. |
/s/ Geoffrey Cook |
Geoffrey Cook |
Chief Executive Officer |
(Principal Executive Officer) |
Dated: March 16, 2018
Exhibit 32.2
CERTIFICATION PURSUANT TO 18 U.S.C. SECTION 1350,
AS ADOPTED PURSUANT TO SECTION 906 OF THE SARBANES-OXLEY ACT OF 2002
In connection with the annual report of The Meet Group, Inc. (the “Company”) on Form 10-K for the period ended December 31, 2017, as filed with the Securities and Exchange Commission on the date hereof, I, James Bugden, certify, pursuant to 18 U.S.C. §1350, as adopted pursuant to §906 of the Sarbanes-Oxley Act of 2002, that to my knowledge:
1. | The annual report fully complies with the requirements of section 13(a) or 15(d) of the Securities Exchange Act of 1934 and |
2. | The information contained in the annual report fairly presents, in all material respects, the financial condition and results of operations of the Company. |
/s/ James Bugden |
James Bugen |
Chief Financial Officer |
(Principal Financial Officer) |
Dated: March 16, 2018